
97 Director’s RowJackson, Tennessee 38305
731-668-7367
Economic Indicators & Trends

Trade Area

Trade Area Determinants
EmploymentEntertainmentEducationHealth CareRetail/Service AttractionsTransportation

Population
Trade Area Madison CountyCity of
Jackson
2018 Projection 395,871 98,695 65,658
2013 Estimate 395,514 98,164 65,322
2010 Census 397,393 98,294 65,413
2000 Census 386,360 91,837 61,339
1990 Census 344,689 77,982 52,142
Growth 2013-2018 0.09% 0.54% 0.51%
Growth 2010-2013 -0.47% -0.13% -0.14%
Growth 2000-2010 2.86% 7.03% 6.64%
Growth 1990-200012.09% 17.77% 17.64%
Source: Claritas

Household Information
2013Estimates
Households
Average # of Persons
Per Household
Average Household
Income
Jackson25,344 2.41 $ 56,620
Madison38,091 2.46 $ 58,475
Trade Area155,338 2.45 $ 48,949

Ages 0-17
22.7%
Ages 18-24
10.3%
Ages 25-34
11.4%
Ages 35-4412.0%
Ages 45-54
13.8%
Ages 55-64
13.1%
Ages 65-74
9.5%Ages 75+
7.2%
Population by Age Category – Trade Area

Jackson/ Madison County Single Family Dwelling Starts
2000
2001
2002
2003
2004
2005
2006
2007
2008
2009
2010
2011
2012
0
50
100
150
200
250
300
350
400
450
JacksonMadison Co
Source: US Census Bureau

2012 Retail Sales by Category
Madison Trade Area
TOTAL 2,113,813,208 5,201,523,722
Building Materials158,564,703 348,784,124
Gen. Merchandise379,132,436 1,119,926,039
Food Stores362,844,425 1,018,446,728
Autos/Boats/Aircraft344,571,494 727,413,865
Service Stations279,137,374 647,256,353
Apparel/Accessories77,817,712 107,092,383
Furniture & Home Furnishings 39,894,538 77,632,367
Eating/Drinking203,620,085 463,721,190
Other268,230,435 652,811,457

Madison County, TN Retail Share
2011 Madison County
2011 Trade Area
2011 % of Total Sales in Madison
2007 % of Total Sales
in Madison
TOTAL 2,113,813,208 5,201,523,722 40.6% 40.1%
Building Materials 158,564,703 348,784,124 45.5% 49.1%
General Merchandise 379,132,436 1,119,926,039 33.9% 36.9%
Food Stores 362,844,425 1,018,446,728 35.6% 34.2%
Autos, Boats & Aircraft 344,571,494 727,413,865 47.4% 39.5%
Service Stations 279,137,374 647,256,353 43.1% 41.3%
Apparel & Accessories 77,817,712 107,092,383 72.7% 66.6%
Furniture & Home Furnishings 39,894,538 77,632,367 51.4% 50.9%
Eating & Drinking 203,620,085 463,721,190 43.9% 44.9%
Other 268,230,435 652,811,457 41.1% 40.1%

Madison County Retail Growth Comparison
2007 2011 2012% Change
2007-2012
% Change 2011-2012
TOTAL 188,822,841 152,611,468 158,564,703 -16.0% 3.9%
Building Materials 385,225,982 372,994,316 379,132,436 -1.6% 1.6%
General Merchandise 304,371,972 362,066,129 362,844,425 19.2% 0.2%
Food Stores 342,359,843 302,596,307 344,571,494 0.6% 13.9%
Autos, Boats & Aircraft 164,534,874 288,357,691 279,137,374 69.7% -3.2%
Service Stations 76,084,803 76,414,450 77,817,712 2.3% 1.8%
Apparel & Accessories 52,342,893 39,097,715 39,894,538 -23.8% 2.0%
Furniture & Home Furnishings 175,584,137 194,267,503 203,620,085 16.0% 4.8%
Eating & Drinking 229,906,162 256,362,857 268,230,435 16.7% 4.6%
Other 188,822,841 152,611,468 158,564,703 -16.0% 3.9%

2011 Inleakage of Retail Sales Top 10 TN Counties
Area name Total Personal Income Retail Sales
Sales to Income Ratio
In/Out Leakage
Sevier, TN $ 2,932,819,000 $ 2,013,717,344 0.687 $ 1,217,230,510
Rutherford, TN $ 8,714,005,000 $ 5,979,560,363 0.686 $ 3,611,987,040
Hamblen, TN $ 1,894,032,000 $ 1,263,615,633 0.667 $ 739,228,906
Putnam, TN $ 2,288,083,000 $ 1,351,063,918 0.590 $ 686,790,376
Madison, TN $ 3,469,897,000 $ 2,044,495,429 0.589 $ 1,036,689,443
Lewis, TN $ 295,590,000 $ 170,900,927 0.578 $ 84,770,841
Knox, TN $ 16,994,073,000 $ 8,661,782,921 0.510 $ 3,703,334,917
Davidson, TN $ 30,069,470,000 $ 14,328,356,384 0.477 $ 5,650,572,199
Henry, TN $ 990,912,000 $ 470,865,196 0.475 $ 185,067,972
Cumberland, TN $ 1,691,634,000 $ 802,269,993 0.474 $ 314,579,601

Comparison of West TN Counties Estimated Inleakage/Outleakage of Retail Sales
Area nameTotal Personal
IncomeRetail Sales
Sales to Income Ratio
In/Out Leakage
Benton $ 463,308,000 $ 160,365,724 0.346 $ (6,117,369)
Carroll $
883,793,000 $ 227,507,567 0.257 $ (28,860,832)
Chester $ 480,926,000 $ 128,068,111 0.266 $ (15,109,927)
Crockett $
470,187,000 $ 107,876,700 0.229 $ (16,704,141)
Decatur $
394,307,000 $ 90,895,699 0.231 $ (13,975,962)
Dyer $
1,234,878,000 $ 480,105,162 0.389 $ 2,164,873
Fayette $
1,678,353,000 $ 262,904,523 0.157 $ (59,846,010)
Gibson $
1,519,810,000 $ 476,154,832 0.313 $ (33,797,204)
Hardeman $
711,248,000 $ 168,355,498 0.237 $ (24,844,895)
Hardin $ 854,825,000 $ 358,503,379 0.419 $ 12,586,938
Haywood $ 585,679,000 $ 163,954,483 0.280 $ (17,106,881)
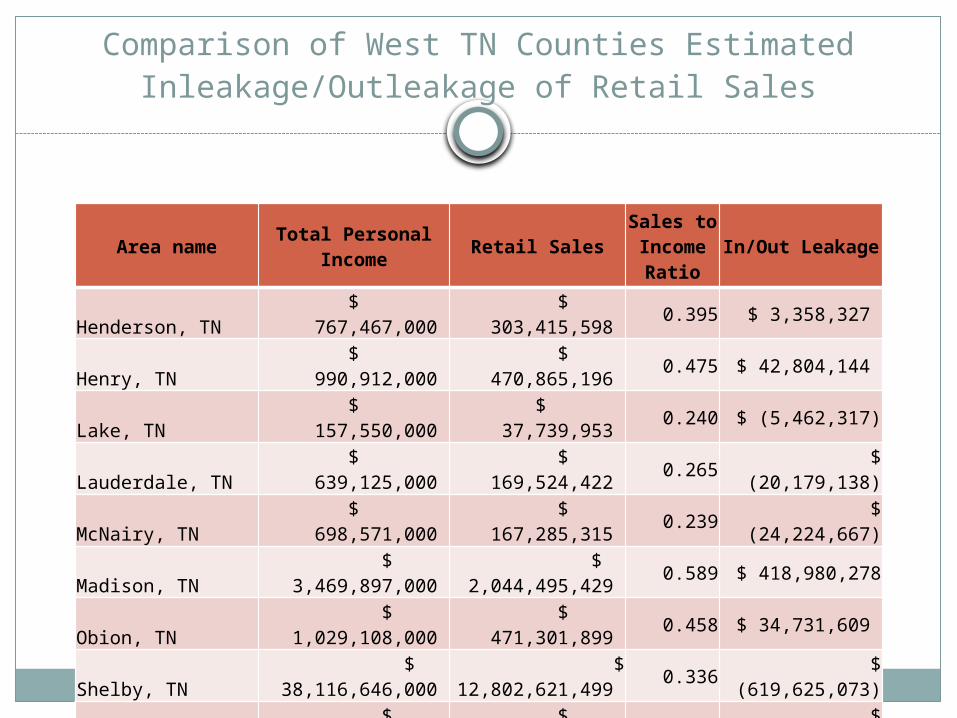
Comparison of West TN Counties Estimated Inleakage/Outleakage of Retail Sales
Area nameTotal Personal
IncomeRetail Sales
Sales to Income Ratio
In/Out Leakage
Henderson, TN $ 767,467,000 $ 303,415,598 0.395 $ 3,358,327
Henry, TN $ 990,912,000 $ 470,865,196 0.475 $ 42,804,144
Lake, TN $ 157,550,000 $ 37,739,953 0.240 $ (5,462,317)
Lauderdale, TN $ 639,125,000 $ 169,524,422 0.265 $ (20,179,138)
McNairy, TN $ 698,571,000 $ 167,285,315 0.239 $ (24,224,667)
Madison, TN $ 3,469,897,000 $ 2,044,495,429 0.589 $ 418,980,278
Obion, TN $ 1,029,108,000 $ 471,301,899 0.458 $ 34,731,609
Shelby, TN $ 38,116,646,000 $ 12,802,621,499 0.336 $ (619,625,073)
Tipton, TN $ 2,142,722,000 $ 430,638,303 0.201 $ (78,936,494)
Weakley, TN $ 1,038,164,000 $ 302,799,878 0.292 $ (28,042,213)

Comparison of Trade Area Estimated Inleakage/Outleakage of Retail Sales
Area nameTotal Personal
IncomeRetail Sales
Sales to Income Ratio
In/Out Leakage
Benton $463,308,000 $160,365,724 0.346 ($6,117,369)
Carroll $883,793,000 $227,507,567 0.257 ($28,860,832)
Chester $480,926,000 $128,068,111 0.266 ($15,109,927)
Crockett $470,187,000 $107,876,700 0.229 ($16,704,141)
Decatur $394,307,000 $90,895,699 0.231 ($13,975,962)
Gibson $1,519,810,000 $476,154,832 0.313 ($33,797,204)
Hardeman $711,248,000 $168,355,498 0.237 ($24,844,895)
Hardin $854,825,000 $358,503,379 0.419 $12,586,938
Haywood $585,679,000 $163,954,483 0.28 ($17,106,881)
Henderson $767,467,000 $303,415,598 0.395 $3,358,327
McNairy $698,571,000 $167,285,315 0.239 ($24,224,667)
Madison $3,469,897,000 $2,044,495,429 0.589 $418,980,278
Weakley $1,038,164,000 $302,799,878 0.292 ($28,042,213)

Unemployment Rates
2004 2005 2006 2007 2008 2009 2010 2011 20120.0
1.0
2.0
3.0
4.0
5.0
6.0
7.0
8.0
9.0
10.0 United StatesTennesseeMadison CountyTrade Area

Unemployment Rates
Area Labor Force Employment Unemployment Rate
Benton 6,950 6,240 710 10.2%
Carroll 13,800 12,300 1,500 10.9%
Chester 8,380 7,670 710 8.5%
Crockett 6,830 6,130 700 10.2%
Decatur 5,750 5,200 550 9.6%
Gibson 21,260 18,800 2,460 11.6%
Hardeman 10,910 9,700 1,200 11.0%
Hardin 12,160 11,000 1,150 9.5%
Haywood 8,770 7,790 980 11.2%
Henderson 12,510 11,190 1,320 10.6%
McNairy 10,730 9,690 1,040 9.7%
Madison 49,730 45,650 4,080 8.2%
Weakley 16,370 14,440 1,940 11.9%
Trade Area 184,150 165,800 18,340 10.0%

Madison County Job Growth
Year Labor Force Growth %
1987 36,890
1992 41,890 13.6%
1997 47,350 13.0%
2002 52,840 11.6%
2007 48,560 -8.1%
2012 49,730 2.4%

US Division of Labor
Natural Resources & Mining1.55% Construction
4.46%Manufacturing
9.26%
Wholesade Trade4.38%
Retail Trade11.56%
Transporta-tion, Ware-
housing & Util-ities
4.58%
Information0.32%
Financial Activities
5.88%
Professional & Business Services13%
Education & Health Ser-
vices23.82%
Leisure & Hospitality
11.01%
Other Services3.55%
Government5.63%
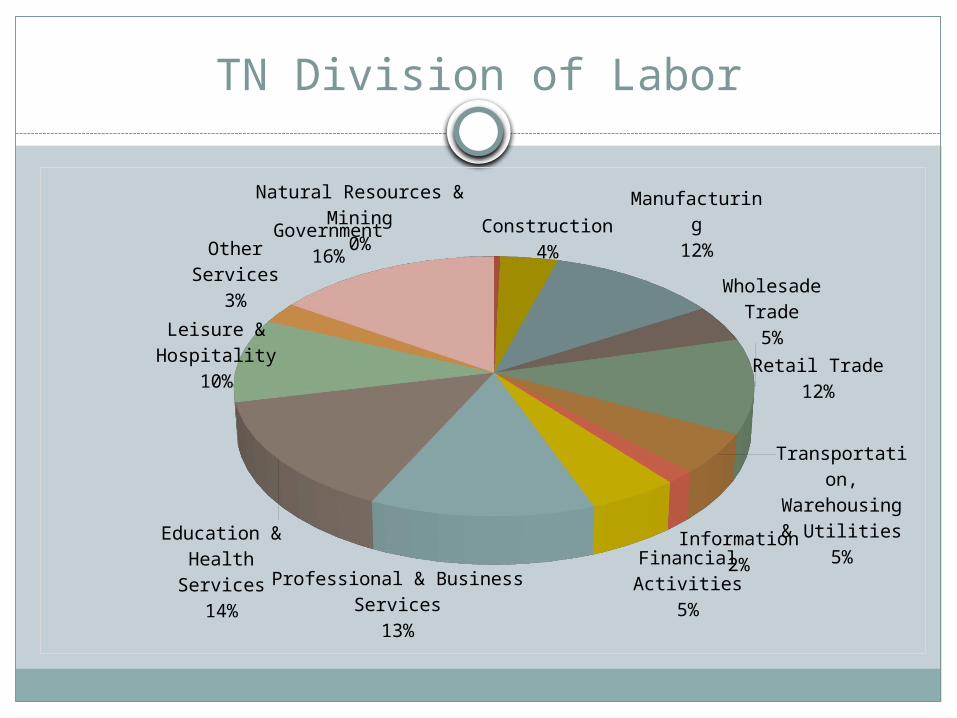
TN Division of Labor
Natural Resources & Mining0%
Construction4%
Manufacturing12%
Wholesade Trade5%
Retail Trade12%Transportation, Warehousing &
Utilities5%
Information2%
Financial Activ-ities5%
Professional & Business Services
13%
Education & Health Services
14%
Leisure & Hos-pitality
10%
Other Services3%
Government16%

Madison County Division of Labor
Natural Resources & Mining0.3%
Construction4.53%
Manu-facturing14.68%
Wholesade
Trade5.37%
Retail Trade
12.36% Trans-portation, Warehous-ing & Util-
ities2.6%
Infor-mation0.89%
Financial Activities
2.66%
Professional & Business Services
9.0%
Education & Health Services15.55%
Leisure & Hospital-
ity9.41%
Other Services1.52%
Gov-ern-ment
19.97%

2012 Tennessee Employment and Wages
Industry CategoryAnnual Average
EmployeesAnnual
Average Wage
Natural Resources & Mining 11,054 $ 38,931 Construction 104,556 $ 45,592 Manufacturing 303,250 $ 52,915 Wholesale Trade 117,538 $ 59,690 Retail Trade 309,954 $ 27,692 Transportation, Warehousing & Utilities 131,433 $ 48,839 Information 43,046 $ 57,072 Financial Activities 132,438 $ 61,537 Professional & Business Services 322,790 $ 47,688 Education & Health Services 372,504 $ 45,084 Leisure & Hospitality 267,034 $ 18,878 Other Services 70,246 $ 29,008 Government 416,901 $ 41,569 All Industry 2,602,744 $ 37,677

2012 Madison County Employment and Wages
Industry CategoryAnnual Average
EmployeesAnnual
Average Wage
Natural Resources & Mining 130 $ 37,283
Construction 2,439 $ 48,323
Manufacturing 7,910 $ 52,325
Wholesade Trade 2,895 $ 43,671
Retail Trade 6,660 $ 24,626
Transportation, Warehousing & Utilities 1,569 $ 39,436
Information 478 $ 41,995
Financial Activities 1,434 $ 49,358
Professional & Business Services 5,340 $ 28,962
Education & Health Services 8,377 $ 45,874
Leisure & Hospitality 5,070 $ 13,737
Other Services 817 $ 25,741
Government 10,760 $ 41,567
All Industry 53,879 $ 38,171

2012 United States Employment and Wages
Industry CategoryAnnual Average
EmployeesAnnual
Average Wage
Natural Resources & Mining 1,995,020 $ 55,944
Construction 5,763,476 $ 52,298
Manufacturing 11,950,963 $ 60,496
Wholesale Trade 5,657,062 $ 68,226
Retail Trade 14,931,239 $ 27,731
Transportation, Warehousing & Utilities 5,907,946 $ 53,023
Information 408,445 $ 81,955
Financial Activities 7,585,920 $ 80,110
Professional & Business Services 18,079,196 $ 64,487
Education & Health Services 30,756,551 $ 45,285
Leisure & Hospitality 14,214,919 $ 20,218
Other Services 4,587,757 $ 30,090
Government 7,270,858 $ 56,579
All Industry 131,696,378 $ 49,289
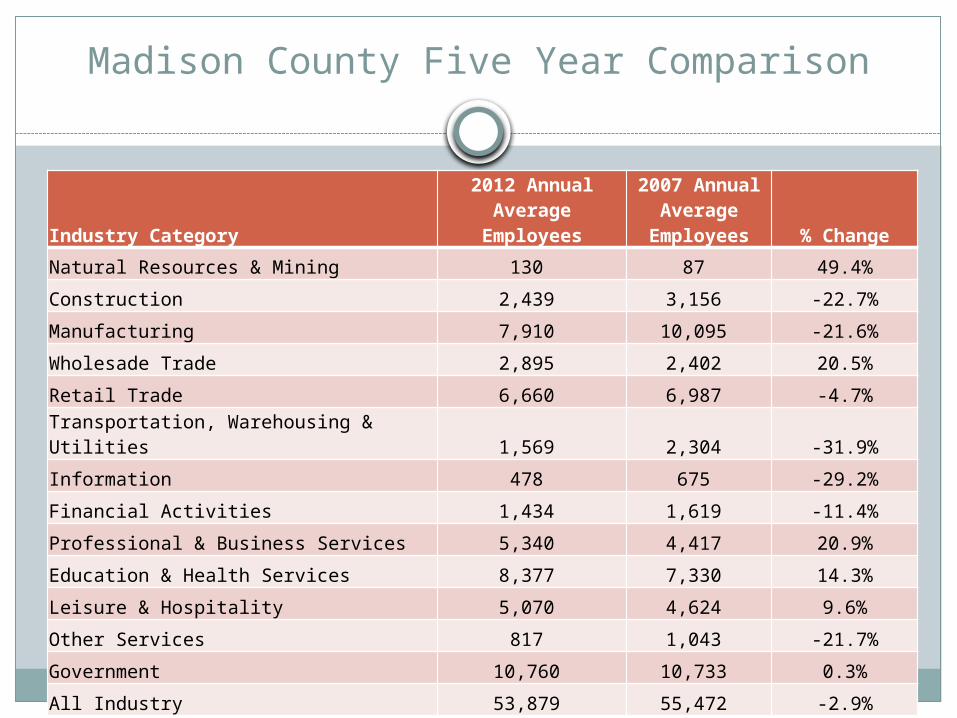
Madison County Five Year Comparison
Industry Category
2012 Annual Average
Employees
2007 Annual Average
Employees % Change
Natural Resources & Mining 130 87 49.4%
Construction 2,439 3,156 -22.7%
Manufacturing 7,910 10,095 -21.6%
Wholesade Trade 2,895 2,402 20.5%
Retail Trade 6,660 6,987 -4.7%
Transportation, Warehousing & Utilities 1,569 2,304 -31.9%
Information 478 675 -29.2%
Financial Activities 1,434 1,619 -11.4%
Professional & Business Services 5,340 4,417 20.9%
Education & Health Services 8,377 7,330 14.3%
Leisure & Hospitality 5,070 4,624 9.6%
Other Services 817 1,043 -21.7%
Government 10,760 10,733 0.3%
All Industry 53,879 55,472 -2.9%

Madison County Five Year Comparison
Industry Category 2012 Annual Average Wage
2007 Annual Average
Wage
% Change in Wages
Natural Resources & Mining $ 37,283 $ 34,568 7.9%
Construction $ 48,323 $ 43,970 9.9%
Manufacturing $ 52,325 $ 45,914 14.0%
Wholesale Trade $ 43,671 $ 39,111 11.7%
Retail Trade $ 24,626 $ 22,943 7.3%
Transportation, Warehousing & Utilities $ 39,436 $ 40,240 -2.0%
Information $ 41,995 $ 36,393 15.4%
Financial Activities $ 49,358 $ 39,780 24.1%
Professional & Business Services $ 28,962 $ 30,050 -3.6%
Education & Health Services $ 45,874 $ 43,501 5.5%
Leisure & Hospitality $ 13,737 $ 12,110 13.4%
Other Services $ 25,741 $ 22,131 16.3%
Government $ 41,567 $ 36,941 12.5%
All Industry $ 38,171 $ 35,481 7.6%

Residency Profile of Madison County Workforce
County of ResidenceWork in Madison
County% of Workforce
Benton 113 0.2%
Carroll 1,355 2.5%
Chester 2,360 4.3%
Crockett 1,833 3.3%
Decatur 166 0.3%
Gibson 4,973 9.0%
Hardeman 903 1.6%
Hardin 227 0.4%
Haywood 1,210 2.2%
Henderson 2,781 5.0%
Madison 38,126 69.1%
McNairy 667 1.2%
Weakley 444 0.8%
Total 55,158 100%

Trade Area Population Growth

Leigh Anne Bentley97 Director’s Row
Jackson, Tennessee 38305731-668-7367
Thank you!


