
A Dissertation
Entitled
The Roles of Information Systems Integration in the Supply Chain Integration
Context - Firm Perspective
by
Thawatchai Jitpaiboon
Submitted as partial fulfillment of the requirements for
the Doctor of Philosophy Degree in
Manufacturing Management
~ . ~.Advisor: Dr. T.S. Ragu-Nathan
7rf~ U~Advisor: Dr. Mark Vonderembse
The University of Toledo
June 2005

UMI Number: 3188242
____________________________________________________________
UMI Microform 3188242 Copyright 2006 by ProQuest Information and Learning Company.
All rights reserved. This microform edition is protected against unauthorized copying under Title 17, United States Code.
_______________________________________________________________
ProQuest Information and Learning Company
789 East Eisenhower Parkway P.O. Box 1346
Ann Arbor, MI 48106-1346

Committee Members,
Signature
Dr. Christine FoxAssociate Professor of Educational Research and MeasurementCollege of EducationThe University of Toledo
Dr~anet L. HartleyProfessor of ManagementCollege of Business AdministrationBowling Green State University
~rDr. Bhanu Ragu-bhthanProfessor of AccbuntingCollege of Business AdministrationThe University of Toledo
Date of Signature

iv
An Abstract of
The Roles of Information Systems Integration (ISI) in the Supply Chain Integration Context – Firm Perspective
Thawatchai Jitpaiboon
Submitted as partial fulfillment of the requirement for
The Doctor of Philosophy degree in
Manufacturing Management
The University of Toledo
June 2005
With advances in information technology (IT), information systems integration
(ISI) and its role in an integrated supply chain have become important to executives and
researchers. ISI represents the degree of cooperation in information system practices
between business functions within a firm and between a firm and its trading partners. It
has been documented that the introduction and utilization of ISI for supply chain
management enhance the firms’ competitiveness and growth. While many firms focus on
achieving high levels of IT utilization, without high levels of ISI, supply chain members
may not attain the full benefits of working within a supply chain.
The concept of ISI can be captured using two main sub-constructs (e.g., internal
ISI and external ISI) and can be conceptualized at three levels – (1) Strategic, (2)
Operational, and (3) Infrastructural. Studying the effects of ISI in these levels can help
researchers and executives understand how ISI practices at different levels contribute to

v
overall supply chain effectiveness. The implications of such an understanding may bring
significant benefits to both operations researchers and practitioners. Such benefits may
include making better decisions about which IT to utilize, which information systems (IS)
practices to emphasize, and what level of ISI to attain. From a practitioner’s perspective, this
research provides important guidelines so firms may better understand ISI issues and
effectively implement IT.
This study proposes three significant contributions to supply chain management
research. First, this study applies an information system perspective to study both causes
and effects of supply chain integration. It proposes a theoretical framework that considers
the role of ISI as a mediator between IT utilization and supply chain integration. Second,
this study provides the inferences made from an instrument that is valid and reliable for
the current study’s context, which are beneficial for both practitioners and academicians.
Third, it examines the effects of supply chain integration on a firm’s operational
performance; the effects of supply chain integration on a suppliers’ operational
performance, the effects of a suppliers’ operational performance on a firm’s operational
performance, the effects of a suppliers’ operational performance on a firm’s overall
performance, and the effects of a firm’s operational performance on the firm’s overall
performance.

vi
ACKNOWLEDGEMENTS
The completion of this dissertation would be impossible without generous help
and unstoppable advice from the following remarkable people.
First, I would like to express my whole hearted gratitude to Dr. T.S. Ragu-Nathan
and Dr. Mark Vonderembse, co-chairs of my dissertation, for their advice and wisdom
given with positive synergy and attitude. They made every effort to make my work
significant and worthwhile. They encouraged me to do better when I was down and
congratulated me when I reached their expectations. They showed concern for my
academic success and well-being as a person. It is my hope to continue our long-term
relationship. To Dr. Ragu and Dr. Vonderembse, thank you very much for being in my
life.
Second, equal thanks also go to Dr. Bhanu Ragu-Nathan, Dr. Janet Hartley, and
Dr. Christine Fox. Your suggestions were exceptional and undeniably brought significant
improvements to my dissertation. They were especially important for improving the
theory development.
Third, I would like to thank the Society of Manufacturing Engineers (SME) for
the letter of endorsement and the provision of the valuable mailing list. Special thank
goes to Mark Stratton (Community Relations Manager, Manufacturing Education &
Research Community), Mary Venianakis (List Manager), and Vincent Harrington
(Publication Manager).
Fourth, I would like to thank many professors: Dr. William Doll, Dr. Jeen S. Lim,
Dr. Ram Rachamadugu, Dr. Udayan Nandkeolyar, and other faculty members who were
valuable sources of knowledge and experience.

vii
Fifth, I am grateful for the financial support for this research provided by the
Miller College of Business, Ball State University. My humble gratitude goes to Dr. Tom
Harris (Chair of Information Systems and Operations Management), Dr. Lynn
Richardson (Dean of the Miller College of Business), Dr. Ray Montagno (Associate
Dean), and Dr. Rodney Davis (Associate Dean).
Lastly, I would like to thank my mother, my father, and my family for continually
supporting me.
viii
TABLE OF CONTENTS
ABSTRACT..........................................................................................................................iv
ACKNOWLEDGEMENTS ................................................................................................vi
LIST OF TABLES ...............................................................................................................xii
LIST OF FIGURES .............................................................................................................xiv
LIST OF APPENDICES .....................................................................................................xv
CHAPTER 1: INTRODUCTION.......................................................................................1 CHAPTER 2: LITERATURE REVIEW ..........................................................................8 2.1 ISI IN THEORY ..............................................................................................................9 2.2 CONSTRUCTS OF ISI....................................................................................................11 2.3 ISI FRAMEWORK AND ITS RELATED CONSTRUCTS...........................................15 2.3.1 Information Technology Utilization .............................................................................15 2.3.2 Supply Chain Integration ..............................................................................................20 2.4 PERFORMANCE INDICATORS...................................................................................23 2.4.1 Firm’s Operational Performance...................................................................................23 2.4.2 Supplier Performance....................................................................................................24 2.4.3 Firm Performance .........................................................................................................25 CHAPTER 3: THEORETICAL FRAMEWORK AND HYPOTHESES DEVELOPMENT ..........................................................................27 3.1 THEORETICAL FRAMEWORK...................................................................................27 3.2 IMPACTS OF IT UTILIZATION OF ISI (H1a and H1b) ..............................................30 3.3 IMPACTS OF IISI ON EISI (H2) ...................................................................................31 3.4 IMPACTS OF ISI ON SUPPLY CHAIN INTEGRATION (H3 and H4).......................32 3.5 IMPACTS OF SUPPLY CHAIN INTEGRATION ON OPERATIONAL PERFORMANCE (H5 and H6).............................................................................................33
ix
3.6 IMPACTS OF SUPPLIERS’ OPERATIONAL PERFORMANCE ON FIRM’S OPERATIONAL PERFORMANCE (H7) ............................................................................35 3.7 IMPACTS OF OPERATIONAL PERFORMANCE ON FIRM PERFORMANCE (H8 and H9) ...........................................................................................................................36 CHAPTER 4: INSTRUMENT DEVELOPMENT ITEM GENERATION AND PILOT TEST ......................................................................38 4.1 ITEM GENERATION.....................................................................................................39 4.2 PILOT TEST....................................................................................................................41 4.3 SCALE DEVELOPMENT: THE Q-SORT METHOD...................................................42 4.3.1 Sorting procedures ........................................................................................................43 4.3.2 Inter-rater reliabilities………………………………………………………………... 46 CHAPTER 5: INSTRUMENT DEVELOPMENT – LARGE SCALE ADMINISTRATION AND INSTRUMENT VALIDATION ..........................................52 5.1 SAMPLING PLAN..........................................................................................................52 5.1.1 Sampling plan and sampling design .............................................................................52 5.1.2 Sampling frame options ................................................................................................53 5.1.3 Random sampling generation .......................................................................................54 5.2 LARGE-SCALED DATA COLLECTION METHODOLOGY.....................................55 5.3 SAMPLING CHARACTERISTICS OF THE RESPONDENTS....................................57 5.3.1 Sampling characteristics of the respondents .................................................................58 5.3.2 Sampling characteristics of the surveyed organizations ...............................................59 5.3.3 Sampling characteristics of the supply chains ..............................................................61 5.3.4 Sampling characteristics of technology applications....................................................63 5.4 TEST OF NON-RESPONSES BIAS ..............................................................................64 5.5 TEST OF RESPONSES BIAS.........................................................................................65 5.6 LARGE-SCALE INSTRUMENT ASSESSMENT METHODOLOGY.........................66

x
5.7 LARGE-SCALE MEASURE RESULTS....................................................................72 5.7.1 Information Technology Utilization (ITU)...............................................................74 5.7.2 Internal Information System Integration (IISI).........................................................81 5.7.3 External Information System Integration (EISI).......................................................90 5.7.4 Supply Chain Integration (SCI) ................................................................................98 5.7.5 Suppliers’ Operational Performance (SOP)............................................................104 5.7.6 Firm’s Operational Performance (FOP)..................................................................111 5.7.7 Firm Performance (FP) ...........................................................................................118 5.8 DISCRIMINANT VALIDITY (SECOND-ORDER CONSTRUCT) .......................120 5.9 PREDICTIVE VALIDITY ........................................................................................122 CHAPTER 6: STRUCTURAL EQUATION MODELING, HYPOTHESES TESTING, AND SUMMARY OF RESULTS.............................................................123 6.1 THE PROPOSED STRUCTURAL MODEL............................................................124 6.2 STRUCTURAL EQUATION MODELING METHODOLOGY .............................126 6.3 STRUCTURAL MODEL TESTING RESULTS ......................................................130 6.3.1 Initial structural modeling results ...........................................................................131 6.3.2 Revised structural model.........................................................................................136 6.4 DISCUSSIONS OF STRUCTURAL MODELING AND HYPOTHESES TESTING RESULTS ........................................................................................................................137 6.5 STRUCTURAL EQUATION MODEL RESULTS – INDIRECT EFFECTS..........143 6.6 MODIFIED STRUCTURAL EQUATION MODEL RESULTS..............................145 6.7 DISCUSSIONS OF THE NEW PATHS ...................................................................148 6.8 SUMMARY OF RESULTS ......................................................................................149 CHAPTER 7: SUMMARY, LIMITATIONS, IMPLICATIONS, AND RECOMMENDATIONS FOR FUTURE RESEARCH.............................................151 7.1 SUMMARY...............................................................................................................151 7.2 IMPLICATIONS FOR PRACTITIONERS ..............................................................154 7.3 IMPLICATIONS FOR RESEARCHERS .................................................................157
xi
7.4 LIMITATIONS OF THE RESEARCH.....................................................................159 7.5 RECOMMENDATIONS FOR FUTURE RESEARCH............................................160 REFERENCE.................................................................................................................164
xii
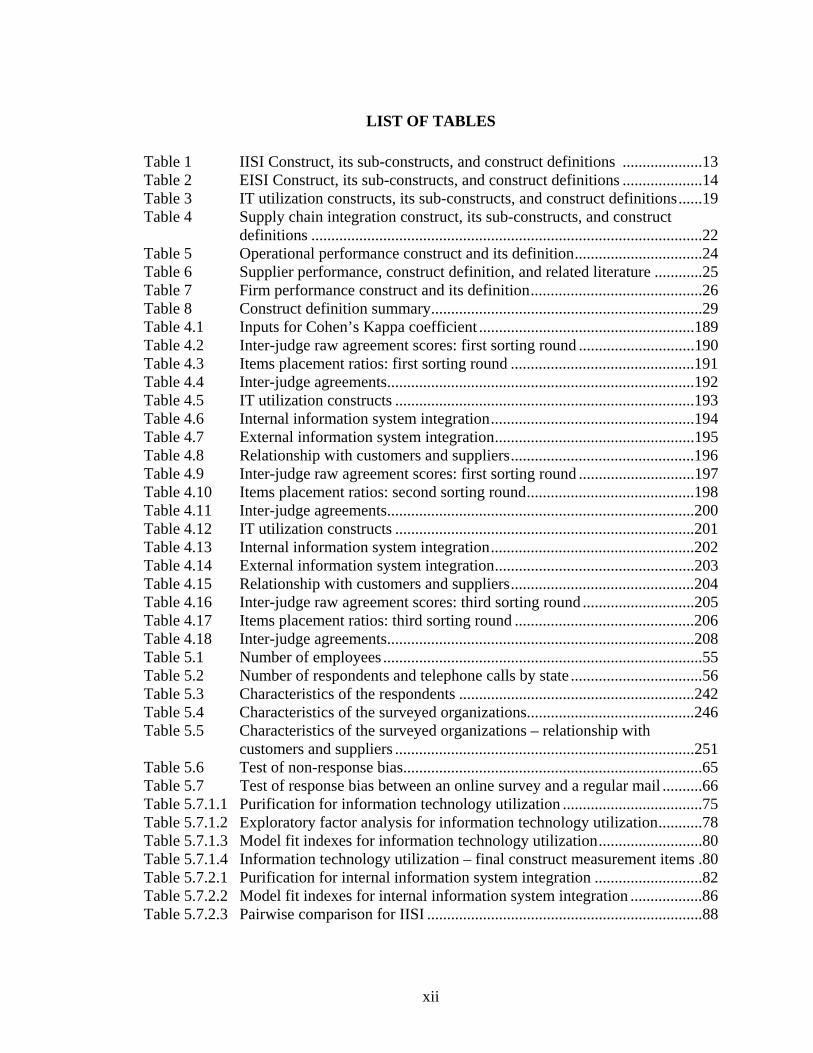
LIST OF TABLES
Table 1 IISI Construct, its sub-constructs, and construct definitions ....................13 Table 2 EISI Construct, its sub-constructs, and construct definitions ....................14 Table 3 IT utilization constructs, its sub-constructs, and construct definitions......19 Table 4 Supply chain integration construct, its sub-constructs, and construct
definitions ..................................................................................................22 Table 5 Operational performance construct and its definition................................24 Table 6 Supplier performance, construct definition, and related literature ............25 Table 7 Firm performance construct and its definition...........................................26 Table 8 Construct definition summary....................................................................29 Table 4.1 Inputs for Cohen’s Kappa coefficient ......................................................189 Table 4.2 Inter-judge raw agreement scores: first sorting round .............................190 Table 4.3 Items placement ratios: first sorting round ..............................................191 Table 4.4 Inter-judge agreements.............................................................................192 Table 4.5 IT utilization constructs ...........................................................................193 Table 4.6 Internal information system integration...................................................194 Table 4.7 External information system integration..................................................195 Table 4.8 Relationship with customers and suppliers..............................................196 Table 4.9 Inter-judge raw agreement scores: first sorting round .............................197 Table 4.10 Items placement ratios: second sorting round..........................................198 Table 4.11 Inter-judge agreements.............................................................................200 Table 4.12 IT utilization constructs ...........................................................................201 Table 4.13 Internal information system integration...................................................202 Table 4.14 External information system integration..................................................203 Table 4.15 Relationship with customers and suppliers..............................................204 Table 4.16 Inter-judge raw agreement scores: third sorting round ............................205 Table 4.17 Items placement ratios: third sorting round .............................................206 Table 4.18 Inter-judge agreements.............................................................................208 Table 5.1 Number of employees ................................................................................55 Table 5.2 Number of respondents and telephone calls by state .................................56 Table 5.3 Characteristics of the respondents ...........................................................242 Table 5.4 Characteristics of the surveyed organizations..........................................246 Table 5.5 Characteristics of the surveyed organizations – relationship with
customers and suppliers ...........................................................................251 Table 5.6 Test of non-response bias...........................................................................65 Table 5.7 Test of response bias between an online survey and a regular mail ..........66 Table 5.7.1.1 Purification for information technology utilization ...................................75 Table 5.7.1.2 Exploratory factor analysis for information technology utilization...........78 Table 5.7.1.3 Model fit indexes for information technology utilization..........................80 Table 5.7.1.4 Information technology utilization – final construct measurement items .80 Table 5.7.2.1 Purification for internal information system integration ...........................82 Table 5.7.2.2 Model fit indexes for internal information system integration ..................86 Table 5.7.2.3 Pairwise comparison for IISI .....................................................................88

xiii
Table 5.7.2.4 Internal information system integration – final construct measurement items...........................................................................................................89
Table 5.7.3.1 Purification for external information system integration...........................91 Table 5.7.3.2 Model fit indexes for external information system integration .................94 Table 5.7.3.3 Pairwise comparison for EISI ....................................................................96 Table 5.7.3.4 External information system integration – final construct measurement
items...........................................................................................................97 Table 5.7.4.1 Purification for supply chain integration ...................................................99 Table 5.7.4.2 Model fit indexes for supply chain integration ........................................101 Table 5.7.4.3 Pairwise comparison for supply chain integration...................................102 Table 5.7.4.4 Supply chain integration – final construct measurement items ...............103 Table 5.7.5.1 Purification for suppliers’ operational performance ................................104 Table 5.7.5.2 Model fit indexes for suppliers’ operational performance.......................107 Table 5.7.5.3 Pairwise comparison for suppliers’ operational performance .................109 Table 5.7.5.4 Suppliers’ operational performance – final construct measurement items110 Table 5.7.6.1 Purification for firm’s operational performance ......................................111 Table 5.7.6.2 Model fit indexes for firm’s operational performance.............................114 Table 5.7.6.3 Pairwise comparison for firm’s operational performance .......................116 Table 5.7.6.4 Firm’s operational performance – final construct measurement items....117 Table 5.7.7.1 Purification for firm performance............................................................118 Table 5.7.7.2 Model fit indexes for firm performance...................................................119 Table 5.7.7.3 Firm performance – final construct measurement items..........................119 Table 5.8.1 Goodness of fit indexes for first and second order model .......................121 Table 5.9.1 Construct-level correlation analysis results .............................................122 Table 6.2.1 The relationship between r and r2 ............................................................130 Table 6.3.1 Initial AMOS structural modeling results................................................134 Table 6.3.2 Revised structural modeling results .........................................................136 Table 6.5.1 Structural modeling result – indirect effects............................................145 Table 6.6.1 Final structural modeling results..............................................................146
xiv
LIST OF FIGURES Figure 2.1 Theoretical framework for information system integration ......................18 Figure 3.1 Theoretical framework for information system integration ......................28 Figure 4.1 Q-sort login page........................................................................................44 Figure 4.2 Q-sort page.................................................................................................45 Figure 4.3 Web-site to calculate Cohen’s Kappa Coefficient ...................................209 Figure 4.4 The result of computing Cohen’s Kappa ................................................210 Figure 5.3.1.1 Respondents by job title...........................................................................243 Figure 5.3.1.2 Respondents by job function....................................................................243 Figure 5.3.1.3 Level of education....................................................................................244 Figure 5.3.1.4 Respondents by years worked at the organization...................................244 Figure 5.3.1.5 Respondents by years of work .................................................................245 Figure 5.3.2.1 Major business .........................................................................................248 Figure 5.3.2.2 Organizations by SIC code ......................................................................248 Figure 5.3.2.3 Organizations by primary production system..........................................249 Figure 5.3.2.4 Organizations by primary manufacturing system....................................249 Figure 5.3.2.5 Organizations by # of employees.............................................................250 Figure 5.3.2.6 Organizations by annual sales..................................................................250 Figure 5.3.3.1 Electronic transactions with customers and suppliers .............................252 Figure 5.3.3.2 Organizations by supply chain horizontal structure.................................252 Figure 5.3.3.3 Organizations by supply chain position...................................................253 Figure 5.6.1 Model A .....................................................................................................71 Figure 5.6.2 Model B .....................................................................................................71 Figure 6.1 Theoretical framework for information system integration.....................125 Figure 6.2 Structural model for information system integration framework ............132 Figure 6.3 Path analysis for information system integration framework ..................133 Figure 6.4 Revised path analysis for information system integration framework ....135 Figure 6.5 Final path analysis for information system integration framework .........147

xv
LIST OF APPENDICES APPENDIX A: MEASUREMENT ITMES ..................................................................174 APPENDIX B: COHEN’S KAPPA AND MORRE AND BENBASAT COEFFICIENT................................................................................................................180 APPENDIX C: THE FINAL VERSION OF QUESTIONNAIRE ................................208 APPENDIX D: LARGE-SCALE MAIL SURVEY QUESTIONNAIRE......................211
APPENDIX E: FACTS AND CHECKLIST .................................................................212
APPENDIX F: MANUFACTURING & IT SURVEY ..................................................213
APPENDIX G: SURVEY ONLINE VERSION ............................................................225
APPENDIX H: MAILING ENVELOP DESIGN ..........................................................234
APPENDIX I: RETURN MAIL ENVELOP DESIGN ..................................................235 APPENDIX J: FOLLOW UP LETTER .........................................................................236 APPENDIX K: LETTER OF ENDORSEMENT FROM SME .....................................237 APPENDIX L: CALLING SCRIPTS............................................................................238 APPENDIX M: SAMPLE CHARACTERISTICS........................................................239 APPENDIX N: THE QUESTIONNAIRE RECOMMENDED FOR FUTURE RESEARCH ..................................................................................................................251 APPENDIX O: IRB FROM UNIVERSITY OF TOLEDO ..........................................263 APPENDIX P: IRB FROM BALL STATE UNIVERSITY ..........................................264
1
CHAPTER 1: INTRODUCTION
A supply chain is a network of companies connected via a set of serial and
parallel supplier-customer relationships from the first supplier to the final customer. A
supply chain involves an interwoven coordination of logistics planning activities among
supply chain members, which include all of the capabilities and functions required to
design, fabricate, distribute, sell, support, use, and recycle or dispose of a product, as well
as the associated information that flows up and down the chain (National research
council, 2000). Supply chains are typically comprised of geographically dispersed
facilities and capabilities, including sources of raw materials, product design and
engineering organizations, manufacturing plants, distribution centers, retail outlets, and
customers, as well as the transportation and communications links between them. As
firms are continually participating in the global market to stay competitive, they are
facing many challenges that include expanding global competition, advancing technology
and innovation, increasing customer expectations, and growing supply chain complexity.
These challenges are expected to continuously increase in intensity and complexity. To
cope with these challenges, firms are applying advanced information technology (IT) to
move toward ever-increasing supply chain integration in both inter- and intra-
organizations.
An integrated supply chain is an association of customers and suppliers who work
together to optimize their collective performance in the creation, distribution, and support
of an end product. All supply chains are integrated to some extent by focusing and
2
coordinating the relevant resources of each participant to optimize the overall
performance of the chain. Therefore, supply chain integration is a continuous process that
can be optimized when supply chain members work together to improve their
relationships and when all participants are aware of key activities at all levels in the
chain.
Information Technology (IT) is playing an increasingly critical role in the success
or failure of the supply chain. IT ranks highly as the essential ingredient and backbone for
the success of supply chain integration (Barut et al., 2002). IT has become one of the
keys to operating success. It is impossible to achieve an effective supply chain without
IT. Since suppliers are located all over the world, it is essential to integrate the activities
both inside and outside of an organization. This requires an integrated information system
(IS) for sharing information on various value-adding activities along the supply chain
(Gunasekaran and Ngai, 2004; Gangopadhyay and Huang, 2004). As the concept of
competing between supply chains grows more intense and widespread because of
inevitable global competition, IT utilization has changed its role from back office and
operational support to strategic imperative. Firms have started to utilize IT to directly
influence the processes of comprising the value chain (Rushton and Oxley 1994;
Williams et al., 1997). Increasingly, IT is used to facilitate internal coordination within a
firm and enhance external integration with external constituencies (e.g., customers and
suppliers) and also to enhance decision making among supply chain members. This
phenomenon is evident by the increased usage of information systems for integration
purposes; for instance, information systems infrastructure (e.g., data communication
tools, network connection, standard data structure, and unified coding standards),

3
information systems software (e.g., enterprise-wide information system such as SAP),
and information systems applications (e.g., centralized database management systems,
electronic data interchange (EDI), web-based or internet-base information systems).
Although the advances in formation technologies are considered a key driver of supply
chain integration; what is the best way to deploy these technologies and to coordinate
supply chain-wide activities is still under research (Gangopadhyay and Haung, 2004).
This research is an attempt to study and understand the phenomenon by which IT
has been used for integration purposes in the supply chain context and to examine how
Information Systems Integration (ISI) relates to other factors (direct and indirect) at the
organizational level. ISI is the degree of cooperation in information system practices
between business functions within a firm and between the firm and its trading partners.
ISI represents how top management perceives the extent of coordination on each IS
activity, which the firm chooses to perform internally or to interact with its trading
partners. At the functional level, ISI helps firms to use data from existing, heterogeneous,
distributed sources by providing integration capabilities that support the illusion that a
single integrated IS is being used in the supply chain. At the operational level, ISI offers
supply chain members the possibility of increased productivity and customer
responsiveness. ISI enhances the firm’s operational performance by integrating similar
functions over different areas and by curtailing unnecessary activities, thus enhancing the
firm’s capability to cope with sophisticated customer needs and to meet product quality
standards, improve product quality, enhance productivity, increase equipment utilization,
reduce space requirements, and expand logistics efficiency and flexibility (Bardi,
Raghunathan, and Bagchi, 1994; Gross, 1984; Kaltwasser, 1990). At the strategic level,

4
ISI helps businesses not only to automate their activities, but also to reshape and improve
their business processes (Venkatraman, 1991).
In spite of a general understanding of the useful roles of ISI in enhancing firms’
competitive position, the empirical investigation explaining both causes and impacts of
ISI has been scarce in literature. The previous studies related to ISI have three major
shortcomings. First, though there have been some studies discussing the issues of ISI,
most of these studies are functionally focused and not in the supply chain context (Wyse
and Higgins, 1993; Webber and Pliskin, 1996; Bhatt, 2000). The empirical investigation
of the roles of ISI in the supply chain context and the establishment of an instrument to
measure the concept of ISI are still lacking.
Second, although benefits of IT utilization in enhancing organizational
performance are well documented in literature (Kim and Narasimhan, 2002; Rushton and
Oxley, 1994; William et al., 1997; Bardi et al., 1994; Carter and Narasimhan, 1995;
Gross 1984; Kaltwasser, 1990), the mechanism by which IT utilization enhances supply
chain integration through ISI is not fully developed. Although some studies have pointed
out that IT utilization can lead to productivity, performance, and differential and
sustainable competitive advantages because it can strengthen linkages between functions
within a firm and between firms (Hammer, 1990; Hammer & Champy, 1993; Davenport
& Short, 1990; Venkatraman, 1994; Kim and Narasimhan, 2002; Narasimhan and Kim,
2001), empirical studies have not shown consistent results. In fact, several studies have
shown that, in some instances, IT investment has had negative, dysfunctional effects on
organizational productivity and performance (Hitt & Brynjolfsson, 1994; Roach, 1989;
Weill, 1988).
5
Third, the study of both the causes and effects of ISI in the supply chain context at
the organizational level is not fully developed and needs more attention from both
practitioners and academicians.
Because the current literature still lacks a clear explanation of the role of ISI in
enhancing the relationship between IT utilization and supply chain integration, this study
seeks to provide three main contributions. First, a measurement of ISI is developed.
Through an extensive literature review, the study identifies three levels of ISI (1)
strategic integration, (2) operational integration, and (3) infrastructural integration, and
two sub-constructs of ISI (1) Internal ISI (IISI) and (2) External ISI (EISI). This
instrument is useful for both practitioners and academicians because it provides an
appropriate set of ISI practices that firm can adopt to gain optimal benefits from
integration of supply chain activities. Three dimensions of ISI guarantees that the
implemented IS can be used to link all activities within and between firms.
Second, this study investigates the mediating role of ISI on the relationship
between IT utilization and supply chain integration. According to the productivity
paradox theory, the mediating role of ISI in ISI framework combined with the results
from this study might be useful to explain the negative relationship between IT utilization
and organizational performance found in previous studies (Hitt & Brynjolfsson, 1994;
Roach, 1989; Weill, 1988; Dos Santos and Sussman, 2000). Small part-manufacturers,
for instance, were forced by larger firms such as Ford and GM to implement IT projects
such as EDI. However, the full benefits of technology utilization are hardly recognized
due to the lack of systematic, hand-on practices which can help firms realize the potential
benefits of IT. Without a higher level of ISI, benefits of supply chain integration may not

6
be fully attained (Bhatt & Stump, 2001). ISI enhances the organizational capability to
make decisions on which IT is to be utilized, which IS practices is to be emphasized, and
on what levels of ISI to focus. From a practitioner’s point of view, this research provides
important guidelines for a firm to better understand ISI issues and to more effectively
implement IT.
Third, this study proposes a theoretical framework to study causes and effects of
ISI. This framework is tested using a large-scale survey methodology. The unit of
analysis is at the organizational level and the targeted respondents are high level
managers of manufacturing firms. The important relationships tested include: (1) direct
impact of IT utilization on internal ISI; (2) direct impact of IT utilization on external ISI;
(3) direct impact of internal ISI on external ISI; (4) direct impact of internal ISI on supply
chain integration; (5) direct impact of external ISI on supply chain integration; (6) direct
impact of supply chain integration on firm’s operational performance; (7) direct impact of
supply chain integration on suppliers’ operational performance; (8) direct impact of
suppliers’ operational performance on firm’s operational performance; (9) direct impact
of suppliers’ operational performance on firm’s overall performance; and (10) direct
impact of firm’s operational performance on firm’s overall performance.
Chapter 2 reviews the literature on theoretical foundation and constructs
development. The overall framework that depicts the relationships between the constructs
and the development of hypotheses are presented in Chapter 3. The research
methodology for generating items for measurement instruments appears in Chapter 4.
The large scale administration and instrument validation are coved in Chapter 5. Chapter
6 covers the structural equation modeling methodology for hypotheses testing and

7
summary of results. Lastly, summary of the study, limitations, implications, and
recommendations for future research are covered in Chapter 7.

8
CHAPTER 2: LITERATURE REVIEW
The globalization of markets and manufacturing has forced the management of
supply chains to consider not only business processes in the traditional value chain, but
also processes that penetrate networks of organizations. Thus, ISI research has turned
from an intra-enterprise focus towards an inter-enterprise focus. Noori and Mavaddat
(1998) discussed ISI as “enterprise-wide systems” which enable a much greater degree of
integration through greater speed and flexibility in the way firms integrate their internal
and external activities. A higher degree of ISI creates information visibility and captures
the moments of information which enable collaborative members of the supply chain to
manage their business processes better (Lummus and Vokkurka, 1999).
Despite the widely held belief that information technology (IT) is fundamental to
a firm’s survival and growth, scholars are still struggling to specify the underlying
mechanisms linking IT to organizational performance (Bharadwaj, 2000). Anecdotal
evidence and case studies have found that effective and efficient use of IT is a key factor
differentiating successful firms from their less successful counterparts (Byrd and
Marshall, 1997; Hammer, 1990; Hammer & Champy, 1993; Davenport & Short, 1990;
Venkatraman, 1994). Although evidence from many case studies suggests that IT
increases productivity and performance (Hammer, 1993; Hammer & Champy, 1993;
Davenport & Short, 1990; Venkatraman, 1994), empirical evidence from large sample
studies has not been as readily forthcoming. In fact, several studies have shown that, in
some instances, IT investment has had negative, dysfunctional effects on organizational

9
productivity and performance (Hitt & Brynjolfsson, 1994; Roach, 1989; Weill, 1988).
There is evidence that many firms, concerned about falling behind on the technology
curve, engage in high IT investments without deriving any benefits from IT (Nolan
1994). Despite the substantial investment in IT by corporations, direct linkage between
technology utilization and increases in productivity and performance has been extremely
elusive. Therefore, this study attempts to explain this missing link using the ISI concept.
2.1. ISI IN THEORY
The study of ISI started as early as 1985. Mudie and Schafer (1985) analyzed ISI
in process terms, as they believed ISI should not only facilitate the process of
development and use of data, applications, and other processing technology, but also
should provide the flexibility to meet the future business demands in workstations,
processing types, and applications. Wyse and Higgins (1993) defined ISI as the extent to
which data and applications through different communication networks can be shared and
accessed for organizational use. They defined ISI into two components: data integration
and technical integration. Data integration refers to the relevancy of the information that
is collected, processed, and disseminated throughout the firm. Technical integration
concerns the physical or formal linkage of information systems and subsystems that are
used by the firm.
Webber and Pliskin (1996) defined ISI in the merger or acquisition context as the
extent of the integration of IS and data processing functions with financial systems,
which are usually a critical component of the IS. The findings point to a positive
relationship between ISI and effectiveness only when controlling IT intensity and

10
organizational culture differences between the joining firms. Stylianou et al. (1996) also
studied ISI framework in the merger and acquisition context conducted by the American
Management Association (AMA). The framework examines the relationships between
the measure of ISI success and the components that affect it. ISI success was measured
using a multidimensional attribute as: 1) IS-assessment of the success of the integration
process and integrated systems; 2) the ability to exploit to avoid opportunities arising
from a merger; 3) the ability to avoid problems stemming from the merger; and 4) the
end-user satisfaction with the integration process and integrated systems. Following this
study, Robbies and Stylianou (1999) modified the ISI success measure to fit with the
post-merger system integration context. The improved IS capability construct was added.
They argued that the measure relating to improved IS capabilities that helped support the
underlying motives for the merger is important and should be included.
Bhatt (2000) studied the relationship between ISI and business process
improvement. He argued that, at a conceptual level, ISI can be viewed as data
architectures, communication networks, and support firms. He used two aspects to
measure the degree of ISI: Data integration and communication networks integration. The
data integration was defined as the extent to which different firms can share a number of
databases for coordinating their activities. Communication networks integration was
defined as the extent to which different information systems can communicate with other
wide information systems to coordinate present and future activities depending on
network connectivity and network flexibility.

11
2.2. CONSTRUCTS OF ISI
Previous studies have discussed the role of ISI in tactical and operational
perspectives suitable for the context of studies such as process development, financial
research or merger and acquisition. Researchers mostly looked at only functional aspects
of ISI, for instance, data integration and communication networks integration (Madnick,
1991; 1995; Wyse and Higgins, 1993; Bhatt, 2000; Wainwright and Waring, 2004;
Themistocleous et al., 2004), the extent of IS and data processing functions and the extent
of integration of financial systems (Webber and Pliskin, 1996), integration of
heterogeneous information systems, databases, or application software, integration of
different physical stages in business processes, and integration of subsystems into a well-
coordinated network system (Sikora and Shaw, 1998; Cohen and Lee, 1988). None of the
previous studies focused on ISI research at the strategic level. In addition, previous
studies considered ISI as a success measure, not as a practice (Stylianou et al., 1996;
Robbies and Stylianou, 1999).
In the inter-and intra-organizational supply chain context where integration of
corporate entities can produce dynamic and synergistic opportunities, ISI should not only
be viewed as traditional back office and processing support, but also as strategic support.
Porter and Millar (1985) asserted that management of information systems can no longer
be the only provision of functional activities such as accounting and record keeping. The
use of advanced information systems in value chain activities allows companies to
enhance competitive differentiation as well as attain cost leadership and sustainable
competitive advantage (Kim and Narasimhan, 2002). McFarlan and McKenny (1984)

12
showed in their information systems strategic grid that the role of IS should change from
operational supporter to strategic enabler in order to form competitive success.
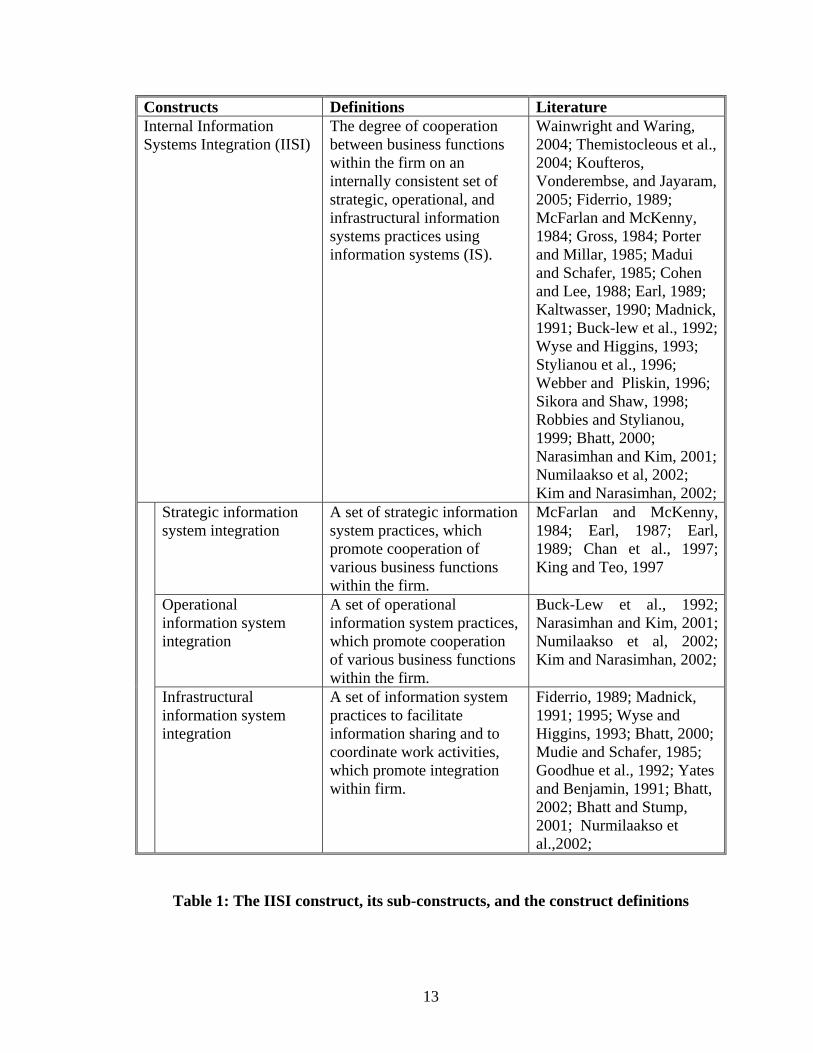
In this study, from a firm’s perspective, ISI is the degree of cooperation between
business functions within the firm (IISI) and between a firm and its trading partners
(EISI) on an internally consistent set of strategic, operational, and infrastructural
information systems practices using information systems (IS). ISI can be defined using
two sub-constructs – IISI and EISI. Table 1 displays the IISI construct, its sub-constructs,
and the construct definitions and Table 2 shows the EISI construct, its sub-constructs, and
the construct definitions.
13
Constructs Definitions Literature Internal Information Systems Integration (IISI)
The degree of cooperation between business functions within the firm on an internally consistent set of strategic, operational, and infrastructural information systems practices using information systems (IS).
Wainwright and Waring, 2004; Themistocleous et al., 2004; Koufteros, Vonderembse, and Jayaram, 2005; Fiderrio, 1989; McFarlan and McKenny, 1984; Gross, 1984; Porter and Millar, 1985; Madui and Schafer, 1985; Cohen and Lee, 1988; Earl, 1989; Kaltwasser, 1990; Madnick, 1991; Buck-lew et al., 1992; Wyse and Higgins, 1993; Stylianou et al., 1996; Webber and Pliskin, 1996; Sikora and Shaw, 1998; Robbies and Stylianou, 1999; Bhatt, 2000; Narasimhan and Kim, 2001; Numilaakso et al, 2002; Kim and Narasimhan, 2002;
Strategic information system integration
A set of strategic information system practices, which promote cooperation of various business functions within the firm.
McFarlan and McKenny, 1984; Earl, 1987; Earl, 1989; Chan et al., 1997; King and Teo, 1997
Operational information system integration
A set of operational information system practices, which promote cooperation of various business functions within the firm.
Buck-Lew et al., 1992; Narasimhan and Kim, 2001; Numilaakso et al, 2002; Kim and Narasimhan, 2002;
Infrastructural information system integration
A set of information system practices to facilitate information sharing and to coordinate work activities, which promote integration within firm.
Fiderrio, 1989; Madnick, 1991; 1995; Wyse and Higgins, 1993; Bhatt, 2000; Mudie and Schafer, 1985; Goodhue et al., 1992; Yates and Benjamin, 1991; Bhatt, 2002; Bhatt and Stump, 2001; Nurmilaakso et al.,2002;
Table 1: The IISI construct, its sub-constructs, and the construct definitions

14
Constructs Definitions Literature External Information Systems Integration (EISI)
The degree of cooperation between a firm and its trading partners on an internally consistent set of strategic, operational, and infrastructural information systems practices using information systems (IS).
Wainwright and Waring, 2004; Themistocleous et al., 2004; Fiderrio, 1989; McFarlan and McKenny, 1984; Gross, 1984; Porter and Millar, 1985; Madui and Schafer, 1985; Cohen and Lee, 1988; Earl, 1989; Kaltwasser, 1990; Madnick, 1991; Buck-lew et al., 1992; Wyse and Higgins, 1993; Stylianou et al., 1996; Webber and Pliskin, 1996; Sikora and Shaw, 1998; Robbies and Stylianou, 1999; Bhatt, 2000; Narasimhan and Kim, 2001; Numilaakso et al, 2002; Kim and Narasimhan, 2002;
Strategic information system integration
A set of strategic information system practices, which promote cooperation between a firm and its external constituencies such as customers and suppliers.
McFarlan and McKenny, 1984; Earl, 1987; Earl, 1989; Chan et al., 1997; King and Teo, 1997
Operational information system integration
A set of operational information system practices, which promote cooperation between a firm and its external constituencies such as customers and suppliers.
Buck-Lew et al., 1992; Narasimhan and Kim, 2001; Numilaakso et al, 2002; Kim and Narasimhan, 2002;
Infrastructural information system integration
A set of information system practices to facilitate information sharing and to coordinate work activities, which promote integration between a firm and its external constituencies such as customers and suppliers.
Fiderrio, 1989; Madnick, 1991; 1995; Wyse and Higgins, 1993; Bhatt, 2000; Mudie and Schafer, 1985; Goodhue et al., 1992; Yates and Benjamin, 1991; Bhatt, 2002; Bhatt and Stump, 2001; Nurmilaakso et al.,2002;
Table 2: The EISI construct, its sub-constructs, and the construct definitions
15
2.3. ISI FRAMEWORK AND ITS RELATED CONSTRUCTS
2.3.1. Information Technology Utilization
Previously, the introduction of IT was viewed as a back office support limited to
the automation of clerical functions (Kim and Narasimhan, 2002). With the realization of
global competition and advances in information technology, the utilization of IT can have
a direct effect on value creation by integrating firm’s supply chain activities resulting in
higher quality products, enhanced productivity, efficient machine utilization, reduced
space and increased logistics efficiency and flexibility (Gross, 1984; Kaltwasser, 1990;
Kim and Narasimhan, 2002). Porter and Millar (1985) asserted that the utilization of IT
has a significant influence on the relationships between value chain activities as well as
on the physical aspects of individual value chain activities. IT provides competitiveness
to firms such as: (a) creating value for customers; (b) creating value for companies; (c)
optimizing or integrating value chains through IT to improve competitiveness; and (d)
accommodating the creation of a new value chain. Earl (1989) asserted that IS must be
considered as a strategic weapon. This view focuses the utilization of IS more in strategic
and managerial activities than in operational areas. He classified the scope of IT into four
categories: (1) IT used to automate or improve the physical aspects of every activity; (2)
IT used to physically connect each value activity or to control the activities at the
connecting point; (3) IS used to facilitate the implementation, support, and management
of value activities, and (4) IS used to optimize or to adjust the connection of each value
activity. Kyobe (2004) purported that strategic IT utilization plays a significant role in
supporting the development and building of core and distinctive competencies which
enable a firm to create a competitive advantage. Jane et al. (2004) argued that advances in
16
information technology have been a primary enabler for firms’ focus on
Interorganizational business processes. Gangopaddyay and Hauang (2004), using
simulation, claimed that the advances in formation technologies make information
sharing possible, and these advances actually become a key driver of supply chain
integration. However, what is the best way to deploy these technologies and to coordinate
supply chain-wide activities is still under research.
This study adopts IT utilization from previous studies (Narasimhan and Kim,
2001; Kim and Narasimhan, 2002; Narasimhan and Kim, 2002). Narasimhan and Kim
(2001) proposed measuring IT utilization using three sub-constructs. The three constructs
include: (1) IS for infrastructural support (e.g., network plan and design system,
accounting information system, and office information system); (2) IS for value creation
management (e.g., production plan and process control system, sales and price
management system, customer service and customer management system, and inventory
and warehouse management system), and (3) IS for logistical operations (e.g.,
transportation management system, forecasting system, automatic ordering system,
resource management system, and plant warehouse location selection system). They
argued that the strategic utilization of IT has two major points in common. First, the role
of IS must be raised from information processing to utilization of technology to change
an existing value chain or create a new value chain. Second, IT should not only automate
and improve the physical aspect of value activities, but also create and optimize the
structural connection among supply chain activities. The IT utilization proposed by
Narasimhan and Kim (2001) focuses only on physical and operational aspects of IS.
Although these two points have significant implications for supply chain activities, these
17
two points might not fully cover the concept of IT utilization in a supply chain integration
context where strategic impacts of IT are far more important than operational and
physical impacts. This study proposes to measure IT utilization using three sub-
constructs: Strategic IT, Operational IT, and Infrastructural IT. Figure 2.1 shows the
constructs and sub-constructs of IT utilization.

18
Figure 2.1: Theoretical framework for information systems integration
External Information Systems Integration
• Strategic integration • Operational integration • Infrastructural integration
Firm’s Operational Performance • Delivery reliability • Process flexibility • Cost leadership • Product innovation • Product quality
Firm Performance • Market share • Return of investment • Customer satisfaction • Sales growth • Profitability
Information Technology Utilization • Strategic IT • Operational IT • Infrastructural IT
Internal Information Systems Integration • Strategic integration • Operational integration • Infrastructural integration
Suppliers’ Operational Performance • Delivery reliability • Process flexibility • Cost leadership • Product innovation • Product quality
Supply Chain Integration • Integration with Customers • Integration with Suppliers
19
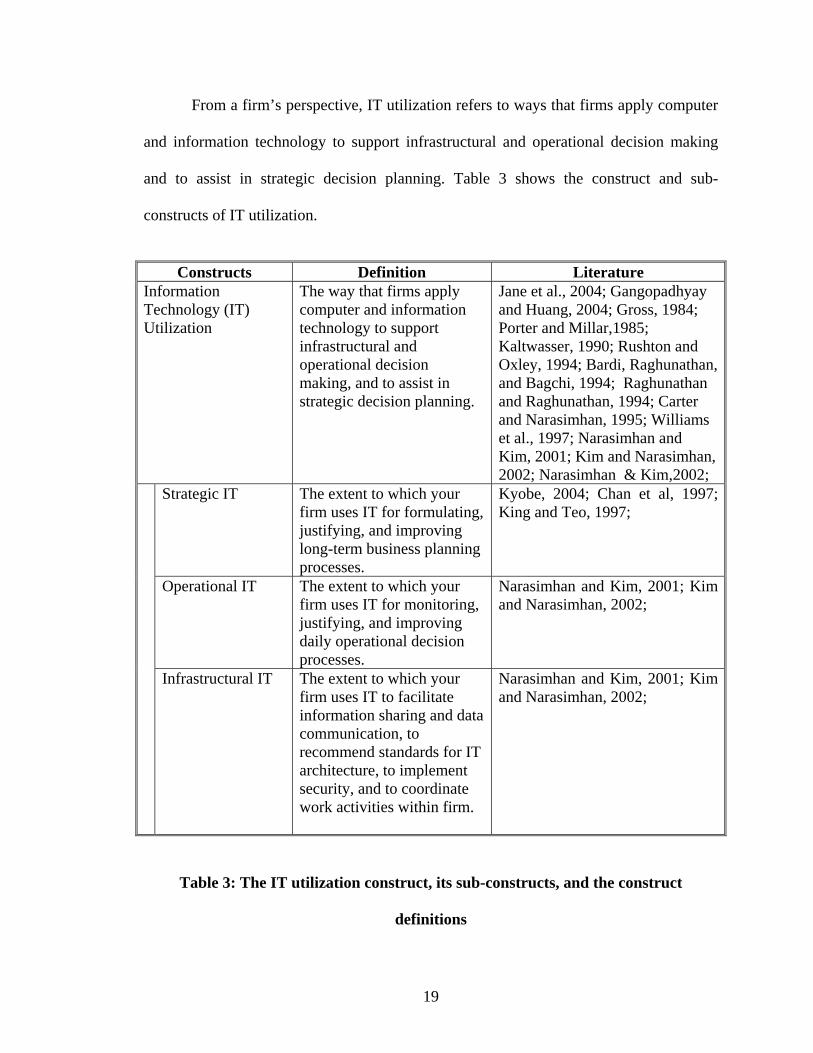
From a firm’s perspective, IT utilization refers to ways that firms apply computer
and information technology to support infrastructural and operational decision making
and to assist in strategic decision planning. Table 3 shows the construct and sub-
constructs of IT utilization.
Constructs Definition Literature
Information Technology (IT) Utilization
The way that firms apply computer and information technology to support infrastructural and operational decision making, and to assist in strategic decision planning.
Jane et al., 2004; Gangopadhyay and Huang, 2004; Gross, 1984; Porter and Millar,1985; Kaltwasser, 1990; Rushton and Oxley, 1994; Bardi, Raghunathan, and Bagchi, 1994; Raghunathan and Raghunathan, 1994; Carter and Narasimhan, 1995; Williams et al., 1997; Narasimhan and Kim, 2001; Kim and Narasimhan, 2002; Narasimhan & Kim,2002;
Strategic IT The extent to which your firm uses IT for formulating, justifying, and improving long-term business planning processes.
Kyobe, 2004; Chan et al, 1997; King and Teo, 1997;
Operational IT The extent to which your firm uses IT for monitoring, justifying, and improving daily operational decision processes.
Narasimhan and Kim, 2001; Kim and Narasimhan, 2002;
Infrastructural IT The extent to which your firm uses IT to facilitate information sharing and data communication, to recommend standards for IT architecture, to implement security, and to coordinate work activities within firm.
Narasimhan and Kim, 2001; Kim and Narasimhan, 2002;
Table 3: The IT utilization construct, its sub-constructs, and the construct
definitions

20
2.3.2. Supply Chain Integration
Supply chain integration is defined as the extent to which a firm coordinates
activities with suppliers and customers (Stock et al., 2000; Narasimhan and Jayaram,
1998; Wood, 1997; Li, 2002; Marquez et al., 2004). Supply chain integration links a firm
with its customers, suppliers, and other channel members by integrating their
relationships, activities, functions, processes and locations (Kim and Narasimhan, 2002).
Having an integrated supply chain provides significant competitive advantage including
the ability to outperform rivals on both price and delivery (Lee and Billington, 1995). The
concept of supply chain integration was studied as early as 1989 by Bowersox. He argued
that the process of supply chain integration should progress from the internal logistics
integration to external integration with suppliers and customers. Both can be
accomplished by the continuous automation and standardization of each internal logistics
function and by efficient information sharing and strategic linkage with suppliers and
customers. Stevens (1989), Byrne and Markham (1991), and Hewitt (1994) suggested
that the development of internal supply chain integration should precede the external
integration with suppliers and customers. Narasimhan and Kim (2002) examined the
effect of chain integration on the relationship between diversification and performance.
The supply chain integration instrument is comprised of three dimensions: (1) internal
integration across the supply chain, (2) a company’s integration with customers, and (3) a
company’s integration with suppliers. Frohlich and Westbrook (2002) and Frohlich
(2002) studied the effect of web-based integration on demand chain management’s
operational performance. In their study, web-based supply chain integration was
measured by two constructs: (1) e-integration with suppliers and (2) e-integration with

21
customers. This study adopts the concept of supply chain integration from previous
research by using two sub-constructs to measure supply chain integration; Integration
with suppliers and Integration with customers (Frohlich and Westbrook, 2002; Frohlich,
2002). Integration with customers involves determining customer requirements and
tailoring internal activities to meet these requirements (Koufteros, Vonderembse, and
Jayaram, 2005). As a firm gets to know its customers better and becomes committed to
understanding and meeting their needs, a strong linkage is forged between the firm and
its customers. Integration with customers ensures that the voice of the customer plays a
vital role in the innovative process with in the organization. Integration with suppliers is
characterized by a long-term commitment between the collaborators, and openness of
communication, and mutual trust. Supplier partnering seeks to bring participants early in
the product life cycle; thus entailing early supplier involvement in product design or the
acquisition of access to superior supplier technological capabilities (Narasimhan and Das,
1999; Peterson et al., 2005). The internal supply chain integration is not included in the
model because the concept is already captured in the ISI construct. Table 4 shows related
literature on supply chain integration, its sub-constructs, and their definitions. Figure 2.1
shows the constructs and sub-constructs of supply chain integration.

22
Constructs Definition Literature Supply Chain Integration
The extent to which a firm coordinates activities with suppliers and customers.
Peterson et al., 2005; Gunasekaran and Ngai, 2004; Bowersox, 1989; Stevens, 1989; Byrne and Markham, 1991; Lee and Billington, 1995; Hewitt, 1994; Clark and Hammond, 1997; Wood, 1997; Lummus et al., 1998; Stock et al., 2002; Narasimhan and Jayaram, 1998; Johnson, 1999; Frohlich and Westbrook, 2001; Ahmad and Schroeder, 2001;Kim and Narasimhan, 2002; Narasimhan and Kim, 2002; Frohlich and Westbrook, 2002; Frohlich, 2002;
External integration with suppliers
The degree of coordination between manufacturing firm and its upstream partners.
Peterson et al., 2005; Koufteros, Vonderembse, and Jayaram, 2005; Bowersox, 1989; Stevens, 1989; Byrne and Markham, 1991; Lee and Billington, 1995; Hewitt, 1994; Clark and Hammond, 1997; Wood, 1997; Lummus et al., 1998; Stock et al., 2002; Narasimhan and Jayaram, 1998; Johnson, 1999; Frohlich and Westbrook, 2001; Ahmad and Schroeder, 2001;Kim and Narasimhan, 2002; Narasimhan and Kim, 2002; Frohlich and Westbrook, 2002; Frohlich, 2002;
External integration with customers
The degree of coordination between manufacturing firm and its downstream customers.
Koufteros, Vonderembse, and Jayaram, 2005; Bowersox, 1989; Stevens, 1989; Byrne and Markham, 1991; Lee and Billington, 1995; Hewitt, 1994; Clark and Hammond, 1997; Wood, 1997; Lummus et al., 1998; Stock et al., 2002; Narasimhan and Jayaram, 1998; Johnson, 1999; Frohlich and Westbrook, 2001; Ahmad and Schroeder, 2001;Kim and Narasimhan, 2002; Narasimhan and Kim, 2002; Frohlich and Westbrook, 2002; Frohlich, 2002;
Table 4: The supply chain integration construct, its sub-constructs, and the
constructs definitions
23
2.4. PERFORMANCE INDICATORS
2.4.1. Firm’s Operational Performance
Operational performance indicators are commonly used in the supply chain
integration context to measure the effects of supply chain integration activities on the
functional/operational outcomes. Considerable agreement exists among academics that
the performance of manufacturing companies can be evaluated by one or more key
competitive priorities (Wheelwright, 1984; Hayes and Wheelwright, 1984: Krajewski and
Ritzman, 1996; Christiansen et al., 2003). Competitive priorities can be described in four
major categories: (1) quality, (2) delivery, (3) cost, and (4) flexibility.
Many studies have reported the use of operational performance as one of the
performance outcomes. For example, Frohlich and Westbrook (2002) studied the effects
of the type of web-based demands and supply integration. They used operational
performance as a dependent variable. The operational benefits of supply chain integration
include faster delivery time, reduced transaction costs, greater profitability, and enhanced
inventory turnover. The use of operational performance in supply chain integration
context can also be found in terms of competitive capabilities. A significant body of prior
empirical research indicates that capabilities such as quality, delivery, flexibility, and/or
cost are positively related to supply chain integration (Khurana and Talbot, 1998;
Kopczak, 1997; Roth, 1998). Rosenzweig et al. (2003) studies the effects of supply chain
integration intensity using competitive capabilities: product quality, delivery reliability,
process flexibility, and cost leadership. Table 4 shows the firm’s operational performance
construct, its literature review, and the construct definition. Figure 2.1 shows the
constructs and sub-constructs of firm’s operational performance.

24
Constructs Definition Literature Firm’s Operational Performance
The extent to which firms can achieve delivery reliability, process flexibility, cost reduction, product/process innovation, and product quality.
Koufteros, Vonderembse, and Jayaram, 2005; Christiansen et al., 2003; Kopczak, 1997; Khurana and Talbot, 1998; Roth, 1998; Frohlich, 2002; Frohlich and Westbrook, 2002; Rosenzweig et al., 2003; Wheelwright, 1984; Hayes and Wheelwright, 1984: Krajewski and Ritzman, 1996; Bardi, Raghunathan, and Bagchi, 1994; Gross, 1984; Kaltwasser, 1990
Table 5: The firm’s operational performance construct and its definition
2.4.2. Suppliers’ Operational Performance
Supplier performance is defined as the extent to which suppliers meet standards of
product quality, delivery reliability, process flexibility, product innovation, and cost
reduction. In the literature, supplier performance is considered one of the powerful
determinants for the firm’s operational success (Davis, 1993; Levy, 1997; Shin et al.,
2000; Tan et al., 1998; Vonderembse and Tracey, 1999; Carr and Pearson, 1999).
Beamon (1998) defined supplier performance as suppliers’ consistency in delivering
materials, components and products to manufacturing firms on time and in good
condition. Poor vendor quality and delivery performance can result in higher inventory
and backlog (Shin et al., 2000). Stevens (1990), Beamon (1998), and Gunasekaran et al.
(2001) asserted that supplier performance is considered a very important dimension of
supply chain performance because supplier involvement helps firms improve overall
quality, reduce costs, and compete with competitors. Table 5 shows the supplier

25
performance construct, its literature review, and the construct definition. Figure 2.1
shows the constructs and sub-constructs of suppliers’ operational performance.
Constructs Definition Literature Suppliers’ Operational Performance
The extent of suppliers’ consistency in delivering materials, components or products to manufacturing firm on time and in good condition
Koufteros, Vonderembse, and Jayaram, 2005; Christiansen et al., 2003; Beamon, 1998; Davis, 1993: Levy, 1997; Li, 2002; Shin et al., 2000; Tan et al., 1998; Vonderembse and Tracey, 1999; Carr and Person, 1999; Stevens, 1990; Gunasekaran et al., 2001.
Table 6: The suppliers’ operational performance construct and its definition
Based on the extensive literature review, the concept of supplier performance can
be measured using five sub-constructs: delivery reliability, delivery flexibility, cost
leadership, innovation, and product quality.
2.4.3. Firm Performance
Firm performance refers to the ability of a firm to fulfill its market and financial
goals (Yamin et al., 1999). There are many studies examining firm performance in the
literature; however, this study focuses on the firm performance in the supply chain
integration context. Wisner (2003) studies the effects of supply chain management
strategy on firm performance. The firm performance can be measured by market share,
return on assets, overall product quality, overall competitive position, and overall

26
customer service level. Rosenzweig et al. (2003) used four items to measure business
performance including pre-tax return on assets (ROA), percentage of revenues from new
products, overall customer satisfaction ratings, and business unit’s sales growth. Frohlich
(2002) used two items to measure e-business performance: Annual percent of
procurement using the Internet and annual percent of sales/turnover using the Internet.
Narasimhan and Kim (2002) used sales growth and market share growth (ratio of the
current level to three years ago), profitability, return on investment, return on assets,
revenue growth, financial liquidity, and net profit to measure firm performance. Table 6
shows related literature on a firm performance construct and the construct definition.
Figure 2.1 shows the constructs and sub-constructs of firm performance.
Constructs Definition Literature Firm Performance The ability of a firm to
fulfill its market and financial goals.
Yamin et al., 1999; Frohlich, 2002; Narasimhan and Kim, 2002;Wisner, 2003; Rosenzweig et al, 2003;
Table 7: The firm performance construct and its definition

27
CHAPTER 3: THEORETICAL FRAMEWORK AND HYPOTHESES DEVELOPMENT
When understanding the phenomenon of ISI, it is helpful to have a framework
from which testable hypotheses can be drawn. A theoretical framework enables
predictions to be made about the role of ISI in supply chain integration context. It
enables observed business to be evaluated and therefore provides better explanations of
the implications of ISI and their consequences.
3.1. THEORETICAL FRAMEWORK
To better understand the mediating role of ISI on the relationship between IT
utilization and organizational performances, a framework is established that describes the
causal relationships among IT utilization, internal ISI, external ISI, supply chain
integration, suppliers’ operational performance, firm’s operational performance, and firm
performance. The rationale underlying this research framework is straightforward. By
considering the relationship of each pair of constructs carefully, Figure 3.1 depicts the
proposed relationships among seven constructs discussed in Chapter 2. The numbers next
to each arrow correspond to the 12 hypotheses to be developed later in this chapter. Table
7 shows the main constructs and their definitions in ISI framework. The following section
will provide theoretical support for each hypothesis.

28
Figure 3.1: Theoretical framework for information systems integration
External Information Systems Integration
• Strategic integration • Operational integration • Infrastructural integration
Firm’s Operational Performance • Delivery reliability • Process flexibility • Cost leadership • Product innovation • Product quality
Firm Performance • Market share • Return of investment • Customer satisfaction • Sales growth • Profitability
Information Technology Utilization • Strategic IT • Operational IT • Infrastructural IT
Internal Information Systems Integration • Strategic integration • Operational integration • Infrastructural integration
Suppliers’ Operational Performance • Delivery reliability • Process flexibility • Cost leadership • Product innovation • Product quality
H2
H4
H3
H6
H7
H8
H9
H1a H5
H1b
Supply Chain Integration • Integration with Customers • Integration with Suppliers

29
Table 8: Construct definitions summary
Constructs Definition Literature Information Technology Utilization (ITU)
The way that firms apply computer and information technology to support infrastructural and operational decision making, and to assist in strategic decision planning.
Jane et al., 2004; Gangopadhyay and Huang, 2004; Gross, 1984; Porter and Millar,1985; Kaltwasser, 1990; Rushton and Oxley, 1994; Bardi, Raghunathan, and Bagchi, 1994; Raghunathan and Raghunathan, 1994; Carter and Narasimhan, 1995; Williams et al., 1997; Narasimhan and Kim, 2001; Kim and Narasimhan, 2002; Narasimhan & Kim,2002;
Internal Information Systems Integration (IISI)
The degree of cooperation between business functions within the firm on an internally consistent set of strategic, operational, and infrastructural information systems practices using information systems (IS).
Wainwright and Waring, 2004; Themistocleous et al., 2004; Koufteros, Vonderembse, and Jayaram, 2005; Fiderrio, 1989; McFarlan and McKenny, 1984; Gross, 1984; Porter and Millar, 1985; Madui and Schafer, 1985; Cohen and Lee, 1988; Earl, 1989; Kaltwasser, 1990; Madnick, 1991; Buck-lew et al., 1992; Wyse and Higgins, 1993; Stylianou et al., 1996; Webber and Pliskin, 1996; Sikora and Shaw, 1998; Robbins and Stylianou, 1999; Bhatt, 2000; Narasimhan and Kim, 2001; Numilaakso et al, 2002; Kim and Narasimhan, 2002;
External Information Systems Integration (EISI)
The degree of cooperation between a firm and its trading partners on an internally consistent set of strategic, operational, and infrastructural information systems practices using information systems (IS).
Wainwright and Waring, 2004; Themistocleous et al., 2004; Koufteros, Vonderembse, and Jayaram, 2005; Fiderrio, 1989; McFarlan and McKenny, 1984; Gross, 1984; Porter and Millar, 1985; Madui and Schafer, 1985; Cohen and Lee, 1988; Earl, 1989; Kaltwasser, 1990; Madnick, 1991; Buck-lew et al., 1992; Wyse and Higgins, 1993; Stylianou et al., 1996; Webber and Pliskin, 1996; Sikora and Shaw, 1998; Robbins and Stylianou, 1999; Bhatt, 2000; Narasimhan and Kim, 2001; Numilaakso et al, 2002; Kim and Narasimhan, 2002;
Supply Chain Integration (SCI)
The extent to which all activities with suppliers and all activities with customers are coordinated.
Peterson et al., 2005; Koufteros, Vonderembse, and Jayaram, 2005; Bowersox, 1989; Stevens, 1989; Byrne and Markham, 1991; Lee and Billington, 1992; Hewitt, 1994; Clark and Hammond, 1997; Wood, 1997; Lummus et al., 1998; Stock et al., 1998; Narasimhan and Jayaram, 1998; Johnson, 1999; Frohlich and Westbrook, 2001; Ahmad and Schroeder, 2001;Kim and Narasimhan, 2002; Narasimhan and Kim, 2002; Frohlich and Westbrook, 2002; Frohlich, 2002;
Suppliers’ Operational Performance (SOP)
The extent to which suppliers meet delivery reliability, process flexibility, cost reduction, product/process innovation, and product quality.
Koufteros, Vonderembse, and Jayaram, 2005; Christiansen et al., 2003; Stevens, 1990; Alverez, 1994; Owen and Richmond, 1995; Beamon, 1998; Spekman et al., 1998; Beaman, 1999; Gunasekaran et al., 2001; Narasimhan and Kim, 2001; Li, 2002; Kim and Narasimhan, 2002;
Firm’s Operational Performance (FOP)
The extent to which firms can achieve delivery reliability, process flexibility, cost reduction, product/process innovation, and product quality.
Koufteros, Vonderembse, and Jayaram, 2005; Christiansen et al., 2003; Kopczak, 1997; Khurana and Talbot, 1998; Roth, 1998; Frohlich, 2002; Frohlich and Westbrook, 2002; Rosenzweig et al., 2003;
Firm Performance (FP)
The ability of a firm to fulfill its market and financial goals.
Yamin et al., 1991; Frohlich, 2002; Narasimhan and Kim, 2002;Wisner, 2003; Rosenzweig et al, 2003;

30
3.2. IMPACTS OF IT UTILIZATION ON ISI (H1a and H1b)
In the inter-organizational supply chain context, not only does IT provide firms
with the automation of clerical functions, but IT is also viewed as providing
infrastructural and strategic support to the value chain. As firms move toward a highly
integrated supply chain, the strategic usage of IT is much clearer and more compatible.
As the trend moves toward globally competing between supply chains, supply chain
members are much inclined to use IT to integrate similar functions spread over different
areas, to communicate with each other, and to coordinate supply chain activities. The
electronic inter-connectivity between two or more firms has become a competitive
necessity to reduce cost and improve services (Bhatt, 2000).
The evidence explaining this phenomenon can be found in both conceptual and
empirical research. Madnick (1991) and Boar (1993) stated that the level of extensive
communication networks and inter-connectivity is raised because of the adoption of
standards and integrated services digital networks (ISDN). Through the utilization of IT,
companies have been able to integrate their internal functions as well as external
activities, thus enhancing capability to cope with the sophisticated needs of customers
and meeting the quality standards of products (Bardi et al., 1994, Carter and Narasimhan,
1995). Because the use of networks, shared databases, and other related information
systems has been considered important for eliminating duplicate activities, preventing
errors, reducing cycle time in product development, and improving inter-organizational
communication, firms have not realized the benefits of ISI. Therefore,
H1a: The higher the extent of IT utilization, the higher the extent of IISI
H1b: The higher the extent of IT utilization, the higher the extent of EISI

31
3.3. IMPACTS OF IISI ON EISI (H2)
The development and evolvement of ISI can be explained using the supply chain
integration theory. For example, Bowersox (1989) argued that the process integration
should progress from the internal logistics integration to external integration with
suppliers and customers. Both can be accomplished by the continuous automation and
standardization of each internal logistics function and by efficient information sharing
and strategic linkage with suppliers and customers. Stevens (1989), Byrne and Markham
(1991), and Hewitt (1994) suggested that the development of internal supply chain
integration should precede the external integration with suppliers and customers. This
notion implies that, in order for IS to be integrated, ISI should happen in a sequential
manner from internal integration to external integration. Firms with higher degree of
internal ISI (i.e., firms with centralized databases, firms with enterprise-wide information
systems) are more likely to integrate with their external partners because ISI processes
take time, effort and capital investment. However, firms which have already set up
internal systems have more chance to integrate with other firms that have compatibles
systems.
In this study, IISI is characterized by internal cooperation between business
functions. ISIS focuses on full system-visibility of internal supply chain activities
including strategic, operational, and infrastructural IS practices. At this stage, all internal
functions from raw material management through production, shipping, and sales are
connected and integrated real-time. EISI, on the other hand, is characterized by an
external cooperation between a firm and its trading partners. At this stage, full supply

32
chain integration extending the scope of integration outside the company is
accomplished. Therefore,
H2: The higher the extent of IISI, the higher the extent of EISI
3.4. IMPACTS OF ISI ON SUPPLY CHAIN INTEGRATION (H3 AND H4)
The sole purpose of ISI is to integrate diverse information system practices
exercised by individual supply chain members and prioritize them into three levels of
integration – strategic, operational, and infrastructural. ISI helps firms save costs by
eliminating redundant logistic activities, unimportant information system practices, and
unnecessary information system investments, which do not contribute to overall
performance. With ISI, the proper architecture of hardware, software, networks,
applications, and management practices must be integrated with the fabric of the firm, its
business processes, and its organizational life (Bourdreau and Couillard, 1999).
Mudie and Schafer (1985) asserted that ISI should not only facilitate the process
of developing and using data, applications, and other processing technology, but also
should provide flexibility to meet the future business demands in workstations,
processing types, and applications. In a merging and acquisition context, ISI is
considered an important success factor when corporations seek to create synergistic
effects by integrating two separate business entities in efforts to increase competitive
advantages (Robbins and Stylianou, 1999; Stylianou et al., 1996). In the inter-
organizational supply chain context, information technologies allow “multiple
organizations to coordinate their activities in an effort to truly manage a supply chain”
(Handfield and Nichols, 1999). ISI represents a set of consistent IS practices that supply

33
chain members adopt and exercise to interact with each other. In this context, ISI can be
both an internal focus and an external focus (IISI and EISI). A higher level of alignment
in IS practices (internal and external) allows firms to stay competitive in a rapidly
changing environment. Firms have to manage different components of technologies by
integrating and coordinating them into a highly efficient, effective, and responsive system
(Sikora and Shaw, 1998). With intensification of competition, firms begin to utilize
information systems to directly influence the processes comprising the value chain
(Rushton and Oxley, 1994; Williams et al., 1997). This study hypothesized that highly
integrated information system practices (internal and external) help enhance cooperation
and coordination between a firm and its external partners (e.g., suppliers and customers);
therefore,
H3: The higher the extent of IISI, the higher the extent of supply chain integration
H4: The higher the extent of EISI, the higher the extent of supply chain
integration
3.5. IMPACTS OF SUPPLY CHAIN INTEGRATION ON OPERATIONAL
PERFORMANCE (H5 AND H6)
When sharing common objectives across the supply chain, firms become more
cost effective, more efficient, more agile, more responsive to market and supply chain
changes, and more innovative. Highly frequent information exchanges within and
between firms in the production processes make the delivery process more stable and
reliable. The supply chain management literature reports a number of studies on the
operational performance benefits that firms derive from supply chain integration.
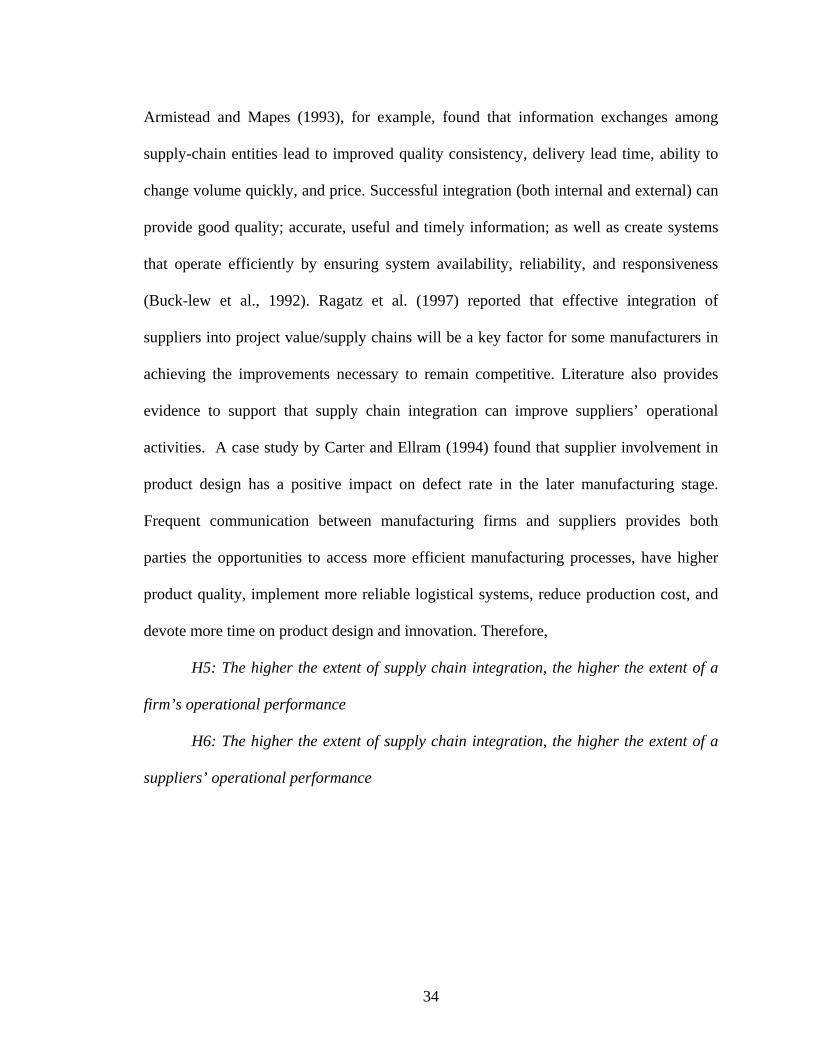
34
Armistead and Mapes (1993), for example, found that information exchanges among
supply-chain entities lead to improved quality consistency, delivery lead time, ability to
change volume quickly, and price. Successful integration (both internal and external) can
provide good quality; accurate, useful and timely information; as well as create systems
that operate efficiently by ensuring system availability, reliability, and responsiveness
(Buck-lew et al., 1992). Ragatz et al. (1997) reported that effective integration of
suppliers into project value/supply chains will be a key factor for some manufacturers in
achieving the improvements necessary to remain competitive. Literature also provides
evidence to support that supply chain integration can improve suppliers’ operational
activities. A case study by Carter and Ellram (1994) found that supplier involvement in
product design has a positive impact on defect rate in the later manufacturing stage.
Frequent communication between manufacturing firms and suppliers provides both
parties the opportunities to access more efficient manufacturing processes, have higher
product quality, implement more reliable logistical systems, reduce production cost, and
devote more time on product design and innovation. Therefore,
H5: The higher the extent of supply chain integration, the higher the extent of a
firm’s operational performance
H6: The higher the extent of supply chain integration, the higher the extent of a
suppliers’ operational performance

35
3.6. IMPACTS OF SUPPLIERS’ OPERATIONAL PERFORMANCE ON FIRM’S
OPERATIONAL PERFORMANCE (H7)
Supplier performance is an inter-organizational performance measurement
dealing with the evaluation of performance outside one’s own organization. The
relationship between suppliers’ operational performance and firm’s operational
performance concerns both intra-organizational performance and inter-organizational
performance. This study hypothesizes that, in the global supply chain environment, a
firm’s competitive position largely depends on its suppliers’ abilities to respond to the
firm’s requirements. In giant industries such as automobile and computer, manufacturing
firms mostly act as a central coordinator managing other logistic activities over the globe
using advanced information technology. For example, Dell Computer manages all the
transactions over the Internet, leaving the real operational activities in the hands of the
suppliers. With this new way of doing business, supplier performance is crucial for the
firm’s survival and competitiveness.
In the literature, supplier performance is considered one of the determinant factors
for the company’s operational success (Monezka et al., 1983; Baxter et al., 1989; Ellram,
1991; Davis, 1993; Levy, 1997). Harley-Davidson has reported that supplier involvement
has improved its overall quality, reduced costs, and helped Harley-Davidson compete
against Japanese manufacturers. Integrated industrial relations between manufacturers
and suppliers have also been cited as a crucial factor to the success of Japanese
manufacturing firms implementing JIT (Hahn et al., 1983; Waters-Fuller, 1995).
Vonderembse and Tracey (1999) empirically tested the relationship between supplier
performance and manufacturing performance. The study stated that if supplier

36
performance is highly correlated with manufacturing performance, a firm may be able to
meet its manufacturing objectives with regard to production costs, work-in-process
inventory levels, product quality, and on-time delivery to the final customers.
Based on extensive literature support, this study argues that supplier performance
is most likely to bring operational benefits to the manufacturing firms; including
reduction of inventory, delivery lead-time and supplier cost, and improvement of
scheduling flexibility and quality. Therefore,
H7: The higher the extent of supplier performance, the higher the extent of a
firm’s operational performance
3.7. IMPACTS OF OPERATIONAL PERFORMANCE ON FIRM
PERFORMANCE (H8 AND H9)
Both firm’s and suppliers’ operational performance; including delivery reliability,
process flexibility, cost leadership, product/process innovation, and product quality, play
a major role in many studies as an intermediate performance indicator. This capability
will in turn influence a firms’ overall performance (Mentzer et al., 2000). The operational
performance provides necessary factors that impact organizational performances by
ruling out other types of performance that are not related to supply chain activities. There
are many studies supporting these relationships (Carr and Pearson, 1999; Frazier et al.,
1988; Carr and Ittner, 1992; Tan et al., 1998). For example, Carr and Pearson (1999)
investigated the impact of “strategic purchasing” and “buyer-supplier relationships” on
the firm’s financial performance”. They found that strategically managed long-term
relationships with key suppliers improve overall product quality, delivery, and process

37
flexibility; and thus have a positive impact on the firm’s financial performance. Based on
extensive literature review, this study hypothesizes that,
H8: The higher the extent of a firm’s operational performance, the higher the
extent of firm performance.
H9: The higher the extent of a supplier’s operational performance, the higher the
extent of firm performance.

38
CHAPTER 4: INSTRUMENT DEVELOPMENT – ITEM GENERATION AND PILOT TEST
In this chapter, the instruments for this research are developed and tested. The
instruments to measure include (1) IT utilization, (2) IISI, (3) EISI, (4) supply chain
integration, (5) suppliers’ operational performance, (6) firm’s operational performance,
and (7) firm performance. Instruments to measure firms’ operational performance,
suppliers’ operational performance, and firm performance were adopted from previous
studies (Tu, 1999; Li, 2002) with minor modifications. Since these three instruments have
been tested in previous studies and were found to be valid and reliable, they were not
tested again in the pilot study. Instead, they were re-validated in the large-scale analysis.
The instruments to measure IT utilization, IISI, IISI, and supply chain integration were
developed and pilot tested.
The development of the instruments for the four remaining constructs was carried
out in three phases: (1) item generation, (2) pilot study, and (3) large-scale data analysis
and instrument validation. First, as discussed in Chapter 2, an extensive and
comprehensive literature review was conducted to identify the content domain of major
constructs in the current research framework. Initial items and the definitions of each
construct were generated from the literature review. The pilot study was conducted using
the Q-sort method. Items placed in a common pool were subjected to three sorting rounds
by the judges to establish which items should be in various categories. The objective of
the Q-sort method is to pre-assess the convergent and discriminant validity of the scales
39
by examining how the items were sorted into various construct categories. After that,
analysis of inter-rater agreement about the items’ placement identifies both bad items and
weakness in the original definitions of the constructs. The third phase was large scale
questionnaire administration (discussed in Chapter 5). Research hypotheses were then
tested based on the large-scale data analysis.
4.1. ITEM GENERATION
Proper generation of measurement items of a construct determines the validity
and reliability of empirical research. The basic requirement for a good measure is content
validity, which means the measurement items contained in an instrument should cover
the major content domain of a construct (Churchill, 1979). Content validity is usually
achieved through comprehensive literature review and interviewing practitioners and
academic experts. A list of initial items for each construct was generated based on a
comprehensive review of relevant literature. The general literature bases for items in each
construct are briefly discussed below.
The items for IT utilization (i.e., Strategic IT, Operational IT, and Infrastructural
IT) were modified from previous studies (Narasimhan and Kim, 2001, 2002). The items
for Information Systems Integration – IISI and EISI (i.e., Strategic IS Integration,
Operational IS Integration, and Infrastructural IS Integration) were developed in this
study. The items for Supply Chain Integration (i.e., Integration with Customers and
Integration with Suppliers) were developed in this study. The items for Suppliers’
Operational Performance (i.e., Delivery Reliability, Process Flexibility, Cost Leadership,
Innovation, and Product Quality) and Firm’s Operational Performance (i.e., Delivery
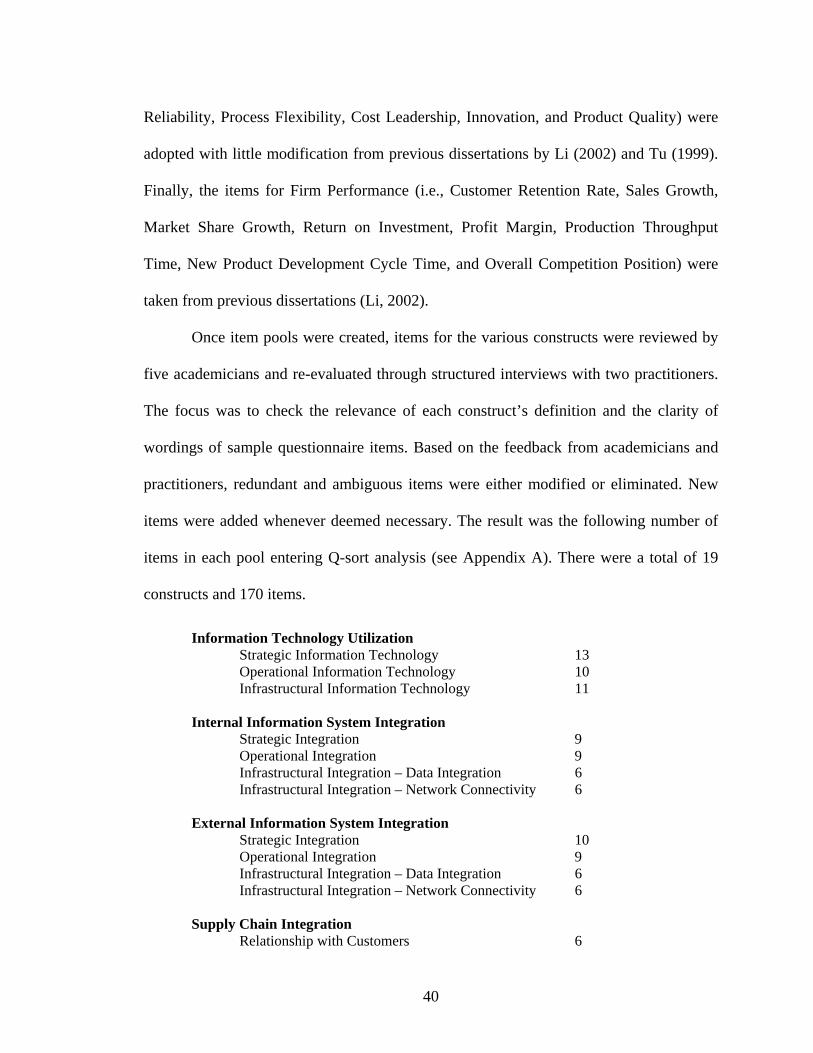
40
Reliability, Process Flexibility, Cost Leadership, Innovation, and Product Quality) were
adopted with little modification from previous dissertations by Li (2002) and Tu (1999).
Finally, the items for Firm Performance (i.e., Customer Retention Rate, Sales Growth,
Market Share Growth, Return on Investment, Profit Margin, Production Throughput
Time, New Product Development Cycle Time, and Overall Competition Position) were
taken from previous dissertations (Li, 2002).
Once item pools were created, items for the various constructs were reviewed by
five academicians and re-evaluated through structured interviews with two practitioners.
The focus was to check the relevance of each construct’s definition and the clarity of
wordings of sample questionnaire items. Based on the feedback from academicians and
practitioners, redundant and ambiguous items were either modified or eliminated. New
items were added whenever deemed necessary. The result was the following number of
items in each pool entering Q-sort analysis (see Appendix A). There were a total of 19
constructs and 170 items.
Information Technology Utilization Strategic Information Technology 13 Operational Information Technology 10 Infrastructural Information Technology 11
Internal Information System Integration Strategic Integration 9 Operational Integration 9 Infrastructural Integration – Data Integration 6 Infrastructural Integration – Network Connectivity 6
External Information System Integration Strategic Integration 10 Operational Integration 9 Infrastructural Integration – Data Integration 6 Infrastructural Integration – Network Connectivity 6
Supply Chain Integration Relationship with Customers 6

41
Relationship with Suppliers 5 Suppliers’ Operational Performance
Delivery Reliability 6 Process Flexibility 6 Cost Leadership 5 Innovation 5 Product Quality 6
Firm’s Operational Performance Delivery Reliability 6 Process Flexibility 6 Cost Leadership 5 Innovation 5 Product Quality 6
Firm Performance 8 Total 170
4.2. PILOT STUDY
To further ensure the content validity, the measurement items generated from
literature reviews were tested with manufacturing managers and operations managers in
the Midwest region of U.S., faculty members who are familiar with operations
management research at a large state university, and Ph.D. students who are specializing
in operations management or manufacturing management.
The structured interview was conducted with two major steps. First, the definition
of each research construct was presented to practitioners and some open-ended questions
were asked to ensure the representation of questions/sub-dimensions for all constructs. In
the second step, a “Q-Sort” methodology was conducted using two approaches (1)
traditional paper based approach and (2) online approach. For the traditional approach,
one 3” by 5” card was printed for each item generated from the literature review. The set

42
of cards for each construct was then shuffled and given to the practitioners. The
definitions of the entire construct and each of its sub-dimensions were also presented.
The practitioners were asked to put each card under each of the sub-dimensions. Items
considered not belonging to any of the existing dimensions were removed and new
dimensions were suggested if applicable. If an item fell under a different dimension from
previously conceived, questions were further examined for possible clarification. During
the process, the practitioners could also suggest combining two possible overlapping
dimensions. The interview results from all practitioners were then carefully analyzed and
a common pattern of thinking was recognized, which formed the basis for further revision
of measurement items and construct dimensions. For the online approach, a Q-Sort
website was constructed to provide convenience for practitioners (e.g., time conflict or
different locations). The detail of Q-Sort method is explained in the following subsection.
A copy of the revised definitions and measurement items was then sent to faculty
members to solicit their comments on the appropriateness of the measure. They had the
opportunity to suggest “Keep”, “Drop”, and “Modify” each item. They could also suggest
new construct dimensions if they felt that the existing dimensions did not cover the entire
content domain. The instruments were then revised based on the comments.
4.3. SCALE DEVELOPMENT: THE Q-SORT METHOD
The basic procedure was to have a vice president of manufacturing, a
manufacturing manager, a plant manager, a manufacturing director, a production
manager, and/or a plant operations manager judge and sort the items from the first stage
into separate sub-constructs, based on construct/sub-construct definitions. A group of
43
potential judges was identified from local businesses. All of the potential participants
were representatives of the population targeted for this study, and were considered
knowledgeable in the manufacturing field, and with the required experience and position
to assess the impact of information technology (IT) in their organization.
Based on the placements made by the judges, the items could then be examined.
Inappropriately worded or ambiguous items could be eliminated or reworded. Two goals
for this stage were to identify and modify any ambiguous items and to pre-assess the
construct validity of the various scales being developed. First, judges sorted the various
items into construct categories. This procedure is similar to the technique Davis (1989)
used in assessing the coverage of the domains of his constructs. First, Davis asked judges
to rank how well the items fit the construct definitions provided, and then asked the
judges to sort items into construct categories. By comparing the categories developed,
Davis was then able to assess the domain coverage of the particular construct. The second
step in this research is similar to a procedure employed by Davis. An indicator of
construct validity was the convergence and divergence of items within the categories. If
an item was consistently placed within a particular category, then it was considered to
demonstrate convergent validity with the related construct, and discriminant validity with
the others.
4.3.1. Sorting Procedures
There were two approaches used to construct the Q-sort method. First, each item
was printed on a 3 x 5 -inch index card. The cards were shuffled into random order for
presentation to the judges. Each judge sorted the cards into categories. A “not applicable”
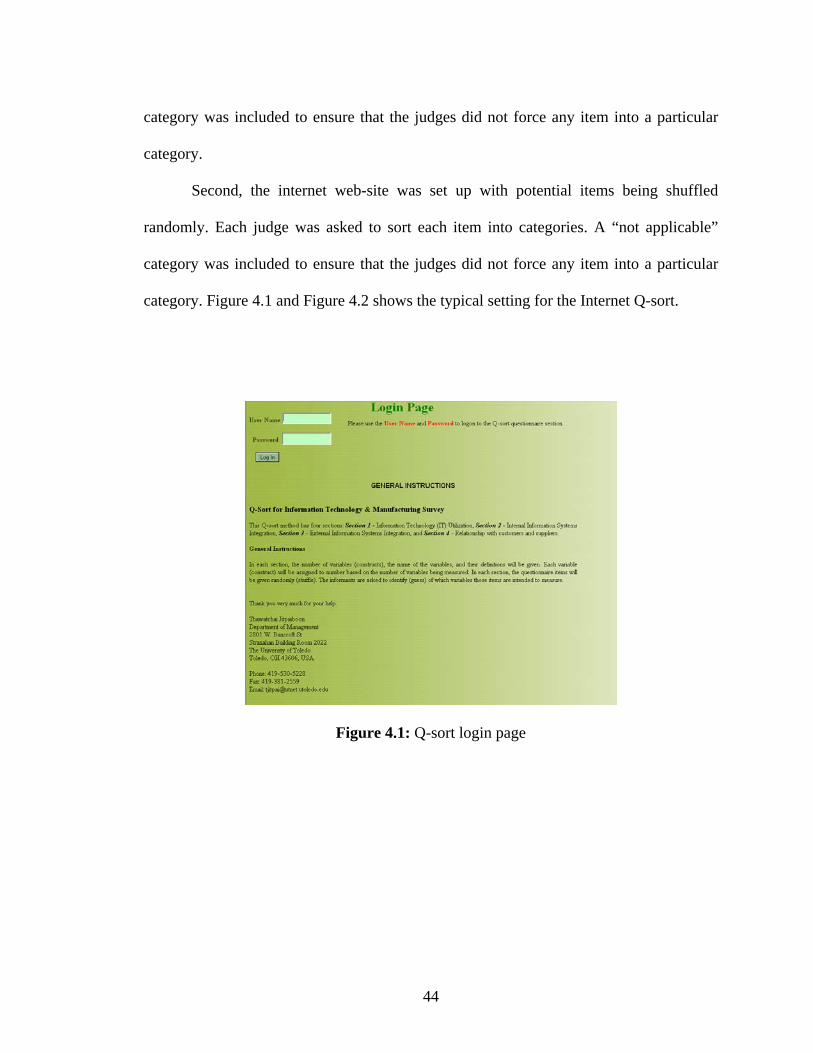
44
category was included to ensure that the judges did not force any item into a particular
category.
Second, the internet web-site was set up with potential items being shuffled
randomly. Each judge was asked to sort each item into categories. A “not applicable”
category was included to ensure that the judges did not force any item into a particular
category. Figure 4.1 and Figure 4.2 shows the typical setting for the Internet Q-sort.
Figure 4.1: Q-sort login page

45
Figure 4.2: Q-sort page
During the three sorting rounds, eleven informants provided input (four
academicians and seven practitioners); however, the results from only three different
pairs of judges (six practitioners only) were used to estimate inter-rater reliability and
item placement score. Each set of judges included appropriate job titles such as vice
president of manufacturing, manufacturing manager, plant manager, manufacturing
director, production manager, and/or plant operations manager. This ensures that a wide
range of perceptions from the targeted population covers the whole domain of the study.
Prior to sorting, the judges were briefed with a standard set of instructions that were
previously tested with a separate judge to ensure comprehensiveness and
comprehensibility. Judges were allowed to ask as many questions as necessary to ensure
they understood the procedure.

46
4.3.2. Inter-rater reliabilities
Two different measures were made to assess the reliability of the sorting
conducted by the judges. First, for each pair of judges in each sorting step, their level of
agreement in categorizing items was measured using Cohen’s Kappa (Cohen, 1960).
Second, an overall measure of both the reliability of the classification scheme and
the validity of the items (Hit Ratio) was adopted from Moore and Benbasat, (1991). The
method required analysis of how many items were placed by the panel of judges for each
round within the target construct. In other words, because each item was included in the
pool explicitly to measure a particular underlying construct, a measurement was taken of
the overall frequency with which the judges placed items within the intended theoretical
construct. The higher the percentage of items placed in the target construct, the higher the
degree of inter-judge agreement across the panel must have occurred. Secondly, scales
based on categories which have a high degree of correct placement of items within them
can be considered to have a high degree of construct validity, with a high potential for
good reliability scores. It must be emphasized that this procedure is more of a qualitative
analysis than a rigorous quantitative procedure. There are no established guidelines for
determining good levels of placement, but the matrix can be used to highlight any
potential problems areas. Following is an example of how this measure would work. A
description of the Cohen’s Kappa (Cohen, 1960) and Moore and Benbasat’s ‘Hit Ratio”
(Moore and Benbasat, 1991) is included in Appendix B.

47
4.3.2.1. Results of First Sort (see detailed results in Appendix B)
Five judges were involved in the first sorting round, two academicians and three
practitioners. Only two practitioners were chosen in the estimation of agreement scores.
In this round, the inter-judge raw agreement scores averaged 0.65 (Table 4.2), the initial
overall placement ratio of items within the target constructs was 75 % (Table 4.3), and
the Kappa scores averaged 0.62. Table 4.1 shows inputs used for calculating Cohen’s
Kappa coefficient. The calculations for the Cohen’s Kappa coefficient are shown below.
A summary of the first round inter-judge agreement indices is shown in Table 4.1
and Figure 4.4. Following the guidelines of Landis and Koch for interpreting the Kappa
coefficient, the value of 0.62 indicates a moderate level of agreement beyond chance for
the judges in the first round. This value is slightly lower than the value for raw agreement
which is 0.65 (Table 4.2). The level of item placement ratios averaged 75% (Table 4.3 &
4.4). For instance, the lowest item placement ratio value was 44% for the External
Operational Information Systems Integration construct, indicating a low degree of
construct validity. On the other hand, two constructs (Relationship with Customers and
Relationship with Suppliers) obtained a high placement ratio over 90%, indicating a high
degree of construct validity.
( )( ) 62 . 0
853)98(853 )64)(98(
22 =−−
=−
−=
∑∑
++
++
i iii
i iiiii
XXNXXXN
k

48
In order to improve the Cohen’s Kappa and other measures of agreement, an
examination of the off-diagonal entries in the placement matrix (Table 4.3) was
conducted. Tables 4.5 to 4.9 show the distribution of the agreement of measurement
items. There are three possible explanations. The first explanation is that both judges
agreed on a particular item but misplaced the item from the original construct intended to
measure it. In such a case, the researcher would switch such items into the right construct
before the next Q-sort round. The second explanation is that only one of the two judges
correctly put the item into the right construct. In this situation, each item would be
considered carefully to either be re-worded, re-grouped, deleted, or unchanged. Third,
both judges correctly sorted the items into the right construct. In this case, no change was
necessary.
4.3.2.2. Results of Second Sort (see detailed results in Appendix B)
Three practitioners were involved in the second sorting round. The second sorting
round included the reworded items and two modified constructs. Infrastructural
Information Systems Integration was changed into two new constructs – Data Integration
and Network Connectivity. In this round the inter-judge raw agreement score average
was 0.75 (Table 4.9), the initial overall placement ratio of items within the target
constructs was 80 % (Table 4.10), and the Kappa score was 0.72.
The calculations for the Cohen’s Kappa coefficient for the second sorting round
are shown below.
( )( ) 72.0
783)98(783)73)(98(
22 =−−
=−
−=
∑∑
++
++
i iii
i iiiii
XXNXXXN
k

49
A summary of the second round inter-judge agreement indices is shown in the
second column of Table 4.11. The value for the Kappa coefficient of 0.72 was higher
than the value obtained in the first round, but still indicated a moderate level of
agreement beyond chance for the judges in the second round. The level of item placement
ratios averaged 80%. The lowest item placement ratio value was 58% for the
Infrastructural IT construct, indicating a low degree of construct validity. Again several
constructs (Operational IT, Internal Strategic Information Systems Integration,
Relationship with Customers and Relationship with Suppliers) obtained over 90% item
placement ratio, indicating a high degree of construct validity.
In order to further improve the Cohen’s Kappa measure of agreement, an
examination of the off-diagonal entries in the placement matrix (Table 4.10) was
conducted. The results of the second round showed some improvements (Table 4.11).
Four constructs including Infrastructural IT, Internal Infrastructural Information Systems
Integration – Data Integration, Internal Infrastructural Information Systems Integration –
Network Connectivity, and External Strategic Information Systems Integration showed
worse inter-judge agreement ratios. These four constructs were the target for
improvement on the following sorting round. Table 4.12 to 4.15 shows the results of the
second sorting round.

50
4.3.2.3. Results of Third Sort (see detailed results in Appendix B)
As in the previous two sorting rounds, four judges participated in the third sorting
round (two practitioners and two academicians), which included the reworded items and
new added items. In the third round the inter-judge raw agreement scores averaged 0.91
(Table 4.16), the initial overall placement ratio of items within the target constructs was
93 % (Table 4.17), and the Kappa scores averaged 0.90.
The calculations for the Cohen’s Kappa coefficient for the third sorting round are
shown below.
A summary of the third round inter-judge agreements indices is shown in the third
column of Table 4.18. The value for the Kappa coefficient of 0.90 is significantly higher
than the value obtained in the second round, and indicates an excellent level of agreement
beyond chance. The level of item placement ratios averaged 93%. The lowest item
placement ratio value was that of 75% (Internal and External Infrastructural Information
Systems Integration - Network Connectivity construct) indicating a moderate to good
degree of construct validity. The construct’s Operational IT, Internal Strategic
Information Systems Integration, Internal Operational Information Systems Integration,
External Strategic Information Systems Integration, External Operational Information
Systems Integration, Relationship with customers, and Relationship with suppliers
obtained a 100% item placement ratio. This placement of items within the target
construct shows that a high degree of construct validity and potential reliability were
achieved.
( )( ) 90.0
735)96(735)87)(96(
22 =−−
=−
−=
∑∑
++
++
i iii
i iiiii
XXNXXXN
k

51
The final refinement of the scales for the large scale survey was the slight
modification of the third sorting round. The resultant measurement instrument from the
three sorting rounds is shown in Appendix C. The number of items remaining for each
construct after the third round of Q-sort was as follows:
Information Technology Utilization Strategic Information Technology 8 Operational Information Technology 11 Infrastructural Information Technology 7
Internal Information System Integration Strategic Integration 9 Operational Integration 8 Infrastructural Integration – Data Integration 6 Infrastructural Integration – Network Connectivity 7
External Information System Integration Strategic Integration 9 Operational Integration 8 Infrastructural Integration – Data Integration 6 Infrastructural Integration – Network Connectivity 6
Supply Chain Integration Relationship with Customers 6 Relationship with Suppliers 6
Suppliers’ Operational Performance
Delivery Reliability 6 Process Flexibility 6 Cost Leadership 5 Innovation 5 Product Quality 6
Firm’s Operational Performance Delivery Reliability 6 Process Flexibility 6 Cost Leadership 5 Innovation 5 Product Quality 6
Firm Performance 8 Total 161

52
CHAPTER 5: INSTRUMENT DEVELOPMENT - LARGE-SCALE ADMINISTRATION AND INSTRUMENT VALIDATION
5.1. SAMPLING PLAN
5.1.1. Sampling plan and sampling design
A cross-sectional self-administered mail survey was conducted. This study aims
to cover a wide variety of respondents from different tiers in supply chains (e.g., raw
material suppliers, assemblers, manufacturers, wholesalers, component suppliers, sub-
assemblers, distributors, and retailers) and from different major business areas (e.g.,
manufacturing, medicine, business service, public utility, transportation, petroleum,
finance, mining, and construction).
Many options are available when developing sampling design. For example,
convenient samples can be chosen if the sampling frame is not available or a population
sample is hard to identify. Simple random sampling can be utilized when a population
sample is unique and well identified. Stratified sampling can be used when the purpose of
research is to find a unique phenomenon that confounds within each sample strata.
Cluster sampling can be used when the population that is to be surveyed is physically or
geographically separated or widely dispersed. According to the available sampling
alternatives, this study chose a simple random sample for several reasons. First, there
were many sampling frames available. There were many manufacturing associations that
provided a list of manufacturing firms. Second, a simple random sample provides reliable
and valid results. The purpose of this research is to explain relationships among variables.

53
The results should show both statistical and practical implications to the external
population represented by the respondents.
5.1.2. Sampling frame options
One important success factor in an empirical study is the quality of respondents.
The respondents are expected to have detailed knowledge on multiple topics covered in a
survey. In the current study, the respondents are expected to have experience in different
levels of IT utilization; which is used to enhance integration within their firm or with
their trading partners. The respondents are also expected to be representatives of different
geographical areas, industries, and firm sizes, so that the results can be highly
generalized.
Many manufacturing associations provide lists of manufacturing firms, e.g. the
Association of Purchasing and Inventory Control (APIC), the Society of Manufacturing
Engineers (SME), the National Association of Purchasing Management (NAPM), the
Council of Logistics Management (CLM), and so on. The criteria for choosing the
optimal sampling frame depended on many factors such as past experience, cost,
available information, experts’ advice, data accuracy, and number of records. In this
study, the sampling frame was obtained from the Society of Manufacturing Engineers
(SME), an internationally known organization of manufacturing managers and engineers,
with more than 120,000 active members world wide and in almost every industry. The
list was obtained with a limited agreement and partial sponsorship by the SME
(Appendix K).

54
5.1.3. Random sampling generation
Once the sampling frame was identified, the process of generating random
samples was undertaken. The initial mailing list of 6,000 names was randomly selected
from the SME United States membership database, which included 120,000 names using
predetermined criteria. The criteria include states in the East North Central and West
North Central regions, job functions, and SIC Codes. The states include OH, IN, MI, IA,
WI, SD, ND, IL, MO, KS, NE, and MS. The job functions include manufacturing
production, manufacturing engineering, and quality assurance/control. Priorities of
members were then stratified in the following SIC classifications.
Food and kindred products........................................................... SIC 20 Tobacco........................................................................................ SIC 21 Textile mill products .................................................................... SIC 22 Apparel and other textile products............................................... SIC 23 Lumber and wood products ......................................................... SIC 24 Furniture and fixtures................................................................... SIC 25 Paper and allied products ............................................................. SIC 26 Printing and publishing ................................................................ SIC 27 Chemical and allied products....................................................... SIC 28 Petroleum and coal products........................................................ SIC 29 Rubber and plastic products......................................................... SIC 30 Leather and leather products........................................................ SIC 31 Stone, clay and glass products ..................................................... SIC 32 Primary metal industries .............................................................. SIC 33 Fabricated metal products ............................................................ SIC 34 Industrial machinery and equipment, except electrical................ SIC 35 Electric and electronic equipment................................................ SIC 36 Transportation equipment ............................................................ SIC 37 Instruments and related products ................................................. SIC 38
The SME provided the mailing list in an ASCII comma delimited format. The list
includes the following fields: keyline (which can be translated into company size and 4
digit SIC code), person’s prefix name, person’s first name, person’s middle initial,

55
person’s last name, person’ job title, company name, address line 1, address line 2, mail
stop, city, state code, zip code, telephone number, and extension number. Table 5.1
shows codes used to translate a company size based on the number of employees.
Codes Employee Sizes 0 1-19 1 20-49 2 50-99 3 100-249 4 250-499 5 500-999 6 1000-2499 7 2500+
Table 5.1: Number of Employees
5.2. LARGE SCALE DATA COLLECTION METHODOLOGY
This mailing list was then further refined through the following steps: 1) names
were removed if they were without organization affiliations, or listed addresses that were
home addresses. This was done in consideration of home privacy of respondents; 2) when
multiple names from the same organization were given, the name of the person with the
most relevant job title was retained and the others were removed; 3) obvious errors in
names and mailing addresses were also corrected. These refinements resulted in a list of
4,000 names.
To ensure a reasonable response rate, five research schemes were administered.
First, 4,000 questionnaires with cover letter, a fact sheet and a letter of endorsement of
the SME indicating the purpose and significance of the study were mailed to the target
respondents between November 8-12, 2004 (Appendix D, E, F, and K). In the cover
letter, a web-address of the online version of the survey along with customized
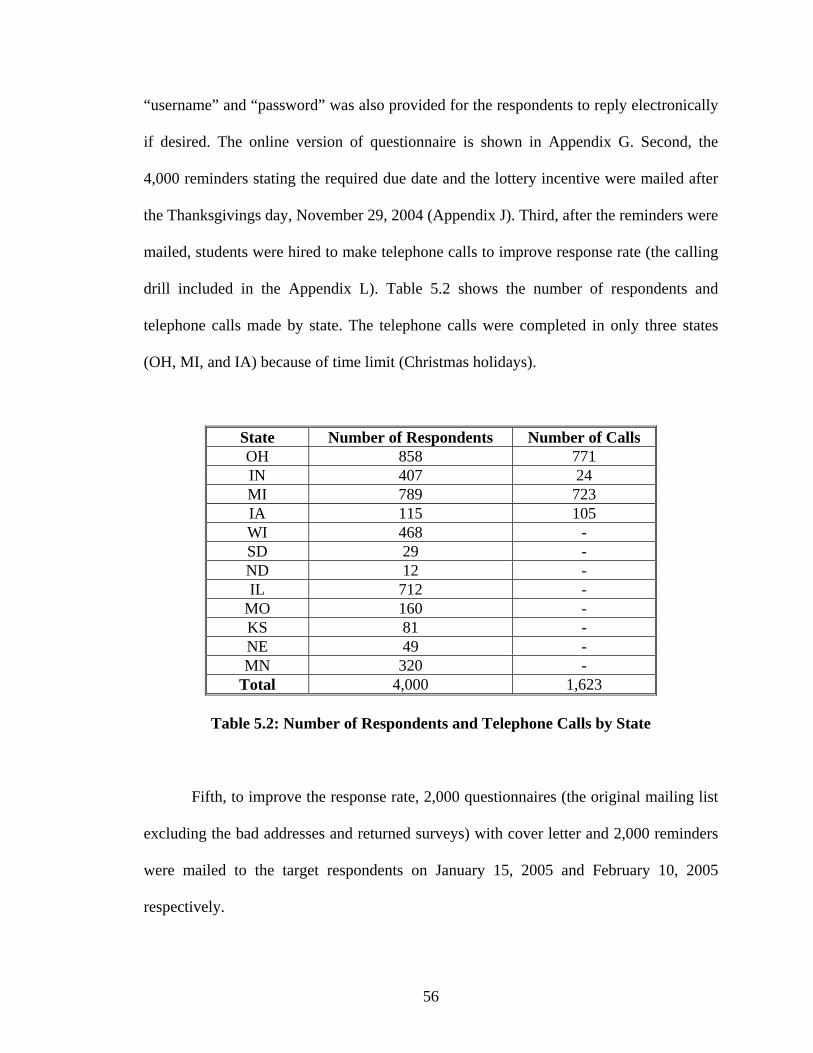
56
“username” and “password” was also provided for the respondents to reply electronically
if desired. The online version of questionnaire is shown in Appendix G. Second, the
4,000 reminders stating the required due date and the lottery incentive were mailed after
the Thanksgivings day, November 29, 2004 (Appendix J). Third, after the reminders were
mailed, students were hired to make telephone calls to improve response rate (the calling
drill included in the Appendix L). Table 5.2 shows the number of respondents and
telephone calls made by state. The telephone calls were completed in only three states
(OH, MI, and IA) because of time limit (Christmas holidays).
State Number of Respondents Number of Calls OH 858 771 IN 407 24 MI 789 723 IA 115 105 WI 468 - SD 29 - ND 12 - IL 712 -
MO 160 - KS 81 - NE 49 - MN 320 -
Total 4,000 1,623
Table 5.2: Number of Respondents and Telephone Calls by State
Fifth, to improve the response rate, 2,000 questionnaires (the original mailing list
excluding the bad addresses and returned surveys) with cover letter and 2,000 reminders
were mailed to the target respondents on January 15, 2005 and February 10, 2005
respectively.
57
Of 4,000 mailed questionnaires, 579 did not reach the targeted respondents
because of bad addresses. One hundred and eighty eight (188) questionnaires were
undeliverable and 391 questionnaires were identified as incorrect addresses from the
follow up phone calls. This number is expected to be higher if all calls are completed.
The main reasons for undeliverable mail were; respondents not with the company,
deceased, company out of business, or company moved. A large number of (235)
respondent refused to participate in the survey. In addition, 14 questionnaires were
returned empty. Therefore, the number of complete and usable responses was 220,
representing a response rate of 6.91% (calculated as 220/(4000-579-235)).
Out of 220 respondents, the first wave produced 148 responses and the second
generated 72 responses. Ninety three respondents (42%) were from the traditional mail
and 127 respondents (58%) were from the on-line version of the survey.
5.3. SAMPLE CHARACTERISTICS OF THE RESPONDENTS
This section discusses sample characteristics of the respondents (job title, levels
of education, years working and years with the organization), the SIC code, the size of
organizations, the organizations (years of implementing SCM program, the number of
product lines, the primary production system, employment size, annual sales, the
percentage of electronic business transactions with customers and suppliers, and
quantitative SCM measures), and the supply chains (horizontal structure, horizontal
position of the organization in the supply chain, and channel structure).

58
5.3.1 Sample Characteristics of the Respondents (also see Table 5.3 Appendix M)
Job Title: 117 of the respondents (53.2%) are managers, while 16 or 7.3% state
they are directors and 15 (6.8%) are titled CEO/president. Sixty of the respondents
(27.3%) are supervisors and 10 (4.6%) are engineers, and 2 (0.9%) are identified as
“other” category.
Job Function: The respondents were asked to mark all job functions that apply to
their everyday tasks. Therefore, the results of this item are combinations of job function
(one respondent can choose more than one job function). The majority of respondents
(41.4%) chose manufacturing and production, 6.5% of the respondents chose corporate
executive, and 6.1% purchasing, while 1.2% chose distribution, 2.3% chose
transportation, and 6.1% chose sales. 13.4% are unidentified. The rest of respondents
(23.0%) belong to the “other” category.
Level of Education: 10.5% of the respondents have finished high school, while
20% state they have completed two-year College and 31.8% have completed Bachelor’s
degrees. 16.4% have completed Mater’s degrees and 1.4% are in a Doctoral level. 15.9%
are unidentified. The rest of the respondents (4.1%) belong to the “other” category.
Years at the Organization: 7.3% of respondents indicate they have been with the
organization less than 10 years, while 24.6% indicate having been at the organization
between 4-10 years, and 18.6% of respondents state their years at the organization as
between 10-15. 9.6% of respondents state that they have been with the organization
between 15-20 years. The respondents with years at the organization more than 20 years
account for 24.6% of the sample. 15.5% are unidentified.

59
Years Working: 0.5% of the respondents have been working less than 3 years.
7.3% of the respondents have been working between 4-10 years, while 12.7% state they
have worked between 10-15 years and 10.9% have worked between 15-20 years. 53.2%
have worked for more than 20 years. 15.5% are unidentified.
In short, more than 53% of the respondents are managers, have been working over
20 years, and/or function in the manufacturing and production area. CEO/presidents and
directors were less likely to respond to the survey as indicated. This is represented by the
low response rate compared to managers. The level of education and years of work at the
current organization are randomly spread out, but the majority completed Bachelor’s
degree and have been working for the current organization for 4-20 years. Figures
5.3.1.1 to 5.3.1.5 (Appendix M) display the respondents by job titles, job functions, level
of education, years worked at the organization, and years of working, respectively.
5.3.2. Sample Characteristics of Surveyed Organizations (also see Table 5.4 Appendix M)
Major Business: 79.6% of the respondents state that their business function is
manufacturing, while 1% state that their main business is transportation and 1% is
mining/construction/agriculture. 3.2% of the respondents are involved in other types of
business and 15.5% are unidentified.
Major Industry: less than 1% of the organizations are in food and kindred
products (SIC 20), tobacco (SIC 21), and furniture and fixtures industry (SIC 25). 1% of
the organizations are in the leather and leather products industry (SIC 31). About 2.7% of
the organizations are in the electric and electronic equipment industry (SIC 36) and 1.8%

60
in instruments and related products industry (SIC 38). About 2.7% of the organizations
are from primary metal industries (SIC 33). About 7.7% of the organizations are from the
rubber and plastic products industry (SIC 30). 27.3% of the organizations are in the
fabricated metal products industry (SIC 34). 10.5% of the organizations are in the
industrial machinery and equipment industry (SIC 35). 12.3% of the organizations are in
the transportation equipment industry (SIC 37). 14.1% of the organizations are in the
miscellaneous manufacturing industries (SIC 39). 18.6% are unidentified.
Primary Production System: Half of the organizations (50%) use make-to-order as
their primary product system; while make-to-stock, engineer-to-order, and assemble-to-
order account for 14.6%, 10%, and 9.1% respectively. 16.4% are unidentified.
Primary Manufacturing System: 9.5% of the organizations use continuous flow
process as their primary manufacturing system; while 18% of the organizations use batch
processing. 10.8% of the organizations use a flexible manufacturing system. 8.6% of the
organizations use an assembly line. 19.8% of the organizations are a job shop. 4.1% of
the organizations are a project system. 13.5% of the organizations are a manufacturing
cell and 15.8% are unidentified.
Number of Employees: 10.9% of the organizations have fewer than 50 employees.
14.6% of the organizations have between 51 and 100 employees. 22.7% of the
organizations have between 100 and 250 employees. 13.2% of the organizations have
between 251 and 500 employees, and 6.4 % of the organizations have between 501 and
1000 employees. Organizations with more than 1000 employees account for 16.4% of the
sample and the rest (15.9%) are unidentified.
61
Annual Sales: 9.1% of the organizations have sales volumes less than 5 million.
7.3% of the organizations have sales volumes between 5 and 10 million. 17.7% of the
organizations have sales volumes between 10 and 25 million. 11.4% and 11.8% of the
respondents have sales volumes between 25-50 million and between 50-100 million
respectively. About 24.1% of the organizations have sales volumes more than 100
million. 18.6% of respondents could not identify their sales volumes.
In short, the majority of the surveyed organizations reported manufacturing as
their business sector mainly in manufacturing fabricated metal products, and/or used a
make-to-order production system. The number of employees and annual sales volumes
are normally distributed among the surveyed organizations. Figure 5.3.2.1 to Figure
5.3.2.6 (Appendix M) display the surveyed organizations according to major business,
major industry, primary business system, primary manufacturing system, number of
employees, and annual sales, respectively.
5.3.3. Sample Characteristics of the Supply Chains (also see Table 5.5 Appendix M)
Organization’s Involvement in “Supply Chain Integration”: 29.6% of the
respondents reported that their organization embarked upon a program aimed at
implementing “Supply Chain Integration”, while 53.6% of the respondents reported
otherwise. 16.8% of the respondents are unidentified.
Electronic Business Transactions with Customers: 13.6% of the organizations
state that they have done less than 10% of their business transactions electronically with
customers, 17.7% of the organizations have done 10%-30% of their business transactions
electronically with customers, and 20% of the organizations have done 30-50% of their
business transactions with customers. 18.6% indicate 50%-80% of their business

62
transactions are done electronically with customers and 11.8% indicate that more than
80% of their business transactions with customers are done electronically. 18.1% are
unidentified.
Electronic Business Transactions with Suppliers: 19.1% of the organizations state
that they have done less than 10% of their business transactions electronically with
customers, 22.7% of the organizations have done 10%-30% of their business transactions
electronically with customers, and 16.8% of the organizations have done 30-50% of their
business transactions with customers. 17.3% indicate 50%-80% of their business
transactions are done electronically with customers and 6.4% indicate that more than
80% of their business transactions with customers are done electronically. 17.7% are
unidentified.
Comparing the electronic business transactions with suppliers and customers (see
Figure 5.3.3.1), it can be seen that most of the business transactions with suppliers and
customers are still done off-line in a traditional way. Organizations are more likely to
conduct electronic business transactions with customers than with suppliers. About 12%
of the organizations do more than 80% of their transactions with customers
electronically, but only 6% of the organizations have done more than 80% of their
business transactions with suppliers electronically. On the other hand, 14% of
organizations conduct less than 10% of the transactions electronically with customers, but
the number of the organizations that only do less than 10% of the transactions with
suppliers is larger by 19%.
Horizontal Structure: horizontal structure refers to the number of tiers across the
supply chain. The supply chain may be long, with numerous tiers, or short, with few tiers.

63
The results show that about half of supply chains (49%) have less than or equal to 3 tiers.
26% have 4 or 5 tiers across the supply chains. 4% have 6 or 7 tiers across the supply
chains. Less than 1% have 8 to 10 tiers across the supply chains. 2% have more than 10
tiers across the supply chains. The rest (18%) are unidentified.
Horizontal Position of an Organization in the Supply Chain: A company can be
positioned at or near the initial source of supply (raw material and component supplier),
be at or near the ultimate customer (distributor/wholesaler/retailer), or somewhere
between these end points of the supply chain (assembler and manufacturer). Among all
surveyed organizations, manufacturers account for 54.1%, assemblers and sub-
assemblers accounts for 9.5% and 4.6% respectively. In addition, 1.4% and 13.4% of
respondents consider themselves raw materials suppliers and component suppliers
correspondingly. Furthermore, distributors, wholesalers, and retailers account for 2.1%,
1.8%, and 0.7% respectively. 12.4% are unidentified. (Note: one company may occupy
multiple positions and may represent multiple items, the calculation of the percentage is
based on the total sample size of 283. Relating to the characteristics of supply chains,
most surveyed organizations are manufacturers (also see Figure 5.3.3.1 to Figure 5.3.3.3
Appendix M).
5.3.4. Sample Characteristics of the Technology Applications
Organization’s Information Technology Applications: 24.2% of the respondents
reported that they use e-mail primarily for work, while 17.1% of the respondents reported
using word processing. 21.4%, 17.1%, and 8.7% of the respondents use spread sheet,
database, and programming tools respectively. 3.2% chose “other” category and 8.2% are
unidentified.

64
Organization’s Computer Applications: 26.1% of the respondents reported that
they use main frame application as a main computing system, while 37.2% of the
respondents reported using PC application. 36.7% use networked application as a main
computing system.
5.4. TEST OF NON-RESPONSE BIAS
One concern of the survey is that information collected from respondents might
have a non-response bias. Non-response bias can be estimated using the mean differences
of some variables between the first wave response and the second wave response can be
estimated by assuming that the second wave response is a non-response for the first
wave.
Four thousand (4,000) surveys were sent out as the first wave. Out of this number,
220 surveys were received. Within this number, 148 responses were from the first wave
and only 72 were from the second wave. Table 5.5 (Appendix M) shows the
demographics of respondents by waves. The non-response bias can also be tested using
an indirect approach by comparing variable means between those subjects who responded
after the initial mailing (first wave) and those who responded to the second wave. Chi-
square tests were used to make the comparisons. The results are shown in the last column
of Table 5.6. We can see no significant difference in employment size, sales volume,
production system, and respondent’s job title between these two groups and we conclude
non-response bias is not a cause for concern.
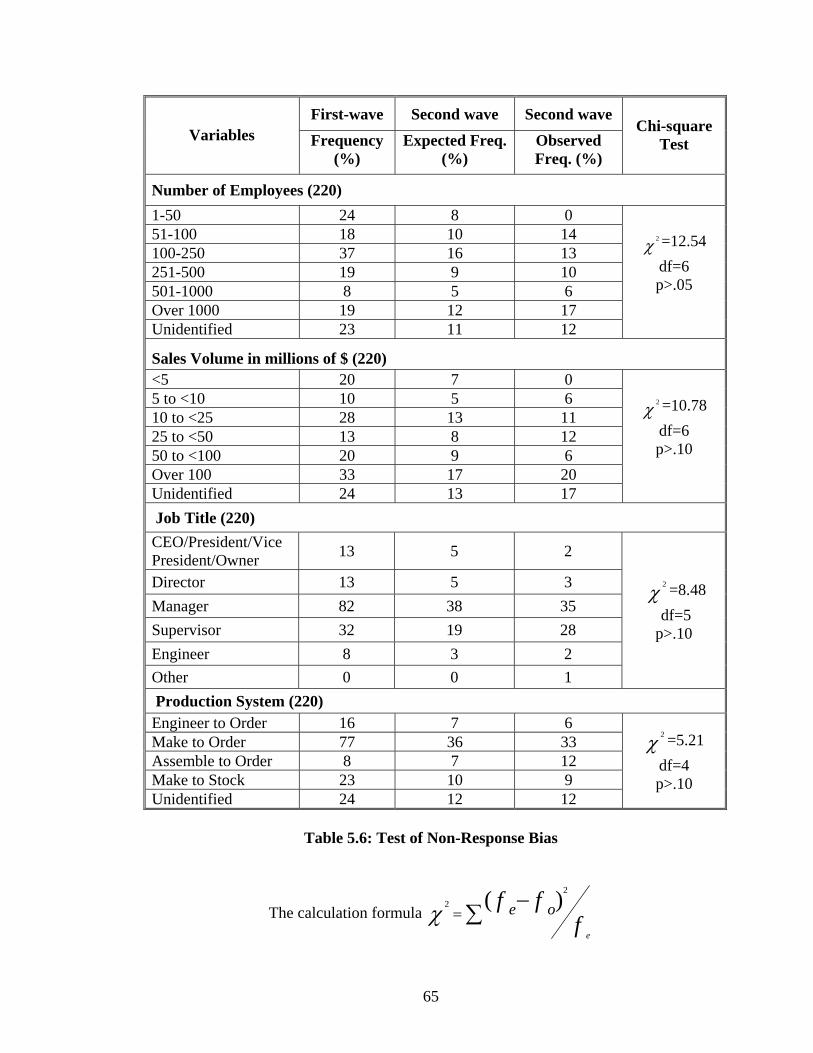
65
First-wave Second wave Second wave Variables Frequency
(%) Expected Freq.
(%) Observed Freq. (%)
Chi-square Test
Number of Employees (220) 1-50 24 8 0 51-100 18 10 14 100-250 37 16 13 251-500 19 9 10 501-1000 8 5 6 Over 1000 19 12 17 Unidentified 23 11 12
χ 2 =12.54 df=6 p>.05
Sales Volume in millions of $ (220) <5 20 7 0 5 to <10 10 5 6 10 to <25 28 13 11 25 to <50 13 8 12 50 to <100 20 9 6 Over 100 33 17 20 Unidentified 24 13 17
χ 2 =10.78 df=6 p>.10
Job Title (220) CEO/President/Vice President/Owner 13 5 2
Director 13 5 3 Manager 82 38 35 Supervisor 32 19 28 Engineer 8 3 2 Other 0 0 1
χ 2 =8.48 df=5
p>.10
Production System (220) Engineer to Order 16 7 6 Make to Order 77 36 33 Assemble to Order 8 7 12 Make to Stock 23 10 9 Unidentified 24 12 12
χ 2 =5.21 df=4 p>.10
Table 5.6: Test of Non-Response Bias
The calculation formula ∑−
= fff
e
oe )( 22χ

66
5.5. TEST OF RESPONSE BIAS
The response bias can also be tested based on the mean differences of some
variables between the regular mail responses and the online responses. Out of 220
responses, 93 (42%) are from the regular mail and 127 (58%) are from the online survey.
The response bias can be tested by comparing variable means between those subjects
who responded online and those who responded using regular mail. Table 5.7 shows the
non-response bias results. The results show that the means values of demographic
variables (e.g., job title, level of education, years of work, years at a company, annual
sales, and number of employees) are not significantly differently at the < 0.05 level.
Thus, the results confirm that a regular mail survey and an online survey have no
response bias.
Variables Regular Mail (Means)
Online Mail (Means) t - Differences P - Value
Job Title 3.01 3.22 1.82 .07
Education 2.89 2.88 0.05 .96
Years of Work 4.18 4.39 1.37 .17
Years at Company 3.17 3.29 0.57 .57
Annual Sales 3.86 4.10 0.91 .37
Number of Employees 3.36 3.55 0.79 .43
Table 5.7: Test of Response Bias between an Online Survey and a Regular Mail

67
5.6. LARGE SCALE INSTRUMENT ASSESSMENT METHODOLOGY
Once the data was collected, the survey instrument used in the large-scale study
was submitted to rigorous reliability and validity assessment using the 220 responses.
The validity of a measurement concerns the “truth” of the measurement. The validity of a
measurement procedure is the degree to which the measurement process measures the
variable it claims to measure. The reliability of a measurement procedure is the stability
or consistency of the measurement. If the same individuals are measured under the same
conditions, a reliable measurement procedure will produce identical measurements.
Although reliability and validity are both criteria for evaluating the quality of a
measurement procedure, these two factors are partially related and partially independent.
A measure cannot be valid unless it is reliable, but a measure can be reliable without
being valid. As per the guidelines of Bagozzi (1980) and Bagozzi and Phillips (1982), the
important properties for measurement to be reliable and valid include content validity,
internal consistency of operationalization (unidimensionality and reliability), construct
validity (discriminant and convergent) and predictive validity.
Content Validity
The content validity of measurement refers to the representativeness of item
content domain. If the measures adequately cover the topics that have been defined as the
relevant dimensions, then it can be concluded that an instrument has good content
validity (Kerlinger, 1978). The evaluation of content validity is a rational judgmental
process not open to numerical justification. Nunnally (1978) stated “Content validity rests
mainly on appeals to reason regarding the adequacy with which important content has
been sampled and on the adequacy with which the content has been cast in the form of
68
test items.” An instrument has content validity if there is a general agreement among the
subjects and researchers that the measurement items that cover all important aspects of
the variable being measured.
Content validity can be assessed by two important processes. First, a
comprehensive review of the literature was conducted to make sure that measurement
items were well covered the domain of the variable being measured (Nunnally, 1978).
Second, a Q-sort method was conducted to clarify a description of the hypothesized
constructs (Appendix B).
Unidimensionality and Reliability
The reliability (internal consistency) of the items comprising each dimension was
examined using Cronbach’s alpha. Following the guideline established by Nunnally
(1978), an alpha score of higher than .70 is generally considered to be acceptable. To
further ensure the unidimensionality of the measurement instrument, Item-total
correlations have been used extensively for the development of unidimensional scales.
Item-total correlation refers to a correlation of an item or indicator with the composite
score of all the items or indicator with the composite score of all the items forming the
same set. Item-total correlations less than 0.5 are usually candidates for elimination in
further analysis. If all the items in a measure are drawn from the domain of a single
construct, responses to those items should be highly intercorrelated (Churchill, 1979).
Convergent Validity
Convergent validity is defined as the extent to which the measurement items are
converged into a theoretical construct. The traditional method employed for evaluation
of construct validity of measurement scales is confirmatory factory analysis (CFA). In
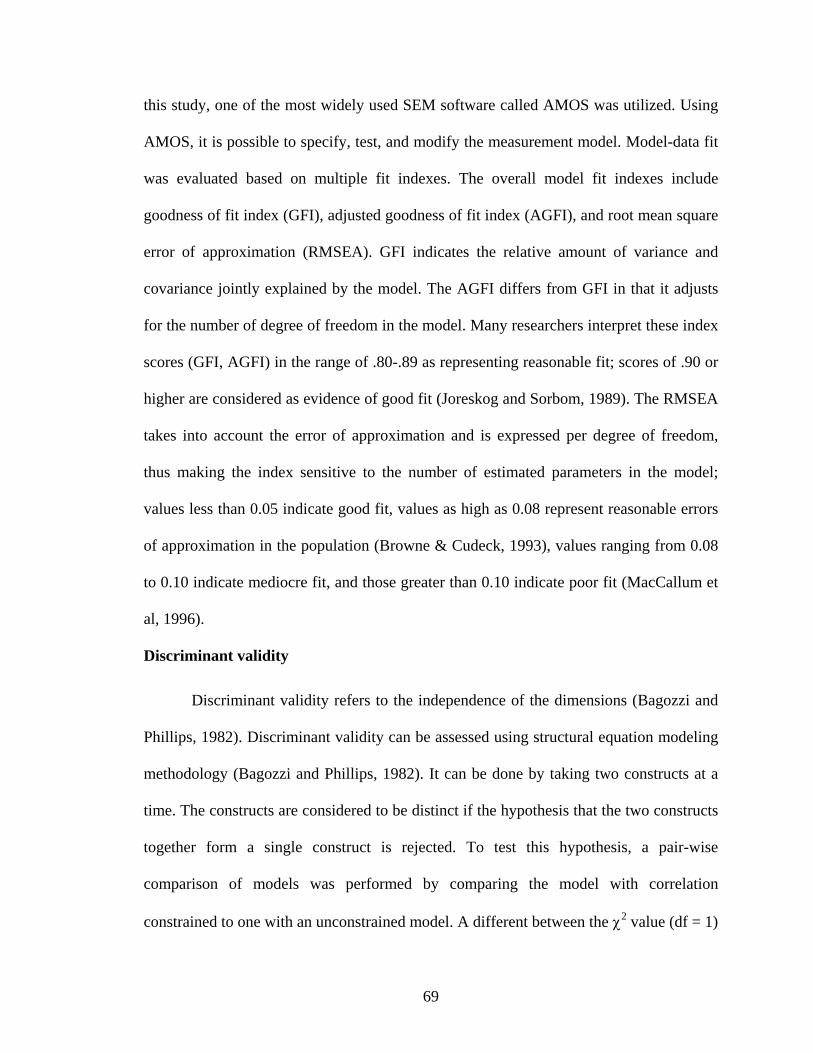
69
this study, one of the most widely used SEM software called AMOS was utilized. Using
AMOS, it is possible to specify, test, and modify the measurement model. Model-data fit
was evaluated based on multiple fit indexes. The overall model fit indexes include
goodness of fit index (GFI), adjusted goodness of fit index (AGFI), and root mean square
error of approximation (RMSEA). GFI indicates the relative amount of variance and
covariance jointly explained by the model. The AGFI differs from GFI in that it adjusts
for the number of degree of freedom in the model. Many researchers interpret these index
scores (GFI, AGFI) in the range of .80-.89 as representing reasonable fit; scores of .90 or
higher are considered as evidence of good fit (Joreskog and Sorbom, 1989). The RMSEA
takes into account the error of approximation and is expressed per degree of freedom,
thus making the index sensitive to the number of estimated parameters in the model;
values less than 0.05 indicate good fit, values as high as 0.08 represent reasonable errors
of approximation in the population (Browne & Cudeck, 1993), values ranging from 0.08
to 0.10 indicate mediocre fit, and those greater than 0.10 indicate poor fit (MacCallum et
al, 1996).
Discriminant validity
Discriminant validity refers to the independence of the dimensions (Bagozzi and
Phillips, 1982). Discriminant validity can be assessed using structural equation modeling
methodology (Bagozzi and Phillips, 1982). It can be done by taking two constructs at a
time. The constructs are considered to be distinct if the hypothesis that the two constructs
together form a single construct is rejected. To test this hypothesis, a pair-wise
comparison of models was performed by comparing the model with correlation
constrained to one with an unconstrained model. A different between the χ2 value (df = 1)

70
of the two models that is significant at p < 0.05 level would indicate support for the
discriminant validity criterion (Joreskog, 1971).
Another important aspect of discriminant validity is the validation of second-order
construct. For example, information technology utilization is measured by strategic
information technology, operational information technology and infrastructural
information technology and each of these sub-constructs is measured by several
indicators. The question here is “do these three sub-constructs form a high order construct
(information technology utilization)?” T coefficient can be used to test for the existence
of the single second-order construct that accounts for the variations in all its sub-
constructs. The T coefficient is calculated as the following: suppose that model A (see
Figure 5.6.1) represents four correlated first-order factors and model B (see Figure 5.6.2)
hypothesizes the same four first-order factors and a single second-order factor. T
coefficient is the ratio of chi-square of model A to the chi-square of model B which
indicates the percentage of variation in the four first order factors in model A explained
by the second-order factor in model B (Doll et al., 1995). Even though the fit index of
model B is always a little “worse” than that of model A since more constraints have been
added in the model B, a T coefficient higher than .80 may indicate the existence of a
second-order construct since most of the variation shared by the first-order factors is
explained by the single second-order factor.
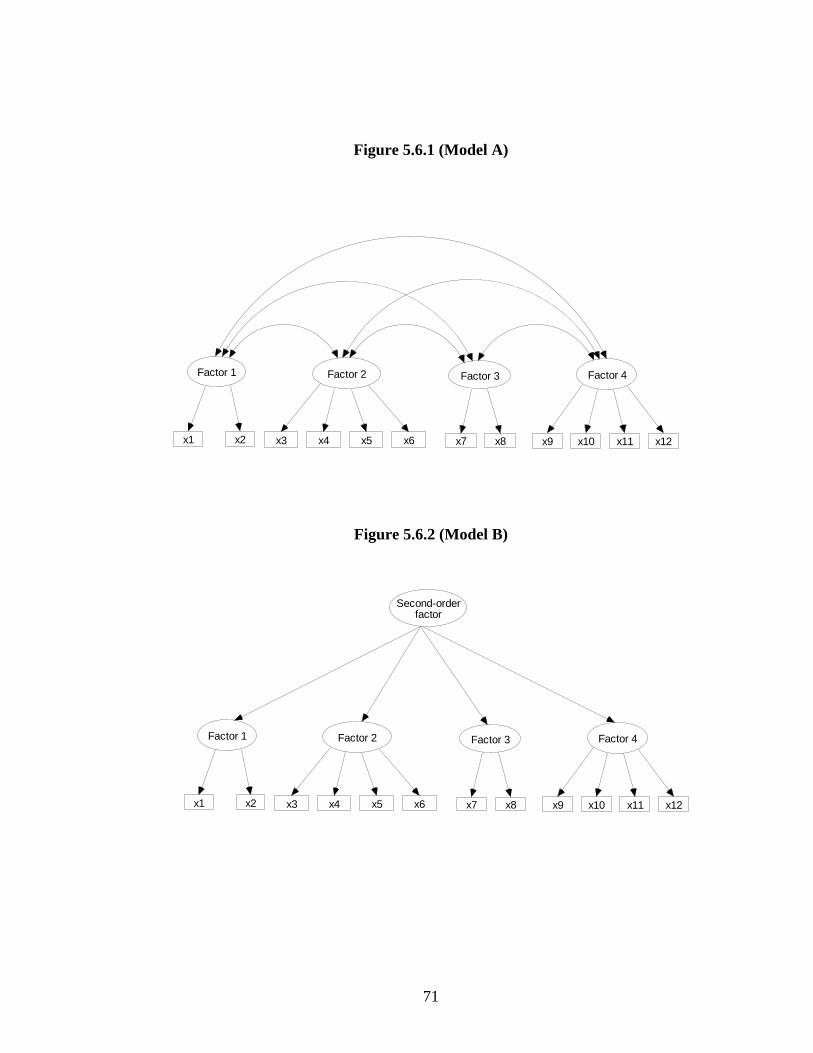
71
Figure 5.6.1 (Model A)
Factor 1
x2x1
Factor 2
x6x5x4x3
Factor 3
x8x7
Factor 4
x10x9 x11 x12
Figure 5.6.2 (Model B)
Factor 1
x2x1
Factor 2
x6x5x4x3
Factor 3
x8x7
Factor 4
x10x9 x11 x12
Second-orderfactor

72
Predictive Validity
The predictive validity of the measures was also examined by linking the
independents variables with their relevant dependent variables. To check for the
predictive validity of the resulting measurement instrument, a composite score for each
construct was calculated by taking the average of all remaining items in the construct.
Pearson correlation coefficients among these composite construct measures were then
calculated to determine the significance of hypothesized relationships.
5.7. LARGE-SCALE MEASUREMENT RESULTS
The following section presents the large-scale instrument validation results on
each of the seven main constructs: Information Technology Utilization (ITU), Internal
Information System Integration (IISI), External Information System Integration (EISI),
Supply Chain Integration (SCI), Suppliers’ Operational Performance (SOP), Firm’s
Operational Performance (FOP), and Firm Performance (FP). For each construct, the
instrument assessment methodology described in the previous section was applied. In
presenting the results of the large-scale study, the following acronyms were used to
number the questionnaire items in each sub-construct.
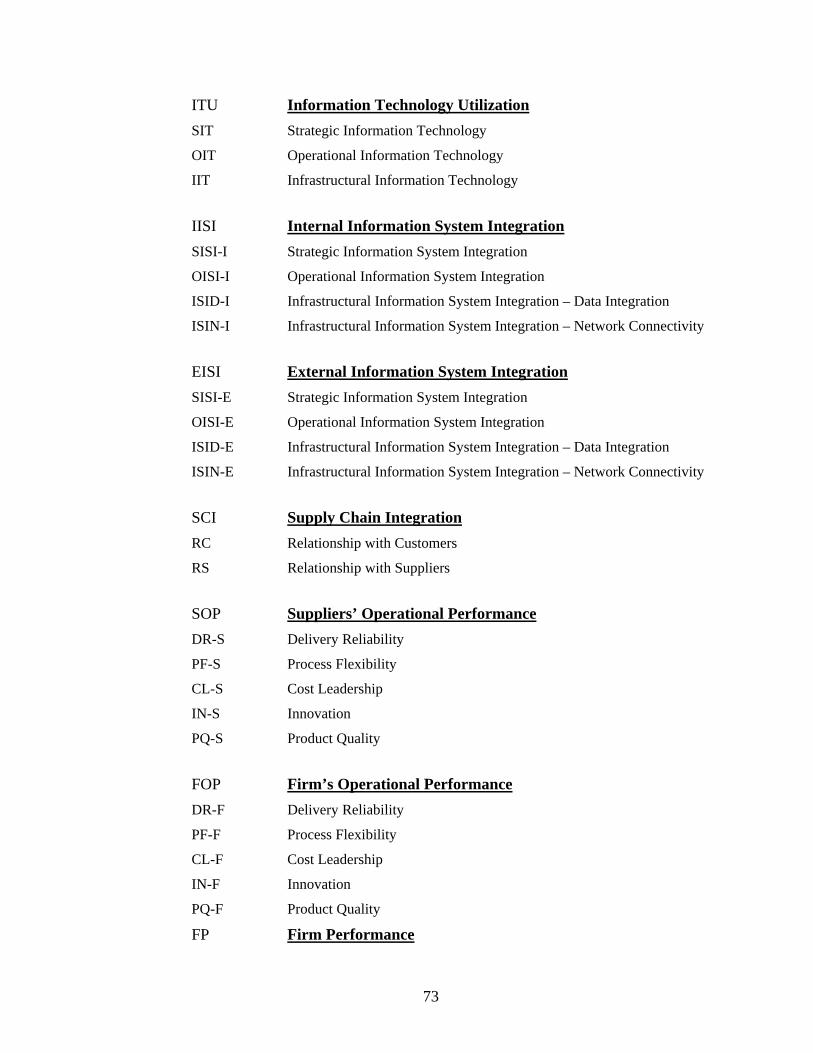
73
ITU Information Technology Utilization SIT Strategic Information Technology
OIT Operational Information Technology
IIT Infrastructural Information Technology
IISI Internal Information System Integration SISI-I Strategic Information System Integration
OISI-I Operational Information System Integration
ISID-I Infrastructural Information System Integration – Data Integration
ISIN-I Infrastructural Information System Integration – Network Connectivity
EISI External Information System Integration SISI-E Strategic Information System Integration
OISI-E Operational Information System Integration
ISID-E Infrastructural Information System Integration – Data Integration
ISIN-E Infrastructural Information System Integration – Network Connectivity
SCI Supply Chain Integration RC Relationship with Customers
RS Relationship with Suppliers
SOP Suppliers’ Operational Performance DR-S Delivery Reliability
PF-S Process Flexibility
CL-S Cost Leadership
IN-S Innovation
PQ-S Product Quality
FOP Firm’s Operational Performance DR-F Delivery Reliability
PF-F Process Flexibility
CL-F Cost Leadership
IN-F Innovation
PQ-F Product Quality
FP Firm Performance

74
For each construct, the instrument assessment methodology described in the
previous section will be applied, and tables will be provided to present the results: 1) The
initial large-scale measurement items for the construct; 2) The dimension-level corrected
item-total correlation (CITC) scores and Cronbach’s alpha; 3) The convergent validity;
and 4) The discriminant validity; and 5) The final set of measurement items for the
construct ( not provided if there is no change in items after instrument validation ).
5.7.1. Information Technology Utilization
The Information Technology Utilization (ITU) construct was initially represented
by three dimensions and 26 items, including Strategic Information Technology (SIT)(8
items), Operational Information Technology (OIT)(11 items), and Infrastructural
Information Technology(IIT)(7 items).
Reliability and Unidimensionality Analysis The analysis began with
purification using CITC analysis. An initial reliability analysis was done for each of the
three Information Technology Utilization (ITU) dimensions. The Corrected Item-Total
Correlation (CITC) scores for all items in SIT, OIT and IIT dimensions were above 0.50.
The final Cronbach’s Alpha scores were 0.89 for SIT, 0.91 for OIT, and 0.84 for IIT. The
CITC for each item, its corresponding code name, and the reliability analysis results are
shown in Table 5.7.1.1.

75
Coding Items CITC-1 CITC-2 α
Strategic Information Technology (SIT)
SIT1 Long-term technology justification and planning. .72
SIT2 Budget justification and planning. .63
SIT3 Investment justification and planning. .69
SIT4 Long-term capacity planning. .69
SIT5 Long-term project planning. .74
SIT6 Project feasibility analysis. .60
SIT7 Competitor analysis. .63
SIT8 Industry analysis. .61
α= .89
Operational Information Technology(OIT) OIT1 Daily production control. .70
OIT2 Daily product quality control. .66
OIT3 Daily products distribution management. .79
OIT4 Daily product movement planning. .76
OIT5 Daily customer analysis. .71
OIT6 Daily customer relationship management. .68
OIT7 Daily supplier relationship management. .66
OIT8 Daily inventory management. .67
OIT9 Daily material requirement planning. .68
OIT10 Daily warehouse/space management. .58
OIT11 Technology services and training .50
α= .91
Table 5.7.1.1: Purification for Information Technology Utilization
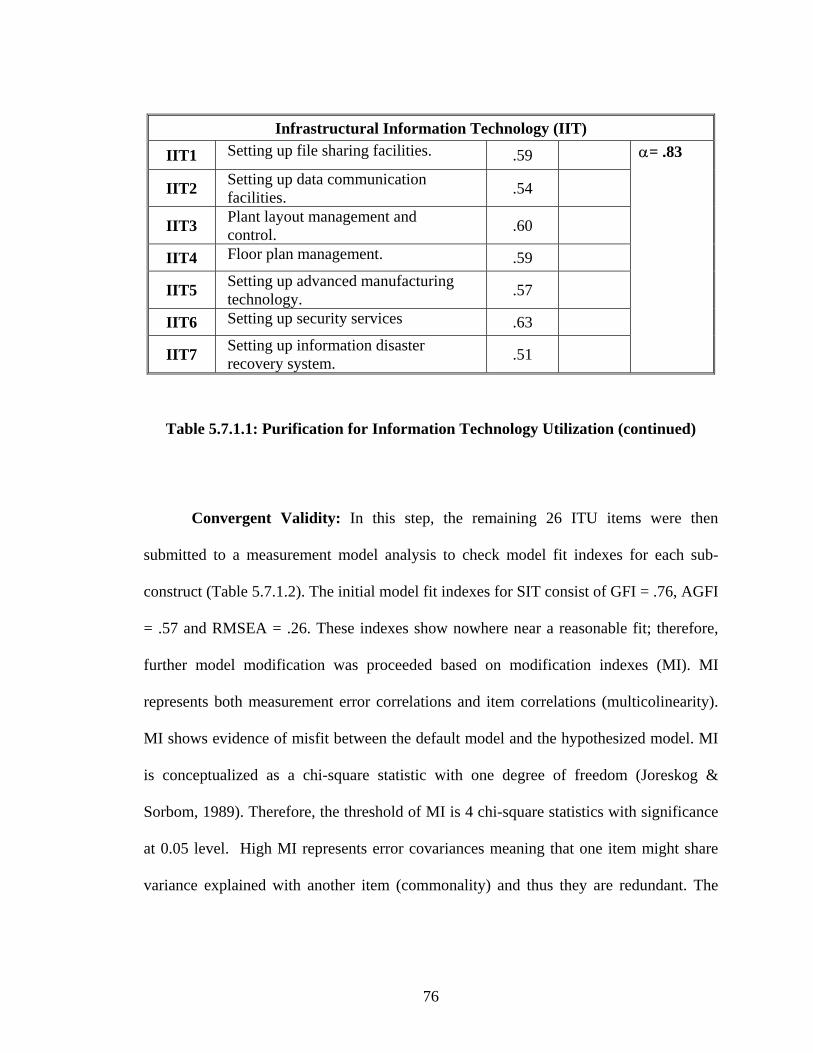
76
Infrastructural Information Technology (IIT)
IIT1 Setting up file sharing facilities. .59
IIT2 Setting up data communication facilities. .54
IIT3 Plant layout management and control. .60
IIT4 Floor plan management. .59
IIT5 Setting up advanced manufacturing technology. .57
IIT6 Setting up security services .63
IIT7 Setting up information disaster recovery system. .51
α= .83
Table 5.7.1.1: Purification for Information Technology Utilization (continued)
Convergent Validity: In this step, the remaining 26 ITU items were then
submitted to a measurement model analysis to check model fit indexes for each sub-
construct (Table 5.7.1.2). The initial model fit indexes for SIT consist of GFI = .76, AGFI
= .57 and RMSEA = .26. These indexes show nowhere near a reasonable fit; therefore,
further model modification was proceeded based on modification indexes (MI). MI
represents both measurement error correlations and item correlations (multicolinearity).
MI shows evidence of misfit between the default model and the hypothesized model. MI
is conceptualized as a chi-square statistic with one degree of freedom (Joreskog &
Sorbom, 1989). Therefore, the threshold of MI is 4 chi-square statistics with significance
at 0.05 level. High MI represents error covariances meaning that one item might share
variance explained with another item (commonality) and thus they are redundant. The

77
remedial action for error covariances is to delete such an item which has high error
variance.
Based on the modification indexes, 4 items (SIT4, SIT6, SIT7, and SIT8) were
dropped. The concepts of SIT4 – Long-term capacity planning and SIT6 – Project
feasibility analysis are already covered in SIT5 – Long-term project planning and
therefore were dropped. The concepts of SIT7 – Competitor analysis and SIT8 – Industry
analysis are already covered in SIT3 – Investment justification and planning and
therefore were dropped in the next phase. The new model fit indexes improved
significantly to GFI = .99, AGFI = .97, and RMSEA = .05.
The initial model fit indexes for OIT consist of GFI = .81, AGFI = .71 and
RMSEA = .15. These indexes show unreasonable fit; therefore, further model
modification was proceeded to get rid of both measurement error correlations and item
correlations (multicolinearity). Based on the modification indexes, six items (OIT3,
OIT6, OIT7, OIT8, OIT10 and OIT11) were dropped. The concepts of OIT3 – Daily
products distribution management, OIT8 – Daily inventory management, and OIT10 –
Daily warehouse/space management are already covered in OIT1 – Daily production
control and OIT4 – Daily product moving planning; therefore, they were dropped. The
concepts of OIT6 – Daily customer relationship management and OIT7 – Daily supplier
relationship management are already covered in OIT9 – Daily material requirement
planning; therefore, they were dropped. OIT11 – Technology services and training seems
to be irrelevant because of the low regression weight; therefore, it was dropped. The new
model fit indexes improved significantly to GFI = .98, AGFI = .93, and RMSEA = .08.

78
The initial model fit indexes for IIT consist of GFI = .68, AGFI = .37 and
RMSEA = .37. These indexes show unreasonable fit; therefore, further model
modification was proceeded to improve model fit indexes. Based on the modification
indexes, one item (IIT3, IIT4, and IIT6) were dropped. The concepts of IIT3 – Plant
layout management and control and IIT4 – Floor plan management show low regression
coefficients and are not really related to infrastructural information technology.
Therefore, they were dropped. The concept of IIT6 – Setting up security service is
already covered in IIT7 – Setting up information disaster recovery system and therefore;
it was dropped in the further analysis. The new model fit indexes improved significantly
to GFI = .99, AGFI = .93, and RMSEA = .09.
Coding Items Initial Model Fit
Final Model Fit
Strategic Information Technology (SIT)
SIT1 Long-term technology justification and planning.
SIT2 Budget justification and planning. SIT3 Investment justification and planning.
SIT4 Long-term capacity planning. *
SIT5 Long-term project planning.
SIT6 Project feasibility analysis. *
SIT7 Competitor analysis. *
SIT8 Industry analysis. *
GFI = .76
AGFI = .57
RMSEA = .26
GFI = .99
AGFI = .97
RMSEA = .05
Operational Information Technology(OIT)
OIT1 Daily production control.
OIT2 Daily product quality control.
OIT3 Daily products distribution management. *
GFI = .71
AGFI = .81
GFI = .98
AGFI = .93
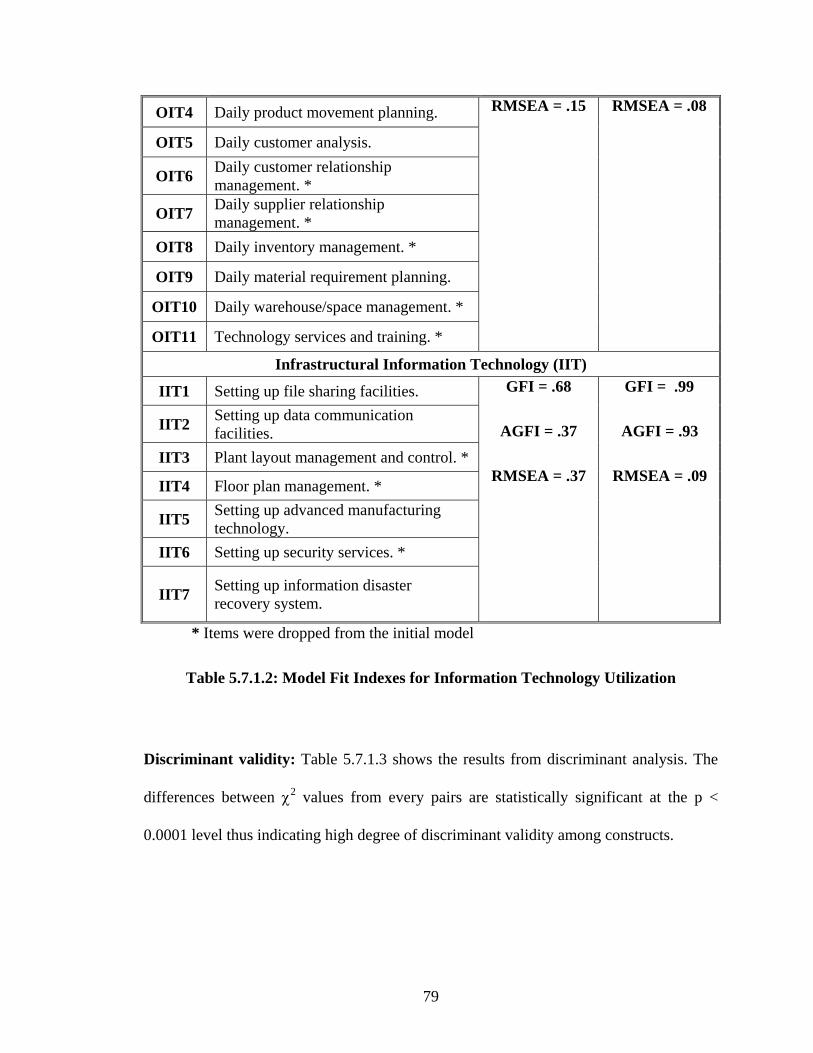
79
OIT4 Daily product movement planning.
OIT5 Daily customer analysis.
OIT6 Daily customer relationship management. *
OIT7 Daily supplier relationship management. *
OIT8 Daily inventory management. *
OIT9 Daily material requirement planning.
OIT10 Daily warehouse/space management. *
OIT11 Technology services and training. *
RMSEA = .15 RMSEA = .08
Infrastructural Information Technology (IIT)
IIT1 Setting up file sharing facilities.
IIT2 Setting up data communication facilities.
IIT3 Plant layout management and control. *
IIT4 Floor plan management. *
IIT5 Setting up advanced manufacturing technology.
IIT6 Setting up security services. *
IIT7 Setting up information disaster recovery system.
GFI = .68
AGFI = .37
RMSEA = .37
GFI = .99
AGFI = .93
RMSEA = .09
* Items were dropped from the initial model
Table 5.7.1.2: Model Fit Indexes for Information Technology Utilization
Discriminant validity: Table 5.7.1.3 shows the results from discriminant analysis. The
differences between χ2 values from every pairs are statistically significant at the p <
0.0001 level thus indicating high degree of discriminant validity among constructs.
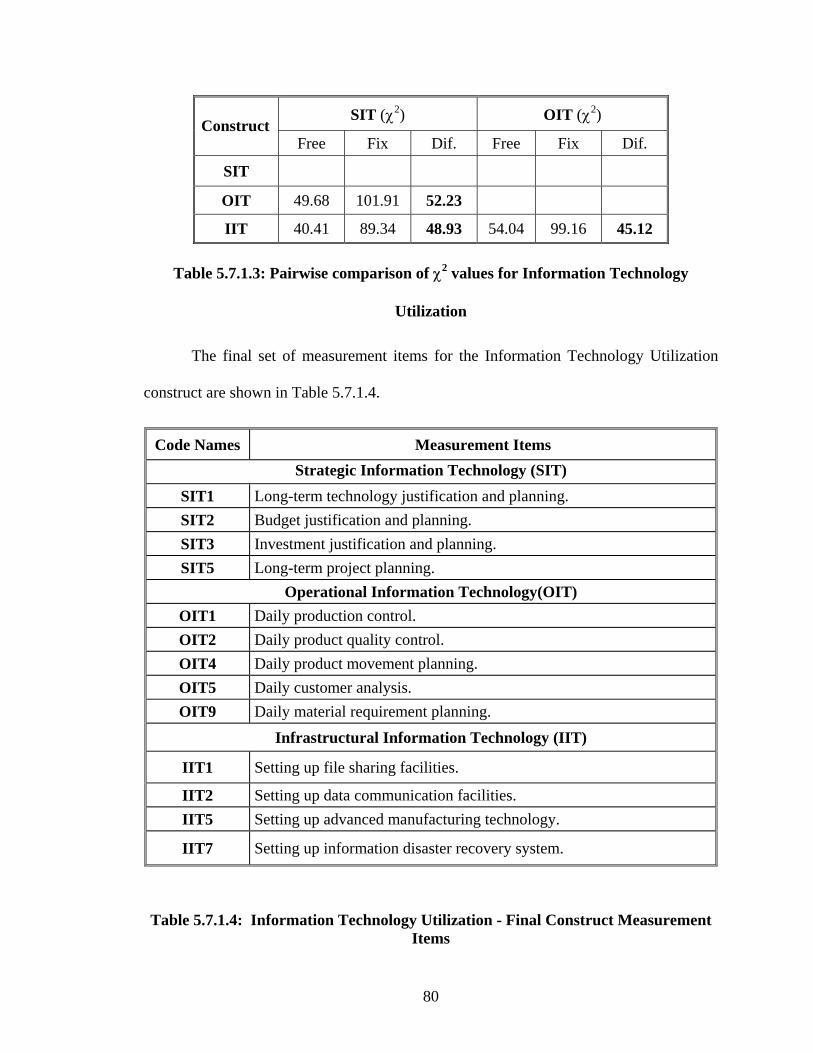
80
SIT (χ2) OIT (χ2) Construct
Free Fix Dif. Free Fix Dif.
SIT
OIT 49.68 101.91 52.23
IIT 40.41 89.34 48.93 54.04 99.16 45.12
Table 5.7.1.3: Pairwise comparison of χ2 values for Information Technology
Utilization
The final set of measurement items for the Information Technology Utilization
construct are shown in Table 5.7.1.4.
Code Names Measurement Items Strategic Information Technology (SIT)
SIT1 Long-term technology justification and planning. SIT2 Budget justification and planning. SIT3 Investment justification and planning. SIT5 Long-term project planning.
Operational Information Technology(OIT) OIT1 Daily production control. OIT2 Daily product quality control. OIT4 Daily product movement planning. OIT5 Daily customer analysis. OIT9 Daily material requirement planning.
Infrastructural Information Technology (IIT)
IIT1 Setting up file sharing facilities.
IIT2 Setting up data communication facilities. IIT5 Setting up advanced manufacturing technology.
IIT7 Setting up information disaster recovery system.
Table 5.7.1.4: Information Technology Utilization - Final Construct Measurement
Items

81
5.7.2. Internal Information System Integration (IISI)
The Internal Information System Integration (IISI) construct was initially
represented by four dimensions and 30 items, including Strategic Information System
Integration (SISI-I)(9 items), Operational Information System Integration (OISI-I)(8
items), Infrastructural Information System Integration – Data Integration (ISID-I) (6
items), and Infrastructural Information Integration – Network Connectivity (ISIN-I)(7
items).
Reliability and Unidimensionality Analysis The analysis began with
purification using CITC analysis. An initial reliability analysis was done for each of the
four Internal Information System Integration (IISI) dimensions. The Corrected Item-Total
Correlation (CITC) scores for all items in SISI-I and ISIN-I dimensions were above 0.50.
One item in OISI-I had CITC lower than 0.50 (OISI-I6) and therefore, this item will be
dropped in the further analysis. ISID-I had one item whose CITC score was lower than
0.50 (ISID-I5). After a careful consideration, ISID-5 was dropped because doing so
improves the overall consistency of the construct significantly. The final Cronbach’s
Alpha scores were 0.93 for SISI-I, 0.88 for OISI-I, 0.80 for ISID-I, and 0.94 for ISIN-I.
The CITC for each item, its corresponding code name, and the reliability analysis results
are shown in Table 5.7.2.1.

82
Coding Items CITC-1 CITC-2 α
Strategic Information System Integration (SISI-I) SISI-I1 Formulate long-term collaborative
decision making. .74
SISI-I2 Justify long-term business plans. .76
SISI-I3 Analyze long-term business plans. .82
SISI-I4 Develop long-term business opportunities. .80
SISI-I5 Identify new markets .71
SISI-I6 Identify long-term technology justification and planning. .75
SISI-I7 Study strategies of competitors. .63
SISI-I8 Define long-term competitive positioning. .73
SISI-I9 Set long-term strategic goals. .82
α= .93
Operational Information System Integration(OISI-I)
OISI-I1 Adjust daily manufacturing processes. .65 .69
OISI-I2 Adjust daily product development processes. .58 .57
OISI-I3 Control daily product quality. .68 .67
OISI-I4 Manage daily order quality. .76 .76
OISI-I5 Exchange daily inventory information. .67 .69
OISI-I6 Select suppliers. * .40
OISI-I7 Manage daily logistical activities. .63 .62
OISI-I8 Establish daily product forecasts. .65 .64
α= .88
Table 5.7.2.1: Purification for Internal Information System Integration

83
Infrastructural Information System Integration- Data Integration (ISID-I)
ISID-I1 Use standard data definitions and codes. .51 .51
ISID-I2 Use standard information/data format. .59 .68 ISID-I3 Use standard presentation format. .62 .68 ISID-I4 Use centralized databases. .59 .59 ISID-I5 Use database synchronization system. * .31
ISID-I6 Integrate data and information. .58 .48
α= .80
Infrastructural Information System Integration- Network Connectivity (ISIN-I)
ISIN-I1 Use IS networks to communicate with other departments. .83
ISIN-I2 Use IS networks to connect to each other’s database. .75
ISIN-I3 Use IS network applications. .85
ISIN-I4 Use IS networks to share information with other departments. .88
ISIN-I5 Use IS networks to connect to centralized databases. .85
ISIN-I6 Use IS networks to facilitate periodic interdepartmental meetings. .69
ISIN-I7 Use compatible network architectures. .76
α= .94
* Item were dropped in the further analysis
Table 5.7.2.1: Purification for Internal Information System Integration (continued)
Convergent Validity: In this step, the remaining 28 IISI items were then
submitted to a measurement model analysis to check model fit indexes for each sub-
construct (Table 5.7.2.2). The initial model fit indexes for SISI-I consist of GFI = .72,
AGFI = .54 and RMSEA = .24. These indexes show nowhere near a reasonable fit;
therefore, further model modification was proceeded based on modification indexes (MI)
for both measurement error correlations and item correlations (multicolinearity). Based
84
on the modification indexes, four items (SISI-I2, SISI-I5, SISI-I7 and SISI-I8) were
dropped. The concept of SISI-I2 – Justify long-term business plans was already covered
in SISI-I3 – Analyze long-term business plans and was dropped. The concept of SISI-I5 –
Identify new markets was also repeated in SISI-I4 – Develop long-term business
opportunities. It was dropped in the later analysis. The concepts of SISI-I7 – Study
strategies of competitors and SISI-I8 – Define long-term competitive positioning were
already covered in SISI-I9 – Set long-term strategic goals; and therefore; were dropped in
the further analysis. The new model fit indexes improved significantly to GFI = .98,
AGFI = .94, and RMSEA = .07.
The initial model fit indexes for OISI-I consist of GFI = .92, AGFI = .89 and
RMSEA = .09. These indexes showed a reasonable fit; however, further model
modification was proceeded to achieve a perfect fit. Based on the modification indexes,
one item (OISI-I2 – Adjust daily product development processes) was dropped because
the concept was already covered in OISI-I1 – Adjust daily manufacturing processes. The
new model fit indexes improved significantly to GFI = .97, AGFI = .94, and RMSEA =
.07.
The initial model fit indexes for ISID-I consist of GFI = .88, AGFI = .72 and
RMSEA = .20. These indexes showed unreasonable fit; therefore, further model
modification was proceeded to achieve a perfect fit. Based on the modification indexes,
one item (ISID-I4 – Use centralized databases) was dropped because the concept was
already covered in ISID-I6 – Integrate data and information. The new model fit indexes
improved significantly to GFI = .99, AGFI = .96, and RMSEA = .07.
.

85
The initial model fit indexes for ISIN-I consist of GFI = .91, AGFI = .82 and
RMSEA = .15. These indexes showed nowhere near a reasonable fit; therefore, further
model modification was examined based on modification indexes (MI) for both
measurement error correlations and item correlations (multicolinearity). Based on the
modification indexes, two items (ISIN-I5, and ISIN-I6) were dropped. The concepts of
ISIN-I5 – Use IS networks to connect to centralized databases and ISIN-I6 – Use IS
networks to facilitate periodic interdepartmental meetings were already covered in ISIN-
I1 – Use IS networks to communicate with other departments; therefore, there were
dropped in the further analysis. The new model fit indexes improved significantly to GFI
= .98, AGFI = .94, and RMSEA = .08.

86
Table 5.7.2.2: Model Fit Indexes for Internal Information System Integration
Coding Items Initial Model Fit
Final Model Fit
Strategic Information System Integration (SISI-I)
SISI-I1 Formulate long-term collaborative decision making.
SISI-I2 Justify long-term business plans. * SISI-I3 Analyze long-term business plans.
SISI-I4 Develop long-term business opportunities.
SISI-I5 Identify new markets. *
SISI-I6 Identify long-term technology justification and planning.
SISI-I7 Study strategies of competitors. *
SISI-I8 Define long-term competitive positioning. *
SISI-I9 Set long-term strategic goals.
GFI = .72
AGFI = .54
RMSEA = .24
GFI = .98
AGFI = .94
RMSEA = .07
Operational Information System Integration(OISI-I)
OISI-I1 Adjust daily manufacturing processes.
OISI-I2 Adjust daily product development processes. *
OISI-I3 Control daily product quality.
OISI-I4 Manage daily order quality.
OISI-I5 Exchange daily inventory information.
OISI-I7 Manage daily logistical activities.
OISI-I8 Establish daily product forecasts.
GFI = .92
AGFI = .89
RMSEA = .09
GFI = .97
AGFI = .94
RMSEA = .07
Infrastructural Information System Integration- Data Integration (ISID-I)
ISID-I1 Use standard data definitions and codes.
ISID-I2 Use standard information/data format.
GFI = .88
AGFI = .72
GFI = .99
AGFI = .96

87
ISID-I3 Use standard presentation format.
ISID-I4 Use centralized databases. *
ISID-I6 Integrate data and information.
RMSEA = .20 RMSEA = .07
Infrastructural Information System Integration- Network Connectivity (ISIN-I)
ISIN-I1 Use IS networks to communicate with other departments.
ISIN-I2 Use IS networks to connect to each other’s database.
ISIN-I3 Use IS network applications.
ISIN-I4 Use IS networks to share information with other departments.
ISIN-I5 Use IS networks to connect to centralized databases. *
ISIN-I6 Use IS networks to facilitate periodic interdepartmental meetings. *
ISIN-I7 Use compatible network architectures.
GFI = .91
AGFI = .82
RMSEA = .15
GFI = .98
AGFI = .94
RMSEA = .08
* Items were dropped from the initial model
Table 5.7.2.2: Model Fit Indexes for Internal Information System Integration
(continued)

88
Discriminant validity: Table 5.7.2.3 shows the results from discriminant analysis. The
differences between χ2 values from every pairs are statistically significant at the p <
0.0001 level thus indicating high degree of discriminant validity among constructs. The
results prove that the constructs are theoretically and statically different from each other
as hypothesized in the measurement development section.
SISI-I (χ2) OISI-I (χ2) ISID-I (χ2) Construct Free Fix Dif. Free Fix Dif. Free Fix Dif.
SISI-I
OISI-I 103.71 175.81 72.10
ISID-I 55.58 132.43 76.85 82.64 149.24 66.60
ISIN-I 74.88 146.50 71.62 73.46 122.68 49.22 125.98 192.33 66.35
Table 5.7.2.3: Pairwise comparison of χ2 values for Internal Information System
Integration

89
The final set of measurement items for the Internal Information System
Integration construct are shown in Table 5.7.2.4.
Code Names Measurement Items Strategic Information System Integration (SISI-I)
SISI-I1 Formulate long-term collaborative decision making. SISI-I3 Analyze long-term business plans. SISI-I4 Develop long-term business opportunities. SISI-I6 Identify long-term technology justification and planning. SISI-I9 Set long-term strategic goals.
Operational Information System Integration(OISI-I) OISI-I1 Adjust daily manufacturing processes. OISI-I3 Control daily product quality. OISI-I4 Manage daily order quality. OISI-I5 Exchange daily inventory information. OISI-I7 Manage daily logistical activities. OISI-I8 Establish daily product forecasts. Infrastructural Information System Integration- Data Integration (ISID-I)
ISID-I1 Use standard data definitions and codes. ISID-I2 Use standard information/data format. ISID-I3 Use standard presentation format. ISID-I6 Integrate data and information.
Infrastructural Information System Integration- Network Connectivity (ISIN-I) ISIN-I1 Use IS networks to communicate with other departments. ISIN-I2 Use IS networks to connect to each other’s database. ISIN-I3 Use IS network applications. ISIN-I4 Use IS networks to share information with other departments. ISIN-I7 Use compatible network architectures
Table 5.7.2.4: Internal Information System Integration - Final Construct
Measurement Items
90
5.7.3. External Information System Integration (EISI)
The External Information System Integration (EISI) construct was initially
represented by four dimensions and 29 items, including Strategic Information System
Integration (SISI-E)(9 items), Operational Information System Integration (OISI-E)(8
items), Infrastructural Information System Integration – Data Integration (ISID-E) (6
items), and Infrastructural Information Integration – Network Connectivity (ISIN-E)(6
items).
Reliability Analysis The analysis began with purification using CITC analysis.
An initial reliability analysis was done for each of the four Internal Information System
Integration (IISI) dimensions. The Corrected Item-Total Correlation (CITC) scores for all
items in all dimensions above 0.60. The final Cronbach’s Alpha scores were 0.96 for
SISI-E, 0.94 for OISI-E, 0.91 for ISID-E, and 0.95 for ISIN-E. The CITC for each item,
its corresponding code name, and the reliability analysis results are shown in Table
5.7.3.1.

91
Table 5.7.3.1: Purification for External Information System Integration
Coding Items CITC-1 CITC-2 α
Strategic Information System Integration (SISI-E)
SISI-E1 Formulate long-term collaborative decision making. .81
SISI-E2 Justify long-term business plans. .89
SISI-E3 Analyze long-term business plans. .90
SISI-E4 Develop long-term business opportunities. .85
SISI-E5 Identify new markets .86
SISI-E6 Identify long-term technology justification and planning. .77
SISI-E7 Study strategies of competitors. .82
SISI-E8 Define long-term competitive positioning. .89
SISI-E9 Set long-term strategic goals. .86
α= .97
Operational Information System Integration(OISI-E) OISI-E1 Adjust daily manufacturing processes. .79
OISI-E2 Adjust daily product development processes. .73
OISI-E3 Control daily product quality. .76
OISI-E4 Manage daily order quality. .83
OISI-E5 Exchange daily inventory information. .80
OISI-E6 Select supplier .70
OISI-E7 Manage daily logistical activities. .78
OISI-E8 Establish daily product forecasts. .70
α= .93
Infrastructural Information System Integration- Data Integration (ISID-E)
ISID-E1 Use standard data definitions and codes. .73
ISID-E2 Use standard information/data format. .69
ISID-E3 Use standard presentation format. .75
ISID-E4 Use centralized databases. .72
ISID-E5 Use database synchronization system. .61
α= .89

92
ISID-E6 Use compatible database systems. .74
Infrastructural Information System Integration- Network Connectivity (ISIN-E)
ISIN-E1 Use IS networks to communicate with each other. .82
ISIN-E2 Use IS networks to connect to each other’s database. .82
ISIN-E3 Use IS network applications. .73
ISIN-E4 Use IS networks to share information with each other. .84
ISIN-E5 Use IS networks to facilitate periodic meetings. .79
ISIN-E6 Use compatible network architectures. .81
α= .93
Table 5.7.3.1: Purification for External Information System Integration (continued)
Convergent Validity: In this step, the remaining 29 EISI items were then
submitted to a measurement model analysis to check model fit indexes for each sub-
construct (Table 5.7.3.2). The initial model fit indexes for SISI-E consist of GFI = .81,
AGFI = .67 and RMSEA = .18. These indexes showed unreasonable fit; therefore, further
model modification was proceeded. Based on the modification indexes, three items (SISI-
E5, SISI-E7 and SISI-E8) were dropped. SISI-E5 – Identify new markets was dropped
because the concept is repeated in SISI-E4 – Develop long-term business opportunities.
Items SISI-E7 – Study strategies of competitors and SISI-E8 – Define long-term
competitive positioning were also dropped because the concepts were already covered in
SISI-E2 – Justify long-term business plans. The new model fit indexes improved
significantly to GFI = .98, AGFI = .90, and RMSEA = .10.
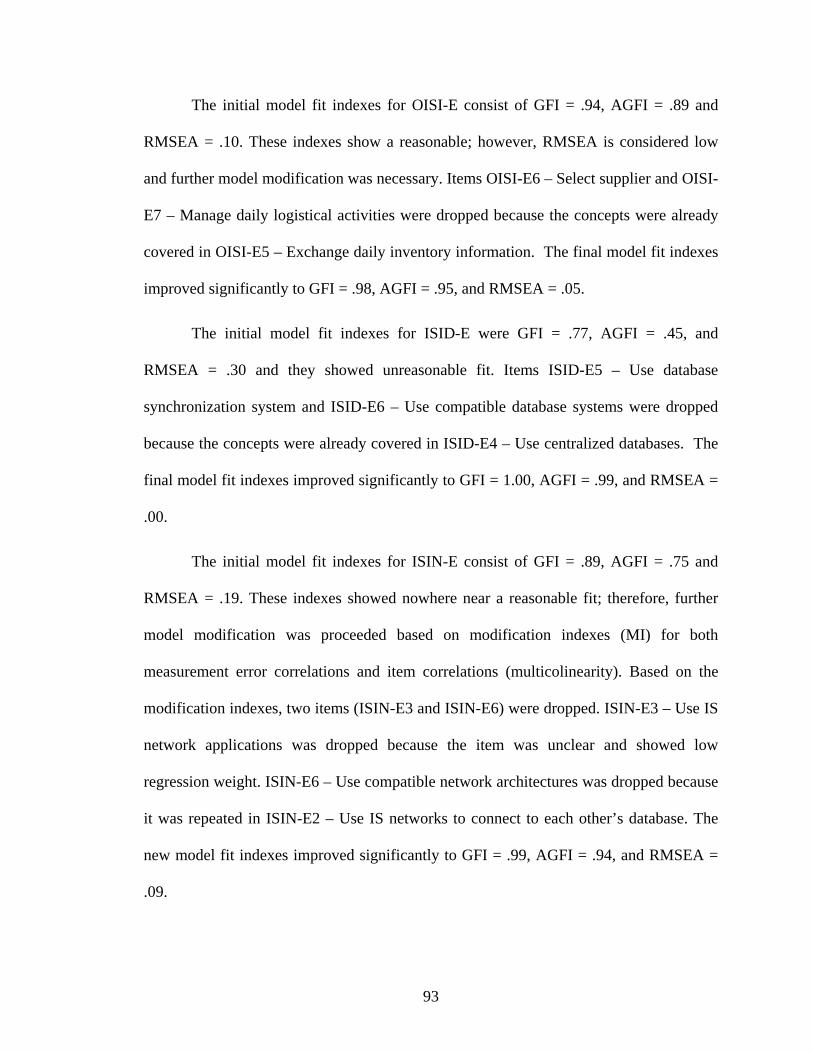
93
The initial model fit indexes for OISI-E consist of GFI = .94, AGFI = .89 and
RMSEA = .10. These indexes show a reasonable; however, RMSEA is considered low
and further model modification was necessary. Items OISI-E6 – Select supplier and OISI-
E7 – Manage daily logistical activities were dropped because the concepts were already
covered in OISI-E5 – Exchange daily inventory information. The final model fit indexes
improved significantly to GFI = .98, AGFI = .95, and RMSEA = .05.
The initial model fit indexes for ISID-E were GFI = .77, AGFI = .45, and
RMSEA = .30 and they showed unreasonable fit. Items ISID-E5 – Use database
synchronization system and ISID-E6 – Use compatible database systems were dropped
because the concepts were already covered in ISID-E4 – Use centralized databases. The
final model fit indexes improved significantly to GFI = 1.00, AGFI = .99, and RMSEA =
.00.
The initial model fit indexes for ISIN-E consist of GFI = .89, AGFI = .75 and
RMSEA = .19. These indexes showed nowhere near a reasonable fit; therefore, further
model modification was proceeded based on modification indexes (MI) for both
measurement error correlations and item correlations (multicolinearity). Based on the
modification indexes, two items (ISIN-E3 and ISIN-E6) were dropped. ISIN-E3 – Use IS
network applications was dropped because the item was unclear and showed low
regression weight. ISIN-E6 – Use compatible network architectures was dropped because
it was repeated in ISIN-E2 – Use IS networks to connect to each other’s database. The
new model fit indexes improved significantly to GFI = .99, AGFI = .94, and RMSEA =
.09.

94
Coding Items Initial Model Fit
Final Model Fit
Strategic Information System Integration (SISI-E)
SISI-E1 Formulate long-term collaborative decision making.
SISI-E2 Justify long-term business plans.
SISI-E3 Analyze long-term business plans.
SISI-E4 Develop new business opportunities.
SISI-E5 Identify new markets. *
SISI-E6 Identify long-term technology justification and planning.
SISI-E7 Study strategies of competitors. *
SISI-E8 Define long-term competitive positioning.*
SISI-E9 Set long-term strategic goals.
GFI = .81
AGFI = .67
RMSEA = .18
GFI = .98
AGFI = .90
RMSEA = .10
* Items were dropped from the initial model
Table 5.7.3.2: Model Fit Indexes for External Information System Integration
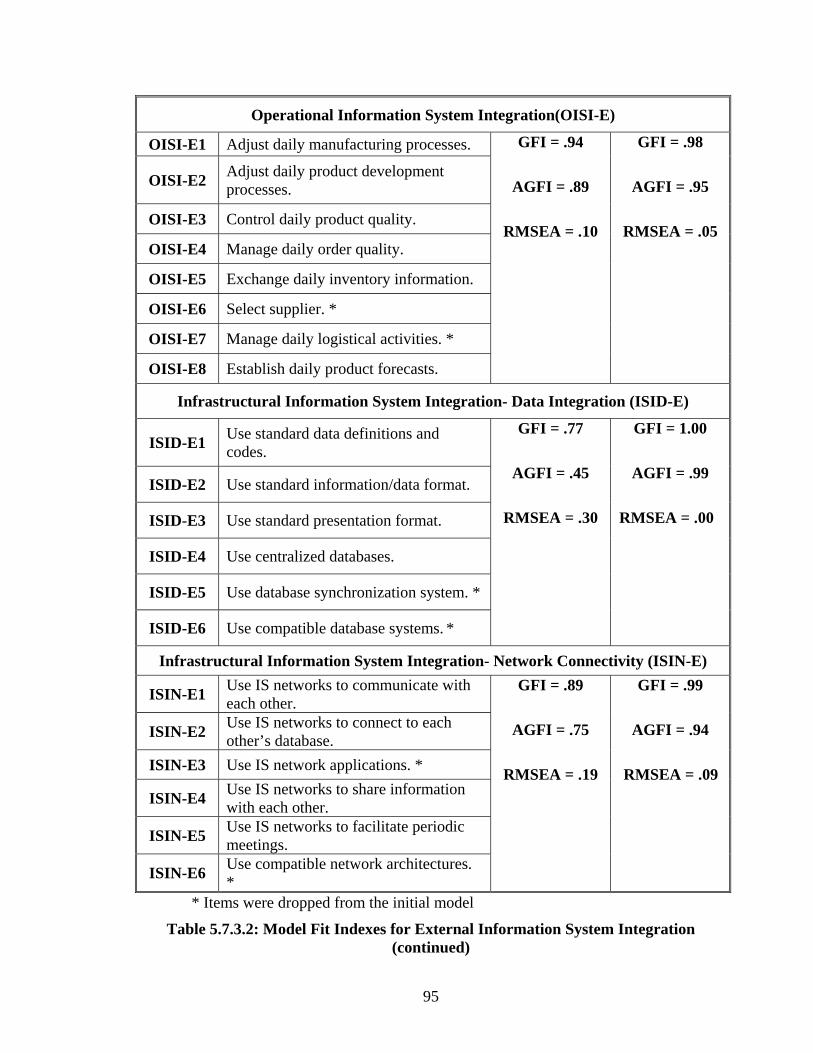
95
Operational Information System Integration(OISI-E)
OISI-E1 Adjust daily manufacturing processes.
OISI-E2 Adjust daily product development processes.
OISI-E3 Control daily product quality.
OISI-E4 Manage daily order quality.
OISI-E5 Exchange daily inventory information.
OISI-E6 Select supplier. *
OISI-E7 Manage daily logistical activities. *
OISI-E8 Establish daily product forecasts.
GFI = .94
AGFI = .89
RMSEA = .10
GFI = .98
AGFI = .95
RMSEA = .05
Infrastructural Information System Integration- Data Integration (ISID-E)
ISID-E1 Use standard data definitions and codes.
ISID-E2 Use standard information/data format.
ISID-E3 Use standard presentation format.
ISID-E4 Use centralized databases.
ISID-E5 Use database synchronization system. *
ISID-E6 Use compatible database systems. *
GFI = .77
AGFI = .45
RMSEA = .30
GFI = 1.00
AGFI = .99
RMSEA = .00
Infrastructural Information System Integration- Network Connectivity (ISIN-E)
ISIN-E1 Use IS networks to communicate with each other.
ISIN-E2 Use IS networks to connect to each other’s database.
ISIN-E3 Use IS network applications. *
ISIN-E4 Use IS networks to share information with each other.
ISIN-E5 Use IS networks to facilitate periodic meetings.
ISIN-E6 Use compatible network architectures. *
GFI = .89
AGFI = .75
RMSEA = .19
GFI = .99
AGFI = .94
RMSEA = .09
* Items were dropped from the initial model
Table 5.7.3.2: Model Fit Indexes for External Information System Integration (continued)

96
Discriminant validity: Table 5.7.3.3 shows the results from discriminant
analysis. The differences between χ2 values from every pairs are statistically significant
at the p < 0.0001 level thus indicating high degree of discriminant validity among
constructs. The results prove that the constructs are theoretically and statically different
from each other as hypothesized in the measurement development section.
SISI-E (χ2) OISI-E (χ2) ISID-E (χ2) Construct Free Fix Dif. Free Fix Dif. Free Fix Dif.
SISI-E
OISI-E 109.71 153.69 43.98
ISID-E 126.36 178.49 52.13 92.32 133.99 41.67
ISIN-E 93.88 132.38 38.50 86.41 118.35 31.94 80.07 123.29 43.22
Table 5.7.3.3: Pairwise comparison of χ2 values for External Information System
Integration

97
The final set of measurement items for the External Information System
Integration construct are shown in Table 5.7.3.3.
Code Names Measurement Items
Strategic Information System Integration (SISI-E)
SISI-E1 Formulate long-term collaborative decision making.
SISI-E2 Justify long-term business plans. SISI-E3 Analyze long-term business plans. SISI-E4 Develop new business opportunities. SISI-E6 Identify long-term technology justification and planning. SISI-E9 Set long-term strategic goals.
Operational Information System Integration(OISI-E) OISI-E1 Adjust daily manufacturing processes. OISI-E2 Adjust daily product development processes. OISI-E3 Control daily product quality. OISI-E4 Manage daily order quality. OISI-E5 Exchange daily inventory information. OISI-E8 Establish daily product forecasts. Infrastructural Information System Integration- Data Integration (ISID-E) ISID-E1 Use standard data definitions and codes ISID-E2 Use standard information/data format. ISID-E3 Use standard data presentation format. ISID-E4 Use centralized databases.
Infrastructural Information System Integration- Network Connectivity (ISIN-E)ISIN-E1 Use IS networks to communicate with each other. ISIN-E2 Use IS networks to connect to each other’s databases. ISIN-E4 Use IS networks to share information with each other. ISIN-E5 Use IS networks to connect to facilitate periodic meeting.
Table 5.7.3.3: External Information System Integration – Final Construct
Measurement Items
98
5.7.4. Supply Chain Integration (SCI)
The Supply Chain Integration (SCI) construct was initially represented by two
dimensions and 12 items, including Relationship with Customers (RC)(6 items) and
Relationship with Suppliers (RS)(6 items).
Reliability and Unidimensionality Analysis: The analysis began with
purification using CITC analysis. An initial reliability analysis was done for each of the
two Supply Chain Integration (SCI) dimensions. The Corrected Item-Total Correlation
(CITC) scores for all items in all dimensions were above 0.50. The final Cronbach’s
Alpha scores were 0.83 for RC, and 0.90 for RS. The CITC for each item, its
corresponding code name, and the reliability analysis results are shown in Table 5.7.4.1.

99
Coding Items CITC-1 CITC-2 α Relationship with Customers (RC)
RC1 The willingness of customers to share their market demands. .61
RC2 The participation level of customers in product development processes. .62
RC3 The participation level of customers in finished goods distribution processes. .62
RC4 The level of customer involvement in preparing business plans. .60
RC5 The extent of follow-up with customers for feedbacks. .58
RC6 The participation level of customers in manufacturing processes. .60
α= .83
Relationship with Suppliers(RS)
RS1 The participation level of suppliers in manufacturing processes. .71
RS2 The participation level of suppliers in production planning processes. .81
RS3 The participation level of suppliers in product development processes. .71
RS4 The level of customer involvement in logistics processes. .76
RS5 The level of cross-over of activities between our firm and our suppliers. .73
RS6 The level of supplier involvement in preparing our business plans .71
α= .90
Table 5.7.4.1: Purification for Supply Chain Integration
Convergent Validity: In this step, the remaining 12 SCI items were then
submitted to a measurement model analysis to check model fit indexes for each sub-
construct (Table 5.7.4.2). The initial model fit indexes for RC consist of GFI = .95, AGFI
= .89 and RMSEA = .11. These indexes showed a reasonable fit; therefore, further model

100
modification was proceeded based on modification indexes (MI) for both measurement
error correlations and item correlations (multicolinearity). Based on the modification
indexes, one item (RC4 – The level of customer involvement in preparing business plans)
was dropped because the concept was already covered in RC6 – The participation level of
customers in manufacturing processes. The new model fit indexes improved significantly
to GFI = .99, AGFI = .98, and RMSEA = .00.
The initial model fit indexes for RS consist of GFI = .93, AGFI = .84 and
RMSEA = .13. These indexes showed a reasonable fit; however, further model
modification was proceeded to achieve a perfect fit. Based on the modification indexes,
one item (RS1 – The participation level of suppliers in manufacturing processes) was
dropped because the concept was already covered in RS4 – The level of customer
involvement in logistics processes. The new model fit indexes improved significantly to
GFI = .97, AGFI = .93, and RMSEA = .09.

101
Coding Items Initial Model Fit
Final Model Fit
Relationship with Customers (RC)
RC1 The willingness of customers to share their market demands.
RC2 The participation level of customers in product development processes.
RC3 The participation level of customers in finished goods distribution processes.
RC4 The level of customer involvement in preparing business plans. *
RC5 The extent of follow-up with customers for feedbacks.
RC6 The participation level of customers in manufacturing processes.
GFI = .95
AGFI = .89
RMSEA = .11
GFI = .99
AGFI = .98
RMSEA = .00
Relationship with Suppliers(RS)
RS1 The participation level of suppliers in manufacturing processes. *
RS2 The participation level of suppliers in production planning processes.
RS3 The participation level of suppliers in product development processes.
RS4 The level of customer involvement in logistics processes.
RS5 The level of cross-over of activities between our firm and our suppliers.
RS6 The level of supplier involvement in preparing our business plans
GFI = .93
AGFI = .84
RMSEA = .13
GFI = .97
AGFI = .93
RMSEA = .09
* Items were dropped from the initial model
Table 5.7.4.2: Model Fit Indexes for Supply Chain Integration
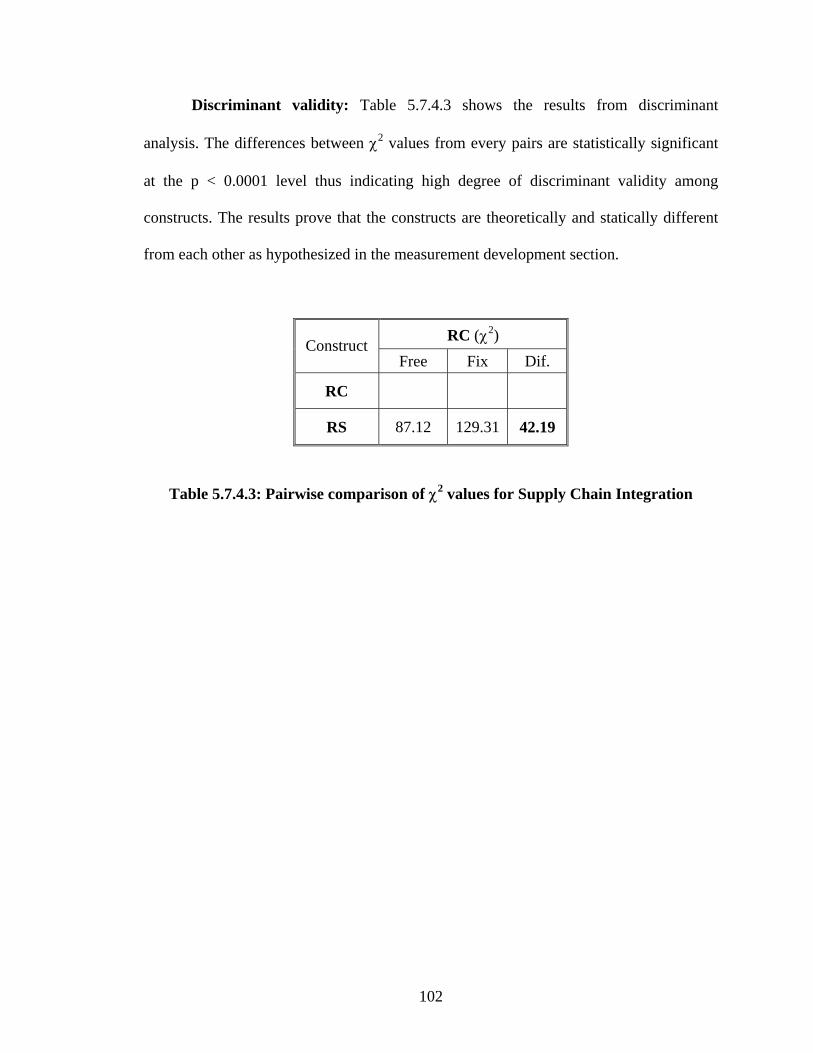
102
Discriminant validity: Table 5.7.4.3 shows the results from discriminant
analysis. The differences between χ2 values from every pairs are statistically significant
at the p < 0.0001 level thus indicating high degree of discriminant validity among
constructs. The results prove that the constructs are theoretically and statically different
from each other as hypothesized in the measurement development section.
RC (χ2) Construct Free Fix Dif.
RC
RS 87.12 129.31 42.19
Table 5.7.4.3: Pairwise comparison of χ2 values for Supply Chain Integration

103
The final set of measurement items for the Supply Chain Integration construct are
shown in Table 5.7.4.4.
Coding Items Relationship with Customers (RC)
RC1 The willingness of customers to share their market demands.
RC2 The participation level of customers in product development processes.
RC3 The participation level of customers in finished goods distribution processes.
RC5 The extent of follow-up with customers for feedbacks.
RC6 The participation level of customers in manufacturing processes.
Relationship with Suppliers(RS)
RS2 The participation level of suppliers in production planning processes.
RS3 The participation level of suppliers in product development processes.
RS4 The level of customer involvement in logistics processes.
RS5 The level of cross-over of activities between our firm and our suppliers.
RS6 The level of supplier involvement in preparing our business plans
Table 5.7.4.4: Supply Chain Integration – Final Construct Measurement Items
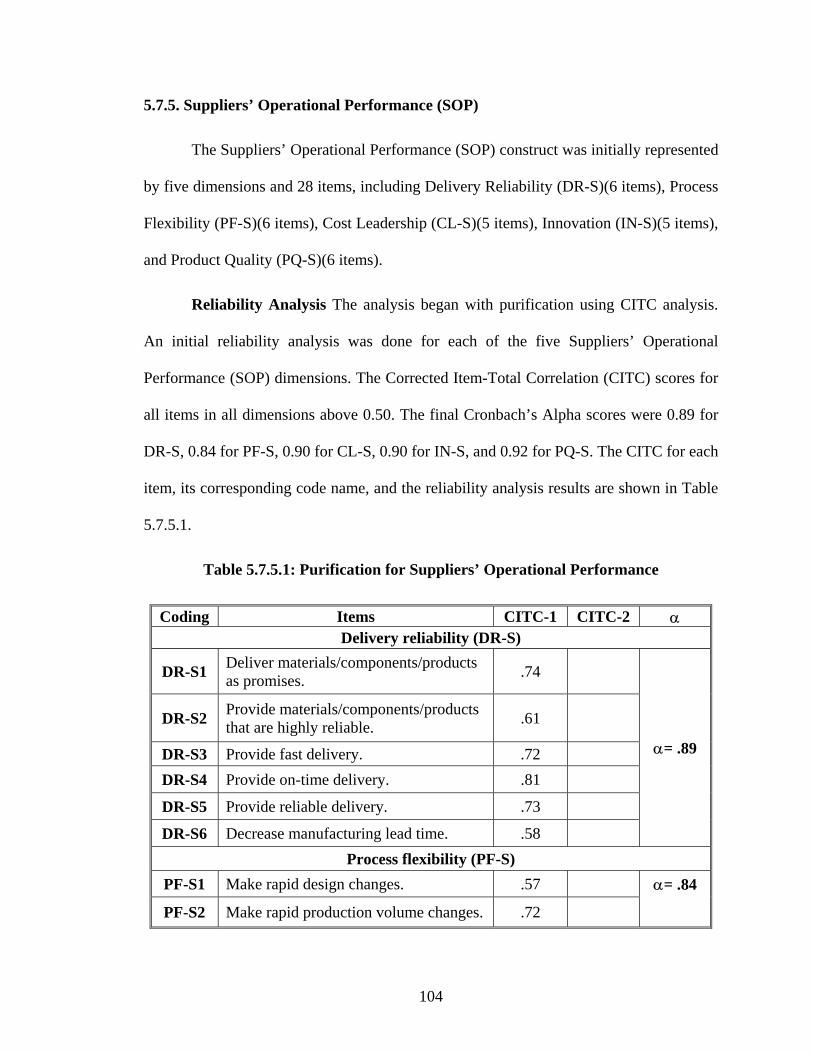
104
5.7.5. Suppliers’ Operational Performance (SOP)
The Suppliers’ Operational Performance (SOP) construct was initially represented
by five dimensions and 28 items, including Delivery Reliability (DR-S)(6 items), Process
Flexibility (PF-S)(6 items), Cost Leadership (CL-S)(5 items), Innovation (IN-S)(5 items),
and Product Quality (PQ-S)(6 items).
Reliability Analysis The analysis began with purification using CITC analysis.
An initial reliability analysis was done for each of the five Suppliers’ Operational
Performance (SOP) dimensions. The Corrected Item-Total Correlation (CITC) scores for
all items in all dimensions above 0.50. The final Cronbach’s Alpha scores were 0.89 for
DR-S, 0.84 for PF-S, 0.90 for CL-S, 0.90 for IN-S, and 0.92 for PQ-S. The CITC for each
item, its corresponding code name, and the reliability analysis results are shown in Table
5.7.5.1.
Table 5.7.5.1: Purification for Suppliers’ Operational Performance
Coding Items CITC-1 CITC-2 α Delivery reliability (DR-S)
DR-S1 Deliver materials/components/products as promises. .74
DR-S2 Provide materials/components/products that are highly reliable. .61
DR-S3 Provide fast delivery. .72 DR-S4 Provide on-time delivery. .81
DR-S5 Provide reliable delivery. .73
DR-S6 Decrease manufacturing lead time. .58
α= .89
Process flexibility (PF-S) PF-S1 Make rapid design changes. .57
PF-S2 Make rapid production volume changes. .72
α= .84

105
PF-S3 Make rapid changeover between product lines. .67
PF-S4 Process both large and small orders. .55
PF-S5 Produce a variety of different products. .56
PF-S6 Increase capacity utilization. .70
Cost leadership (CL-S)
CL-S1 Produce materials/components/products at low cost. .61
CL-S2 Reduce production cost. .83 CL-S3 Reduce inventory cost. .77 CL-S4 Reduce unit cost. .84 CL-S5 Increase labor productivity. .69
α= .90
Innovation (IN-S) IN-S1 Develop new ways of customer service. .71
IN-S2 Develop new forms of shop floor management. .77
IN-S3 Develop new ways of supply chain management. .85
IN-S4 Develop new products and features. .72
IN-S5 Develop new process technologies. .75
α= .90
Product quality (PQ-S) PQ-S1 Provide better product performance. .76 PQ-S2 Improve product durability. .80
PQ-S3 Provide product conformance to specifications. .63
PQ-S4 Improve product reliability. .85
PQ-S5 Reduce defective rate. .82 PQ-S6 Better product reputation. .77
α= .92

106
Convergent Validity: In this step, 28 SOP items were then submitted to a
measurement model analysis to check model fit indexes for each sub-construct (Table
5.7.5.2). The initial model fit indexes for CL-S shows a excellent fit; therefore, no further
model modification was necessary.
The initial model fit indexes for DR-S consist of GFI = .95, AGFI = .89 and
RMSEA = .11. These indexes showed a reasonable fit; however, further model
modification was proceeded to achieve a perfect fit. Based on the modification indexes,
one item (DR-S6 – Decrease manufacturing lead time) was dropped because the concept
was already covered in DR-S1 – Deliver materials/components/production as promises.
The new model fit indexes improved significantly to GFI = .98, AGFI = .93, and RMSEA
= .09.
The initial model fit indexes for PF-S consist of GFI = .94, AGFI = .87, and
RMSEA = .13. These indexes showed a reasonable fit; however, further model
modification was proceeded to achieve a perfect fit. Based on the modification indexes,
one item (PF-S5 – Produce a variety of different products) was dropped because the item
showed low regression weight and high measurement error. The new model fit indexes
improved significantly to GFI = .99, AGFI = .97, and RMSEA = .00.
The initial model fit indexes for IN-S consist of GFI = .96, AGFI = .88, and
RMSEA = .13. These indexes showed a reasonable fit; however, further model
modification was proceeded to achieve a perfect fit. Based on the modification indexes,
one item (IN-S4 – Develop new products and features) was dropped because the item
showed low regression weight and high measurement error. The new model fit indexes
improved significantly to GFI = .98, AGFI = .92, and RMSEA = .11.

107
The initial model fit indexes for PQ-S consist of GFI = .86, AGFI = .69, and
RMSEA = .21. These indexes showed a reasonable fit; however, further model
modification was proceeded to achieve a perfect fit. Based on the modification indexes,
two items (PQ-S2 – Improve product durability and PQ-S4 – Improve product reliability)
were dropped because the items showed low regression weight and high measurement
error. The new model fit indexes improved significantly to GFI = 1.00, AGFI = .98, and
RMSEA = .02.
Table 5.7.5.2: Model Fit Indexes for Suppliers’ Operational Performance
Coding Items Initial Model Fit
Final Model Fit
Delivery reliability (DR-S)
DR-S1 Deliver materials/components/products as promises.
DR-S2 Provide materials/components/products that are highly reliable.
DR-S3 Provide fast delivery. DR-S4 Provide on-time delivery.
DR-S5 Provide reliable delivery.
DR-S6 Decrease manufacturing lead time. *
GFI = .95
AGFI = .89
RMSEA = .11
GFI = .98
AGFI = .93
RMSEA = .09
Process flexibility (PF-S) PF-S1 Make rapid design changes. PF-S2 Make rapid production volume changes.
PF-S3 Make rapid changeover between product lines.
PF-S4 Process both large and small orders.
PF-S5 Produce a variety of different products. *
PF-S6 Increase capacity utilization.
GFI = .94
AGFI = .87
RMSEA = .13
GFI = .99
AGFI = .97
RMSEA = .00
Cost leadership (CL-S)
CL-S1 Produce materials/components/products at low cost.
GFI = .97
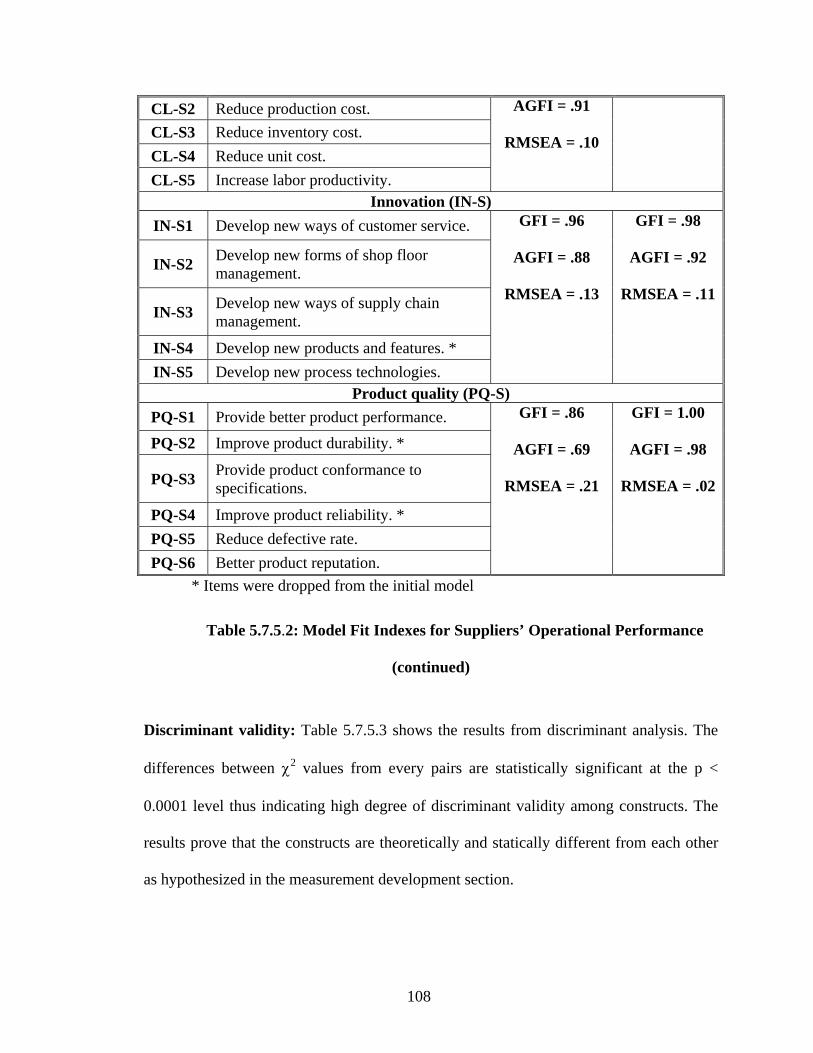
108
CL-S2 Reduce production cost. CL-S3 Reduce inventory cost. CL-S4 Reduce unit cost. CL-S5 Increase labor productivity.
AGFI = .91
RMSEA = .10
Innovation (IN-S) IN-S1 Develop new ways of customer service.
IN-S2 Develop new forms of shop floor management.
IN-S3 Develop new ways of supply chain management.
IN-S4 Develop new products and features. * IN-S5 Develop new process technologies.
GFI = .96
AGFI = .88
RMSEA = .13
GFI = .98
AGFI = .92
RMSEA = .11
Product quality (PQ-S) PQ-S1 Provide better product performance. PQ-S2 Improve product durability. *
PQ-S3 Provide product conformance to specifications.
PQ-S4 Improve product reliability. * PQ-S5 Reduce defective rate. PQ-S6 Better product reputation.
GFI = .86
AGFI = .69
RMSEA = .21
GFI = 1.00
AGFI = .98
RMSEA = .02
* Items were dropped from the initial model
Table 5.7.5.2: Model Fit Indexes for Suppliers’ Operational Performance
(continued)
Discriminant validity: Table 5.7.5.3 shows the results from discriminant analysis. The
differences between χ2 values from every pairs are statistically significant at the p <
0.0001 level thus indicating high degree of discriminant validity among constructs. The
results prove that the constructs are theoretically and statically different from each other
as hypothesized in the measurement development section.

109
DR-S (χ2) PF-S (χ2) CL-S (χ2) IN-S (χ2) Construct
Free Fix Dif. Free Fix Dif. Free Fix Dif. Free Fix Dif.
DR-S
PF-S 50.4 144.7 94.3
CL-S 82.4 214.9 132.5 107.9 229.3 121.4
IN-S 52.4 166.2 113.8 40.7 141.2 100.5 70.1 185.2 115.1
PQ-S 46.4 153.0 106.6 39.8 162.3 122.5 53.7 188.9 135.2 59.5 160.6 101.1
Table 5.7.5.3: Pairwise comparison of χ2 values for Supplier’s Operational
Performance

110
The final set of measurement items for the Suppliers’ Operational Performance
construct are shown in Table 5.7.5.4.
Coding Items Delivery reliability (DR-S)
DR-S1 Deliver materials/components/products as promises. DR-S2 Provide materials/components/products that are highly reliable. DR-S3 Provide fast delivery. DR-S4 Provide on-time delivery. DR-S5 Provide reliable delivery.
Process flexibility (PF-S) PF-S1 Make rapid design changes. PF-S2 Make rapid production volume changes. PF-S3 Make rapid changeover between product lines. PF-S4 Process both large and small orders. PF-S6 Increase capacity utilization.
Cost leadership (CL-S)
CL-S1 Produce materials/components/products at low cost.
CL-S2 Reduce production cost. CL-S3 Reduce inventory cost. CL-S4 Reduce unit cost. CL-S5 Increase labor productivity.
Innovation (IN-S)
IN-S1 Develop new ways of customer service.
IN-S2 Develop new forms of shop floor management.
IN-S3 Develop new ways of supply chain management. IN-S5 Develop new process technologies.
Product quality (PQ-S) PQ-S1 Provide better product performance. PQ-S3 Provide product conformance to specifications. PQ-S5 Reduce defective rate. PQ-S6 Better product reputation.
Table 5.7.5.4: Suppliers’ Operational Performance – Final Construct Measurement
Items

111
5.7.6. Firm’s Operational Performance (FOP)
The Firm’s Operational Performance (FOP) construct was initially represented by
five dimensions and 28 items, including Delivery Reliability (DR-F)(6 items), Process
Flexibility (PF-F)(6 items), Cost Leadership (CL-F)(5 items), Innovation (IN-F)(5 items),
and Product Quality (PQ-F)(6 items).
Reliability and Unidimensionality Analysis: The analysis began with
purification using CITC analysis. An initial reliability analysis was done for each of the
five Firm’s Operational Performance (FOP) dimensions. The Corrected Item-Total
Correlation (CITC) scores for almost all the items were above 0.50. Two items show
CITC a little lower than 0.50; therefore, these items will be kept for further analysis. The
final Cronbach’s Alpha scores were 0.87 for DR-F, 0.82 for PF-F, 0.87 for CL-F, 0.81 for
IN-F, and 0.91 for PQ-F. The CITC for each item, its corresponding code name, and the
reliability analysis results are shown in Table 5.7.6.1.
Table 5.7.6.1: Purification for Firm’s Operational Performance
Coding Items CITC-1 CITC-2 α
Delivery reliability (DR-F)
DR-F1 Deliver materials/components/ products as promises. .60
DR-F2 Provide materials/components/ products that are highly reliable. .55
DR-F3 Provide fast delivery. .74 DR-F4 Provide on-time delivery. .80
DR-F5 Provide reliable delivery. .79
DR-F6 Decrease manufacturing lead time. .58
α= .87
Process flexibility (PF-F)

112
PF-F1 Make rapid design changes. .66
PF-F2 Make rapid production volume changes. .62
PF-F3 Make rapid changeover between product lines. .70
PF-F4 Process both large and small orders. .53
PF-F5 Produce a variety of different products. .52
PF-F6 Increase capacity utilization. .49 Keep
α= .82
Cost leadership (CL-F)
CL-F1 Produce materials/components/ products at low cost. .42 Keep
CL-F2 Reduce production cost. .78 CL-F3 Reduce inventory cost. .73 CL-F4 Reduce unit cost. .83 CL-F5 Increase labor productivity. .71
α= .87
Innovation (IN-F)
IN-F1 Develop new ways of customer service. .69
IN-F2 Develop new forms of shop floor management. .59
IN-F3 Develop new ways of supply chain management. .64
IN-F4 Develop new products and features. .55
IN-F5 Develop new process technologies. .55
α= .81
Product quality (PQ-F) PQ-F1 Provide better product performance. .82
PQ-F2 Improve product durability. .78
PQ-F3 Provide product conformance to specifications. .71
PQ-F4 Improve product reliability. .78
PQ-F5 Reduce defective rate. .70 PQ-F6 Better product reputation. .77
α= .91
Table 5.7.6.1: Purification for Firm’s Operational Performance (continued)

113
Convergent Validity: In this step, the remaining 28 SOP items were then
submitted to a measurement model analysis to check model fit indexes for each sub-
construct (Table 5.7.6.2). The initial model fit indexes for PF-F and CL-F showed a
reasonable fit; therefore, no further model modification was necessary.
The initial model fit indexes for DR-F consist of GFI = .92, AGFI = .81 and
RMSEA = .17. These indexes showed an unreasonable fit; therefore, further model
modification was proceeded to achieve a perfect fit. Based on the modification indexes,
two items (DR-F2 and DR-F6) were dropped. DR-F2 – Provide
materials/components/products that were highly reliable was dropped because the
concept was already covered in DSR-F1 – Deliver materials/components/products as
promises. DR-F6 – Decrease manufacturing lead time was also dropped because the
concept was redundant with item DR-F3 – Provide fast delivery. The new model fit
indexes improved significantly to GFI = 1.00, AGFI = .99, and RMSEA = .00.
The initial model fit indexes for IN-F consist of GFI = .93, AGFI = .79 and
RMSEA = .18. These indexes showed a reasonable fit; however, further model
modification was proceeded to achieve a perfect fit. Based on the modification indexes,
one item (IN-F4 – Develop new products and features) was dropped because the item
showed low regression weight. The new model fit indexes improved significantly to GFI
= .98, AGFI = .90, and RMSEA = .13.
The initial model fit indexes for PQ-F consist of GFI = .93, AGFI = .83 and
RMSEA = .15. These indexes showed a reasonable fit; however, further model
modification was proceeded to achieve a perfect fit. Based on the modification indexes,

114
two items (PQ-F2 and PQ-F5) were dropped. PQ-F2 – Improve product durability was
also dropped because the concept was redundant with item PQ-F1 – Provide better
product performance. PQ-F6 – Better product reputation was dropped because the item
showed low regression weight and high measurement error. The new model fit indexes
improved significantly to GFI = .98, AGFI = .94, and RMSEA = .08.
Table 5.7.6.2: Model Fit Indexes for Firm’s Operational Performance
Coding Items Initial Model Fit
Final Model Fit
Delivery reliability (DR-F)
DR-F1 Deliver materials/components/products as promises.
DR-F2 Provide materials/components/products that are highly reliable. *
DR-F3 Provide fast delivery. DR-F4 Provide on-time delivery.
DR-F5 Provide reliable delivery.
DR-F6 Decrease manufacturing lead time. *
GFI = .92
AGFI = .81
RMSEA = .17
GFI = 1.00
AGFI = .99
RMSEA = .00
Process flexibility (PF-F) PF-F1 Make rapid design changes.
PF-F2 Make rapid production volume changes.
PF-F3 Make rapid changeover between product lines.
PF-F4 Process both large and small orders.
PF-F5 Produce a variety of different products.
PF-F6 Increase capacity utilization
GFI = .98
AGFI = .96
RMSEA = .03
Cost leadership (CL-F)
CL-F1 Produce materials/components/ products at low cost.
CL-F2 Reduce production cost.
GFI = .98

115
CL-F3 Reduce inventory cost. CL-F4 Reduce unit cost. CL-F5 Increase labor productivity.
AGFI = .95
RMSEA = .07
Innovation (IN-F)
IN-F1 Develop new ways of customer service.
IN-F2 Develop new forms of shop floor management.
IN-F3 Develop new ways of supply chain management.
IN-F4 Develop new products and features. *
IN-F5 Develop new process technologies.
GFI = .93
AGFI = .79
RMSEA = .18
GFI = .98
AGFI = .90
RMSEA = .13
Product quality (PQ-F) PQ-F1 Provide better product performance. PQ-F2 Improve product durability. *
PQ-F3 Provide product conformance to specifications.
PQ-F4 Improve product reliability. PQ-F5 Reduce defective rate. PQ-F6 Better product reputation. *
GFI = .93
AGFI = .83
RMSEA = .15
GFI = .98
AGFI = .94
RMSEA = .08
* Items were dropped from the initial model
Table 5.7.6.2: Model Fit Indexes for Firm’s Operational Performance (continued)
Discriminant validity: Table 5.7.6.3 shows the results from discriminant analysis. The
differences between χ2 values from every pairs are statistically significant at the p <
0.0001 level thus indicating high degree of discriminant validity among constructs. The
results prove that the constructs are theoretically and statically different from each other
as hypothesized in the measurement development section.

116
DR-F (χ2) PF-F (χ2) CL-F (χ2) IN-F (χ2) Construct
Free Fix Dif. Free Fix Dif. Free Fix Dif. Free Fix Dif.
DR-F
PF-F 241.9 411.0 169.1
CL-F 194.4 333.6 139.2 118.1 212.0 93.9
IN-F 150.6 257.3 106.7 73.8 135.9 62.1 68.5 157.0 88.5
Q-F 203.0 326.0 123.0 105.3 172.9 67.6 97.4 207.8 110.4 137.5 198.9 61.4
Table 5.7.6.3: Pairwise comparison of χ2 values for Firm’s Operational Performance
The final set of measurement items for the Firm’s Operational Performance
construct are shown in Table 5.7.6.4.

117
Coding Items Delivery reliability (DR-F)
DR-F1 Deliver materials/components/products as promises. DR-F3 Provide fast delivery. DR-F4 Provide on-time delivery.
DR-F5 Provide reliable delivery. Process flexibility (PF-F)
PF-F1 Make rapid design changes. PF-F2 Make rapid production volume changes.
PF-F3 Make rapid changeover between product lines.
PF-F4 Process both large and small orders.
PF-F5 Produce a variety of different products.
PF-F6 Increase capacity utilization.
Cost leadership (CL-F)
CL-F1 Produce materials/components/products at low cost.
CL-F2 Reduce production cost. CL-F3 Reduce inventory cost. CL-F4 Reduce unit cost. CL-F5 Increase labor productivity.
Innovation (IN-F)
IN-F1 Develop new ways of customer service.
IN-F2 Develop new forms of shop floor management.
IN-F3 Develop new ways of supply chain management.
IN-F5 Develop new process technologies. Product quality (PQ-F)
PQ-F1 Provide better product performance. PQ-F3 Provide product conformance to specifications. PQ-F4 Improve product reliability. PQ-F5 Reduce defective rate.
Table 5.7.6.4: Firm’s Operational Performance – Final Construct Measurement
Items
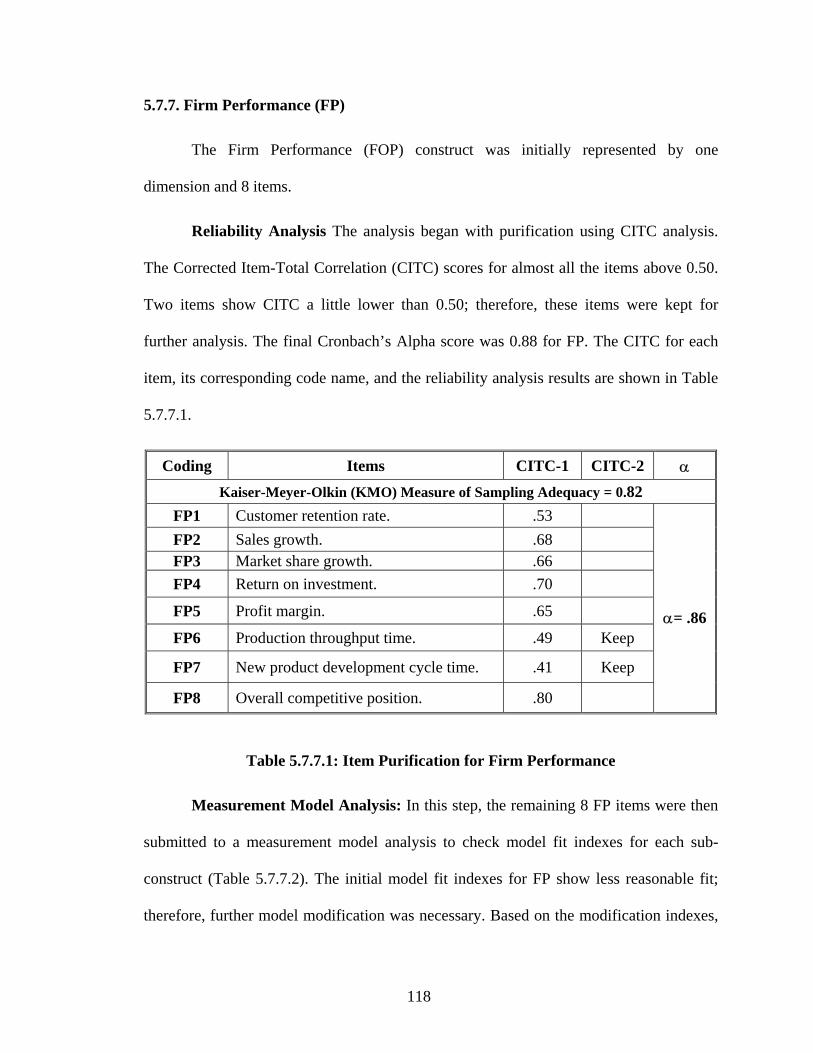
118
5.7.7. Firm Performance (FP)
The Firm Performance (FOP) construct was initially represented by one
dimension and 8 items.
Reliability Analysis The analysis began with purification using CITC analysis.
The Corrected Item-Total Correlation (CITC) scores for almost all the items above 0.50.
Two items show CITC a little lower than 0.50; therefore, these items were kept for
further analysis. The final Cronbach’s Alpha score was 0.88 for FP. The CITC for each
item, its corresponding code name, and the reliability analysis results are shown in Table
5.7.7.1.
Coding Items CITC-1 CITC-2 α Kaiser-Meyer-Olkin (KMO) Measure of Sampling Adequacy = 0.82
FP1 Customer retention rate. .53 FP2 Sales growth. .68 FP3 Market share growth. .66 FP4 Return on investment. .70
FP5 Profit margin. .65
FP6 Production throughput time. .49 Keep
FP7 New product development cycle time. .41 Keep
FP8 Overall competitive position. .80
α= .86
Table 5.7.7.1: Item Purification for Firm Performance
Measurement Model Analysis: In this step, the remaining 8 FP items were then
submitted to a measurement model analysis to check model fit indexes for each sub-
construct (Table 5.7.7.2). The initial model fit indexes for FP show less reasonable fit;
therefore, further model modification was necessary. Based on the modification indexes,

119
three items (FP3, FP5, and FP7) were dropped because the concepts are already covered
in other items. The new model fit indexes improve significantly to GFI = .99, AGFI =
.96, and RMSEA = .02.
Coding Items Initial Model Fit Final Model FitFP1 Customer retention rate. FP2 Sales growth. FP3 Market share growth. * FP4 Return on investment.
FP5 Profit margin. *
FP6 Production throughput time.
FP7 New product development cycle time. *
FP8 Overall competitive position.
GFI = .83
AGFI = .69
RMSEA = .19
GFI = .99
AGFI = .96
RMSEA = .05
* Items were dropped from the initial model
Table 5.7.7.2: Model Fit Indexes for Firm Performance
The final set of measurement items for the Firm Performance construct are shown
in table 5.7.7.3.
Coding Items
FP1 Customer retention rate. FP2 Sales growth. FP4 Return on investment.
FP6 Production throughput times
FP8 Overall competitive position.
Table 5.7.7.3: Firm Performance – Final Construct

120
5.8. DISCRIMINANT VALIDITY (SECOND-ORDER CONSTRUCT)
The second-order factor is explaining the covariation among first-order factors in
a more parsimonious way (i.e., one that requires fewer degrees of freedoms). Therefore,
even when the higher-order model is able to explain the factor covariations, the
goodness-of-fit of the higher order model can never be better than the corresponding
first-order model (Segars and Grover, 1998). In this sense, the first-order model provides
a target or optimum fit for the higher-order model. It has been suggested that the efficacy
of second-order model be assessed through examination of target (T) coefficient (where
T= χ2 first-order model/χ2 second-order model) (Marsh and Hocevar, 1985). The T
coefficient .80 to 1.0 indicates the existence of a second-order construct since most of the
variation shared by the first-order factors is explained by the single second-order factor.
Table 5.8.1 shows the calculated target coefficient between the first-order model and the
second-order model. This value suggests that the addition of the second-order model does
not significant increase χ2. Therefore, the second-order model represents a more
parsimonious representation of observed covariances and it should be accepted over the
first-order model as a “truer” representation of model structure. The results prove that
the second-order constructs do really exist as hypothesized in the theory development
section.

121
Construct Model Chi-Square (df) Chi-Square/df GFI AGFI RMSEA T coefficient
First- Order 120.00 (62) 1.94 0.92 0.89 0.07
ITU
Second-Order 120.00 (62) 1.94 0.92 0.89 0.07
100.00%
First-Order 408.48 (164) 2.50 0.86 0.82 0.08
IISI
Second-Order 415.03 (166) 2.50 0.85 0.81 0.08
98.42%
First-Order 461.47 (164) 2.81 0.83 0.79 0.09
EISI
Second-Order 463.62 (166) 2.79 0.83 0.79 0.09
89.94%
First-Order 429.27 (220) 1.95 0.86 0.83 0.07 Suppliers’
Operational
Performance Second-Order 452.19 (225) 2.01 0.86 0.83 0.07
94.93%
First-Order 571.68 (220) 2.60 0.82 0.77 0.09 Firm’s
Operational
Performance Second-Order 577.10 (225) 2.57 0.82 0.78 0.09
99.06%
Table 5.8.1: Goodness of Fit Indexes for First and Second Order Model
5.9. PREDICTIVE VALIDITY (CONSTRUCT-LEVEL CORRELATION ANALYSIS)
In order for measurement to be generalized, criterion-related validity or predictive
validity must be performed by comparing the second-order factor models with one or
more external variables (criterion) known or believed to measure the attribute. Criterion-
related validity is characterized by prediction to an outside criterion and by checking a
measuring instrument, either now or future, against some outcome or measure (Kerlinger,
1986). In this study, the criterion used to test the predictive validity is endogenous latent
variable or a dependent variable.

122
To check for the predictive validity of the 10 hypotheses presented in Chapter 2,
the Pearson correlation coefficients of the 10 hypothesized relationships were calculated
using a composite score for each construct. The composite score was computed by taking
the average score of all items in a specific construct. The results are presented in Table
5.9.1. As can be seen from the table, all correlations are significant at the 0.01 level.
Thus, all hypothesized relationships of interest are statistically supported by the Pearson
correlation. Further hypotheses testing using structural equation causal modeling were
discussed in the next chapter.
Hypothesis Independent Variable Dependent Variable Pearson Correlation
H1a Information Technology Utilization (ITU)
Internal Information Systems Integration (IISI) 0.786**
H1b Information Technology Utilization (ITU)
External Information Systems Integration (EISI)
0.685**
H2 Internal Information Systems Integration (IISI)
External Information Systems Integration (EISI)
0.809**
H3 Internal Information Systems Integration (IISI)
Supply Chain Integration (SCI)
0.453**
H4 External Information Systems Integration (EISI)
Supply Chain Integration (SCI)
0.539**
H5 Supply Chain Integration (SCI) Suppliers’ Operational Performance (SOP)
0.366**
H6 Supply Chain Integration (SCI) Firm’s Operational Performance (FOP)
0.386**
H7 Suppliers’ Operational Performance (SOP)
Firm’s Operational Performance (FOP) 0.491**
H8 Suppliers’ Operational Performance (SOP) Firm Performance (FP) 0.353**
H9 Firm’s Operational Performance (FOP) Firm Performance (FP) 0.573**
** Correlation is significant at the 0.01 level
Table 5.9.1: Construct-Level Correlation Analysis Results

123
CHAPTER 6: STRUCTURAL EQUATION MODELING, HYPOTHESES
TESTING, AND RECOMMENDATIONS FOR FUTURE RESEARCH
Although the bivariate correlations are statistically significant for all hypothesized
relationships, it may not be true when all the relationships are put together in a
multivariate complex model due to the interactions among variables. Since the
measurement instruments for all seven major constructs in the current study have already
been validated in Chapter 5, the hypotheses can be tested in a much more rigorous
manner using the structural equation modeling (SEM) framework.
A major methodological breakthrough in the study of complex interrelations
among variables has been the development and application of SEM (Joreskog, 1970).
SEM is widely recognized as a powerful methodology for capturing and explicating
complex multivariate relations in social science data. It represents the unification of two
methodological traditions: factor analysis originating from psychology and
psychometrics, and simultaneous equations (path analytic) modeling originating from
econometrics (Kaplan and Elliot, 1997). Therefore, The standard SEM is composed of
two parts – the measurement model ( a sub-model in SEM that specifies the indicators of
each construct and assesses the reliability of each construct for later use in estimating the
causal relationships) and the structural model (The set of dependence relationships
linking the model constructs). Since the measurement properties of each instrument in the
current study has already been evaluated through comprehensive reliability analysis and
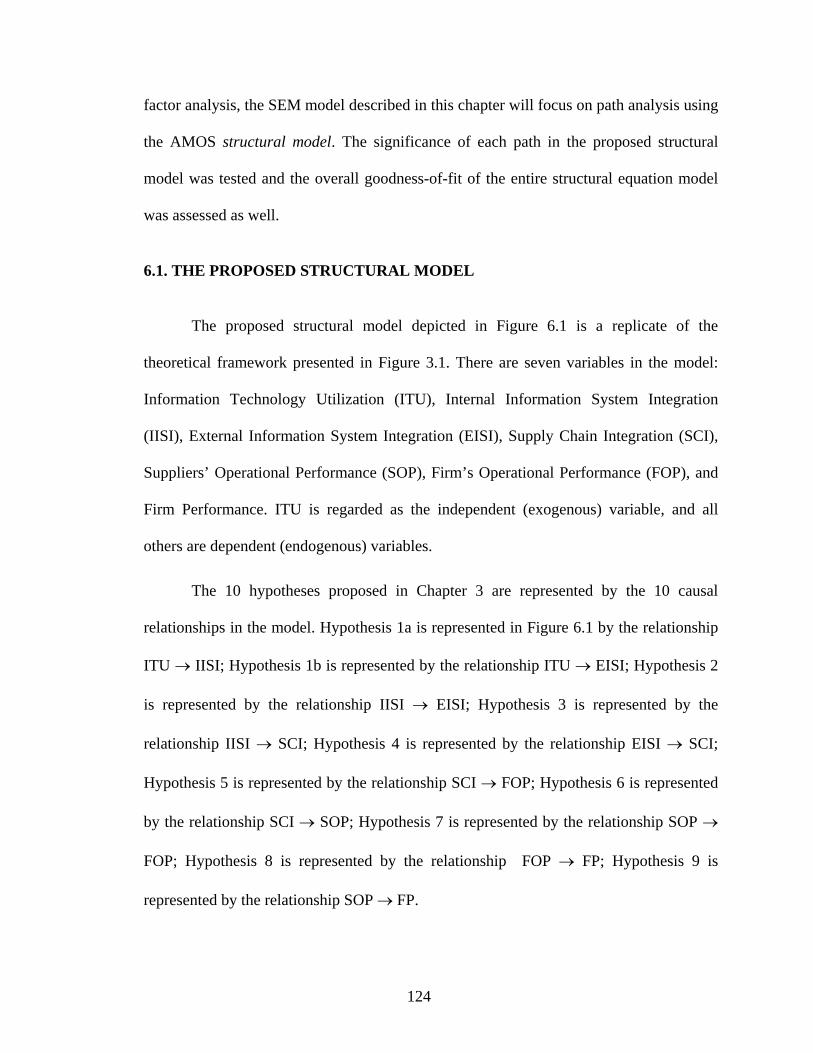
124
factor analysis, the SEM model described in this chapter will focus on path analysis using
the AMOS structural model. The significance of each path in the proposed structural
model was tested and the overall goodness-of-fit of the entire structural equation model
was assessed as well.
6.1. THE PROPOSED STRUCTURAL MODEL
The proposed structural model depicted in Figure 6.1 is a replicate of the
theoretical framework presented in Figure 3.1. There are seven variables in the model:
Information Technology Utilization (ITU), Internal Information System Integration
(IISI), External Information System Integration (EISI), Supply Chain Integration (SCI),
Suppliers’ Operational Performance (SOP), Firm’s Operational Performance (FOP), and
Firm Performance. ITU is regarded as the independent (exogenous) variable, and all
others are dependent (endogenous) variables.
The 10 hypotheses proposed in Chapter 3 are represented by the 10 causal
relationships in the model. Hypothesis 1a is represented in Figure 6.1 by the relationship
ITU → IISI; Hypothesis 1b is represented by the relationship ITU → EISI; Hypothesis 2
is represented by the relationship IISI → EISI; Hypothesis 3 is represented by the
relationship IISI → SCI; Hypothesis 4 is represented by the relationship EISI → SCI;
Hypothesis 5 is represented by the relationship SCI → FOP; Hypothesis 6 is represented
by the relationship SCI → SOP; Hypothesis 7 is represented by the relationship SOP →
FOP; Hypothesis 8 is represented by the relationship FOP → FP; Hypothesis 9 is
represented by the relationship SOP → FP.
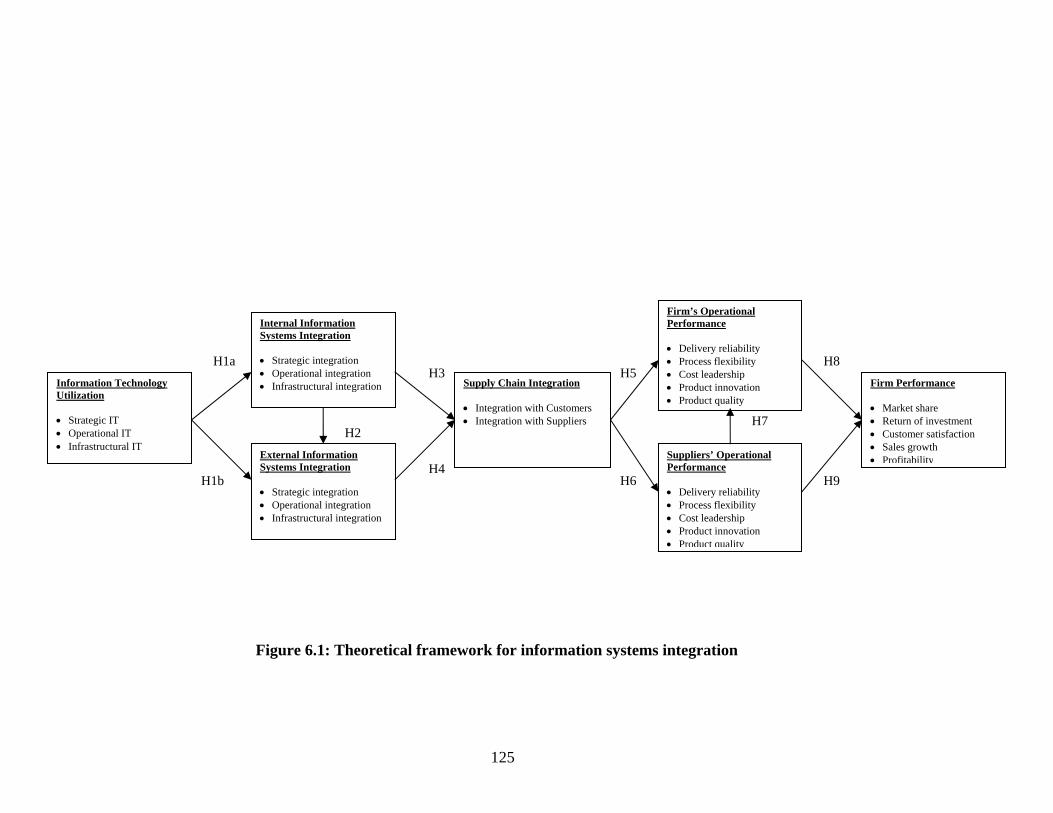
125
Figure 6.1: Theoretical framework for information systems integration
External Information Systems Integration
• Strategic integration • Operational integration • Infrastructural integration
Firm’s Operational Performance • Delivery reliability • Process flexibility • Cost leadership • Product innovation • Product quality
Firm Performance • Market share • Return of investment • Customer satisfaction • Sales growth • Profitability
Information Technology Utilization • Strategic IT • Operational IT • Infrastructural IT
Internal Information Systems Integration • Strategic integration • Operational integration • Infrastructural integration
Suppliers’ Operational Performance • Delivery reliability • Process flexibility • Cost leadership • Product innovation • Product quality
H2
H4
H3
H6
H7
H8
H9
H1a H5
H1b
Supply Chain Integration • Integration with Customers • Integration with Suppliers
126
6.2. STRUCTURAL EQUATION MODELING METHODOLOGY
Before proceeding to the AMOS structural model testing of the hypotheses, the
structural equation modeling methodology and some major model evaluation indices
were discussed.
Unlike the traditional statistical methods that can examine only a single
relationship at a time, the structural equation modeling (SEM) method greatly expanded
the researchers’ capability to study a set of interrelated relationships simultaneously. The
first and most difficult steps in the SEM are to specify the two components: Measurement
Model and Structure Model. It is difficult because SEM model specification must always
be based on sound theory from existing literature. The need for theoretical justification in
SEM is very important for the specification of dependence relationships, modifications to
the proposed relationships, and many other aspects of model estimation (Hair, et al.,
1992, pp. 434).
Once the measurement and structure models are specified, the researcher must
choose a computer program for model estimation and evaluation. The most widely used
program is AMOS 5 by James L. Arbuckle (1994-2003). There is no single statistical test
that best describes the strength of a model. Instead, researchers have developed a number
of goodness-of-fit measures to assess the results from three perspectives: 1) overall fit, 2)
comparative fit to a base model, and 3) model parsimony. The AMOS algorithm provides
several such statistics that can be used to evaluate the hypothesized model and also
suggest ways in which the model might be modified given sufficient theoretical
justification.

127
Overall Fit Measures.
The most fundamental measure of overall fit is the chi-square statistic (χ2). Low
values, which result in significance levels greater than 0.05, indicate that the actual and
predicted input matrices are not statistically different, hence a good fit. However, the χ2
measure is often criticized for its over-sensitivity to sample size, especially in cases
where the sample size exceeds 200 respondents (Hair et al., 1992, pp. 490). As sample
size increases, this measure has a greater tendency to indicate significant differences for
equivalent models. Thus the current study does not use the χ2 measure.
A second measure of overall fit is the Goodness-of-fit index (GFI) provided by
AMOS. GFI represents the overall degree of fit (the squared residuals from prediction
compared to the actual data), but is not adjusted for the degrees of freedom. GFI ranges in
value from 0 (poor fit) to 1 (perfect fit). Generally, a GFI value of greater than 0.90 is
considered as acceptable (Segars and Grover, 1993).
Another measure of overall fit is the Root Mean Square Error of
Approximation (RMSEA). The RMSEA takes into account the error of approximation
and is expressed per degree of freedom, thus making the index sensitive to the number of
estimated parameters in the model; values less than 0.05 indicate good fit, values as high
as 0.08 represent reasonable errors of approximation in the population (Browne &
Cudeck, 1993), values range from 0.08 to 0.10 indicate mediocre fit, and those greater
than 0.10 indicate poor fit (MacCallum et al, 1996).

128
Comparative Fit Measures.
This class of measures compares the proposed model to some baseline model
(null model) – some realistic model that all other models should be expected to exceed. In
most cases, the null model is a single construct model with all indicators perfectly
measuring the construct. One of the most popular measures of this kind is the Normed
Fit Index (NFI), which ranges from 0 (no fit at all) to 1 (perfect fit). A commonly
recommended value is 0.90 or greater (Hair et al., 1992).
Parsimonious Fit Measures.
This type of measure relates the goodness-of-fit of the model to the number of
estimated coefficients required to achieve this level of fit. The basic objective is to
diagnose whether model fit has been achieved by “over-fitting” the data with too many
coefficients. The most widely used measure of parsimonious fit is Adjusted Goodness-
of-Fit Index (AGFI) provided by AMOS. AGFI is an extension of GFI but adjusted by
the ratio of degrees of freedom for the proposed model to the degrees of freedom for the
null model. A recommended acceptance value of AGFI is 0.80 or greater (Segars and
Grover, 1993).
Modification Indices
The AMOS program also provides modification indices that suggest possible
ways of improving model fit, such as uncovering new relationships among constructs.
However, one has to bear in mind that the modifications must have sufficient theoretical
justification.
129
Effect Size
Effect size is a name given to a family of indices that measure the magnitude of a
treatment effect. Unlike significance tests, these indices are independent of sample size.
Effect size is commonly used to compliment structural equation modeling (SEM) because
SEM is a large-sample technique (e.g., 200 is the “floor” size of the sample; larger
sample sizes are more appropriate). When the test of a relationship deals with a large-
sample size, effect size helps researchers to differentiate between statistical significance
and practical significance. In SEM, standardized structural or path coefficients are the
effect sizes calculated by the model estimation program. Often these values are displayed
above their respective arrows on the arrow diagram specifying a model. The
interpretation is similar to regression: if a standardized structural coefficient is 2.0, then
the latent dependent will increase by 2.0 standard units for each unit increase in the latent
independent. In AMOS, the standardized structural coefficients are labeled “standardized
regression weights”, which are similar to the coefficients used to test the strength of
relationships. Table 6.2.1 shows the recommended values of effect size by Cohen (1988
and 1990, p. 1309). The structural paths and loadings of substantial strength (as opposed
to just statistically significant) should be at least 0.371 to be considered large indicating
13.8% of variance in the dependent variable that is accounted by the independent
variable. Standardized paths should be at least 0.148 in order to be considered meaningful
or medium effect. Meehl (1990) argues that anything lower may be due to what he has
termed the crud factor where “everything correlates to some extent with everything else”
(p. 204) because of "some complex unknown network of genetic and environmental
factors" (p. 209). Paths of 0.10, for example, represent at best a one-percent explanation
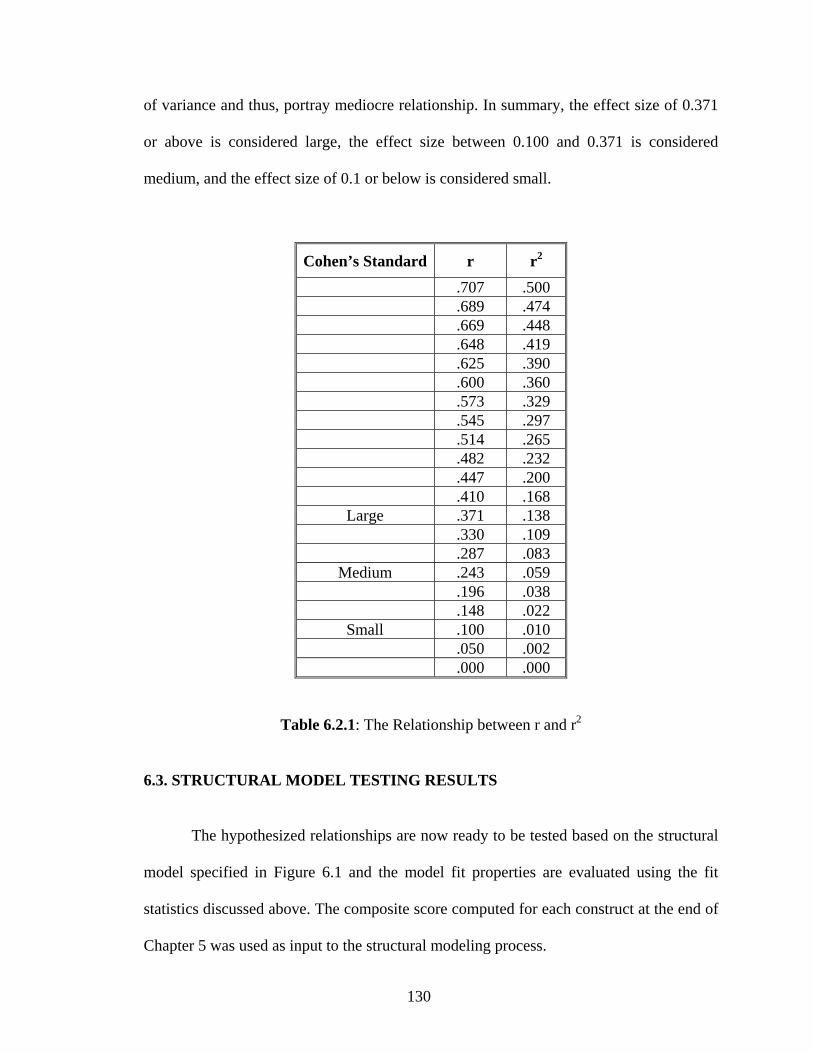
130
of variance and thus, portray mediocre relationship. In summary, the effect size of 0.371
or above is considered large, the effect size between 0.100 and 0.371 is considered
medium, and the effect size of 0.1 or below is considered small.
Cohen’s Standard r r2 .707 .500 .689 .474 .669 .448 .648 .419 .625 .390 .600 .360 .573 .329 .545 .297 .514 .265 .482 .232 .447 .200 .410 .168
Large .371 .138 .330 .109 .287 .083
Medium .243 .059 .196 .038 .148 .022
Small .100 .010 .050 .002 .000 .000
Table 6.2.1: The Relationship between r and r2
6.3. STRUCTURAL MODEL TESTING RESULTS
The hypothesized relationships are now ready to be tested based on the structural
model specified in Figure 6.1 and the model fit properties are evaluated using the fit
statistics discussed above. The composite score computed for each construct at the end of
Chapter 5 was used as input to the structural modeling process.
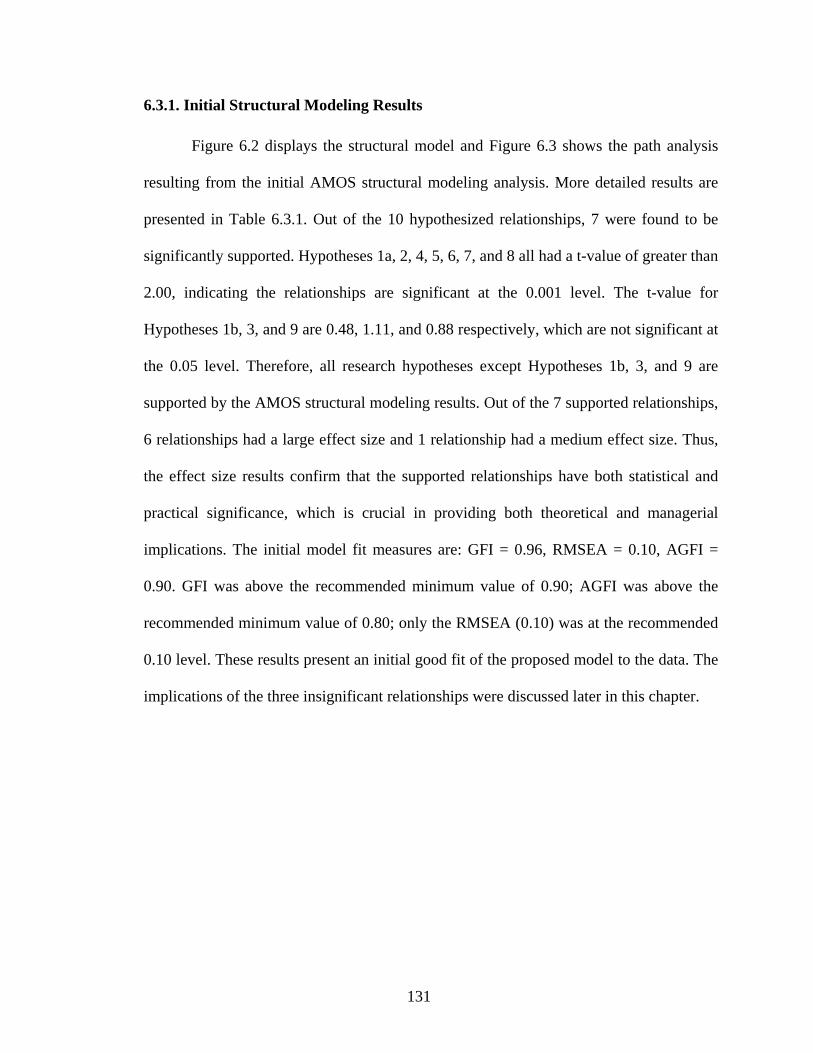
131
6.3.1. Initial Structural Modeling Results
Figure 6.2 displays the structural model and Figure 6.3 shows the path analysis
resulting from the initial AMOS structural modeling analysis. More detailed results are
presented in Table 6.3.1. Out of the 10 hypothesized relationships, 7 were found to be
significantly supported. Hypotheses 1a, 2, 4, 5, 6, 7, and 8 all had a t-value of greater than
2.00, indicating the relationships are significant at the 0.001 level. The t-value for
Hypotheses 1b, 3, and 9 are 0.48, 1.11, and 0.88 respectively, which are not significant at
the 0.05 level. Therefore, all research hypotheses except Hypotheses 1b, 3, and 9 are
supported by the AMOS structural modeling results. Out of the 7 supported relationships,
6 relationships had a large effect size and 1 relationship had a medium effect size. Thus,
the effect size results confirm that the supported relationships have both statistical and
practical significance, which is crucial in providing both theoretical and managerial
implications. The initial model fit measures are: GFI = 0.96, RMSEA = 0.10, AGFI =
0.90. GFI was above the recommended minimum value of 0.90; AGFI was above the
recommended minimum value of 0.80; only the RMSEA (0.10) was at the recommended
0.10 level. These results present an initial good fit of the proposed model to the data. The
implications of the three insignificant relationships were discussed later in this chapter.
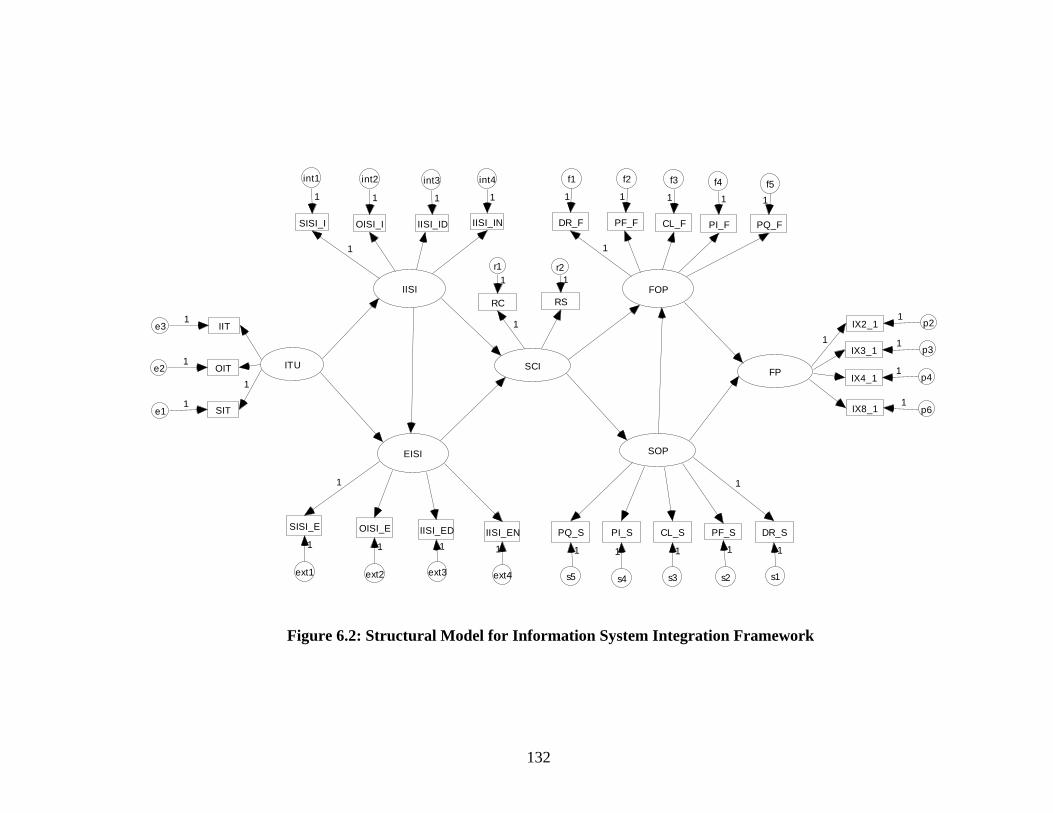
132
ITU
SITe1
1
1
OITe21
IITe31
IISI
SISI_I
int1
1
OISI_I
int2
1
IISI_ID
int3
1
EISI
IISI_ED
ext3
1
OISI_E
ext2
1
SISI_E
ext1
1
SCI
RC
r11
RS
r21
FOP
DR_F
f1
1
PF_F
f2
1
CL_F
f3
1
PI_F
f4
1
PQ_F
f51
SOP
DR_S
s1
1
PF_S
s2
1
CL_S
s3
1
PI_S
s4
1
PQ_S
s5
FP
IX2_1 p2
1
1
IX3_1 p31
IX4_1 p41
IX8_1 p61
IISI_IN
int4
1
IISI_EN
ext4
1
1
1
1
1
1 1
Figure 6.2: Structural Model for Information System Integration Framework

133
Figure 6.3: Path Analysis Results for Information System Integration Framework
External Information Systems Integration
Firm’s Operational Performance
Firm Performance Information Technology Utilization
Internal Information Systems Integration
Suppliers’ Operational Performance
H2 * 0.77, t = 11.15
H4 * 0.47, t = 5.07
H3 0.10, t = 1.11
H6 * 0.37, t = 5.80
H7 * 0.40, t = 6.60
H8 * 0.45, t = 6.62
H9 0.06, t = 0.88
H1a * 0.81, t = 20.5
H5 * 0.27, t = 4.38
H1b 0.03, t = 0.48
Supply Chain Integration
GFI = 0.96, AGFI = 0.90, and RMSEA = 0.10, * Significance at < 0.001

134
Hypotheses Relationship AMOS Coefficients
Effect Size t-value P Support
H1a ITU → IISI 0.81 Large 20.50 *** Yes H1b ITU → EISI 0.03 Small 0.48 0.63 No H2 IISI → EISI 0.77 Large 11.15 *** Yes H3 IISI → SCI 0.10 Small 1.11 0.27 No H4 EISI → SCI 0.47 Large 5.07 *** Yes H5 SCI → FOP 0.27 Medium 4.38 *** Yes H6 SCI → SOP 0.37 Large 5.80 *** Yes H7 SOP → FOP 0.40 Large 6.60 *** Yes H8 FOP → FP 0.45 Large 6.62 *** Yes H9 SOP → FP 0.06 Small 0.88 0.38 No
GFI = 0.96 AGFI = 0.90 RMSEA = 0.10 *** P < 0.001
Table 6.3.1: Initial AMOS Structural Modeling Results

135
Figure 6.4: Revised Path Analysis Results for Information System Integration Framework
External Information Systems Integration
Firm’s Operational Performance
Firm Performance Information Technology Utilization
Internal Information Systems Integration
Suppliers’ Operational Performance
H2 * 0.80, t = 19.6
H4 * 0.56, t = 9.89
H6 * 0.36, t = 5.80
H7 * 0.40, t = 6.60
H8 * 0.48, t = 8.10
H1a * 0.81, t = 20.4
H5 * 0.26, t = 4.38
Supply Chain Integration
GFI = 0.95, AGFI = 0.91, and RMSEA = 0.09 * Significance at < 0.001

136
6.3.2. Revised Structural Model
After revising the structural model by removing the three insignificant
relationships (H1b, H3, and H9), the model was tested again using AMOS. The results
are presented in Figure 6.4 and Table 6.3.2. All paths have a t-value of greater than 2.0
and significantly at the 0.001 level. Out of the 7 supported relationships, 5 relationships
had a large effect size and 2 relationships had a medium effect size. Thus, the effect size
results confirm that the supported relationships have both statistical and practical
significance, which is crucial in providing both theoretical and managerial implications.
The fit indexes of the revised indicate a good fit: GFI = 0.95 was greater than the
minimum level 0.90 level; AGFI = 0.91 was above the minimum 0.80 level; and RMSEA
= 0.09 level was lower than the recommended 0.10 level.
Hypotheses Relationship AMOS Coefficients
Effect Size t-value P Support
H1a ITU → IISI 0.81 Large 20.40 *** Yes H2 IISI → EISI 0.80 Large 19.60 *** Yes H4 EISI → SCI 0.56 Large 9.89 *** Yes H5 SCI → FOP 0.26 Medium 4.38 *** Yes H6 SCI → SOP 0.36 Medium 5.80 *** Yes H7 SOP → FOP 0.40 Large 6.60 *** Yes H8 FOP → FP 0.48 Large 8.10 *** Yes
GFI = 0.95 AGFI = 0.91 RMSEA = 0.09 *** P < 0.001
Table 6.3.2: Revised Structural Modeling Results

137
6.4. DISCUSSIONS OF STRUCTURAL MODELING AND HYPOTHESES TESTING RESULTS
The previous sections reported the structural modeling and hypotheses testing
results on the proposed model. To summarize, 6 of 10 hypothesized relationships
(Hypotheses 1a, 2, 4, 6, 7, and 8) were significant at the 0.05 level, four hypotheses were
not significantly supported (Hypotheses 1b, 3, 5, and 9), and the final AMOS structural
model displayed very good fit to the data. Three new direct paths were found.
However, statistical significance and model fit are not the ultimate objectives of
academic research. They are just the means to the end, which is to achieve better
understanding of the subject under investigation, and discover new relationships. The
results from the research will be of great value both to practitioners in terms of assisting
their business decision making processes, and researchers in terms of providing some
new instruments for further academic exploration. Therefore, the practical and theoretical
implications of the results of each hypothesis are discussed as follows.
Hypothesis H1a: The higher the extent of IT utilization, the higher the extent of
IISI
Hypothesis H1b: The higher the extent of IT utilization, the higher the extent of
EISI
Hypothesis H1a was found to be significant and hypothesis H1b was found to be
non-significant. This indicates that IT utilization has a direct positive influence on IISI
but not EISI. The level of IT utilization represents the extent to which a firm applies
computer and other information technologies to aid its internal activities. These internal
138
activities include strategic level activities (e.g., strategic planning, investment planning,
budget analysis), operational level activities (e.g., daily operations), and functional
activities (e.g., infrastructural decisions). The extensive use of information technology
can evolve into a high level of internal information system integration as employees in
the organization use technology to communicate with each other. The evidence can be
found in the adoption of standards and integrated services digital networks (ISDN), the
Internet and World Wide Web technology, Electronic Data Interchange (EDI) and
Electronic Commerce (EC), which raise the level of extensive communication networks
and inter-connectivity. Through the utilization of IT, companies have been able to
integrate their internal functions as well as external activities, thus enhancing capability
to cope with the sophisticated needs of customers and meeting the quality standards of
products (Bardi et al., 1994, Carter and Narasimhan, 1995). Because the use of networks,
shared databases, and other related IS have been considered enormously important for
eliminating duplicate activities, preventing errors, reducing cycle time in product
development, and improving inter-organizational communication, firms realized the
benefits of information system integration.
Hypothesis H2: The higher the extent of IISI, the higher the extent of EISI.
The hypothesis H2 was found to be significant. This indicates that IISI has a
direct positive influence on EISI. Information System Integration (ISI) is characterized by
degree of cooperation between business functions within a firm and between a firm and
its trading partners on an internally consistent set of information system practices. Such
practices consist of three levels. 1) At the infrastructural level, departments/firms can be

139
connected through data integration activities (e.g., using standard data definitions and
presentation formats) and network connectivity activities (e.g., using IS networks to
communicate and facilitate join agreement). 2) At the operational level,
departments/firms can use IS to facilitate joined daily activities (e.g., adjusting
manufacturing process, controlling product quality, managing order fulfillment, and
monitoring inventory level). 3) At the strategic level, departments/firms can interact with
each other to agree on collaborative decisions (e.g., formulating and justifying long-term
business plan, identifying future markets and new technologies, and studying
competitors).
ISIS focuses on full system-visibility of internal supply chain activities including
strategic, operational, and infrastructural IS practices. At this stage, all internal functions
from raw material management through production, shipping, and sales are connected
and integrated real-time. EISI, on the other hand, is characterized by external cooperation
between a firm and its trading partners. At this stage, full supply chain integration
extending the scope of integration outside the company is accomplished. The relationship
between IISI and EISI was not clear in previous literature. However, this relationship can
be explained using supply chain integration theory. For example, Bowersox (1989)
argued that process integration should progress from internal logistics integration to
external integration with suppliers and customers. Both can be accomplished by the
continuous automation and standardization of each internal logistics function and by
efficient information sharing and strategic linkage with suppliers and customers. Stevens
(1989), Byrne and Markham (1991), and Hewitt (1994) suggested that the development

140
of internal supply chain integration should precede the external integration with suppliers
and customers.
Hypothesis H3: The higher the extent of IISI, the higher the extent of supply chain
integration
Hypothesis H4: The higher the extent of EISI, the higher the extent of supply chain
integration
The hypothesis H3 was found to be non-significant and the hypothesis H4 was
found to be significant. This indicates that EISI has a direct positive influence on supply
chain integration; however, IISI does not. The results suggest that a firm’s internal
information system integration does not affect the extent of supply chain integration
directly but through external information system integration (EISI). This implies that it
does not matter how well a firm can implement information systems internally, supply
chain integration can only be improved if a firm uses information systems to interact with
external partners.
Hypothesis H5: The higher the extent of supply chain integration, the higher the extent of
firm’s operational performance
Hypothesis H6: The higher the extent of supply chain integration, the higher the extent of
suppliers’ operational performance
The hypothesis H5 and H6 were found to be significant. This indicates that supply
chain integration has a direct positive influence on a firm’s operational performance and
a suppliers’ operational performance. A highly integrated supply chain has been reported
to influence operational performance benefits in a number of studies (e.g., Armistead and

141
Mapes, 1993, Buck-lew et al., 1992). Ragatz et al. (1997) reported that effective
integration of suppliers into project value/supply chains will be a key factor for some
manufacturers in achieving the improvements necessary to remain competitive. Carter
and Ellram (1994) found that supplier involvement in product design has a positive
impact on defect rate in the later manufacturing stage. This finding empirically confirms
the assertion in the literature that a high level of supply chain integration could provide
an organization with competitive advantage. The successful supply chain implementation
will improve the organization’s performance on cost, quality, dependability, flexibility,
and time-to-market, and give the organization a defensible position over its competitors
through coordination of inter-organizational activities along the supply chain.
Hypothesis H7: The higher the extent of supplier performance, the higher the extent of
firm’s operational performance.
The hypothesis H7 was found to be significant. This indicates that supplier
performance has a direct positive influence on a firm’s operational performance.
Suppliers and a firm form a cooperative relationship with each other. Firms depend on
suppliers for a fast delivery of raw materials and parts, high quality of products,
reliability and flexibility at reasonable costs. Suppliers also depend on firms for their
generous volume at a reasonable price. It is a win-win situation. One way for a firm to
improve its competitive priorities is to create a strategic alliance. A strategic alliance is an
agreement with another firm that may take many forms such as collaborative effort, joint
venture, and technology licensing.
142
Hypothesis H8: The higher the extent of firm’s operational performance, the higher the
extent of firm performance
Hypothesis H9: The higher the extent of suppliers’ operational performance, the higher
the extent of firm performance
The hypothesis H8 was found to be significant and the hypothesis H9 was found
to be non-significant. This indicates that the firm’s operational performance affects a firm
performance directly, however; suppliers’ operational performance does not have a direct
positive influence on firm performance. Suppliers’ operational performance might affect
a firm performance indirectly through a firm’s operational performance as evidence in
hypothesis 6. This implies that suppliers and firms have to work together to improve their
business processes in order to gain financial benefits. World class suppliers provide
necessary factors to impact organizational performances but do not guarantee the success
of a firm unless the firm strategically manages long-term relationships with key suppliers,
improves overall product quality, delivery, process flexibility, and thus has a positive
impact on the firm’s financial performance.
143
6.5. STRUCTURAL EQUATION MODEL RESULTS – INDIRECT EFFECTS
Previous section (table 6.3.1) reports three of ten hypotheses were not
significantly supported. The hypotheses include (1) the direct relationship between
information technology utilization and external information systems integration, (2) the
direct relationship between internal information systems integration and supply chain
integration, and (3) the direct relationship between suppliers’ operational performance
and firm performance. As shown in table 6.5.1, these three relationships can be explained
in the form of indirect effect.
The indirect impact of information technology utilization on external information
systems integration is significant at p < 0.001 level and the indirect impact of internal
information systems integration and supply chain integration is significant at p < 0.01
level. This result supports the claim mentioned earlier that information systems
integration is a sequential process. The process starts within a firm by the firm integrating
all its internal activities including infrastructural components (e.g., hardware, software,
and standard), operational components (e.g., managing daily operations activities and
exchanging information), and strategic components (e.g., justifying business plan,
analyzing market position, and setting long term business goals). This process is crucial
and a pre-requisite for the success of a supply chain integration because only external
integration has a direct impact on supply chain integration. Even though information
technology utilization does not impact external integration and supply chain integration
directly, it does through internal integration as evident in the strong indirect relationship.
The results also provide managerial implications for top management. Top
management involved in technology investments must set a high priority on the
144
technologies that have potential revenues to both internal and external integration.
Investing high capital on technologies geared toward internal integration alone; even
though it sounds tempting, takes less time and is easy to measure benefits, and might
satisfy many stakeholders - is not good for the organization in the long run. Integration
projects should be viewed at the strategic level and provide long-term benefits (such as
supply chain integration and supply chain performance). Therefore, technology
investment strategy, internal information systems integration strategy, external
information systems integration strategy, and corporate strategy should be viewed
simultaneously - not a disposal of one another - when implementing technologies. All
strategies must be aligned because each component is important for the success of the
whole supply chain.
The results also show that the indirect impact of supplies’ operational
performance on firm performance is significant at p < 0.01 level. The results imply that
firms must view suppliers as a strategic weapon; even though suppliers are a separate
entity. Forming a close relationship with suppliers may bring many benefits to the firm
including reduced product development time, improved transparent communication,
focused efforts to core businesses, enhanced customer satisfaction, and increased
operational and firm performance. Because of the inevitable global competition, many
firms are interesting in forming a long-term relationship with their suppliers (e.g., Wal-
Mart and P&G, Kodak and IBM, and etc.). By forming the strategic relationship, a firm’s
supply chain can compete with other supply chains.

145
Hypotheses Relationship Direct Indirect Total T-Value
of Indirect effect
P-Value of Indirect Effect
H1a ITU → IISI 0.81 0.00 0.81 0.00 0.00 H1b ITU → EISI 0.03 0.63 0.66 9.10 *** H2 IISI → EISI 0.77 0.00 0.77 0.00 0.00 H3 IISI → SCI 0.10 0.37 0.47 3.89 *** H4 EISI → SCI 0.47 0.00 0.47 0.00 0.00 H5 SCI → FOP 0.27 0.14 0.41 2.41 0.008 H6 SCI → SOP 0.37 0.00 0.37 0.00 0.00 H7 SOP → FOP 0.40 0.00 0.40 0.00 0.00 H8 FOP → FP 0.45 0.00 0.45 0.00 0.00 H9 SOP → FP 0.06 0.18 0.24 2.64 0.004
Table 6.5.1: Structural Modeling Results – Indirect Effects
6.6. MODIFIED STRUCTURAL EQUATION MODEL RESULTS
Although the model fit indices were generally acceptable in the revised model,
there is still room for improvement to reach a higher standard of research. Especially the
RMSEA was still high, though acceptable. This might indicate some other uncovered
relationships in the model. After checking the modification indices provided by AMOS
structural results, two interesting new paths not proposed in the original model were
uncovered, which made perfect theoretical sense.
The two new discovered paths include: 1) the direct positive effects of Internal
Information System Integration (IISI) on Firm’s Operational Performance (FOP), and 2)
the direct positive effects of Supply Chain Integration (SCI) on Firm Performance (FP).
These are very interesting and meaningful findings. After adding these two new paths,
the structural model was estimated again using AMOS. The final results are presented in

146
Figure 6.5 and Table 6.6.1. All relationships show t-value greater than 2.0 and
significant at the 0.05 level. Out of the 9 relationships, 5 relationships had a large effect
size and 4 relationships had a medium effect size. Thus, the effect size results confirm
that the supported relationships have both statistical and practical significance, which is
crucial in providing both theoretical and managerial implications. The model fit indices
were significantly improved. GFI = 0.98, AGFI = 0.96, and RMSEA = 0.03 were all
significantly better than the suggested limits.
Hypotheses Relationship Coefficients Effect size t-value P Support
H1a ITU → IISI 0.81 Large 20.40 *** Yes H2 IISI → EISI 0.80 Large 19.60 *** Yes H4 EISI → SCI 0.56 Large 9.89 *** Yes H5 SCI → FOP 0.15 Medium 2.28 0.02 Yes H6 SCI → SOP 0.36 Medium 5.80 *** Yes H7 SOP → FOP 0.39 Large 6.58 *** Yes H8 FOP → FP 0.41 Large 6.40 *** Yes
New IISI → FOP 0.26 Medium 4.27 *** Yes New SCI → FP 0.17 Medium 2.59 0.009 Yes
GFI = 0.98 AGFI = 0.96 RMSEA = 0.03 *** = P < 0.001
Table 6.6.1: Final Structural Modeling Results

147
Figure 6.5: Final Path Analysis Results for Information System Integration Framework
External Information Systems Integration
Firm’s Operational Performance
Firm Performance Information Technology Utilization
Internal Information Systems Integration
Suppliers’ Operational Performance
H2 * 0.80, t = 19.60
H4 * 0.56, t = 9.89
H6 * 0.36, t = 5.80
H7 * 0.39, t = 6.58
H8 * 0.41, t = 6.40
H1a * 0.81, t = 20.4 H5 *
0.15, t = 2.28
Supply Chain Integration
GFI = 0.98, AGFI = 0.96, and RMSEA = 0.03, * Significance at < 0.001
0.17, t = 2.59
0.26, t = 4.27

148
6.7. DISCUSSION OF THE NEW PATHS
Path 1: The direct influence of internal information systems integration on firm’s
operational performance.
The results did not support the original hypothesis that internal information
systems integration indirectly influences firm’s operational performance through supply
chain integration. However, the new direct relationship between internal information
systems integration and firm’s operational performance emerges. This new relationship
actually makes theoretical and practical sense. The firm’s operational performance relates
to firm’s competitive priorities (e.g., delivery reliability, process flexibility, cost
leadership, product/process innovation, and product quality). From the results, the high
level of firm’s operational performance is dependent on the level of system integration
within the firm. Firms that extensively use information systems to accommodate different
level of activities (e.g., strategic, operational, and infrastructural) are more likely to
accomplish their internal competitiveness; even though they do not involve much in
supply chain activities. This explains why some companies do really well by themselves
by implementing the right tools and practices but provide no value added to the overall
supply chain.
Path 2: The direct influence of supply chain integration on firm performance.
The new relationship was not covered in the original hypothesis. It unsurprisingly
provides both theoretical and practical sense as it relates to path 1 relationship. Path 1
shows that internal information system integration provides firm’s internal advantages

149
because it improves firm’s operational performance; however, it might not provide
ultimate benefits. As the new path shows the direct relationship between supply chain
integration and firm performance, firms do not actually gain high level of performance
unless they involve in supply chain integration activities. Supply chain integration
activities may include involving customers and suppliers in the strategic and operational
activities such as determining market demand, identifying product development process,
enhancing logistics activities, and preparing strategic and business plans. Supply chain
integration provides a means to an end for firms to improve their overall performance
level.
6.8. SUMMARY OF RESULTS
Overall, the results indicate that higher levels of information technology
utilization will lead to improved internal information systems integration, and improved
internal information systems integration will enhance external information systems
integration and firm’s operational performance. The results also show that external
information systems integration rather than internal information systems integration
directly influences supply chain integration. In addition, firm performance is not only
influenced directly by its operational performance and supply chain integration, but also
indirectly by its suppliers’ operational performance. Moreover, the findings reveal that
effective supply chain integration will facilitate the firm’s operational performance, the
supplier’s operational performance, and firm performance. However, the findings did not
support the direct impact of information technology utilization on external information
systems integrations, the direct impact of internal information systems integration on
150
supply chain integration, and the direct impact of suppliers’ operational performance on
firm performance.
The next chapter will conclude with the limitations of the research, contributions,
implications for managers, and recommendations for future research.

151
CHAPTER 7: SUMMARY, LIMITATIONS, IMPLICATIONS, AND
RECOMMENDATIONS FOR FUTURE RESEARCH
This chapter provides (1) summary of research findings and major contributions,
(2) implications for practitioners, (3) limitations of the research, and (4)
recommendations for future research.
7.1. SUMMARY
The current research represents one of the first large-scale empirical efforts to
systemically investigate the complex causal relationships between information systems
integration and other related constructs such as information technology utilization, supply
chain integration, firm’s operational performance, suppliers’ operational performance,
and firm performance. It aims to answer the following important questions: 1) What are
the key dimensions of information systems integration? 2) What are the key dimensions
of information technology utilization? 3) What factors indirectly and directly affect
operational performance and firm performance? 4) How are customers and suppliers
involved in the process of supply chain integration? 5) What is the highest priority level
of integration for firms to gain ultimate benefits from their supply chain?
As mentioned in the introduction, there is no clear definition of constructs and
conceptual frameworks on information systems integration in the current literature and
most empirical research mainly focuses on the physical aspects of information systems
152
integration such as data integration and network connectivity within a merger and
acquisition context. The few studies that have attempted to empirically study the concept
of information systems integration are not clearly focused and mainly relate to
infrastructural integration. The current study provides a complete set of measurements for
information systems integration consisting of strategic integration, operational integration
and infrastructural integration. The information systems integration framework developed
here considers supply chain integration at the firm level. It represents top management’s
perception of the degree of involvement between a firm and its trading partners. Based on
the data collected from 220 top managements and executives, the model was tested using
structural equation modeling methodology. The study contributes to our understanding of
information systems integration and supply chain research a number of ways.
First, this research provides a theoretical framework that identifies the detailed
dimensions of information systems integration, information technology utilization, supply
chain integration, firm’s operational performance, suppliers’ operational performance,
and firm performance. This framework provides a foundation for future research. In the
future, new constructs may be added to provide in-depth understanding of information
systems integration theory.
Second, the study provides the inferences made from an instrument that is valid
and reliable for the current study’s context. The measurement instruments include four
constructs: 1) information technology utilization, 2) internal information system
integration, 3) external information system integration, and 4) supply chain integration.
All the scales have been tested through rigorous statistical methodologies including pre-
test, pilot-test using Q-sort method, confirmatory factor analysis, unidimensionality,

153
reliability, and the validation of second-order construct. All the scales are shown to meet
the requirements for reliability and validity and thus, can be used in future research. Such
valid and reliable scales have been otherwise lacking in the literature. The development
of these scales will greatly stimulate and facilitate theory development in this field.
Third, this study provides supporting evidence to the conceptual and prescriptive
literature about previously inconclusive statements regarding the relationship between
information technology utilization and performance. The results demonstrate that a
higher level of information technology utilization will lead to a higher level of supply
chain integration and firm performance through information systems integration. The
results of this study further provide the empirical support that information systems
integration acts as a bridge between the effective use of IT and the high level of
coordination within the supply chain. It can be concluded that only information
technologies used for integration purposes will provide sustainable competitive
advantage for the organizations within the supply chain.
Fourth, the results highlight the critical role of customers and suppliers in
facilitating supply chain integration. Effective relationships with customers and suppliers
will directly lead to a higher level of supply chain integration and in turn lead to a higher
level of operational performance for both firms and suppliers. Moreover, relationships
with trading partners will directly and indirectly influence firm performance through
firm’s and suppliers’ operational performance. This is a very valuable finding since
partner relationships have received little attention by top management.
Fifth, this research reveals that the nature of the information systems integration
process occurs in a sequential manner. The integration process starts with collaborating

154
activities between departments such as collaborating and developing business plans,
identifying new markets, adjusting manufacturing and logistics process, setting up
network connectivity, and etc. Once the internal integration is firmly rooted, the process
of external information systems integration is begun by involving their trading partners.
Therefore, internal integration process is crucial and a pre-requisite for the success of a
supply chain. The empirical findings from testing the influence of partner relationship
attributes added significantly to the current body of knowledge in SCM field. It shows
that the role of information systems integration in enhancing supply chain is strategic,
operational, and infrastructural. Moreover, the indirect influence of IT use on supply
chain integration demonstrates that the higher level of IT use alone will not necessarily
result in the higher level of supply chain integration if not accompanied by other factors,
such as internal information systems integration and external information systems
integration.
7.2. IMPLICATIONS FOR PRACTITIONERS
The results of this study have several important implications for practitioners.
First, as today’s competition is moving from competing between firms to competing
between supply chains, more organizations are increasingly adopting information
technologies in the hope for improving operational and firm’s performance. But there are
doubts about the potential benefits from information technology utilization. The findings
of this research assure the practitioners that information technology utilization is an
effective way of competing and information systems integration implementation does
have strong impacts on competitive advantage and organizational performance.
155
Second, the results of this study show that the information technology utilization
affects the firm’s internal information system integration directly; which in turn indirectly
impacts the firm’s external information system integration. This implies that the firm can
only be integrated with its external partners through information technology when it is
internally integrated and has an infrastructure in place. Without a high level of internal
integration, the linkage with external partners will never work. Information technology
alone does not guarantee external integration. This explains why several firms investing
in high-tech do not successfully gain potential benefits from their investment.
Technology is just a tool; it is not a solution. The implication to practitioners is clear; to
achieve a high level of integration with suppliers and customers, internal integration is
imperative and the process of integration is sequential from internal to external.
Third, the direct relationship between internal information systems integration and
external information systems integration implies that, in order for information systems to
be integrated; the process of integration occurs in a sequential manner from internal
integration to external integration. Firms with high degree of internal integration (e.g.,
firms successfully implement enterprise-wide information systems such as SAP and
MRP) are more likely to integrate with their external partners than firms with no internal
integration system. Internal information systems integration projects are time consuming
and capital intensive. Not all the firms implementing internal integration system can be
successful. However, firms successfully implementing internal integration have more
chances to integrate with other firms using existing compatible systems than the counter
parts.

156
Fourth, the results indicate that internal information systems integration has an
indirect impact on supply chain integration through external information systems
integration. This implies that top management should devote much study to technology
investment strategies because investing in the wrong technologies can become a
competitive disadvantage. Top management should pay much attention, resources, and
effort to invest in technologies that have value toward external integration, thus
improving supply chain integration. As a firm is continuously competing not only with
other firms but also with other value chains, investing in technologies geared toward
external integration will improve the entire supply chain. The competitive advantages
from improving supply chain integration include enhancing information flow and
improving operational performance (e.g., cost leadership, product quality, delivery speed,
process flexibility, and technology innovation) because logistics activities are much more
transparent.
Fifth, the research identifies the key dimensions of information technology
utilization. As hypothesized, the dimensions of information technology utilization include
three sub-dimensions namely strategic IT, operational IT, and infrastructural IT. As
identified in previous studies, information technology utilization provides both positive
and negative impacts on a firm’s outcomes because the full concept of information
technology utilization has been poorly defined and utilized by many firms. In fact, many
firms still tend to consider information technology utilization at the infrastructural and
operational level, not at the strategic level. Even though firms have realized the
importance of implementing the right information technology, they often do not know
exactly what to implement, or just focus on part of technologies. The findings
157
demonstrate to the practitioners that in order to gain full benefits, strategic information
technologies should be set a high priority. This implies that investing in technologies that
have strategic implications provides a building block for the supply chain integration
success.
Sixth, the research identifies the key dimensions of information systems
integration that a firm can adopt to interact with its trading partners. As hypothesized, the
dimensions of information systems integration include two dimensions namely internal
information systems integration and external information systems integration each with
three sub-dimensions namely strategic, operational, and infrastructural information
systems integration. These dimensions provide precise information to assist top
management when implementing information systems. The findings demonstrate to the
practitioners that, in order to gain overall benefits, top management should establish
information system that best serve their internal firm needs before attempting external
integration.
7.3. IMPLICATIONS FOR RESEARCHERS
First, the study provides the inferences made from an instrument that is valid and
reliable for the current study’s context for evaluating an organization’s level of
information technology utilization, information systems integration and supply chain
integration, and tests these constructs with two performance outcomes namely
operational performance and firm performance. Although several previous studies
discussed the measurement of information technology utilization, they were either
oriented toward infrastructural integration or operational integration such as network

158
integration and data integration. The instruments developed in this research capture an
important aspect of information system practices -strategic information systems
integration. The new instruments provide better guideline for researchers in the SCM
area; because, in the supply chain integration context, information technologies are
intentionally designed to support coordination and enhance transparent information, and
thus, can be considered strategic coalition tools. These measures are useful to researchers
who are interested in evaluating causes and effects of information technologies to the
overall supply chain.
Second, the findings identify the mediating role of information systems
integration in facilitating supply chain coordination. This study takes a look at the supply
chain integration at the firm level by measuring the degree of coordination between a
firm and its trading partners (customers and suppliers). The concept of supply chain
integration is difficult to measure; however, the level of coordination between a firm and
its trading partners can be used as an indirect measure of this concept. This measure is
useful to researchers who are interested in measuring the level of supply chain integration
but cannot specify a sampling frame of the supply chain. Measuring supply chain
integration at the firm level provides an alternative way to study supply chain outcomes.
Third, the study provides the inferences made from an instrument that is valid and
reliable for the current study’s context to measure the concept of information systems
integration. With two sub-dimensions of information systems integration, the new
instruments help expand research ideas for researchers who might adopt these measures
to study the factors affecting information systems integration such as culture. These
measures are also useful to researchers who are interested in studying the effects of
159
information systems integration on other important management variables such as top
management support and mass customization.
7.4. LIMITATIONS OF THE RESEARCH
While the current research made significant contributions from both a theoretical
and practical point of view, it also has limitations, which are described below.
First, because of the limited number of observations (220), the revalidation of
constructs was not carried out in this research. This needs to be addressed in future
research. New mailing lists and research methods may be applied to improve the response
rate.
Second, in this research, individual respondents (manufacturing managers and top
management) in an organization were asked to respond to complex information systems
integration issues, operational performance, and organizational performance dealing with
all the participants along the supply chain, including upstream suppliers and downstream
customers. However, no person in an organization is in charge of the entire supply chain:
for example, manufacturing managers are mainly responsible for procuring raw materials
and parts and managing production, and may not be in an appropriate position to answer
the supplier/customer-related questions. The main area of manufacturing managers is
production and they may not have thorough knowledge of their suppliers, customers, and
firm performance. Therefore, the use of single respondent responses may generate some
measurement inaccuracy.

160
Third, the response rate of 7%, even though comparable to similar studies, is
considered low. A main important of the low response rate is the length of questionnaire.
Because of the time constraint of top management, manufacturing managers and
executives are unlikely to participate in the lengthy survey. This issue can be addressed in
the future research by reducing the number of items in the questionnaire and
concentrating the focus of the questionnaire to the areas requiring further clarification.
7.5. RECOMMENDATIONS FOR FUTURE RESEARCH
Definition and measurement items should be refined based on the results of the
measurement model analysis. Future research should not only attempt to develop better
definitions and sub-dimensions but also use the least amount of parsimony. Since the
usefulness of a measurement scale comes from its generalizability, future research should
revalidate measurement scales developed through this research by using the similar
reference populations. Appendix N shows the recommended questionnaire items for the
future research.
The following recommendations are proposed for future research.
Future research should conduct factorial invariance tests. Generalizability of
measurement scales can further be supported by factorial invariance tests. Using the
instruments developed in this research, one may test for factorial invariance across
industries, across different organization size, and across organizations with different
supply chain structure (such as supply chain length, organization’s position in the supply
chain, channel structure, and so on).
161
Future research should apply multiple methods to obtain data. The use of a single
respondent to represent what are supposed to be intra/inter-organization wide variables
may generate some inaccuracy and more than the usual amount of random error
(Koufteros, 1995). Future research should seek to utilize multiple respondents from each
participating organization as an effort to enhance reliability of research findings. Once a
construct is measured with multiple methods, random error and method variance may be
assessed using a multitrait-multimethod approach.
Future research should examine the hypothesized structural relationships across
industries. Assuming an adequate sample size in each industry, structural analysis may be
done by industry. This would reveal either industry-specific structural relationships or
invariance of structural relationships across industries. The same hypothesized structural
relationships across countries can also be tested in the future research. This will allow the
comparison of Information System Integration between countries, the identification of
country-specific ISI issues, and the generalization of common ITU facilitating factors and
ISI practices across countries.
Future research should incorporate the factors inhibiting the implementation of
ITU. Such issues as interdependence of the partners, channel conflict, power, and
organizational/national culture have received attention in the literature. Studying the
impacts of such inhibiting factors and solutions to reduce or even eliminate such negative
influence on ISI practices are critical for further understanding ISI issues and improving
overall firm performance. Future research should also explore the impact of such
inhibiting factors on ISI practices and supply chain performance.
162
Future studies can also examine the proposed relationships by bringing some
contextual variables into the model, such as organizational size and supply chain
structure. For example, it will be intriguing to investigate how ISI practices differ across
organization size. It will also be interesting to examine the impact of supply chain
structure (supply chain length, organization’s position in the supply chain, channel
structure, and so on) on ISI practice and performance.
This study indicates that ITU plays an important role in implementing ISI practice
and improving organizational performance. There are several issues regarding the success
of IT implementations (such as trust, commitment, and shared vision). For example, how
does one choose to implement a specific IT from many alternatives? What tools and
procedures can be used to establish a successful IT implementation? What skills are
necessary to develop commitment and credibility in the relationship between ITU and
ISI? What is the role of top management in establishing a successful IT implementation?
There may be addressed in future research.
In this study, composite measures are used to represent each construct, and only
the structural model is tested using AMOS. However, the strength and nature of
relationships among sub-constructs across variables may vary. For example, it is certain
that ISI practices play critical roles in affecting operational performance and firm
performance at the organizational level. More detailed questions can be raised, such as
which ISI practice (i.e. strategic, operational, or infrastructural practices.) has more
impact on performance, or which dimension of operational performance (i.e. process
flexibility, product quality, cost, delivery speed, reliability) influences competitive
advantage more. By assessing these relationships at the sub-construct level, one may
163
explore numerous alternative models of structural relationships and make the findings
more meaningful for decision makers.
Finally, future research can expand the current theoretical framework by
integrating new constructs from other fields. For example, one might incorporate top
management support and mass customization into the existing framework.
164
REFERENCES
Alvarez, D. (1994). “Solving the puzzle of industry’s rubic cube-effective supply chain management”, Logistics Focus, 2(4), 2-4. Armistead, C. and Mapes, J. (1993). “The impact of supply chain integration on operating performance,” Logistics Information Management, 6(4), 9-14. Bagozzi, R.P. (1980) A Causal Model in Marketing, New York, Wiley.
Bardi, E.J., Raghunathan, T.S., and Bagchi, P.K. (1994). “Logistics information systems: the strategic role of top management”. Journal of Business Logistics, 15(1), 71-85. Barut, M., Faisst, W., and Kanet, J.J. (2002). “Measuring supply chain coupling: an information system perspective”, European Journal of Purchasing & Supply Management, 8, 161-171. Baxter, L.F., Ferguson, N., Macbeth, D.K., and Neil, G.C. (1989). “Getting the message across? Supplier quality improvement programmes: some issues in practice”, International journal of operations and production management, 9(5), 69-76. Beamon, B.M. (1998). “Supply chain design and analysis: models and methods”, International Journal of Production Economics. Bharadwaj, A.S. (2000). “A resource-based perspective on information technology capability and firm performance: An empirical investigation”, MIS Quarterly, 24(1), 169-196. Bhatt, G.D. (2000). “An empirical examination of the effects of information systems integrations on business process improvement”, International Journal of Operations & Production Management, 20(11), 1331-1359. Bhatt, G.D. and Stump, R.L. (2001). “An empirically derived model of the role of IS networks in business process improvement initiatives”, Omega, 29, 29-48. Boar, B.H. (1993). “The art of strategic planning for information technology: Crafting strategy for the 90s, John Wiley & Sons, New York, NY. Bourdreau, A. and Couillard, G. (1999). “Systems integration and knowledge management”, Information Systems Management, Fall, 24-32. Bowersox, D.J. (1989). “Logistics in the integrated enterprise”, The Annual Conference of the Council of Logistics Management, St. Louis, MO.

165
Browne, M.W. and Cudeck, R. (1993). “Alternative ways of assessing model fit”. In K.A. Bollen & J.S. Long (Eds.), Testing structural equation models (pp. 445-455). Newbury Park, CA: Sage. Byrne, B.M. (1989). “A primer of LISREL: Basic application and programming for confirmatory factor analytic models”, New York: Springer-Verlag. Bryne, P.M. and Markham, W.J. (1991). “Improving quality and productivity in the logistics processes: Achieving customer satisfaction breakthroughs” Oak Brook, IL: Council of Logistics Management. Buck-lew, M., Wardle, M., and Pliskin, N. (1992). “Accounting for information technology in corporate acquisitions”, Information and Management, 22, 363-369. Byrd, T. and Marshall, T. (1997). “Relating information technology investment to organizational performance a Causal Model Analysis”, Omega, 25(1), 43-56. Carr, L. and Ittner, C.D. (1992). “Measuring the cost of ownership.” Journal of Cost Management, 6(3), 42-51. Carr, A.S., Pearson, J.N. (1999). “Strategically managed buyer-seller relationships and performance outcomes”, Journal of Operations Management, 17,497-519. Carter, J.R. and Ellram, L.M. (1994). “The impact of inter-organizational alliances in improving supplier quality”, International Journal of Physical Distribution & Logistics Management, 24, 15-23. Carter, J.R. and Narasimhan, R. (1995). Purchasing and supply management: Future directions and trends (Tempe, AZ; Center for advanced purchasing studies). Chan, Y.E., Huff, S.L., Barclay, D.W., and Copeland, D.G. (1997). “Business Strategic Orientation, Information Systems Strategic Orientation, and Strategic Alignment” , Information Systems Research, 8(2), 125- 149. Christiansen, T., Berry, W.L., Bruun, P., and Ward, P. (2003). “A mapping of competitive priorities, manufacturing practices, and operational performance in groups of Danish manufacturing companies”, International Journal of Operations and Production Management, 23(10), 1163-1184. Churchill, G.A. (1979). “A paradigm for developing better measures of marketing constructs”, Journal of Marketing Studies, 16, 12-27. Clark, T.H. and Hammond, J.H. (1997). “Reengineering channel reordering processes to improve total supply-chain performance”, Production and Operations Management, 6(3), 248-265.
166
Cohen, J. (1960), “A Coefficient of Agreement for Nominal Scales”, Educational and Psychological Measurement, Spring, pp. 37-46.
Cohen, J. (1988). Statistical Power Analysis for the Behavioral Sciences (2nd ed.), Lawrence Erlbaum, Hillsdale, NJ.
Cohen, J. (1990). “Things I Have Learned (So Far)”, American Psychologist (12), 1304-1312.
Cohen, M.A. and Lee, H.L. (1988). “Strategic analysis of integrated production-distribution systems: Models and methods.” Operations Research., 36(2), pp. 216-228. Cronbach, L. J., (1951). “Coefficient alpha and the internal structure of tests”, Psychometrika, 16, pp. 297-335. Davenport, T.H. and Short, J. (1990). “The new industrial engineering: information technology and business process redesign,” Sloan Management Review, 11-27. Davis, F. D. (1989). “Perceived Usefulness, Perceived Ease of Use, and User Acceptance of Information Technology,” MIS Quarterly , 13(3), 319–339. Davis, T. (1993). “Effective supply chain management”, Sloan management review, 35-46, Summer. Doll, W. J., Raghunathan, T., Lim, S. J. and Gupta, Y. P (1995), “A Confirmatory Factor Analysis of the User Information Satisfaction Instrument”, Information Systems Research, 6(2), 177-188.
Dos Santos, B. and Sussman, L. (2000). “Improving the return on IT investment: the productivity paradox”, International Journal of Information Management, 20, 429-440. Earl, M.J. (1987). “Information Systems Strategy Formulation”, in R.J. Boland Jr. and R.A. Hirshheim (Eds.), Critical Issues in Information Systems Research, John Wiley & Sons Ltd., New York, 157-178. Earl, M.J. (1989). “Management strategies for information technology” (Englewood cliffs, NJ: Prentice Hall). Ellram, L.M., (1991). “Supply chain management: the industrial organization perspective”, International journal of physical distribution and logistics management, 21(1), 13-22. Fiderio, J. (1989).“What IS puts together, business deal can sunder”, ComputerWorld, 24, 69.
167
Frazier, G.L., Spekman, R.E., and O’Neal,C.R. (1988). “Just-in-time exchange relationships in industrial markets”, Journal of Marketing, 52(4), 52-67. Frohlich, M.T. and Westbrook, R. (2002). “Demand chain management in manufacturing and services: web-based integration, drivers, and performance”, Journal of Operations Management, 20, 729-745. Frohlich, M.T. (2002). “e-Integration in the supply chain: Barriers and Performance”, Decision Sciences, 33(4), 537-555. Gerbing, D. W. and Anderson, J.C. (1988), “Evaluating Structural Equation Methods, Number of Indicators per Factor, and Improper Solutions on Structural Equation Modeling Fit Indices”, Structural Equation Modeling, 2(2), 119-144. Goodhue, D.L., Kirsch, L.J., Quillard, J.A., and Wybo, M.D., (1992). “Strategic data planning: Lessons from the field,” MIS Quarterly, 16(1), March, 11-34. Gross, J.L. (1984). “Component can be added gradually by locally mapping out present and future uses”. Industrial Engineering, 16(6), 28-37. Gangopadhyay, A. and Huang, Z. (2004). “Studying the value information sharing in e-business supply chain management”, Journal of International Technology and Information Management, 13(1), 49-60. Gunasekaran, A. and Ngai, E.W.T. (2004). “Information systems in supply chain integration and management”, European Journal of Operational Research, 159, 269-295. Gunasekaran, A, Patel, C., and Tirtiroglu, E. (2001). “Performance measures and metrics in a supply chain environment”, International Journal of Operations and Production Management, 21(1/2), 71-87. Handfield, R.B., and Nichols, E.L., Jr. (1999). Introduction to supply chain management, Prentice Hall, Upper Saddler River, New Jersey. Hahn, C.K., Kim, K.H., and Kim, J.S. (1983). “Costs of competition: implications for purchasing strategy”, Journal of Purchasing and Materials Management, 2-7, fall. Hair, J.F., Anderson, R.E., Tatham, R.L., and Black, W.C. (1998). Multivariate Data Analysis. Fifth Edition, Macmillan Publishing Company, New York, NY. Hammer, M. (1990). “Reengineering work: Don’t automate, obliterate,” Harvard Business Review, 104-112. Hammer, M., and Champy, J. (1993). “Business process reengineering: A manifesto for business revolution”, Harper Business, New York.
168
Hattie, J. (1985), “Methodology Review: Assessing Unidimensionality of Tests and Items”, Applied Psychological Measurement, 9, pp.139-164. Hayes, R.H., Wheelwright, S.C. (1984). “Restoring our competitive edge: competing through manufacturing”, Wiley, New York. Hewitt, F. (1994). “Supply chain redesign,” The International Journal of Logistics Management, 5(2), 1-8. Hitt, L. and Brynjolfsson, E. (1994). “Three faces of IT value: theory and evidence”. Proceeding of the 15th International Conference on Information Systems. Jane, F., Janis, L.G., and Amy, W.R. (2004). “The ecology of Interorganizational information sharing”, Journal of International Technology and Information Management, 13(2), 73-86. Johnson, J.L. (1999). “Strategic integration in distribution channels: Managing the interfirm relationship as a strategic asset”, Academy of Marketing Science Journal, 27(1), 4-18. Joreskog, K.G. (1970). “A general method for analysis of covariance structures.” Biometrika, 57, 239-251. Joreskog, K. G. and Sorbom D. (1989), LISREL 7 Users’ Reference Guide, Scientific Software Inc., Chicago, IL.
Kaltwasser, C. (1990). “Know how to choose the right CIM systems integrators.” Industrial Engineering, 22(7), 27-29. Kaplan and Elliot (1997). “A didactic example of multilevel structural equation modeling application to the study of organizations.” In Structural Equation Modeling, 4(1), pp. 1-24. Kerlinger, F.N. (1978). Foundations of Behavioral Research, McGraw Hill, New York.
Kim, S.W. and Narasimhan, R. (2002). “Information system utilization in supply chain integration efforts”, Int. J. Prod. Res., 40(18), 4585-4609. King, W. R., and T. S. H. Teo, (1997). “Integration between business planning and information systems planning: Validating a stage hypothesis”, Decision Sciences, 28(2). Khurana, A. and Talbot, B. (1998). “The internationalization process model through the lens of the global color picture tube industry”, Journal of Operations Management, 16(2-3), 215-239.

169
Kopczak, L.R. (1997). “Logistics partnerships and supply chain restructuring: survey results from the US computer industry”, Production and Operations Management, 6(2), 226-247. Koufteros, X., Vonderembse, M., and Jayaram, J. (2005). “Internal and external integration for product development: The contingency effects of uncertainty, equivocality, and platform strategy”, Decision Sciences, 36(1), 97-133. Krajewski, L.J., Ritzman, L.P. (1996). “Operations management: strategy and analysis”, 4th edition, Wesley, Addison. Kyobe, M.E. (2004). “Investigating the strategic utilization of IT resources in the small and medium-sized firms of the eastern free state province”, International Small Business Journal, 22(2), 131-158. Lee, H.L. and Billington, C. (1995). “The evolution of supply chain management models and practices at Hewlett Packard”, Interface, 25(5), 42-63. Levy, D.L., (1997). “Lean production in an international supply chain”, Sloan Management Review, 94-102, Winter. Li, S. (2002). “An integrated model for supply chain management practice, performance, and competitive advantage”, Dissertation, the University of Toledo. Lummus, R.R., Vokurka, R.J., and Alber, K.L. (1998). “Strategic supply chain planning”, Production and Inventory Management Journal, 39(3), 49-58. Lummus, R. R. and Vokurka, R. J. (1999). “Defining Supply Chain Management: a Historical Perspective and Practical Guidelines”, Industrial Management and Data Systems, 99(1), 11-17. MacCallum, R.C., Browne, M.W., and Sugawara, H.M. (1996). “Power analysis and determination of sample size for covariance structure modeling.” Psychological Methods, 1, 130-149. Madnick, S.E. (1991). “The information technology platform”, in Scott Morton, M.S. (Ed), The corporation of the 1990s: Information technology and organizational transformation, Oxford University Press, New York, NY. Madnick, S.E. (1995). “Integration technology: the reinvention of the linkage between information systems and computer science”, Decision Support Systems, 13, 373-380. Marquez, A.C., Bianchi, C., and Gupta, J.N.D. (2004). “Operational and financial effectiveness of e-collaboration tools in supply chain integration”, European Journal of Operational research, 159, 348-363.

170
Marsh, H.W. and Hocevar, D. (1985). “Application of confirmatory factor analysis to the study of self-concept: first-and higher-order factor models and their invariance across groups”, Psychological Bull, 97(3), 562-582.
McDonald, R. P. (1981), “The Dimensionality of Tests and Items”, British Journal of Mathematical and Statistical Psychology, 34, 100-117.
Meehl, P. E. (1990), “Why Summaries of Research on Psychological Theories Are Often Uninterpretable” Psychological Reports, 66, 195-244.
Mentzer, J.T., Min, S., and Zacharia, Z.G. (2000). “The nature of interfirm partnership in supply chain management”, Journal of Retailing, 76(4), 549-568. Monczka, R.M., Trent, R.J., Callahan, T.J. (1983). “Supply base strategies to maximize supplier performance.”, International journal of physical distribution and logistics management, 23(4), 42-54. Moore, G.C., and Benbasat, I. (1991). “Development of an instrument to measure the perceptions of adopting and information technology innovation”, Information Systems Research, 2(3), 192-222. (Qsort Method). McFarlan, F.W. and McKenney, J.L. (1984). “Information technology changes the way you compete.” Harvard Business Review, 62(5), 98-103. Mudie, M.W. and Schafer, D.J. (1985). “An information technology architecture for change”, IBM System Journal, 24(3/4), 307-315. Narasimhan, R. and Das, A. (1999). “An empirical investigation of the contribution of strategic sourcing to manufacturing flexibilities and performance”, Decision Sciences, 30(3), 683-718. Narasimhan, R. and Kim, S.W. (2001). “Information system utilization strategy for supply chain integration”, Journal of business logistics, 22(2), 51-75. Narasimhan, R. and Kim, S.W. (2002). “Effect of supply chain integration on the relationship between diversification and performance: evidence from Japanese and Korean firms”, Journal of operations management, 20, 303-323. National research council. (2000). Surviving Supply Chain Integration: Strategies for small manufacturers, National Academy Press, Washington, D.C. Nolan, R. (1994). “Note on estimating the value of the IT asset,” Harvard Business School, 9, 195-197. Noori, H. and Mavaddat, F., (1998). “Enterprise integration: issues and methods”, International Journal of Production Research, 36(8), 2083-2097.
171
Nunnally, J.C. (1978). Psychometric Theory, McGraw Hill, New York.
Nurmilaakso, J., Kettunen, J., and Seilonen, I. (2002). “XML-based supply chain integration: a case study”. Integrated Manufacturing Systems, 13(8), 586-595. Owens, G. and Richmond, B. (1995). “Best practices in retailing: How to reinvest your supply chain: what works, what doesn’t”, Chain Store Age, 71(11), 96-98. Peterson, K.J., Handfield, R.B., and Ragatz, G.L. (2005). “Supplier integration into new product development: coordinating product, process, and supply chain design”, Journal of Operations Management, 23, 371-388. Porter, M.E. and Millar, V.E. (1985). “How information gives you competitive advantage”, Harvard Business School, 63(4), 149-160. Raghunathan, Bahnu, Raghunathan, T. S., Tu, Qiang, (1999), “Dimensionality of the strategic grid framework: the construct and its measurement”, Information Systems Research, 10(4), pp.343-355. Raghunathan, B. and Raghunathan, T.S. (1994). “Adaptation of a planning system success model to information systems planning”, Information Systems Research, 5(3), pp. 326-340. Ragatz, G.L., Handfield, R.B., and Scannell, T.V. (1997). “Success factors for integrating suppliers into new product development”, Journal of Product Innovation Management, 14(3), 190-202. Robbins, S.S. and Stylianou, A.C. (1999). “Post-merger systems integration: the impact on IS capabilities”, Information and Management, 36, 205-212. Rosenzweig, E.D., Roth, A.V., and Dean Jr., J.W. (2003). “The influence of an integration strategy on competitive capabilities and business performance: an exploratory study of consumer products manufacturers.” Journal of Operations Management, 21, 437-456 Roth, A.V. (1998). “The second generation of quality: global supply chain integration in Japan and the United States. In: Cortada, J.W., Woods, J.A. (Eds), The Quality Yearbook. McGraw-Hill, NY, 38.1-38.44. Roach, S.S. (1989). “Pitfalls on the “new” assembly line: Can services learn from manufacturing? Economic Perspectives.” Morgan Stanley and Company, New York. Rushton, A. and Oxley, J. (1994). Handbook of logistics and distribution management. (London: Kogan Page), 248-249.

172
Sagars, A.H. and Grover, V. (1996). “Designing company wide information systems: Risk factors and coping strategies.” Long Range Planning, 29(3), 381-392. Segars, A.H. and Grover, V. (1998), “Strategic information systems planning success: an investigation of the construct and its measurement”, MIS Quarterly, June, 139-163.
Shin, H., Collier, D.A., and Wilson, D.D. (2000). “Supply management orientation and supplier/buyer performance”, Journal of Operations Management, 18, 317-333. Sikora, R. and Shaw, M.J. (1998). “A Multi-Agent Framework for the Coordination and Integration of Information Systems.” Management Science, Nov, 44(11), S65-S78. Stevens, G.C. (1989). “Integrating the supply chain.”, International Journal of Physical Distribution and Materials Management, 19(8), 3-8. Stevens, G.C. (1990). “Successful supply chain management”, Management Decision, 28(8), 25-30. Stylianou, A.C., Jeffries, C.J., and Robbins, S.S. (1996). “Corporate mergers and the problems of IS integration”. Information and Management, 31, 203-213. Tan, K.C., Kannan, V.R., and Handfield, R.B. (1998). “Supply Chain Management: Supplier Performance and Firm Performance”, International Journal of Purchasing and Materials, 34 (4), 2-9. Themistocleous, M., Irani, Z., and Love, P.E.D. (2004). “Evaluating the integration of supply chain information systems: A case study”, European Journal of Operational Research, 159, 393-405. Tu, Q. (1999). “Achieving Mass Customization through Technology Application and Absorptive Capacity – A Customer- Oriented Framework”, Dissertation, the University of Toledo. Venkatraman, N. (1991). “IT-Induced business reconfiguration”, in Scott Morton, M.S. (Ed.), The Corporation of the 1990s: Information Technology and Organizational Transformation, Oxford University Press, New York, NY. Venkatraman, N. (1994). “IT-enabled business transformation: From automation to business scope redefinition.” Sloan Management Review, 35, 73-87. Vonderembse, M.A. and Tracey, M.. (1999). “The impact of supplier selection criteria and supplier involvement on manufacturing performance”, The journal of supply chain management: A global review of purchasing and supply, 35(3), 33-39.

173
Wainwright, D. and Waring, T. (2004). “Three domains of implementing integrated information systems: redressing the balance between technology, strategic and organizational analysis”, International Journal of Information Management, 24, 329-346. Waters-Fuller, N. (1995). “Just-in-time purchasing and supply: a review of the literature”, International journal of operations and production management, 15(9), 220-236. Webber, Y. and Pliskin, N. (1996). “The effects of information systems integration and organizational culture on a firm’s effectiveness”, Information and Management, 30, 81-90. Weill, P. (1988). “The relationship between investment in information technology and firm performance in the manufacturing sector”, Ph.D. Dissertation, Stern School of Business, New York University, NY. Wheelwright, S.C. (1984). “Manufacturing strategy: defining the missing link”, Strategic management journal, 5(1), 77-91. Williams, L.R., Nibbs, A., Irby, D. and Finley, T. (1997). “Logistics integration: the effect of information technology, team composition, and corporate competitive positioning”. Journal of Business Logistics, 18(2), 31-41. Wisner, J.D. (2003). “A structural equation model of supply chain management strategies and firm performance”, Journal of Business Logistics, 24(1),1-26. Wyse, J.E. and Higgins, C.A. (1993). “MIS integration: a framework for management”, Journal of Systems Management, Feb, 32-37. Yamin, S., Gunasekaran, A., and Mavondo, F.T. (1999). “Relationship between generic strategy, competitive advantage, and firm performance: an empirical analysis”, Technovation, 19(8), 507-518. Yates, Joanne and Robert I. Benjamin. (1991) “The Past and Present as a Window on the Future,” in Michael S. Scott Morton, ed. The Corporation of the 1990s: Information Technology and Organizational Transformation. Oxford University Press. 1991.
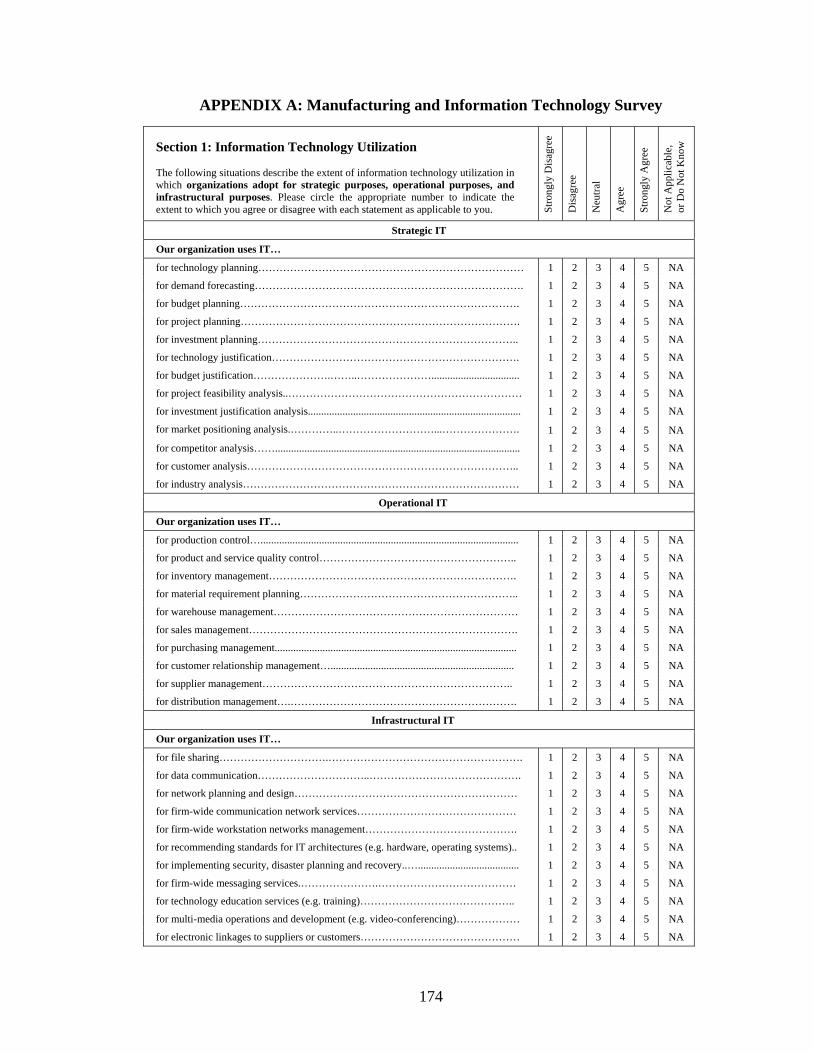
174
APPENDIX A: Manufacturing and Information Technology Survey
Section 1: Information Technology Utilization The following situations describe the extent of information technology utilization in which organizations adopt for strategic purposes, operational purposes, and infrastructural purposes. Please circle the appropriate number to indicate the extent to which you agree or disagree with each statement as applicable to you. St
rong
ly D
isag
ree
Dis
agre
e
Neu
tral
Agr
ee
Stro
ngly
Agr
ee
Not
App
licab
le,
or D
o N
ot K
now
Strategic IT
Our organization uses IT…
for technology planning………………………………………………………………… 1 2 3 4 5 NA
for demand forecasting…………………………………………………………………. 1 2 3 4 5 NA
for budget planning……………………………………………………………………. 1 2 3 4 5 NA
for project planning……………………………………………………………………. 1 2 3 4 5 NA
for investment planning……………………………………………………………….. 1 2 3 4 5 NA
for technology justification……………………………………………………………. 1 2 3 4 5 NA
for budget justification………………….……..…………………................................. 1 2 3 4 5 NA
for project feasibility analysis..………………………………………………………… 1 2 3 4 5 NA
for investment justification analysis................................................................................ 1 2 3 4 5 NA
for market positioning analysis.…………..………………………...…………………. 1 2 3 4 5 NA
for competitor analysis……............................................................................................ 1 2 3 4 5 NA
for customer analysis………………………………………………………………….. 1 2 3 4 5 NA
for industry analysis…………………………………………………………………… 1 2 3 4 5 NA
Operational IT
Our organization uses IT…
for production control…................................................................................................. 1 2 3 4 5 NA
for product and service quality control……………………………………………….. 1 2 3 4 5 NA
for inventory management……………………………………………………………. 1 2 3 4 5 NA
for material requirement planning…………………………………………………….. 1 2 3 4 5 NA
for warehouse management…………………………………………………………… 1 2 3 4 5 NA
for sales management…………………………………………………………………. 1 2 3 4 5 NA
for purchasing management........................................................................................... 1 2 3 4 5 NA
for customer relationship management…..................................................................... 1 2 3 4 5 NA
for supplier management…………………………………………………………….. 1 2 3 4 5 NA
for distribution management….………………………………………………………. 1 2 3 4 5 NA
Infrastructural IT
Our organization uses IT…
for file sharing………………………….………………………………………………. 1 2 3 4 5 NA
for data communication…………………………..……………………………………. 1 2 3 4 5 NA
for network planning and design……………………………………………………… 1 2 3 4 5 NA
for firm-wide communication network services……………………………………… 1 2 3 4 5 NA
for firm-wide workstation networks management……………………………………. 1 2 3 4 5 NA
for recommending standards for IT architectures (e.g. hardware, operating systems).. 1 2 3 4 5 NA
for implementing security, disaster planning and recovery..…...................................... 1 2 3 4 5 NA
for firm-wide messaging services.………………….………………………………… 1 2 3 4 5 NA
for technology education services (e.g. training)…………………………………….. 1 2 3 4 5 NA
for multi-media operations and development (e.g. video-conferencing)……………… 1 2 3 4 5 NA
for electronic linkages to suppliers or customers……………………………………… 1 2 3 4 5 NA

175
Section 2: Information Systems Integration - Internal The following statements describe the extent to which various business functions within the organization interact with each other using information systems (IS). Please circle the appropriate number to indicate the extent of integration with each statement as it pertains to your organization.
Stro
ngly
Dis
agre
e
Dis
agre
e
Neu
tral
Agr
ee
Stro
ngly
Agr
ee
Not
App
licab
le, o
r D
o N
ot K
now
Strategic Integration - Internal The use of Information Systems (IS) facilitates cooperation of various business functions within the organization in…
formulating collaborative decision making………………………………………... 1 2 3 4 5 NA justifying joint business plans……………………....……………………………... 1 2 3 4 5 NA analyzing the effectiveness of long-term business plans…………………………. 1 2 3 4 5 NA developing new business opportunities……………...……………………………. 1 2 3 4 5 NA identifying new markets…………………………………………………………… 1 2 3 4 5 NA identifying new technologies………..………...…………………………………... 1 2 3 4 5 NA studying competitors.……….…………………………………………………….. 1 2 3 4 5 NA defining firm’s competitive position……………….……………………………… 1 2 3 4 5 NA setting firm’s strategic goals………………..……………………………………... 1 2 3 4 5 NA
Operational Integration - Internal The use of Information Systems (IS) facilitates cooperation of various business functions within the organization in…
establishing manufacturing processes…………….………………….…………… 1 2 3 4 5 NA developing product designs……………….……………………………………… 1 2 3 4 5 NA identifying product development processes.…….………………………………. 1 2 3 4 5 NA managing order information………………….………………………………….. 1 2 3 4 5 NA exchanging inventory information….…….……………………………………… 1 2 3 4 5 NA selecting suppliers……..…..……………………….…………………………….. 1 2 3 4 5 NA managing logistical activities…………..…………………………………………. 1 2 3 4 5 NA establishing product forecasts……………………………..……………………… 1 2 3 4 5 NA sharing functional knowledge…………….………………………………………. 1 2 3 4 5 NA
Infrastructural Integration – Data Integration Various business functions within the organization…..
use standard data definitions and codes…………………………………………… 1 2 3 4 5 NA use standard data presentation format…………………………………………….. 1 2 3 4 5 NA use firm-wide databases (e.g. Oracle)……………………………………………. 1 2 3 4 5 NA use database synchronization systems (e.g. Palm).………………………………. 1 2 3 4 5 NA use firm-wide IS applications (e.g. Outlook, Lotus Note, SAP)………………….. 1 2 3 4 5 NA have low degree of data redundancy……………………………………………… 1 2 3 4 5 NA
Infrastructural Integration – Network Connectivity
Various business functions within the organization…. use IS networks to communicate with each other through ………………………... 1 2 3 4 5 NA use IS networks to share information with each other…………………………….. 1 2 3 4 5 NA use IS networks to connect to centralized databases…………….………………… 1 2 3 4 5 NA use IS networks to facilitate periodic interdepartmental meetings……...………… 1 2 3 4 5 NA use compatible network architectures…………………………………………….. 1 2 3 4 5 NA use firm-wide workstation networks………………………………….…………… 1 2 3 4 5 NA

176
Section 3: Information Systems Integration - External The following statements describe the extent to which a firm interacts with its suppliers and customers using information systems (IS). Please circle the appropriate number to indicate the extent of integration with each statement as it pertains to your organization.
Stro
ngly
Dis
agre
e
Dis
agre
e
Neu
tral
Agr
ee
Stro
ngly
Agr
ee
Not
App
licab
le, o
r D
o N
ot K
now
Strategic Integration - External
The use of Information Systems (IS) facilitates cooperation between our firm and our trading partners in…
formulating collaborative decision making……………………………… 1 2 3 4 5 NA justifying joint business plans………….…………..……………………… 1 2 3 4 5 NA analyzing the effectiveness of long-term business plans…….……… 1 2 3 4 5 NA generating new products…….…………………………………………… 1 2 3 4 5 NA establishing new business opportunities………………………………… 1 2 3 4 5 NA identifying new markets………………..…..……………………………… 1 2 3 4 5 NA identifying new technologies……………………………………………… 1 2 3 4 5 NA studying competitors……………………………………………………… 1 2 3 4 5 NA defining joint competitive position…………………….………………… 1 2 3 4 5 NA setting joint strategic goals…………..………………………………….… 1 2 3 4 5 NA
Operational Integration - External
The use of Information Systems (IS) facilitates cooperation between our firm and our trading partners in…
establishing manufacturing processes…………..………………………… 1 2 3 4 5 NA developing product designs……………………………………………… 1 2 3 4 5 NA designing product development processes……….……………………… 1 2 3 4 5 NA managing order information…………………………….………………… 1 2 3 4 5 NA exchanging inventory information ……………………………………… 1 2 3 4 5 NA selecting raw materials and parts…………………………………..……… 1 2 3 4 5 NA managing logistical activities……………………………………..……… 1 2 3 4 5 NA establishing product forecasts………………………….………………… 1 2 3 4 5 NA sharing business knowledge……………………………………………… 1 2 3 4 5 NA
Infrastructural Integration – Data Integration Our firm and our trading partners…
use standard data definitions and codes…………………………………… 1 2 3 4 5 NA use standard data presentation format……………………………………... 1 2 3 4 5 NA use database synchronization systems………………………………..… 1 2 3 4 5 NA use compatible database systems……………………………………… 1 2 3 4 5 NA use compatible IS applications………………..…………………..……… 1 2 3 4 5 NA have low degree of redundancy…………………………………………… 1 2 3 4 5 NA
Infrastructural Integration – Network Connectivity
Our firm and our trading partners… use IS networks to communicate with each other.. ……………………… 1 2 3 4 5 NA use IS networks to share information with each other…………………… 1 2 3 4 5 NA use IS networks to connect to each other’s databases… ………………… 1 2 3 4 5 NA use IS networks to negotiate business issues (e.g. price)….……………… 1 2 3 4 5 NA use IS networks to facilitate periodic meeting……….…………………… 1 2 3 4 5 NA use compatible network architectures…………………………………….. 1 2 3 4 5 NA

177
Section 4. The following statements describe the extent of supply chain integration by which the organization interacts with external constituencies (e.g., customers and suppliers. Please circle the appropriate number to indicate the extent on integration with each statement as it pertains to your organization. V
ery
Low
Low
Mod
erat
e
Hig
h
Ver
y H
igh
Not
App
licab
le, o
r D
o N
ot K
now
Integration with suppliers
The participation level of suppliers in manufacturing processes……… 1 2 3 4 5 NA The participation level of suppliers in production planning processes.. 1 2 3 4 5 NA The participation level of suppliers in product development processes.. 1 2 3 4 5 NA The participation level of suppliers in logistics processes…………… 1 2 3 4 5 NA The level of cross-over of activities between our firm and our suppliers………………………………………………………………. 1 2 3 4 5 NA The level of supplier involvement in preparing our business plans…… 1 2 3 4 5 NA
Integration with customers
The willingness of customers to share their market demands..……….. 1 2 3 4 5 NA The participation level of customers in product development processes................................................................................................. 1 2 3 4 5 NA The participation level of customers in finished goods distribution processes……………………………………………………………….. 1 2 3 4 5 NA The level of customer involvement in preparing business plans……… 1 2 3 4 5 NA The extent of follow-up with customers for feedbacks………..………. 1 2 3 4 5 NA

178
Section 5: Suppliers’ and Firm’s Operational Performance The following statements describe typical supplier and firm objectives. Please circle the appropriate number that best indicates the level of your suppliers’ and firm’s attainment of each objective as applicable to your perception. Please respond to both sides as left side indicates the level of supplier’s operational performance and right side indicates the level of firm’s operational performance.
Stro
ngly
Dis
agre
e
Dis
agre
e
Neu
tral
Agr
ee
Stro
ngly
Agr
ee
Not
App
licab
le, o
r D
o N
ot K
now
Stro
ngly
Dis
agre
e
Dis
agre
e
Neu
tral
Agr
ee
Stro
ngly
Agr
ee
Not
App
licab
le, o
r D
o N
ot K
now
Performance Dimensions Supplier’s Operational Performance Delivery reliability
Firm’s Operational Performance
1 2 3 4 5 NA Deliver materials/components/products as promises…………… 1 2 3 4 5 NA
1 2 3 4 5 NA Provide materials/components/products that are highly reliable... 1 2 3 4 5 NA
1 2 3 4 5 NA Provide fast delivery……………………………………………. 1 2 3 4 5 NA
1 2 3 4 5 NA Provide on-time delivery………….…………………………….. 1 2 3 4 5 NA
1 2 3 4 5 NA Provide reliable delivery………………………………………… 1 2 3 4 5 NA
1 2 3 4 5 NA Decrease manufacturing lead time…………………………….. 1 2 3 4 5 NA Process flexibility
1 2 3 4 5 NA Make rapid design changes…………………………..……….. 1 2 3 4 5 NA
1 2 3 4 5 NA Make rapid production volume changes…………..………….. 1 2 3 4 5 NA
1 2 3 4 5 NA Make rapid changeover between product lines………………. 1 2 3 4 5 NA
1 2 3 4 5 NA Process both large and small orders……………….…………. 1 2 3 4 5 NA
1 2 3 4 5 NA Produce a variety of different products………….…………… 1 2 3 4 5 NA
1 2 3 4 5 NA Increase capacity utilization…………………………………… 1 2 3 4 5 NA Cost leadership
1 2 3 4 5 NA Produce materials/components/products at low cost………… 1 2 3 4 5 NA
1 2 3 4 5 NA Reduce production cost………………………………………. 1 2 3 4 5 NA
1 2 3 4 5 NA Reduce inventory cost……………..…………………………. 1 2 3 4 5 NA
1 2 3 4 5 NA Reduce unit cost……………………………………………… 1 2 3 4 5 NA
1 2 3 4 5 NA Increase labor productivity……………….………………….. 1 2 3 4 5 NA Innovation
1 2 3 4 5 NA Develop new ways of customer service……………………… 1 2 3 4 5 NA
1 2 3 4 5 NA Develop new forms of shop floor management……………… 1 2 3 4 5 NA
1 2 3 4 5 NA Develop new ways of supply chain management……………. 1 2 3 4 5 NA
1 2 3 4 5 NA Develop new products and features………………………….. 1 2 3 4 5 NA
1 2 3 4 5 NA Develop new process technologies…………………………… 1 2 3 4 5 NA Product quality
1 2 3 4 5 NA Provide better product performance………………………….. 1 2 3 4 5 NA
1 2 3 4 5 NA Improve product durability…………………………………… 1 2 3 4 5 NA
1 2 3 4 5 NA Provide product conformance to specifications……………… 1 2 3 4 5 NA
1 2 3 4 5 NA Improve product reliability………….……………………….. 1 2 3 4 5 NA
1 2 3 4 5 NA Reduce defective rate…………….………………………….. 1 2 3 4 5 NA
1 2 3 4 5 NA Better product reputation…………………………………….. 1 2 3 4 5 NA
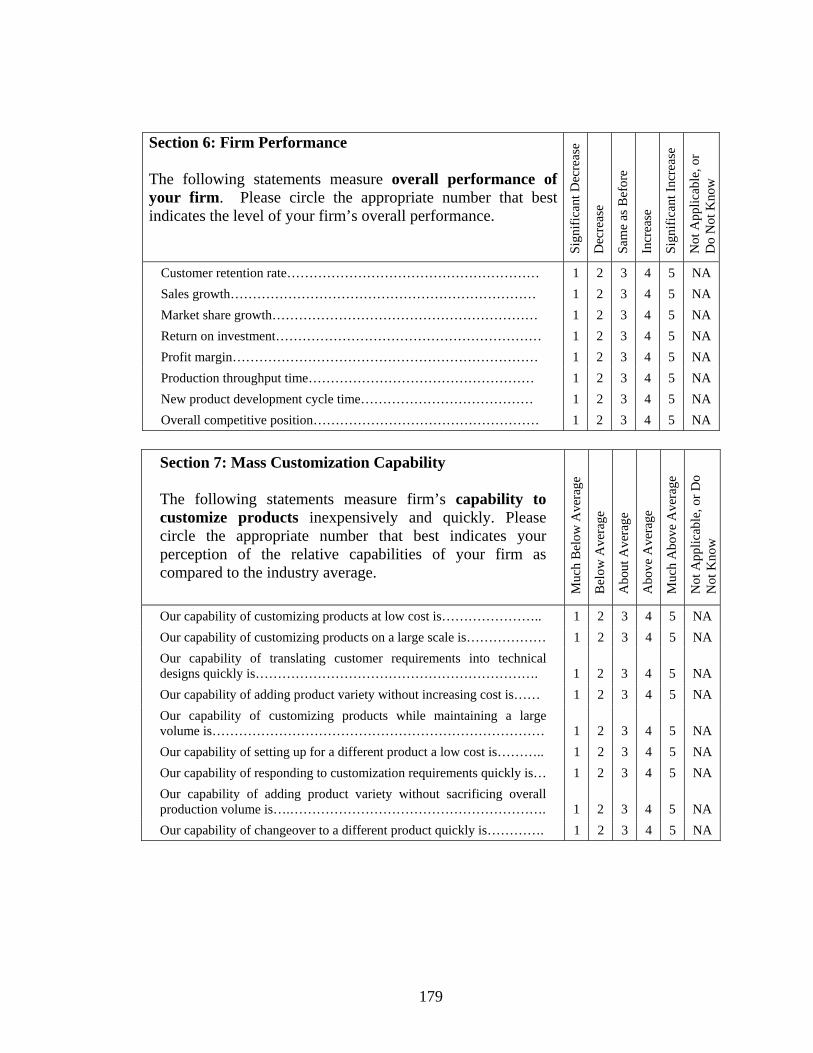
179
Section 6: Firm Performance The following statements measure overall performance of your firm. Please circle the appropriate number that best indicates the level of your firm’s overall performance.
Sign
ifica
nt D
ecre
ase
Dec
reas
e
Sam
e as
Bef
ore
Incr
ease
Sign
ifica
nt In
crea
se
Not
App
licab
le, o
r D
o N
ot K
now
Customer retention rate………………………………………………… 1 2 3 4 5 NA Sales growth…………………………………………………………… 1 2 3 4 5 NA Market share growth…………………………………………………… 1 2 3 4 5 NA Return on investment…………………………………………………… 1 2 3 4 5 NA Profit margin…………………………………………………………… 1 2 3 4 5 NA Production throughput time…………………………………………… 1 2 3 4 5 NA New product development cycle time………………………………… 1 2 3 4 5 NA Overall competitive position…………………………………………… 1 2 3 4 5 NA
Section 7: Mass Customization Capability The following statements measure firm’s capability to customize products inexpensively and quickly. Please circle the appropriate number that best indicates your perception of the relative capabilities of your firm as compared to the industry average. M
uch
Bel
ow A
vera
ge
Bel
ow A
vera
ge
Abo
ut A
vera
ge
Abo
ve A
vera
ge
Muc
h A
bove
Ave
rage
Not
App
licab
le, o
r Do
Not
Kno
w
Our capability of customizing products at low cost is………………….. 1 2 3 4 5 NA Our capability of customizing products on a large scale is……………… 1 2 3 4 5 NA Our capability of translating customer requirements into technical designs quickly is………………………………………………………. 1 2 3 4 5 NA Our capability of adding product variety without increasing cost is…… 1 2 3 4 5 NA Our capability of customizing products while maintaining a large volume is………………………………………………………………… 1 2 3 4 5 NA Our capability of setting up for a different product a low cost is……….. 1 2 3 4 5 NA Our capability of responding to customization requirements quickly is… 1 2 3 4 5 NA Our capability of adding product variety without sacrificing overall production volume is….…………………………………………………. 1 2 3 4 5 NA Our capability of changeover to a different product quickly is…………. 1 2 3 4 5 NA

180
APPENDIX B
COHEN’S KAPPA AND MORRE AND BENBASAT COEFFICIENT
The Q-sort method is an iterative process in which the degree of agreement
between judges forms the basis of assessing construct validity and improving the
reliability of the constructs. The method consists of two stages. In the first stage, two
judges are requested to sort the questionnaire items according to different constructs,
based on which the inter-judge agreement is measured. In the second stage, questionnaire
items that were identified as being too ambiguous, as a result of the first stage, are
reworded or deleted, in an effort to improve the agreement between the judges. The
process is carried out repeatedly until a satisfactory level of agreement is reached.
The following example describes the theoretical basis for the Q-sort method and
the two evaluation indices to measure inter-judge agreement level: Cohen’s Kappa
(Cohen, 1960) and Moore and Benbasat’s ‘Hit Ratio” (Moore and Benbasat, 1991).
Let us assume that two judges independently classified a set of N components as
either acceptable or rejectable. After the work was finished the following table was
constructed:
Judge 1 Acceptable Rejectable Totals Acceptable X11 X12 X 1+ Rejectable X21 X22 X 2+
Judge 2
Totals X+1 X+2 N Xij = the number of components in the ith row and jth column, for i,j = 1,2.

181
The above table can also be constructed using percentages by dividing each
numerical entry by N. For the population of components, the table will look like:
Judge 1 Acceptable Rejectable Totals Acceptable P11 P12 P 1+ Rejectable P21 P22 P 2+
Judge 2
Totals P+1 P+2 100 Pij = the percentage of components in the ith row and jth column.
We will use this table of percentages to describe the Cohen’s Kappa coefficient of
agreement. The simplest measure of agreement is the proportion of components that were
classified the same by both judges, i.e., Σi Pii = P11 + P22. However, Cohen suggested
comparing the actual agreement, Σi Pii, with the chance of agreement that would occur if
the row and columns are independent, i.e., Σi Pi+P+i. The difference between the actual
and chance agreements, Σi Pii - Σi Pi+P+i, is the percent agreement above that which is due
to chance. This difference can be standardized by dividing it by its maximum possible
value, i.e., 100% - Σi Pi + P+I = 1 - Σi Pi +P+i. The ratio of these is denoted by the Greek
letter kappa and is referred to as Cohen’s kappa.
)PP(-1)PP(-P=k
i++ii
i++iiiii
ΣΣΣ
Thus, Cohen’s Kappa is a measure of agreement that can be interpreted as the
proportion of joint judgment in which there is agreement after chance agreement is
excluded. The three basic assumptions for this agreement coefficient are: 1) the units are
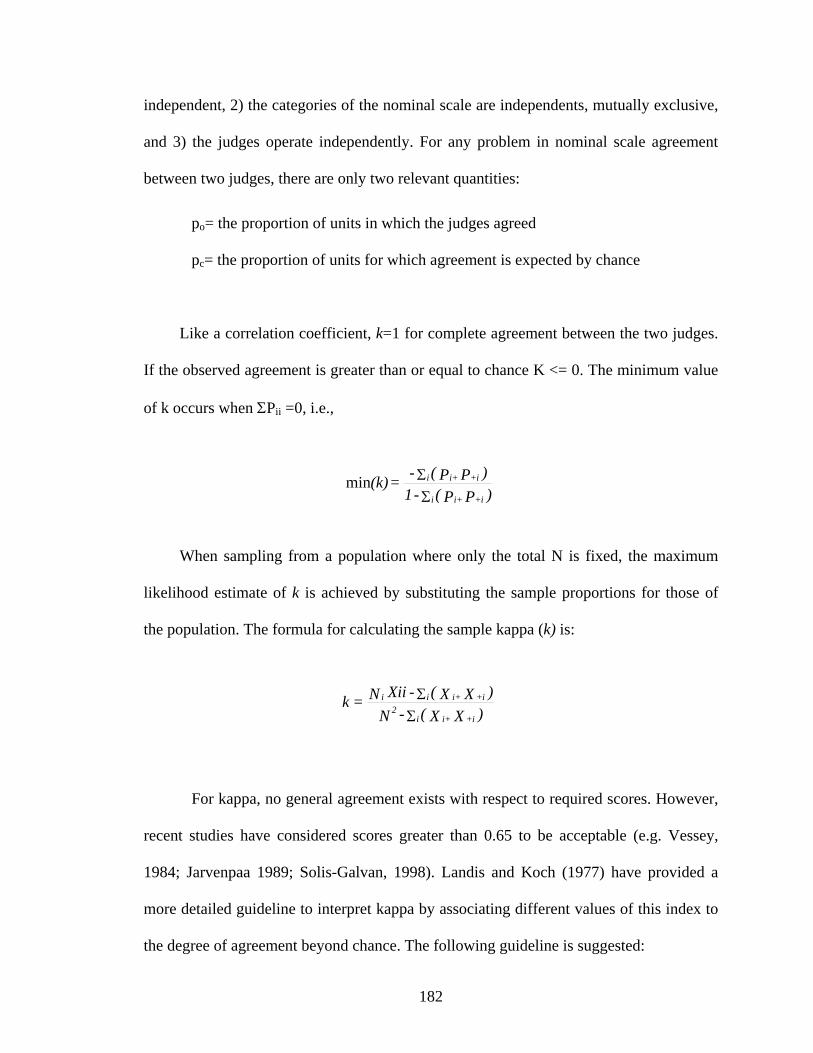
182
independent, 2) the categories of the nominal scale are independents, mutually exclusive,
and 3) the judges operate independently. For any problem in nominal scale agreement
between two judges, there are only two relevant quantities:
po= the proportion of units in which the judges agreed
pc= the proportion of units for which agreement is expected by chance
Like a correlation coefficient, k=1 for complete agreement between the two judges.
If the observed agreement is greater than or equal to chance K <= 0. The minimum value
of k occurs when ΣPii =0, i.e.,
When sampling from a population where only the total N is fixed, the maximum
likelihood estimate of k is achieved by substituting the sample proportions for those of
the population. The formula for calculating the sample kappa (k) is:
For kappa, no general agreement exists with respect to required scores. However,
recent studies have considered scores greater than 0.65 to be acceptable (e.g. Vessey,
1984; Jarvenpaa 1989; Solis-Galvan, 1998). Landis and Koch (1977) have provided a
more detailed guideline to interpret kappa by associating different values of this index to
the degree of agreement beyond chance. The following guideline is suggested:
)PP(-1)PP(-=(k)i++ii
i++ii
ΣΣmin
)XX(-N)XX(-XiiN=k
i++ii2
i++iii
ΣΣ

183
Value of Kappa Degree of Agreement Beyond Chance .76 - 1.00 Excellent .40 - .75 Fair to Good (Moderate) .39 or less Poor
A second overall measure of both the reliability of the classification scheme and
the validity of the items was developed by Moore and Benbasat (1991). The method
required analysis of how many items were placed by the panel of judges for each round
within the target construct. In other words, because each item was included in the pool
explicitly to measure a particular underlying construct, a measurement was taken of the
overall frequency with which the judges placed items within the intended theoretical
construct. The higher the percentage of items placed in the target construct, the higher the
degree of inter-judge agreement across the panel that must have occurred.
Moreover, scales based on categories that have a high degree of correct placement
of items within them can be considered to have a high degree of construct validity, with a
high potential for good reliability scores. It must be emphasized that this procedure is
more a qualitative analysis than a rigorous quantitative procedure. There are no
established guidelines for determining good levels of placement, but the matrix can be
used to highlight any potential problem areas. The following exemplifies how this
measure works.

184
Item Placement Scores
ACTUAL CONSTRUCTS A B C D N/A Total % Hits
A 26 2 1 0 1 30 87 B 8 18 4 0 0 30 60 C 0 0 30 0 0 30 100
THEORETICAL
D 0 1 0 28 1 30 93
Item Placements: 120 Hits: 102 Overall “Hit Ratio”: 85%
The item placement ratio (the “Hit Ration”) is an indicator of how many items
were placed in the intended, or target, category by the judges. As an example of how this
measure could be used, consider the simple case of four theoretical constructs with ten
items developed for each construct. With a panel of three judges, a theoretical total of 30
placements could be made within each construct. Thereby, a theoretical versus actual
matrix of item placements could be created as shown in the table above (including an
ACTUAL “N/A: Not Applicable” column where judges could place items which they felt
fit none of the categories).
Examination of the diagonal of the matrix shows that with a theoretical maximum
of 120 target placements (four constructs at 30 placements per construct), a total of 102
“hits” were achieved, for an overall “hit ratio” of 85%. More important, an examination
of each row shows how the items created to tap the particular constructs are actually
being classified. For example, row C shows that all 30-item placements were within the
target construct, but that in row B, only 60% (18/30) were within the target. In the latter
case, 8 of the placements were made in construct A, which might indicate the items
underlying these placements are not differentiated enough from the items created for

185
construct A. This finding would lead one to have confidence in scale based on row C, but
be hesitant about accepting any scale based on row B. In an examination of off-diagonal
entries indicate how complex any construct might be. Actual constructs based on
columns with a high number of entries in the off diagonal might be considered too
ambiguous, so any consistent pattern of item misclassification should be examined.

186
Q-Sort Results for the First Sorting Round
C11 C12 C13 C21 C22 C23 C31 C32 C33 C41 C42 NA T Xi+X+i
C11 7 5 12 96C12 1 5 1 7 77C13 1 6 7 49C21 7 4 11 88C22 4 1 1 6 66C23 1 3 8 12 108C31 9 7 16 192C32 2 1 3 33C33 1 3 6 2 12 72C41 6 6 42C42 1 5 6 30NA 0 0 0
T 8 11 7 8 11 9 12 11 6 7 5 3 98 853
Table 4.1: Inputs for Cohen’s Kappa coefficient

187
C11. Strategic IT C12. Operational IT C13. Infrastructural IT C21. Internal Strategic Information Systems Integration C22. Internal Operational Information Systems Integration
C23. Internal Infrastructural Information Systems Integration C31. External Strategic Information Systems Integration C32. External Operational Information Systems Integration C33. External Infrastructural Information Systems Integration C41. Relationship with customers C42. Relationship with suppliers
Table 4.2: Inter-judge Raw Agreement Scores: First Sorting Round
Judge 1
C11
C12
C13
C21
C22
C23
C31
C32
C33
C41
C42 NA
C11
7
5
C12
1
5
1
C13
1
6
C21
7
4
C22
4
1
1
C23
1
3
8
C31
9
7
C32
2
1
C33
1
3
6
2
C41
6
C42 1 5
J u d g e 2
NA 0
Total items placement: 98 Number of Agreement: 64 Agreement Ratio: 0.65

188
Table 4.3: Items Placement Ratios: First Sorting Round
ACTUAL CATEGORIES
C11
C12
C13
C21
C22
C23
C31
C32
C33
C41
C42
NA
T
TG%
C11 15 5 20 75
C12 4 10 2 16 63
C13 1 3 12 16 75
C21 14 3 1 18 78
C22 5 11 1 1 18 61
C23 3 19 22 86
C31 17 3 20 85
C32 10 8 18 44
C33 1 3 18 2 24 75
C41 12 12 100
T H E O R E T I C A L
C42 1 11 12 92
Total Items Placement: 196 Hits: 147 Overall Hit Ratio: 75 %
C11. Strategic IT C12. Operational IT C13. Infrastructural IT C21. Internal Strategic Information Systems Integration C22. Internal Operational Information Systems Integration
C23. Internal Infrastructural Information Systems Integration C31. External Strategic Information Systems Integration C32. External Operational Information Systems Integration C33. External Infrastructural Information Systems Integration C41. Relationship with customers C42. Relationship with suppliers

189
Table 4.4: Inter-Judge Agreements
Agreement Measure
Round 1
Raw Agreement
.65
Cohen’s Kappa
.49
Placement Ratio Summary
Strategic IT
.75
Operational IT
.63
Infrastructural IT
.75 Internal Strategic Information Systems Integration
.78
Internal Operational Information Systems Integration
.61
Internal Infrastructural Information Systems Integration
.86
External Strategic Information Systems Integration.
.85
External Operational Information Systems Integration
.44
External Infrastructural Information Systems Integration
.75
Relationship with customers
1.00
Relationship with suppliers
.92 Average
.75
Table 4.5 to 4.8 show the Q-sort results from the first round.

190
Two misplaces One misplace or No misplace
Section 1: Information Technology Utilization The following situations describe the extent to which the manufacturing department uses information technology (IT) for strategic, operational, and infrastructural purposes. Please circle the appropriate number to indicate the extent to which you agree or disagree with each statement as applicable to your unit. technology justification and planning budget justification and planning investment justification and planning capacity planning manufacturing processes identification (continuous, job shop, batch, project and line). project planning project feasibility analysis competitor analysis customer analysis industry analysis production control product and service quality control inventory management material requirement planning warehouse management customer relationship management supplier relationship management products distribution management file sharing data communication plant layout management and control. technology education services (e.g. training) multi-media operations and development (e.g. CAD, CAM, Robots) warehouse/space management facility infrastructure design product movement planning
Table 4.5: IT Utilization Construct

191
Section 2: Information Systems Integration - Internal The following statements describe the extent to which the manufacturing department collaborates with other business functions by using information technology (IT). Please circle the appropriate number to indicate the extent to which you agree or disagree with each statement as applicable to your unit.
formulate collaborative decision making justify business plans analyze the effectiveness of business plans develop new business opportunities identify new markets identify new technologies study competitors define competitive position set strategic goals establish manufacturing processes develop product designs identify product development processes manage order information exchange inventory information select suppliers manage logistical activities establish product forecasts share functional knowledge use standard data definitions and codes use standard data presentation format use centralized databases (e.g. Oracle) use database synchronization systems (e.g. Palm) use enterprise-wide IS applications (e.g. Outlook, Lotus Note, SAP) reduce information redundancy use IS networks to communicate with each other use IS networks to share information with each other use IS networks to connect to centralized databases use IS networks to facilitate periodic interdepartmental meetings use compatible network architectures
Table 4.6: Internal Information Systems Integration Construct

192
Section 3: Information Systems Integration - External The following statements describe the extent to which the manufacturing department collaborates with its suppliers and customers by using information technology (IT). Please circle the appropriate number to indicate the extent to which you agree or disagree with each statement as applicable to your unit. formulate collaborative decision making justify business plans analyze the effectiveness of business plans generate new products establish new business opportunities identify new markets identify new technologies study competitors define competitive position set strategic goals establish manufacturing processes develop product designs design product development processes manage order information exchange inventory information select raw materials and parts manage logistical activities establish product forecasts share business knowledge use standard data definitions and codes use standard data presentation format use database synchronization systems use compatible database systems use compatible IS applications reduce information redundancy use IS networks to communicate with each other use IS networks to share information with each other use IS networks to connect to each other’s databases use IS networks to negotiate business issues (e.g. price) use IS networks to facilitate periodic meeting use compatible network architectures
Table 4.7: External Information Systems Integration Construct
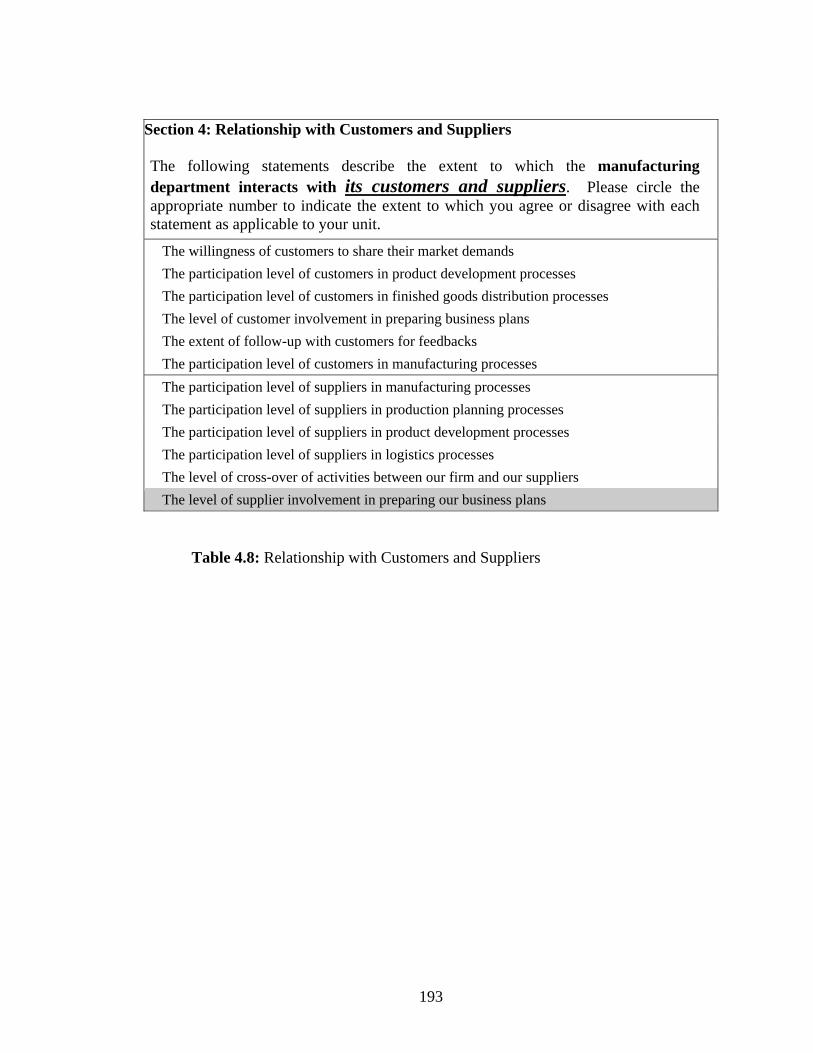
193
Table 4.8: Relationship with Customers and Suppliers
Section 4: Relationship with Customers and Suppliers The following statements describe the extent to which the manufacturing department interacts with its customers and suppliers. Please circle the appropriate number to indicate the extent to which you agree or disagree with each statement as applicable to your unit.
The willingness of customers to share their market demands The participation level of customers in product development processes The participation level of customers in finished goods distribution processes The level of customer involvement in preparing business plans The extent of follow-up with customers for feedbacks The participation level of customers in manufacturing processes The participation level of suppliers in manufacturing processes The participation level of suppliers in production planning processes The participation level of suppliers in product development processes The participation level of suppliers in logistics processes The level of cross-over of activities between our firm and our suppliers The level of supplier involvement in preparing our business plans
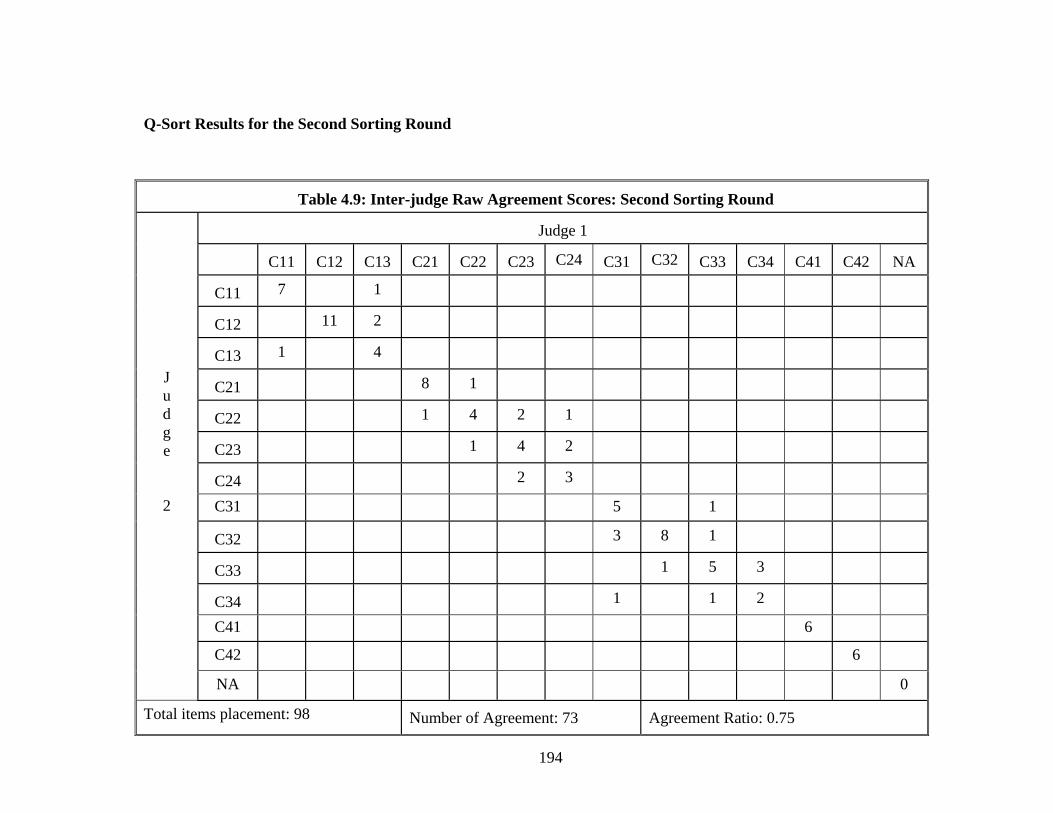
194
Q-Sort Results for the Second Sorting Round
Table 4.9: Inter-judge Raw Agreement Scores: Second Sorting Round
Judge 1
C11
C12
C13
C21
C22
C23 C24
C31 C32
C33
C34
C41
C42 NA
C11 7 1
C12 11 2
C13 1 4
C21 8 1
C22 1 4 2 1
C23 1 4 2
C24 2 3
C31 5 1
C32 3 8 1
C33 1 5 3
C34 1 1 2
C41 6
C42 6
J u d g e 2
NA 0
Total items placement: 98 Number of Agreement: 73 Agreement Ratio: 0.75

195
Table 4.10: Items Placement Ratios: Second Sorting Round
ACTUAL CATEGORIES
C11
C12
C13
C21
C22
C23 C24
C31
C32
C33
C34
C41
C42
NA
T
TG%
C11 24 4 2 30 80
C12 23 1 24 95
C13 2 8 14 24 58
C21 25 1 1 27 93
C22 1 21 4 1 27 78
C23 1 12 5 18 67
C24 5 10 15 67
C31 23 3 3 1 30 77
C32 21 6 27 78
C33 1 14 2 1 18 78
C34 2 4 12 18 67
C41 18 18 100
T H E O R E T I C A L
C42 1 17 18 94
Total Items Placement: 294 Hits: 234 Overall Hit Ratio: 80 %

196
C11. Strategic IT C12. Operational IT C13. Infrastructural IT C21. Internal Strategic Information Systems Integration C22. Internal Operational Information Systems Integration C23. Internal Infrastructural Information Systems Integration - Data Integration C24. Internal Infrastructural Information Systems Integration - Network Connectivity C31. External Strategic Information Systems Integration C32. External Operational Information Systems Integration C33. External Infrastructural Information Systems Integration - Data Integration C34. External Infrastructural Information Systems Integration - Network Connectivity C41. Relationship with customers C42. Relationship with suppliers
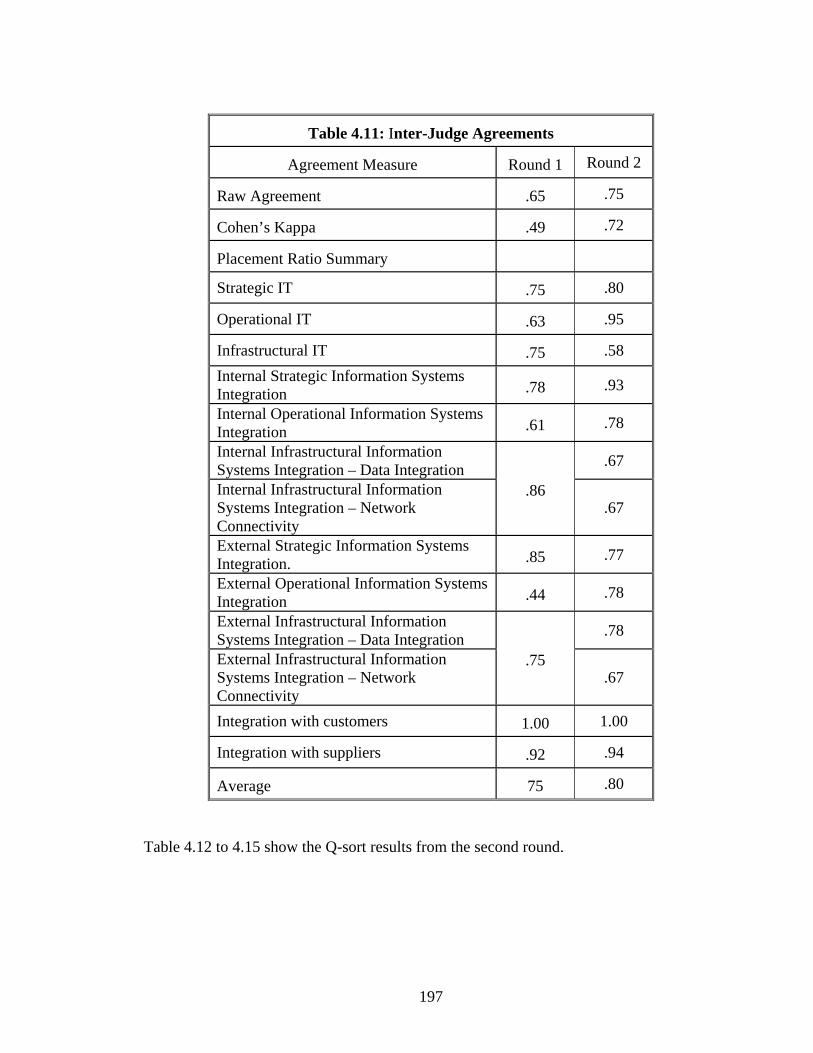
197
Table 4.11: Inter-Judge Agreements
Agreement Measure
Round 1 Round 2
Raw Agreement
.65 .75
Cohen’s Kappa
.49 .72
Placement Ratio Summary
Strategic IT
.75 .80
Operational IT
.63 .95
Infrastructural IT
.75 .58 Internal Strategic Information Systems Integration
.78 .93
Internal Operational Information Systems Integration
.61 .78
Internal Infrastructural Information Systems Integration – Data Integration .67
Internal Infrastructural Information Systems Integration – Network Connectivity
.86
.67
External Strategic Information Systems Integration.
.85 .77
External Operational Information Systems Integration
.44 .78
External Infrastructural Information Systems Integration – Data Integration .78
External Infrastructural Information Systems Integration – Network Connectivity
.75
.67
Integration with customers
1.00 1.00
Integration with suppliers
.92 .94 Average
75 .80
Table 4.12 to 4.15 show the Q-sort results from the second round.

198
Three misplaces Two misplaces One misplace No misplace
Section 1: Information Technology Utilization The following situations describe the extent to which the manufacturing department uses information technology (IT) for strategic, operational, and infrastructural purposes. Please circle the appropriate number to indicate the extent to which you agree or disagree with each statement as applicable to your unit.
Long-term technology justification and planning Budget justification and planning Investment justification and planning Long-term capacity planning Long-term manufacturing processes identification (continuous, job shop, batch, and line) Long-term project planning Project feasibility analysis Competitor analysis Customer analysis Industry analysis Daily production control Daily product and service quality control Daily inventory management Daily material requirement planning Daily warehouse management Daily customer relationship management Daily supplier relationship management Daily products distribution management Daily product movement planning Daily warehouse/space management File sharing Data communication Plant layout management and control Technology education services (e.g. training) Multi-media operations and development (e.g. CAD, CAM, Robots) Facility infrastructure design
Table 4.12: IT Utilization Construct

199
Section 2: Information Systems Integration - Internal The following statements describe the extent to which the manufacturing department collaborates with other business functions by using information technology (IT). Please circle the appropriate number to indicate the extent to which you agree or disagree with each statement as applicable to your unit.
Formulate long-term collaborative decision making Justify long-term business plans Analyze the effectiveness of long-term business plans Develop new business opportunities Identify new markets Identify long-term technology justification and planning Study competitors Define long-term competitive positioning Set long-term strategic goals Adjust daily manufacturing processes Identify product development processes Develop daily product designs Manage daily order information Exchange daily inventory information Select suppliers Manage daily logistical activities Establish daily product forecasts Share daily functional knowledge Use standard data definitions and codes Use standard data presentation format Use centralized databases (e.g. Oracle) Use database synchronization systems (e.g. Palm) Use enterprise-wide IS applications (e.g. Outlook, Lotus Note, SAP) Reduce data (information) redundancy Use IS networks to communicate with each other Use IS networks to share information with each other Use IS networks to connect to centralized databases Use IS networks to facilitate periodic interdepartmental meetings Use compatible network architectures
Table 4.13: Internal Information Systems Integration
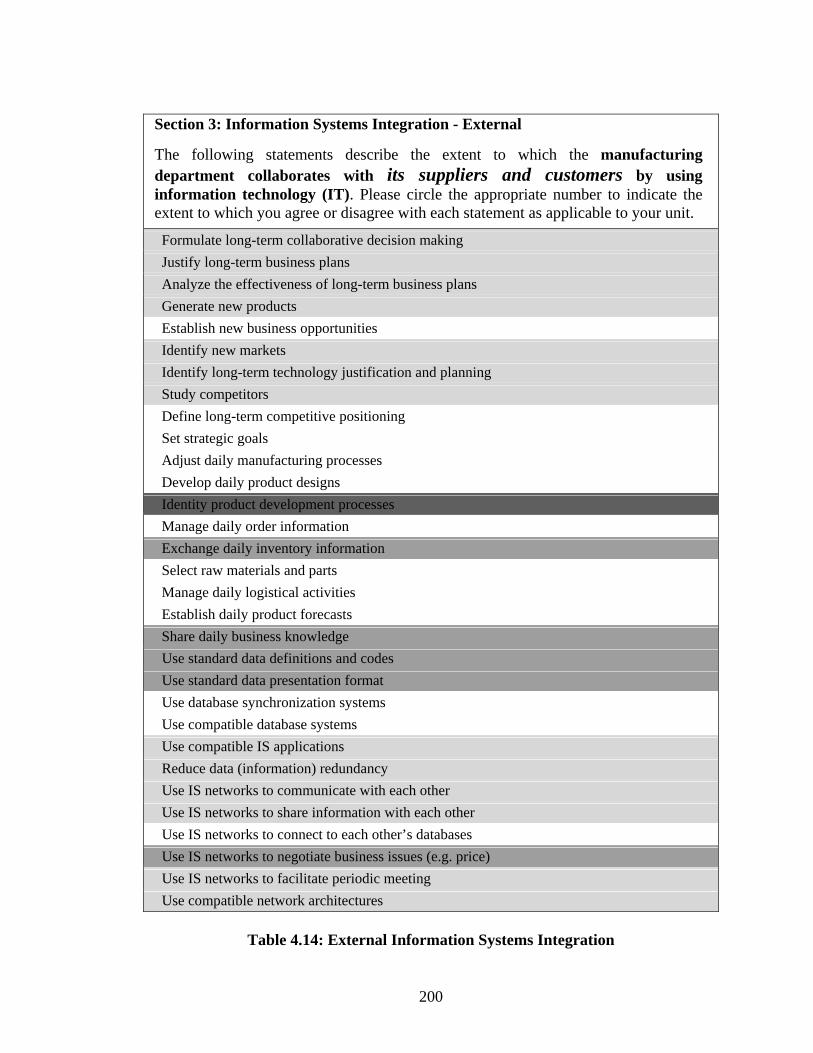
200
Section 3: Information Systems Integration - External The following statements describe the extent to which the manufacturing department collaborates with its suppliers and customers by using information technology (IT). Please circle the appropriate number to indicate the extent to which you agree or disagree with each statement as applicable to your unit.
Formulate long-term collaborative decision making Justify long-term business plans Analyze the effectiveness of long-term business plans Generate new products Establish new business opportunities Identify new markets Identify long-term technology justification and planning Study competitors Define long-term competitive positioning Set strategic goals Adjust daily manufacturing processes Develop daily product designs Identity product development processes Manage daily order information Exchange daily inventory information Select raw materials and parts Manage daily logistical activities Establish daily product forecasts Share daily business knowledge Use standard data definitions and codes Use standard data presentation format Use database synchronization systems Use compatible database systems Use compatible IS applications Reduce data (information) redundancy Use IS networks to communicate with each other Use IS networks to share information with each other Use IS networks to connect to each other’s databases Use IS networks to negotiate business issues (e.g. price) Use IS networks to facilitate periodic meeting Use compatible network architectures
Table 4.14: External Information Systems Integration

201
Table 4.15: Relationship with Customers and Suppliers
Section 4: Relationship with Customers and Suppliers The following statements describe the extent to which the manufacturing department interacts with its customers and suppliers. Please circle the appropriate number to indicate the extent to which you agree or disagree with each statement as applicable to your unit.
The willingness of customers to share their market demand The participation level of customers in product development processes The participation level of customers in finished goods distribution processes The level of customer involvement in preparing business plans The extent of follow-up with customers for feedbacks The participation level of customers in manufacturing processes The participation level of suppliers in manufacturing processes The participation level of suppliers in production planning processes The participation level of suppliers in product development processes The participation level of suppliers in logistics processes The level of cross-over of activities between our firm and our suppliers The level of supplier involvement in preparing our business plans

202
Q-Sort Results for the Third Sorting Round
Table 4.16: Inter-judge Raw Agreement Scores: Third Sorting Round
Judge 1
C11 C12 C13 C21 C22 C23 C24 C31 C32 C33 C34 C41 C42 NA
C11 7
C12 11
C13 2 6
C21 9
C22 8
C23 5 3
C24 4
C31 9
C32 7 1
C33 6 1
C34 2 3
C41 6
C42 6
J u d g e 2
NA 0
Total items placement: 96 Number of Agreement: 87 Agreement Ratio: 0.91
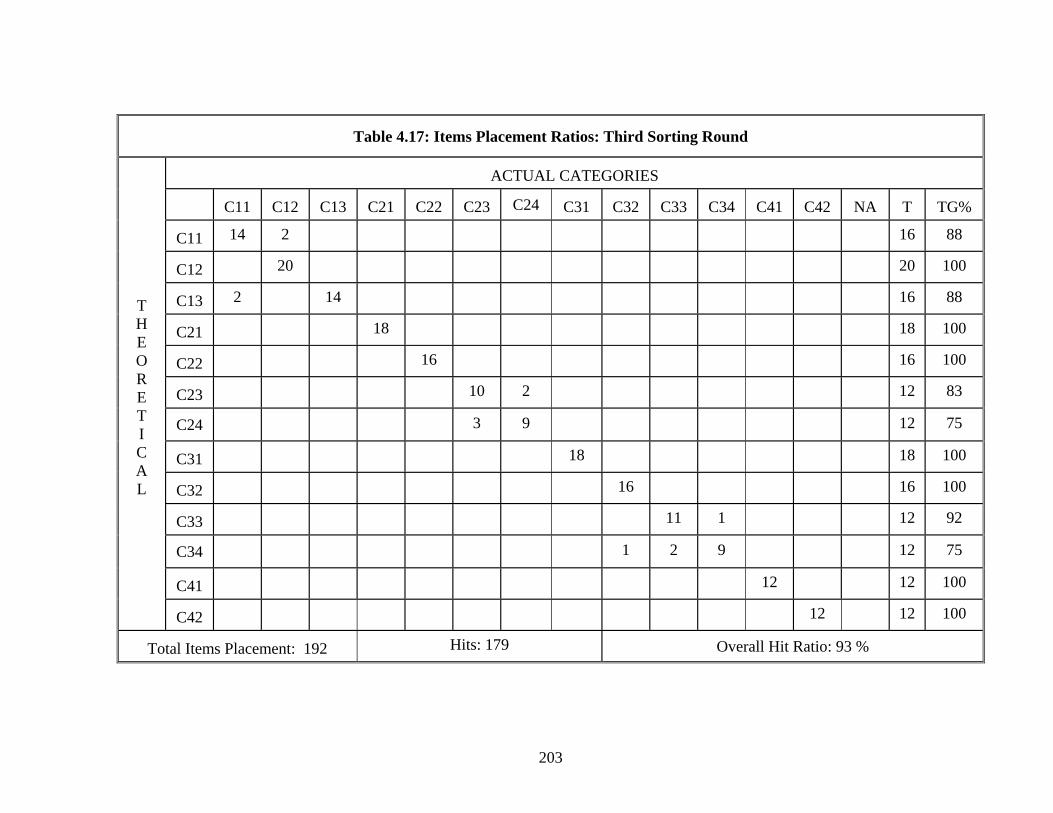
203
Table 4.17: Items Placement Ratios: Third Sorting Round
ACTUAL CATEGORIES
C11
C12
C13
C21
C22
C23 C24
C31
C32
C33
C34
C41
C42
NA
T
TG%
C11 14 2 16 88
C12 20 20 100
C13 2 14 16 88
C21 18 18 100
C22 16 16 100
C23 10 2 12 83
C24 3 9 12 75
C31 18 18 100
C32 16 16 100
C33 11 1 12 92
C34 1 2 9 12 75
C41 12 12 100
T H E O R E T I C A L
C42 12 12 100
Total Items Placement: 192 Hits: 179 Overall Hit Ratio: 93 %

204
C11. Strategic IT C12. Operational IT C13. Infrastructural IT C21. Internal Strategic Information Systems Integration C22. Internal Operational Information Systems Integration C23. Internal Infrastructural Information Systems Integration - Data Integration C24. Internal Infrastructural Information Systems Integration - Network Connectivity C31. External Strategic Information Systems Integration C32. External Operational Information Systems Integration C33. External Infrastructural Information Systems Integration - Data Integration C34. External Infrastructural Information Systems Integration - Network Connectivity C41. Relationship with customers C42. Relationship with suppliers

205
Table 4.18: Inter-Judge Agreements
Agreement Measure
Round 1 Round 2 Round 3
Raw Agreement
.65 .75 .91
Cohen’s Kappa
.49 .72 .90
Placement Ratio Summary
Strategic IT
.75 .80 .88
Operational IT
.63 .95 1.00
Infrastructural IT
.75 .58 .88 Internal Strategic Information Systems Integration
.78 .93 1.00
Internal Operational Information Systems Integration
.61 .78 1.00
Internal Infrastructural Information Systems Integration – Data Integration .67 .83
Internal Infrastructural Information Systems Integration – Network Connectivity
.86
.67 .75
External Strategic Information Systems Integration.
.85 .77 1.00
External Operational Information Systems Integration
.44 .78 1.00
External Infrastructural Information Systems Integration – Data Integration .78 .92
External Infrastructural Information Systems Integration – Network Connectivity
.75
.67 .75
Integration with customers
1.00 1.00 1.00
Integration with suppliers
.92 .94 1.00 Average
75 .80 .93

206
The Cohen’s Kappa coefficient can also be calculated using this web-site
http://www.kokemus.kokugo.juen.ac.jp/service/kappa-e.html. The web-site shows the
same results as calculated manually. Figure 4.3 shows the web-site inputs and Figure 4.4
shows the results.
Figure 4.3: Web-site to Calculate Cohen’s Kappa Coefficient

207
Figure 4.4: The Result of Computing Cohen's Kappa 2004/06/17 04:43 JST
Matrix: 12 x 12 Data : 98
c11 c12 c13 c21 c22 c23 c31 c32 c33 c41 c42 NA SUM
c11 7 1 0 0 0 0 0 0 0 0 0 0 8
c12 5 5 1 0 0 0 0 0 0 0 0 0 11
c13 0 1 6 0 0 0 0 0 0 0 0 0 7
c21 0 0 0 7 0 1 0 0 0 0 0 0 8
c22 0 0 0 4 4 3 0 0 0 0 0 0 11
c23 0 0 0 0 1 8 0 0 0 0 0 0 9
c31 0 0 0 0 0 0 9 2 1 0 0 0 12
c32 0 0 0 0 0 0 7 1 3 0 0 0 11
c33 0 0 0 0 0 0 0 0 6 0 0 0 6
c41 0 0 0 0 0 0 0 0 0 6 1 0 7
c42 0 0 0 0 0 0 0 0 0 0 5 0 5
NA 0 0 0 0 1 0 0 0 2 0 0 0 3
SUM 12 7 7 11 6 12 16 3 12 6 6 0 98 Kappa : 0.619243515026854 Po : 0.653061224489796 Pc : 0.088817159516868 Se : 0.052769721182628 Sk : 0.0310759818011669 Z : 19.9267562643379
Kappa: The value of kappa (Cohen's kappa). Po : The proportion of agreement observed. (composite) Pc : The proportion of agreement expected due to chance. (composite) Se : The standard error of data. Sk : The standard error for kappa. Z : The associated score (kappa divided by its standard error).

208
APPENDIX C: THE FINAL VERSION OF QUESTIONNAIRE
Section 1: Information Technology Utilization
The following situations describe the extent to which the manufacturing department uses information technology (IT) for strategic, operational, and infrastructural purposes. Please circle the appropriate number to indicate the extent to which you agree or disagree with each statement as applicable to your unit. St
rong
ly D
isag
ree
Dis
agre
e
Neu
tral
Agr
ee
Stro
ngly
Agr
ee
Not
App
licab
le, o
r D
o N
ot K
now
In our manufacturing department, we use IT for… Long-term technology justification and planning 1 2 3 4 5 NA
Budget justification and planning 1 2 3 4 5 NA Investment justification and planning 1 2 3 4 5 NA Long-term capacity planning 1 2 3 4 5 NA Long-term project planning 1 2 3 4 5 NA Project feasibility analysis 1 2 3 4 5 NA Competitor analysis 1 2 3 4 5 NA Industry analysis 1 2 3 4 5 NA Daily production control 1 2 3 4 5 NA Daily product quality control 1 2 3 4 5 NA Daily products distribution management 1 2 3 4 5 NA Daily product movement planning 1 2 3 4 5 NA Daily customer analysis 1 2 3 4 5 NA Daily customer relationship management 1 2 3 4 5 NA Daily supplier relationship management 1 2 3 4 5 NA Daily inventory management 1 2 3 4 5 NA Daily material requirement planning 1 2 3 4 5 NA Daily warehouse/space management 1 2 3 4 5 NA Technology services and training 1 2 3 4 5 NA Setting up file sharing facilities (e.g., network cable, telephone line, wireless network) 1 2 3 4 5 NA Setting up data communication facilities (e.g., server, LAN, routers, disk/drive, network computers) 1 2 3 4 5 NA Plant layout management and control (e.g., locations of machines/tools, line configuration, safety staircase) 1 2 3 4 5 NA Floor plan management (e.g., material flow in/out plans, space management) 1 2 3 4 5 NA Setting up advanced manufacturing technology (e.g., CAD/CAM, Robots, EDI) 1 2 3 4 5 NA Setting up security services (e.g., control room, video camera, automatic door, intercom) 1 2 3 4 5 NA Setting up information disaster recovery system (e.g., disk redundancy, backup facility) 1 2 3 4 5 NA
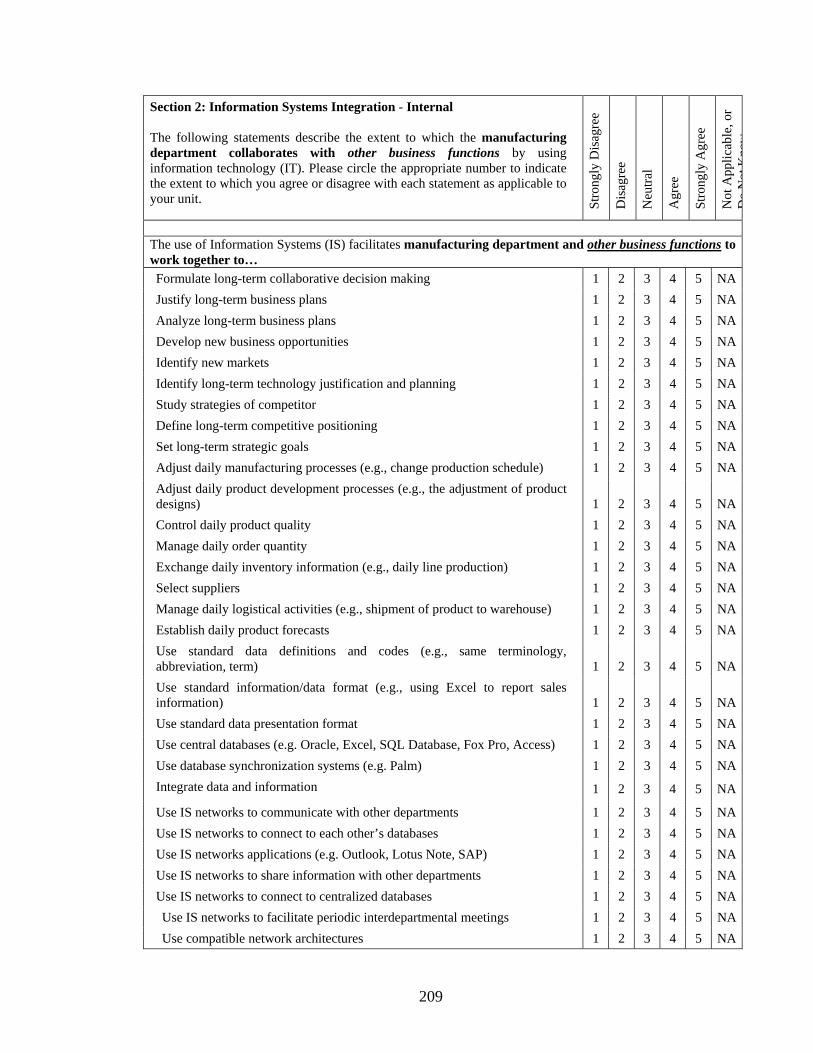
209
Section 2: Information Systems Integration - Internal The following statements describe the extent to which the manufacturing department collaborates with other business functions by using information technology (IT). Please circle the appropriate number to indicate the extent to which you agree or disagree with each statement as applicable to your unit. St
rong
ly D
isag
ree
Dis
agre
e
Neu
tral
Agr
ee
Stro
ngly
Agr
ee
Not
App
licab
le, o
r D
oN
otK
now
The use of Information Systems (IS) facilitates manufacturing department and other business functions to work together to… Formulate long-term collaborative decision making 1 2 3 4 5 NAJustify long-term business plans 1 2 3 4 5 NAAnalyze long-term business plans 1 2 3 4 5 NADevelop new business opportunities 1 2 3 4 5 NAIdentify new markets 1 2 3 4 5 NAIdentify long-term technology justification and planning 1 2 3 4 5 NAStudy strategies of competitor 1 2 3 4 5 NADefine long-term competitive positioning 1 2 3 4 5 NASet long-term strategic goals 1 2 3 4 5 NAAdjust daily manufacturing processes (e.g., change production schedule) 1 2 3 4 5 NAAdjust daily product development processes (e.g., the adjustment of product designs) 1 2 3 4 5 NAControl daily product quality 1 2 3 4 5 NAManage daily order quantity 1 2 3 4 5 NAExchange daily inventory information (e.g., daily line production) 1 2 3 4 5 NASelect suppliers 1 2 3 4 5 NAManage daily logistical activities (e.g., shipment of product to warehouse) 1 2 3 4 5 NAEstablish daily product forecasts 1 2 3 4 5 NAUse standard data definitions and codes (e.g., same terminology, abbreviation, term) 1 2 3 4 5 NAUse standard information/data format (e.g., using Excel to report sales information) 1 2 3 4 5 NAUse standard data presentation format 1 2 3 4 5 NAUse central databases (e.g. Oracle, Excel, SQL Database, Fox Pro, Access) 1 2 3 4 5 NAUse database synchronization systems (e.g. Palm) 1 2 3 4 5 NAIntegrate data and information 1 2 3 4 5 NA
Use IS networks to communicate with other departments 1 2 3 4 5 NAUse IS networks to connect to each other’s databases 1 2 3 4 5 NAUse IS networks applications (e.g. Outlook, Lotus Note, SAP) 1 2 3 4 5 NAUse IS networks to share information with other departments 1 2 3 4 5 NAUse IS networks to connect to centralized databases 1 2 3 4 5 NAUse IS networks to facilitate periodic interdepartmental meetings 1 2 3 4 5 NAUse compatible network architectures 1 2 3 4 5 NA

210
Section 3: Information Systems Integration - External The following statements describe the extent to which the manufacturing department collaborates with its suppliers and customers by using information technology (IT). Please circle the appropriate number to indicate the extent to which you agree or disagree with each statement as applicable to your unit. St
rong
ly D
isag
ree
Dis
agre
e
Neu
tral
Agr
ee
Stro
ngly
Agr
ee
Not
App
licab
le,
or D
o N
ot K
now
The use of Information Systems (IS) facilitates manufacturing department and its suppliers and customers to work together to…
Formulate long-term collaborative decision making 1 2 3 4 5 NA Justify long-term business plans 1 2 3 4 5 NA Analyze long-term business plans 1 2 3 4 5 NA Develop new business opportunities 1 2 3 4 5 NA Identify new markets 1 2 3 4 5 NA Identify long-term technology justification and planning 1 2 3 4 5 NA Study strategies of competitors 1 2 3 4 5 NA Define long-term competitive positioning 1 2 3 4 5 NA Set long-term strategic goals 1 2 3 4 5 NA Adjust daily manufacturing processes (e.g., changing production schedule) 1 2 3 4 5 NA Adjust daily product development processes (e.g., the adjustment of product designs) 1 2 3 4 5 NA
Control daily product quality 1 2 3 4 5 NA Manage daily order quantity 1 2 3 4 5 NA Exchange daily inventory information (e.g., daily line production) 1 2 3 4 5 NA
Select raw materials and parts 1 2 3 4 5 NA Manage daily logistical activities (e.g., shipment of product) 1 2 3 4 5 NA Establish daily product forecasts 1 2 3 4 5 NA Use standard data definitions and codes (e.g., same terminology, abbreviation, term) 1 2 3 4 5 NA
Use standard information/data format (e.g., using Excel to report sales information) 1 2 3 4 5 NA
Use standard data presentation format 1 2 3 4 5 NA Use central databases (e.g., Oracle, Excel, SQL Database, Access, Fox Pro) 1 2 3 4 5 NA Use database synchronization systems (e.g., Palm) 1 2 3 4 5 NA Use compatible database systems 1 2 3 4 5 NA Use IS networks to communicate with each other 1 2 3 4 5 NA Use IS networks to connect to each other’s databases 1 2 3 4 5 NA Use IS networks applications (e.g., Outlook, Lotus Note, SAP) 1 2 3 4 5 NA Use IS networks to share information with each other 1 2 3 4 5 NA Use IS networks to facilitate periodic meeting 1 2 3 4 5 NA Use compatible network architectures 1 2 3 4 5 NA

211
APPENDIX D
COVER LETTER October 10, 2005 XXX YYYYY ZZZZZZZ 1239 Portsmouth Drive Howell, MI 48843 Dear XXX: My name is Thawatchai Jitpaiboon. I am an Assistant Professor from the Miller College of Business, Department of Information Systems and Operations Management at Ball State University. This survey research is a partial fulfillment of requirements for the Doctor of Philosophy degree in Manufacturing Management from the University of Toledo. The purpose of the study is to examine the important roles of Information Technology (IT) in enhancing Supply Chain Integration for the manufacturing industry. This study provides guidelines to better implement and utilize technology, improve operational decision making processes, and enhance firm performance. The results from this study will be published in respected journals dedicated to manufacturing management, supply chain management, and operations management, which can be educational and useful for the manufacturing community. I appreciate your valuable time to finish this questionnaire and return it using the enclosed pre-paid envelope by November 25, 2004. If you would like to complete this questionnaire online (more secure and speedy), you can do so by logging on to our secured web-site at http://tjitpaiboon.iweb.bsu.edu/. Your username is “XXX” and your password is “bsu12017”. In addition, as a token of our appreciation for your help, you can request the summary average of your firm’s results compared to the industry, which will be sent to you free of charge. Your confidentiality and anonymity are assured. Again, please help us improve our manufacturing industry by expressing yourself in this questionnaire. Thank you for your cooperation. A business-reply envelope is enclosed for your use. Sincerely,
Thawatchai Jitpaiboon Assistant Professor Department of Information Systems and Operations Management, WB224 Ball State University Phone: 765-285-7048 Fax: 765-285-5308 Email: [email protected]
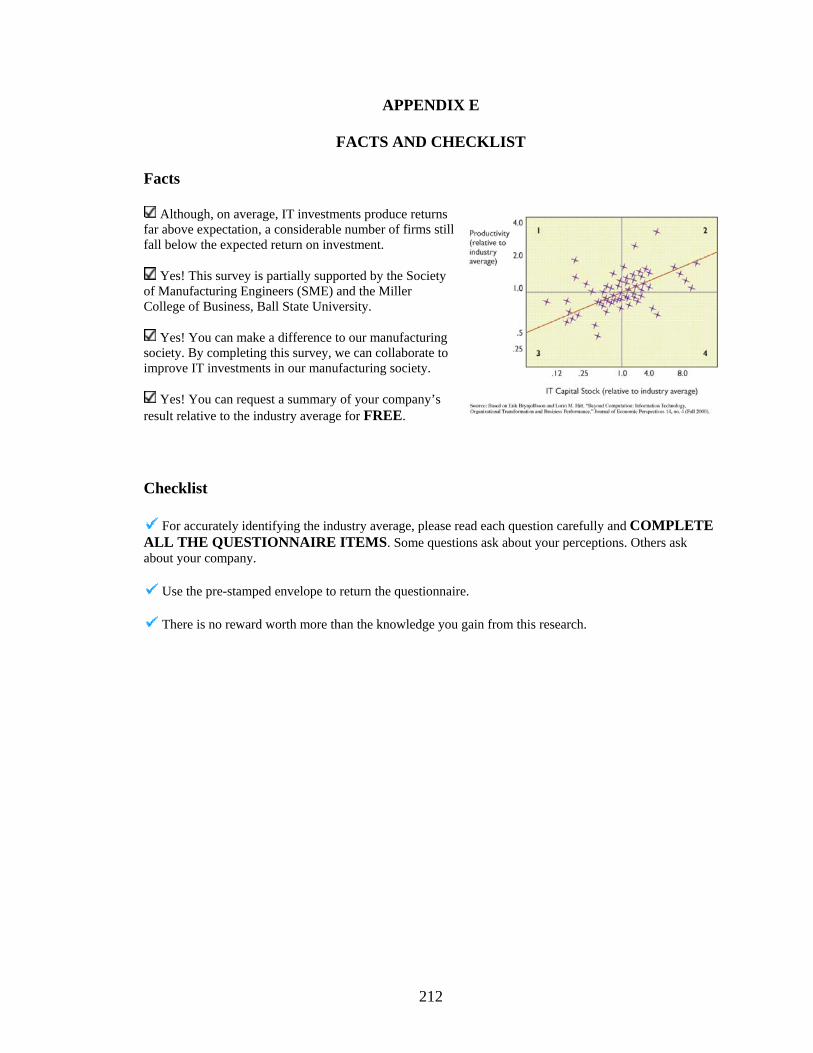
212
APPENDIX E
FACTS AND CHECKLIST Facts
Although, on average, IT investments produce returns far above expectation, a considerable number of firms still fall below the expected return on investment.
Yes! This survey is partially supported by the Society of Manufacturing Engineers (SME) and the Miller College of Business, Ball State University.
Yes! You can make a difference to our manufacturing society. By completing this survey, we can collaborate to improve IT investments in our manufacturing society.
Yes! You can request a summary of your company’s result relative to the industry average for FREE. Checklist
For accurately identifying the industry average, please read each question carefully and COMPLETE ALL THE QUESTIONNAIRE ITEMS. Some questions ask about your perceptions. Others ask about your company.
Use the pre-stamped envelope to return the questionnaire.
There is no reward worth more than the knowledge you gain from this research.

213
APPENDIX F
Manufacturing & Information Technology Survey
Thawatchai Jitpaiboon
Assistant Professor Department of Information Systems and Operations Management
Miller College of Business Ball State University
Muncie, IN 47306 Phone: 765-285-7048
Fax: 765-285-5308 Email: [email protected]
(Please feel free to contact anytime you need further clarification.)
214
GENERAL INSTRUCTIONS
This questionnaire is part of a study underway to document the importance of information technology (IT) in enhancing the integration of manufacturing enterprises. This study examines manufacturing managers’ perception on how their information systems practices contribute to supply chain integration and performance. Such knowledge gaining from this research can help practitioners and researchers to focus on the most important information systems activities which help an organization to improve its competitive position. The questionnaire is divided into nine sections. Each question requires that you choose the alternative that best fits your views on that topic. We estimate that it should take you about 20 to 30 minutes to complete this questionnaire. There are no right or wrong answers. We are interested only in your opinions. The information provided by you will be treated in the strictest confidence. Your responses will be entered in a coded format and in no instance will a person ever be identified as having given a particular response. Thank you for your cooperation. We believe that, with your assistance, this study can help clarify a number of information systems issues in manufacturing that have only been addressed so far in theory. Please seal your completed questionnaire in the enclosed envelope and return it the address provided below. Thank you very much for your help.
Thawatchai Jitpaiboon Assistant Professor Department of Information Systems and Operations Management Miller College of Business Ball State University Muncie, IN 47306 Phone: 765-285-7048 Fax: 765-285-5308 Email: [email protected]

215
Section 1: Information Technology Utilization The following situations describe the extent to which the manufacturing department uses information technology (IT) for strategic, operational, and infrastructural purposes. Please circle the appropriate number to indicate the extent to which you agree or disagree with each statement as applicable to your unit. In our manufacturing department, we use IT for… St
rong
ly D
isag
ree
Dis
agre
e
Neu
tral
Agr
ee
Stro
ngly
Agr
ee
Not
App
licab
le, o
r D
o N
ot K
now
Long-term technology justification and planning……………………..……………… 1 2 3 4 5 NA
Budget justification and planning……………………………………………………… 1 2 3 4 5 NA
Investment justification and planning………………………………………………… 1 2 3 4 5 NA Long-term capacity planning………………………………………………………… 1 2 3 4 5 NA Long-term project planning…………………………..……………………………….. 1 2 3 4 5 NA Project feasibility analysis..…………………………………………………………….. 1 2 3 4 5 NA Competitor analysis……................................................................................................... 1 2 3 4 5 NA Industry analysis……………………………………………………………………….. 1 2 3 4 5 NA Daily production control….............................................................................................. 1 2 3 4 5 NA Daily product quality control……………………………………………..……….…… 1 2 3 4 5 NA Daily products distribution management…..………………………………………….. 1 2 3 4 5 NA Daily product movement planning………………..…………….………...…………… 1 2 3 4 5 NA Daily customer analysis…………..…………………………………………………… 1 2 3 4 5 NA Daily customer relationship management…..................................................................... 1 2 3 4 5 NA Daily supplier relationship management………………………………….…………… 1 2 3 4 5 NA Daily inventory management………………………………………………………….. 1 2 3 4 5 NA Daily material requirement planning…………………………….………….…………. 1 2 3 4 5 NA Daily warehouse/space management….………………………………………………. 1 2 3 4 5 NA Technology services and training…………….……………………………………….. 1 2 3 4 5 NA Setting up file sharing facilities (e.g., network cable, telephone line, wireless network). 1 2 3 4 5 NA Setting up data communication facilities (e.g., server, LAN, routers, disk/drive, network computers)…………………………………………………………….………. 1 2 3 4 5 NA Plant layout management and control (e.g., locations of machines/tools, line configuration, safety staircase)…………………………………………………………. 1 2 3 4 5 NA Floor plan management (e.g., material flow in/out plans, space management)................ 1 2 3 4 5 NA Setting up advanced manufacturing technology (e.g., CAD/CAM, Robots, EDI)......... 1 2 3 4 5 NA Setting up security services (e.g., control room, video camera, automatic door, intercom)……………………………………………………………………………. 1 2 3 4 5 NA
Setting up information disaster recovery system (e.g., disk redundancy, backup facility)…………………………………………………………………………………. 1 2 3 4 5 NA

216
Section 2: Information Systems Integration - Internal The following statements describe the extent to which the manufacturing department collaborates with other business functions (i.e., Sales, Marketing) by using information technology (IT). Please circle the appropriate number to indicate the extent to which you agree or disagree with each statement as applicable to your unit. The use of Information Systems (IS) facilitates manufacturing department and other internal business functions to work together to… St
rong
ly D
isag
ree
Dis
agre
e
Neu
tral
Agr
ee
Stro
ngly
Agr
ee
Not
App
licab
le, o
r D
o N
ot
Kno
w
Formulate long-term collaborative decision making…………………………..….....…… 1 2 3 4 5 NA Justify long-term business plans…..……………....…………….………………………… 1 2 3 4 5 NA Analyze long-term business plans…..…………….……………………………………… 1 2 3 4 5 NA Develop long-term business opportunities.....…….…………………………….……….. 1 2 3 4 5 NA Identify new markets……...…………………………………………………………….. 1 2 3 4 5 NA Identify long-term technology justification and planning……………………………….. 1 2 3 4 5 NA Study strategies of competitors……………………….…………………………………… 1 2 3 4 5 NA Define long-term competitive positioning...……………………………………………… 1 2 3 4 5 NA Set long-term strategic goals……...………..………………………..…………………… 1 2 3 4 5 NA Adjust daily manufacturing processes (e.g., changing production schedule)...….……… 1 2 3 4 5 NA Adjust daily product development processes (e.g., adjusting product designs)………… 1 2 3 4 5 NA Control daily product quality………... ………..….…………………………………...... 1 2 3 4 5 NA Manage daily order quantity…………………….……………...………………………… 1 2 3 4 5 NA Exchange daily inventory information (e.g., daily line production)....………..….………. 1 2 3 4 5 NA Select suppliers………..…..……………………….…………………….…………..…… 1 2 3 4 5 NA
Manage daily logistical activities (e.g., shipping products to warehouse)……………… 1 2 3 4 5 NA Establish daily product forecasts.……………………..……………….…………..……… 1 2 3 4 5 NA Use standard data definitions and codes (e.g., same terminology, abbreviation, jargon)... 1 2 3 4 5 NA Use standard information/data format (e.g., using Excel to report sales information)…… 1 2 3 4 5 NA Use standard data presentation format………………………………………….……….. 1 2 3 4 5 NA Use centralized databases (e.g. Oracle, Excel, SQL Database, Fox Pro, Access)……… 1 2 3 4 5 NA Use database synchronization systems (e.g. Palm)………………………………...….… 1 2 3 4 5 NA Integrate data and information………………………………..………………...………… 1 2 3 4 5 NA Use IS networks to communicate with other departments...………………………..…… 1 2 3 4 5 NA Use IS networks to connect to each other’s databases… …………………………...…… 1 2 3 4 5 NA Use IS networks applications (e.g. Outlook, Lotus Note, SAP)……………...…..……… 1 2 3 4 5 NA Use IS networks to share information with other departments………………….……...… 1 2 3 4 5 NA Use IS networks to connect to centralized databases…………..……………….………. 1 2 3 4 5 NA Use IS networks to facilitate periodic interdepartmental meetings……….……………... 1 2 3 4 5 NA Use compatible network architectures………………………..………………………..… 1 2 3 4 5 NA

217
Section 3: Information Systems Integration - External The following statements describe the extent to which the manufacturing department collaborates with its suppliers and customers by using information technology (IT). Please circle the appropriate number to indicate the extent to which you agree or disagree with each statement as applicable to your unit. The use of Information Systems (IS) facilitates manufacturing department and its suppliers and customers to work together to…
Stro
ngly
Dis
agre
e
Dis
agre
e
Neu
tral
Agr
ee
Stro
ngly
Agr
ee
Not
App
licab
le, o
r
Do
Not
Kno
w
Formulate long-term collaborative decision making…………..………………….….. 1 2 3 4 5 NA Justify long-term business plans …………….…...………..……………….…….….. 1 2 3 4 5 NA Analyze long-term business plans……………………….....……..….…….………… 1 2 3 4 5 NA Develop new business opportunities.…………………..……………………………… 1 2 3 4 5 NA Identify new markets….………………..…..…………..……………………………… 1 2 3 4 5 NA Identify long-term technology justification and planning.……………………………. 1 2 3 4 5 NA Study strategies of competitors…...…………………………………………………… 1 2 3 4 5 NA Define long-term competitive positioning……...………….……………….…………. 1 2 3 4 5 NA Set long-term strategic goals….……..………….…………………………………...… 1 2 3 4 5 NA Adjust daily manufacturing processes (e.g., changing production schedule)…………. 1 2 3 4 5 NA
Adjust daily product development processes (e.g., adjusting product designs)……... 1 2 3 4 5 NA
Control daily product quality…………..…….…………………………….………… 1 2 3 4 5 NA Manage daily order quantity….…………………….………………………………… 1 2 3 4 5 NA Exchange daily inventory information (e.g., daily line production)..…………………. 1 2 3 4 5 NA Select raw materials and parts…...…………………………..……………………….. 1 2 3 4 5 NA Manage daily logistical activities (e.g., shipping products)..…….….………………. 1 2 3 4 5 NA Establish daily product forecasts………………….………………………………….. 1 2 3 4 5 NA Use standard data definitions and codes (e.g., same terminology, abbreviation, jargon)………………………………………………………………………………… 1 2 3 4 5 NA
Use standard information/data format (e.g., using Excel to report sales information)…………………………………………………………………….. 1 2 3 4 5 NA
Use standard data presentation format……………………………...…………..……. 1 2 3 4 5 NA Use central databases (e.g., Oracle, Excel, SQL Database, Access, Fox Pro)………… 1 2 3 4 5 NA Use database synchronization systems (e.g., Palm)…………..………………………. 1 2 3 4 5 NA Use compatible database systems……………………….……………….…………….. 1 2 3 4 5 NA Use IS networks to communicate with each other.. ………………………………… 1 2 3 4 5 NA Use IS networks to connect to each other’s databases… …………………………….. 1 2 3 4 5 NA Use IS networks applications (e.g., Outlook, Lotus Note, SAP)…………………….. 1 2 3 4 5 NA Use IS networks to share information with each other……………..………………..... 1 2 3 4 5 NA Use IS networks to facilitate periodic meeting…….……………………...………… 1 2 3 4 5 NA Use compatible network architectures…………………………………...……..…… 1 2 3 4 5 NA

218
Section 4: Relationship with Customers and Suppliers The following statements describe the extent to which the manufacturing department interacts with its customers and suppliers. Please circle the appropriate number to indicate the extent to which you agree or disagree with each statement as applicable to your unit. V
ery
Low
Low
Mod
erat
e
Hig
h
Ver
y H
igh
Not
App
licab
le, o
r D
o N
ot K
now
The willingness of customers to share their market demands..……………………..…… 1 2 3 4 5 NA The participation level of customers in product development processes............................. 1 2 3 4 5 NA The participation level of customers in finished goods distribution processes……….… 1 2 3 4 5 NA The level of customer involvement in preparing business plans………………………… 1 2 3 4 5 NA The extent of follow-up with customers for feedbacks………..………………………… 1 2 3 4 5 NA The participation level of customers in manufacturing processes……………………… 1 2 3 4 5 NA The participation level of suppliers in manufacturing processes………………………… 1 2 3 4 5 NA The participation level of suppliers in production planning processes..………………… 1 2 3 4 5 NA The participation level of suppliers in product development processes.............................. 1 2 3 4 5 NA The participation level of suppliers in logistics processes………………..………...…… 1 2 3 4 5 NA The level of cross-over of activities between our firm and our suppliers………………… 1 2 3 4 5 NA The level of supplier involvement in preparing our business plans……………………… 1 2 3 4 5 NA
Section 5: Mass Customization Capability The following statements measure firm’s capability to customize products inexpensively and quickly. Please circle the appropriate number that best indicates your perception of the relative capabilities of your firm as compared to the industry average. V
ery
Low
Low
Mod
erat
e
Hig
h
Ver
y H
igh
Not
App
licab
le,
or D
o N
ot K
now
Our capability of customizing products at low cost is…………………………………… 1 2 3 4 5 NA Our capability of customizing products on a large scale is……………………………… 1 2 3 4 5 NA Our capability of translating customer requirements into technical designs quickly is… 1 2 3 4 5 NA Our capability of adding product variety without increasing cost is……………………… 1 2 3 4 5 NA Our capability of customizing products while maintaining a large volume is……………. 1 2 3 4 5 NA Our capability of setting up for a different product a low cost is………………..……….. 1 2 3 4 5 NA Our capability of responding to customization requirements quickly is……..…………… 1 2 3 4 5 NA Our capability of adding product variety without sacrificing overall production volume is………………………………………………………………………………………….. 1 2 3 4 5 NA Our capability of changeover to a different product quickly is…………………………… 1 2 3 4 5 NA

219
Section 6: Suppliers’ and Firm’s Operational Performance The following statements describe typical operational performance objectives for firms and their suppliers. Please circle the number that best indicates the level of your suppliers’ and your firm’s attainment of each objective. Please note that left side indicates the level of supplier’s operational performance and right side indicates the level of firm’s operational performance. Please fill in both sides of questionnaire items.
Stro
ngly
Dis
agre
e
Dis
agre
e
Neu
tral
Agr
ee
Stro
ngly
Agr
ee
Not
App
licab
le, o
r D
o N
ot K
now
St
rong
ly D
isag
ree
Dis
agre
e
Neu
tral
Agr
ee
Stro
ngly
Agr
ee
Not
App
licab
le, o
r D
o N
ot K
now
Supplier Performance Dimensions Firm
1 2 3 4 5 NA Deliver materials/components/products as promises 1 2 3 4 5 NA1 2 3 4 5 NA Provide materials/components/products that are highly reliable 1 2 3 4 5 NA1 2 3 4 5 NA Provide fast delivery 1 2 3 4 5 NA1 2 3 4 5 NA Provide on-time delivery 1 2 3 4 5 NA1 2 3 4 5 NA Provide reliable delivery 1 2 3 4 5 NA1 2 3 4 5 NA Decrease manufacturing lead time 1 2 3 4 5 NA1 2 3 4 5 NA Make rapid design changes 1 2 3 4 5 NA1 2 3 4 5 NA Make rapid production volume changes 1 2 3 4 5 NA1 2 3 4 5 NA Make rapid changeover between product lines 1 2 3 4 5 NA1 2 3 4 5 NA Process both large and small orders 1 2 3 4 5 NA1 2 3 4 5 NA Produce a variety of different products 1 2 3 4 5 NA1 2 3 4 5 NA Increase capacity utilization 1 2 3 4 5 NA1 2 3 4 5 NA Produce materials/components/products at low cost 1 2 3 4 5 NA1 2 3 4 5 NA Reduce production cost 1 2 3 4 5 NA1 2 3 4 5 NA Reduce inventory cost 1 2 3 4 5 NA1 2 3 4 5 NA Reduce unit cost 1 2 3 4 5 NA1 2 3 4 5 NA Increase labor productivity 1 2 3 4 5 NA1 2 3 4 5 NA Develop new ways of customer service 1 2 3 4 5 NA1 2 3 4 5 NA Develop new forms of shop floor management 1 2 3 4 5 NA1 2 3 4 5 NA Develop new ways of supply chain management 1 2 3 4 5 NA1 2 3 4 5 NA Develop new products and features 1 2 3 4 5 NA1 2 3 4 5 NA Develop new process technologies 1 2 3 4 5 NA1 2 3 4 5 NA Provide better product performance 1 2 3 4 5 NA1 2 3 4 5 NA Improve product durability 1 2 3 4 5 NA1 2 3 4 5 NA Provide product conformance to specifications 1 2 3 4 5 NA1 2 3 4 5 NA Improve product reliability 1 2 3 4 5 NA1 2 3 4 5 NA Reduce defective rate 1 2 3 4 5 NA1 2 3 4 5 NA Better product reputation 1 2 3 4 5 NA

220
Section 7: Top Management Support for System Integration
With regard to top management support for system integration, please circle the appropriate number that accurately reflects your firm’s PRESENT conditions.
Stro
ngly
Dis
agre
e
Dis
agre
e
Neu
tral
Agr
ee
Stro
ngly
Agr
ee
Not
App
licab
le, o
r D
o N
ot K
now
Top management is interested in our relationship with our trading partners …………… 1 2 3 4 5 NA Top management supports our department with the resources we need ………………… 1 2 3 4 5 NA Top management regards our relationship with trading partners a high priority item …… 1 2 3 4 5 NA Top management participates in integration with our trading partners…………………… 1 2 3 4 5 NA Top management considers the relationship between us and our trading partners to be important……………………………………………………………………………… 1 2 3 4 5 NA Top management encourages open communication with our trading partners…………… 1 2 3 4 5 NA Top management provides enough training on technology used to communicate with our trading partners………………………………………………………………….. 1 2 3 4 5 NA
Section 8: Firm Performance
The following statements measure overall performance of your firm. Please circle the appropriate number that best indicates the level of your firm’s overall performance.
V
ery
Low
Low
Mod
erat
e
Hig
h
Ver
y H
igh
Not
App
licab
le, o
r D
o N
ot K
now
Customer retention rate…………………………………………………………………… 1 2 3 4 5 NA Sales growth……………………………………………………………………………… 1 2 3 4 5 NA Market share growth……………………………………………………………………… 1 2 3 4 5 NA Return on investment…………………………………………………………………… 1 2 3 4 5 NA Profit margin……………………………………………………………………………… 1 2 3 4 5 NA Production throughput time……………………………………………………………… 1 2 3 4 5 NA New product development cycle time…………………………………………………… 1 2 3 4 5 NA Overall competitive position……………………………………………………………… 1 2 3 4 5 NA
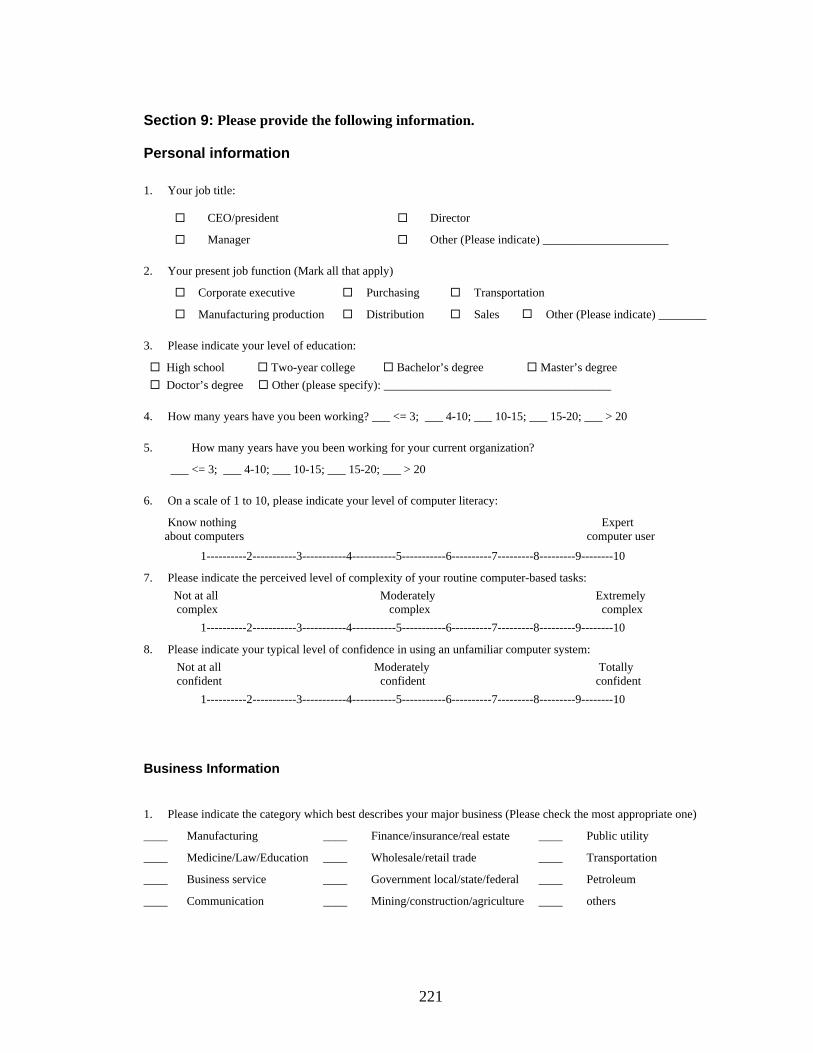
221
Section 9: Please provide the following information.
Personal information 1. Your job title:
CEO/president Director
Manager Other (Please indicate) _____________________
2. Your present job function (Mark all that apply)
Corporate executive Purchasing Transportation
Manufacturing production Distribution Sales Other (Please indicate) ________
3. Please indicate your level of education:
High school Two-year college Bachelor’s degree Master’s degree Doctor’s degree Other (please specify): ______________________________________
4. How many years have you been working? ___ <= 3; ___ 4-10; ___ 10-15; ___ 15-20; ___ > 20
5. How many years have you been working for your current organization?
___ <= 3; ___ 4-10; ___ 10-15; ___ 15-20; ___ > 20
6. On a scale of 1 to 10, please indicate your level of computer literacy:
Know nothing Expert about computers computer user
1----------2-----------3-----------4-----------5-----------6----------7---------8---------9--------10
7. Please indicate the perceived level of complexity of your routine computer-based tasks: Not at all Moderately Extremely complex complex complex
1----------2-----------3-----------4-----------5-----------6----------7---------8---------9--------10
8. Please indicate your typical level of confidence in using an unfamiliar computer system: Not at all Moderately Totally confident confident confident
1----------2-----------3-----------4-----------5-----------6----------7---------8---------9--------10
Business Information
1. Please indicate the category which best describes your major business (Please check the most appropriate one)
____ Manufacturing ____ Finance/insurance/real estate ____ Public utility
____ Medicine/Law/Education ____ Wholesale/retail trade ____ Transportation
____ Business service ____ Government local/state/federal ____ Petroleum
____ Communication ____ Mining/construction/agriculture ____ others
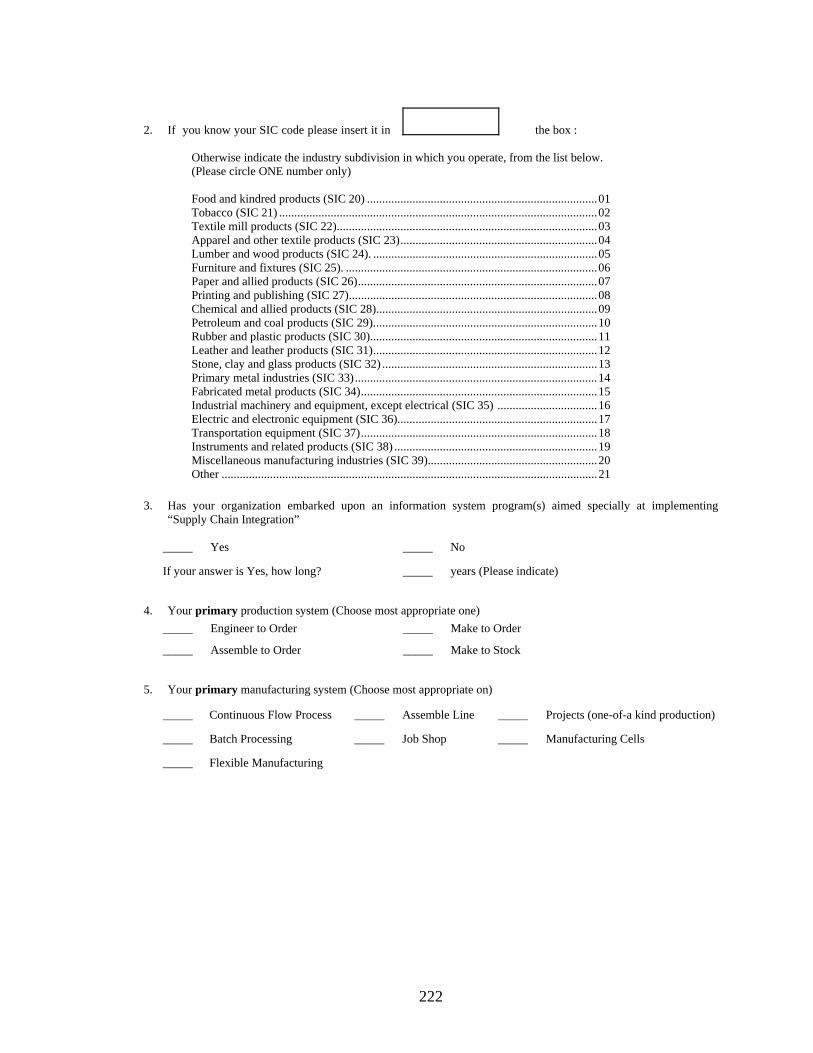
222
2. If you know your SIC code please insert it in the box :
Otherwise indicate the industry subdivision in which you operate, from the list below. (Please circle ONE number only) Food and kindred products (SIC 20) ............................................................................01 Tobacco (SIC 21) .........................................................................................................02 Textile mill products (SIC 22)......................................................................................03 Apparel and other textile products (SIC 23).................................................................04 Lumber and wood products (SIC 24). ..........................................................................05 Furniture and fixtures (SIC 25). ...................................................................................06 Paper and allied products (SIC 26)...............................................................................07 Printing and publishing (SIC 27)..................................................................................08 Chemical and allied products (SIC 28).........................................................................09 Petroleum and coal products (SIC 29)..........................................................................10 Rubber and plastic products (SIC 30)...........................................................................11 Leather and leather products (SIC 31)..........................................................................12 Stone, clay and glass products (SIC 32) .......................................................................13 Primary metal industries (SIC 33)................................................................................14 Fabricated metal products (SIC 34)..............................................................................15 Industrial machinery and equipment, except electrical (SIC 35) .................................16 Electric and electronic equipment (SIC 36)..................................................................17 Transportation equipment (SIC 37)..............................................................................18 Instruments and related products (SIC 38) ...................................................................19 Miscellaneous manufacturing industries (SIC 39)........................................................20 Other ............................................................................................................................21
3. Has your organization embarked upon an information system program(s) aimed specially at implementing
“Supply Chain Integration”
_____ Yes _____ No
If your answer is Yes, how long? _____ years (Please indicate)
4. Your primary production system (Choose most appropriate one)
_____ Engineer to Order _____ Make to Order
_____ Assemble to Order _____ Make to Stock
5. Your primary manufacturing system (Choose most appropriate on)
_____ Continuous Flow Process _____ Assemble Line _____ Projects (one-of-a kind production)
_____ Batch Processing _____ Job Shop _____ Manufacturing Cells
_____ Flexible Manufacturing

223
6. Number of employees in your company: _____ 1 - 50 _____ 51 - 100 _____ 101 – 250 _____ 251 – 500 _____ 501 - 1000 _____ Over 1000
7. Average annual sales of your company in millions of $:
_____ Under 5 _____ 5 to < 10 _____ 10 to < 25 _____ 25 to < 50 _____ 50 to < 100 _____ Over 100
8. Please indicate the position of your company in the supply chain (Mark all that applies).
____ Raw material supplier ____ Component supplier ____ Wholesaler
____ Assembler ____ Sub-assembler ____ Retailer
____ Manufacturer ____ Distributor
9. Please indicate the category that best describe your primary business:
____ Automotive or parts ____ Fabricated metal products ____ Electronics
____ Electrical equipment ____ Furniture and fixtures ____ Appliances
____ Rubber and plastic products ____ Industrial machinery and equipment ____ Others
____ Transportation equipment ____ Instruments and related products
10. Please place check marks against one or more of the following technology applications you are primarily (heavily) using in your work.
E-mail Word processing Spread sheet Database Programming tools Others (please specify) ____________________________________________
11. What percentage of your business transactions with your customers is done electronically? _____ Less than 10% _____ 10-30% _____ 30-50% _____ 50-80% _____ More than 80%
12. What percentage of your business transactions with your suppliers is done electronically?
_____ Less than 10% _____ 10-30% _____ 30-50% _____ 50-80% _____ More than 80%
13. Please indicate the number of tiers across your supply chain? _____ <= 3 _____ 4-5 _____ 6-7 _____ 8-10 _____ > 10
14. What percentage of the computer applications that you are currently working with can be classified under each of the following three categories (Please fill in the percentages against each application so that the percentages add up to 100%): _______% Main Frame Application ______% PC Application _______% Networked Application

224
We totally respect your privacy. Please note that the information you provide below
will be used for academic purposes only.
If you would like to receive the summarized version of your company’s results compared to the industry, please specify the mode of receiving the information.
Hard copy by regular mailing services Download from the internet (login and password)
E-mail with attachment Other (Please indicate) _____________________
Thank you for your cooperation and response.
The author is currently working at Ball State University, the Miller College of Business, as an assistant professor of information systems and operations management.
Please complete the following details or attach your business card: Your name: ________________________________________________ Business Name: ____________________________________________ Title: _____________________________________________________ Address: __________________________________________________ _________________________________________________________ City: ___________________________ State: ____________________ Zip Code: _______________Phone: ___________________________ Fax: _________________ Email: _____________________________

225
APPENDIX G This appendix shows an online version of a survey and its functionality. The web-
based survey starts with the welcome page as shown in the following:
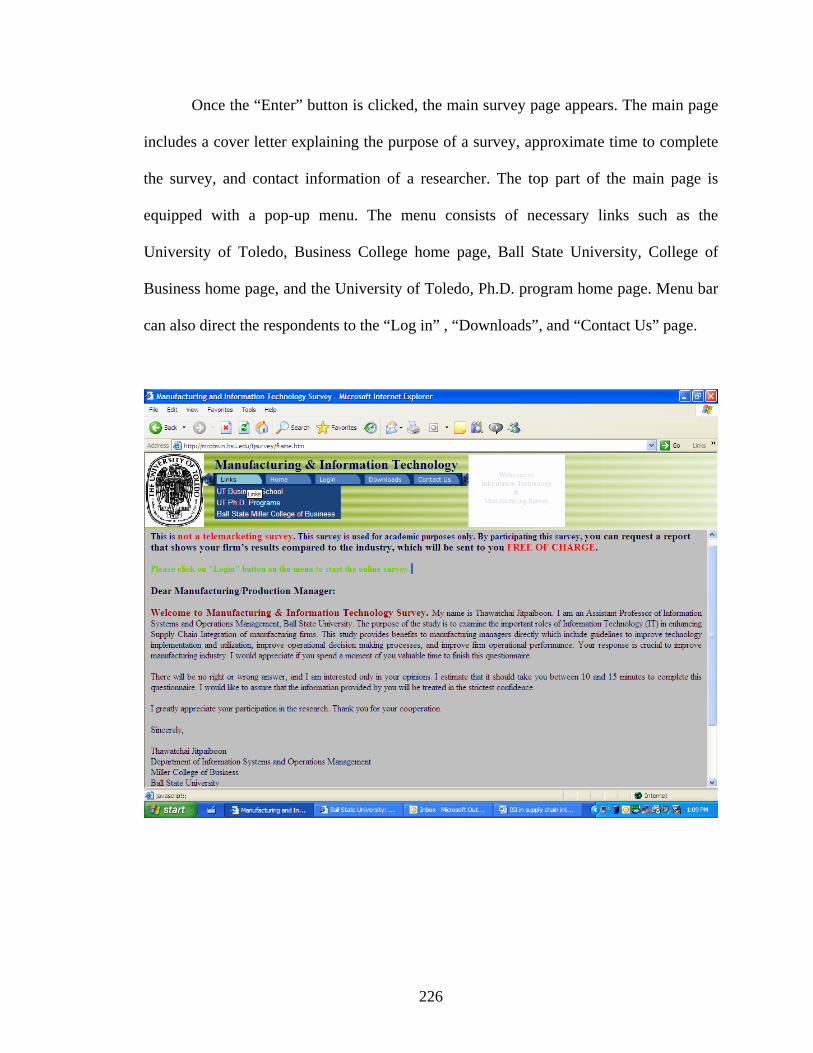
226
Once the “Enter” button is clicked, the main survey page appears. The main page
includes a cover letter explaining the purpose of a survey, approximate time to complete
the survey, and contact information of a researcher. The top part of the main page is
equipped with a pop-up menu. The menu consists of necessary links such as the
University of Toledo, Business College home page, Ball State University, College of
Business home page, and the University of Toledo, Ph.D. program home page. Menu bar
can also direct the respondents to the “Log in” , “Downloads”, and “Contact Us” page.
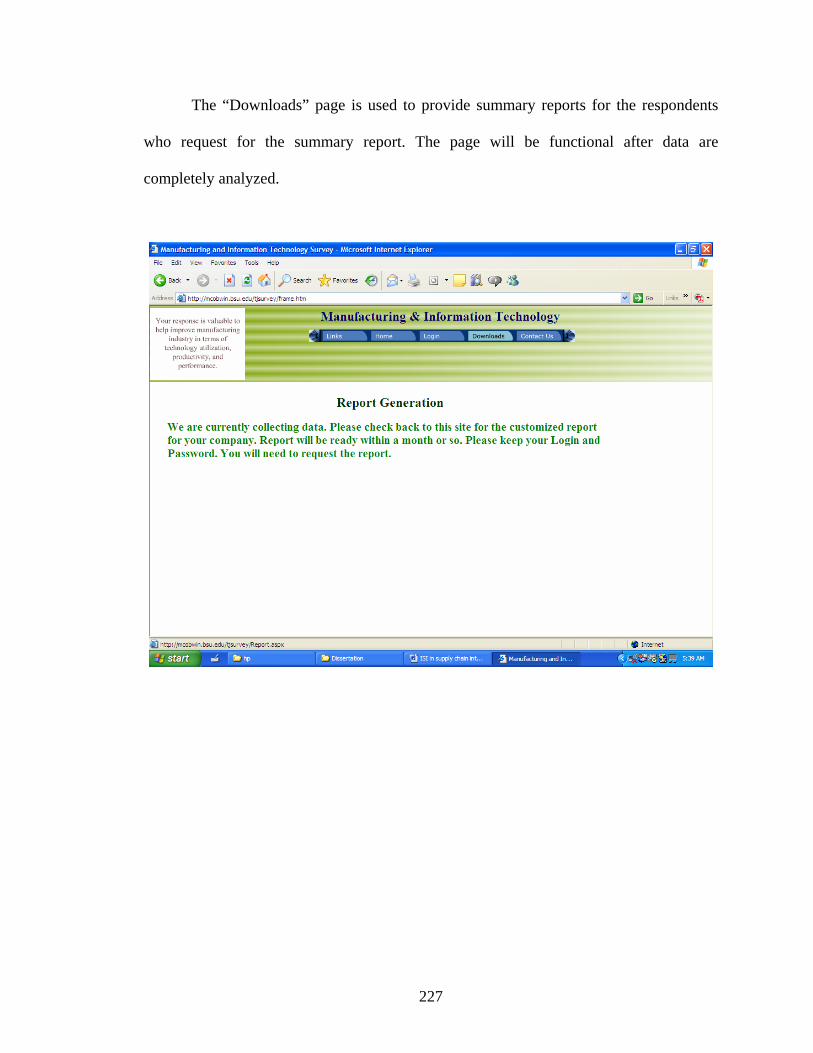
227
The “Downloads” page is used to provide summary reports for the respondents
who request for the summary report. The page will be functional after data are
completely analyzed.
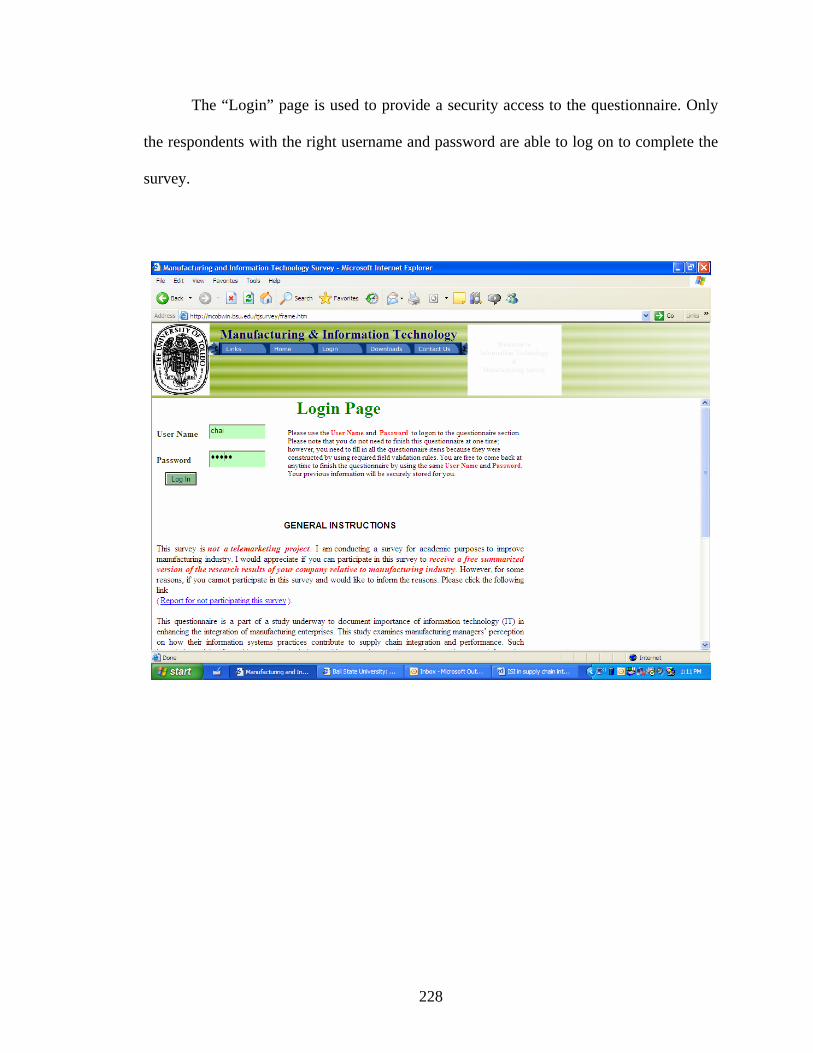
228
The “Login” page is used to provide a security access to the questionnaire. Only
the respondents with the right username and password are able to log on to complete the
survey.

229
After logging to the web site, the web site shows a customized welcome statement
at the top part and a blank questionnaire at the bottom part.
However, if the respondent logs on the second time, the web-page updates
necessary information as previously chosen by the respondents. With this option, the
respondents do not need to finish at one time.
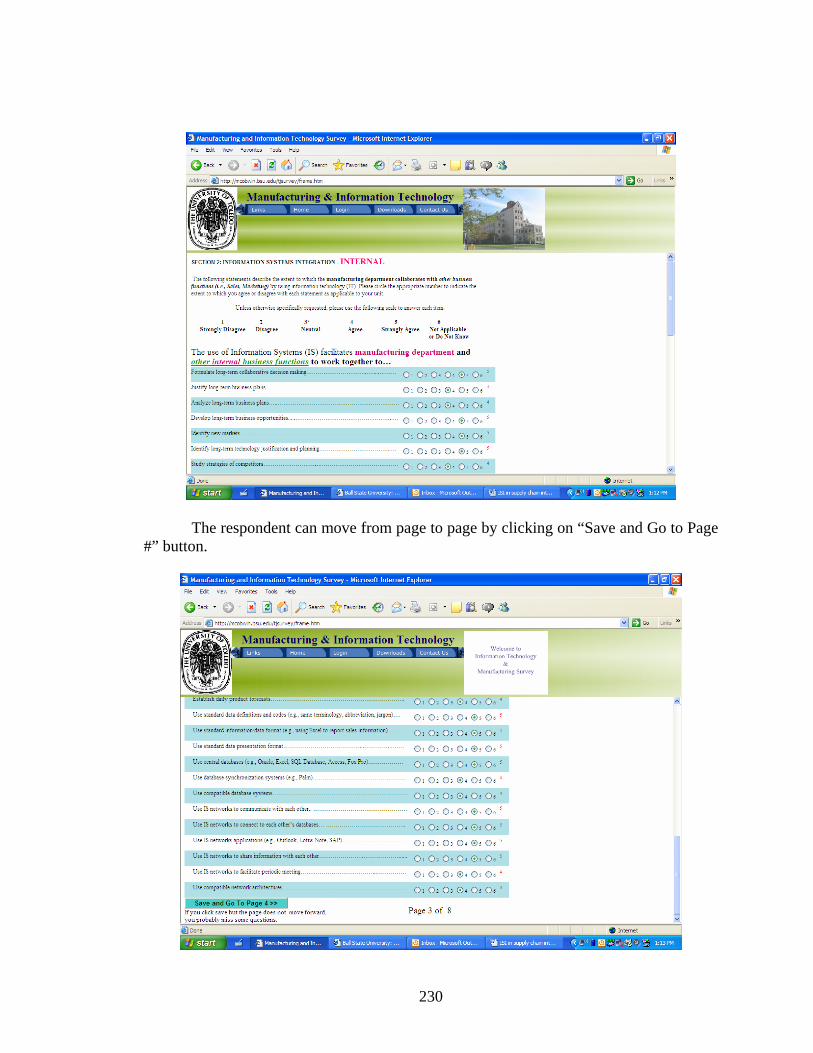
230
The respondent can move from page to page by clicking on “Save and Go to Page #” button.

231

232

233
This page provides the respondents’ ability to request the summary report of a
survey and shows modes of receiving information.
234
APPENDIX H
Department of Information Systems and Operations Management Miller College of Business Ball State University Muncie, IN 47306 XXX XXXXX YYYY YYY Howell, MI 48843
235
APPENDIX I
1-44200
Thawatchai Jitpaiboon Department of Information Systems and Operations Management Miller College of Business, WB203 Ball State University Muncie, IN 47306-9987

236
APPENDIX J
October 10, 2005 XXXX Manager YYYY ZZZZZZZZ Comstock Park, MI 49321-8914 Dear XXX: Approximately five weeks ago, I sent you a questionnaire survey of Manufacturing and Information Technology. You are one of the manufacturing managers carefully selected from SME membership to participate in this survey. Your response, therefore, is very valuable to this project. Being that the holiday season is so busy for us all, you probably have not had time to complete the survey, or planned to complete it after the Thanksgiving. This is just a reminder to make sure that you have received the questionnaire. I hope that you are able to fill it out by December 25, 2004. If you have already completed and returned the survey, please disregard this letter. In case you have not responded, please take a few minutes to fill out the previously sent questionnaire. In case you misplaced your original copy, please feel free to request a new one from the address provided below. You can also complete this survey on our secured web-site at http://tjitpaiboon.iweb.bsu.edu/. Your username is “XXX” and your password is “bsu1946”. To encourage participation in this survey, I have arranged for two lottery prizes worth $100 each. To be included in the drawing, please return the survey before December 25, 2004. Won’t you please complete your survey as soon as possible, so the odds of winning a prize are in your favor? In addition, you can request a report that shows your firm’s results compared to the industry, which will be sent to you FREE OF CHARGE. Thank you very much for your consideration. Sincerely,
Thawatchai Jitpaiboon Assistant Professor Department of Information Systems and Operations Management, WB224 Ball State University Phone: 765-285-7048 Fax: 765-285-5308 Email: [email protected]
Please participate in this survey to win $100 cash. You can also request the syndicated report for FREE.

237
APPENDIX K
October 11, 2004 Thawatchai Jitpaiboon Assistant Professor ISOM Department Miller College of Business Ball State University WB 100 Muncie, IN 47306 Dear Professor Jitpaiboon, On behalf of SME, I am pleased to confirm our support for the survey entitled “Manufacturing & Information Technology Survey.” We have provided you with a select mailing list of individuals for this research and we encourage them to participate in your survey. The results of your study will be of interest to members of our Technical Community Network. They will be looking to identify opportunities to further enhance manufacturing through services and products of value to the manufacturing community. SME’s Technical Community Network represents key focus areas within the world of manufacturing. Community membership is free to all SME members. Each community provides its members with opportunities to participate in new events, training, technical reference information, publications, and services, along with the ability to guide the development and expansion of these resources. Additional information is available at: www.sme.org/communities. We look forward to your successful results. Sincerely, Mark J. Stratton Community Relations Manager Education and Research Community

238
APPENDIX L
CALLING SCRIPTS
Person Contacted: 1. Hi, this is - - calling from Ball State University. How are you? 2. I am calling to inquire whether or not you received the Manufacturing and Information Technology survey that we sent you in the mail a couple weeks ago, and to see if you had any questions about the survey. 3. We’re doing follow up calls because you are one of the 500 manufacturing managers carefully selected from the Society of Manufacturing Engineers or SME membership to participate in this survey. Your response, therefore, is very valuable to this project. 4. We would like to know we can count on you. We would like to assure you that our survey is strictly for educational research purposes and has no marketing ties. All participants in the survey will receive a free syndicated report which shows your firm’s results compared to the industry, which will be sent to you FREE OF CHARGE. 5. In addition, to encourage participation in this survey, I have arranged for two lottery prizes worth $100 each. To be included in the drawing, please return the survey before December 25, 2004. Won’t you please complete your survey as soon as possible, so the odds of winning a prize are in your favor? 6. The author of the survey, Professor Chai, who has expertise in the field of Information Systems and Operations Management, would like to extend to you any consulting efforts that he and our department can offer to you in the future. His contact info is on the survey, if you have any interest in the matter or any questions about the survey. 7. With that being said, do you have any concerns or questions about the survey? (if so, contact Professor Chai) Have you had a chance to complete it yet? 8. We would like to know if there is any reason why you wouldn’t be interested in participating in our study. - - 9. OK, thank you for your time. Goodbye.
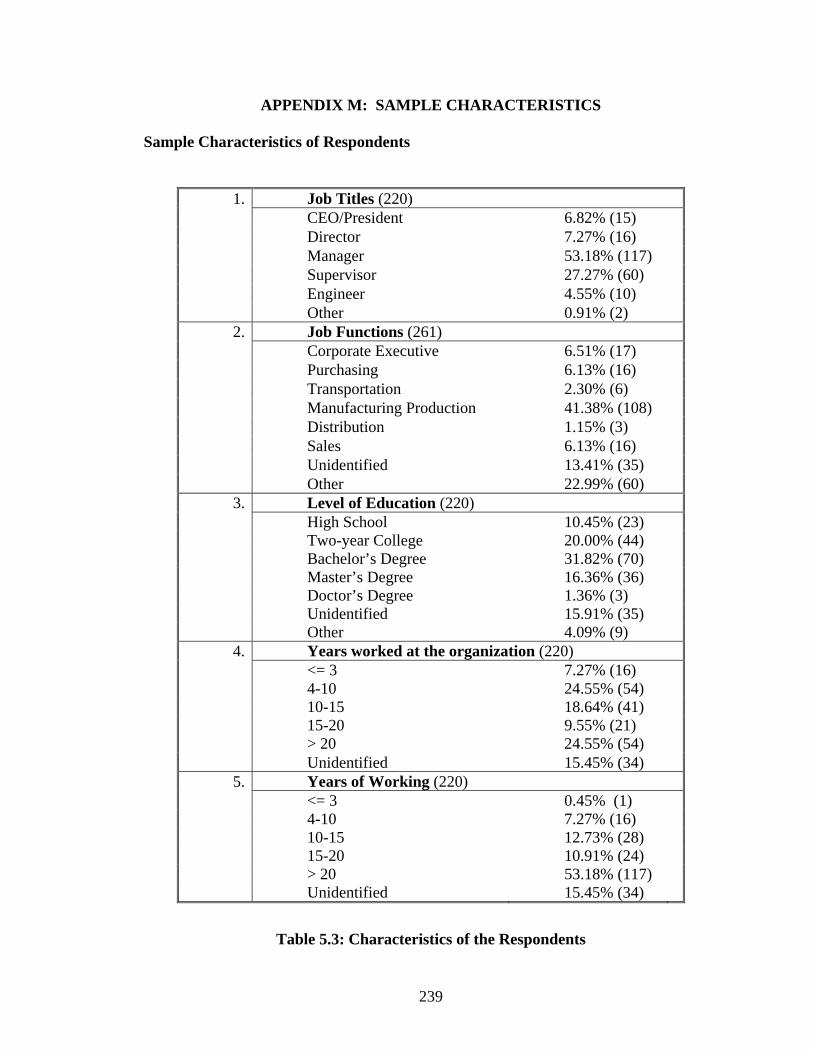
239
APPENDIX M: SAMPLE CHARACTERISTICS
Sample Characteristics of Respondents
Job Titles (220) CEO/President 6.82% (15) Director 7.27% (16) Manager 53.18% (117) Supervisor 27.27% (60) Engineer 4.55% (10)
1.
Other 0.91% (2) Job Functions (261) Corporate Executive 6.51% (17) Purchasing 6.13% (16) Transportation 2.30% (6) Manufacturing Production 41.38% (108) Distribution 1.15% (3) Sales 6.13% (16) Unidentified 13.41% (35)
2.
Other 22.99% (60) Level of Education (220) High School 10.45% (23) Two-year College 20.00% (44) Bachelor’s Degree 31.82% (70) Master’s Degree 16.36% (36) Doctor’s Degree 1.36% (3) Unidentified 15.91% (35)
3.
Other 4.09% (9) Years worked at the organization (220) <= 3 7.27% (16) 4-10 24.55% (54) 10-15 18.64% (41) 15-20 9.55% (21) > 20 24.55% (54)
4.
Unidentified 15.45% (34) 5. Years of Working (220) <= 3 0.45% (1) 4-10 7.27% (16) 10-15 12.73% (28) 15-20 10.91% (24) > 20 53.18% (117) Unidentified 15.45% (34)
Table 5.3: Characteristics of the Respondents

240
Figure 5.3.1.1 Respondents by Job Title
Manager53%
Director7%
CEO /President7%
Other1%
Supervisor27%
Engineer5%
6.51%
6.13%
2.30%
41.38%
1.15%
6.13%
13.41%
22.99%
Corporate Executive
Purchasing
Transportation
Manufacturing Production
Distribution
Sales
Unidentified
Other
Job
Func
tion
Figure 5.3.1.2 Respondents by Job Function

241
Figure 5.3.1.3 Level of Education
Other4%
Doctor's Degree
1%
Master's Degree
16%Bachelor's
Degree33%
Two-year College
20%
High School10%
Unidentified16%
Figure 5.2.1.4 Respondents by Years Worked at the Organization
4-10 years24%
Under 3 years7%
Unidentified15%
15-20 years10%
10-15 years19%
Over 20 years25%

242
Figure 5.2.1.5 Respondents by Years of Work
10-15, 12.73%
4-10, 7.27%<= 3, 0.45%
15-20, 10.91%
>20, 53.18%
Unidentified, 15.45%

243
Sample Characteristics of Respondents’ Organization
Major business (220) Manufacturing 79.55% (175) Transportation 0.91% (2) Mining/construction/agriculture 0.91% (2) Other 3.18% (7)
Unidentified 15.45% (34) Major industry (220) Food and kindred products (SIC 20) 0.45% (1) Tobacco (SIC 21) 0.45% (1) Furniture and fixtures (SIC 25) 0.45% (1) Rubber and plastic products (SIC 30) 7.73% (17) Leather and leather products (SIC 31) 0.91% (2) Primary metal industries (SIC 33) 2.73% (6) Fabricated metal products (SIC 34) 27.27% (60) Industrial machinery and equipment (SIC 35) 10.45% (23) Electric and electronic equipment (SIC 36) 2.73% (6) Transportation equipment (SIC 37) 12.27% (27) Instruments and related products (SIC 38) 1.82% (4) Miscellaneous manufacturing industries (SIC 39) 14.09 (31)
2.
Other 18.64% (41) Primary production system (220) Engineer to Order 10.00% (22) Make to Order 50.00% (110) Assemble to Order 9.09% (20) Make to Stock 14.55% (32)
3.
Unidentified 16.36% (36)
Table 5.4 Characteristics of the Surveyed Organizations

244
Primary manufacturing system (220) Continuous flow process 9.46% (21) Batch processing 18.02% (40) Flexible manufacturing 10.81% (24) Assemble line 8.56% (19) Job shop 19.82% (44) Project 4.05% (9) Manufacturing cell 13.51% (30)
4.
Unidentified 15.77 (35) Number of employees (220) 1-50 10.91% (24) 51-100 14.55% (32) 101-250 22.73% (50) 251-500 13.18% (29) 501-1000 6.36% (14) Over 1000 16.36% (36)
5.
Unidentified 15.91% (35) Annual sales in millions of $ (220) < 5 9.09% (20) 5 to 10 7.27% (16) 10 to <25 17.73% (39) 25 to <50 11.36% (25) 50 to <100 11.82% (26) >100 24.08% (53)
6.
Unidentified 18.64% (41)
Table 5.4 Characteristics of the Surveyed Organizations (continued)

245
5.3.2.1 Major Business
Manufacturing79%
Mining/construction/agrilculture
1%
Transportation1%
Other3%
Unidentified16%
5.3.2.2 Organizations by SIC Code
SIC 3428%
Other19%
SIC 3712%
SIC 3914%
SIC 382% SIC 36
3%SIC 3510%
SIC 311%
SIC 333%
SIC 308%
SIC 210%
SIC 200%
SIC 250%

246
5.3.2.3 Organizations by Primary Production System
Engineer to Order10%
Unidentified16%
Make to Stock15%
Assemble to Order
9%
Make to Order50%
5.3.2.4 Organizations by Primary Manufacturing System
Manufacturing cell14%
Job shop19%
Assemble9%
Continuous flow9%
Unidentified16%
Project4%
Batch processing18%
Flexible manufacturing
11%
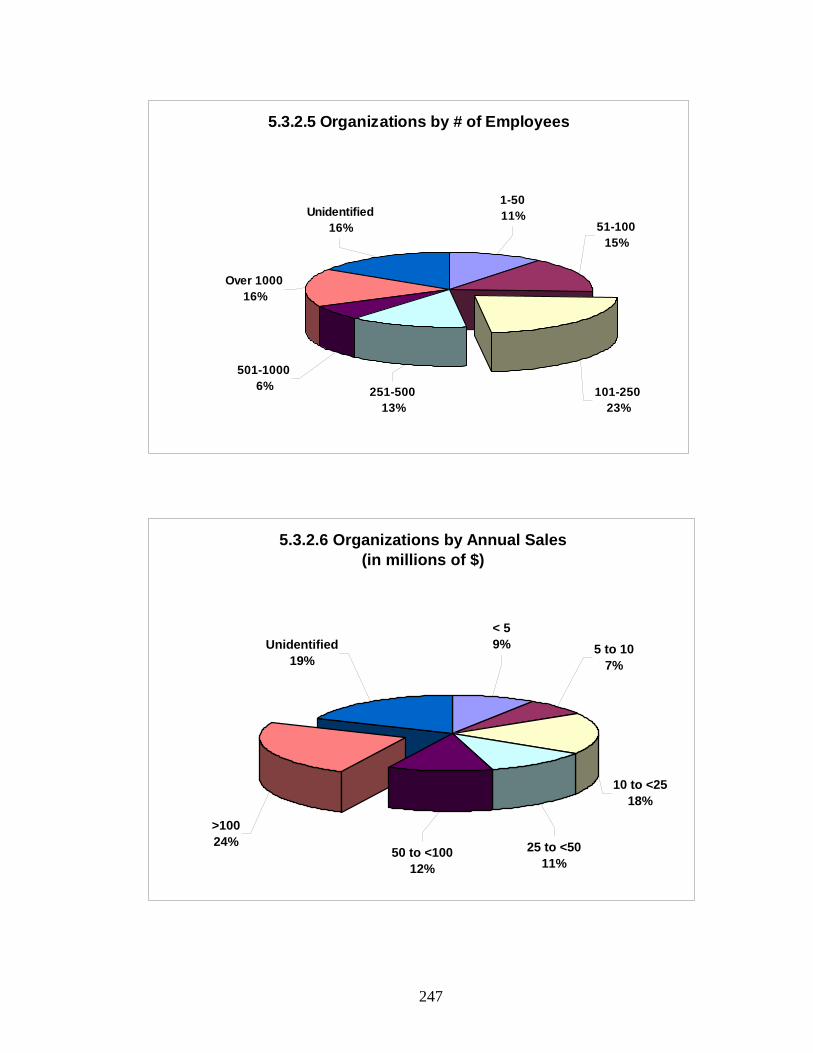
247
5.3.2.5 Organizations by # of Employees
101-25023%
501-10006% 251-500
13%
51-10015%
1-5011%Unidentified
16%
Over 100016%
5.3.2.6 Organizations by Annual Sales(in millions of $)
10 to <2518%
25 to <5011%
50 to <10012%
>10024%
Unidentified19%
5 to 107%
< 59%
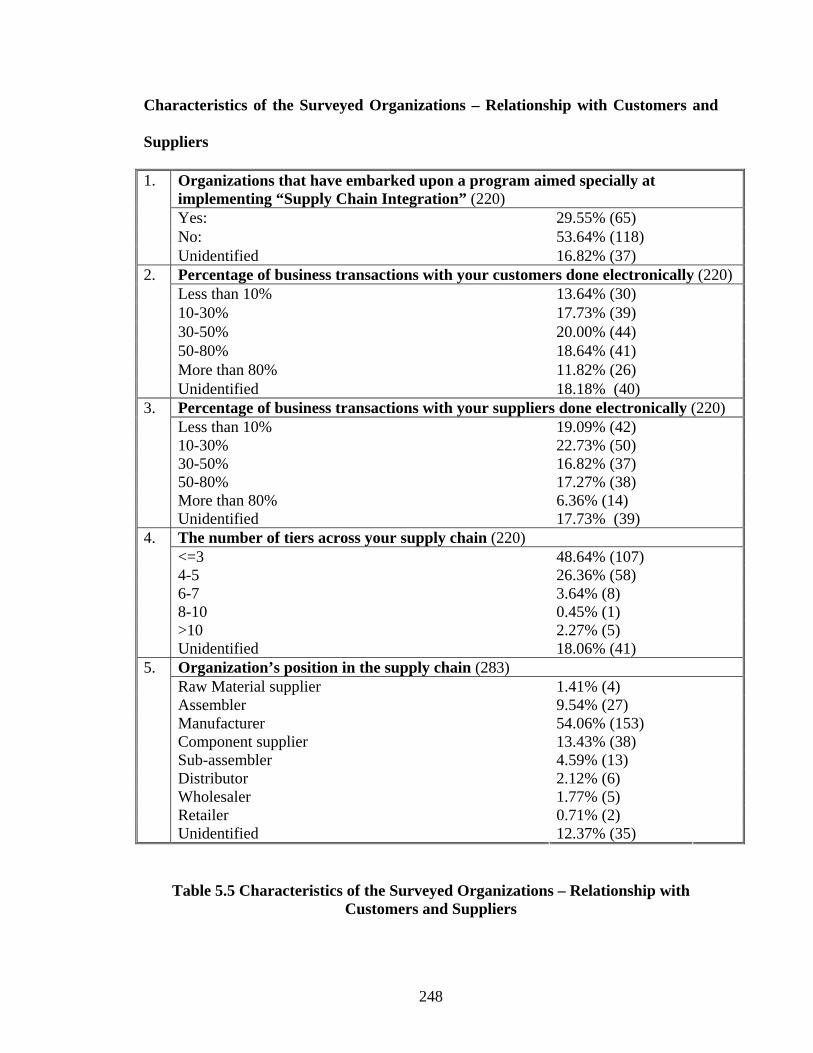
248
Characteristics of the Surveyed Organizations – Relationship with Customers and
Suppliers
Organizations that have embarked upon a program aimed specially at implementing “Supply Chain Integration” (220) Yes: 29.55% (65) No: 53.64% (118)
1.
Unidentified 16.82% (37) Percentage of business transactions with your customers done electronically (220) Less than 10% 13.64% (30) 10-30% 17.73% (39) 30-50% 20.00% (44) 50-80% 18.64% (41) More than 80% 11.82% (26)
2.
Unidentified 18.18% (40) Percentage of business transactions with your suppliers done electronically (220) Less than 10% 19.09% (42) 10-30% 22.73% (50) 30-50% 16.82% (37) 50-80% 17.27% (38) More than 80% 6.36% (14)
3.
Unidentified 17.73% (39) The number of tiers across your supply chain (220) <=3 48.64% (107) 4-5 26.36% (58) 6-7 3.64% (8) 8-10 0.45% (1) >10 2.27% (5)
4.
Unidentified 18.06% (41) Organization’s position in the supply chain (283) Raw Material supplier 1.41% (4) Assembler 9.54% (27) Manufacturer 54.06% (153) Component supplier 13.43% (38) Sub-assembler 4.59% (13) Distributor 2.12% (6) Wholesaler 1.77% (5) Retailer 0.71% (2)
5.
Unidentified 12.37% (35)
Table 5.5 Characteristics of the Surveyed Organizations – Relationship with Customers and Suppliers

249
13.6%19.1%
17.7%22.7%
20.0%16.8%
18.6%17.3%
11.8%6.4%
18.2%17.7%
Less than 10%
10-30%
30-50%
50-80%
More than 80%
Unidentified
5.3.3.1 Electronic Transcations with Customers and Suppliers
SuppliersCustomers
5.3.3.2 Organizations by Supply Chain Horizontal Structure (measured by # of tiers across the supply
chain)
4-526%
<=349%
> 102%
8-100%
6-74%
Unidentified19%

250
1.4%
13.4%
9.5%
4.6%
54.1%
2.1%
1.8%
0.7%
12.4%
Raw Material supplier
Component supplier
Assembler
Sub-assembler
Manufacturer
Distributor
Wholesaler
Retailer
UnidetifiedO
rgan
izat
ion'
s Po
sitio
n in
the
Supp
ly C
hain
5.3.3.3 Organizations by Supply Chain Position

251
APPENDIX N: THE QUESTIONNAIRE RECOMMENDED FOR FUTURE
RESEARCH
Manufacturing & Information Technology Survey
Thawatchai Jitpaiboon
Assistant Professor Department of Information Systems and Operations Management
Miller College of Business Ball State University
Muncie, IN 47306 Phone: 765-285-7048
Fax: 765-285-5308 Email: [email protected]
(Please feel free to contact anytime you need further clarification.)
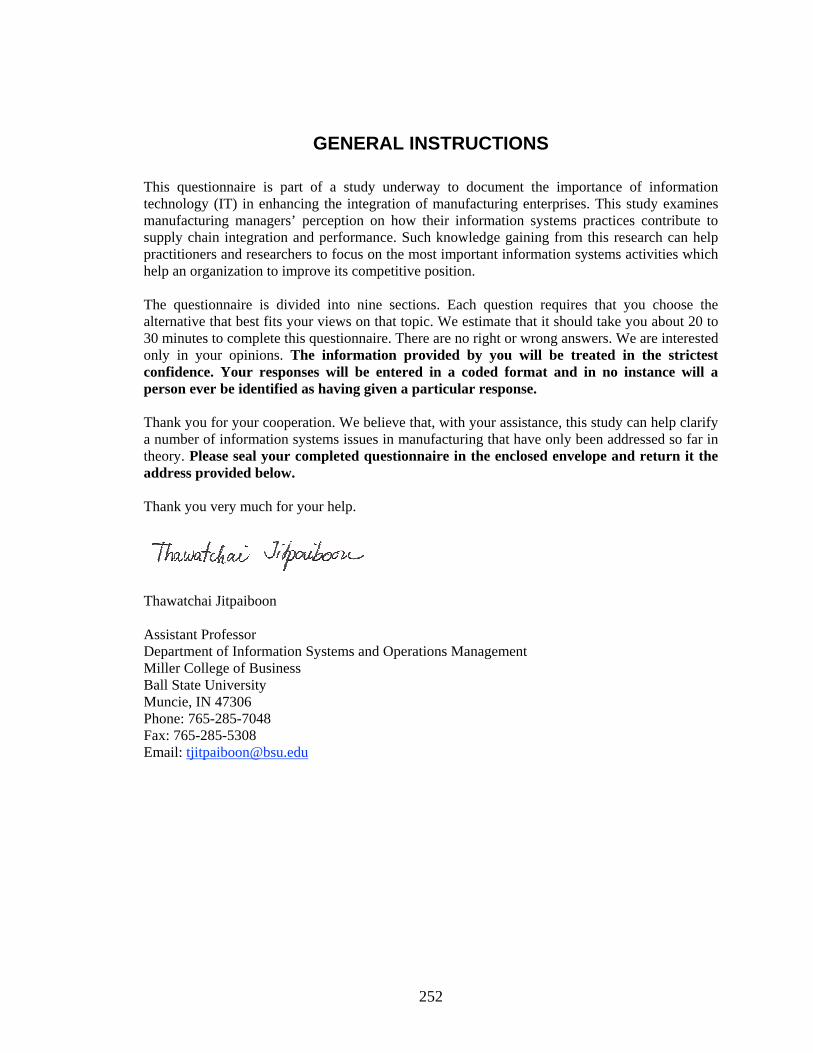
252
GENERAL INSTRUCTIONS
This questionnaire is part of a study underway to document the importance of information technology (IT) in enhancing the integration of manufacturing enterprises. This study examines manufacturing managers’ perception on how their information systems practices contribute to supply chain integration and performance. Such knowledge gaining from this research can help practitioners and researchers to focus on the most important information systems activities which help an organization to improve its competitive position. The questionnaire is divided into nine sections. Each question requires that you choose the alternative that best fits your views on that topic. We estimate that it should take you about 20 to 30 minutes to complete this questionnaire. There are no right or wrong answers. We are interested only in your opinions. The information provided by you will be treated in the strictest confidence. Your responses will be entered in a coded format and in no instance will a person ever be identified as having given a particular response. Thank you for your cooperation. We believe that, with your assistance, this study can help clarify a number of information systems issues in manufacturing that have only been addressed so far in theory. Please seal your completed questionnaire in the enclosed envelope and return it the address provided below. Thank you very much for your help.
Thawatchai Jitpaiboon Assistant Professor Department of Information Systems and Operations Management Miller College of Business Ball State University Muncie, IN 47306 Phone: 765-285-7048 Fax: 765-285-5308 Email: [email protected]

253
Section 1: Information Technology Utilization The following situations describe the extent to which the manufacturing department uses information technology (IT) for strategic, operational, and infrastructural purposes. Please circle the appropriate number to indicate the extent to which you agree or disagree with each statement as applicable to your unit. In our manufacturing department, we use IT for… St
rong
ly D
isag
ree
Dis
agre
e
Neu
tral
Agr
ee
Stro
ngly
Agr
ee
Not
App
licab
le, o
r D
o N
ot K
now
Long-term technology justification and planning……………………..…………….… 1 2 3 4 5 NA Budget justification and planning……………………………………………………... 1 2 3 4 5 NA Investment justification and planning…………………………………………………. 1 2 3 4 5 NA Long-term project planning…………………………..……………………………..… 1 2 3 4 5 NA
Daily production control….............................................................................................. 1 2 3 4 5 NA Daily product quality control……………………………………………..…………… 1 2 3 4 5 NA Daily product movement planning………………..…………….…………………… 1 2 3 4 5 NA Daily customer analysis………………………………………………………………. 1 2 3 4 5 NA Daily material requirement planning…………………………….………….…………. 1 2 3 4 5 NA
Setting up file sharing facilities (e.g., network cable, telephone line, wirelessnetwork)……………………………………………………………………………….. 1 2 3 4 5 NA Setting up data communication facilities (e.g., server, LAN, routers, disk/drive, network computers)………….………………………………………………………. 1 2 3 4 5 NA Setting up advanced manufacturing technology (e.g., CAD/CAM, Robots, EDI).......... 1 2 3 4 5 NA Setting up information disaster recovery system (e.g., disk redundancy, backupfacility)………………………………………………………………………………… 1 2 3 4 5 NA

254
Section 2: Information Systems Integration - Internal The following statements describe the extent to which the manufacturing department collaborates with other business functions (i.e., Sales, Marketing) by using information technology (IT). Please circle the appropriate number to indicate the extent to which you agree or disagree with each statement as applicable to your unit. The use of Information Systems (IS) facilitates manufacturing department and other internal business functions to work together to… St
rong
ly D
isag
ree
Dis
agre
e
Neu
tral
Agr
ee
Stro
ngly
Agr
ee
Not
App
licab
le, o
r D
o N
ot
Kno
w
Formulate long-term collaborative decision making…………………………..….....…… 1 2 3 4 5 NA Analyze long-term business plans…..…………….……………………………………… 1 2 3 4 5 NA Develop long-term business opportunities.....…….…………………………….……….. 1 2 3 4 5 NA Identify long-term technology justification and planning……………………………….. 1 2 3 4 5 NA Set long-term strategic goals……...………..………………………..…………………… 1 2 3 4 5 NA
Adjust daily manufacturing processes (e.g., changing production schedule)...….……… 1 2 3 4 5 NA Control daily product quality………... ………..….…………………………………...… 1 2 3 4 5 NA Manage daily order quantity…………………….……………...………………………… 1 2 3 4 5 NA Exchange daily inventory information (e.g., daily line production)....………..….………. 1 2 3 4 5 NA Manage daily logistical activities (e.g., shipping products to warehouse)……………… 1 2 3 4 5 NA Establish daily product forecasts.……………………..……………….…………..……… 1 2 3 4 5 NA
Use standard data definitions and codes (e.g., same terminology, abbreviation, jargon)... 1 2 3 4 5 NA Use standard information/data format (e.g., using Excel to report sales information)…… 1 2 3 4 5 NA Use standard data presentation format………………………………………….……….. 1 2 3 4 5 NA Integrate data and information………………………………………………………….. 1 2 3 4 5 NA
Use IS networks to communicate with other departments...………………………..…… 1 2 3 4 5 NA Use IS networks to connect to each other’s databases… …………………………...…… 1 2 3 4 5 NA Use IS networks applications (e.g. Outlook, Lotus Note, SAP)……………...…..……… 1 2 3 4 5 NA Use IS networks to share information with other departments………………….……... 1 2 3 4 5 NA Use compatible network architectures………………………..…………………………. 1 2 3 4 5 NA

255
Section 3: Information Systems Integration - External The following statements describe the extent to which the manufacturing department collaborates with its suppliers and customers by using information technology (IT). Please circle the appropriate number to indicate the extent to which you agree or disagree with each statement as applicable to your unit. The use of Information Systems (IS) facilitates manufacturing department and its suppliers and customers to work together to…
Stro
ngly
Dis
agre
e
Dis
agre
e
Neu
tral
Agr
ee
Stro
ngly
Agr
ee
Not
App
licab
le, o
r
Do
Not
Kno
w
Formulate long-term collaborative decision making…………..…………………….. 1 2 3 4 5 NA Justify long-term business plans …………….…...………..……………….…….….. 1 2 3 4 5 NA Analyze long-term business plans……………………….....……..….…….………… 1 2 3 4 5 NA Develop new business opportunities.…………………..……………………………… 1 2 3 4 5 NA Identify long-term technology justification and planning…………………………….. 1 2 3 4 5 NA Set long-term strategic goals….……..………….…………………………………...… 1 2 3 4 5 NA
Adjust daily manufacturing processes (e.g., changing production schedule)…………. 1 2 3 4 5 NA
Adjust daily product development processes (e.g., adjusting product designs)…..…... 1 2 3 4 5 NA
Control daily product quality………..…….…………………………….…………... 1 2 3 4 5 NA Manage daily order quantity…..…………………….………………………………… 1 2 3 4 5 NA Exchange daily inventory information (e.g., daily line production)..…………………. 1 2 3 4 5 NA Establish daily product forecasts………………….………………………………….. 1 2 3 4 5 NA
Use standard data definitions and codes (e.g., same terminology, abbreviation,jargon)……………………………………………………………………………..…. 1 2 3 4 5 NA
Use standard information/data format (e.g., using Excel to report salesinformation)………………………………………………………………………..….. 1 2 3 4 5 NA
Use standard data presentation format……………………………...…………..……. 1 2 3 4 5 NA Use central databases (e.g., Oracle, Excel, SQL Database, Access, Fox Pro)………. 1 2 3 4 5 NA
Use IS networks to communicate with each other.. ………………………………… 1 2 3 4 5 NA Use IS networks to connect to each other’s databases… …………………………….. 1 2 3 4 5 NA Use IS networks to share information with each other…………..………………...... 1 2 3 4 5 NA Use IS networks to facilitate periodic meeting…….…………………...…………… 1 2 3 4 5 NA
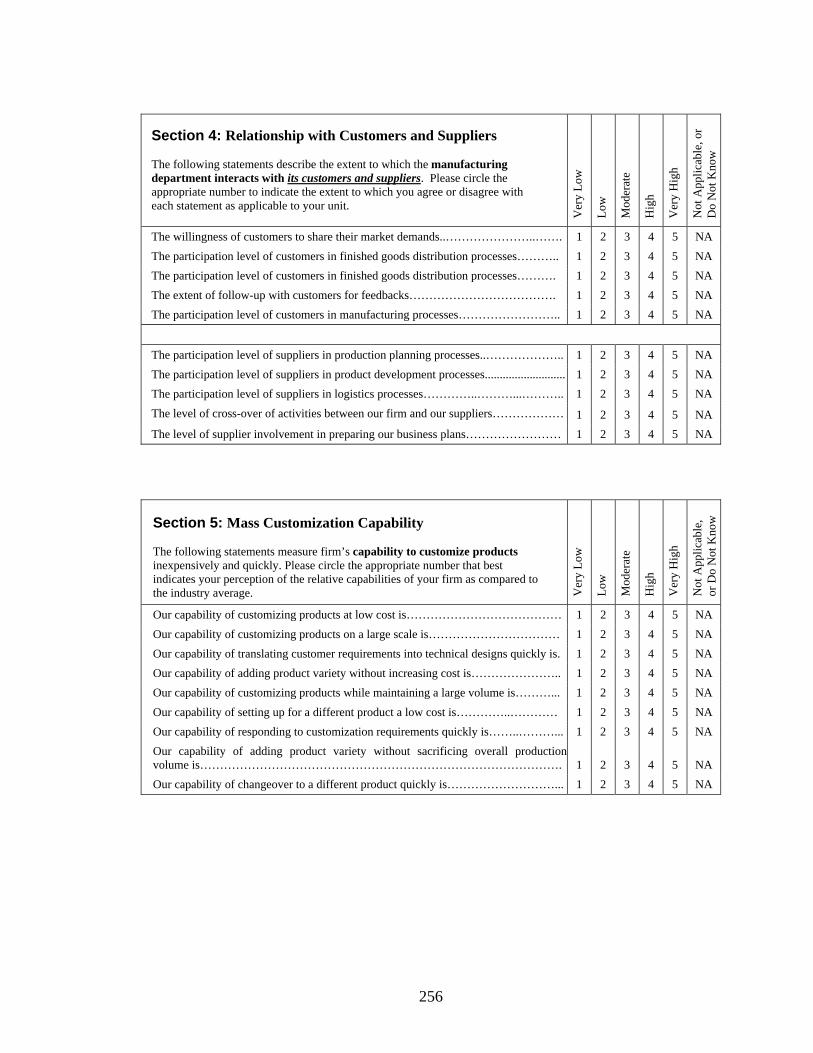
256
Section 4: Relationship with Customers and Suppliers The following statements describe the extent to which the manufacturing department interacts with its customers and suppliers. Please circle the appropriate number to indicate the extent to which you agree or disagree with each statement as applicable to your unit. V
ery
Low
Low
Mod
erat
e
Hig
h
Ver
y H
igh
Not
App
licab
le, o
r D
o N
ot K
now
The willingness of customers to share their market demands..…………………..……. 1 2 3 4 5 NA The participation level of customers in finished goods distribution processes……….. 1 2 3 4 5 NA The participation level of customers in finished goods distribution processes………. 1 2 3 4 5 NA The extent of follow-up with customers for feedbacks………………………………. 1 2 3 4 5 NA The participation level of customers in manufacturing processes…………………….. 1 2 3 4 5 NA
The participation level of suppliers in production planning processes..……………….. 1 2 3 4 5 NA The participation level of suppliers in product development processes........................... 1 2 3 4 5 NA The participation level of suppliers in logistics processes…………..………...……….. 1 2 3 4 5 NA The level of cross-over of activities between our firm and our suppliers……………… 1 2 3 4 5 NA The level of supplier involvement in preparing our business plans…………………… 1 2 3 4 5 NA
Section 5: Mass Customization Capability The following statements measure firm’s capability to customize products inexpensively and quickly. Please circle the appropriate number that best indicates your perception of the relative capabilities of your firm as compared to the industry average. V
ery
Low
Low
Mod
erat
e
Hig
h
Ver
y H
igh
Not
App
licab
le,
or D
o N
ot K
now
Our capability of customizing products at low cost is………………………………… 1 2 3 4 5 NA Our capability of customizing products on a large scale is…………………………… 1 2 3 4 5 NA Our capability of translating customer requirements into technical designs quickly is. 1 2 3 4 5 NA Our capability of adding product variety without increasing cost is………………….. 1 2 3 4 5 NA Our capability of customizing products while maintaining a large volume is………... 1 2 3 4 5 NA Our capability of setting up for a different product a low cost is…………..………… 1 2 3 4 5 NA Our capability of responding to customization requirements quickly is……..………... 1 2 3 4 5 NA Our capability of adding product variety without sacrificing overall production volume is………………………………………………………………………………. 1 2 3 4 5 NA Our capability of changeover to a different product quickly is………………………... 1 2 3 4 5 NA

257
Section 6: Suppliers’ and Firm’s Operational Performance The following statements describe typical operational performance objectives for firms and their suppliers. Please circle the number that best indicates the level of your suppliers’ and your firm’s attainment of each objective. Please note that left side indicates the level of supplier’s operational performance and right side indicates the level of firm’s operational performance. Please fill in both sides of questionnaire items.
Stro
ngly
Dis
agre
e
Dis
agre
e
Neu
tral
Agr
ee
Stro
ngly
Agr
ee
Not
App
licab
le, o
r D
o N
ot K
now
St
rong
ly D
isag
ree
Dis
agre
e
Neu
tral
Agr
ee
Stro
ngly
Agr
ee
Not
App
licab
le, o
r D
o N
ot K
now
Supplier Performance Dimensions Firm
1 2 3 4 5 NA Deliver materials/components/products as promises 1 2 3 4 5 NA 1 2 3 4 5 NA Provide fast delivery 1 2 3 4 5 NA 1 2 3 4 5 NA Provide on-time delivery 1 2 3 4 5 NA 1 2 3 4 5 NA Provide reliable delivery 1 2 3 4 5 NA 1 2 3 4 5 NA Decrease manufacturing lead time 1 2 3 4 5 NA 1 2 3 4 5 NA Make rapid production volume changes 1 2 3 4 5 NA 1 2 3 4 5 NA Make rapid changeover between product lines 1 2 3 4 5 NA 1 2 3 4 5 NA Process both large and small orders 1 2 3 4 5 NA 1 2 3 4 5 NA Increase capacity utilization 1 2 3 4 5 NA 1 2 3 4 5 NA Produce materials/components/products at low cost 1 2 3 4 5 NA 1 2 3 4 5 NA Reduce production cost 1 2 3 4 5 NA 1 2 3 4 5 NA Reduce inventory cost 1 2 3 4 5 NA 1 2 3 4 5 NA Reduce unit cost 1 2 3 4 5 NA 1 2 3 4 5 NA Increase labor productivity 1 2 3 4 5 NA 1 2 3 4 5 NA Develop new ways of customer service 1 2 3 4 5 NA 1 2 3 4 5 NA Develop new forms of shop floor management 1 2 3 4 5 NA 1 2 3 4 5 NA Develop new ways of supply chain management 1 2 3 4 5 NA 1 2 3 4 5 NA Develop new products and features 1 2 3 4 5 NA 1 2 3 4 5 NA Develop new process technologies 1 2 3 4 5 NA 1 2 3 4 5 NA Provide better product performance 1 2 3 4 5 NA 1 2 3 4 5 NA Provide product conformance to specifications 1 2 3 4 5 NA 1 2 3 4 5 NA Reduce defective rate 1 2 3 4 5 NA 1 2 3 4 5 NA Better product reputation 1 2 3 4 5 NA
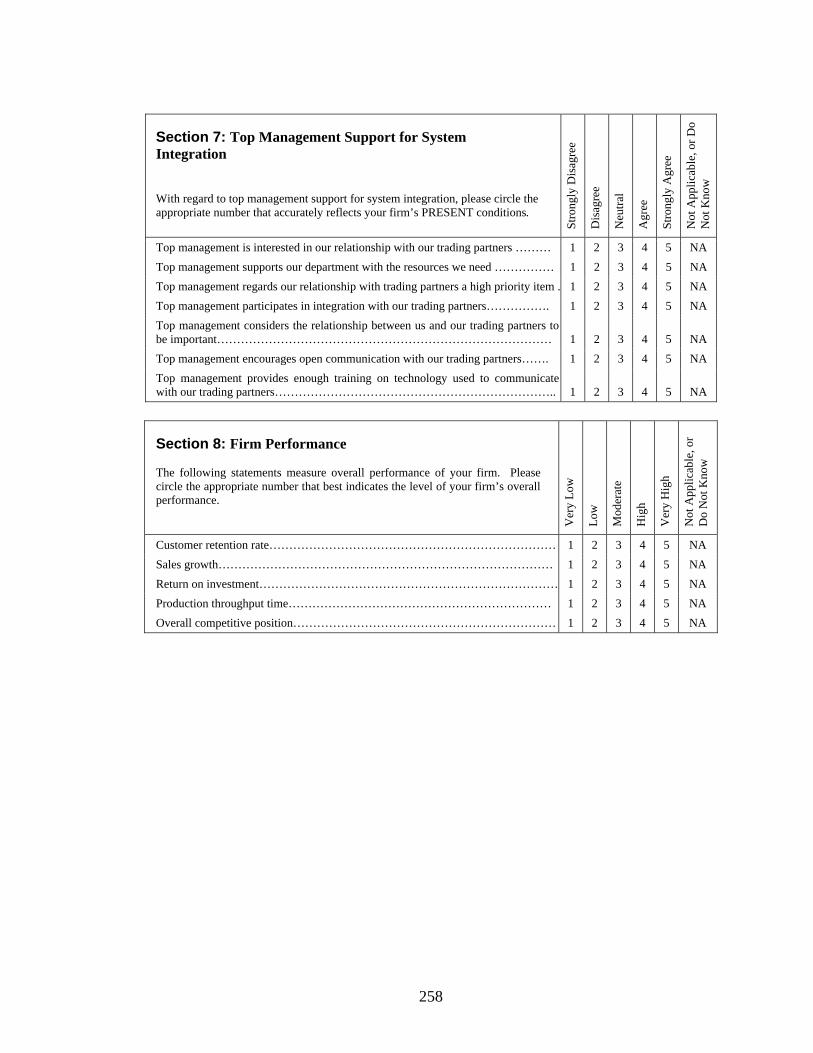
258
Section 7: Top Management Support for System Integration
With regard to top management support for system integration, please circle the appropriate number that accurately reflects your firm’s PRESENT conditions. St
rong
ly D
isag
ree
Dis
agre
e
Neu
tral
Agr
ee
Stro
ngly
Agr
ee
Not
App
licab
le, o
r Do
Not
Kno
w
Top management is interested in our relationship with our trading partners ……… 1 2 3 4 5 NA Top management supports our department with the resources we need …………… 1 2 3 4 5 NA Top management regards our relationship with trading partners a high priority item . 1 2 3 4 5 NA Top management participates in integration with our trading partners……………. 1 2 3 4 5 NA Top management considers the relationship between us and our trading partners to be important………………………………………………………………………… 1 2 3 4 5 NA Top management encourages open communication with our trading partners……. 1 2 3 4 5 NA Top management provides enough training on technology used to communicate with our trading partners…………………………………………………………….. 1 2 3 4 5 NA
Section 8: Firm Performance The following statements measure overall performance of your firm. Please circle the appropriate number that best indicates the level of your firm’s overall performance. V
ery
Low
Low
Mod
erat
e
Hig
h
Ver
y H
igh
Not
App
licab
le, o
r D
o N
ot K
now
Customer retention rate……………………………………………………………… 1 2 3 4 5 NA Sales growth………………………………………………………………………… 1 2 3 4 5 NA Return on investment………………………………………………………………… 1 2 3 4 5 NA Production throughput time………………………………………………………… 1 2 3 4 5 NA Overall competitive position………………………………………………………… 1 2 3 4 5 NA

259
Section 9: Please provide the following information.
Personal information 5. Your job title:
CEO/president Director
Manager Other (Please indicate) _____________________
6. Your present job function (Mark all that apply)
Corporate executive Purchasing Transportation
Manufacturing production Distribution Sales Other (Please indicate) ___________
7. Please indicate your level of education:
High school Two-year college Bachelor’s degree Master’s degree Doctor’s degree Other (please specify): ______________________________________
8. How many years have you been working? ___ <= 3; ___ 4-10; ___ 10-15; ___ 15-20; ___ > 20
9. How many years have you been working for your current organization?
___ <= 3; ___ 4-10; ___ 10-15; ___ 15-20; ___ > 20
10. On a scale of 1 to 10, please indicate your level of computer literacy:
Know nothing Expert about computers computer user
1----------2-----------3-----------4-----------5-----------6----------7---------8---------9--------10
11. Please indicate the perceived level of complexity of your routine computer-based tasks: Not at all Moderately Extremely complex complex complex
1----------2-----------3-----------4-----------5-----------6----------7---------8---------9--------10
12. Please indicate your typical level of confidence in using an unfamiliar computer system: Not at all Moderately Totally onfident confident confident
1----------2-----------3-----------4-----------5-----------6----------7---------8---------9--------10
Business Information
2. Please indicate the category which best describes your major business (Please check the most appropriate one)
____ Manufacturing ____ Finance/insurance/real estate ____ Public utility
____ Medicine/Law/Education ____ Wholesale/retail trade ____ Transportation
____ Business service ____ Government local/state/federal ____ Petroleum
____ Communication ____ Mining/construction/agriculture ____ others
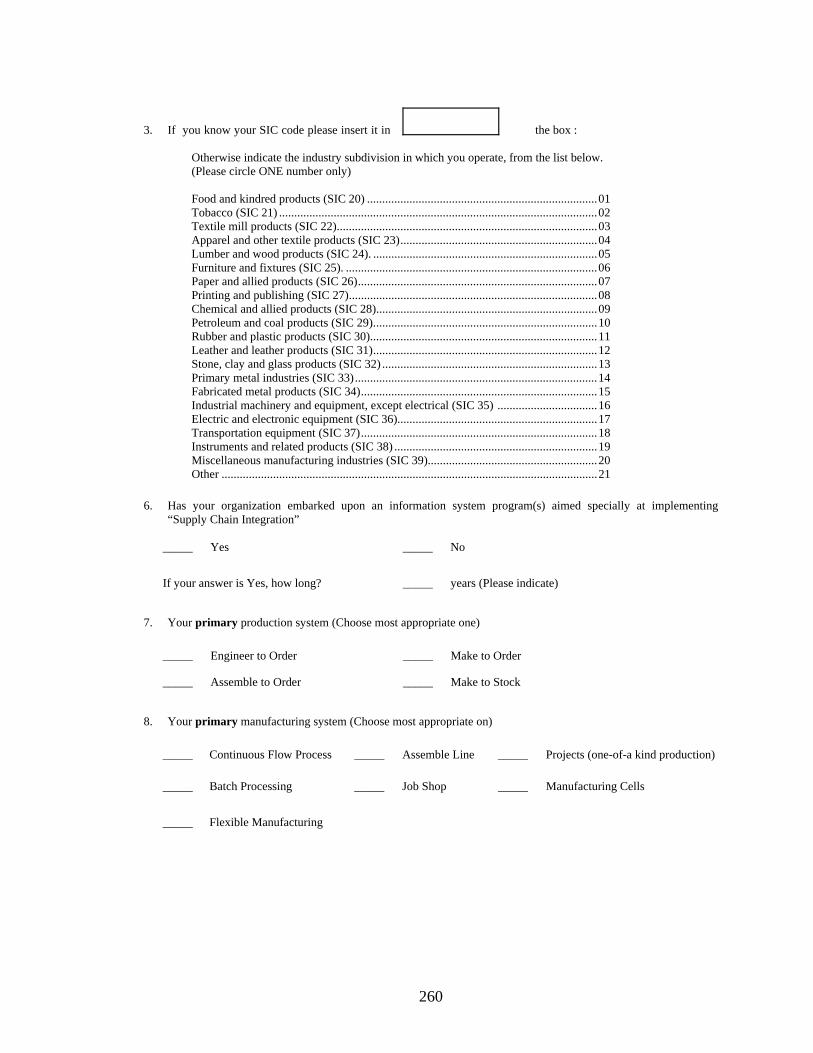
260
3. If you know your SIC code please insert it in the box :
Otherwise indicate the industry subdivision in which you operate, from the list below. (Please circle ONE number only) Food and kindred products (SIC 20) ............................................................................01 Tobacco (SIC 21) .........................................................................................................02 Textile mill products (SIC 22)......................................................................................03 Apparel and other textile products (SIC 23).................................................................04 Lumber and wood products (SIC 24). ..........................................................................05 Furniture and fixtures (SIC 25). ...................................................................................06 Paper and allied products (SIC 26)...............................................................................07 Printing and publishing (SIC 27)..................................................................................08 Chemical and allied products (SIC 28).........................................................................09 Petroleum and coal products (SIC 29)..........................................................................10 Rubber and plastic products (SIC 30)...........................................................................11 Leather and leather products (SIC 31)..........................................................................12 Stone, clay and glass products (SIC 32) .......................................................................13 Primary metal industries (SIC 33)................................................................................14 Fabricated metal products (SIC 34)..............................................................................15 Industrial machinery and equipment, except electrical (SIC 35) .................................16 Electric and electronic equipment (SIC 36)..................................................................17 Transportation equipment (SIC 37)..............................................................................18 Instruments and related products (SIC 38) ...................................................................19 Miscellaneous manufacturing industries (SIC 39)........................................................20 Other ............................................................................................................................21
6. Has your organization embarked upon an information system program(s) aimed specially at implementing
“Supply Chain Integration”
_____ Yes _____ No
If your answer is Yes, how long? _____ years (Please indicate)
7. Your primary production system (Choose most appropriate one)
_____ Engineer to Order _____ Make to Order
_____ Assemble to Order _____ Make to Stock
8. Your primary manufacturing system (Choose most appropriate on)
_____ Continuous Flow Process _____ Assemble Line _____ Projects (one-of-a kind production)
_____ Batch Processing _____ Job Shop _____ Manufacturing Cells
_____ Flexible Manufacturing
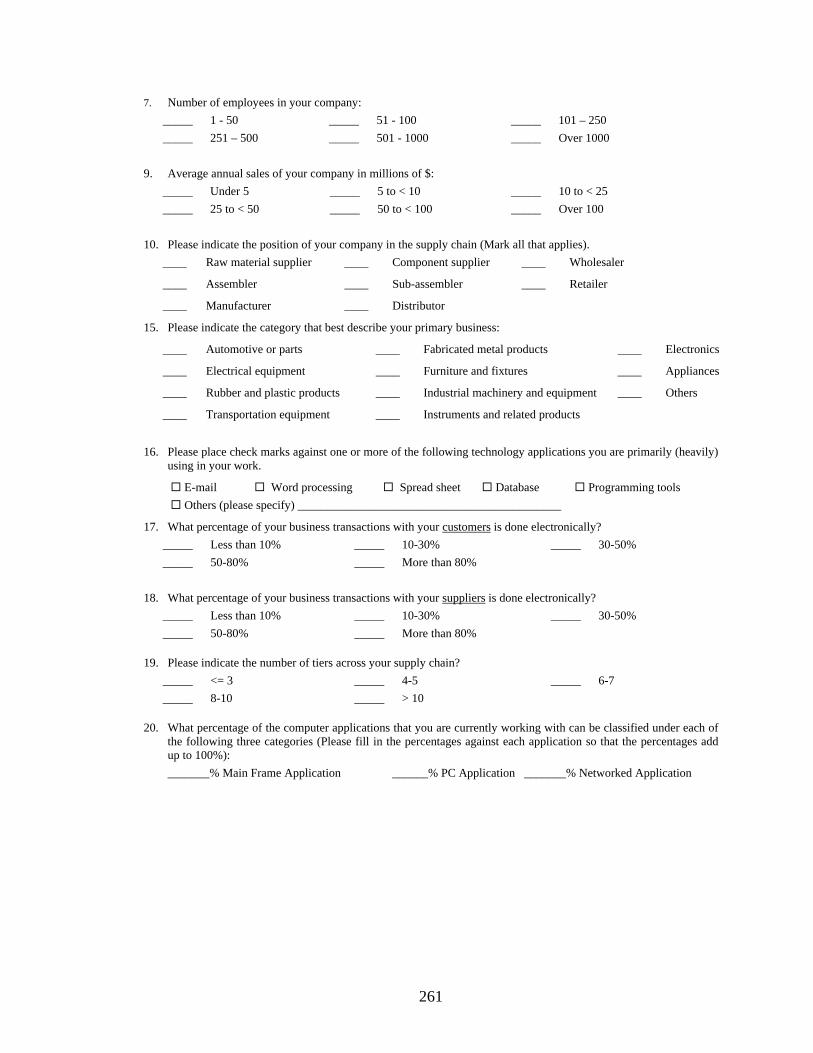
261
7. Number of employees in your company: _____ 1 - 50 _____ 51 - 100 _____ 101 – 250 _____ 251 – 500 _____ 501 - 1000 _____ Over 1000
9. Average annual sales of your company in millions of $:
_____ Under 5 _____ 5 to < 10 _____ 10 to < 25 _____ 25 to < 50 _____ 50 to < 100 _____ Over 100
10. Please indicate the position of your company in the supply chain (Mark all that applies).
____ Raw material supplier ____ Component supplier ____ Wholesaler
____ Assembler ____ Sub-assembler ____ Retailer
____ Manufacturer ____ Distributor
15. Please indicate the category that best describe your primary business:
____ Automotive or parts ____ Fabricated metal products ____ Electronics
____ Electrical equipment ____ Furniture and fixtures ____ Appliances
____ Rubber and plastic products ____ Industrial machinery and equipment ____ Others
____ Transportation equipment ____ Instruments and related products
16. Please place check marks against one or more of the following technology applications you are primarily (heavily) using in your work.
E-mail Word processing Spread sheet Database Programming tools Others (please specify) ____________________________________________
17. What percentage of your business transactions with your customers is done electronically? _____ Less than 10% _____ 10-30% _____ 30-50% _____ 50-80% _____ More than 80%
18. What percentage of your business transactions with your suppliers is done electronically?
_____ Less than 10% _____ 10-30% _____ 30-50% _____ 50-80% _____ More than 80%
19. Please indicate the number of tiers across your supply chain? _____ <= 3 _____ 4-5 _____ 6-7 _____ 8-10 _____ > 10
20. What percentage of the computer applications that you are currently working with can be classified under each of the following three categories (Please fill in the percentages against each application so that the percentages add up to 100%): _______% Main Frame Application ______% PC Application _______% Networked Application

262
We totally respect your privacy. Please note that the information you provide below
will be used for academic purposes only.
If you would like to receive the summarized version of your company’s results compared to the industry, please specify the mode of receiving the information.
Hard copy by regular mailing services Download from the internet (login and password)
E-mail with attachment Other (Please indicate) _____________________
Thank you for your cooperation and response.
Please complete the following details or attach your business card: Your name: ________________________________________________ Business Name: ____________________________________________ Title: _____________________________________________________ Address: __________________________________________________ _________________________________________________________ City: ___________________________ State: ____________________ Zip Code: _______________Phone: ___________________________ Fax: _________________ Email: _____________________________

263
APPENDIX O
IRB FROM UNIVERSITY OF TOLEDO

264
APPENDIX P
IRB FROM BALL STATE UNIVERSITY


