
Solving Super-Synchronous Vibration
on a Double Suction Pump
By:
Maki M. Onari & William D. Marscher
Mechanical Solutions, Inc. – Whippany, NJ
Gene Sabini
ITT Goulds – Seneca Falls, NY
Kris Olasin
Motiva Enterprise – New Orleans, LA
27th International Pump Users Symposium
September 12 - 15, 2011
426

• Two single-stage double suction API pumps were
designed by ITT Goulds to replace legacy 4x15 HVC
Pumps at Motiva Convent Refinery for vacuum bottom
service.
• Pump type / Model: 4x8-15A / 3620 modified to fit HVC
• Application: vacuum residuum (water, oil, and coke mix)
at 705 degF
• The pump was directly coupled to an induction motor
operating through a VFD to allow operation at two
different speeds of 2970 rpm and 3555 rpm (rated speed)
(49.5 Hz and 59.3 Hz).
• The rated capacity: 1158 GPM
• TDH: 754 ft and 244 HP
Background
427

Background
428
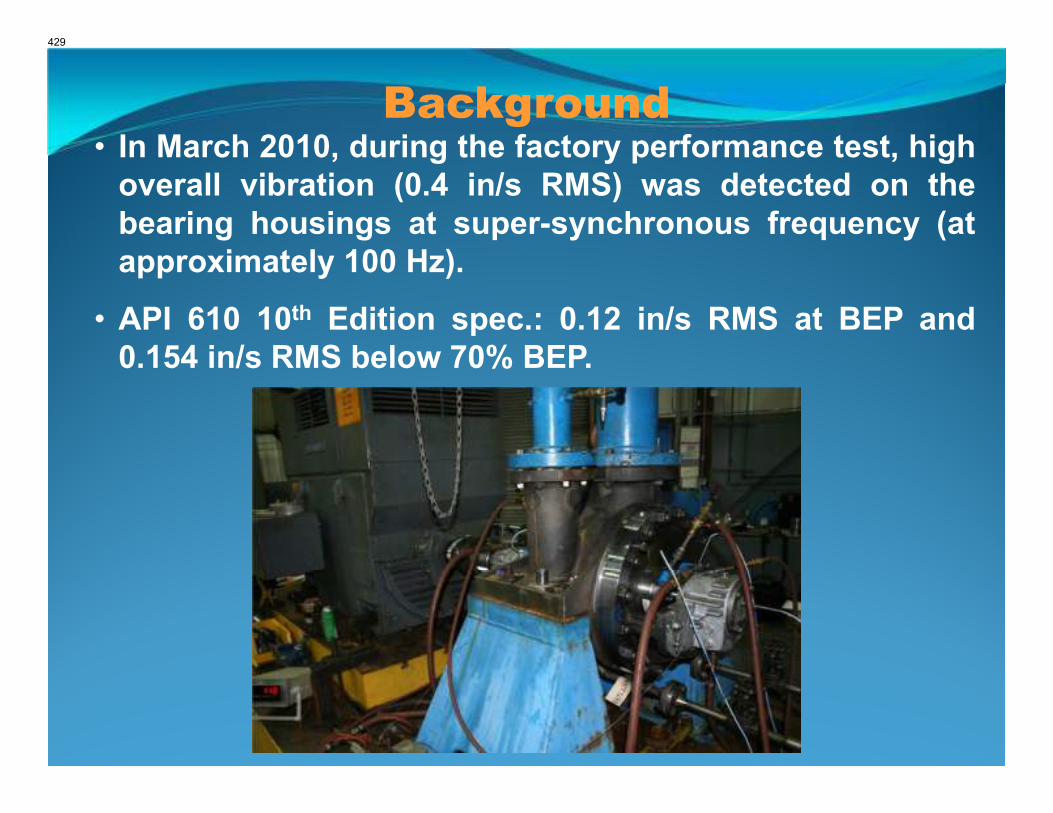
• In March 2010, during the factory performance test, high
overall vibration (0.4 in/s RMS) was detected on the
bearing housings at super-synchronous frequency (at
approximately 100 Hz).
• API 610 10th Edition spec.: 0.12 in/s RMS at BEP and
0.154 in/s RMS below 70% BEP.
Background
429

• Pump provided with “wrap-around” coke-crusher wear
ring design with 3 struts (unevenly spaced) and a six-
vane impeller.
Background
430

• Over 8 months period, the pump was tested in
several test facilities with different drivers suggesting
that the problem was internal within the pump and
not related to a support structure natural frequency
nor acoustic natural frequencies from the piping
system. Later the pump was sent to the R&D
Facilities for extensive testing, where the pump was
tested at two different speeds without significant
difference in the high vibration.
• Internal modifications were implemented by off-
setting the coke-breaker struts and also removing
them without success.
• MSI was requested to evaluate the basis for highly
unusual and unexpected rotordynamic issues.
Background
431

Vibration Testing
• Continuous Monitoring testing during transient and
steady operation to monitor the shaft and bearing
vibration amplitude, structural natural frequencies,
pressure pulsations, torsional natural frequencies,
etc.
• Operating Deflection Shape (ODS) testing during
steady operation.
• Experimental Modal Analysis (EMA) test to
determine the natural frequencies of the pump
structure and the rotor system.
432
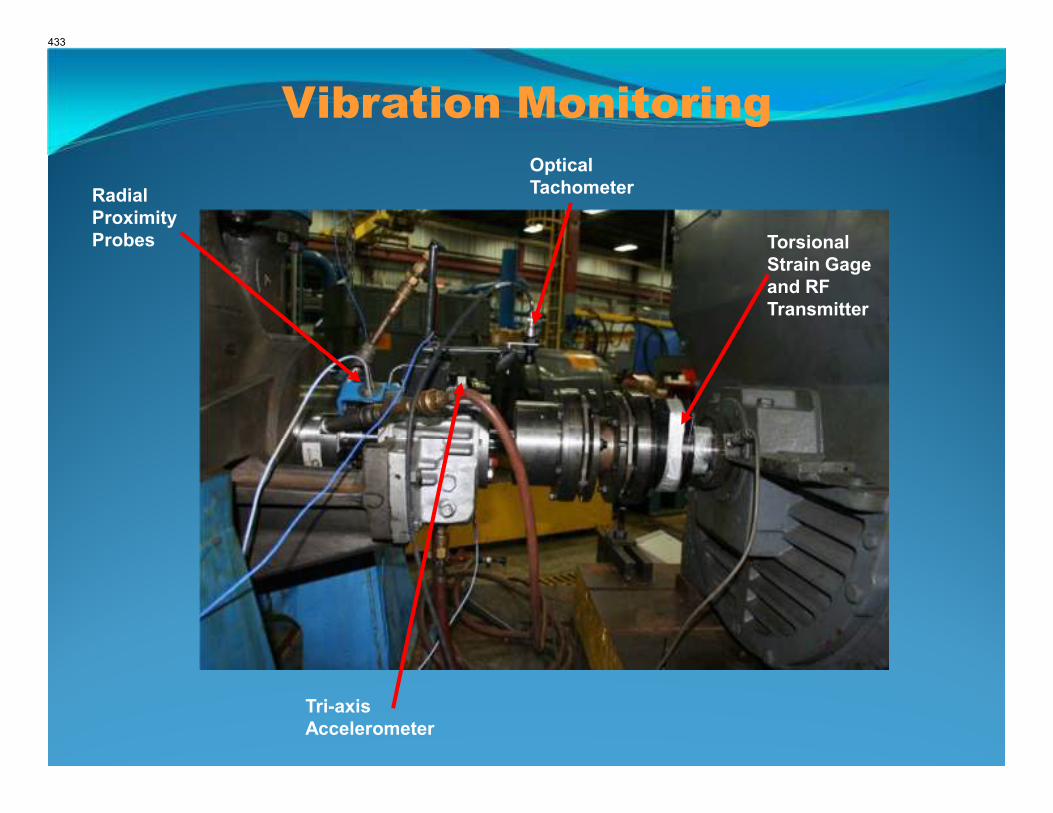
Vibration Monitoring
Radial
Proximity
Probes
Tri-axis
Accelerometer
Optical
Tachometer
Torsional
Strain Gage
and RF
Transmitter
433

Vibration Monitoring
Radial &
Axial
Proximity
Probes
Tri-Axis
Accelerometer
Dynamic
Pressure
Transducers
Torsional
Strain Gage
and RF
Transmitter
434

Vibration Monitoring
Summary Table Overall Vibration Amplitude
at Two Different Speeds and Flow Rates
Worse vibration case for each speed condition
Note: Vibrations above 0.30 in/s RMS are red/bold
Pump OBB Pump IBB Suct. Nozzle Disch. Nozzle
TimeSpeed
(Hz)
Flow
(GPM)TDH (ft)
Ch 1
(Axial)
Ch 2
(Hor)
Ch 3
(Vert)
Ch 4
(Axial)
Ch 5
(Hor)
Ch 6
(Vert)
Ch 7
(Vert)
Ch 8
(Axial)
Ch 9
(Hor)
Ch 10
(Vert)
Ch 11
(Axial)
Ch 12
(Hor)
13:56 49.5 304 636 0.13 0.024 0.13 0.11 0.11 0.145 0.085 0.14 0.09 0.06 0.11 0.1
14:06 49.5 6.4 628 0.15 0.03 0.17 0.12 0.25 0.2 0.09 0.16 0.09 0.07 0.13 0.1
14:15 49.5 311 634 0.13 0.03 0.13 0.11 0.11 0.16 0.09 0.12 0.08 0.06 0.11 0.09
14:24 49.5 611 612 0.12 0.02 0.14 0.12 0.12 0.16 0.09 0.14 0.09 0.06 0.13 0.09
14:36 49.5 911 563 0.14 0.03 0.16 0.19 0.15 0.18 0.14 0.13 0.09 0.07 0.13 0.1
14:45 49.5 966 552 0.13 0.12 0.15 0.15 0.14 0.16 0.18 0.13 0.09 0.07 0.13 0.09
14:53 49.5 1226 484 0.15 0.14 0.19 0.21 0.18 0.22 0.22 0.15 0.1 0.09 0.17 0.1
15:00 49.5 1533 359 0.14 0.14 0.16 0.2 0.18 0.22 0.24 0.14 0.09 0.09 0.16 0.2
15:19 59.25 6 885 0.24 0.3 0.25 0.23 0.47 0.34 0.17 0.19 0.18 0.13 0.2 0.18
15:24 59.25 359 876 0.22 0.31 0.2 0.22 0.37 0.29 0.11 0.18 0.17 0.11 0.19 0.18
15:29 59.25 727 853 0.24 0.31 0.23 0.3 0.28 0.31 0.16 0.19 0.17 0.12 0.21 0.18
15:34 59.25 1092 781 0.25 0.31 0.33 0.28 0.26 0.28 0.22 0.19 0.17 0.15 0.22 0.18
15:39 59.25 1163 764 0.26 0.32 0.38 0.31 0.27 0.31 0.24 0.19 0.17 0.17 0.24 0.19
15:44 59.25 1463 680 0.25 0.29 0.28 0.33 0.23 0.27 0.19 0.17 0.15 0.13 0.18 0.17
15:49 59.25 1823 511 0.22 0.23 0.18 0.22 0.21 0.2 0.12 0.15 0.14 0.21 0.16 N/A
15:57 59.25 1159 767 0.24 0.32 0.26 0.27 0.26 0.27 0.16 0.19 0.17 0.14 0.21 0.18
Overall Vibration (in/s RMS)Condition
435

Continuous Monitoring Test
Running Speed 3570 rpm – 1163 GPM – 764 ft
436

0 40 80 120 160 200 240 280 320 360 400
[Hz]
1u
2u
5u
10u
20u
50u
100u
200u
500u
1m
2m
5m
10m
20m
50m
0.1
0.2
0.51
[in/s]
Cursor values
X: 94.625 Hz
Y: 57.166m in/s
Autospectrum(Signal 3) - Mark 1 (Real) \ FFT Analyzer
OBB Vertical Overall: 0.38 in/s RMS
Vibration Monitoring
Running Speed 3570 rpm (59.5 Hz) – 1163 GPM – 764 ft
1x rpm 1.59x rpm
437

0 40 80 120 160 200 240 280 320 360 400
[Hz]
50u
100u
200u
500u
1m
2m
5m
10m
20m
50m
0.1
0.2
0.5
1
2
[mil]
Cursor values
X: 94.875 Hz
Y: 3.225 mil
4
Autospectrum(Signal 17) - Mark 1 (Real) \ FFT Analyzer
Vibration Monitoring
Running Speed 3570 rpm (59.5 Hz) – 1163 GPM – 764 ft
1x rpm 1.59x rpm
IBB-YIBB Proximity probe Y: 9.1 mils pk-pk @ 95 Hz
438

Vibration Monitoring
OBB IBB
Radial Proximity Probes
~9.0 mils pk-pk ~9.5 mils pk-pk
Orbit(Signal 14,Signal 15) (Nyquist)
Working : 1159 GPM Linear Rec 15 OK : Input : FFT Analyzer
-6
-4
-2
0
2
4
6
[mil]
[mil]-6 -4 -2 0 2 4 6
Orbit(Signal 14,Signal 15) (Nyquist)
Working : 1159 GPM Linear Rec 15 OK : Input : FFT Analyzer
-6
-4
-2
0
2
4
6
[mil]
[mil]-6 -4 -2 0 2 4 6
Orbit(Signal 16,Signal 17) (Nyquist)
Working : 1159 GPM Linear Rec 15 OK : Input : FFT Analyzer
-6
-4
-2
0
2
4
6
[mil]
[mil]-6 -4 -2 0 2 4 6
Orbit(Signal 16,Signal 17) (Nyquist)
Working : 1159 GPM Linear Rec 15 OK : Input : FFT Analyzer
-6
-4
-2
0
2
4
6
[mil]
[mil]-6 -4 -2 0 2 4 6
Running Speed 3570 rpm (59.5 Hz) – 1163 GPM – 764 ft
439

Transient Continuous Monitoring
During Coast-Down
from 3570 rpm to 0 rpm
440

Vibration Monitoring
Super-synchronous
vibration diminished
at 1380 rpm and
below
Super-synchronous
vibration
1x rpm 1x rpm
Super-synchronous
vibration
Super-synchronous
vibration
1x rpm 1x rpm
441

o Shaft center-line plots viewed from the NDE
o Shaft position in seconds during the coast-down from 3570 rpm (0 sec) to 0 rpm 750 sec.
o The shaft moves towards the upper left position after the pump starts (towards 9 O’clock
position).
o Green circles represents the shaft centerline plots simulating the start-up process from
the bottom (off-set plots). Note the static cross-coupled stiffness force (FKyx) is larger
than the calculated synchronous damping force (FCxx) when the shaft speed is above
1380 rpm.
FKyxFCyyFKyxFCyy
Super-synchronous
spike disappears
below 1380 rpm
Super-synchronous
spike disappears
below 1380 rpm
Vibration Monitoring
Full Speed 3570 rpm Full Speed 3570 rpm
Zero Speed 0 rpm Zero Speed 0 rpm
Shaft position in time (seconds) Shaft position in time (seconds)
442

Operating Deflection Shape (ODS)
Testing
Forced Response Test Results
443

Operating Deflection Shape
Over 600 vibration
measurement/ directions
ODS Computer Model
444

Operating Deflection Shape
ODS Animation @ 1x rpm (59.4 Hz)
445

Operating Deflection Shape
ODS Animation @ 94.8 Hz
446

Experimental Modal Analysis (EMA)
Testing
Frequency Response Test Results
447

Frequency Response(Signal 17,Signal 7) - Mark 1 (Magnitude)
Working : rotor modal IBB Hor rec 9 : Input : Enhanced
0 40 80 120 160 200 240 280 320 360 400
1u
3u
10u
30u
100u
300u
1m
3m
10m
[Hz]
[mil /lbf] Frequency Response(Signal 17,Signal 7) - Mark 1 (Magnitude)
Working : rotor modal IBB Hor rec 9 : Input : Enhanced
0 40 80 120 160 200 240 280 320 360 400
1u
3u
10u
30u
100u
300u
1m
3m
10m
[Hz]
[mil /lbf]
Pump Rotor Frequency Response Function (FRF) plot
while the pump was not operating
Radial Proximity Probe IBB-Y
98.0 Hz
Experimental Modal Analysis
448

Experimental Modal Analysis
Frequency Response(Signal 14,Signal 7) - Input (Magnitude)
Working : Input : Input : Enhanced
0 40 80 120 160 200 240 280 320 360 400
10u
30u
100u
300u
1m
3m
10m
30m
100m
[Hz]
[mil /lbf] Frequency Response(Signal 14,Signal 7) - Input (Magnitude)
Working : Input : Input : Enhanced
0 40 80 120 160 200 240 280 320 360 400
10u
30u
100u
300u
1m
3m
10m
30m
100m
[Hz]
[mil /lbf]
FRF plot while the pump was operating at 49.5 Hz
– 615 GPM and 616 ft of TDH
Reading from the radial proximity probe OBB-X
Note that the rotor natural frequency shifted upwards with
the speed and the stiffness from the wear rings.
111 Hz
1x rpm
449

Visual Inspection
450

IB side impeller wear
ring with evidence of
rubbing
Case wear ring rub only
between 9 and 12 O’clock as
viewed from the NDE or OBB
Visual Inspection
451
Preliminary Conclusions
1. The high vibration of the pump was due to a rotordynamic
instability exciting the first bending mode of the pump shaft.
2. The excitation source was likely from fluid whirl and non
axi-symmetric pressure within the "wrap-around" coke
crusher wear rings that were acting as large sleeve
bearings.
3. The ratio between the super-synchronous vibration
frequency with respect to the running speed frequency was
not constant, pending to sure out stall phenomena.
4. The first bending mode of the pump rotor at 98 Hz shifted to
approximately 111 Hz while the pump was operating. The
large excitation at 94.9 Hz, apparently from super-
synchronous fluid whirl led to entrainment of the nearby
rotor’s lateral natural frequency, causing large amplification
of the shaft vibration at the super-synchronous frequency.
452
Proposed Recommendations
1. Based on a collaborative discussion with the OEM, one fix
option for this instability was the addition of swirl-breakers by
milling radial vanelets (slots) on the case wear ring. These 18
slots were equally spaced leaving vanelets of 1/8” of width and
¼” of axial depth.
2. The wrap-around wear ring was modified with a tapered design
at the ID side of the ring with approximately 2 to 3 degrees with
the widest clearance at the exit of the seal at the pump suction.
453

Proposed Recommendations
454

Follow-Up Testing
455

0 40 80 120 160 200 240 280 320 360 400
[Hz]
100n
200n
500n
1u
2u
5u
10u
20u
50u
100u
200u
500u
1m
2m
5m
10m
20m
50m0.1
[in/s]
Cursor values
X: 59.250 Hz
Y: 8.510m in/s
Autospectrum(Signal 8) - Mark 1 (Magnitude) \ FFT Analyzer
OBB Vertical Overall: 0.05 in/s RMS
Vibration Monitoring
Running Speed 3555 rpm (59.3 Hz) – 1163 GPM – 741 ft
1x rpm
456

0 40 80 120 160 200 240 280 320 360 400
[Hz]
50u
100u
200u
500u
1m
2m
5m
10m
20m
50m
0.1
0.2
[mil]
Cursor values
X: 59.250 Hz
Y: 0.404 mil
Autospectrum(Signal 3) - Mark 1 (Magnitude) \ FFT Analyzer
Vibration Monitoring
1x rpm
IBB-YIBB Proximity probe Y: 1.1 mils pk-pk @ 59.3 Hz
Running Speed 3555 rpm (59.3 Hz) – 1163 GPM – 741 ft
457

Vibration Monitoring
Radial Proximity Probes
Running Speed 3555 rpm (59.3 Hz) – 1163 GPM – 741 ft
OBB IBB
~2 mils pk-pk ~2.1 mils pk-pk
Orbit(Signal 1,Signal 2) (Nyquist)
Working : 1164 GPM rec 11 : Input : FFT Analyzer
-2
-1.6
-1.2
-800m
-400m
0
400m
800m
1.2
1.6
2
[mil ]
[mil ]-2 -1.5 -1 -500m 0 500m 1 1.5 2
Orbit(Signal 1,Signal 2) (Nyquist)
Working : 1164 GPM rec 11 : Input : FFT Analyzer
-2
-1.6
-1.2
-800m
-400m
0
400m
800m
1.2
1.6
2
[mil ]
[mil ]-2 -1.5 -1 -500m 0 500m 1 1.5 2
Orbit(Signal 3,Signal 4) (Nyquist)
Working : 1164 GPM rec 11 : Input : FFT Analyzer
-2
-1.6
-1.2
-800m
-400m
0
400m
800m
1.2
1.6
2
[mil ]
[mil ]-2 -1.5 -1 -500m 0 500m 1 1.5 2
Orbit(Signal 3,Signal 4) (Nyquist)
Working : 1164 GPM rec 11 : Input : FFT Analyzer
-2
-1.6
-1.2
-800m
-400m
0
400m
800m
1.2
1.6
2
[mil ]
[mil ]-2 -1.5 -1 -500m 0 500m 1 1.5 2
Mostly Run-Out Mostly Run-Out
458

• The root cause of the vibration on this pump was due to a
rotordynamic instability exciting the first bending mode of
the pump rotor.
• A typical rotor dynamic analysis would not be able to predict
this type of excitation forcing function. In order to predict
this type of excitation, a detailed CFD analysis would need to
be performed, which is not a common practice.
• After modifications performed on the wrap-around wear ring,
the super-synchronous vibration disappeared. The overall
vibration from the bearing housing and the shaft were
reduced by a factor of 4.5.
• EMA testing of the rotor, while in operation (Time-Averaged
Pulse technique), is a powerful troubleshooting tool to
determine rotor natural frequencies in any pumping system
or turbomachine.
Conclusions
459

Thank you
Any QuestionsO?
460


