Download - 3Q 2020 Earnings Conference Call

© 2020 Raytheon Technologies
All rights reserved
3Q 2020 Earnings
Conference CallOctober 27, 2020
Forward-Looking Statements
This press release contains statements which, to the extent they are not statements of historical or present fact, constitute “forward-looking statements” under the securities laws. From time to time, oral or written forward-
looking statements may also be included in other information released to the public. These forward-looking statements are intended to provide Raytheon Technologies Corporation’s (“RTC”) management’s current
expectations or plans for our future operating and financial performance, based on assumptions currently believed to be valid. Forward-looking statements can be identified by the use of words such as “believe,” “expect,”
“expectations,” “plans,” “strategy,” “prospects,” “estimate,” “project,” “target,” “anticipate,” “will,” “should,” “see,” “gu idance,” “outlook,” “confident,” “on track” and other words of similar meaning. Forward-looking statements
may include, among other things, statements relating to future sales, earnings, cash flow, results of operations, uses of cash, share repurchases, tax rates, R&D spend, other measures of financial performance, potential
future plans, strategies or transactions, credit ratings and net indebtedness, other anticipated benefits to RTC of United Technologies Corporation’s (“UTC”) Rockwell Collins acquisition, the merger between UTC and
Raytheon Company (“Raytheon”, and such merger, the “merger”) or the spin-offs by UTC of Otis Worldwide Corporation and Carrier Global Corporation into separate independent companies (the “separation
transactions”), including estimated synergies and customer cost savings resulting from the merger and the separation transact ions and other statements that are not solely historical facts. All forward-looking statements
involve risks, uncertainties and other factors that may cause actual results to differ materially from those expressed or implied in the forward-looking statements. For those statements, we claim the protection of the safe
harbor for forward-looking statements contained in the U.S. Private Securities Litigation Reform Act of 1995. Such risks, uncertainties and other factors include, without limitation: (1) the effect of economic conditions in the
industries and markets in which RTC operates in the U.S. and globally and any changes therein, including financial market conditions, fluctuations in commodity prices, interest rates and foreign currency exchange rates,
levels of end market demand in both the commercial and defense segments of the aerospace industry, levels of air travel, financial condition of commercial airlines, and the impact of pandemic health issues (including
COVID-19 and its effects, among other things, on global supply, demand and distribution capabilities as the COVID-19 outbreak continues and results in an increasingly prolonged period of disruption to air travel and
commercial activities generally, and significant restrictions and limitations on businesses, particularly within the aerospace and commercial airlines industries) aviation safety concerns, weather conditions and natural
disasters, the financial condition of our customers and suppliers, and the risks associated with U.S. government sales (including changes or shifts in defense spending due to budgetary constraints, spending cuts resulting
from sequestration or the allocation of funds to governmental responses to COVID-19, a government shutdown, or otherwise, and uncertain funding of programs); (2) challenges in the development, production, delivery,
support, performance and realization of the anticipated benefits (including our expected returns under customer contracts) of advanced technologies and new products and services; (3) the scope, nature, impact or timing
of acquisition and divestiture activity, including among other things the integration of UTC’s and Raytheon’s businesses or the integration of RTC with other businesses and realization of synergies and opportunities for
growth and innovation and incurrence of related costs and expenses; (4) RTC’s levels of indebtedness, capital spending and research and development spending; (5) future availability of credit and factors that may affect
such availability, including credit market conditions and our capital structure; (6) the timing and scope of future repurchases by RTC of its common stock, which have been suspended through the end of the calendar year
and may continue to be suspended, or discontinued or delayed, at any time due to various factors, including market conditions and the level of other investing activities and uses of cash; (7) delays and disruption in
delivery of materials and services from suppliers; (8) company and customer-directed cost reduction efforts and restructuring costs and savings and other consequences thereof (including the potential termination of U.S.
government contracts and performance under undefinitized contract awards and the potential inability to recover termination costs); (9) new business and investment opportunities; (10) the ability to realize the intended
benefits of organizational changes; (11) the anticipated benefits of diversification and balance of operations across product lines, regions and industries; (12) the outcome of legal proceedings, investigations and other
contingencies; (13) pension plan assumptions and future contributions; (14) the impact of the negotiation of collective bargaining agreements and labor disputes; (15) the effect of changes in political conditions in the U.S.
and other countries in which RTC and its businesses operate, including a change in the Administration or change in the makeup of Congress following the outcome of the November 2020 elections that may impact, among
other things, regulatory approvals, the effect of changes in U.S. trade policies or the U.K.’s withdrawal from the European Union, on general market conditions, global trade policies and currency exchange rates in the near
term and beyond; (16) the effect of changes in tax (including U.S. tax reform enacted on December 22, 2017, which is commonly referred to as the Tax Cuts and Jobs Act of 2017), environmental, regulatory and other laws
and regulations (including, among other things, export and import requirements such as the International Traffic in Arms Regulations and the Export Administration Regulations, anti-bribery and anti-corruption
requirements, including the Foreign Corrupt Practices Act, industrial cooperation agreement obligations, and procurement and other regulations) in the U.S. and other countries in which RTC and its businesses operate;
(17) the possibility that the anticipated benefits from the combination of UTC’s and Raytheon’s businesses (including ongoing integration activities from historic UTC and Raytheon acquisitions prior to the merger) cannot
be realized in full or at all or may take longer to realize than expected, or the possibility that costs or difficulties related to the integration of UTC’s businesses with Raytheon’s will be greater than expected or may not result
in the achievement of estimated synergies within the contemplated time frame or at all; (18) the ability of RTC to retain and hire key personnel and the ability of our personnel to continue to operate our facilities and
businesses around the world in light of, among other factors, the COVID-19 outbreak; (19) the expected benefits to RTC of the separation transactions; (20) the intended qualification of (i) the merger as a tax-free
reorganization and (ii) the separation transactions as tax-free to UTC and former UTC shareowners, in each case, for U.S. federal income tax purposes; and (21) the risk that dissynergy costs incurred in connection with
the separation transactions will exceed legacy UTC’s or legacy Raytheon’s estimates. For additional information on identify ing factors that may cause actual results to vary materially from those stated in forward-looking
statements, see the reports of RTC, UTC and Raytheon on Forms S-4, 10-K, 10-Q and 8-K filed with or furnished to the Securities and Exchange Commission from time to time. Any forward-looking statement speaks only
as of the date on which it is made, and RTC assumes no obligation to update or revise such statement, whether as a result of new information, future events or otherwise, except as required by applicable law.
Note: All results and expectations in the presentation reflect continuing operations unless otherwise noted.
1

• Sales in line with expectations, and better than expected adjusted EPS and free cash flow
• Robust defense backlog of over $70B
• Executing cost reduction and cash conservation actions
• ~$700M of cost reduction realized in 3Q
• ~$1.9B of cash conservation realized in 3Q
• Achieved over $65M in RTX synergies (~$100M year-to-date)
• Achieved $40M in Collins synergies (~$430M acquisition to date)
• Completed Military GPS and Space ISR divestitures resulting in $2B net proceeds
3Q Highlights
2
Results reflect continued progress and acceleration of cost reduction and cash conservation actions
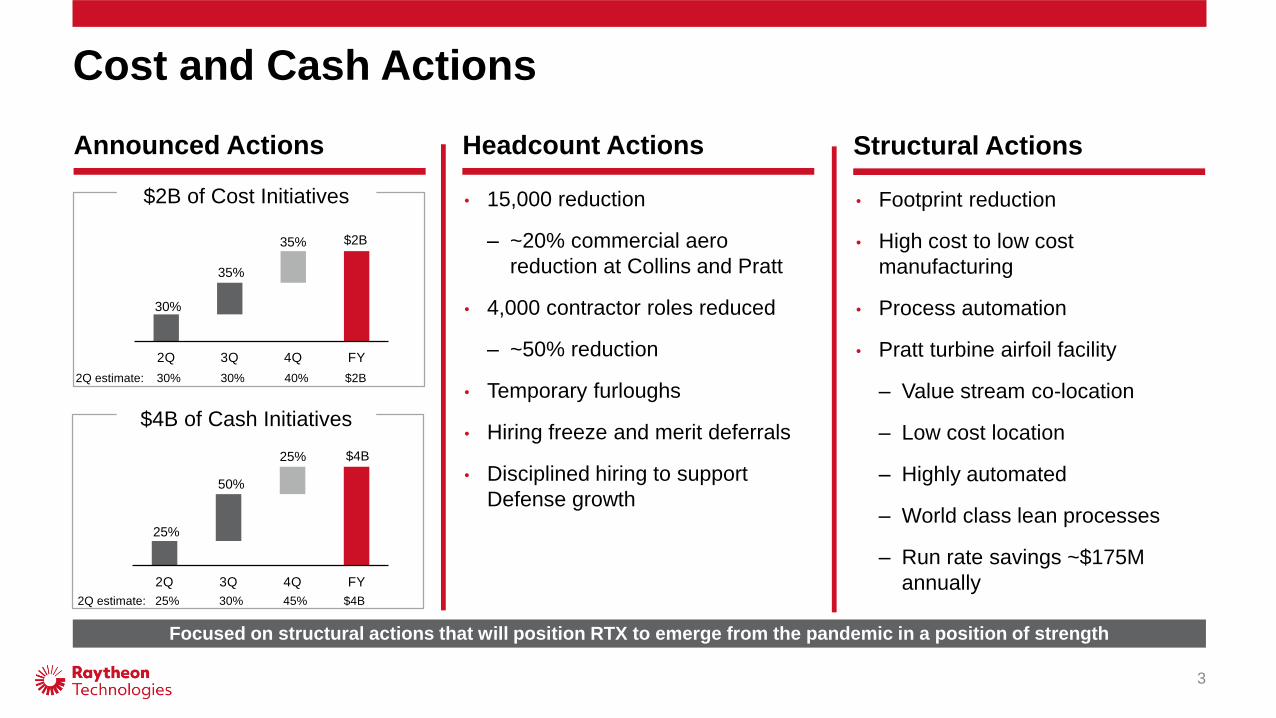
Cost and Cash Actions
Focused on structural actions that will position RTX to emerge from the pandemic in a position of strength
$2B of Cost Initiatives
$4B of Cash Initiatives
3
Announced Actions Structural ActionsHeadcount Actions
• Footprint reduction
• High cost to low cost
manufacturing
• Process automation
• Pratt turbine airfoil facility
– Value stream co-location
– Low cost location
– Highly automated
– World class lean processes
– Run rate savings ~$175M
annually
• 15,000 reduction
– ~20% commercial aero
reduction at Collins and Pratt
• 4,000 contractor roles reduced
– ~50% reduction
• Temporary furloughs
• Hiring freeze and merit deferrals
• Disciplined hiring to support
Defense growth
2Q estimate: 30% 30% 40% $2B
2Q estimate: 25% 30% 45% $4B
30%
35%
35% $2B
2Q 3Q 4Q FY
25%
50%
25% $4B
2Q 3Q 4Q FY
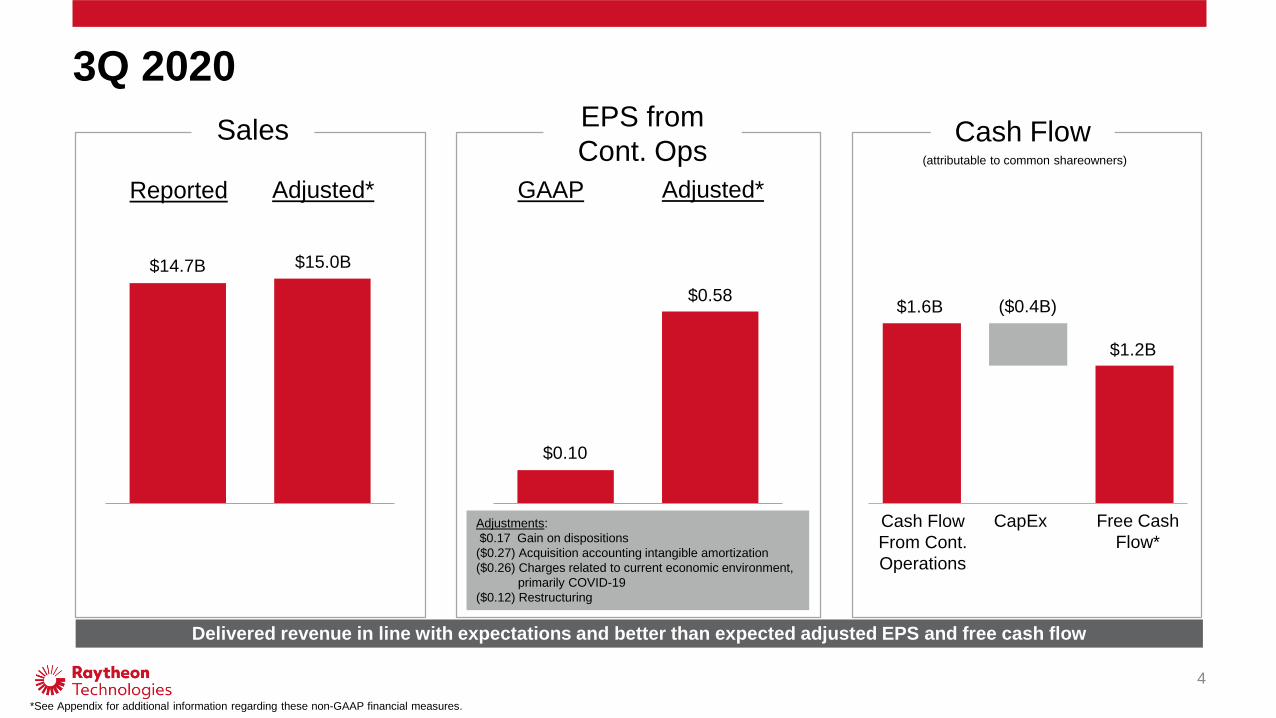
3Q 2020
$14.7B
(attributable to common shareowners)
*See Appendix for additional information regarding these non-GAAP financial measures.
Adjusted*GAAP
Delivered revenue in line with expectations and better than expected adjusted EPS and free cash flow
4
$15.0B
Reported Adjusted*
Cash FlowSales
$1.6B ($0.4B)
$1.2B
Adjustments:
$0.17 Gain on dispositions
($0.27) Acquisition accounting intangible amortization
($0.26) Charges related to current economic environment,
primarily COVID-19
($0.12) Restructuring
Free Cash
Flow*
Cash Flow
From Cont.
Operations
CapEx
EPS from
Cont. Ops
$0.10
$0.58
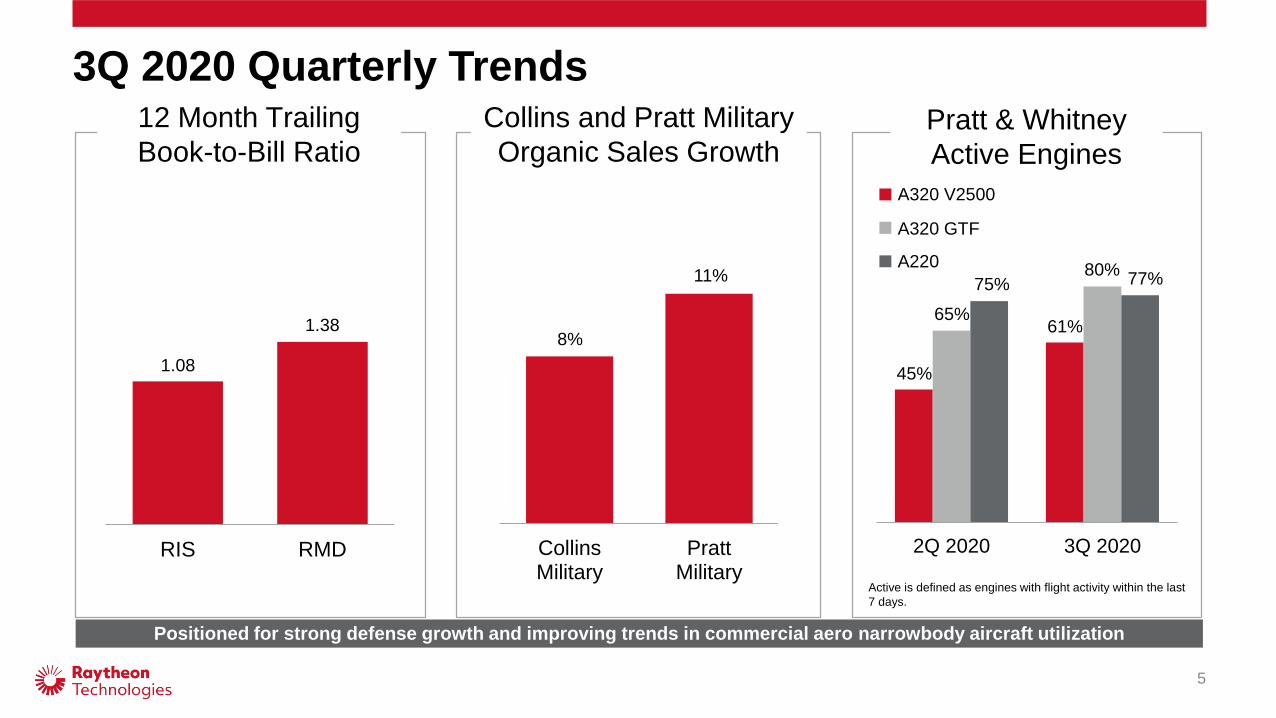
RIS RMD 2Q 2020 3Q 2020CollinsMilitary
PrattMilitary
3Q 2020 Quarterly Trends
11%
Positioned for strong defense growth and improving trends in commercial aero narrowbody aircraft utilization
5
8%
45%
65%
A320 V2500
A320 GTF
1.08
1.38
A220
75%
61%
80%77%
12 Month Trailing
Book-to-Bill Ratio
Collins and Pratt Military
Organic Sales GrowthPratt & Whitney
Active Engines
Active is defined as engines with flight activity within the last
7 days.
• Organic sales* down 33%
• Adjusted sales* down 34%
– Commercial OEM down 44%
– Commercial aftermarket down 52%
– Military up 4% (up 8% ex-divestitures and FX)
• Adjusted operating profit* down 94%
– Lower sales and unfavorable absorption driven by COVID-19 impact
– Cost mitigation tailwinds
– Synergy capture
– Favorable military volume
Collins Aerospace Segment Highlights
3Q 2020
Reported Adjusted* YOY Var.*
Sales 4,274 4,278 (34)%
Operating Profit 526 73 (94)%
ROS 12.3% 1.7%
($ millions)
6
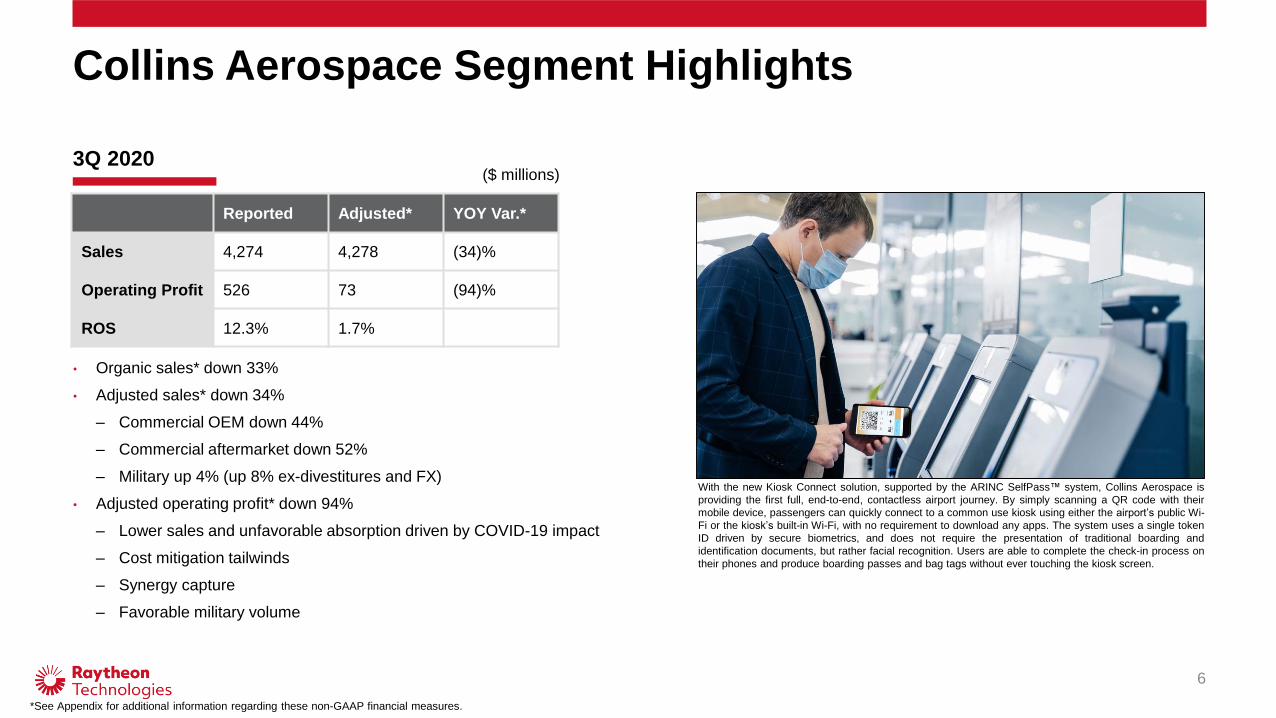
With the new Kiosk Connect solution, supported by the ARINC SelfPass™ system, Collins Aerospace is
providing the first full, end-to-end, contactless airport journey. By simply scanning a QR code with their
mobile device, passengers can quickly connect to a common use kiosk using either the airport’s public Wi-
Fi or the kiosk’s built-in Wi-Fi, with no requirement to download any apps. The system uses a single token
ID driven by secure biometrics, and does not require the presentation of traditional boarding and
identification documents, but rather facial recognition. Users are able to complete the check-in process on
their phones and produce boarding passes and bag tags without ever touching the kiosk screen.
*See Appendix for additional information regarding these non-GAAP financial measures.
• Organic sales* down 34%
• Adjusted sales* down 28%
– Commercial OEM down 30%
– Commercial aftermarket down 51%
– Military up 11%
• Adjusted operating profit* down 108%
– Lower sales and unfavorable absorption driven by COVID-19 impact
– Cost mitigation tailwinds
– Favorable military volume
Pratt & Whitney Segment Highlights
3Q 2020($ millions)
*See Appendix for additional information regarding these non-GAAP financial measures.
7
Reported Adjusted* YOY Var.*
Sales 3,494 3,790 (28)%
Operating Profit (615) (43) (108)%
ROS (17.6)% (1.1)%
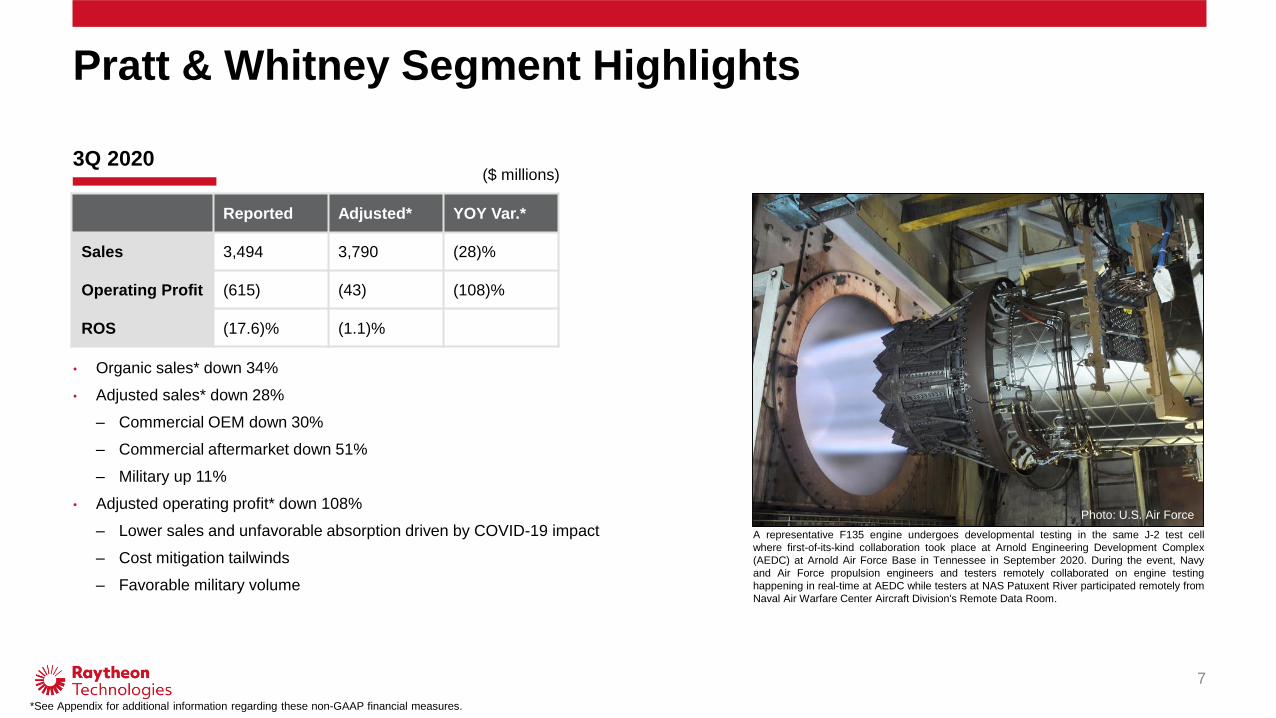
A representative F135 engine undergoes developmental testing in the same J-2 test cell
where first-of-its-kind collaboration took place at Arnold Engineering Development Complex
(AEDC) at Arnold Air Force Base in Tennessee in September 2020. During the event, Navy
and Air Force propulsion engineers and testers remotely collaborated on engine testing
happening in real-time at AEDC while testers at NAS Patuxent River participated remotely from
Naval Air Warfare Center Aircraft Division's Remote Data Room.
Photo: Bell Aircraft
Photo: U.S. Air Force
• Bookings
– $928M of classified bookings
– $176M to perform operations and sustainment for the U. S. Air
Force’s Launch and Test Range System (LTRS)
• 12 month trailing book to bill ratio 1.08
• Q3 book-to-bill ratio 0.85
• Backlog $18.3B
Raytheon Intelligence & Space Segment Highlights
3Q 2020
8
($ millions)
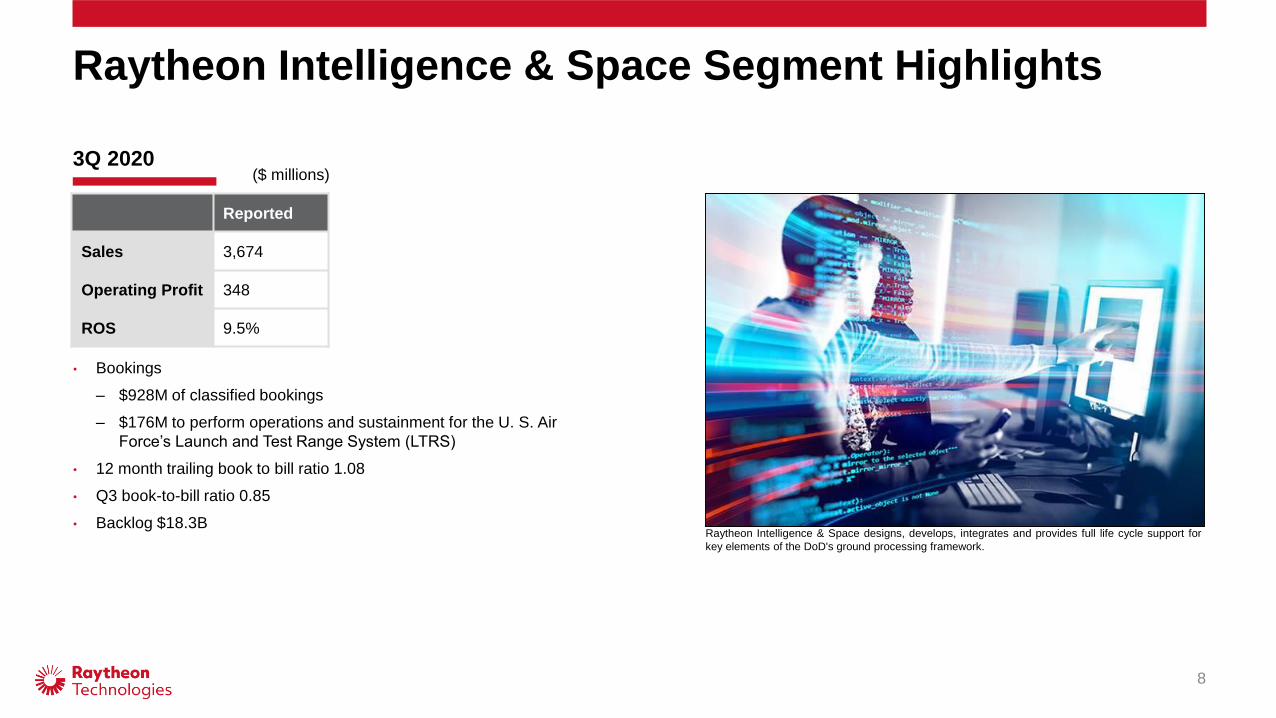
Raytheon Intelligence & Space designs, develops, integrates and provides full life cycle support for
key elements of the DoD's ground processing framework.
Reported
Sales 3,674
Operating Profit 348
ROS 9.5%
Raytheon Missiles & Defense Segment Highlights
3Q 2020
9
• Bookings
– $186M for AN/TPY-2 radar program for the Kingdom of Saudi Arabia
• 12 month trailing book-to-bill ratio 1.38
• Q3 book-to-bill ratio 0.69
• Backlog $31.6B
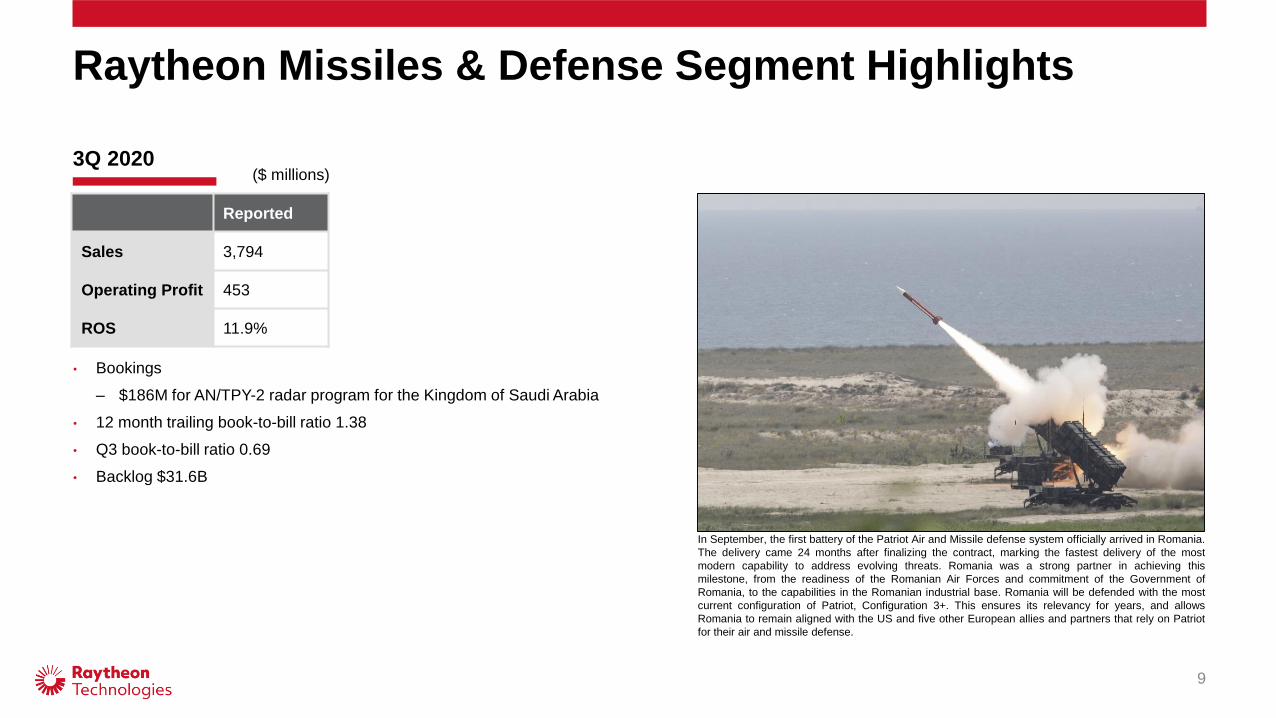
In September, the first battery of the Patriot Air and Missile defense system officially arrived in Romania.
The delivery came 24 months after finalizing the contract, marking the fastest delivery of the most
modern capability to address evolving threats. Romania was a strong partner in achieving this
milestone, from the readiness of the Romanian Air Forces and commitment of the Government of
Romania, to the capabilities in the Romanian industrial base. Romania will be defended with the most
current configuration of Patriot, Configuration 3+. This ensures its relevancy for years, and allows
Romania to remain aligned with the US and five other European allies and partners that rely on Patriot
for their air and missile defense.
Reported
Sales 3,794
Operating Profit 453
ROS 11.9%
($ millions)
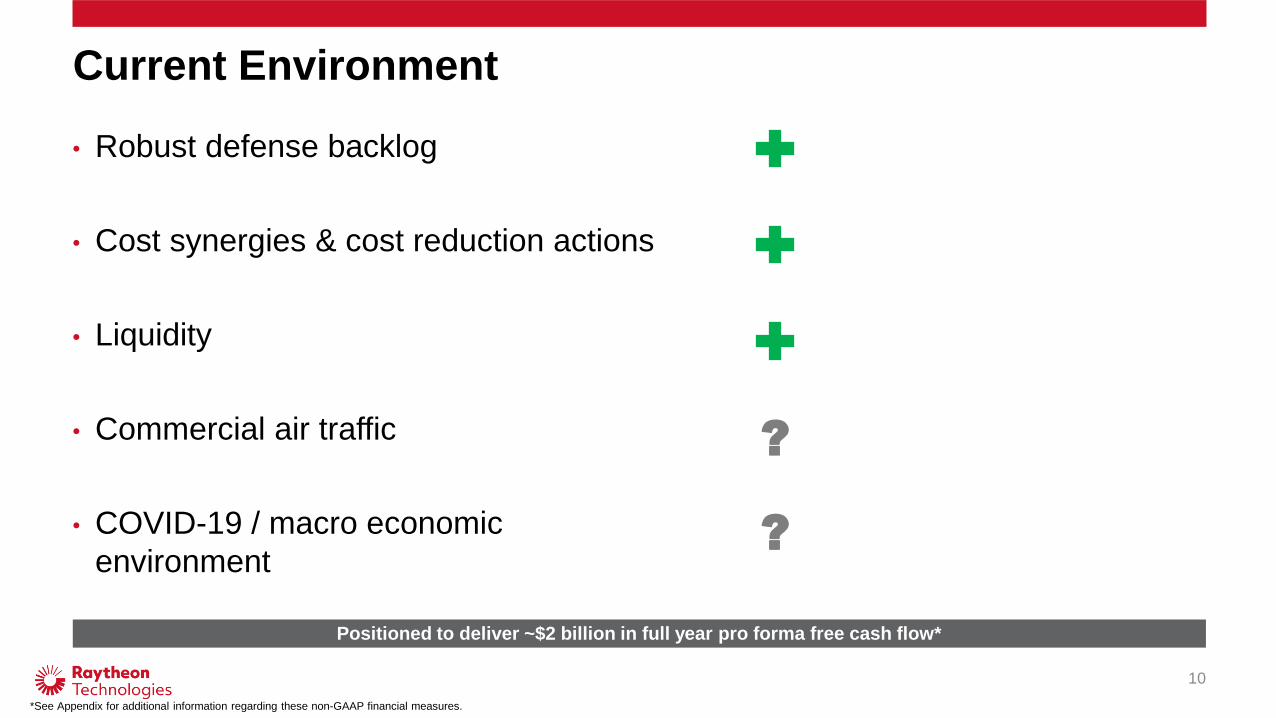
Current Environment
10
Positioned to deliver ~$2 billion in full year pro forma free cash flow*
• Robust defense backlog
• Cost synergies & cost reduction actions
• Liquidity
• Commercial air traffic
• COVID-19 / macro economic
environment
?
?
*See Appendix for additional information regarding these non-GAAP financial measures.
• Support employees, customers and suppliers
• Invest in technology and product innovation
• Execute integration and deliver synergies
• Drive structural cost reduction
• Disciplined capital deployment and maintain strong liquidity
2020 Priorities
Taking decisive actions to position the business for long-term growth
11

© 2020 Raytheon Technologies
All rights reserved

Appendix
13
Raytheon Technologies Corporation’s (“RTC”) reports its financial results in accordance with accounting principles generally accepted in the United States ("GAAP").
We supplement the reporting of our financial information determined under GAAP with certain non-GAAP financial information. The non-GAAP information presented provides investors with additional useful
information, but should not be considered in isolation or as substitutes for the related GAAP measures. Moreover, other companies may define non-GAAP measures differently, which limits the usefulness of
these measures for comparisons with such other companies. We encourage investors to review our financial statements and publicly-filed reports in their entirety and not to rely on any single financial
measure.
Adjusted net sales, organic sales, adjusted operating profit (loss), adjusted net income, adjusted earnings per share (“EPS”), adjusted diluted weighted average shares outstanding, and the adjusted effective
tax rate are non-GAAP financial measures. Adjusted net sales represents consolidated net sales from continuing operations (a GAAP measure), excluding significant items of a non-recurring and/or
nonoperational nature (hereinafter referred to as “other significant items”). Organic sales represents consolidated net sales (a GAAP measure), excluding the impact of foreign currency translation,
acquisitions and divestitures completed in the preceding twelve months and other significant items. Adjusted operating profit (loss) represents income from continuing operations (a GAAP measure),
excluding restructuring costs, acquisition accounting adjustments and other significant items. Adjusted net income represents net income from continuing operations (a GAAP measure), excluding
restructuring costs, acquisition accounting adjustments and other significant items. Adjusted EPS represents diluted earnings per share from continuing operations (a GAAP measure), excluding restructuring
costs, acquisition accounting adjustments and other significant items. Adjusted diluted weighted average shares outstanding represents diluted weighted average shares outstanding (a GAAP measure),
including stock awards which were anti-dilutive during the nine months ended September 30, 2020 as a result of the net loss from operations. The adjusted effective tax rate represents the effective tax rate (a
GAAP measure), excluding the tax effect of restructuring costs, acquisition accounting adjustments and other significant items. For the Business segments, when applicable, adjustments of net sales similarly
reflect continuing operations excluding other significant items, and adjustments of operating profit and margins similarly reflect continuing operations, excluding restructuring, acquisition accounting
adjustments and other significant items.
Free cash flow is a non-GAAP financial measure that represents cash flow from operations (a GAAP measure) less capital expenditures. Management believes free cash flow is a useful measure of liquidity
and an additional basis for assessing RTC's ability to fund its activities, including the financing of acquisitions, debt service, repurchases of RTC's common stock and distribution of earnings to shareowners.
A reconciliation of the non-GAAP measures to the corresponding amounts prepared in accordance with GAAP appears in the tables in this Appendix. The tables provide additional information as to the items
and amounts that have been excluded from the adjusted measures.
When we provide our expectation for free cash flow on a forward-looking basis, a reconciliation of the differences between the non-GAAP expectations and the corresponding GAAP measures (expected cash
flow from operations) generally is not available without unreasonable effort due to potentially high variability, complexity and low visibility as to the items that would be excluded from the GAAP measure in the
relevant future period, such as unusual gains and losses, the ultimate outcome of pending litigation, fluctuations in foreign currency exchange rates, the impact and timing of potential acquisitions and
divestitures, and other structural changes or their probable significance. The variability of the excluded items may have a significant, and potentially unpredictable, impact on our future GAAP results.
Use and Definitions of Non-GAAP Financial Measures
14
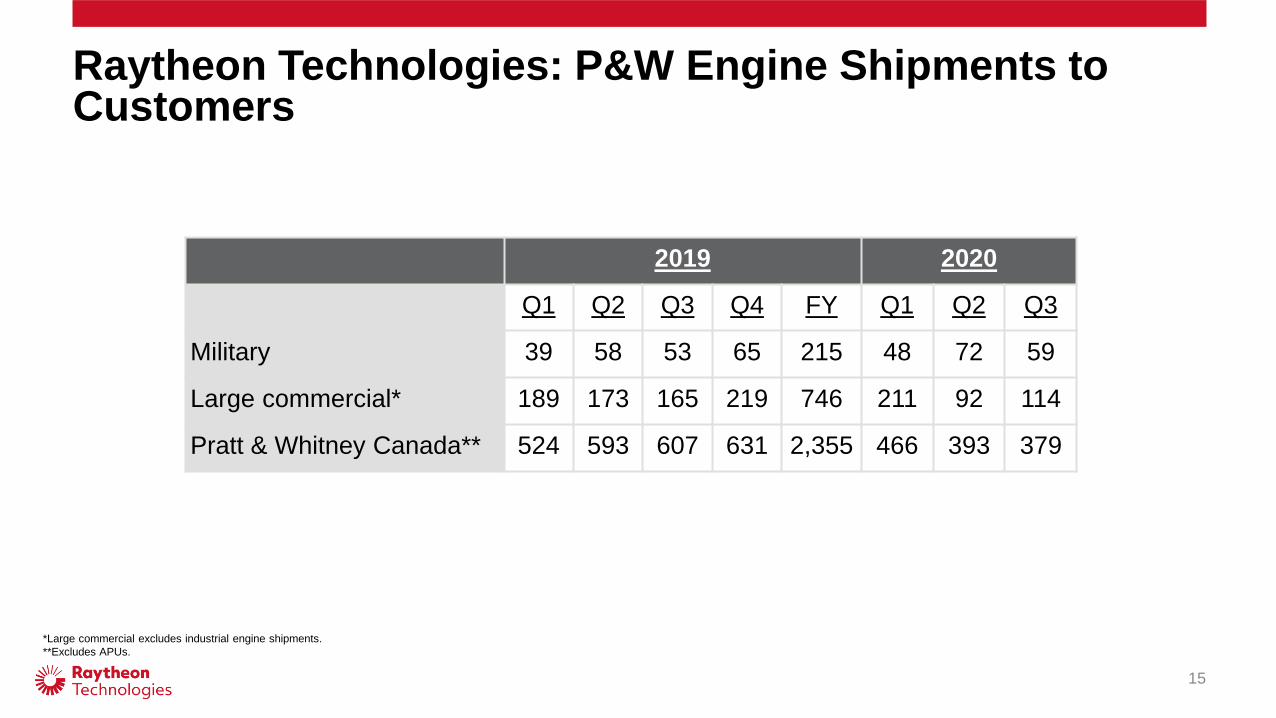
Raytheon Technologies: P&W Engine Shipments to Customers
*Large commercial excludes industrial engine shipments.
**Excludes APUs.
15
2019 2020
Q1 Q2 Q3 Q4 FY Q1 Q2 Q3
Military 39 58 53 65 215 48 72 59
Large commercial* 189 173 165 219 746 211 92 114
Pratt & Whitney Canada** 524 593 607 631 2,355 466 393 379
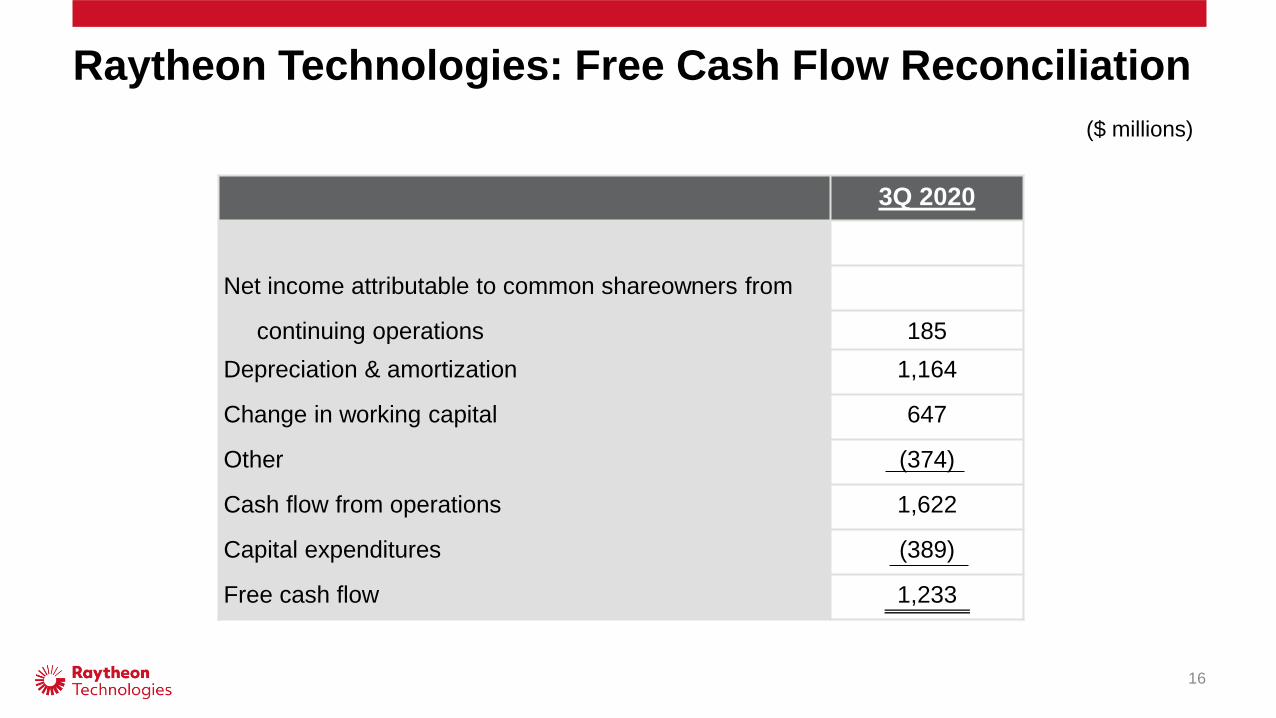
Raytheon Technologies: Free Cash Flow Reconciliation
($ millions)
16
3Q 2020
Net income attributable to common shareowners from
continuing operations 185
Depreciation & amortization 1,164
Change in working capital 647
Other (374)
Cash flow from operations 1,622
Capital expenditures (389)
Free cash flow 1,233
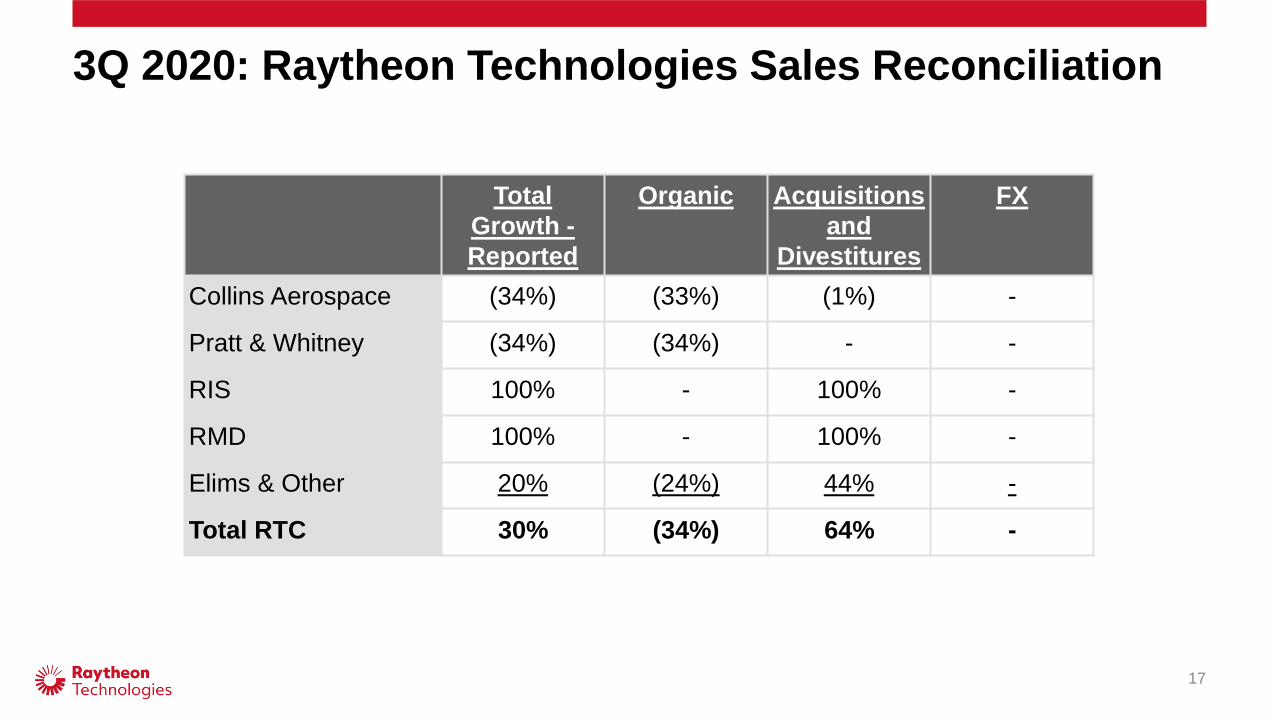
3Q 2020: Raytheon Technologies Sales Reconciliation
17
Total
Growth -
Reported
Organic Acquisitions
and
Divestitures
FX
Collins Aerospace (34%) (33%) (1%) -
Pratt & Whitney (34%) (34%) - -
RIS 100% - 100% -
RMD 100% - 100% -
Elims & Other 20% (24%) 44% -
Total RTC 30% (34%) 64% -
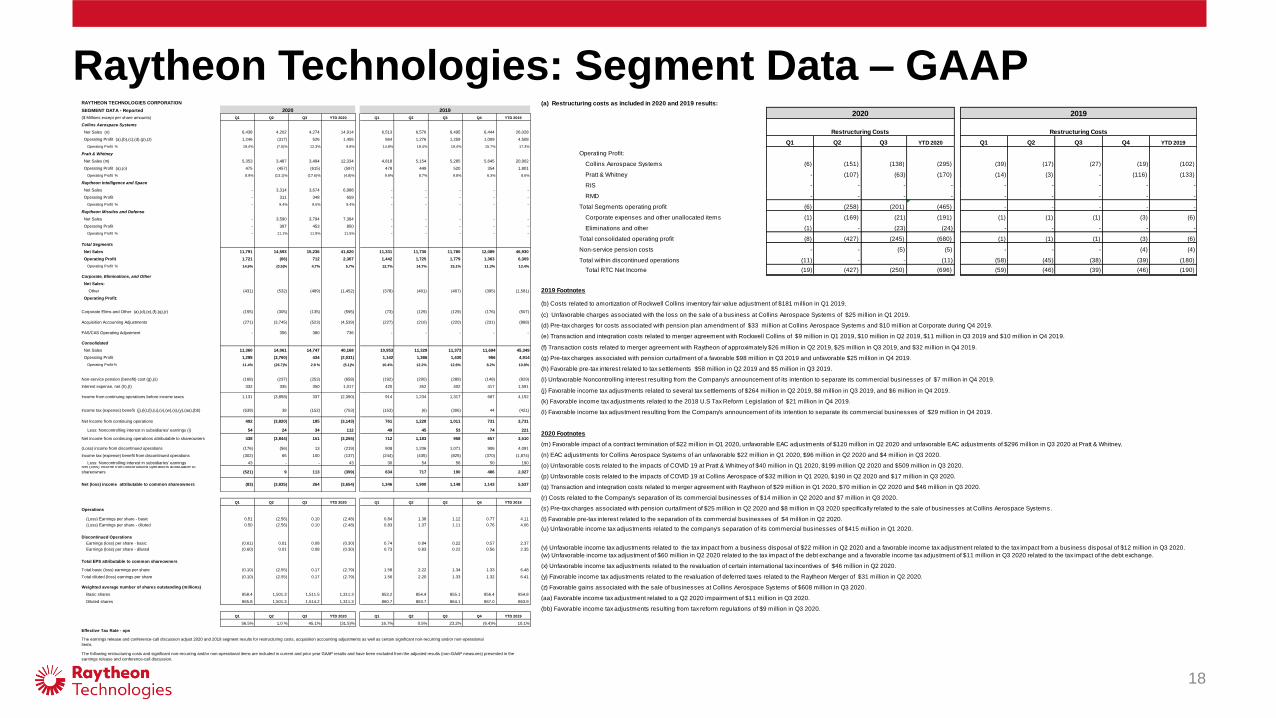
Raytheon Technologies: Segment Data – GAAP
18
RAYTHEON TECHNOLOGIES CORPORATION
SEGMENT DATA - Reported
($ Millions except per share amounts) Q1 Q2 Q3 YTD 2020 Q1 Q2 Q3 Q4 YTD 2019
Collins Aerospace Systems
Net Sales (n) 6,438 4,202 4,274 14,914 6,513 6,576 6,495 6,444 26,028
Operating Profit (a),(b),(c),(d),(p),(z) 1,246 (317) 526 1,455 964 1,276 1,259 1,009 4,508
Operating Profit % 19.4% (7.5)% 12.3% 9.8% 14.8% 19.4% 19.4% 15.7% 17.3%
Pratt & Whitney
Net Sales (m) 5,353 3,487 3,494 12,334 4,818 5,154 5,285 5,645 20,902
Operating Profit (a),(o) 475 (457) (615) (597) 478 449 520 354 1,801
Operating Profit % 8.9% (13.1)% (17.6)% (4.8)% 9.9% 8.7% 9.8% 6.3% 8.6%
Raytheon Intelligence and Space
Net Sales - 3,314 3,674 6,988 - - - - -
Operating Profit - 311 348 659 - - - - -
Operating Profit % - 9.4% 9.5% 9.4% - - - - -
Raytheon Missiles and Defense
Net Sales - 3,590 3,794 7,384 - - - - -
Operating Profit - 397 453 850 - - - - -
Operating Profit % - 11.1% 11.9% 11.5% - - - - - -
Total Segments
Net Sales 11,791 14,593 15,236 41,620 11,331 11,730 11,780 12,089 46,930
Operating Profit 1,721 (66) 712 2,367 1,442 1,725 1,779 1,363 6,309
Operating Profit % 14.6% (0.5)% 4.7% 5.7% 12.7% 14.7% 15.1% 11.3% 13.4%
Corporate, Eliminations, and Other
Net Sales:
Other (431) (532) (489) (1,452) (378) (401) (407) (395) (1,581)
Operating Profit:
Corporate Elims and Other (a),(d),(e),(f),(q),(r) (155) (305) (135) (595) (73) (129) (129) (176) (507)
Acquisition Accounting Adjustments (271) (3,745) (523) (4,539) (227) (210) (220) (231) (888)
FAS/CAS Operating Adjustment - 356 380 736 - - - - -
Consolidated
Net Sales 11,360 14,061 14,747 40,168 10,953 11,329 11,373 11,694 45,349
Operating Profit 1,295 (3,760) 434 (2,031) 1,142 1,386 1,430 956 4,914
Operating Profit % 11.4% (26.7)% 2.9 % (5.1)% 10.4% 12.2% 12.6% 8.2% 10.8%
Non-service pension (benefit) cost (g),(s) (168) (237) (253) (658) (192) (200) (289) (148) (829)
Interest expense, net (h),(t) 332 335 350 1,017 420 352 402 417 1,591
Income from continuing operations before income taxes 1,131 (3,858) 337 (2,390) 914 1,234 1,317 687 4,152
Income tax (expense) benefit (j),(k),(l),(u),(v),(w),(x),(y),(aa),(bb) (639) 38 (152) (753) (153) (6) (306) 44 (421)
Net Income from continuing operations 492 (3,820) 185 (3,143) 761 1,228 1,011 731 3,731
Less: Noncontrolling interest in subsidiaries' earnings (i) 54 24 34 112 49 45 53 74 221
Net income from continuing operations attributable to shareowners 438 (3,844) 151 (3,255) 712 1,183 958 657 3,510
(Loss) income from discontinued operations (176) (56) 13 (219) 908 1,206 1,071 906 4,091
Income tax (expense) benefit from discontinued operations (302) 65 100 (137) (244) (435) (825) (370) (1,874)
Less: Noncontrolling interest in subsidiaries' earnings 43 - - 43 30 54 56 50 190Net (loss) income from discontinued operations attributable to
shareowners (521) 9 113 (399) 634 717 190 486 2,027
Net (loss) income attributable to common shareowners (83) (3,835) 264 (3,654) 1,346 1,900 1,148 1,143 5,537
Q1 Q2 Q3 YTD 2020 Q1 Q2 Q3 Q4 YTD 2019
Operations
(Loss) Earnings per share - basic 0.51 (2.56) 0.10 (2.48) 0.84 1.38 1.12 0.77 4.11
(Loss) Earnings per share - diluted 0.50 (2.56) 0.10 (2.48) 0.83 1.37 1.11 0.76 4.06
Discontinued Operations
Earnings (loss) per share - basic (0.61) 0.01 0.08 (0.30) 0.74 0.84 0.22 0.57 2.37
Earnings (loss) per share - diluted (0.60) 0.01 0.08 (0.30) 0.73 0.83 0.22 0.56 2.35
Total EPS attributable to common shareowners
Total basic (loss) earnings per share (0.10) (2.55) 0.17 (2.79) 1.58 2.22 1.34 1.33 6.48
Total diluted (loss) earnings per share (0.10) (2.55) 0.17 (2.79) 1.56 2.20 1.33 1.32 6.41
Weighted average number of shares outstanding (millions)
Basic shares 858.4 1,501.3 1,511.5 1,311.3 853.2 854.4 855.1 856.4 854.8
Diluted shares 865.8 1,501.3 1,514.2 1,311.3 860.7 863.7 864.1 867.0 863.9
Q1 Q2 Q3 YTD 2020 Q1 Q2 Q3 Q4 YTD 2019
56.5% 1.0 % 45.1% (31.5)% 16.7% 0.5% 23.2% (6.4)% 10.1%
Effective Tax Rate - ops
2020 2019
The earnings release and conference-call discussion adjust 2020 and 2019 segment results for restructuring costs, acquisition accounting adjustments as well as certain significant non-recurring and/or non-operational
items.
The following restructuring costs and significant non-recurring and/or non-operational items are included in current and prior year GAAP results and have been excluded from the adjusted results (non-GAAP measures) presented in the
earnings release and conference-call discussion.
(a) Restructuring costs as included in 2020 and 2019 results:
Q1 Q2 Q3 YTD 2020 Q1 Q2 Q3 Q4 YTD 2019
Operating Profit:
Collins Aerospace Systems (6) (151) (138) (295) (39) (17) (27) (19) (102)
Pratt & Whitney - (107) (63) (170) (14) (3) - (116) (133)
RIS - - - - - - - - -
RMD - - - - - - - - -
Total Segments operating profit (6) (258) (201) (465) - - - - -
Corporate expenses and other unallocated items (1) (169) (21) (191) (1) (1) (1) (3) (6)
Eliminations and other (1) - (23) (24) - - - - -
Total consolidated operating profit (8) (427) (245) (680) (1) (1) (1) (3) (6)
Non-service pension costs - - (5) (5) - - - (4) (4)
Total within discontinued operations (11) - - (11) (58) (45) (38) (39) (180)
Total RTC Net Income (19) (427) (250) (696) (59) (46) (39) (46) (190)
2020 2019
(j) Favorable income tax adjustments related to several tax settlements of $264 million in Q2 2019, $8 million in Q3 2019, and $6 million in Q4 2019.
Restructuring Costs Restructuring Costs
2019 Footnotes
(b) Costs related to amortization of Rockwell Collins inventory fair value adjustment of $181 million in Q1 2019.
(c) Unfavorable charges associated with the loss on the sale of a business at Collins Aerospace Systems of $25 million in Q1 2019.
(d) Pre-tax charges for costs associated with pension plan amendment of $33 million at Collins Aerospace Systems and $10 million at Corporate during Q4 2019.
(e) Transaction and integration costs related to merger agreement with Rockwell Collins of $9 million in Q1 2019, $10 million in Q2 2019, $11 million in Q3 2019 and $10 million in Q4 2019.
(f) Transaction costs related to merger agreement with Raytheon of approximately $26 million in Q2 2019, $25 million in Q3 2019, and $32 million in Q4 2019.
(g) Pre-tax charges associated with pension curtailment of a favorable $98 million in Q3 2019 and unfavorable $25 million in Q4 2019.
(h) Favorable pre-tax interest related to tax settlements $58 million in Q2 2019 and $5 million in Q3 2019.
(i) Unfavorable Noncontrolling interest resulting from the Company's announcement of its intention to separate its commercial businesses of $7 million in Q4 2019.
(t) Favorable pre-tax interest related to the separation of its commercial businesses of $4 million in Q2 2020.
(k) Favorable income tax adjustments related to the 2018 U.S Tax Reform Legislation of $21 million in Q4 2019.
(l) Favorable income tax adjustment resulting from the Company's announcement of its intention to separate its commercial businesses of $29 million in Q4 2019.
2020 Footnotes
(m) Favorable impact of a contract termination of $22 million in Q1 2020, unfavorable EAC adjustments of $120 million in Q2 2020 and unfavorable EAC adjustments of $296 million in Q3 2020 at Pratt & Whitney.
(n) EAC adjustments for Collins Aerospace Systems of an unfavorable $22 million in Q1 2020, $96 million in Q2 2020 and $4 million in Q3 2020.
(o) Unfavorable costs related to the impacts of COVID 19 at Pratt & Whitney of $40 million in Q1 2020, $199 million Q2 2020 and $509 million in Q3 2020.
(p) Unfavorable costs related to the impacts of COVID 19 at Collins Aerospace of $32 million in Q1 2020, $190 in Q2 2020 and $17 million in Q3 2020.
(q) Transaction and integration costs related to merger agreement with Raytheon of $29 million in Q1 2020, $70 million in Q2 2020 and $46 million in Q3 2020.
(r) Costs related to the Company's separation of its commercial businesses of $14 million in Q2 2020 and $7 million in Q3 2020.
(s) Pre-tax charges associated with pension curtailment of $25 million in Q2 2020 and $8 million in Q3 2020 specifically related to the sale of businesses at Collins Aerospace Systems.
(aa) Favorable income tax adjustment related to a Q2 2020 impairment of $11 million in Q3 2020.
(bb) Favorable income tax adjustments resulting from tax reform regulations of $9 million in Q3 2020.
(u) Unfavorable income tax adjustments related to the company's separation of its commercial businesses of $415 million in Q1 2020.
(v) Unfavorable income tax adjustments related to the tax impact from a business disposal of $22 million in Q2 2020 and a favorable income tax adjustment related to the tax impact from a business disposal of $12 million in Q3 2020.
(w) Unfavorable income tax adjustment of $60 million in Q2 2020 related to the tax impact of the debt exchange and a favorable income tax adjustment of $11 million in Q3 2020 related to the tax impact of the debt exchange.
(x) Unfavorable income tax adjustments related to the revaluation of certain international tax incentives of $46 million in Q2 2020.
(y) Favorable income tax adjustments related to the revaluation of deferred taxes related to the Raytheon Merger of $31 million in Q2 2020.
(z) Favorable gains associated with the sale of businesses at Collins Aerospace Systems of $608 million in Q3 2020.
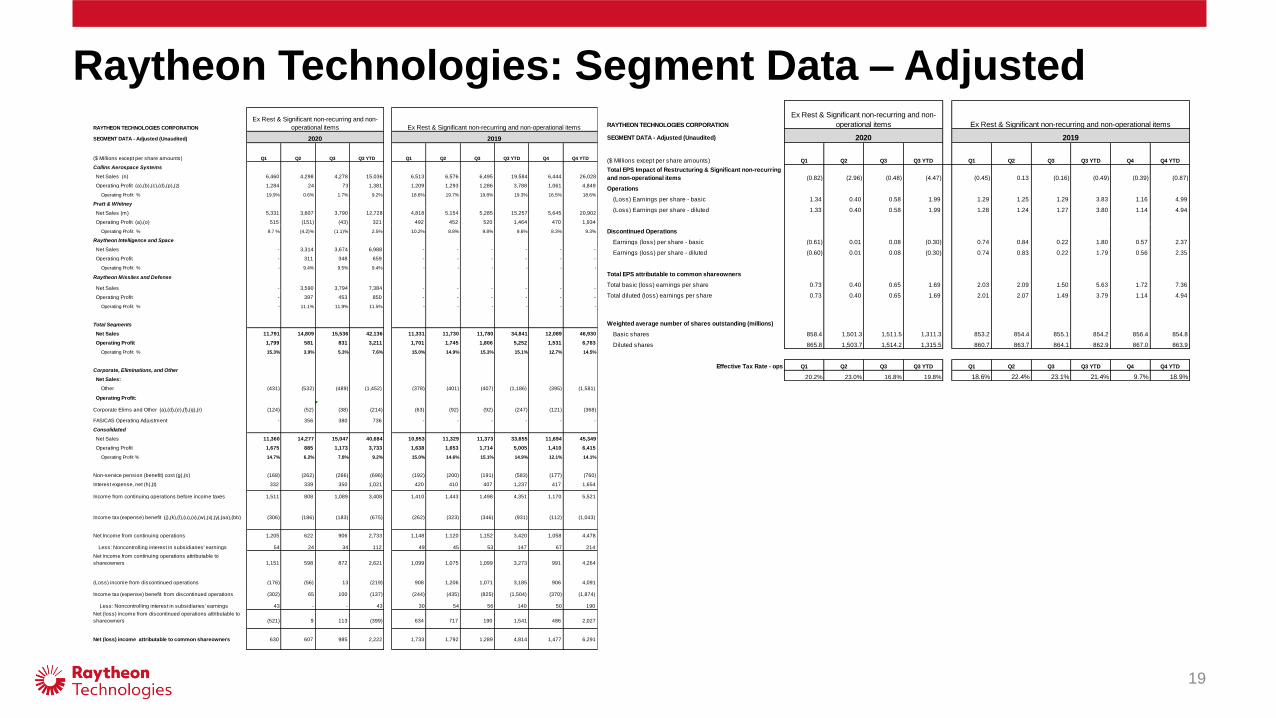
Raytheon Technologies: Segment Data – Adjusted
19
RAYTHEON TECHNOLOGIES CORPORATION
SEGMENT DATA - Adjusted (Unaudited)
($ Millions except per share amounts) Q1 Q2 Q3 Q3 YTD Q1 Q2 Q3 Q3 YTD Q4 Q4 YTD
Collins Aerospace Systems
Net Sales (n) 6,460 4,298 4,278 15,036 6,513 6,576 6,495 19,584 6,444 26,028
Operating Profit (a),(b),(c),(d),(p),(z) 1,284 24 73 1,381 1,209 1,293 1,286 3,788 1,061 4,849
Operating Profit % 19.9% 0.6% 1.7% 9.2% 18.6% 19.7% 19.8% 19.3% 16.5% 18.6%
Pratt & Whitney
Net Sales (m) 5,331 3,607 3,790 12,728 4,818 5,154 5,285 15,257 5,645 20,902
Operating Profit (a),(o) 515 (151) (43) 321 492 452 520 1,464 470 1,934
Operating Profit % 9.7 % (4.2)% (1.1)% 2.5% 10.2% 8.8% 9.8% 9.6% 8.3% 9.3%
Raytheon Intelligence and Space
Net Sales - 3,314 3,674 6,988 - - - - - -
Operating Profit - 311 348 659 - - - - - -
Operating Profit % - 9.4% 9.5% 9.4% - - - - - -
Raytheon Missiles and Defense
Net Sales - 3,590 3,794 7,384 - - - - - -
Operating Profit - 397 453 850 - - - - - -
Operating Profit % - 11.1% 11.9% 11.5% - - - - - -
Total Segments
Net Sales 11,791 14,809 15,536 42,136 11,331 11,730 11,780 34,841 12,089 46,930
Operating Profit 1,799 581 831 3,211 1,701 1,745 1,806 5,252 1,531 6,783
Operating Profit % 15.3% 3.9% 5.3% 7.6% 15.0% 14.9% 15.3% 15.1% 12.7% 14.5%
Corporate, Eliminations, and Other
Net Sales:
Other (431) (532) (489) (1,452) (378) (401) (407) (1,186) (395) (1,581)
Operating Profit:
Corporate Elims and Other (a),(d),(e),(f),(q),(r) (124) (52) (38) (214) (63) (92) (92) (247) (121) (368)
FAS/CAS Operating Adjustment - 356 380 736 - - - - - -
Consolidated
Net Sales 11,360 14,277 15,047 40,684 10,953 11,329 11,373 33,655 11,694 45,349
Operating Profit 1,675 885 1,173 3,733 1,638 1,653 1,714 5,005 1,410 6,415
Operating Profit % 14.7% 6.2% 7.8% 9.2% 15.0% 14.6% 15.1% 14.9% 12.1% 14.1%
Non-service pension (benefit) cost (g),(s) (168) (262) (266) (696) (192) (200) (191) (583) (177) (760)
Interest expense, net (h),(t) 332 339 350 1,021 420 410 407 1,237 417 1,654
Income from continuing operations before income taxes 1,511 808 1,089 3,408 1,410 1,443 1,498 4,351 1,170 5,521
Income tax (expense) benefit (j),(k),(l),(u),(v),(w),(x),(y),(aa),(bb) (306) (186) (183) (675) (262) (323) (346) (931) (112) (1,043)
Net Income from continuing operations 1,205 622 906 2,733 1,148 1,120 1,152 3,420 1,058 4,478
Less: Noncontrolling interest in subsidiaries' earnings 54 24 34 112 49 45 53 147 67 214
Net income from continuing operations attributable to
shareowners 1,151 598 872 2,621 1,099 1,075 1,099 3,273 991 4,264
(Loss) income from discontinued operations (176) (56) 13 (219) 908 1,206 1,071 3,185 906 4,091
Income tax (expense) benefit from discontinued operations (302) 65 100 (137) (244) (435) (825) (1,504) (370) (1,874)
Less: Noncontrolling interest in subsidiaries' earnings 43 - - 43 30 54 56 140 50 190
Net (loss) income from discontinued operations attributable to
shareowners (521) 9 113 (399) 634 717 190 1,541 486 2,027
Net (loss) income attributable to common shareowners 630 607 985 2,222 1,733 1,792 1,289 4,814 1,477 6,291
Ex Rest & Significant non-recurring and non-operational items
2020 2019
Ex Rest & Significant non-recurring and non-
operational items RAYTHEON TECHNOLOGIES CORPORATION
SEGMENT DATA - Adjusted (Unaudited)
($ Millions except per share amounts) Q1 Q2 Q3 Q3 YTD Q1 Q2 Q3 Q3 YTD Q4 Q4 YTD
Total EPS Impact of Restructuring & Significant non-recurring
and non-operational items (0.82) (2.96) (0.48) (4.47) (0.45) 0.13 (0.16) (0.49) (0.39) (0.87)
Operations
(Loss) Earnings per share - basic 1.34 0.40 0.58 1.99 1.29 1.25 1.29 3.83 1.16 4.99
(Loss) Earnings per share - diluted 1.33 0.40 0.58 1.99 1.28 1.24 1.27 3.80 1.14 4.94
Discontinued Operations
Earnings (loss) per share - basic (0.61) 0.01 0.08 (0.30) 0.74 0.84 0.22 1.80 0.57 2.37
Earnings (loss) per share - diluted (0.60) 0.01 0.08 (0.30) 0.74 0.83 0.22 1.79 0.56 2.35
Total EPS attributable to common shareowners
Total basic (loss) earnings per share 0.73 0.40 0.65 1.69 2.03 2.09 1.50 5.63 1.72 7.36
Total diluted (loss) earnings per share 0.73 0.40 0.65 1.69 2.01 2.07 1.49 3.79 1.14 4.94
Weighted average number of shares outstanding (millions)
Basic shares 858.4 1,501.3 1,511.5 1,311.3 853.2 854.4 855.1 854.2 856.4 854.8
Diluted shares 865.8 1,503.7 1,514.2 1,315.5 860.7 863.7 864.1 862.9 867.0 863.9
Effective Tax Rate - ops Q1 Q2 Q3 Q3 YTD Q1 Q2 Q3 Q3 YTD Q4 Q4 YTD
20.2% 23.0% 16.8% 19.8% 18.6% 22.4% 23.1% 21.4% 9.7% 18.9%
Ex Rest & Significant non-recurring and non-operational items
2020 2019
Ex Rest & Significant non-recurring and non-
operational items
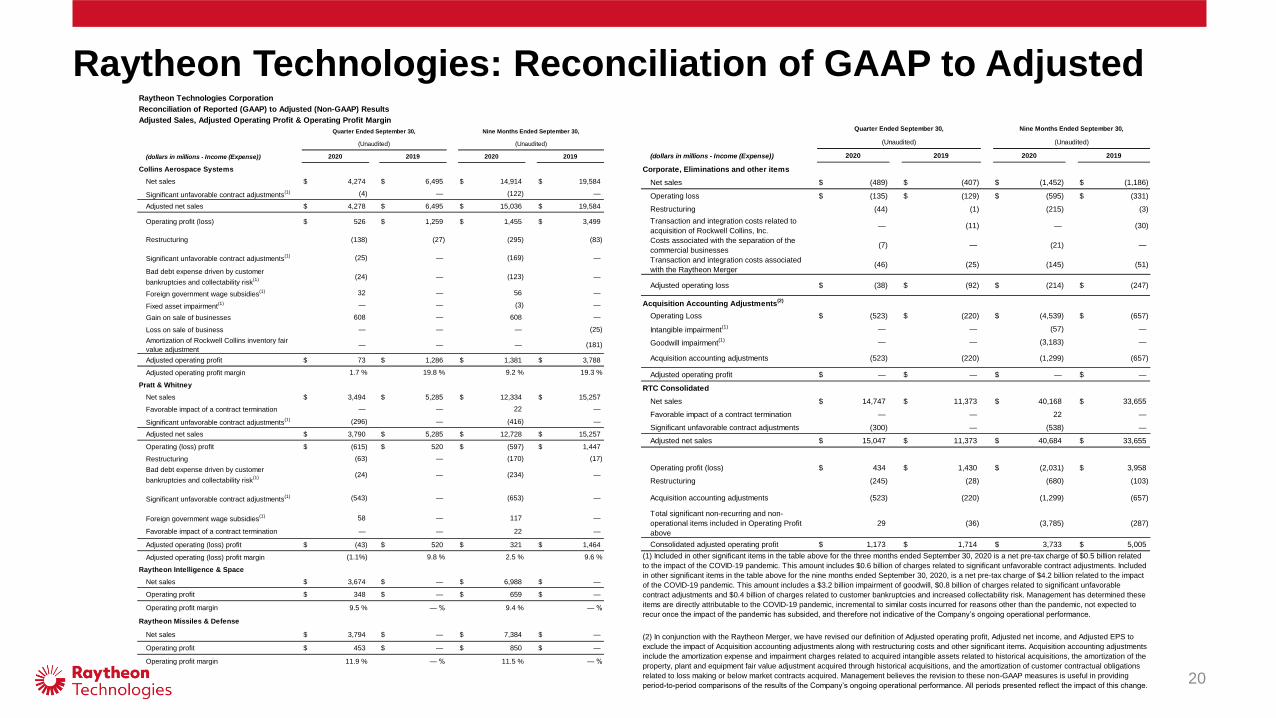
Raytheon Technologies: Reconciliation of GAAP to Adjusted
20
(dollars in millions - Income (Expense))
Corporate, Eliminations and other items
Net sales $ (489) $ (407) $ (1,452) $ (1,186)
Operating loss $ (135) $ (129) $ (595) $ (331)
Restructuring (44) (1) (215) (3)
Transaction and integration costs related to
acquisition of Rockwell Collins, Inc. — (11) — (30)
Costs associated with the separation of the
commercial businesses (7) — (21) —
Transaction and integration costs associated
with the Raytheon Merger (46) (25) (145) (51)
Adjusted operating loss $ (38) $ (92) $ (214) $ (247)
Acquisition Accounting Adjustments(2)
Operating Loss $ (523) $ (220) $ (4,539) $ (657)
Intangible impairment(1) — — (57) —
Goodwill impairment(1) — — (3,183) —
Acquisition accounting adjustments (523) (220) (1,299) (657)
Adjusted operating profit $ — $ — $ — $ —
RTC Consolidated
Net sales $ 14,747 $ 11,373 $ 40,168 $ 33,655
Favorable impact of a contract termination — — 22 —
Significant unfavorable contract adjustments (300) — (538) —
Adjusted net sales $ 15,047 $ 11,373 $ 40,684 $ 33,655
Operating profit (loss) $ 434 $ 1,430 $ (2,031) $ 3,958
Restructuring (245) (28) (680) (103)
Acquisition accounting adjustments (523) (220) (1,299) (657)
Total significant non-recurring and non-
operational items included in Operating Profit
above
29 (36) (3,785) (287)
Consolidated adjusted operating profit $ 1,173 $ 1,714 $ 3,733 $ 5,005
(2) In conjunction with the Raytheon Merger, we have revised our definition of Adjusted operating profit, Adjusted net income, and Adjusted EPS to
exclude the impact of Acquisition accounting adjustments along with restructuring costs and other significant items. Acquisition accounting adjustments
include the amortization expense and impairment charges related to acquired intangible assets related to historical acquisitions, the amortization of the
property, plant and equipment fair value adjustment acquired through historical acquisitions, and the amortization of customer contractual obligations
related to loss making or below market contracts acquired. Management believes the revision to these non-GAAP measures is useful in providing
period-to-period comparisons of the results of the Company’s ongoing operational performance. All periods presented reflect the impact of this change.
(1) Included in other significant items in the table above for the three months ended September 30, 2020 is a net pre-tax charge of $0.5 billion related
to the impact of the COVID-19 pandemic. This amount includes $0.6 billion of charges related to significant unfavorable contract adjustments. Included
in other significant items in the table above for the nine months ended September 30, 2020, is a net pre-tax charge of $4.2 billion related to the impact
of the COVID-19 pandemic. This amount includes a $3.2 billion impairment of goodwill, $0.8 billion of charges related to significant unfavorable
contract adjustments and $0.4 billion of charges related to customer bankruptcies and increased collectability risk. Management has determined these
items are directly attributable to the COVID-19 pandemic, incremental to similar costs incurred for reasons other than the pandemic, not expected to
recur once the impact of the pandemic has subsided, and therefore not indicative of the Company’s ongoing operational performance.
20202020 2019
Quarter Ended September 30, Nine Months Ended September 30,
(Unaudited) (Unaudited)
2019
Raytheon Technologies Corporation
Reconciliation of Reported (GAAP) to Adjusted (Non-GAAP) Results
Adjusted Sales, Adjusted Operating Profit & Operating Profit Margin
(dollars in millions - Income (Expense))
Collins Aerospace Systems
Net sales $ 4,274 $ 6,495 $ 14,914 $ 19,584
Significant unfavorable contract adjustments(1)
Adjusted net sales $ 4,278 $ 6,495 $ 15,036 $ 19,584
Operating profit (loss) $ 526 $ 1,259 $ 1,455 $ 3,499
Restructuring
Significant unfavorable contract adjustments(1)
Bad debt expense driven by customer
bankruptcies and collectability risk(1)
Foreign government wage subsidies(1)
Fixed asset impairment(1)
Gain on sale of businesses
Loss on sale of business
Amortization of Rockwell Collins inventory fair
value adjustment
Adjusted operating profit $ 73 $ 1,286 $ 1,381 $ 3,788
Adjusted operating profit margin
Pratt & Whitney
Net sales $ 3,494 $ 5,285 $ 12,334 $ 15,257
Favorable impact of a contract termination
Significant unfavorable contract adjustments(1)
Adjusted net sales $ 3,790 $ 5,285 $ 12,728 $ 15,257
Operating (loss) profit $ (615) $ 520 $ (597) $ 1,447
Restructuring
Bad debt expense driven by customer
bankruptcies and collectability risk(1)
Significant unfavorable contract adjustments(1)
Foreign government wage subsidies(1)
Favorable impact of a contract termination
Adjusted operating (loss) profit $ (43) $ 520 $ 321 $ 1,464
Adjusted operating (loss) profit margin
Raytheon Intelligence & Space
Net sales $ 3,674 $ — $ 6,988 $ —
Operating profit $ 348 $ — $ 659 $ —
Operating profit margin
Raytheon Missiles & Defense
Net sales $ 3,794 $ — $ 7,384 $ —
Operating profit $ 453 $ — $ 850 $ —
Operating profit margin 11.9 % — % 11.5 % — %
9.5 % — % 9.4 % — %
(1.1%) 9.8 % 2.5 % 9.6 %
58 — 117 —
— — 22 —
(24) — (234) —
(543) — (653) —
(296) — (416) —
(63) — (170) (17)
— — 22 —
— — — (181)
1.7 % 19.8 % 9.2 % 19.3 %
608 — 608 —
— — — (25)
32 — 56 —
— — (3) —
(25) — (169) —
(24) — (123) —
(4) — (122) —
(138) (27) (295) (83)
2020 2019 2020 2019
Quarter Ended September 30, Nine Months Ended September 30,
(Unaudited) (Unaudited)
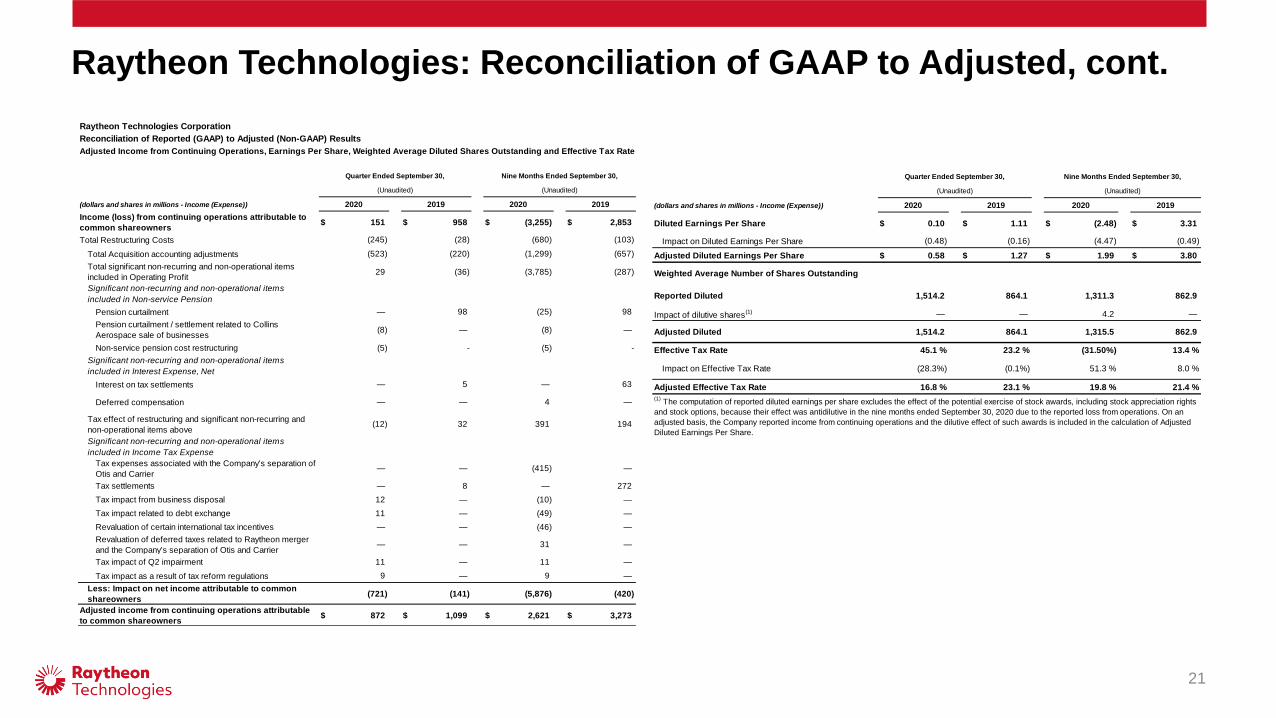
Raytheon Technologies: Reconciliation of GAAP to Adjusted, cont.
21
(dollars and shares in millions - Income (Expense))
Diluted Earnings Per Share $ 0.10 $ 1.11 $ (2.48) $ 3.31
Impact on Diluted Earnings Per Share
Adjusted Diluted Earnings Per Share $ 0.58 $ 1.27 $ 1.99 $ 3.80
Weighted Average Number of Shares Outstanding
Reported Diluted 1,514.2 864.1 1,311.3 862.9
Impact of dilutive shares(1) — — 4.2 —
Adjusted Diluted 1,514.2 864.1 1,315.5 862.9
Effective Tax Rate 45.1 % 23.2 % (31.50%) 13.4 %
Impact on Effective Tax Rate (28.3%) (0.1%) 51.3 % 8.0 %
Adjusted Effective Tax Rate 16.8 % 23.1 % 19.8 % 21.4 %
(1) The computation of reported diluted earnings per share excludes the effect of the potential exercise of stock awards, including stock appreciation rights
and stock options, because their effect was antidilutive in the nine months ended September 30, 2020 due to the reported loss from operations. On an
adjusted basis, the Company reported income from continuing operations and the dilutive effect of such awards is included in the calculation of Adjusted
Diluted Earnings Per Share.
(0.48) (0.16) (4.47) (0.49)
2020 2019
Quarter Ended September 30, Nine Months Ended September 30,
(Unaudited) (Unaudited)
2020 2019
Raytheon Technologies Corporation
Reconciliation of Reported (GAAP) to Adjusted (Non-GAAP) Results
Adjusted Income from Continuing Operations, Earnings Per Share, Weighted Average Diluted Shares Outstanding and Effective Tax Rate
(dollars and shares in millions - Income (Expense))
Income (loss) from continuing operations attributable to
common shareowners$ 151 $ 958 $ (3,255) $ 2,853
Total Restructuring Costs
Total Acquisition accounting adjustments
Total significant non-recurring and non-operational items
included in Operating Profit
Significant non-recurring and non-operational items
included in Non-service Pension
Pension curtailment
Pension curtailment / settlement related to Collins
Aerospace sale of businesses
Non-service pension cost restructuring (5) - (5) -
Significant non-recurring and non-operational items
included in Interest Expense, Net
Interest on tax settlements
Deferred compensation
Tax effect of restructuring and significant non-recurring and
non-operational items above
Significant non-recurring and non-operational items
included in Income Tax Expense
Tax expenses associated with the Company's separation of
Otis and Carrier
Tax settlements
Tax impact from business disposal
Tax impact related to debt exchange
Revaluation of certain international tax incentives
Revaluation of deferred taxes related to Raytheon merger
and the Company's separation of Otis and Carrier
Tax impact of Q2 impairment
Tax impact as a result of tax reform regulations
Less: Impact on net income attributable to common
shareowners
Adjusted income from continuing operations attributable
to common shareowners$ 872 $ 1,099 $ 2,621 $ 3,273
(721) (141) (5,876) (420)
11 — 11 —
9 — 9 —
— — (46) —
— — 31 —
12 — (10) —
11 — (49) —
— — (415) —
— 8 — 272
(12) 32 391 194
— 5 — 63
— — 4 —
(8) — (8) —
— 98 (25) 98
(523) (220) (1,299) (657)
29 (36) (3,785) (287)
(245) (28) (680) (103)
2020 2019 2020 2019
Quarter Ended September 30, Nine Months Ended September 30,
(Unaudited) (Unaudited)
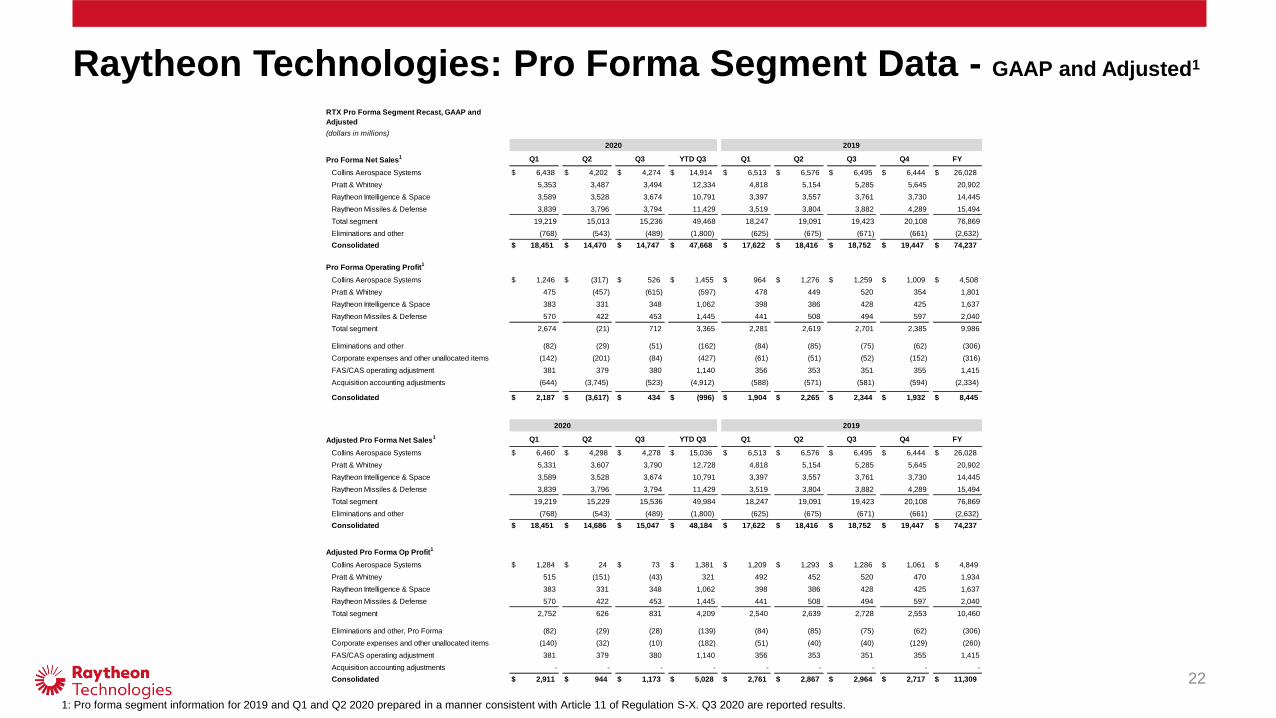
Raytheon Technologies: Pro Forma Segment Data - GAAP and Adjusted1
22
1: Pro forma segment information for 2019 and Q1 and Q2 2020 prepared in a manner consistent with Article 11 of Regulation S-X. Q3 2020 are reported results.
RTX Pro Forma Segment Recast, GAAP and
Adjusted
(dollars in millions)
Pro Forma Net Sales1 Q1 Q2 Q3 YTD Q3 Q1 Q2 Q3 Q4 FY
Collins Aerospace Systems $ 6,438 $ 4,202 $ 4,274 $ 14,914 $ 6,513 $ 6,576 $ 6,495 $ 6,444 $ 26,028
Pratt & Whitney 5,353 3,487 3,494 12,334 4,818 5,154 5,285 5,645 20,902
Raytheon Intelligence & Space 3,589 3,528 3,674 10,791 3,397 3,557 3,761 3,730 14,445
Raytheon Missiles & Defense 3,839 3,796 3,794 11,429 3,519 3,804 3,882 4,289 15,494
Total segment 19,219 15,013 15,236 49,468 18,247 19,091 19,423 20,108 76,869
Eliminations and other (768) (543) (489) (1,800) (625) (675) (671) (661) (2,632)
Consolidated $ 18,451 $ 14,470 $ 14,747 $ 47,668 $ 17,622 $ 18,416 $ 18,752 $ 19,447 $ 74,237
Pro Forma Operating Profit1
Collins Aerospace Systems $ 1,246 $ (317) $ 526 $ 1,455 $ 964 $ 1,276 $ 1,259 $ 1,009 $ 4,508
Pratt & Whitney 475 (457) (615) (597) 478 449 520 354 1,801
Raytheon Intelligence & Space 383 331 348 1,062 398 386 428 425 1,637
Raytheon Missiles & Defense 570 422 453 1,445 441 508 494 597 2,040
Total segment 2,674 (21) 712 3,365 2,281 2,619 2,701 2,385 9,986
Eliminations and other (82) (29) (51) (162) (84) (85) (75) (62) (306)
Corporate expenses and other unallocated items (142) (201) (84) (427) (61) (51) (52) (152) (316)
FAS/CAS operating adjustment 381 379 380 1,140 356 353 351 355 1,415
Acquisition accounting adjustments (644) (3,745) (523) (4,912) (588) (571) (581) (594) (2,334)
Consolidated $ 2,187 $ (3,617) $ 434 $ (996) $ 1,904 $ 2,265 $ 2,344 $ 1,932 $ 8,445
Adjusted Pro Forma Net Sales1 Q1 Q2 Q3 YTD Q3 Q1 Q2 Q3 Q4 FY
Collins Aerospace Systems $ 6,460 $ 4,298 $ 4,278 $ 15,036 $ 6,513 $ 6,576 $ 6,495 $ 6,444 $ 26,028
Pratt & Whitney 5,331 3,607 3,790 12,728 4,818 5,154 5,285 5,645 20,902
Raytheon Intelligence & Space 3,589 3,528 3,674 10,791 3,397 3,557 3,761 3,730 14,445
Raytheon Missiles & Defense 3,839 3,796 3,794 11,429 3,519 3,804 3,882 4,289 15,494
Total segment 19,219 15,229 15,536 49,984 18,247 19,091 19,423 20,108 76,869
Eliminations and other (768) (543) (489) (1,800) (625) (675) (671) (661) (2,632)
Consolidated $ 18,451 $ 14,686 $ 15,047 $ 48,184 $ 17,622 $ 18,416 $ 18,752 $ 19,447 $ 74,237
Adjusted Pro Forma Op Profit1
Collins Aerospace Systems $ 1,284 $ 24 $ 73 $ 1,381 $ 1,209 $ 1,293 $ 1,286 $ 1,061 $ 4,849
Pratt & Whitney 515 (151) (43) 321 492 452 520 470 1,934
Raytheon Intelligence & Space 383 331 348 1,062 398 386 428 425 1,637
Raytheon Missiles & Defense 570 422 453 1,445 441 508 494 597 2,040
Total segment 2,752 626 831 4,209 2,540 2,639 2,728 2,553 10,460
Eliminations and other, Pro Forma (82) (29) (28) (139) (84) (85) (75) (62) (306)
Corporate expenses and other unallocated items (140) (32) (10) (182) (51) (40) (40) (129) (260)
FAS/CAS operating adjustment 381 379 380 1,140 356 353 351 355 1,415
Acquisition accounting adjustments - - - - - - - - -
Consolidated $ 2,911 $ 944 $ 1,173 $ 5,028 $ 2,761 $ 2,867 $ 2,964 $ 2,717 $ 11,309
2020
2020 2019
2019
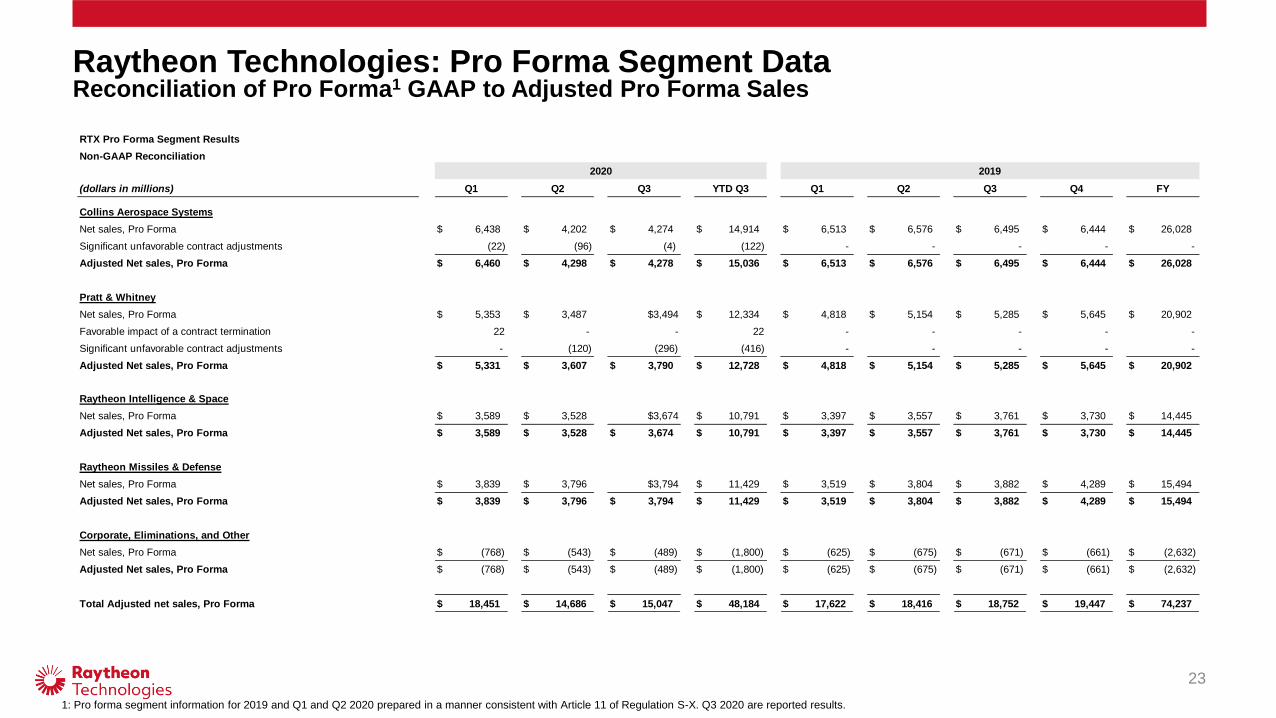
Raytheon Technologies: Pro Forma Segment DataReconciliation of Pro Forma1 GAAP to Adjusted Pro Forma Sales
23
RTX Pro Forma Segment Results
Non-GAAP Reconciliation
(dollars in millions) Q1 Q2 Q3 YTD Q3 Q1 Q2 Q3 Q4 FY
Collins Aerospace Systems
Net sales, Pro Forma $ 6,438 $ 4,202 $ 4,274 $ 14,914 $ 6,513 $ 6,576 $ 6,495 $ 6,444 $ 26,028
Significant unfavorable contract adjustments (22) (96) (4) (122) - - - - -
Adjusted Net sales, Pro Forma $ 6,460 $ 4,298 $ 4,278 $ 15,036 $ 6,513 $ 6,576 $ 6,495 $ 6,444 $ 26,028
Pratt & Whitney
Net sales, Pro Forma $ 5,353 $ 3,487 $3,494 $ 12,334 $ 4,818 $ 5,154 $ 5,285 $ 5,645 $ 20,902
Favorable impact of a contract termination 22 - - 22 - - - - -
Significant unfavorable contract adjustments - (120) (296) (416) - - - - -
Adjusted Net sales, Pro Forma $ 5,331 $ 3,607 $ 3,790 $ 12,728 $ 4,818 $ 5,154 $ 5,285 $ 5,645 $ 20,902
Raytheon Intelligence & Space
Net sales, Pro Forma $ 3,589 $ 3,528 $3,674 $ 10,791 $ 3,397 $ 3,557 $ 3,761 $ 3,730 $ 14,445
Adjusted Net sales, Pro Forma $ 3,589 $ 3,528 $ 3,674 $ 10,791 $ 3,397 $ 3,557 $ 3,761 $ 3,730 $ 14,445
Raytheon Missiles & Defense
Net sales, Pro Forma $ 3,839 $ 3,796 $3,794 $ 11,429 $ 3,519 $ 3,804 $ 3,882 $ 4,289 $ 15,494
Adjusted Net sales, Pro Forma $ 3,839 $ 3,796 $ 3,794 $ 11,429 $ 3,519 $ 3,804 $ 3,882 $ 4,289 $ 15,494
Corporate, Eliminations, and Other
Net sales, Pro Forma $ (768) $ (543) $ (489) $ (1,800) $ (625) $ (675) $ (671) $ (661) $ (2,632)
Adjusted Net sales, Pro Forma $ (768) $ (543) $ (489) $ (1,800) $ (625) $ (675) $ (671) $ (661) $ (2,632)
Total Adjusted net sales, Pro Forma $ 18,451 $ 14,686 $ 15,047 $ 48,184 $ 17,622 $ 18,416 $ 18,752 $ 19,447 $ 74,237
2020 2019
1: Pro forma segment information for 2019 and Q1 and Q2 2020 prepared in a manner consistent with Article 11 of Regulation S-X. Q3 2020 are reported results.
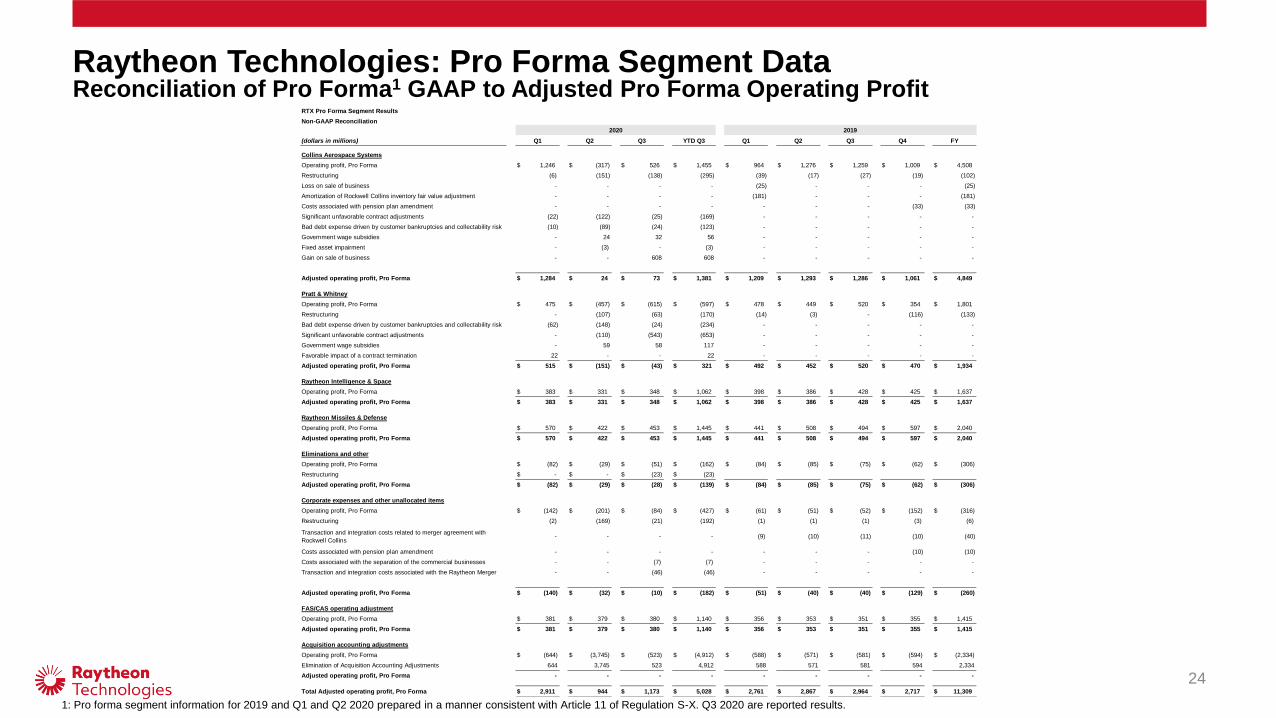
Raytheon Technologies: Pro Forma Segment DataReconciliation of Pro Forma1 GAAP to Adjusted Pro Forma Operating Profit
24
RTX Pro Forma Segment Results
Non-GAAP Reconciliation
(dollars in millions) Q1 Q2 Q3 YTD Q3 Q1 Q2 Q3 Q4 FY
Collins Aerospace Systems
Operating profit, Pro Forma $ 1,246 $ (317) $ 526 $ 1,455 $ 964 $ 1,276 $ 1,259 $ 1,009 $ 4,508
Restructuring (6) (151) (138) (295) (39) (17) (27) (19) (102)
Loss on sale of business - - - - (25) - - - (25)
Amortization of Rockwell Collins inventory fair value adjustment - - - - (181) - - - (181)
Costs associated with pension plan amendment - - - - - - - (33) (33)
Significant unfavorable contract adjustments (22) (122) (25) (169) - - - - -
Bad debt expense driven by customer bankruptcies and collectability risk (10) (89) (24) (123) - - - - -
Government wage subsidies - 24 32 56 - - - - -
Fixed asset impairment - (3) - (3) - - - - -
Gain on sale of business - - 608 608 - - - - -
Adjusted operating profit, Pro Forma $ 1,284 $ 24 $ 73 $ 1,381 $ 1,209 $ 1,293 $ 1,286 $ 1,061 $ 4,849
Pratt & Whitney
Operating profit, Pro Forma $ 475 $ (457) $ (615) $ (597) $ 478 $ 449 $ 520 $ 354 $ 1,801
Restructuring - (107) (63) (170) (14) (3) - (116) (133)
Bad debt expense driven by customer bankruptcies and collectability risk (62) (148) (24) (234) - - - - -
Significant unfavorable contract adjustments - (110) (543) (653) - - - - -
Government wage subsidies - 59 58 117 - - - - -
Favorable impact of a contract termination 22 - - 22 - - - - -
Adjusted operating profit, Pro Forma $ 515 $ (151) $ (43) $ 321 $ 492 $ 452 $ 520 $ 470 $ 1,934
Raytheon Intelligence & Space
Operating profit, Pro Forma $ 383 $ 331 $ 348 $ 1,062 $ 398 $ 386 $ 428 $ 425 $ 1,637
Adjusted operating profit, Pro Forma $ 383 $ 331 $ 348 $ 1,062 $ 398 $ 386 $ 428 $ 425 $ 1,637
Raytheon Missiles & Defense
Operating profit, Pro Forma $ 570 $ 422 $ 453 $ 1,445 $ 441 $ 508 $ 494 $ 597 $ 2,040
Adjusted operating profit, Pro Forma $ 570 $ 422 $ 453 $ 1,445 $ 441 $ 508 $ 494 $ 597 $ 2,040
Eliminations and other
Operating profit, Pro Forma $ (82) $ (29) $ (51) $ (162) $ (84) $ (85) $ (75) $ (62) $ (306)
Restructuring $ - $ - $ (23) $ (23)
Adjusted operating profit, Pro Forma $ (82) $ (29) $ (28) $ (139) $ (84) $ (85) $ (75) $ (62) $ (306)
Corporate expenses and other unallocated items
Operating profit, Pro Forma $ (142) $ (201) $ (84) $ (427) $ (61) $ (51) $ (52) $ (152) $ (316)
Restructuring (2) (169) (21) (192) (1) (1) (1) (3) (6)
Transaction and integration costs related to merger agreement with
Rockwell Collins - - - - (9) (10) (11) (10) (40)
Costs associated with pension plan amendment - - - - - - - (10) (10)
Costs associated with the separation of the commercial businesses - - (7) (7) - - - - -
Transaction and integration costs associated with the Raytheon Merger - - (46) (46) - - - - -
Adjusted operating profit, Pro Forma $ (140) $ (32) $ (10) $ (182) $ (51) $ (40) $ (40) $ (129) $ (260)
FAS/CAS operating adjustment
Operating profit, Pro Forma $ 381 $ 379 $ 380 $ 1,140 $ 356 $ 353 $ 351 $ 355 $ 1,415
Adjusted operating profit, Pro Forma $ 381 $ 379 $ 380 $ 1,140 $ 356 $ 353 $ 351 $ 355 $ 1,415
Acquisition accounting adjustments
Operating profit, Pro Forma $ (644) $ (3,745) $ (523) $ (4,912) $ (588) $ (571) $ (581) $ (594) $ (2,334)
Elimination of Acquisition Accounting Adjustments 644 3,745 523 4,912 588 571 581 594 2,334
Adjusted operating profit, Pro Forma - - - - - - - - -
Total Adjusted operating profit, Pro Forma $ 2,911 $ 944 $ 1,173 $ 5,028 $ 2,761 $ 2,867 $ 2,964 $ 2,717 $ 11,309
2020 2019
1: Pro forma segment information for 2019 and Q1 and Q2 2020 prepared in a manner consistent with Article 11 of Regulation S-X. Q3 2020 are reported results.
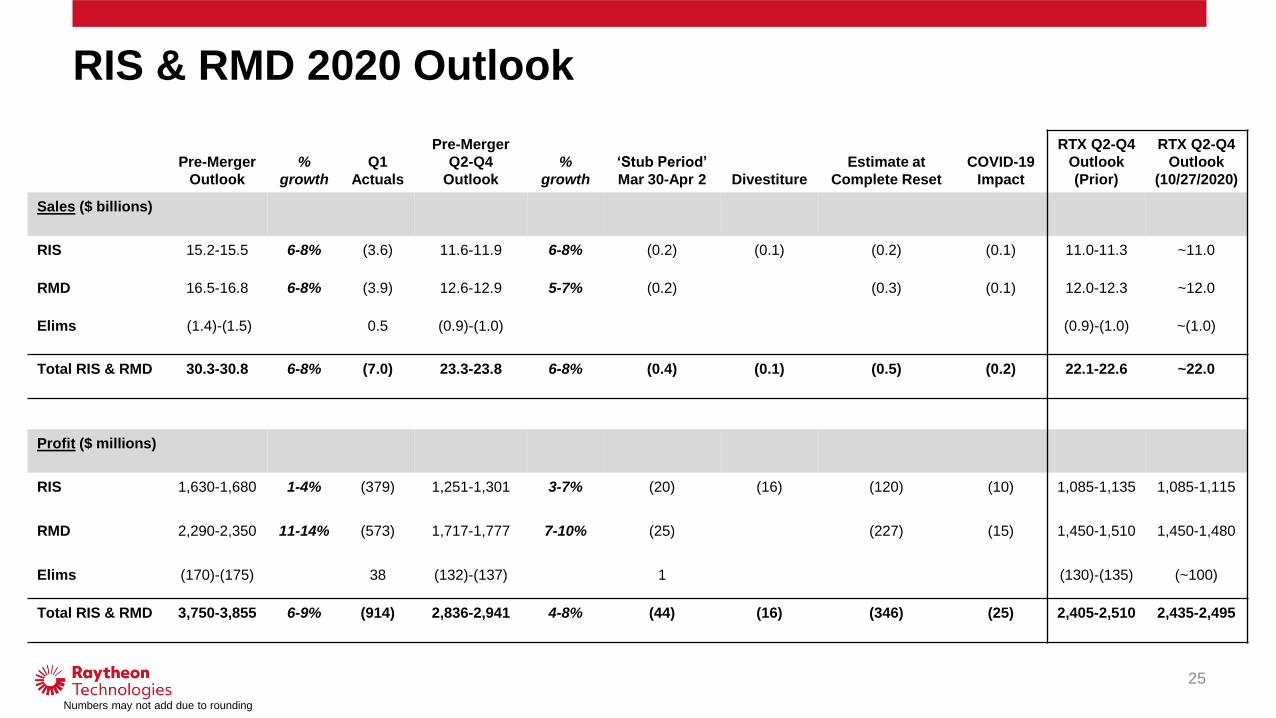
25
Pre-Merger
Outlook
%
growth
Q1
Actuals
Pre-Merger
Q2-Q4
Outlook
%
growth
‘Stub Period’
Mar 30-Apr 2 Divestiture
Estimate at
Complete Reset
COVID-19
Impact
RTX Q2-Q4
Outlook
(Prior)
RTX Q2-Q4
Outlook
(10/27/2020)
Sales ($ billions)
RIS 15.2-15.5 6-8% (3.6) 11.6-11.9 6-8% (0.2) (0.1) (0.2) (0.1) 11.0-11.3 ~11.0
RMD 16.5-16.8 6-8% (3.9) 12.6-12.9 5-7% (0.2) (0.3) (0.1) 12.0-12.3 ~12.0
Elims (1.4)-(1.5) 0.5 (0.9)-(1.0) (0.9)-(1.0) ~(1.0)
Total RIS & RMD 30.3-30.8 6-8% (7.0) 23.3-23.8 6-8% (0.4) (0.1) (0.5) (0.2) 22.1-22.6 ~22.0
Profit ($ millions)
RIS 1,630-1,680 1-4% (379) 1,251-1,301 3-7% (20) (16) (120) (10) 1,085-1,135 1,085-1,115
RMD 2,290-2,350 11-14% (573) 1,717-1,777 7-10% (25) (227) (15) 1,450-1,510 1,450-1,480
Elims (170)-(175) 38 (132)-(137) 1 (130)-(135) (~100)
Total RIS & RMD 3,750-3,855 6-9% (914) 2,836-2,941 4-8% (44) (16) (346) (25) 2,405-2,510 2,435-2,495
RIS & RMD 2020 Outlook
Numbers may not add due to rounding
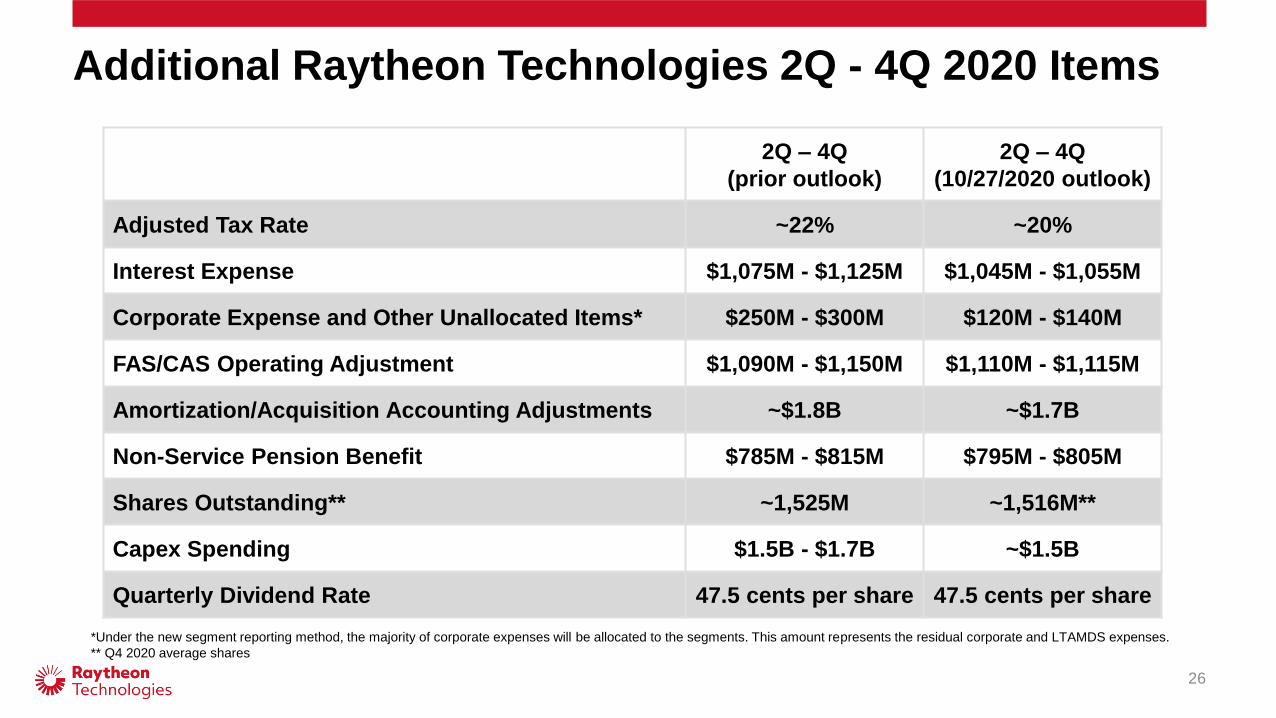
Additional Raytheon Technologies 2Q - 4Q 2020 Items
26
*Under the new segment reporting method, the majority of corporate expenses will be allocated to the segments. This amount represents the residual corporate and LTAMDS expenses.
** Q4 2020 average shares
2Q – 4Q
(prior outlook)
2Q – 4Q
(10/27/2020 outlook)
Adjusted Tax Rate ~22% ~20%
Interest Expense $1,075M - $1,125M $1,045M - $1,055M
Corporate Expense and Other Unallocated Items* $250M - $300M $120M - $140M
FAS/CAS Operating Adjustment $1,090M - $1,150M $1,110M - $1,115M
Amortization/Acquisition Accounting Adjustments ~$1.8B ~$1.7B
Non-Service Pension Benefit $785M - $815M $795M - $805M
Shares Outstanding** ~1,525M ~1,516M**
Capex Spending $1.5B - $1.7B ~$1.5B
Quarterly Dividend Rate 47.5 cents per share 47.5 cents per share


