Download - 38 Pumpout Test in Alluvial Sands
8/11/2019 38 Pumpout Test in Alluvial Sands
http://slidepdf.com/reader/full/38-pumpout-test-in-alluvial-sands 1/8
AYGEC – 2008, Bangalore
47
PUMP-OUT TESTS IN ALLUVIAL SANDS – A CASE STUDY
Sorabh Gupta, Sanjay Gupta & Ravi SundaramCengrs Geotechnica Pvt. Ltd., New Delhi, India Email: [email protected]
ABSTRACT
For design of the dewatering system for construction of a multi-storeyed building with three
basements, pump-out tests were conducted to evaluate the various hydraulic parameters of the
aquifer. The deposits at site consist of fine sands of alluvial origin. The test results indicated veryhigh permeability of the aquifer, necessitating a complex dewatering system that was not
envisaged earlier. The paper presents details of the test conducted and analysis of the test results.
INTRODUCTION
The project site is located near Delhi in northern India. A commercial building (shopping mall) is
planned to be constructed which shall have three basements and ground plus 18 storeys. Thefoundation level shall be about 18 m below the Original Ground Level (OGL). For foundation
construction, it was necessary to lower the groundwater level to 21 m depth below OGL.Since the excavation for the basement required substantial dewatering, pump-out tests were
performed after excavation to 7 m depth. The hydraulic parameters obtained from the test were
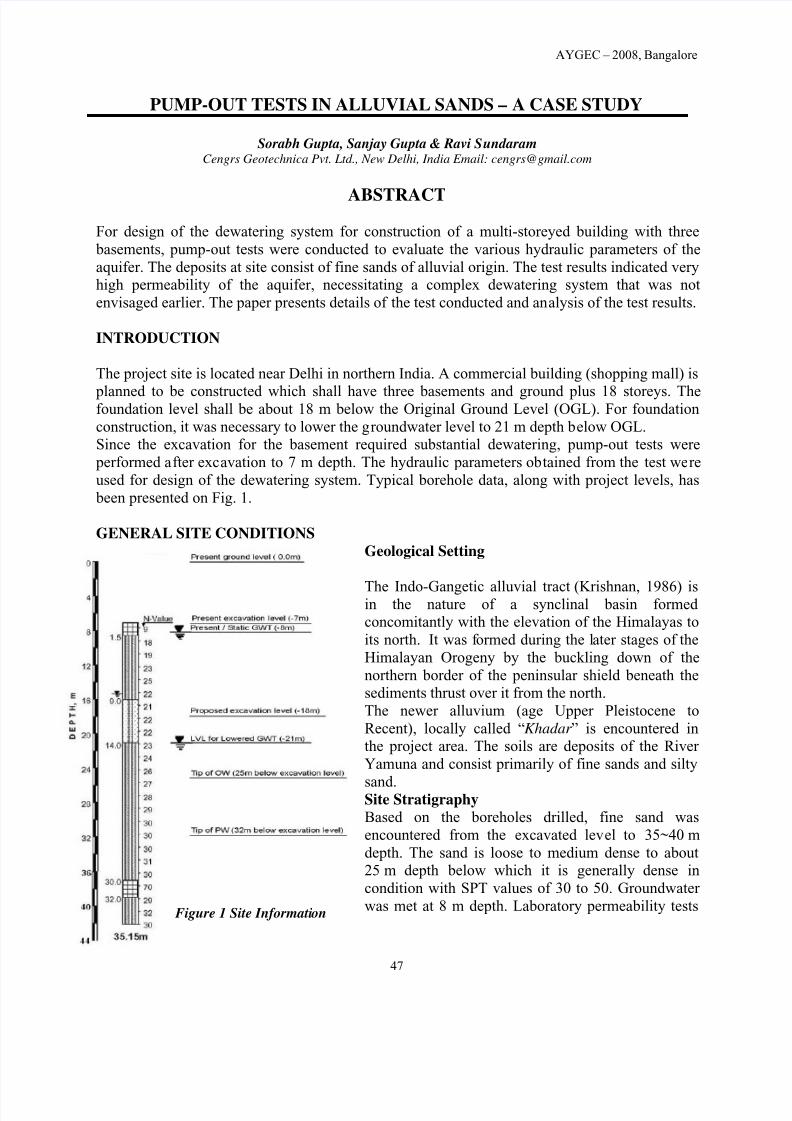
used for design of the dewatering system. Typical borehole data, along with project levels, has
been presented on Fig. 1.
GENERAL SITE CONDITIONS
Geological Setting
The Indo-Gangetic alluvial tract
(Krishnan, 1986) isin the nature of a synclinal basin formedconcomitantly with the elevation of the Himalayas to
its north. It was formed during the later stages of the
Himalayan Orogeny by the buckling down of the
northern border of the peninsular shield beneath thesediments thrust over it from the north.
The newer alluvium (age Upper Pleistocene to
Recent), locally called “Khadar ” is encountered inthe project area. The soils are deposits of the River
Yamuna and consist primarily of fine sands and silty
sand.Site Stratigraphy
Based on the boreholes drilled, fine sand was
encountered from the excavated level to 35~40 m
depth. The sand is loose to medium dense to about25 m depth below which it is generally dense in
condition with SPT values of 30 to 50. Groundwater
was met at 8 m depth. Laboratory permeability tests Figure 1 Site Information
8/11/2019 38 Pumpout Test in Alluvial Sands
http://slidepdf.com/reader/full/38-pumpout-test-in-alluvial-sands 2/8
PUMP-OUT TESTS IN ALLUVIAL SANDS – A CASE STUDY
48
indicated that the coefficient of permeability of the soils is in the range of 2 to 5 x10⁻⁴
cm/s.
AQUIFE R PUMP OUT TEST
An aquifer test (full scale pump-out test) was performed at site to determine hydraulic
parameters such as drawdown-time relationships, transmissivity, hydraulic conductivity, wellstorage coefficient, etc. The test was performed in three stages viz., step-drawdown test, constant
drawdown test and recuperation test (Gupta & Sundaram, 2003). Hydraulic parameters derivedfrom the tests, averaged over the spatial zone of influence of the test, are used to design
dewatering system and to develop a hydro-geological model.
Details of Wells Installed
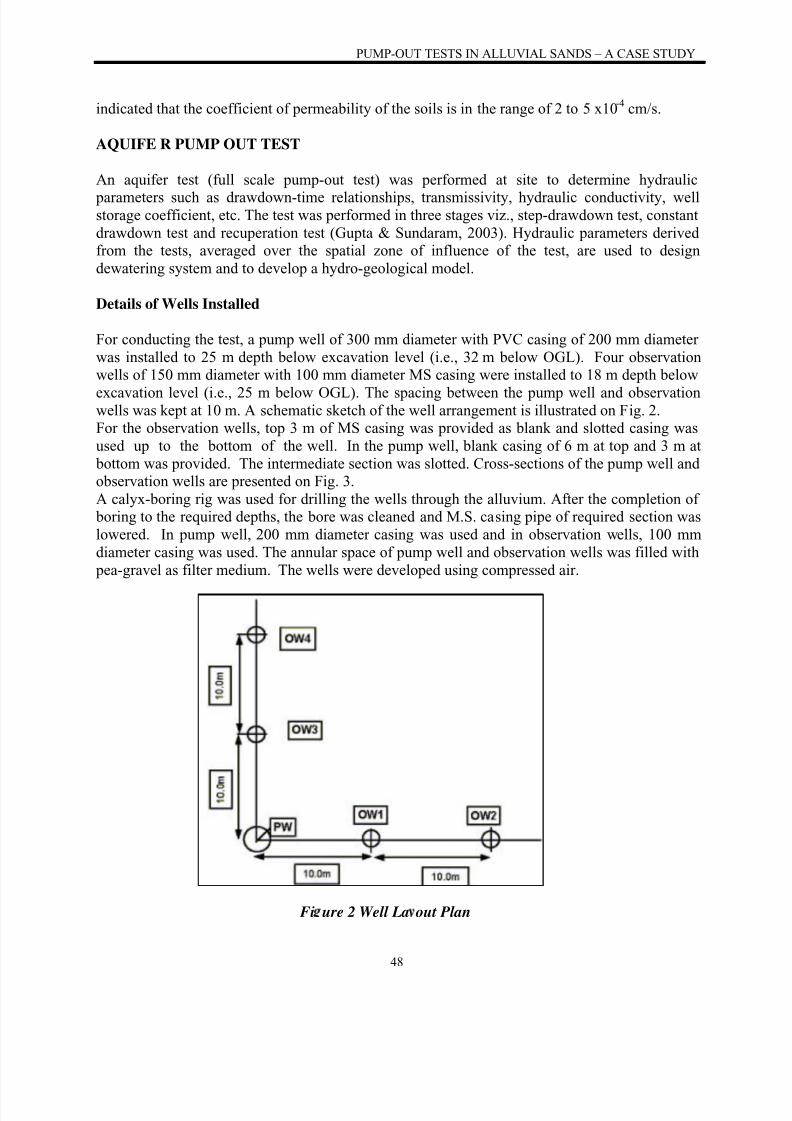
For conducting the test, a pump well of 300 mm diameter with PVC casing of 200 mm diameter
was installed to 25 m depth below excavation level (i.e., 32 m below OGL). Four observationwells of 150 mm diameter with 100 mm diameter MS casing were installed to 18 m depth below
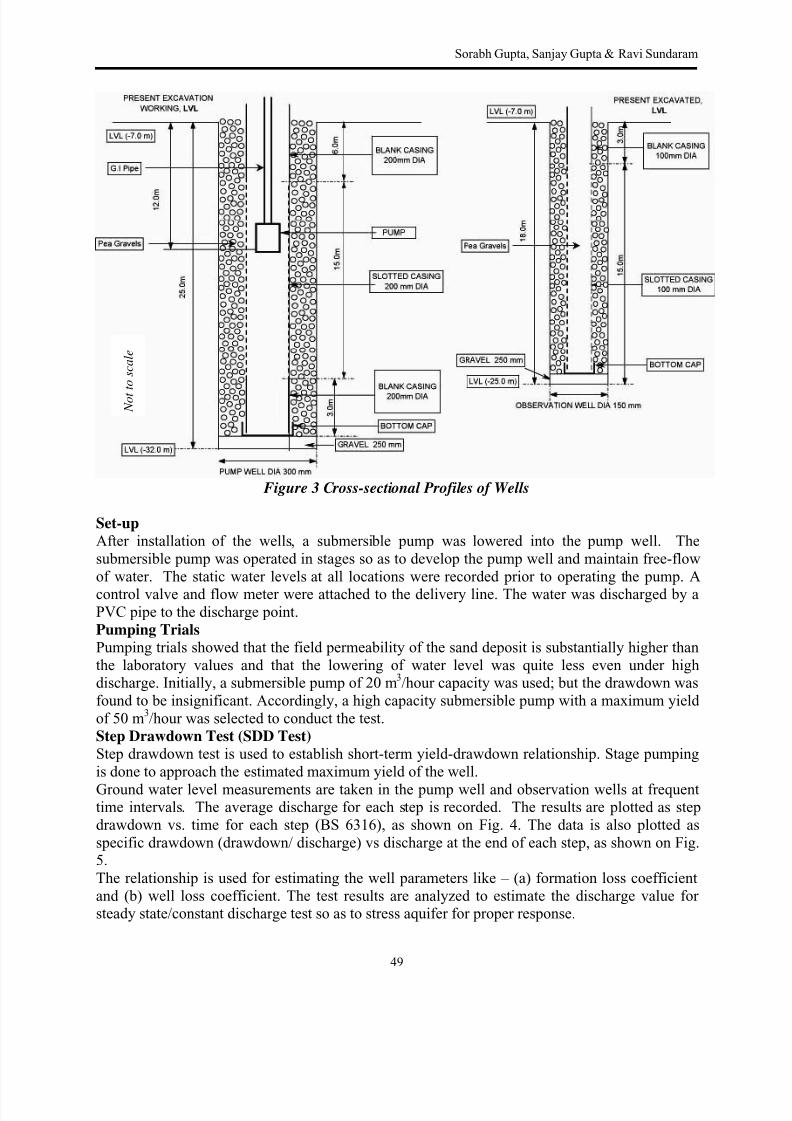
excavation level (i.e., 25 m below OGL). The spacing between the pump well and observationwells was kept at 10 m. A schematic sketch of the well arrangement is illustrated on Fig. 2.For the observation wells, top 3 m of MS casing was provided as blank and slotted casing was
used up to the bottom of the well. In the pump well, blank casing of 6 m at top and 3 m at
bottom was provided. The intermediate section was slotted. Cross-sections of the pump well andobservation wells are presented on Fig. 3.
A calyx-boring rig was used for drilling the wells through the alluvium. After the completion of boring to the required depths, the bore was cleaned and M.S. casing pipe of required section was
lowered. In pump well, 200 mm diameter casing was used and in observation wells, 100 mm
diameter casing was used. The annular space of pump well and observation wells was filled with
pea-gravel as filter medium. The wells were developed using compressed air.
Fi ure 2 Well La out Plan
8/11/2019 38 Pumpout Test in Alluvial Sands
http://slidepdf.com/reader/full/38-pumpout-test-in-alluvial-sands 3/8
8/11/2019 38 Pumpout Test in Alluvial Sands
http://slidepdf.com/reader/full/38-pumpout-test-in-alluvial-sands 4/8
PUMP-OUT TESTS IN ALLUVIAL SANDS – A CASE STUDY
50
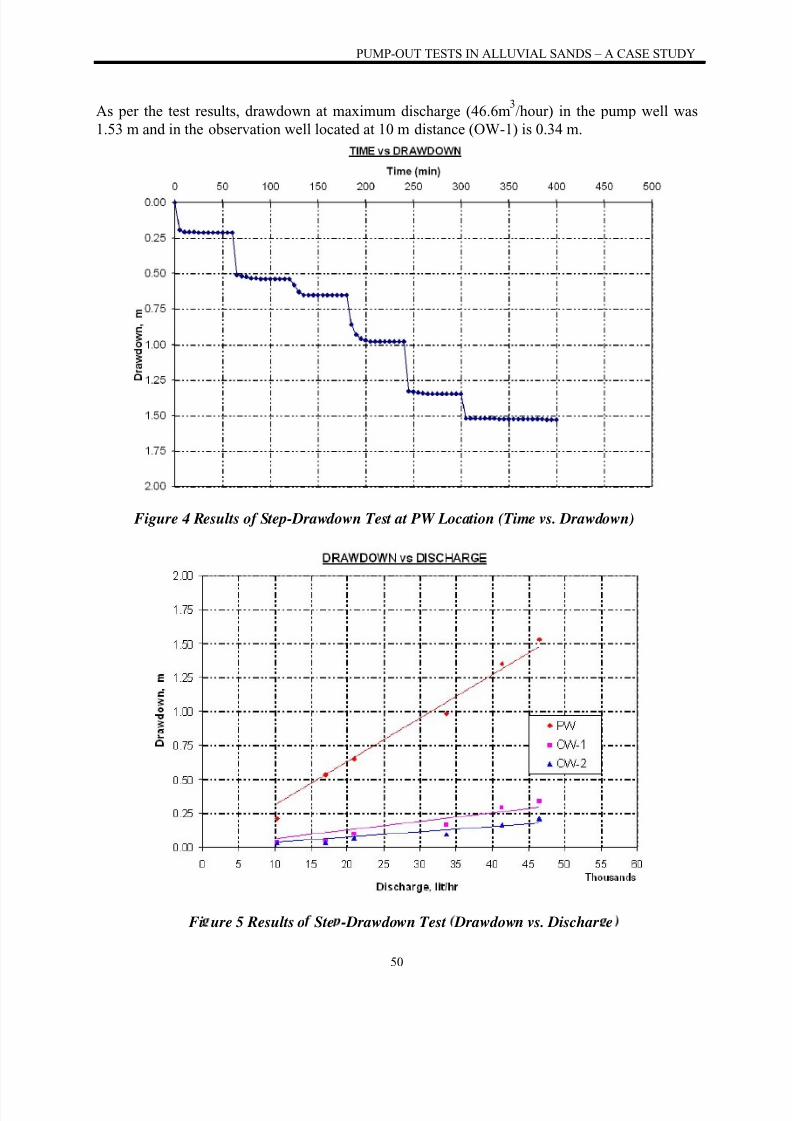
As per the test results, drawdown at maximum discharge (46.6m3/hour) in the pump well was
1.53 m and in the observation well located at 10 m distance (OW-1) is 0.34 m.
Figure 4 Results of Step-Drawdown Test at PW Location (Time vs. Drawdown)
Fi ure 5 Results o Ste -Drawdown Test Drawdown vs. Dischar e
8/11/2019 38 Pumpout Test in Alluvial Sands
http://slidepdf.com/reader/full/38-pumpout-test-in-alluvial-sands 5/8
Sorabh Gupta, Sanjay Gupta & Ravi Sundaram
51
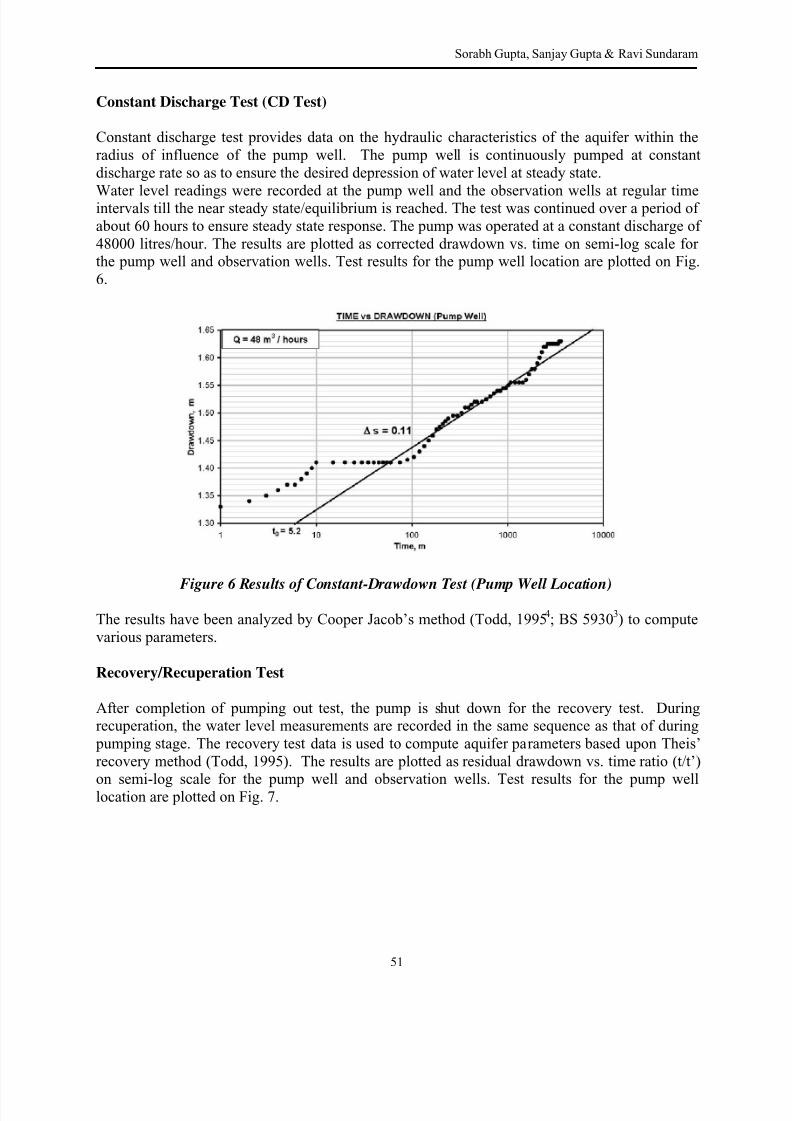
Constant Discharge Test (CD Test)
Constant discharge test provides data on the hydraulic characteristics of the aquifer within the
radius of influence of the pump well. The pump well is continuously pumped at constant
discharge rate so as to ensure the desired depression of water level at steady state.
Water level readings were recorded at the pump well and the observation wells at regular timeintervals till the near steady state/equilibrium is reached. The test was continued over a period of
about 60 hours to ensure steady state response. The pump was operated at a constant discharge of
48000 litres/hour. The results are plotted as corrected drawdown vs. time on semi-log scale forthe pump well and observation wells. Test results for the pump well location are plotted on Fig.
6.
Figure 6 Results of Constant-Drawdown Test (Pump Well Location)
The results have been analyzed by Cooper Jacob’s method (Todd, 19954; BS 5930
3) to compute
various parameters.
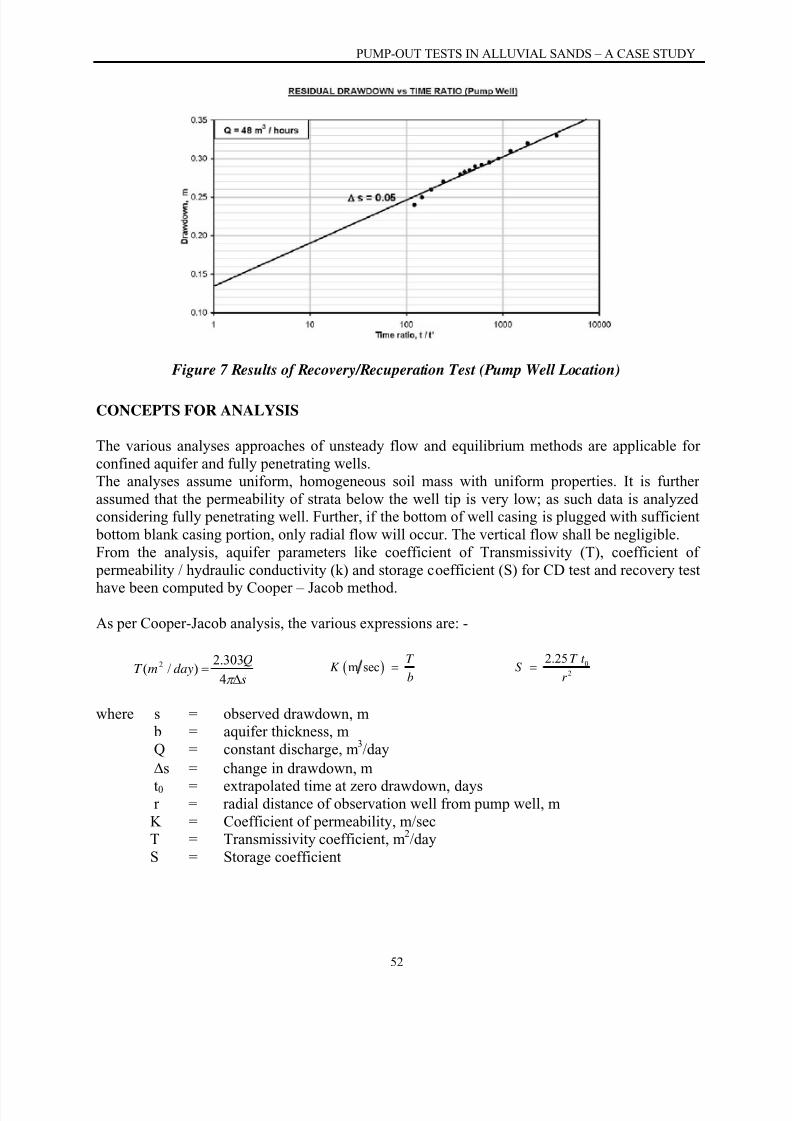
Recovery/Recuperation Test
After completion of pumping out test, the pump is shut down for the recovery test. Duringrecuperation, the water level measurements are recorded in the same sequence as that of during
pumping stage. The recovery test data is used to compute aquifer parameters based upon Theis’
recovery method (Todd, 1995). The results are plotted as residual drawdown vs. time ratio (t/t’)
on semi-log scale for the pump well and observation wells. Test results for the pump welllocation are plotted on Fig. 7.
8/11/2019 38 Pumpout Test in Alluvial Sands
http://slidepdf.com/reader/full/38-pumpout-test-in-alluvial-sands 6/8
8/11/2019 38 Pumpout Test in Alluvial Sands
http://slidepdf.com/reader/full/38-pumpout-test-in-alluvial-sands 7/8
Sorabh Gupta, Sanjay Gupta & Ravi Sundaram
53
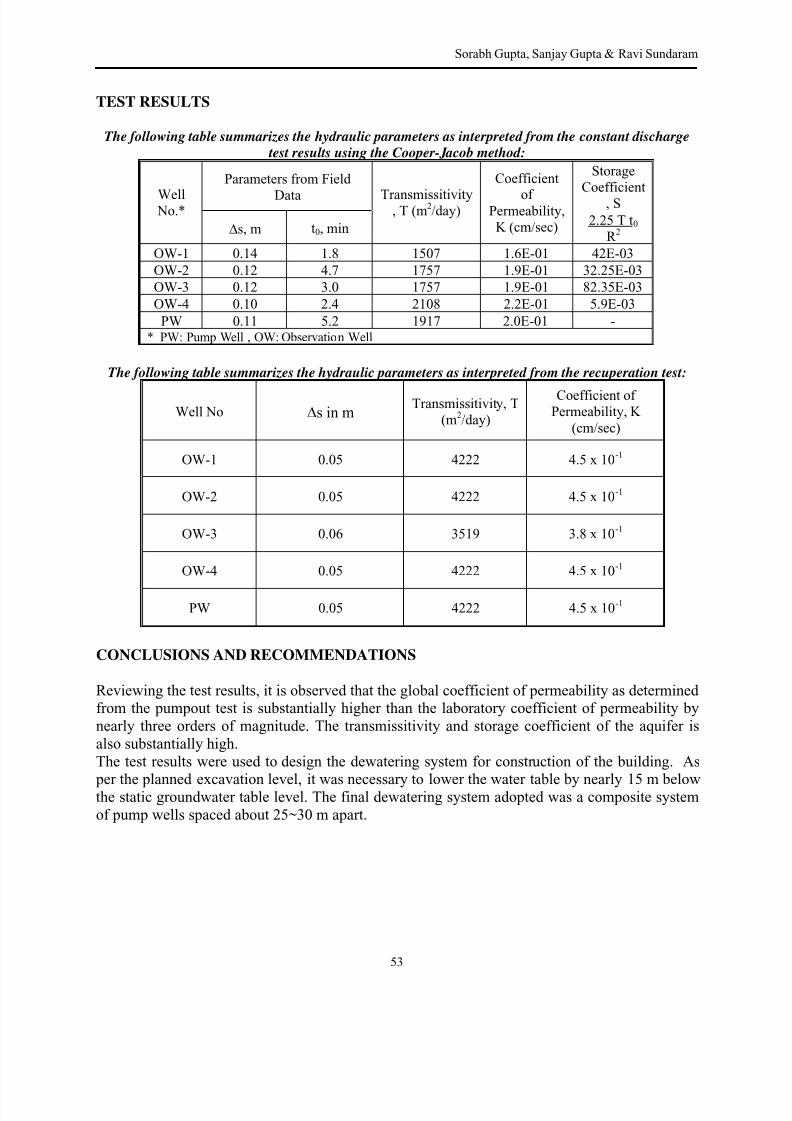
TEST RESULTS
The following table summarizes the hydraulic parameters as interpreted from the constant discharge
test results using the Cooper-Jacob method:
Parameters from Field
Data
Storage
Coefficient
, SWell No.*
∆s, m t0, min
Transmissitivity, T (m2/day)
Coefficient
ofPermeability,
K (cm/sec)2.25 T t0
R 2 OW-1 0.14 1.8 1507 1.6E-01 42E-03
OW-2 0.12 4.7 1757 1.9E-01 32.25E-03
OW-3 0.12 3.0 1757 1.9E-01 82.35E-03
OW-4 0.10 2.4 2108 2.2E-01 5.9E-03
PW 0.11 5.2 1917 2.0E-01 -* PW: Pump Well , OW: Observation Well
The following table summarizes the hydraulic parameters as interpreted from the recuperation test:
Well No ∆s in m Transmissitivity, T
(m2/day)
Coefficient ofPermeability, K
(cm/sec)
OW-1 0.05 4222 4.5 x 10⁻¹
OW-2 0.05 4222 4.5 x 10⁻¹
OW-3 0.06 3519 3.8 x 10⁻¹
OW-4 0.05 4222 4.5 x 10⁻¹
PW 0.05 4222 4.5 x 10⁻¹
CONCLUSIONS AND RECOMMENDATIONS
Reviewing the test results, it is observed that the global coefficient of permeability as determinedfrom the pumpout test is substantially higher than the laboratory coefficient of permeability by
nearly three orders of magnitude. The transmissitivity and storage coefficient of the aquifer is
also substantially high.
The test results were used to design the dewatering system for construction of the building. As
per the planned excavation level, it was necessary to lower the water table by nearly 15 m belowthe static groundwater table level. The final dewatering system adopted was a composite system
of pump wells spaced about 25~30 m apart.
8/11/2019 38 Pumpout Test in Alluvial Sands
http://slidepdf.com/reader/full/38-pumpout-test-in-alluvial-sands 8/8
PUMP-OUT TESTS IN ALLUVIAL SANDS – A CASE STUDY
54
REFERENCES
1. Krishnan, M.S. (1986) , Geology of India & Burma. CBS Publishers, New Delhi.
2. Sanjay Gupta & Ravi Sundaram (2003), Geotechnical Investigation – Emerging Trends,Proc. Indian Geotechnical Conference IGS-2003, Roorkee , 635-645
3.
BS-6316-1992: Code of Practice for Test: Pumping of Water Wells, British StandardsInstitution, UK.
4. Todd, D.K. Groundwater Geology, 2nd
edn. 1995 Wiley, Asia, pp. 125-130.


