
Contents 目次
セグメント別/地域別販売実績Consolidated Sales by Business and Geographical Segments
財務データFinancial Data
経営指標Management Indicators
1. 安定性指標1. Stability
2. 収益性指標2. Profitability
3. 生産性指標3. Productivity
4. 効率性指標4. Efficiency
5. 投資指標5. Investment
貸借対照表(連結)Consolidated Balance Sheets
損益計算書(連結)Consolidated Statements of Income
包括利益計算書(連結)Consolidated Statement of Comprehensive Income
株主資本等変動計算書(連結)Consolidated Statements of Changes in Net Assets
キャッシュ・フロー計算書(連結)Consolidated Statements of Cash Flows
その他(連結)Others (Consolidated)
貸借対照表(単体)Non-Consolidated Balance Sheets
損益計算書(単体)Non-Consolidated Statements of Income
株主資本等変動計算書(単体)Non-Consolidated Statements of Changes in Net Assets
その他(単体)Others (Non-Consolidated)
Copyright © 2019 ULVAC, Inc.
1
3
4
5
2019 Fact Sheet6
7
8
9
6
株式会社 アルバック 13
13
10
10
10
10
11
12

● 品目別/地域別販売実績 Consolidated Sales by Business and Geographical Segments
FPD及びPV製造装置
FPD and PV production equipment
86,75139%
半導体及び
電子部品製造装置Semiconductor and
Electronic device productionequipment
43,32720%
コンポーネントComponents
34,22916%
一般産業用装置Industrial
equipment 23,391
11%
材料Materials
14,3727%
その他Others 18,651
8%
0
50,000
100,000
150,000
200,000
250,000
14/6 15/6 16/6 17/6 18/6 19/6
74,270 64,52282,282 80,411 74,808
85,662
12,99819,294
20,551 21,07017,762
16,23429,169 27,909
27,738 37,75738,304 23,717
43,160 49,257
46,291
75,656 95,019
72,7554,532 5,177
4,019
4,8066,712
4,673
9,749 13,014
11,555
12,130
16,666
17,681
国内Japan
台湾Taiwan
韓国South Korea
中国China
その他アジアOther Asia
欧米他Europe,others
単位:百万円 Millions of yen
連結売上高推移(地域別)Consolidated sales by region
2019年6月期連結売上高構成比(品目別)Consolidated sales by business segment in year ended Jun. 2019
単位:百万円 Millions of yen
真空機器事業Vacuum Equipment
Business 187,698
85%
真空応用事業Vacuum Application
Business33,023
15%
1
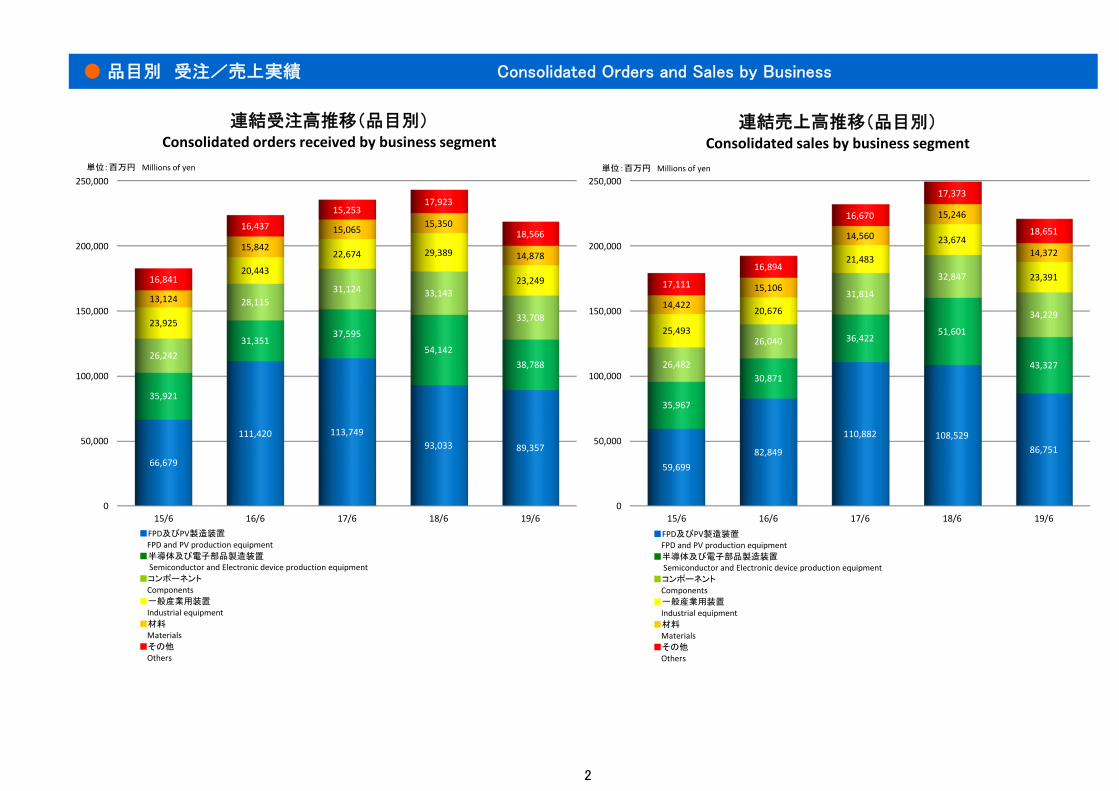
● 品目別 受注/売上実績 Consolidated Orders and Sales by Business
0
50,000
100,000
150,000
200,000
250,000
15/6 16/6 17/6 18/6 19/6
59,69982,849
110,882 108,52986,751
35,967
30,871
36,422 51,601
43,32726,482
26,040
31,814
32,847
34,22925,493
20,676
21,483
23,674
23,391
14,422
15,106
14,560
15,246
14,372
17,111
16,894
16,670
17,373
18,651
0
50,000
100,000
150,000
200,000
250,000
15/6 16/6 17/6 18/6 19/6
66,679
111,420 113,74993,033 89,357
35,921
31,35137,595
54,14238,788
26,242
28,11531,124 33,143
33,70823,925
20,44322,674 29,389
23,249
13,124
15,842
15,065 15,350
14,878
16,841
16,43715,253
17,923
18,566
■FPD及びPV製造装置
FPD and PV production equipment■半導体及び電子部品製造装置
Semiconductor and Electronic device production equipment■コンポーネント
Components■一般産業用装置
Industrial equipment■材料
Materials■その他
Others
連結売上高推移(品目別)Consolidated sales by business segment
連結受注高推移(品目別)Consolidated orders received by business segment
単位:百万円 Millions of yen 単位:百万円 Millions of yen
■FPD及びPV製造装置
FPD and PV production equipment■半導体及び電子部品製造装置
Semiconductor and Electronic device production equipment■コンポーネント
Components■一般産業用装置
Industrial equipment■材料
Materials■その他
Others
2

● 財務データ Financial Data
*Shareholders' equity = Net assets - Minority interests(百万円/Millions of yen)
売上高 Net sales 連結 Consolidated 179,174 192,437 231,831 249,271 220,721
単体 Non-consolidated 86,494 110,309 137,889 148,493 119,509
営業利益 Operating profit 連結 Consolidated 11,132 17,864 29,468 35,351 23,828
単体 Non-consolidated 3,181 8,370 14,575 18,862 7,635
経常利益 Ordinary profit 連結 Consolidated 12,475 18,373 29,716 36,907 25,575
単体 Non-consolidated 6,642 11,185 18,594 24,030 13,899
自己資本 Shareholders' equity (net assets less minority interests) 連結 Consolidated 79,369 72,899 98,688 147,531 150,912
単体 Non-consolidated 47,191 46,769 63,344 105,028 104,219
自己資本比率 Shareholders' equity ratio 連結 Consolidated 32.8 33.2 40.2 49.6 53.5
% % 単体 Non-consolidated 30.0 31.2 36.7 49.3 51.3
総資産 Total assets 連結 Consolidated 242,348 219,561 245,306 297,418 282,302
単体 Non-consolidated 157,448 150,081 172,413 212,961 203,015
キャッシュ・フロー Cash flows
営業活動によるキャッシュ・フロー Cash flows from operating activities 21,992 23,708 37,818 19,086 18,282
投資活動によるキャッシュ・フロー Cash flows from investing activities -4,055 -5,593 -13,713 -1,564 -9,448
フリー・キャッシュ・フロー Free cash flows 17,937 18,115 24,105 17,522 8,834
17/6 18/6
連結 Consolidated
19/615/6 16/6
0
50
100
150
200
250
300
15/6 16/6 17/6 18/6 19/6
179.2192.4
231.8249.3
220.7
86.5110.3
137.9 148.5119.5
連結 Consolidated単体 Non-consolidated
0
5
10
15
20
25
30
35
40
15/6 16/6 17/6 18/6 19/6
11.1
17.9
29.5
35.4
23.8
3.2
8.4
14.6
18.9
7.6
連結 Consolidated単体 Non-consolidated
0
5
10
15
20
25
30
35
40
15/6 16/6 17/6 18/6 19/6
12.5
18.4
29.7
36.9
25.6
6.6
11.2
18.6
24.0
13.9
連結 Consolidated単体 Non-consolidated
79.4
72.9
98.7
147.5 150.9
47.2 46.8
63.3
105.0 104.232.8 33.2
40.2
49.653.5
30.0 31.2
36.7
49.3 51.3
0
20
40
60
80
100
120
140
160
0
10
20
30
40
50
60
15/6 16/6 17/6 18/6 19/6
自己資本(連結) Shareholders' equity(consolidated)
自己資本(単体) Shareholders' equity(non-consolidated)
自己資本比率(連結) Shareholders' equity ratio(consolidated)
自己資本比率(単体) Shareholders' equity ratio(non-consolidated)
0
50
100
150
200
250
300
350
400
15/6 16/6 17/6 18/6 19/6
242.3219.6
245.3
297.4282.3
157.4 150.1172.4
213.0 203.0
連結 Consolidated単体 Non-consolidated
22.0 23.7
37.8
19.1 18.3
-4.1 -5.6
-13.7
-1.6
-9.4
17.9 18.124.1
17.5
8.8
-20
-10
0
10
20
30
40
50
15/6 16/6 17/6 18/6 19/6
営業活動 Cash flows from operating activities投資活動 Cash flows from investing activitiesフリー・キャッシュ・フロー Free cash flows
売上高Net sales
営業利益Operating profit
経常利益Ordinary profit
自己資本 / 自己資本比率Shareholders' equity*/ Shareholders' equity ratio
総資産Total assets
キャッシュ・フロー(連結)Cash flows (consolidated)
単位:10億円 Billions of yen
単位: % 単位:10億円 Billions of yen 単位:10億円 Billions of yen単位:10億円 Billions of yen
単位:10億円 Billions of yen単位:10億円 Billions of yen
3

● 経営指標 Management Indicators
1. 安定性指標 1. Stability
(%)
● 1. 安定性指標 1. Stability 流動比率 Current ratio 連結 Consolidated 124 135 146 166 193
単体 Non-consolidated 97 107 113 135 154
当座比率 Acid ratio 連結 Consolidated 94 98 109 121 144
単体 Non-consolidated 80 82 82 95 105
負債比率 Debt ratio 連結 Consolidated 198 194 142 97 83
単体 Non-consolidated 234 221 172 103 95
固定比率 Fixed ratio 連結 Consolidated 106 104 77 68 66
単体 Non-consolidated 149 140 102 83 80
借入金依存度 Debt-to-total-assets ratio 連結 Consolidated 34 29 17 12 13
単体 Non-consolidated 39 33 21 14 16
インタレスト・カバレッジ Interest coverage ratio 連結 Consolidated 11 23 58 103 84
倍 Times 単体 Non-consolidated 9 20 49 89 61
15/6 18/6 19/616/6 17/6
124135
146
166
193
97107
113
135
154
80
100
120
140
160
180
200
15/6 16/6 17/6 18/6 19/6
連結 Consolidated単体 Non-consolidated
94 98109
121
144
80 82 82
95105
40
60
80
100
120
140
160
15/6 16/6 17/6 18/6 19/6
連結 Consolidated単体 Non-consolidated
198 194
142
9783
234221
172
103 95
50
100
150
200
250
300
350
15/6 16/6 17/6 18/6 19/6
連結 Consolidated単体 Non-consolidated
106
104
7768
66
149140
102
83 80
60
80
100
120
140
160
180
200
220
15/6 16/6 17/6 18/6 19/6
連結 Consolidated単体 Non-consolidated
34
29
1712 13
39
33
21
1416
10
20
30
40
50
60
15/6 16/6 17/6 18/6 19/6
連結 Consolidated単体 Non-consolidated
11
23
58
103
84
9
20
49
89
61
0
20
40
60
80
100
120
15/6 16/6 17/6 18/6 19/6
連結 Consolidated単体 Non-consolidated
流動比率
Current ratio当座比率
Acid ratio負債比率
Debt ratio
固定比率
Fixed ratio借入金依存度
Debt-to-total-assets ratioインタレスト・カバレッジ
Interest coverage ratio
単位: %
単位: % 単位: 倍 Times単位: %
単位: %単位: %
4

● 経営指標 Management Indicators
2. 収益性指標 2. Profitability
(%)
● 2. 収益性指標 2. Profitability 売上総利益率 Gross profit to net sales 連結 Consolidated 24.3 26.6 27.5 29.3 29.4
単体 Non-consolidated 21.2 23.8 23.6 26.0 24.2
売上営業利益率 Operating profit to net sales 連結 Consolidated 6.2 9.3 12.7 14.2 10.8
単体 Non-consolidated 3.7 7.6 10.6 12.7 6.4
売上経常利益率 Ordinary profit to net sales 連結 Consolidated 7.0 9.5 12.8 14.8 11.6
単体 Non-consolidated 7.7 10.1 13.5 16.2 11.6
売上当期純利益率 Net income to net sales 連結 Consolidated 5.0 8.7 10.6 14.4 8.5
単体 Non-consolidated 7.5 11.3 13.0 20.0 10.2
総資産利益率(ROA) Return on assets 連結 Consolidated 3.8 7.2 10.5 13.2 6.4
単体 Non-consolidated 4.2 8.1 11.1 15.4 5.8
自己資本利益率(ROE) Return on equity 連結 Consolidated 12.1 21.9 28.5 29.2 12.5
単体 Non-consolidated 14.2 26.6 32.6 35.3 11.6
19/618/615/6 16/6 17/6
24.326.6 27.5
29.3 29.4
21.223.8 23.6
26.024.2
0
5
10
15
20
25
30
35
15/6 16/6 17/6 18/6 19/6
連結 Consolidated単体 Non-consolidated
6.2
9.3
12.7
14.2
10.8
3.7
7.6
10.6
12.7
6.4
0
3
6
9
12
15
15/6 16/6 17/6 18/6 19/6
連結 Consolidated単体 Non-consolidated
7.0
9.5
12.814.8
11.67.7
10.1
13.5
16.2
11.6
0
5
10
15
20
15/6 16/6 17/6 18/6 19/6
連結 Consolidated単体 Non-consolidated
5.0
8.710.6
14.4
8.57.5
11.313.0
20.0
10.2
0
5
10
15
20
25
15/6 16/6 17/6 18/6 19/6
連結 Consolidated
単体 Non-consolidated
3.8
7.2
10.5
13.2
6.44.2
8.1
11.1
15.4
5.8
0
5
10
15
20
15/6 16/6 17/6 18/6 19/6
連結 Consolidated
単体 Non-consolidated
12.1
21.9
28.5 29.2
12.514.2
26.6
32.635.3
11.6
0
10
20
30
40
15/6 16/6 17/6 18/6 19/6
連結 Consolidated単体 Non-consolidated
売上総利益率
Gross profit to net sales売上営業利益率
Operating profit to net sales売上経常利益率
Ordinary profit to net sales
売上当期純利益率
Net income to net sales総資産利益率(ROA)
Return on assets自己資本利益率(ROE)
Return on equity
単位: %
単位: % 単位: %単位: %
単位: %単位: %
5

● 経営指標 Management Indicators
3. Productivity 4. Efficiency
● 3. 生産性指標 3. Productivity 従業員数 Number of employees 連結 Consolidated 5,904 5,886 6,072 6,439 6,424
人 Persons 単体 Non-consolidated 1,097 1,148 1,225 1,293 1,335
従業員一人当たり経常利益 Ordinary profit per employee 連結 Consolidated 2.1 3.1 4.9 5.7 4.0
百万円 Millions of yen 単体 Non-consolidated 6.1 9.7 15.2 18.6 10.4
● 4. 効率性指標 4. Efficiency 総資産回転率 Total assets turnover 連結 Consolidated 0.76 0.83 1.00 0.92 0.76
回 Times 単体 Non-consolidated 0.56 0.72 0.86 0.77 0.57
売上債権回転率 Receivables turnover 連結 Consolidated 3.5 3.4 3.6 3.2 2.7
回 Times 単体 Non-consolidated 2.8 3.1 3.3 2.7 2.2
たな卸資産回転率 Inventory turnover 連結 Consolidated 5.4 6.2 7.8 7.2 5.6
回 Times 単体 Non-consolidated 7.3 12.0 16.5 14.8 8.8
固定資産回転率 Fixed assets turnover 連結 Consolidated 2.1 2.4 3.1 2.8 2.2
回 Times 単体 Non-consolidated 1.2 1.6 2.1 2.0 1.4
19/6
19/6
15/6 16/6 17/6 18/6
3. 生産性指標 4. 効率性指標
18/615/6 16/6 17/6
0
2,000
4,000
6,000
8,000
10,000
15/6 16/6 17/6 18/6 19/6
5,904 5,886 6,072 6,439 6,424
1,097 1,148 1,225 1,293 1,335
連結 Consolidated単体 Non-consolidated
2.13.1
4.9 5.74.0
6.1
9.7
15.2
18.6
10.4
0
5
10
15
20
15/6 16/6 17/6 18/6 19/6
連結 Consolidated単体 Non-consolidated
0.760.83
1.00
0.92
0.76
0.56
0.72
0.86
0.77
0.57
0.4
0.6
0.8
1
1.2
15/6 16/6 17/6 18/6 19/6
連結 Consolidated単体 Non-consolidated
5.46.2
7.8 7.25.6
7.3
12.0
16.5
14.8
8.8
0
2
4
6
8
10
12
14
16
18
15/6 16/6 17/6 18/6 19/6
連結 Consolidated
単体 Non-consolidated
3.5 3.43.6
3.2
2.72.8
3.13.3
2.7
2.2
0
1
2
3
4
15/6 16/6 17/6 18/6 19/6
連結 Consolidated
単体 Non-consolidated
2.12.4
3.12.8
2.2
1.2
1.6
2.1 2.0
1.4
0
1
2
3
4
15/6 16/6 17/6 18/6 19/6
連結 Consolidated単体 Non-consolidated
従業員数
Number of employees従業員一人当たり経常利益
Ordinary profit per employee総資産回転率
Total assets turnover
たな卸資産回転率
Inventory turnover売上債権回転率
Receivables turnover固定資産回転率
Fixed assets turnover
単位: 人 Persons
単位: 回 Times 単位: 回 Times
単位: 回 Times単位: 百万円 Millions of yen
単位: 回 Times
6

● 経営指標 Management Indicators
5. 投資指標 5. Investment
(円 / Yen)
● 5. 投資指標 5. Investment 一株当たり当期純利益(EPS) Earnings per share 連結 Consolidated 172.73 338.37 496.35 728.68 378.78
単体 Non-consolidated 124.56 253.10 364.47 602.43 246.71
配当性向 Payout ratio 連結 Consolidated 6 8.9 10.1 13.0 27.7
% % 単体 Non-consolidated 8 11.9 13.7 15.8 42.6
一株当たり純資産額 Net assets per share 連結 Consolidated 1,398.66 1,477.29 2,002.90 2,994.12 3,062.39
単体 Non-consolidated 746.47 947.65 1,285.42 2,131.25 2,114.61
19/618/615/6 16/6 17/6
172.73
338.37
496.35
728.68
378.78
124.56
253.10
364.47
602.43
246.71
0
200
400
600
800
15/6 16/6 17/6 18/6 19/6
連結 Consolidated単体 Non-consolidated
5.88.9 10.1
13.0
27.7
8.011.9
13.7 15.8
42.6
0
10
20
30
40
50
15/6 16/6 17/6 18/6 19/6
連結 Consolidated単体 Non-consolidated
1,398.66 1,477.29
2,002.90
2,994.12 3,062.39
746.47947.65
1,285.42
2,131.25 2,114.61
0
500
1,000
1,500
2,000
2,500
3,000
3,500
15/6 16/6 17/6 18/6 19/6
連結 Consolidated単体 Non-consolidated
一株当たり当期純利益(EPS)
Earnings per share配当性向
Payout ratio一株当たり純資産額
Net assets per share単位: 円 Yen 単位: 円 Yen単位: %
7

● 貸借対照表(連結) Consolidated Balance Sheets
15/6 16/6 17/6 18/6 19/6資産の部 Assets流 動 資 産 Current assets 現金及び預金 Cash on hand and in banks 62,684 45,713 56,434 57,074 58,557 受取手形及び売掛金 Notes and accounts receivable, trade 56,684 57,958 70,519 87,276 77,236 商品及び製品 Merchandise and finished goods 3,551 4,645 5,097 4,615 3,937 仕掛品 Work in process 18,685 16,808 15,880 23,618 24,033 原材料及び貯蔵品 Raw materials and supplies 9,897 8,009 9,240 10,847 11,803 繰延税金資産 Deferred tax assets 1,620 4,746 6,027 - - その他 Other 5,264 6,356 7,299 9,509 6,840 貸倒引当金 Allowance for doubtful accounts -482 -621 -811 -914 -444 流 動 資 産 合 計 Total current assets 157,903 143,616 169,685 192,026 181,962固 定 資 産 Non-current assets 有形固定資産 Property, plant and equipment 65,662 60,374 60,306 64,297 65,687 無形固定資産 Intangible assets 4,625 3,916 3,573 3,454 3,446 投資その他の資産 Investments and other assets 14,156 11,655 11,743 37,641 31,207固 定 資 産 合 計 Total non-current assets 84,444 75,945 75,622 105,392 100,340資 産 合 計 Total assets 242,348 219,561 245,306 297,418 282,302負債の部 Liabilities流 動 負 債 Current liabilities 支払手形及び買掛金 Notes and accounts payable, trade 33,816 35,303 48,829 55,566 40,748 短期借入金 Short-term loan payable 62,844 39,453 30,199 21,539 14,915 リース債務 Lease obligations 385 319 315 300 306 未払法人税等 Income taxes payable 1,392 2,039 2,525 4,534 2,802 前受金 Advances received 14,492 13,598 16,908 16,739 15,849 繰延税金負債 Deferred tax liabilities 52 11 10 - - 賞与引当金 Accrued employees' bonuses 1,931 2,206 2,738 3,185 3,625 役員賞与引当金 Accrued directors' bonuses 203 368 401 512 485 製品保証引当金 Accrued warranty costs 2,059 1,964 2,069 1,742 1,632 受注損失引当金 Provision for loss on order received 129 558 785 1,074 1,099 その他 Other 9,976 10,331 11,175 13,637 13,041流 動 負 債 合 計 Total current liabilities 127,277 106,150 115,954 118,829 94,501固 定 負 債 Long-term liabilities 長期借入金 Long-term loans payable 19,805 23,237 12,528 14,150 20,668 リース債務 Lease obligations 557 546 692 607 551 繰延税金負債 Deferred tax liabilities 1,590 1,399 1,408 22 16 退職給付に係る負債 Net defined benefit liability 6,715 8,711 8,311 8,370 7,846 役員退職慰労引当金 Accrued directors' retirement benefits 394 319 335 272 75 役員株式給付引当金 Provision for board benefit trust - - 74 134 145 資産除去債務 Asset retirement obligations 333 336 392 395 399 その他 Other 747 831 694 568 512固 定 負 債 合 計 Total long-term liabilities 30,142 35,378 24,436 24,520 30,213負 債 合 計 Total liabilities 157,420 141,529 140,389 143,348 124,714純資産の部 Net Assets株主資本 Shareholders’ equity 資本金 Capital stock 20,873 20,873 20,873 20,873 20,873 資本剰余金 Capital surplus 16,435 4,582 3,912 3,912 3,912 利益剰余金 Retained earnings 34,609 50,813 73,801 107,238 120,985 自己株式 Treasury shares -10 -10 -271 -266 -247 株 主 資 本 合 計 Total shareholders’ equity 71,908 76,258 98,315 131,756 145,522その他の包括利益累計額 Accumulated other comprehensive income その他有価証券評価差額金 Valuation difference on available-for-sale securities 718 130 491 14,950 6,652 為替換算調整勘定 Foreign currency translation adjustment 7,462 -667 2,480 2,579 266 退職給付に係る調整累計額 Remeasurements of defined benefit plans -718 -2,822 -2,599 -1,753 -1,528 その他の包括利益累計額合計 Total accumulated other comprehensive income 7,462 -3,359 372 15,775 5,390非支配株主持分 Non-controlling interests 5,559 5,133 6,229 6,538 6,676純 資 産 合 計 Total net assets 84,928 78,032 104,917 154,069 157,588負 債 純 資 産 合 計 Total liabilities and net assets 242,348 219,561 245,306 297,418 282,302
単位:百万円 Millions of yen
8
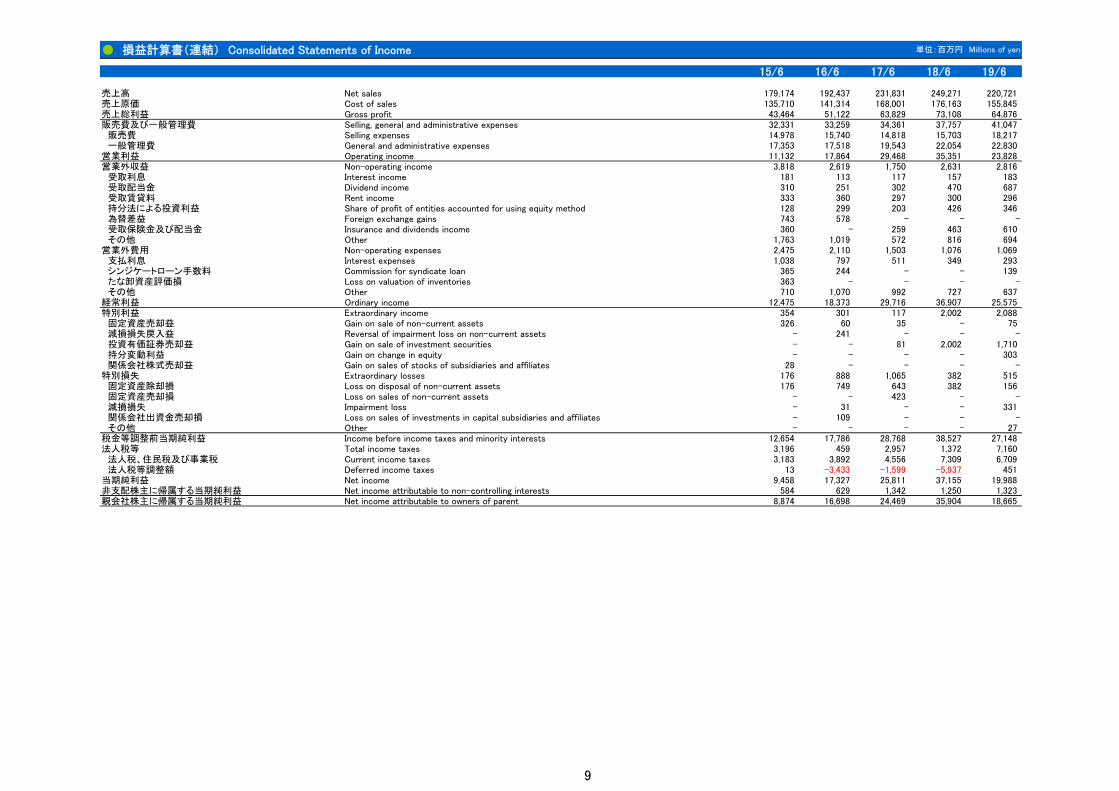
● 損益計算書(連結) Consolidated Statements of Income
15/6 16/6 17/6 18/6 19/6
売上高 Net sales 179,174 192,437 231,831 249,271 220,721売上原価 Cost of sales 135,710 141,314 168,001 176,163 155,845売上総利益 Gross profit 43,464 51,122 63,829 73,108 64,876販売費及び一般管理費 Selling, general and administrative expenses 32,331 33,259 34,361 37,757 41,047 販売費 Selling expenses 14,978 15,740 14,818 15,703 18,217 一般管理費 General and administrative expenses 17,353 17,518 19,543 22,054 22,830営業利益 Operating income 11,132 17,864 29,468 35,351 23,828営業外収益 Non-operating income 3,818 2,619 1,750 2,631 2,816 受取利息 Interest income 181 113 117 157 183 受取配当金 Dividend income 310 251 302 470 687 受取賃貸料 Rent income 333 360 297 300 296 持分法による投資利益 Share of profit of entities accounted for using equity method 128 299 203 426 346 為替差益 Foreign exchange gains 743 578 - - - 受取保険金及び配当金 Insurance and dividends income 360 - 259 463 610 その他 Other 1,763 1,019 572 816 694営業外費用 Non-operating expenses 2,475 2,110 1,503 1,076 1,069 支払利息 Interest expenses 1,038 797 511 349 293 シンジケートローン手数料 Commission for syndicate loan 365 244 - - 139 たな卸資産評価損 Loss on valuation of inventories 363 - - - - その他 Other 710 1,070 992 727 637経常利益 Ordinary income 12,475 18,373 29,716 36,907 25,575特別利益 Extraordinary income 354 301 117 2,002 2,088 固定資産売却益 Gain on sale of non-current assets 326 60 35 - 75 減損損失戻入益 Reversal of impairment loss on non-current assets - 241 - - - 投資有価証券売却益 Gain on sale of investment securities - - 81 2,002 1,710 持分変動利益 Gain on change in equity - - - - 303 関係会社株式売却益 Gain on sales of stocks of subsidiaries and affiliates 28 - - - -特別損失 Extraordinary losses 176 888 1,065 382 515 固定資産除却損 Loss on disposal of non-current assets 176 749 643 382 156 固定資産売却損 Loss on sales of non-current assets - - 423 - - 減損損失 Impairment loss - 31 - - 331 関係会社出資金売却損 Loss on sales of investments in capital subsidiaries and affiliates - 109 - - - その他 Other - - - - 27税金等調整前当期純利益 Income before income taxes and minority interests 12,654 17,786 28,768 38,527 27,148法人税等 Total income taxes 3,196 459 2,957 1,372 7,160 法人税、住民税及び事業税 Current income taxes 3,183 3,892 4,556 7,309 6,709 法人税等調整額 Deferred income taxes 13 -3,433 -1,599 -5,937 451当期純利益 Net income 9,458 17,327 25,811 37,155 19,988非支配株主に帰属する当期純利益 Net income attributable to non-controlling interests 584 629 1,342 1,250 1,323親会社株主に帰属する当期純利益 Net income attributable to owners of parent 8,874 16,698 24,469 35,904 18,665
単位:百万円 Millions of yen
9
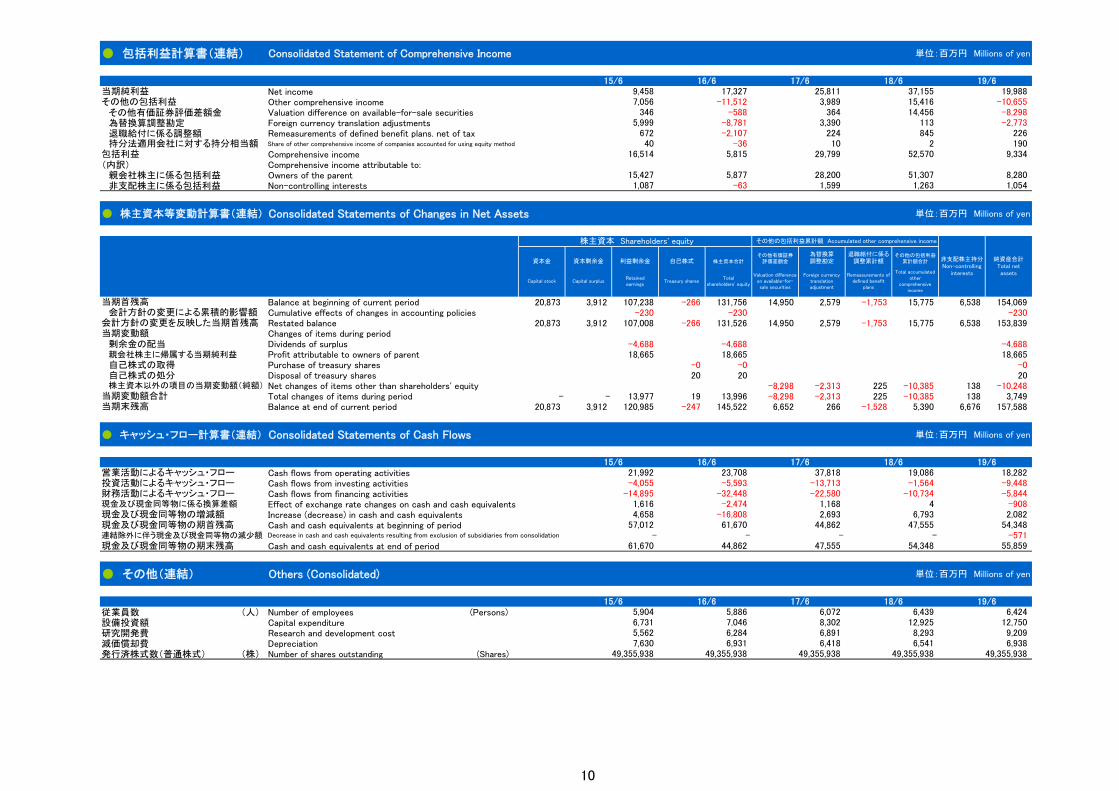
● 包括利益計算書(連結) Consolidated Statement of Comprehensive Income 単位:百万円 Millions of yen
Net incomeOther comprehensive income
その他有価証券評価差額金 Valuation difference on available-for-sale securities為替換算調整勘定 Foreign currency translation adjustments退職給付に係る調整額 Remeasurements of defined benefit plans. net of tax
Share of other comprehensive income of companies accounted for using equity method
Comprehensive income(内訳) Comprehensive income attributable to:
親会社株主に係る包括利益 Owners of the parent非支配株主に係る包括利益 Non-controlling interests
Consolidated Statements of Changes in Net Assets 単位:百万円 Millions of yen
資本金 資本剰余金 利益剰余金 自己株式 株主資本合計その他有価証券
評価差額金
為替換算調整勘定
退職給付に係る調整累計額
その他の包括利益累計額合計
Capital stock Capital surplusRetainedearnings
Treasury sharesTotal
shareholders' equity
Valuation differenceon available-for-sale securities
Foreign currencytranslationadjustment
Remeasurements ofdefined benefit
plans
Total accumulatedother
comprehensiveincome
Balance at beginning of current period 20,873 3,912 107,238 -266 131,756 14,950 2,579 -1,753 15,775 6,538 154,069Cumulative effects of changes in accounting policies -230 -230 -230 Restated balance 20,873 3,912 107,008 -266 131,526 14,950 2,579 -1,753 15,775 6,538 153,839Changes of items during period
剰余金の配当 Dividends of surplus -4,688 -4,688 -4,688 親会社株主に帰属する当期純利益 Profit attributable to owners of parent 18,665 18,665 18,665自己株式の取得 Purchase of treasury shares -0 -0 -0 自己株式の処分 Disposal of treasury shares 20 20 20
Net changes of items other than shareholders' equity -8,298 -2,313 225 -10,385 138 -10,248 Total changes of items during period - - 13,977 19 13,996 -8,298 -2,313 225 -10,385 138 3,749Balance at end of current period 20,873 3,912 120,985 -247 145,522 6,652 266 -1,528 5,390 6,676 157,588
Consolidated Statements of Cash Flows 単位:百万円 Millions of yen
Cash flows from operating activitiesCash flows from investing activitiesCash flows from financing activitiesEffect of exchange rate changes on cash and cash equivalentsIncrease (decrease) in cash and cash equivalentsCash and cash equivalents at beginning of period
Cash and cash equivalents at end of period
● その他(連結) Others (Consolidated) 単位:百万円 Millions of yen
従業員数 (人) Number of employees (Persons)設備投資額 Capital expenditure研究開発費 Research and development cost減価償却費 Depreciation 発行済株式数(普通株式) (株) Number of shares outstanding (Shares)
2
15,41614,456
15/6当期純利益
-11,512 -588
-8,781
25,8113,989
3643,390
18/6
672 -2,107 224 845-2,773
37,155
当期変動額合計当期末残高
52,570
51,307
● 株主資本等変動計算書(連結)
1,08715,427
包括利益 9,334
113346
40
5,999
持分法適用会社に対する持分相当額 -36 10
9,458その他の包括利益 7,056
190
49,355,938 49,355,93849,355,938 49,355,938 49,355,9387,630
5,904 15/6 16/6 17/6
12,925 12,7508,293 9,2095,562 6,2846,541 6,938
6,439 6,424 18/6 19/6
6,931
6,072
現金及び現金同等物の期末残高
-14,895 1,168
-22,580 1,616 -2,474
-32,448
- -571
現金及び現金同等物の増減額 2,693現金及び現金同等物に係る換算差額
現金及び現金同等物の期首残高
財務活動によるキャッシュ・フロー
4,65857,012
-16,808 61,670 47,555 54,34844,862
6,793 2,082
-10,734
8,3026,8916,418
6,7315,8867,046
19/6 16/6 17/6
-8,298
19,98817,327-10,655
-9,448
4 -908 -5,844
-1,564 23,708 19,086 18,282
-4,055
5,815
226
8,2801,054
会計方針の変更を反映した当期首残高会計方針の変更による累積的影響額
連結除外に伴う現金及び現金同等物の減少額 Decrease in cash and cash equivalents resulting from exclusion of subsidiaries from consolidation
21,992
-
営業活動によるキャッシュ・フロー投資活動によるキャッシュ・フロー
-63
19/6 18/6
● キャッシュ・フロー計算書(連結)
15/6 16/6 17/6
純資産合計Total netassets
非支配株主持分Non-controlling
interests
当期変動額
株主資本以外の項目の当期変動額(純額)
当期首残高
29,799
28,200
株主資本 Shareholders' equity その他の包括利益累計額 Accumulated other comprehensive income
16,514
5,8771,599 1,263
55,85961,670 44,862-
-5,593 37,818
-13,713
-47,555 54,348
10

● 貸借対照表(単体) Non-Consolidated Balance Sheets
15/6 16/6 17/6 18/6 19/6資産の部 Assets流 動 資 産 Current assets
現金及び預金 Cash on hand and in banks 38,172 27,864 30,757 27,674 33,205受取手形 Notes receivable, trade 507 5 333 1 -電子記録債権 Electronically recorded monetary claims 285 755 983 1,024 652売掛金 Accounts receivable, trade 33,031 36,163 46,518 59,767 47,856製品 Finished goods 1,232 1,368 811 1,226 1,168原材料 Raw materials 2,199 1,586 1,789 2,620 3,561仕掛品 Work in process 5,704 6,262 4,928 8,672 9,895短期貸付金 Short-term loans receivable 2,949 3,151 12,123 14,069 15,217未収入金 Accounts receivable-other 2,412 3,466 4,307 5,372 3,869繰延税金資産 Deferred tax assets - 3,009 4,166 - -その他 Other 830 1,799 2,034 2,291 4,167貸倒引当金 Allowance for doubtful accounts -219 -666 -740 -828 -
流 動 資 産 合 計 Total current assets 87,102 84,763 108,010 121,887 119,590固 定 資 産 Non-current assets
有形固定資産 Property, plant and equipment 37,267 35,395 34,862 37,340 39,544無形固定資産 Intangible assets 3,913 3,349 2,958 2,744 2,551投資その他の資産 Investments and other assets 29,166 26,574 26,584 50,990 41,330
固 定 資 産 合 計 Total non-current assets 70,346 65,319 64,403 91,074 83,425資 産 合 計 Total assets 157,448 150,081 172,413 212,961 203,015負債の部 Liabilities流 動 負 債 Current liabilities
支払手形 Notes payable, trade 2,792 587 1,107 1,047 1,436電子記録債務 Electronically recorded obligations - 12,714 18,588 19,559 13,585買掛金 Accounts payable, trade 27,433 20,433 32,931 34,882 30,543短期借入金 Short-term loan payable 36,800 20,165 14,170 9,792 4,050
Current portion of long-term debt 6,441 7,768 10,319 6,984 7,269リース債務 Lease obligations 67 76 61 46 96未払金 Accounts payable — other 3,327 3,131 3,073 3,667 3,795未払法人税等 Income taxes payable - 233 536 1,469 78前受金 Advances received 6,465 7,576 7,015 6,944 8,052預り金 Deposits received 3,721 3,465 3,967 3,461 4,549賞与引当金 Accrued employees' bonuses 450 507 518 549 565役員賞与引当金 Accrued directors' bonuses - 131 165 200 194製品保証引当金 Accrued warranty costs 1,015 1,131 1,247 915 790受注損失引当金 Provision for loss on order received 93 511 528 1,025 1,022その他 Other 837 944 1,348 2,648 1,506
流 動 負 債 合 計 Total current liabilities 89,439 79,373 95,573 93,189 77,530固 定 負 債 Long-term liabilities
長期借入金 Long-term loans payable 18,066 22,047 11,728 13,558 20,468リース債務 Lease obligations 148 155 113 77 79繰延税金負債 Deferred tax liabilities 518 15 135 - -
Accrued employees' retirement benefits 1,488 1,063 803 459 114Provision for board benefit trust - - 74 134 145
資産除去債務 Asset retirement obligations 156 156 208 209 209その他 Other 442 503 435 308 251
固 定 負 債 合 計 Total long-term liabilities 20,818 23,939 13,496 14,744 21,266負 債 合 計 Total liabilities 110,257 103,312 109,069 107,933 98,796純資産の部 Net Assets株主資本 Shareholders’ equity 46,511 46,655 62,885 90,109 97,599
資本金 Capital stock 20,873 20,873 20,873 20,873 20,873資本剰余金 Capital surplus 16,435 4,582 4,582 4,582 4,582利益剰余金 Retained earnings 9,211 21,209 37,700 64,919 72,390自己株式 Treasury shares -9 -9 -269 -265 -246
評価・換算差額等 Valuation and translation adjustments 679 114 458 14,918 6,620その他有価証券評価差額金 Valuation difference on available-for-sale securities 679 114 458 14,918 6,620
純 資 産 合 計 Total net assets 47,191 46,769 63,344 105,028 104,219負 債 純 資 産 合 計 Total liabilities and net assets 157,448 150,081 172,413 212,961 203,015
1年以内返済予定の長期借入金
退職給付引当金
単位:百万円 Millions of yen
役員株式給付引当金
11

● 損益計算書(単体) Non-Consolidated Statements of Income
15/6 16/6 17/6 18/6 19/6売上高 Net sales 86,494 110,309 137,889 148,493 119,509売上原価 Cost of sales 68,125 84,055 105,405 109,862 90,546売上総利益 Gross profit 18,368 26,254 32,484 38,630 28,963販売費及び一般管理費 Selling, general and administrative expenses 15,188 17,884 17,909 19,769 21,328営業利益 Operating income 3,181 8,370 14,575 18,862 7,635営業外収益 Non-operating income 5,372 4,690 5,478 6,047 7,401
受取利息及び配当金 Interest income and dividend income 3,213 3,655 4,490 5,250 6,485スクラップ売却益 Gain on sales of scraps 1,060 - - - -受取賃貸料 Rent income 370 338 341 406 410その他 Other 729 697 647 391 506
営業外費用 Non-operating expenses 1,910 1,874 1,458 879 1,137支払利息 Interest expenses 712 607 392 270 231為替差損 Foreign exchange losses - 152 281 101 236賃貸資産経費 Cost and expense for rental activities 285 250 257 306 321シンジケートローン手数料 Commission for syndicate loan 365 244 170 - 139たな卸資産評価損 Loss on valuation of inventories 93 - - - -その他 Other 455 622 358 201 210
経常利益 Ordinary income 6,642 11,185 18,594 24,030 13,899特別利益 Extraordinary income 390 59 94 2,002 1,710
投資有価証券売却益 Gain on sale of investment securities - 1 81 2,002 1,710関係会社株式売却益 Gain on sales of stocks of subsidiaries and affiliates 92 - - - -固定資産売却益 Gain on sales of non-current assets 299 58 12 - -
特別損失 Extraordinary losses 151 1,313 624 358 293固定資産除却損 Loss on disposal of non-current assets 151 731 563 358 141減損損失 Impairment loss - 31 - - 151その他 Other - 522 62 - -
税引前当期純利益 Income before income taxes and minority interests 6,882 9,931 18,064 25,674 15,316法人税等 Total income taxes 385 -2,560 93 -4,013 3,158
法人税、住民税及び事業税 Current income taxes 473 850 1,190 2,284 1,646法人税等調整額 Deferred income taxes -88 -3,410 -1,097 -6,297 1,512
当期純利益 Net income 6,497 12,491 17,971 29,687 12,159
単位:百万円 Millions of yen
12

Non-Consolidated Statements of Changes in Net Assets 単位:百万円 Millions of yen
固定資産圧縮積立金
Reserve foradvanced
depreciation ofnon-current
assets
繰越利益剰余金
Retainedearnings brought
forward
Balance at beginning of current period 20,873 105 4,477 4,582 973 654 63,293 64,919 -265 90,109 14,918 14,918 105,028Changes of items during periodDividends of surplus -4,688 -4,688 -4,688 -4,688
利益準備金の積立 Provision of legal retained earnings 469 -469 - - -Reversal of reserve for advanced depreciation of non-current assets -62 62 - - -Net income 12,159 12,159 12,159 12,159Purchase of treasury shares -0 -0 -0
自己株式の処分 Disposal of treasury shares 20 20 20Net changes of items other than shareholders' equity -8,298 -8,298 -8,298
当期変動額合計 Total changes of items during period - - - - 469 -62 7,063 7,470 19 7,490 -8,298 -8,298 -808 当期末残高 Balance at end of current period 20,873 105 4,477 4,582 1,442 592 70,356 72,390 -246 97,599 6,620 6,620 104,219
Others (Non-Consolidated)
従業員数 (人) Number of employees (Persons)発行済株式数(普通株式) (株) Number of shares outstanding (Shares)一株当たり配当金(普通株式) (円) Dividend per share (common shares) (Yen)
● その他(単体)
当期純利益
その他資本
剰余金
Other capitalsurplus
Capital surplus
固定資産圧縮積立金の取崩
● 株主資本等変動計算書(単体)
自己株式の取得
株主資本以外の項目の当期変動額(純額)
その他利益剰余金
評価・換算差額等
当期首残高当期変動額
剰余金の配当
Other retained earnings
純資産合計
Total netassets
Valuation andtranslation adjustments
資本金
Capital stock
利益剰余金
その他有価証券
評価差額金
Valuationdifference onavailable-for-sale securities
株主資本
Shareholders' equity
資本剰余金
評価・換算差額等合計
Totalvaluation andtranslation
adjustments
Retained earnings
資本準備金
Legal capitalsurplus
資本剰余金合計
Total capitalsurplus
株主資本合計
Totalshareholders'
equity
自己株式
Treasuryshares
利益準備金
Legalretainedearnings
利益剰余金合計
Totalretainedearnings
1,293 1,335 19/6 18/6
1,097 17/6 16/6
1,148 15/6
1,225
10 30 50 10549,355,938 49,355,938
9549,355,938 49,355,938 49,355,938
13


