
2015INTERNATIONALPROPERTYRIGHTS INDEXTHE 2015 EDITION REPRESENTS 99 PERCENT OF WORLD GROSSDOMESTIC PRODUCT AND 94 PERCENT OF WORLD POPULATION
STUDY BY
DR. SARY LEVY-CARCIENTE2014/2015 Hernando De Soto Fellow
With Contributions by: Dr. Hernando De Soto, Wagner Lenhart,
Dr. Buğra Kalkan, Dr. Björn Hasselgren, Patrick Krassén, Souad
Adnane, Bienvenido Oplas, Jr., Giammarco Brenelli,
Prof. Wolfgang Grassl
A Project ofthe PropertyRights Alliance
2015 IPRI PARTNER ORGANIZATIONS
Afghanistan’s Economic and Legal Studies Organization (AELSO), Afghanistan, · Foundation for Economic Freedom, Albania · Fundación Atlas 1853, Argentina · Fundación Bases, Argentina · Fundación Liberdad y Progreso, Argentina · Fundación Libertad, Argentina · Institute for Public Affairs, Australia · My Choice, Australia · Austrian Economics Center, Austria · F.A. v. Hayek Institute, Austria · The Nassau Institute, Bahamas · CPA, Bosnia Herzegovina · Populi, Bolivia · Instituto Liberdade, Brazil · Institute for Market Economics, Bulgaria · Centre Des Affaires Humaines (CEDAH), Burkina Faso · Frontier Centre for Public Policy, Canada · Fundación para el Progreso, Chile · Libertad y Desarrollo, Chile · Cathay Institute of Public Affairs, China · Unirule Institute of Economics, China · Instituto de Ciencia Politica, Colombia · Asociación de Consumidores Libres, Costa Rica · IDEAS, Costa Rica · Centre de Analisis para Políticas Públicas (CAPP), Dominican Republic · Instituto Ecuatoriano de Economía Politica, Ecuador · The Egyptian Center for Public Policy Studies, Egypt · Institute for Economic Studies Europe (IES), France · New Economic School, Georgia · Friedrich Naumann Foundation, Germany · Institute for Free Enterprise, Germany · IMANI Center for Policy and Education, Ghana · Greek Liberties Monitor (GLM), Greece · CIEN, Guatemala · Fundación Eléutera, Honduras · The Lion Rock Institute, Hong Kong · Centre for Civil Society, India · Centre for Policy Research, India · Liberty Institute, India · India Institute, India · Iraq Institute for Economic Reform, Iraq · Hibernia Forum, Ireland · Jerusalem Institute for Market Studies, Israel · Competere, Italy · Think-in, Italy · Istituto Bruno Leoni, Italy · Institute for Development and Economic Affairs (IDEA), Kazakhstan · Center for Free Enterprise, Korea · Bishkek Business Club, Kyrgyz Republic · Central Asian Free Market Institute, Kyrgyz Republic · OHRID Institute for Economic Strategies and International Affairs, Macedonia · Institute for Democracy and Economic Affairs (IDEAS), Malaysia · Southeast Asia Network for Development (SEANET), Malaysia/ASEAN · Center of Research and Development (CIDAC), Mexico · Instituto de Pensamiento Estratégico Ágora A.C. (IPEA), Mexico · Fundación Idea, Mexico · EBI Think Tank Institute, Mongolia · Center for Entrepreneurship and Economic Development (CEED), Montenegro · The Arab Center for Scientific Research and Humane Studies, Morocco · Samriddhi Foundation, Nepal · New Zealand Taxpayers’ Union, New Zealand · Initiative for Public Policy Analysis, Nigeria · Civita, Norway · International Research Foundation (IRF), Oman · Alternate Solutions Institute, Pakistan · Policy Research Institute of Market Economy (PRIME), Pakistan · Pal-Think for Strategic Studies, Palestinian Territories · Fundación Libertad, Panama · Contribuyentes por Respeto, Peru · Institute for Liberty and Democracy, Peru · Instituto de Libre Empresa, Peru · Minimal Government Thinkers, Inc., Philippines · Ludwig von Mises Institute, Poland · Forum Obywatelskiego Rozwoju, Poland · Polish-American Foundation for Economic Research and Education, Poland · Warsaw Enterprise Institute, Poland · Center for Institutional Analysis and Development (CADI), Romania · Libek, Serbia · F. A. Hayek Foundation, Slovakia · The Free Market Foundation, South Africa · Civisimo, Spain · Timbro, Sweden · World Taxpayers Associations (WTA), Sweden · Liberales Institute, Switzerland · Institute of Future Studies for Development (IFD), Thailand · Association for Liberal Thinking, Turkey · Freedom Research Association, Turkey · Bow Group, UK · Institute for Economic Affairs, UK · Property Rights Alliance, USA · Acton Institute, USA · Center for the Dissemination of Economic Knowledge (CEDICE), Venezuela · Zambia Institute for Public Policy Analysis (ZIPPA), Zambia .
FOR MORE INFORMATION, OR TO BE PART OF THE PARTNER ORGANIZATIONS, PLEASE CONTACT LORENZO MONTANARI, EXECUTIVE DIRECTOR OF THE PROPERTY RIGHTS ALLIANCE AT [email protected]
The International Property Rights Index (IPRI) is the flagship publication of the Property Rights Alliance (PRA). PRA, based in Washington, D.C., is dedicated to promoting property rights around the world. In this year’s production of the IPRI, PRA worked with 92 think tanks and policy organizations in 65 countries involved in research, policy development, education and promotion of property rights in their countries, to compile data for the index.
The 2015 edition of the IPRI examines 129 countries.
The importance of property rights is directly related to the values and principles of individual liberty. A strong system of property rights not only promotes prosperity but also creates a virtuous cycle of human flourishing in society.
The IPRI is an annual comparative study that aims to quantify the strength of property rights – both physical and intellectual – and to rank countries accordingly. The IPRI scores and ranks each country based on 10 factors reflecting the state of its Legal and Political Environment (LP), Physical Property Rights (PPR), and Intellectual Property Rights (IPR).
The scope of this 2015 edition represents 98.66 percent of the world Gross Domestic Product and 93.56 percent of the world population.
IPRI 2015 RESULTS The 2015 IPRI ranks a total of 129 countries from around the world. The selection of countries is determined solely by the availability of sufficient data. The increase in number of countries included in this year’s IPRI is due to an increase in available data.
The sample of 129 countries on the IPRI this year averaged a score of 5.3. The Legal and Political Environment (LP) was the weakest component with a score of 4.99, the Physical Property Rights (PPR) was the strongest component with a score of 5.77, and the Intellectual Property Rights (IPR) component fell in between with a score of 5.14.
IPRI 2015 - EXECUTIVE SUMMARY
FIGURE 1 - 2015 IPRI Rankings by Country
0 1 2 3 4 5 6 7 8 9
8.327
8.227
8.207
8.147
8.118
8.050
7.994
7.977
7.929
7.905
7.894
7.714
7.690
7.607
7.606
7.602
7.554
7.492
7.431
7.364
7.301
7.209
7.040
6.874
6.720
6.646
6.621
6.602
6.585
6.556
6.274
6.242
6.165
6.126
6.048
5.977
5.966
5.931
5.926
5.909
5.904
5.898
5.874
FIN 1
NOR 2
NZL 3
LUX 4
SGP 5
CHE 6
SWE 7
JPN 8
CAN 9
NLD 10
DNK 11
AUS 12
GBR 13
DEU 14
USA 15
HKG 16
AUT 17
QAT 18
IRL 19
BEL 20
ARE 21
FRA 22
ISL 23
TWN 24
MLT 25
CHL 26
EST 27
MYS 28
ZAF 29
PRT 30
CZE 31
ISR 32
OMN 33
MUS 34
CYP 35
SAU 36
PRI 37
KOR 38
BWA 39
URY 40
POL 41
RWA 42
SVK 43
0 1 2 3 4 5 6 7
4.464
4.433
4.371
4.363
4.339
4.338
4.285
4.261
4.249
4.245
4.236
4.224
4.214
4.169
4.143
4.135
4.087
4.079
4.053
4.006
3.998
3.965
3.926
3.915
3.906
3.820
3.768
3.738
3.713
3.618
3.563
3.557
3.470
3.378
3.320
3.238
2.785
2.728
2.698
2.671
2.647
2.564
2.534
GTM 87
GAB 88
HND 89
DOM 90
UGA 91
SLE 92
GUY 93
ARM 94
GEO 95
BOL 96
MLI 97
CIV 98
MOZ 99
NPL 100
BFA 101
EGY 102
AZE 103
DZA 104
NIC 105
ETH 106
ARG 107
IRN 108
UKR 109
SRB 110
CMR 111
MDG 112
MRT 113
PRY 114
ALB 115
MDA 116
TCD 117
PAK 118
LBN 119
NGA 120
BDI 121
ZWE 122
YEM 123
LBY 124
VEN 125
HTI 126
AGO 127
BGD 128
MMR 129
0 1 2 3 4 5
5.864
5.849
5.826
5.818
5.736
5.730
5.612
5.589
5.534
5.389
5.353
5.290
5.279
5.267
5.261
5.219
5.199
5.185
5.155
5.153
5.099
5.052
4.952
4.944
4.935
4.923
4.900
4.873
4.812
4.760
4.753
4.750
4.735
4.644
4.614
4.603
4.566
4.548
4.540
4.533
4.531
4.490
4.488
LTU 44
JOR 45
HUN 46
BHR 47
CRI 48
ESP 49
GHA 50
ITA 51
LVA 52
CHN 53
JAM 54
ROU 55
GRC 56
PAN 57
TUR 58
TTO 59
KWT 60
SVN 61
IND 62
MAR 63
BRA 64
PHL 65
MKD 66
SWZ 67
BGR 68
THA 69
IDN 70
HRV 71
SLV 72
LKA 73
COL 74
MEX 75
ZMB 76
TUN 77
TZA 78
PER 79
SEN 80
RUS 81
MNE 82
KEN 83
MWI 84
VNM 85
KAZ 86
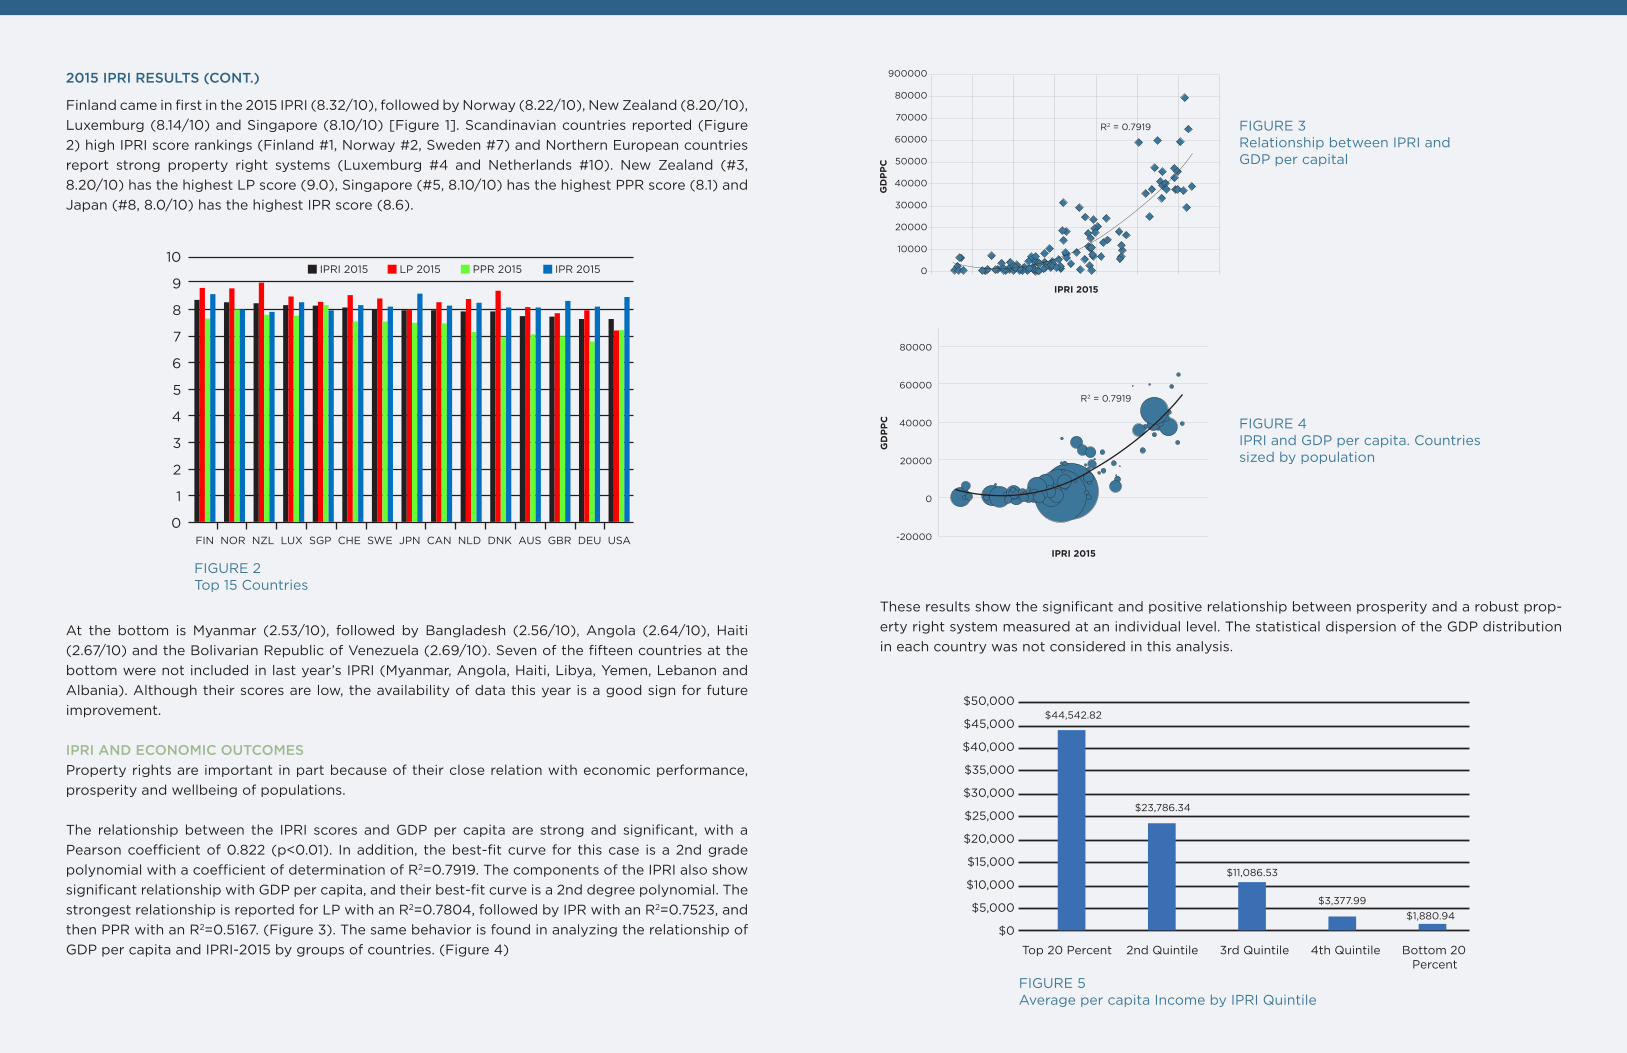
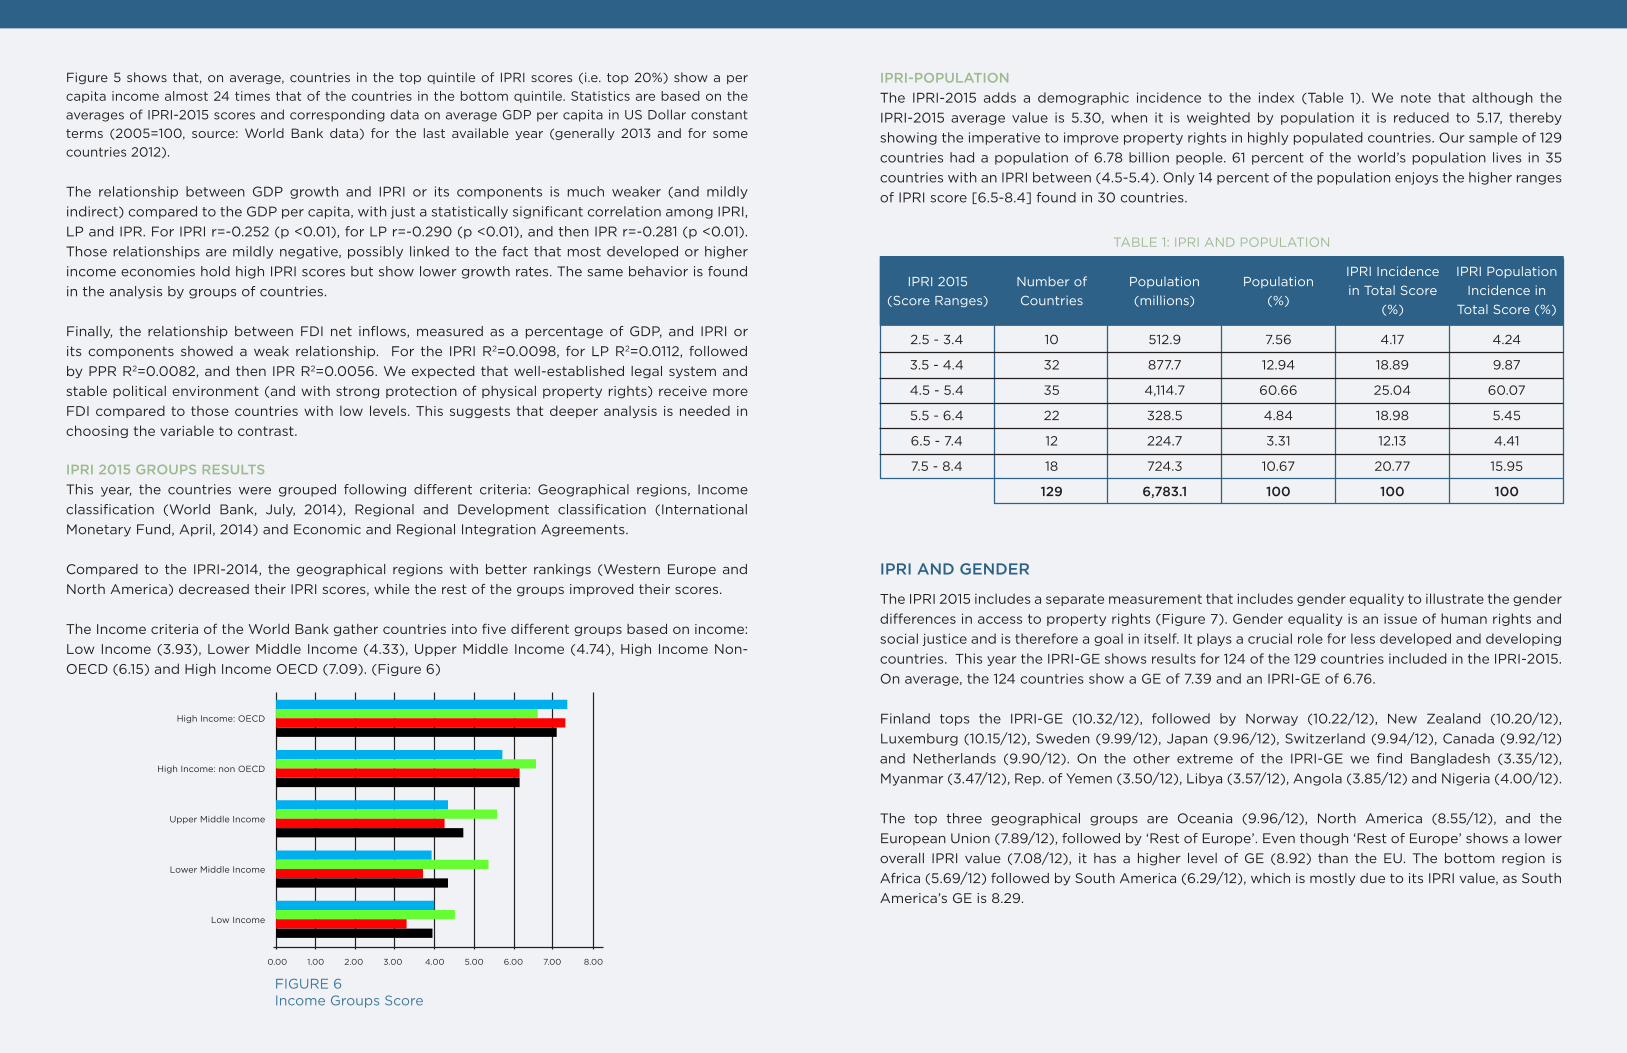
Finland came in first in the 2015 IPRI (8.32/10), followed by Norway (8.22/10), New Zealand (8.20/10), Luxemburg (8.14/10) and Singapore (8.10/10) [Figure 1]. Scandinavian countries reported (Figure 2) high IPRI score rankings (Finland #1, Norway #2, Sweden #7) and Northern European countries report strong property right systems (Luxemburg #4 and Netherlands #10). New Zealand (#3, 8.20/10) has the highest LP score (9.0), Singapore (#5, 8.10/10) has the highest PPR score (8.1) and Japan (#8, 8.0/10) has the highest IPR score (8.6).
10
9
8
7
6
5
4
3
2
1
0FIN NOR NZL LUX SGP CHE SWE JPN CAN NLD DNK AUS GBR DEU USA
IPRI 2015 LP 2015 PPR 2015 IPR 2015
FIGURE 2Top 15 Countries
At the bottom is Myanmar (2.53/10), followed by Bangladesh (2.56/10), Angola (2.64/10), Haiti (2.67/10) and the Bolivarian Republic of Venezuela (2.69/10). Seven of the fifteen countries at the bottom were not included in last year’s IPRI (Myanmar, Angola, Haiti, Libya, Yemen, Lebanon and Albania). Although their scores are low, the availability of data this year is a good sign for future improvement.
IPRI AND ECONOMIC OUTCOMESProperty rights are important in part because of their close relation with economic performance, prosperity and wellbeing of populations.
The relationship between the IPRI scores and GDP per capita are strong and significant, with a Pearson coefficient of 0.822 (p<0.01). In addition, the best-fit curve for this case is a 2nd grade polynomial with a coefficient of determination of R2=0.7919. The components of the IPRI also show significant relationship with GDP per capita, and their best-fit curve is a 2nd degree polynomial. The strongest relationship is reported for LP with an R2=0.7804, followed by IPR with an R2=0.7523, and then PPR with an R2=0.5167. (Figure 3). The same behavior is found in analyzing the relationship of GDP per capita and IPRI-2015 by groups of countries. (Figure 4)
These results show the significant and positive relationship between prosperity and a robust prop-erty right system measured at an individual level. The statistical dispersion of the GDP distribution in each country was not considered in this analysis.
FIGURE 4IPRI and GDP per capita. Countriessized by population
Top 20 Percent 2nd Quintile 3rd Quintile 4th Quintile Bottom 20 Percent
$50,000
$45,000
$40,000
$35,000
$30,000
$25,000
$20,000
$15,000
$10,000
$5,000
$0
$44,542.82
$23,786.34
$11,086.53
$3,377.99$1,880.94
FIGURE 5Average per capita Income by IPRI Quintile
2015 IPRI RESULTS (CONT.)
FIGURE 3Relationship between IPRI and GDP per capital
900000
80000
70000
60000
50000
40000
30000
20000
10000
0
GD
PP
C
IPRI 2015
R2 = 0.7919
80000
60000
40000
20000
0
-20000
GD
PP
C
R2 = 0.7919
IPRI 2015
IPRI 2015 GROUPS RESULTS This year, the countries were grouped following different criteria: Geographical regions, Income classification (World Bank, July, 2014), Regional and Development classification (International Monetary Fund, April, 2014) and Economic and Regional Integration Agreements.
Compared to the IPRI-2014, the geographical regions with better rankings (Western Europe and North America) decreased their IPRI scores, while the rest of the groups improved their scores.
The Income criteria of the World Bank gather countries into five different groups based on income: Low Income (3.93), Lower Middle Income (4.33), Upper Middle Income (4.74), High Income Non-OECD (6.15) and High Income OECD (7.09). (Figure 6)
High Income: OECD
High Income: non OECD
Upper Middle Income
Lower Middle Income
Low Income
0.00 1.00 2.00 3.00 4.00 5.00 6.00 7.00 8.00
IPRI-POPULATION The IPRI-2015 adds a demographic incidence to the index (Table 1). We note that although the IPRI-2015 average value is 5.30, when it is weighted by population it is reduced to 5.17, thereby showing the imperative to improve property rights in highly populated countries. Our sample of 129 countries had a population of 6.78 billion people. 61 percent of the world’s population lives in 35 countries with an IPRI between (4.5-5.4). Only 14 percent of the population enjoys the higher ranges of IPRI score [6.5-8.4] found in 30 countries.
2.5 - 3.4
3.5 - 4.4
4.5 - 5.4
5.5 - 6.4
6.5 - 7.4
7.5 - 8.4
10
32
35
22
12
18
129
512.9
877.7
4,114.7
328.5
224.7
724.3
6,783.1
7.56
12.94
60.66
4.84
3.31
10.67
100
4.17
18.89
25.04
18.98
12.13
20.77
100
4.24
9.87
60.07
5.45
4.41
15.95
100
IPRI 2015(Score Ranges)
Number ofCountries
Population(millions)
Population(%)
IPRI Incidencein Total Score
(%)
IPRI PopulationIncidence in
Total Score (%)
TABLE 1: IPRI AND POPULATION
IPRI AND GENDER
The IPRI 2015 includes a separate measurement that includes gender equality to illustrate the gender differences in access to property rights (Figure 7). Gender equality is an issue of human rights and social justice and is therefore a goal in itself. It plays a crucial role for less developed and developing countries. This year the IPRI-GE shows results for 124 of the 129 countries included in the IPRI-2015. On average, the 124 countries show a GE of 7.39 and an IPRI-GE of 6.76.
Finland tops the IPRI-GE (10.32/12), followed by Norway (10.22/12), New Zealand (10.20/12), Luxemburg (10.15/12), Sweden (9.99/12), Japan (9.96/12), Switzerland (9.94/12), Canada (9.92/12) and Netherlands (9.90/12). On the other extreme of the IPRI-GE we find Bangladesh (3.35/12), Myanmar (3.47/12), Rep. of Yemen (3.50/12), Libya (3.57/12), Angola (3.85/12) and Nigeria (4.00/12).
The top three geographical groups are Oceania (9.96/12), North America (8.55/12), and the European Union (7.89/12), followed by ‘Rest of Europe’. Even though ‘Rest of Europe’ shows a lower overall IPRI value (7.08/12), it has a higher level of GE (8.92) than the EU. The bottom region is Africa (5.69/12) followed by South America (6.29/12), which is mostly due to its IPRI value, as South America’s GE is 8.29.
Figure 5 shows that, on average, countries in the top quintile of IPRI scores (i.e. top 20%) show a per capita income almost 24 times that of the countries in the bottom quintile. Statistics are based on the averages of IPRI-2015 scores and corresponding data on average GDP per capita in US Dollar constant terms (2005=100, source: World Bank data) for the last available year (generally 2013 and for some countries 2012).
The relationship between GDP growth and IPRI or its components is much weaker (and mildly indirect) compared to the GDP per capita, with just a statistically significant correlation among IPRI, LP and IPR. For IPRI r=-0.252 (p <0.01), for LP r=-0.290 (p <0.01), and then IPR r=-0.281 (p <0.01). Those relationships are mildly negative, possibly linked to the fact that most developed or higher income economies hold high IPRI scores but show lower growth rates. The same behavior is found in the analysis by groups of countries.
Finally, the relationship between FDI net inflows, measured as a percentage of GDP, and IPRI or its components showed a weak relationship. For the IPRI R2=0.0098, for LP R2=0.0112, followed by PPR R2=0.0082, and then IPR R2=0.0056. We expected that well-established legal system and stable political environment (and with strong protection of physical property rights) receive more FDI compared to those countries with low levels. This suggests that deeper analysis is needed in choosing the variable to contrast.
FIGURE 6Income Groups Score

IPRI CLUSTER ANALYSIS This year we performed a cluster analysis in order to gather homogeneous countries (Figure 8). The 129 countries were classified according to their values in LP, PPR and IPR into three different clusters. Each cluster represents a different group with common characteristics beyond merely property rights. The cluster analysis revealed countries grouped with a high degree of homogeneity and property rights, which confirms the relevance of property rights in shaping societies.
OCEANIA NORTHAMERICA
EUROPEANUNION
REST OFEUROPE ASIA CENTRAL AMERICA
AND THE CARIBBEANSOUTH
AMERICA AFRICA
12.00
10.00
8.00
6.00
4.00
2.00
0.00
GE IPRI - GE
CASE STUDIES
Case study on Peru. The Hidden History of the Defeat of the Shining Path - and the Birth of Peru’s New Middle Class
By Dr. Hernando De Soto, Institute for Liberty and Democracy
Over the past year the Institute for Liberty
and Democracy (ILD) has been reviewing its
archives as a reminder of the great success it
has had in Peru. The ILD managed to steer Peru
away from the dangerous path to state induced
violence and towards economic prosperity and
freedom. The Peruvian elite denied people
access to property and business rights based on
the assumption that the poor and uneducated
were incapable of economic contribution. The
ILD helped distinguish between those who
wanted to be included in the economic system
(DECAS) and those who supported radical
terrorism. Reforms to the economy proposed
and defended by the ILD allowed business
registration to decrease from 278 days to 1 day
and at a fraction of the previous cost. As a result,
388,000 new businesses and 558,000 new jobs
were created. Terrorists could no longer find
recruits, as people chose economic prosperity
over radical terrorism. The ILD remembers its
success and hopes to bring the same ideas to
the Middle East and North Africa, where 300
million people are currently searching for the
same alternative to terrorism that Peruvians
once were.
Case Study on Brazil. Reflections on the Social Function of Property in Brazil
By Wagner Lenhart, Instituto Liberdade
Property rights are protected as among the
fundamental rights in the Brazilian Constitution.
However such recognition is made with
exceptions, and these rights are relativized by
several mechanisms of state intervention in
the private domain. This study analyzes the
“social function” of property, a conception of
the public interest in property that limits and
relativizes property rights in the Brazilian legal
system. The social function of property has
been understood by many Brazilian scholars
and judges as an advancement in the realm of
property rights. The problem is that the social
function of property generates by its own
nature, a culture of devaluation and disrespect
of private assets, creates legal insecurity,
and results in repeated cases of arbitrary
conduct by public administrators. As a result, it
negatively affects the country’s economy. For
these reasons, the social function of property
can and should be questioned and rethought.
WWW.INTERNATIONALPROPERTYRIGHTSINDEX.ORG
FIGURE 7GE and IPRI-GE Groups of Countries
FIGURE 8Clusters’ Members and Centroids. Factor 1 and Factor 2
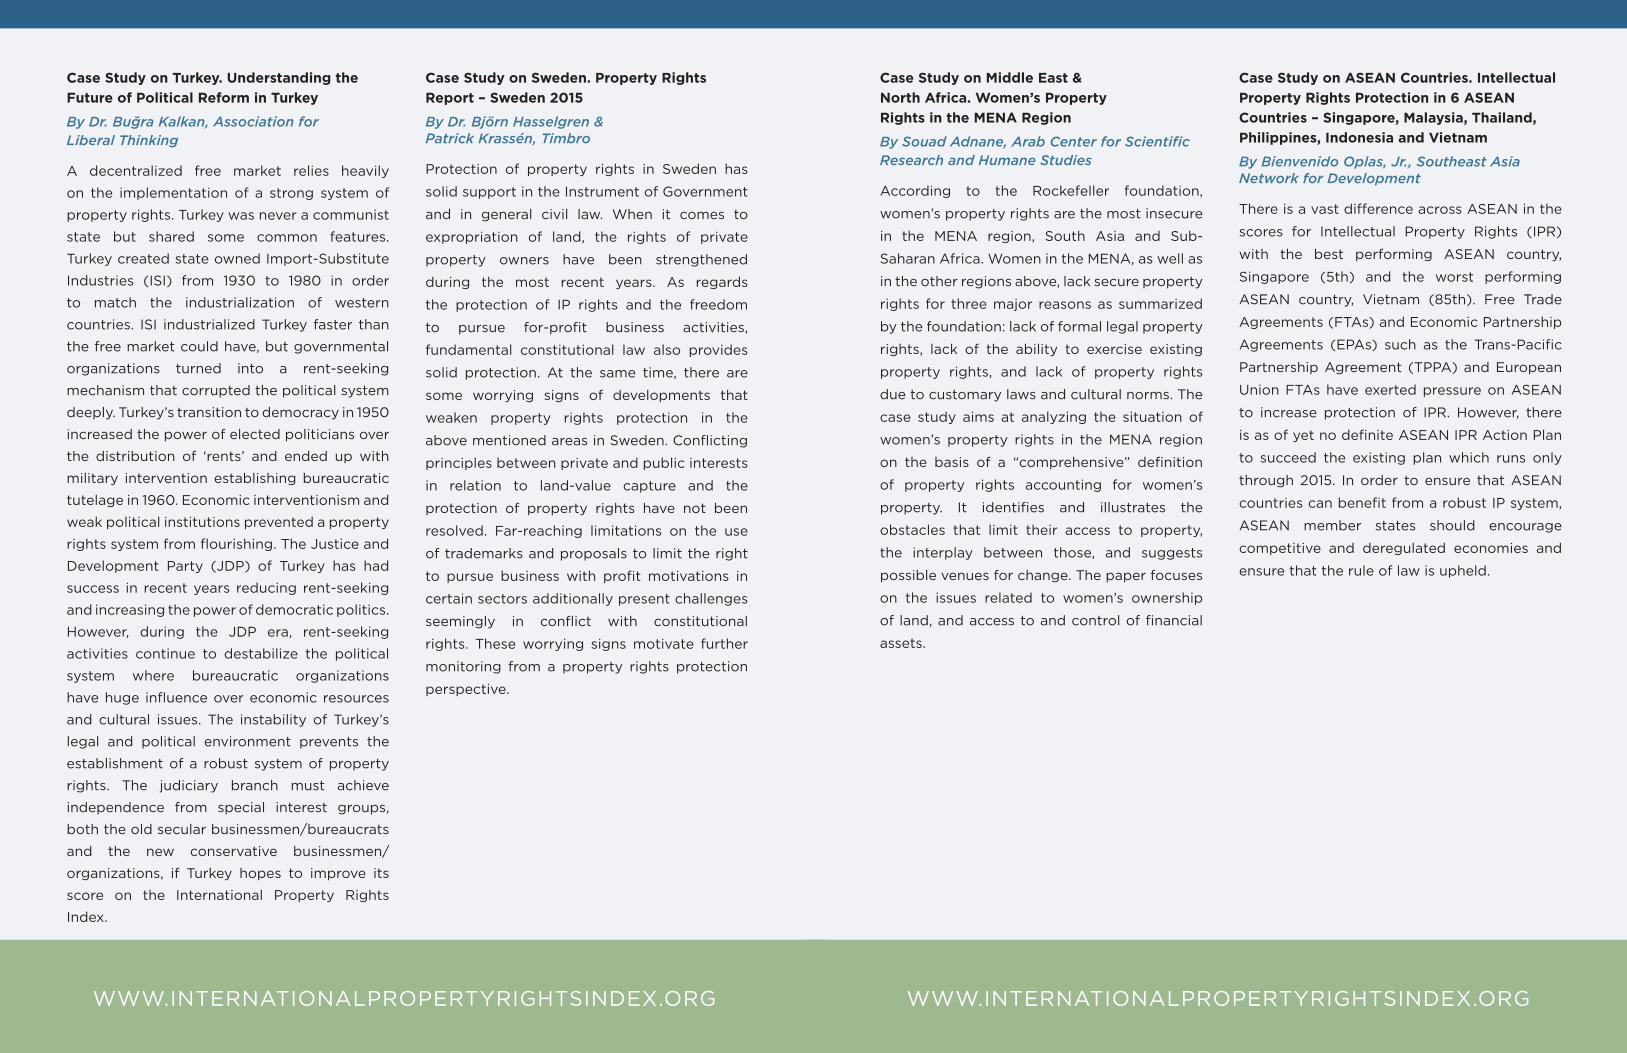
Case Study on Turkey. Understanding the Future of Political Reform in Turkey
By Dr. Buğra Kalkan, Association forLiberal Thinking
A decentralized free market relies heavily
on the implementation of a strong system of
property rights. Turkey was never a communist
state but shared some common features.
Turkey created state owned Import-Substitute
Industries (ISI) from 1930 to 1980 in order
to match the industrialization of western
countries. ISI industrialized Turkey faster than
the free market could have, but governmental
organizations turned into a rent-seeking
mechanism that corrupted the political system
deeply. Turkey’s transition to democracy in 1950
increased the power of elected politicians over
the distribution of ‘rents’ and ended up with
military intervention establishing bureaucratic
tutelage in 1960. Economic interventionism and
weak political institutions prevented a property
rights system from flourishing. The Justice and
Development Party (JDP) of Turkey has had
success in recent years reducing rent-seeking
and increasing the power of democratic politics.
However, during the JDP era, rent-seeking
activities continue to destabilize the political
system where bureaucratic organizations
have huge influence over economic resources
and cultural issues. The instability of Turkey’s
legal and political environment prevents the
establishment of a robust system of property
rights. The judiciary branch must achieve
independence from special interest groups,
both the old secular businessmen/bureaucrats
and the new conservative businessmen/
organizations, if Turkey hopes to improve its
score on the International Property Rights
Index.
Case Study on Sweden. Property Rights Report – Sweden 2015
By Dr. Björn Hasselgren & Patrick Krassén, Timbro
Protection of property rights in Sweden has
solid support in the Instrument of Government
and in general civil law. When it comes to
expropriation of land, the rights of private
property owners have been strengthened
during the most recent years. As regards
the protection of IP rights and the freedom
to pursue for-profit business activities,
fundamental constitutional law also provides
solid protection. At the same time, there are
some worrying signs of developments that
weaken property rights protection in the
above mentioned areas in Sweden. Conflicting
principles between private and public interests
in relation to land-value capture and the
protection of property rights have not been
resolved. Far-reaching limitations on the use
of trademarks and proposals to limit the right
to pursue business with profit motivations in
certain sectors additionally present challenges
seemingly in conflict with constitutional
rights. These worrying signs motivate further
monitoring from a property rights protection
perspective.
WWW.INTERNATIONALPROPERTYRIGHTSINDEX.ORG WWW.INTERNATIONALPROPERTYRIGHTSINDEX.ORG
Case Study on Middle East & North Africa. Women’s Property Rights in the MENA Region
By Souad Adnane, Arab Center for Scientific Research and Humane Studies
According to the Rockefeller foundation,
women’s property rights are the most insecure
in the MENA region, South Asia and Sub-
Saharan Africa. Women in the MENA, as well as
in the other regions above, lack secure property
rights for three major reasons as summarized
by the foundation: lack of formal legal property
rights, lack of the ability to exercise existing
property rights, and lack of property rights
due to customary laws and cultural norms. The
case study aims at analyzing the situation of
women’s property rights in the MENA region
on the basis of a “comprehensive” definition
of property rights accounting for women’s
property. It identifies and illustrates the
obstacles that limit their access to property,
the interplay between those, and suggests
possible venues for change. The paper focuses
on the issues related to women’s ownership
of land, and access to and control of financial
assets.
Case Study on ASEAN Countries. Intellectual Property Rights Protection in 6 ASEAN Countries – Singapore, Malaysia, Thailand, Philippines, Indonesia and Vietnam
By Bienvenido Oplas, Jr., Southeast Asia Network for Development
There is a vast difference across ASEAN in the
scores for Intellectual Property Rights (IPR)
with the best performing ASEAN country,
Singapore (5th) and the worst performing
ASEAN country, Vietnam (85th). Free Trade
Agreements (FTAs) and Economic Partnership
Agreements (EPAs) such as the Trans-Pacific
Partnership Agreement (TPPA) and European
Union FTAs have exerted pressure on ASEAN
to increase protection of IPR. However, there
is as of yet no definite ASEAN IPR Action Plan
to succeed the existing plan which runs only
through 2015. In order to ensure that ASEAN
countries can benefit from a robust IP system,
ASEAN member states should encourage
competitive and deregulated economies and
ensure that the rule of law is upheld.

WWW.INTERNATIONALPROPERTYRIGHTSINDEX.ORG
Case Study on Fashion & Intellectual Property Rights. Globalisation: a New Opportunity for Counterfeiting? The Case of the Italian Fashion Industry
By Giammarco Brenelli, Competere
The law regarding industrial property
rights encompasses both the definition and
protection of new ideas, applied to industry.
It originally developed together with the
industrial revolution, first in the single countries
and later with international conventions. With
the advent of globalisation, however, it has
become apparent that there are many gaps in
the protection of ideas and innovation afforded
by legislation, and in fact development
on a global scale has brought with it the
“poisoned fruit” of increased opportunity for
counterfeiting. The huge and easy profits from
counterfeiting have attracted organised crime,
with a consequent need for standardised
protection and continuous updating of the
remedial measures. While the EU is still limited
in its action in this sphere, some national legal
systems are already reacting. Italy, for its part,
in 2009 introduced new probative tools and
also effective precautionary measures to be
implemented before trial. From the perspective
of the criminal code, the law today gives
stronger protection, not only of trademarks
and patents but of a company’s entire heritage
of know-how, and the action taken by damaged
companies and their defence counsels is more
incisive.
Special Case Study on Religion & Property Rights. Property Rights from a Christian Perspective
By Prof. Wolfgang Grassl, Acton Institute
A proper understanding of private property
is contingent upon two interdependent
components. First, private property is essential
for freedom and personal development.
Second, God has destined the goods of the
earth to benefit all people and nations. Failure
to appreciate both aspects of private property
leads to either laissez-faire capitalism or the
all-encompassing state, what Pius XI called
the “twin rocks of shipwreck.” Such teaching
calls for asceticism and detachment, and the
rejection of private property among some of its
members, recalling the fact that the apostles
of the early Church held property in common.
The ever-expanding secular powers of kings,
emperors and lords eventually led the Church
to have to define property rights to keep the
state at bay. Saint Thomas Aquinas declared
while it is natural for individuals to own things,
God as Creator is the ultimate owner of all
goods of the earth. Through ownership and
work the human person can glorify God in all
things, while being prudent to make sure what
one has does not prevent another from being.
The relationship between the human being
and property is best understood as a steward:
the person has the responsibility to treat his
property as Christ would, never forgetting that
God is the true owner of all in this world.


![View full document [PDF 5.77 MB]](https://cdn.vdocuments.mx/doc/165x107/5868d92f1a28ab7b568bd4fb/view-full-document-pdf-577-mb.jpg)
