
2012 Fourth Quarter and
Year End Results February 21, 2013
May 2, 2012
1

Cautionary Statement
2
CAUTIONARY NOTE REGARDING FORWARD-LOOKING STATEMENTS: This presentation contains “forward-looking statements” within the meaning of
the United States Private Securities Litigation Reform Act of 1995 and applicable Canadian securities legislation. Except for statements of historical
fact relating to the Company, information contained herein constitutes forward-looking statements, including any information as to the Company’s
strategy, plans or future financial or operating performance. Forward-looking statements are characterized by words such as “plan,” “expect”,
“budget”, “target”, “project”, “intend,” “believe”, “anticipate”, “estimate” and other similar words, or statements that certain events or
conditions “may” or “will” occur. Forward-looking statements are based on the opinions, assumptions and estimates of management considered
reasonable at the date the statements are made, and are inherently subject to a variety of risks and uncertainties and other known and unknown
factors that could cause actual events or results to differ materially from those projected in the forward-looking statements. These factors include
the Company’s expectations in connection with the projects and exploration programs discussed herein being met, the impact of general business and
economic conditions, global liquidity and credit availability on the timing of cash flows and the values of assets and liabilities based on projected
future conditions, fluctuating metal prices (such as gold, copper, silver and zinc), currency exchange rates (such as the Brazilian Real, the Chilean
Peso, the Argentine Peso and Mexican Peso versus the United States Dollar), possible variations in ore grade or recovery rates, changes in the
Company’s hedging program, changes in accounting policies, changes in the Company’s corporate mineral resources, risk related to non-core mine
dispositions, risks related to acquisitions, changes in project parameters as plans continue to be refined, changes in project development,
construction, production and commissioning time frames, risk related to joint venture operations, the possibility of project cost overruns or
unanticipated costs and expenses, higher prices for fuel, steel, power, labour and other consumables contributing to higher costs and general risks of
the mining industry, failure of plant, equipment or processes to operate as anticipated, unexpected changes in mine life, final pricing for concentrate
sales, unanticipated results of future studies, seasonality and unanticipated weather changes, costs and timing of the development of new deposits,
success of exploration activities, permitting time lines, government regulation and the risk of government expropriation or nationalization of mining
operations, environmental risks, unanticipated reclamation expenses, title disputes or claims, limitations on insurance coverage and timing and
possible outcome of pending litigation and labour disputes, as well as those risk factors discussed or referred to in the Company’s annual
Management’s Discussion and Analysis and Annual Information for the year ended December 31, 2011 filed with the securities regulatory authorities in
all provinces of Canada and available at www.sedar.com, and the Company’s Annual Report on Form 40-F filed with the United States Securities and
Exchange Commission. Although the Company has attempted to identify important factors that could cause actual actions, events or results to differ
materially from those described in forward-looking statements, there may be other factors that cause actions, events or results not to be anticipated,
estimated or intended. There can be no assurance that forward-looking statements will prove to be accurate, as actual results and future events
could differ materially from those anticipated in such statements. The Company undertakes no obligation to update forward-looking statements if
circumstances or management’s estimates, assumptions or opinions should change, except as required by applicable law. The reader is cautioned not
to place undue reliance on forward-looking statements. The forward-looking information contained herein is presented for the purpose of assisting
investors in understanding the Company’s expected financial and operational performance and results as at and for the periods ended on the dates
presented in the Company’s plans and objectives and may not be appropriate for other purposes.

3
Peter Marrone
Chief Executive Officer

4
Agenda
Overview Peter Marrone – Chief Executive Officer
Operational highlights Ludovico Costa – Chief Operating Officer
Financial highlights Charles Main - Chief Financial Officer
Development projects Evandro Cintra – SVP, Technical Services
Exploration Darcy Marud – SVP, Exploration
In Summary Peter Marrone – Chief Executive Officer

5
Y A M A N A ’ S C O R P O R A T E O B J E C T I V E
Clear Strategic Direction
Consistently delivering on expectations
Creating a reliable precious metals
company focused on growth and
sustainability across all measures
from production to cash flow.

Y A M A N A ’ S C O R P O R A T E S T R A T E G Y
Clear Strategic Focus – Reliability
6
We Stick to What We Know and Where We Know it

7
Y A M A N A ’ S C O R P O R A T E S T R A T E G Y
Growth: Operational and Financial
Exploration ► Development ► Operations ►
Financial ► Corporate Development

8
L E V E R A G I N G E X P E R T I S E T O C R E A T E V A L U E
Cerro Moro – Newest addition to the pipeline
High grade gold project acquired in mid / late 2012
• Broadly similar to existing operations: Mercedes
and El Peñón
• Since acquisition, mineral resources increased by
44% -- 1.95 million GEO
• Technical and trade-off studies completed
• Pre-development work initiated • Same approach to development used at Mercedes
• Average expected annual production ~ 200,000
GEO
Delivering value through application of expertise

V A L U E T H R O U G H E X P L O R A T I O N
Mineral Resources Growth
9
13.0
16.7
18.6 19.3
11.9
14.1 13.6
15.6
8.5
7.4
10.3 11.4
2009 2010 2011 2012
Proven and Probable mineral reserves
Measured and Indicated mineral resources
Inferred mineral resources
GEO
(m
illions)
GEO
(m
illions)
Note: Refer to the Mineral reserves and Resources table available at yamana.com for further detail on Mineral Reserves and Resources discussed in this presentation
+28%
+4% +11%
6th consecutive year of mineral reserve & mineral resource increases

10
13,412 14,212
2011 2012
+6%
17,108
17,938
2011 2012
+5%
Mineral Reserves - Operations(1)
(000)
Mineral Reserves - Operations
and Projects in Development(2)
(000)
V A L U E T H R O U G H E X P L O R A T I O N
Mineral Reserves (GEO)
1. Operations includes: Chapada, El Peñón, Gualcamayo, Mercedes, Jacobina, Minera Florida and Fazenda Brasileiro
2. Projects in Development includes: Ernesto/Pau a Pique, C1-Santa Luz and Pilar
Growth in quality and ounces

11
Mineral Reserves - Grade
(g/t)
0.83 0.93 0.96
2010 2011 2012
+16% of
Exploration
Improving quality of ounces
V A L U E T H R O U G H E X P L O R A T I O N
Mineral Reserves (GEO)
1. Operations includes: Chapada, El Peñón, Gualcamayo, Mercedes, Jacobina, Minera Florida and Fazenda Brasileiro
2. Projects in Development includes: Ernesto/Pau a Pique, C1-Santa Luz and Pilar
Importance
of
Exploration

O P E R A T I O N A L P E R F O R M A N C E
Production and Growth Reliability
Note: Silver production is treated as a gold equivalent and is based on an assumed silver to gold ratio of 50:1 in 2011 and 2012.
12
Delivering consistent quarter over quarter production growth
Growth in Production
(GEO)
278,832
288,700
310,490
322,990
Q1 2012 Q2 2012 Q3 2012 Q4 2012
267,368
278,737 279,274 276,918
Q1 2011 Q2 2011 Q3 2011 Q4 2011
239,838
253,264
267,409
286,683
Q1 2010 Q2 2010 Q3 2010 Q4 2010
2010 2011 2012

D E L I V E R I N G O R G A N I C G R O W T H
Continued Production Growth
13
2010 2011 2012A 2013E 2014E
Silver ozs
Gold ONLY ozs
1.1M 1.0M
Note: Silver production is treated as a gold equivalent based on a silver to gold ratio of 50:1.
9M
1.2M
Established trend at delivering production growth
+60%
10M 9M
+20%
+33%
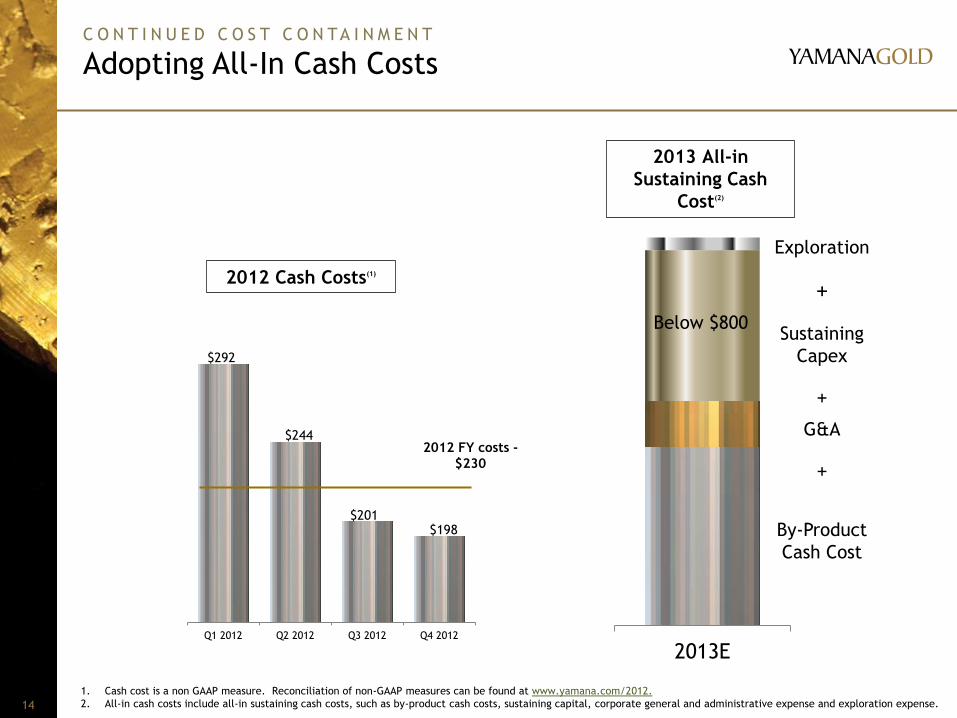
14
2013E
Below $800
2012 Cash Costs(1)
2012 FY costs -
$230
2013 All-in
Sustaining Cash
Cost(2)
C O N T I N U E D C O S T C O N TA I N M E N T
Adopting All-In Cash Costs
Exploration
+
Sustaining
Capex
+
G&A
+
By-Product
Cash Cost
$292
$244
$201 $198
Q1 2012 Q2 2012 Q3 2012 Q4 2012
1. Cash cost is a non GAAP measure. Reconciliation of non-GAAP measures can be found at www.yamana.com/2012.
2. All-in cash costs include all-in sustaining cash costs, such as by-product cash costs, sustaining capital, corporate general and administrative expense and exploration expense.

G R O W T H I N F I N A N C I A L M E T R I C S
Generating Cash Flow Growth
15
$873M +20%
Avg. cash flow to end of 2009-2011 Cash flow to end of 2012
2012 2009-2011
Cash flow continues to trend upward
495,619
856,827
1,266,373
1,044,946
2009 2010 2011 2012
Cash flow
growth
expected to
continue
Delivering value through
generating cash flow
Cash Flow to End of 2012(1)
$1.045B
1. All-in cash costs include all-in sustaining cash costs, such as by-product cash costs, sustaining capital, corporate general and administrative expense and exploration expense.

16
Ludovico Costa
Chief Operating Officer

Delivering on Production Growth
17
Production Q4 2012 2012
GEO 322,990 1,201,010
Gold (ozs) 276,373 1,019,969
Silver (ozs) 2.3M 9.0M
Copper (lbs)(Chapada) 40.5M 150.6M
Costs(1) Q4 2012 2012
GEO $198 $230
Production 2013
GEO 1.44 -1.60M
Copper (lbs) 120-135M
1. Cash cost is a non GAAP measure. Reconciliation of non-GAAP measures can be found at www.yamana.com/2012
Production expected to increase in 2013 by approx. 20%

Chapada
18
Production Q4 2012 2012
Tonnes (mined) 5,924,456 22,490,266
Tonnes (processed) 5,734,592 21,591,482
Gold grade (g/t) 0.28 0.29
Gold recovery (%) 59.4 59.4
Gold produced (GEO) 32,498 128,171
Cash cost/GEO (co-product) $349 $333
Cash cost/GEO (by-product) $(2,021) $(1,865)
Copper recovery (%) 81.1 82.2
Copper produced (M lbs) 40.5 150.6
Copper cost/lb $1.38 $1.40
Copper grade (%) 0.40 0.39
Gold production expected to increase in 2014 and years to follow

El Peñón
19
Production Q4 2012 2012
Tonnes (mined) 377,341 1,442,245
Tonnes (processed) 362,874 1,415,292
Gold grade (g/t) 8.59 7.47
Gold recovery (%) 93.0 93.5
Gold produced (GEO) 128,119 462,496
Gold produced (ozs) 93,448 317,557
Silver produced (ozs) 1,733,573 7,246,951
Cash cost/GEO $415 $440
11% increase in GEO production over Q4 2011

Gualcamayo
20
Production Q4 2012 2012
Tonnes (mined) 1,294,174 9,720,842
Tonnes (processed) 2,002,170 7,742,140
Gold grade (g/t) 0.66 0.80
Gold recovery (%) 75.8 75.5
Gold produced (ozs) 31,502 147,310
Cash cost/oz $485 $536
Targeting approximately 200,000 gold ounces beginning in 2014

Mercedes
21
Production Q4 2012 2012
Tonnes (mined) 136,105 513,684
Tonnes (processed) 164,285 603,188
Gold grade (g/t) 7.38 6.43
Gold recovery (%) 95.8 94.8
Gold produced (GEO)1 39,443 126,010
Gold (ozs)2 36,057 116,215
Silver (ozs)3 169,313 489,747
Cash cost/GEO $435 $485
1. Includes 8,959 GEO commissioning production for the full year 2. Includes 8,201 gold ounces commissioning production for the full year. 3. Includes 37,912 silver ounces of
commissioning production for the full year.
First full year of production above top of guidance

Jacobina
22
Production Q4 2012 2012
Tonnes (mined) 503,669 2,109,613
Tonnes (processed) 508,737 2,104,683
Gold grade (g/t) 1.87 1.84
Gold recovery (%) 92.5 93.8
Gold produced (ozs) 28,337 116,863
Cash cost/oz $825 $747
Opportunity to increase production to over 140,000 ounces

Minera Florida
23
Production Q4 2012 2012
Tonnes (mined) 205,882 858,953
Tonnes (processed) 222,440 902,788
Gold grade (g/t) 3.53 3.34
Gold recovery (%) 81.6 81.1
Gold produced (GEO)1 32,797
105,679
Gold (ozs)2 27,889 89,163
Silver (ozs)3 245,393 825,812
Cash cost/GEO $805 $797
1. Includes 1,861 GEO commissioning production for the full year. 2. Includes 1,486 gold ounces commissioning production for the full year. 3. Includes 18,737 silver ounces of
commissioning production for the full year.
42% increase GEO production over Q4 2011

Other Operations
24
Fazenda Brasilero
• 22% increase in production over 2011
• Cash costs 7% lower than 2011
Alumbrera
• Recorded higher earnings for Q4 2012 and full year
• Cash distributions resumed January 2013

25
Chuck Main
Chief Financial Officer

F I N A N C I A L S T A T U S
Financial Performance
26
Revenue
$197M Adjusted Earnings2
per share: $0.26
$298M Operating cash flow2,3
per share: $0.40
Production (GEO)1 322,990
Production Copper - Chapada (Mlbs) 40.5
1. Production includes commissioning. 2. A non-GAAP measure. A reconciliation of non-GAAP measures can be found at www.yamana.com/2012 in accordance with
previous Canadian GAAP for public entities. 3. Operating cash flow generated from operations before changes in non-cash working capital in accordance with Canadian
GAAP for public entities.
$630M
$1.045B
$694M
$2.3B
1,201,010
150.6
$0.93
Q4 2012 2012
$1.40

F I N A N C I A L S T A T U S
Robust Balance Sheet
27
$146M
$54M
$384M
$58M
$766M
$1.165B
$1.1B
Exploration
Debt
Available Cash &
Credit
Cash & Cash Equivalents
Corporate G&A
Net Finance Expense
DD&A
$350M
Capital Expenditure1
1. Capital Expenditure excludes the Extorre acquisition cost of $373M

28
$1,404 $1,361 $1,479 $1,494
$0
$400
$800
$1,200
$1,600
Q1 2012 Q2 2012 Q3 2012 Q4 2012
C O N T I N U E D C O S T C O N TA I N M E N T
Margin Expansion Exceeding Metal Price Changes
Note: Cash margin is the difference between the average realized gold price and by-product cash costs per GEO.
Margins reflect cost containment -- beyond changes in metals pricing
By-product cash costs
• Cash costs have declined
quarter over quarter
• Margin expansion has
exceeded commodity
price changes in each
quarter
Avera
ge R
ealized G
old
Pri
ce

29
2013
BELOW
$800
C O N T I N U E D C O S T C O N TA I N M E N T
All-in Sustaining Costs
Note: All-in cash costs include all-in sustaining cash costs, such as by-product cash costs, sustaining capital, corporate general and administrative expense and exploration expense.
Industry low all-in sustaining costs
Exploration
+
Sustaining
Capex
+
G&A
+
By-Product
Cash Cost
All-in sustaining costs
• Newly disclosed metric
• Historically only
considered internally
• Complementary to cash
costs
• Measure of capacity for
free cash flow generation

30
Evandro Cintra
SVP, Technical Services

D E V E L O P M E N T P R O J E C T S
All On Track
31
Est. Annual GEO Production
Pilar
C1 Santa Luz
Status
• Physical advancement 75% complete
• Developing Caiamar, high grade satellite deposit
• Start-up planned for mid-year 2013
• Physical advancement over 95% complete
• Start-up of operation pending – completion of
commissioning in mid-2013
100,000 oz
120,000 oz
Delivering growth through organic projects
Strategic Life
10+ yrs
9+ yrs
Gualcamayo – QDD Lower West
• Development continues and ramp-up is expected for mid-2013
• 200,000 ozs of sustainable production commencing in 2014
Cerro Moro
• Average annual production – 200,000 GEO
• 1,000 tpd – 70% from underground
• Pre-development of production ready decline initiated
• 2014 – feasibility and other studies to be completed

32
Darcy Marud
SVP, Exploration

F O C U S E D A N D S U C C E S S F U L E X P L O R AT I O N
2012 Exploration Successes
33
Replace mineral reserves and resources at all operations
• Mineral reserves at operations increased by 6% to 14.2M Aueq ounces
Increase mineral resource base
• Total gold equivalent mineral reserves increased by 4.1% to 19.3M ounces.
• Measured and Indicated gold equivalent mineral resources by 15% to 15.6M ounces.
• Inferred resources increased by 10%.
Accelerate development of new discoveries at development projects
• Maria Lazarus at Pilar, Corpo Sul at Chapada and Dorada West at El Penon.
Develop new projects and preliminary resources
• Initial mineral resources at Lavra Velha and Arco Sul
Reconnaissance exploration to find new projects
• 10 new targets generated
$125M for 2012 Exploration Program

34
Cerro Moro
Exploration drilling began in October • More than 100 holes completed in principal ore bodies.
First resource since acquisition • Indicated gold equivalent resources increase by 44% to 1.954M
New Discoveries – Margarita vein in La Negrita • Initial drilling has identified new vein zone 4 kilometers north of Zoe.
F O C U S E D A N D S U C C E S S F U L E X P L O R AT I O N
2012 Exploration Successes
Indicated
Cut-Off
(g/t) Tonnes
(000's) Au
(g/t) Ag
(g/t) AuEq
(g/t) Au oz
(000's) Ag oz
(000's) GEO
(000's) 1.0 4,157 6.6 400.3 14.6 884 53,497 1,953 1.5 3,311 8.2 491.6 18.0 874 52,328 1,921 2.0 2,962 9.1 542.4 20.0 869 51,651 1,901 2.5 2,777 9.7 573.5 21.2 864 51,204 1,888 3.0 2,681 10.0 591.2 21.8 861 50,949 1,880 3.5 2,602 10.3 606.2 22.4 858 50,703 1,872 4.0 2,500 10.6 626.4 23.1 852 50,346 1,860
Inferred
1.0 3,598 1.9 115.9 4.2 222 13,408 490 1.5 2,904 2.3 134.2 5.0 212 12,535 463 2.0 2,617 2.4 143.5 5.3 205 12,071 447 2.5 2,340 2.6 154.7 5.7 194 11,642 427 3.0 2,106 2.7 166.3 6.0 181 11,260 406 3.5 1,921 2.8 175.1 6.3 171 10,817 387 4.0 1,725 2.9 184.9 6.6 158 10,255 363

35
Chapada • Corpo Sul extended and added to mineral reserves resulting in increased copper and gold
grades year over year
• Gold mineral reserves increased by 11% and copper mineral reserves by 7%.
El Peñón • Dorada West added to mineral reserves. Grades decreased by 9% with addition of lower
grades from Pampa Augusta Victoria open pit.
• Gold equivalent mineral reserve increased by 6%.
Mercedes • Lupita and Diluvio added to indicated resources resulted in lower average grade.
• Rey de Oro low grade near surface mineralization added to inferred mineral resources.
• Higher grades intersected later in year are principal target for 2013 and may connect
to Klondike located 1 kilometer NW.
Pilar
• Addition of Maria Lazarus to inferred mineral resources.
• Deposit remains open in all directions.
F O C U S E D A N D S U C C E S S F U L E X P L O R AT I O N
2012 Exploration Successes

Continued focus of increasing minreral reserves and resources at all
operations. – Fortuna West and Dorada West at El Peñón .
– Corpo Sul and Chapada Norte at Chapada
– Rodado and QDDLW extension at Gualcamayo.
– Rey de Oro at Mercedes.
Advance new development projects – New vein zone, “Margarita” at Cerro Moro.
– Maria Lazara at Pilar
Increase size potential of new projects – Arco Sul and Lavra Velha
36
F O C U S E D A N D S U C C E S S F U L E X P L O R AT I O N
2013 Exploration Objectives

R&R Growth – 2007 to 2012
66% reserve growth since 2007 – 11% annualized growth rate
Note: Ag:Au = 50:1 except Mercedes (140:1)
0
5,000
10,000
15,000
20,000
25,000
2007 2008 2009 2010 2011 2012
P&P Aueq
M&I Aueq
Inferred Aueq
F O C U S E D A N D S U C C E S S F U L E X P L O R A T I O N

Questions
38

Conclusion
39
Peter Marrone
Chief Executive Officer

40
2012 2013 2014
Existing Operations
Organic Projects
Note: Gold equivalent ounces (GEO). Silver production is treated as a gold equivalent and is based on an assumed silver to gold ratio of 50:1.
2013 production to increase by approximately 20%
P R O D U C T I O N A N D G R O W T H R E L I A B I L I T Y
Delivering Value through Organic Growth
2014 production to increase by approximately 33%
+33% +20%
1.75M GEO of sustainable production expected from 2015 onwards
$873M
Avg. cash flow to end of 2009-2011 Cash flow to end of 2012
2012 2009-2011
$1.045B +20%

42
200 Bay Street, Suite 2200
Toronto, Ontario
M5J 2J3
416-815-0220/1-888-809-0925
www.yamana.com
![Medics Gone Wild [PIQUE]](https://cdn.vdocuments.mx/doc/165x107/577ce05c1a28ab9e78b327e2/medics-gone-wild-pique.jpg)


