Download - 2010 New Student Profile

2010 New Student Profile
enrollment.mst.edu
Founded 1870 | Rolla, Missouri

1,170 new first-time freshmen 388 new transfer students
32 states represented Massachusetts to California, Alaska to Florida
+18 foreign countries represented
Ave. ACT: 27.7 upper 10% in nation, four perfect ACT & one SAT scores
Ave. HS GPA: 3.80 94% have a 3.5 GPA or higher
38% from upper 10% of high school class 85% from upper 30% of high school class 86 Valedictorians and Salutatorians 16.5% from non-ranking
schools
Freshman ClassFall 2010
Unofficial data provided for internal university planning and training - NOT FOR PUBLIC DISTRIBUTIONOfficial S&T enrollment data available until after 4th week census
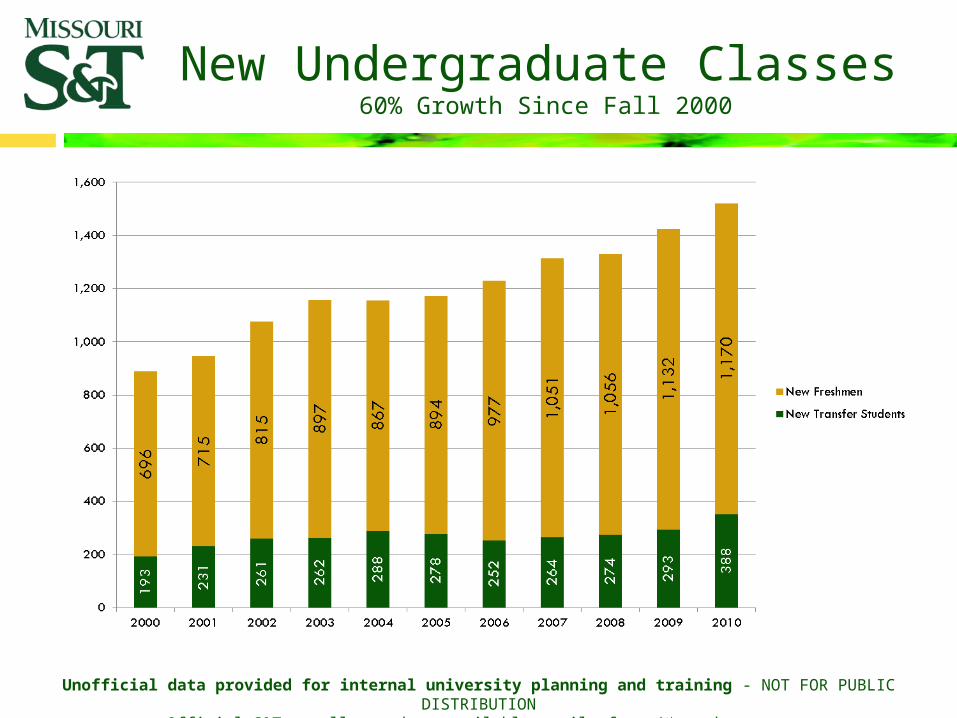
New Undergraduate Classes 60% Growth Since Fall 2000
Unofficial data provided for internal university planning and training - NOT FOR PUBLIC DISTRIBUTIONOfficial S&T enrollment data available until after 4th week census
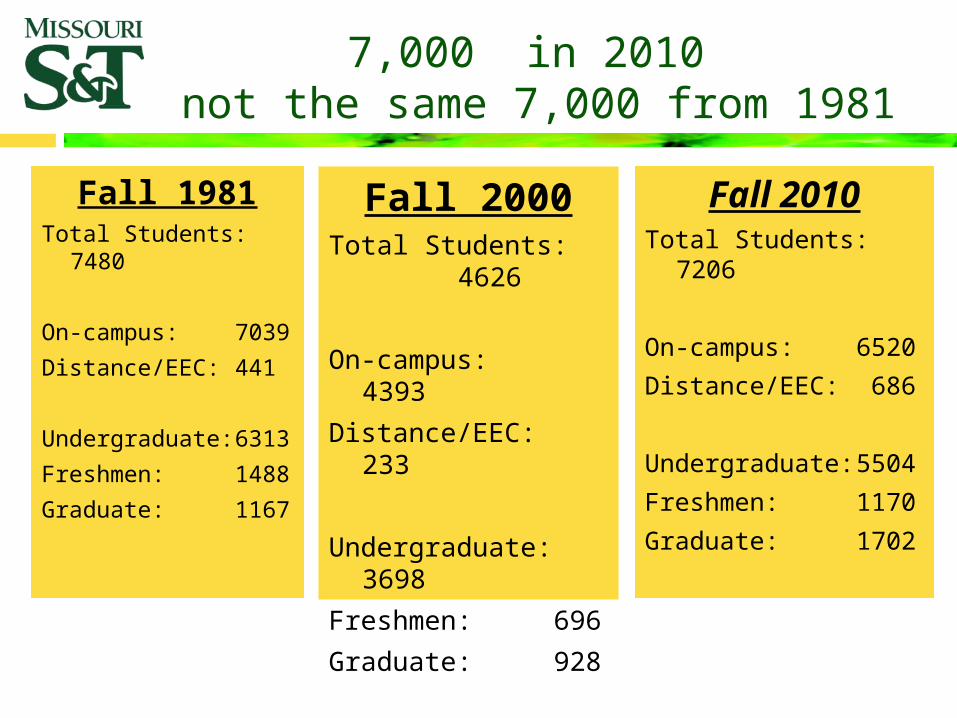
Fall 1981Total Students:
7480
On-campus: 7039
Distance/EEC: 441
Undergraduate:6313
Freshmen: 1488
Graduate: 1167
Fall 2010Total Students: 7206
On-campus: 6520
Distance/EEC: 686
Undergraduate: 5504
Freshmen: 1170
Graduate: 1702
7,000 in 2010 not the same 7,000 from 1981
Fall 2000Total Students: 4626
On-campus: 4393
Distance/EEC: 233
Undergraduate: 3698
Freshmen: 696
Graduate: 928
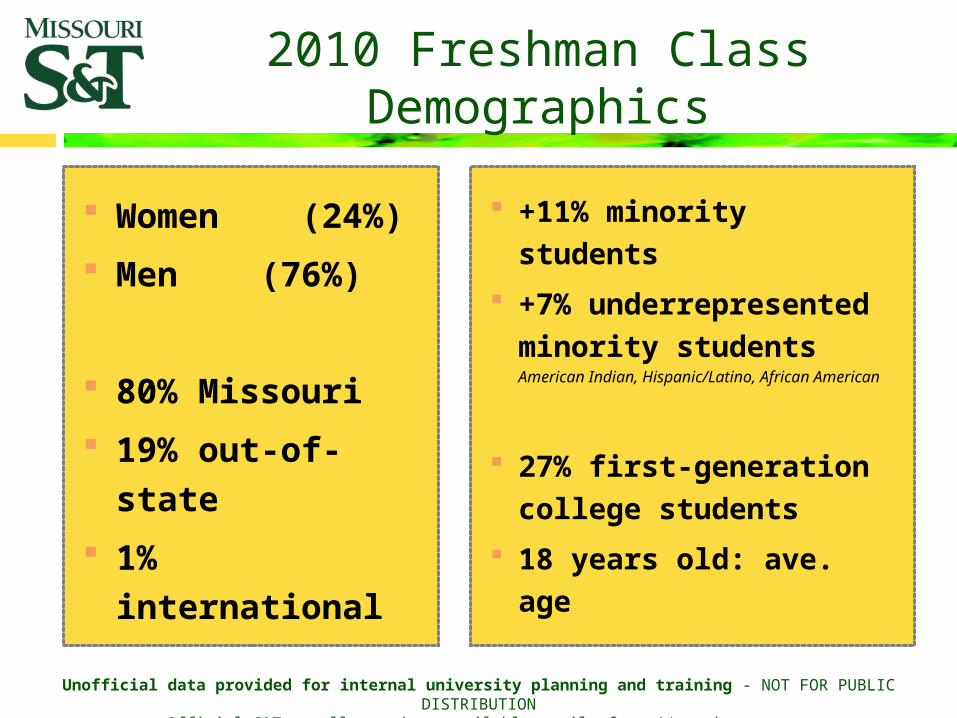
Women (24%)
Men (76%)
80% Missouri
19% out-of-state
1% international
+11% minority students
+7% underrepresented minority studentsAmerican Indian, Hispanic/Latino, African American
27% first-generation college students
18 years old: ave. age
2010 Freshman Class Demographics
Unofficial data provided for internal university planning and training - NOT FOR PUBLIC DISTRIBUTIONOfficial S&T enrollment data available until after 4th week census
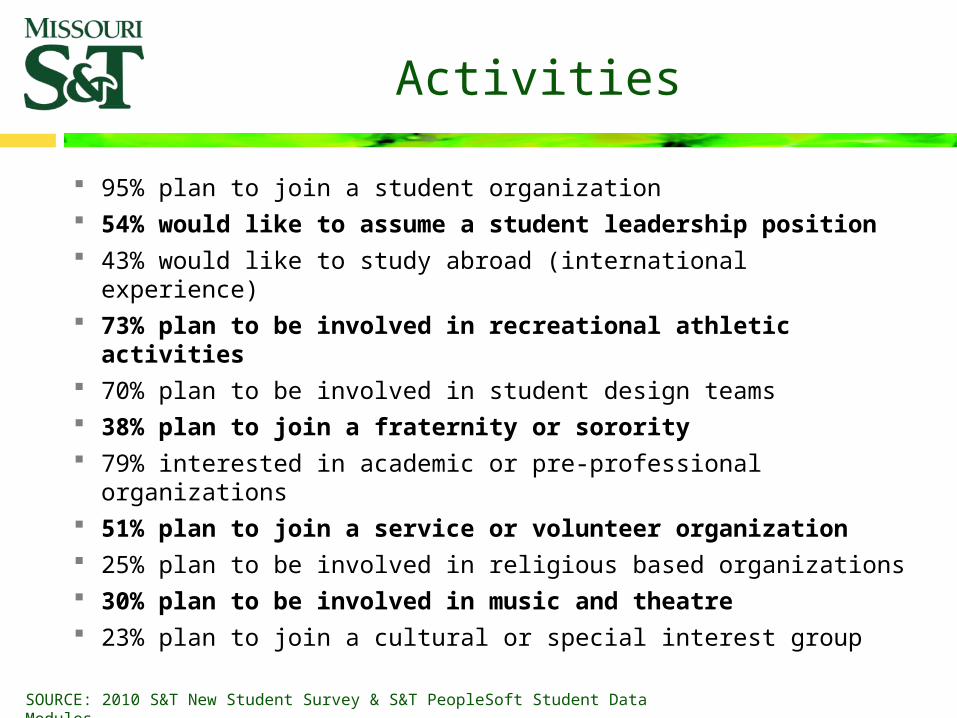
95% plan to join a student organization 54% would like to assume a student leadership position 43% would like to study abroad (international experience) 73% plan to be involved in recreational athletic activities 70% plan to be involved in student design teams 38% plan to join a fraternity or sorority 79% interested in academic or pre-professional organizations 51% plan to join a service or volunteer organization 25% plan to be involved in religious based organizations 30% plan to be involved in music and theatre 23% plan to join a cultural or special interest group
Activities
SOURCE: 2010 S&T New Student Survey & S&T PeopleSoft Student Data Modules
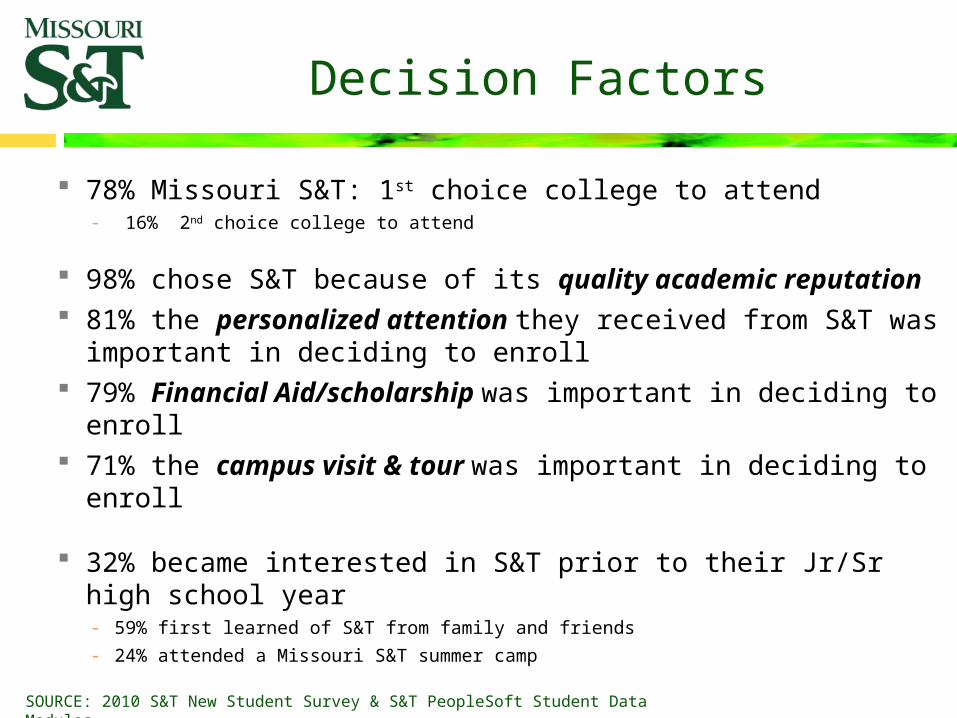
78% Missouri S&T: 1st choice college to attend- 16% 2nd choice college to attend
98% chose S&T because of its quality academic reputation 81% the personalized attention they received from S&T was
important in deciding to enroll 79% Financial Aid/scholarship was important in deciding to enroll 71% the campus visit & tour was important in deciding to enroll
32% became interested in S&T prior to their Jr/Sr high school year- 59% first learned of S&T from family and friends- 24% attended a Missouri S&T summer camp
Decision Factors
SOURCE: 2010 S&T New Student Survey & S&T PeopleSoft Student Data Modules

64% plan to complete a B.S. in 4 years or less
91% plan to co-op or intern
46% plan to study more than 11 hours per week at S&T 85% studied less than 5 hours per week in high school
- 92% plan to earn a 3.0 or higher S&T GPA- 46% plan to earn a 3.5 or higher S&T GPA
41% plan to earn a graduate degree at S&T 56% are likely to complete a graduate degree
Expectations
SOURCE: 2010 S&T New Student Survey & S&T PeopleSoft Student Data Modules
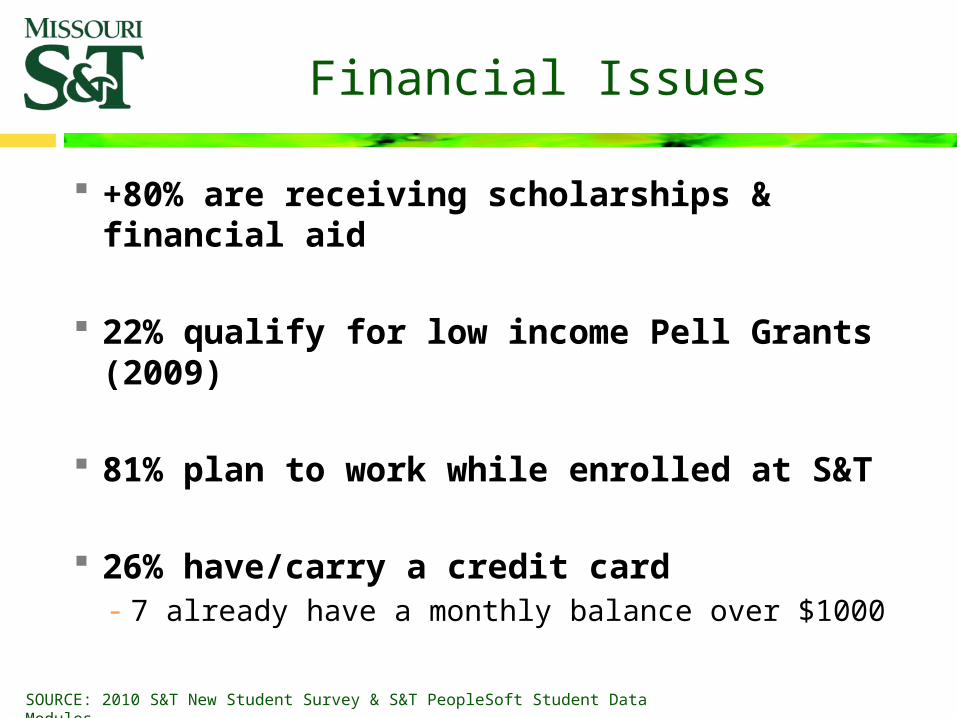
+80% are receiving scholarships & financial aid
22% qualify for low income Pell Grants (2009)
81% plan to work while enrolled at S&T
26% have/carry a credit card- 7 already have a monthly balance over $1000
Financial Issues
SOURCE: 2010 S&T New Student Survey & S&T PeopleSoft Student Data Modules

S&T Affordability
Current Undergraduate Students (2010)- Average parent income: $ 83,500
- Family incomes below $45,000: 21%
- First generation college students: 27%
- Pell Grant eligible students: 22%
Graduation Statistics - Approximate indebtedness (2009): $ 23,500
- Average 2010 starting salary: $ 57,800
SOURCE: 2009 S&T PeopleSoft Student FINAID Data Modules & DOE
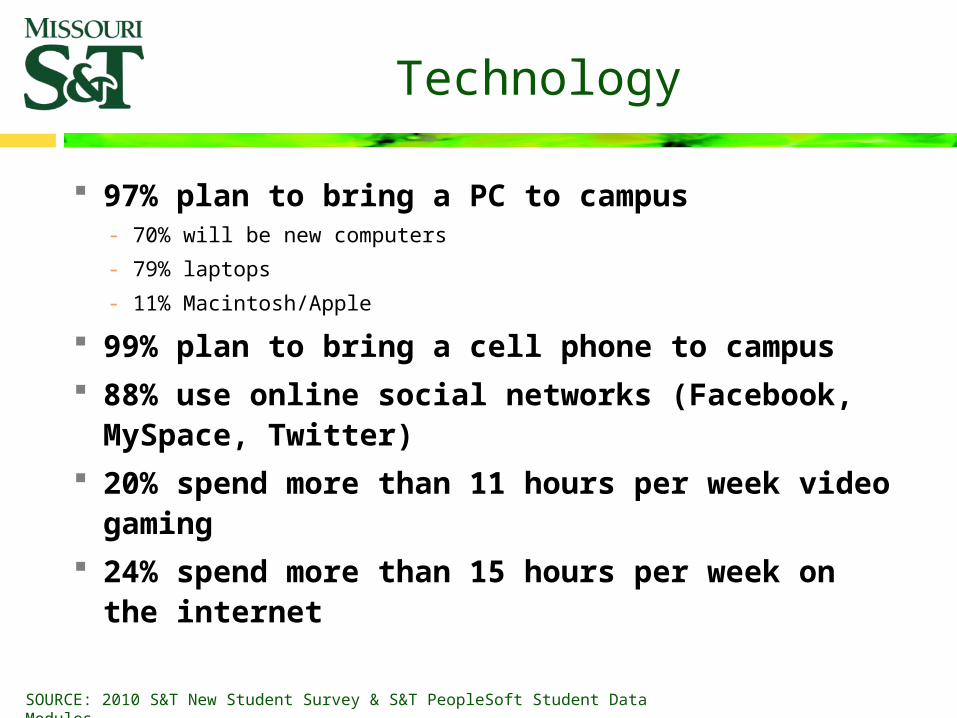
97% plan to bring a PC to campus- 70% will be new computers
- 79% laptops
- 11% Macintosh/Apple
99% plan to bring a cell phone to campus 88% use online social networks (Facebook, MySpace,
Twitter) 20% spend more than 11 hours per week video gaming 24% spend more than 15 hours per week on the
internet
Technology
SOURCE: 2010 S&T New Student Survey & S&T PeopleSoft Student Data Modules

Undergraduate Graduate
2003 $ 47,305 $ 52,744
2004 $ 46,567 $ 52,945
2005 $ 49,181 $ 53,042
2006 $ 51,059 $ 58,120
2007 $ 53,669 $ 62,751
2008 $ 55,975 $ 63,640
2009 $ 57,521 $ 67,567
2010 $ 57,800 $ 64,243
Reported Starting Salaries at Commencement
SOURCE: S&T COC Graduating Student Survey
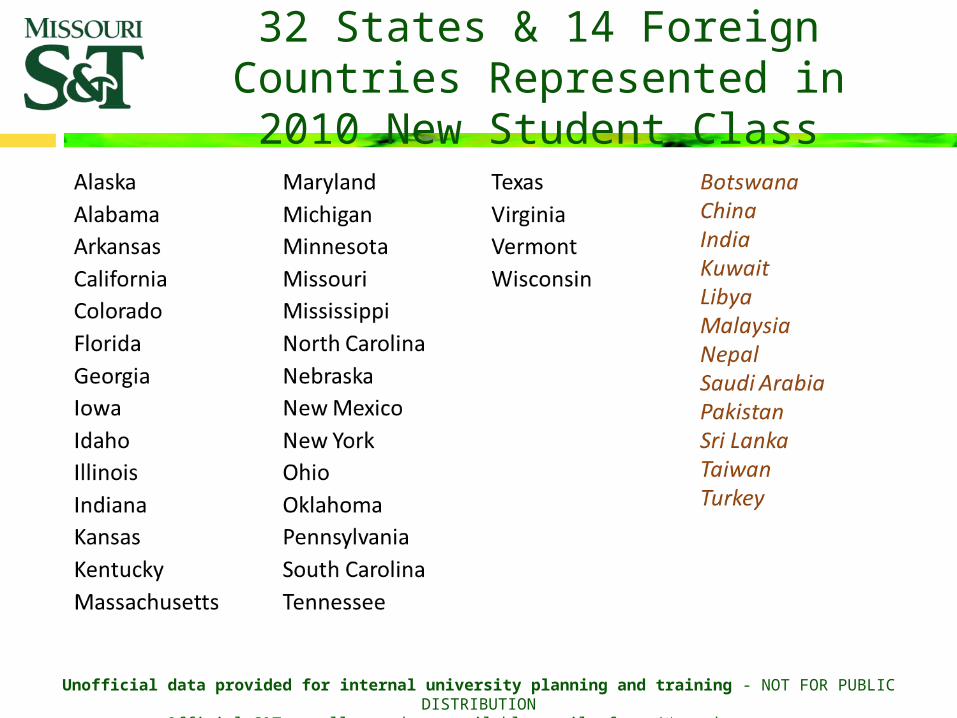
32 States & 14 Foreign Countries Represented in 2010 New Student Class
Unofficial data provided for internal university planning and training - NOT FOR PUBLIC DISTRIBUTIONOfficial S&T enrollment data available until after 4th week census

2010 Top Feeder Schools
Rolla Senior High School – 33Francis Howell North – 21Marquette High School – 18Home Schooled – 16Oakville High School – 15Waynesville High School – 14Wentzville Timberland High School – 14Jefferson City High School – 13Francis Howell High School – 13Eureka High School – 12Lafayette High School – 11Camdenton High School – 10Fort Zumwalt High School-South – 10DeSmet High School – 10Edwardsville (IL) High School – 10Lindbergh High School – 10Hazelwood West High School – 10Troy High School – 10
Blue Springs South High School – 9Fort Zumwalt High School-West – 9John F. Hodge High School – 9Pacific High School – 9Rockwood Summit High School – 9St. Dominic High School – 9Seckman High School – 9Blue Springs High School – 8Parkway South High School – 8Francis Howell Central – 8Ladue Horton Watkins High School – 8St. Louis University High School – 8Affton High School – 7Christian Brothers College High School – 7Wentzville High School – 7Hazelwood Central High School – 7Lee Summit North High School – 7Parkway West High School - 7
Unofficial data provided for internal university planning and training - NOT FOR PUBLIC DISTRIBUTIONOfficial S&T enrollment data available until after 4th week census


