
2010 Annual Report
JPMorgan Chase & Co.
©2011 JPMorgan Chase & Co. All rights reserved.Printed in the U.S.A.
Corporate headquarters270 Park Avenue New York, NY 10017-2070 Telephone: 212-270-6000 jpmorganchase.com
Principal subsidiariesJPMorgan Chase Bank, National Association Chase Bank USA, National Association J.P. Morgan Securities LLC
Annual Report on Form 10-KThe Annual Report on Form 10-K of JPMorgan Chase & Co. as filed with the U.S. Securities and Exchange Commission will be made available without charge upon request to:
Office of the Secretary JPMorgan Chase & Co. 270 Park Avenue New York, NY 10017-2070
Stock listingNew York Stock Exchange London Stock Exchange Tokyo Stock Exchange
The New York Stock Exchange ticker symbol for the common stock of JPMorgan Chase & Co. is JPM.
Financial information about JPMorgan Chase & Co. can be accessed by visiting the Investor Relations web site at jpmorganchase.com. Additional questions should be addressed to:
Investor Relations JPMorgan Chase & Co. 270 Park Avenue New York, NY 10017-2070 Telephone: 212-270-6000
DirectorsTo contact any of the Board members or committee chairs, the Presiding Director or the non-management directors as a group, please mail correspondence to:
JPMorgan Chase & Co. Attention (Board member(s)) Office of the Secretary 270 Park Avenue New York, NY 10017-2070
The Corporate Governance Principles of the Board, the charters of the principal Board committees, the Code of Conduct, the Code of Ethics for Finance Professionals and other governance information can be accessed by visiting our web site at jpmorganchase.com and clicking on “Governance” under the “About us” tab.
Transfer agent and registrarBNY Mellon 480 Washington Boulevard Jersey City, NJ 07310-1900 Telephone: 800-758-4651 bnymellon.com/shareowner/equityaccess
Investor Services Program JPMorgan Chase & Co.’s Investor Services Program offers a variety of convenient, low-cost services to make it easier to reinvest dividends and buy and sell shares of JPMorgan Chase & Co. common stock. A brochure and enroll- ment materials may be obtained by contacting the Program Administrator, BNY Mellon, by calling 800-758-4651, by writing to the address indicated above or by visiting its web site at bnymellon.com/shareowner/equityaccess.
Direct deposit of dividendsFor information about direct deposit of dividends, please contact BNY Mellon.
Stockholder inquiriesContact BNY Mellon:
By telephone:
Within the United States, Canada and Puerto Rico: 800-758-4651 (toll free)
From all other locations: 201-680-6889 (collect)
TDD service for the hearing impaired within the United States, Canada and Puerto Rico: 800-231-5469 (toll free)
All other locations: 201-680-6610 (collect)
By mail:
BNY Mellon 480 Washington Boulevard Jersey City, NJ 07310-1900
Duplicate mailingsIf you receive duplicate mailings because you have more than one account listing and you wish to consolidate your accounts, please write to BNY Mellon at the address above.
Independent registered public accounting firmPricewaterhouseCoopers LLP 300 Madison Avenue New York, NY 10017-6204
As of the beginning of 2009, JPMorgan Chase & Co. has distributed shareholder information under the U.S. Securities and Exchange Commission “Notice and Access” rule. As a result, the firm prints 700,000 fewer Annual Reports and Proxy Statements, which saves on an annual basis approximately 6,400 trees and 800 metric tons of CO2 emissions.
This Annual Report is printed on paper made from well-managed forests and other controlled sources. The paper is independently certified by BVQI to the Forest Stewardship Council (FSC) standards. The paper contains a minimum of 20% post-consumer waste recycled fibers.
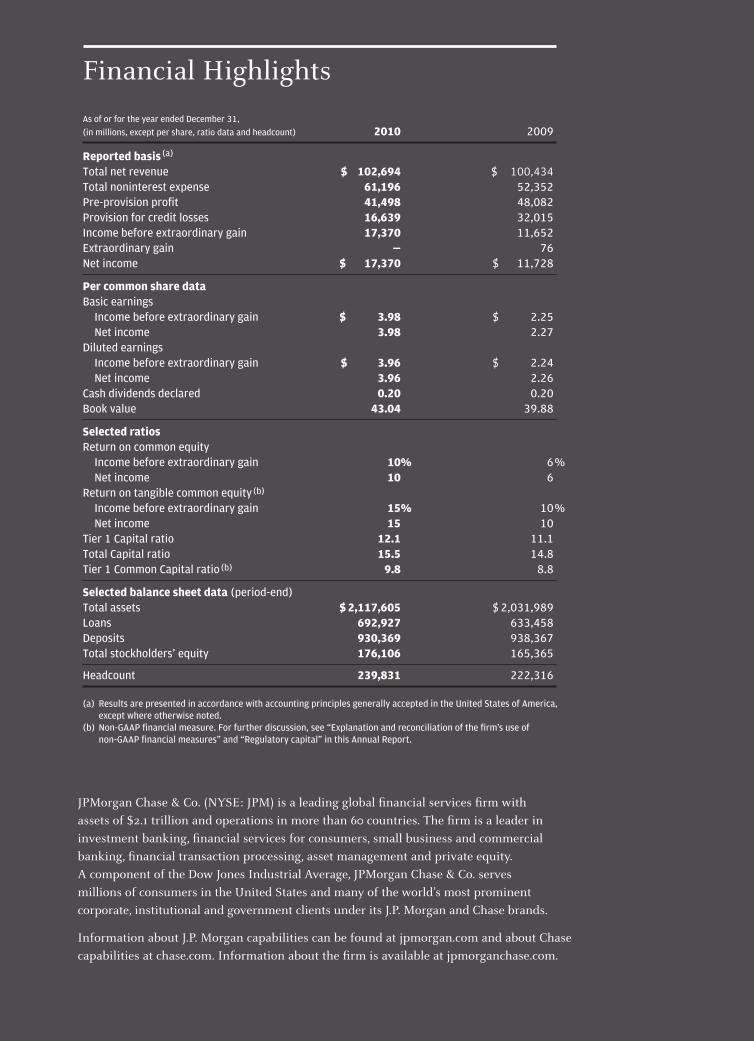
As of or for the year ended December 31,(in millions, except per share, ratio data and headcount) 2010 2009
Reported basis (a)
Total net revenue $ 102,694 $ 100,434Total noninterest expense 61,196 52,352Pre-provision profit 41,498 48,082 Provision for credit losses 16,639 32,015Income before extraordinary gain 17,370 11,652Extraordinary gain — 76Net income $ 17,370 $ 11,728
Per common share dataBasic earnings Income before extraordinary gain $ 3.98 $ 2.25 Net income 3.98 2.27Diluted earnings Income before extraordinary gain $ 3.96 $ 2.24 Net income 3.96 2.26Cash dividends declared 0.20 0.20Book value 43.04 39.88
Selected ratiosReturn on common equity Income before extraordinary gain 10% 6 % Net income 10 6Return on tangible common equity(b)
Income before extraordinary gain 15% 10 % Net income 15 10Tier 1 Capital ratio 12.1 11.1Total Capital ratio 15.5 14.8Tier 1 Common Capital ratio(b) 9.8 8.8
Selected balance sheet data (period-end)Total assets $ 2,117,605 $ 2,031,989Loans 692,927 633,458Deposits 930,369 938,367Total stockholders’ equity 176,106 165,365
Headcount 239,831 222,316
(a) Results are presented in accordance with accounting principles generally accepted in the United States of America, except where otherwise noted. (b) Non-GAAP financial measure. For further discussion, see “Explanation and reconciliation of the firm’s use of non-GAAP financial measures” and “Regulatory capital” in this Annual Report.
Financial Highlights
JPMorgan Chase & Co. (NYSE: JPM) is a leading global financial services firm with assets of $2.1 trillion and operations in more than 60 countries. The firm is a leader in investment banking, financial services for consumers, small business and commercial banking, financial transaction processing, asset management and private equity. A component of the Dow Jones Industrial Average, JPMorgan Chase & Co. serves millions of consumers in the United States and many of the world’s most prominent corporate, institutional and government clients under its J.P. Morgan and Chase brands.
Information about J.P. Morgan capabilities can be found at jpmorgan.com and about Chase capabilities at chase.com. Information about the firm is available at jpmorganchase.com.
Rev1_11-0309_AR10_IFC_IBC_UG.indd 1 4/4/11 9:49 PM

We continue to focus on the way forward.
Throughout 2010, JPMorgan Chase supported the economic recovery while also preparing for the future.
We provided and raised $1.6 trillion for creditworthy businesses and consumers.
We became the nation’s largest Small Business Administration lender, more than doubling our loan volume over 2009. And we approved more than $250 million in loans to small businesses through our second review process, making it possible to turn “no” into “yes.”
We helped hundreds of thousands of homeowners avoid foreclosure through our outreach counseling. And we committed more than $3 billion to affordable housing developments for those in need.
We supported not-for-profits and public services, raising nearly $100 billion in 2010 for hospitals, schools and communities across the country. Additionally, we gave in excess of $190 million* through grants and sponsorships to thousands of not-for-profit organizations across the United States and in more than 25 countries.
Over the past year, we, as always, have relied on our core values, our commitment to clients and our fortress balance sheet to guide our actions. We will continue to serve our customers and the communities where they live and work.
This is the way JPMorgan Chase is making a difference.
This is the way forward.
* Contributions include charitable giving from JPMorgan Chase & Co. and the JPMorgan Chase Foundation, and this giving is inclusive of $41.8 million in grants to Community Development Financial Institutions.

2
Dear Fellow Shareholders,
Your company earned a record $17 billion in 2010, up 48% from $12 billion in
2009. As points of reference: In 2008 — which, as you know, was a year filled
with unprecedented challenges — we earned $6 billion; and the year before, we
earned $15 billion, a then-record for us. The performance of our JPMorgan Chase
stock during this period of time — and over the past decade (including heritage
company Bank One) — is shown in the chart on page 4.
Our return on tangible equity for 2010 was 15%. Given your company’s earnings
power, these returns should be higher. In a more normal environment, we believe
we could earn approximately $22 billion to $24 billion. Your company’s earnings,
particularly because of the business we are in, will always be somewhat volatile.
The main reason for the difference between what we should be earning and
what we are earning is the extraordinarily high losses we still are bearing on
mortgages and mortgage-related issues. These losses have been running at a
rate of approximately $4 billion a year, after-tax, and, while they should come
down over time, they, unfortunately, will continue at elevated levels for a while.
On the brighter side, we increased our annual dividend to $1 per share and
have re-established the ability to buy back stock if and when we think it’s
appropriate to do so.
Looking at these results in the context of the last three difficult years, what
particularly pleases me is how exceptionally our company performed, not
in absolute financial terms but in human terms. No matter how tough the
circumstances or how difficult the events, we were there for our clients and
our communities — providing credit and raising capital. We provided credit
and raised capital of approximately $1.6 trillion for our clients in 2010 alone.
Those clients included hospitals, schools, local governments, municipalities,
corporations, small businesses and individuals. While helping our clients
— large and small — prepare for the future, we continued to actively support the
economic recovery. At the same time, we continued to invest in your
company’s future and to build our businesses — opening branches and offices
and adding bankers across the globe, including hiring more than 8,000 people
in the United States alone. As a result, we gained market share and became a
better competitor in almost every single business.

3
Jamie Dimon,Chairman and Chief Executive Officer
The outstanding efforts of our 240,000 employees around the world enabled
our firm to weather the worst economic storm in recent history and to emerge
stronger than ever. And — while we are proud of the many ways we rose to meet
the untold challenges we faced — we also are keenly aware of the ongoing
imperative to continually innovate and improve — to get smarter, better, faster —
in service to our clients. This is the only way we will be able to thrive going
forward and to overcome the challenges ahead.
I’ve asked the chief executive of each of our lines of business to write you a letter
about his or her respective business, both to review the 2010 results and to offer
an outlook for the future. I hope as you read their letters in the section follow-
ing this letter that you get the same sense that I do: Across your company, we
have talented leaders and great opportunities; we are performing well financially
against our competition; we are investing in our organic growth; and, perhaps
most important, we are focused on building quality businesses.
4
Quality business, to us, means good clients; excellent products; constant innovation;
state-of-the-art systems; and dedicated, capable, well-trained employees who care
about the customers we serve. It means building consistently, not overreacting to
short-term factors, and being trusted and respected by our clients in all the communi-
ties where we do business. In a risk-taking business, it is easy to generate increasingly
better results in the short run by taking on excessive risk or by building lower quality
business — but you will pay for that in the long run. That is not what we are after.
In this letter, I will focus my comments on issues of great impact to our business:
I. The Post-crisis Environment: How We View the Significant Challenges Ahead
II. Big Opportunities: How We Will Grow in U.S. and International Markets
III. The Customer Experience: How We Will Continue to Improve It
IV. Global Financial Reform: How the Key Aspects Will Affect Our Businesses and Our Country
V. Conclusion
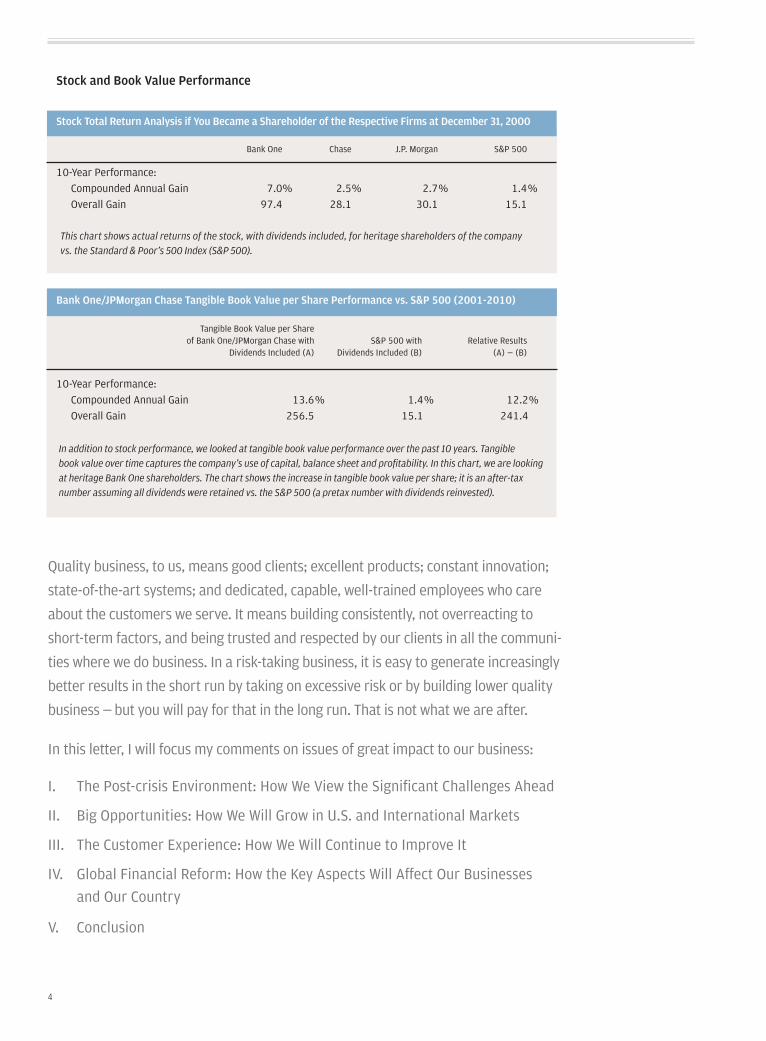
Stock and Book Value Performance
Stock Total Return Analysis if You Became a Shareholder of the Respective Firms at December 31, 2000
Bank One Chase J.P. Morgan S&P 500 10-Year Performance: Compounded Annual Gain 7.0 % 2.5 % 2.7 % 1.4 % Overall Gain 97.4 28.1 30.1 15.1
Bank One/JPMorgan Chase Tangible Book Value per Share Performance vs. S&P 500 (2001-2010)
Tangible Book Value per Share of Bank One/JPMorgan Chase with S&P 500 with Relative Results Dividends Included (A) Dividends Included (B) (A) — (B)
10-Year Performance: Compounded Annual Gain 13.6 % 1.4 % 12.2 % Overall Gain 256.5 15.1 241.4
In addition to stock performance, we looked at tangible book value performance over the past 10 years. Tangible
book value over time captures the company’s use of capital, balance sheet and profitability. In this chart, we are looking
at heritage Bank One shareholders. The chart shows the increase in tangible book value per share; it is an after-tax
number assuming all dividends were retained vs. the S&P 500 (a pretax number with dividends reinvested).
This chart shows actual returns of the stock, with dividends included, for heritage shareholders of the company
vs. the Standard & Poor’s 500 Index (S&P 500).

5
As we enter 2011, we find ourselves having weathered an epic storm – not just the global financial crisis itself but its effect on the global financial system and our industry. As a nation, we may have averted disaster thanks to a great collective effort, but many challenges remain. A lot of work has been done – some of which has been excellent and necessary. Other aspects are less satisfactory and even potentially harmful, and we need to face and fix them in a thorough, balanced, intelligent manner. Suffice it to say that a good deal of work remains to be done.
In our meetings with shareholders, we often are asked the following tough questions:
• WhatwillbethefalloutfromtheEuropeansovereign exposures and the geopolitical risks,particularlyintheMiddleEast?
• Howarewegoingtodealwithallthelitigation around mortgages, municipali-ties, Bear Stearns, the bankruptcies of LehmanBrothers,WashingtonMutual(WaMu)andothers?
• WilltheAmericaneconomyrecoverintheshortrun?Howwillabnormalmonetarypolicies and looming fiscal deficits affect us?DoesAmericahavethecapacityinthe long run to deal effectively with other important problems it faces, including immigration, our energy policy, the environment, our education and health systems, our infrastructure and our still-unbalancedtradeandcapitalflows?
• Willtheroleofbankschangeinthisnewenvironment?Willtheybeabletogrowprofitably?WillAmericanbanksbeabletofreely compete with increasingly formi-dable foreign banks, some of which are the beneficiariesofpowerfulstatesupport?
• Howwillthemortgageandmortgage-relatedissuesendup?Howmuchwilltheycostus?Andhowwilltheyberesolved?Charlie Scharf deals with some of these questions in his letter later in this Annual Report. These issues are extremely complex and will take years to resolve. There is plenty of misinformation and a number of misconceptions around mortgages, and your company is going to make a dedicated effort to describe in detail what we do, how we do it, what the right things to do are, what the mistakes we made are and how we will rectify them. I will not go into the details in this letter, but, rest assured, we are fully engaged on this issue of mort-gages, and you will be hearing more from us about it in the future.
In thinking about the answers to the ques-tions posed, it would be naive to be blindly and irrationally optimistic – or to be blindly andirrationallypessimistic.Wecannotpredictthe future with any real certainty, but we can offer our shareholders some insight into how we think about these issues, what they mean for the company and how we manage through them. Remember, our goal is not to guess the future; our goal is to be prepared to thrive under widely variable conditions.
We Face the Future in a Strong Position
Our businesses and management team are among the best in the industry. It is diffi-cult to replicate our franchises and the intelligence embedded in our expertise, in our systems and in the experience of our people. Our fortress balance sheet provides us with strong and growing capital – and we always are thinking far ahead about the best ways to deploy it.
Webelievewehavetheforesightandfortitude to use our capital wisely. Our first priority was to restore a decent dividend – this is what our shareholders wanted (if it were up to me personally, I would reinvest
I . THE POST-CRISIS ENVIRONMENT: HOW WE VIEW THE SIGNIFICANT CHALLENGES AHEAD

6
all the capital into our company and not pay any dividend – but this is not what most shareholderswant).Wewouldliketobecompletely clear about how we prioritize our use of capital. These priorities are:
• Firstandforemost,toinvestinorganicgrowth – building great, long-term profitable businesses.Weseesignificantopportunitiesfor organic growth in each of our businesses.
• Second,tomakeacquisitions–bothsmalladd-ons and larger ones, but only if the price is right and we have a clear ability to manage the risks and execute properly. (If we are not running our own businesses well,weshouldnotbedoingacquisitions.)
• Andthird,tobuybackstock–asadisci-pline, we always will buy back the stock weissueforcompensation.However,wewill buy back additional stock only when, looking forward, we see few opportunities to invest in organic growth and acquisi-tions. And we will buy back stock only when we believe it benefits our remaining shareholders – not the ones who are selling (i.e.,wewillbepricesensitive).
Wealsobelievethatstrengthcreatesgoodopportunities in bad times. And, yes, we know we have made and will continue to make mistakes – all businesses do – but we hope to catch them early, fix them quickly and learn from them.
Wearenotcomplacentaboutrenewed,intense competition everywhere we operate – infact,it’salreadyhere.Whateverthefuturebrings – and it will bring both good and bad – we are prepared, and we expect to emerge among the leaders.
How We View European Sovereign and Geopolitical Risk
TheEuropeanUnion(EU)isoneofthegreat collective endeavors of all time – where participating countries are striving to form a permanent union of nations for the benefit of all their citizens.
In the short run, i.e., in the next year or two, webelievethattheEuroZone,infitsandstarts, will work through its problems. It has the will and wherewithal to do so. The politiciansofEuropeseemtobecompletelydevoted to making this work – as their predecessors were for the past 60 years. The process will be messy, but the consequence of giving up could be far worse: Sovereign defaults could lead to a bank crisis with serious economic consequences. Since it is the same money (if sovereign nations defaultontheirdebt,theEUwillhavetorecapitalize its banks by approximately the sameamount),itisbettertofixtheproblemwithout causing additional complications.
Once the short-term issues are addressed, there likely will be some restructuring of the fiscal and monetary agreements between the nations and possibly the restructuring of some of the nations’ debt. Webelievetherearewaystodothiswithminimaldamage–particularlyiftheEUisable to achieve economic growth.
Whenthesovereigncrisisstarted,JPMorgan Chase’s gross exposures to Greece, Ireland, Portugal, Spain and Italy totaled approximately $40 billion – but net of collateral and hedges, our real exposures wereapproximately$20billion.Wedidnotrunorpanic–westayedthecourse.Whilewe reduced some of our exposures (essen-tially, the investment of excess cash for the company),wedidnotreducetheexposuresassociated with serving our clients, and we continued to actively conduct business in those nations. Our position was clear and consistent: to be there for our clients, not just in good times, but in bad times as well.
Going forward, this mission will not change. Weknowtherisks,andwearepreparedto take them. For example, in the unlikely occurrence of extremely bad outcomes in all these countries, JPMorgan Chase ultimately

7
could lose approximately $3 billion, after-tax. But we are in the business of taking risks in support of our clients and believe that this is a risk worth bearing since we hope to be growing our business in these countries for decades to come.
Our broader perspective on geopolitical uncertainty is that it is a constant state of affairs, which has been and always will be there, whether immediately visible or not. Such uncertainty is one of the main reasons we control our credit exposures and main-tain extremely strong capital and liquidity at all times.
Before turning to the economic impact of the crisisintheMiddleEast,wehope,firstandforemost, that the outcome of these historic movements will be to enhance the life and rights of the people in the region.
For our company, in particular, our direct exposures are manageable. The key economic impact is if extreme turmoil leads to extraordi-narily high oil prices, which then could cause a global recession. As you know, however, we always run this company to be prepared to deal with the effects of a global recession.
How We View Our Legal Exposures
Unfortunately,wewillbedealingwithlegalissues – the detritus of the storm – for years to come. They range from mortgage-related litigation to lawsuits concerning Bear Stearns andthebankruptciesofWaMu,LehmanBrothers and others.
Ourstrategyissimple:Whenweareright,we will fight mightily to ensure a just outcome.Whenwearenot,wewillsayso.
Some of the legal challenges we face stem from our acquisitions of Bear Stearns and WaMu,whereweinheritedsomeoftheirexposures.Hadwenotacquiredthesefirms, there would be no lawsuits because there would be no money to pay – our deep pockets are an attractive target to plaintiffs. WhiletheAmericanlegalsystemisoneofthe world’s best, it also is one of the only legal systems that does not require the losing
party to pay the winning party’s legal costs. Large actions against big companies, whether justified or not, have the potential to deliver large payoffs. This lack of balance and fair-ness too often results in outrageous claims. Whynot?Plaintiffshavelittletolose.Ourshareholders should know that we have set aside significant reserves to handle many of these exposures.
How We View the American Economy — Short Term and Long Term
Five years ago, very few people seemed to worry about outsized risk, black swans and fat tails. Today, people see a black swan with a fat tail behind every rock.
TheU.S.economywas,isandwillremainfor the foreseeable future the mightiest economic machine on this planet. America is home to many of the best universities and companies in the world. It still is one of the greatest innovators. The volume and varia-tion of our inventions created in America are extraordinary – from bold new technolo-gies, like the Internet, to thousands of small, incremental improvements in processes and products that, in aggregate, dramatically improve productivity. America also has an exceptional legal system (notwithstanding my many reservations about the class-action andtortsystem)andthebestanddeepestcapital markets. The American people have a great work ethic, from farmers and factory workers to engineers and businessmen (even bankersandCEOs).Anditstillhasthemostentrepreneurial population on earth. Amer-ican ingenuity is alive and well.
I mention all this because we need to put our current problems – and they are real – into proper context. Our problems may be daunting, but they also are resolvable. As a nation, we have overcome far worse challenges,fromtheCivilWartotheGreatDepressiontoWorldWarII.Evenamidourcurrent challenges, we have begun to see clear signs of stability and growth returning tothecapitalmarketsandtheU.S.economy.Almost everything is better than it was a year or two ago.
It’s conceivable that we are at the begin-ning of a self-sustaining recovery that could power through many of the negatives we’ve

8
been focusing on recently. Consumers are getting stronger, spending at levels similar to those two-and-a-half years ago, but, instead of spending more than their income, they now are saving 5% of their income. And consumer debt service costs, i.e., how much they spend of their income to service their debt, have returned to levels seen in the 1990s (due to debt repayment, charge-offs and debt forgive-ness,lowerinterestrates,etc.).
Businesses, large and small, are getting stronger. Large companies have plenty of cash. Medium sized and small businesses are in better financial condition and are starting to borrow again. Global trade is growing – U.S.exportswereup16%in2010.Jobgrowthseems to have begun. Financial markets are wide open – and banks are lending more freely.U.S.businesses,largeandsmall,areinvesting more than $2 trillion a year in capital expenditures and research and devel-opment. They have the ability to do more, and, at the end of the day, the growth in the economy ultimately is driven by increased capital investment.
The biggest negative that people point to is that home prices are continuing to decline, new home sales are at record lows and foreclosures are on the rise. Our data indicates that the rate of foreclosures will start to come down later this year. Approxi-mately 30% of the homes in America do not have mortgages – and of those that do, approximately 90% of mortgage-holding homeowners are paying their loans on time. Housingaffordabilityisatanall-timehigh.TheU.S.populationisgrowingatover3million a year, and those people eventually will need housing. Additionally, the fact that fewer homes are being built means that supply and demand will come into balance sooner than it otherwise would have. That said, housing prices likely will continue to go down modestly because of the contin-uous high levels of homes for sale. The ulti-mate recovery of the housing market and housing prices likely will follow job growth and a general recovery in the economy.
Yes, America still is facing headwinds and uncertainties – including abnormal monetary policy and looming fiscal deficits. And while we can’t really predict what the economy will do in the next year or two (though we think itisgettingstronger),weareconfidentthatthe world’s greatest economy will regain its footing and grow over the ensuing decade.
But we must take serious action to ensure our success in the decades ahead
Whileourconfidenceinthenextdecade is high, for America to thrive after that, it soon must confront some of the serious issuesfacingit.Weneedtoredoubleourefforts to develop an immigration policy and a real, sustainable energy policy; protect our environment; improve our education and health systems; rebuild our infrastructure for the future; and find solutions for our still-unbalanced trade and capital flows.
The sooner we address these issues, the better – America does not have a divine right to success, and it can’t rely on wishful thinking and its great heritage alone to get the country where it needs to go. But I remain, perhaps naively, optimistic. As WinstonChurchilloncesaid,“Youcanalways count on Americans to do the right thing – after they’ve tried everything else.”
Will the Role of Banks Change in This New Environment?
Banks serve a critical function in society, but it often is difficult to describe that func-tioninbasicterms.WhenIwastravelinginGhana with one of our daughters (yes, the same daughter who asked me what a finan-cialcrisiswasthreeyearsago),shepointedout all the buildings and projects that had been started but never finished.
All the money that went into Ghana’s unfinished buildings was needlessly wasted and, in fact, had damaged the citizens of the country. This sorry sight provided me with a concrete example of how to describe what banks actually should do. I explained to our daughter that had banks (or inves-tors)beendoingtheirjob,theywouldhavemade sure that before money was invested in a project or enterprise, it had good pros-pects of success: It would be built for good

9
reasons, it would be appropriately utilized, it would be properly constructed, it would be insured and, if something went wrong, the asset would be put to the best possible use afterward. At the microlevel of one building or one small business, it is easy to under-stand what banks do. They lend or invest, having done their homework, to maximize the chance of success. Sometimes they are wrong, and unforeseen circumstances can derail that success, but if they do their job well, this lending improves the general health of an economy.
At the macrolevel, we talk about having lent, invested or raised approximately $1.6 trillion for companies, not-for-profits and individuals over the course of 2010. But at the human level, here’s some of what we did last year:
• Weoriginatedmortgagestoover720,000people.
• Weprovidednewcreditcardstomorethan11 million people.
• Welentorincreasedcredittonearly30,000small businesses.
• Welenttoover1,500not-for-profitandgovernment entities, including states, municipalities, hospitals and universities.
• Weextendedorincreasedloanlimitsto approximately 6,500 middle market companies.
• Welenttoorraisedcapitalformorethan8,500 corporations.
Wetakecalculatedriskswhenwedothislending, and sometimes we make mistakes. But I can assure you that this never is our intent.Wedothisbankingactivityinall50statesintheUnitedStatesandinmorethan140 countries around the world. To ensure that we do it right and comply with the laws of the land, we have risk committees, credit committees, underwriting committees, compliance and legal reviews, and more.
Banks play a critical role in our economic system by properly allocating, underwriting and understanding risk as credit is given to various entities and by helping to manage, move and invest capital for clients. The key question is how will all the regulatory changesaffectthebanks’abilitytodothis?
What will not change: Clients still will need our services
From the point of view of the customer – always the best way to look at a business – the services we offer, which are not easy to duplicate,willremainessential.Economies,markets, technology and trends will change, but we know companies and consumers still will need the financial services we provide.
Whenconsumerswalkintoourretailbranches, they still will need checking and savings accounts, mortgages, investments, and credit and debit cards.
Whensmallbusinesscustomerswalkintoourbranches, they still will need cash manage-ment services, loans and investment advice.
WhentheCEOsofmiddlemarketcompa-nies are called upon by our bankers, they still will need cash management, loans, trade finance and investment advice. Some even may require derivatives or foreign exchange services to help manage their exposures.
Finally, when large companies work with our bankers, they will continue to need merger and acquisition or other financial advice and access to the global equity and debt markets. Given the increasing complexity of their business, they also will require deriva-tives to help manage various exposures, e.g., the changing prices of interest rates, foreign currencies and commodities.
In fact, the opportunities are large. A growing world still will need large-scale capital creation and bank lending and will increas-ingly require financial services. Several factors underscore just how pressing these capital-intensive needs will be in the future:
• Globalcreditoutstandingwillgrowbyapproximately $100 trillion over the next 10 years across both emerging markets and developed nations, an 80% increase.
• AnalystsfromMcKinseyandtheWorldEconomicForumsuggestthatglobalfinancialwealth could grow by approximately $160 tril-lion over the next 10 years, a 100% increase.
• U.S.financialwealthisexpectedtoincreaseby more than $30 trillion over the next 10 years,a70%increase.

10
• Globalgrossdomesticproductisexpectedto grow by approximately $50 trillion in nominal terms ($25 trillion in real 2010 dollar-valueterms)overthenext10years,an approximately 80% increase.
• Annualcorporateinvestmentsinplantandequipment (globally running at approxi-mately$8trillionayear)shouldatleastdouble over the next 10 years – our multi-national clients account for approximately 50% of this.
Effectivelydeliveringonthisgrowingdemand requires strong, healthy financial institutions. This bodes well for JPMorgan Chase – we are in exactly the right place.
What will not change: Banks will continue to need to earn adequate market-demanded returns on capital
Like all businesses, banks must continue to earn adequate returns on capital – inves-tors demand it. Some argue, however, that if regulation results in better capitalized banks and a more stable financial system, returns demanded on capital would be lower to reflect the lower risk involved. This probably is true but not likely to be materially significant.
What will change: New regulation will affect prod-ucts and their pricing
A likely outcome of the new regulations is that products and their pricing will change. Some products will go away, some will be redesigned and some will be repriced.
Last year, we spoke about how we would adjust our products and services for the new credit card pricing rules and new overdraft rules. So I will not repeat them here. In a later section, I will talk about how we will adjust to the new restrictions on the pricing of debit cards.
Highercapitalandliquiditystandardsthatare required under Basel III likely will affect the pricing of many products and services.
Two examples come to mind:
Current Basel III rules require banks to hold more capital and maintain more liquidity to support the revolving credit they provide to both middle market and large institutions. In some cases, the liquidity rules alone require us to hold 100% of highly liquid assets to support a revolver. For example, to support a $100 million revolver, we would be required to own $100 million of highly liquid securi-tieswithveryshortmaturities.Weestimatethis would increase our incremental cost on a three-year revolver by approximately 60 basis points a year. That leaves us with three options:1)passthecostontothecustomer,2)losemoneyonthatrevolver,or3)notmake the loan. In the real world, the likely outcome is that some borrowers will have less or no access to credit, some borrowers will pay a lot more for credit, some would pay only a little bit more and some highly rated companies might find it cheaper to provide liquidity on their own, i.e., hold more excess cash on their balance sheet as opposed to relying on banks for credit liquidity backup.
Certain products may disappear completely because they simply are too expensive to provide.(Some,likethe“CDO-squares”willnotbemissed.)Forexample,capitalchargeson certain securitizations will be so high for banks that either these transactions no longer will be done or they will migrate to other credit intermediaries (think hedge funds)thatcanmorecheaplyinvestinthem.I will have more to say on regulation in the fourth section of this letter.
What we don’t know (and we have a healthy fear of unintended consequences)
Around the world and all at once, policy-makers and regulators are making countless changes, from guidelines around market-making, derivatives rules, capital and liquidity standards, and more. Many of the rules have yet to be defined in detail, and it is likely that they will not be applied evenly around the world. The combined impact of so much change – so much unknown about the inter-play among all these factors and an uneven

11
global playing field – potentially is large. These unpredictable outcomes and unin-tended consequences could affect far more than products and pricing. For example, if a business cannot sell certain products or if the cost of selling them is so high that it cannot be adequately recouped, that business risks losing all of its clients. A simple analogy: If a restaurant that sells burgers can’t sell french fries, it risks losing all of its customers.
Like it or not, we will adjust to the impact of new regulation on financial products and pricing. But we will remain vigilant about the changes that could threaten or under-mine entire businesses. Three of our main concerns are:
First, and most important, we want to ensure that our clients are not negatively affected in a material way and that our ability to prop-erly serve them is not unduly compromised.
Second, we need to be cautious about the creation of non-banks or new shadow banks. This could happen if the cumulative effect of all the regulations not only hampers banks from conducting their business but restricts them so much that the business slowly and inevitably moves to non-banks.
And, third, we need to ensure that American banks are not significantly disadvantaged relative to their global counterparts. The cumulative effect of higher capital standards, too restrictive market-making and deriva-tives rules, price control and arbitrary bank taxes could significantly impede our ability to compete over the long run.
Wedon’texpectanyofthesethreeoutcomesto occur – nor do we believe that it was or is the intent of the lawmakers or regulators – but it bears paying close attention.
Although we tend to focus on the downside of unintended consequences, we should recognize that there may be some positive consequences. For example, large changes in business regulations and dynamics often lead to new businesses, innovations and new products. Also, our ability to compete may be hampered in some instances but actu-ally helped in others. For example, the cost and complexity of all the recent regulations, ironically, could create greater barriers for new entrants and new competitors.

12
Eachofourbusinessheadshasarticulatedcompelling growth strategies for his or her respective business (see their letters on pages34–47ofthisAnnualReport).Acrossthe firm, the opportunities to grow organi-cally are huge. And we intend to pursue them aggressively – every day, every quarter and every year by building new branches; launching new products and tools and intro-ducing new technology; and relentlessly hiring and developing good people.
Weknowthatbuildingourbusinessesorganically can be challenging to execute, but it is critical – and the potential payoff is enormous. Organic growth also will continue to fuel cross line-of-business opportunities. For example, when Retail Financial Services opens a branch, it provides Card Services with the opportunity to offer more credit cards. And when Commercial Banking develops a new client relationship, these clients often require Investment Banking services. These are just two examples – there are many more.
Inadditionto“normal”growth,wewant to highlight a few specific initiatives – each of which could add $500 million or more to profits over the next five to ten years. These include:
• AcceleratingCommercialBanking’sandBusiness Banking’s growth in the heritage WaMufootprint:Essentially,WaMudidnotdothistypeofbusiness.Ultimately,wewill have added more than 1,500 bankers in statesfromCaliforniaandWashingtontoFlorida.Wealreadyarewellonourwaytobuilding into this branch network the same kind of middle market banking and small business banking that we have established in other markets across the country.
• ExpandingoutourCommoditiesfranchise:In our commodities business, we now have a full array of physical trading and finan-cial products and services to support our 3,000 clients who trade in these markets
aroundtheworld.Whenalloureffortsarecompletely integrated and are running at full capacity, profits of this business will grow even more strongly. (And this should happeninthenexttwotothreeyears.)
• Dramaticallyincreasingourbranchopen-ings:Wewillmovefromanaverageof120new branches a year to more than 200 in 2011 and probably more than that in subse-quent years. This aggressive build-out is a coordinated effort between our real estate teams; our technology and operations teams; and our management, development and training staff. New branches typically break even by the end of the second year, and, when fully established, which takes several more years, each branch ultimately should earn more than $1 million in profits a year. Yes, we are concerned about technology reducing the need for physical branches, but all our research shows that we still will need branches to serve our customers.WhileuseoftheInternetandATMs has skyrocketed, branch traffic essentially has remained steady. Over time, branches may become smaller, but we still think they will remain essential.
• GrowingourChasePrivateClientServicesbusiness:Weestimatethatapproximately2 million customers who use our branches are fairly affluent and need investment services tailored to the high-net-worth segment.Wehavetestedthisconcept,andit seems to be working well. Therefore, we intend to open approximately 150 Private Client Services locations over the next few years to better support our affluent clients. At these offices, dedicated bankers will work with customers and provide them with investment products that are tailored to their needs.
• Continuingtoexpandourinternationalwholesale businesses, including our Global CorporateBank(GCB):Thiseffortisdescribed in the next section.
I I . B IG OPPORTUNITIES: HOW WE WILL GROW IN U.S. AND INTERNATIONAL MARKETS

13
Our Resolute Commitment to Expanding Our International Wholesale Businesses
One of the greatest opportunities before us is to grow our wholesale businesses globally. This opportunity exists not just in developed markets but also in developing, emerging andeventheso-called“frontier”markets.The reasons are simple: As the world grows, our clients generally grow even faster, as do trade volumes, capital, cross-border investing and global wealth.
ArecentMcKinseystudyestimatesthatglobal investment, with accompanying growth in credit and capital needs, will grow by two times or some $13 trillion over the next 20 years in real terms – a multiple of what we saw in the early 1980s. Global invest-ment will amount to $24 trillion in 2030 compared with $11 trillion in recent years. Developing economies are embarking on one of the biggest building booms in history. Rapid urbanization is increasing demand for new roads and other public infrastruc-ture. Companies are building new plants and buyingmachinery.TheMcKinseyreport,in fact, warns of potential capital and credit shortages as this exponential growth occurs.
Banks will play a vital role in financing these investments and in connecting savers and borrowers around the world. Much of this capital and investing will be cross-border and will be done by the very institutions that our bank already serves, i.e., multinational corpo-rations, large investors, sovereign wealth funds and others.
Rest assured, we are going about this effort withoureyesopen.Wedonotharboranyfalse notions that it is easy or risk free. And you cannot have stop-and-start strategies. Countries will want to know you are there for the long run – you cannot be a fair-weather friend!
International expansion is a long, tough andsometimestediousjob.Executionoftenrequires lengthy lead times, and differences in cultures and laws present many chal-lenges. By necessity, we end up bearing additional sovereign and political risk. But the effort clearly is worth it: The opportuni-ties are great, and the risk can be managed. Here’showandwhywethinkso.
We essentially are following our customers around the world
Our wholesale bankers around the world do business with essentially most of the global Fortune 2000 plus some 400 of large sover-eign wealth funds and public or quasi-public entities (these include governments, central banks, government pension plans and governmentinfrastructureentities).
As these entities expand globally – adding coun-tries and locations to where these organizations do business – we essentially grow with them. Wealreadybankthesecompaniesandsimplyneed to be where they are going to need us.
We will grow by adding bankers, branches and products
The overwhelming majority of our worldwide expansion will come through organic growth – adding bankers, branches and products. Some examples of our recent efforts include:
• OurGCBhashired100bankerssinceJanuary 1, 2010, and, by the end of 2012, we expect to grow to 300 bankers covering more than 3,000 clients globally.
• InBrazil,ChinaandIndia,wecontinueto enhance the firm’s presence by adding bankers and increasing our client coverage. Five years ago, we covered approximately 200 clients in those countries, and, today, wecoverapproximately700clientsinthosethreecountries.Weareexpandingthiskindof coverage in many other countries, too.
• InChina,overthelasttwoyears,weaddedtwonewbranches(GuangzhouandChengdu)to our existing three (Shanghai, Tianjin and Beijing),andwearecontinuingourexpan-sion with more branch openings planned for 2011. Our expanded footprint enhances our ability to serve both local companies and foreign multinationals as they grow their businesses in China. In addition to the domestic renminbi capabilities, J.P. Morgan is at the forefront of the internationalization of the renminbi, a product that more and more clients are demanding for cross-border trade.
• Aroundtheworld,weopenednewbranches in Australia, Bangladesh, Brazil, China, Great Britain, Japan, the Nether-lands,Qatar,SwitzerlandandtheUnitedArabEmirates,amongothers,andweplannearly 20 more to be added by 2013.

14
This build-out of our additional locations results in a huge network effect. For example, Chinese capital is moving into Brazil – and we already are on the ground in bothplaces.Whenwebuildoutourcapa-bilities in Africa, we also are improving our servicetoEuropeanclientswhomaybelooking at investing in Africa.
Alongside these expansion efforts, we are adding many products. For example:
• Wearebuildingourcapabilitytoprovidelocal credit – by establishing capital lines for subsidiaries of multinational companies and providing credit to large local companies.
• Wealsoareabletoofferourclientssophis-ticated supply chain finance products (we recently helped finance Caterpillar’s suppliersaroundtheworld).
Of course, we also are building the proper systems, legal teams and operational capabili-ties to support this bigger network.
In addition to these organic efforts, we are on the lookout for smaller acquisitions that can help us accelerate our strategy. For example, our acquisition of the world-class Brazilian hedge fund Gávea Investimentos, aspartofourHighbridgebusiness,dramati-cally improves our ability to manage money both for local investors and for those around the world seeking to invest in Brazil and emerging markets.
We see global growth opportunities for decades to come
In the business community and across the media, we have seen a tremendous focus on the emerging markets in advanced stages of development; specifically, Brazil, Russia, India and China. But this opportunity also is large in countries like Turkey, Indonesia, Malaysia and many others – in fact, some parts of the world are on the brink of mean-ingful development.
A quick look at sub-Saharan Africa provides a bit of perspective on the opportunities beforeusoverthenext20years.Economicactivity in the region is expected to grow annuallybyapproximately4.7%overthenext20 years, from $800 billion to $2 trillion, as its populationgrowsby370millionto1.2billion.
Many nations in sub-Saharan Africa are adopting better and stronger governance, and they are fortified by great natural and other resources, which will benefit their future prosperity.
Weestimatethatmorethan80%ofourtopmultinational clients are doing business in sub-Saharan Africa and expect their number and footprint to grow steadily over the next 20years.Whilewecurrentlydobusinessin21 of the 49 sub-Saharan nations, we are on the ground only in South Africa and Nigeria. WeanticipatethatourclientswillneedusonthegroundinAngola,Kenya,Tanzaniaandseveral other African countries over the next couple of decades. The investments we make over the years to enter sub-Saharan Africa will not materially affect profits in the short run but will produce a real payoff in decades tocome.Wewillstartplantingthefieldnow,to be reaped by future generations.
While Developing Consumer and Commercial Banking Operations Abroad Is an Option, It Is Not a Strategic Imperative
Over the long term, expanding our consumer and commercial banking footprint outside theUnitedStatesisthenextlogicalstep.This aspiration is a strategic option – not a necessity. Some businesses need to be competitive internationally to be successful – think investment banking, commercial aircraft and mobile device manufacturers. But some businesses do not need to be – thinkretailandcommercialbanking.WecanbeverysuccessfulintheUnitedStatesin retail and commercial banking and never take them internationally. Therefore, this aspiration is a strategic option, not a stra-tegic imperative, to be carried out only if and when it makes sense.
International acquisitions are riskier than U.S.acquisitions:Therearefarfeweroppor-tunities for cost savings, terms for investing vary from country to country, there is higher legal and cultural risk, and execution is more difficult. Therefore, we will acquire these businesses internationally only if we can do it right, which means the price needs to be right, we need to have an adequate margin for error and we have to have the ability to execute properly.
15
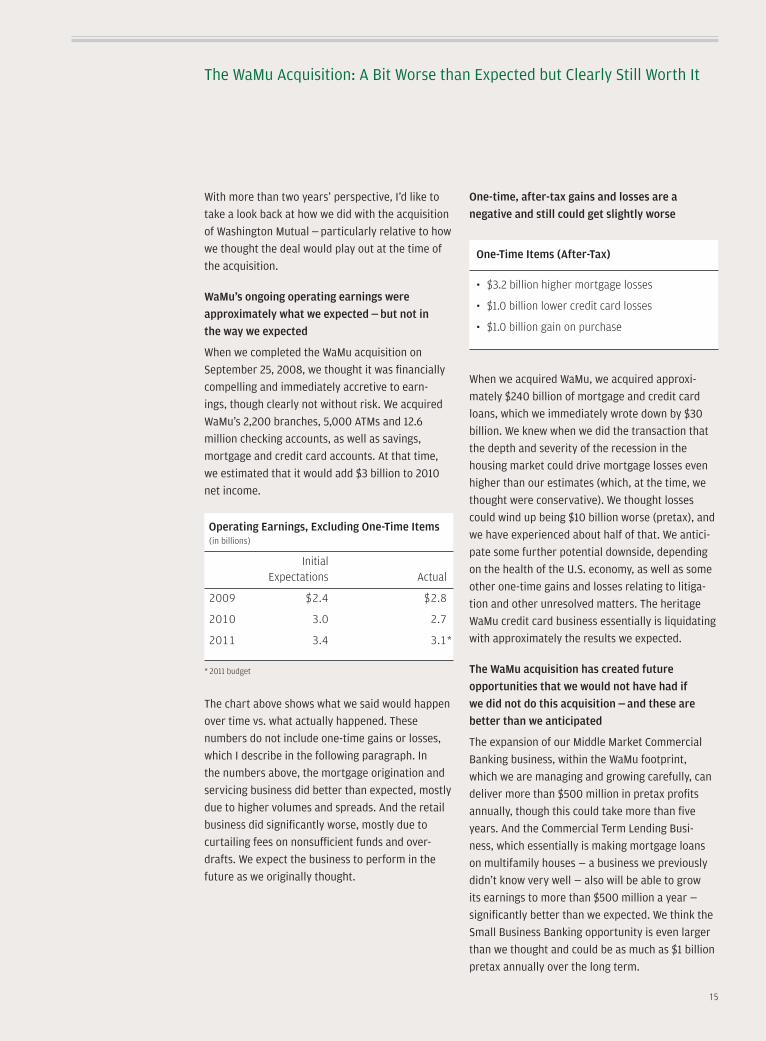
The WaMu Acquisition: A Bit Worse than Expected but Clearly Still Worth It
With more than two years’ perspective, I’d like to take a look back at how we did with the acquisition of Washington Mutual — particularly relative to how we thought the deal would play out at the time of the acquisition.
WaMu’s ongoing operating earnings were approximately what we expected — but not in the way we expected
When we completed the WaMu acquisition on September 25, 2008, we thought it was financially compelling and immediately accretive to earn-ings, though clearly not without risk. We acquired WaMu’s 2,200 branches, 5,000 ATMs and 12.6 million checking accounts, as well as savings, mortgage and credit card accounts. At that time, we estimated that it would add $3 billion to 2010 net income.
The chart above shows what we said would happen over time vs. what actually happened. These numbers do not include one-time gains or losses, which I describe in the following paragraph. In the numbers above, the mortgage origination and servicing business did better than expected, mostly due to higher volumes and spreads. And the retail business did significantly worse, mostly due to curtailing fees on nonsufficient funds and over-drafts. We expect the business to perform in the future as we originally thought.
One-time, after-tax gains and losses are a negative and still could get slightly worse
When we acquired WaMu, we acquired approxi-mately $240 billion of mortgage and credit card loans, which we immediately wrote down by $30 billion. We knew when we did the transaction that the depth and severity of the recession in the housing market could drive mortgage losses even higher than our estimates (which, at the time, we thought were conservative). We thought losses could wind up being $10 billion worse (pretax), and we have experienced about half of that. We antici-pate some further potential downside, depending on the health of the U.S. economy, as well as some other one-time gains and losses relating to litiga-tion and other unresolved matters. The heritage WaMu credit card business essentially is liquidating with approximately the results we expected.
The WaMu acquisition has created future opportunities that we would not have had if we did not do this acquisition — and these are better than we anticipated
The expansion of our Middle Market Commercial Banking business, within the WaMu footprint, which we are managing and growing carefully, can deliver more than $500 million in pretax profits annually, though this could take more than five years. And the Commercial Term Lending Busi-ness, which essentially is making mortgage loans on multifamily houses — a business we previously didn’t know very well — also will be able to grow its earnings to more than $500 million a year — significantly better than we expected. We think the Small Business Banking opportunity is even larger than we thought and could be as much as $1 billion pretax annually over the long term.
One-Time Items (After-Tax)
• $3.2billionhighermortgagelosses
• $1.0billionlowercreditcardlosses
• $1.0billiongainonpurchase
Operating Earnings, Excluding One-Time Items (in billions)
Initial Expectations Actual
2009 $2.4 $2.8
2010 3.0 2.7
2011 3.4 3.1 *
*2011budget
15

16
I I I . THE CUSTOMER EXPERIENCE: HOW WE WILL CONTINUE TO IMPROVE IT
Weareonlyinbusinesstoserveourclients– and this is true of every aspect of our busi-ness.Everyloanwemakeorservice,everyaccount we maintain, every financing we do and any investing we do is to serve our clients. Our job is to consistently strive to do a better job for all our clients – and to do it faster, smarter and better.
Doing a great job for our clients requires us to be discerning about who our clients are and clear about what doing a good job means. In our business in particular, client selectioniscritical.Unlikeotherbusi-nesses, we often have to turn away clients. Sometimes we, by necessity, are put in the uncomfortable position of advising or even requiring our clients to do things they don’t want to do, such as: restructuring or selling assets or making payments to avoid penal-ties. Careful client selection leads to quality clients. And in conjunction with conservative accounting, it leads to a high-quality busi-ness. J.P. Morgan, Jr., said it best when he declaredthefirm’smissionwastodo“first-class business in a first-class way.”
Below are some of the ways we will strive to continue delivering on that promise.
Doing a Better Job Serving Complex Global Corporate Clients
Wedoagoodjobadvisingandservicingour complex global corporate clients. But we want to do an even better job – a great job – under all circumstances. So we are redou-bling our efforts by:
• Improvingourinformation:Wearebuilding robust systems to put key infor-mation about our corporate client relation-ships at our fingertips – for example, all the services we provide them, which markets they are in and what their needs are.
• Coordinatingglobalcoverage:Betterinformation and coordination enable us to do a better – and, often, more cost-effective – job for the client. As a global financial institution, we may have 30 to 40 bankers from our offices globally calling on a large corporate client. That’s because we provide such a broad set of products and services in multiple locations around the world: M&A and advisory services; asset management; sales and trading or pension plans; manage-ment of cash flows, foreign exchange and interest rate exposure; and more.
• Buildingoutourcoverage:Wearesystem-atically expanding the depth and breadth of our international coverage of the large, multinational companies that we cover aroundtheworld.Weareembarkingonagranular, detailed review, name by name and subsidiary by subsidiary, of the multi-national companies we support for the purpose of developing a game plan – from the ground up – for how we will build out our coverage going forward.
• Bringingthewholefirmtobear:Forallourclients, we want to make available the best that JPMorgan Chase has to offer every-where.Wewanttheseclientstoknowthatthe full force and power of the company are behind them and their goals, that we will be there in good times and bad, and that our advice is unconflicted and trustworthy.
• Ensuringthatsolutionsandinnovationsareclientdriven:Werecognizethatourbusiness works only if it works for the client, not just for JPMorgan Chase. Cross-selling, for example, is good only when it benefits the client.
17
Doing a Better Job Serving Consumers and Small Business Customers
All businesses claim to focus on better serving their clients. Most can show you the service metrics by which they judge them-selves–ascanwe.Weintendtodomorethan that by taking a step back and looking at the customer experience holistically – from every angle, including:
• Productdesign:Inabusinessascomplexas ours, often we find ourselves adding more features and complexity without going back to see how it looks from the customer’sstandpoint.Westrivetofollowthe example set by companies like Apple, which always aims to make its products and services as simple and intuitive as possible for the customer.
For example, at one point, our customers were getting notifications from us in the mail and by phone. Then we innovated the process by reaching out to them in real time through text alerts whenever their account balance fell below a specified amount.However,atfirst,ourcustomerscould not respond to these alerts. Then we developed Chase Instant Action AlertsSM, our two-way text alerts that allow customers to send a text back to us in order to transfer money between accounts and help avoid overdraft fees. This product has beenwildlysuccessful.Wecurrentlyhavemore than 10 million mobile customers, and we are adding over 500,000 new mobile banking customers each month.
• Sellingandcross-selling:Thegoalofcross-selling is to better and more completely serve customers’ needs and help them realize their goals in ways that save them time, money and aggravation. Properly done, what we sell our customers should be good for them because we are listening to them, figuring out their needs, and trying to meet those needs in the most efficient and effective manner possible. Getting customers into the right accounts, the right credit cards, online bill payment and alert systems allows us to give our customers more and be more efficient. But selling and cross-selling must work for the customer – improperly done, these efforts are annoy-ances and, at worst, do customers a great
disservice. To do this right, we need to educate our salespeople and constantly try to align our incentive systems to support doing what is right for the customer.
• Consumeradvocacy:Ineachofourconsumer businesses, we’ve created Consumer Practice groups, managed by veryseniorpeople.Weexpectthesegroupsto review all our policies, products and procedures – ranging from pricing and fee decisions to clear disclosure and trans-parency of terms associated with each product – and to ensure we are treating our customers fairly and are delivering great service. These Consumer Practice teams have the power both to right a wrong for any of our customers and to help change processes going forward.
• Streamlinedcustomercommunications:Wearestrivingtobeasclearandsimpleaspossible and not get caught up in legalese in our communications. (Of course, we need to provide the proper legal disclosures, many ofwhicharerequiredbyregulators.)
• Systemsupgrades:Alltheaboveimprove-ments require changes to our systems, both those that are visible to our customers and those that are helpful to our employees tobetterservethosecustomers.Wehaveimproved customer convenience on everyday needs such as completing the rollout of over 10,000 Deposit Friendly ATMs, which take cash and check deposits without deposit slips or envelopes. Addi-tionally, the system our bankers use has been enhanced to quickly access a custom-er’s account history, including any issues reported by customers or actions taken on the customer’s behalf by branch employees in the last 90 days.
• Learningmorefromcustomercomplaintsandemployeesuggestions:Wealsoareredoubling our efforts to learn from customer complaints and employee ideas. Customer complaints often can be gifts: They frequently tell us how we can improve our products and services. As for employees, they often have great ideas on what can be done better but usually aren’t asked.Wewillusethisfeedbackfromcustomers and employees to improve prod-ucts and services across the firm.

18
Innovating for Our Customers
Financial services have been highly innovative over the past 20 years.
On the consumer side, we have seen ATMs and debit cards lead the way to online bill paying and other Internet-enabled technolo-gies. We also are particularly proud of our most recent consumer innovations, including:
• OurnewcreditcardproductsincludeChase BlueprintSM, a flexible payment tool that allows our card customers to better manage expenses on their own terms; InkSM from Chase for business card users; and Chase SapphireSM and Palladium for the affluent market.
• OurChase QuickDepositSM iPhone banking application allows customers to deposit checks simply by taking a picture from their iPhones. This app was the winner of nine Best of 2010 smartphone awards. In 2010, 336,000 customers made deposits via QuickDeposit, and 46,000 business customers made deposits with our Classic QuickDeposit scanner. We also recently have added the QuickDeposit app to Android phones.
• OurInternetbillpaymentsystemallowscustomers to make payments in a variety of ways, including Quick Pay for electronic person-to-person payments and traditional online bill payments. In 2010, 16.3 million customers made 445 million payments using chase.com.
• ForPrivateBankingandhigh-net-worthclients, we launched an iPad application that lets customers see, in one place, their credit card, checking and investment accounts. Soon these clients will be able to buy and sell securities online through this application.
In wholesale banking, innovation has been equally apparent over time:
• Treasurerscanaccumulateglobalcashandmove it with the flick of a finger to where it can be most productive.
• LastNovember,welaunchedtheJ.P.MorganResearch iPad app, which gives clients reports and analysis from more than 1,000 analysts on economic indicators, markets, companies and asset classes around the world. Unlike other research apps of its kind, users will be able to access content offline and receive instant alerts when new content they pre-select becomes available.
• Corporationsnowhavetheabilitytoraisemoney quickly and often simultaneously in markets around the world.
• Corporationshavetheabilitytohedge,quickly and cost-effectively, large expo-sures like interest rates, foreign exchange, commodity prices, credit exposures, etc.
• Stocksnowcanbeboughtandsoldvirtu-ally instantaneously on markets around the world, at a cost of pennies or less a share.
Acknowledging and Fixing Mistakes
Unfortunately, we make mistakes. They range from innocuous errors to some egre-gious ones. They range from paperwork errors to systems failures to rude service. Sometimes we make loans we shouldn’t make, and sometimes we don’t make loans that we should. Some of these are individual mistakes, and some are more systemic.
There always are reasons for these mistakes. Sometimes they are readily understand-able. Other times, they leave you shaking your head. But we never should make these mistakes deliberately or with venal intent. Some mistakes are made out of a simple misjudgment. And, unfortunately, and very infrequently – sometimes someone in our company knowingly does something wrong. Of course, such activity would never, ever be condoned or permitted by senior manage-ment. And when it does happen, we take immediate and firm action.
We know that when we make mistakes, we should hold ourselves accountable, and we should rectify them.

19
Herearetheprinciplesweabidebyindealing with our mistakes:
Senior management should actively be on the lookout for problems
At all times, senior management must be vigilant about errors made across the firm – we ask lots of questions, read customer complaints, and make sure our own people are allowed to question our products and services. Generally, we all know how we would want to be treated, and management should strive to treat our customers this way.
This particularly applies to long-standing practices. Just because something always has been done a certain way does not mean that it is still right.
We need to acknowledge mistakes to ourselves
Wecannotfixproblemsifwedenythem.Acknowledging an error, however, isn’t enough.Weneedtofigureoutwhyithappened.Wasitisolatedorembeddedinoneofoursystems?Wasittheresultofpoortrainingofourpeople?Or,perhaps,inourdesire to keep up with the competition, did we start doing things with which we were uncomfortable?
There is one error, in particular, from our recent past that I would like to highlight: the mistakes we made in servicing mortgages heldbyU.S.militaryfamilies.Ourfirmhasa great history of honoring our military and veterans, and the errors we made on these loans, including foreclosures, were a painful aberrationfromthattrackrecord.Wedeeplyregret this, we have apologized to our mili-tary customers and their families, and we have tried to rectify these mistakes as best we can. I want to reiterate that apology here and now.
Werecentlyhaveannouncedanewprogramfor the military and veteran community that includes many initiatives, from recruiting veterans into our firm, with our corporate partners, to providing enhanced products and services for the military and their fami-lies. As a company, we aim to serve members of our armed services with the respect and special benefits they deserve because we recognize the sacrifice and hardships they bear to protect our nation and our freedoms.
We should acknowledge our mistakes to our customers
Customers know that any company can makemistakes.Whattheyhateiswhenthecompany denies it. If we make a mistake with a customer, we should acknowledge it and take the proper remedial action.
When we find mistakes, we should fully disclose them to those who should know
Whenwemakemistakes,weself-reportthem, as appropriate, to our regulators and to our Board of Directors as appropriate.
We also take appropriate and timely action with those involved
This can mean fixing an error-prone system, retraining our people, or modi-fyingproductsorservices.Unfortunately,this sometimes means firing an individual or replacing management, but only if such action is warranted due to bad behavior or real incompetence.
20
IV. GLOBAL FINANCIAL REFORM: HOW THE KEY ASPECTS WILL AFFECT OUR BUSINESSES AND OUR COUNTRY
The crisis of the last few years was proof enough that many aspects of our financial system needed to be fixed and reformed to minimize the chance of such a crisis reoccurring.
As I have discussed in prior letters, a multi-tude of issues caused, or contributed to, this crisis: structural issues, such as a critical lack of liquidity in some of our country’s money market funds and in short-term financing markets; high leverage, which was omni-present in the system; unregulated shadow banking; poor mortgage underwriting; huge trade imbalances; and ineffective regula-tion of Fannie Mae and Freddie Mac, among other factors.
A great number of the regulatory changes adopted in 2010 were essential. Foremost among them were higher capital and liquidity standards and the establishment of a Financial Stability Oversight Council. This body has the critical mandate of monitoring the financial system in its entirety, elimi-nating gaps and ensuring that all financial firms are properly regulated while antici-pating future problems. Resolution Authority also was necessary in order to give regulators both the legal authority and the capability to manage and unwind large financial firms, just as the Federal Deposit Insurance Corpo-ration(FDIC)hasdonewithsmallerU.S.banksforyears.Wealsosupportedstresstesting and well-managed clearinghouses for standard derivatives.
In addition, we have been very supportive of certain changes in compensation rules. In fact, long before they were mandated, JPMorgan Chase already had instituted most of these compensation practices. One particu-larly good new rule, a practice we had estab-lished but only for our Operating Committee, was the ability to clawback compensation from senior executives when appropriate. Wenowhaveextendedtheseclawbackrules
to cover more senior managers at our firm. Hadthisclawbackregimebeeninplacebefore the crisis, many senior executives who ultimately were responsible for the failure of their companies would have had to return much of their ill-gotten gains.
WithregardtotheDodd-FrankWallStreetReform and Consumer Protection Act, however, we do have some concerns. The extensive reforms introduced by this legisla-tion represent the most wide-ranging changes totheU.S.regulatoryframeworkforfinancialservices since the 1930s, and we likely will have to live with these reforms for the next 50 years. Dodd-Frank is a significant and thor-ough rewrite of the rules that our industry must follow. The impact of this legislation will be significant, and the outcomes – both posi-tive and negative – will be a function of how the reforms are implemented.
It is of vital importance that Dodd-Frank implementation – along with the finaliza-tion of Basel Committee capital standards and other regulatory changes affecting our industry – is thoughtful and proportionate and takes into account the cumulative effect of the major changes that already have taken place since the crisis began. This is the only way we can hope to avoid unintended nega-tive consequences, nurture a stable economic recovery, build a strong financial system and create a fair playing field for all.
Our System Was on the Edge of Chaos, and Governments and Regulators Deserve Enormous Credit for Preventing the Collapse
I have long been on record giving huge credittotheU.S.governmentandgovern-ments around the world for the drastic, bold actions they took to stop this rapidly moving crisis from getting considerably worse. A great number of the actions that the Treasury and the Federal Reserve took, both directly and indirectly, helped sustain numerous institutions and probably prevented many

21
from failure and bankruptcy. These actions were done to save the economy and to safeguardjobs.Whileweshouldtrytodoeverything in our power to stop a crisis from happening again, we should recognize two critical points. Markets can be rational or irrational, and fear could freeze markets again. And when there are severe problems, only the government, in some form, has the wherewithal, power and liquidity to be the backstop of last resort.
Effectively changing our exceedingly complex global economic system requires great care
Whenthiscrisisbegan,itlookedas“normal”as any crisis can, but it quickly careened into a global catastrophe. Most observers pinpoint the key moment as Lehman Brothers’ failure in September 2008. But one of the things that made Lehman’s failure so bad was that it came after the failure of Bear Stearns, Fannie Mae and Freddie Mac, among others. It was the cumulative effect of the collapse of all these institutions, many of which were overleveraged,thatwassodamaging.HadLehman’s failure occurred at another time, and been an isolated event, its failure would not likely have been so devastating.
Complex systems – and our global economic system surely is one – often oscillate within relatively normal confines. Our complex economic system regularly has produced “normal”recessionsandboomsandocca-sionally a devastating one like the Great Depression or the recent economic crisis. The factors that occasionally and devastat-ingly derail a system at any point in time may have contributed only because the table already had been set; at other times, the same factor would have had no effect at all. This phenomenon shows up in complex systems throughout nature.
Scientists dealing with complex systems try to isolate the impact of changing one input while holding all other elements constant. They know that if they change everything at once, it may be impossible to identify cause and effect.
As we try to remake our complex economic system, we need to be cautious and respectful of what the cumulative effect will be of making multiple changes at the same time.
A Great Deal Already Has Been Done to Improve the System — by Regulators and Governments — and by the Market Itself
As all the rules and regulations of Dodd-Frank and Basel III are being completed, a tremendous amount already has been done to strengthen the financial system.
Capital and liquidity standards already have been strengthened
Before the crisis, we believe the thresholds for capital and liquidity requirements were far too low. This was one of the key underlying causes of the crisis (and the reason JPMorgan Chase always held far more capital than was required).Itclearlyneededtobefixed.
These standards already have been increased severaltimes:WhentheTreasuryconductedthe stress test in February of 2009, it raised the minimum Tier 1 Common Capital requirement from 2% to 4%. The recent stress test raised the capital requirement to 5% and imposed a more stringent test: Banks now must demonstrate that they can maintain a capital level of 5% throughout a highly stressed environment. The new Basel III requirements effectively will raise the 5% to 10%. (I will talk more about capital stan-dardslaterinthissection.)
Substantial improvements already have been made in the standards for residential and commercial mortgages and secured financing, among others
The marketplace, investors, banks, regulators and rating agencies already have signifi-cantly upgraded the standards by which many products and institutions operate. For example:
• Allnewmortgagesarebeingwrittentocomply with standards that existed many years ago, before the worst of the past decade’s excesses. These mortgages include sensible features such as loan-to-value ratios mostly below 80%, true income verification and more conservative home-value appraisals.
• Moneymarketfundsnowarerequiredtodisclose more information, hold higher-rated paper and maintain much more liquidity as a safeguard against potential runs. This was a critical systemic flaw around the Lehman collapse.
22
• Financialfirmsnowdiscloseagreatdealmore information. Some of the information provided is quite useful, such as disclosures on funding, liquidity of assets and greater detailoncredit.(Unfortunately,muchofthisinformationisoflittleusetoanybody.)
• Therepurchaseagreementorrepomarkets– in which large investors, institutions and financial firms use short-term, collateral-ized borrowing to finance some of their investments – now require more conser-vative“haircuts,”andnolongerfinanceexotic securities.
Shadow banking essentially is gone
People mean very different things when they talkaboutthe“shadowbankingsystem.”Whendiscussingit,Idividethisso-calledsystem into two pieces: The first piece is one most observers barely knew existed. It consisted of largely off-balance sheet instru-ments like structured investment vehicles (SIV).Thesecondpieceiscomprisedofon-balance sheet instruments that were fairly well-known, such as asset-backed commercial paper, money market funds and repos.
The off-balance sheet vehicles, like SIVs, essentially are gone. The on-balance sheet instruments like money market funds, repos and asset-backed commercial paper are smaller in size, less leveraged, more conser-vatively managed and far more transparent.
There are more regulators with proper Resolution Authority and comprehensive oversight
Today, a greater number of regulatory bodies are providing an unprecedented level of oversight. New resolution laws and living wills will give regulators even more tools to use in handling a future crisis.
Banks’ trading businesses are far more conservative
BanksintheUnitedStateshaveeffectivelyeliminated proprietary trading. In addition, exotic products are smaller in size and more transparent, and trading books require far more capital and liquidity to support.
Standardized derivatives already are moving to clearinghouses
It is a common misperception that deriva-tives were not regulated. They actually were: bytheU.S.CommodityFuturesTrading
Commission(CFTC),theU.S.SecuritiesandExchangeCommission(SEC)andvariousother bank regulators. It also is a misconcep-tion that derivatives pricing lacked trans-parency; accurate market data on the vast majority of all derivatives were readily avail-able and easy to access.
Nonetheless, we agree it is a good thing that standardized derivatives are moving to clearinghouses. This will help standardize contracts, simplify operational procedures, improve regulatory transparency and reduce aggregate counterparty risk. I will discuss this issue in more detail later.
Boards, management and regulators are more attentive to risk
At the corporate board and management levels, risk management now involves much greater attention to detail. Risk reviews are increasingly thorough, risk disclosures are deeper and any executive responsible for risk taking is the recipient of extensive oversight.
Collectively, these substantial changes have materially reduced risk to each individual financial institution and to the system as a whole.Whilesomeoftheimprovementsstillneed to be codified, they may go a long way in creating the very strong kind of financial system we all want.
We Need to Get the Rest of It Right — Based on Facts and Analysis, Not Anger or Specious Arguments
In their book, This Time Is Different: Eight Centuries of Financial Folly, economists CarmenReinhartandKennethRogoffstudiedeight large economic crises over the past 800 years. These crises generally emanated from trade imbalances, foreign exchange issues and real estate speculation. Included among their observations was the fact that when the crisis also involved the collapse of the finan-cial system – in four of the eight crises they studied – recovery took longer than expected (onaverage,fouryearsinsteadoftwoyears).But we should not assume that this historic pattern is preordained or predictive. It also seems likely that bad policy decisions made inadvertently and without forethought – during and after these crises – may very well have increased the level, length and severity of the economic stress attributed to these crises.
23
For the implementation of Dodd-Frank to be effective, it must recognize the improve-ments that already have been made and focus on resolving what remains to be done. Dodd-Frank creates several additional regula-tors and sets forth more than 400 rules and regulations that need to be implemented by various regulatory bodies. In addition to theserules,therewillberulesfromEuropeangovernments and new capital and liquidity requirements emanating from Basel.
Weallhaveahugeinterestinboththestability and growth of the system. And we know that our chances for a strong global recovery are maximized if we get the rest oftheregulatoryreformeffortright.We’regetting close – let’s not blow it. Moving forward, here are some important issues that need to be handled carefully.
The new oversight board — the Financial Stability Oversight Council — needs to require coordination among all the regulators, both domestic and global
Ideally, America should have streamlined its regulatory system. Instead, our legisla-tors have created several additional regula-tors. This makes domestic and international coordination both more complex and even more critical. In fact, many of the regulators are setting up departments to deal with the other regulatory departments (if that is not the very definition of bureaucracy, I don’t knowwhatis).
It makes it all the more important that the new oversight board, the Financial Stability OversightCouncil(FSOC),fosterstruecoordination among the regulators’ activi-ties.Unfortunately,therealreadyissomeevidencethattheCFTCandtheSECaremoving in different directions in their regu-lation of like products. The FSOC should nip this problem in the bud.
In addition to domestic coordination, the FSOC must ensure that the rules and regu-lations coming from Basel and the G20 are implemented in a consistent and coordinated fashion. The FSOC also must be vigilant in identifying imbalances within the system that generate excessive risk – and be ready to take rapid action to fix such imbalances. Finally, it needs to be aware of the development of new shadow banks and be prepared to intervene when they pose potential risks to the system.
Regulators should build a system that creates continuous improvement
There are implicit difficulties in trying tocreate“perfect”rules.Whatregulatorsneed to do is put a system in place that can respond in real time to changes in the marketplace, create a culture that promotes continuous improvement, and design effec-tive tools that operate as both gas pedals and brakes. This is what will enable them to do a better job managing the economy.
Herearejustafewexamplesofeffectivetools and uses: The ability of regulators to change mortgage loan-to-value ratios up or down if they thought the housing market was becoming too frothy; change capital requirements immediately on specific loans, investments or securities when specific asset classes showed signs of becoming problem-atic; and dial up or down certain liquidity requirements and repo haircuts when excesses were taking place.
The Volcker Rule needs to leave ample room for market-making — the lifeblood of our capital markets
The Volcker Rule has various components. Wehavenoissuewithtwoofthese:thecomponent eliminating pure proprietary trading; and the component limiting banks from investing substantial amounts of their own capital into hedge funds.
Our concern largely is with a third aspect regarding capital and market-making. It’s critical that the rules regarding market-making allow properly priced risk to be taken so we can serve clients and maintain liquidity. The recently proposed higher capital and liquidity standards for market-making operations – the new Basel II and Basel III capital rules – approximately triple the amount of regulatory capital for trading portfolios inclusive of market-making and hedging activities. For the most part, these capital rules protect against excessive risk taking.Wedon’tbelieveanyadditionalrulesare needed, under the Volcker Rule or other-wise.However,iftheremustbemorerules,these rules need to be carefully constructed (e.g., they should distinguish between liquid and illiquid securities, allow for hedging either on a specific-name or portfolio basis,
24
etc.).Whenmarket-makersareabletoaggres-sively buy and sell securities in size, inves-tors are able to get the best possible prices for their securities.
Derivatives regulation must allow for true end-user exemptions and for transparency rules that don’t restrict liquidity
As I already stated, we completely agree with the creation of clearinghouses for standard derivatives. That said, clearinghouses do not eliminate risk; they standardize and concen-trate it. Therefore, it is essential that these clearinghouses be strong, operate under sound rules and have well-capitalized member institutions.Wedonotwantweakclearing-houses to become the next systemic problem.
It’s also important to maintain a category of non-standardized derivatives contracts. These contracts are not fit for a clearing-house because the clearinghouse cannot adequately value, margin or settle them. However,thesecustom,over-the-countercontracts are important to very sophisticated institutions (of course, such contracts should be fully disclosed to the regulators and prop-erlyregulated).
Additionally, client margin requirements need to be clarified. If clients are required to post margin, either their liquidity will be reduced or these clients will migrate their derivatives trades to overseas markets that do not have such posting requirements.
Regulators also must seek to strike the right balance between the need for transparency and the need to protect investors’ interests. To the extent that transparency rules reduce liquidity and widen spreads, they actually can damage the very investors the regula-tors are trying to help. If market-makers are required to quickly disclose the price at which they are buying a large amount of securities or a small amount of very illiquid securities, they will necessarily be more conservative about the amount of risk they take. As a result, they will bid for less and price the risk higher since the whole world will know their position.
Finally, there is a truly misguided element of Dodd-Frank regarding derivatives. This so-called“spin-outprovision”requiresfirms like ours to move credit, equity and commodity derivatives outside the bank. This requirement necessitates our creating a separately capitalized subsidiary and requiring our clients to establish new legal contracts with this new subsidiary. This is an operational nightmare (which we can handle)butmakesithardertoserviceclients.It runs completely counter to recent efforts by regulators to reduce banks’ exposure to counterparty default. This provision creates a lot of costs and nobenefits.Webelievethatitmakes our system riskier – not safer.
We need to create a Consumer Financial Protec-tion Bureau that is effective for both consumers and banks
It has been widely reported that we were against the creation of a Consumer Financial ProtectionBureau(CFPB).Wewerenot–wewere against the creation of a standalone CFPB, operating separately and apart from whatever regulatory agency already had oversightauthorityoverbanks.Wethoughtthat a CFPB should have been housed within the banking regulators and with proper authority within that regulator. This would have avoided the overlap, confusion and bureaucracy created by competing agencies.
However,wefullyacknowledgethattherewere many good reasons that led to the creation of the CFPB and believe that if the CFPB does its job well, the agency will benefit American consumers and the system. Strong regulatory standards, adequate review of new products and transparency to consumers all are good things. Indeed, had there been stronger standards in the mort-gage markets, one huge cause of the recent crisis might have been avoided. Other coun-tries with stricter limits on mortgages, such as higher loan-to-value ratios, didn’t experi-ence a mortgage crisis comparable with ours. As recently as five years ago, most Americans wouldhavecalledtheU.S.mortgagemarketone of the best in the world – boy, was that wrong!Whathappenedtooursystemdidnot work well for any market participant – lender or borrower – and a careful rewriting of the rules would benefit all.

25
The Durbin Amendment was passed with no fact-finding, analysis or debate, had nothing to do with the crisis and potentially will harm consumers
The Durbin Amendment, which regulates debit interchange fees, was added belatedly to the Dodd-Frank Act. It is an example of a policy that has little basis in fact or analysis. When policymakers undertake such a signifi-cant rewrite of the rules, there often is a tendency to adopt ideas with surface appeal. In this case, some potentially significant, unintended consequences exist, particularly for consumers.
Most analysis of the costs and benefits of debit cards shows that the debit card provides more total value (after fairly looking at all the costs and benefits) to retailers than cash, checks or many other forms of payment. In addition, merchants negotiate fees (if they agree to accept debit cards at all – 20% don’t), and some pay as low as 35 basis points while other merchants pay considerably more.
The law that passed, and has been inter-preted by the Fed in its proposed rule, permits a bank to charge only its “incre-mental” interchange cost. This cost does not include the direct costs of issuing debit cards, such as the printing and mailing of the cards, operational and call center support to service the cards, and the cost of fraud. Also absent from the analysis are the costs of ATMs and branches, which are part of the fixed costs of servicing checking accounts and debit cards. Any business that is allowed to charge only enough to recover its products’ variable costs would soon be in bankruptcy.
The harm will fall largely on consumers; banks will be forced to lose money on debit interchange transactions and likely will compensate by increasing fees in some way for deposit customers. While the primary effect on consumers will be higher prices for banking services, there also will be secondary effects. Some customers may opt out of the banking system (even though the cost of being unbanked is much higher).* The law will disproportionately affect lower income
consumers. Some analysts estimate that as many as 5% of U.S. families currently in the mainstream banking system will leave and become unbanked. The Durbin Amend-ment undoes a generation of hard work to decrease the cost and increase the efficiencies of banking for ordinary Americans and to reduce the ranks of the unbanked.
Finally, it’s a terrible mistake and also bad policy for the government to get involved in price fixing and regulating business-to-business contracts. The Durbin Amendment is price fixing at its worst. It is arbitrary and discriminatory – it stipulates that only large banks (those with assets of $10 billion or more) will be affected by its price fixing. But while the law purports to exempt smaller banks, credit unions and prepaid govern-ment benefit cards, the reality is that not one of these groups will be immune to the nega-tive implications of this rule.
The debit card has been a tremendous boon to both merchants and consumers. Before policymakers undertake these types of actions that pose such profound effects, they need to fully understand the conse-quences of their actions. The Durbin Amend-ment was passed in the middle of the night with limited fact-finding, little analysis and minimal debate, and I think it appropriate that we return to fact-finding and analysis in the full light of day.
Resolution Authority needs to be properly designed
Simply put, Resolution Authority essentially provides a bankruptcy process for big banks that is controlled and minimizes damage to the economy. We made a mistake when we called this aspect of financial reform “Resolution Authority,” which sounds to the general public very much like a bailout. Perhaps a better name for it would have been “Minimally Damaging Bankruptcy For Big Dumb Banks” (MDBFBDB). Banks entering this process should do so with the understanding and certainty that the equity will be wiped out, the clawbacks on compensation will be fully invoked, and the company will be dismembered and eventu-ally sold or liquidated.
* There is an interesting Associated Press article written on the cost of being unbanked.
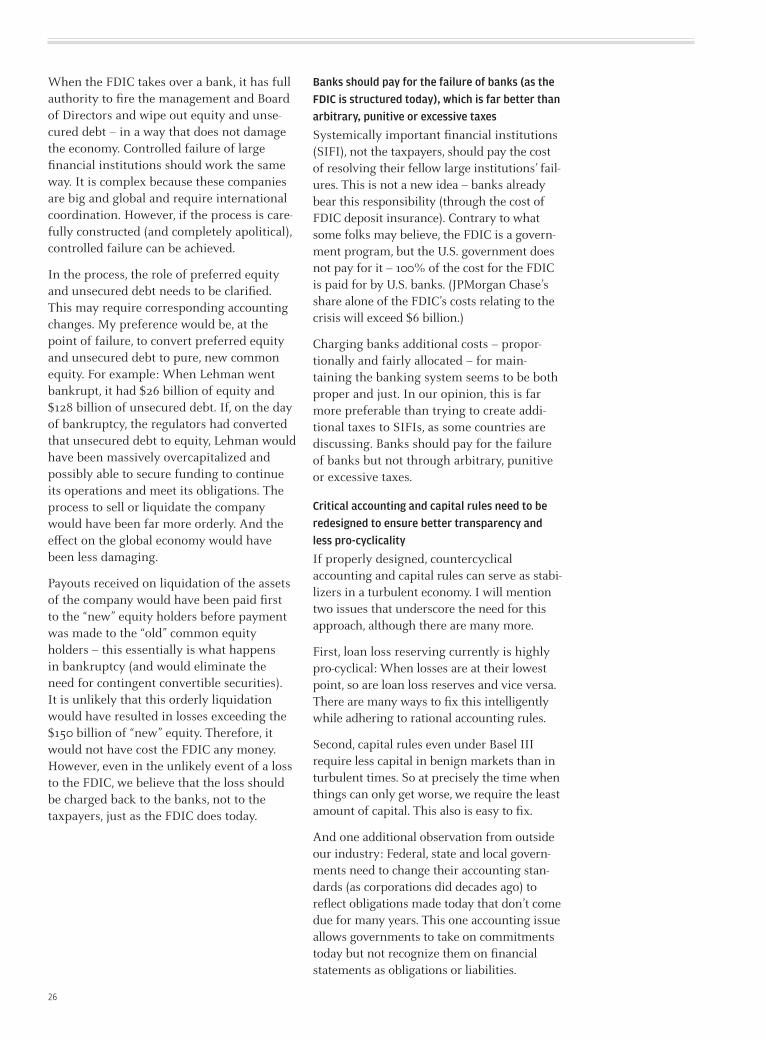
26
WhentheFDICtakesoverabank,ithasfullauthority to fire the management and Board of Directors and wipe out equity and unse-cured debt – in a way that does not damage the economy. Controlled failure of large financial institutions should work the same way. It is complex because these companies are big and global and require international coordination.However,iftheprocessiscare-fullyconstructed(andcompletelyapolitical),controlled failure can be achieved.
In the process, the role of preferred equity and unsecured debt needs to be clarified. This may require corresponding accounting changes. My preference would be, at the point of failure, to convert preferred equity and unsecured debt to pure, new common equity.Forexample:WhenLehmanwentbankrupt, it had $26 billion of equity and $128 billion of unsecured debt. If, on the day of bankruptcy, the regulators had converted that unsecured debt to equity, Lehman would have been massively overcapitalized and possibly able to secure funding to continue its operations and meet its obligations. The process to sell or liquidate the company would have been far more orderly. And the effect on the global economy would have been less damaging.
Payouts received on liquidation of the assets of the company would have been paid first tothe“new”equityholdersbeforepaymentwasmadetothe“old”commonequityholders – this essentially is what happens in bankruptcy (and would eliminate the needforcontingentconvertiblesecurities).It is unlikely that this orderly liquidation would have resulted in losses exceeding the $150billionof“new”equity.Therefore,itwould not have cost the FDIC any money. However,evenintheunlikelyeventofalossto the FDIC, we believe that the loss should be charged back to the banks, not to the taxpayers, just as the FDIC does today.
Banks should pay for the failure of banks (as the FDIC is structured today), which is far better than arbitrary, punitive or excessive taxes
Systemically important financial institutions (SIFI),notthetaxpayers,shouldpaythecostof resolving their fellow large institutions’ fail-ures. This is not a new idea – banks already bear this responsibility (through the cost of FDICdepositinsurance).Contrarytowhatsome folks may believe, the FDIC is a govern-mentprogram,buttheU.S.governmentdoesnot pay for it – 100% of the cost for the FDIC ispaidforbyU.S.banks.(JPMorganChase’sshare alone of the FDIC’s costs relating to the crisiswillexceed$6billion.)
Charging banks additional costs – propor-tionally and fairly allocated – for main-taining the banking system seems to be both proper and just. In our opinion, this is far more preferable than trying to create addi-tional taxes to SIFIs, as some countries are discussing. Banks should pay for the failure of banks but not through arbitrary, punitive or excessive taxes.
Critical accounting and capital rules need to be redesigned to ensure better transparency and less pro-cyclicality
If properly designed, countercyclical accounting and capital rules can serve as stabi-lizers in a turbulent economy. I will mention two issues that underscore the need for this approach, although there are many more.
First, loan loss reserving currently is highly pro-cyclical:Whenlossesareattheirlowestpoint, so are loan loss reserves and vice versa. There are many ways to fix this intelligently while adhering to rational accounting rules.
Second, capital rules even under Basel III require less capital in benign markets than in turbulent times. So at precisely the time when things can only get worse, we require the least amount of capital. This also is easy to fix.
And one additional observation from outside our industry: Federal, state and local govern-ments need to change their accounting stan-dards(ascorporationsdiddecadesago)toreflect obligations made today that don’t come due for many years. This one accounting issue allows governments to take on commitments today but not recognize them on financial statements as obligations or liabilities.

27
We need to beware of backward-looking models and “group think”
Weneedtobehighlyconsciousofthelimitations of backward-looking models. And we need to be even more conscious and suspect of what will happen when all market participants essentially are using the samemodels.Whilewewantalevel,globalplaying field – and fair application of rules to all participants, including common and consistent ways of calculating risk-weighted assets – we need to guard against the risk of “groupthink.”Ifallparticipantsusethesamemodels and capital-allocation standards, this potentially plants the seeds of the next crisis. That is essentially what happened with mort-gages in this last crisis.
The mortgage business needs to be radically overhauled
Weneedtorethinkthemortgageindustryfrom the ground up. I’ve already spoken about why we need stronger standards, including loan-to-value ratios and income verification, but we also need servicing contracts that are more consistent from both the consumer and investor standpoints. In addition, it would be beneficial to have foreclosure processes and standards that are common and consistent across all 50 states.
Most critically, it is incumbent upon us to resolve the status of the government-sponsored entities, Fannie Mae and Freddie Mac,andthe“skininthegame”ruleswithregardtosecuritizations.Wegenerallybelieve in these rules regarding securitiza-tions (requiring mortgage originators to hold 5%oftheriskoftheloanstheymake).Thatsaid, the devil will be in the details, but we generally are supportive. Additionally, the government recently rolled out three models of how government-sponsored enterprises (GSE)mightbereformedovertime.Anyofthese models could be designed to work for consumers and investors and effectively could create a strong and stable mortgage finance system. Alternatively, any one could be designed in a way that could lead to disaster.
The key is for policymakers and market participants to get all elements right. If they succeed, then mortgage products will be much improved for both consumers andinvestors.Also,iftherolesoftheGSEswere to be better clarified and more limited, there would be lower risk of damage to the economy, and the taxpayers would not be left footing the bill for failure.
Getting to the Right Capital and Liquidity Levels
Of all the changes being made in the finan-cial system, we believe it is most impor-tant to have higher, but proper, capital and liquidity requirements for banks. But these levels cannot be arbitrary or political – they must be rooted in logic and designed for the fundamental purpose of best preparing banks to be able to handle extremely stressed environments – a purpose that always has been central to JPMorgan Chase’s capital andliquiditypositions.Wealsobelievethatif the levels of capital are set too high, they can both impede economic growth and push more of what we refer to as banking into the hands of non-banks.
JPMorgan Chase had adequate capital both to deal with the government’s new stress test, and, more important, to deal with the real stress test of the past few years — we don’t see the need for more
Stress tests – both forward- and backward-lookingones–showthat7%BaselITier1Common Capital provided plenty of capital. Whenthegovernmentdiditsfirststresstestin February of 2009, it required banks to have 4% Tier 1 Common Capital. As shown in the chart on the next page, JPMorgan Chase wentintothecrisiswith7%.Withthatlevelof equity, we were able to acquire both Bear StearnsandWaMuwhilesimultaneouslypowering through the crisis. Throughout the entire period, our capital ratio barely dropped.
The Basel III rules effectively would require JPMorgan Chase to hold approximately 50% more capital than the already high level of capital held during the crisis. The call under BaselIIIforastandard7%ofTier1CommonCapital essentially is equivalent to the 10% standard or more under Basel I. This is
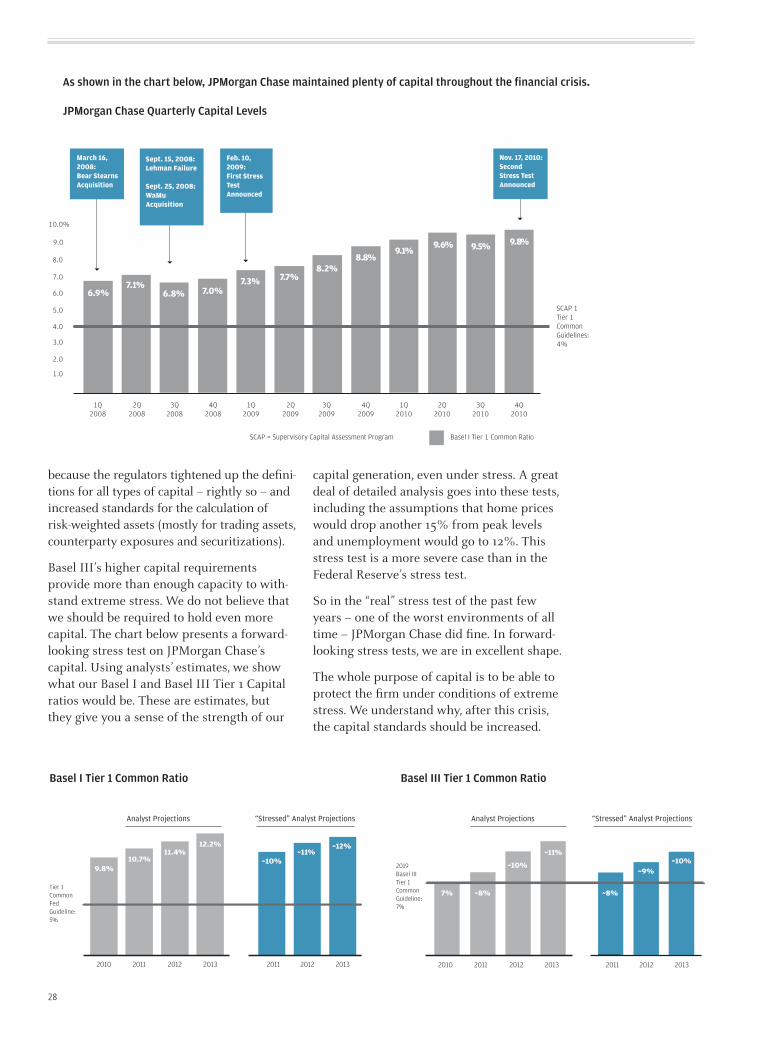
28
because the regulators tightened up the defini-tions for all types of capital – rightly so – and increased standards for the calculation of risk-weighted assets (mostly for trading assets, counterpartyexposuresandsecuritizations).
Basel III’s higher capital requirements provide more than enough capacity to with-standextremestress.Wedonotbelievethatwe should be required to hold even more capital. The chart below presents a forward-looking stress test on JPMorgan Chase’s capital.Usinganalysts’estimates,weshowwhat our Basel I and Basel III Tier 1 Capital ratios would be. These are estimates, but they give you a sense of the strength of our
capital generation, even under stress. A great deal of detailed analysis goes into these tests, including the assumptions that home prices would drop another 15% from peak levels and unemployment would go to 12%. This stress test is a more severe case than in the Federal Reserve’s stress test.
Sointhe“real”stresstestofthepastfewyears – one of the worst environments of all time – JPMorgan Chase did fine. In forward-looking stress tests, we are in excellent shape.
The whole purpose of capital is to be able to protect the firm under conditions of extreme stress.Weunderstandwhy,afterthiscrisis,the capital standards should be increased.
Basel I Tier 1 Common Ratio Basel III Tier 1 Common Ratio
2013201220112010 201320122011 2013201220112010 201320122011
Tier 1 Common Fed Guideline: 5%
Analyst Projections “Stressed” Analyst Projections Analyst Projections “Stressed” Analyst Projections
Basel I Tier 1 Common Ratio Basel III Tier 1 Common Ratio
9.8%10.7%
11.4%12.2%
~10%~11%
~12%
7% ~8%
~10%
~11%
~8%
~9%~10%
2019Basel IIITier 1 Common Guideline: 7%
1Q2009
2Q2009
3Q2009
4Q2009
1Q2010
2Q2010
3Q2010
9.1%9.6%
4Q2010
9.5%
8.2%8.8%
5.0
6.0
7.0
8.0
4.0
3.0
2.0
1.0
9.0
10.0%
7.3%
4Q2008
7.0%
3Q2008
6.8%
2Q2008
7.1%
1Q2008
6.9%
7.7%
JPMorgan Chase Quarterly Capital Levels
SCAP 1 Tier 1Common Guidelines: 4%
Feb. 10, 2009:First Stress Test Announced
Nov. 17, 2010:Second Stress Test Announced
9.8%
March 16, 2008: Bear Stearns Acquisition
Sept. 15, 2008:Lehman Failure
Sept. 25, 2008:WaMuAcquisition
Basel I Tier 1 Common RatioSCAP = Supervisory Capital Assessment Program
As shown in the chart below, JPMorgan Chase maintained plenty of capital throughout the financial crisis.
JPMorgan Chase Quarterly Capital Levels
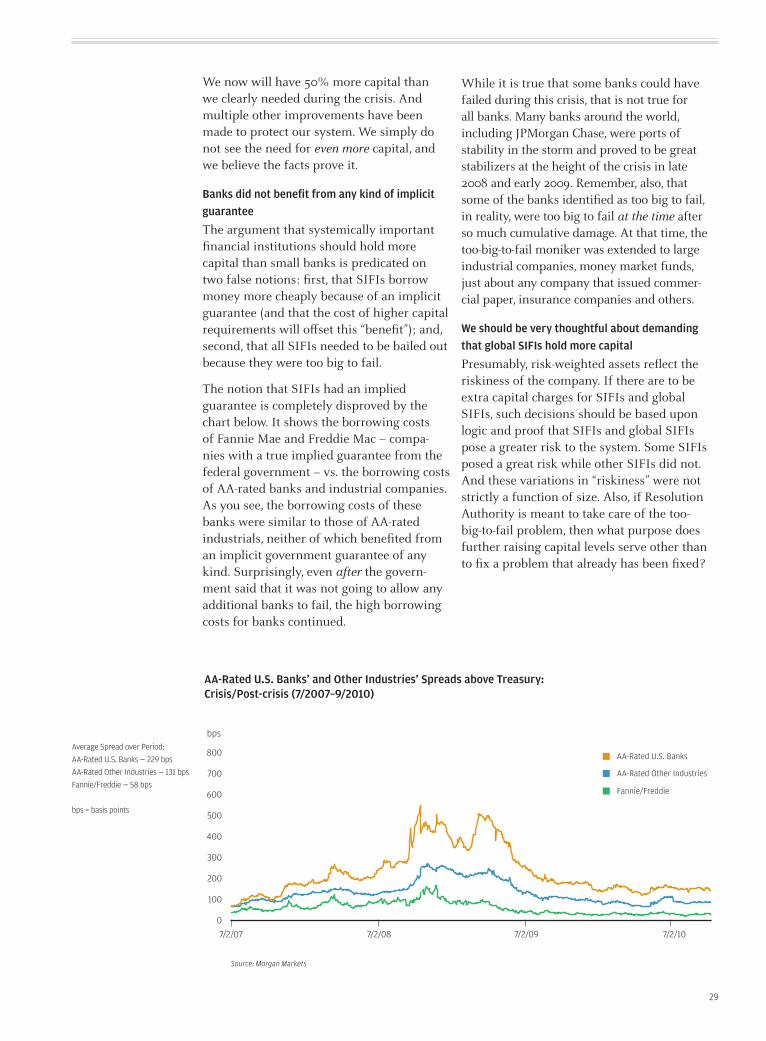
29
Wenowwillhave50%morecapitalthanwe clearly needed during the crisis. And multiple other improvements have been madetoprotectoursystem.Wesimplydonot see the need for even more capital, and we believe the facts prove it.
Banks did not benefit from any kind of implicit guarantee
The argument that systemically important financial institutions should hold more capital than small banks is predicated on two false notions: first, that SIFIs borrow money more cheaply because of an implicit guarantee (and that the cost of higher capital requirementswilloffsetthis“benefit”);and,second, that all SIFIs needed to be bailed out because they were too big to fail.
The notion that SIFIs had an implied guarantee is completely disproved by the chart below. It shows the borrowing costs of Fannie Mae and Freddie Mac – compa-nies with a true implied guarantee from the federal government – vs. the borrowing costs of AA-rated banks and industrial companies. As you see, the borrowing costs of these banks were similar to those of AA-rated industrials, neither of which benefited from an implicit government guarantee of any kind. Surprisingly, even after the govern-ment said that it was not going to allow any additional banks to fail, the high borrowing costs for banks continued.
Whileitistruethatsomebankscouldhavefailed during this crisis, that is not true for all banks. Many banks around the world, including JPMorgan Chase, were ports of stability in the storm and proved to be great stabilizers at the height of the crisis in late 2008 and early 2009. Remember, also, that some of the banks identified as too big to fail, in reality, were too big to fail at the time after so much cumulative damage. At that time, the too-big-to-fail moniker was extended to large industrial companies, money market funds, just about any company that issued commer-cial paper, insurance companies and others.
We should be very thoughtful about demanding that global SIFIs hold more capital
Presumably, risk-weighted assets reflect the riskiness of the company. If there are to be extra capital charges for SIFIs and global SIFIs, such decisions should be based upon logic and proof that SIFIs and global SIFIs pose a greater risk to the system. Some SIFIs posed a great risk while other SIFIs did not. Andthesevariationsin“riskiness”werenotstrictly a function of size. Also, if Resolution Authority is meant to take care of the too-big-to-fail problem, then what purpose does further raising capital levels serve other than tofixaproblemthatalreadyhasbeenfixed?
0
100
200
300
400
500
600
700
800
7/2/107/2/097/2/087/2/07
Source: Morgan Markets
bps
“AA” rated U.S. banks and other industries spreads above Treasury:Crisis/Post-Crisis (7/2007– 9/2010)
AA-Rated U.S. Banks
AA-Rated Other Industries
Fannie/Freddie
AA-Rated U.S. Banks’ and Other Industries’ Spreads above Treasury:Crisis/Post-crisis (7/2007–9/2010)
AverageSpreadoverPeriod:AA-RatedU.S.Banks—229bpsAA-RatedOtherIndustries—131bpsFannie/Freddie—58bps
bps=basispoints

30
EventheidentificationofSIFIsorglobalSIFIs creates issues: Does this status make youabettercredit?Won’titcausedistor-tions in the future as some people decide thatitwillbesafertobankwithSIFIs?Arethe regulators going to make it clear what a company could do to give up the SIFI or global SIFI status and reduce your capital requirements?Aretheregoingtobespecificways for specific SIFIs to reduce their capital requirements?WilltheidentificationofglobalSIFIsbedonefairlyacrosscountries?Willtherebebright-linetestsorwillitbeup to the judgment of various bureaucra-cies?Won’ttheidentificationofSIFIssimplybecome a political process as you travel to Washington,D.C.,toarguewhyyoushouldnotbeaSIFI?
In short, we at JPMorgan Chase see the value of higher capital and liquidity and the wisdom of resolution plans and living wills that make iteasiertoletbigbanksfail.Weevenbelievethat banks should continue to pay for bank failures.Wejustdon’tbelieveinarbitraryandincreasingly higher capital ratios.
The Need for Large Global Banks and America’s Competitive Position
Companies come in various sizes, shapes and forms. There are many reasons for this. At JPMorgan Chase, we benefit from huge economies of scale in our businesses. The same goes for most large enterprises. Economiesofscaleinourindustrygener-ally come from technology, including data centers, networks and software; the benefits of global branding; the ability to make huge investments; and the true diversification of risks. The beneficiaries of these economies of scale ultimately are the consumers who these companies serve.
Moreover, in many ways, the size of our company is directly related to the size of the clients we serve globally. Our size supports the level of resources needed to service these large, multinational clients – and enables us to take on the necessary risk to support them.
For some of our wholesale clients, we are asked to make bridge loans or underwrite securitiesof$10billionormore.Webuyandsell trillions of dollars of securities a day and move some $10 trillion of cash around the worldeveryday.Whenweprovidecredittoa client, it may include revolving credit, trade finance, trading lines, intraday lines and derivatives lines – often in multiple locations globally – and often in the billions.
Inourretailbusiness,buyingWaMuenabled us to improve branches in many ways: adding salespeople; retrofitting and upgrading each location; adding improved products, services and systems; and saving some$1millionateachbranch.Ultimately,this allowed us to offer our clients better products and services.
In a free market economy, companies grow over time because they are winning customers. These companies win customers and grow market share because they – rela-tive to the competition – are doing a better andfaster(andattimeslessexpensive)jobof providing customers with what they want.
Consolidation does not cause crises, and the U.S. banking system is far less consolidated than most other countries
TheU.S.bankingsystemhasgonefromapproximately 20,000 banks 30 years ago to approximately7,000today.Thattrendlikelywill continue as banks seek out economies of scale and competitive advantage. That does not mean there won’t be start-ups and successful community banks. It just means that, in general, consolidation will continue, as it has in many industries.
TheU.S.systemisstillfarlessconsolidatedthan most other countries (see chart on next pageontop).
In any case, the degree of industry consolida-tion has not, in and of itself, been a driving force behind the financial crisis. In fact, some countries that were far more consolidated (Canada, Australia, Brazil, China and Japan, tonameafew)hadnoproblemsduringthiscrisis so there is not compelling evidence to back up the notion that consolidation was a major cause of the problem.
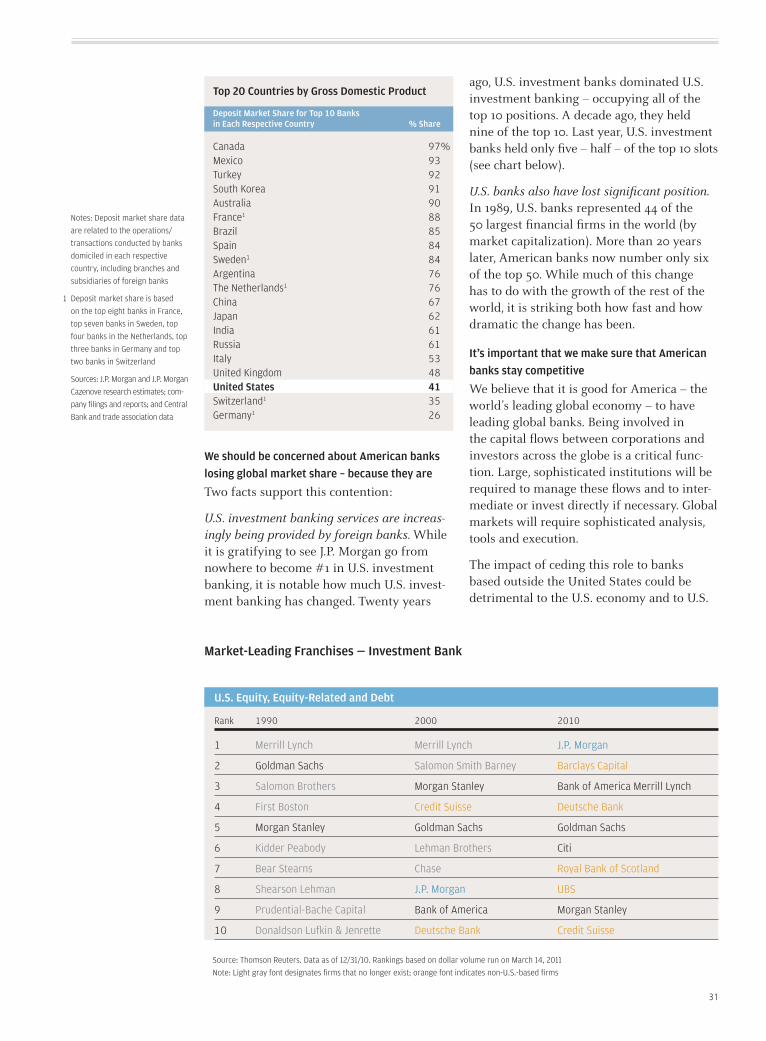
31
Notes: Deposit market share data are related to the operations/transactions conducted by banks domiciled in each respective country, including branches and subsidiaries of foreign banks
1 Deposit market share is based on the top eight banks in France, top seven banks in Sweden, top four banks in the Netherlands, top three banks in Germany and top two banks in Switzerland
Sources: J.P. Morgan and J.P. Morgan Cazenove research estimates; com-pany filings and reports; and Central Bank and trade association data
Top 20 Countries by Gross Domestic Product
Deposit Market Share for Top 10 Banks in Each Respective Country % Share
Canada 97 %Mexico 93Turkey 92South Korea 91Australia 90France1 88Brazil 85 Spain 84Sweden1 84Argentina 76The Netherlands1 76China 67Japan 62India 61Russia 61Italy 53United Kingdom 48United States 41Switzerland1 35Germany1 26
We should be concerned about American banks losing global market share – because they are
Two facts support this contention:
U.S. investment banking services are increas-ingly being provided by foreign banks. While it is gratifying to see J.P. Morgan go from nowhere to become #1 in U.S. investment banking, it is notable how much U.S. invest-ment banking has changed. Twenty years
ago, U.S. investment banks dominated U.S. investment banking – occupying all of the top 10 positions. A decade ago, they held nine of the top 10. Last year, U.S. investment banks held only five – half – of the top 10 slots (see chart below).
U.S. banks also have lost significant position. In 1989, U.S. banks represented 44 of the 50 largest financial firms in the world (by market capitalization). More than 20 years later, American banks now number only six of the top 50. While much of this change has to do with the growth of the rest of the world, it is striking both how fast and how dramatic the change has been.
It’s important that we make sure that American banks stay competitive
We believe that it is good for America – the world’s leading global economy – to have leading global banks. Being involved in the capital flows between corporations and investors across the globe is a critical func-tion. Large, sophisticated institutions will be required to manage these flows and to inter-mediate or invest directly if necessary. Global markets will require sophisticated analysis, tools and execution.
The impact of ceding this role to banks based outside the United States could be detrimental to the U.S. economy and to U.S.
Market-Leading Franchises — Investment Bank
U.S. Equity, Equity-Related and Debt
Rank 1990 2000 2010
1 Merrill Lynch Merrill Lynch J.P. Morgan
2 Goldman Sachs Salomon Smith Barney Barclays Capital
3 Salomon Brothers Morgan Stanley Bank of America Merrill Lynch
4 First Boston Credit Suisse Deutsche Bank
5 Morgan Stanley Goldman Sachs Goldman Sachs
6 Kidder Peabody Lehman Brothers Citi
7 Bear Stearns Chase Royal Bank of Scotland
8 Shearson Lehman J.P. Morgan UBS
9 Prudential-Bache Capital Bank of America Morgan Stanley
10 Donaldson Lufkin & Jenrette Deutsche Bank Credit Suisse
Source: Thomson Reuters. Data as of 12/31/10. Rankings based on dollar volume run on March 14, 2011 Note: Light gray font designates firms that no longer exist; orange font indicates non-U.S.-based firms

32
companies.Foralongtime,theUnitedStateshas had the deepest and best capital markets on the planet. These markets match investors with companies, large and small, who inno-vate, invest and grow around the world. They have helped build some of the best compa-nies in the world and the best economy on the planet. America’s financial institutions have been a critical part of this success.
Whilemistakesweremadeandchangewasclearly required, we should not throw out the baby with the bath water.
Some of the laws that were written and some of the possible interpretations of rules to come could create competitive disadvantages for American banks. They are adding up, and they bear watching. They are:
• Americanbanksnolongerhavetheabilityto use tax-deductible preferred stock as capital(overseasbanksdo).
• Mostothercountrieshavemadeitclearthat they will not accept the Volcker Rule (despite Paul Volcker’s testimony that inter-national regulators would adopt it once theyunderstoodit).
• ManyoftherulesregardingderivativesbeingadoptedintheUnitedStatesareunlikely to be adopted universally. Certain countries are licking their chops at the prospectofU.S.banksbeingunabletocompete in derivatives. Remember, the clients will go to the place that is the cheapest and most effective for them.
• Thereareconcentrationlimits,oldandnew, that constrain American banks’ ability from making acquisitions both here and abroad. Some of these constraints will not apply to foreign banks.
• Thereareproposedbanktaxesorotherarbitrary taxes that could disadvantage large banks – even the FDIC has skewed its deposit insurance to increase the charge to bigger banks.
• Manyoftheleadingeconomiesoftheworld may not have their large banks maintain additional capital requirements in excessofthe7%calledforinBaselIII.
• Itisclearthatsomecountries’regulationallows for a much less conservative calcula-tion on risk-weighted assets.
WedonotbelievethattheFederalReserveorthe Treasury would want to leave American banksatadisadvantage.WeneedAmericanleadership to be forceful and engaged to ensure a fair outcome.
We all have a vested interest in getting this right
The government took great action to stop the crisis from getting worse. Lawmakers and regulators have and will take much action to fix what clearly was a broken system. As quickly as we reasonably can, we should finish the remaining rules and requirements and create the certainty that will help the system to heal faster. Nothing is more impor-tant than getting our economy growing and getting Americans back to work. And the regulators should remember that they always have the right to change things again – if and when appropriate.

33
V. CONCLUSION
You can rest assured that your management team and Board of Directors are completely focused on all the opportunities, issues and risks that we have ahead of us.
Regarding the regulatory changes, we have some70projectsandworkteams–fullystaffed with lawyers; accountants; credit officers; compliance, systems and opera-tions specialists; and bankers and traders – analyzing and preparing for each of the new regulatory requirements. All in all, thousands of our people around the world are partially or fully engaged in these endeavors.
Wewillensurethatwemeetallthenewrules and requirements, both in letter and spirit, and we will make sure that everything we do, wherever we can, is done with the customerforemostinmind.Whileweexpectto make numerous changes in our products, services and prices, we will strive to do so in the most customer-friendly way possible.
As we look toward the future, we see incred-ible opportunities for your company, and our teams around the world are fully engaged in pursuing them.
In every way we can, we continue to actively support the economic recovery. Weknowthatcommunitiesarebuiltwheneveryone does his or her part. And we intend to do ours by being a responsible corporate citizen and helping our commu-nities across the globe. You can read more about our extensive efforts on jpmorganchase.com/forward.
Our people have done an extraordinary job, often under difficult circumstances. I hope you are as proud of them as I am.
Jamie Dimon ChairmanandChiefExecutiveOfficer
April 4, 2011

34
Fortunately, it isn’t in our nature to take success for granted – it’s our firm’s culture to continually earn and re-earn client trust.
2010 Results: Near Record PerformanceThe Investment Bank generated solid returns. Net income was $6.6 billion on revenue of $26 billion, just short of 2009’s record levels. ROE was 17% on $40 billion of capital – our through-the-cycle target.
J.P. Morgan’s debt markets leader-ship, combined with investor confi-dence and low interest rates, enabled corporates to prepare their balance sheets for long-term growth. Clients made good progress, although the Gulf oil spill, sovereign debt concerns and regulatory uncertainty challenged markets. As well, the mid-year “flash crash” was a healthy reminder that technology can outpace control.
Customers, spearheading the recovery, selected J.P. Morgan for numerous public and private capital raises. We were privileged to work for many prominent clients like General Motors, the Agricultural Bank of China and Novartis.
In late 2009, I rejoined the Invest-ment Bank after 10 years in Asset Management. Obviously, there were many changes during that decade as world GDP nearly doubled and the digital revolution impacted consumers, businesses and countries on a global scale.
I’d like to highlight three changes that are particularly meaningful for our business. First, technology ceased to be “support” for trading and banking; it now is part of J.P. Morgan’s client offering. Second, countries like China, long tagged “emerging,” today are powerful and important; this antique label no longer applies. Third, J.P. Morgan became both a universal bank and a leading investment bank, with finan-cial strength, capabilities and a client base unparalleled in global finance.
The Investment Bank now serves approximately 16,000 investor clients and 5,000 issuer clients. No doubt the financial crisis helped us gain share – we were the safe harbor and, subsequently, as the recovery took hold, a port of opportunity.
We expanded our market-making footprint, adding local capabilities in important countries like Russia and Brazil. China’s approval of our securities joint venture means a larger in-country presence and the ability to participate in domestic underwriting. Three of the top five exchanges for IPOs last year were in China, accounting for nearly 40% of dollar volume.
An emphasis on liquidity, derivative book repositioning and trading disci-pline led to our best-ever revenue-to-risk relationship. There were no trading-day losses in three of the last four quarters.
The Sempra acquisition added skill and capacity, particularly in oil and base metals, and 1,000 clients. J.P. Morgan now serves client needs across all important physical and financial commodity markets.
The formation of our Markets Strategies group, with senior manage-ment and advanced quantitative and programming talent, brought focus and momentum to electronic trading and related initiatives.
Investment Bank
“ J.P. Morgan’s financial strength, client base and capabilities are unparalleled … we are positioned to serve clients as they expand globally.”
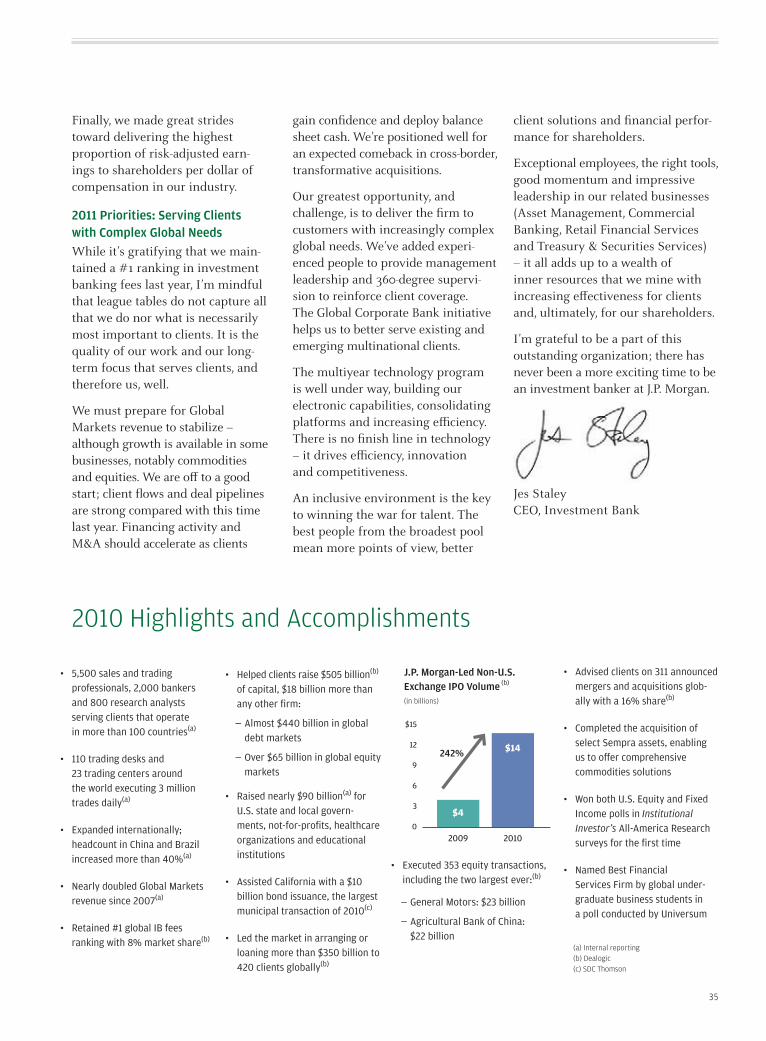
35
• 5,500salesandtradingprofessionals,2,000bankersand800researchanalystsservingclientsthatoperateinmorethan100countries(a)
• 110tradingdesksand23tradingcentersaroundtheworldexecuting3milliontradesdaily(a)
• Expandedinternationally;headcountinChinaandBrazilincreasedmorethan40%(a)
• NearlydoubledGlobalMarketsrevenuesince2007(a)
• Retained#1globalIBfeesrankingwith8%marketshare(b)
• Helpedclientsraise$505billion(b)ofcapital,$18billionmorethananyotherfirm:
—Almost$440billioninglobaldebtmarkets
—Over$65billioninglobalequitymarkets
• Raisednearly$90billion(a)forU.S.stateandlocalgovern-ments,not-for-profits,healthcareorganizationsandeducationalinstitutions
• AssistedCaliforniawitha$10billionbondissuance,thelargestmunicipaltransactionof2010(c)
• Ledthemarketinarrangingorloaningmorethan$350billionto420clientsglobally(b)
2010 Highlights and Accomplishments
Finally, we made great strides toward delivering the highest proportion of risk-adjusted earn-ings to shareholders per dollar of compensation in our industry.
2011 Priorities: Serving Clients with Complex Global NeedsWhile it’s gratifying that we main-tained a #1 ranking in investment banking fees last year, I’m mindful that league tables do not capture all that we do nor what is necessarily most important to clients. It is the quality of our work and our long-term focus that serves clients, and therefore us, well.
We must prepare for Global Markets revenue to stabilize – although growth is available in some businesses, notably commodities and equities. We are off to a good start; client flows and deal pipelines are strong compared with this time last year. Financing activity and M&A should accelerate as clients
gain confidence and deploy balance sheet cash. We’re positioned well for an expected comeback in cross-border, transformative acquisitions.
Our greatest opportunity, and challenge, is to deliver the firm to customers with increasingly complex global needs. We’ve added experi-enced people to provide management leadership and 360-degree supervi-sion to reinforce client coverage. The Global Corporate Bank initiative helps us to better serve existing and emerging multinational clients.
The multiyear technology program is well under way, building our electronic capabilities, consolidating platforms and increasing efficiency. There is no finish line in technology – it drives efficiency, innovation and competitiveness.
An inclusive environment is the key to winning the war for talent. The best people from the broadest pool mean more points of view, better
• Executed353equitytransactions,includingthetwolargestever:(b)
—GeneralMotors:$23billion
—AgriculturalBankofChina:$22billion
• Advisedclientson311announcedmergersandacquisitionsglob-allywitha16%share(b)
• CompletedtheacquisitionofselectSempraassets,enablingustooffercomprehensivecommoditiessolutions
• WonbothU.S.EquityandFixedIncomepollsin Institutional
Investor’s All-AmericaResearchsurveysforthefirsttime
• NamedBestFinancialServicesFirmbyglobalunder-graduatebusinessstudentsinapollconductedbyUniversum
(a) Internal reporting(b) Dealogic(c) SDC Thomson
client solutions and financial perfor-mance for shareholders.
Exceptional employees, the right tools, good momentum and impressive leadership in our related businesses (Asset Management, Commercial Banking, Retail Financial Services and Treasury & Securities Services) – it all adds up to a wealth of inner resources that we mine with increasing effectiveness for clients and, ultimately, for our shareholders.
I’m grateful to be a part of this outstanding organization; there has never been a more exciting time to be an investment banker at J.P. Morgan.
Jes Staley CEO, Investment Bank
J.P. Morgan-Led Non-U.S. Exchange IPO Volume (b)
(in billions)
0
3
6
9
12
15
0
3
6
9
12
$ 15
$14
$4
2009 2010
242%

36
states, our customers use our 5,300 bank branches and 16,000 ATMs, one of the largest networks nationwide. Our branches also are used to serve customers from other lines of busi-ness, including the Commercial Bank and the Private Bank.
Mortgage Banking, Auto & Other Consumer Lending services almost 9 million mortgages and provides new loans through loan officers and correspondents. Our customers also can obtain auto financing through more than 16,000 auto dealerships and student loans at more than 2,200 schools and universities nationwide.
While I remain confident of the value of Chase’s retail franchise, I know we can do better than the results we’ve achieved over the past two years. Fortunately, the core strength of our franchise gives RFS a foundation upon which to grow in 2011 and beyond: We will continue to expand both our branch network and our offerings within those branches, as our mortgage portfolio works its way back toward profitability.
JPMorgan Chase possesses one of the most attractive retail financial services franchises in America, with ample opportunities to grow even after one of the most challenging periods in our history. We have the scale, technology and people to continue to deliver great service for our customers and terrific value to our shareholders.
Retail Financial Services (RFS) serves consumers and small busi-nesses through a range of venues: in-person service at bank branches, auto dealerships and school financial aid offices; telephone banking; auto-mated teller machines; and online and mobile banking. The strength of RFS derives from its scope across two businesses: Retail Banking, and Mortgage Banking, Auto & Other Consumer Lending.
Our 29,000 branch salespeople assist 30 million RFS customers with checking and savings accounts, credit and debit cards, mortgages, home equity and business loans, auto loans and investment advice. Across 23
2010 Results: Solid Retail Earnings Offset by Ongoing Mortgage LossesFor 2010, RFS generated net income of $2.5 billion on revenue of $31.8 billion and a return on equity of 9%. These results, while an improvement from 2009, are well below what these businesses are capable of producing and what you should expect from us.
Our core banking and lending busi-nesses performed well and saw solid organic growth throughout the year, but these results were partially offset by elevated credit losses and mort-gage repurchase expenses. As well, we made additions to our loan loss reserves for the home loan portfolios, much of which are in run-off mode.
For comparison’s sake, if we exclude our Home Lending portfolios and repurchase expenses, RFS earnings were $6.7 billion, with ROE of 37%. This represents the earnings power of RFS, as losses in the mortgage portfolios will decrease significantly in size and, eventually, contribute positively to earnings.
Retail Financial Services
“I would not trade our franchise for anyone else’s.”

37
Home Lending Our Home Lending business continues to go through a turbulent period. Loans acquired from Wash-ington Mutual, as well as some of the Chase-originated loans, continued to perform terribly. While losses and delinquencies decreased from their peaks, they still are at unacceptably high levels.
Our Home Lending portfolios lost $4.2 billion in 2010 (including repur-chase expenses). At the same time, we benefited from the refinancing boom, and net income in produc-tion (excluding repurchase losses) increased by 58%. We will need to continue managing these two very different issues for the next several years, as losses likely will remain high in the legacy portfolio while we focus on gaining profitable new business.
(Please see my accompanying discussion of the mortgage business on page 38.)
Retail Banking For 2010, Retail Banking reported net income of $3.6 billion, down 7% from the prior year. Net revenue was down 2% to $17.6 billion, driven by lower deposit-related fees, largely offset by higher debit card income and a shift to wider-spread deposit products.
Adding 3 million new customers every year, our Retail Banking fran-chise continues its growth trajec-tory, with strong and increasing brand recognition across the country. Excluding acquisitions, our net income has grown at a compound annual growth rate of 9% since 2005. To deliver that growth, we have maintained our long-standing focus on acquiring and deepening customer relationships and continu-ally investing for the future.
In 2010, we opened 154 new branches and added 3,700 personal bankers, nearly 600 loan officers and 450 business bankers to better serve our customers. We opened 1.5 million net new checking accounts and increased our sales production per branch by 16%. Our cross-sell ratio, at nearly seven products per household, is one of the highest in the industry.
We are not just getting bigger but we are constantly working to serve our customers better – for example, in 2010, innovation in mobile banking with convenient new smartphone applications. More than 17 million customers use our online services, representing a compound annual growth rate of more than 36% since 2006. Finally, the personal touch for which Chase branches are renowned – thanks to our great employees, who constantly strive to provide better advice and service – remains a cornerstone of our business.
2011 Priorities: Growing Our Branch Business with Expanded Offerings across Our NetworkThe results of the past year vali-date the essential soundness of our approach to growing our business. Going forward, we intend to remain focused on our customers and our people, which have sustained us during these challenging times.
Continuing to focus on organic growth is our primary goal. We already have more to offer consumers and businesses than most of our competitors, not to mention the stability of JPMorgan Chase standing behind us.
• Despiteadifficultenvironmentin2010,wehadstronggrowthacrossourRetailBankingfranchise,including:
—BusinessBankingoriginationsup104%yearoveryear
—Branchmortgageoriginationsup48%
—End-of-perioddepositsof$344.2billion,up3%
—Checkingaccountsof27.3million,up6%
—Investmentsalesup8%
• Exceededourgoalofprovid-ing$10billionofnewcredittoAmericansmallbusinessesin2010.Weextendedcredittomorethan250,000smallbusinesseswithannualsalesoflessthan$20millionthroughBusinessBanking,CommercialBankandBusinessCardbusi-nesses.In2010,Chase’slendingtosmallbusinessesacrossthefirmwasupmorethan50%.Wewererankedthe#1SmallBusinessAdministrationlenderinAmerica
2010 Highlights and Accomplishments
• AutoFinanceachievedrecord2010performanceearningnetincomeof$832million,up117%,ontotalrevenueof$2.8billion,up20%
• Deepenedourcustomerrelationshipsbyincreasingthenumberofproductsandservicesheldbyourcustomersby7%(from6.26to6.68)
• Heldthe#1depositmarketshareinkeycitiesinourfootprint,includingNewYork(16.7%),Dallas(13.6%),Houston(16.2%)andChicago(12.9%)
• IncreasedouroriginationmarketshareinHomeLendingto10.4%from8.6%
• Todate,wehavepreventednearly500,000foreclosuresandofferedmorethan1millionmodifications
• Opened17ChaseHomeowner-shipCentersacrossthecountrytoprovideone-on-onecounsel-ingtoborrowers,bringingthetotalnumberofcentersto51andcounting

38
Wehavelearnedagreatdealfromthemistakesofthelastfewyearsandareworkingeverydaytogetthefirm’stroubledmortgageportfoliosintobettershape.Here,Iansweranumberofques-tionsofthekindregularlyposedbyourcustomersandshareholders.
What mistakes did the firm make in mortgages, and how can it avoid them in the future?
Frankly,wemissedsomerealbasics.Ourstressscenarioswerenotnearlysevereenough.Wereliedtoomuchonbackward-lookingstatisticaldatatogaugeourrisk.Overseveralyears,wechangedmanyunderwritingprocessesandrequirements,usuallyinsmallways—but,cumulatively,overtime,thesesmallchangescombinedtodramaticallychangeourriskprofileinwayswedidnotfullyunderstand.Mostimpor-
A Q&A WITH CHARLIE SCHARF ON MORTGAGES
tant,wedidnotunderstandtheultimateeffectthesegradualchanges(alongwithgovernmentpolicy)werehavingonhousingpricesbroadly.Allthesefactorscontrib-utedtoariskprofilethatbecameoutsizedrelativetoourearnings.Weknowwewerenotaloneintheindustryinmakingthesemistakes,butweholdourselvestoahigherstandardandknowwecannotmissthesebasicsagain.Wehavechangedourunder-writingstandards,processes,analyticsandthewaywethinkaboutrisk,andwebelievethatwewillavoidtheseproblemsandothersliketheminthefuture.
Should JPMorgan Chase still originate and service home loans, given all of the risks?
Yes.HomeownershiphasbeenandwillcontinuetobeagoalofmostpeopleinAmerica,andwewanttobethereto
supportit.Weareverysupportiveofmort-gagereformandbelieveahealthy,vibrantmortgagemarketthatsupportsrespon-siblehomeownershipcanbeachieved.
Wealsobelievethatbeingtheprimaryprovideroffinancialproductstoourcustomersmeanswemustbeagreatproviderofhomelendingproducts.Thedistributioncapacitywehavethroughourbankbranchesandtherelationshipswehavewithmorethan55millioncustomerspositionsustobeaprimaryU.S.providerofhomeloans.Throughourretailandcreditcardbusinesses,wehavecontactwiththesemillionsofcustomersnearlyeveryday,andweknowtheirfinancialhealthand,often,theirlong-termfinan-cialaspirations.Ourgoalistoexcelatprovidingthesecustomerswithmort-gagesinthesamewayaswithourotherproductsandservices.
In 2011, we are continuing to add sales staff in our branches to serve customers. As for the branches them-selves, we have had great success growing our nationwide footprint – the 1,000 branches built since 2002 have added $150 million to our pretax profits as of 2010, a number expected to grow to more than $1 billion by 2018. Over the next five years, we anticipate building another 1,500-2,000 branches in our existing markets, generating an additional $1.5 billion to $2.0 billion in pretax income when seasoned.
Across the business, we also are pursuing several growth initiatives with great potential for our bottom line. For affluent customers, we
plan to open 50 new Chase Private Client locations in 2011, with corre-sponding investments in staff, tech-nology, products and customized service; we will have more than 150 locations by the end of 2013, primarily in New York, Chicago and Los Angeles. We also are expanding our Business Banking segment, especially in the heritage WaMu footprint. In those markets alone, Business Banking lent $878 million in 2010, up from almost zero a year earlier; our expansion could generate $1 billion in annual pretax income over time. Finally, we continue to advance our leader-ship in developing new products and services for our customers, such as instant-issue debit cards, QuickDepositSM and Chase Instant Action AlertsSM.
The experiences of the past few years have shown beyond a doubt that we have an excellent franchise built on strong business fundamentals. It is a franchise that has weathered a signif-icant economic storm and is built to withstand future shocks. But more important, it is positioned to grow and to strengthen. I would not trade our franchise for anyone else’s. This is a great time to be part of Chase, and I look forward to what I believe are even better days to come.
Charlie Scharf CEO, Retail Financial Services
38

39
Given everything we’ve read about the health of the mortgage market, what is the current state of JPMorgan Chase’s mortgage portfolio?
Speakingjustforourfirm,weservice$1.2trillioninmortgagesandhomeequityloans—abitlessthan9millioninnumber—whichrepresentsabout12%oftheentiremarket.
Youlikelyhavereadmanyalarmingthingsaboutthemortgageservicingindustry,someofwhicharetruebutmanyofwhicharenot.Thisstatisticmaysurpriseyou:Morethan90%ofthemortgagecustomersweservicecontinuetomaketimelypayments,regardlessofthevalueoftheirhome.Andthat’strueacrossmostoftheindustry.Fortunately,mostpeoplewhoborrowmoney—whetherit’samortgageoranothertypeofdebt—honortheirobligationtopayitback.
Unfortunately,theeconomicenvironmenthasmadeitdifficultforsomecustomerstomaketheirpayments.Hard-workingpeoplehavelosttheirjobsorseentheirincomereduced.Wehavearesponsibilitytoourshareholders,tothecommunitiesweserveandtoourcustomerstoworkwiththosewhowanttostayintheirhomesbutarehavingtroublemakingpaymentsbecauseoftemporaryeconomichardship.Andwehaveanumberofprogramstohelpthosepeople.
When does JPMorgan Chase have to foreclose on a homeowner?
Simply put, we don’t want to foreclose on homes.Foreclosureisthelastandworstalternativeforeveryone:theindividual,thecommunity,thehousingmarketandtheeconomymorebroadly—aswellasthefirm.Welosearoundsixtimesmoremoneyonforeclosurethanonmodification.
Sadly,itistheonlypathforsomeborrowers.Theaverageloanisover14monthsdelinquentwhenweultimatelyforeclose.Ofthehomesweforecloseon,57%arenotowner-occupied,ofwhichoverhalfwerevacantatforeclosure.
Another10%wereowner-occupiedbutvacantatforeclosure,andafurthersubsetofborrowerseitherdidnotrespondtooureffortstocontactthem,didnotapplyforamodificationordidnotsubmittherequireddocumentation.
Wegotogreatlengthstopreventforeclo-sure.Weaggressivelyattempttocontacteverycustomershortlyafterbecomingdelinquent.Foracustomerhavingdifficultypayingforandstilllivinginhisorherhome,ourgoalistomodifytheloan.Todate,wehavepreventednearly500,000foreclo-suresthroughmodifications,forbearance,shortsalesandotherprograms;andwehaveofferedmorethan1millionmodifica-tions,with285,000completed.Wehavepreventedtwotimesasmanyforeclosuresaswehavecompleted.
Allthatsaid,wedonotviewitasourresponsibilitytohelpthosewhocanpaybutchoosenottopaysimplybecausethevalueoftheirhomehasfallen.
So why does the firm foreclose on a homeowner?
Generally,forthosewhowecannothelpwithmodificationorothersolutions,therearethreereasonsweforeclose:
1. Themortgage-holderdoesn’trespond.Wecannothelppeoplewhodon’trespondtousordon’tsendusrequiredinformation.Regrettably,roughly20%oftheseborrowersneverrespondtomorethan100attemptsbyChasetogetintouchwiththemwhentheygodelinquent.
2. Wedon’treceiveproperdocumenta-tion.Approximately70%oftheseborrowerseitherdonotsendusanyoralloftherequireddocumentationtoapplyforamodification.Themodi-ficationprogramrequiresspecificdocumentationfromeachborrowerinordertoproperlyidentifythepeoplewhocanaffordamodification.Thisiseasiersaidthandone.
3. Themortgage-holdersimplycan’taffordthemortgage.Finally,ofthe10%remaining,themajorityareoffereda
modificationbutdonotmakeallthenecessarypayments.Andasmallerpercentageofmortgage-holdersaredeclinedforamodificationbecauseitisdeterminedtheycanaffordtheircurrentmortgagepayment.
Aswell,we’velearnedthatnoteverycustomerwhocanaffordtocontinuetoliveinhisorherhomewantstodoso.Inthesesituations,thebestsolutionisforustohelpthatcustomergetoutoftheirexistinghomethroughashortsaleordeedinlieu.Inordertofacilitatethesesolutions,weoftenofferrelocationassistancetoanotherresidence.
Inadditiontotheabovethreereasons,italsomustbesaidthatsomepeopleknowinglymisrepresentedfactsontheirmortgageapplications.Forexample,theyoverstatedincomeorwerepurchasingrealestateforinvestmentratherthanasaresidence.Thosepeoplehurtthesystemforeveryone.Andwearetryinghardtoensuresuchindividualsdon’treceiveassistancethatshouldgotohomeownerswhotrulyarestrugglingandaretryingtostayintheirhomes.
What steps has JPMorgan Chase taken to help troubled borrowers?
Wehavecommittedsignificantresources,includingadding6,400peopleandreas-signing2,600currentstaff,tohelpwithtroubledborrowers.Wealsohaveopened51ChaseHomeownershipCentersacrossthecountrytoofferface-to-facecoun-seling,andweplantoopen30morebytheendof2011.Wehaveassistedmorethan120,000customersthroughthesecenterstodate.Wealsohostlarge-scaleborroweroutreacheventsandhaveseenmorethan60,000homeownersthroughtheseevents.
Thereisnoquestionthatthemortgagemarkethasbeenthroughaverypainfulperiodforeveryoneoverthepastfewyears.Weareseeingsignsofarecoveryinsomepartsofthecountryandareeagertoputtheforeclosureproblemsbehindallofus.Wewanttodoourparttogettheeconomymovingagain.
39

40
Chase’s recently introduced propri-etary products and features are targeted at vital, profitable segments of the consumer market. Chase FreedomSM, which targets savvy rewards-oriented consumers; Chase SapphireSM, targeting the affluent market; InkSM from Chase, aimed at business card users; Chase BlueprintSM, which helps consumers take charge of their finances; and our Ultimate RewardsSM program all have shown encouraging early success, with customers using our products for more of their spending.
Even after several challenging years, I never have been more confident about the outlook for Card Services. As we work to help customers manage (and not become overwhelmed by) their personal finances, Card Services enters 2011 in a strong position as credit markets improve and as we strive to make our offerings ever more indispensable.
In 2010, Chase Card Services made strong progress in positioning its business for the future, as we gained customers and increased market share of consumer payments. As we enter 2011, more customers are using our products than at any time in history.
The strength of JPMorgan Chase gave Card Services the ability, during the worst three years in the credit card industry’s history, to make bold investments across its portfolio: innovative new products, such as our suite of resources for business card holders; a broader-based rewards platform than any other card provider; and ground-breaking services that directly respond to consumer needs. These products and services enable us to build strong and enduring relation-ships with Chase cardmembers, who not only see everyday value in our offerings but also depend on us to help them make progress toward their goals.
2010 Results: Sales and Market Share Up amid Product GrowthCard Services ended 2010 with improvements in several key areas across all customer segments. Net income was $2.1 billion compared with a net loss of $2.2 billion in 2009. The improved results were driven by a lower provision for credit losses, partially offset by lower net revenue. Sales volume for 2010, excluding the Washington Mutual (WaMu) portfolio, was $302 billion – a record high and a measure that shows customers are using our products more frequently for their daily needs.
Beginning in 2008, which was the year the financial crisis began, we have consistently gained sales market share for Chase card products. We have gained 234 basis points of market share over those three years, which is 74 basis points more than our closest
“As we enter 2011, more customers are using our products than at any time in history.”
Card Services

41
• Attainedrecordhighsalesvolumeof$302billion(excludingWaMu)
• Attainedrecordhightransactionvolumeof4billion(excludingWaMu)
• Increasedmarketshareofsalesby234basispointsfrom2008through2010(excludingWaMu)
• Added11.3millionnewVisa,MasterCardandprivatelabelcreditcardaccounts
• Processed20.5billiontransac-tionsthroughChasePaymentech,agloballeaderinpaymentproc-essingandmerchantacquiring
• Chasebranchnetworkcontinuedtogenerateapproximately1.5millionnewcardaccountsandmorethan40%ofrevenuefromnewmerchantsforChasePaymentech
• Launched,withHyattHotels,theglobalhospitalitycompany’sfirst-everrewardscreditcard
2010 Highlights and Accomplishments
competitor. Chase’s card products are winning in the marketplace and are gaining share across key customer segments.
We continued to streamline our co-brand partnerships, from some 200 in 2008 to approximately 80 in 2010, focused exclusively on aligning Chase with some of the world’s best brands, such as Hyatt Hotels and Ritz-Carlton.
Our credit line management strategy has helped improve credit loss trends, as we have closed inac-tive accounts, removing approxi-mately $50 billion of unused credit lines since 2008; lowered credit lines for high-risk customers; and reduced average credit lines for new accounts. We’ve changed our approach to risk assessment, looking at customers’ debt-to-income and total bankcard debt, as well as their FICO score.
2011 Priorities: Benefiting from Customer Relationships as Consumer Markets ImproveLooking ahead, we continue to be concerned about elevated unem-ployment levels, an uncertain regulatory environment and the ever-present challenges of driving growth. However, our new products and services are providing plenty of reasons for our customers to use Chase for everyday spending, and we believe growth will come through delivering the best customer service in our industry. In light of this, I have reaffirmed our 20% return on equity target on reduced equity of $13 billion.
A key part of our growth strategy is launching premier products and rewards programs in partnership with brands known worldwide for best-in-class service and value to our joint customers.
To make every interaction an outstanding one, we’re looking at every policy, practice, communi-cation and conversation through
the customers’ eyes. This customer filter is in place throughout our organization, from our Treating Customers Fairly principles; to our new Consumer Practices orga-nization, charged with ensuring that all our marketing promises are clear, simple and transparent; to customer treatment strategies focused on individual needs; to employee accountability for imme-diately raising issues that affect the customer experience.
Chase Card Services is excited about the momentum we are building. As evidenced by our sales share gains, the response from our customers to our new products and services has been terrific. Our busi-ness is well positioned to continue to gain profitable market share.
Gordon Smith CEO, Card Services
230
240
250
260
270
280
290
300
$ 310
20102009200820072006
$257
$281
$293
$279
$302
3.4
3.1
3.63.7
4.0
3.0
3.5
4.0
4.5
5.0
Sales volume, excluding WaMu (dollars in billions)
Sales transactions, excluding WaMu (in billions)
Note: Sales data exclude cash advances and balance transfers
Sale
s vo
lum
e
Sale
s tr
ansa
ctio
ns
Sales Volume and Transactions Hit Record Levels in 2010
•
•••
•
Sales Volume and Transactions Hit Record Levels in 2010

42
2010 Results: Record Earnings amid Strong Cross-Sell and Reduction in Nonaccruing AssetsFor Commercial Banking, 2010 proved to be another year of excep-tional performance. By staying true to our steadfast discipline in client selection and actively managing our risk, we delivered record revenue of $6 billion, record earnings of $2.1 billion and an ROE of 26%. We also continued to diligently manage expenses – up only 1% from 2009 – resulting in operating margin growth of 8% and a best-in-class overhead ratio of 36%.
This year, our clients generated record gross Investment Banking revenue, up 15% from 2009 to $1.3 billion. This partnership accounted for almost a quarter of the firm’s domestic IB fees in 2010. There’s still room left to grow, and we are working closely with our IB partners to actively identify new opportunities.
In 2010, we lowered nonaccrual loans by nearly 30% through an aggressive reduction in troubled assets. Charge-offs remained somewhat elevated, at 0.94% of total loans, but were significantly below their 2009 peak of
During my 32 years in the industry, I never have been more proud and excited to be a JPMorgan Chase commercial banker. Our business has achieved transformational growth since 2005, the year following the JPMorgan Chase and Bank One merger. In this time, we grew revenue by 73%, loans by 102% and liabilities by 110%, and we more than doubled our operating margin and earnings. We also have expanded our geographic footprint and now operate across 28 states and in more than 115 of the largest cities in the United States and Canada.
Dedicated client service and person-alized local banker coverage are fundamental to our banking model. Our client turnover is minimal, and our average client relationship tenor is greater than 14 years. Although our relationships are local, we rely on the global reach of JPMorgan Chase’s lending, Treasury Services, Investment Banking (IB) and Asset Management businesses. This part-nership across our businesses results in very strong cross-sell, and, on average, our clients use more than eight products per relationship.
1.02%. Even through the most chal-lenging period of the financial crisis, Commercial Banking maintained a fortress balance sheet with strong reserve levels. We ended 2010 with more than $2.5 billion reserved for loan losses, or 2.61% of ending loan balances. As we enter 2011, credit costs are approaching normalized levels.
At JPMorgan Chase, we are proud members of the communities we serve and are committed to strengthening the economy. I always am surprised when people say banks aren’t lending to small businesses. In fact, companies with annual revenue of $50 million or less represent nearly 70% of our middle market client base. This year alone, we extended $92 billion in new financing across our businesses, including over $9 billion to more than 600 government entities, not-for-profit organizations, healthcare companies and educational institu-tions. Additionally, we recently intro-duced a program called Lending Our Strength, a financing initiative specif-ically designed to support our clients’ growth by offering flexible structures and terms for the purchase of equip-ment and owner-occupied real estate.
Commercial Banking
“ Even more than the sheer size of our client base, I take pride in our focus on building long-term relationships.”

43
Through our Community Devel-opment Banking group, we also committed nearly $1.5 billion to create and retain more than 12,000 units of affordable housing for low- and moderate-income families.
2011 Priorities: U.S. and Global Market Expansions and an Even Higher Cross-Sell Target While we are pleased with our track record of strong performance, we are even more enthusiastic about what lies ahead. We are actively pursuing four key areas of growth:
U.S. Market Expansion – Cali-fornia, Washington, Oregon, Florida and Georgia represent attractive new growth markets for us. With over 250 dedicated resources in place, this expansion is well under way and has the potential to generate more than $1 billion in additional revenue for Commer-cial Banking. We also have over 40 commercial bankers covering key markets outside our branch footprint, including Philadelphia, Boston, Washington D.C., St. Louis and Minneapolis.
International Growth – As U.S. companies increase global commerce, serving their commercial banking needs has become a key differentiator that sets us apart from the competition. Since 2005, we have added more than 1,400 clients outside the United States and will continue to increase our office and branch locations around the world as our customers expand their reach.
Investment Banking – Six years ago, we set a target of $1 billion in revenue from IB products sold to commercial clients. Since that time, we have more than doubled this revenue, achieving $1.3 billion in gross IB revenue in 2010. We are confident that we will continue to gain share and have set a new goal of $2 billion in gross IB revenue within the next five years.
Commercial Real Estate – Finally, we are seeing improved opportuni-ties in each of our three real estate businesses: Commercial Term Lending, Real Estate Banking and Community Development Banking. Through the most recent cycle of market stress, we significantly
outperformed our peers, giving us the confidence and resolve to capi-talize on future real estate demand. As we move forward, we will dili-gently maintain our conservative underwriting approach and prudent risk management so that we are able to grow our real estate portfolios responsibly as the market recovers.
As I look back over the last few years, I am very pleased with Commercial Banking’s progress since the merger. Together, we have achieved an unpar-alleled combination of competitive advantages: exceptional people, critical branch footprint, product and service superiority, capital strength and large scale. All our accomplishments, both past and present, not only validate our status as an industry leader but also position us to continue to meet the needs of our clients and grow our business well into the future.
Todd Maclin CEO, Commercial Banking
2010 Highlights and Accomplishments
• Retainedtop3leadershippositionnationallyinmarketpenetrationandleadshare(a)
• Maintainedourrankingasthenation’s#1multifamilylender(b)andimprovedourrankingtobecomethenation’s#2largemiddlemarketlender(c)
• Achievedthe#1returnonequityinourpeergroupat26%
• Producedrecordrevenueof$6billionandrecordnetincomethroughcontinuedfocusonlong-termperformance
• Continuedtobealeaderinasset-basedlendingbyclosingmorethan$3billioninloans
• Deliveredarecord$1.3billioningrossInvestmentBankingrevenue
• Increasednewandrenewedlendingtomiddlemarketcompanies
• Continuedtooutperformpeersincreditqualitywiththelowestnetcharge-offratio
• Maintainedthelowestloan-to-depositratio—onlybankunder100%
• Demonstratedourcommitmenttosupportingcommunitiesbyextendingmorethan$9billiontoover600government,not-for-profit,healthcareandeducationalinstitutions
• Addedmorethan1,500newmiddlemarketclientsandgrewourinternationalbusinessbyaddingnearly500newclientsoverseas
• Acquiredahighlyperformingandimmediatelyaccretive$3.5billionmultifamilyloanportfoliofromCitibank
• Committednearly$1.5billiontocreateandretainmorethan12,000unitsofaffordablehousinginover100U.S.cities
(a)GreenwichMarketStudy,2010(b)FederalDepositInsuranceCorporation,12/31/10(c)ThomsonReuters,2010
Gross Investment Banking Revenue(inmillions)
200
0
400
600
800
1,000
2005 2010
1,200
$1,400
$552
$1,335
142%

44
Across the industry, treasury and securities servicing are attractive businesses with strong fundamental characteristics. They provide stable earnings with excellent margins and high returns on capital. They also grow as global economies grow, trade activity increases and clients’ activi-ties in international markets expand. And such businesses are hard to repli-cate: Success requires scale of invest-ment in people, systems and services. Having made the necessary invest-ment, TSS is a leader in each of our businesses and one of the very few firms with the financial strength and resources to maintain that leadership.
That said, we have work to do. Given TSS’ intrinsic strengths, our perfor-mance is not where it has the poten-tial to be. The TSS leadership team is highly focused on closing this gap between the quality of our business and the financial results we deliver. We will do so by improving our operating margins through increased efficiency and product innovation; benefiting, where possible, from higher interest-rate environments; and, most critically, extending our higher-margin international business.
During the six years that I had the privilege of serving as JPMorgan Chase’s Chief Financial Officer, I gained perspective on all the firm’s businesses. Treasury & Securities Services (TSS) is notable not only for its inherently attrac-tive business characteristics but also for its global potential.
TSS has tremendous capacity for profitable overseas growth like the firm’s other international wholesale businesses – Investment Banking and Asset Management. That potential resides in both of TSS’ operating units: Treasury Services (TS), comprising cash manage-ment, payments and receivables, liquidity management and trade finance; and Worldwide Securities Services (WSS), comprising asset custody and administration.
Now that I have the equally great privilege of serving as CEO of TSS, I would like to talk about the strengths of this business and discuss how we are going to realize its potential.
2010 Results: Volume Up and Revenue Flat, with Strategic Investment for the FutureTSS reported 2010 net income of $1.1 billion, down from $1.2 billion in 2009. Revenue was flat, at $7.4 billion, as spreads remained low and securities lending revenue fell by 30%. Expenses rose on higher business volume and investment in global expansion.
Revenue was roughly even between TS and WSS, each at approximately $3.7 billion. Just under half of total TSS revenue was generated outside the United States.
Despite the challenging market envi-ronment, there was strong growth in the underlying revenue drivers for both operating units. In WSS, assets under custody grew 8% to $16.1 trillion. In TS, deposits or liability balances totaled $169.2 billion, 5% higher than in 2009.
To support growth initiatives, we invested heavily in 2010 in our people, products and infrastructure, fueling a 6% rise in expense. Most notably, we hired nearly 150 new sales and relationship managers around the world, bringing our total to nearly 1,100 globally, and we increased tech-nology expenditures by 23%.
Treasury & Securities Services
“ Treasury & Securities Services is notable not only for its inherently attractive business characteristics but also for its global potential.”

45
• Serveworld-classclientsinmorethan140countriesandterritories:
—80%ofGlobalFortune500companies
—Top25banksintheworldandnineoutof10largestcentralbanks
—68%oftop50globalassetmanagersand25%oftop300globalpensionfunds
• WSSranked#2inassetsundercustodywith$16.1trillion,servingclientsin90+markets,withdirectcustodyinsevenmarketsandclearingon40+exchangesand57over-the-countermarkets
• Processedapproximately$10trillionofdailycashtransfers
• OpenednewrepresentativeofficesinBangladesh,AbuDhabi,andGuernsey
2010 Highlights and Accomplishments
2011 Priorities: Primed to Capture Growth GloballyWe expect to increase earnings over the next few years as we reach our operating margin target of 35%, a considerable step up from 2010’s margin of 23%. Some of that improvement will come as interest rates normalize, boosting our net interest income and fees; and some will result from improved operating efficiency and upgraded product offerings.
The area of greatest potential, however, is our international busi-ness. As our clients expand rapidly into new markets around the world, they need local access to the oper-ating services TSS provides. We are investing in our firm-wide network so we can be where our clients are, serving them seamlessly as they expand geographically.
The accelerating globalization of our clients was a key impetus for the recently launched J.P. Morgan Global Corporate Bank (GCB), which serves current and prospec-tive wholesale clients in nearly every major world market. In tandem with the GCB initiative, we are aggressively expanding the international capabilities of the TS unit. Over the next three years, we will add approximately 20 loca-tions outside the United States, primarily in emerging markets, and we will have hired approximately 200 new corporate bankers since the end of 2009. This investment is critical to support companies based in emerging economies that are expanding into developed inter-national markets, as well as global corporations moving into new markets and emerging economies.
In TSS’ other operating unit, WSS, approximately 60% of revenue already comes from outside the United States, with client service and relation-
• Launchedfirst-everHongKongDepositaryReceiptlistingontheHongKongStockExchangeforBrazilianminingcompanyVale,S.A.
• Earnedmorethan100industryawardsandtoprankings,including:
—#1clearerofU.S.dollarsintheworld,withmorethan20%marketshare
—#1inAutomatedClearingHouseoriginationsforthelastthreedecades
—GlobalFinancialSupplyChainBankoftheYear(thirdconsecutiveyear), Treasury
Management International,2011
—BestTransactionBankingBusinessinAsiaPacific, The Asian Banker
—BestTradeBankintheWorld,Trade & Forfaiting Review
—FundAdministratoroftheYear,Global Investor
—EuropeanSecuritiesServicesandCustodianoftheYear, International Custody & Fund
Administration
• InitiatedaGoGreencampaignwithmorethan10,000clients,whichhaseliminatedover141milliondocuments—theequiva-lentof4millionpoundsofpaper,47,000treesor69millionpoundsofgreenhousegases
ship management functions in 30 markets. WSS will continue to grow by deepening our service coverage, strengthening client relationships and expanding its local capabilities to serve our clients as they extend their asset management activities around the world. Further growth will occur as capital markets in emerging econo-mies continue to open and develop.
I am confident and excited about the future of TSS. We have the resources, capital and opportunities to grow. Improving economic fundamentals – combined with the higher revenue we expect from our international expansion and lower investment spending as our strategic initiatives are completed – position us very well for the next stage of growth.
Mike Cavanagh CEO, Treasury & Securities Services
Trade Loans Up $11.0 Billion(inbillions)
0
5
10
15
20
25
0
5
10
15
20
$25
0
5
10
15
$20
0
100
200
300
400
500
600
700
$800
$316
$7.9
2009
$691
$15.6
$10.2
$21.2
2010 2009 2010
J.P. Morgan
Industry Average
Trade loans are up $8.2 billion or 102%
107%

46
ment, Highbridge and Gávea fran-chises, we count among us many of the world’s top portfolio managers, research analysts, traders and client advisors. They invest in a full range of stock and bond strategies, as well as offer a comprehensive range of investments from leading hedge fund, private equity and real estate managers. With this broader plat-form, we are better able to serve an increasingly sophisticated and engaged client base.
2010: A Record YearDespite sweeping regulatory changes to our industry during the past year, little has changed in the way we conduct our investment businesses. In 2010, we continued our tradition of client and shareholder focus and delivered record revenue of nearly $9 billion, up from almost $8 billion in 2009. Net income rose 20% to $1.7 billion, our highest annual earnings in three years, with return on equity of 26% and a healthy margin of 31%. These results were produced while continuing to invest in our people, systems and risk management; improving our operations; and leading the industry in developing best-in-class legal and compliance practices.
When I joined J.P. Morgan Asset Management in 1996, it was a much different business. We managed $179 billion of assets, generating about $1 billion in revenue for the firm. Of our few thousand clients, most were very large institutions and ultra-high-net- worth individuals that were invested primarily in stocks and bonds.
Fifteen years later, by virtually any measure, Asset Management has become one of the leading global money managers and private banks, serving individuals, institutions, pension funds, endowments, founda-tions, central banks and sovereign entities globally.
Today, we have $1.3 trillion in assets under management (AUM) and $1.8 trillion in assets under supervision. Our revenue has grown to nearly $9 billion. We now deliver our products and services locally through more than 200 offices around the world to over 7,000 institutions and more than 5 million individuals.
Through our J.P. Morgan Private Bank, Private Wealth Management, J.P. Morgan Securities, J.P. Morgan Asset Management, JF Asset Manage-
After the 2008 financial crisis, we saw tremendous cash inflows into our firm as part of a “flight to quality” from many places in the world. As risk appetite began to rebound, clients – many of them new to our firm – diversified into solutions across our platform, driving our long-term net new AUM flows to a record $69 billion and the highest levels of total AUM ($1.3 trillion) in our history. We continue to attract new assets in many of these areas because of our strong long-term investment performance, with 80% of our funds ranking in the top two quartiles in the industry over a five-year period.(a)
While our primary goal is to be the most respected asset manager – not the biggest – our business cannot be successful without continuous invest-ment in talented new professionals. In Private Banking, we grew our client advisor team by 15% globally and 32% outside the United States. In our Global Institutional and Sover-eigns businesses, we strengthened our senior sales management by putting top talent in key leadership positions.
Asset Management
“ Our success ultimately is measured by our ability to generate superior risk-adjusted returns for our clients over the long term and across business cycles.”
(a) QuartilerankingsourcedfromLipperfortheU.S.and Taiwan;MorningstarfortheU.K.,Luxembourg,France andHongKong;andNomuraforJapan

47
• Third,wehavetocontinuetoinvestin local delivery of our products and services to the myriad markets we serve, especially in our under-penetrated international markets.
Throughout our more than 175 years of constant evolution and expan-sion, what never has changed is our commitment to delivering “first-class business in a first-class way.” Whether we are investing assets, providing trust and estate services or lending money, we take our responsibility to clients very seri-ously. Clients come to us because we deliver best-in-class investment management. But clients stay with us because they trust we always will uphold our obligations to them.
We look forward to continuing to invest in the best people and tech-nology to provide superior invest-ment advice to our clients around the world for generations to come. Mary Callahan Erdoes CEO, Asset Management
• #1inU.S.RealEstateEquityandInfrastructure, Pensions &
Investments
• Second-largestmanagerofabsolutereturnstrategies, Absolute Return
• Second-largestrecipientoflong-termU.S.mutualfundflowsintheindustry,Strategic Insight
• AssetManagementCompanyoftheYearinAsiaandHongKong,The Asset
• GoldStandardAwardforFundsManagementintheUnitedKingdomforeighthyearinarow,IncisiveMedia
• LeadingPan-EuropeanFundMan-agementFirm,ThomsonReuters
• 3,500+netnewclientsaddedtoPrivateBankingin2010
• 453front-facingclientprofession-alshiredaroundtheworld—themostever
• InstitutionalHedgeFundManageroftheYear(Highbridge), Institutional Investor
• U.S.LargeCapCorePMTomLuddynamedMoneyManageroftheYear, Institutional Investor
2010 Highlights and Accomplishments
In retail distribution, we increased our sales teams by 20% across the United States; Europe, Middle East and Africa; and Asia Pacific.
Finally, in the investment arena, as part of our commitment to increasing local coverage in important emerging markets, we purchased a majority stake in Gávea Investimentos, a leading alternative investments company in Brazil run by Arminio Fraga, former presi-dent of the Central Bank of Brazil. Through its hedge funds, private equity and longer-term investments, and wealth management services, Gávea invests across both emerging and broader international markets, with a macroeconomic, research- intensive investment process.
This transaction was particularly important as our clients are increas-ingly looking to access Brazil’s rapidly growing economy. Together with Gávea, we now can provide our clients with a powerful combination of local emerging markets expertise and a global platform. We’ve had the pleasure of getting to know Arminio over the last decade as he’s served
on J.P. Morgan’s International Council. During that time, I’ve seen firsthand the unique perspective he and his team bring to investment decisions in Brazil, as well as the government expe-rience the team applies to macroinvest-ment decisions. I’m thrilled that our clients globally now are able to benefit from Gávea’s investment expertise.
Strategic Priorities for 2011 Our success ultimately is measured by our ability to generate superior risk-adjusted returns for our clients over the long term and across busi-ness cycles. With very strong and consistent investment performance across most products, our priorities are focused on three areas that will further strengthen our leadership:
• First,wemustmaintainourstrong investment performance in existing products and improve any areas of underperformance.
• Second,weneedtocontinuetomaintain our leadership position in innovation of new products and bring creative ideas quickly to market, espe-cially in an increasingly global and interconnected environment.
0
500
1000
1500
2000
0
500
20102005
Institutional Retail Private Banking
1-year basis
3-year basis
5-year basis
Total assets under management in 1st/2nd quartiles
1,000$420
$245
$484
$687
$422
$731
$1,149
$1,840
1,500
$2,00080%
70
60
50
40
30
20
$ 2,000
CAGR: 10%Five-Year GrowthRate: 60%
Assets Under Supervision — 2005 to 2010
(in billions)
Global Mutual Fund Performance Metrics
(percentage)
0
10
20
30
40
50
60
70
80
+10% +10%
+6%
2009
2010
2009
2010
2009
2010
0
500
1000
1500
2000
0
500
20102005
Institutional Retail Private Banking
1-year basis
3-year basis
5-year basis
Total assets under management in 1st/2nd quartiles
1,000$420
$245
$484
$687
$422
$731
$1,149
$1,840
1,500
$2,00080%
70
60
50
40
30
20
$ 2,000
CAGR: 10%
Five-Year GrowthRate: 60%
Assets Under Supervision — 2005 to 2010
(in billions)
Global Mutual Fund Performance Metrics
(percentage)
0
10
20
30
40
50
60
70
80
+10% +10%
+6%
2009
2010
2009
2010
2009
2010
Assets under Supervision — 2005 to 2010(inbillions)
Global Mutual FundPerformance Metrics(percentage)

48
• Launchedaseriesofprogramstohelpournation’sveteransmanagetheirfinancialneeds.Initiatedassistanceprogramstoeducate,employandprovidehomestomilitarymembersandveterans.Forinstance,wecom-mittedtodonate1,000homestoourveteransoverthenextfiveyears.WehavepartneredwithSyracuseUniversitytoprovideatechnologycertificatetoveteransseekingatechnologycareerandformedanalliancewith10majorcorporateemployerstocommittohiringatleast100,000veteransby2020.Inaddition,weoffercareer,work-life,disabilityandchildcareservicestoouremploy-eestransitioningbacktoworkaftermilitaryservice.
• Providedmorethan$3billioninLow-IncomeHousingTaxCreditsandothercommunitydevelopmentloansandinvestmentstopreserveorconstructmorethan28,000unitsofaffordablehousing.
• Stayedontracktomeetour20%greenhousegasreductiontarget.Offset140,000metrictonsofemissionsfromemployeeairtravelwithcarboncredits.Increasedthenumberofbranchesbuilttosmartandresponsibleconstructionpracticesto198,including13LEED-certifiedbranch-essince2008.Continuedourfocusonprocuringpaperfromcertifiedresponsiblymanagedsources,raisingtheproportionfrom70%oftotalvolumetonearly90%,andcontinuedeffortstoeliminatepaperstatements.
• Reviewed245financialtransactionsinanefforttomitigateadverseenvironmentalandsocialimpacts.
• Investedmorethan$190million*inourcommunities,includingcontributionsfromtheJPMorganChaseFoundation,supportingprogramsfocusedtowardcom-munitydevelopment,qualityeducationandaccesstothearts.
• Engagedmorethan2.5millionFacebookusersintheinnovative,philanthropiccrowd-sourcingpro-gram,ChaseCommunityGiving.Theprogramdirected$10milliontosmallandgrassrootscharitiesacrosstheUnitedStates.
• HelpedbringprivatesectortalenttothemicrofinancesectorthroughpartnershipwithGrameenFoundation’sBankerswithoutBorders®.Coordinatedtrainingfornot-for-profitsonestablishingfor-profitprivateequityfundsandhostedacapitalmarketsleader-shipconferenceforwomenbank-ers.Employee-drivenphilanthropyprogramsspanfivecontinentsandadvocatesforcausessuchaschil-dren’swellness,cancerresearchandenvironmentalpreservation.
• Providednearly275,000hoursofvolunteerservicebyemployeesthroughtheGoodWorksprograminlocalcommunities.
• Committed$15millionininvestmentsinsocialventureandmicro-insurancefundsinLatinAmerica,AfricaandAsia.OurSocialFinancebusinesstargetsinvestmentsthatgeneratesocialandfinancialreturns.
• ProvidedFeedingAmericawithitslargestone-timecorporategift,helpingittoprovide40millionadditionalmealstohungryfamilieswith34newrefrigeratedtrucksandoperationalsupportto19FeedingAmericafoodbanksin13states.
• Donated$3.5milliontosupporttheexpansionofJobAct®,auniqueskillsdevelopmentandyouthemploymentinitiativeinGermany.JobAct®helpslong-termunem-ployedyouthenterthejobmarketorpursuefurthereducation.
• Continuedourcommitmenttoannuallyspendmorethan$1billionwithdiversesuppliers.
2010 Highlights and Accomplishments
0
100
200
300
400
500
600
700
$800
0
100
200
300
400
500
600
700
800
Community Development $77,405 40%Arts & Culture $15,499 8%Education $67,111 35%Employee Programs $7,267 4%Other $25,384 13%Total $192,666 100%
41%
8%
35%
12%
4%
$572
2009
$652
2010
$491
2008
$335
2007
$234
2006
$154
2005
$70
2004
Chase is on track to deliver on its 10-year, $800 billion pledge of
investment in low- and moderate-income communities. Seven years
into the pledge, we already have invested more than $650 billion. (in billions)
At JPMorgan Chase, corporate responsibility is a part of how we do what we do every day for customers and the communities we serve. We are committed to responsibly managing our businesses in a manner that creates value for our consumer, small business and corporate clients, as well as our shareholders, communities and employees.
2010 Charitable Contributions*
*ContributionsincludecharitablegivingfromJPMorganChase&Co.andtheJPMorganChaseFoundation,andthisgivingisinclusiveof$41.8millioningrantstoCommunityDevelopmentFinancialInstitutions.
0
100
200
300
400
500
600
700
$800
0
100
200
300
400
500
600
700
800
Community Development $77,405 40%Arts & Culture $15,499 8%Education $67,111 35%Employee Programs $7,267 4%Other $25,384 13%Total $192,666 100%
41%
8%
35%
12%
4%
$572
2009
$652
2010
$491
2008
$335
2007
$234
2006
$154
2005
$70
2004
Artsandculture
Education
Communitydevelopment
Other
Employeeprograms
Corporate Responsibility

Table of contents
JPMorgan Chase & Co./2010 Annual Report 51
Financial:
52 Five-Year Summary of Consolidated Financial Highlights
53 Five-Year Stock Performance
Management’s discussion and analysis:
54 Introduction
55 Executive Overview
59 Consolidated Results of Operations
64 Explanation and Reconciliation of the Firm’s Use of Non-GAAP Financial Measures
67 Business Segment Results
91 International Operations
92 Balance Sheet Analysis
95 Off–Balance Sheet Arrangements and Contractual Cash Obligations
102 Capital Management
107 Risk Management
110 Liquidity Risk Management
116 Credit Risk Management
142 Market Risk Management
147 Private Equity Risk Management
147 Operational Risk Management
148 Reputation and Fiduciary Risk Management
149 Critical Accounting Estimates Used by the Firm
155 Accounting and Reporting Developments
156 Nonexchange-Traded Commodity Derivative Contracts at Fair Value
157 Forward-Looking Statements
Audited financial statements:
158 Management’s Report on Internal Control Over Financial Reporting
159 Report of Independent Registered Public Accounting Firm
160 Consolidated Financial Statements
164 Notes to Consolidated Financial Statements
Supplementary information:
295 Selected Quarterly Financial Data
297 Selected Annual Financial Data
299 Short-term and other borrowed funds
300 Glossary of Terms
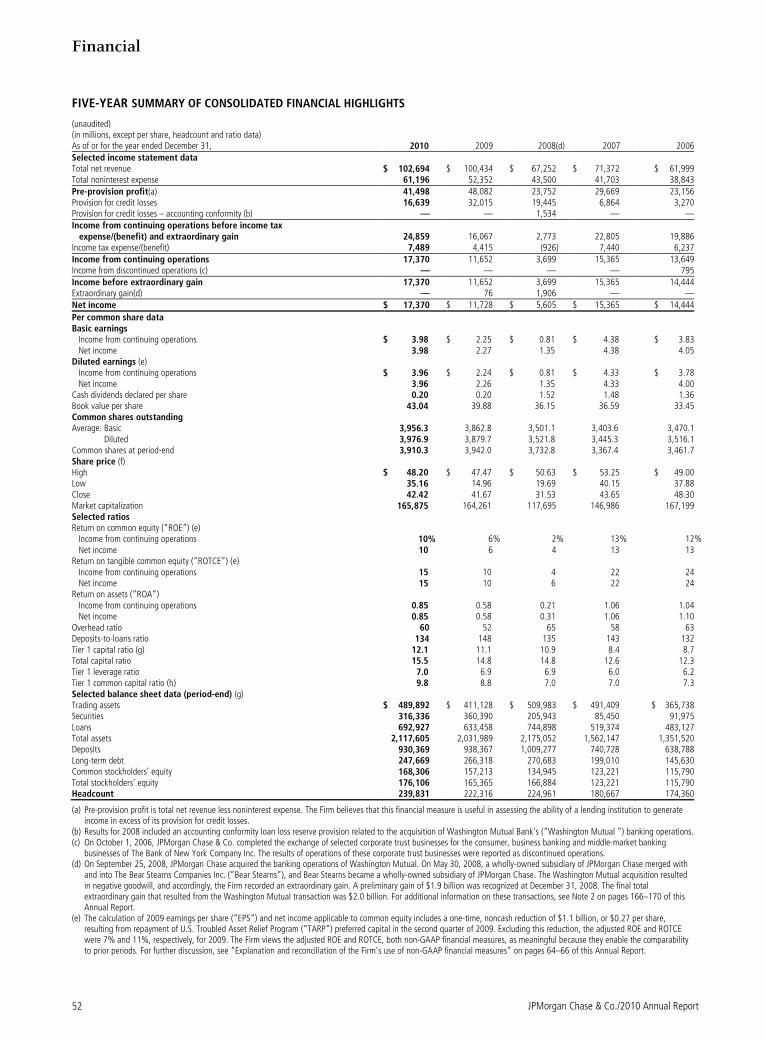
Financial
JPMorgan Chase & Co./2010 Annual Report 52
FIVE-YEAR SUMMARY OF CONSOLIDATED FINANCIAL HIGHLIGHTS
(unaudited) (in millions, except per share, headcount and ratio data) As of or for the year ended December 31, 2010 2009 2008(d) 2007 2006
Selected income statement data Total net revenue $ 102,694 $ 100,434 $ 67,252 $ 71,372 $ 61,999 Total noninterest expense 61,196 52,352 43,500 41,703 38,843
Pre-provision profit(a) 41,498 48,082 23,752 29,669 23,156 Provision for credit losses 16,639 32,015 19,445 6,864 3,270 Provision for credit losses – accounting conformity (b) — — 1,534 — —
Income from continuing operations before income tax expense/(benefit) and extraordinary gain 24,859 16,067 2,773 22,805 19,886
Income tax expense/(benefit) 7,489 4,415 (926) 7,440 6,237
Income from continuing operations 17,370 11,652 3,699 15,365 13,649 Income from discontinued operations (c) — — — — 795
Income before extraordinary gain 17,370 11,652 3,699 15,365 14,444 Extraordinary gain(d) — 76 1,906 — —
Net income $ 17,370 $ 11,728 $ 5,605 $ 15,365 $ 14,444
Per common share data Basic earnings Income from continuing operations $ 3.98 $ 2.25 $ 0.81 $ 4.38 $ 3.83 Net income 3.98 2.27 1.35 4.38 4.05 Diluted earnings (e) Income from continuing operations $ 3.96 $ 2.24 $ 0.81 $ 4.33 $ 3.78 Net income 3.96 2.26 1.35 4.33 4.00 Cash dividends declared per share 0.20 0.20 1.52 1.48 1.36 Book value per share 43.04 39.88 36.15 36.59 33.45 Common shares outstanding Average: Basic 3,956.3 3,862.8 3,501.1 3,403.6 3,470.1 Diluted 3,976.9 3,879.7 3,521.8 3,445.3 3,516.1 Common shares at period-end 3,910.3 3,942.0 3,732.8 3,367.4 3,461.7 Share price (f) High $ 48.20 $ 47.47 $ 50.63 $ 53.25 $ 49.00 Low 35.16 14.96 19.69 40.15 37.88 Close 42.42 41.67 31.53 43.65 48.30 Market capitalization 165,875 164,261 117,695 146,986 167,199 Selected ratios Return on common equity (“ROE”) (e) Income from continuing operations 10% 6% 2% 13% 12 % Net income 10 6 4 13 13 Return on tangible common equity (“ROTCE”) (e) Income from continuing operations 15 10 4 22 24 Net income 15 10 6 22 24 Return on assets (“ROA”) Income from continuing operations 0.85 0.58 0.21 1.06 1.04 Net income 0.85 0.58 0.31 1.06 1.10 Overhead ratio 60 52 65 58 63 Deposits-to-loans ratio 134 148 135 143 132 Tier 1 capital ratio (g) 12.1 11.1 10.9 8.4 8.7 Total capital ratio 15.5 14.8 14.8 12.6 12.3 Tier 1 leverage ratio 7.0 6.9 6.9 6.0 6.2 Tier 1 common capital ratio (h) 9.8 8.8 7.0 7.0 7.3 Selected balance sheet data (period-end) (g) Trading assets $ 489,892 $ 411,128 $ 509,983 $ 491,409 $ 365,738 Securities 316,336 360,390 205,943 85,450 91,975 Loans 692,927 633,458 744,898 519,374 483,127 Total assets 2,117,605 2,031,989 2,175,052 1,562,147 1,351,520 Deposits 930,369 938,367 1,009,277 740,728 638,788 Long-term debt 247,669 266,318 270,683 199,010 145,630 Common stockholders’ equity 168,306 157,213 134,945 123,221 115,790 Total stockholders’ equity 176,106 165,365 166,884 123,221 115,790 Headcount 239,831 222,316 224,961 180,667 174,360
(a) Pre-provision profit is total net revenue less noninterest expense. The Firm believes that this financial measure is useful in assessing the ability of a lending institution to generate income in excess of its provision for credit losses.
(b) Results for 2008 included an accounting conformity loan loss reserve provision related to the acquisition of Washington Mutual Bank’s (“Washington Mutual “) banking operations. (c) On October 1, 2006, JPMorgan Chase & Co. completed the exchange of selected corporate trust businesses for the consumer, business banking and middle-market banking
businesses of The Bank of New York Company Inc. The results of operations of these corporate trust businesses were reported as discontinued operations. (d) On September 25, 2008, JPMorgan Chase acquired the banking operations of Washington Mutual. On May 30, 2008, a wholly-owned subsidiary of JPMorgan Chase merged with
and into The Bear Stearns Companies Inc. (“Bear Stearns”), and Bear Stearns became a wholly-owned subsidiary of JPMorgan Chase. The Washington Mutual acquisition resulted in negative goodwill, and accordingly, the Firm recorded an extraordinary gain. A preliminary gain of $1.9 billion was recognized at December 31, 2008. The final total extraordinary gain that resulted from the Washington Mutual transaction was $2.0 billion. For additional information on these transactions, see Note 2 on pages 166–170 of this Annual Report.
(e) The calculation of 2009 earnings per share (“EPS”) and net income applicable to common equity includes a one-time, noncash reduction of $1.1 billion, or $0.27 per share, resulting from repayment of U.S. Troubled Asset Relief Program (“TARP”) preferred capital in the second quarter of 2009. Excluding this reduction, the adjusted ROE and ROTCE were 7% and 11%, respectively, for 2009. The Firm views the adjusted ROE and ROTCE, both non-GAAP financial measures, as meaningful because they enable the comparability to prior periods. For further discussion, see “Explanation and reconciliation of the Firm’s use of non-GAAP financial measures” on pages 64–66 of this Annual Report.
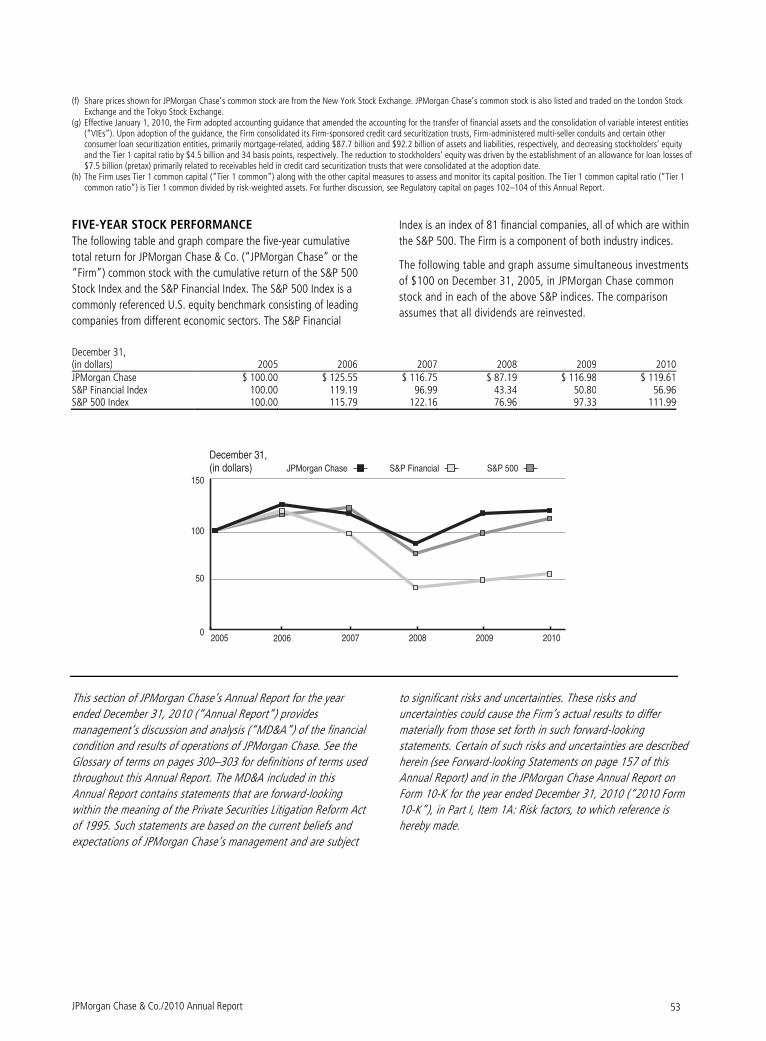
JPMorgan Chase & Co./2010 Annual Report 53
(f) Share prices shown for JPMorgan Chase’s common stock are from the New York Stock Exchange. JPMorgan Chase’s common stock is also listed and traded on the London Stock Exchange and the Tokyo Stock Exchange.
(g) Effective January 1, 2010, the Firm adopted accounting guidance that amended the accounting for the transfer of financial assets and the consolidation of variable interest entities (“VIEs”). Upon adoption of the guidance, the Firm consolidated its Firm-sponsored credit card securitization trusts, Firm-administered multi-seller conduits and certain other consumer loan securitization entities, primarily mortgage-related, adding $87.7 billion and $92.2 billion of assets and liabilities, respectively, and decreasing stockholders’ equity and the Tier 1 capital ratio by $4.5 billion and 34 basis points, respectively. The reduction to stockholders’ equity was driven by the establishment of an allowance for loan losses of $7.5 billion (pretax) primarily related to receivables held in credit card securitization trusts that were consolidated at the adoption date.
(h) The Firm uses Tier 1 common capital (“Tier 1 common”) along with the other capital measures to assess and monitor its capital position. The Tier 1 common capital ratio (“Tier 1 common ratio”) is Tier 1 common divided by risk-weighted assets. For further discussion, see Regulatory capital on pages 102–104 of this Annual Report.
FIVE-YEAR STOCK PERFORMANCE
The following table and graph compare the five-year cumulative
total return for JPMorgan Chase & Co. (“JPMorgan Chase” or the
“Firm”) common stock with the cumulative return of the S&P 500
Stock Index and the S&P Financial Index. The S&P 500 Index is a
commonly referenced U.S. equity benchmark consisting of leading
companies from different economic sectors. The S&P Financial
Index is an index of 81 financial companies, all of which are within
the S&P 500. The Firm is a component of both industry indices.
The following table and graph assume simultaneous investments
of $100 on December 31, 2005, in JPMorgan Chase common
stock and in each of the above S&P indices. The comparison
assumes that all dividends are reinvested.
December 31, (in dollars) 2005 2006 2007 2008 2009 2010 JPMorgan Chase $ 100.00 $ 125.55 $ 116.75 $ 87.19 $ 116.98 $ 119.61 S&P Financial Index 100.00 119.19 96.99 43.34 50.80 56.96 S&P 500 Index 100.00 115.79 122.16 76.96 97.33 111.99
This section of JPMorgan Chase’s Annual Report for the year
ended December 31, 2010 (“Annual Report”) provides
management’s discussion and analysis (“MD&A”) of the financial
condition and results of operations of JPMorgan Chase. See the
Glossary of terms on pages 300–303 for definitions of terms used
throughout this Annual Report. The MD&A included in this
Annual Report contains statements that are forward-looking
within the meaning of the Private Securities Litigation Reform Act
of 1995. Such statements are based on the current beliefs and
expectations of JPMorgan Chase’s management and are subject
to significant risks and uncertainties. These risks and
uncertainties could cause the Firm’s actual results to differ
materially from those set forth in such forward-looking
statements. Certain of such risks and uncertainties are described
herein (see Forward-looking Statements on page 157 of this
Annual Report) and in the JPMorgan Chase Annual Report on
Form 10-K for the year ended December 31, 2010 (“2010 Form
10-K”), in Part I, Item 1A: Risk factors, to which reference is
hereby made.
0
50
100
150
December 31,(in dollars)
2005 2006 2007 2008 2009 2010
S&P Financial S&P 500JPMorgan Chase
Management’s discussion and analysis
JPMorgan Chase & Co./2010 Annual Report 54
INTRODUCTION
JPMorgan Chase & Co., a financial holding company incorporated
under Delaware law in 1968, is a leading global financial services
firm and one of the largest banking institutions in the United States
of America (“U.S.”), with $2.1 trillion in assets, $176.1 billion in
stockholders’ equity and operations in more than 60 countries as of
December 31, 2010. The Firm is a leader in investment banking,
financial services for consumers, small business and commercial
banking, financial transaction processing, asset management and
private equity. Under the J.P. Morgan and Chase brands, the Firm
serves millions of customers in the U.S. and many of the world’s
most prominent corporate, institutional and government clients.
JPMorgan Chase’s principal bank subsidiaries are JPMorgan
Chase Bank, National Association (“JPMorgan Chase Bank,
N.A.”), a national bank with branches in 23 states in the U.S.;
and Chase Bank USA, National Association (“Chase Bank USA,
N.A.”), a national bank that is the Firm’s credit card issuing
bank. JPMorgan Chase’s principal nonbank subsidiary is J.P.
Morgan Securities LLC (“JPMorgan Securities”; formerly J.P.
Morgan Securities Inc.), the Firm’s U.S. investment banking firm.
JPMorgan Chase’s activities are organized, for management
reporting purposes, into six business segments, as well as
Corporate/Private Equity. The Firm’s wholesale businesses
comprise the Investment Bank, Commercial Banking, Treasury &
Securities Services and Asset Management segments. The Firm’s
consumer businesses comprise the Retail Financial Services and
Card Services segments. A description of the Firm’s business
segments, and the products and services they provide to their
respective client bases, follows.
Investment Bank
J.P. Morgan is one of the world’s leading investment banks, with
deep client relationships and broad product capabilities. The clients
of the Investment Bank (“IB”) are corporations, financial
institutions, governments and institutional investors. The Firm offers
a full range of investment banking products and services in all
major capital markets, including advising on corporate strategy and
structure, capital-raising in equity and debt markets, sophisticated
risk management, market-making in cash securities and derivative
instruments, prime brokerage, and research.
Retail Financial Services
Retail Financial Services (“RFS”) serves consumers and businesses
through personal service at bank branches and through ATMs,
online banking and telephone banking, as well as through auto
dealerships and school financial-aid offices. Customers can use
more than 5,200 bank branches (third-largest nationally) and
16,100 ATMs (second-largest nationally), as well as online and
mobile banking around the clock. More than 28,900 branch
salespeople assist customers with checking and savings accounts,
mortgages, home equity and business loans, and investments
across the 23-state footprint from New York and Florida to
California. Consumers also can obtain loans through more than
16,200 auto dealerships and 2,200 schools and universities
nationwide.
Card Services
Card Services (“CS”) is one of the nation’s largest credit card
issuers, with over $137 billion in loans and over 90 million open
accounts. Customers used Chase cards to meet $313 billion of their
spending needs in 2010. Through its merchant acquiring business,
Chase Paymentech Solutions, CS is a global leader in payment
processing and merchant acquiring.
Commercial Banking
Commercial Banking (“CB”) delivers extensive industry knowledge,
local expertise and dedicated service to nearly 24,000 clients
nationally, including corporations, municipalities, financial institutions
and not-for-profit entities with annual revenue generally ranging from
$10 million to $2 billion, and nearly 35,000 real estate
investors/owners. CB partners with the Firm’s other businesses to
provide comprehensive solutions, including lending, treasury services,
investment banking and asset management to meet its clients’
domestic and international financial needs.
Treasury & Securities Services
Treasury & Securities Services (“TSS”) is a global leader in
transaction, investment and information services. TSS is one of the
world’s largest cash management providers and a leading global
custodian. Treasury Services (“TS”) provides cash management,
trade, wholesale card and liquidity products and services to small-
and mid-sized companies, multinational corporations, financial
institutions and government entities. TS partners with IB, CB, RFS
and Asset Management businesses to serve clients firmwide.
Certain TS revenue is included in other segments’ results.
Worldwide Securities Services holds, values, clears and services
securities, cash and alternative investments for investors and
broker-dealers, and manages depositary receipt programs globally.
Asset Management
Asset Management (“AM”), with assets under supervision of $1.8
trillion, is a global leader in investment and wealth management. AM
clients include institutions, retail investors and high-net-worth
individuals in every major market throughout the world. AM offers
global investment management in equities, fixed income, real estate,
hedge funds, private equity and liquidity products, including money-
market instruments and bank deposits. AM also provides trust and
estate, banking and brokerage services to high-net-worth clients, and
retirement services for corporations and individuals. The majority of
AM’s client assets are in actively managed portfolios.
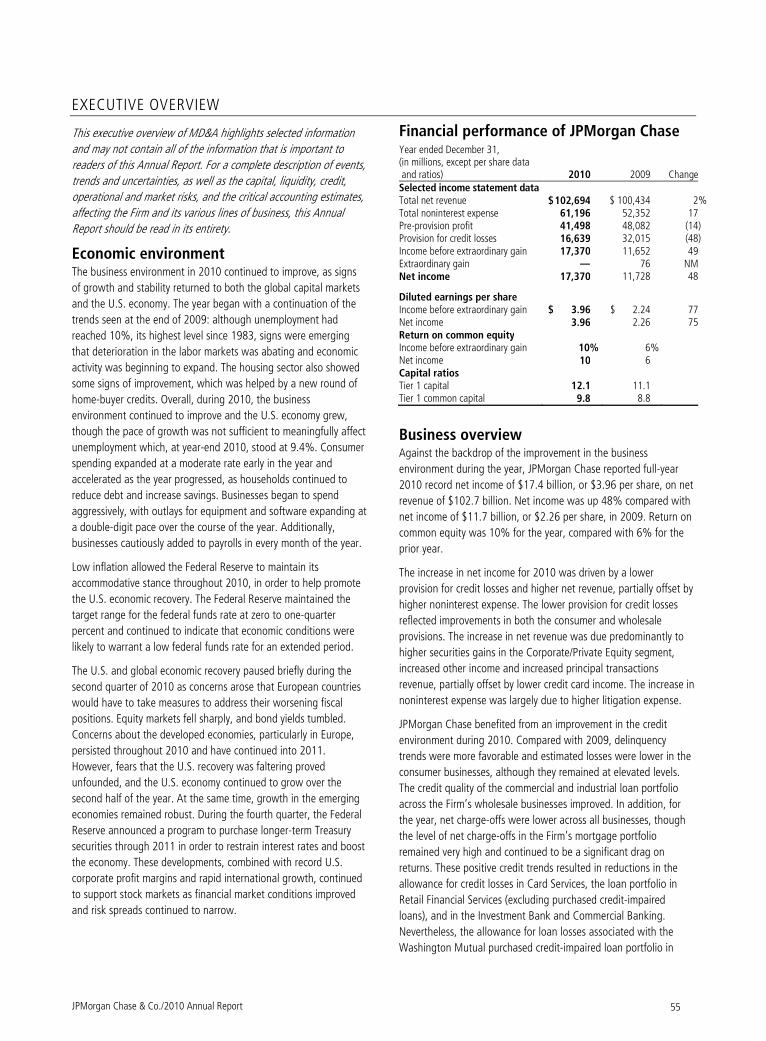
JPMorgan Chase & Co./2010 Annual Report 55
EXECUTIVE OVERVIEW
This executive overview of MD&A highlights selected information
and may not contain all of the information that is important to
readers of this Annual Report. For a complete description of events,
trends and uncertainties, as well as the capital, liquidity, credit,
operational and market risks, and the critical accounting estimates,
affecting the Firm and its various lines of business, this Annual
Report should be read in its entirety.
Economic environment The business environment in 2010 continued to improve, as signs
of growth and stability returned to both the global capital markets
and the U.S. economy. The year began with a continuation of the
trends seen at the end of 2009: although unemployment had
reached 10%, its highest level since 1983, signs were emerging
that deterioration in the labor markets was abating and economic
activity was beginning to expand. The housing sector also showed
some signs of improvement, which was helped by a new round of
home-buyer credits. Overall, during 2010, the business
environment continued to improve and the U.S. economy grew,
though the pace of growth was not sufficient to meaningfully affect
unemployment which, at year-end 2010, stood at 9.4%. Consumer
spending expanded at a moderate rate early in the year and
accelerated as the year progressed, as households continued to
reduce debt and increase savings. Businesses began to spend
aggressively, with outlays for equipment and software expanding at
a double-digit pace over the course of the year. Additionally,
businesses cautiously added to payrolls in every month of the year.
Low inflation allowed the Federal Reserve to maintain its
accommodative stance throughout 2010, in order to help promote
the U.S. economic recovery. The Federal Reserve maintained the
target range for the federal funds rate at zero to one-quarter
percent and continued to indicate that economic conditions were
likely to warrant a low federal funds rate for an extended period.
The U.S. and global economic recovery paused briefly during the
second quarter of 2010 as concerns arose that European countries
would have to take measures to address their worsening fiscal
positions. Equity markets fell sharply, and bond yields tumbled.
Concerns about the developed economies, particularly in Europe,
persisted throughout 2010 and have continued into 2011.
However, fears that the U.S. recovery was faltering proved
unfounded, and the U.S. economy continued to grow over the
second half of the year. At the same time, growth in the emerging
economies remained robust. During the fourth quarter, the Federal
Reserve announced a program to purchase longer-term Treasury
securities through 2011 in order to restrain interest rates and boost
the economy. These developments, combined with record U.S.
corporate profit margins and rapid international growth, continued
to support stock markets as financial market conditions improved
and risk spreads continued to narrow.
Financial performance of JPMorgan Chase Year ended December 31, (in millions, except per share data and ratios) 2010 2009 Change Selected income statement data Total net revenue $ 102,694 $ 100,434 2% Total noninterest expense 61,196 52,352 17Pre-provision profit 41,498 48,082 (14) Provision for credit losses 16,639 32,015 (48) Income before extraordinary gain 17,370 11,652 49Extraordinary gain — 76 NM Net income 17,370 11,728 48
Diluted earnings per share Income before extraordinary gain $ 3.96 $ 2.24 77Net income 3.96 2.26 75Return on common equity Income before extraordinary gain 10% 6% Net income 10 6 Capital ratios Tier 1 capital 12.1 11.1 Tier 1 common capital 9.8 8.8
Business overview Against the backdrop of the improvement in the business
environment during the year, JPMorgan Chase reported full-year
2010 record net income of $17.4 billion, or $3.96 per share, on net
revenue of $102.7 billion. Net income was up 48% compared with
net income of $11.7 billion, or $2.26 per share, in 2009. Return on
common equity was 10% for the year, compared with 6% for the
prior year.
The increase in net income for 2010 was driven by a lower
provision for credit losses and higher net revenue, partially offset by
higher noninterest expense. The lower provision for credit losses
reflected improvements in both the consumer and wholesale
provisions. The increase in net revenue was due predominantly to
higher securities gains in the Corporate/Private Equity segment,
increased other income and increased principal transactions
revenue, partially offset by lower credit card income. The increase in
noninterest expense was largely due to higher litigation expense.
JPMorgan Chase benefited from an improvement in the credit
environment during 2010. Compared with 2009, delinquency
trends were more favorable and estimated losses were lower in the
consumer businesses, although they remained at elevated levels.
The credit quality of the commercial and industrial loan portfolio
across the Firm’s wholesale businesses improved. In addition, for
the year, net charge-offs were lower across all businesses, though
the level of net charge-offs in the Firm’s mortgage portfolio
remained very high and continued to be a significant drag on
returns. These positive credit trends resulted in reductions in the
allowance for credit losses in Card Services, the loan portfolio in
Retail Financial Services (excluding purchased credit-impaired
loans), and in the Investment Bank and Commercial Banking.
Nevertheless, the allowance for loan losses associated with the
Washington Mutual purchased credit-impaired loan portfolio in
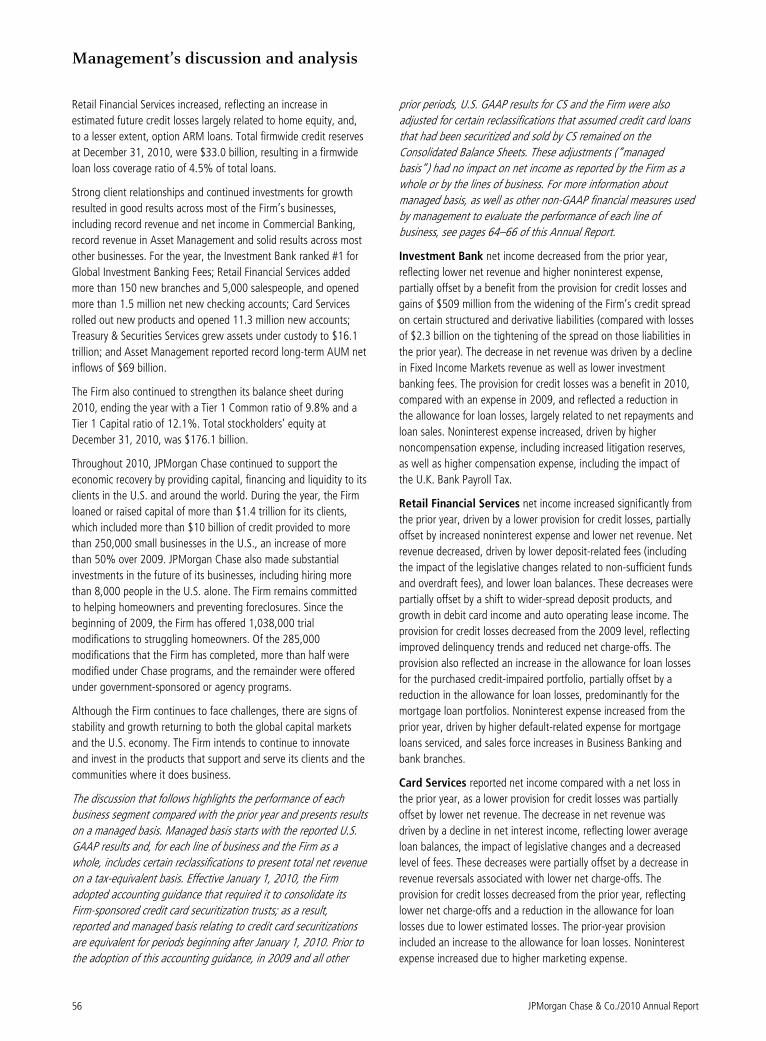
Management’s discussion and analysis
JPMorgan Chase & Co./2010 Annual Report 56
Retail Financial Services increased, reflecting an increase in
estimated future credit losses largely related to home equity, and,
to a lesser extent, option ARM loans. Total firmwide credit reserves
at December 31, 2010, were $33.0 billion, resulting in a firmwide
loan loss coverage ratio of 4.5% of total loans.
Strong client relationships and continued investments for growth
resulted in good results across most of the Firm’s businesses,
including record revenue and net income in Commercial Banking,
record revenue in Asset Management and solid results across most
other businesses. For the year, the Investment Bank ranked #1 for
Global Investment Banking Fees; Retail Financial Services added
more than 150 new branches and 5,000 salespeople, and opened
more than 1.5 million net new checking accounts; Card Services
rolled out new products and opened 11.3 million new accounts;
Treasury & Securities Services grew assets under custody to $16.1
trillion; and Asset Management reported record long-term AUM net
inflows of $69 billion.
The Firm also continued to strengthen its balance sheet during
2010, ending the year with a Tier 1 Common ratio of 9.8% and a
Tier 1 Capital ratio of 12.1%. Total stockholders’ equity at
December 31, 2010, was $176.1 billion.
Throughout 2010, JPMorgan Chase continued to support the
economic recovery by providing capital, financing and liquidity to its
clients in the U.S. and around the world. During the year, the Firm
loaned or raised capital of more than $1.4 trillion for its clients,
which included more than $10 billion of credit provided to more
than 250,000 small businesses in the U.S., an increase of more
than 50% over 2009. JPMorgan Chase also made substantial
investments in the future of its businesses, including hiring more
than 8,000 people in the U.S. alone. The Firm remains committed
to helping homeowners and preventing foreclosures. Since the
beginning of 2009, the Firm has offered 1,038,000 trial
modifications to struggling homeowners. Of the 285,000
modifications that the Firm has completed, more than half were
modified under Chase programs, and the remainder were offered
under government-sponsored or agency programs.
Although the Firm continues to face challenges, there are signs of
stability and growth returning to both the global capital markets
and the U.S. economy. The Firm intends to continue to innovate
and invest in the products that support and serve its clients and the
communities where it does business.
The discussion that follows highlights the performance of each
business segment compared with the prior year and presents results
on a managed basis. Managed basis starts with the reported U.S.
GAAP results and, for each line of business and the Firm as a
whole, includes certain reclassifications to present total net revenue
on a tax-equivalent basis. Effective January 1, 2010, the Firm
adopted accounting guidance that required it to consolidate its
Firm-sponsored credit card securitization trusts; as a result,
reported and managed basis relating to credit card securitizations
are equivalent for periods beginning after January 1, 2010. Prior to
the adoption of this accounting guidance, in 2009 and all other
prior periods, U.S. GAAP results for CS and the Firm were also
adjusted for certain reclassifications that assumed credit card loans
that had been securitized and sold by CS remained on the
Consolidated Balance Sheets. These adjustments (“managed
basis”) had no impact on net income as reported by the Firm as a
whole or by the lines of business. For more information about
managed basis, as well as other non-GAAP financial measures used
by management to evaluate the performance of each line of
business, see pages 64–66 of this Annual Report.
Investment Bank net income decreased from the prior year,
reflecting lower net revenue and higher noninterest expense,
partially offset by a benefit from the provision for credit losses and
gains of $509 million from the widening of the Firm’s credit spread
on certain structured and derivative liabilities (compared with losses
of $2.3 billion on the tightening of the spread on those liabilities in
the prior year). The decrease in net revenue was driven by a decline
in Fixed Income Markets revenue as well as lower investment
banking fees. The provision for credit losses was a benefit in 2010,
compared with an expense in 2009, and reflected a reduction in
the allowance for loan losses, largely related to net repayments and
loan sales. Noninterest expense increased, driven by higher
noncompensation expense, including increased litigation reserves,
as well as higher compensation expense, including the impact of
the U.K. Bank Payroll Tax.
Retail Financial Services net income increased significantly from
the prior year, driven by a lower provision for credit losses, partially
offset by increased noninterest expense and lower net revenue. Net
revenue decreased, driven by lower deposit-related fees (including
the impact of the legislative changes related to non-sufficient funds
and overdraft fees), and lower loan balances. These decreases were
partially offset by a shift to wider-spread deposit products, and
growth in debit card income and auto operating lease income. The
provision for credit losses decreased from the 2009 level, reflecting
improved delinquency trends and reduced net charge-offs. The
provision also reflected an increase in the allowance for loan losses
for the purchased credit-impaired portfolio, partially offset by a
reduction in the allowance for loan losses, predominantly for the
mortgage loan portfolios. Noninterest expense increased from the
prior year, driven by higher default-related expense for mortgage
loans serviced, and sales force increases in Business Banking and
bank branches.
Card Services reported net income compared with a net loss in
the prior year, as a lower provision for credit losses was partially
offset by lower net revenue. The decrease in net revenue was
driven by a decline in net interest income, reflecting lower average
loan balances, the impact of legislative changes and a decreased
level of fees. These decreases were partially offset by a decrease in
revenue reversals associated with lower net charge-offs. The
provision for credit losses decreased from the prior year, reflecting
lower net charge-offs and a reduction in the allowance for loan
losses due to lower estimated losses. The prior-year provision
included an increase to the allowance for loan losses. Noninterest
expense increased due to higher marketing expense.
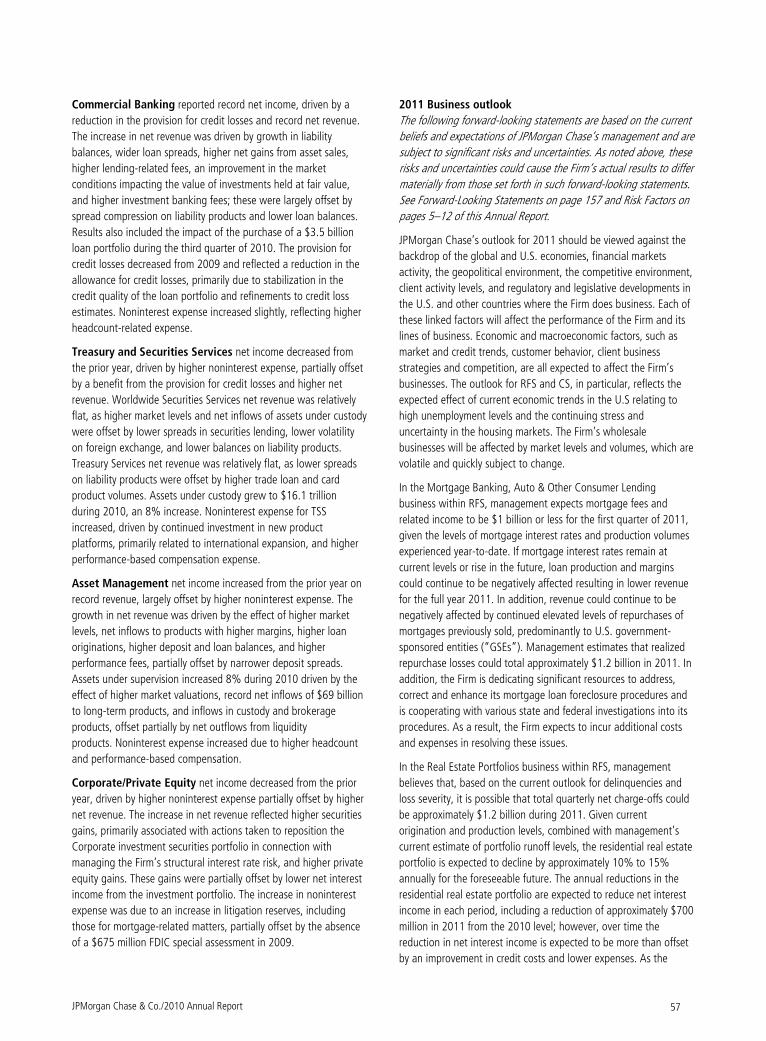
JPMorgan Chase & Co./2010 Annual Report 57
Commercial Banking reported record net income, driven by a
reduction in the provision for credit losses and record net revenue.
The increase in net revenue was driven by growth in liability
balances, wider loan spreads, higher net gains from asset sales,
higher lending-related fees, an improvement in the market
conditions impacting the value of investments held at fair value,
and higher investment banking fees; these were largely offset by
spread compression on liability products and lower loan balances.
Results also included the impact of the purchase of a $3.5 billion
loan portfolio during the third quarter of 2010. The provision for
credit losses decreased from 2009 and reflected a reduction in the
allowance for credit losses, primarily due to stabilization in the
credit quality of the loan portfolio and refinements to credit loss
estimates. Noninterest expense increased slightly, reflecting higher
headcount-related expense.
Treasury and Securities Services net income decreased from
the prior year, driven by higher noninterest expense, partially offset
by a benefit from the provision for credit losses and higher net
revenue. Worldwide Securities Services net revenue was relatively
flat, as higher market levels and net inflows of assets under custody
were offset by lower spreads in securities lending, lower volatility
on foreign exchange, and lower balances on liability products.
Treasury Services net revenue was relatively flat, as lower spreads
on liability products were offset by higher trade loan and card
product volumes. Assets under custody grew to $16.1 trillion
during 2010, an 8% increase. Noninterest expense for TSS
increased, driven by continued investment in new product
platforms, primarily related to international expansion, and higher
performance-based compensation expense.
Asset Management net income increased from the prior year on
record revenue, largely offset by higher noninterest expense. The
growth in net revenue was driven by the effect of higher market
levels, net inflows to products with higher margins, higher loan
originations, higher deposit and loan balances, and higher
performance fees, partially offset by narrower deposit spreads.
Assets under supervision increased 8% during 2010 driven by the
effect of higher market valuations, record net inflows of $69 billion
to long-term products, and inflows in custody and brokerage
products, offset partially by net outflows from liquidity
products. Noninterest expense increased due to higher headcount
and performance-based compensation.
Corporate/Private Equity net income decreased from the prior
year, driven by higher noninterest expense partially offset by higher
net revenue. The increase in net revenue reflected higher securities
gains, primarily associated with actions taken to reposition the
Corporate investment securities portfolio in connection with
managing the Firm’s structural interest rate risk, and higher private
equity gains. These gains were partially offset by lower net interest
income from the investment portfolio. The increase in noninterest
expense was due to an increase in litigation reserves, including
those for mortgage-related matters, partially offset by the absence
of a $675 million FDIC special assessment in 2009.
2011 Business outlook
The following forward-looking statements are based on the current
beliefs and expectations of JPMorgan Chase’s management and are
subject to significant risks and uncertainties. As noted above, these
risks and uncertainties could cause the Firm’s actual results to differ
materially from those set forth in such forward-looking statements.
See Forward-Looking Statements on page 157 and Risk Factors on
pages 5–12 of this Annual Report.
JPMorgan Chase’s outlook for 2011 should be viewed against the
backdrop of the global and U.S. economies, financial markets
activity, the geopolitical environment, the competitive environment,
client activity levels, and regulatory and legislative developments in
the U.S. and other countries where the Firm does business. Each of
these linked factors will affect the performance of the Firm and its
lines of business. Economic and macroeconomic factors, such as
market and credit trends, customer behavior, client business
strategies and competition, are all expected to affect the Firm’s
businesses. The outlook for RFS and CS, in particular, reflects the
expected effect of current economic trends in the U.S relating to
high unemployment levels and the continuing stress and
uncertainty in the housing markets. The Firm’s wholesale
businesses will be affected by market levels and volumes, which are
volatile and quickly subject to change.
In the Mortgage Banking, Auto & Other Consumer Lending
business within RFS, management expects mortgage fees and
related income to be $1 billion or less for the first quarter of 2011,
given the levels of mortgage interest rates and production volumes
experienced year-to-date. If mortgage interest rates remain at
current levels or rise in the future, loan production and margins
could continue to be negatively affected resulting in lower revenue
for the full year 2011. In addition, revenue could continue to be
negatively affected by continued elevated levels of repurchases of
mortgages previously sold, predominantly to U.S. government-
sponsored entities (“GSEs”). Management estimates that realized
repurchase losses could total approximately $1.2 billion in 2011. In
addition, the Firm is dedicating significant resources to address,
correct and enhance its mortgage loan foreclosure procedures and
is cooperating with various state and federal investigations into its
procedures. As a result, the Firm expects to incur additional costs
and expenses in resolving these issues.
In the Real Estate Portfolios business within RFS, management
believes that, based on the current outlook for delinquencies and
loss severity, it is possible that total quarterly net charge-offs could
be approximately $1.2 billion during 2011. Given current
origination and production levels, combined with management’s
current estimate of portfolio runoff levels, the residential real estate
portfolio is expected to decline by approximately 10% to 15%
annually for the foreseeable future. The annual reductions in the
residential real estate portfolio are expected to reduce net interest
income in each period, including a reduction of approximately $700
million in 2011 from the 2010 level; however, over time the
reduction in net interest income is expected to be more than offset
by an improvement in credit costs and lower expenses. As the
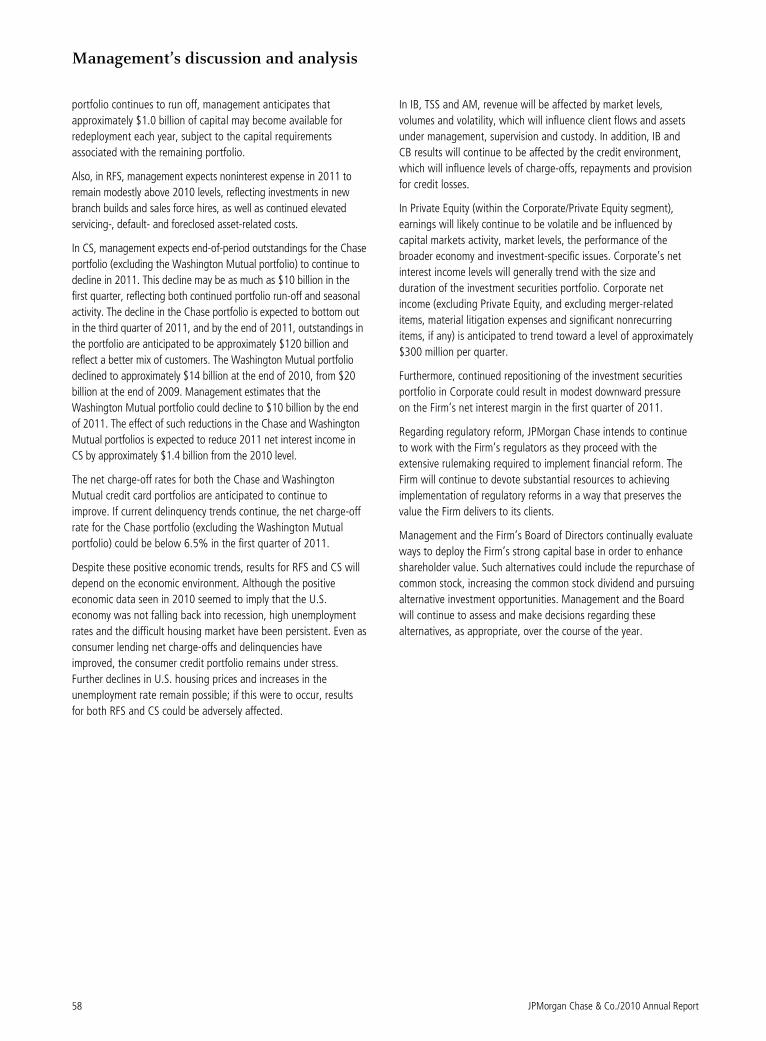
Management’s discussion and analysis
JPMorgan Chase & Co./2010 Annual Report 58
portfolio continues to run off, management anticipates that
approximately $1.0 billion of capital may become available for
redeployment each year, subject to the capital requirements
associated with the remaining portfolio.
Also, in RFS, management expects noninterest expense in 2011 to
remain modestly above 2010 levels, reflecting investments in new
branch builds and sales force hires, as well as continued elevated
servicing-, default- and foreclosed asset-related costs.
In CS, management expects end-of-period outstandings for the Chase
portfolio (excluding the Washington Mutual portfolio) to continue to
decline in 2011. This decline may be as much as $10 billion in the
first quarter, reflecting both continued portfolio run-off and seasonal
activity. The decline in the Chase portfolio is expected to bottom out
in the third quarter of 2011, and by the end of 2011, outstandings in
the portfolio are anticipated to be approximately $120 billion and
reflect a better mix of customers. The Washington Mutual portfolio
declined to approximately $14 billion at the end of 2010, from $20
billion at the end of 2009. Management estimates that the
Washington Mutual portfolio could decline to $10 billion by the end
of 2011. The effect of such reductions in the Chase and Washington
Mutual portfolios is expected to reduce 2011 net interest income in
CS by approximately $1.4 billion from the 2010 level.
The net charge-off rates for both the Chase and Washington
Mutual credit card portfolios are anticipated to continue to
improve. If current delinquency trends continue, the net charge-off
rate for the Chase portfolio (excluding the Washington Mutual
portfolio) could be below 6.5% in the first quarter of 2011.
Despite these positive economic trends, results for RFS and CS will
depend on the economic environment. Although the positive
economic data seen in 2010 seemed to imply that the U.S.
economy was not falling back into recession, high unemployment
rates and the difficult housing market have been persistent. Even as
consumer lending net charge-offs and delinquencies have
improved, the consumer credit portfolio remains under stress.
Further declines in U.S. housing prices and increases in the
unemployment rate remain possible; if this were to occur, results
for both RFS and CS could be adversely affected.
In IB, TSS and AM, revenue will be affected by market levels,
volumes and volatility, which will influence client flows and assets
under management, supervision and custody. In addition, IB and
CB results will continue to be affected by the credit environment,
which will influence levels of charge-offs, repayments and provision
for credit losses.
In Private Equity (within the Corporate/Private Equity segment),
earnings will likely continue to be volatile and be influenced by
capital markets activity, market levels, the performance of the
broader economy and investment-specific issues. Corporate’s net
interest income levels will generally trend with the size and
duration of the investment securities portfolio. Corporate net
income (excluding Private Equity, and excluding merger-related
items, material litigation expenses and significant nonrecurring
items, if any) is anticipated to trend toward a level of approximately
$300 million per quarter.
Furthermore, continued repositioning of the investment securities
portfolio in Corporate could result in modest downward pressure
on the Firm’s net interest margin in the first quarter of 2011.
Regarding regulatory reform, JPMorgan Chase intends to continue
to work with the Firm’s regulators as they proceed with the
extensive rulemaking required to implement financial reform. The
Firm will continue to devote substantial resources to achieving
implementation of regulatory reforms in a way that preserves the
value the Firm delivers to its clients.
Management and the Firm’s Board of Directors continually evaluate
ways to deploy the Firm’s strong capital base in order to enhance
shareholder value. Such alternatives could include the repurchase of
common stock, increasing the common stock dividend and pursuing
alternative investment opportunities. Management and the Board
will continue to assess and make decisions regarding these
alternatives, as appropriate, over the course of the year.
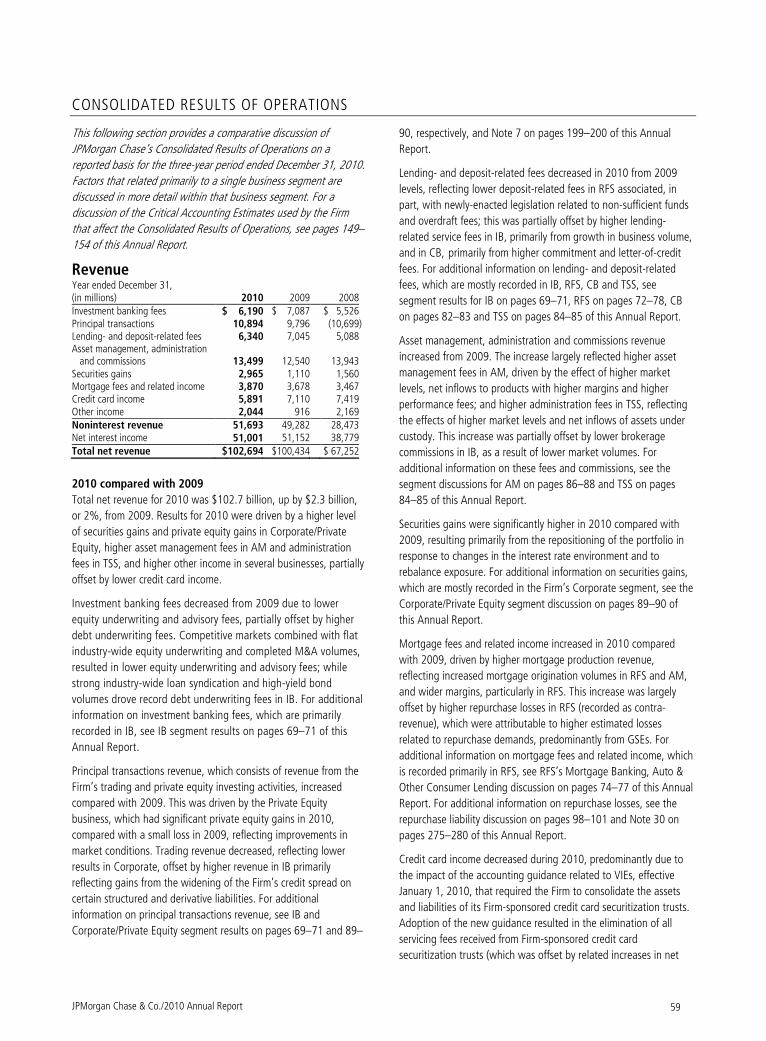
JPMorgan Chase & Co./2010 Annual Report 59
CONSOLIDATED RESULTS OF OPERATIONS
This following section provides a comparative discussion of
JPMorgan Chase’s Consolidated Results of Operations on a
reported basis for the three-year period ended December 31, 2010.
Factors that related primarily to a single business segment are
discussed in more detail within that business segment. For a
discussion of the Critical Accounting Estimates used by the Firm
that affect the Consolidated Results of Operations, see pages 149–
154 of this Annual Report.
Revenue Year ended December 31, (in millions) 2010 2009 2008 Investment banking fees $ 6,190 $ 7,087 $ 5,526 Principal transactions 10,894 9,796 (10,699) Lending- and deposit-related fees 6,340 7,045 5,088 Asset management, administration and commissions 13,499 12,540 13,943 Securities gains 2,965 1,110 1,560 Mortgage fees and related income 3,870 3,678 3,467 Credit card income 5,891 7,110 7,419 Other income 2,044 916 2,169 Noninterest revenue 51,693 49,282 28,473 Net interest income 51,001 51,152 38,779 Total net revenue $102,694 $100,434 $ 67,252
2010 compared with 2009
Total net revenue for 2010 was $102.7 billion, up by $2.3 billion,
or 2%, from 2009. Results for 2010 were driven by a higher level
of securities gains and private equity gains in Corporate/Private
Equity, higher asset management fees in AM and administration
fees in TSS, and higher other income in several businesses, partially
offset by lower credit card income.
Investment banking fees decreased from 2009 due to lower
equity underwriting and advisory fees, partially offset by higher
debt underwriting fees. Competitive markets combined with flat
industry-wide equity underwriting and completed M&A volumes,
resulted in lower equity underwriting and advisory fees; while
strong industry-wide loan syndication and high-yield bond
volumes drove record debt underwriting fees in IB. For additional
information on investment banking fees, which are primarily
recorded in IB, see IB segment results on pages 69–71 of this
Annual Report.
Principal transactions revenue, which consists of revenue from the
Firm’s trading and private equity investing activities, increased
compared with 2009. This was driven by the Private Equity
business, which had significant private equity gains in 2010,
compared with a small loss in 2009, reflecting improvements in
market conditions. Trading revenue decreased, reflecting lower
results in Corporate, offset by higher revenue in IB primarily
reflecting gains from the widening of the Firm’s credit spread on
certain structured and derivative liabilities. For additional
information on principal transactions revenue, see IB and
Corporate/Private Equity segment results on pages 69–71 and 89–
90, respectively, and Note 7 on pages 199–200 of this Annual
Report.
Lending- and deposit-related fees decreased in 2010 from 2009
levels, reflecting lower deposit-related fees in RFS associated, in
part, with newly-enacted legislation related to non-sufficient funds
and overdraft fees; this was partially offset by higher lending-
related service fees in IB, primarily from growth in business volume,
and in CB, primarily from higher commitment and letter-of-credit
fees. For additional information on lending- and deposit-related
fees, which are mostly recorded in IB, RFS, CB and TSS, see
segment results for IB on pages 69–71, RFS on pages 72–78, CB
on pages 82–83 and TSS on pages 84–85 of this Annual Report.
Asset management, administration and commissions revenue
increased from 2009. The increase largely reflected higher asset
management fees in AM, driven by the effect of higher market
levels, net inflows to products with higher margins and higher
performance fees; and higher administration fees in TSS, reflecting
the effects of higher market levels and net inflows of assets under
custody. This increase was partially offset by lower brokerage
commissions in IB, as a result of lower market volumes. For
additional information on these fees and commissions, see the
segment discussions for AM on pages 86–88 and TSS on pages
84–85 of this Annual Report.
Securities gains were significantly higher in 2010 compared with
2009, resulting primarily from the repositioning of the portfolio in
response to changes in the interest rate environment and to
rebalance exposure. For additional information on securities gains,
which are mostly recorded in the Firm’s Corporate segment, see the
Corporate/Private Equity segment discussion on pages 89–90 of
this Annual Report.
Mortgage fees and related income increased in 2010 compared
with 2009, driven by higher mortgage production revenue,
reflecting increased mortgage origination volumes in RFS and AM,
and wider margins, particularly in RFS. This increase was largely
offset by higher repurchase losses in RFS (recorded as contra-
revenue), which were attributable to higher estimated losses
related to repurchase demands, predominantly from GSEs. For
additional information on mortgage fees and related income, which
is recorded primarily in RFS, see RFS’s Mortgage Banking, Auto &
Other Consumer Lending discussion on pages 74–77 of this Annual
Report. For additional information on repurchase losses, see the
repurchase liability discussion on pages 98–101 and Note 30 on
pages 275–280 of this Annual Report.
Credit card income decreased during 2010, predominantly due to
the impact of the accounting guidance related to VIEs, effective
January 1, 2010, that required the Firm to consolidate the assets
and liabilities of its Firm-sponsored credit card securitization trusts.
Adoption of the new guidance resulted in the elimination of all
servicing fees received from Firm-sponsored credit card
securitization trusts (which was offset by related increases in net
Management’s discussion and analysis
JPMorgan Chase & Co./2010 Annual Report 60
interest income and the provision for credit losses, and the
elimination of securitization income/(losses) in other income).
Lower income from other fee-based products also contributed to
the decrease in credit card income. Excluding the impact of the
adoption of the new accounting guidance, credit card income
increased in 2010, reflecting higher customer charge volume on
credit and debit cards. For a more detailed discussion of the impact
of the adoption of the new accounting guidance on the
Consolidated Statements of Income, see Explanation and
Reconciliation of the Firm’s Use of Non-GAAP Financial Measures
on pages 64–66 of this Annual Report. For additional information
on credit card income, see the CS and RFS segment results on
pages 79–81, and pages 72–78, respectively, of this Annual
Report.
Other income increased in 2010, largely due to the write-down of
securitization interests during 2009 and higher auto operating
lease income in RFS.
Net interest income was relatively flat in 2010 compared with
2009. The effect of lower loan balances was predominantly offset
by the effect of the adoption of the new accounting guidance
related to VIEs (which increased net interest income by
approximately $5.8 billion in 2010). Excluding the impact of the
adoption of the new accounting guidance, net interest income
decreased, driven by lower average loan balances, primarily in
CS, RFS and IB, reflecting the continued runoff of the credit card
balances and residential real estate loans, and net repayments
and loan sales; lower yields and fees on credit card receivables,
reflecting the impact of legislative changes; and lower yields on
securities in Corporate resulting from investment portfolio
repositioning. The Firm’s average interest-earning assets were
$1.7 trillion in 2010, and the net yield on those assets, on a FTE
basis, was 3.06%, a decrease of 6 basis points from 2009. For a
more detailed discussion of the impact of the adoption of the
new accounting guidance related to VIEs on the Consolidated
Statements of Income, see Explanation and Reconciliation of the
Firm’s Use of Non-GAAP Financial Measures on pages 64–66 of
this Annual Report. For further information on the impact of the
legislative changes on the Consolidated Statements of Income,
see CS discussion on Credit Card Legislation on page 79 of this
Annual Report.
2009 compared with 2008
Total net revenue was $100.4 billion, up by $33.2 billion, or 49%,
from the prior year. The increase was driven by higher principal
transactions revenue, primarily related to improved performance
across most fixed income and equity products, and the absence of
net markdowns on legacy leveraged lending and mortgage
positions in IB, as well as higher levels of trading gains and
investment securities income in Corporate/Private Equity. Results
also benefited from the impact of the Washington Mutual
transaction, which contributed to increases in net interest income,
lending- and deposit-related fees, and mortgage fees and related
income. Lastly, higher investment banking fees also contributed to
revenue growth. These increases in revenue were offset partially by
reduced fees and commissions from the effect of lower market
levels on assets under management and custody, and the absence
of proceeds from the sale of Visa shares in its initial public offering
in the first quarter of 2008.
Investment banking fees increased from the prior year, due to
higher equity and debt underwriting fees. For a further discussion
of investment banking fees, which are primarily recorded in IB, see
IB segment results on pages 69–71 of this Annual Report.
Principal transactions revenue, which consists of revenue from
trading and private equity investing activities, was significantly
higher compared with the prior year. Trading revenue increased,
driven by improved performance across most fixed income and
equity products; modest net gains on legacy leveraged lending and
mortgage-related positions, compared with net markdowns of
$10.6 billion in the prior year; and gains on trading positions in
Corporate/Private Equity, compared with losses in the prior year of
$1.1 billion on markdowns of Federal National Mortgage
Association (“Fannie Mae”) and Federal Home Loan Mortgage
Corporation (“Freddie Mac”) preferred securities. These increases
in revenue were offset partially by an aggregate loss of $2.3 billion
from the tightening of the Firm’s credit spread on certain structured
liabilities and derivatives, compared with gains of $2.0 billion in the
prior year from widening spreads on these liabilities and
derivatives. The Firm’s private equity investments produced a slight
net loss in 2009, a significant improvement from a larger net loss in
2008. For a further discussion of principal transactions revenue, see
IB and Corporate/Private Equity segment results on pages 69–71
and 89–90, respectively, and Note 7 on pages 199–200 of this
Annual Report.
JPMorgan Chase & Co./2010 Annual Report 61
Lending- and deposit-related fees rose from the prior year,
predominantly reflecting the impact of the Washington Mutual
transaction and organic growth in both lending- and deposit-
related fees in RFS, CB, IB and TSS. For a further discussion of
lending- and deposit-related fees, which are mostly recorded in
RFS, TSS and CB, see the RFS segment results on pages 72–78, the
TSS segment results on pages 84–85, and the CB segment results
on pages 82–83 of this Annual Report.
The decline in asset management, administration and commissions
revenue compared with the prior year was largely due to lower
asset management fees in AM from the effect of lower market
levels. Also contributing to the decrease were lower administration
fees in TSS, driven by the effect of market depreciation on certain
custody assets and lower securities lending balances; and lower
brokerage commissions revenue in IB, predominantly related to
lower transaction volume. For additional information on these fees
and commissions, see the segment discussions for TSS and AM on
pages 84–85 and pages 86–88, respectively, of this Annual Report.
Securities gains were lower in 2009 and included credit losses
related to other-than-temporary impairment and lower gains on
the sale of MasterCard shares totaling $241 million in 2009,
compared with $668 million in 2008. These decreases were
offset partially by higher gains from repositioning the Corporate
investment securities portfolio in connection with managing the
Firm’s structural interest rate risk. For a further discussion of
securities gains, which are mostly recorded in Corporate/Private
Equity, see the Corporate/Private Equity segment discussion on
pages 89–90 of this Annual Report.
Mortgage fees and related income increased slightly from the prior
year, as higher net mortgage servicing revenue was largely offset by
lower production revenue. The increase in net mortgage servicing
revenue was driven by growth in average third-party loans serviced
as a result of the Washington Mutual transaction. Mortgage
production revenue declined from the prior year, reflecting an
increase in estimated losses from the repurchase of previously-sold
loans, offset partially by wider margins on new originations. For a
discussion of mortgage fees and related income, which is recorded
primarily in RFS, see RFS’s Mortgage Banking, Auto & Other
Consumer Lending discussion on pages 74–77 of this Annual
Report.
Credit card income, which includes the impact of the Washington
Mutual transaction, decreased slightly compared with the prior
year, due to lower servicing fees earned in connection with CS
securitization activities, largely as a result of higher credit losses.
The decrease was partially offset by wider loan margins on
securitized credit card loans; higher merchant servicing revenue
related to the dissolution of the Chase Paymentech Solutions joint
venture; and higher interchange income. For a further discussion of
credit card income, see the CS segment results on pages 79–81 of
this Annual Report.
Other income decreased from the prior year, due predominantly
to the absence of $1.5 billion in proceeds from the sale of Visa
shares as part of its initial public offering in the first quarter of
2008; a $1.0 billion gain on the dissolution of the Chase
Paymentech Solutions joint venture in the fourth quarter of 2008;
and lower net securitization income in CS. These items were
partially offset by a $464 million charge recognized in 2008
related to the repurchase of auction-rate securities at par; the
absence of a $423 million loss incurred in the second quarter of
2008, reflecting the Firm’s 49.4% share of Bear Stearns’s losses
from April 8 to May 30, 2008; and higher valuations on certain
investments, including seed capital in AM.
Net interest income increased from the prior year, driven by the
Washington Mutual transaction, which contributed to higher
average loans and deposits. The Firm’s interest-earning assets were
$1.7 trillion, and the net yield on those assets, on a fully taxable-
equivalent (“FTE”) basis, was 3.12%, an increase of 25 basis
points from 2008. Excluding the impact of the Washington Mutual
transaction, the increase in net interest income in 2009 was driven
by a higher level of investment securities, as well as a wider net
interest margin, which reflected the overall decline in market
interest rates during the year. Declining interest rates had a positive
effect on the net interest margin, as rates paid on the Firm’s
interest-bearing liabilities decreased faster relative to the decline in
rates earned on interest-earning assets. These increases in net
interest income were offset partially by lower loan balances, which
included the effect of lower customer demand, repayments and
charge-offs.
Management’s discussion and analysis
JPMorgan Chase & Co./2010 Annual Report 62
Provision for credit losses Year ended December 31, (in millions) 2010 2009 2008Wholesale $ (850) $ 3,974 $ 3,327
Consumer, excluding credit card(a) 9,452 16,022 10,610
Credit card(a) 8,037 12,019 7,042Total provision for credit losses $16,639 $ 32,015 $ 20,979
(a) Includes adjustments to the provision for credit losses recognized in the Corporate/Private Equity segment related to the Washington Mutual transaction in 2008.
2010 compared with 2009
The provision for credit losses declined by $15.4 billion compared
with 2009, due to decreases in both the consumer and wholesale
provisions. The decreases in the consumer provisions reflected
reductions in the allowance for credit losses for mortgages and
credit cards as a result of improved delinquency trends and lower
estimated losses. This was partially offset by an increase in the
allowance for credit losses associated with the Washington Mutual
purchased credit-impaired loans portfolio, resulting from increased
estimated future credit losses. The decrease in the wholesale
provision in 2010 reflected a reduction in the allowance for credit
losses, predominantly as a result of continued improvement in the
credit quality of the commercial and industrial loan portfolio,
reduced net charge-offs, and net repayments and loan sales. For a
more detailed discussion of the loan portfolio and the allowance for
credit losses, see the segment discussions for RFS on pages 72–78,
CS on pages 79–81, IB on pages 69–71 and CB on pages 82–83,
and the Allowance for Credit Losses section on pages 139–141 of
this Annual Report.
2009 compared with 2008
The provision for credit losses in 2009 rose by $11.0 billion
compared with the prior year, predominantly due to a significant
increase in the consumer provision. The prior year included a
$1.5 billion charge to conform Washington Mutual’s allowance for
loan losses, which affected both the consumer and wholesale
portfolios. For the purpose of the following analysis, this charge is
excluded. The consumer provision reflected additions to the
allowance for loan losses for the home equity, mortgage and credit
card portfolios, as weak economic conditions, housing price
declines and higher unemployment rates continued to drive higher
estimated losses for these portfolios. Included in the 2009 addition
to the allowance for loan losses was a $1.6 billion provision related
to estimated deterioration in the Washington Mutual purchased
credit-impaired portfolio. The wholesale provision increased from
the prior year, reflecting continued weakness in the credit
environment in 2009 compared with the prior year. For a more
detailed discussion of the loan portfolio and the allowance for loan
losses, see the segment discussions for RFS on pages 72–78, CS on
pages 79–81, IB on pages 69–71 and CB on pages 82–83, and the
Allowance for Credit Losses section on pages 139–141 of this
Annual Report.
Noninterest expense Year ended December 31, (in millions) 2010 2009 2008
Compensation expense(a) $ 28,124 $ 26,928 $ 22,746 Noncompensation expense:
Occupancy expense 3,681 3,666 3,038Technology, communications and equipment 4,684 4,624 4,315Professional and outside services 6,767 6,232 6,053Marketing 2,446 1,777 1,913
Other expense(b)(c)(d) 14,558 7,594 3,740 Amortization of intangibles 936 1,050 1,263Total noncompensation expense 33,072 24,943 20,322Merger costs — 481 432Total noninterest expense $ 61,196 $ 52,352 $ 43,500
(a) Expense for 2010 included a payroll tax expense related to the U.K. Bank Payroll Tax on certain compensation awarded from December 9, 2009, to April 5, 2010, to relevant banking employees.
(b) In 2010, 2009 and 2008, included litigation expense of $7.4 billion, $161 million and a net benefit of $781 million, respectively.
(c) In 2010, 2009 and 2008, included foreclosed property expense of $1.0 billion, $1.4 billion and $213 million, respectively. For additional information regarding foreclosed property, see Note 11 on page 213 of this Annual Report.
(d) Expense for 2009 included a $675 million FDIC special assessment.
2010 compared with 2009
Total noninterest expense for 2010 was $61.2 billion, up by
$8.8 billion, or 17%, from 2009. The increase was driven by higher
noncompensation expense, largely due to higher litigation expense,
and the effect of investments in the businesses.
Compensation expense increased from the prior year, predominantly
due to higher salary expense related to investments in the
businesses, including additional sales staff in RFS and client
advisors in AM, and the impact of the U.K. Bank Payroll Tax.
In addition to the aforementioned higher litigation expense, which
was largely for mortgage-related matters in Corporate and IB, the
increase in noncompensation expense was driven by higher
marketing expense in CS; higher professional services expense,
due to continued investments in new product platforms in the
businesses, including those related to international expansion;
higher default-related expense, including costs associated with
foreclosure affidavit-related suspensions (recorded in other
expense), for the serviced portfolio in RFS; and higher brokerage,
clearing and exchange transaction processing expense in IB.
Partially offsetting these increases was the absence of a $675
million FDIC special assessment recognized in 2009. For a further
discussion of litigation expense, see the Litigation reserve
discussion in Note 32 pages 282–289 of this Annual Report. For a
discussion of amortization of intangibles, refer to Note 17 on pages
260–263 of this Annual Report.
There were no merger costs recorded in 2010, compared with
merger costs of $481 million in 2009. For additional information on
merger costs, refer to Note 11 on page 213 of this Annual Report.
JPMorgan Chase & Co./2010 Annual Report 63
2009 compared with 2008
Total noninterest expense was $52.4 billion, up by $8.9 billion, or
20%, from the prior year. The increase was driven by the impact of
the Washington Mutual transaction, higher performance-based
compensation expense, higher FDIC-related costs, and increased
mortgage servicing and default-related expense. These items were
offset partially by lower headcount-related expense, including
salary and benefits but excluding performance-based incentives,
and other noncompensation costs related to employees.
Compensation expense increased in 2009 compared with the prior
year, reflecting higher performance-based incentives, as well as the
impact of the Washington Mutual transaction. Excluding these two
items, compensation expense decreased as a result of a reduction in
headcount, particularly in the wholesale businesses and in Corporate.
Noncompensation expense increased from the prior year, due
predominantly to the following: the impact of the Washington
Mutual transaction; higher ongoing FDIC insurance premiums and
an FDIC special assessment of $675 million recognized in the
second quarter of 2009; higher mortgage servicing and default-
related expense, which included an increase in foreclosed property
expense of $1.2 billion; higher litigation costs; and the effect of the
dissolution of the Chase Paymentech Solutions joint venture. These
increases were partially offset by lower headcount-related expense,
particularly in IB, TSS and AM; a decrease in amortization of
intangibles, predominantly related to purchased credit card
relationships; lower mortgage reinsurance losses; and a decrease in
credit card marketing expense. For a discussion of amortization of
intangibles, refer to Note 17 on pages 260–263 of this Annual
Report.
For information on merger costs, refer to Note 11 on page 213 of
this Annual Report.
Income tax expense Year ended December 31, (in millions, except rate) 2010 2009 2008 Income before income tax expense/
(benefit) and extraordinary gain $ 24,859 $ 16,067 $ 2,773 Income tax expense/(benefit) 7,489 4,415 (926) Effective tax rate 30.1% 27.5% (33.4)%
2010 compared with 2009
The increase in the effective tax rate compared with the prior year
was primarily the result of higher reported pretax book income, as
well as changes in the proportion of income subject to U.S. federal
and state and local taxes. These increases were partially offset by
increased benefits associated with the undistributed earnings of
certain non-U.S. subsidiaries that were deemed to be reinvested
indefinitely, as well as tax benefits recognized upon the resolution
of tax audits in 2010. For additional information on income taxes,
see Critical Accounting Estimates Used by the Firm on pages 149–
154 and Note 27 on pages 271–273 of this Annual Report.
2009 compared with 2008
The change in the effective tax rate compared with the prior year
was primarily the result of higher reported pretax income and
changes in the proportion of income subject to U.S. federal, state
and local taxes. Benefits related to tax-exempt income, business tax
credits and tax audit settlements increased in 2009 relative to
2008; however, the impact of these items on the effective tax rate
was reduced by the significantly higher level of pretax income in
2009. In addition, 2008 reflected the realization of benefits of $1.1
billion from the release of deferred tax liabilities associated with the
undistributed earnings of certain non-U.S. subsidiaries that were
deemed to be reinvested indefinitely.
Extraordinary gain On September 25, 2008, JPMorgan Chase acquired the banking
operations of Washington Mutual. This transaction was accounted
for under the purchase method of accounting for business
combinations. The adjusted net asset value of the banking
operations after purchase accounting adjustments was higher than
the consideration paid by JPMorgan Chase, resulting in an
extraordinary gain. The preliminary gain recognized in 2008 was
$1.9 billion. In the third quarter of 2009, the Firm recognized an
additional $76 million extraordinary gain associated with the final
purchase accounting adjustments for the acquisition. For a further
discussion of the Washington Mutual transaction, see Note 2 on
pages 166–170 of the Firm’s 2009 Annual Report.
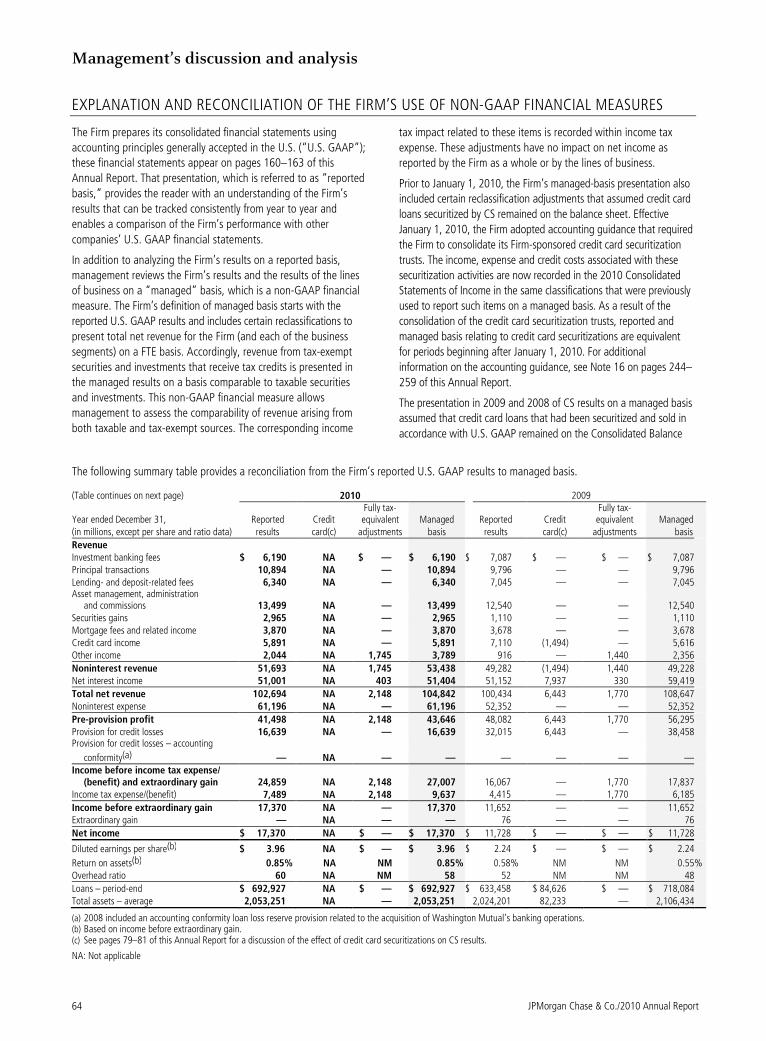
Management’s discussion and analysis
JPMorgan Chase & Co./2010 Annual Report 64
EXPLANATION AND RECONCILIATION OF THE FIRM’S USE OF NON-GAAP FINANCIAL MEASURES
The Firm prepares its consolidated financial statements using
accounting principles generally accepted in the U.S. (“U.S. GAAP”);
these financial statements appear on pages 160–163 of this
Annual Report. That presentation, which is referred to as “reported
basis,” provides the reader with an understanding of the Firm’s
results that can be tracked consistently from year to year and
enables a comparison of the Firm’s performance with other
companies’ U.S. GAAP financial statements.
In addition to analyzing the Firm’s results on a reported basis,
management reviews the Firm’s results and the results of the lines
of business on a “managed” basis, which is a non-GAAP financial
measure. The Firm’s definition of managed basis starts with the
reported U.S. GAAP results and includes certain reclassifications to
present total net revenue for the Firm (and each of the business
segments) on a FTE basis. Accordingly, revenue from tax-exempt
securities and investments that receive tax credits is presented in
the managed results on a basis comparable to taxable securities
and investments. This non-GAAP financial measure allows
management to assess the comparability of revenue arising from
both taxable and tax-exempt sources. The corresponding income
tax impact related to these items is recorded within income tax
expense. These adjustments have no impact on net income as
reported by the Firm as a whole or by the lines of business.
Prior to January 1, 2010, the Firm’s managed-basis presentation also
included certain reclassification adjustments that assumed credit card
loans securitized by CS remained on the balance sheet. Effective
January 1, 2010, the Firm adopted accounting guidance that required
the Firm to consolidate its Firm-sponsored credit card securitization
trusts. The income, expense and credit costs associated with these
securitization activities are now recorded in the 2010 Consolidated
Statements of Income in the same classifications that were previously
used to report such items on a managed basis. As a result of the
consolidation of the credit card securitization trusts, reported and
managed basis relating to credit card securitizations are equivalent
for periods beginning after January 1, 2010. For additional
information on the accounting guidance, see Note 16 on pages 244–
259 of this Annual Report.
The presentation in 2009 and 2008 of CS results on a managed basis
assumed that credit card loans that had been securitized and sold in
accordance with U.S. GAAP remained on the Consolidated Balance
The following summary table provides a reconciliation from the Firm’s reported U.S. GAAP results to managed basis.
(Table continues on next page) 2010 2009
Year ended December 31, Reported Credit Fully tax-equivalent Managed Reported Credit
Fully tax-equivalent Managed
(in millions, except per share and ratio data) results card(c) adjustments basis results card(c) adjustments basis
Revenue Investment banking fees $ 6,190 NA $ — $ 6,190 $ 7,087 $ — $ — $ 7,087 Principal transactions 10,894 NA — 10,894 9,796 — — 9,796 Lending- and deposit-related fees 6,340 NA — 6,340 7,045 — — 7,045 Asset management, administration
and commissions 13,499 NA — 13,499 12,540 — — 12,540 Securities gains 2,965 NA — 2,965 1,110 — — 1,110 Mortgage fees and related income 3,870 NA — 3,870 3,678 — — 3,678 Credit card income 5,891 NA — 5,891 7,110 (1,494) — 5,616 Other income 2,044 NA 1,745 3,789 916 — 1,440 2,356
Noninterest revenue 51,693 NA 1,745 53,438 49,282 (1,494) 1,440 49,228 Net interest income 51,001 NA 403 51,404 51,152 7,937 330 59,419
Total net revenue 102,694 NA 2,148 104,842 100,434 6,443 1,770 108,647 Noninterest expense 61,196 NA — 61,196 52,352 — — 52,352
Pre-provision profit 41,498 NA 2,148 43,646 48,082 6,443 1,770 56,295 Provision for credit losses 16,639 NA — 16,639 32,015 6,443 — 38,458 Provision for credit losses – accounting
conformity(a) — NA — — — — — — Income before income tax expense/
(benefit) and extraordinary gain 24,859 NA 2,148 27,007 16,067 — 1,770 17,837 Income tax expense/(benefit) 7,489 NA 2,148 9,637 4,415 — 1,770 6,185
Income before extraordinary gain 17,370 NA — 17,370 11,652 — — 11,652 Extraordinary gain — NA — — 76 — — 76
Net income $ 17,370 NA $ — $ 17,370 $ 11,728 $ — $ — $ 11,728
Diluted earnings per share(b) $ 3.96 NA $ — $ 3.96 $ 2.24 $ — $ — $ 2.24
Return on assets(b) 0.85% NA NM 0.85% 0.58% NM NM 0.55% Overhead ratio 60 NA NM 58 52 NM NM 48
Loans – period-end $ 692,927 NA $ — $ 692,927 $ 633,458 $ 84,626 $ — $ 718,084 Total assets – average 2,053,251 NA — 2,053,251 2,024,201 82,233 — 2,106,434
(a) 2008 included an accounting conformity loan loss reserve provision related to the acquisition of Washington Mutual’s banking operations. (b) Based on income before extraordinary gain. (c) See pages 79–81 of this Annual Report for a discussion of the effect of credit card securitizations on CS results.
NA: Not applicable
JPMorgan Chase & Co./2010 Annual Report 65
Sheets, and that the earnings on the securitized loans were classified
in the same manner as the earnings on retained loans recorded on
the Consolidated Balance Sheets. JPMorgan Chase had used this
managed-basis information to evaluate the credit performance and
overall financial performance of the entire managed credit card
portfolio. Operations were funded and decisions were made about
allocating resources, such as employees and capital, based on
managed financial information. In addition, the same underwriting
standards and ongoing risk monitoring are used for both loans on the
Consolidated Balance Sheets and securitized loans. Although
securitizations result in the sale of credit card receivables to a trust,
JPMorgan Chase retains the ongoing customer relationships, as the
customers may continue to use their credit cards; accordingly, the
customer’s credit performance affects both the securitized loans and
the loans retained on the Consolidated Balance Sheets. JPMorgan
Chase believed that this managed-basis information was useful to
investors, as it enabled them to understand both the credit risks
associated with the loans reported on the Consolidated Balance
Sheets and the Firm’s retained interests in securitized loans. For a
reconciliation of 2009 and 2008 reported to managed basis results
for CS, see CS segment results on pages 79–81 of this Annual
Report. For information regarding the securitization process, and
loans and residual interests sold and securitized, see Note 16 on
pages 244–259 of this Annual Report.
Tangible common equity (“TCE”) represents common stockholders’
equity (i.e., total stockholders’ equity less preferred stock) less
identifiable intangible assets (other than mortgage servicing rights
(“MSRs”)) and goodwill, net of related deferred tax liabilities.
ROTCE, a non-GAAP financial ratio, measures the Firm’s earnings
as a percentage of TCE and is, in management’s view, a
meaningful measure to assess the Firm’s use of equity.
Management also uses certain non-GAAP financial measures at the
business-segment level, because it believes these other non-GAAP
financial measures provide information to investors about the
underlying operational performance and trends of the particular
business segment and, therefore, facilitate a comparison of the
business segment with the performance of its competitors. Non-
GAAP financial measures used by the Firm may not be comparable
to similarly named non-GAAP financial measures used by other
companies.
(Table continued from previous page)
2008
Reported Credit Fully tax- equivalent Managed
results card(c) adjustments basis
$ 5,526 $ — $ — $ 5,526
(10,699) — — (10,699) 5,088 — — 5,088
13,943 — — 13,943 1,560 — — 1,560 3,467 — — 3,467 7,419 (3,333) — 4,086 2,169 — 1,329 3,498
28,473 (3,333) 1,329 26,469 38,779 6,945 579 46,303
67,252 3,612 1,908 72,772 43,500 — — 43,500
23,752 3,612 1,908 29,272 19,445 3,612 — 23,057
1,534 — — 1,534
2,773 — 1,908 4,681 (926) — 1,908 982
3,699 — — 3,699 1,906 — — 1,906
$ 5,605 $ — $ — $ 5,605
$ 0.81 $ — $ — $ 0.81 0.21% NM NM 0.20% 65 NM NM 60
$ 744,898 $ 85,571 $ — $ 830,469 1,791,617 76,904 — 1,868,521
Calculation of certain U.S. GAAP and non-GAAP metrics
The table below reflects the formulas used to calculate both the following U.S. GAAP and non-GAAP measures.
Return on common equity Net income* / Average common stockholders’ equity
Return on tangible common equity(d) Net income* / Average tangible common equity
Return on assets Reported net income / Total average assets Managed net income / Total average managed assets(e) (including average securitized credit card receivables)
Overhead ratio Total noninterest expense / Total net revenue
* Represents net income applicable to common equity
(d) The Firm uses ROTCE, a non-GAAP financial measure, to evaluate its use of equity and to facilitate comparisons with competitors. Refer to the following page for the calculation of average tangible common equity.
(e) The Firm uses return on managed assets, a non-GAAP financial measure, to evaluate the overall performance of the managed credit card portfolio, including securitized credit card loans.
Management’s discussion and analysis
JPMorgan Chase & Co./2010 Annual Report 66
Average tangible common equity
Year ended December 31, (in millions) 2010 2009 2008Common stockholders’ equity $ 161,520 $ 145,903 $ 129,116Less: Goodwill 48,618 48,254 46,068Less: Certain identifiable
intangible assets 4,178 5,095 5,779
Add: Deferred tax liabilities(a) 2,587 2,547 2,369Tangible Common Equity $ 111,311 $ 95,101 $ 79,638
(a) Represents deferred tax liabilities related to tax-deductible goodwill and to identifiable intangibles created in non-taxable transactions, which are netted against goodwill and other intangibles when calculating TCE.
Impact of TARP preferred stock issued to the U.S. Treasury
The calculation of 2009 net income applicable to common equity
included a one-time, noncash reduction of $1.1 billion resulting
from the repayment of TARP preferred capital. Excluding this
reduction, ROE would have been 7% for 2009. The Firm views
adjusted ROE, a non-GAAP financial measure, as meaningful
because it enables the comparability to prior periods.
Year ended December 31, 2009 (in millions, except ratios) As reported
Excluding the TARP redemption
Return on equity Net income $ 11,728 $ 11,728 Less: Preferred stock dividends 1,327 1,327 Less: Accelerated amortization
from redemption of preferred stock issued to the U.S. Treasury 1,112 —
Net income applicable to common equity 9,289 10,401
Average common stockholders’ equity $ 145,903 $ 145,903
ROE 6% 7 %
In addition, the calculated net income applicable to common equity for the
year ended December 31, 2009, was also affected by the TARP repayment.
The following table presents the effect on net income applicable to common
stockholders and the $0.27 reduction to diluted earnings per share (“EPS”)
for the year ended December 31, 2009.
Year ended December 31, 2009 (in millions, except per share) As reported
Effect of TARP redemption
Diluted earnings per share
Net income $ 11,728 $ — Less: Preferred stock dividends 1,327 — Less: Accelerated amortization
from redemption of preferred stock issued to the U.S. Treasury 1,112 1,112
Net income applicable to common equity 9,289 (1,112 )
Less: Dividends and undistributed earnings allocated to participating securities 515 (62 )
Net income applicable to common stockholders 8,774 (1,050 )
Total weighted average diluted shares outstanding 3,879.7 3,879.7
Net income per share $ 2.26 $ (0.27 )
Other financial measures
The Firm also discloses the allowance for loan losses to total
retained loans, excluding home lending purchased credit-impaired
loans and loans held by the Washington Mutual Master Trust
(“WMMT”). For a further discussion of this credit metric, see
Allowance for Credit Losses on pages 139–141 of this Annual
Report.

JPMorgan Chase & Co./2010 Annual Report 67
BUSINESS SEGMENT RESULTS
The Firm is managed on a line of business basis. The business
segment financial results presented reflect the current organization
of JPMorgan Chase. There are six major reportable business
segments: Investment Bank, Retail Financial Services, Card Services,
Commercial Banking, Treasury & Securities Services and Asset
Management, as well as a Corporate/Private Equity segment.
The business segments are determined based on the products and
services provided, or the type of customer served, and reflect the
manner in which financial information is currently evaluated by
management. Results of these lines of business are presented on a
managed basis.
Description of business segment reporting methodology
Results of the business segments are intended to reflect each segment
as if it were essentially a stand-alone business. The management
reporting process that derives business segment results allocates
income and expense using market-based methodologies. Business
segment reporting methodologies used by the Firm are discussed
below. The Firm continues to assess the assumptions, methodologies
and reporting classifications used for segment reporting, and further
refinements may be implemented in future periods.
Revenue sharing
When business segments join efforts to sell products and services
to the Firm’s clients, the participating business segments agree to
share revenue from those transactions. The segment results reflect
these revenue-sharing agreements.
Funds transfer pricing
Funds transfer pricing is used to allocate interest income and
expense to each business and transfer the primary interest rate risk
exposures to the Treasury group within the Corporate/Private Equity
business segment. The allocation process is unique to each
business segment and considers the interest rate risk, liquidity risk
and regulatory requirements of that segment’s stand-alone peers.
This process is overseen by senior management and reviewed by
the Firm’s Asset-Liability Committee (“ALCO”). Business segments
may be permitted to retain certain interest rate exposures subject to
management approval.
JPMorgan Chase
Investment Bank
Retail Financial Services
Card
Services
Commercial
Banking
Treasury & Securities Services
Asset
Management
Businesses: • Investment Banking - Advisory - Debt and equity underwriting
• Market-making and trading - Fixed income - Equities
• Corporate lending
• Prime Services
• Research
Businesses: • Retail Banking
- Consumer and Business Banking (includ- ing Business Banking loans) • Mortgage Banking, Auto & Other Consumer Lending: - Mortgage production and servicing - Auto, student and other loan originations and balances • Real Estate Portfolios: - Residential mortgage loans - Home equity loans and originations
Businesses: • Credit Card
• Merchant Acquiring
Businesses: • Middle Market Banking
• Commercial Term Lending
• Mid-Corporate Banking
• Real Estate Banking
Businesses: • Treasury Services
• Worldwide Securities Services
Businesses: • Private Banking
• Investment Management: - Institutional - Retail
• Highbridge
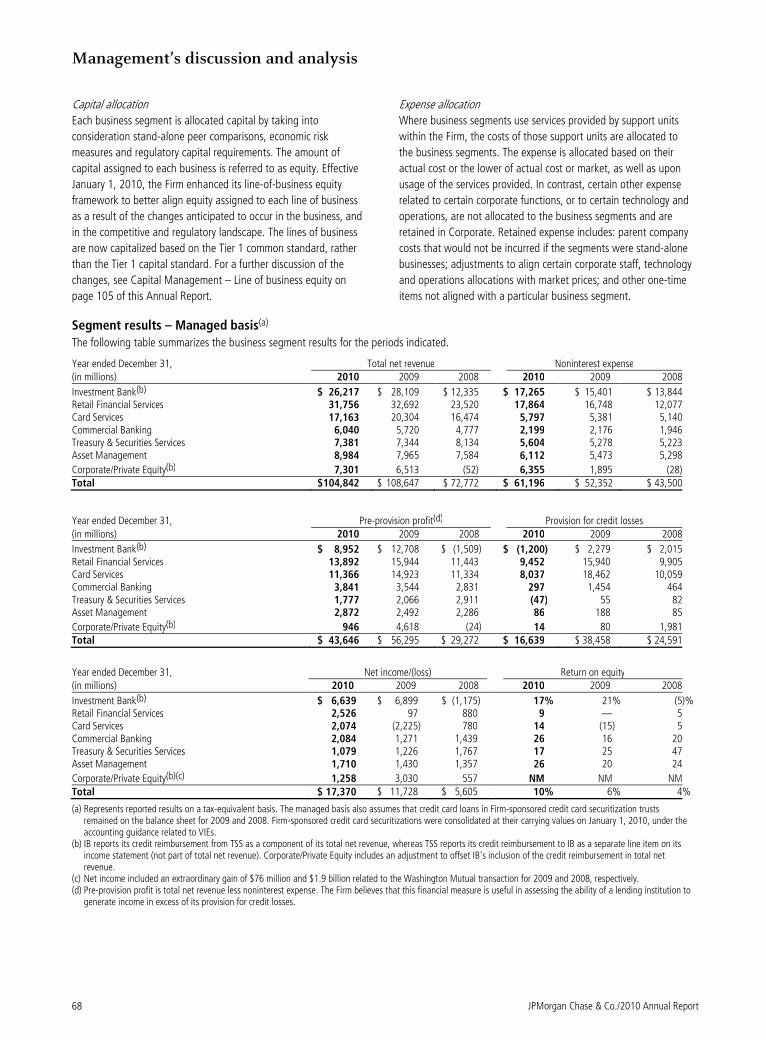
Management’s discussion and analysis
JPMorgan Chase & Co./2010 Annual Report 68
Capital allocation
Each business segment is allocated capital by taking into
consideration stand-alone peer comparisons, economic risk
measures and regulatory capital requirements. The amount of
capital assigned to each business is referred to as equity. Effective
January 1, 2010, the Firm enhanced its line-of-business equity
framework to better align equity assigned to each line of business
as a result of the changes anticipated to occur in the business, and
in the competitive and regulatory landscape. The lines of business
are now capitalized based on the Tier 1 common standard, rather
than the Tier 1 capital standard. For a further discussion of the
changes, see Capital Management – Line of business equity on
page 105 of this Annual Report.
Expense allocation
Where business segments use services provided by support units
within the Firm, the costs of those support units are allocated to
the business segments. The expense is allocated based on their
actual cost or the lower of actual cost or market, as well as upon
usage of the services provided. In contrast, certain other expense
related to certain corporate functions, or to certain technology and
operations, are not allocated to the business segments and are
retained in Corporate. Retained expense includes: parent company
costs that would not be incurred if the segments were stand-alone
businesses; adjustments to align certain corporate staff, technology
and operations allocations with market prices; and other one-time
items not aligned with a particular business segment.
Segment results – Managed basis(a) The following table summarizes the business segment results for the periods indicated.
Year ended December 31, Total net revenue Noninterest expense (in millions) 2010 2009 2008 2010 2009 2008
Investment Bank(b) $ 26,217 $ 28,109 $ 12,335 $ 17,265 $ 15,401 $ 13,844 Retail Financial Services 31,756 32,692 23,520 17,864 16,748 12,077 Card Services 17,163 20,304 16,474 5,797 5,381 5,140 Commercial Banking 6,040 5,720 4,777 2,199 2,176 1,946 Treasury & Securities Services 7,381 7,344 8,134 5,604 5,278 5,223 Asset Management 8,984 7,965 7,584 6,112 5,473 5,298
Corporate/Private Equity(b) 7,301 6,513 (52) 6,355 1,895 (28) Total $ 104,842 $ 108,647 $ 72,772 $ 61,196 $ 52,352 $ 43,500
Year ended December 31, Pre-provision profit(d) Provision for credit losses (in millions) 2010 2009 2008 2010 2009 2008
Investment Bank(b) $ 8,952 $ 12,708 $ (1,509) $ (1,200) $ 2,279 $ 2,015 Retail Financial Services 13,892 15,944 11,443 9,452 15,940 9,905 Card Services 11,366 14,923 11,334 8,037 18,462 10,059 Commercial Banking 3,841 3,544 2,831 297 1,454 464 Treasury & Securities Services 1,777 2,066 2,911 (47) 55 82 Asset Management 2,872 2,492 2,286 86 188 85
Corporate/Private Equity(b) 946 4,618 (24) 14 80 1,981 Total $ 43,646 $ 56,295 $ 29,272 $ 16,639 $ 38,458 $ 24,591
Year ended December 31, Net income/(loss) Return on equity (in millions) 2010 2009 2008 2010 2009 2008
Investment Bank(b) $ 6,639 $ 6,899 $ (1,175) 17% 21% (5 )% Retail Financial Services 2,526 97 880 9 — 5 Card Services 2,074 (2,225) 780 14 (15) 5 Commercial Banking 2,084 1,271 1,439 26 16 20 Treasury & Securities Services 1,079 1,226 1,767 17 25 47 Asset Management 1,710 1,430 1,357 26 20 24
Corporate/Private Equity(b)(c) 1,258 3,030 557 NM NM NM Total $ 17,370 $ 11,728 $ 5,605 10% 6% 4 %
(a) Represents reported results on a tax-equivalent basis. The managed basis also assumes that credit card loans in Firm-sponsored credit card securitization trusts remained on the balance sheet for 2009 and 2008. Firm-sponsored credit card securitizations were consolidated at their carrying values on January 1, 2010, under the accounting guidance related to VIEs.
(b) IB reports its credit reimbursement from TSS as a component of its total net revenue, whereas TSS reports its credit reimbursement to IB as a separate line item on its income statement (not part of total net revenue). Corporate/Private Equity includes an adjustment to offset IB's inclusion of the credit reimbursement in total net revenue.
(c) Net income included an extraordinary gain of $76 million and $1.9 billion related to the Washington Mutual transaction for 2009 and 2008, respectively. (d) Pre-provision profit is total net revenue less noninterest expense. The Firm believes that this financial measure is useful in assessing the ability of a lending institution to
generate income in excess of its provision for credit losses.
JPMorgan Chase & Co./2010 Annual Report 69
INVESTMENT BANK
J.P. Morgan is one of the world’s leading investment
banks, with deep client relationships and broad product
capabilities. The clients of IB are corporations, financial
institutions, governments and institutional investors. The
Firm offers a full range of investment banking products
and services in all major capital markets, including
advising on corporate strategy and structure, capital-
raising in equity and debt markets, sophisticated risk
management, market-making in cash securities and
derivative instruments, prime brokerage, and research.
Selected income statement data Year ended December 31, (in millions, except ratios) 2010 2009
2008(e) Revenue Investment banking fees $ 6,186 $ 7,169 $ 5,907
Principal transactions(a) 8,454 8,154 (7,042) Lending- and deposit-related fees 819 664 463 Asset management, administration and commissions 2,413 2,650 3,064
All other income(b) 381 (115) (341) Noninterest revenue 18,253 18,522 2,051 Net interest income 7,964 9,587 10,284
Total net revenue(c) 26,217 28,109 12,335
Provision for credit losses (1,200) 2,279 2,015
Noninterest expense Compensation expense 9,727 9,334 7,701 Noncompensation expense 7,538 6,067 6,143 Total noninterest expense 17,265 15,401 13,844 Income/(loss) before income tax expense/(benefit) 10,152 10,429 (3,524)
Income tax expense/(benefit)(d) 3,513 3,530 (2,349) Net income/(loss) $ 6,639 $ 6,899 $ (1,175)
Financial ratios ROE 17% 21% (5 )% ROA 0.91 0.99 (0.14) Overhead ratio 66 55 112 Compensation expense as % of total
net revenue(f) 37 33 62
(a) The 2009 results reflect modest net gains on legacy leveraged lending and mortgage-related positions, compared with net markdowns of $10.6 billion in 2008.
(b) TSS was charged a credit reimbursement related to certain exposures managed within IB’s credit portfolio on behalf of clients shared with TSS. IB recognizes this credit reimbursement in its credit portfolio business in all other income.
(c) Total net revenue included tax-equivalent adjustments, predominantly due to income tax credits related to affordable housing and alternative energy investments as well as tax-exempt income from municipal bond investments of $1.7 billion, $1.4 billion and $1.7 billion for 2010, 2009 and 2008, respectively.
(d) The income tax benefit in 2008 includes the result of reduced deferred tax liabilities on overseas earnings.
(e) Results for 2008 include seven months of the combined Firm’s (JPMorgan Chase & Co.’s and Bear Stearns’) results and five months of heritage JPMorgan Chase results.
(f) The compensation expense as a percentage of total net revenue ratio includes the impact of the U.K. Bank Payroll Tax on certain compensation awarded from December 9, 2009 to April 5, 2010 to relevant banking employees. For comparability to prior periods, IB excludes the impact of the U.K. Bank Payroll Tax expense, which results in a compensation expense as a percentage of total net revenue for 2010 of 35%, which is a non-GAAP financial measure.
The following table provides IB’s total net revenue by business segment.
Year ended December 31, (in millions) 2010 2009
2008(e) Revenue by business Investment banking fees: Advisory $ 1,469 $ 1,867 $ 2,008 Equity underwriting 1,589 2,641 1,749 Debt underwriting 3,128 2,661 2,150 Total investment banking fees 6,186 7,169 5,907
Fixed income markets(a) 15,025 17,564 1,957
Equity markets(b) 4,763 4,393 3,611
Credit portfolio(c)(d) 243 (1,017) 860 Total net revenue $ 26,217 $ 28,109 $12,335
Revenue by region(d) Americas $ 15,189 $ 15,156 $ 2,610 Europe/Middle East/Africa 7,405 9,790 7,710 Asia/Pacific 3,623 3,163 2,015 Total net revenue $ 26,217 $ 28,109 $12,335
(a) Fixed income markets primarily include revenue related to market-making across global fixed income markets, including foreign exchange, interest rate, credit and commodities markets.
(b) Equities markets primarily include revenue related to market-making across global equity products, including cash instruments, derivatives, convertibles and prime services.
(c) Credit portfolio revenue includes net interest income, fees and loan sale activity, as well as gains or losses on securities received as part of a loan restructuring, for IB’s credit portfolio. Credit portfolio revenue also includes the results of risk management related to the Firm’s lending and derivative activities. See pages 116–118 of the Credit Risk Management section of this Annual Report for further discussion.
(d) TSS was charged a credit reimbursement related to certain exposures managed within IB’s credit portfolio on behalf of clients shared with TSS. IB recognizes this credit reimbursement in its credit portfolio business in all other income.
(e) Results for 2008 include seven months of the combined Firm’s (JPMorgan Chase & Co.’s and Bear Stearns’) results and five months of heritage JPMorgan Chase & Co. results.
2010 compared with 2009
Net income was $6.6 billion, down 4% compared with the prior year.
These results primarily reflected lower net revenue as well as higher
noninterest expense, largely offset by a benefit from the provision for
credit losses, compared with an expense in the prior year.
Net revenue was $26.2 billion, compared with $28.1 billion in the
prior year. Investment banking fees were $6.2 billion, down 14%
from the prior year; these consisted of record debt underwriting
fees of $3.1 billion (up 18%), equity underwriting fees of
$1.6 billion (down 40%), and advisory fees of $1.5 billion (down
21%). Fixed Income Markets revenue was $15.0 billion, compared
with $17.6 billion in the prior year. The decrease from the prior
year largely reflected lower results in rates and credit markets,
partially offset by gains of $287 million from the widening of the
Firm’s credit spread on certain structured liabilities, compared with
losses of $1.1 billion in the prior year. Equity Markets revenue was
$4.8 billion, compared with $4.4 billion in the prior year, reflecting
solid client revenue, as well as gains of $181 million from the
widening of the Firm’s credit spread on certain structured liabilities,
compared with losses of $596 million in the prior year. Credit
Portfolio revenue was $243 million, primarily reflecting net interest
income and fees on loans, partially offset by the negative impact of
Management’s discussion and analysis
JPMorgan Chase & Co./2010 Annual Report 70
credit spreads on derivative assets and mark-to-market losses on
hedges of retained loans.
The provision for credit losses was a benefit of $1.2 billion, compared
with an expense of $2.3 billion in the prior year. The current-year
provision reflected a reduction in the allowance for loan losses, largely
related to net repayments and loan sales. Net charge-offs were
$735 million, compared with $1.9 billion in the prior year.
Noninterest expense was $17.3 billion, up $1.9 billion from the prior
year, driven by higher noncompensation expense, which included
increased litigation reserves, and higher compensation expense
which included the impact of the U.K. Bank Payroll Tax.
Return on Equity was 17% on $40.0 billion of average allocated
capital.
2009 compared with 2008
Net income was $6.9 billion, compared with a net loss of $1.2
billion in the prior year. These results reflected significantly higher
total net revenue, partially offset by higher noninterest expense and
a higher provision for credit losses.
Total net revenue was $28.1 billion, compared with $12.3 billion in
the prior year. Investment banking fees were up 21% to $7.2
billion, consisting of debt underwriting fees of $2.7 billion (up
24%), equity underwriting fees of $2.6 billion (up 51%), and
advisory fees of $1.9 billion (down 7%). Fixed Income Markets
revenue was $17.6 billion, compared with $2.0 billion in the prior
year, reflecting improved performance across most products and
modest net gains on legacy leveraged lending and mortgage-
related positions, compared with net markdowns of $10.6 billion in
the prior year. Equity Markets revenue was $4.4 billion, up 22%
from the prior year, driven by strong client revenue across products,
particularly prime services, and improved trading results. Fixed
Income and Equity Markets results also included losses of $1.7
billion from the tightening of the Firm’s credit spread on certain
structured liabilities, compared with gains of $1.2 billion in the
prior year. Credit Portfolio revenue was a loss of $1.0 billion versus
a gain of $860 million in the prior year, driven by mark-to-market
losses on hedges of retained loans compared with gains in the prior
year, partially offset by the positive net impact of credit spreads on
derivative assets and liabilities.
The provision for credit losses was $2.3 billion, compared with $2.0
billion in the prior year, reflecting continued weakness in the credit
environment. The allowance for loan losses to end-of-period loans
retained was 8.25%, compared with 4.83% in the prior year. Net
charge-offs were $1.9 billion, compared with $105 million in the
prior year. Total nonperforming assets were $4.2 billion, compared
with $2.5 billion in the prior year.
Noninterest expense was $15.4 billion, up $1.6 billion, or 11%,
from the prior year, driven by higher performance-based
compensation expense, partially offset by lower headcount-related
expense.
Return on Equity was 21% on $33.0 billion of average allocated capital, compared with negative 5% on $26.1 billion of average allocated capital in the prior year. Selected metrics As of or for the year ended December 31, (in millions, except headcount) 2010 2009 2008Selected balance sheet data
(period-end) Loans:(a)
Loans retained(b) $ 53,145 $ 45,544 $ 71,357 Loans held-for-sale and loans at fair value 3,746 3,567 13,660Total loans 56,891 49,111 85,017
Equity 40,000 33,000 33,000
Selected balance sheet data (average)
Total assets $ 731,801 $ 699,039 $ 832,729Trading assets – debt and equity
instruments 307,061 273,624 350,812Trading assets – derivative
receivables 70,289 96,042 112,337Loans: (a)
Loans retained(b) 54,402 62,722 73,108Loans held-for-sale and loans at fair value 3,215 7,589 18,502Total loans 57,617 70,311 91,610
Adjusted assets(c) 540,449 538,724 679,780Equity 40,000 33,000 26,098
Headcount 26,314 24,654 27,938
(a) Effective January 1, 2010, the Firm adopted accounting guidance related to VIEs. Upon adoption of the guidance, the Firm consolidated its Firm-administered multi-seller conduits. As a result, $15.1 billion of related loans were recorded in loans on the Consolidated Balance Sheets.
(b) Loans retained included credit portfolio loans, leveraged leases and other accrual loans, and excluded loans held-for-sale and loans at fair value.
(c) Adjusted assets, a non-GAAP financial measure, equals total assets minus (1) securities purchased under resale agreements and securities borrowed less securities sold, not yet purchased; (2) assets of variable interest entities (“VIEs”); (3) cash and securities segregated and on deposit for regulatory and other purposes; (4) goodwill and intangibles; (5) securities received as collateral; and (6) investments purchased under the Asset-Backed Commercial Paper Money Market Mutual Fund Liquidity Facility (“AML Facility”). The amount of adjusted assets is presented to assist the reader in comparing IB’s asset and capital levels to other investment banks in the securities industry. Asset-to-equity leverage ratios are commonly used as one measure to assess a company’s capital adequacy. IB believes an adjusted asset amount that excludes the assets discussed above, which were considered to have a low risk profile, provides a more meaningful measure of balance sheet leverage in the securities industry.
JPMorgan Chase & Co./2010 Annual Report 71
Selected metrics As of or for the year ended December 31, (in millions, except ratios) 2010 2009 2008
Credit data and quality statistics Net charge-offs $ 735 $ 1,904 $ 105 Nonperforming assets:
Nonaccrual loans:
Nonaccrual loans retained(a)(b) 3,159 3,196 1,143 Nonaccrual loans held-for-sale and
loans at fair value 460 308 32
Total nonperforming loans 3,619 3,504 1,175 Derivative receivables 34 529 1,079 Assets acquired in loan satisfactions 117 203 247
Total nonperforming assets 3,770 4,236 2,501
Allowance for credit losses: Allowance for loan losses 1,863 3,756 3,444 Allowance for lending-related commitments 447 485 360
Total allowance for credit losses 2,310 4,241 3,804
Net charge-off rate(a)(c) 1.35% 3.04% 0.14% Allowance for loan losses to period-end
loans retained(a)(c) 3.51 8.25 4.83 Allowance for loan losses to average
loans retained(a)(c)(d) 3.42 5.99 4.71(i)
Allowance for loan losses to
nonaccrual loans retained(a)(b)(c) 59 118 301 Nonaccrual loans to total period-end loans 6.36 7.13 1.38 Nonaccrual loans to average loans 6.28 4.98 1.28
Market risk–average trading and credit portfolio VaR – 95%
confidence level(e) Trading activities:
Fixed income $ 65 $ 160 $ 162
Foreign exchange 11 18 23 Equities 22 47 47 Commodities and other 16 20 23
Diversification(f) (43) (91) (88)
Total trading VaR(g) 71 154 167
Credit portfolio VaR(h) 26 52 45
Diversification(f) (10) (42) (36)
Total trading and credit portfolio VaR $ 87 $ 164 $ 176
(a) Loans retained included credit portfolio loans, leveraged leases and other accrual loans, and excluded loans held-for-sale and loans accounted for at fair value.
(b) Allowance for loan losses of $1.1 billion, $1.3 billion and $430 million were held against these nonaccural loans at December 31, 2010, 2009 and 2008, respectively.
(c) Loans held-for-sale and loans at fair value were excluded when calculating the allowance coverage ratio and net charge-off rate.
(d) Results for 2008 include seven months of the combined Firm’s (JPMorgan Chase & Co.’s and Bear Stearns’) results and five months of heritage JPMorgan Chase & Co.’s results only.
(e) For 2008, 95% VaR reflects data only for the last six months of the year as the Firm began to calculate VaR using a 95% confidence level effective in the third quarter of 2008, rather than the prior 99% confidence level.
(f) Average value-at-risk (“VaR”) was less than the sum of the VaR of the components described above, which is due to portfolio diversification. The diversification effect reflects the fact that the risks were not perfectly correlated. The risk of a portfolio of positions is therefore usually less than the sum of the risks of the positions themselves.
(g) Trading VaR includes predominantly all trading activities in IB, as well as syndicated lending facilities that the Firm intends to distribute; however,
particular risk parameters of certain products are not fully captured, for example, correlation risk. Trading VaR does not include the debit valuation adjustments (“DVA”) taken on derivative and structured liabilities to reflect the credit quality of the Firm. See VaR discussion on pages 142–146 and the DVA Sensitivity table on page 144 of this Annual Report for further details. Trading VaR includes the estimated credit spread sensitivity of certain mortgage products.
(h) Credit portfolio VaR includes the derivative credit valuation adjustments (“CVA”), hedges of the CVA and mark-to-market (“MTM”) hedges of the retained loan portfolio, which were all reported in principal transactions revenue. This VaR does not include the retained loan portfolio.
(i) Excluding the impact of a loan originated in March 2008 to Bear Stearns, the adjusted ratio would be 4.84% for 2008. The average balance of the loan extended to Bear Stearns was $1.9 billion for 2008.
Market shares and rankings(a)
2010 2009 2008 Year ended Market Market Market December 31, share Rankings share Rankings share Rankings Global investment
banking fees (b) 8% #1 9% #1 9% #2 Debt, equity and equity-related Global 7 1 9 1 8 2 U.S. 11 2 15 1 14 2 Syndicated loans Global 9 1 8 1 9 1 U.S. 19 2 22 1 22 1
Long-term debt (c) Global 7 2 8 1 8 3 U.S. 11 2 14 1 14 2 Equity and equity- related
Global(d) 7 3 12 1 12 2 U.S. 13 2 16 2 16 2
Announced M&A(e) Global 16 4 24 3 25 1 U.S. 23 3 36 2 31 2
(a) Source: Dealogic. Global Investment Banking fees reflects ranking of fees and market share. Remainder of rankings reflects transaction volume rank and market share. Results for 2008 are pro forma for the Bear Stearns merger.
(b) Global IB fees exclude money market, short-term debt and shelf deals. (c) Long-term debt tables include investment-grade, high-yield, supranationals,
sovereigns, agencies, covered bonds, asset-backed securities and mortgage-backed securities; and exclude money market, short-term debt, and U.S. municipal securities.
(d) Equity and equity-related rankings include rights offerings and Chinese A-Shares.
(e) Global announced M&A is based on transaction value at announcement; all other rankings are based on transaction proceeds, with full credit to each book manager/equal if joint. Because of joint assignments, market share of all participants will add up to more than 100%. M&A for 2010, 2009 and 2008, reflects the removal of any withdrawn transactions. U.S. announced M&A represents any U.S. involvement ranking.
According to Dealogic, the Firm was ranked #1 in Global
Investment Banking Fees generated during 2010, based on
revenue; #1 in Global Debt, Equity and Equity-related; #1 in
Global Syndicated Loans; #2 in Global Long-Term Debt; #3 in
Global Equity and Equity-related; and #4 in Global Announced
M&A, based on volume.
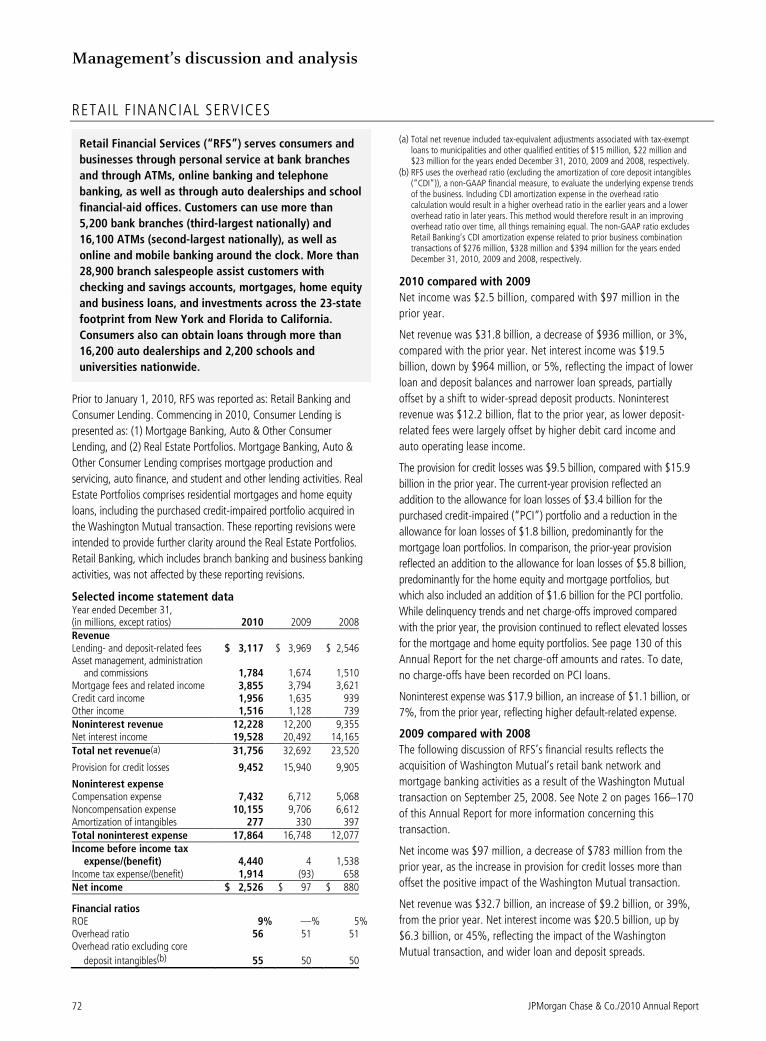
Management’s discussion and analysis
JPMorgan Chase & Co./2010 Annual Report 72
RETAIL FINANCIAL SERVICES
Retail Financial Services (“RFS”) serves consumers and
businesses through personal service at bank branches
and through ATMs, online banking and telephone
banking, as well as through auto dealerships and school
financial-aid offices. Customers can use more than
5,200 bank branches (third-largest nationally) and
16,100 ATMs (second-largest nationally), as well as
online and mobile banking around the clock. More than
28,900 branch salespeople assist customers with
checking and savings accounts, mortgages, home equity
and business loans, and investments across the 23-state
footprint from New York and Florida to California.
Consumers also can obtain loans through more than
16,200 auto dealerships and 2,200 schools and
universities nationwide.
Prior to January 1, 2010, RFS was reported as: Retail Banking and
Consumer Lending. Commencing in 2010, Consumer Lending is
presented as: (1) Mortgage Banking, Auto & Other Consumer
Lending, and (2) Real Estate Portfolios. Mortgage Banking, Auto &
Other Consumer Lending comprises mortgage production and
servicing, auto finance, and student and other lending activities. Real
Estate Portfolios comprises residential mortgages and home equity
loans, including the purchased credit-impaired portfolio acquired in
the Washington Mutual transaction. These reporting revisions were
intended to provide further clarity around the Real Estate Portfolios.
Retail Banking, which includes branch banking and business banking
activities, was not affected by these reporting revisions.
Selected income statement data Year ended December 31, (in millions, except ratios) 2010 2009 2008 Revenue Lending- and deposit-related fees $ 3,117 $ 3,969 $ 2,546 Asset management, administration
and commissions 1,784 1,674 1,510 Mortgage fees and related income 3,855 3,794 3,621 Credit card income 1,956 1,635 939 Other income 1,516 1,128 739 Noninterest revenue 12,228 12,200 9,355 Net interest income 19,528 20,492 14,165
Total net revenue(a) 31,756 32,692 23,520
Provision for credit losses 9,452 15,940 9,905
Noninterest expense Compensation expense 7,432 6,712 5,068 Noncompensation expense 10,155 9,706 6,612 Amortization of intangibles 277 330 397 Total noninterest expense 17,864 16,748 12,077 Income before income tax
expense/(benefit) 4,440 4 1,538 Income tax expense/(benefit) 1,914 (93) 658 Net income $ 2,526 $ 97 $ 880
Financial ratios ROE 9% —% 5% Overhead ratio 56 51 51 Overhead ratio excluding core
deposit intangibles(b) 55 50 50
(a) Total net revenue included tax-equivalent adjustments associated with tax-exempt loans to municipalities and other qualified entities of $15 million, $22 million and $23 million for the years ended December 31, 2010, 2009 and 2008, respectively.
(b) RFS uses the overhead ratio (excluding the amortization of core deposit intangibles (“CDI”)), a non-GAAP financial measure, to evaluate the underlying expense trends of the business. Including CDI amortization expense in the overhead ratio calculation would result in a higher overhead ratio in the earlier years and a lower overhead ratio in later years. This method would therefore result in an improving overhead ratio over time, all things remaining equal. The non-GAAP ratio excludes Retail Banking’s CDI amortization expense related to prior business combination transactions of $276 million, $328 million and $394 million for the years ended December 31, 2010, 2009 and 2008, respectively.
2010 compared with 2009
Net income was $2.5 billion, compared with $97 million in the
prior year.
Net revenue was $31.8 billion, a decrease of $936 million, or 3%,
compared with the prior year. Net interest income was $19.5
billion, down by $964 million, or 5%, reflecting the impact of lower
loan and deposit balances and narrower loan spreads, partially
offset by a shift to wider-spread deposit products. Noninterest
revenue was $12.2 billion, flat to the prior year, as lower deposit-
related fees were largely offset by higher debit card income and
auto operating lease income.
The provision for credit losses was $9.5 billion, compared with $15.9
billion in the prior year. The current-year provision reflected an
addition to the allowance for loan losses of $3.4 billion for the
purchased credit-impaired (“PCI”) portfolio and a reduction in the
allowance for loan losses of $1.8 billion, predominantly for the
mortgage loan portfolios. In comparison, the prior-year provision
reflected an addition to the allowance for loan losses of $5.8 billion,
predominantly for the home equity and mortgage portfolios, but
which also included an addition of $1.6 billion for the PCI portfolio.
While delinquency trends and net charge-offs improved compared
with the prior year, the provision continued to reflect elevated losses
for the mortgage and home equity portfolios. See page 130 of this
Annual Report for the net charge-off amounts and rates. To date,
no charge-offs have been recorded on PCI loans.
Noninterest expense was $17.9 billion, an increase of $1.1 billion, or
7%, from the prior year, reflecting higher default-related expense.
2009 compared with 2008
The following discussion of RFS’s financial results reflects the
acquisition of Washington Mutual’s retail bank network and
mortgage banking activities as a result of the Washington Mutual
transaction on September 25, 2008. See Note 2 on pages 166–170
of this Annual Report for more information concerning this
transaction.
Net income was $97 million, a decrease of $783 million from the
prior year, as the increase in provision for credit losses more than
offset the positive impact of the Washington Mutual transaction.
Net revenue was $32.7 billion, an increase of $9.2 billion, or 39%,
from the prior year. Net interest income was $20.5 billion, up by
$6.3 billion, or 45%, reflecting the impact of the Washington
Mutual transaction, and wider loan and deposit spreads.
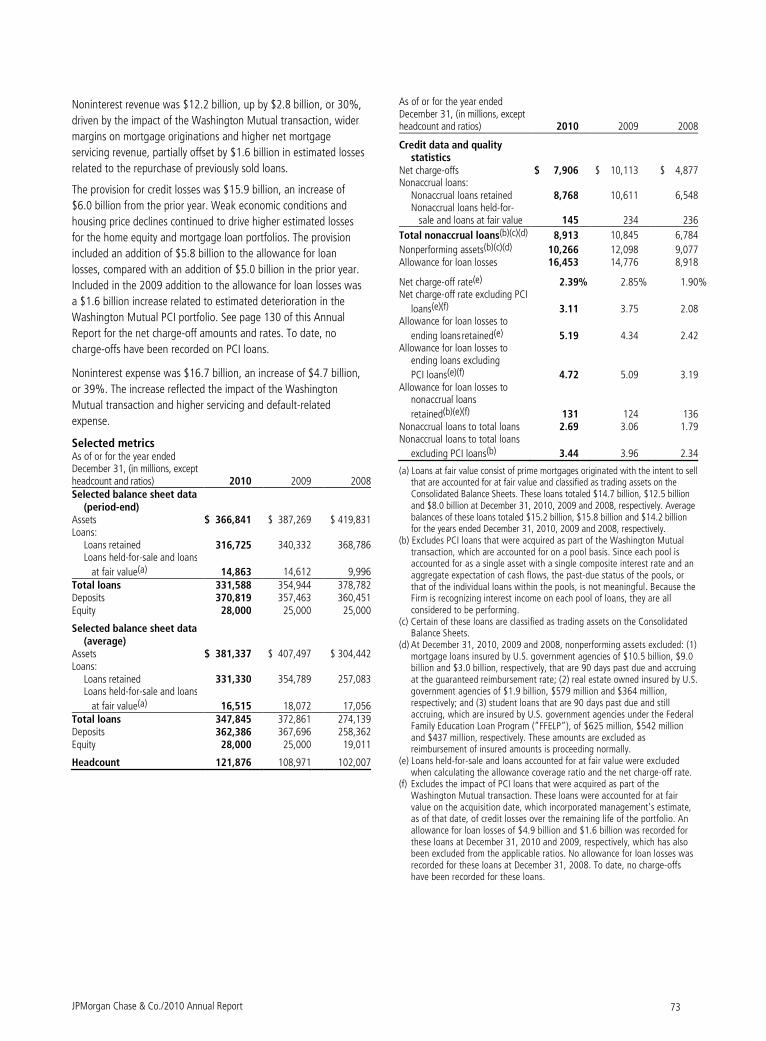
JPMorgan Chase & Co./2010 Annual Report 73
Noninterest revenue was $12.2 billion, up by $2.8 billion, or 30%,
driven by the impact of the Washington Mutual transaction, wider
margins on mortgage originations and higher net mortgage
servicing revenue, partially offset by $1.6 billion in estimated losses
related to the repurchase of previously sold loans.
The provision for credit losses was $15.9 billion, an increase of
$6.0 billion from the prior year. Weak economic conditions and
housing price declines continued to drive higher estimated losses
for the home equity and mortgage loan portfolios. The provision
included an addition of $5.8 billion to the allowance for loan
losses, compared with an addition of $5.0 billion in the prior year.
Included in the 2009 addition to the allowance for loan losses was
a $1.6 billion increase related to estimated deterioration in the
Washington Mutual PCI portfolio. See page 130 of this Annual
Report for the net charge-off amounts and rates. To date, no
charge-offs have been recorded on PCI loans.
Noninterest expense was $16.7 billion, an increase of $4.7 billion,
or 39%. The increase reflected the impact of the Washington
Mutual transaction and higher servicing and default-related
expense.
Selected metrics
As of or for the year ended December 31, (in millions, except headcount and ratios) 2010 2009 2008 Selected balance sheet data
(period-end) Assets $ 366,841 $ 387,269 $ 419,831 Loans:
Loans retained 316,725 340,332 368,786 Loans held-for-sale and loans
at fair value(a) 14,863 14,612 9,996 Total loans 331,588 354,944 378,782 Deposits 370,819 357,463 360,451 Equity 28,000 25,000 25,000
Selected balance sheet data (average)
Assets $ 381,337 $ 407,497 $ 304,442 Loans:
Loans retained 331,330 354,789 257,083 Loans held-for-sale and loans
at fair value(a) 16,515 18,072 17,056 Total loans 347,845 372,861 274,139 Deposits 362,386 367,696 258,362 Equity 28,000 25,000 19,011
Headcount 121,876 108,971 102,007
As of or for the year ended December 31, (in millions, except headcount and ratios) 2010 2009 2008
Credit data and quality statistics
Net charge-offs $ 7,906 $ 10,113 $ 4,877 Nonaccrual loans:
Nonaccrual loans retained 8,768 10,611 6,548 Nonaccrual loans held-for- sale and loans at fair value 145 234 236
Total nonaccrual loans(b)(c)(d) 8,913 10,845 6,784
Nonperforming assets(b)(c)(d) 10,266 12,098 9,077 Allowance for loan losses 16,453 14,776 8,918
Net charge-off rate(e) 2.39% 2.85% 1.90% Net charge-off rate excluding PCI
loans(e)(f) 3.11 3.75 2.08 Allowance for loan losses to
ending loans retained(e) 5.19 4.34 2.42 Allowance for loan losses to
ending loans excluding
PCI loans(e)(f) 4.72 5.09 3.19 Allowance for loan losses to
nonaccrual loans
retained(b)(e)(f) 131 124 136 Nonaccrual loans to total loans 2.69 3.06 1.79 Nonaccrual loans to total loans
excluding PCI loans(b) 3.44 3.96 2.34
(a) Loans at fair value consist of prime mortgages originated with the intent to sell that are accounted for at fair value and classified as trading assets on the Consolidated Balance Sheets. These loans totaled $14.7 billion, $12.5 billion and $8.0 billion at December 31, 2010, 2009 and 2008, respectively. Average balances of these loans totaled $15.2 billion, $15.8 billion and $14.2 billion for the years ended December 31, 2010, 2009 and 2008, respectively.
(b) Excludes PCI loans that were acquired as part of the Washington Mutual transaction, which are accounted for on a pool basis. Since each pool is accounted for as a single asset with a single composite interest rate and an aggregate expectation of cash flows, the past-due status of the pools, or that of the individual loans within the pools, is not meaningful. Because the Firm is recognizing interest income on each pool of loans, they are all considered to be performing.
(c) Certain of these loans are classified as trading assets on the Consolidated Balance Sheets.
(d) At December 31, 2010, 2009 and 2008, nonperforming assets excluded: (1) mortgage loans insured by U.S. government agencies of $10.5 billion, $9.0 billion and $3.0 billion, respectively, that are 90 days past due and accruing at the guaranteed reimbursement rate; (2) real estate owned insured by U.S. government agencies of $1.9 billion, $579 million and $364 million, respectively; and (3) student loans that are 90 days past due and still accruing, which are insured by U.S. government agencies under the Federal Family Education Loan Program (”FFELP”), of $625 million, $542 million and $437 million, respectively. These amounts are excluded as reimbursement of insured amounts is proceeding normally.
(e) Loans held-for-sale and loans accounted for at fair value were excluded when calculating the allowance coverage ratio and the net charge-off rate.
(f) Excludes the impact of PCI loans that were acquired as part of the Washington Mutual transaction. These loans were accounted for at fair value on the acquisition date, which incorporated management's estimate, as of that date, of credit losses over the remaining life of the portfolio. An allowance for loan losses of $4.9 billion and $1.6 billion was recorded for these loans at December 31, 2010 and 2009, respectively, which has also been excluded from the applicable ratios. No allowance for loan losses was recorded for these loans at December 31, 2008. To date, no charge-offs have been recorded for these loans.
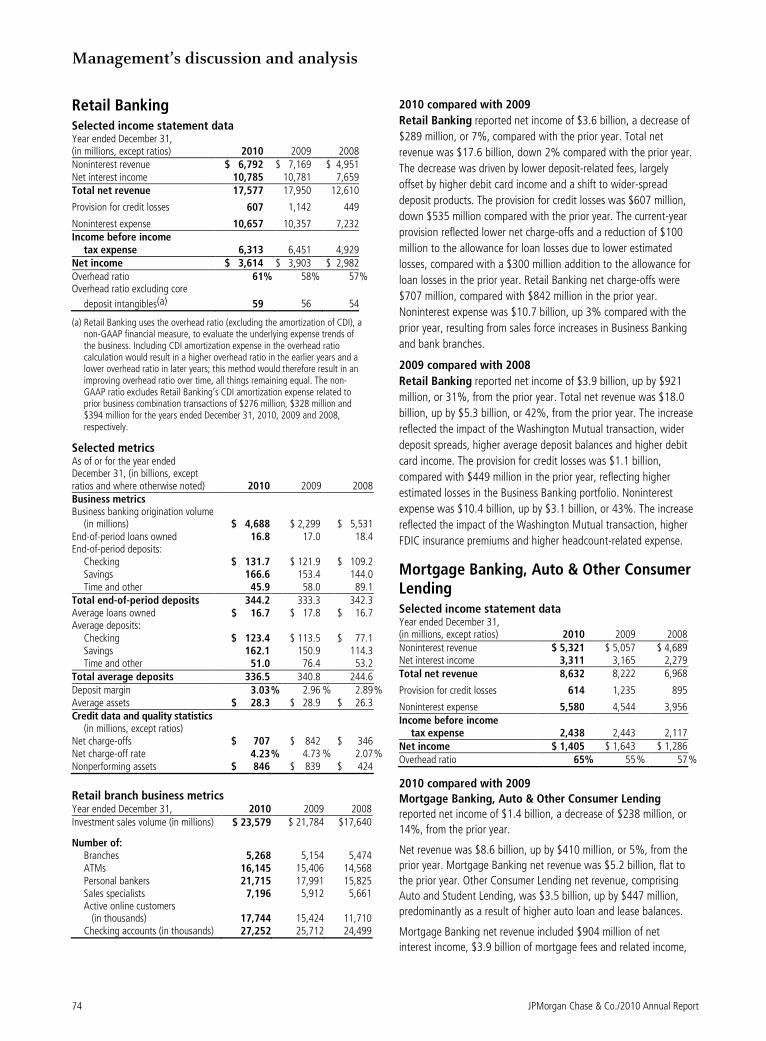
Management’s discussion and analysis
JPMorgan Chase & Co./2010 Annual Report 74
Retail Banking Selected income statement data Year ended December 31, (in millions, except ratios) 2010 2009 2008 Noninterest revenue $ 6,792 $ 7,169 $ 4,951 Net interest income 10,785 10,781 7,659 Total net revenue 17,577 17,950 12,610
Provision for credit losses 607 1,142 449
Noninterest expense 10,657 10,357 7,232 Income before income
tax expense 6,313 6,451 4,929 Net income $ 3,614 $ 3,903 $ 2,982 Overhead ratio 61% 58% 57% Overhead ratio excluding core
deposit intangibles(a) 59 56 54
(a) Retail Banking uses the overhead ratio (excluding the amortization of CDI), a non-GAAP financial measure, to evaluate the underlying expense trends of the business. Including CDI amortization expense in the overhead ratio calculation would result in a higher overhead ratio in the earlier years and a lower overhead ratio in later years; this method would therefore result in an improving overhead ratio over time, all things remaining equal. The non-GAAP ratio excludes Retail Banking’s CDI amortization expense related to prior business combination transactions of $276 million, $328 million and $394 million for the years ended December 31, 2010, 2009 and 2008, respectively.
Selected metrics
As of or for the year ended December 31, (in billions, except ratios and where otherwise noted) 2010 2009 2008 Business metrics Business banking origination volume
(in millions) $ 4,688 $ 2,299 $ 5,531 End-of-period loans owned 16.8 17.0 18.4 End-of-period deposits:
Checking $ 131.7 $ 121.9 $ 109.2 Savings 166.6 153.4 144.0 Time and other 45.9 58.0 89.1
Total end-of-period deposits 344.2 333.3 342.3 Average loans owned $ 16.7 $ 17.8 $ 16.7 Average deposits:
Checking $ 123.4 $ 113.5 $ 77.1 Savings 162.1 150.9 114.3 Time and other 51.0 76.4 53.2
Total average deposits 336.5 340.8 244.6 Deposit margin 3.03 % 2.96 % 2.89 % Average assets $ 28.3 $ 28.9 $ 26.3 Credit data and quality statistics
(in millions, except ratios) Net charge-offs $ 707 $ 842 $ 346 Net charge-off rate 4.23 % 4.73 % 2.07 % Nonperforming assets $ 846 $ 839 $ 424
Retail branch business metrics
Year ended December 31, 2010 2009 2008
Investment sales volume (in millions) $ 23,579 $ 21,784 $17,640
Number of: Branches 5,268 5,154 5,474 ATMs 16,145 15,406 14,568 Personal bankers 21,715 17,991 15,825 Sales specialists 7,196 5,912 5,661 Active online customers (in thousands) 17,744 15,424 11,710
Checking accounts (in thousands) 27,252 25,712 24,499
2010 compared with 2009
Retail Banking reported net income of $3.6 billion, a decrease of
$289 million, or 7%, compared with the prior year. Total net
revenue was $17.6 billion, down 2% compared with the prior year.
The decrease was driven by lower deposit-related fees, largely
offset by higher debit card income and a shift to wider-spread
deposit products. The provision for credit losses was $607 million,
down $535 million compared with the prior year. The current-year
provision reflected lower net charge-offs and a reduction of $100
million to the allowance for loan losses due to lower estimated
losses, compared with a $300 million addition to the allowance for
loan losses in the prior year. Retail Banking net charge-offs were
$707 million, compared with $842 million in the prior year.
Noninterest expense was $10.7 billion, up 3% compared with the
prior year, resulting from sales force increases in Business Banking
and bank branches.
2009 compared with 2008
Retail Banking reported net income of $3.9 billion, up by $921
million, or 31%, from the prior year. Total net revenue was $18.0
billion, up by $5.3 billion, or 42%, from the prior year. The increase
reflected the impact of the Washington Mutual transaction, wider
deposit spreads, higher average deposit balances and higher debit
card income. The provision for credit losses was $1.1 billion,
compared with $449 million in the prior year, reflecting higher
estimated losses in the Business Banking portfolio. Noninterest
expense was $10.4 billion, up by $3.1 billion, or 43%. The increase
reflected the impact of the Washington Mutual transaction, higher
FDIC insurance premiums and higher headcount-related expense.
Mortgage Banking, Auto & Other Consumer Lending Selected income statement data Year ended December 31, (in millions, except ratios) 2010
2009 2008
Noninterest revenue $ 5,321 $ 5,057 $ 4,689 Net interest income 3,311 3,165 2,279 Total net revenue 8,632 8,222 6,968
Provision for credit losses 614 1,235 895
Noninterest expense 5,580 4,544 3,956 Income before income
tax expense 2,438 2,443 2,117 Net income $ 1,405 $ 1,643 $ 1,286 Overhead ratio 65% 55 % 57 %
2010 compared with 2009
Mortgage Banking, Auto & Other Consumer Lending
reported net income of $1.4 billion, a decrease of $238 million, or
14%, from the prior year.
Net revenue was $8.6 billion, up by $410 million, or 5%, from the
prior year. Mortgage Banking net revenue was $5.2 billion, flat to
the prior year. Other Consumer Lending net revenue, comprising
Auto and Student Lending, was $3.5 billion, up by $447 million,
predominantly as a result of higher auto loan and lease balances.
Mortgage Banking net revenue included $904 million of net
interest income, $3.9 billion of mortgage fees and related income,
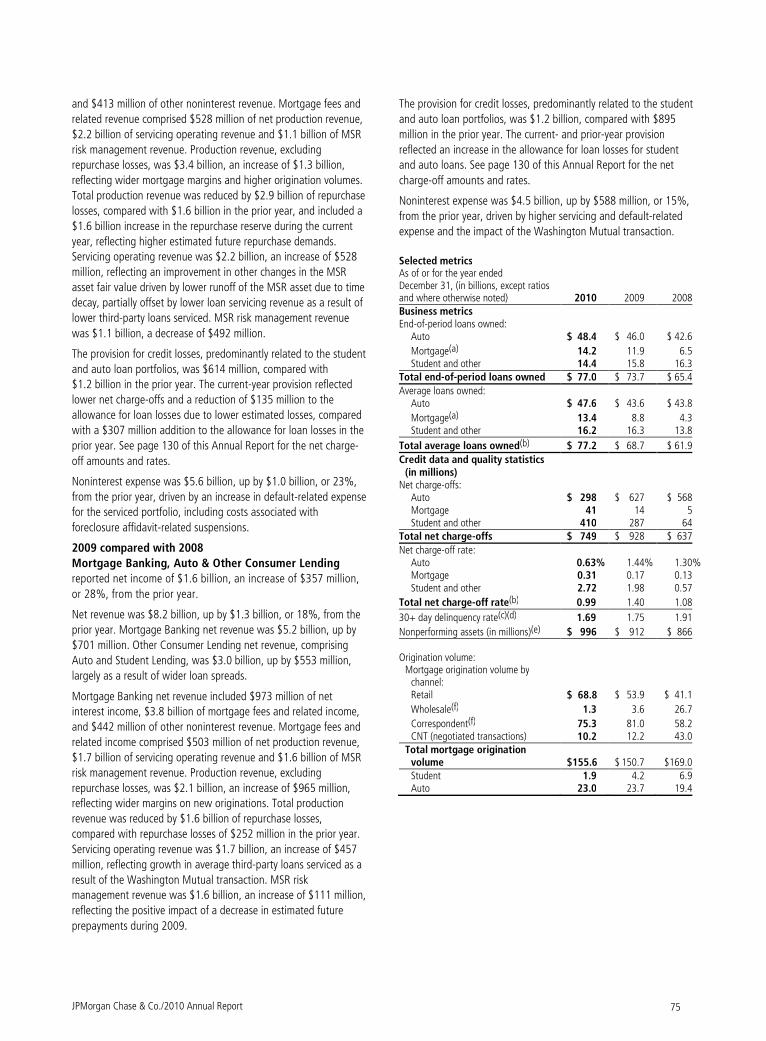
JPMorgan Chase & Co./2010 Annual Report 75
and $413 million of other noninterest revenue. Mortgage fees and
related revenue comprised $528 million of net production revenue,
$2.2 billion of servicing operating revenue and $1.1 billion of MSR
risk management revenue. Production revenue, excluding
repurchase losses, was $3.4 billion, an increase of $1.3 billion,
reflecting wider mortgage margins and higher origination volumes.
Total production revenue was reduced by $2.9 billion of repurchase
losses, compared with $1.6 billion in the prior year, and included a
$1.6 billion increase in the repurchase reserve during the current
year, reflecting higher estimated future repurchase demands.
Servicing operating revenue was $2.2 billion, an increase of $528
million, reflecting an improvement in other changes in the MSR
asset fair value driven by lower runoff of the MSR asset due to time
decay, partially offset by lower loan servicing revenue as a result of
lower third-party loans serviced. MSR risk management revenue
was $1.1 billion, a decrease of $492 million.
The provision for credit losses, predominantly related to the student
and auto loan portfolios, was $614 million, compared with
$1.2 billion in the prior year. The current-year provision reflected
lower net charge-offs and a reduction of $135 million to the
allowance for loan losses due to lower estimated losses, compared
with a $307 million addition to the allowance for loan losses in the
prior year. See page 130 of this Annual Report for the net charge-
off amounts and rates.
Noninterest expense was $5.6 billion, up by $1.0 billion, or 23%,
from the prior year, driven by an increase in default-related expense
for the serviced portfolio, including costs associated with
foreclosure affidavit-related suspensions.
2009 compared with 2008
Mortgage Banking, Auto & Other Consumer Lending
reported net income of $1.6 billion, an increase of $357 million,
or 28%, from the prior year.
Net revenue was $8.2 billion, up by $1.3 billion, or 18%, from the
prior year. Mortgage Banking net revenue was $5.2 billion, up by
$701 million. Other Consumer Lending net revenue, comprising
Auto and Student Lending, was $3.0 billion, up by $553 million,
largely as a result of wider loan spreads.
Mortgage Banking net revenue included $973 million of net
interest income, $3.8 billion of mortgage fees and related income,
and $442 million of other noninterest revenue. Mortgage fees and
related income comprised $503 million of net production revenue,
$1.7 billion of servicing operating revenue and $1.6 billion of MSR
risk management revenue. Production revenue, excluding
repurchase losses, was $2.1 billion, an increase of $965 million,
reflecting wider margins on new originations. Total production
revenue was reduced by $1.6 billion of repurchase losses,
compared with repurchase losses of $252 million in the prior year.
Servicing operating revenue was $1.7 billion, an increase of $457
million, reflecting growth in average third-party loans serviced as a
result of the Washington Mutual transaction. MSR risk
management revenue was $1.6 billion, an increase of $111 million,
reflecting the positive impact of a decrease in estimated future
prepayments during 2009.
The provision for credit losses, predominantly related to the student
and auto loan portfolios, was $1.2 billion, compared with $895
million in the prior year. The current- and prior-year provision
reflected an increase in the allowance for loan losses for student
and auto loans. See page 130 of this Annual Report for the net
charge-off amounts and rates.
Noninterest expense was $4.5 billion, up by $588 million, or 15%,
from the prior year, driven by higher servicing and default-related
expense and the impact of the Washington Mutual transaction.
Selected metrics As of or for the year ended December 31, (in billions, except ratios and where otherwise noted) 2010 2009 2008 Business metrics End-of-period loans owned:
Auto $ 48.4 $ 46.0 $ 42.6
Mortgage(a) 14.2 11.9 6.5 Student and other 14.4 15.8 16.3
Total end-of-period loans owned $ 77.0 $ 73.7 $ 65.4
Average loans owned: Auto $ 47.6 $ 43.6 $ 43.8
Mortgage(a) 13.4 8.8 4.3 Student and other 16.2 16.3 13.8
Total average loans owned(b) $ 77.2 $ 68.7 $ 61.9
Credit data and quality statistics (in millions)
Net charge-offs: Auto $ 298 $ 627 $ 568 Mortgage 41 14 5 Student and other 410 287 64
Total net charge-offs $ 749 $ 928 $ 637
Net charge-off rate: Auto 0.63% 1.44% 1.30 % Mortgage 0.31 0.17 0.13 Student and other 2.72 1.98 0.57
Total net charge-off rate(b) 0.99 1.40 1.08
30+ day delinquency rate(c)(d) 1.69 1.75 1.91
Nonperforming assets (in millions)(e) $ 996 $ 912 $ 866 Origination volume:
Mortgage origination volume by channel: Retail $ 68.8 $ 53.9 $ 41.1
Wholesale(f) 1.3 3.6 26.7
Correspondent(f) 75.3 81.0 58.2 CNT (negotiated transactions) 10.2 12.2 43.0
Total mortgage origination volume $155.6 $ 150.7 $169.0 Student 1.9 4.2 6.9 Auto 23.0 23.7 19.4
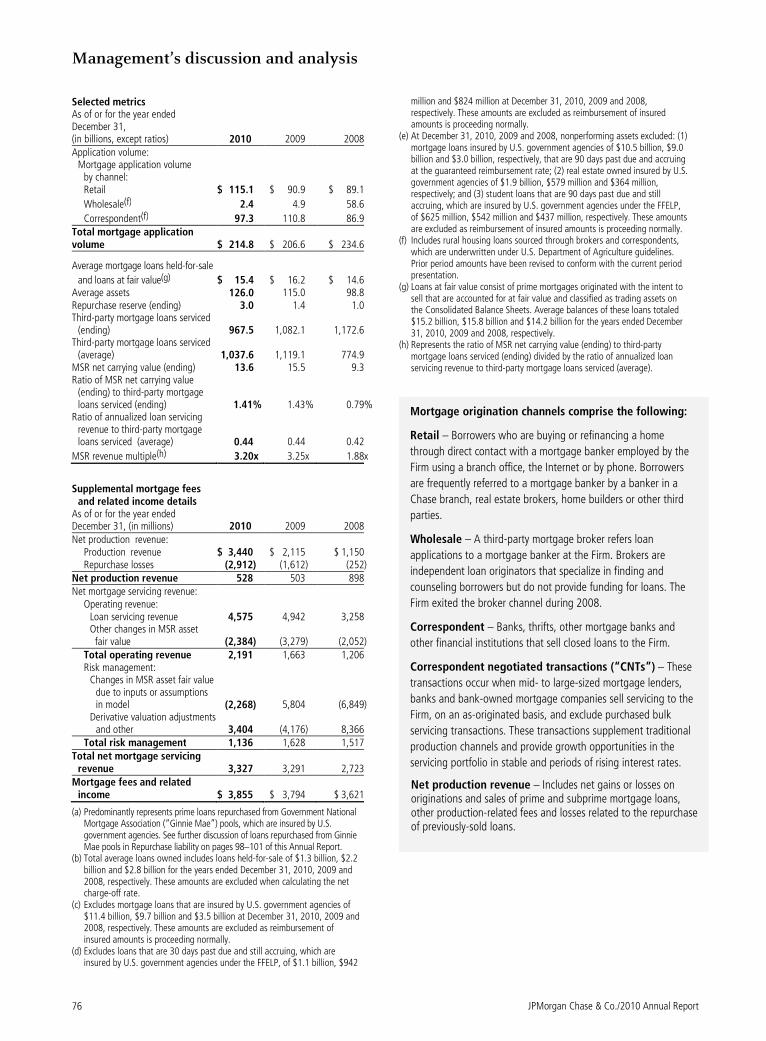
Management’s discussion and analysis
JPMorgan Chase & Co./2010 Annual Report 76
Selected metrics As of or for the year ended December 31, (in billions, except ratios) 2010 2009 2008 Application volume:
Mortgage application volume by channel: Retail $ 115.1 $ 90.9 $ 89.1
Wholesale(f) 2.4 4.9 58.6
Correspondent(f) 97.3 110.8 86.9 Total mortgage application volume $ 214.8 $ 206.6 $ 234.6
Average mortgage loans held-for-sale
and loans at fair value(g) $ 15.4 $ 16.2 $ 14.6 Average assets 126.0 115.0 98.8 Repurchase reserve (ending) 3.0 1.4 1.0 Third-party mortgage loans serviced
(ending) 967.5 1,082.1 1,172.6 Third-party mortgage loans serviced
(average) 1,037.6 1,119.1 774.9 MSR net carrying value (ending) 13.6 15.5 9.3 Ratio of MSR net carrying value
(ending) to third-party mortgage loans serviced (ending) 1.41% 1.43% 0.79%
Ratio of annualized loan servicing revenue to third-party mortgage loans serviced (average) 0.44 0.44 0.42
MSR revenue multiple(h) 3.20x 3.25x 1.88x
Supplemental mortgage fees
and related income details As of or for the year ended December 31, (in millions) 2010 2009 2008 Net production revenue:
Production revenue $ 3,440 $ 2,115 $ 1,150 Repurchase losses (2,912) (1,612) (252)
Net production revenue 528 503 898 Net mortgage servicing revenue:
Operating revenue: Loan servicing revenue 4,575 4,942 3,258 Other changes in MSR asset fair value (2,384) (3,279) (2,052)
Total operating revenue 2,191 1,663 1,206 Risk management:
Changes in MSR asset fair value due to inputs or assumptions in model (2,268) 5,804 (6,849)
Derivative valuation adjustments and other 3,404 (4,176) 8,366
Total risk management 1,136 1,628 1,517 Total net mortgage servicing
revenue 3,327 3,291 2,723 Mortgage fees and related
income $ 3,855 $ 3,794 $ 3,621
(a) Predominantly represents prime loans repurchased from Government National Mortgage Association (“Ginnie Mae”) pools, which are insured by U.S. government agencies. See further discussion of loans repurchased from Ginnie Mae pools in Repurchase liability on pages 98–101 of this Annual Report.
(b) Total average loans owned includes loans held-for-sale of $1.3 billion, $2.2 billion and $2.8 billion for the years ended December 31, 2010, 2009 and 2008, respectively. These amounts are excluded when calculating the net charge-off rate.
(c) Excludes mortgage loans that are insured by U.S. government agencies of $11.4 billion, $9.7 billion and $3.5 billion at December 31, 2010, 2009 and 2008, respectively. These amounts are excluded as reimbursement of insured amounts is proceeding normally.
(d) Excludes loans that are 30 days past due and still accruing, which are insured by U.S. government agencies under the FFELP, of $1.1 billion, $942
million and $824 million at December 31, 2010, 2009 and 2008, respectively. These amounts are excluded as reimbursement of insured amounts is proceeding normally.
(e) At December 31, 2010, 2009 and 2008, nonperforming assets excluded: (1) mortgage loans insured by U.S. government agencies of $10.5 billion, $9.0 billion and $3.0 billion, respectively, that are 90 days past due and accruing at the guaranteed reimbursement rate; (2) real estate owned insured by U.S. government agencies of $1.9 billion, $579 million and $364 million, respectively; and (3) student loans that are 90 days past due and still accruing, which are insured by U.S. government agencies under the FFELP, of $625 million, $542 million and $437 million, respectively. These amounts are excluded as reimbursement of insured amounts is proceeding normally.
(f) Includes rural housing loans sourced through brokers and correspondents, which are underwritten under U.S. Department of Agriculture guidelines. Prior period amounts have been revised to conform with the current period presentation.
(g) Loans at fair value consist of prime mortgages originated with the intent to sell that are accounted for at fair value and classified as trading assets on the Consolidated Balance Sheets. Average balances of these loans totaled $15.2 billion, $15.8 billion and $14.2 billion for the years ended December 31, 2010, 2009 and 2008, respectively.
(h) Represents the ratio of MSR net carrying value (ending) to third-party mortgage loans serviced (ending) divided by the ratio of annualized loan servicing revenue to third-party mortgage loans serviced (average).
Mortgage origination channels comprise the following:
Retail – Borrowers who are buying or refinancing a home
through direct contact with a mortgage banker employed by the
Firm using a branch office, the Internet or by phone. Borrowers
are frequently referred to a mortgage banker by a banker in a
Chase branch, real estate brokers, home builders or other third
parties.
Wholesale – A third-party mortgage broker refers loan
applications to a mortgage banker at the Firm. Brokers are
independent loan originators that specialize in finding and
counseling borrowers but do not provide funding for loans. The
Firm exited the broker channel during 2008.
Correspondent – Banks, thrifts, other mortgage banks and
other financial institutions that sell closed loans to the Firm.
Correspondent negotiated transactions (“CNTs”) – These
transactions occur when mid- to large-sized mortgage lenders,
banks and bank-owned mortgage companies sell servicing to the
Firm, on an as-originated basis, and exclude purchased bulk
servicing transactions. These transactions supplement traditional
production channels and provide growth opportunities in the
servicing portfolio in stable and periods of rising interest rates.
Net production revenue – Includes net gains or losses on originations and sales of prime and subprime mortgage loans, other production-related fees and losses related to the repurchase of previously-sold loans.
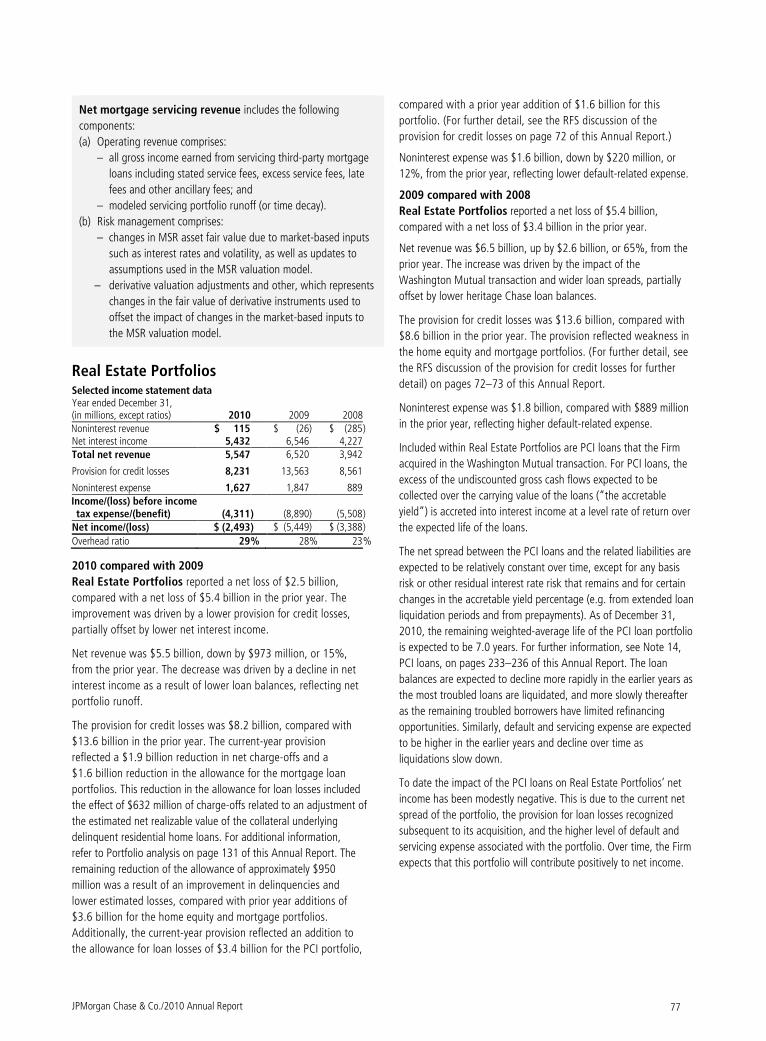
JPMorgan Chase & Co./2010 Annual Report 77
Net mortgage servicing revenue includes the following
components:
(a) Operating revenue comprises:
– all gross income earned from servicing third-party mortgage
loans including stated service fees, excess service fees, late
fees and other ancillary fees; and
– modeled servicing portfolio runoff (or time decay).
(b) Risk management comprises:
– changes in MSR asset fair value due to market-based inputs
such as interest rates and volatility, as well as updates to
assumptions used in the MSR valuation model.
– derivative valuation adjustments and other, which represents
changes in the fair value of derivative instruments used to
offset the impact of changes in the market-based inputs to
the MSR valuation model.
Real Estate Portfolios Selected income statement data Year ended December 31, (in millions, except ratios) 2010 2009 2008 Noninterest revenue $ 115 $ (26) $ (285 ) Net interest income 5,432 6,546 4,227 Total net revenue 5,547 6,520 3,942
Provision for credit losses 8,231 13,563 8,561
Noninterest expense 1,627 1,847 889 Income/(loss) before income tax expense/(benefit) (4,311 ) (8,890) (5,508 )
Net income/(loss) $ (2,493 ) $ (5,449) $ (3,388 )
Overhead ratio 29 % 28% 23 %
2010 compared with 2009
Real Estate Portfolios reported a net loss of $2.5 billion,
compared with a net loss of $5.4 billion in the prior year. The
improvement was driven by a lower provision for credit losses,
partially offset by lower net interest income.
Net revenue was $5.5 billion, down by $973 million, or 15%,
from the prior year. The decrease was driven by a decline in net
interest income as a result of lower loan balances, reflecting net
portfolio runoff.
The provision for credit losses was $8.2 billion, compared with
$13.6 billion in the prior year. The current-year provision
reflected a $1.9 billion reduction in net charge-offs and a
$1.6 billion reduction in the allowance for the mortgage loan
portfolios. This reduction in the allowance for loan losses included
the effect of $632 million of charge-offs related to an adjustment of
the estimated net realizable value of the collateral underlying
delinquent residential home loans. For additional information,
refer to Portfolio analysis on page 131 of this Annual Report. The
remaining reduction of the allowance of approximately $950
million was a result of an improvement in delinquencies and
lower estimated losses, compared with prior year additions of
$3.6 billion for the home equity and mortgage portfolios.
Additionally, the current-year provision reflected an addition to
the allowance for loan losses of $3.4 billion for the PCI portfolio,
compared with a prior year addition of $1.6 billion for this
portfolio. (For further detail, see the RFS discussion of the
provision for credit losses on page 72 of this Annual Report.)
Noninterest expense was $1.6 billion, down by $220 million, or
12%, from the prior year, reflecting lower default-related expense.
2009 compared with 2008
Real Estate Portfolios reported a net loss of $5.4 billion,
compared with a net loss of $3.4 billion in the prior year.
Net revenue was $6.5 billion, up by $2.6 billion, or 65%, from the
prior year. The increase was driven by the impact of the
Washington Mutual transaction and wider loan spreads, partially
offset by lower heritage Chase loan balances.
The provision for credit losses was $13.6 billion, compared with
$8.6 billion in the prior year. The provision reflected weakness in
the home equity and mortgage portfolios. (For further detail, see
the RFS discussion of the provision for credit losses for further
detail) on pages 72–73 of this Annual Report.
Noninterest expense was $1.8 billion, compared with $889 million
in the prior year, reflecting higher default-related expense.
Included within Real Estate Portfolios are PCI loans that the Firm
acquired in the Washington Mutual transaction. For PCI loans, the
excess of the undiscounted gross cash flows expected to be
collected over the carrying value of the loans (“the accretable
yield”) is accreted into interest income at a level rate of return over
the expected life of the loans.
The net spread between the PCI loans and the related liabilities are
expected to be relatively constant over time, except for any basis
risk or other residual interest rate risk that remains and for certain
changes in the accretable yield percentage (e.g. from extended loan
liquidation periods and from prepayments). As of December 31,
2010, the remaining weighted-average life of the PCI loan portfolio
is expected to be 7.0 years. For further information, see Note 14,
PCI loans, on pages 233–236 of this Annual Report. The loan
balances are expected to decline more rapidly in the earlier years as
the most troubled loans are liquidated, and more slowly thereafter
as the remaining troubled borrowers have limited refinancing
opportunities. Similarly, default and servicing expense are expected
to be higher in the earlier years and decline over time as
liquidations slow down.
To date the impact of the PCI loans on Real Estate Portfolios’ net
income has been modestly negative. This is due to the current net
spread of the portfolio, the provision for loan losses recognized
subsequent to its acquisition, and the higher level of default and
servicing expense associated with the portfolio. Over time, the Firm
expects that this portfolio will contribute positively to net income.
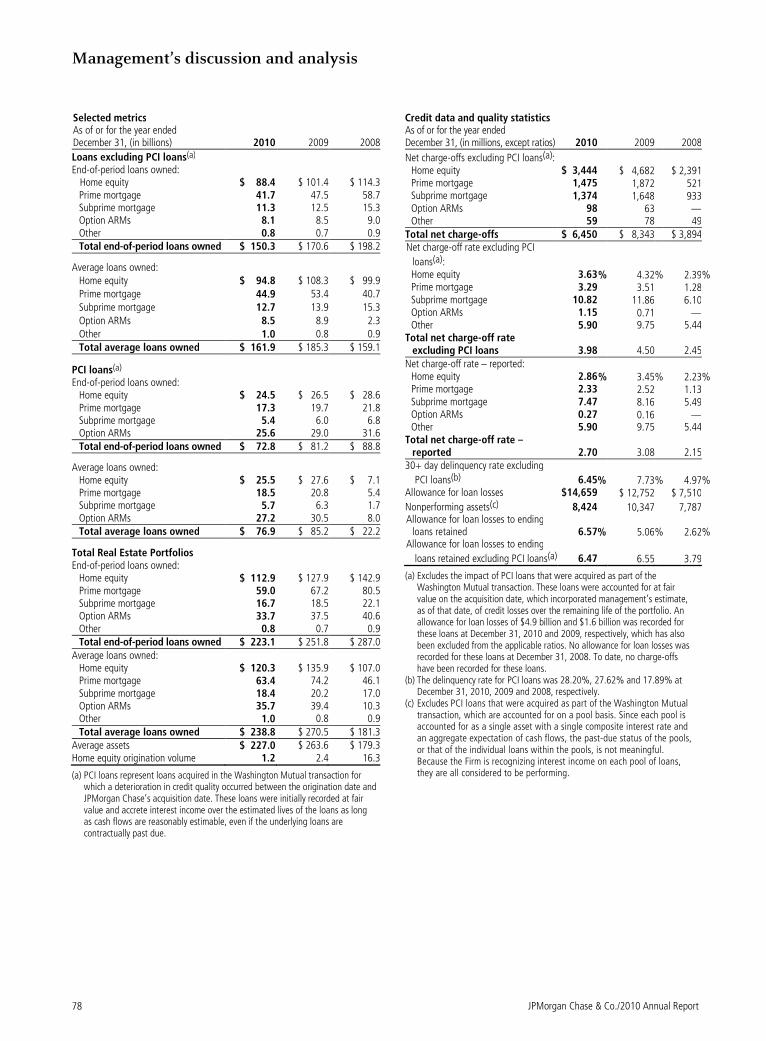
Management’s discussion and analysis
JPMorgan Chase & Co./2010 Annual Report 78
Selected metrics As of or for the year ended December 31, (in billions) 2010 2009 2008
Loans excluding PCI loans(a) End-of-period loans owned:
Home equity $ 88.4 $ 101.4 $ 114.3 Prime mortgage 41.7 47.5 58.7Subprime mortgage 11.3 12.5 15.3Option ARMs 8.1 8.5 9.0Other 0.8 0.7 0.9Total end-of-period loans owned $ 150.3 $ 170.6 $ 198.2
Average loans owned: Home equity $ 94.8 $ 108.3 $ 99.9Prime mortgage 44.9 53.4 40.7Subprime mortgage 12.7 13.9 15.3Option ARMs 8.5 8.9 2.3Other 1.0 0.8 0.9Total average loans owned $ 161.9 $ 185.3 $ 159.1
PCI loans(a) End-of-period loans owned:
Home equity $ 24.5 $ 26.5 $ 28.6Prime mortgage 17.3 19.7 21.8Subprime mortgage 5.4 6.0 6.8Option ARMs 25.6 29.0 31.6Total end-of-period loans owned $ 72.8 $ 81.2 $ 88.8
Average loans owned: Home equity $ 25.5 $ 27.6 $ 7.1Prime mortgage 18.5 20.8 5.4Subprime mortgage 5.7 6.3 1.7Option ARMs 27.2 30.5 8.0Total average loans owned $ 76.9 $ 85.2 $ 22.2
Total Real Estate Portfolios End-of-period loans owned:
Home equity $ 112.9 $ 127.9 $ 142.9 Prime mortgage 59.0 67.2 80.5Subprime mortgage 16.7 18.5 22.1Option ARMs 33.7 37.5 40.6Other 0.8 0.7 0.9Total end-of-period loans owned $ 223.1 $ 251.8 $ 287.0
Average loans owned: Home equity $ 120.3 $ 135.9 $ 107.0Prime mortgage 63.4 74.2 46.1Subprime mortgage 18.4 20.2 17.0Option ARMs 35.7 39.4 10.3Other 1.0 0.8 0.9Total average loans owned $ 238.8 $ 270.5 $ 181.3
Average assets $ 227.0 $ 263.6 $ 179.3Home equity origination volume 1.2 2.4 16.3
(a) PCI loans represent loans acquired in the Washington Mutual transaction for which a deterioration in credit quality occurred between the origination date and JPMorgan Chase’s acquisition date. These loans were initially recorded at fair value and accrete interest income over the estimated lives of the loans as long as cash flows are reasonably estimable, even if the underlying loans are contractually past due.
Credit data and quality statistics As of or for the year ended December 31, (in millions, except ratios) 2010 2009 2008
Net charge-offs excluding PCI loans(a): Home equity $ 3,444 $ 4,682 $ 2,391 Prime mortgage 1,475 1,872 521 Subprime mortgage 1,374 1,648 933 Option ARMs 98 63 — Other 59 78 49
Total net charge-offs $ 6,450 $ 8,343 $ 3,894 Net charge-off rate excluding PCI
loans(a): Home equity 3.63% 4.32% 2.39% Prime mortgage 3.29 3.51 1.28 Subprime mortgage 10.82 11.86 6.10 Option ARMs 1.15 0.71 — Other 5.90 9.75 5.44
Total net charge-off rate excluding PCI loans 3.98 4.50 2.45
Net charge-off rate – reported: Home equity 2.86% 3.45% 2.23% Prime mortgage 2.33 2.52 1.13 Subprime mortgage 7.47 8.16 5.49 Option ARMs 0.27 0.16 — Other 5.90 9.75 5.44
Total net charge-off rate – reported 2.70 3.08 2.15
30+ day delinquency rate excluding
PCI loans(b) 6.45% 7.73% 4.97% Allowance for loan losses $14,659 $ 12,752 $ 7,510
Nonperforming assets(c) 8,424 10,347 7,787 Allowance for loan losses to ending
loans retained 6.57% 5.06% 2.62% Allowance for loan losses to ending
loans retained excluding PCI loans(a) 6.47 6.55 3.79
(a) Excludes the impact of PCI loans that were acquired as part of the Washington Mutual transaction. These loans were accounted for at fair value on the acquisition date, which incorporated management’s estimate, as of that date, of credit losses over the remaining life of the portfolio. An allowance for loan losses of $4.9 billion and $1.6 billion was recorded for these loans at December 31, 2010 and 2009, respectively, which has also been excluded from the applicable ratios. No allowance for loan losses was recorded for these loans at December 31, 2008. To date, no charge-offs have been recorded for these loans.
(b) The delinquency rate for PCI loans was 28.20%, 27.62% and 17.89% at December 31, 2010, 2009 and 2008, respectively.
(c) Excludes PCI loans that were acquired as part of the Washington Mutual transaction, which are accounted for on a pool basis. Since each pool is accounted for as a single asset with a single composite interest rate and an aggregate expectation of cash flows, the past-due status of the pools, or that of the individual loans within the pools, is not meaningful. Because the Firm is recognizing interest income on each pool of loans, they are all considered to be performing.
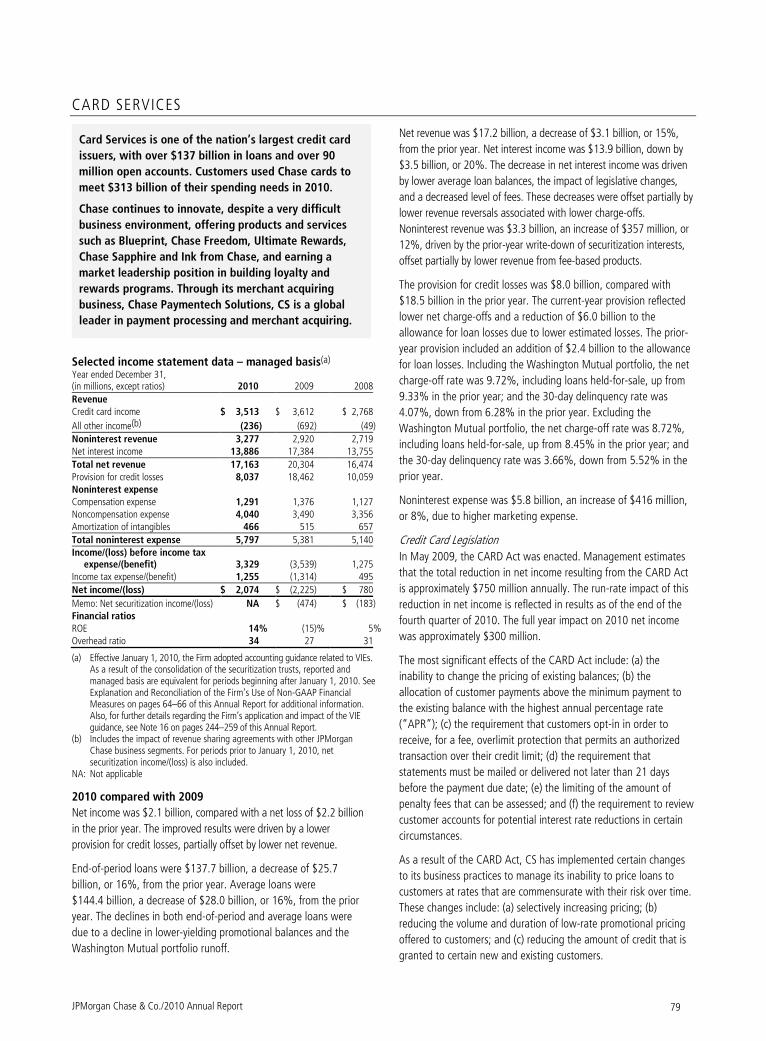
JPMorgan Chase & Co./2010 Annual Report 79
CARD SERVICES
Card Services is one of the nation’s largest credit card
issuers, with over $137 billion in loans and over 90
million open accounts. Customers used Chase cards to
meet $313 billion of their spending needs in 2010.
Chase continues to innovate, despite a very difficult
business environment, offering products and services
such as Blueprint, Chase Freedom, Ultimate Rewards,
Chase Sapphire and Ink from Chase, and earning a
market leadership position in building loyalty and
rewards programs. Through its merchant acquiring
business, Chase Paymentech Solutions, CS is a global
leader in payment processing and merchant acquiring.
Selected income statement data – managed basis(a) Year ended December 31, (in millions, except ratios) 2010 2009 2008
Revenue Credit card income $ 3,513 $ 3,612 $ 2,768
All other income(b) (236) (692) (49)
Noninterest revenue 3,277 2,920 2,719 Net interest income 13,886 17,384 13,755
Total net revenue 17,163 20,304 16,474 Provision for credit losses 8,037 18,462 10,059 Noninterest expense Compensation expense 1,291 1,376 1,127 Noncompensation expense 4,040 3,490 3,356 Amortization of intangibles 466 515 657
Total noninterest expense 5,797 5,381 5,140 Income/(loss) before income tax
expense/(benefit) 3,329 (3,539) 1,275 Income tax expense/(benefit) 1,255 (1,314) 495
Net income/(loss) $ 2,074 $ (2,225) $ 780
Memo: Net securitization income/(loss) NA $ (474) $ (183) Financial ratios ROE 14% (15)% 5% Overhead ratio 34 27 31
(a) Effective January 1, 2010, the Firm adopted accounting guidance related to VIEs. As a result of the consolidation of the securitization trusts, reported and managed basis are equivalent for periods beginning after January 1, 2010. See Explanation and Reconciliation of the Firm’s Use of Non-GAAP Financial Measures on pages 64–66 of this Annual Report for additional information. Also, for further details regarding the Firm’s application and impact of the VIE guidance, see Note 16 on pages 244–259 of this Annual Report.
(b) Includes the impact of revenue sharing agreements with other JPMorgan Chase business segments. For periods prior to January 1, 2010, net securitization income/(loss) is also included.
NA: Not applicable
2010 compared with 2009
Net income was $2.1 billion, compared with a net loss of $2.2 billion
in the prior year. The improved results were driven by a lower
provision for credit losses, partially offset by lower net revenue.
End-of-period loans were $137.7 billion, a decrease of $25.7
billion, or 16%, from the prior year. Average loans were
$144.4 billion, a decrease of $28.0 billion, or 16%, from the prior
year. The declines in both end-of-period and average loans were
due to a decline in lower-yielding promotional balances and the
Washington Mutual portfolio runoff.
Net revenue was $17.2 billion, a decrease of $3.1 billion, or 15%,
from the prior year. Net interest income was $13.9 billion, down by
$3.5 billion, or 20%. The decrease in net interest income was driven
by lower average loan balances, the impact of legislative changes,
and a decreased level of fees. These decreases were offset partially by
lower revenue reversals associated with lower charge-offs.
Noninterest revenue was $3.3 billion, an increase of $357 million, or
12%, driven by the prior-year write-down of securitization interests,
offset partially by lower revenue from fee-based products.
The provision for credit losses was $8.0 billion, compared with
$18.5 billion in the prior year. The current-year provision reflected
lower net charge-offs and a reduction of $6.0 billion to the
allowance for loan losses due to lower estimated losses. The prior-
year provision included an addition of $2.4 billion to the allowance
for loan losses. Including the Washington Mutual portfolio, the net
charge-off rate was 9.72%, including loans held-for-sale, up from
9.33% in the prior year; and the 30-day delinquency rate was
4.07%, down from 6.28% in the prior year. Excluding the
Washington Mutual portfolio, the net charge-off rate was 8.72%,
including loans held-for-sale, up from 8.45% in the prior year; and
the 30-day delinquency rate was 3.66%, down from 5.52% in the
prior year.
Noninterest expense was $5.8 billion, an increase of $416 million,
or 8%, due to higher marketing expense.
Credit Card Legislation
In May 2009, the CARD Act was enacted. Management estimates
that the total reduction in net income resulting from the CARD Act
is approximately $750 million annually. The run-rate impact of this
reduction in net income is reflected in results as of the end of the
fourth quarter of 2010. The full year impact on 2010 net income
was approximately $300 million.
The most significant effects of the CARD Act include: (a) the
inability to change the pricing of existing balances; (b) the
allocation of customer payments above the minimum payment to
the existing balance with the highest annual percentage rate
(“APR”); (c) the requirement that customers opt-in in order to
receive, for a fee, overlimit protection that permits an authorized
transaction over their credit limit; (d) the requirement that
statements must be mailed or delivered not later than 21 days
before the payment due date; (e) the limiting of the amount of
penalty fees that can be assessed; and (f) the requirement to review
customer accounts for potential interest rate reductions in certain
circumstances.
As a result of the CARD Act, CS has implemented certain changes
to its business practices to manage its inability to price loans to
customers at rates that are commensurate with their risk over time.
These changes include: (a) selectively increasing pricing; (b)
reducing the volume and duration of low-rate promotional pricing
offered to customers; and (c) reducing the amount of credit that is
granted to certain new and existing customers.
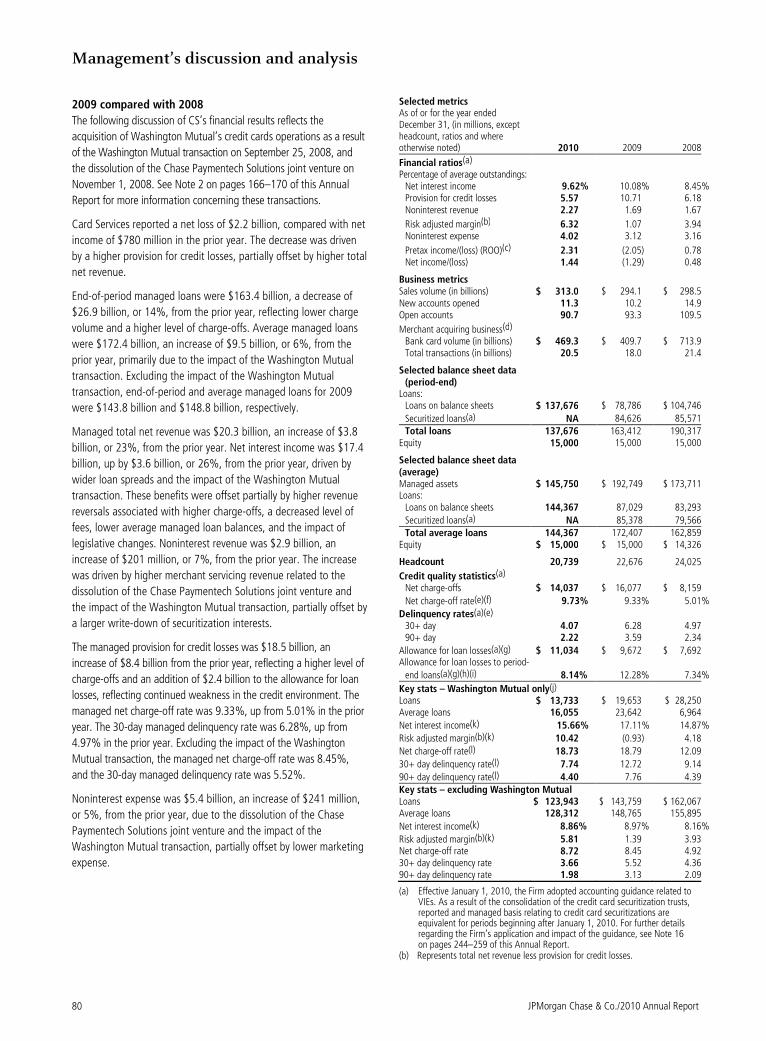
Management’s discussion and analysis
JPMorgan Chase & Co./2010 Annual Report 80
2009 compared with 2008
The following discussion of CS’s financial results reflects the
acquisition of Washington Mutual’s credit cards operations as a result
of the Washington Mutual transaction on September 25, 2008, and
the dissolution of the Chase Paymentech Solutions joint venture on
November 1, 2008. See Note 2 on pages 166–170 of this Annual
Report for more information concerning these transactions.
Card Services reported a net loss of $2.2 billion, compared with net
income of $780 million in the prior year. The decrease was driven
by a higher provision for credit losses, partially offset by higher total
net revenue.
End-of-period managed loans were $163.4 billion, a decrease of
$26.9 billion, or 14%, from the prior year, reflecting lower charge
volume and a higher level of charge-offs. Average managed loans
were $172.4 billion, an increase of $9.5 billion, or 6%, from the
prior year, primarily due to the impact of the Washington Mutual
transaction. Excluding the impact of the Washington Mutual
transaction, end-of-period and average managed loans for 2009
were $143.8 billion and $148.8 billion, respectively.
Managed total net revenue was $20.3 billion, an increase of $3.8
billion, or 23%, from the prior year. Net interest income was $17.4
billion, up by $3.6 billion, or 26%, from the prior year, driven by
wider loan spreads and the impact of the Washington Mutual
transaction. These benefits were offset partially by higher revenue
reversals associated with higher charge-offs, a decreased level of
fees, lower average managed loan balances, and the impact of
legislative changes. Noninterest revenue was $2.9 billion, an
increase of $201 million, or 7%, from the prior year. The increase
was driven by higher merchant servicing revenue related to the
dissolution of the Chase Paymentech Solutions joint venture and
the impact of the Washington Mutual transaction, partially offset by
a larger write-down of securitization interests.
The managed provision for credit losses was $18.5 billion, an
increase of $8.4 billion from the prior year, reflecting a higher level of
charge-offs and an addition of $2.4 billion to the allowance for loan
losses, reflecting continued weakness in the credit environment. The
managed net charge-off rate was 9.33%, up from 5.01% in the prior
year. The 30-day managed delinquency rate was 6.28%, up from
4.97% in the prior year. Excluding the impact of the Washington
Mutual transaction, the managed net charge-off rate was 8.45%,
and the 30-day managed delinquency rate was 5.52%.
Noninterest expense was $5.4 billion, an increase of $241 million,
or 5%, from the prior year, due to the dissolution of the Chase
Paymentech Solutions joint venture and the impact of the
Washington Mutual transaction, partially offset by lower marketing
expense.
Selected metrics As of or for the year ended December 31, (in millions, except headcount, ratios and where otherwise noted) 2010 2009 2008
Financial ratios(a) Percentage of average outstandings:
Net interest income 9.62% 10.08% 8.45% Provision for credit losses 5.57 10.71 6.18 Noninterest revenue 2.27 1.69 1.67
Risk adjusted margin(b) 6.32 1.07 3.94 Noninterest expense 4.02 3.12 3.16
Pretax income/(loss) (ROO)(c) 2.31 (2.05) 0.78 Net income/(loss) 1.44 (1.29) 0.48
Business metrics Sales volume (in billions) $ 313.0 $ 294.1 $ 298.5 New accounts opened
11.3 10.2 14.9
Open accounts 90.7 93.3 109.5
Merchant acquiring business(d) Bank card volume (in billions) $ 469.3 $ 409.7 $ 713.9 Total transactions (in billions) 20.5 18.0 21.4
Selected balance sheet data (period-end)
Loans: Loans on balance sheets $ 137,676 $ 78,786 $ 104,746
Securitized loans(a) NA 84,626 85,571 Total loans 137,676 163,412 190,317
Equity 15,000 15,000 15,000
Selected balance sheet data (average) Managed assets $ 145,750 $ 192,749 $ 173,711 Loans:
Loans on balance sheets 144,367 87,029 83,293
Securitized loans(a) NA 85,378 79,566 Total average loans 144,367 172,407 162,859
Equity $ 15,000 $ 15,000 $ 14,326
Headcount 20,739 22,676 24,025
Credit quality statistics(a) Net charge-offs $ 14,037 $ 16,077 $ 8,159
Net charge-off rate(e)(f) 9.73% 9.33% 5.01%
Delinquency rates(a)(e) 30+ day 4.07 6.28 4.97 90+ day 2.22 3.59 2.34
Allowance for loan losses(a)(g) $ 11,034 $ 9,672 $ 7,692 Allowance for loan losses to period-
end loans(a)(g)(h)(i) 8.14% 12.28% 7.34%
Key stats – Washington Mutual only(j) Loans $ 13,733 $ 19,653 $ 28,250 Average loans 16,055 23,642 6,964
Net interest income(k) 15.66% 17.11% 14.87%
Risk adjusted margin(b)(k) 10.42 (0.93) 4.18
Net charge-off rate(l) 18.73 18.79 12.09
30+ day delinquency rate(l) 7.74 12.72 9.14
90+ day delinquency rate(l) 4.40 7.76 4.39 Key stats – excluding Washington Mutual Loans $ 123,943 $ 143,759 $ 162,067 Average loans 128,312 148,765 155,895
Net interest income(k) 8.86% 8.97% 8.16%
Risk adjusted margin(b)(k) 5.81 1.39 3.93 Net charge-off rate 8.72 8.45 4.92 30+ day delinquency rate 3.66 5.52 4.36 90+ day delinquency rate 1.98 3.13 2.09
(a) Effective January 1, 2010, the Firm adopted accounting guidance related to VIEs. As a result of the consolidation of the credit card securitization trusts, reported and managed basis relating to credit card securitizations are equivalent for periods beginning after January 1, 2010. For further details regarding the Firm’s application and impact of the guidance, see Note 16 on pages 244–259 of this Annual Report.
(b) Represents total net revenue less provision for credit losses.
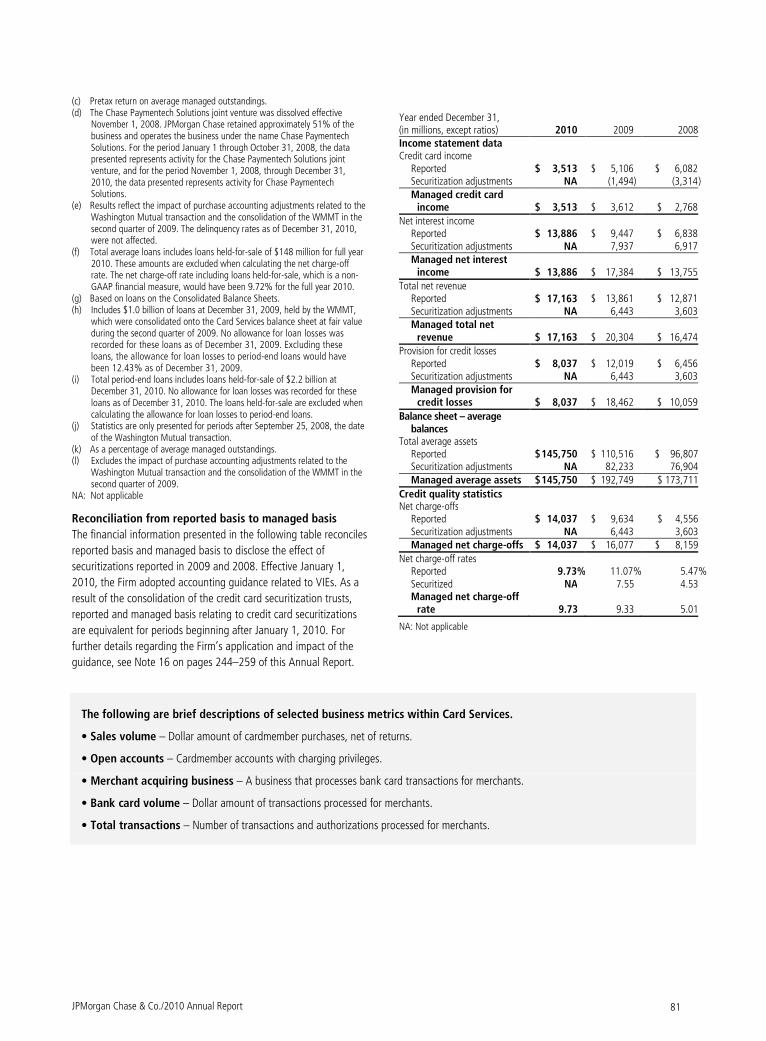
JPMorgan Chase & Co./2010 Annual Report 81
(c) Pretax return on average managed outstandings. (d) The Chase Paymentech Solutions joint venture was dissolved effective
November 1, 2008. JPMorgan Chase retained approximately 51% of the business and operates the business under the name Chase Paymentech Solutions. For the period January 1 through October 31, 2008, the data presented represents activity for the Chase Paymentech Solutions joint venture, and for the period November 1, 2008, through December 31, 2010, the data presented represents activity for Chase Paymentech Solutions.
(e) Results reflect the impact of purchase accounting adjustments related to the Washington Mutual transaction and the consolidation of the WMMT in the second quarter of 2009. The delinquency rates as of December 31, 2010, were not affected.
(f) Total average loans includes loans held-for-sale of $148 million for full year 2010. These amounts are excluded when calculating the net charge-off rate. The net charge-off rate including loans held-for-sale, which is a non-GAAP financial measure, would have been 9.72% for the full year 2010.
(g) Based on loans on the Consolidated Balance Sheets. (h) Includes $1.0 billion of loans at December 31, 2009, held by the WMMT,
which were consolidated onto the Card Services balance sheet at fair value during the second quarter of 2009. No allowance for loan losses was recorded for these loans as of December 31, 2009. Excluding these loans, the allowance for loan losses to period-end loans would have been 12.43% as of December 31, 2009.
(i) Total period-end loans includes loans held-for-sale of $2.2 billion at December 31, 2010. No allowance for loan losses was recorded for these loans as of December 31, 2010. The loans held-for-sale are excluded when calculating the allowance for loan losses to period-end loans.
(j) Statistics are only presented for periods after September 25, 2008, the date of the Washington Mutual transaction.
(k) As a percentage of average managed outstandings. (l) Excludes the impact of purchase accounting adjustments related to the
Washington Mutual transaction and the consolidation of the WMMT in the second quarter of 2009.
NA: Not applicable
Reconciliation from reported basis to managed basis
The financial information presented in the following table reconciles
reported basis and managed basis to disclose the effect of
securitizations reported in 2009 and 2008. Effective January 1,
2010, the Firm adopted accounting guidance related to VIEs. As a
result of the consolidation of the credit card securitization trusts,
reported and managed basis relating to credit card securitizations
are equivalent for periods beginning after January 1, 2010. For
further details regarding the Firm’s application and impact of the
guidance, see Note 16 on pages 244–259 of this Annual Report.
Year ended December 31, (in millions, except ratios) 2010 2009 2008 Income statement data Credit card income
Reported $ 3,513 $ 5,106 $ 6,082 Securitization adjustments NA (1,494) (3,314 ) Managed credit card
income $ 3,513 $ 3,612 $ 2,768
Net interest income Reported $ 13,886 $ 9,447 $ 6,838 Securitization adjustments NA 7,937 6,917 Managed net interest
income $ 13,886 $ 17,384 $ 13,755
Total net revenue Reported $ 17,163 $ 13,861 $ 12,871 Securitization adjustments NA 6,443 3,603 Managed total net
revenue $ 17,163 $ 20,304 $ 16,474
Provision for credit losses Reported $ 8,037 $ 12,019 $ 6,456 Securitization adjustments NA 6,443 3,603 Managed provision for
credit losses $ 8,037 $ 18,462 $ 10,059
Balance sheet – average balances
Total average assets Reported $ 145,750 $ 110,516 $ 96,807 Securitization adjustments NA 82,233 76,904 Managed average assets $ 145,750 $ 192,749 $ 173,711
Credit quality statistics Net charge-offs
Reported $ 14,037 $ 9,634 $ 4,556 Securitization adjustments NA 6,443 3,603 Managed net charge-offs $ 14,037 $ 16,077 $ 8,159
Net charge-off rates Reported 9.73% 11.07% 5.47% Securitized NA 7.55 4.53 Managed net charge-off
rate 9.73 9.33 5.01
NA: Not applicable
The following are brief descriptions of selected business metrics within Card Services.
• Sales volume – Dollar amount of cardmember purchases, net of returns.
• Open accounts – Cardmember accounts with charging privileges.
• Merchant acquiring business – A business that processes bank card transactions for merchants.
• Bank card volume – Dollar amount of transactions processed for merchants.
• Total transactions – Number of transactions and authorizations processed for merchants.
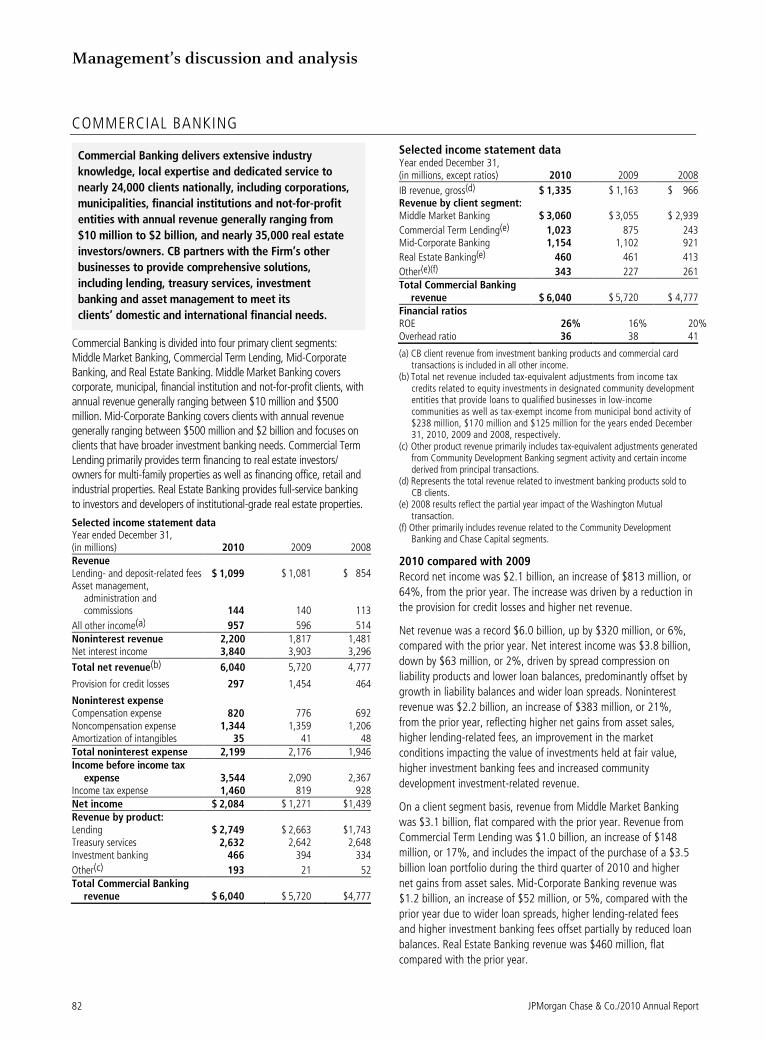
Management’s discussion and analysis
JPMorgan Chase & Co./2010 Annual Report 82
COMMERCIAL BANKING
Commercial Banking delivers extensive industry
knowledge, local expertise and dedicated service to
nearly 24,000 clients nationally, including corporations,
municipalities, financial institutions and not-for-profit
entities with annual revenue generally ranging from
$10 million to $2 billion, and nearly 35,000 real estate
investors/owners. CB partners with the Firm’s other
businesses to provide comprehensive solutions,
including lending, treasury services, investment
banking and asset management to meet its
clients’ domestic and international financial needs.
Commercial Banking is divided into four primary client segments: Middle Market Banking, Commercial Term Lending, Mid-Corporate Banking, and Real Estate Banking. Middle Market Banking covers corporate, municipal, financial institution and not-for-profit clients, with annual revenue generally ranging between $10 million and $500 million. Mid-Corporate Banking covers clients with annual revenue generally ranging between $500 million and $2 billion and focuses on clients that have broader investment banking needs. Commercial Term Lending primarily provides term financing to real estate investors/ owners for multi-family properties as well as financing office, retail and industrial properties. Real Estate Banking provides full-service banking to investors and developers of institutional-grade real estate properties.
Selected income statement data Year ended December 31, (in millions) 2010 2009 2008Revenue Lending- and deposit-related fees $ 1,099 $ 1,081 $ 854Asset management,
administration and commissions 144 140 113
All other income(a) 957 596 514Noninterest revenue 2,200 1,817 1,481Net interest income 3,840 3,903 3,296
Total net revenue(b) 6,040 5,720 4,777
Provision for credit losses 297 1,454 464
Noninterest expense Compensation expense 820 776 692Noncompensation expense 1,344 1,359 1,206Amortization of intangibles 35 41 48Total noninterest expense 2,199 2,176 1,946 Income before income tax
expense 3,544 2,090 2,367 Income tax expense 1,460 819 928 Net income $ 2,084 $ 1,271 $1,439 Revenue by product: Lending $ 2,749 $ 2,663 $1,743 Treasury services 2,632 2,642 2,648 Investment banking 466 394 334
Other(c) 193 21 52 Total Commercial Banking
revenue $ 6,040 $ 5,720 $4,777
Selected income statement data Year ended December 31, (in millions, except ratios) 2010 2009 2008
IB revenue, gross(d) $ 1,335 $ 1,163 $ 966 Revenue by client segment: Middle Market Banking $ 3,060 $ 3,055 $ 2,939
Commercial Term Lending(e) 1,023 875 243 Mid-Corporate Banking 1,154 1,102 921
Real Estate Banking(e) 460 461 413
Other(e)(f) 343 227 261 Total Commercial Banking
revenue $ 6,040 $ 5,720 $ 4,777 Financial ratios ROE 26% 16% 20% Overhead ratio 36 38 41
(a) CB client revenue from investment banking products and commercial card transactions is included in all other income.
(b) Total net revenue included tax-equivalent adjustments from income tax credits related to equity investments in designated community development entities that provide loans to qualified businesses in low-income communities as well as tax-exempt income from municipal bond activity of $238 million, $170 million and $125 million for the years ended December 31, 2010, 2009 and 2008, respectively.
(c) Other product revenue primarily includes tax-equivalent adjustments generated from Community Development Banking segment activity and certain income derived from principal transactions.
(d) Represents the total revenue related to investment banking products sold to CB clients.
(e) 2008 results reflect the partial year impact of the Washington Mutual transaction.
(f) Other primarily includes revenue related to the Community Development Banking and Chase Capital segments.
2010 compared with 2009
Record net income was $2.1 billion, an increase of $813 million, or
64%, from the prior year. The increase was driven by a reduction in
the provision for credit losses and higher net revenue.
Net revenue was a record $6.0 billion, up by $320 million, or 6%,
compared with the prior year. Net interest income was $3.8 billion,
down by $63 million, or 2%, driven by spread compression on
liability products and lower loan balances, predominantly offset by
growth in liability balances and wider loan spreads. Noninterest
revenue was $2.2 billion, an increase of $383 million, or 21%,
from the prior year, reflecting higher net gains from asset sales,
higher lending-related fees, an improvement in the market
conditions impacting the value of investments held at fair value,
higher investment banking fees and increased community
development investment-related revenue.
On a client segment basis, revenue from Middle Market Banking
was $3.1 billion, flat compared with the prior year. Revenue from
Commercial Term Lending was $1.0 billion, an increase of $148
million, or 17%, and includes the impact of the purchase of a $3.5
billion loan portfolio during the third quarter of 2010 and higher
net gains from asset sales. Mid-Corporate Banking revenue was
$1.2 billion, an increase of $52 million, or 5%, compared with the
prior year due to wider loan spreads, higher lending-related fees
and higher investment banking fees offset partially by reduced loan
balances. Real Estate Banking revenue was $460 million, flat
compared with the prior year.
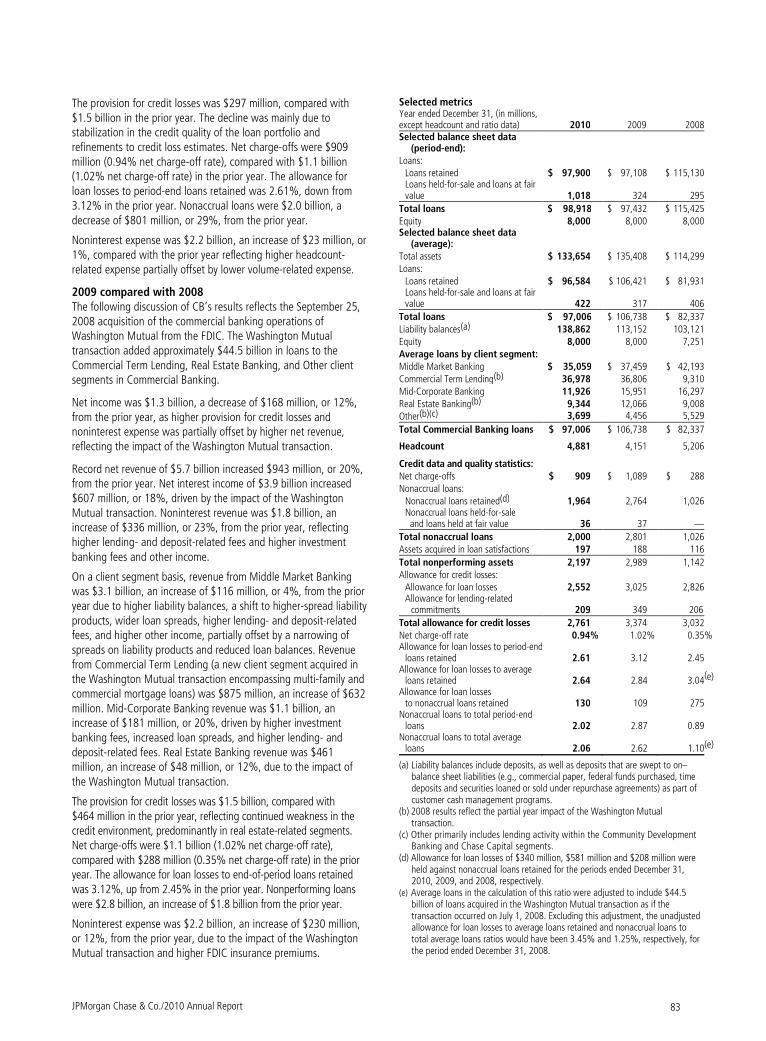
JPMorgan Chase & Co./2010 Annual Report 83
The provision for credit losses was $297 million, compared with $1.5 billion in the prior year. The decline was mainly due to stabilization in the credit quality of the loan portfolio and refinements to credit loss estimates. Net charge-offs were $909 million (0.94% net charge-off rate), compared with $1.1 billion (1.02% net charge-off rate) in the prior year. The allowance for loan losses to period-end loans retained was 2.61%, down from 3.12% in the prior year. Nonaccrual loans were $2.0 billion, a decrease of $801 million, or 29%, from the prior year.
Noninterest expense was $2.2 billion, an increase of $23 million, or 1%, compared with the prior year reflecting higher headcount-related expense partially offset by lower volume-related expense.
2009 compared with 2008 The following discussion of CB’s results reflects the September 25, 2008 acquisition of the commercial banking operations of Washington Mutual from the FDIC. The Washington Mutual transaction added approximately $44.5 billion in loans to the Commercial Term Lending, Real Estate Banking, and Other client segments in Commercial Banking.
Net income was $1.3 billion, a decrease of $168 million, or 12%, from the prior year, as higher provision for credit losses and noninterest expense was partially offset by higher net revenue, reflecting the impact of the Washington Mutual transaction.
Record net revenue of $5.7 billion increased $943 million, or 20%, from the prior year. Net interest income of $3.9 billion increased $607 million, or 18%, driven by the impact of the Washington Mutual transaction. Noninterest revenue was $1.8 billion, an increase of $336 million, or 23%, from the prior year, reflecting higher lending- and deposit-related fees and higher investment banking fees and other income.
On a client segment basis, revenue from Middle Market Banking was $3.1 billion, an increase of $116 million, or 4%, from the prior year due to higher liability balances, a shift to higher-spread liability products, wider loan spreads, higher lending- and deposit-related fees, and higher other income, partially offset by a narrowing of spreads on liability products and reduced loan balances. Revenue from Commercial Term Lending (a new client segment acquired in the Washington Mutual transaction encompassing multi-family and commercial mortgage loans) was $875 million, an increase of $632 million. Mid-Corporate Banking revenue was $1.1 billion, an increase of $181 million, or 20%, driven by higher investment banking fees, increased loan spreads, and higher lending- and deposit-related fees. Real Estate Banking revenue was $461 million, an increase of $48 million, or 12%, due to the impact of the Washington Mutual transaction.
The provision for credit losses was $1.5 billion, compared with $464 million in the prior year, reflecting continued weakness in the credit environment, predominantly in real estate-related segments. Net charge-offs were $1.1 billion (1.02% net charge-off rate), compared with $288 million (0.35% net charge-off rate) in the prior year. The allowance for loan losses to end-of-period loans retained was 3.12%, up from 2.45% in the prior year. Nonperforming loans were $2.8 billion, an increase of $1.8 billion from the prior year.
Noninterest expense was $2.2 billion, an increase of $230 million, or 12%, from the prior year, due to the impact of the Washington Mutual transaction and higher FDIC insurance premiums.
Selected metrics Year ended December 31, (in millions, except headcount and ratio data) 2010 2009 2008 Selected balance sheet data
(period-end): Loans:
Loans retained $ 97,900 $ 97,108 $ 115,130 Loans held-for-sale and loans at fair value 1,018 324 295
Total loans $ 98,918 $ 97,432 $ 115,425 Equity 8,000 8,000 8,000 Selected balance sheet data
(average): Total assets $ 133,654 $ 135,408 $ 114,299 Loans:
Loans retained $ 96,584 $ 106,421 $ 81,931 Loans held-for-sale and loans at fair value 422 317 406
Total loans $ 97,006 $ 106,738 $ 82,337 Liability balances(a) 138,862 113,152 103,121 Equity 8,000 8,000 7,251 Average loans by client segment: Middle Market Banking $ 35,059 $ 37,459 $ 42,193 Commercial Term Lending(b) 36,978 36,806 9,310 Mid-Corporate Banking 11,926 15,951 16,297 Real Estate Banking(b) 9,344 12,066 9,008 Other(b)(c) 3,699 4,456 5,529
Total Commercial Banking loans $ 97,006 $ 106,738 $ 82,337
Headcount 4,881 4,151 5,206
Credit data and quality statistics: Net charge-offs $ 909 $ 1,089 $ 288 Nonaccrual loans:
Nonaccrual loans retained(d) 1,964 2,764 1,026 Nonaccrual loans held-for-sale and loans held at fair value 36 37 —
Total nonaccrual loans 2,000 2,801 1,026 Assets acquired in loan satisfactions 197 188 116
Total nonperforming assets 2,197 2,989 1,142 Allowance for credit losses:
Allowance for loan losses 2,552 3,025 2,826 Allowance for lending-related
commitments 209 349 206
Total allowance for credit losses 2,761 3,374 3,032 Net charge-off rate 0.94% 1.02% 0.35% Allowance for loan losses to period-end
loans retained 2.61 3.12 2.45 Allowance for loan losses to average
loans retained 2.64 2.84 3.04(e)
Allowance for loan losses to nonaccrual loans retained 130 109 275
Nonaccrual loans to total period-end loans 2.02 2.87 0.89
Nonaccrual loans to total average loans 2.06 2.62 1.10(e)
(a) Liability balances include deposits, as well as deposits that are swept to on–balance sheet liabilities (e.g., commercial paper, federal funds purchased, time deposits and securities loaned or sold under repurchase agreements) as part of customer cash management programs.
(b) 2008 results reflect the partial year impact of the Washington Mutual transaction.
(c) Other primarily includes lending activity within the Community Development Banking and Chase Capital segments.
(d) Allowance for loan losses of $340 million, $581 million and $208 million were held against nonaccrual loans retained for the periods ended December 31, 2010, 2009, and 2008, respectively.
(e) Average loans in the calculation of this ratio were adjusted to include $44.5 billion of loans acquired in the Washington Mutual transaction as if the transaction occurred on July 1, 2008. Excluding this adjustment, the unadjusted allowance for loan losses to average loans retained and nonaccrual loans to total average loans ratios would have been 3.45% and 1.25%, respectively, for the period ended December 31, 2008.
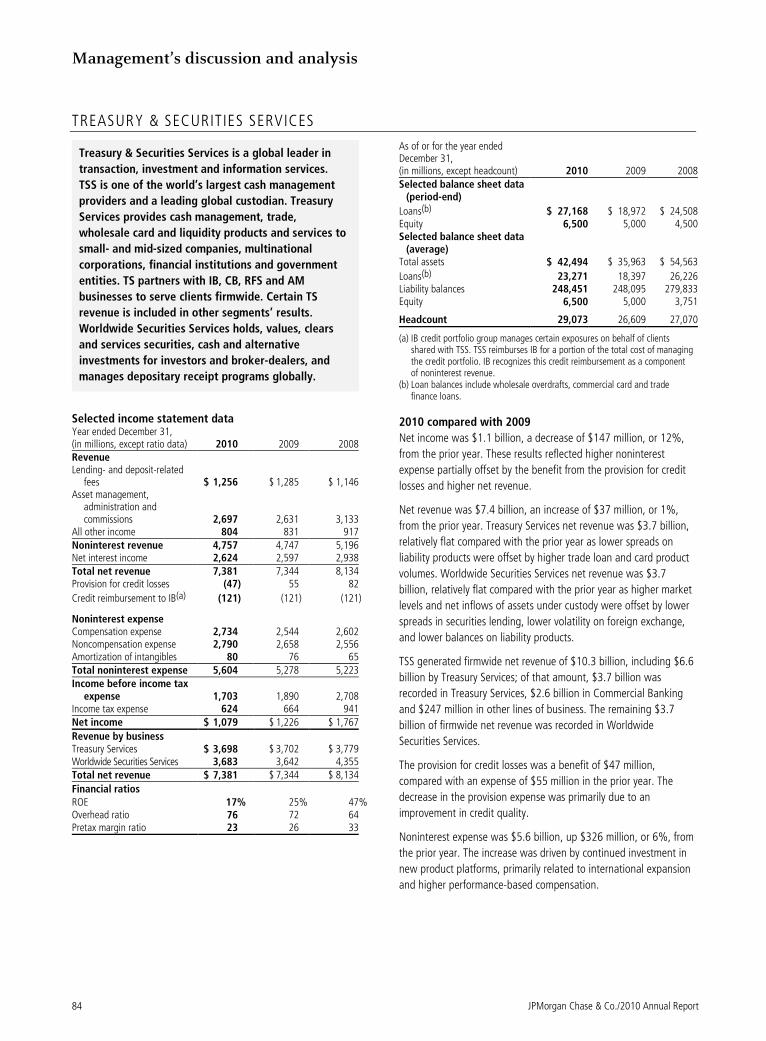
Management’s discussion and analysis
JPMorgan Chase & Co./2010 Annual Report 84
TREASURY & SECURITIES SERVICES
Treasury & Securities Services is a global leader in
transaction, investment and information services.
TSS is one of the world’s largest cash management
providers and a leading global custodian. Treasury
Services provides cash management, trade,
wholesale card and liquidity products and services to
small- and mid-sized companies, multinational
corporations, financial institutions and government
entities. TS partners with IB, CB, RFS and AM
businesses to serve clients firmwide. Certain TS
revenue is included in other segments’ results.
Worldwide Securities Services holds, values, clears
and services securities, cash and alternative
investments for investors and broker-dealers, and
manages depositary receipt programs globally.
Selected income statement data Year ended December 31, (in millions, except ratio data) 2010 2009 2008 Revenue Lending- and deposit-related
fees $ 1,256 $ 1,285 $ 1,146 Asset management,
administration and commissions 2,697 2,631 3,133
All other income 804 831 917 Noninterest revenue 4,757 4,747 5,196 Net interest income 2,624 2,597 2,938 Total net revenue 7,381 7,344 8,134 Provision for credit losses (47) 55 82
Credit reimbursement to IB(a) (121) (121) (121)
Noninterest expense Compensation expense 2,734 2,544 2,602 Noncompensation expense 2,790 2,658 2,556 Amortization of intangibles 80 76 65 Total noninterest expense 5,604 5,278 5,223 Income before income tax
expense 1,703 1,890 2,708 Income tax expense 624 664 941 Net income $ 1,079 $ 1,226 $ 1,767
Revenue by business Treasury Services $ 3,698 $ 3,702 $ 3,779 Worldwide Securities Services 3,683 3,642 4,355 Total net revenue $ 7,381 $ 7,344 $ 8,134
Financial ratios ROE 17% 25% 47% Overhead ratio 76 72 64 Pretax margin ratio 23 26 33
As of or for the year ended December 31, (in millions, except headcount) 2010 2009 2008Selected balance sheet data
(period-end)
Loans(b) $ 27,168 $ 18,972 $ 24,508Equity 6,500 5,000 4,500Selected balance sheet data
(average) Total assets $ 42,494 $ 35,963 $ 54,563
Loans(b) 23,271 18,397 26,226Liability balances 248,451 248,095 279,833Equity 6,500 5,000 3,751
Headcount 29,073 26,609 27,070
(a) IB credit portfolio group manages certain exposures on behalf of clients shared with TSS. TSS reimburses IB for a portion of the total cost of managing the credit portfolio. IB recognizes this credit reimbursement as a component of noninterest revenue.
(b) Loan balances include wholesale overdrafts, commercial card and trade finance loans.
2010 compared with 2009
Net income was $1.1 billion, a decrease of $147 million, or 12%,
from the prior year. These results reflected higher noninterest
expense partially offset by the benefit from the provision for credit
losses and higher net revenue.
Net revenue was $7.4 billion, an increase of $37 million, or 1%,
from the prior year. Treasury Services net revenue was $3.7 billion,
relatively flat compared with the prior year as lower spreads on
liability products were offset by higher trade loan and card product
volumes. Worldwide Securities Services net revenue was $3.7
billion, relatively flat compared with the prior year as higher market
levels and net inflows of assets under custody were offset by lower
spreads in securities lending, lower volatility on foreign exchange,
and lower balances on liability products.
TSS generated firmwide net revenue of $10.3 billion, including $6.6
billion by Treasury Services; of that amount, $3.7 billion was
recorded in Treasury Services, $2.6 billion in Commercial Banking
and $247 million in other lines of business. The remaining $3.7
billion of firmwide net revenue was recorded in Worldwide
Securities Services.
The provision for credit losses was a benefit of $47 million,
compared with an expense of $55 million in the prior year. The
decrease in the provision expense was primarily due to an
improvement in credit quality.
Noninterest expense was $5.6 billion, up $326 million, or 6%, from
the prior year. The increase was driven by continued investment in
new product platforms, primarily related to international expansion
and higher performance-based compensation.
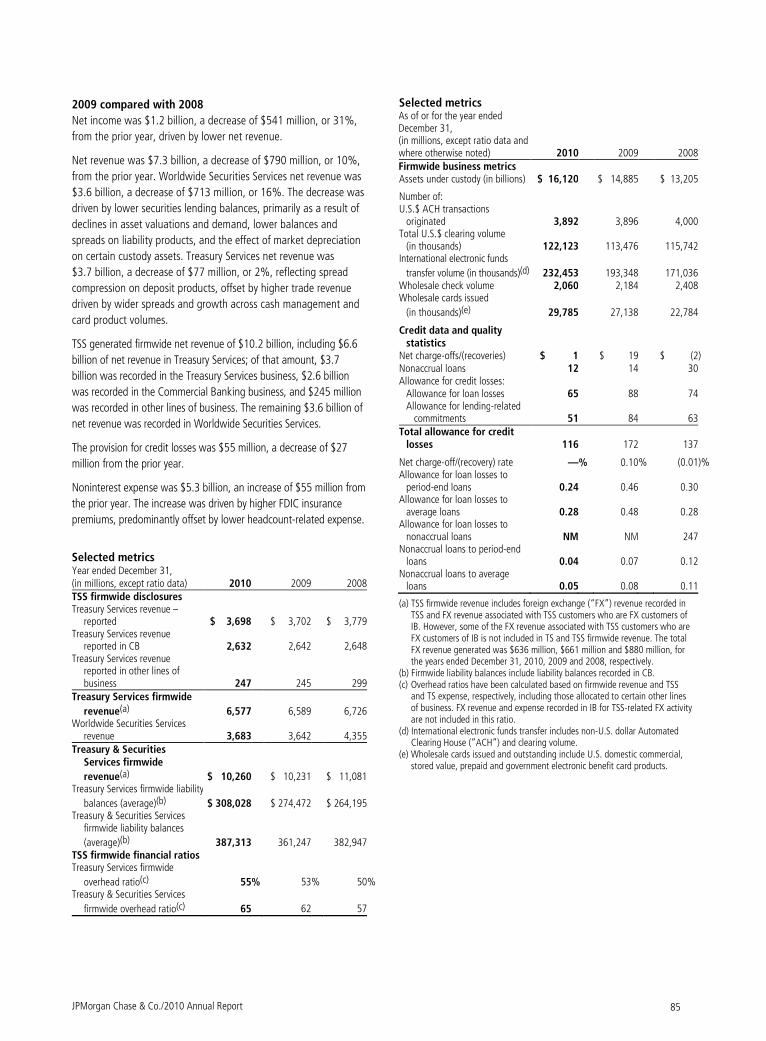
JPMorgan Chase & Co./2010 Annual Report 85
2009 compared with 2008
Net income was $1.2 billion, a decrease of $541 million, or 31%,
from the prior year, driven by lower net revenue.
Net revenue was $7.3 billion, a decrease of $790 million, or 10%,
from the prior year. Worldwide Securities Services net revenue was
$3.6 billion, a decrease of $713 million, or 16%. The decrease was
driven by lower securities lending balances, primarily as a result of
declines in asset valuations and demand, lower balances and
spreads on liability products, and the effect of market depreciation
on certain custody assets. Treasury Services net revenue was
$3.7 billion, a decrease of $77 million, or 2%, reflecting spread
compression on deposit products, offset by higher trade revenue
driven by wider spreads and growth across cash management and
card product volumes.
TSS generated firmwide net revenue of $10.2 billion, including $6.6
billion of net revenue in Treasury Services; of that amount, $3.7
billion was recorded in the Treasury Services business, $2.6 billion
was recorded in the Commercial Banking business, and $245 million
was recorded in other lines of business. The remaining $3.6 billion of
net revenue was recorded in Worldwide Securities Services.
The provision for credit losses was $55 million, a decrease of $27
million from the prior year.
Noninterest expense was $5.3 billion, an increase of $55 million from
the prior year. The increase was driven by higher FDIC insurance
premiums, predominantly offset by lower headcount-related expense.
Selected metrics Year ended December 31, (in millions, except ratio data) 2010 2009 2008 TSS firmwide disclosures Treasury Services revenue –
reported $ 3,698 $ 3,702 $ 3,779 Treasury Services revenue
reported in CB 2,632 2,642 2,648 Treasury Services revenue
reported in other lines of business 247 245 299
Treasury Services firmwide
revenue(a) 6,577 6,589 6,726 Worldwide Securities Services
revenue 3,683 3,642 4,355 Treasury & Securities
Services firmwide
revenue(a) $ 10,260 $ 10,231 $ 11,081 Treasury Services firmwide liability
balances (average)(b) $ 308,028 $ 274,472 $ 264,195 Treasury & Securities Services
firmwide liability balances
(average)(b) 387,313 361,247 382,947 TSS firmwide financial ratios Treasury Services firmwide
overhead ratio(c) 55% 53 % 50% Treasury & Securities Services
firmwide overhead ratio(c) 65 62 57
Selected metrics As of or for the year ended December 31, (in millions, except ratio data and where otherwise noted) 2010 2009 2008 Firmwide business metrics Assets under custody (in billions) $ 16,120 $ 14,885 $ 13,205
Number of: U.S.$ ACH transactions
originated 3,892 3,896 4,000 Total U.S.$ clearing volume
(in thousands) 122,123 113,476 115,742 International electronic funds
transfer volume (in thousands)(d) 232,453 193,348 171,036 Wholesale check volume 2,060 2,184 2,408 Wholesale cards issued
(in thousands)(e) 29,785 27,138 22,784
Credit data and quality statistics
Net charge-offs/(recoveries) $ 1 $ 19 $ (2) Nonaccrual loans 12 14 30 Allowance for credit losses:
Allowance for loan losses 65 88 74 Allowance for lending-related commitments 51 84 63
Total allowance for credit losses 116 172 137
Net charge-off/(recovery) rate —% 0.10% (0.01)% Allowance for loan losses to
period-end loans 0.24 0.46 0.30 Allowance for loan losses to
average loans 0.28 0.48 0.28 Allowance for loan losses to
nonaccrual loans NM NM 247 Nonaccrual loans to period-end
loans 0.04 0.07 0.12 Nonaccrual loans to average
loans 0.05 0.08 0.11
(a) TSS firmwide revenue includes foreign exchange (“FX”) revenue recorded in TSS and FX revenue associated with TSS customers who are FX customers of IB. However, some of the FX revenue associated with TSS customers who are FX customers of IB is not included in TS and TSS firmwide revenue. The total FX revenue generated was $636 million, $661 million and $880 million, for the years ended December 31, 2010, 2009 and 2008, respectively.
(b) Firmwide liability balances include liability balances recorded in CB. (c) Overhead ratios have been calculated based on firmwide revenue and TSS
and TS expense, respectively, including those allocated to certain other lines of business. FX revenue and expense recorded in IB for TSS-related FX activity are not included in this ratio.
(d) International electronic funds transfer includes non-U.S. dollar Automated Clearing House (”ACH”) and clearing volume.
(e) Wholesale cards issued and outstanding include U.S. domestic commercial, stored value, prepaid and government electronic benefit card products.
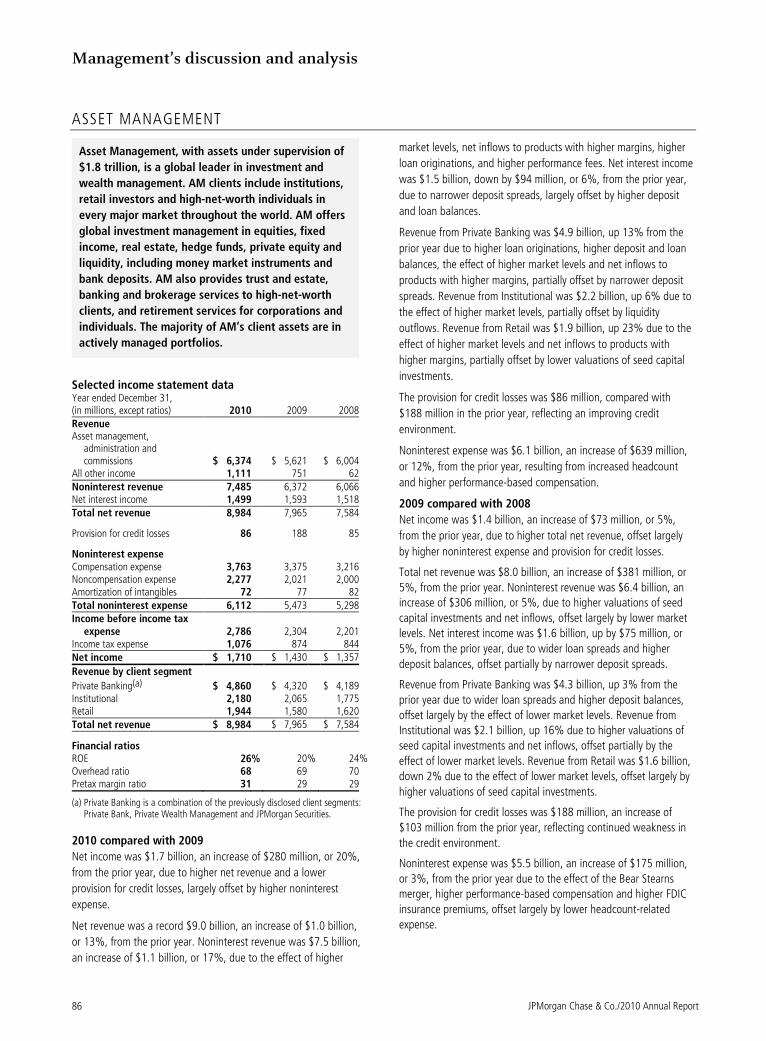
Management’s discussion and analysis
JPMorgan Chase & Co./2010 Annual Report 86
ASSET MANAGEMENT
Asset Management, with assets under supervision of
$1.8 trillion, is a global leader in investment and
wealth management. AM clients include institutions,
retail investors and high-net-worth individuals in
every major market throughout the world. AM offers
global investment management in equities, fixed
income, real estate, hedge funds, private equity and
liquidity, including money market instruments and
bank deposits. AM also provides trust and estate,
banking and brokerage services to high-net-worth
clients, and retirement services for corporations and
individuals. The majority of AM’s client assets are in
actively managed portfolios.
Selected income statement data Year ended December 31, (in millions, except ratios) 2010 2009 2008 Revenue Asset management,
administration and commissions $ 6,374 $ 5,621 $ 6,004
All other income 1,111 751 62 Noninterest revenue 7,485 6,372 6,066 Net interest income 1,499 1,593 1,518 Total net revenue 8,984 7,965 7,584
Provision for credit losses 86 188 85
Noninterest expense Compensation expense 3,763 3,375 3,216 Noncompensation expense 2,277 2,021 2,000 Amortization of intangibles 72 77 82 Total noninterest expense 6,112 5,473 5,298 Income before income tax
expense 2,786 2,304 2,201 Income tax expense 1,076 874 844 Net income $ 1,710 $ 1,430 $ 1,357
Revenue by client segment
Private Banking(a) $ 4,860 $ 4,320 $ 4,189 Institutional 2,180 2,065 1,775 Retail 1,944 1,580 1,620 Total net revenue $ 8,984 $ 7,965 $ 7,584
Financial ratios ROE 26% 20% 24 % Overhead ratio 68 69 70 Pretax margin ratio 31 29 29
(a) Private Banking is a combination of the previously disclosed client segments: Private Bank, Private Wealth Management and JPMorgan Securities.
2010 compared with 2009
Net income was $1.7 billion, an increase of $280 million, or 20%,
from the prior year, due to higher net revenue and a lower
provision for credit losses, largely offset by higher noninterest
expense.
Net revenue was a record $9.0 billion, an increase of $1.0 billion,
or 13%, from the prior year. Noninterest revenue was $7.5 billion,
an increase of $1.1 billion, or 17%, due to the effect of higher
market levels, net inflows to products with higher margins, higher
loan originations, and higher performance fees. Net interest income
was $1.5 billion, down by $94 million, or 6%, from the prior year,
due to narrower deposit spreads, largely offset by higher deposit
and loan balances.
Revenue from Private Banking was $4.9 billion, up 13% from the
prior year due to higher loan originations, higher deposit and loan
balances, the effect of higher market levels and net inflows to
products with higher margins, partially offset by narrower deposit
spreads. Revenue from Institutional was $2.2 billion, up 6% due to
the effect of higher market levels, partially offset by liquidity
outflows. Revenue from Retail was $1.9 billion, up 23% due to the
effect of higher market levels and net inflows to products with
higher margins, partially offset by lower valuations of seed capital
investments.
The provision for credit losses was $86 million, compared with
$188 million in the prior year, reflecting an improving credit
environment.
Noninterest expense was $6.1 billion, an increase of $639 million,
or 12%, from the prior year, resulting from increased headcount
and higher performance-based compensation.
2009 compared with 2008
Net income was $1.4 billion, an increase of $73 million, or 5%,
from the prior year, due to higher total net revenue, offset largely
by higher noninterest expense and provision for credit losses.
Total net revenue was $8.0 billion, an increase of $381 million, or
5%, from the prior year. Noninterest revenue was $6.4 billion, an
increase of $306 million, or 5%, due to higher valuations of seed
capital investments and net inflows, offset largely by lower market
levels. Net interest income was $1.6 billion, up by $75 million, or
5%, from the prior year, due to wider loan spreads and higher
deposit balances, offset partially by narrower deposit spreads.
Revenue from Private Banking was $4.3 billion, up 3% from the
prior year due to wider loan spreads and higher deposit balances,
offset largely by the effect of lower market levels. Revenue from
Institutional was $2.1 billion, up 16% due to higher valuations of
seed capital investments and net inflows, offset partially by the
effect of lower market levels. Revenue from Retail was $1.6 billion,
down 2% due to the effect of lower market levels, offset largely by
higher valuations of seed capital investments.
The provision for credit losses was $188 million, an increase of
$103 million from the prior year, reflecting continued weakness in
the credit environment.
Noninterest expense was $5.5 billion, an increase of $175 million,
or 3%, from the prior year due to the effect of the Bear Stearns
merger, higher performance-based compensation and higher FDIC
insurance premiums, offset largely by lower headcount-related
expense.
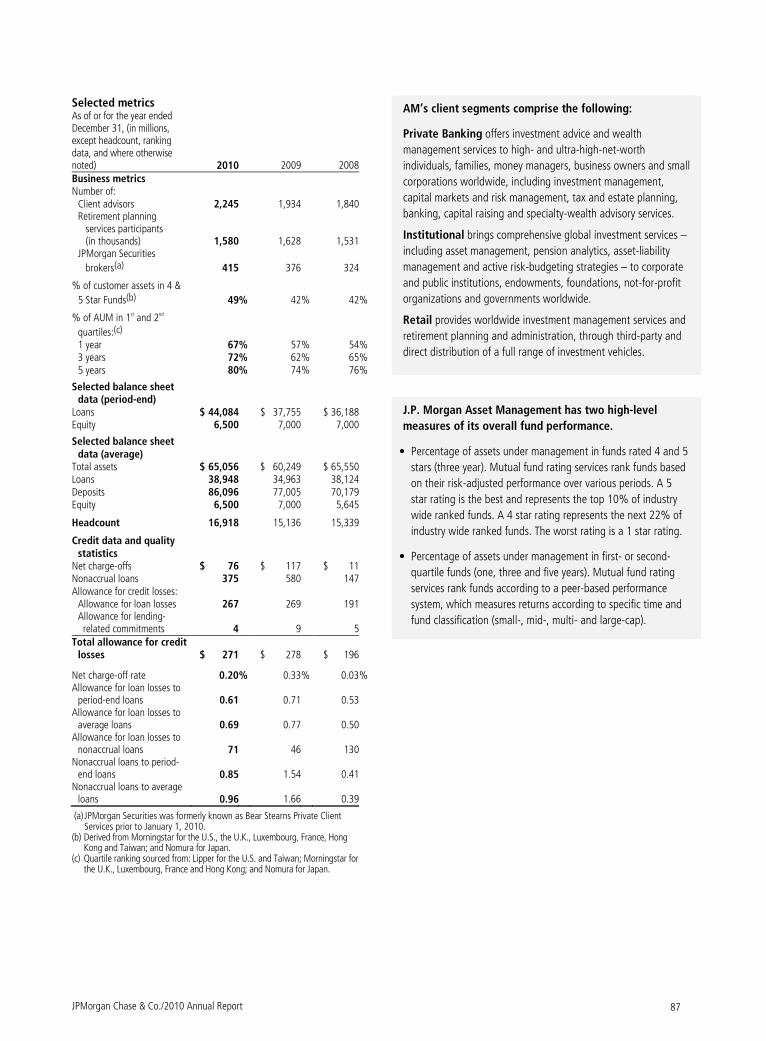
JPMorgan Chase & Co./2010 Annual Report 87
Selected metrics As of or for the year ended December 31, (in millions, except headcount, ranking data, and where otherwise noted) 2010 2009 2008 Business metrics Number of:
Client advisors 2,245 1,934 1,840 Retirement planning services participants (in thousands) 1,580 1,628 1,531 JPMorgan Securities
brokers(a) 415 376 324
% of customer assets in 4 &
5 Star Funds(b) 49% 42 % 42%
% of AUM in 1st and 2nd
quartiles:(c) 1 year 67% 57 % 54% 3 years 72% 62 % 65% 5 years 80% 74 % 76%
Selected balance sheet data (period-end)
Loans $ 44,084 $ 37,755 $ 36,188 Equity 6,500 7,000 7,000
Selected balance sheet data (average)
Total assets $ 65,056 $ 60,249 $ 65,550 Loans 38,948 34,963 38,124 Deposits 86,096 77,005 70,179 Equity 6,500 7,000 5,645
Headcount 16,918 15,136 15,339
Credit data and quality statistics
Net charge-offs $ 76 $ 117 $ 11 Nonaccrual loans 375 580 147 Allowance for credit losses:
Allowance for loan losses 267 269 191 Allowance for lending- related commitments 4 9 5
Total allowance for credit losses $ 271 $ 278 $ 196
Net charge-off rate 0.20% 0.33 % 0.03 % Allowance for loan losses to
period-end loans 0.61 0.71 0.53 Allowance for loan losses to
average loans 0.69 0.77 0.50 Allowance for loan losses to
nonaccrual loans 71 46 130 Nonaccrual loans to period-
end loans 0.85 1.54 0.41 Nonaccrual loans to average
loans 0.96 1.66 0.39
(a) JPMorgan Securities was formerly known as Bear Stearns Private Client Services prior to January 1, 2010.
(b) Derived from Morningstar for the U.S., the U.K., Luxembourg, France, Hong Kong and Taiwan; and Nomura for Japan.
(c) Quartile ranking sourced from: Lipper for the U.S. and Taiwan; Morningstar for the U.K., Luxembourg, France and Hong Kong; and Nomura for Japan.
AM’s client segments comprise the following:
Private Banking offers investment advice and wealth
management services to high- and ultra-high-net-worth
individuals, families, money managers, business owners and small
corporations worldwide, including investment management,
capital markets and risk management, tax and estate planning,
banking, capital raising and specialty-wealth advisory services.
Institutional brings comprehensive global investment services –
including asset management, pension analytics, asset-liability
management and active risk-budgeting strategies – to corporate
and public institutions, endowments, foundations, not-for-profit
organizations and governments worldwide.
Retail provides worldwide investment management services and
retirement planning and administration, through third-party and
direct distribution of a full range of investment vehicles.
J.P. Morgan Asset Management has two high-level
measures of its overall fund performance.
• Percentage of assets under management in funds rated 4 and 5
stars (three year). Mutual fund rating services rank funds based
on their risk-adjusted performance over various periods. A 5
star rating is the best and represents the top 10% of industry
wide ranked funds. A 4 star rating represents the next 22% of
industry wide ranked funds. The worst rating is a 1 star rating.
• Percentage of assets under management in first- or second-
quartile funds (one, three and five years). Mutual fund rating
services rank funds according to a peer-based performance
system, which measures returns according to specific time and
fund classification (small-, mid-, multi- and large-cap).
Management’s discussion and analysis
JPMorgan Chase & Co./2010 Annual Report 88
Assets under supervision 2010 compared with 2009
Assets under supervision were $1.8 trillion at December 31, 2010,
an increase of $139 billion, or 8%, from the prior year. Assets
under management were $1.3 trillion, an increase of $49 billion, or
4%, due to the effect of higher market levels and net inflows in
long-term products, largely offset by net outflows in liquidity
products. Custody, brokerage, administration and deposit balances
were $542 billion, up by $90 billion, or 20%, due to custody and
brokerage inflows and the effect of higher market levels. The Firm
also has a 41% interest in American Century Companies, Inc.,
whose AUM totaled $103 billion and $86 billion at December 31,
2010 and 2009, respectively; these are excluded from the AUM
above.
2009 compared with 2008
Assets under supervision were $1.7 trillion at December 31, 2009,
an increase of $205 billion, or 14%, from the prior year. Assets
under management were $1.2 trillion, an increase of $116 billion,
or 10%, from the prior year. The increases were due to the effect of
higher market valuations and inflows in fixed income and equity
products offset partially by outflows in cash products. Custody,
brokerage, administration and deposit balances were $452 billion,
up by $89 billion, due to the effect of higher market levels on
custody and brokerage balances, and brokerage inflows in Private
Banking. The Firm also had a 42% interest in American Century
Companies, Inc. at December 31, 2009, whose AUM totaled $86
billion and $70 billion at December 31, 2009 and 2008,
respectively; these are excluded from the AUM above.
Assets under supervision(a) As of or for the year ended December 31, (in billions) 2010 2009 2008 Assets by asset class Liquidity $ 497 $ 591 $ 613 Fixed income 289 226 180 Equities and multi-asset 404 339 240 Alternatives 108 93 100 Total assets under management 1,298 1,249 1,133 Custody/brokerage/administration/ deposits 542 452 363 Total assets under supervision $ 1,840 $ 1,701 $ 1,496
Assets by client segment
Private Banking(b) $ 284 $ 270 $ 258 Institutional 686 709 681 Retail 328 270 194 Total assets under management $ 1,298 $ 1,249 $ 1,133
Private Banking(b) $ 731 $ 636 $ 552 Institutional 687 710 682 Retail 422 355 262 Total assets under supervision $ 1,840 $ 1,701 $ 1,496
Assets by geographic region December 31, (in billions) 2010 2009 2008U.S./Canada $ 862 $ 837 $ 798 International 436 412 335 Total assets under management $ 1,298 $ 1,249 $ 1,133
U.S./Canada $ 1,271 $ 1,182 $ 1,084 International 569 519 412 Total assets under supervision $ 1,840 $ 1,701 $ 1,496
Mutual fund assets by asset class
Liquidity $ 446 $ 539 $ 553 Fixed income 92 67 41 Equities and multi-asset 169 143 92 Alternatives 7 9 7 Total mutual fund assets $ 714 $ 758 $ 693
Assets under management rollforward
Year ended December 31, (in billions) 2010 2009 2008 Beginning balance, January 1 $ 1,249 $ 1,133 $ 1,193 Net asset flows:
Liquidity (89) (23) 210 Fixed income 50 34 (12) Equities, multi-asset and alternatives 19 17 (47)
Market/performance/other impacts(c) 69 88 (211) Ending balance, December 31 $ 1,298 $ 1,249 $ 1,133 Assets under supervision
rollforward Beginning balance, January 1 $ 1,701 $ 1,496 $ 1,572 Net asset flows 28 50 181
Market/performance/other impacts(c) 111 155 (257) Ending balance, December 31 $ 1,840 $ 1,701 $ 1,496
(a) Excludes assets under management of American Century Companies, Inc., in which the Firm had a 41%, 42% and 43% ownership at December 31, 2010, 2009 and 2008, respectively.
(b) Private Banking is a combination of the previously disclosed client segments: Private Bank, Private Wealth Management and JPMorgan Securities.
(c) Includes $15 billion for assets under management and $68 billion for assets under supervision, which were acquired in the Bear Stearns merger in the second quarter of 2008.
JPMorgan Chase & Co./2010 Annual Report 89
CORPORATE/PRIVATE EQUITY
The Corporate/Private Equity sector comprises Private
Equity, Treasury, the Chief Investment Office, corporate
staff units and expense that is centrally managed.
Treasury and the Chief Investment Office manage capital,
liquidity and structural risks of the Firm. The corporate
staff units include Central Technology and Operations,
Internal Audit, Executive Office, Finance, Human
Resources, Marketing & Communications, Legal &
Compliance, Corporate Real Estate and General Services,
Risk Management, Corporate Responsibility and Strategy
& Development. Other centrally managed expense
includes the Firm’s occupancy and pension-related
expense, net of allocations to the business.
Selected income statement data Year ended December 31, (in millions, except headcount) 2010 2009 2008 Revenue
Principal transactions(a) $ 2,208 $ 1,574 $ (3,588 )
Securities gains(b) 2,898 1,139 1,637
All other income(c) 253 58 1,673 Noninterest revenue 5,359 2,771 (278 ) Net interest income 2,063 3,863 347
Total net revenue(d) 7,422 6,634 69
Provision for credit losses 14 80 447 (j)
Provision for credit losses –
accounting conformity(e) — — 1,534
Noninterest expense Compensation expense 2,357 2,811 2,340
Noncompensation expense(f) 8,788 3,597 1,841 Merger costs — 481 432 Subtotal 11,145 6,889 4,613 Net expense allocated to other
businesses (4,790) (4,994) (4,641 ) Total noninterest expense 6,355 1,895 (28 ) Income/(loss) before income
tax expense/(benefit) and extraordinary gain 1,053 4,659 (1,884 )
Income tax expense/(benefit)(g) (205) 1,705 (535 ) Income/(loss) before
extraordinary gain 1,258 2,954 (1,349 )
Extraordinary gain(h) — 76 1,906 Net income $ 1,258 $ 3,030 $ 557
Total net revenue Private equity $ 1,239 $ 18 $ (963 ) Corporate 6,183 6,616 1,032 Total net revenue $ 7,422 $ 6,634 $ 69
Net income/(loss) Private equity $ 588 $ (78) $ (690 )
Corporate(i) 670 3,108 1,247 Total net income $ 1,258 $ 3,030 $ 557 Headcount 20,030 20,119 23,376
(a) Included losses on preferred equity interests in Fannie Mae and Freddie Mac in 2008.
(b) Included gain on sale of MasterCard shares in 2008. (c) Included a gain from the dissolution of the Chase Paymentech Solutions joint
venture and proceeds from the sale of Visa shares in its initial public offering in 2008.
(d) Total net revenue included tax-equivalent adjustments, predominantly due to tax-exempt income from municipal bond investments of $226 million, $151 million and $57 million for 2010, 2009 and 2008, respectively.
(e) Represents an accounting conformity credit loss reserve provision related to the acquisition of Washington Mutual Bank’s banking operations.
(f) Includes litigation expense of $5.7 billion for 2010, compared with net benefits of $0.3 billion and $1.0 billion for 2009 and 2008, respectively. Included in the net benefits were a release of credit card litigation reserves in 2008 and insurance recoveries related to settlement of the Enron and WorldCom class action litigations. Also included a $675 million FDIC special assessment during 2009.
(g) Includes tax benefits recognized upon the resolution of tax audits. (h) On September 25, 2008, JPMorgan Chase acquired the banking operations of
Washington Mutual Bank. The acquisition resulted in negative goodwill, and accordingly, the Firm recognized an extraordinary gain. A preliminary gain of $1.9 billion was recognized at December 31, 2008. The final total extraordinary gain that resulted from the Washington Mutual transaction was $2.0 billion.
(i) 2009 and 2008 included merger costs and the extraordinary gain related to the Washington Mutual transaction, as well as items related to the Bear Stearns merger, including merger costs, asset management liquidation costs and JPMorgan Securities broker retention expense.
(j) In November 2008, the Firm transferred $5.8 billion of higher quality credit card loans from the legacy Chase portfolio to a securitization trust previously established by Washington Mutual (“the Trust”). As a result of converting higher credit quality Chase-originated on-book receivables to the Trust’s seller’s interest which had a higher overall loss rate reflective of the total assets within the Trust, approximately $400 million of incremental provision expense was recorded during the fourth quarter of 2008. This incremental provision expense was recorded in the Corporate segment as the action related to the acquisition of Washington Mutual's banking operations. For further discussion of credit card securitizations, see Note 16 on pages 244–259 of this Annual Report.
2010 compared with 2009
Net income was $1.3 billion compared with $3.0 billion in the prior
year. The decrease was driven by higher litigation expense, partially
offset by higher net revenue.
Net income for Private Equity was $588 million, compared with a
net loss of $78 million in the prior year, reflecting the impact of
improved market conditions on certain investments in the portfolio.
Net revenue was $1.2 billion compared with $18 million in the
prior year, reflecting private equity gains of $1.3 billion compared
with losses of $54 million. Noninterest expense was $323 million,
an increase of $182 million, driven by higher compensation
expense.
Net income for Corporate was $670 million, compared with $3.1
billion in the prior year. Current year results reflect after-tax
litigation expense of $3.5 billion, lower net interest income and
trading gains, partially offset by a higher level of securities gains,
primarily driven by repositioning of the portfolio in response to
changes in the interest rate environment and to rebalance
exposure. The prior year included merger-related net loss of $635
million and a $419 million FDIC assessment.
Management’s discussion and analysis
JPMorgan Chase & Co./2010 Annual Report 90
2009 compared with 2008
Net income was $3.0 billion compared with $557 million in the
prior year. The increase was driven by higher net revenue, partially
offset by higher litigation expense.
Net loss for Private Equity was $78 million compared with a net
loss of $690 million in the prior year. Net revenue was $18 million,
an increase of $981 million, reflecting private equity losses of $54
million compared with losses of $894 million. Noninterest expense
was $141 million, an increase of $21 million.
Net income for Corporate, including merger-related items, was $3.1
billion, compared with $1.2 billion in the prior year. Results in 2009
reflected higher levels of trading gains, net interest income and an
after-tax gain of $150 million from the sale of MasterCard shares,
partially offset by $635 million merger-related losses, a $419 million
FDIC special assessment, lower securities gains and the absence of
the $1.9 billion extraordinary gain related to the Washington
Mutual merger in 2008. Trading gains and net interest income
increased due to the Chief Investment Office’s (“CIO”) significant
purchases of mortgage-backed securities guaranteed by U.S.
government agencies, corporate debt securities, U.S. Treasury and
government agency securities and other asset-backed securities.
These investments were generally associated with the management
of interest rate risk and investment of cash resulting from the excess
funding the Firm continued to experience during 2009. The increase
in securities was partially offset by sales of higher-coupon instruments
(part of repositioning the investment portfolio) as well as
prepayments and maturities.
After-tax results in 2008 included $955 million in proceeds from the
sale of Visa shares in its initial public offering and $627 million from
the dissolution of the Chase Paymentech Solutions joint venture.
These items were partially offset by losses of $642 million on
preferred securities of Fannie Mae and Freddie Mac, a $248 million
charge related to the offer to repurchase auction-rate securities and
$211 million net merger costs.
Treasury and CIO Selected income statement and balance sheet data As of or for the year ended December 31, (in millions) 2010 2009 2008
Securities gains(a) $ 2,897 $ 1,147 $ 1,652 Investment securities portfolio (average) 323,673 324,037 113,010 Investment securities portfolio (ending) 310,801 340,163 192,564 Mortgage loans (average) 9,004 7,427 7,059 Mortgage loans (ending) 10,739 8,023 7,292
(a) Results for 2008 included a gain on the sale of MasterCard shares. All periods reflect repositioning of the Corporate investment securities portfolio.
For further information on the investment securities portfolio, see
Note 3 and Note 12 on pages 170–187 and 214–218, respectively,
of this Annual Report. For further information on CIO VaR and the
Firm’s earnings-at-risk, see the Market Risk Management section
on pages 142–146 of this Annual Report.
Private Equity Portfolio
Selected income statement and balance sheet data As of or for the year ended December 31, (in millions) 2010 2009 2008 Private equity gains/(losses) Realized gains $ 1,409 $ 109 $ 1,717
Unrealized gains/(losses)(a) (302) (81) (2,480 ) Total direct investments 1,107 28 (763 ) Third-party fund investments 241 (82) (131 )
Total private equity gains/(losses)(b) $ 1,348 $ (54) $ (894 )
Private equity portfolio information(c) Direct investments Publicly held securities Carrying value $ 875 $ 762 $ 483 Cost 732 743 792 Quoted public value 935 791 543
Privately held direct securities Carrying value 5,882 5,104 5,564 Cost 6,887 5,959 6,296
Third-party fund investments(d) Carrying value 1,980 1,459 805 Cost 2,404 2,079 1,169 Total private equity portfolio Carrying value $ 8,737 $ 7,325 $ 6,852 Cost $10,023 $ 8,781 $ 8,257
(a) Unrealized gains/(losses) contain reversals of unrealized gains and losses that were recognized in prior periods and have now been realized.
(b) Included in principal transactions revenue in the Consolidated Statements of Income. (c) For more information on the Firm’s policies regarding the valuation of the private
equity portfolio, see Note 3 on pages 170–187 of this Annual Report. (d) Unfunded commitments to third-party equity funds were $1.0 billion, $1.5 billion and
$1.4 billion at December 31, 2010, 2009 and 2008, respectively.
2010 compared with 2009
The carrying value of the private equity portfolio at December 31,
2010, was $8.7 billion, up from $7.3 billion at December 31, 2009.
The portfolio increase was primarily due to incremental follow-on
investments. The portfolio represented 6.9% of the Firm’s
stockholders’ equity less goodwill at December 31, 2010, up from
6.3% at December 31, 2009.
2009 compared with 2008
The carrying value of the private equity portfolio at December 31,
2009, was $7.3 billion, up from $6.9 billion at December 31, 2008.
The portfolio increase was primarily driven by additional follow-on
investments and net unrealized gains on the existing portfolio,
partially offset by sales during 2009. The portfolio represented
6.3% of the Firm’s stockholders’ equity less goodwill at December
31, 2009, up from 5.8% at December 31, 2008.
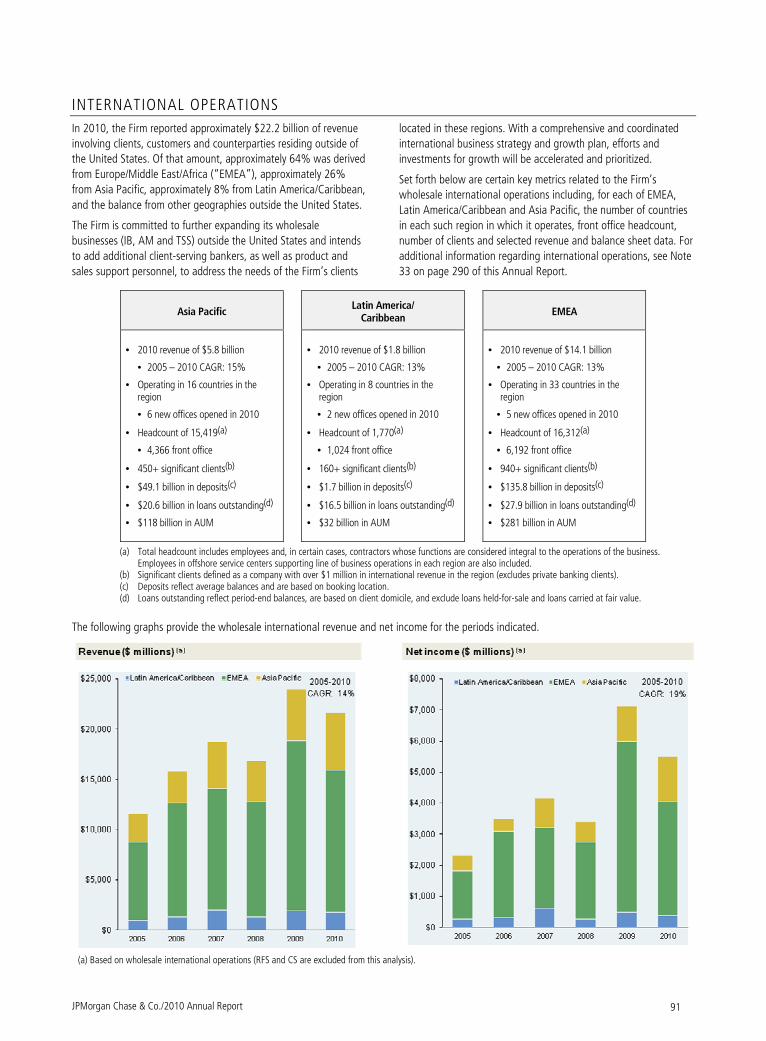
JPMorgan Chase & Co./2010 Annual Report 91
INTERNATIONAL OPERATIONS
In 2010, the Firm reported approximately $22.2 billion of revenue
involving clients, customers and counterparties residing outside of
the United States. Of that amount, approximately 64% was derived
from Europe/Middle East/Africa (“EMEA”), approximately 26%
from Asia Pacific, approximately 8% from Latin America/Caribbean,
and the balance from other geographies outside the United States.
The Firm is committed to further expanding its wholesale
businesses (IB, AM and TSS) outside the United States and intends
to add additional client-serving bankers, as well as product and
sales support personnel, to address the needs of the Firm’s clients
located in these regions. With a comprehensive and coordinated
international business strategy and growth plan, efforts and
investments for growth will be accelerated and prioritized.
Set forth below are certain key metrics related to the Firm’s
wholesale international operations including, for each of EMEA,
Latin America/Caribbean and Asia Pacific, the number of countries
in each such region in which it operates, front office headcount,
number of clients and selected revenue and balance sheet data. For
additional information regarding international operations, see Note
33 on page 290 of this Annual Report.
Asia Pacific Latin America/
Caribbean EMEA
• 2010 revenue of $5.8 billion
• 2005 – 2010 CAGR: 15%
• Operating in 16 countries in the region
• 6 new offices opened in 2010
• Headcount of 15,419(a)
• 4,366 front office
• 450+ significant clients(b)
• $49.1 billion in deposits(c)
• $20.6 billion in loans outstanding(d)
• $118 billion in AUM
• 2010 revenue of $1.8 billion
• 2005 – 2010 CAGR: 13%
• Operating in 8 countries in the region
• 2 new offices opened in 2010
• Headcount of 1,770(a)
• 1,024 front office
• 160+ significant clients(b)
• $1.7 billion in deposits(c)
• $16.5 billion in loans outstanding(d)
• $32 billion in AUM
• 2010 revenue of $14.1 billion
• 2005 – 2010 CAGR: 13%
• Operating in 33 countries in the region
• 5 new offices opened in 2010
• Headcount of 16,312(a)
• 6,192 front office
• 940+ significant clients(b)
• $135.8 billion in deposits(c)
• $27.9 billion in loans outstanding(d)
• $281 billion in AUM
(a) Total headcount includes employees and, in certain cases, contractors whose functions are considered integral to the operations of the business. Employees in offshore service centers supporting line of business operations in each region are also included.
(b) Significant clients defined as a company with over $1 million in international revenue in the region (excludes private banking clients). (c) Deposits reflect average balances and are based on booking location. (d) Loans outstanding reflect period-end balances, are based on client domicile, and exclude loans held-for-sale and loans carried at fair value.
The following graphs provide the wholesale international revenue and net income for the periods indicated.
(a) Based on wholesale international operations (RFS and CS are excluded from this analysis).
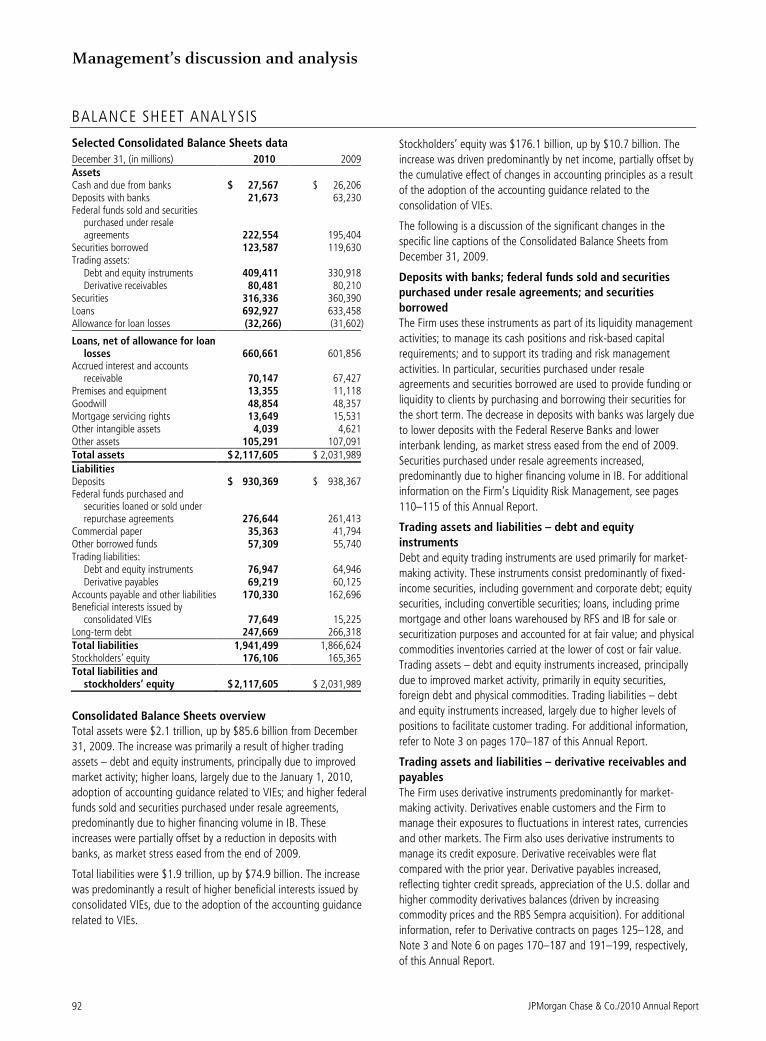
Management’s discussion and analysis
JPMorgan Chase & Co./2010 Annual Report 92
BALANCE SHEET ANALYSIS
Selected Consolidated Balance Sheets data
December 31, (in millions) 2010 2009 Assets Cash and due from banks $ 27,567 $ 26,206 Deposits with banks 21,673 63,230 Federal funds sold and securities
purchased under resale agreements 222,554 195,404
Securities borrowed 123,587 119,630 Trading assets:
Debt and equity instruments 409,411 330,918 Derivative receivables 80,481 80,210
Securities 316,336 360,390 Loans 692,927 633,458 Allowance for loan losses (32,266) (31,602)
Loans, net of allowance for loan losses 660,661 601,856
Accrued interest and accounts receivable 70,147 67,427
Premises and equipment 13,355 11,118 Goodwill 48,854 48,357 Mortgage servicing rights 13,649 15,531 Other intangible assets 4,039 4,621 Other assets 105,291 107,091 Total assets $ 2,117,605 $ 2,031,989
Liabilities Deposits $ 930,369 $ 938,367 Federal funds purchased and
securities loaned or sold under repurchase agreements 276,644 261,413
Commercial paper 35,363 41,794 Other borrowed funds 57,309 55,740 Trading liabilities:
Debt and equity instruments 76,947 64,946 Derivative payables 69,219 60,125
Accounts payable and other liabilities 170,330 162,696 Beneficial interests issued by
consolidated VIEs 77,649 15,225 Long-term debt 247,669 266,318 Total liabilities 1,941,499 1,866,624 Stockholders’ equity 176,106 165,365 Total liabilities and
stockholders’ equity $ 2,117,605 $ 2,031,989
Consolidated Balance Sheets overview
Total assets were $2.1 trillion, up by $85.6 billion from December
31, 2009. The increase was primarily a result of higher trading
assets – debt and equity instruments, principally due to improved
market activity; higher loans, largely due to the January 1, 2010,
adoption of accounting guidance related to VIEs; and higher federal
funds sold and securities purchased under resale agreements,
predominantly due to higher financing volume in IB. These
increases were partially offset by a reduction in deposits with
banks, as market stress eased from the end of 2009.
Total liabilities were $1.9 trillion, up by $74.9 billion. The increase
was predominantly a result of higher beneficial interests issued by
consolidated VIEs, due to the adoption of the accounting guidance
related to VIEs.
Stockholders’ equity was $176.1 billion, up by $10.7 billion. The
increase was driven predominantly by net income, partially offset by
the cumulative effect of changes in accounting principles as a result
of the adoption of the accounting guidance related to the
consolidation of VIEs.
The following is a discussion of the significant changes in the
specific line captions of the Consolidated Balance Sheets from
December 31, 2009.
Deposits with banks; federal funds sold and securities
purchased under resale agreements; and securities
borrowed
The Firm uses these instruments as part of its liquidity management
activities; to manage its cash positions and risk-based capital
requirements; and to support its trading and risk management
activities. In particular, securities purchased under resale
agreements and securities borrowed are used to provide funding or
liquidity to clients by purchasing and borrowing their securities for
the short term. The decrease in deposits with banks was largely due
to lower deposits with the Federal Reserve Banks and lower
interbank lending, as market stress eased from the end of 2009.
Securities purchased under resale agreements increased,
predominantly due to higher financing volume in IB. For additional
information on the Firm’s Liquidity Risk Management, see pages
110–115 of this Annual Report.
Trading assets and liabilities – debt and equity
instruments
Debt and equity trading instruments are used primarily for market-
making activity. These instruments consist predominantly of fixed-
income securities, including government and corporate debt; equity
securities, including convertible securities; loans, including prime
mortgage and other loans warehoused by RFS and IB for sale or
securitization purposes and accounted for at fair value; and physical
commodities inventories carried at the lower of cost or fair value.
Trading assets – debt and equity instruments increased, principally
due to improved market activity, primarily in equity securities,
foreign debt and physical commodities. Trading liabilities – debt
and equity instruments increased, largely due to higher levels of
positions to facilitate customer trading. For additional information,
refer to Note 3 on pages 170–187 of this Annual Report.
Trading assets and liabilities – derivative receivables and
payables
The Firm uses derivative instruments predominantly for market-
making activity. Derivatives enable customers and the Firm to
manage their exposures to fluctuations in interest rates, currencies
and other markets. The Firm also uses derivative instruments to
manage its credit exposure. Derivative receivables were flat
compared with the prior year. Derivative payables increased,
reflecting tighter credit spreads, appreciation of the U.S. dollar and
higher commodity derivatives balances (driven by increasing
commodity prices and the RBS Sempra acquisition). For additional
information, refer to Derivative contracts on pages 125–128, and
Note 3 and Note 6 on pages 170–187 and 191–199, respectively,
of this Annual Report.
JPMorgan Chase & Co./2010 Annual Report 93
Securities
Substantially all of the securities portfolio is classified as available-
for-sale (“AFS”) and used primarily to manage the Firm’s exposure
to interest rate movements and to invest cash resulting from excess
funding positions. Securities decreased, largely due to repositioning
of the portfolio in Corporate, in response to changes in the interest
rate environment and to rebalance exposures. The repositioning
reduced U.S. government agency securities and increased non-U.S.
mortgage-backed securities. The adoption of the new accounting
guidance related to VIEs, which resulted in the elimination of
retained AFS securities issued by Firm-sponsored credit card
securitization trusts, also contributed to the decrease. For
information related to securities, refer to the Corporate/Private
Equity segment on pages 89–90, and Note 3 and Note 12 on
pages 170–187 and 214–218, respectively, of this Annual Report.
Loans and allowance for loan losses
The Firm provides loans to a variety of customers, from large
corporate and institutional clients to individual consumers. Loans and
the allowance for loan losses increased as a result of the Firm’s
adoption of accounting guidance related to VIEs at January 1, 2010.
Excluding the impact of the adoption of the new accounting
guidance, loans decreased due to the continued runoff of the
residential real estate loans and credit card balances. The decrease
was partially offset by an increase in wholesale loans, mainly in TSS
and AM.
The allowance for loan losses, excluding the impact of this adoption,
decreased primarily due to a decline in the credit card and wholesale
allowance. The decrease was offset partially by an increase in the
consumer (excluding credit card) allowance.
For a more detailed discussion of the loan portfolio and the
allowance for loan losses, refer to Credit Risk Management on
pages 116–141, and Notes 3, 4, 14 and 15 on pages 170–187,
187–189, 220–238 and 239–243, respectively, of this Annual
Report.
Accrued interest and accounts receivable
This line caption consists of accrued interest receivables from
interest-earning assets; receivables from customers (primarily from
activities related to IB’s Prime Services business); receivables from
brokers, dealers and clearing organizations; and receivables from
failed securities sales. Accrued interest and accounts receivable
increased, reflecting higher customer receivables in IB’s Prime
Services business due to increased client activity. The increase was
offset partially by the elimination of retained securitization interests
upon the adoption of the new accounting guidance that resulted in
the consolidation of Firm-sponsored credit card securitization trusts.
For a more detailed discussion of the adoption, see Note 1 and
Note 16 on pages 164–165 and 244–259, respectively, of this
Annual Report.
Premises and equipment
The Firm’s premises and equipment consist of land, buildings,
leasehold improvements, furniture and fixtures, hardware and
software, and other equipment. The increase in premises and
equipment was primarily due to the purchase of two buildings, one
in New York and one in London; investments in hardware, software
and other equipment also contributed to the increase. The increase
was partially offset by the related depreciation and amortization of
these assets.
Goodwill
Goodwill arises from business combinations and represents the
excess of the purchase price of an acquired entity or business over
the fair values assigned to assets acquired and liabilities assumed.
The increase in goodwill was largely due to the acquisition of RBS
Sempra Commodities’ global oil, global metal, and European power
and gas businesses by IB; and the purchase of a majority interest in
Gávea Investimentos, a leading alternative asset management
company in Brazil, by AM. For additional information on goodwill,
see Note 17 on pages 260–263 of this Annual Report.
Mortgage servicing rights
MSRs represent the fair value of future cash flows for performing
specified mortgage-servicing activities (predominantly related to
residential mortgages) for others. MSRs are either purchased from
third parties or retained upon the sale or securitization of mortgage
loans. Servicing activities include collecting principal, interest and
escrow payments from borrowers; making tax and insurance
payments on behalf of borrowers; monitoring delinquencies and
executing foreclosure proceedings; and accounting for and
remitting principal and interest payments to the related investors of
the mortgage-backed securities. MSRs decreased, predominantly
due to a significant decline in market interest rates during 2010, as
well as from servicing portfolio runoff and dispositions of MSRs.
These decreases were partially offset by increases related to sales in
RFS of originated loans for which servicing rights were retained. For
additional information on MSRs, see Note 3 and Note 17 on pages
170–187 and 260–263, respectively, of this Annual Report
Other intangible assets
Other intangible assets consist of purchased credit card
relationships, other credit card–related intangibles, core deposit
intangibles and other intangibles. The decrease in other intangible
assets was predominately due to amortization, partially offset by an
increase resulting from the aforementioned Gávea Investimentos
transaction. For additional information on other intangible assets,
see Note 17 on pages 260–263 of this Annual Report.
Other assets
Other assets consist of private equity and other investments, cash
collateral pledged, corporate and bank-owned life insurance
policies, assets acquired in loan satisfactions (including real estate
owned) and all other assets. At December 31, 2010, other assets
were relatively flat compared with December 31, 2009.
Management’s discussion and analysis
JPMorgan Chase & Co./2010 Annual Report 94
Deposits
Deposits represent a liability to customers, both retail and
wholesale, related to non-brokerage funds held on their behalf.
Deposits are classified by location (U.S. and non-U.S.), whether
they are interest- or noninterest-bearing, and by type (i.e., demand,
money-market, savings, time or negotiable order of withdrawal
accounts). Deposits provide a stable and consistent source of
funding for the Firm. Deposits decreased, reflecting a decline in
wholesale funding due to the Firm’s lower funding needs, and
lower deposit levels in TSS. These factors were offset partially by
net inflows from existing customers and new business in CB, RFS
and AM. For more information on deposits, refer to the RFS and
AM segment discussions on pages 72–78 and 86–88, respectively;
the Liquidity Risk Management discussion on pages 110–115; and
Note 3 and Note 19 on pages 170–187 and 263–264, respectively,
of this Annual Report. For more information on wholesale liability
balances, which includes deposits, refer to the CB and TSS segment
discussions on pages 82–83 and 84–85, respectively, of this
Annual Report.
Federal funds purchased and securities loaned or sold
under repurchase agreements
The Firm uses these instruments as part of its liquidity management
activities and to support its trading and risk management activities.
In particular, federal funds purchased and securities loaned or sold
under repurchase agreements are used as short-term funding
sources and to make securities available to clients for their short-
term liquidity purposes. Securities sold under repurchase
agreements increased, largely due to increased levels of activity in
IB, partially offset by a decrease in CIO repositioning activities. For
additional information on the Firm’s Liquidity Risk Management,
see pages 110–115 of this Annual Report.
Commercial paper and other borrowed funds
The Firm uses commercial paper and other borrowed funds in its
liquidity management activities to meet short-term funding needs,
and in connection with a TSS liquidity management product,
whereby excess client funds are transferred into commercial paper
overnight sweep accounts. Commercial paper and other borrowed
funds, which includes advances from Federal Home Loan Banks
(“FHLBs”), decreased due to lower funding requirements. For
additional information on the Firm’s Liquidity Risk Management
and other borrowed funds, see pages 110–115, and Note 20 on
page 264 of this Annual Report.
Accounts payable and other liabilities
Accounts payable and other liabilities consist of payables to
customers (primarily from activities related to IB’s Prime Services
business); payables to brokers, dealers and clearing organizations;
payables from failed securities purchases; accrued expense,
including interest-bearing liabilities; and all other liabilities,
including litigation reserves and obligations to return securities
received as collateral. Accounts payable and other liabilities
increased due to additional litigation reserves, largely for mortgage-
related matters.
Beneficial interests issued by consolidated VIEs
Beneficial interests issued by consolidated VIEs represent interest-
bearing beneficial-interest liabilities, which increased,
predominantly due to the Firm’s adoption of accounting guidance
related to VIEs, partially offset by maturities of $24.9 billion related
to Firm-sponsored credit card securitization trusts. For additional
information on Firm-sponsored VIEs and loan securitization trusts,
see Off–Balance Sheet Arrangements and Contractual Cash
Obligations below, and Note 16 and Note 22 on pages 244–259
and 265–266, respectively, of this Annual Report.
Long-term debt
The Firm uses long-term debt (including trust-preferred capital debt
securities) to provide cost-effective and diversified sources of funds
and as critical components of the Firm's liquidity and capital
management activities. Long-term debt decreased, due to lower
funding requirements. Maturities and redemptions totaled $53.4
billion during 2010 and were partially offset by new issuances of
$36.0 billion. For additional information on the Firm’s long-term
debt activities, see the Liquidity Risk Management discussion on
pages 110–115, and Note 22 on pages 265–266 of this Annual
Report.
Stockholders’ equity
Total stockholders’ equity increased, predominantly due to net
income, and net issuances and commitments to issue under the
Firm’s employee stock-based compensation plans. The increase was
partially offset by the impact of the adoption of the new accounting
guidance related to VIEs, which resulted in a reduction of $4.5 billion,
driven by the establishment of an allowance for loan losses of $7.5
billion (pretax) related to receivables predominantly held in credit
card securitization trusts that were consolidated at the adoption
date. Also partially offsetting the increase were stock repurchases;
the purchase of the remaining interest in a consolidated subsidiary
from noncontrolling shareholders; and the declaration of cash
dividends on common and preferred stock. For a more detailed
discussion of the adoption of new consolidated guidance related to
VIEs, see Notes 1 and 16 on pages 164–165 and 244–259,
respectively, of this Annual Report.
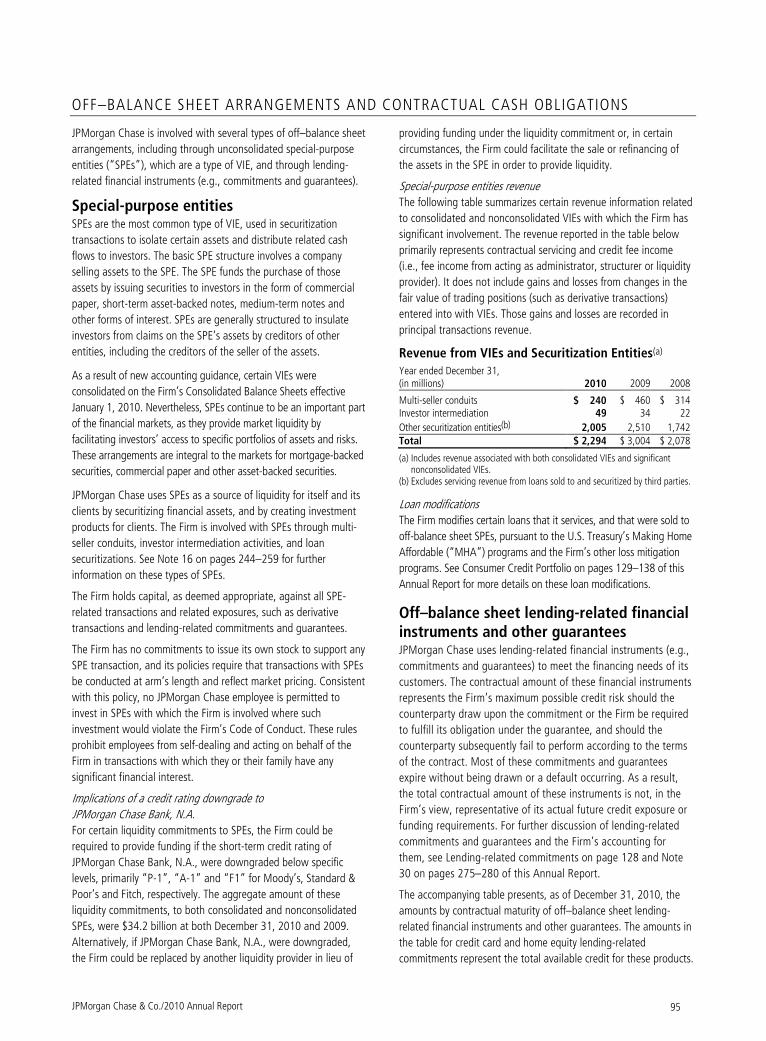
JPMorgan Chase & Co./2010 Annual Report 95
OFF–BALANCE SHEET ARRANGEMENTS AND CONTRACTUAL CASH OBLIGATIONS
JPMorgan Chase is involved with several types of off–balance sheet
arrangements, including through unconsolidated special-purpose
entities (“SPEs”), which are a type of VIE, and through lending-
related financial instruments (e.g., commitments and guarantees).
Special-purpose entities SPEs are the most common type of VIE, used in securitization
transactions to isolate certain assets and distribute related cash
flows to investors. The basic SPE structure involves a company
selling assets to the SPE. The SPE funds the purchase of those
assets by issuing securities to investors in the form of commercial
paper, short-term asset-backed notes, medium-term notes and
other forms of interest. SPEs are generally structured to insulate
investors from claims on the SPE’s assets by creditors of other
entities, including the creditors of the seller of the assets.
As a result of new accounting guidance, certain VIEs were
consolidated on the Firm’s Consolidated Balance Sheets effective
January 1, 2010. Nevertheless, SPEs continue to be an important part
of the financial markets, as they provide market liquidity by
facilitating investors’ access to specific portfolios of assets and risks.
These arrangements are integral to the markets for mortgage-backed
securities, commercial paper and other asset-backed securities.
JPMorgan Chase uses SPEs as a source of liquidity for itself and its
clients by securitizing financial assets, and by creating investment
products for clients. The Firm is involved with SPEs through multi-
seller conduits, investor intermediation activities, and loan
securitizations. See Note 16 on pages 244–259 for further
information on these types of SPEs.
The Firm holds capital, as deemed appropriate, against all SPE-
related transactions and related exposures, such as derivative
transactions and lending-related commitments and guarantees.
The Firm has no commitments to issue its own stock to support any
SPE transaction, and its policies require that transactions with SPEs
be conducted at arm’s length and reflect market pricing. Consistent
with this policy, no JPMorgan Chase employee is permitted to
invest in SPEs with which the Firm is involved where such
investment would violate the Firm’s Code of Conduct. These rules
prohibit employees from self-dealing and acting on behalf of the
Firm in transactions with which they or their family have any
significant financial interest.
Implications of a credit rating downgrade to
JPMorgan Chase Bank, N.A.
For certain liquidity commitments to SPEs, the Firm could be
required to provide funding if the short-term credit rating of
JPMorgan Chase Bank, N.A., were downgraded below specific
levels, primarily “P-1”, “A-1” and “F1” for Moody’s, Standard &
Poor’s and Fitch, respectively. The aggregate amount of these
liquidity commitments, to both consolidated and nonconsolidated
SPEs, were $34.2 billion at both December 31, 2010 and 2009.
Alternatively, if JPMorgan Chase Bank, N.A., were downgraded,
the Firm could be replaced by another liquidity provider in lieu of
providing funding under the liquidity commitment or, in certain
circumstances, the Firm could facilitate the sale or refinancing of
the assets in the SPE in order to provide liquidity.
Special-purpose entities revenue
The following table summarizes certain revenue information related
to consolidated and nonconsolidated VIEs with which the Firm has
significant involvement. The revenue reported in the table below
primarily represents contractual servicing and credit fee income
(i.e., fee income from acting as administrator, structurer or liquidity
provider). It does not include gains and losses from changes in the
fair value of trading positions (such as derivative transactions)
entered into with VIEs. Those gains and losses are recorded in
principal transactions revenue.
Revenue from VIEs and Securitization Entities(a)
Year ended December 31, (in millions) 2010 2009 2008
Multi-seller conduits $ 240 $ 460 $ 314
Investor intermediation 49 34 22
Other securitization entities(b) 2,005 2,510 1,742 Total $ 2,294 $ 3,004 $ 2,078
(a) Includes revenue associated with both consolidated VIEs and significant nonconsolidated VIEs.
(b) Excludes servicing revenue from loans sold to and securitized by third parties.
Loan modifications
The Firm modifies certain loans that it services, and that were sold to
off-balance sheet SPEs, pursuant to the U.S. Treasury’s Making Home
Affordable (“MHA”) programs and the Firm’s other loss mitigation
programs. See Consumer Credit Portfolio on pages 129–138 of this
Annual Report for more details on these loan modifications.
Off–balance sheet lending-related financial instruments and other guarantees JPMorgan Chase uses lending-related financial instruments (e.g.,
commitments and guarantees) to meet the financing needs of its
customers. The contractual amount of these financial instruments
represents the Firm’s maximum possible credit risk should the
counterparty draw upon the commitment or the Firm be required
to fulfill its obligation under the guarantee, and should the
counterparty subsequently fail to perform according to the terms
of the contract. Most of these commitments and guarantees
expire without being drawn or a default occurring. As a result,
the total contractual amount of these instruments is not, in the
Firm’s view, representative of its actual future credit exposure or
funding requirements. For further discussion of lending-related
commitments and guarantees and the Firm’s accounting for
them, see Lending-related commitments on page 128 and Note
30 on pages 275–280 of this Annual Report.
The accompanying table presents, as of December 31, 2010, the
amounts by contractual maturity of off–balance sheet lending-
related financial instruments and other guarantees. The amounts in
the table for credit card and home equity lending-related
commitments represent the total available credit for these products.
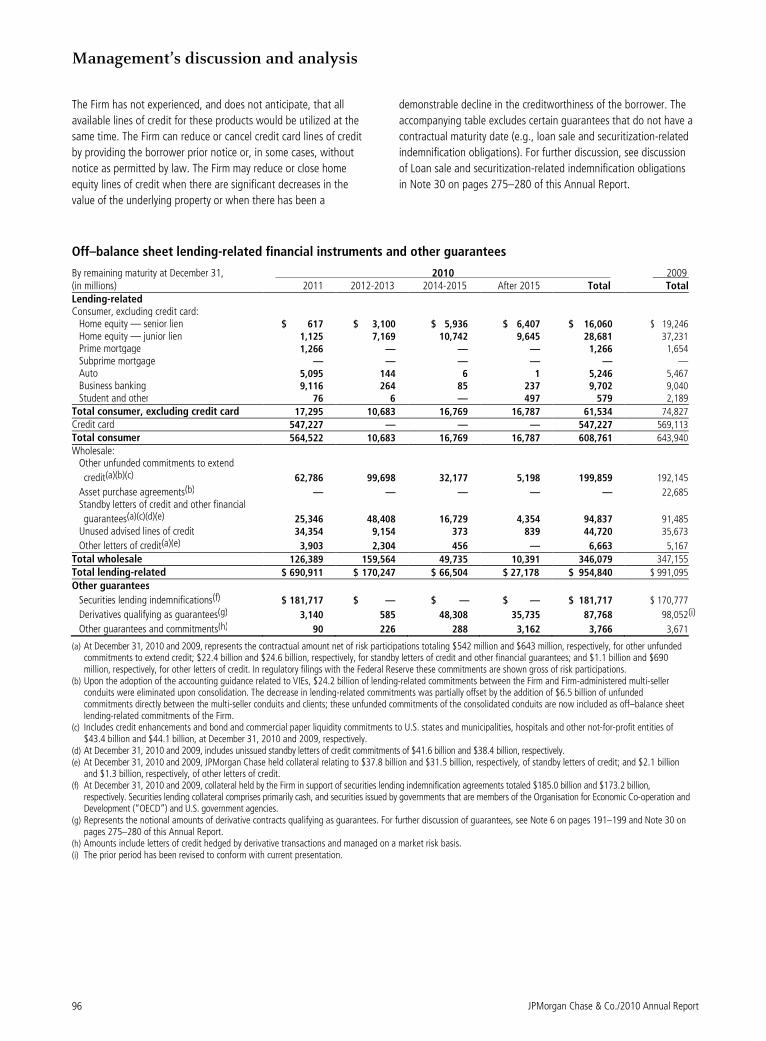
Management’s discussion and analysis
JPMorgan Chase & Co./2010 Annual Report 96
The Firm has not experienced, and does not anticipate, that all
available lines of credit for these products would be utilized at the
same time. The Firm can reduce or cancel credit card lines of credit
by providing the borrower prior notice or, in some cases, without
notice as permitted by law. The Firm may reduce or close home
equity lines of credit when there are significant decreases in the
value of the underlying property or when there has been a
demonstrable decline in the creditworthiness of the borrower. The
accompanying table excludes certain guarantees that do not have a
contractual maturity date (e.g., loan sale and securitization-related
indemnification obligations). For further discussion, see discussion
of Loan sale and securitization-related indemnification obligations
in Note 30 on pages 275–280 of this Annual Report.
Off–balance sheet lending-related financial instruments and other guarantees
By remaining maturity at December 31, 2010 2009 (in millions) 2011 2012-2013 2014-2015 After 2015 Total Total Lending-related Consumer, excluding credit card:
Home equity — senior lien $ 617 $ 3,100 $ 5,936 $ 6,407 $ 16,060 $ 19,246 Home equity — junior lien 1,125 7,169 10,742 9,645 28,681 37,231 Prime mortgage 1,266 — — — 1,266 1,654 Subprime mortgage — — — — — — Auto 5,095 144 6 1 5,246 5,467 Business banking 9,116 264 85 237 9,702 9,040 Student and other 76 6 — 497 579 2,189
Total consumer, excluding credit card 17,295 10,683 16,769 16,787 61,534 74,827
Credit card 547,227 — — — 547,227 569,113
Total consumer 564,522 10,683 16,769 16,787 608,761 643,940
Wholesale: Other unfunded commitments to extend
credit(a)(b)(c) 62,786 99,698 32,177 5,198 199,859 192,145
Asset purchase agreements(b) — — — — — 22,685
Standby letters of credit and other financial
guarantees(a)(c)(d)(e) 25,346 48,408 16,729 4,354 94,837 91,485 Unused advised lines of credit 34,354 9,154 373 839 44,720 35,673
Other letters of credit(a)(e) 3,903 2,304 456 — 6,663 5,167
Total wholesale 126,389 159,564 49,735 10,391 346,079 347,155
Total lending-related $ 690,911 $ 170,247 $ 66,504 $ 27,178 $ 954,840 $ 991,095
Other guarantees
Securities lending indemnifications(f) $ 181,717 $ — $ — $ — $ 181,717 $ 170,777
Derivatives qualifying as guarantees(g) 3,140 585 48,308 35,735 87,768 98,052 (i)
Other guarantees and commitments(h) 90 226 288 3,162 3,766 3,671
(a) At December 31, 2010 and 2009, represents the contractual amount net of risk participations totaling $542 million and $643 million, respectively, for other unfunded commitments to extend credit; $22.4 billion and $24.6 billion, respectively, for standby letters of credit and other financial guarantees; and $1.1 billion and $690 million, respectively, for other letters of credit. In regulatory filings with the Federal Reserve these commitments are shown gross of risk participations.
(b) Upon the adoption of the accounting guidance related to VIEs, $24.2 billion of lending-related commitments between the Firm and Firm-administered multi-seller conduits were eliminated upon consolidation. The decrease in lending-related commitments was partially offset by the addition of $6.5 billion of unfunded commitments directly between the multi-seller conduits and clients; these unfunded commitments of the consolidated conduits are now included as off–balance sheet lending-related commitments of the Firm.
(c) Includes credit enhancements and bond and commercial paper liquidity commitments to U.S. states and municipalities, hospitals and other not-for-profit entities of $43.4 billion and $44.1 billion, at December 31, 2010 and 2009, respectively.
(d) At December 31, 2010 and 2009, includes unissued standby letters of credit commitments of $41.6 billion and $38.4 billion, respectively. (e) At December 31, 2010 and 2009, JPMorgan Chase held collateral relating to $37.8 billion and $31.5 billion, respectively, of standby letters of credit; and $2.1 billion
and $1.3 billion, respectively, of other letters of credit. (f) At December 31, 2010 and 2009, collateral held by the Firm in support of securities lending indemnification agreements totaled $185.0 billion and $173.2 billion,
respectively. Securities lending collateral comprises primarily cash, and securities issued by governments that are members of the Organisation for Economic Co-operation and Development (“OECD”) and U.S. government agencies.
(g) Represents the notional amounts of derivative contracts qualifying as guarantees. For further discussion of guarantees, see Note 6 on pages 191–199 and Note 30 on pages 275–280 of this Annual Report.
(h) Amounts include letters of credit hedged by derivative transactions and managed on a market risk basis. (i) The prior period has been revised to conform with current presentation.
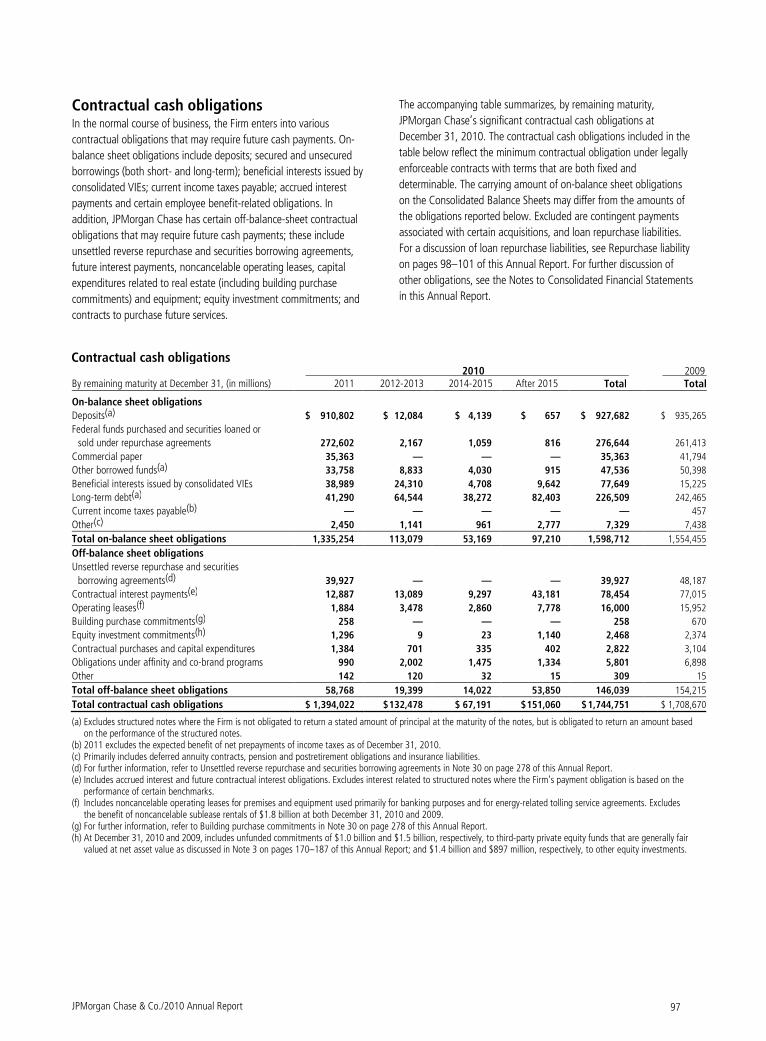
JPMorgan Chase & Co./2010 Annual Report 97
Contractual cash obligations
In the normal course of business, the Firm enters into various
contractual obligations that may require future cash payments. On-
balance sheet obligations include deposits; secured and unsecured
borrowings (both short- and long-term); beneficial interests issued by
consolidated VIEs; current income taxes payable; accrued interest
payments and certain employee benefit-related obligations. In
addition, JPMorgan Chase has certain off-balance-sheet contractual
obligations that may require future cash payments; these include
unsettled reverse repurchase and securities borrowing agreements,
future interest payments, noncancelable operating leases, capital
expenditures related to real estate (including building purchase
commitments) and equipment; equity investment commitments; and
contracts to purchase future services.
The accompanying table summarizes, by remaining maturity,
JPMorgan Chase’s significant contractual cash obligations at
December 31, 2010. The contractual cash obligations included in the
table below reflect the minimum contractual obligation under legally
enforceable contracts with terms that are both fixed and
determinable. The carrying amount of on-balance sheet obligations
on the Consolidated Balance Sheets may differ from the amounts of
the obligations reported below. Excluded are contingent payments
associated with certain acquisitions, and loan repurchase liabilities.
For a discussion of loan repurchase liabilities, see Repurchase liability
on pages 98–101 of this Annual Report. For further discussion of
other obligations, see the Notes to Consolidated Financial Statements
in this Annual Report.
Contractual cash obligations 2010 2009 By remaining maturity at December 31, (in millions) 2011 2012-2013 2014-2015 After 2015 Total Total
On-balance sheet obligations
Deposits(a) $ 910,802 $ 12,084 $ 4,139 $ 657 $ 927,682 $ 935,265
Federal funds purchased and securities loaned or
sold under repurchase agreements 272,602 2,167 1,059 816 276,644 261,413
Commercial paper 35,363 — — — 35,363 41,794
Other borrowed funds(a) 33,758 8,833 4,030 915 47,536 50,398
Beneficial interests issued by consolidated VIEs 38,989 24,310 4,708 9,642 77,649 15,225
Long-term debt(a) 41,290 64,544 38,272 82,403 226,509 242,465
Current income taxes payable(b) — — — — — 457
Other(c) 2,450 1,141 961 2,777 7,329 7,438
Total on-balance sheet obligations 1,335,254 113,079 53,169 97,210 1,598,712 1,554,455
Off-balance sheet obligations
Unsettled reverse repurchase and securities
borrowing agreements(d) 39,927 — — — 39,927 48,187
Contractual interest payments(e) 12,887 13,089 9,297 43,181 78,454 77,015
Operating leases(f) 1,884 3,478 2,860 7,778 16,000 15,952
Building purchase commitments(g) 258 — — — 258 670
Equity investment commitments(h) 1,296 9 23 1,140 2,468 2,374
Contractual purchases and capital expenditures 1,384 701 335 402 2,822 3,104
Obligations under affinity and co-brand programs 990 2,002 1,475 1,334 5,801 6,898
Other 142 120 32 15 309 15
Total off-balance sheet obligations 58,768 19,399 14,022 53,850 146,039 154,215
Total contractual cash obligations $ 1,394,022 $ 132,478 $ 67,191 $ 151,060 $ 1,744,751 $ 1,708,670
(a) Excludes structured notes where the Firm is not obligated to return a stated amount of principal at the maturity of the notes, but is obligated to return an amount based on the performance of the structured notes.
(b) 2011 excludes the expected benefit of net prepayments of income taxes as of December 31, 2010. (c) Primarily includes deferred annuity contracts, pension and postretirement obligations and insurance liabilities. (d) For further information, refer to Unsettled reverse repurchase and securities borrowing agreements in Note 30 on page 278 of this Annual Report. (e) Includes accrued interest and future contractual interest obligations. Excludes interest related to structured notes where the Firm’s payment obligation is based on the
performance of certain benchmarks. (f) Includes noncancelable operating leases for premises and equipment used primarily for banking purposes and for energy-related tolling service agreements. Excludes
the benefit of noncancelable sublease rentals of $1.8 billion at both December 31, 2010 and 2009. (g) For further information, refer to Building purchase commitments in Note 30 on page 278 of this Annual Report. (h) At December 31, 2010 and 2009, includes unfunded commitments of $1.0 billion and $1.5 billion, respectively, to third-party private equity funds that are generally fair
valued at net asset value as discussed in Note 3 on pages 170–187 of this Annual Report; and $1.4 billion and $897 million, respectively, to other equity investments.
Management’s discussion and analysis
JPMorgan Chase & Co./2010 Annual Report 98
Repurchase liability
In connection with the Firm’s loan sale and securitization activities
with Fannie Mae and Freddie Mac (the “GSEs”) and other loan sale
and private-label securitization transactions, the Firm has made
representations and warranties that the loans sold meet certain
requirements. For transactions with the GSEs, these representations
relate to type of collateral, underwriting standards, validity of
certain borrower representations in connection with the loan,
primary mortgage insurance being in force for any mortgage loan
with a loan-to-value ratio (“LTV”) greater than 80%, and the use
of the GSEs’ standard legal documentation. The Firm may be, and
has been, required to repurchase loans and/or indemnify the GSEs
and other investors for losses due to material breaches of these
representations and warranties; however, predominantly all of the
repurchase demands received by the Firm and the Firm’s losses
realized to date are related to loans sold to the GSEs.
To date, the repurchase demands the Firm has received from the
GSEs primarily relate to loans originated from 2005 to 2008.
Demands against the pre-2005 and post-2008 vintages have not
been significant; the Firm attributes this to the comparatively
favorable credit performance of these vintages and to the enhanced
underwriting and loan qualification standards implemented
progressively during 2007 and 2008. From 2005 to 2008, excluding
Washington Mutual, loans sold to the GSEs subject to representations
and warranties for which the Firm may be liable were approximately
$380 billion; this amount represents the principal amount of loans
sold throughout 2005 to 2008 and has not been adjusted for
subsequent activity, such as borrower repayments of principal or
repurchases completed to date. See the discussion below for
information concerning the process the Firm uses to evaluate
repurchase demands for breaches of representations and warranties,
and the Firm’s estimate of probable losses related to such exposure.
From 2005 to 2008, Washington Mutual sold approximately $150
billion of loans to the GSEs subject to certain representations and
warranties. Subsequent to the Firm’s acquisition of certain assets and
liabilities of Washington Mutual from the FDIC in September 2008,
the Firm resolved and/or limited certain current and future repurchase
demands for loans sold to the GSEs by Washington Mutual, although
it remains the Firm’s position that such obligations remain with the
FDIC receivership. Nevertheless, certain payments have been made
with respect to certain of the then current and future repurchase
demands, and the Firm will continue to evaluate and may pay
certain future repurchase demands related to individual loans. In
addition to the payments already made, the Firm estimates it has a
remaining repurchase liability of approximately $190 million as of
December 31, 2010, relating to unresolved and future demands on
loans sold to the GSEs by Washington Mutual. After consideration of
this repurchase liability, the Firm believes that the remaining GSE
repurchase exposure related to Washington Mutual presents minimal
future risk to the Firm’s financial results.
The Firm also sells loans in securitization transactions with Ginnie
Mae; these loans are typically insured by the Federal Housing
Administration (“FHA”) or the Rural Housing Administration
(“RHA”) and/or guaranteed by the U.S. Department of Veterans
Affairs (“VA”). The Firm, in its role as servicer, may elect to
repurchase delinquent loans securitized by Ginnie Mae in
accordance with guidelines prescribed by Ginnie Mae, FHA, RHA
and VA. Amounts due under the terms of these loans continue to
be insured and the reimbursement of insured amounts is
proceeding normally. Accordingly, the Firm has not recorded any
repurchase liability related to these loans.
From 2005 to 2008, the Firm and certain acquired entities sold or
deposited approximately $450 billion of residential mortgage loans to
securitization trusts in private-label securitizations they sponsored. In
connection therewith certain representations and warranties were
made related to these loans. With respect to the $165 billion of
private-label securitizations originated by Washington Mutual, it is
the Firm’s position that repurchase obligations remain with the FDIC
receivership.
While the terms of the securitization transactions vary, they generally
differ from loan sales to GSEs in that, among other things: (i) in order
to direct the trustee to investigate loan files, the security holders must
make a formal request for the trustee to do so, and typically, this
requires agreement of the holders of a specified percentage of the
outstanding securities; (ii) generally, the mortgage loans are not
required to meet all GSE eligibility criteria; and (iii) in many cases, the
party demanding repurchase is required to demonstrate that a loan-
level breach of a representation or warranty has materially and
adversely affected the value of the loan. Of the $450 billion
originally sold or deposited (including $165 billion by Washington
Mutual, as to which the Firm maintains the repurchase obligations
remain with the FDIC receivership), approximately $180 billion of
principal has been repaid. Approximately $80 billion of loans have
been liquidated, with an average loss severity of 57%. The
remaining outstanding principal balance of these loans as of
December 31, 2010, was approximately $190 billion.
To date, loan-level repurchase demands in private-label
securitizations have been limited. As a result, the Firm’s repurchase
reserve primarily relates to loan sales to the GSEs and is
predominantly derived from repurchase activity with the GSEs. While
it is possible that the volume of repurchase demands in private-label
securitizations will increase in the future, the Firm cannot offer a
reasonable estimate of those future demands based on historical
experience to date. Thus far, claims related to private-label
securitizations (including from insurers that have guaranteed certain
obligations of the securitization trusts) have generally manifested
themselves through securities-related litigation. The Firm separately
evaluates its exposure to such litigation in establishing its litigation
reserves. For additional information regarding litigation, see Note 32
on pages 282–289 of this Annual Report.
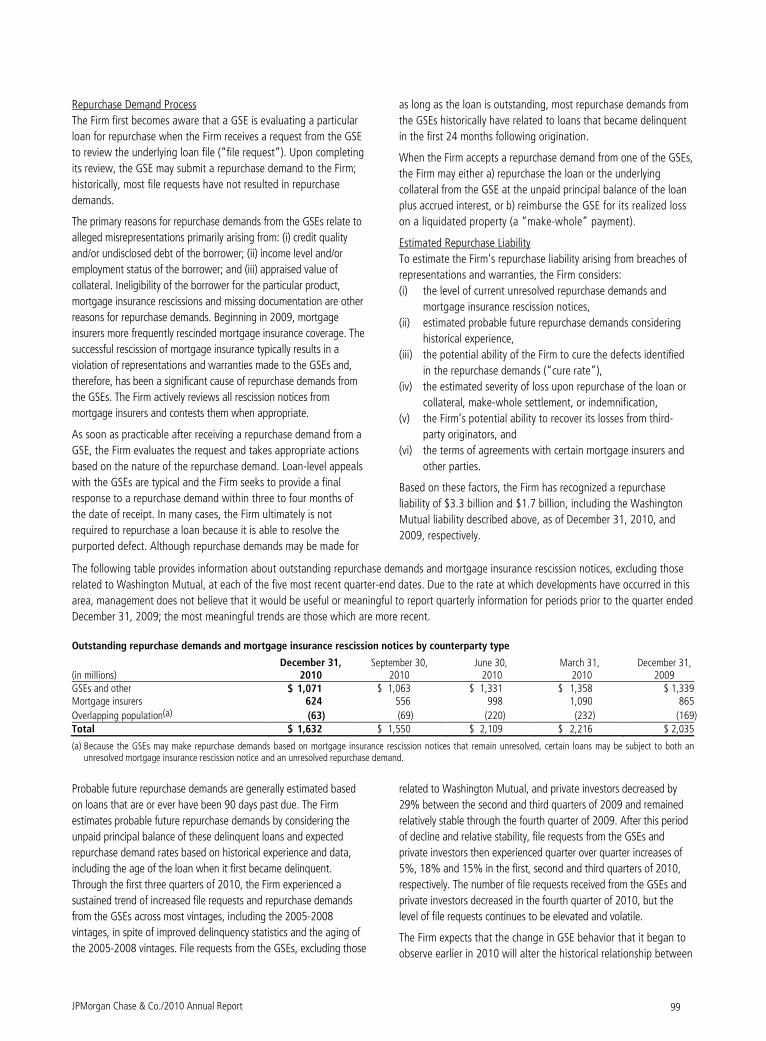
JPMorgan Chase & Co./2010 Annual Report 99
Repurchase Demand Process
The Firm first becomes aware that a GSE is evaluating a particular
loan for repurchase when the Firm receives a request from the GSE
to review the underlying loan file (“file request”). Upon completing
its review, the GSE may submit a repurchase demand to the Firm;
historically, most file requests have not resulted in repurchase
demands.
The primary reasons for repurchase demands from the GSEs relate to
alleged misrepresentations primarily arising from: (i) credit quality
and/or undisclosed debt of the borrower; (ii) income level and/or
employment status of the borrower; and (iii) appraised value of
collateral. Ineligibility of the borrower for the particular product,
mortgage insurance rescissions and missing documentation are other
reasons for repurchase demands. Beginning in 2009, mortgage
insurers more frequently rescinded mortgage insurance coverage. The
successful rescission of mortgage insurance typically results in a
violation of representations and warranties made to the GSEs and,
therefore, has been a significant cause of repurchase demands from
the GSEs. The Firm actively reviews all rescission notices from
mortgage insurers and contests them when appropriate.
As soon as practicable after receiving a repurchase demand from a
GSE, the Firm evaluates the request and takes appropriate actions
based on the nature of the repurchase demand. Loan-level appeals
with the GSEs are typical and the Firm seeks to provide a final
response to a repurchase demand within three to four months of
the date of receipt. In many cases, the Firm ultimately is not
required to repurchase a loan because it is able to resolve the
purported defect. Although repurchase demands may be made for
as long as the loan is outstanding, most repurchase demands from
the GSEs historically have related to loans that became delinquent
in the first 24 months following origination.
When the Firm accepts a repurchase demand from one of the GSEs,
the Firm may either a) repurchase the loan or the underlying
collateral from the GSE at the unpaid principal balance of the loan
plus accrued interest, or b) reimburse the GSE for its realized loss
on a liquidated property (a “make-whole” payment).
Estimated Repurchase Liability
To estimate the Firm’s repurchase liability arising from breaches of
representations and warranties, the Firm considers:
(i) the level of current unresolved repurchase demands and
mortgage insurance rescission notices,
(ii) estimated probable future repurchase demands considering
historical experience,
(iii) the potential ability of the Firm to cure the defects identified
in the repurchase demands (“cure rate”),
(iv) the estimated severity of loss upon repurchase of the loan or
collateral, make-whole settlement, or indemnification,
(v) the Firm’s potential ability to recover its losses from third-
party originators, and
(vi) the terms of agreements with certain mortgage insurers and
other parties.
Based on these factors, the Firm has recognized a repurchase
liability of $3.3 billion and $1.7 billion, including the Washington
Mutual liability described above, as of December 31, 2010, and
2009, respectively.
The following table provides information about outstanding repurchase demands and mortgage insurance rescission notices, excluding those
related to Washington Mutual, at each of the five most recent quarter-end dates. Due to the rate at which developments have occurred in this
area, management does not believe that it would be useful or meaningful to report quarterly information for periods prior to the quarter ended
December 31, 2009; the most meaningful trends are those which are more recent.
Outstanding repurchase demands and mortgage insurance rescission notices by counterparty type
(in millions)
December 31, 2010
September 30, 2010
June 30, 2010
March 31, 2010
December 31, 2009
GSEs and other $ 1,071 $ 1,063 $ 1,331 $ 1,358 $ 1,339 Mortgage insurers 624 556 998 1,090 865
Overlapping population(a) (63) (69) (220) (232) (169) Total $ 1,632 $ 1,550 $ 2,109 $ 2,216 $ 2,035
(a) Because the GSEs may make repurchase demands based on mortgage insurance rescission notices that remain unresolved, certain loans may be subject to both an unresolved mortgage insurance rescission notice and an unresolved repurchase demand.
Probable future repurchase demands are generally estimated based
on loans that are or ever have been 90 days past due. The Firm
estimates probable future repurchase demands by considering the
unpaid principal balance of these delinquent loans and expected
repurchase demand rates based on historical experience and data,
including the age of the loan when it first became delinquent.
Through the first three quarters of 2010, the Firm experienced a
sustained trend of increased file requests and repurchase demands
from the GSEs across most vintages, including the 2005-2008
vintages, in spite of improved delinquency statistics and the aging of
the 2005-2008 vintages. File requests from the GSEs, excluding those
related to Washington Mutual, and private investors decreased by
29% between the second and third quarters of 2009 and remained
relatively stable through the fourth quarter of 2009. After this period
of decline and relative stability, file requests from the GSEs and
private investors then experienced quarter over quarter increases of
5%, 18% and 15% in the first, second and third quarters of 2010,
respectively. The number of file requests received from the GSEs and
private investors decreased in the fourth quarter of 2010, but the
level of file requests continues to be elevated and volatile.
The Firm expects that the change in GSE behavior that it began to
observe earlier in 2010 will alter the historical relationship between
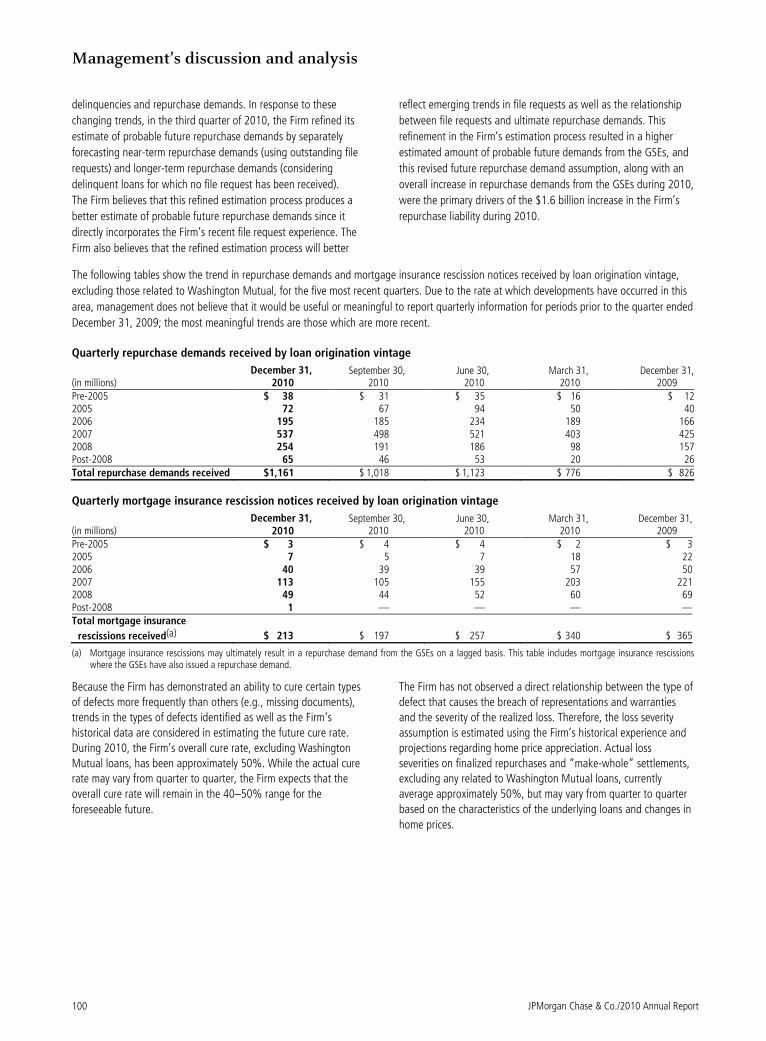
Management’s discussion and analysis
JPMorgan Chase & Co./2010 Annual Report 100
delinquencies and repurchase demands. In response to these
changing trends, in the third quarter of 2010, the Firm refined its
estimate of probable future repurchase demands by separately
forecasting near-term repurchase demands (using outstanding file
requests) and longer-term repurchase demands (considering
delinquent loans for which no file request has been received).
The Firm believes that this refined estimation process produces a
better estimate of probable future repurchase demands since it
directly incorporates the Firm’s recent file request experience. The
Firm also believes that the refined estimation process will better
reflect emerging trends in file requests as well as the relationship
between file requests and ultimate repurchase demands. This
refinement in the Firm’s estimation process resulted in a higher
estimated amount of probable future demands from the GSEs, and
this revised future repurchase demand assumption, along with an
overall increase in repurchase demands from the GSEs during 2010,
were the primary drivers of the $1.6 billion increase in the Firm’s
repurchase liability during 2010.
The following tables show the trend in repurchase demands and mortgage insurance rescission notices received by loan origination vintage,
excluding those related to Washington Mutual, for the five most recent quarters. Due to the rate at which developments have occurred in this
area, management does not believe that it would be useful or meaningful to report quarterly information for periods prior to the quarter ended
December 31, 2009; the most meaningful trends are those which are more recent.
Quarterly repurchase demands received by loan origination vintage
(in millions) December 31,
2010 September 30,
2010 June 30, 2010
March 31, 2010
December 31, 2009
Pre-2005 $ 38 $ 31 $ 35 $ 16 $ 12 2005 72 67 94 50 40 2006 195 185 234 189 166 2007 537 498 521 403 425 2008 254 191 186 98 157 Post-2008 65 46 53 20 26 Total repurchase demands received $1,161 $ 1,018 $ 1,123 $ 776 $ 826
Quarterly mortgage insurance rescission notices received by loan origination vintage
(in millions) December 31,
2010 September 30,
2010 June 30, 2010
March 31, 2010
December 31, 2009
Pre-2005 $ 3 $ 4 $ 4 $ 2 $ 3 2005 7 5 7 18 22 2006 40 39 39 57 50 2007 113 105 155 203 221 2008 49 44 52 60 69 Post-2008 1 — — — — Total mortgage insurance
rescissions received(a) $ 213 $ 197 $ 257 $ 340 $ 365
(a) Mortgage insurance rescissions may ultimately result in a repurchase demand from the GSEs on a lagged basis. This table includes mortgage insurance rescissions where the GSEs have also issued a repurchase demand.
Because the Firm has demonstrated an ability to cure certain types
of defects more frequently than others (e.g., missing documents),
trends in the types of defects identified as well as the Firm’s
historical data are considered in estimating the future cure rate.
During 2010, the Firm’s overall cure rate, excluding Washington
Mutual loans, has been approximately 50%. While the actual cure
rate may vary from quarter to quarter, the Firm expects that the
overall cure rate will remain in the 40–50% range for the
foreseeable future.
The Firm has not observed a direct relationship between the type of
defect that causes the breach of representations and warranties
and the severity of the realized loss. Therefore, the loss severity
assumption is estimated using the Firm’s historical experience and
projections regarding home price appreciation. Actual loss
severities on finalized repurchases and “make-whole” settlements,
excluding any related to Washington Mutual loans, currently
average approximately 50%, but may vary from quarter to quarter
based on the characteristics of the underlying loans and changes in
home prices.
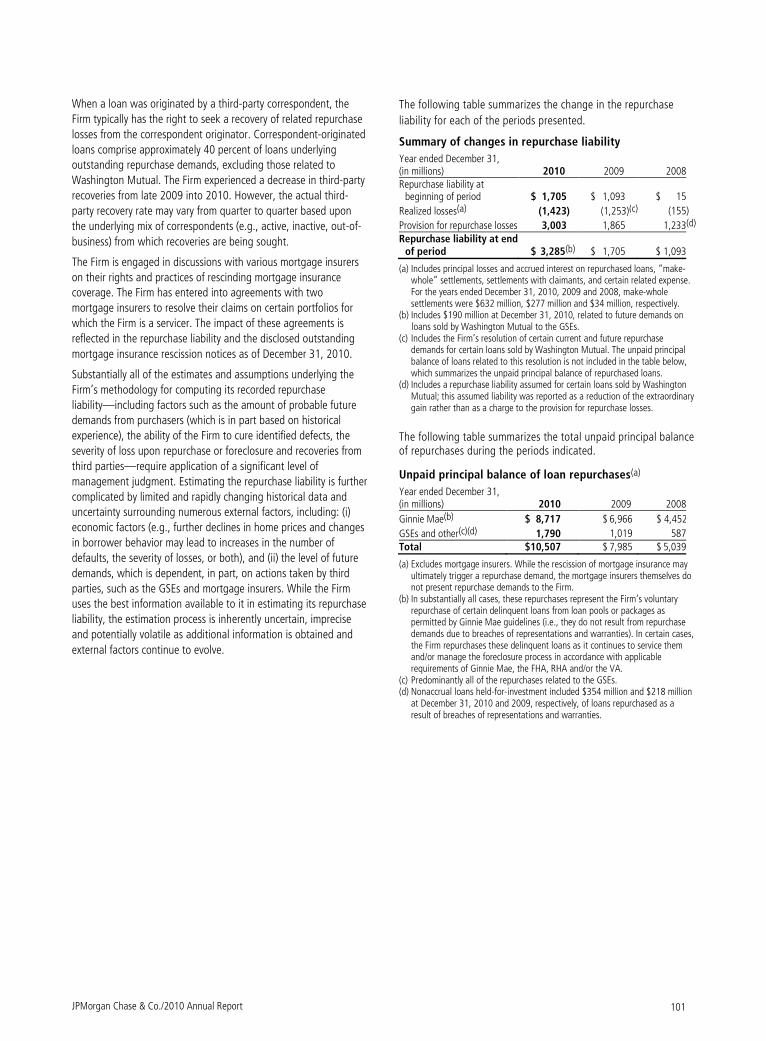
JPMorgan Chase & Co./2010 Annual Report 101
When a loan was originated by a third-party correspondent, the
Firm typically has the right to seek a recovery of related repurchase
losses from the correspondent originator. Correspondent-originated
loans comprise approximately 40 percent of loans underlying
outstanding repurchase demands, excluding those related to
Washington Mutual. The Firm experienced a decrease in third-party
recoveries from late 2009 into 2010. However, the actual third-
party recovery rate may vary from quarter to quarter based upon
the underlying mix of correspondents (e.g., active, inactive, out-of-
business) from which recoveries are being sought.
The Firm is engaged in discussions with various mortgage insurers
on their rights and practices of rescinding mortgage insurance
coverage. The Firm has entered into agreements with two
mortgage insurers to resolve their claims on certain portfolios for
which the Firm is a servicer. The impact of these agreements is
reflected in the repurchase liability and the disclosed outstanding
mortgage insurance rescission notices as of December 31, 2010.
Substantially all of the estimates and assumptions underlying the
Firm’s methodology for computing its recorded repurchase
liability—including factors such as the amount of probable future
demands from purchasers (which is in part based on historical
experience), the ability of the Firm to cure identified defects, the
severity of loss upon repurchase or foreclosure and recoveries from
third parties—require application of a significant level of
management judgment. Estimating the repurchase liability is further
complicated by limited and rapidly changing historical data and
uncertainty surrounding numerous external factors, including: (i)
economic factors (e.g., further declines in home prices and changes
in borrower behavior may lead to increases in the number of
defaults, the severity of losses, or both), and (ii) the level of future
demands, which is dependent, in part, on actions taken by third
parties, such as the GSEs and mortgage insurers. While the Firm
uses the best information available to it in estimating its repurchase
liability, the estimation process is inherently uncertain, imprecise
and potentially volatile as additional information is obtained and
external factors continue to evolve.
The following table summarizes the change in the repurchase
liability for each of the periods presented.
Summary of changes in repurchase liability
Year ended December 31, (in millions) 2010 2009 2008 Repurchase liability at
beginning of period $ 1,705 $ 1,093 $ 15
Realized losses(a) (1,423) (1,253)(c) (155)
Provision for repurchase losses 3,003 1,865 1,233(d) Repurchase liability at end
of period $ 3,285(b) $ 1,705 $ 1,093
(a) Includes principal losses and accrued interest on repurchased loans, “make-whole” settlements, settlements with claimants, and certain related expense. For the years ended December 31, 2010, 2009 and 2008, make-whole settlements were $632 million, $277 million and $34 million, respectively.
(b) Includes $190 million at December 31, 2010, related to future demands on loans sold by Washington Mutual to the GSEs.
(c) Includes the Firm’s resolution of certain current and future repurchase demands for certain loans sold by Washington Mutual. The unpaid principal balance of loans related to this resolution is not included in the table below, which summarizes the unpaid principal balance of repurchased loans.
(d) Includes a repurchase liability assumed for certain loans sold by Washington Mutual; this assumed liability was reported as a reduction of the extraordinary gain rather than as a charge to the provision for repurchase losses.
The following table summarizes the total unpaid principal balance of repurchases during the periods indicated.
Unpaid principal balance of loan repurchases(a)
Year ended December 31, (in millions) 2010 2009 2008
Ginnie Mae(b) $ 8,717 $ 6,966 $ 4,452
GSEs and other(c)(d) 1,790 1,019 587 Total $10,507 $ 7,985 $ 5,039
(a) Excludes mortgage insurers. While the rescission of mortgage insurance may ultimately trigger a repurchase demand, the mortgage insurers themselves do not present repurchase demands to the Firm.
(b) In substantially all cases, these repurchases represent the Firm’s voluntary repurchase of certain delinquent loans from loan pools or packages as permitted by Ginnie Mae guidelines (i.e., they do not result from repurchase demands due to breaches of representations and warranties). In certain cases, the Firm repurchases these delinquent loans as it continues to service them and/or manage the foreclosure process in accordance with applicable requirements of Ginnie Mae, the FHA, RHA and/or the VA.
(c) Predominantly all of the repurchases related to the GSEs. (d) Nonaccrual loans held-for-investment included $354 million and $218 million
at December 31, 2010 and 2009, respectively, of loans repurchased as a result of breaches of representations and warranties.
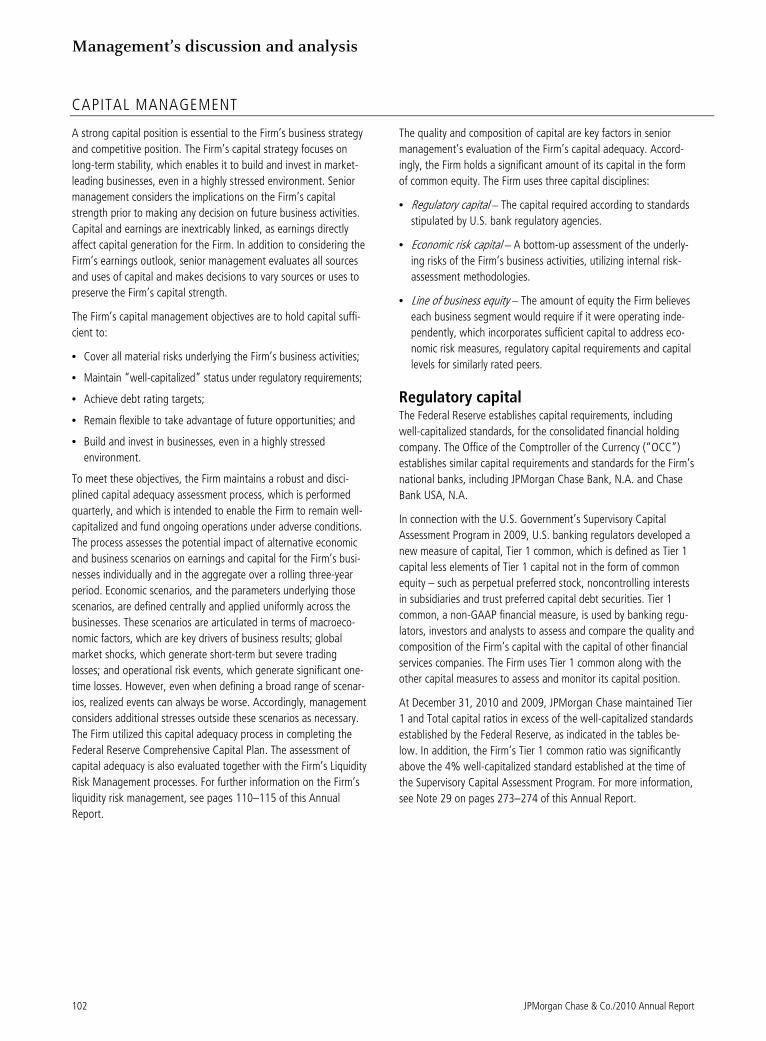
Management’s discussion and analysis
102 JPMorgan Chase & Co./2010 Annual Report
CAPITAL MANAGEMENT
A strong capital position is essential to the Firm’s business strategy
and competitive position. The Firm’s capital strategy focuses on
long-term stability, which enables it to build and invest in market-
leading businesses, even in a highly stressed environment. Senior
management considers the implications on the Firm’s capital
strength prior to making any decision on future business activities.
Capital and earnings are inextricably linked, as earnings directly
affect capital generation for the Firm. In addition to considering the
Firm’s earnings outlook, senior management evaluates all sources
and uses of capital and makes decisions to vary sources or uses to
preserve the Firm’s capital strength.
The Firm’s capital management objectives are to hold capital suffi-
cient to:
• Cover all material risks underlying the Firm’s business activities;
• Maintain “well-capitalized” status under regulatory requirements;
• Achieve debt rating targets;
• Remain flexible to take advantage of future opportunities; and
• Build and invest in businesses, even in a highly stressed
environment.
To meet these objectives, the Firm maintains a robust and disci-
plined capital adequacy assessment process, which is performed
quarterly, and which is intended to enable the Firm to remain well-
capitalized and fund ongoing operations under adverse conditions.
The process assesses the potential impact of alternative economic
and business scenarios on earnings and capital for the Firm’s busi-
nesses individually and in the aggregate over a rolling three-year
period. Economic scenarios, and the parameters underlying those
scenarios, are defined centrally and applied uniformly across the
businesses. These scenarios are articulated in terms of macroeco-
nomic factors, which are key drivers of business results; global
market shocks, which generate short-term but severe trading
losses; and operational risk events, which generate significant one-
time losses. However, even when defining a broad range of scenar-
ios, realized events can always be worse. Accordingly, management
considers additional stresses outside these scenarios as necessary.
The Firm utilized this capital adequacy process in completing the
Federal Reserve Comprehensive Capital Plan. The assessment of
capital adequacy is also evaluated together with the Firm’s Liquidity
Risk Management processes. For further information on the Firm’s
liquidity risk management, see pages 110–115 of this Annual
Report.
The quality and composition of capital are key factors in senior
management’s evaluation of the Firm’s capital adequacy. Accord-
ingly, the Firm holds a significant amount of its capital in the form
of common equity. The Firm uses three capital disciplines:
• Regulatory capital – The capital required according to standards
stipulated by U.S. bank regulatory agencies.
• Economic risk capital – A bottom-up assessment of the underly-
ing risks of the Firm’s business activities, utilizing internal risk-
assessment methodologies.
• Line of business equity – The amount of equity the Firm believes
each business segment would require if it were operating inde-
pendently, which incorporates sufficient capital to address eco-
nomic risk measures, regulatory capital requirements and capital
levels for similarly rated peers.
Regulatory capital The Federal Reserve establishes capital requirements, including
well-capitalized standards, for the consolidated financial holding
company. The Office of the Comptroller of the Currency (“OCC”)
establishes similar capital requirements and standards for the Firm’s
national banks, including JPMorgan Chase Bank, N.A. and Chase
Bank USA, N.A.
In connection with the U.S. Government’s Supervisory Capital
Assessment Program in 2009, U.S. banking regulators developed a
new measure of capital, Tier 1 common, which is defined as Tier 1
capital less elements of Tier 1 capital not in the form of common
equity – such as perpetual preferred stock, noncontrolling interests
in subsidiaries and trust preferred capital debt securities. Tier 1
common, a non-GAAP financial measure, is used by banking regu-
lators, investors and analysts to assess and compare the quality and
composition of the Firm’s capital with the capital of other financial
services companies. The Firm uses Tier 1 common along with the
other capital measures to assess and monitor its capital position.
At December 31, 2010 and 2009, JPMorgan Chase maintained Tier
1 and Total capital ratios in excess of the well-capitalized standards
established by the Federal Reserve, as indicated in the tables be-
low. In addition, the Firm’s Tier 1 common ratio was significantly
above the 4% well-capitalized standard established at the time of
the Supervisory Capital Assessment Program. For more information,
see Note 29 on pages 273–274 of this Annual Report.
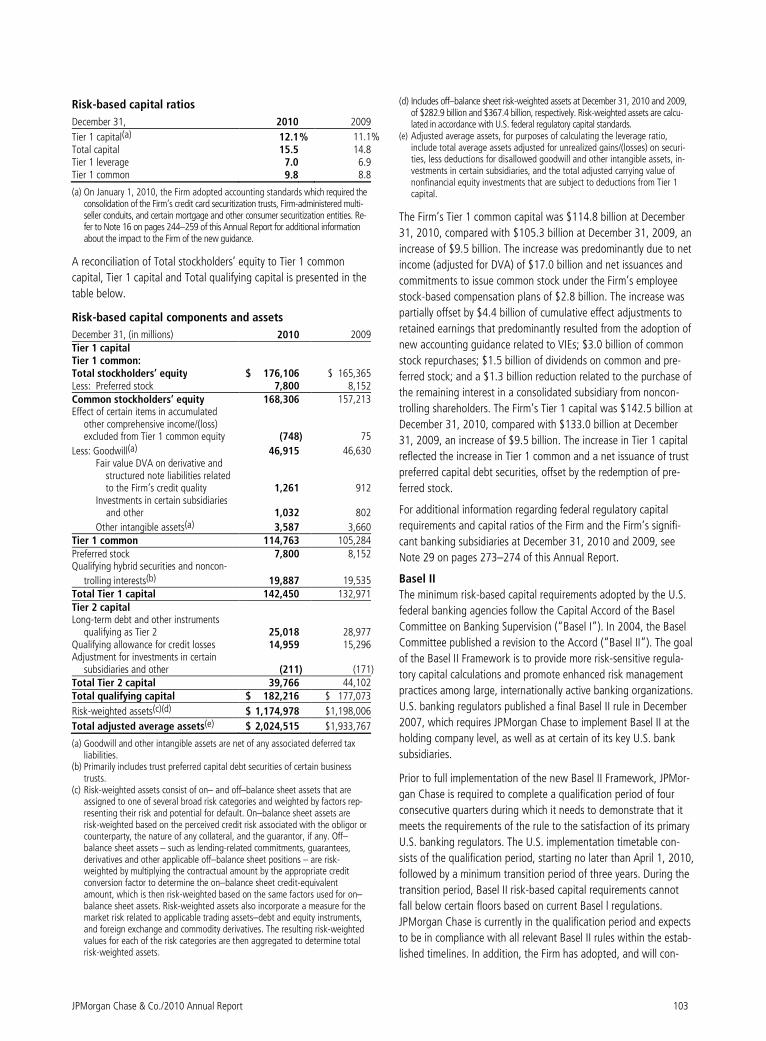
JPMorgan Chase & Co./2010 Annual Report 103
Risk-based capital ratios
December 31, 2010 2009
Tier 1 capital(a) 12.1 % 11.1% Total capital 15.5 14.8 Tier 1 leverage 7.0 6.9 Tier 1 common 9.8 8.8
(a) On January 1, 2010, the Firm adopted accounting standards which required the consolidation of the Firm’s credit card securitization trusts, Firm-administered multi-seller conduits, and certain mortgage and other consumer securitization entities. Re-fer to Note 16 on pages 244–259 of this Annual Report for additional information about the impact to the Firm of the new guidance.
A reconciliation of Total stockholders’ equity to Tier 1 common
capital, Tier 1 capital and Total qualifying capital is presented in the
table below.
Risk-based capital components and assets
December 31, (in millions) 2010 2009 Tier 1 capital Tier 1 common: Total stockholders’ equity $ 176,106 $ 165,365 Less: Preferred stock 7,800 8,152 Common stockholders’ equity 168,306 157,213 Effect of certain items in accumulated
other comprehensive income/(loss) excluded from Tier 1 common equity (748) 75
Less: Goodwill(a) 46,915 46,630 Fair value DVA on derivative and structured note liabilities related to the Firm’s credit quality 1,261 912 Investments in certain subsidiaries and other 1,032 802
Other intangible assets(a) 3,587 3,660 Tier 1 common 114,763 105,284 Preferred stock 7,800 8,152 Qualifying hybrid securities and noncon-
trolling interests(b) 19,887 19,535 Total Tier 1 capital 142,450 132,971 Tier 2 capital Long-term debt and other instruments
qualifying as Tier 2 25,018 28,977 Qualifying allowance for credit losses 14,959 15,296 Adjustment for investments in certain
subsidiaries and other (211)
(171) Total Tier 2 capital 39,766 44,102 Total qualifying capital $ 182,216 $ 177,073
Risk-weighted assets(c)(d) $ 1,174,978 $1,198,006
Total adjusted average assets(e) $ 2,024,515 $1,933,767
(a) Goodwill and other intangible assets are net of any associated deferred tax liabilities.
(b) Primarily includes trust preferred capital debt securities of certain business trusts.
(c) Risk-weighted assets consist of on– and off–balance sheet assets that are assigned to one of several broad risk categories and weighted by factors rep-resenting their risk and potential for default. On–balance sheet assets are risk-weighted based on the perceived credit risk associated with the obligor or counterparty, the nature of any collateral, and the guarantor, if any. Off–balance sheet assets – such as lending-related commitments, guarantees, derivatives and other applicable off–balance sheet positions – are risk-weighted by multiplying the contractual amount by the appropriate credit conversion factor to determine the on–balance sheet credit-equivalent amount, which is then risk-weighted based on the same factors used for on–balance sheet assets. Risk-weighted assets also incorporate a measure for the market risk related to applicable trading assets–debt and equity instruments, and foreign exchange and commodity derivatives. The resulting risk-weighted values for each of the risk categories are then aggregated to determine total risk-weighted assets.
(d) Includes off–balance sheet risk-weighted assets at December 31, 2010 and 2009, of $282.9 billion and $367.4 billion, respectively. Risk-weighted assets are calcu-lated in accordance with U.S. federal regulatory capital standards.
(e) Adjusted average assets, for purposes of calculating the leverage ratio, include total average assets adjusted for unrealized gains/(losses) on securi-ties, less deductions for disallowed goodwill and other intangible assets, in-vestments in certain subsidiaries, and the total adjusted carrying value of nonfinancial equity investments that are subject to deductions from Tier 1 capital.
The Firm’s Tier 1 common capital was $114.8 billion at December
31, 2010, compared with $105.3 billion at December 31, 2009, an
increase of $9.5 billion. The increase was predominantly due to net
income (adjusted for DVA) of $17.0 billion and net issuances and
commitments to issue common stock under the Firm’s employee
stock-based compensation plans of $2.8 billion. The increase was
partially offset by $4.4 billion of cumulative effect adjustments to
retained earnings that predominantly resulted from the adoption of
new accounting guidance related to VIEs; $3.0 billion of common
stock repurchases; $1.5 billion of dividends on common and pre-
ferred stock; and a $1.3 billion reduction related to the purchase of
the remaining interest in a consolidated subsidiary from noncon-
trolling shareholders. The Firm’s Tier 1 capital was $142.5 billion at
December 31, 2010, compared with $133.0 billion at December
31, 2009, an increase of $9.5 billion. The increase in Tier 1 capital
reflected the increase in Tier 1 common and a net issuance of trust
preferred capital debt securities, offset by the redemption of pre-
ferred stock.
For additional information regarding federal regulatory capital
requirements and capital ratios of the Firm and the Firm’s signifi-
cant banking subsidiaries at December 31, 2010 and 2009, see
Note 29 on pages 273–274 of this Annual Report.
Basel II
The minimum risk-based capital requirements adopted by the U.S.
federal banking agencies follow the Capital Accord of the Basel
Committee on Banking Supervision (“Basel I”). In 2004, the Basel
Committee published a revision to the Accord (“Basel II”). The goal
of the Basel II Framework is to provide more risk-sensitive regula-
tory capital calculations and promote enhanced risk management
practices among large, internationally active banking organizations.
U.S. banking regulators published a final Basel II rule in December
2007, which requires JPMorgan Chase to implement Basel II at the
holding company level, as well as at certain of its key U.S. bank
subsidiaries.
Prior to full implementation of the new Basel II Framework, JPMor-
gan Chase is required to complete a qualification period of four
consecutive quarters during which it needs to demonstrate that it
meets the requirements of the rule to the satisfaction of its primary
U.S. banking regulators. The U.S. implementation timetable con-
sists of the qualification period, starting no later than April 1, 2010,
followed by a minimum transition period of three years. During the
transition period, Basel II risk-based capital requirements cannot
fall below certain floors based on current Basel l regulations.
JPMorgan Chase is currently in the qualification period and expects
to be in compliance with all relevant Basel II rules within the estab-
lished timelines. In addition, the Firm has adopted, and will con-
Management’s discussion and analysis
104 JPMorgan Chase & Co./2010 Annual Report
tinue to adopt, based on various established timelines, Basel II rules
in certain non-U.S. jurisdictions, as required.
Basel III
In addition to the Basel II Framework, on December 16, 2010, the
Basel Committee issued the final version of the Capital Accord,
called “Basel III”, which included narrowing the definition of capi-
tal, increasing capital requirements for specific exposures, introduc-
ing short-term liquidity coverage and term funding standards, and
establishing an international leverage ratio. The Basel Committee
also announced higher capital ratio requirements under Basel III
which provide that the common equity requirement will be in-
creased to 7%, comprised of a minimum of 4.5% plus a 2.5%
capital conservation buffer.
In addition, the U.S. federal banking agencies have published for
public comment proposed risk-based capital floors pursuant to the
requirements of the Dodd-Frank Act to establish a permanent Basel
I floor under Basel II / Basel III capital calculations.
The Firm fully expects to be in compliance with the higher Basel III
capital standards when they become effective on January 1, 2019,
as well as additional Dodd-Frank Act capital requirements when
they are implemented. The Firm estimates that its Tier 1 common
ratio under Basel III rules (including the changes for calculating
capital on trading assets and securitizations) would be 7% as of
December 31, 2010. This estimate reflects the Firm’s current under-
standing of the Basel III rules and their application to its businesses
as currently conducted; accordingly, this estimate will evolve over
time as the Firm’s businesses change and as a result of further rule-
making on Basel III implementation from U.S. federal banking
agencies. The Firm also believes it may need to modify the current
liquidity profile of its assets and liabilities in response to the short-
term liquidity coverage and term funding standards contained in
Basel III. The Basel III revisions governing liquidity and capital
requirements are subject to prolonged observation and transition
periods. The observation period for the liquidity coverage ratio and
term funding standards begins in 2011, with implementation in
2015 and 2018, respectively. The transition period for banks to
meet the revised common equity requirement will begin in 2013,
with implementation on January 1, 2019. The Firm will continue to
monitor the ongoing rule-making process to assess both the timing
and the impact of Basel III on its businesses and financial condition.
Broker-dealer regulatory capital
JPMorgan Chase’s principal U.S. broker-dealer subsidiaries
are J.P. Morgan Securities LLC (“JPMorgan Securities”; formerly
J.P. Morgan Securities Inc.), and J.P. Morgan Clearing Corp.
(“JPMorgan Clearing”). JPMorgan Securities became a limited
liability company on September 1, 2010. JPMorgan Clearing is a
subsidiary of JPMorgan Securities and provides clearing and
settlement services. JPMorgan Securities and JPMorgan Clearing
are each subject to Rule 15c3-1 under the Securities Exchange
Act of 1934 (the “Net Capital Rule”). JPMorgan Securities and
JPMorgan Clearing are also registered as futures commission
merchants and subject to Rule 1.17 of the Commodity Futures
Trading Commission (“CFTC”).
JPMorgan Securities and JPMorgan Clearing have elected to compute
their minimum net capital requirements in accordance with the
“Alternative Net Capital Requirements” of the Net Capital Rule. At
December 31, 2010, JPMorgan Securities’ net capital, as defined by
the Net Capital Rule, was $6.9 billion, exceeding the minimum
requirement by $6.3 billion, and JPMorgan Clearing’s net capital was
$5.7 billion, exceeding the minimum requirement by $3.9 billion.
In addition to its minimum net capital requirement, JPMorgan
Securities is required to hold tentative net capital in excess of $1.0
billion and is also required to notify the Securities and Exchange
Commission (“SEC”) in the event that tentative net capital is less
than $5.0 billion, in accordance with the market and credit risk
standards of Appendix E of the Net Capital Rule. As of December
31, 2010, JPMorgan Securities had tentative net capital in excess of
the minimum and notification requirements.
Economic risk capital JPMorgan Chase assesses its capital adequacy relative to the risks
underlying its business activities, using internal risk-assessment
methodologies. The Firm measures economic capital primarily
based on four risk factors: credit, market, operational and private
equity risk.
Economic risk capital Yearly Average Year ended December 31, (in billions) 2010 2009Credit risk $ 49.7 $ 51.3Market risk 15.1 15.4Operational risk 7.4 8.5Private equity risk 6.2 4.7Economic risk capital 78.4 79.9Goodwill 48.6 48.3
Other(a) 34.5 17.7Total common stockholders’ equity $ 161.5 $ 145.9
(a) Reflects additional capital required, in the Firm’s view, to meet its regulatory and debt rating objectives.
Credit risk capital
Credit risk capital is estimated separately for the wholesale businesses
(IB, CB, TSS and AM) and consumer businesses (RFS and CS).
Credit risk capital for the overall wholesale credit portfolio is de-
fined in terms of unexpected credit losses, both from defaults and
from declines in the portfolio value due to credit deterioration
measured over a one-year period at a confidence level consistent
with an “AA” credit rating standard. Unexpected losses are losses
in excess of those for which allowances for credit losses are main-
tained. The capital methodology is based on several principal
drivers of credit risk: exposure at default (or loan-equivalent
amount), default likelihood, credit spreads, loss severity and portfo-
lio correlation.
JPMorgan Chase & Co./2010 Annual Report 105
Credit risk capital for the consumer portfolio is based on product
and other relevant risk segmentation. Actual segment-level default
and severity experience are used to estimate unexpected losses for
a one-year horizon at a confidence level consistent with an “AA”
credit rating standard. See Credit Risk Management on pages 116–
118 of this Annual Report for more information about these credit
risk measures.
Market risk capital
The Firm calculates market risk capital guided by the principle that
capital should reflect the risk of loss in the value of portfolios and
financial instruments caused by adverse movements in market
variables, such as interest and foreign exchange rates, credit
spreads, and securities and commodities prices, taking into account
the liquidity of the financial instruments. Results from daily VaR,
biweekly stress-tests, issuer credit spreads and default risk calcula-
tions, as well as other factors, are used to determine appropriate
capital levels. Market risk capital is allocated to each business
segment based on its risk assessment. See Market Risk Manage-
ment on pages 142–146 of this Annual Report for more informa-
tion about these market risk measures.
Operational risk capital
Capital is allocated to the lines of business for operational risk
using a risk-based capital allocation methodology which estimates
operational risk on a bottom-up basis. The operational risk capital
model is based on actual losses and potential scenario-based stress
losses, with adjustments to the capital calculation to reflect
changes in the quality of the control environment or the use of risk-
transfer products. The Firm believes its model is consistent with the
Basel II Framework. See Operational Risk Management on pages
147–148 of this Annual Report for more information about opera-
tional risk.
Private equity risk capital
Capital is allocated to privately- and publicly-held securities,
third-party fund investments, and commitments in the private
equity portfolio to cover the potential loss associated with a
decline in equity markets and related asset devaluations. In
addition to negative market fluctuations, potential losses in
private equity investment portfolios can be magnified by liquidity
risk. Capital allocation for the private equity portfolio is based on
measurement of the loss experience suffered by the Firm and
other market participants over a prolonged period of adverse
equity market conditions.
Line of business equity The Firm’s framework for allocating capital is based on the follow-
ing objectives:
• Integrate firmwide capital management activities with capital
management activities within each of the lines of business;
• Measure performance consistently across all lines of business;
and
• Provide comparability with peer firms for each of the lines of
business
Equity for a line of business represents the amount the Firm be-
lieves the business would require if it were operating independ-
ently, incorporating sufficient capital to address economic risk
measures, regulatory capital requirements and capital levels for
similarly rated peers. Capital is also allocated to each line of busi-
ness for, among other things, goodwill and other intangibles asso-
ciated with acquisitions effected by the line of business. Return on
common equity is measured and internal targets for expected
returns are established as key measures of a business segment’s
performance.
Line of business equity December 31, (in billions) 2010 2009Investment Bank $ 40.0 $ 33.0Retail Financial Services 28.0 25.0Card Services 15.0 15.0Commercial Banking 8.0 8.0Treasury & Securities Services 6.5 5.0Asset Management 6.5 7.0Corporate/Private Equity 64.3 64.2Total common stockholders’ equity $ 168.3 $ 157.2
Line of business equity Yearly Average (in billions) 2010 2009 2008Investment Bank $ 40.0 $ 33.0 $ 26.1Retail Financial Services 28.0 25.0 19.0Card Services 15.0 15.0 14.3Commercial Banking 8.0 8.0 7.3Treasury & Securities Services 6.5 5.0 3.8Asset Management 6.5 7.0 5.6Corporate/Private Equity 57.5 52.9 53.0Total common
stockholders’ equity $ 161.5 $ 145.9 $ 129.1
Effective January 1, 2010, the Firm enhanced its line of business
equity framework to better align equity assigned to the lines of
business with changes anticipated to occur in each line of busi-
ness, and to reflect the competitive and regulatory landscape. The
lines of business are now capitalized based on the Tier 1 common
standard, rather than the Tier 1 capital standard. In 2011, the
Firm will further evaluate its line-of-business equity framework as
appropriate to reflect future Basel III Tier 1 common capital
requirements.
Management’s discussion and analysis
106 JPMorgan Chase & Co./2010 Annual Report
Capital actions Dividends
On February 23, 2009, the Board of Directors reduced the Firm’s
quarterly common stock dividend from $0.38 to $0.05 per share,
effective with the dividend paid on April 30, 2009, to sharehold-
ers of record on April 6, 2009. The action enabled the Firm to
retain approximately $5.5 billion in common equity in each of
2010 and 2009, and was taken to ensure the Firm had sufficient
capital strength in the event the very weak economic conditions
that existed at the beginning of 2009 deteriorated further.
JPMorgan Chase declared quarterly cash dividends on its com-
mon stock in the amount of $0.05 per share for each quarter of
2010 and 2009.
For information regarding dividend restrictions, see Note 23 and
Note 28 on pages 267–268 and 273, respectively, of this Annual
Report.
The following table shows the common dividend payout ratio based
on reported net income.
Year ended December 31, 2010 2009 2008
Common dividend payout ratio 5% 9% 114%
Issuance
On June 5, 2009, the Firm issued $5.8 billion, or 163 million
shares, of common stock at $35.25 per share. On September 30,
2008, the Firm issued $11.5 billion, or 284 million shares, of com-
mon stock at $40.50 per share. The proceeds from these issuances
were used for general corporate purposes. For additional informa-
tion regarding common stock, see Note 24 on page 268 of this
Annual Report.
Capital Purchase Program
Pursuant to the U.S. Treasury’s Capital Purchase Program, on Octo-
ber 28, 2008, the Firm issued to the U.S. Treasury, for total pro-
ceeds of $25.0 billion, (i) 2.5 million shares of Series K Preferred
Stock, and (ii) a Warrant to purchase up to 88,401,697 shares of
the Firm’s common stock, at an exercise price of $42.42 per share,
subject to certain antidilution and other adjustments. On June 17,
2009, the Firm redeemed all of the outstanding shares of Series K
Preferred Stock and repaid the full $25.0 billion principal amount
together with accrued dividends. The U.S. Treasury exchanged the
Warrant for 88,401,697 warrants, each of which is a warrant to
purchase a share of the Firm’s common stock at an exercise price of
$42.42 per share, and, on December 11, 2009, sold the warrants in a
secondary public offering for $950 million. The Firm did not purchase
any of the warrants sold by the U.S. Treasury.
Stock repurchases
Under the stock repurchase program authorized by the Firm’s Board
of Directors, the Firm is authorized to repurchase up to $10.0
billion of the Firm’s common stock plus the 88 million warrants sold
by the U.S. Treasury in 2009. During 2009, the Firm did not repur-
chase any shares of its common stock or warrants. In the second
quarter of 2010, the Firm resumed common stock repurchases, and
during the year repurchased an aggregate of 78 million shares for
$3.0 billion at an average price per share of $38.49. The Firm’s
share repurchase activities in 2010 were intended to offset share-
count increases resulting from employee stock-based incentive
awards and were consistent with the Firm’s goal of maintaining an
appropriate sharecount. The Firm did not repurchase any of the
warrants during 2010. As of December 31, 2010, $3.2 billion of
authorized repurchase capacity remained with respect to the com-
mon stock, and all of the authorized repurchase capacity remained
with respect to the warrants.
The Firm may, from time to time, enter into written trading plans
under Rule 10b5-1 of the Securities Exchange Act of 1934 to
facilitate the repurchase of common stock and warrants in accor-
dance with the repurchase program. A Rule 10b5-1 repurchase
plan allows the Firm to repurchase its equity during periods when it
would not otherwise be repurchasing common stock – for example,
during internal trading “black-out periods.” All purchases under a
Rule 10b5-1 plan must be made according to a predefined plan
established when the Firm is not aware of material nonpublic
information.
The authorization to repurchase common stock and warrants will be
utilized at management’s discretion, and the timing of purchases and
the exact number of shares and warrants purchased is subject to
various factors, including market conditions; legal considerations
affecting the amount and timing of repurchase activity; the Firm’s
capital position (taking into account goodwill and intangibles); inter-
nal capital generation; and alternative potential investment opportu-
nities. The repurchase program does not include specific price targets
or timetables; may be executed through open market purchases or
privately negotiated transactions, including through the use of Rule
10b5-1 programs; and may be suspended at any time.
For additional information regarding repurchases of the Firm’s equity
securities, see Part II, Item 5, Market for registrant’s common equity,
related stockholder matters and issuer purchases of equity securities,
on pages 13–14 of JPMorgan Chase’s 2010 Form 10-K.
JPMorgan Chase & Co./2010 Annual Report 107
RISK MANAGEMENT
Risk is an inherent part of JPMorgan Chase’s business activities. The
Firm’s risk management framework and governance structure are
intended to provide comprehensive controls and ongoing manage-
ment of the major risks taken in its business activities. The Firm
employs a holistic approach to risk management to ensure the
broad spectrum of risk types are considered in managing its busi-
ness activities. The Firm’s risk management framework is intended
to create a culture of risk awareness and personal responsibility
throughout the Firm where collaboration, discussion, escalation and
sharing of information is encouraged.
The Firm’s overall risk appetite is established in the context of the
Firm’s capital, earnings power, and diversified business model. The
Firm employs a formal risk appetite framework to clearly link risk
appetite and return targets, controls and capital management. The
Firm’s CEO is responsible for setting the overall risk appetite of the
Firm and the LOB CEOs are responsible for setting the risk appetite
for their respective lines of business. The Risk Policy Committee of
the Firm’s Board of Directors approves the risk appetite policy on
behalf of the entire Board of Directors.
Risk governance
The Firm’s risk governance structure is based on the principle that
each line of business is responsible for managing the risk inherent
in its business, albeit with appropriate Corporate oversight. Each
line of business risk committee is responsible for decisions regarding
the business’ risk strategy, policies and controls.
Overlaying line of business risk management are four corporate
functions with risk management–related responsibilities: Risk
Management, the Chief Investment Office, Corporate Treasury,
and Legal and Compliance.
Risk Management operates independently to provide oversight of
firmwide risk management and controls, and is viewed as a part-
ner in achieving appropriate business objectives. Risk Management
coordinates and communicates with each line of business through
the line of business risk committees and chief risk officers to man-
age risk. The Risk Management function is headed by the Firm’s
Chief Risk Officer, who is a member of the Firm’s Operating
Committee and who reports to the Chief Executive Officer and the
Board of Directors, primarily through the Board’s Risk Policy
Committee. The Chief Risk Officer is also a member of the line of
business risk committees. Within the Firm’s Risk Management
function are units responsible for credit risk, market risk, opera-
tional risk and private equity risk, as well as risk reporting, risk
policy and risk technology and operations. Risk technology and
operations is responsible for building the information technology
infrastructure used to monitor and manage risk.
The Chief Investment Office and Corporate Treasury are respon-
sible for measuring, monitoring, reporting and managing the
Firm’s liquidity, interest rate and foreign exchange risk, and
other structural risks.
Legal and Compliance has oversight for legal and fiduciary risk.
In addition to the risk committees of the lines of business and the
above-referenced risk management functions, the Firm also has
an Investment Committee, an Asset-Liability Committee and three
other risk-related committees – the Risk Working Group, the
Global Counterparty Committee and the Markets Committee. All
of these committees are accountable to the Operating Commit-
tee. The membership of these committees are composed of senior
management of the Firm, including representatives of lines of
business, Risk Management, Finance and other senior executives.
The committees meet frequently to discuss a broad range of
topics including, for example, current market conditions and other
external events, risk exposures, and risk concentrations to ensure
that the impact of risk factors are considered broadly across the
Firm’s businesses.
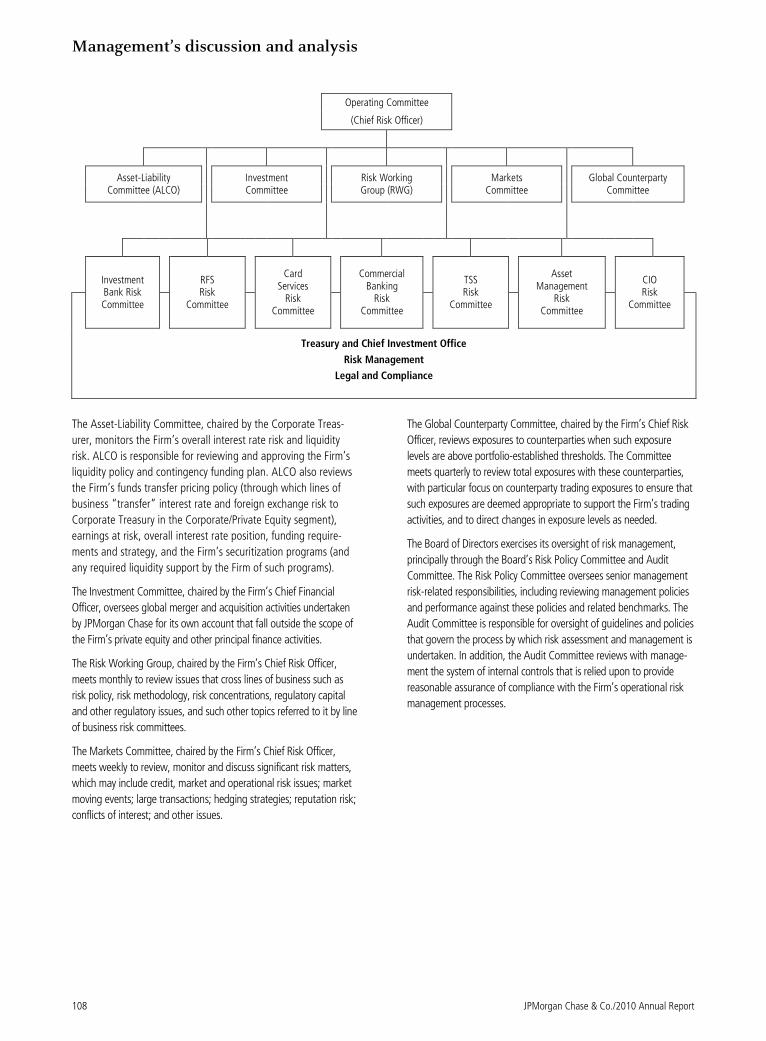
Management’s discussion and analysis
108 JPMorgan Chase & Co./2010 Annual Report
The Asset-Liability Committee, chaired by the Corporate Treas-
urer, monitors the Firm’s overall interest rate risk and liquidity
risk. ALCO is responsible for reviewing and approving the Firm’s
liquidity policy and contingency funding plan. ALCO also reviews
the Firm’s funds transfer pricing policy (through which lines of
business “transfer” interest rate and foreign exchange risk to
Corporate Treasury in the Corporate/Private Equity segment),
earnings at risk, overall interest rate position, funding require-
ments and strategy, and the Firm’s securitization programs (and
any required liquidity support by the Firm of such programs).
The Investment Committee, chaired by the Firm’s Chief Financial
Officer, oversees global merger and acquisition activities undertaken
by JPMorgan Chase for its own account that fall outside the scope of
the Firm’s private equity and other principal finance activities.
The Risk Working Group, chaired by the Firm’s Chief Risk Officer,
meets monthly to review issues that cross lines of business such as
risk policy, risk methodology, risk concentrations, regulatory capital
and other regulatory issues, and such other topics referred to it by line
of business risk committees.
The Markets Committee, chaired by the Firm’s Chief Risk Officer,
meets weekly to review, monitor and discuss significant risk matters,
which may include credit, market and operational risk issues; market
moving events; large transactions; hedging strategies; reputation risk;
conflicts of interest; and other issues.
The Global Counterparty Committee, chaired by the Firm’s Chief Risk
Officer, reviews exposures to counterparties when such exposure
levels are above portfolio-established thresholds. The Committee
meets quarterly to review total exposures with these counterparties,
with particular focus on counterparty trading exposures to ensure that
such exposures are deemed appropriate to support the Firm’s trading
activities, and to direct changes in exposure levels as needed.
The Board of Directors exercises its oversight of risk management,
principally through the Board’s Risk Policy Committee and Audit
Committee. The Risk Policy Committee oversees senior management
risk-related responsibilities, including reviewing management policies
and performance against these policies and related benchmarks. The
Audit Committee is responsible for oversight of guidelines and policies
that govern the process by which risk assessment and management is
undertaken. In addition, the Audit Committee reviews with manage-
ment the system of internal controls that is relied upon to provide
reasonable assurance of compliance with the Firm’s operational risk
management processes.
Operating Committee
(Chief Risk Officer)
Asset-Liability
Committee (ALCO)
Investment Committee
Risk Working Group (RWG)
Markets Committee
Global Counterparty Committee
Investment Bank Risk Committee
RFS Risk
Committee
Card Services
Risk Committee
Commercial Banking
Risk Committee
TSS Risk
Committee
Asset Management
Risk Committee
CIO Risk
Committee
Treasury and Chief Investment Office
Risk Management
Legal and Compliance

JPMorgan Chase & Co./2010 Annual Report 109
Risk monitoring and control
The Firm’s ability to properly identify, measure, monitor and report risk
is critical to both its soundness and profitability.
• Risk identification: The Firm’s exposure to risk through its daily
business dealings, including lending and capital markets activities,
is identified and aggregated through the Firm’s risk management
infrastructure. In addition, individuals who manage risk positions,
particularly those that are complex, are responsible for identifying
and estimating potential losses that could arise from specific or
unusual events that may not be captured in other models, and for
communicating those risks to senior management.
• Risk measurement: The Firm measures risk using a variety of
methodologies, including calculating probable loss, unexpected
loss and value-at-risk, and by conducting stress tests and making
comparisons to external benchmarks. Measurement models and
related assumptions are routinely subject to internal model review,
empirical validation and benchmarking with the goal of ensuring
that the Firm’s risk estimates are reasonable and reflective of the
risk of the underlying positions.
• Risk monitoring/control: The Firm’s risk management policies and
procedures incorporate risk mitigation strategies and include ap-
proval limits by customer, product, industry, country and business.
These limits are monitored on a daily, weekly and monthly basis,
as appropriate.
• Risk reporting: The Firm reports risk exposures on both a line of
business and a consolidated basis. This information is reported to
management on a daily, weekly and monthly basis, as appropriate.
There are eight major risk types identified in the business activities
of the Firm: liquidity risk, credit risk, market risk, interest rate risk,
private equity risk, operational risk, legal and fiduciary risk, and
reputation risk.
Management’s discussion and analysis
110 JPMorgan Chase & Co./2010 Annual Report
LIQUIDITY RISK MANAGEMENT
The ability to maintain surplus levels of liquidity through economic
cycles is crucial to financial services companies, particularly during
periods of adverse conditions. The Firm’s funding strategy is intended
to ensure liquidity and diversity of funding sources to meet actual and
contingent liabilities through both normal and stress periods.
JPMorgan Chase’s primary sources of liquidity include a diversified
deposit base, which was $930.4 billion at December 31, 2010, and
access to the equity capital markets and long-term unsecured and
secured funding sources, including asset securitizations and borrowings
from FHLBs. Additionally, JPMorgan Chase maintains large pools of
highly-liquid unencumbered assets. The Firm actively monitors the
availability of funding in the wholesale markets across various geo-
graphic regions and in various currencies. The Firm’s ability to generate
funding from a broad range of sources in a variety of geographic loca-
tions and in a range of tenors is intended to enhance financial flexibility
and limit funding concentration risk.
Management considers the Firm’s liquidity position to be strong, based
on its liquidity metrics as of December 31, 2010, and believes that the
Firm’s unsecured and secured funding capacity is sufficient to meet its
on– and off–balance sheet obligations. The Firm was able to access the
funding markets as needed during 2010 and throughout the recent
financial crisis.
Governance
The Firm’s governance process is designed to ensure that its liquidity
position remains strong. The Asset-Liability Committee reviews and
approves the Firm’s liquidity policy and contingency funding plan.
Corporate Treasury formulates and is responsible for executing the
Firm’s liquidity policy and contingency funding plan as well as meas-
uring, monitoring, reporting and managing the Firm’s liquidity risk
profile. JPMorgan Chase centralizes the management of global funding
and liquidity risk within Corporate Treasury to maximize liquidity access,
minimize funding costs and enhance global identification and coordina-
tion of liquidity risk. This centralized approach involves frequent com-
munication with the business segments, disciplined management of
liquidity at the parent holding company, comprehensive market-
based pricing of all assets and liabilities, continuous balance sheet
monitoring, frequent stress testing of liquidity sources, and frequent
reporting to and communication with senior management and the
Board of Directors regarding the Firm’s liquidity position.
Liquidity monitoring
The Firm employs a variety of metrics to monitor and manage
liquidity. One set of analyses used by the Firm relates to the timing
of liquidity sources versus liquidity uses (e.g., funding gap analysis
and parent holding company funding, which is discussed below). A
second set of analyses focuses on ratios of funding and liquid
collateral (e.g., measurements of the Firm’s reliance on short-term
unsecured funding as a percentage of total liabilities, as well as
analyses of the relationship of short-term unsecured funding to
highly-liquid assets, the deposits-to-loans ratio and other balance
sheet measures).
The Firm performs regular liquidity stress tests as part of its liquidity
monitoring. The purpose of the liquidity stress tests is intended to
ensure sufficient liquidity for the Firm under both idiosyncratic and
systemic market stress conditions. These scenarios evaluate the Firm’s
liquidity position across a full year horizon by analyzing the net fund-
ing gaps resulting from contractual and contingent cash and collateral
outflows versus by the Firm’s ability to generate additional liquidity by
pledging or selling excess collateral and issuing unsecured debt. The
scenarios are produced for the parent holding company and major
bank subsidiaries as well as the Firm’s major U.S. broker-dealer
subsidiaries.
The idiosyncratic stress scenario employed by the Firm is a JPMor-
gan Chase-specific event that evaluates the Firm’s net funding gap
after a short-term ratings downgrade from the current level of A-
1+/P-1 to A-2/P-2. The systemic market stress scenario evaluates
the Firm’s net funding gap during a period of severe market stress
similar to market conditions in 2008 and assumes the Firm is not
uniquely stressed versus its peers. The Firm’s liquidity position is
strong under the Firm-defined stress scenarios outlined above.
Parent holding company
Liquidity monitoring on the parent holding company takes into
consideration regulatory restrictions that limit the extent to which
bank subsidiaries may extend credit to the parent holding company
and other nonbank subsidiaries. Excess cash generated by parent
holding company issuance activity is placed with both bank and
nonbank subsidiaries in the form of deposits and advances to
satisfy a portion of subsidiary funding requirements. The remainder
of the excess cash is used to purchase liquid collateral through
reverse repurchase agreements. As discussed below, the Firm’s
liquidity management activities are also intended to ensure that its
subsidiaries have the ability to generate replacement funding in the
event the parent holding company requires repayment of the
aforementioned deposits and advances.
JPMorgan Chase & Co./2010 Annual Report 111
The Firm closely monitors the ability of the parent holding company
to meet all of its obligations with liquid sources of cash or cash
equivalents for an extended period of time without access to the
unsecured funding markets. The Firm targets pre-funding of parent
holding company obligations for at least 12 months; however, due
to conservative liquidity management actions taken by the Firm in
the current environment, the current pre-funding of such obliga-
tions is significantly greater than target.
Global Liquidity Reserve
In addition to the parent holding company, the Firm maintains a
significant amount of liquidity – primarily at its bank subsidiaries, but
also at its nonbank subsidiaries. The Global Liquidity Reserve repre-
sents consolidated sources of available liquidity to the Firm, including
cash on deposit at central banks, and cash proceeds reasonably
expected to be received in secured financings of highly liquid, unen-
cumbered securities – such as government-issued debt, government-
and FDIC-guaranteed corporate debt, U.S. government agency debt
and agency mortgage-backed securities (“MBS”). The liquidity
amount anticipated to be realized from secured financings is based
on management’s current judgment and assessment of the Firm’s
ability to quickly raise secured financings. The Global Liquidity Re-
serve also includes the Firm’s borrowing capacity at various FHLBs,
the Federal Reserve Bank discount window and various other central
banks from collateral pledged by the Firm to such banks. Although
considered as a source of available liquidity, the Firm does not view
borrowing capacity at the Federal Reserve Bank discount window and
various other central banks as a primary source of funding. As of
December 31, 2010, the Global Liquidity Reserve was approximately
$262 billion.
In addition to the Global Liquidity Reserve, the Firm has significant
amounts of other high-quality, marketable securities available to
raise liquidity, such as corporate debt and equity securities.
Basel III
On December 16, 2010, the Basel Committee published the final
Basel III rules pertaining to capital and liquidity requirements, includ-
ing minimum standards for short-term liquidity coverage – the liquid-
ity coverage ratio (the “LCR”) – and term funding – the net stable
funding ratio (the “NSFR”). These minimum standards will be phased
in over time. The observation period for both the LCR and the NSFR
commences in 2011, with implementation in 2015 and 2018, respec-
tively. For more information, see the discussion on Basel III on page
104 of this Annual Report.
Funding
Sources of funds
A key strength of the Firm is its diversified deposit franchise, through
the RFS, CB, TSS and AM lines of business, which provides a stable
source of funding and decreases reliance on the wholesale markets.
As of December 31, 2010, total deposits for the Firm were $930.4
billion, compared with $938.4 billion at December 31, 2009. Aver-
age total deposits for the Firm were $881.1 billion during 2010,
compared with $882.0 billion during 2009. The Firm typically experi-
ences higher deposit balances at period ends driven by higher sea-
sonal customer deposit inflows. A significant portion of the Firm’s
deposits are retail deposits (40% and 38% at December 31, 2010
and 2009, respectively), which are considered particularly stable as
they are less sensitive to interest rate changes or market volatility. A
significant portion of the Firm’s wholesale deposits are also consid-
ered stable sources of funding due to the nature of the relationships
from which they are generated, particularly customers’ operating
service relationships with the Firm. As of December 31, 2010, the
Firm’s deposits-to-loans ratio was 134%, compared with 148% at
December 31, 2009. The decline in the Firm’s deposits-to-loans ratio
was predominately due to an increase in loans resulting from the
January 1, 2010, implementation of new accounting guidance re-
lated to VIEs. The impact of the new accounting guidance on the
deposits-to-loans ratio was partially offset by continued attrition of
the heritage Washington Mutual residential loan and credit card loan
portfolios. For further discussions of deposit and liability balance
trends, see the discussion of the results for the Firm’s business
segments and the Balance Sheet Analysis on pages 69–88 and 92–
94, respectively, of this Annual Report. For a more detailed discus-
sion of the adoption of the new accounting guidance, see Note 1 on
pages 164–165 of this Annual Report.
Additional sources of funding include a variety of unsecured and
secured short-term and long-term instruments. Short-term unsecured
funding sources include federal funds and Eurodollars purchased,
certificates of deposit, time deposits, commercial paper and bank
notes. Long-term unsecured funding sources include long-term debt,
trust preferred capital debt securities, preferred stock and common
stock.
Management’s discussion and analysis
112 JPMorgan Chase & Co./2010 Annual Report
The Firm’s short-term secured sources of funding consist of securi-
ties loaned or sold under agreements to repurchase and borrowings
from the Chicago, Pittsburgh and San Francisco FHLBs. Secured
long-term funding sources include asset-backed securitizations, and
borrowings from the Chicago, Pittsburgh and San Francisco FHLBs.
Funding markets are evaluated on an ongoing basis to achieve an
appropriate global balance of unsecured and secured funding at
favorable rates.
Short-term funding
The Firm’s reliance on short-term unsecured funding sources such
as federal funds and Eurodollars purchased, certificates of deposit,
time deposits, commercial paper and bank notes is limited.
Total commercial paper liabilities for the Firm were $35.4 billion as
of December 31, 2010, compared with $41.8 billion as of Decem-
ber 31, 2009. However, of those totals, $29.2 billion and $28.7
billion as of December 31, 2010 and 2009, respectively, originated
from deposits that customers chose to sweep into commercial
paper liabilities as a cash management product offered by the Firm.
Therefore, commercial paper liabilities sourced from wholesale
funding markets were $6.2 billion as of December 31, 2010, com-
pared with $13.1 billion as of December 31, 2009. There were no
material differences between the average and year-end balances of
commercial paper outstanding for the year ended and as of De-
cember 31, 2010.
Securities loaned or sold under agreements to repurchase are
secured predominantly by high quality securities collateral, includ-
ing government-issued debt, agency debt and agency MBS. The
balances of securities loaned or sold under agreements to repur-
chase, which constitute a significant portion of the federal funds
purchased and securities loaned or sold under repurchase agree-
ments, was $273.3 billion as of December 31, 2010, compared
with $253.5 billion as of December 31, 2009. There were no mate-
rial differences between the average and year-end balances of
securities loaned or sold under agreements to repurchase for the
year ended and as of December 31, 2010. The balances associated
with securities loaned or sold under agreements to repurchase
fluctuate over time due to customers’ investment and financing
activities; the Firm’s demand for financing; the Firm’s matched
book activity; the ongoing management of the mix of the Firm’s
liabilities, including its secured and unsecured financing (for both
the investment and trading portfolios); and other market and
portfolio factors. For additional information, see the Balance Sheet
Analysis on pages 92–94, Note 13 on page 219 and Note 20 on page
264 of this Annual Report.
The short-term portion of total other borrowed funds for the Firm
was $34.3 billion as of December 31, 2010, compared with $32.9
billion as of December 31, 2009. There were no material differ-
ences between the average and year-end balances of other bor-
rowed funds for the year ended and as of December 31, 2010.
For additional information, see the table for Short-term and other
borrowed funds on page 299 of this Annual Report.
Long-term funding and issuance
During 2010, the Firm issued $36.1 billion of long-term debt,
including $17.1 billion of senior notes issued in the U.S. market,
$2.9 billion of senior notes issued in the non-U.S. markets, $1.5
billion of trust preferred capital debt securities, and $14.6 billion
of IB structured notes. In addition, in January 2011, the Firm
issued $4.3 billion of long-term debt, including $3.5 billion of
senior notes in the U.S. market and $800 million of senior notes
issued in non-U.S. markets. During 2009, the Firm issued $19.7
billion of FDIC-guaranteed long-term debt under the Temporary
Liquidity Guarantee Program. During 2009, the Firm also issued
non-FDIC-guaranteed debt of $16.1 billion (including $11.0
billion of senior notes and $2.5 billion of trust preferred capital
debt securities issued in the U.S. market, and $2.6 billion of
senior notes issued in non-U.S. markets) and $15.5 billion of IB
structured notes. During 2010, $53.4 billion of long-term debt
matured or were redeemed, including $907 million of trust pre-
ferred capital debt securities redeemed on December 28, 2010,
through a tender offer, and $22.8 billion of IB structured notes.
During 2009, $55.7 billion of long-term debt (including trust
preferred capital debt securities) matured or were redeemed,
including $27.2 billion of IB structured notes.
In addition to the unsecured long-term funding and issuances
discussed above, the Firm securitizes consumer credit card loans,
residential mortgages, auto loans and student loans for funding
purposes. Loans securitized by the Firm’s wholesale businesses are
related to client-driven transactions and are not considered to be a
source of funding for the Firm. Effective January 1, 2010, certain
Firm-sponsored credit card loan, student loan and auto loan securi-
tization trusts were consolidated as a result of the accounting
guidance related to VIEs. As a result of consolidating these securiti-
zation trusts, the maturities or redemptions of the beneficial inter-
ests issued by the securitization trusts are reported as a component
of the Firm’s cash flows from financing activities. During 2010, the
Firm did not securitize any credit card loans, residential mortgage
loans, auto loans or student loans through consolidated or noncon-
solidated securitization trusts. During 2009, the Firm securitized
$26.5 billion of credit card loans via nonconsolidated securitization
trusts. During 2010, $25.8 billion of loan securitizations matured or
were redeemed, including $24.9 billion of credit card loan securiti-
zations, $210 million of auto loan securitizations, $294 million of
residential mortgage loan securitizations and $326 million of stu-
dent loan securitizations. For further discussion of loan securitiza-
tions, see Note 16 on pages 244–259 in this Annual Report.
JPMorgan Chase & Co./2010 Annual Report 113
During 2010, the Firm borrowed $18.7 billion of new long-term
advances from the FHLBs, which were offset by $18.6 billion of
maturities. During 2009, the Firm did not access the FHLBs for any
new long-term advances and maturities were $9.5 billion during
the period.
Termination of replacement capital covenants
In connection with the issuance of certain of its trust preferred
capital debt securities and its noncumulative perpetual preferred
stock, the Firm had entered into Replacement Capital Covenants
(“RCCs”). These RCCs granted certain rights to the holders of
“covered debt,” as defined in the RCCs, that prohibited the repay-
ment, redemption or purchase of such trust preferred capital debt
securities and noncumulative perpetual preferred stock except, with
limited exceptions, to the extent that JPMorgan Chase had re-
ceived, in each such case, specified amounts of proceeds from the
sale of certain qualifying securities. On December 10, 2010, the
Firm received consents from the holders of a majority in liquidation
amount of the covered debt to the termination of the RCCs, and
the Firm terminated the RCCs pursuant to their terms.
Cash flows
For the years ended December 31, 2010, 2009 and 2008, cash and
due from banks increased $1.4 billion, and decreased $689 million
and $13.2 billion, respectively. The following discussion highlights
the major activities and transactions that affected JPMorgan
Chase’s cash flows during 2010, 2009 and 2008.
Cash flows from operating activities
JPMorgan Chase’s operating assets and liabilities support the
Firm’s capital markets and lending activities, including the origina-
tion or purchase of loans initially designated as held-for-sale.
Operating assets and liabilities can vary significantly in the normal
course of business due to the amount and timing of cash flows,
which are affected by client-driven activities, market conditions and
trading strategies. Management believes cash flows from opera-
tions, available cash balances and the Firm’s ability to generate
cash through short- and long-term borrowings are sufficient to fund
the Firm’s operating liquidity needs.
For the year ended December 31, 2010, net cash used by operating
activities was $3.8 billion, mainly driven by an increase primarily in
trading assets—debt and equity instruments; principally due to
improved market activity primarily in equity securities, foreign debt
and physical commodities, partially offset by an increase in trading
liabilities due to higher levels of positions taken to facilitate cus-
tomer driven trading. Net cash was provided by net income and
from adjustments for non-cash items such as the provision for
credit losses, depreciation and amortization and stock-based com-
pensation. Additionally, proceeds from sales and paydowns of
loans originated or purchased with an initial intent to sell were
higher than cash used to acquire such loans.
For the years ended December 31, 2009 and 2008, net cash pro-
vided by operating activities was $122.8 billion and $23.9 billion,
respectively. In 2009, the net decline in trading assets and liabilities
was affected by the impact of the challenging capital markets
environment that existed in 2008, and continued into the first half
of 2009. In 2009 and 2008, net cash generated from operating
activities was higher than net income, largely as a result of adjust-
ments for non-cash items such as the provision for credit losses. In
addition, for 2009 and 2008 proceeds from sales, securitizations
and paydowns of loans originated or purchased with an initial
intent to sell were higher than cash used to acquire such loans, but
the cash flows from these loan activities remained at reduced levels
as a result of the lower activity in these markets.
Cash flows from investing activities
The Firm’s investing activities predominantly include loans originated
to be held for investment, the AFS securities portfolio and other short-
term interest-earning assets. For the year ended December 31, 2010,
net cash of $54.0 billion was provided by investing activities. This
resulted from a decrease in deposits with banks largely due to a
decline in deposits placed with the Federal Reserve Bank and
lower interbank lending as market stress eased since the end of
2009; net sales and maturities of AFS securities used in the Firm’s
interest rate risk management activities largely due to reposition-
ing of the portfolio in Corporate, in response to changes in the
interest rate environment and to rebalance exposures; and a net
decrease in the loan portfolio, driven by the expected runoff of
the Washington Mutual credit card portfolio, a decline in lower-
yielding promotional credit card balances, continued runoff of the
residential real estate portfolios, and repayments and loan sales
in IB and CB; the decrease was partially offset by higher origina-
tions across the wholesale and consumer businesses. Partially
offsetting these cash proceeds was an increase in securities
purchased under resale agreements, predominantly due to higher
financing volume in IB; and cash used for business acquisitions,
primarily RBS Sempra.
For the year ended December 31, 2009, net cash of $29.4 billion
was provided by investing activities, primarily from a decrease in
deposits with banks reflecting lower demand for inter-bank lending
and lower deposits with the Federal Reserve Bank relative to the
elevated levels at the end of 2008; a net decrease in the loan
portfolio across most businesses, driven by continued lower cus-
tomer demand and loan sales in the wholesale businesses, lower
charge volume on credit cards, slightly higher credit card securitiza-
tions, and paydowns; and the maturity of all asset-backed commer-
cial paper issued by money market mutual funds in connection with
the AML facility of the Federal Reserve Bank of Boston. Largely
offsetting these cash proceeds were net purchases of AFS securities
associated with the Firm’s management of interest rate risk and
investment of cash resulting from an excess funding position.
Management’s discussion and analysis
114 JPMorgan Chase & Co./2010 Annual Report
For the year ended December 31, 2008, net cash of $283.7
billion was used in investing activities, primarily for: increased
deposits with banks as the result of the availability of excess cash
for short-term investment opportunities through interbank lend-
ing, and reserve balances held by the Federal Reserve (which
became an investing activity in 2008, reflecting a policy change
of the Federal Reserve to pay interest to depository institutions on
reserve balances); net purchases of investment securities in the
AFS portfolio to manage the Firm’s exposure to interest rate
movements; net additions to the wholesale loan portfolio from
organic growth in CB; additions to the consumer prime mortgage
portfolio as a result of the decision to retain, rather than sell, new
originations of nonconforming prime mortgage loans; an increase
in securities purchased under resale agreements reflecting growth
in demand from clients for liquidity; and net purchases of asset-
backed commercial paper from money market mutual funds in
connection with the Asset-Backed Commercial Paper Money
Market Mutual Fund Liquidity Facility (“AML facility”) of the Fed-
eral Reserve Bank of Boston. Partially offsetting these uses of
cash were proceeds from loan sales and securitization activities
as well as net cash received from acquisitions and the sale of an
investment. Additionally, in June 2008, in connection with the
Bear Stearns merger, the Firm sold assets acquired from Bear
Stearns to the FRBNY and received cash proceeds of $28.85
billion.
Cash flows from financing activities
The Firm’s financing activities primarily reflect cash flows related to
raising customer deposits, and issuing long-term debt (including trust
preferred capital debt securities) as well as preferred and common
stock. In 2010, net cash used in financing activities was $49.2 billion.
This resulted from net payments of long-term borrowings and trust
preferred capital debt securities as new issuances were more than
offset by payments primarily reflecting a decline in beneficial inter-
ests issued by consolidated VIEs due to maturities related to Firm-
sponsored credit card securitization trusts; a decline in deposits
associated with wholesale funding activities due to the Firm’s lower
funding needs; lower deposit levels in TSS, offset partially by net
inflows from existing customers and new business in AM, CB and
RFS; a decline in commercial paper and other borrowed funds due
to lower funding requirements; payments of cash dividends; and
repurchases of common stock. Cash was generated as a result of
an increase in securities sold under repurchase agreements largely
as a result of an increase in activity levels in IB partially offset by a
decrease in CIO reflecting repositioning activities.
In 2009, net cash used in financing activities was $153.1 billion; this
reflected a decline in wholesale deposits, predominantly in TSS, driven
by the continued normalization of wholesale deposit levels resulting
from the mitigation of credit concerns, compared with the heightened
market volatility and credit concerns in the latter part of 2008; a
decline in other borrowings, due to the absence of borrowings from
the Federal Reserve under the Term Auction Facility program; net
repayments of short-term advances from FHLBs and the maturity of
the nonrecourse advances under the Federal Reserve Bank of Boston
AML Facility; the June 17, 2009, repayment in full of the $25.0 billion
principal amount of Series K Preferred Stock issued to the U.S. Treas-
ury; and the payment of cash dividends on common and preferred
stock. Cash was also used for the net payment of long-term borrow-
ings and trust preferred capital debt securities, as issuances of FDIC-
guaranteed debt and non-FDIC guaranteed debt in both the U.S. and
European markets were more than offset by repayments including
long-term advances from FHLBs. Cash proceeds resulted from an
increase in securities loaned or sold under repurchase agreements,
partly attributable to favorable pricing and to financing the increased
size of the Firm’s AFS securities portfolio; and the issuance of $5.8
billion of common stock. There were no repurchases in the open
market of common stock or the warrants during 2009.
In 2008, net cash provided by financing activities was $247.0 billion
due to growth in wholesale deposits, in particular, interest- and
noninterest-bearing deposits in TSS (driven by both new and existing
clients, and due to the deposit inflows related to the heightened
volatility and credit concerns affecting the global markets that began
in the third quarter of 2008), as well as increases in AM and CB (due
to organic growth); proceeds of $25.0 billion from the issuance of
preferred stock and the Warrant to the U.S. Treasury under the Capi-
tal Purchase Program; additional issuances of common stock and
preferred stock used for general corporate purposes; an increase in
other borrowings due to nonrecourse secured advances under the
Federal Reserve Bank of Boston AML Facility to fund the purchase of
asset-backed commercial paper from money market mutual funds;
increases in federal funds purchased and securities loaned or sold
under repurchase agreements in connection with higher client de-
mand for liquidity and to finance growth in the Firm’s AFS securities
portfolio; and a net increase in long-term borrowings due to a combi-
nation of non-FDIC guaranteed debt and trust preferred capital debt
securities issued prior to December 4, 2008, and the issuance of
$20.8 billion of FDIC-guaranteed long-term debt issued during the
fourth quarter of 2008. The fourth-quarter FDIC-guaranteed debt
issuance was offset partially by maturities of non-FDIC guaranteed
long-term debt during the same period. The increase in long-term
borrowings and trust preferred capital debt securities was used
primarily to fund certain illiquid assets held by the parent holding
company and to build liquidity. Cash was also used to pay dividends
on common and preferred stock. The Firm did not repurchase any
shares of its common stock during 2008.
JPMorgan Chase & Co./2010 Annual Report 115
Credit ratings
The cost and availability of financing are influenced by credit ratings.
Reductions in these ratings could have an adverse effect on the Firm’s
access to liquidity sources, increase the cost of funds, trigger addi-
tional collateral or funding requirements and decrease the number of
investors and counterparties willing to lend to the Firm. Additionally,
the Firm’s funding requirements for VIEs and other third-party com-
mitments may be adversely affected by a decline in credit ratings. For
additional information on the impact of a credit ratings downgrade
on the funding requirements for VIEs, and on derivatives and collat-
eral agreements, see Special-purpose entities on page 95 and Ratings
profile of derivative receivables MTM on page 124, and Note 6 on
pages 191–199, respectively, of this Annual Report.
Critical factors in maintaining high credit ratings include a stable and
diverse earnings stream, strong capital ratios, strong credit quality
and risk management controls, diverse funding sources, and disci-
plined liquidity monitoring procedures.
The credit ratings of the parent holding company and each of the Firm’s significant banking subsidiaries as of December 31, 2010, were as follows.
Short-term debt Senior long-term debt Moody’s S&P Fitch Moody’s S&P Fitch
JPMorgan Chase & Co. P-1 A-1 F1+ Aa3 A+ AA–JPMorgan Chase Bank, N.A. P-1 A-1+ F1+ Aa1 AA– AA–Chase Bank USA, N.A. P-1 A-1+ F1+ Aa1 AA– AA–
The senior unsecured ratings from Moody’s, S&P and Fitch on
JPMorgan Chase and its principal bank subsidiaries remained
unchanged at December 31, 2010, from December 31, 2009. At
December 31, 2010, Moody’s and S&P’s outlook remained nega-
tive, while Fitch’s outlook remained stable.
Following the Firm’s earnings release on January 14, 2011, S&P
and Moody’s announced that their ratings on the Firm remained
unchanged.
If the Firm’s senior long-term debt ratings were downgraded by one
notch, the Firm believes the incremental cost of funds or loss of
funding would be manageable, within the context of current mar-
ket conditions and the Firm’s liquidity resources. JPMorgan Chase’s
unsecured debt does not contain requirements that would call for
an acceleration of payments, maturities or changes in the structure
of the existing debt, provide any limitations on future borrowings or
require additional collateral, based on unfavorable changes in the
Firm’s credit ratings, financial ratios, earnings, or stock price.
Several rating agencies have announced that they will be evaluating
the effects of the financial regulatory reform legislation in order to
determine the extent, if any, to which financial institutions, including
the Firm, may be negatively impacted. There is no assurance the
Firm’s credit ratings will not be downgraded in the future as a result
of any such reviews.
Management’s discussion and analysis
116 JPMorgan Chase & Co./2010 Annual Report
CREDIT RISK MANAGEMENT
Credit risk is the risk of loss from obligor or counterparty default.
The Firm provides credit (for example, through loans, lending-
related commitments, guarantees and derivatives) to a variety of
customers, from large corporate and institutional clients to the
individual consumer. Loans originated or acquired by the Firm’s
wholesale businesses are generally retained on the balance sheet.
Credit risk management actively monitors the wholesale portfolio to
ensure that it is well diversified across industry, geography, risk
rating, maturity and individual client categories. Portfolio manage-
ment for wholesale loans includes, for the Firm’s syndicated loan
business, distributing originations into the market place, targeting
exposure held in the retained wholesale portfolio at less than 10%
of the customer facility. With regard to the consumer credit market,
the Firm focuses on creating a portfolio that is diversified from a
product, industry and geographic perspective. Loss mitigation
strategies are being employed for all home lending portfolios.
These strategies include rate reductions, forbearance and other
actions intended to minimize economic loss and avoid foreclosure.
In the mortgage business, originated loans are either retained in
the mortgage portfolio or securitized and sold to U.S. government
agencies and U.S. government-sponsored enterprises.
Credit risk organization
Credit risk management is overseen by the Chief Risk Officer and
implemented within the lines of business. The Firm’s credit risk
management governance consists of the following functions:
• Establishing a comprehensive credit risk policy framework
• Monitoring and managing credit risk across all portfolio
segments, including transaction and line approval
• Assigning and managing credit authorities in connection with
the approval of all credit exposure
• Managing criticized exposures and delinquent loans
• Determining the allowance for credit losses and ensuring appro-
priate credit risk-based capital management
Risk identification
The Firm is exposed to credit risk through lending and capital
markets activities. Credit Risk Management works in partnership
with the business segments in identifying and aggregating expo-
sures across all lines of business.
Risk measurement
To measure credit risk, the Firm employs several methodologies for
estimating the likelihood of obligor or counterparty default. Meth-
odologies for measuring credit risk vary depending on several
factors, including type of asset (e.g., consumer versus wholesale),
risk measurement parameters (e.g., delinquency status and bor-
rower’s credit score versus wholesale risk-rating) and risk manage-
ment and collection processes (e.g., retail collection center versus
centrally managed workout groups). Credit risk measurement is
based on the amount of exposure should the obligor or the coun-
terparty default, the probability of default and the loss severity
given a default event. Based on these factors and related market-
based inputs, the Firm estimates both probable and unexpected
losses for the wholesale and consumer portfolios as follows:
• Probable losses are based primarily upon statistical estimates of
credit losses as a result of obligor or counterparty default. How-
ever, probable losses are not the sole indicators of risk.
• Unexpected losses, reflected in the allocation of credit risk capi-
tal, represent the potential volatility of actual losses relative to
the probable level of losses.
Risk measurement for the wholesale portfolio is assessed primarily
on a risk-rated basis; for the consumer portfolio, it is assessed
primarily on a credit-scored basis.
Risk-rated exposure
Risk ratings are assigned to differentiate risk within the portfolio
and are reviewed on an ongoing basis by Credit Risk Management
and revised, if needed, to reflect the borrowers’ current financial
positions, risk profiles and the related collateral. For portfolios that
are risk-rated, probable and unexpected loss calculations are based
on estimates of probability of default and loss severity given a
default. These risk-rated portfolios are generally held in IB, CB, TSS
and AM; they also include approximately $18 billion of certain
business banking and auto loans in RFS that are risk-rated because
they have characteristics similar to commercial loans. Probability of
default is the likelihood that a loan will not be repaid and will
default. Probability of default is calculated for each client who has a
risk-rated loan (wholesale and certain risk-rated consumer loans).
Loss given default is an estimate of losses given a default event and
takes into consideration collateral and structural support for each
credit facility. Calculations and assumptions are based on manage-
ment information systems and methodologies which are under
continual review.

JPMorgan Chase & Co./2010 Annual Report 117
Credit-scored exposure
For credit-scored portfolios (generally held in RFS and CS), probable
loss is based on a statistical analysis of inherent losses expected to
emerge over discrete periods of time for each portfolio. The credit-
scored portfolio includes mortgage, home equity, certain business
banking and auto loans, student loans, as well as credit card loans.
Probable losses inherent in the portfolio are estimated using sophisti-
cated portfolio modeling, credit scoring and decision-support tools,
which take into account factors such as delinquency, geography, LTV
ratios and credit scores. These analyses are applied to the Firm’s
current portfolios in order to estimate the severity of losses, which
determines the amount of probable losses. Other risk characteristics
utilized to evaluate probable losses include recent loss experience in
the portfolios, changes in origination sources, portfolio seasoning,
potential borrower behavior and the macroeconomic environment.
These factors and analyses are updated at least on a quarterly basis
or more frequently as market conditions dictate.
Risk monitoring and control
The Firm has developed policies and practices that are designed to
preserve the independence and integrity of the approval and deci-
sion-making process of extending credit and to ensure credit risks
are assessed accurately, approved properly, monitored regularly
and managed actively at both the transaction and portfolio levels.
The policy framework establishes credit approval authorities, con-
centration limits, risk-rating methodologies, portfolio review pa-
rameters and guidelines for management of distressed exposure.
For consumer credit risk, delinquency and other trends, including
any concentrations at the portfolio level, are monitored for poten-
tial problems, as certain of these trends can be ameliorated through
changes in underwriting policies and portfolio guidelines. Con-
sumer Credit Risk Management evaluates delinquency and other
trends against business expectations, current and forecasted eco-
nomic conditions, and industry benchmarks. All of these historical
and forecasted trends are incorporated into the modeling of esti-
mated consumer credit losses and are part of the monitoring of the
credit risk profile of the portfolio.
Wholesale credit risk is monitored regularly at an aggregate portfo-
lio, industry and individual counterparty basis with established
concentration limits that are reviewed and revised, as deemed
appropriate by management, on an annual basis. Industry and
counterparty limits, as measured in terms of exposure and eco-
nomic credit risk capital, are subject to stress-based loss constraints
for the aggregate portfolio.
Management of the Firm’s wholesale exposure is accomplished
through a number of means including:
• Loan syndication and participations
• Loan sales and securitizations
• Credit derivatives
• Use of master netting agreements
• Collateral and other risk-reduction techniques
In addition to Risk Management, the Firm’s Audit department
provides periodic reviews, as well as continuous monitoring, where
appropriate, of the Firm’s consumer and wholesale portfolios.
In the Firm’s wholesale and certain risk-rated consumer credit
portfolios, a credit review group within the Audit department is
responsible for:
• Independently assessing and validating the changing risk grades
assigned to exposures; and
• Evaluating the effectiveness of business units’ risk rating, includ-
ing the accuracy and consistency of risk grades, the timeliness of
risk grade changes and the justification of risk grades in credit
memoranda
In the Firm’s consumer credit portfolio, the Audit department
periodically tests the internal controls around the modeling process
including the integrity of the data utilized. In addition, the risk
inherent in the Firm’s consumer based loans is evaluated using
models whose construction, assumptions and on-going perform-
ance relative to expectations are reviewed by an independent risk
management group that is separate from the lines of business. For
further discussion on consumer loans, see Note 14 on pages 220–
238 of this Annual Report.
Risk reporting
To enable monitoring of credit risk and decision-making, aggregate
credit exposure, credit quality forecasts, concentration levels and
risk profile changes are reported regularly to senior Credit Risk
Management. Detailed portfolio reporting of industry, customer,
product and geographic concentrations occurs monthly, and the
appropriateness of the allowance for credit losses is reviewed by
senior management at least on a quarterly basis. Through the risk
reporting and governance structure, credit risk trends and limit
exceptions are provided regularly to, and discussed with, senior
management. For further discussion of risk monitoring and control,
see page 109 of this Annual Report.
Management’s discussion and analysis
118 JPMorgan Chase & Co./2010 Annual Report
2010 Credit risk overview
During 2010, the credit environment improved compared with
2009, resulting in decreased downgrade, default and charge-off
activity and improved delinquency trends. Despite challenging
macroeconomic conditions, particularly in the first half of 2010, the
Firm continued to actively manage its underperforming and nonac-
crual loans and reduce such exposures through repayments, loan
sales and workouts. These efforts resulted in an improvement in the
credit quality of the portfolio compared with 2009 and contributed
to the Firm’s reduction in the allowance for credit losses, particu-
larly in CS and IB. During the year and particularly in the second
half of 2010, customer demand for credit improved, loan origina-
tion activity and market liquidity improved and credit spreads
tightened from 2009.
In the wholesale portfolio, criticized assets, nonperforming assets
and charge-offs decreased from peak loss levels experienced in
2009, reflecting general improvement in the portfolio, partially
offset by continued weakness in commercial real estate (“CRE”).
Toward the end of 2010, CRE exposure showed some positive signs
of stabilization as property values improved somewhat from the
declines witnessed over the prior two years. The wholesale portfolio
continues to be actively managed, in part by conducting ongoing,
in-depth reviews of credit quality and of industry, product and client
concentrations. Underwriting guidelines across all areas of lending
have remained in focus, consistent with evolving market conditions
and the Firm’s risk management activities. Reflecting the improve-
ment in credit quality of the wholesale portfolio throughout the
year, the wholesale allowance for loan loss coverage ratio was
2.14%, compared with 3.57% at the end of 2009. For further
discussion of the wholesale credit environment and wholesale
loans, see Wholesale Credit Portfolio on pages 120–129 and Note
14 on pages 220–238 of this Annual Report.
The consumer portfolio credit performance improved from 2009
with lower delinquent loans, nonperforming assets and charge-offs.
However, credit performance continued to be negatively affected by
the economic environment. High unemployment and weak overall
economic conditions continued to have a negative impact in the
number of loans charged off, while continued weak housing prices
have resulted in an elevated severity of loss recognized on de-
faulted real estate loans. The Firm has taken proactive action to
assist homeowners most in need of financial assistance throughout
the economic downturn. The Firm is participating in the U.S. Treas-
ury’s MHA programs and continuing its other loss-mitigation efforts
for financially distressed borrowers who do not qualify for the U.S.
Treasury’s programs. In addition, over the past several years, the
Firm has taken actions to reduce risk exposure to consumer loans
by tightening both underwriting and loan qualification standards,
as well as eliminating certain products and loan origination chan-
nels. For further discussion of the consumer credit environment and
consumer loans, see Consumer Credit Portfolio on pages 129–138
and Note 14 on pages 220–238 of this Annual Report.
CREDIT PORTFOLIO
The following table presents JPMorgan Chase’s credit portfolio as
of December 31, 2010 and 2009. Total credit exposure of $1.8
trillion at December 31, 2010, decreased by $46.9 billion from
December 31, 2009, reflecting a decrease of $83.8 billion in the
consumer portfolio, partly offset by an increase of $36.9 billion in
the wholesale portfolio. During 2010, lending-related commit-
ments decreased by $36.3 billion, loans decreased by $25.2
billion and receivables from customers increased by $16.8 billion.
The overall decrease in total loans was primarily related to re-
payments, low customer demand and loan sales, partially offset
by the adoption of the accounting guidance related to VIEs,
predominantly in the wholesale portfolio.
While overall portfolio exposure declined, the Firm provided and
raised nearly $1.4 trillion in new and renewed credit and capital
for consumers, corporations, small businesses, municipalities and
not-for-profit organizations during 2010.
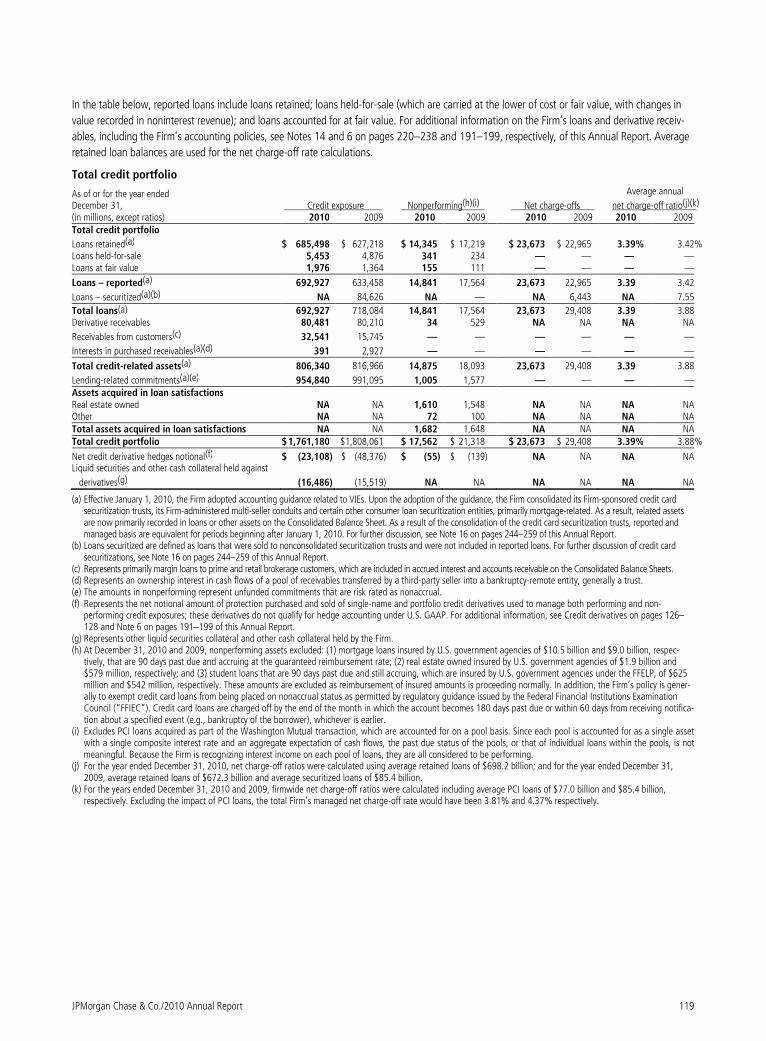
JPMorgan Chase & Co./2010 Annual Report 119
In the table below, reported loans include loans retained; loans held-for-sale (which are carried at the lower of cost or fair value, with changes in
value recorded in noninterest revenue); and loans accounted for at fair value. For additional information on the Firm’s loans and derivative receiv-
ables, including the Firm’s accounting policies, see Notes 14 and 6 on pages 220–238 and 191–199, respectively, of this Annual Report. Average
retained loan balances are used for the net charge-off rate calculations.
Total credit portfolio
As of or for the year ended December 31, Credit exposure Nonperforming(h)(i) Net charge-offs
Average annual
net charge-off ratio(j)(k) (in millions, except ratios) 2010 2009 2010 2009 2010 2009 2010 2009 Total credit portfolio
Loans retained(a) $ 685,498 $ 627,218 $ 14,345 $ 17,219 $ 23,673 $ 22,965 3.39% 3.42% Loans held-for-sale 5,453 4,876 341 234 — — — — Loans at fair value 1,976 1,364 155 111 — — — —
Loans – reported(a) 692,927 633,458 14,841 17,564 23,673 22,965 3.39 3.42
Loans – securitized(a)(b) NA 84,626 NA — NA 6,443 NA 7.55
Total loans(a) 692,927 718,084 14,841 17,564 23,673 29,408 3.39 3.88Derivative receivables 80,481 80,210 34 529 NA NA NA NA
Receivables from customers(c) 32,541 15,745 — — — — — —
Interests in purchased receivables(a)(d) 391 2,927 — — — — — —
Total credit-related assets(a) 806,340 816,966 14,875 18,093 23,673 29,408 3.39 3.88
Lending-related commitments(a)(e) 954,840 991,095 1,005 1,577 — — — — Assets acquired in loan satisfactions Real estate owned NA NA 1,610 1,548 NA NA NA NA Other NA NA 72 100 NA NA NA NA Total assets acquired in loan satisfactions NA NA 1,682 1,648 NA NA NA NA Total credit portfolio $ 1,761,180 $1,808,061 $ 17,562 $ 21,318 $ 23,673 $ 29,408 3.39% 3.88%
Net credit derivative hedges notional(f) $ (23,108) $ (48,376) $ (55) $ (139) NA NA NA NALiquid securities and other cash collateral held against
derivatives(g) (16,486) (15,519) NA NA NA NA NA NA
(a) Effective January 1, 2010, the Firm adopted accounting guidance related to VIEs. Upon the adoption of the guidance, the Firm consolidated its Firm-sponsored credit card securitization trusts, its Firm-administered multi-seller conduits and certain other consumer loan securitization entities, primarily mortgage-related. As a result, related assets are now primarily recorded in loans or other assets on the Consolidated Balance Sheet. As a result of the consolidation of the credit card securitization trusts, reported and managed basis are equivalent for periods beginning after January 1, 2010. For further discussion, see Note 16 on pages 244–259 of this Annual Report.
(b) Loans securitized are defined as loans that were sold to nonconsolidated securitization trusts and were not included in reported loans. For further discussion of credit card securitizations, see Note 16 on pages 244–259 of this Annual Report.
(c) Represents primarily margin loans to prime and retail brokerage customers, which are included in accrued interest and accounts receivable on the Consolidated Balance Sheets. (d) Represents an ownership interest in cash flows of a pool of receivables transferred by a third-party seller into a bankruptcy-remote entity, generally a trust. (e) The amounts in nonperforming represent unfunded commitments that are risk rated as nonaccrual. (f) Represents the net notional amount of protection purchased and sold of single-name and portfolio credit derivatives used to manage both performing and non-
performing credit exposures; these derivatives do not qualify for hedge accounting under U.S. GAAP. For additional information, see Credit derivatives on pages 126–128 and Note 6 on pages 191–199 of this Annual Report.
(g) Represents other liquid securities collateral and other cash collateral held by the Firm. (h) At December 31, 2010 and 2009, nonperforming assets excluded: (1) mortgage loans insured by U.S. government agencies of $10.5 billion and $9.0 billion, respec-
tively, that are 90 days past due and accruing at the guaranteed reimbursement rate; (2) real estate owned insured by U.S. government agencies of $1.9 billion and $579 million, respectively; and (3) student loans that are 90 days past due and still accruing, which are insured by U.S. government agencies under the FFELP, of $625 million and $542 million, respectively. These amounts are excluded as reimbursement of insured amounts is proceeding normally. In addition, the Firm’s policy is gener-ally to exempt credit card loans from being placed on nonaccrual status as permitted by regulatory guidance issued by the Federal Financial Institutions Examination Council (“FFIEC”). Credit card loans are charged off by the end of the month in which the account becomes 180 days past due or within 60 days from receiving notifica-tion about a specified event (e.g., bankruptcy of the borrower), whichever is earlier.
(i) Excludes PCI loans acquired as part of the Washington Mutual transaction, which are accounted for on a pool basis. Since each pool is accounted for as a single asset with a single composite interest rate and an aggregate expectation of cash flows, the past due status of the pools, or that of individual loans within the pools, is not meaningful. Because the Firm is recognizing interest income on each pool of loans, they are all considered to be performing.
(j) For the year ended December 31, 2010, net charge-off ratios were calculated using average retained loans of $698.2 billion; and for the year ended December 31, 2009, average retained loans of $672.3 billion and average securitized loans of $85.4 billion.
(k) For the years ended December 31, 2010 and 2009, firmwide net charge-off ratios were calculated including average PCI loans of $77.0 billion and $85.4 billion, respectively. Excluding the impact of PCI loans, the total Firm’s managed net charge-off rate would have been 3.81% and 4.37% respectively.
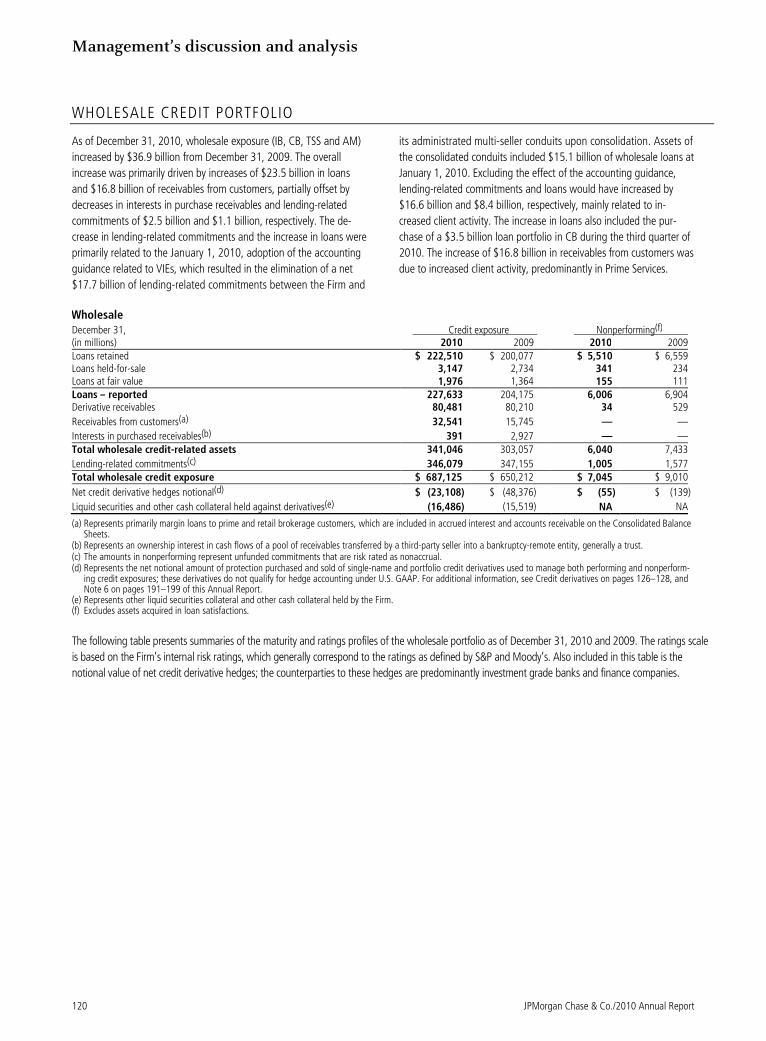
Management’s discussion and analysis
120 JPMorgan Chase & Co./2010 Annual Report
WHOLESALE CREDIT PORTFOLIO
As of December 31, 2010, wholesale exposure (IB, CB, TSS and AM)
increased by $36.9 billion from December 31, 2009. The overall
increase was primarily driven by increases of $23.5 billion in loans
and $16.8 billion of receivables from customers, partially offset by
decreases in interests in purchase receivables and lending-related
commitments of $2.5 billion and $1.1 billion, respectively. The de-
crease in lending-related commitments and the increase in loans were
primarily related to the January 1, 2010, adoption of the accounting
guidance related to VIEs, which resulted in the elimination of a net
$17.7 billion of lending-related commitments between the Firm and
its administrated multi-seller conduits upon consolidation. Assets of
the consolidated conduits included $15.1 billion of wholesale loans at
January 1, 2010. Excluding the effect of the accounting guidance,
lending-related commitments and loans would have increased by
$16.6 billion and $8.4 billion, respectively, mainly related to in-
creased client activity. The increase in loans also included the pur-
chase of a $3.5 billion loan portfolio in CB during the third quarter of
2010. The increase of $16.8 billion in receivables from customers was
due to increased client activity, predominantly in Prime Services.
Wholesale
December 31, Credit exposure Nonperforming(f)
(in millions) 2010 2009 2010 2009 Loans retained $ 222,510 $ 200,077 $ 5,510 $ 6,559 Loans held-for-sale 3,147 2,734 341 234 Loans at fair value 1,976 1,364 155 111 Loans – reported 227,633 204,175 6,006 6,904 Derivative receivables 80,481 80,210 34 529
Receivables from customers(a) 32,541 15,745 — —
Interests in purchased receivables(b) 391 2,927 — — Total wholesale credit-related assets 341,046 303,057 6,040 7,433
Lending-related commitments(c) 346,079 347,155 1,005 1,577 Total wholesale credit exposure $ 687,125 $ 650,212 $ 7,045 $ 9,010
Net credit derivative hedges notional(d) $ (23,108) $ (48,376) $ (55) $ (139)
Liquid securities and other cash collateral held against derivatives(e) (16,486) (15,519) NA NA
(a) Represents primarily margin loans to prime and retail brokerage customers, which are included in accrued interest and accounts receivable on the Consolidated Balance Sheets.
(b) Represents an ownership interest in cash flows of a pool of receivables transferred by a third-party seller into a bankruptcy-remote entity, generally a trust. (c) The amounts in nonperforming represent unfunded commitments that are risk rated as nonaccrual. (d) Represents the net notional amount of protection purchased and sold of single-name and portfolio credit derivatives used to manage both performing and nonperform-
ing credit exposures; these derivatives do not qualify for hedge accounting under U.S. GAAP. For additional information, see Credit derivatives on pages 126–128, and Note 6 on pages 191–199 of this Annual Report.
(e) Represents other liquid securities collateral and other cash collateral held by the Firm. (f) Excludes assets acquired in loan satisfactions.
The following table presents summaries of the maturity and ratings profiles of the wholesale portfolio as of December 31, 2010 and 2009. The ratings scale
is based on the Firm’s internal risk ratings, which generally correspond to the ratings as defined by S&P and Moody’s. Also included in this table is the
notional value of net credit derivative hedges; the counterparties to these hedges are predominantly investment grade banks and finance companies.
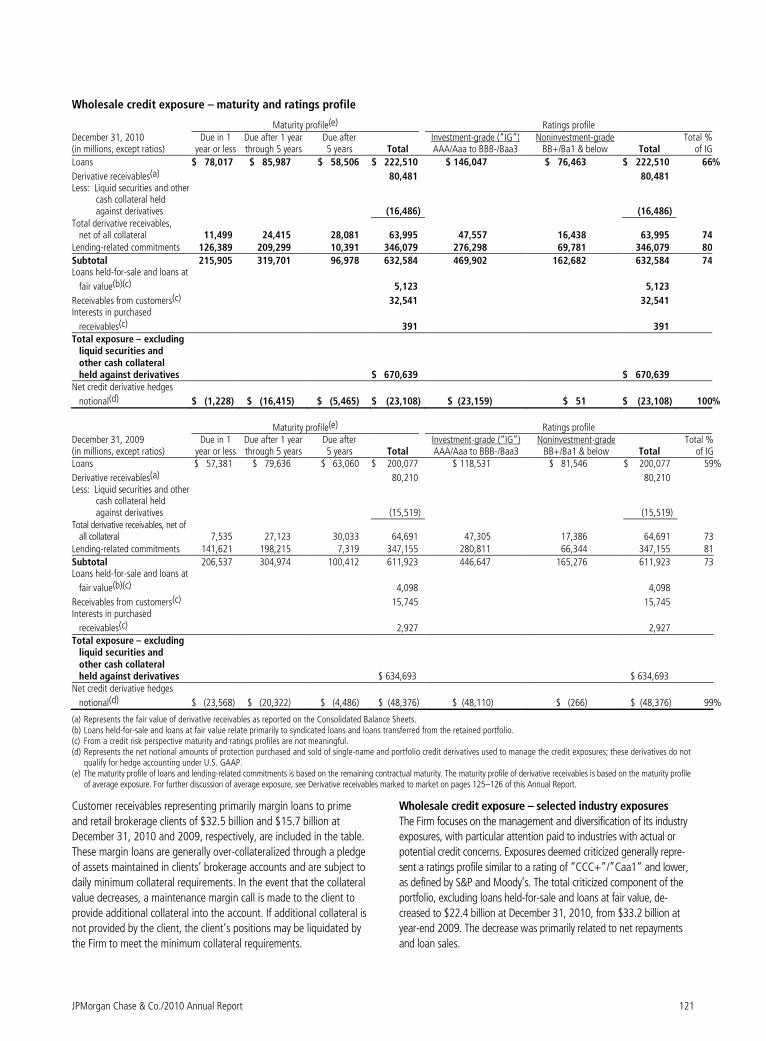
JPMorgan Chase & Co./2010 Annual Report 121
Wholesale credit exposure – maturity and ratings profile
Maturity profile(e) Ratings profile
December 31, 2010
(in millions, except ratios) Due in 1
year or less Due after 1 year through 5 years
Due after 5 years Total
Investment-grade (“IG”) AAA/Aaa to BBB-/Baa3
Noninvestment-grade BB+/Ba1 & below Total
Total % of IG
Loans $ 78,017 $ 85,987 $ 58,506 $ 222,510 $ 146,047 $ 76,463 $ 222,510 66%
Derivative receivables(a) 80,481
80,481 Less: Liquid securities and other
cash collateral held against derivatives
(16,486)
(16,486)
Total derivative receivables, net of all collateral 11,499 24,415 28,081 63,995 47,557 16,438 63,995 74
Lending-related commitments
126,389 209,299 10,391 346,079 276,298 69,781 346,079 80
Subtotal 215,905 319,701 96,978 632,584 469,902 162,682 632,584 74 Loans held-for-sale and loans at
fair value(b)(c) 5,123 5,123
Receivables from customers(c) 32,541 32,541 Interests in purchased
receivables(c) 391 391 Total exposure – excluding
liquid securities and other cash collateral held against derivatives $ 670,639 $ 670,639
Net credit derivative hedges
notional(d) $ (1,228) $ (16,415) $ (5,465) $ (23,108) $ (23,159) $ 51 $ (23,108) 100%
Maturity profile(e) Ratings profile
December 31, 2009
(in millions, except ratios) Due in 1
year or less Due after 1 year through 5 years
Due after 5 years Total
Investment-grade (“IG”) AAA/Aaa to BBB-/Baa3
Noninvestment-grade BB+/Ba1 & below Total
Total % of IG
Loans $ 57,381 $ 79,636 $ 63,060 $ 200,077 $ 118,531 $ 81,546 $ 200,077 59%
Derivative receivables(a) 80,210
80,210 Less: Liquid securities and other
cash collateral held against derivatives
(15,519)
(15,519)
Total derivative receivables, net of all collateral 7,535 27,123 30,033 64,691 47,305 17,386 64,691 73
Lending-related commitments
141,621 198,215 7,319 347,155 280,811 66,344 347,155 81
Subtotal 206,537 304,974 100,412 611,923 446,647 165,276 611,923 73 Loans held-for-sale and loans at
fair value(b)(c) 4,098 4,098
Receivables from customers(c) 15,745 15,745 Interests in purchased
receivables(c) 2,927 2,927 Total exposure – excluding
liquid securities and other cash collateral held against derivatives $ 634,693 $ 634,693
Net credit derivative hedges
notional(d) $ (23,568) $ (20,322) $ (4,486) $ (48,376) $ (48,110) $ (266) $ (48,376) 99%
(a) Represents the fair value of derivative receivables as reported on the Consolidated Balance Sheets. (b) Loans held-for-sale and loans at fair value relate primarily to syndicated loans and loans transferred from the retained portfolio. (c) From a credit risk perspective maturity and ratings profiles are not meaningful. (d) Represents the net notional amounts of protection purchased and sold of single-name and portfolio credit derivatives used to manage the credit exposures; these derivatives do not
qualify for hedge accounting under U.S. GAAP. (e) The maturity profile of loans and lending-related commitments is based on the remaining contractual maturity. The maturity profile of derivative receivables is based on the maturity profile
of average exposure. For further discussion of average exposure, see Derivative receivables marked to market on pages 125–126 of this Annual Report.
Customer receivables representing primarily margin loans to prime
and retail brokerage clients of $32.5 billion and $15.7 billion at
December 31, 2010 and 2009, respectively, are included in the table.
These margin loans are generally over-collateralized through a pledge
of assets maintained in clients’ brokerage accounts and are subject to
daily minimum collateral requirements. In the event that the collateral
value decreases, a maintenance margin call is made to the client to
provide additional collateral into the account. If additional collateral is
not provided by the client, the client’s positions may be liquidated by
the Firm to meet the minimum collateral requirements.
Wholesale credit exposure – selected industry exposures
The Firm focuses on the management and diversification of its industry
exposures, with particular attention paid to industries with actual or
potential credit concerns. Exposures deemed criticized generally repre-
sent a ratings profile similar to a rating of “CCC+”/”Caa1” and lower,
as defined by S&P and Moody’s. The total criticized component of the
portfolio, excluding loans held-for-sale and loans at fair value, de-
creased to $22.4 billion at December 31, 2010, from $33.2 billion at
year-end 2009. The decrease was primarily related to net repayments
and loan sales.
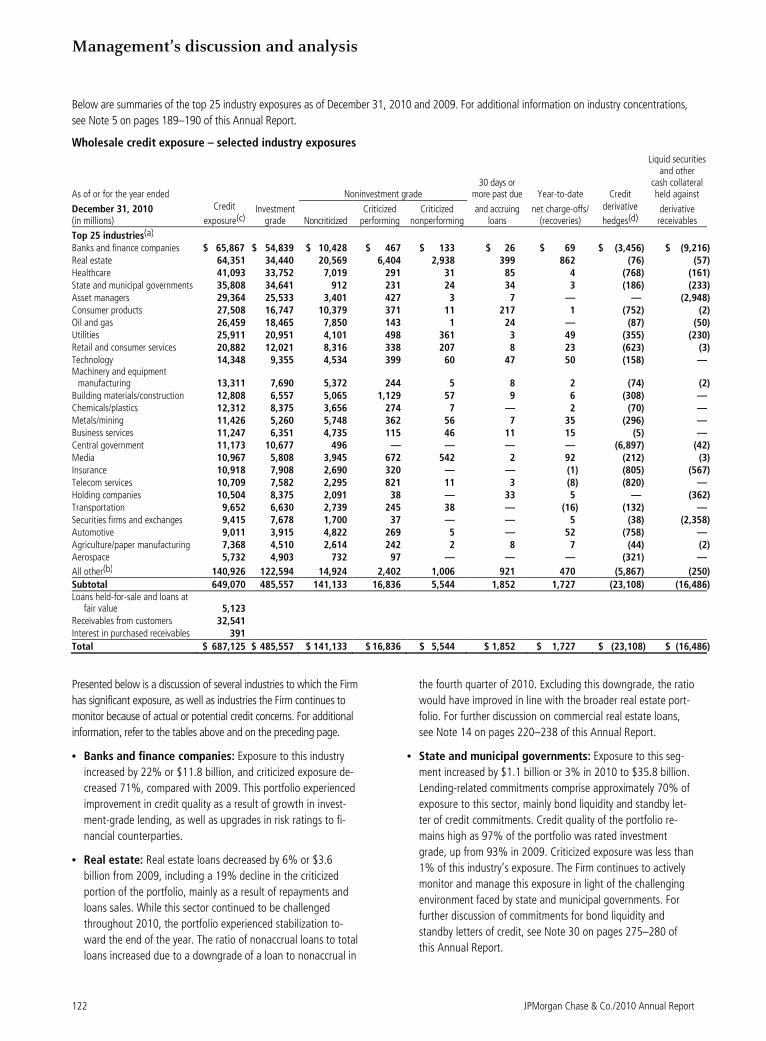
Management’s discussion and analysis
122 JPMorgan Chase & Co./2010 Annual Report
Below are summaries of the top 25 industry exposures as of December 31, 2010 and 2009. For additional information on industry concentrations,
see Note 5 on pages 189–190 of this Annual Report.
Wholesale credit exposure – selected industry exposures
Liquid securities
and other 30 days or cash collateral As of or for the year ended Noninvestment grade more past due Year-to-date Credit held against
December 31, 2010 (in millions)
Credit
exposure(c) Investment
grade Noncriticized Criticized
performing Criticized
nonperforming and accruing
loans net charge-offs/
(recoveries)
derivative
hedges(d) derivative receivables
Top 25 industries(a) Banks and finance companies $ 65,867 $ 54,839 $ 10,428 $ 467 $ 133 $ 26 $ 69 $ (3,456) $ (9,216) Real estate 64,351 34,440 20,569 6,404 2,938 399 862 (76) (57) Healthcare 41,093 33,752 7,019 291 31 85 4 (768) (161) State and municipal governments 35,808 34,641 912 231 24 34 3 (186) (233) Asset managers 29,364 25,533 3,401 427 3 7 — — (2,948) Consumer products 27,508 16,747 10,379 371 11 217 1 (752) (2) Oil and gas 26,459 18,465 7,850 143 1 24 — (87) (50) Utilities 25,911 20,951 4,101 498 361 3 49 (355) (230) Retail and consumer services 20,882 12,021 8,316 338 207 8 23 (623) (3) Technology 14,348 9,355 4,534 399 60 47 50 (158) — Machinery and equipment
manufacturing 13,311 7,690 5,372 244 5 8 2 (74) (2) Building materials/construction 12,808 6,557 5,065 1,129 57 9 6 (308) — Chemicals/plastics 12,312 8,375 3,656 274 7 — 2 (70) — Metals/mining 11,426 5,260 5,748 362 56 7 35 (296) — Business services 11,247 6,351 4,735 115 46 11 15 (5) — Central government 11,173 10,677 496 — — — — (6,897) (42) Media 10,967 5,808 3,945 672 542 2 92 (212) (3) Insurance 10,918 7,908 2,690 320 — — (1) (805) (567) Telecom services 10,709 7,582 2,295 821 11 3 (8) (820) — Holding companies 10,504 8,375 2,091 38 — 33 5 — (362) Transportation 9,652 6,630 2,739 245 38 — (16) (132) — Securities firms and exchanges 9,415 7,678 1,700 37 — — 5 (38) (2,358) Automotive 9,011 3,915 4,822 269 5 — 52 (758) — Agriculture/paper manufacturing 7,368 4,510 2,614 242 2 8 7 (44) (2) Aerospace 5,732 4,903 732 97 — — — (321) —
All other(b) 140,926 122,594 14,924 2,402 1,006 921 470 (5,867) (250)
Subtotal 649,070 485,557 141,133 16,836 5,544 1,852 1,727 (23,108) (16,486) Loans held-for-sale and loans at
fair value 5,123 Receivables from customers 32,541 Interest in purchased receivables 391
Total $ 687,125 $ 485,557 $ 141,133 $ 16,836 $ 5,544 $ 1,852 $ 1,727 $ (23,108) $ (16,486)
Presented below is a discussion of several industries to which the Firm
has significant exposure, as well as industries the Firm continues to
monitor because of actual or potential credit concerns. For additional
information, refer to the tables above and on the preceding page.
• Banks and finance companies: Exposure to this industry
increased by 22% or $11.8 billion, and criticized exposure de-
creased 71%, compared with 2009. This portfolio experienced
improvement in credit quality as a result of growth in invest-
ment-grade lending, as well as upgrades in risk ratings to fi-
nancial counterparties.
• Real estate: Real estate loans decreased by 6% or $3.6
billion from 2009, including a 19% decline in the criticized
portion of the portfolio, mainly as a result of repayments and
loans sales. While this sector continued to be challenged
throughout 2010, the portfolio experienced stabilization to-
ward the end of the year. The ratio of nonaccrual loans to total
loans increased due to a downgrade of a loan to nonaccrual in
the fourth quarter of 2010. Excluding this downgrade, the ratio
would have improved in line with the broader real estate port-
folio. For further discussion on commercial real estate loans,
see Note 14 on pages 220–238 of this Annual Report.
• State and municipal governments: Exposure to this seg-
ment increased by $1.1 billion or 3% in 2010 to $35.8 billion.
Lending-related commitments comprise approximately 70% of
exposure to this sector, mainly bond liquidity and standby let-
ter of credit commitments. Credit quality of the portfolio re-
mains high as 97% of the portfolio was rated investment
grade, up from 93% in 2009. Criticized exposure was less than
1% of this industry’s exposure. The Firm continues to actively
monitor and manage this exposure in light of the challenging
environment faced by state and municipal governments. For
further discussion of commitments for bond liquidity and
standby letters of credit, see Note 30 on pages 275–280 of
this Annual Report.
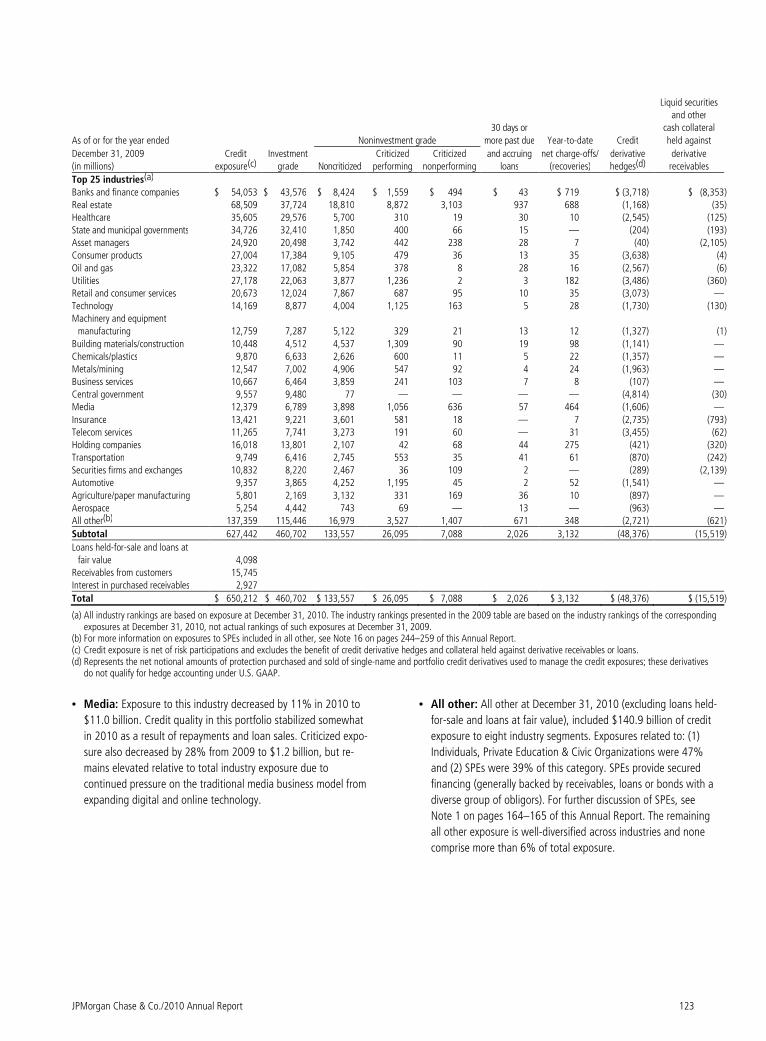
JPMorgan Chase & Co./2010 Annual Report 123
Liquid securities
and other 30 days or cash collateral
As of or for the year ended Noninvestment grade more past due Year-to-date Credit held against
December 31, 2009 (in millions)
Credit exposure(c)
Investment grade Noncriticized
Criticized performing
Criticized nonperforming
and accruing loans
net charge-offs/ (recoveries)
derivative hedges(d)
derivative receivables
Top 25 industries(a)
Banks and finance companies $ 54,053 $ 43,576 $ 8,424 $ 1,559 $ 494 $ 43 $ 719 $ (3,718) $ (8,353 ) Real estate 68,509 37,724 18,810 8,872 3,103 937 688 (1,168) (35 ) Healthcare 35,605 29,576 5,700 310 19 30 10 (2,545) (125 ) State and municipal governments 34,726 32,410 1,850 400 66 15 — (204) (193 ) Asset managers 24,920 20,498 3,742 442 238 28 7 (40) (2,105 ) Consumer products 27,004 17,384 9,105 479 36 13 35 (3,638) (4 )
Oil and gas 23,322 17,082 5,854 378 8 28 16 (2,567) (6 ) Utilities 27,178 22,063 3,877 1,236 2 3 182 (3,486) (360 ) Retail and consumer services 20,673 12,024 7,867 687 95 10 35 (3,073) — Technology 14,169 8,877 4,004 1,125 163 5 28 (1,730) (130 ) Machinery and equipment manufacturing 12,759 7,287 5,122 329 21 13 12 (1,327) (1 )
Building materials/construction 10,448 4,512 4,537 1,309 90 19 98 (1,141) — Chemicals/plastics 9,870 6,633 2,626 600 11 5 22 (1,357) — Metals/mining 12,547 7,002 4,906 547 92 4 24 (1,963) — Business services 10,667 6,464 3,859 241 103 7 8 (107) — Central government 9,557 9,480 77 — — — — (4,814) (30 ) Media 12,379 6,789 3,898 1,056 636 57 464 (1,606) —
Insurance 13,421 9,221 3,601 581 18 — 7 (2,735) (793 ) Telecom services 11,265 7,741 3,273 191 60 — 31 (3,455) (62 ) Holding companies 16,018 13,801 2,107 42 68 44 275 (421) (320 ) Transportation 9,749 6,416 2,745 553 35 41 61 (870) (242 ) Securities firms and exchanges 10,832 8,220 2,467 36 109 2 — (289) (2,139 ) Automotive 9,357 3,865 4,252 1,195 45 2 52 (1,541) —
Agriculture/paper manufacturing 5,801 2,169 3,132 331 169 36 10 (897) — Aerospace 5,254 4,442 743 69 — 13 — (963) — All other(b) 137,359 115,446 16,979 3,527 1,407 671 348 (2,721) (621 )
Subtotal 627,442 460,702 133,557 26,095 7,088 2,026 3,132 (48,376) (15,519 )
Loans held-for-sale and loans at fair value 4,098
Receivables from customers 15,745 Interest in purchased receivables 2,927
Total $ 650,212 $ 460,702 $ 133,557 $ 26,095 $ 7,088 $ 2,026 $ 3,132 $ (48,376) $ (15,519 )
(a) All industry rankings are based on exposure at December 31, 2010. The industry rankings presented in the 2009 table are based on the industry rankings of the corresponding exposures at December 31, 2010, not actual rankings of such exposures at December 31, 2009.
(b) For more information on exposures to SPEs included in all other, see Note 16 on pages 244–259 of this Annual Report. (c) Credit exposure is net of risk participations and excludes the benefit of credit derivative hedges and collateral held against derivative receivables or loans. (d) Represents the net notional amounts of protection purchased and sold of single-name and portfolio credit derivatives used to manage the credit exposures; these derivatives
do not qualify for hedge accounting under U.S. GAAP.
• Media: Exposure to this industry decreased by 11% in 2010 to
$11.0 billion. Credit quality in this portfolio stabilized somewhat
in 2010 as a result of repayments and loan sales. Criticized expo-
sure also decreased by 28% from 2009 to $1.2 billion, but re-
mains elevated relative to total industry exposure due to
continued pressure on the traditional media business model from
expanding digital and online technology.
• All other: All other at December 31, 2010 (excluding loans held-
for-sale and loans at fair value), included $140.9 billion of credit
exposure to eight industry segments. Exposures related to: (1)
Individuals, Private Education & Civic Organizations were 47%
and (2) SPEs were 39% of this category. SPEs provide secured
financing (generally backed by receivables, loans or bonds with a
diverse group of obligors). For further discussion of SPEs, see
Note 1 on pages 164–165 of this Annual Report. The remaining
all other exposure is well-diversified across industries and none
comprise more than 6% of total exposure.
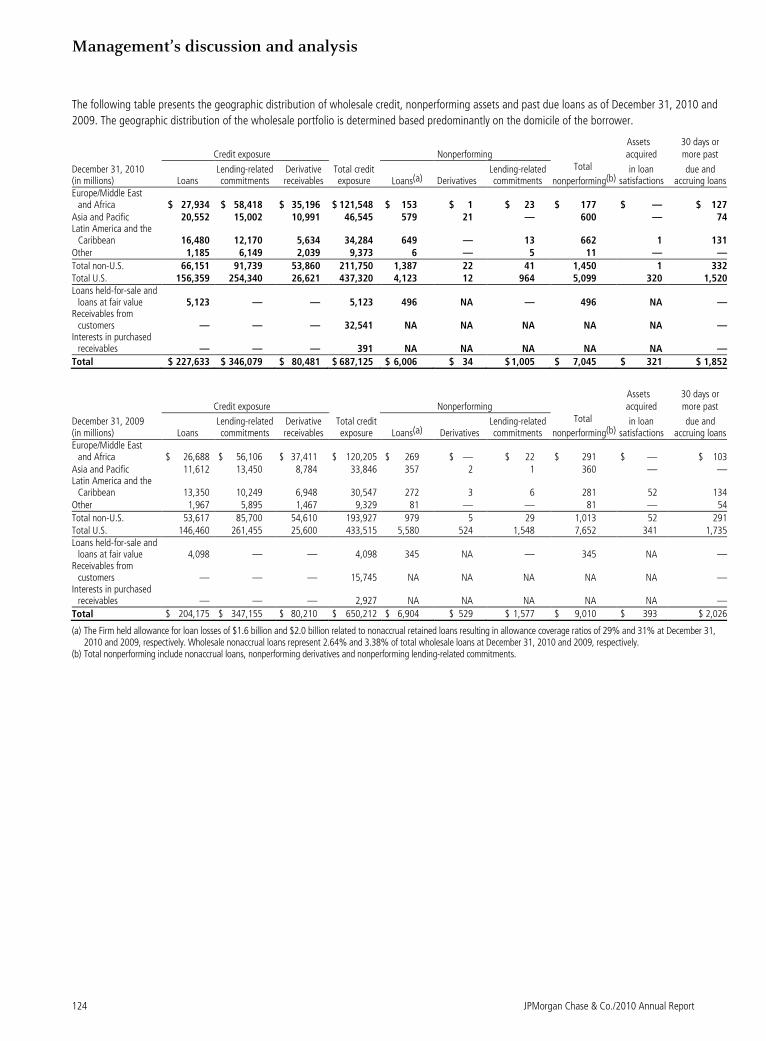
Management’s discussion and analysis
124 JPMorgan Chase & Co./2010 Annual Report
The following table presents the geographic distribution of wholesale credit, nonperforming assets and past due loans as of December 31, 2010 and
2009. The geographic distribution of the wholesale portfolio is determined based predominantly on the domicile of the borrower.
Assets 30 days or Credit exposure Nonperforming acquired more past
December 31, 2010 (in millions) Loans
Lending-related commitments
Derivative receivables
Total credit exposure Loans(a) Derivatives
Lending-related commitments
Total
nonperforming(b) in loan
satisfactions due and accruing loans
Europe/Middle East and Africa
$ 27,934 $ 58,418 $ 35,196 $ 121,548 $ 153 $ 1 $ 23 $ 177 $ — $ 127
Asia and Pacific 20,552 15,002 10,991 46,545 579 21 — 600 — 74Latin America and the
Caribbean 16,480 12,170 5,634 34,284 649 — 13 662 1 131Other 1,185 6,149 2,039 9,373 6 — 5 11 — —
Total non-U.S. 66,151 91,739 53,860 211,750 1,387 22 41 1,450 1 332Total U.S. 156,359 254,340 26,621 437,320 4,123 12 964 5,099 320 1,520Loans held-for-sale and
loans at fair value 5,123 — — 5,123 496 NA — 496 NA —Receivables from
customers — — — 32,541 NA NA NA NA NA —Interests in purchased
receivables — — — 391 NA NA NA NA NA —
Total $ 227,633 $ 346,079 $ 80,481 $ 687,125 $ 6,006 $ 34 $ 1,005 $ 7,045 $ 321 $ 1,852
Assets 30 days or Credit exposure Nonperforming acquired more past
December 31, 2009 (in millions) Loans
Lending-related commitments
Derivative receivables
Total credit exposure Loans(a) Derivatives
Lending-related commitments
Total
nonperforming(b) in loan
satisfactions due and accruing loans
Europe/Middle East and Africa
$ 26,688 $ 56,106 $ 37,411 $ 120,205 $ 269 $ — $ 22 $ 291 $ — $ 103
Asia and Pacific 11,612 13,450 8,784 33,846 357 2 1 360 — —Latin America and the
Caribbean 13,350 10,249 6,948 30,547 272 3 6 281 52 134Other 1,967 5,895 1,467 9,329 81 — — 81 — 54
Total non-U.S. 53,617 85,700 54,610 193,927 979 5 29 1,013 52 291Total U.S. 146,460 261,455 25,600 433,515 5,580 524 1,548 7,652 341 1,735Loans held-for-sale and
loans at fair value 4,098 — — 4,098 345 NA — 345 NA —Receivables from
customers — — — 15,745 NA NA NA NA NA —Interests in purchased
receivables — — — 2,927 NA NA NA NA NA —
Total $ 204,175 $ 347,155 $ 80,210 $ 650,212 $ 6,904 $ 529 $ 1,577 $ 9,010 $ 393 $ 2,026
(a) The Firm held allowance for loan losses of $1.6 billion and $2.0 billion related to nonaccrual retained loans resulting in allowance coverage ratios of 29% and 31% at December 31, 2010 and 2009, respectively. Wholesale nonaccrual loans represent 2.64% and 3.38% of total wholesale loans at December 31, 2010 and 2009, respectively.
(b) Total nonperforming include nonaccrual loans, nonperforming derivatives and nonperforming lending-related commitments.
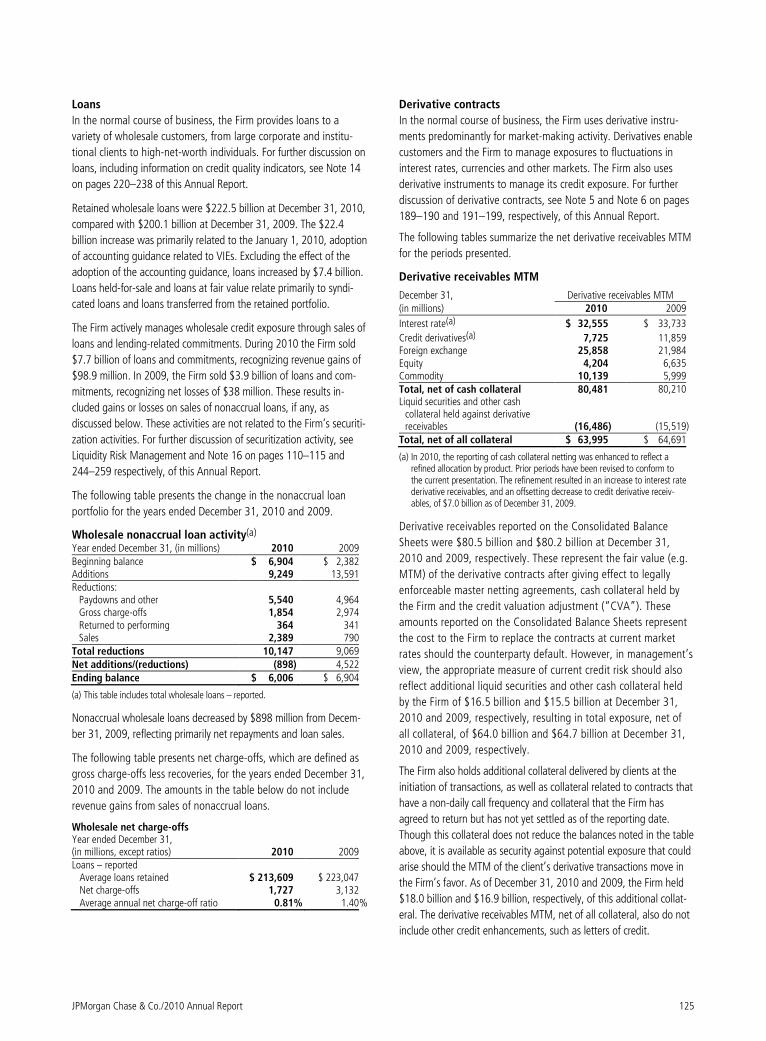
JPMorgan Chase & Co./2010 Annual Report 125
Loans
In the normal course of business, the Firm provides loans to a
variety of wholesale customers, from large corporate and institu-
tional clients to high-net-worth individuals. For further discussion on
loans, including information on credit quality indicators, see Note 14
on pages 220–238 of this Annual Report.
Retained wholesale loans were $222.5 billion at December 31, 2010,
compared with $200.1 billion at December 31, 2009. The $22.4
billion increase was primarily related to the January 1, 2010, adoption
of accounting guidance related to VIEs. Excluding the effect of the
adoption of the accounting guidance, loans increased by $7.4 billion.
Loans held-for-sale and loans at fair value relate primarily to syndi-
cated loans and loans transferred from the retained portfolio.
The Firm actively manages wholesale credit exposure through sales of
loans and lending-related commitments. During 2010 the Firm sold
$7.7 billion of loans and commitments, recognizing revenue gains of
$98.9 million. In 2009, the Firm sold $3.9 billion of loans and com-
mitments, recognizing net losses of $38 million. These results in-
cluded gains or losses on sales of nonaccrual loans, if any, as
discussed below. These activities are not related to the Firm’s securiti-
zation activities. For further discussion of securitization activity, see
Liquidity Risk Management and Note 16 on pages 110–115 and
244–259 respectively, of this Annual Report.
The following table presents the change in the nonaccrual loan
portfolio for the years ended December 31, 2010 and 2009.
Wholesale nonaccrual loan activity(a) Year ended December 31, (in millions) 2010 2009Beginning balance $ 6,904 $ 2,382Additions 9,249 13,591Reductions:
Paydowns and other 5,540 4,964Gross charge-offs 1,854 2,974Returned to performing 364 341Sales 2,389 790
Total reductions 10,147 9,069Net additions/(reductions) (898) 4,522Ending balance $ 6,006 $ 6,904
(a) This table includes total wholesale loans – reported.
Nonaccrual wholesale loans decreased by $898 million from Decem-
ber 31, 2009, reflecting primarily net repayments and loan sales.
The following table presents net charge-offs, which are defined as
gross charge-offs less recoveries, for the years ended December 31,
2010 and 2009. The amounts in the table below do not include
revenue gains from sales of nonaccrual loans.
Wholesale net charge-offs Year ended December 31, (in millions, except ratios) 2010 2009 Loans – reported
Average loans retained $ 213,609 $ 223,047 Net charge-offs 1,727 3,132 Average annual net charge-off ratio 0.81% 1.40 %
Derivative contracts
In the normal course of business, the Firm uses derivative instru-
ments predominantly for market-making activity. Derivatives enable
customers and the Firm to manage exposures to fluctuations in
interest rates, currencies and other markets. The Firm also uses
derivative instruments to manage its credit exposure. For further
discussion of derivative contracts, see Note 5 and Note 6 on pages
189–190 and 191–199, respectively, of this Annual Report.
The following tables summarize the net derivative receivables MTM
for the periods presented.
Derivative receivables MTM
December 31, Derivative receivables MTM (in millions) 2010 2009
Interest rate(a) $ 32,555 $ 33,733
Credit derivatives(a) 7,725 11,859Foreign exchange 25,858 21,984Equity 4,204 6,635Commodity 10,139 5,999Total, net of cash collateral 80,481 80,210Liquid securities and other cash
collateral held against derivative receivables (16,486) (15,519)
Total, net of all collateral $ 63,995 $ 64,691
(a) In 2010, the reporting of cash collateral netting was enhanced to reflect a refined allocation by product. Prior periods have been revised to conform to the current presentation. The refinement resulted in an increase to interest rate derivative receivables, and an offsetting decrease to credit derivative receiv-ables, of $7.0 billion as of December 31, 2009.
Derivative receivables reported on the Consolidated Balance
Sheets were $80.5 billion and $80.2 billion at December 31,
2010 and 2009, respectively. These represent the fair value (e.g.
MTM) of the derivative contracts after giving effect to legally
enforceable master netting agreements, cash collateral held by
the Firm and the credit valuation adjustment (“CVA”). These
amounts reported on the Consolidated Balance Sheets represent
the cost to the Firm to replace the contracts at current market
rates should the counterparty default. However, in management’s
view, the appropriate measure of current credit risk should also
reflect additional liquid securities and other cash collateral held
by the Firm of $16.5 billion and $15.5 billion at December 31,
2010 and 2009, respectively, resulting in total exposure, net of
all collateral, of $64.0 billion and $64.7 billion at December 31,
2010 and 2009, respectively.
The Firm also holds additional collateral delivered by clients at the
initiation of transactions, as well as collateral related to contracts that
have a non-daily call frequency and collateral that the Firm has
agreed to return but has not yet settled as of the reporting date.
Though this collateral does not reduce the balances noted in the table
above, it is available as security against potential exposure that could
arise should the MTM of the client’s derivative transactions move in
the Firm’s favor. As of December 31, 2010 and 2009, the Firm held
$18.0 billion and $16.9 billion, respectively, of this additional collat-
eral. The derivative receivables MTM, net of all collateral, also do not
include other credit enhancements, such as letters of credit.
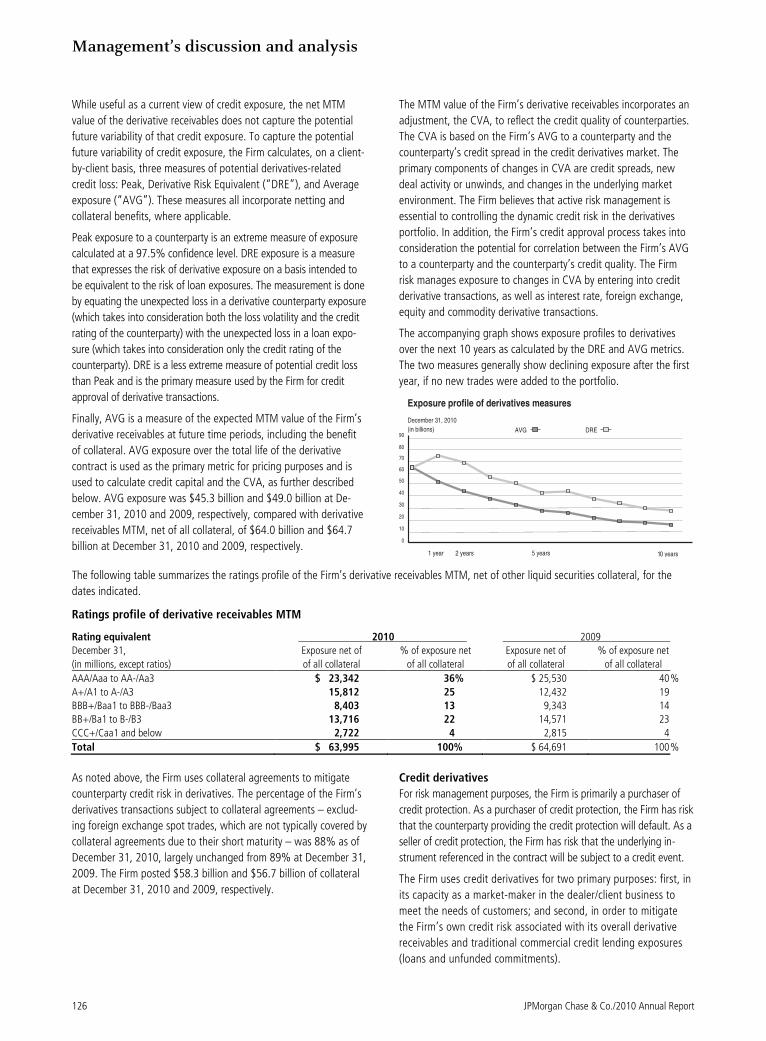
Management’s discussion and analysis
126 JPMorgan Chase & Co./2010 Annual Report
While useful as a current view of credit exposure, the net MTM
value of the derivative receivables does not capture the potential
future variability of that credit exposure. To capture the potential
future variability of credit exposure, the Firm calculates, on a client-
by-client basis, three measures of potential derivatives-related
credit loss: Peak, Derivative Risk Equivalent (“DRE”), and Average
exposure (“AVG”). These measures all incorporate netting and
collateral benefits, where applicable.
Peak exposure to a counterparty is an extreme measure of exposure
calculated at a 97.5% confidence level. DRE exposure is a measure
that expresses the risk of derivative exposure on a basis intended to
be equivalent to the risk of loan exposures. The measurement is done
by equating the unexpected loss in a derivative counterparty exposure
(which takes into consideration both the loss volatility and the credit
rating of the counterparty) with the unexpected loss in a loan expo-
sure (which takes into consideration only the credit rating of the
counterparty). DRE is a less extreme measure of potential credit loss
than Peak and is the primary measure used by the Firm for credit
approval of derivative transactions.
Finally, AVG is a measure of the expected MTM value of the Firm’s
derivative receivables at future time periods, including the benefit
of collateral. AVG exposure over the total life of the derivative
contract is used as the primary metric for pricing purposes and is
used to calculate credit capital and the CVA, as further described
below. AVG exposure was $45.3 billion and $49.0 billion at De-
cember 31, 2010 and 2009, respectively, compared with derivative
receivables MTM, net of all collateral, of $64.0 billion and $64.7
billion at December 31, 2010 and 2009, respectively.
The MTM value of the Firm’s derivative receivables incorporates an
adjustment, the CVA, to reflect the credit quality of counterparties.
The CVA is based on the Firm’s AVG to a counterparty and the
counterparty’s credit spread in the credit derivatives market. The
primary components of changes in CVA are credit spreads, new
deal activity or unwinds, and changes in the underlying market
environment. The Firm believes that active risk management is
essential to controlling the dynamic credit risk in the derivatives
portfolio. In addition, the Firm’s credit approval process takes into
consideration the potential for correlation between the Firm’s AVG
to a counterparty and the counterparty’s credit quality. The Firm
risk manages exposure to changes in CVA by entering into credit
derivative transactions, as well as interest rate, foreign exchange,
equity and commodity derivative transactions.
The accompanying graph shows exposure profiles to derivatives
over the next 10 years as calculated by the DRE and AVG metrics.
The two measures generally show declining exposure after the first
year, if no new trades were added to the portfolio.
0
10
20
30
40
50
60
70
80
90
Exposure profile of derivatives measures
December 31, 2010
(in billions) AVG DRE
1 year 2 years 5 years 10 years
The following table summarizes the ratings profile of the Firm’s derivative receivables MTM, net of other liquid securities collateral, for the
dates indicated.
Ratings profile of derivative receivables MTM
Rating equivalent 2010 2009
December 31, Exposure net of % of exposure net Exposure net of % of exposure net
(in millions, except ratios) of all collateral of all collateral of all collateral of all collateral
AAA/Aaa to AA-/Aa3 $ 23,342 36% $ 25,530 40 %
A+/A1 to A-/A3 15,812 25 12,432 19
BBB+/Baa1 to BBB-/Baa3 8,403 13 9,343 14
BB+/Ba1 to B-/B3 13,716 22 14,571 23
CCC+/Caa1 and below 2,722 4 2,815 4
Total $ 63,995 100% $ 64,691 100 %
As noted above, the Firm uses collateral agreements to mitigate
counterparty credit risk in derivatives. The percentage of the Firm’s
derivatives transactions subject to collateral agreements – exclud-
ing foreign exchange spot trades, which are not typically covered by
collateral agreements due to their short maturity – was 88% as of
December 31, 2010, largely unchanged from 89% at December 31,
2009. The Firm posted $58.3 billion and $56.7 billion of collateral
at December 31, 2010 and 2009, respectively.
Credit derivatives
For risk management purposes, the Firm is primarily a purchaser of
credit protection. As a purchaser of credit protection, the Firm has risk
that the counterparty providing the credit protection will default. As a
seller of credit protection, the Firm has risk that the underlying in-
strument referenced in the contract will be subject to a credit event.
The Firm uses credit derivatives for two primary purposes: first, in
its capacity as a market-maker in the dealer/client business to
meet the needs of customers; and second, in order to mitigate
the Firm’s own credit risk associated with its overall derivative
receivables and traditional commercial credit lending exposures
(loans and unfunded commitments).
JPMorgan Chase & Co./2010 Annual Report 127
Of the Firm’s $80.5 billion of total derivative receivables MTM at
December 31, 2010, $7.7 billion, or 10%, was associated with
credit derivatives, before the benefit of liquid securities collateral.
One type of credit derivatives the Firm enters into with counterparties
are credit default swaps (“CDS”). The large majority of CDS are
subject to collateral arrangements to protect the Firm from counter-
party credit risk. The use of collateral to settle against defaulting
counterparties generally performed as designed in significantly miti-
gating the Firm’s exposure to these counterparties. In 2010, the
frequency and size of defaults related to the underlying debt refer-
enced in credit derivatives was lower than 2009. For further discus-
sion of derivatives, see Note 6 on pages 191–199 of this Annual
Report.
The following table presents the Firm’s notional amounts of credit
derivatives protection purchased and sold as of December 31, 2010
and 2009, distinguishing between dealer/client activity and credit
portfolio activity.
2010 2009
Dealer/client Credit portfolio Dealer/client Credit portfolio December 31, Protection Protection Protection Protection Protection Protection Protection Protection
(in millions) purchased(b) sold purchased(c) sold Total purchased(b) sold purchased(c) sold TotalCredit default
swaps $ 2,661,657 $ 2,658,825 $ 23,523 $ 415 $ 5,344,420 $ 2,957,277 $ 2,936,987 $ 48,831 $ 455 $ 5,943,550Other credit
derivatives(a) 34,250 93,776 — — 128,026 39,763 10,575 — — 50,338Total $ 2,695,907 $ 2,752,601 $ 23,523 $ 415 $ 5,472,446 $ 2,997,040 $ 2,947,562 $ 48,831 $ 455 $ 5,993,888
(a) Primarily consists of total return swaps and credit default swap options. (b) Included $2,662 billion and $2,987 billion at December 31, 2010 and 2009, respectively, of notional exposure where the Firm has sold protection on the identical
underlying reference instruments. (c) Included zero and $19.7 billion at December 31, 2010 and 2009, respectively, that represented the notional amount for structured portfolio protection; the Firm retains
the first risk of loss on this portfolio.
Dealer/client business Within the dealer/client business, the Firm actively manages credit
derivatives by buying and selling credit protection, predominantly on
corporate debt obligations, according to client demand. For further
information, see Note 6 on pages 191–199 of this Annual Report.
At December 31, 2010, the total notional amount of protection
purchased and sold decreased by $496.1 billion from year-end
2009. The decrease was primarily due to the impact of industry
efforts to reduce offsetting trade activity.
Credit portfolio activities Management of the Firm’s wholesale exposure is accomplished
through a number of means including loan syndication and partici-
pations, loan sales, securitizations, credit derivatives, use of master
netting agreements, and collateral and other risk-reduction tech-
niques. The Firm also manages its wholesale credit exposure by
purchasing protection through single-name and portfolio credit
derivatives to manage the credit risk associated with loans, lend-
ing-related commitments and derivative receivables. Changes in
credit risk on the credit derivatives are expected to offset changes
in credit risk on the loans, lending-related commitments or deriva-
tive receivables. This activity does not reduce the reported level of
assets on the balance sheet or the level of reported off–balance
sheet commitments, although it does provide the Firm with credit
risk protection. The Firm also diversifies its exposures by selling
credit protection, which increases exposure to industries or clients
where the Firm has little or no client-related exposure; however,
this activity is not material to the Firm’s overall credit exposure.
Use of single-name and portfolio credit derivatives
Notional amount of protection purchased and sold
December 31, (in millions) 2010 2009Credit derivatives used to manage Loans and lending-related commitments $ 6,698 $ 36,873Derivative receivables 16,825 11,958
Total protection purchased(a) 23,523 48,831Total protection sold 415 455Credit derivatives hedges notional, net $23,108 $ 48,376
(a) Included zero and $19.7 billion at December 31, 2010 and 2009, respec-tively, that represented the notional amount for structured portfolio protec-tion; the Firm retains the first risk of loss on this portfolio.
The credit derivatives used by JPMorgan Chase for credit portfolio
management activities do not qualify for hedge accounting under
U.S. GAAP; these derivatives are reported at fair value, with gains
and losses recognized in principal transactions revenue. In contrast,
the loans and lending-related commitments being risk-managed are
accounted for on an accrual basis. This asymmetry in accounting
treatment, between loans and lending-related commitments and
the credit derivatives used in credit portfolio management activities,
causes earnings volatility that is not representative, in the Firm’s
view, of the true changes in value of the Firm’s overall credit expo-
sure. The MTM value related to the Firm’s credit derivatives used
for managing credit exposure, as well as the MTM value related to
the CVA (which reflects the credit quality of derivatives counter-
party exposure) are included in the gains and losses realized on
credit derivatives disclosed in the table below. These results can
vary from period to period due to market conditions that affect
specific positions in the portfolio.
Management’s discussion and analysis
128 JPMorgan Chase & Co./2010 Annual Report
Year ended December 31,
(in millions) 2010 2009 2008
Hedges of lending-related commitments(a) $ (279) $ (3,258) $ 2,216
CVA and hedges of CVA(a) (403) 1,920 (2,359))
Net gains/(losses) $ (682) $ (1,338) $ (143))
(a) These hedges do not qualify for hedge accounting under U.S. GAAP.
Lending-related commitments
JPMorgan Chase uses lending-related financial instruments, such as
commitments and guarantees, to meet the financing needs of its
customers. The contractual amount of these financial instruments
represents the maximum possible credit risk should the counterpar-
ties draw down on these commitments or the Firm fulfills its obliga-
tion under these guarantees, and should the counterparties
subsequently fail to perform according to the terms of these con-
tracts.
Wholesale lending-related commitments were $346.1 billion at
December 31, 2010, compared with $347.2 billion at December
31, 2009. The decrease reflected the January 1, 2010, adoption of
accounting guidance related to VIEs. Excluding the effect of the
accounting guidance, lending-related commitments would have
increased by $16.6 billion.
In the Firm’s view, the total contractual amount of these wholesale
lending-related commitments is not representative of the Firm’s
actual credit risk exposure or funding requirements. In determining
the amount of credit risk exposure the Firm has to wholesale lend-
ing-related commitments, which is used as the basis for allocating
credit risk capital to these commitments, the Firm has established a
“loan-equivalent” amount for each commitment; this amount
represents the portion of the unused commitment or other contin-
gent exposure that is expected, based on average portfolio histori-
cal experience, to become drawn upon in an event of a default by
an obligor. The loan-equivalent amounts of the Firm’s lending-
related commitments were $189.9 billion and $179.8 billion as of
December 31, 2010 and 2009, respectively.
Country exposure The Firm’s wholesale portfolio includes country risk exposures to
both developed and emerging markets. The Firm seeks to diversify
its country exposures, including its credit-related lending, trading
and investment activities, whether cross-border or locally funded.
Country exposure under the Firm’s internal risk management ap-
proach is reported based on the country where the assets of the
obligor, counterparty or guarantor are located. Exposure amounts,
including resale agreements, are adjusted for collateral and for
credit enhancements (e.g., guarantees and letters of credit) pro-
vided by third parties; outstandings supported by a guarantor
located outside the country or backed by collateral held outside the
country are assigned to the country of the enhancement provider.
In addition, the effect of credit derivative hedges and other short
credit or equity trading positions are taken into consideration. Total
exposure measures include activity with both government and
private-sector entities in a country.
The Firm also reports country exposure for regulatory purposes
following FFIEC guidelines, which are different from the Firm’s
internal risk management approach for measuring country expo-
sure. For additional information on the FFIEC exposures, see Cross-
border outstandings on page 314 of this Annual Report.
Several European countries, including Greece, Portugal, Spain, Italy
and Ireland, have been subject to credit deterioration due to weak-
nesses in their economic and fiscal situations. The Firm is closely
monitoring its exposures to these five countries. Aggregate net
exposures to these five countries as measured under the Firm’s
internal approach was less than $15.0 billion at December 31,
2010, with no country representing a majority of the exposure.
Sovereign exposure in all five countries represented less than half the
aggregate net exposure. The Firm currently believes its exposure to
these five countries is modest relative to the Firm’s overall risk expo-
sures and is manageable given the size and types of exposures to
each of the countries and the diversification of the aggregate expo-
sure. The Firm continues to conduct business and support client
activity in these countries and, therefore, the Firm’s aggregate net
exposures may vary over time. In addition, the net exposures may be
impacted by changes in market conditions, and the effects of interest
rates and credit spreads on market valuations.
As part of its ongoing country risk management process, the Firm
monitors exposure to emerging market countries, and utilizes
country stress tests to measure and manage the risk of extreme loss
associated with a sovereign crisis. There is no common definition of
emerging markets, but the Firm generally includes in its definition
those countries whose sovereign debt ratings are equivalent to
“A+” or lower. The table below presents the Firm’s exposure to its
top 10 emerging markets countries based on its internal measure-
ment approach. The selection of countries is based solely on the
Firm’s largest total exposures by country and does not represent its
view of any actual or potentially adverse credit conditions.
JPMorgan Chase & Co./2010 Annual Report 129
Top 10 emerging markets country exposure
At December 31, 2010 Cross-border Total exposure (in billions) Lending(a) Trading(b) Other(c) Total Local(d)
Brazil $ 3.0 $ 1.8 $ 1.1 $ 5.9 $ 3.9 $ 9.8South Korea 3.0 1.4 1.5 5.9 3.1 9.0India 4.2 2.1 1.4 7.7 1.1 8.8China 3.6 1.1 1.0 5.7 1.2 6.9Hong Kong 2.5 1.5 1.2 5.2 — 5.2Mexico 2.1 2.3 0.5 4.9 — 4.9Malaysia 0.6 2.0 0.3 2.9 0.4 3.3Taiwan 0.3 0.6 0.4 1.3 1.9 3.2Thailand 0.3 1.1 0.4 1.8 0.9 2.7Russia 1.2 1.0 0.3 2.5 — 2.5
At December 31, 2009 Cross-border Total
exposure (in billions) Lending(a) Trading(b) Other(c) Total Local(d)
South Korea $ 2.7 $ 1.7 $ 1.3 $ 5.7 $ 3.3 $ 9.0India 1.5 2.7 1.1 5.3 0.3 5.6Brazil 1.8 (0.5) 1.0 2.3 2.2 4.5China 1.8 0.4 0.8 3.0 — 3.0Taiwan 0.1 0.8 0.3 1.2 1.8 3.0Hong Kong 1.1 0.2 1.3 2.6 — 2.6Mexico 1.2 0.8 0.4 2.4 — 2.4Chile 0.8 0.6 0.5 1.9 — 1.9Malaysia 0.1 1.3 0.3 1.7 0.2 1.9South Africa 0.4 0.8 0.5 1.7 — 1.7
(a) Lending includes loans and accrued interest receivable, interest-earning deposits with banks, acceptances, other monetary assets, issued letters of credit net of participations, and undrawn commitments to extend credit.
(b) Trading includes: (1) issuer exposure on cross-border debt and equity instruments, held both in trading and investment accounts and adjusted for the impact of issuer hedges, including credit derivatives; and (2) counterparty exposure on derivative and foreign exchange contracts as well as securities financing trades (resale agreements and securities borrowed).
(c) Other represents mainly local exposure funded cross-border, including capital investments in local entities. (d) Local exposure is defined as exposure to a country denominated in local currency and booked locally. Any exposure not meeting these criteria is defined as cross-border exposure.
CONSUMER CREDIT PORTFOLIO
JPMorgan Chase’s consumer portfolio consists primarily of resi-
dential mortgages, home equity loans, credit cards, auto loans,
student loans and business banking loans. The Firm’s primary
focus is on serving the prime consumer credit market. For further
information on the consumer loans, see Note 14 on pages 220–
238 of this Annual Report.
A substantial portion of the consumer loans acquired in the Wash-
ington Mutual transaction were identified as purchased credit-
impaired based on an analysis of high-risk characteristics, including
product type, LTV ratios, FICO scores and delinquency status. These
PCI loans are accounted for on a pool basis, and the pools are
considered to be performing. See pages 132–134 of this Annual
Report for further information on the purchased credit-impaired
loans.
The credit performance of the consumer portfolio across the
entire product spectrum has stabilized but high unemployment
and weak overall economic conditions continue to put pressure
on the number of loans charged off, and weak housing prices
continue to negatively affect the severity of loss recognized on
real estate loans that default. Delinquencies and nonaccrual loans
remain elevated but have improved. The delinquency trend exhib-
ited improvement in the first half of 2010; early-stage delinquen-
cies (30–89 days delinquent) then flattened across most RFS
products early in the second half of the year, before once again
showing improvement at the end of the year. Late-stage residen-
tial real estate delinquencies (150+ days delinquent) remain
elevated. The elevated level of these credit quality metrics is due,
in part, to loss-mitigation activities currently being undertaken
and elongated foreclosure processing timelines. Losses related to
these loans continued to be recognized in accordance with the
Firm’s standard charge-off practices, but some delinquent loans
that would have otherwise been foreclosed upon remain in the
mortgage and home equity loan portfolios.
Since mid-2007, the Firm has taken actions to reduce risk expo-
sure to consumer loans by tightening both underwriting and loan
qualification standards, as well as eliminating certain products
and loan origination channels for residential real estate lending.
The tightening of underwriting criteria for auto loans has resulted
in the reduction of both extended-term and high LTV financing. In
addition, new originations of private student loans are limited to
school-certified loans, the majority of which include a qualified
co-borrower.
As a further action to reduce risk associated with lending-related
commitments, the Firm has reduced or canceled certain lines of
credit as permitted by law. For example, the Firm may reduce or
close home equity lines of credit when there are significant de-
creases in the value of the underlying property or when there has
been a demonstrable decline in the creditworthiness of the bor-
rower. Also, the Firm typically closes credit card lines when the
borrower is 60 days or more past due. Finally, certain inactive
credit card lines have been closed, and a number of active credit
card lines have been reduced.
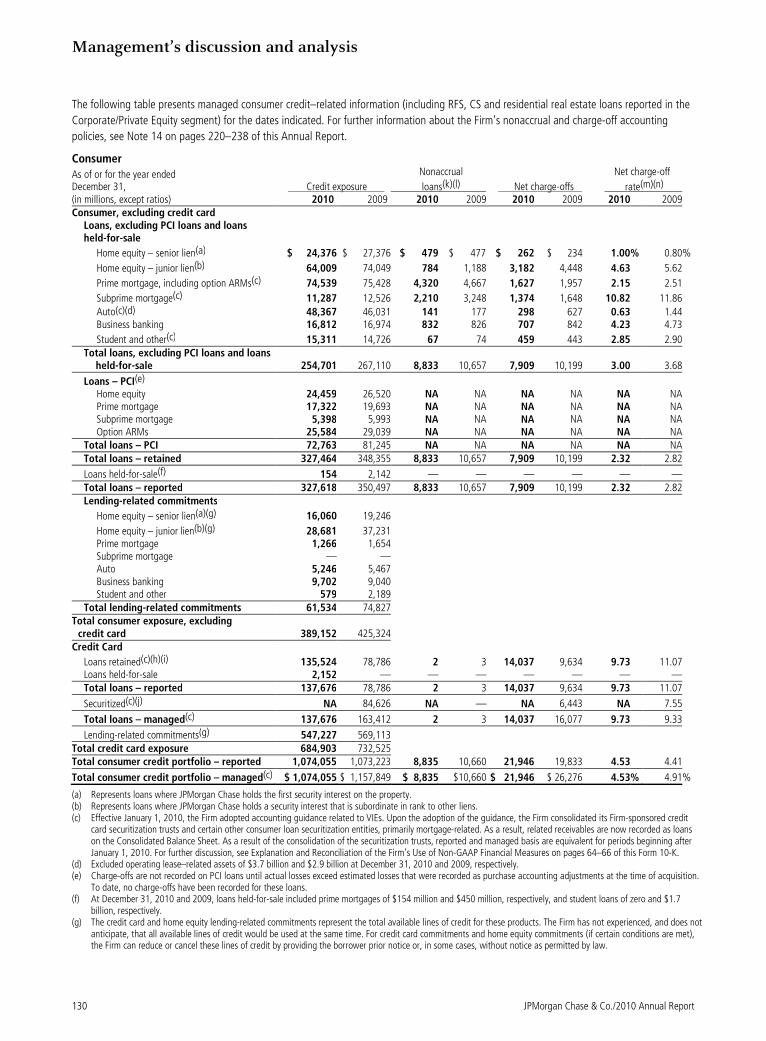
Management’s discussion and analysis
130 JPMorgan Chase & Co./2010 Annual Report
The following table presents managed consumer credit–related information (including RFS, CS and residential real estate loans reported in the
Corporate/Private Equity segment) for the dates indicated. For further information about the Firm’s nonaccrual and charge-off accounting
policies, see Note 14 on pages 220–238 of this Annual Report.
Consumer
As of or for the year ended December 31, Credit exposure
Nonaccrual
loans(k)(l) Net charge-offs
Net charge-off
rate(m)(n) (in millions, except ratios) 2010 2009 2010 2009 2010 2009 2010 2009Consumer, excluding credit card
Loans, excluding PCI loans and loans held-for-sale
Home equity – senior lien(a) $ 24,376 $ 27,376 $ 479 $ 477 $ 262 $ 234 1.00% 0.80%
Home equity – junior lien(b) 64,009 74,049 784 1,188 3,182 4,448 4.63 5.62
Prime mortgage, including option ARMs(c) 74,539 75,428 4,320 4,667 1,627 1,957 2.15 2.51
Subprime mortgage(c) 11,287 12,526 2,210 3,248 1,374 1,648 10.82 11.86
Auto(c)(d) 48,367 46,031 141 177 298 627 0.63 1.44 Business banking 16,812 16,974 832 826 707 842 4.23 4.73
Student and other(c) 15,311 14,726 67 74 459 443 2.85 2.90 Total loans, excluding PCI loans and loans
held-for-sale 254,701 267,110 8,833 10,657 7,909 10,199 3.00 3.68
Loans – PCI(e) Home equity 24,459 26,520 NA NA NA NA NA NA Prime mortgage 17,322 19,693 NA NA NA NA NA NA Subprime mortgage 5,398 5,993 NA NA NA NA NA NA Option ARMs 25,584 29,039 NA NA NA NA NA NA Total loans – PCI 72,763 81,245 NA NA NA NA NA NA Total loans – retained 327,464 348,355 8,833 10,657 7,909 10,199 2.32 2.82
Loans held-for-sale(f) 154 2,142 — — — — — — Total loans – reported 327,618 350,497 8,833 10,657 7,909 10,199 2.32 2.82 Lending-related commitments
Home equity – senior lien(a)(g) 16,060 19,246
Home equity – junior lien(b)(g) 28,681 37,231 Prime mortgage 1,266 1,654 Subprime mortgage — — Auto 5,246 5,467 Business banking 9,702 9,040 Student and other 579 2,189 Total lending-related commitments 61,534 74,827
Total consumer exposure, excluding credit card 389,152 425,324
Credit Card
Loans retained(c)(h)(i) 135,524 78,786 2 3 14,037 9,634 9.73 11.07 Loans held-for-sale 2,152 — — — — — — — Total loans – reported 137,676 78,786 2 3 14,037 9,634 9.73 11.07
Securitized(c)(j) NA 84,626 NA — NA 6,443 NA 7.55
Total loans – managed(c) 137,676 163,412 2 3 14,037 16,077 9.73 9.33
Lending-related commitments(g) 547,227 569,113 Total credit card exposure 684,903 732,525 Total consumer credit portfolio – reported 1,074,055 1,073,223 8,835 10,660 21,946 19,833 4.53
4.41
Total consumer credit portfolio – managed(c) $ 1,074,055 $ 1,157,849 $ 8,835 $10,660 $ 21,946 $ 26,276 4.53% 4.91%
(a) Represents loans where JPMorgan Chase holds the first security interest on the property. (b) Represents loans where JPMorgan Chase holds a security interest that is subordinate in rank to other liens. (c) Effective January 1, 2010, the Firm adopted accounting guidance related to VIEs. Upon the adoption of the guidance, the Firm consolidated its Firm-sponsored credit
card securitization trusts and certain other consumer loan securitization entities, primarily mortgage-related. As a result, related receivables are now recorded as loans on the Consolidated Balance Sheet. As a result of the consolidation of the securitization trusts, reported and managed basis are equivalent for periods beginning after January 1, 2010. For further discussion, see Explanation and Reconciliation of the Firm’s Use of Non-GAAP Financial Measures on pages 64–66 of this Form 10-K.
(d) Excluded operating lease–related assets of $3.7 billion and $2.9 billion at December 31, 2010 and 2009, respectively. (e) Charge-offs are not recorded on PCI loans until actual losses exceed estimated losses that were recorded as purchase accounting adjustments at the time of acquisition.
To date, no charge-offs have been recorded for these loans. (f) At December 31, 2010 and 2009, loans held-for-sale included prime mortgages of $154 million and $450 million, respectively, and student loans of zero and $1.7
billion, respectively. (g) The credit card and home equity lending-related commitments represent the total available lines of credit for these products. The Firm has not experienced, and does not
anticipate, that all available lines of credit would be used at the same time. For credit card commitments and home equity commitments (if certain conditions are met), the Firm can reduce or cancel these lines of credit by providing the borrower prior notice or, in some cases, without notice as permitted by law.
JPMorgan Chase & Co./2010 Annual Report 131
(h) Included $1.0 billion of loans at December 31, 2009, held by the WMMT, which were consolidated onto the Firm’s Consolidated Balance Sheets at fair value in 2009. Such loans had been fully repaid or charged off as of December 31, 2010. See Note 16 on pages 244–259 this Annual Report.
(i) Included billed finance charges and fees net of an allowance for uncollectible amounts. (j) Loans securitized are defined as loans that were sold to nonconsolidated securitization trusts and not included in reported loans. For a further discussion of credit card
securitizations, see CS on pages 79–81 of this Annual Report. (k) At December 31, 2010 and 2009, nonaccrual loans excluded: (1) mortgage loans insured by U.S. government agencies of $10.5 billion and $9.0 billion, respectively,
that are 90 days past due and accruing at the guaranteed reimbursement rate; and (2) student loans that are 90 days past due and still accruing, which are insured by U.S. government agencies under the FFELP, of $625 million and $542 million, respectively. These amounts are excluded as reimbursement of insured amounts is pro-ceeding normally. In addition, the Firm’s policy is generally to exempt credit card loans from being placed on nonaccrual status as permitted by regulatory guidance. Un-der guidance issued by the FFIEC, credit card loans are charged off by the end of the month in which the account becomes 180 days past due or within 60 days from receiving notification about a specified event (e.g., bankruptcy of the borrower), whichever is earlier.
(l) Excludes PCI loans that were acquired as part of the Washington Mutual transaction, which are accounted for on a pool basis. Since each pool is accounted for as a single asset with a single composite interest rate and an aggregate expectation of cash flows, the past-due status of the pools, or that of individual loans within the pools, is not meaningful. Because the Firm is recognizing interest income on each pool of loans, they are all considered to be performing.
(m) Average consumer loans held-for-sale and loans at fair value were $1.5 billion and $2.2 billion for the years ended December 31, 2010 and 2009, respectively. These amounts were excluded when calculating net charge-off rates.
(n) As further discussed below, net charge-off rates for 2010 reflect the impact of an aggregate $632 million adjustment related to the Firm’s estimate of the net realizable value of the collateral underlying the loans at the charge-off date. Absent this adjustment, net charge-off rates would have been 0.92%, 4.57%, 1.73% and 8.87% for home equity – senior lien; home equity – junior lien; prime mortgage (including option ARMs); and subprime mortgage, respectively. Total consumer, excluding credit card and PCI loans, and total consumer, excluding credit card net charge-off rates would have been 2.76% and 2.14%, respectively, excluding this adjustment.
Effective January 1, 2010, the Firm adopted accounting guidance
related to VIEs. Upon adoption of this guidance, the Firm consoli-
dated its Firm-sponsored credit card securitization trusts and certain
other consumer loan securitization entities. The following table
summarizes the impact on consumer loans at adoption.
Reported loans January 1, 2010 (in millions) Consumer, excluding credit card
Prime mortgage, including option ARMs $ 1,858 Subprime mortgage 1,758 Auto 218 Student 1,008 Total consumer, excluding credit card 4,842 Credit card 84,663 Total increase in consumer loans $ 89,505
Consumer, excluding credit card Portfolio analysis
The following discussion relates to the specific loan and lending-
related categories. Purchased credit-impaired loans are excluded
from individual loan product discussions and are addressed sepa-
rately below. For further information about the Firm’s consumer
portfolio, related delinquency information and other credit quality
indicators, see Note 14 on pages 220–238 of this Annual Report.
It is the Firm’s policy to charge down residential real estate loans to
net realizable value at no later than 180 days past due. During the
fourth quarter of 2010, the Firm recorded an aggregate adjustment
of $632 million to increase net charge-offs related to the estimated
net realizable value of the collateral underlying delinquent residen-
tial home loans. Because these losses were previously recognized in
the provision and allowance for loan losses, this adjustment had no
impact on the Firm’s net income. The impact of this aggregate
adjustment on reported net charge-off rates is provided in footnote
(n) above.
Home equity: Home equity loans at December 31, 2010, were
$88.4 billion, compared with $101.4 billion at December 31, 2009.
The decrease in this portfolio primarily reflected loan paydowns and
charge-offs. Junior lien net charge-offs declined from the prior year
but remained high. Senior lien nonaccrual loans remained relatively
flat, while junior lien nonaccrual loans decreased from prior year-
end as a result of improvement in early-stage delinquencies. Im-
provements in delinquencies and charge-offs slowed during the
second half of the year and stabilized at these elevated levels. In
addition to delinquent accounts, the Firm monitors current junior
lien loans where the borrower has a first mortgage loan which is
either delinquent or has been modified, as such junior lien loans are
considered to be at higher risk of delinquency. The portfolio con-
tained an estimated $4 billion of such junior lien loans. The risk
associated with these junior lien loans was considered in establish-
ing the allowance for loan losses at December 31, 2010.
Mortgage: Mortgage loans at December 31, 2010, including
prime and subprime mortgages and mortgage loans held-for-sale,
were $86.0 billion, compared with $88.4 billion at December 31,
2009. The decrease was primarily due to portfolio runoff, partially
offset by the addition of loans to the balance sheet as a result of
the adoption of the accounting guidance related to VIEs. Net
charge-offs decreased from the prior year but remained elevated.
Prime mortgages at December 31, 2010, including option ARMs,
were $74.7 billion, compared with $75.9 billion at December 31,
2009. The decrease in loans was due to paydowns and charge-offs
on delinquent loans, partially offset by the addition of loans as a
result of the adoption of the accounting guidance related to VIEs.
Early-stage delinquencies showed improvement during the year but
remained at elevated levels. Late-stage delinquencies increased
during the first half of the year, then trended lower for several
months before flattening toward the end of 2010. Nonaccrual loans
showed improvement, but also remained elevated as a result of
ongoing modification activity and foreclosure processing delays.
Charge-offs declined year over year but remained high.
Option ARM loans, which are included in the prime mortgage
portfolio, were $8.1 billion at December 31, 2010, and represented
11% of the prime mortgage portfolio. These are primarily loans
with low LTV ratios and high borrower FICOs. Accordingly, the Firm
expects substantially lower losses on this portfolio when compared
with the PCI option ARM pool. As of December 31, 2010, ap-
proximately 8% of the option ARM borrowers were delinquent, 4%
were making interest-only or negatively amortizing payments, and
88% were making amortizing payments. Substantially all borrowers
within the portfolio are subject to risk of payment shock due to
future payment recast as a limited number of these loans have been
modified. The cumulative amount of unpaid interest added to the
Management’s discussion and analysis
132 JPMorgan Chase & Co./2010 Annual Report
unpaid principal balance due to negative amortization of option
ARMs was $24 million and $78 million at December 31, 2010 and
2009, respectively. The Firm estimates the following balances of
option ARM loans will experience a recast that results in a payment
increase: $72 million in 2011, $241 million in 2012 and $784
million in 2013. The Firm did not originate option ARMs and new
originations of option ARMs were discontinued by Washington
Mutual prior to the date of JPMorgan Chase’s acquisition of its
banking operations.
Subprime mortgages at December 31, 2010 were $11.3 billion,
compared with $12.5 billion at December 31, 2009. The decrease
was due to paydowns and charge-offs on delinquent loans, partially
offset by the addition of loans as a result of the adoption of the
accounting guidance related to VIEs. Late-stage delinquencies
remained elevated but continued to improve, albeit at a slower rate
during the second half of the year, while early-stage delinquencies
stabilized at an elevated level during this period. Nonaccrual loans
improved largely as a result of the improvement in late-stage
delinquencies. Charge-offs reflected modest improvement.
Auto: Auto loans at December 31, 2010, were $48.4 billion,
compared with $46.0 billion at December 31, 2009. Delinquent
and nonaccrual loans have decreased. In addition, net charge-offs
have declined 52% from the prior year. Provision expense de-
creased due to favorable loss severity as a result of a strong used-
car market nationwide and reduced loss frequency due to the
tightening of underwriting criteria in earlier periods. The auto loan
portfolio reflected a high concentration of prime quality credits.
Business banking: Business banking loans at December 31, 2010,
were $16.8 billion, compared with $17.0 billion at December 31, 2009.
The decrease was primarily a result of run-off of the Washington Mutual
portfolio and charge-offs on delinquent loans. These loans primarily
include loans which are highly collateralized, often with personal loan
guarantees. Nonaccrual loans continued to remain elevated. After
having increased during the first half of 2010, nonaccrual loans as of
December 31, 2010, declined to year-end 2009 levels.
Student and other: Student and other loans at December 31,
2010, including loans held-for-sale, were $15.3 billion, compared
with $16.4 billion at December 31, 2009. Other loans primarily
include other secured and unsecured consumer loans. Delinquencies
reflected some stabilization in the second half of 2010, but remained
elevated. Charge-offs during 2010 remained relatively flat with 2009
levels reflecting the impact of elevated unemployment levels.
Purchased credit-impaired loans: PCI loans at December 31,
2010, were $72.8 billion compared with $81.2 billion at December
31, 2009. This portfolio represents loans acquired in the Washing-
ton Mutual transaction that were recorded at fair value at the time
of acquisition. That fair value included an estimate of credit losses
expected to be realized over the remaining lives of the loans, and
therefore no allowance for loan losses was recorded for these loans
as of the acquisition date.
The Firm regularly updates the amount of principal and interest
cash flows expected to be collected for these loans. Probable
decreases in expected loan principal cash flows would trigger the
recognition of impairment through the provision for loan losses.
Probable and significant increases in expected cash flows (e.g.,
decreased principal credit losses, the net benefit of modifications)
would first reverse any previously recorded allowance for loan
losses, with any remaining increase in the expected cash flows
recognized prospectively in interest income over the remaining
estimated lives of the underlying loans.
During 2010, management concluded as part of the Firm’s regular
assessment of the PCI pools that it was probable that higher expected
principal credit losses would result in a decrease in expected cash
flows. Accordingly, the Firm recognized an aggregate $3.4 billion
impairment related to the home equity, prime mortgage, option ARM
and subprime mortgage PCI portfolios. As a result of this impairment,
the Firm’s allowance for loan losses for the home equity, prime
mortgage, option ARM and subprime mortgage PCI portfolios was
$1.6 billion, $1.8 billion, $1.5 billion and $98 million, respectively, at
December 31, 2010, compared with an allowance for loan losses of
$1.1 billion and $491 million for the prime mortgage and option
ARM PCI portfolios, respectively, at December 31, 2009.
Approximately 39% of the option ARM borrowers were delinquent,
5% were making interest-only or negatively amortizing payments,
and 56% were making amortizing payments. Approximately 50%
of current borrowers are subject to risk of payment shock due to
future payment recast; substantially all of the remaining loans have
been modified to a fixed rate fully amortizing loan. The cumulative
amount of unpaid interest added to the unpaid principal balance of
the option ARM PCI pool was $1.4 billion and $1.9 billion at De-
cember 31, 2010 and 2009, respectively. The Firm estimates the
following balances of option ARM PCI loans will experience a recast
that results in a payment increase: $1.2 billion in 2011, $2.7 billion
in 2012 and $508 million in 2013.
The following table provides a summary of lifetime loss estimates included in both the nonaccretable difference and the allowance for loan
losses. Principal charge-offs will not be recorded on these pools until the nonaccretable difference has been fully depleted.
Lifetime loss estimates(a) LTD liquidation losses(b)
December 31, (in millions) 2010 2009 2010 2009
Option ARMs $ 11,588 $ 10,650 $ 4,860 $ 1,744
Home equity 14,698 13,138 8,810 6,060
Prime mortgage 4,870 4,240 1,495 794
Subprime mortgage 3,732 3,842 1,250 796
Total $ 34,888 $ 31,870 $ 16,415 $ 9,394
(a) Includes the original nonaccretable difference established in purchase accounting of $30.5 billion for principal losses only. The remaining nonaccretable difference for principal losses only was $14.1 billion and $21.1 billion at December 31, 2010 and 2009, respectively. All probable increases in principal losses and foregone interest subsequent to the purchase date are reflected in the allowance for loan losses.
(b) Life-to-date (“LTD”) liquidation losses represent realization of loss upon loan resolution.
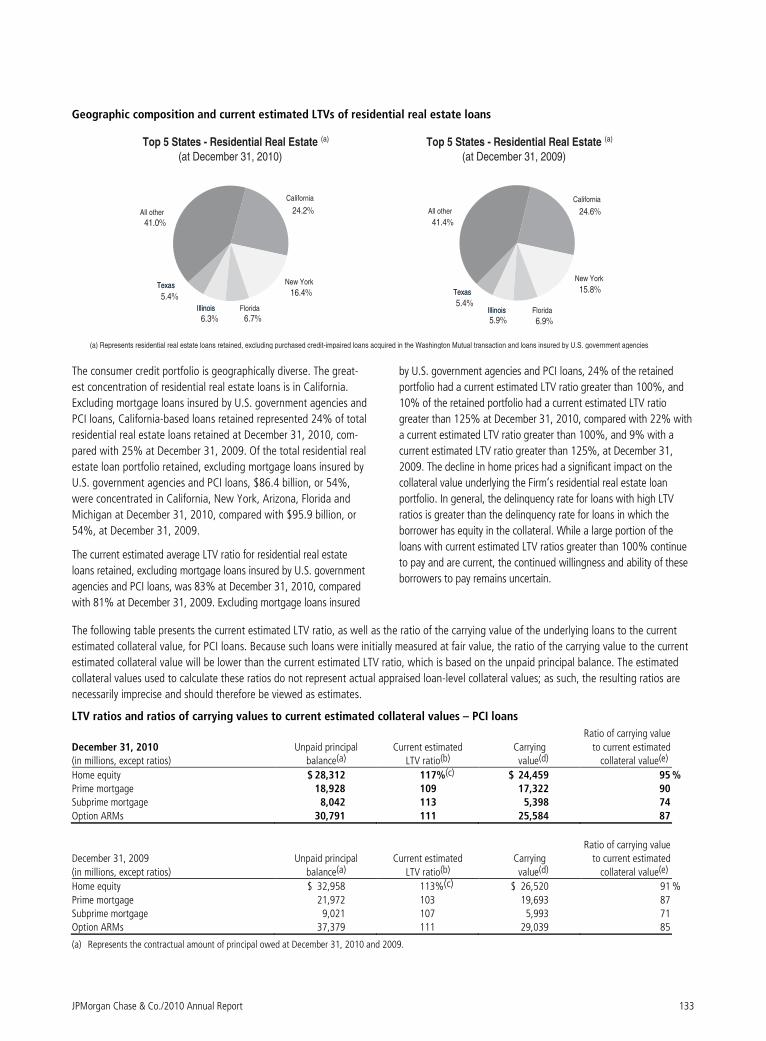
JPMorgan Chase & Co./2010 Annual Report 133
Geographic composition and current estimated LTVs of residential real estate loans
California
TexasTexas New York
41.0%
24.2%
5.4%
Florida
16.4%
6.7%6.3%IllinoisIllinois
All other
(a) Represents residential real estate loans retained, excluding purchased credit-impaired loans acquired in the Washington Mutual transaction and loans insured by U.S. government agencies.
California
TexasTexas
New York
41.4%24.6%
5.4%Florida
15.8%
6.9%5.9%IllinoisIllinois
All other
Top 5 States - Residential Real Estate
(at December 31, 2009)
(a)Top 5 States - Residential Real Estate
(at December 31, 2010)
(a)
The consumer credit portfolio is geographically diverse. The great-
est concentration of residential real estate loans is in California.
Excluding mortgage loans insured by U.S. government agencies and
PCI loans, California-based loans retained represented 24% of total
residential real estate loans retained at December 31, 2010, com-
pared with 25% at December 31, 2009. Of the total residential real
estate loan portfolio retained, excluding mortgage loans insured by
U.S. government agencies and PCI loans, $86.4 billion, or 54%,
were concentrated in California, New York, Arizona, Florida and
Michigan at December 31, 2010, compared with $95.9 billion, or
54%, at December 31, 2009.
The current estimated average LTV ratio for residential real estate
loans retained, excluding mortgage loans insured by U.S. government
agencies and PCI loans, was 83% at December 31, 2010, compared
with 81% at December 31, 2009. Excluding mortgage loans insured
by U.S. government agencies and PCI loans, 24% of the retained
portfolio had a current estimated LTV ratio greater than 100%, and
10% of the retained portfolio had a current estimated LTV ratio
greater than 125% at December 31, 2010, compared with 22% with
a current estimated LTV ratio greater than 100%, and 9% with a
current estimated LTV ratio greater than 125%, at December 31,
2009. The decline in home prices had a significant impact on the
collateral value underlying the Firm’s residential real estate loan
portfolio. In general, the delinquency rate for loans with high LTV
ratios is greater than the delinquency rate for loans in which the
borrower has equity in the collateral. While a large portion of the
loans with current estimated LTV ratios greater than 100% continue
to pay and are current, the continued willingness and ability of these
borrowers to pay remains uncertain.
The following table presents the current estimated LTV ratio, as well as the ratio of the carrying value of the underlying loans to the current
estimated collateral value, for PCI loans. Because such loans were initially measured at fair value, the ratio of the carrying value to the current
estimated collateral value will be lower than the current estimated LTV ratio, which is based on the unpaid principal balance. The estimated
collateral values used to calculate these ratios do not represent actual appraised loan-level collateral values; as such, the resulting ratios are
necessarily imprecise and should therefore be viewed as estimates.
LTV ratios and ratios of carrying values to current estimated collateral values – PCI loans
December 31, 2010
(in millions, except ratios)
Unpaid principal
balance(a)
Current estimated
LTV ratio(b)
Carrying
value(d)
Ratio of carrying value
to current estimated
collateral value(e)
Home equity $ 28,312 117%(c) $ 24,459 95 %
Prime mortgage 18,928 109 17,322 90
Subprime mortgage 8,042 113 5,398 74
Option ARMs 30,791 111 25,584 87
December 31, 2009
(in millions, except ratios)
Unpaid principal
balance(a)
Current estimated
LTV ratio(b)
Carrying
value(d)
Ratio of carrying value
to current estimated
collateral value(e)
Home equity $ 32,958 113%(c) $ 26,520 91 %
Prime mortgage 21,972 103 19,693 87
Subprime mortgage 9,021 107 5,993 71
Option ARMs 37,379 111 29,039 85
(a) Represents the contractual amount of principal owed at December 31, 2010 and 2009.
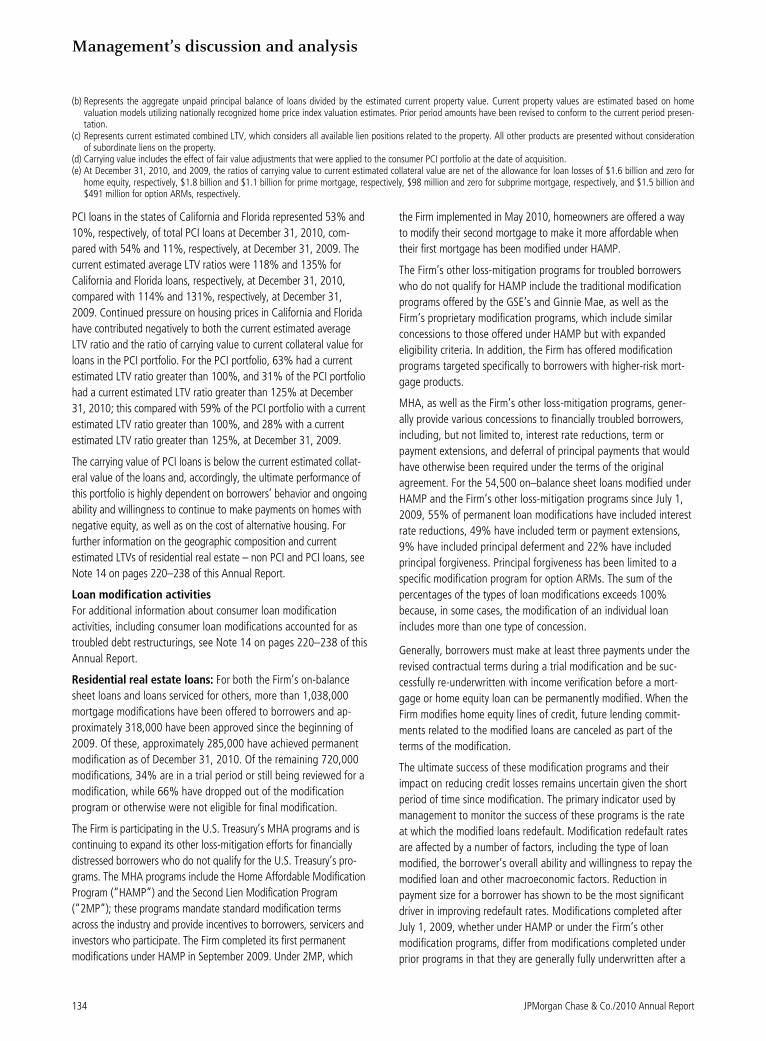
Management’s discussion and analysis
134 JPMorgan Chase & Co./2010 Annual Report
(b) Represents the aggregate unpaid principal balance of loans divided by the estimated current property value. Current property values are estimated based on home valuation models utilizing nationally recognized home price index valuation estimates. Prior period amounts have been revised to conform to the current period presen-tation.
(c) Represents current estimated combined LTV, which considers all available lien positions related to the property. All other products are presented without consideration of subordinate liens on the property.
(d) Carrying value includes the effect of fair value adjustments that were applied to the consumer PCI portfolio at the date of acquisition. (e) At December 31, 2010, and 2009, the ratios of carrying value to current estimated collateral value are net of the allowance for loan losses of $1.6 billion and zero for
home equity, respectively, $1.8 billion and $1.1 billion for prime mortgage, respectively, $98 million and zero for subprime mortgage, respectively, and $1.5 billion and $491 million for option ARMs, respectively.
PCI loans in the states of California and Florida represented 53% and
10%, respectively, of total PCI loans at December 31, 2010, com-
pared with 54% and 11%, respectively, at December 31, 2009. The
current estimated average LTV ratios were 118% and 135% for
California and Florida loans, respectively, at December 31, 2010,
compared with 114% and 131%, respectively, at December 31,
2009. Continued pressure on housing prices in California and Florida
have contributed negatively to both the current estimated average
LTV ratio and the ratio of carrying value to current collateral value for
loans in the PCI portfolio. For the PCI portfolio, 63% had a current
estimated LTV ratio greater than 100%, and 31% of the PCI portfolio
had a current estimated LTV ratio greater than 125% at December
31, 2010; this compared with 59% of the PCI portfolio with a current
estimated LTV ratio greater than 100%, and 28% with a current
estimated LTV ratio greater than 125%, at December 31, 2009.
The carrying value of PCI loans is below the current estimated collat-
eral value of the loans and, accordingly, the ultimate performance of
this portfolio is highly dependent on borrowers’ behavior and ongoing
ability and willingness to continue to make payments on homes with
negative equity, as well as on the cost of alternative housing. For
further information on the geographic composition and current
estimated LTVs of residential real estate – non PCI and PCI loans, see
Note 14 on pages 220–238 of this Annual Report.
Loan modification activities
For additional information about consumer loan modification
activities, including consumer loan modifications accounted for as
troubled debt restructurings, see Note 14 on pages 220–238 of this
Annual Report.
Residential real estate loans: For both the Firm’s on-balance
sheet loans and loans serviced for others, more than 1,038,000
mortgage modifications have been offered to borrowers and ap-
proximately 318,000 have been approved since the beginning of
2009. Of these, approximately 285,000 have achieved permanent
modification as of December 31, 2010. Of the remaining 720,000
modifications, 34% are in a trial period or still being reviewed for a
modification, while 66% have dropped out of the modification
program or otherwise were not eligible for final modification.
The Firm is participating in the U.S. Treasury’s MHA programs and is
continuing to expand its other loss-mitigation efforts for financially
distressed borrowers who do not qualify for the U.S. Treasury’s pro-
grams. The MHA programs include the Home Affordable Modification
Program (“HAMP”) and the Second Lien Modification Program
(“2MP”); these programs mandate standard modification terms
across the industry and provide incentives to borrowers, servicers and
investors who participate. The Firm completed its first permanent
modifications under HAMP in September 2009. Under 2MP, which
the Firm implemented in May 2010, homeowners are offered a way
to modify their second mortgage to make it more affordable when
their first mortgage has been modified under HAMP.
The Firm’s other loss-mitigation programs for troubled borrowers
who do not qualify for HAMP include the traditional modification
programs offered by the GSE’s and Ginnie Mae, as well as the
Firm’s proprietary modification programs, which include similar
concessions to those offered under HAMP but with expanded
eligibility criteria. In addition, the Firm has offered modification
programs targeted specifically to borrowers with higher-risk mort-
gage products.
MHA, as well as the Firm’s other loss-mitigation programs, gener-
ally provide various concessions to financially troubled borrowers,
including, but not limited to, interest rate reductions, term or
payment extensions, and deferral of principal payments that would
have otherwise been required under the terms of the original
agreement. For the 54,500 on–balance sheet loans modified under
HAMP and the Firm’s other loss-mitigation programs since July 1,
2009, 55% of permanent loan modifications have included interest
rate reductions, 49% have included term or payment extensions,
9% have included principal deferment and 22% have included
principal forgiveness. Principal forgiveness has been limited to a
specific modification program for option ARMs. The sum of the
percentages of the types of loan modifications exceeds 100%
because, in some cases, the modification of an individual loan
includes more than one type of concession.
Generally, borrowers must make at least three payments under the
revised contractual terms during a trial modification and be suc-
cessfully re-underwritten with income verification before a mort-
gage or home equity loan can be permanently modified. When the
Firm modifies home equity lines of credit, future lending commit-
ments related to the modified loans are canceled as part of the
terms of the modification.
The ultimate success of these modification programs and their
impact on reducing credit losses remains uncertain given the short
period of time since modification. The primary indicator used by
management to monitor the success of these programs is the rate
at which the modified loans redefault. Modification redefault rates
are affected by a number of factors, including the type of loan
modified, the borrower’s overall ability and willingness to repay the
modified loan and other macroeconomic factors. Reduction in
payment size for a borrower has shown to be the most significant
driver in improving redefault rates. Modifications completed after
July 1, 2009, whether under HAMP or under the Firm’s other
modification programs, differ from modifications completed under
prior programs in that they are generally fully underwritten after a
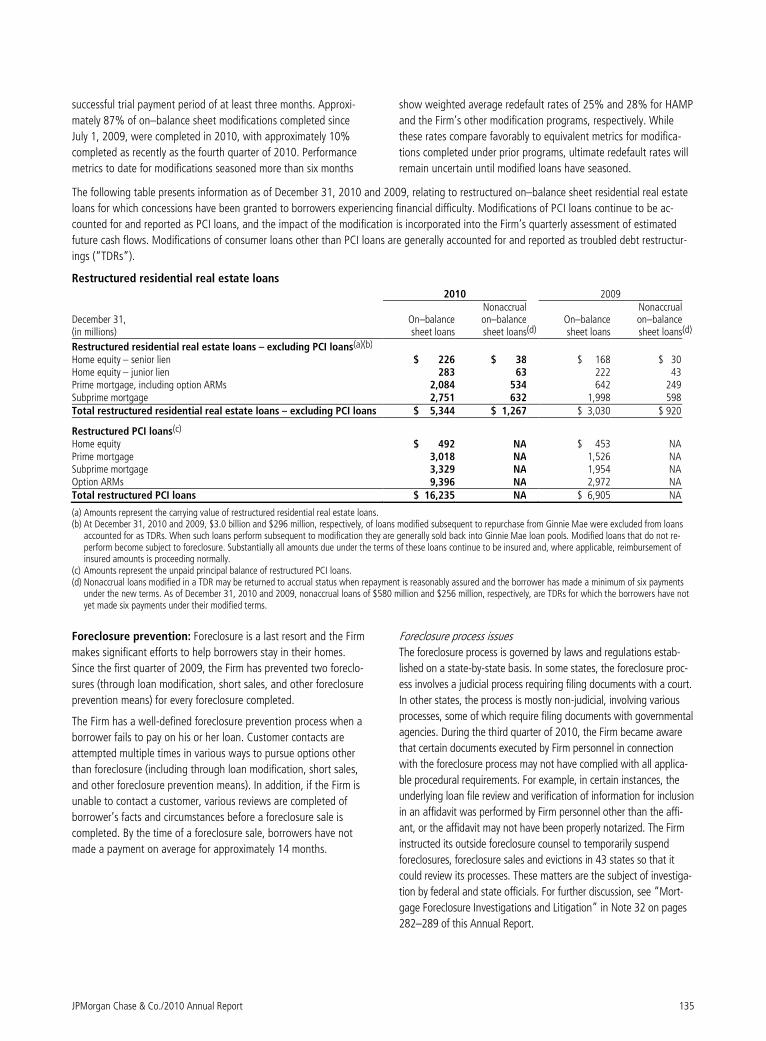
JPMorgan Chase & Co./2010 Annual Report 135
successful trial payment period of at least three months. Approxi-
mately 87% of on–balance sheet modifications completed since
July 1, 2009, were completed in 2010, with approximately 10%
completed as recently as the fourth quarter of 2010. Performance
metrics to date for modifications seasoned more than six months
show weighted average redefault rates of 25% and 28% for HAMP
and the Firm’s other modification programs, respectively. While
these rates compare favorably to equivalent metrics for modifica-
tions completed under prior programs, ultimate redefault rates will
remain uncertain until modified loans have seasoned.
The following table presents information as of December 31, 2010 and 2009, relating to restructured on–balance sheet residential real estate
loans for which concessions have been granted to borrowers experiencing financial difficulty. Modifications of PCI loans continue to be ac-
counted for and reported as PCI loans, and the impact of the modification is incorporated into the Firm’s quarterly assessment of estimated
future cash flows. Modifications of consumer loans other than PCI loans are generally accounted for and reported as troubled debt restructur-
ings (“TDRs”).
Restructured residential real estate loans
2010 2009
December 31, (in millions)
On–balance sheet loans
Nonaccrual on–balance
sheet loans(d) On–balance sheet loans
Nonaccrual on–balance
sheet loans(d)
Restructured residential real estate loans – excluding PCI loans(a)(b) Home equity – senior lien $ 226 $ 38 $ 168 $ 30 Home equity – junior lien 283 63 222 43 Prime mortgage, including option ARMs 2,084 534 642 249 Subprime mortgage 2,751 632 1,998 598 Total restructured residential real estate loans – excluding PCI loans $ 5,344 $ 1,267 $ 3,030 $ 920
Restructured PCI loans(c) Home equity $ 492 NA $ 453 NA Prime mortgage 3,018 NA 1,526 NA Subprime mortgage 3,329 NA 1,954 NA Option ARMs 9,396 NA 2,972 NA Total restructured PCI loans $ 16,235 NA $ 6,905 NA
(a) Amounts represent the carrying value of restructured residential real estate loans. (b) At December 31, 2010 and 2009, $3.0 billion and $296 million, respectively, of loans modified subsequent to repurchase from Ginnie Mae were excluded from loans
accounted for as TDRs. When such loans perform subsequent to modification they are generally sold back into Ginnie Mae loan pools. Modified loans that do not re-perform become subject to foreclosure. Substantially all amounts due under the terms of these loans continue to be insured and, where applicable, reimbursement of insured amounts is proceeding normally.
(c) Amounts represent the unpaid principal balance of restructured PCI loans. (d) Nonaccrual loans modified in a TDR may be returned to accrual status when repayment is reasonably assured and the borrower has made a minimum of six payments
under the new terms. As of December 31, 2010 and 2009, nonaccrual loans of $580 million and $256 million, respectively, are TDRs for which the borrowers have not yet made six payments under their modified terms.
Foreclosure prevention: Foreclosure is a last resort and the Firm
makes significant efforts to help borrowers stay in their homes.
Since the first quarter of 2009, the Firm has prevented two foreclo-
sures (through loan modification, short sales, and other foreclosure
prevention means) for every foreclosure completed.
The Firm has a well-defined foreclosure prevention process when a
borrower fails to pay on his or her loan. Customer contacts are
attempted multiple times in various ways to pursue options other
than foreclosure (including through loan modification, short sales,
and other foreclosure prevention means). In addition, if the Firm is
unable to contact a customer, various reviews are completed of
borrower’s facts and circumstances before a foreclosure sale is
completed. By the time of a foreclosure sale, borrowers have not
made a payment on average for approximately 14 months.
Foreclosure process issues
The foreclosure process is governed by laws and regulations estab-
lished on a state-by-state basis. In some states, the foreclosure proc-
ess involves a judicial process requiring filing documents with a court.
In other states, the process is mostly non-judicial, involving various
processes, some of which require filing documents with governmental
agencies. During the third quarter of 2010, the Firm became aware
that certain documents executed by Firm personnel in connection
with the foreclosure process may not have complied with all applica-
ble procedural requirements. For example, in certain instances, the
underlying loan file review and verification of information for inclusion
in an affidavit was performed by Firm personnel other than the affi-
ant, or the affidavit may not have been properly notarized. The Firm
instructed its outside foreclosure counsel to temporarily suspend
foreclosures, foreclosure sales and evictions in 43 states so that it
could review its processes. These matters are the subject of investiga-
tion by federal and state officials. For further discussion, see “Mort-
gage Foreclosure Investigations and Litigation” in Note 32 on pages
282–289 of this Annual Report.
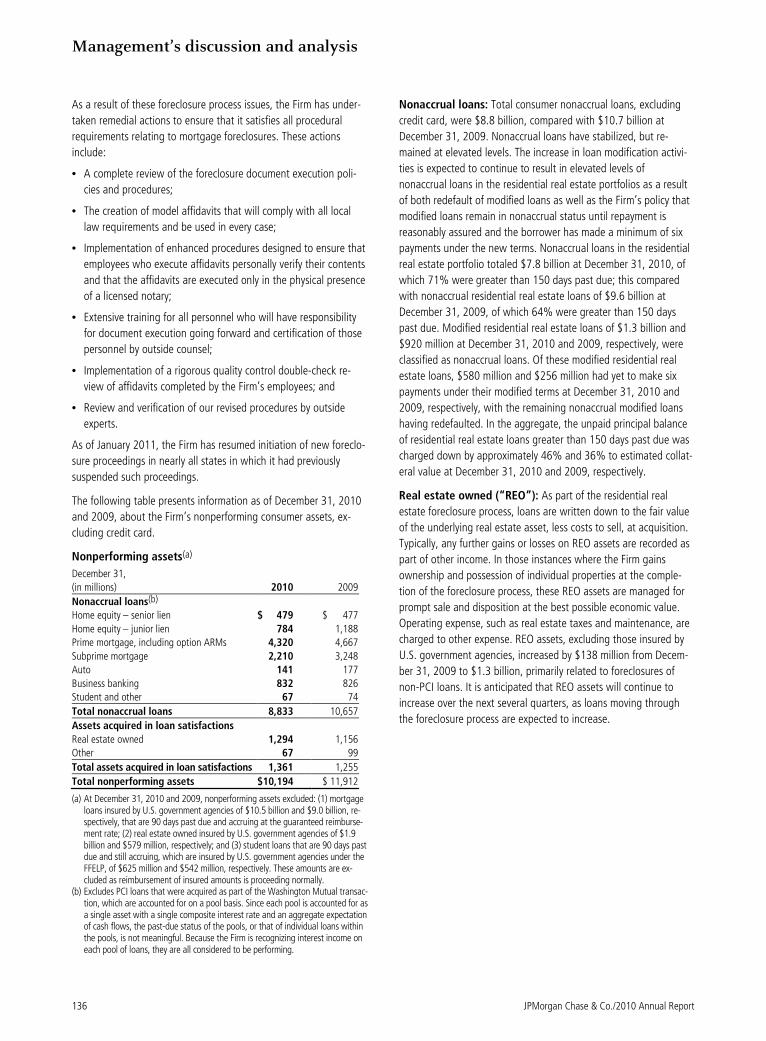
Management’s discussion and analysis
136 JPMorgan Chase & Co./2010 Annual Report
As a result of these foreclosure process issues, the Firm has under-
taken remedial actions to ensure that it satisfies all procedural
requirements relating to mortgage foreclosures. These actions
include:
• A complete review of the foreclosure document execution poli-
cies and procedures;
• The creation of model affidavits that will comply with all local
law requirements and be used in every case;
• Implementation of enhanced procedures designed to ensure that
employees who execute affidavits personally verify their contents
and that the affidavits are executed only in the physical presence
of a licensed notary;
• Extensive training for all personnel who will have responsibility
for document execution going forward and certification of those
personnel by outside counsel;
• Implementation of a rigorous quality control double-check re-
view of affidavits completed by the Firm’s employees; and
• Review and verification of our revised procedures by outside
experts.
As of January 2011, the Firm has resumed initiation of new foreclo-
sure proceedings in nearly all states in which it had previously
suspended such proceedings.
The following table presents information as of December 31, 2010
and 2009, about the Firm’s nonperforming consumer assets, ex-
cluding credit card.
Nonperforming assets(a)
December 31,
(in millions) 2010 2009
Nonaccrual loans(b)
Home equity – senior lien $ 479 $ 477
Home equity – junior lien 784 1,188
Prime mortgage, including option ARMs 4,320 4,667
Subprime mortgage 2,210 3,248
Auto 141 177
Business banking 832 826
Student and other 67 74
Total nonaccrual loans 8,833 10,657
Assets acquired in loan satisfactions
Real estate owned 1,294 1,156
Other 67 99
Total assets acquired in loan satisfactions 1,361 1,255
Total nonperforming assets $10,194 $ 11,912
(a) At December 31, 2010 and 2009, nonperforming assets excluded: (1) mortgage loans insured by U.S. government agencies of $10.5 billion and $9.0 billion, re-spectively, that are 90 days past due and accruing at the guaranteed reimburse-ment rate; (2) real estate owned insured by U.S. government agencies of $1.9 billion and $579 million, respectively; and (3) student loans that are 90 days past due and still accruing, which are insured by U.S. government agencies under the FFELP, of $625 million and $542 million, respectively. These amounts are ex-cluded as reimbursement of insured amounts is proceeding normally.
(b) Excludes PCI loans that were acquired as part of the Washington Mutual transac-tion, which are accounted for on a pool basis. Since each pool is accounted for as a single asset with a single composite interest rate and an aggregate expectation of cash flows, the past-due status of the pools, or that of individual loans within the pools, is not meaningful. Because the Firm is recognizing interest income on each pool of loans, they are all considered to be performing.
Nonaccrual loans: Total consumer nonaccrual loans, excluding
credit card, were $8.8 billion, compared with $10.7 billion at
December 31, 2009. Nonaccrual loans have stabilized, but re-
mained at elevated levels. The increase in loan modification activi-
ties is expected to continue to result in elevated levels of
nonaccrual loans in the residential real estate portfolios as a result
of both redefault of modified loans as well as the Firm’s policy that
modified loans remain in nonaccrual status until repayment is
reasonably assured and the borrower has made a minimum of six
payments under the new terms. Nonaccrual loans in the residential
real estate portfolio totaled $7.8 billion at December 31, 2010, of
which 71% were greater than 150 days past due; this compared
with nonaccrual residential real estate loans of $9.6 billion at
December 31, 2009, of which 64% were greater than 150 days
past due. Modified residential real estate loans of $1.3 billion and
$920 million at December 31, 2010 and 2009, respectively, were
classified as nonaccrual loans. Of these modified residential real
estate loans, $580 million and $256 million had yet to make six
payments under their modified terms at December 31, 2010 and
2009, respectively, with the remaining nonaccrual modified loans
having redefaulted. In the aggregate, the unpaid principal balance
of residential real estate loans greater than 150 days past due was
charged down by approximately 46% and 36% to estimated collat-
eral value at December 31, 2010 and 2009, respectively.
Real estate owned (“REO”): As part of the residential real
estate foreclosure process, loans are written down to the fair value
of the underlying real estate asset, less costs to sell, at acquisition.
Typically, any further gains or losses on REO assets are recorded as
part of other income. In those instances where the Firm gains
ownership and possession of individual properties at the comple-
tion of the foreclosure process, these REO assets are managed for
prompt sale and disposition at the best possible economic value.
Operating expense, such as real estate taxes and maintenance, are
charged to other expense. REO assets, excluding those insured by
U.S. government agencies, increased by $138 million from Decem-
ber 31, 2009 to $1.3 billion, primarily related to foreclosures of
non-PCI loans. It is anticipated that REO assets will continue to
increase over the next several quarters, as loans moving through
the foreclosure process are expected to increase.
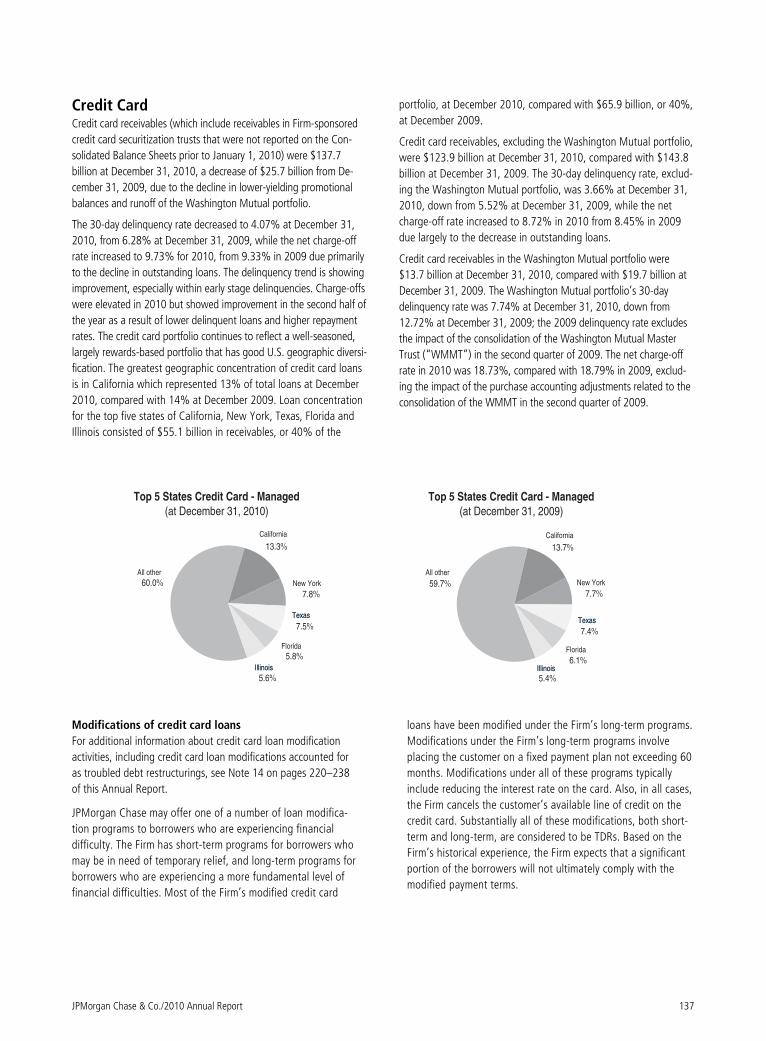
JPMorgan Chase & Co./2010 Annual Report 137
Credit Card Credit card receivables (which include receivables in Firm-sponsored
credit card securitization trusts that were not reported on the Con-
solidated Balance Sheets prior to January 1, 2010) were $137.7
billion at December 31, 2010, a decrease of $25.7 billion from De-
cember 31, 2009, due to the decline in lower-yielding promotional
balances and runoff of the Washington Mutual portfolio.
The 30-day delinquency rate decreased to 4.07% at December 31,
2010, from 6.28% at December 31, 2009, while the net charge-off
rate increased to 9.73% for 2010, from 9.33% in 2009 due primarily
to the decline in outstanding loans. The delinquency trend is showing
improvement, especially within early stage delinquencies. Charge-offs
were elevated in 2010 but showed improvement in the second half of
the year as a result of lower delinquent loans and higher repayment
rates. The credit card portfolio continues to reflect a well-seasoned,
largely rewards-based portfolio that has good U.S. geographic diversi-
fication. The greatest geographic concentration of credit card loans
is in California which represented 13% of total loans at December
2010, compared with 14% at December 2009. Loan concentration
for the top five states of California, New York, Texas, Florida and
Illinois consisted of $55.1 billion in receivables, or 40% of the
portfolio, at December 2010, compared with $65.9 billion, or 40%,
at December 2009.
Credit card receivables, excluding the Washington Mutual portfolio,
were $123.9 billion at December 31, 2010, compared with $143.8
billion at December 31, 2009. The 30-day delinquency rate, exclud-
ing the Washington Mutual portfolio, was 3.66% at December 31,
2010, down from 5.52% at December 31, 2009, while the net
charge-off rate increased to 8.72% in 2010 from 8.45% in 2009
due largely to the decrease in outstanding loans.
Credit card receivables in the Washington Mutual portfolio were
$13.7 billion at December 31, 2010, compared with $19.7 billion at
December 31, 2009. The Washington Mutual portfolio’s 30-day
delinquency rate was 7.74% at December 31, 2010, down from
12.72% at December 31, 2009; the 2009 delinquency rate excludes
the impact of the consolidation of the Washington Mutual Master
Trust (“WMMT”) in the second quarter of 2009. The net charge-off
rate in 2010 was 18.73%, compared with 18.79% in 2009, exclud-
ing the impact of the purchase accounting adjustments related to the
consolidation of the WMMT in the second quarter of 2009.
Modifications of credit card loans
For additional information about credit card loan modification
activities, including credit card loan modifications accounted for
as troubled debt restructurings, see Note 14 on pages 220–238
of this Annual Report.
JPMorgan Chase may offer one of a number of loan modifica-
tion programs to borrowers who are experiencing financial
difficulty. The Firm has short-term programs for borrowers who
may be in need of temporary relief, and long-term programs for
borrowers who are experiencing a more fundamental level of
financial difficulties. Most of the Firm’s modified credit card
loans have been modified under the Firm’s long-term programs.
Modifications under the Firm’s long-term programs involve
placing the customer on a fixed payment plan not exceeding 60
months. Modifications under all of these programs typically
include reducing the interest rate on the card. Also, in all cases,
the Firm cancels the customer’s available line of credit on the
credit card. Substantially all of these modifications, both short-
term and long-term, are considered to be TDRs. Based on the
Firm’s historical experience, the Firm expects that a significant
portion of the borrowers will not ultimately comply with the
modified payment terms.
Top 5 States Credit Card - Managed
(at December 31, 2010)
California
TexasTexas
New York60.0%
13.3%
7.5%
Florida
7.8%
5.8%
5.6%IllinoisIllinois
All other
California
TexasTexas
New York59.7%
13.7%
7.4%
Florida
7.7%
6.1%
5.4%IllinoisIllinois
All other
Top 5 States Credit Card - Managed
(at December 31, 2009)
Management’s discussion and analysis
138 JPMorgan Chase & Co./2010 Annual Report
If the cardholder does not comply with the modified payment
terms, then the credit card loan agreement generally reverts back
to its pre-modification payment rate terms. Assuming that those
borrowers do not begin to perform in accordance with those
payment terms, the loans continue to age and will ultimately be
charged off in accordance with the Firm’s standard charge-off
policy. In addition, if a borrower successfully completes a short-
term modification program, then the loan reverts back to its pre-
modification payment terms. However, in most cases the Firm
does not reinstate the borrower’s line of credit.
At December 31, 2010 and 2009, the Firm had $10.0 billion and
$6.2 billion, respectively, of on–balance sheet credit card loans
outstanding that have been modified in troubled debt restructur-
ings. These balances include both credit card loans with modified
payment terms and credit card loans that have reverted back to
their pre-modification payment terms. The increase in modified
credit card loans outstanding from December 31, 2009, to Decem-
ber 31, 2010, is primarily attributable to previously-modified loans
held in Firm-sponsored credit card securitization trusts being con-
solidated as a result of adopting the new accounting guidance
regarding consolidation of VIEs.
Consistent with the Firm’s policy, all credit card loans typically
remain on accrual status. However, the Firm separately establishes
an allowance for the estimated uncollectible portion of billed and
accrued interest and fee income on credit card loans.
COMMUNITY REINVESTMENT ACT EXPOSURE
The Community Reinvestment Act (“CRA”) encourages banks
to meet the credit needs of borrowers in all segments of their
communities, including neighborhoods with low or moderate
incomes. JPMorgan Chase is a national leader in community
development by providing loans, investments and community
development services in communities across the United States.
At December 31, 2010 and 2009, the Firm’s CRA loan portfolio
was approximately $16 billion and $18 billion, respectively. Of
the CRA portfolio 65% were residential mortgage loans and
15% were business banking loans at both December 31, 2010
and 2009, respectively; 9% and 8%, respectively, were com-
mercial real estate loans; and 11% and 12%, respectively, were
other loans. The CRA nonaccrual loans were 6% of the Firm’s
nonaccrual loans at both December 31, 2010 and 2009. Net
charge-offs in the CRA portfolio were 3% of the Firm’s net
charge-offs in both 2010 and 2009.
JPMorgan Chase & Co./2010 Annual Report 139
ALLOWANCE FOR CREDIT LOSSES
JPMorgan Chase’s allowance for loan losses covers the wholesale
(risk-rated), and consumer (primarily scored) portfolios. The allow-
ance represents management’s estimate of probable credit losses
inherent in the Firm’s loan portfolio. Management also determines
an allowance for wholesale and consumer (excluding credit card)
lending-related commitments using a methodology similar to that
used for the wholesale loans. During 2010, the Firm did not make
any significant changes to the methodologies or policies used to
establish its allowance for credit losses.
For a further discussion of the components of the allowance for
credit losses, see Critical Accounting Estimates Used by the Firm on
pages 149–154 and Note 15 on pages 239–243 of this Annual
Report.
At least quarterly, the allowance for credit losses is reviewed by the
Chief Risk Officer, the Chief Financial Officer and the Controller of
the Firm and discussed with the Risk Policy and Audit Committees
of the Board of Directors of the Firm. As of December 31, 2010,
JPMorgan Chase deemed the allowance for credit losses to be
appropriate (i.e., sufficient to absorb losses inherent in the portfo-
lio, including those not yet identifiable).
The allowance for credit losses was $33.0 billion at December 31,
2010, an increase of $442 million from $32.5 billion at December
31, 2009. The increase was primarily due to the Firm’s adoption
of accounting guidance related to VIEs. As a result of the consoli-
dation of certain securitization entities, the Firm established an
allowance for loan losses of $7.5 billion at January 1, 2010,
primarily related to the receivables that had been held in credit
card securitization trusts. Excluding the $7.5 billion transition
adjustment at adoption, the allowance decreased by $6.8 billion
in the consumer and wholesale portfolios, generally reflecting an
improvement in credit quality.
The consumer (excluding credit card) allowance for loan losses
increased $1.6 billion largely due to a $3.4 billion increase related
to further estimated deterioration in the Washington Mutual PCI
pools, partially offset by a $1.8 billion reduction predominantly in
non-credit-impaired residential real estate reserves reflecting im-
proved loss outlook as a result of the resumption of favorable
delinquency trends at the end of 2010, as well as a $632 million
adjustment related to the estimated net realizable value of the
collateral underlying delinquent residential home loans. For addi-
tional information, refer to page 131 of this Annual Report.
The credit card allowance for loan losses increased $1.4 billion
from December 31, 2009, largely due to the impact of the adoption
of the accounting guidance related to VIEs. Excluding the effect of
the transition adjustment at adoption, the credit card allowance
decreased by $6.0 billion from December 31, 2009, reflecting lower
estimated losses primarily related to improved delinquency trends
as well as lower levels of outstandings.
The wholesale allowance for loan losses decreased by $2.4 billion
from December 31, 2009, primarily due to repayments and loan
sales, as well as continued improvement in the credit quality of the
commercial and industrial loan portfolio.
The allowance for lending-related commitments for both wholesale
and consumer (excluding credit card), which is reported in other
liabilities, was $717 million and $939 million at December 31,
2010 and 2009, respectively. The decrease primarily reflected the
continued improvement in the credit quality of the wholesale com-
mercial and industrial loan portfolio.
The credit ratios in the table below are based on retained loan
balances, which exclude loans held-for-sale and loans accounted
for at fair value.
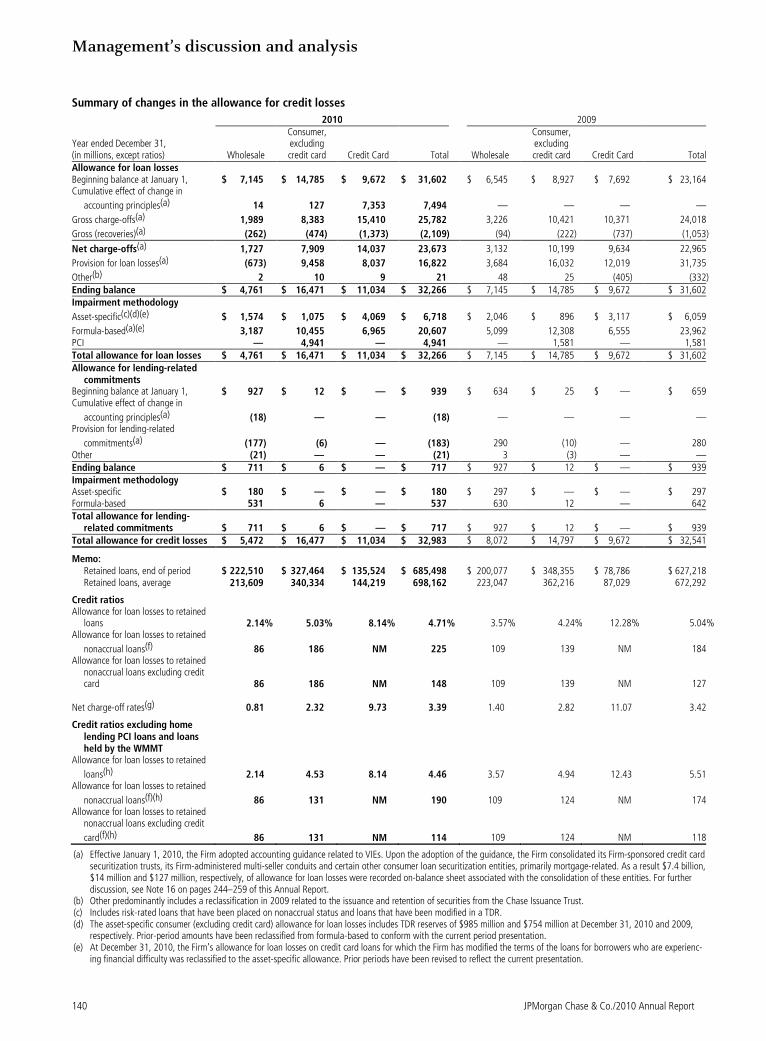
Management’s discussion and analysis
140 JPMorgan Chase & Co./2010 Annual Report
Summary of changes in the allowance for credit losses
2010 2009
Year ended December 31, (in millions, except ratios) Wholesale
Consumer, excluding credit card Credit Card Total Wholesale
Consumer, excluding credit card Credit Card Total
Allowance for loan losses Beginning balance at January 1, $ 7,145 $ 14,785 $ 9,672 $ 31,602 $ 6,545 $ 8,927 $ 7,692 $ 23,164 Cumulative effect of change in
accounting principles(a) 14 127 7,353 7,494 — — — —
Gross charge-offs(a) 1,989 8,383 15,410 25,782 3,226 10,421 10,371 24,018
Gross (recoveries)(a) (262) (474) (1,373) (2,109) (94) (222) (737) (1,053)
Net charge-offs(a) 1,727 7,909 14,037 23,673 3,132 10,199 9,634 22,965
Provision for loan losses(a) (673) 9,458 8,037 16,822 3,684 16,032 12,019 31,735
Other(b) 2 10 9 21 48 25 (405) (332) Ending balance $ 4,761 $ 16,471 $ 11,034 $ 32,266 $ 7,145 $ 14,785 $ 9,672 $ 31,602 Impairment methodology
Asset-specific(c)(d)(e) $ 1,574 $ 1,075 $ 4,069 $ 6,718 $ 2,046 $ 896 $ 3,117 $ 6,059
Formula-based(a)(e) 3,187 10,455 6,965 20,607 5,099 12,308 6,555 23,962 PCI — 4,941 — 4,941 — 1,581 — 1,581 Total allowance for loan losses $ 4,761 $ 16,471 $ 11,034 $ 32,266 $ 7,145 $ 14,785 $ 9,672 $ 31,602 Allowance for lending-related
commitments Beginning balance at January 1, $ 927 $ 12 $ — $ 939 $ 634 $ 25 $ — $ 659 Cumulative effect of change in
accounting principles(a) (18) — — (18) — — — — Provision for lending-related
commitments(a) (177) (6) — (183) 290 (10) — 280 Other (21) — — (21) 3 (3) — — Ending balance $ 711 $ 6 $ — $ 717 $ 927 $ 12 $ — $ 939 Impairment methodology Asset-specific $ 180 $ — $ — $ 180 $ 297 $ — $ — $ 297 Formula-based 531 6 — 537 630 12 — 642 Total allowance for lending-
related commitments $ 711 $ 6 $ — $ 717 $ 927 $ 12 $ — $ 939 Total allowance for credit losses $ 5,472 $ 16,477 $ 11,034 $ 32,983 $ 8,072 $ 14,797 $ 9,672 $ 32,541
Memo: Retained loans, end of period $ 222,510 $ 327,464 $ 135,524 $ 685,498 $ 200,077 $ 348,355 $ 78,786 $ 627,218 Retained loans, average 213,609 340,334 144,219 698,162 223,047 362,216 87,029 672,292
Credit ratios Allowance for loan losses to retained
loans 2.14% 5.03% 8.14% 4.71% 3.57% 4.24% 12.28% 5.04% Allowance for loan losses to retained
nonaccrual loans(f) 86 186
NM
225 109 139 NM 184
Allowance for loan losses to retained nonaccrual loans excluding credit card 86
186
NM
148 109 139 NM 127
Net charge-off rates(g) 0.81
2.32
9.73
3.39 1.40 2.82 11.07 3.42
Credit ratios excluding home lending PCI loans and loans held by the WMMT
Allowance for loan losses to retained
loans(h) 2.14
4.53
8.14
4.46 3.57 4.94 12.43 5.51
Allowance for loan losses to retained
nonaccrual loans(f)(h) 86 131
NM
190 109 124 NM 174
Allowance for loan losses to retained nonaccrual loans excluding credit
card(f)(h) 86 131
NM
114 109 124 NM 118
(a) Effective January 1, 2010, the Firm adopted accounting guidance related to VIEs. Upon the adoption of the guidance, the Firm consolidated its Firm-sponsored credit card securitization trusts, its Firm-administered multi-seller conduits and certain other consumer loan securitization entities, primarily mortgage-related. As a result $7.4 billion, $14 million and $127 million, respectively, of allowance for loan losses were recorded on-balance sheet associated with the consolidation of these entities. For further discussion, see Note 16 on pages 244–259 of this Annual Report.
(b) Other predominantly includes a reclassification in 2009 related to the issuance and retention of securities from the Chase Issuance Trust. (c) Includes risk-rated loans that have been placed on nonaccrual status and loans that have been modified in a TDR. (d) The asset-specific consumer (excluding credit card) allowance for loan losses includes TDR reserves of $985 million and $754 million at December 31, 2010 and 2009,
respectively. Prior-period amounts have been reclassified from formula-based to conform with the current period presentation. (e) At December 31, 2010, the Firm’s allowance for loan losses on credit card loans for which the Firm has modified the terms of the loans for borrowers who are experienc-
ing financial difficulty was reclassified to the asset-specific allowance. Prior periods have been revised to reflect the current presentation.
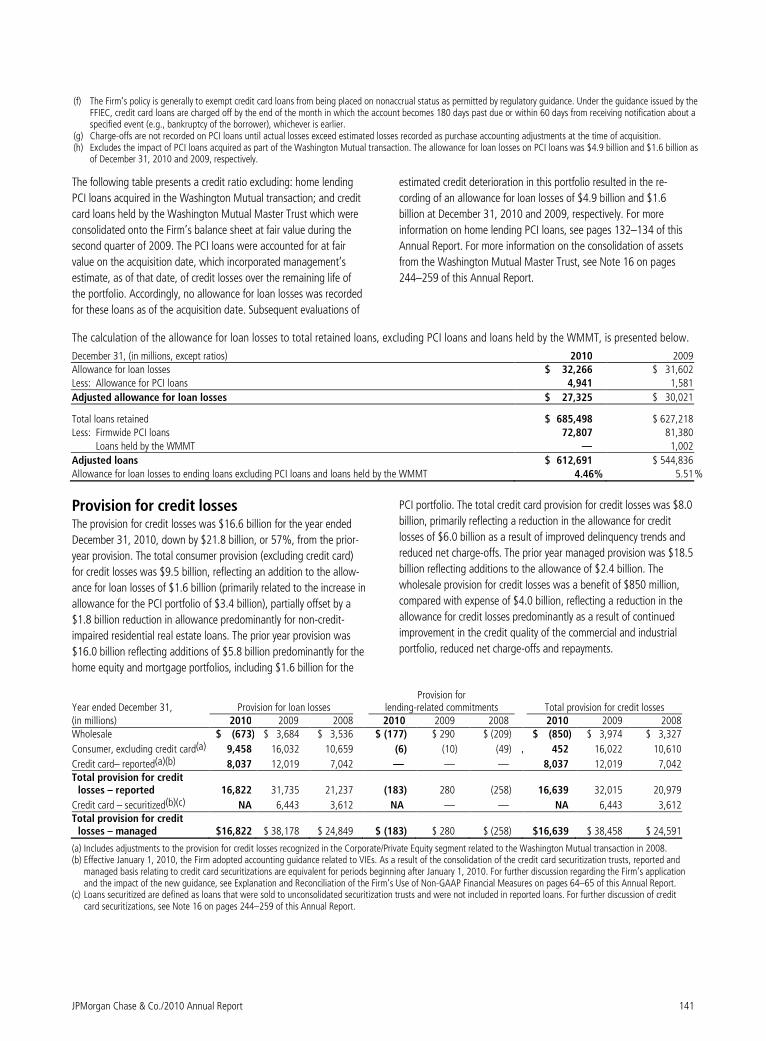
JPMorgan Chase & Co./2010 Annual Report 141
(f) The Firm’s policy is generally to exempt credit card loans from being placed on nonaccrual status as permitted by regulatory guidance. Under the guidance issued by the FFIEC, credit card loans are charged off by the end of the month in which the account becomes 180 days past due or within 60 days from receiving notification about a specified event (e.g., bankruptcy of the borrower), whichever is earlier.
(g) Charge-offs are not recorded on PCI loans until actual losses exceed estimated losses recorded as purchase accounting adjustments at the time of acquisition. (h) Excludes the impact of PCI loans acquired as part of the Washington Mutual transaction. The allowance for loan losses on PCI loans was $4.9 billion and $1.6 billion as
of December 31, 2010 and 2009, respectively.
The following table presents a credit ratio excluding: home lending
PCI loans acquired in the Washington Mutual transaction; and credit
card loans held by the Washington Mutual Master Trust which were
consolidated onto the Firm’s balance sheet at fair value during the
second quarter of 2009. The PCI loans were accounted for at fair
value on the acquisition date, which incorporated management’s
estimate, as of that date, of credit losses over the remaining life of
the portfolio. Accordingly, no allowance for loan losses was recorded
for these loans as of the acquisition date. Subsequent evaluations of
estimated credit deterioration in this portfolio resulted in the re-
cording of an allowance for loan losses of $4.9 billion and $1.6
billion at December 31, 2010 and 2009, respectively. For more
information on home lending PCI loans, see pages 132–134 of this
Annual Report. For more information on the consolidation of assets
from the Washington Mutual Master Trust, see Note 16 on pages
244–259 of this Annual Report.
The calculation of the allowance for loan losses to total retained loans, excluding PCI loans and loans held by the WMMT, is presented below.
December 31, (in millions, except ratios) 2010 2009
Allowance for loan losses $ 32,266 $ 31,602
Less: Allowance for PCI loans 4,941 1,581
Adjusted allowance for loan losses $ 27,325 $ 30,021
Total loans retained $ 685,498 $ 627,218
Less: Firmwide PCI loans 72,807 81,380
Loans held by the WMMT — 1,002
Adjusted loans $ 612,691 $ 544,836
Allowance for loan losses to ending loans excluding PCI loans and loans held by the WMMT 4.46% 5.51 %
Provision for credit losses The provision for credit losses was $16.6 billion for the year ended
December 31, 2010, down by $21.8 billion, or 57%, from the prior-
year provision. The total consumer provision (excluding credit card)
for credit losses was $9.5 billion, reflecting an addition to the allow-
ance for loan losses of $1.6 billion (primarily related to the increase in
allowance for the PCI portfolio of $3.4 billion), partially offset by a
$1.8 billion reduction in allowance predominantly for non-credit-
impaired residential real estate loans. The prior year provision was
$16.0 billion reflecting additions of $5.8 billion predominantly for the
home equity and mortgage portfolios, including $1.6 billion for the
PCI portfolio. The total credit card provision for credit losses was $8.0
billion, primarily reflecting a reduction in the allowance for credit
losses of $6.0 billion as a result of improved delinquency trends and
reduced net charge-offs. The prior year managed provision was $18.5
billion reflecting additions to the allowance of $2.4 billion. The
wholesale provision for credit losses was a benefit of $850 million,
compared with expense of $4.0 billion, reflecting a reduction in the
allowance for credit losses predominantly as a result of continued
improvement in the credit quality of the commercial and industrial
portfolio, reduced net charge-offs and repayments.
Year ended December 31, Provision for loan losses Provision for
lending-related commitments Total provision for credit losses (in millions) 2010 2009 2008 2010 2009 2008 2010 2009 2008 Wholesale $ (673) $ 3,684 $ 3,536 $ (177) $ 290 $ (209) $ (850) $ 3,974 $ 3,327
Consumer, excluding credit card(a) 9,458 16,032 10,659 (6) (10) (49) 9, 452 16,022 10,610
Credit card– reported(a)(b) 8,037 12,019 7,042 — — — 8,037 12,019 7,042 Total provision for credit
losses – reported 16,822 31,735 21,237 (183) 280 (258) 16,639 32,015 20,979
Credit card – securitized(b)(c) NA 6,443 3,612 NA — — NA 6,443 3,612 Total provision for credit
losses – managed $16,822 $ 38,178 $ 24,849 $ (183) $ 280 $ (258) $16,639 $ 38,458 $ 24,591
(a) Includes adjustments to the provision for credit losses recognized in the Corporate/Private Equity segment related to the Washington Mutual transaction in 2008. (b) Effective January 1, 2010, the Firm adopted accounting guidance related to VIEs. As a result of the consolidation of the credit card securitization trusts, reported and
managed basis relating to credit card securitizations are equivalent for periods beginning after January 1, 2010. For further discussion regarding the Firm’s application and the impact of the new guidance, see Explanation and Reconciliation of the Firm’s Use of Non-GAAP Financial Measures on pages 64–65 of this Annual Report.
(c) Loans securitized are defined as loans that were sold to unconsolidated securitization trusts and were not included in reported loans. For further discussion of credit card securitizations, see Note 16 on pages 244–259 of this Annual Report.
Management’s discussion and analysis
142 JPMorgan Chase & Co./2010 Annual Report
MARKET RISK MANAGEMENT
Market risk is the exposure to an adverse change in the market
value of portfolios and financial instruments caused by a change in
market prices or rates.
Market risk management
Market Risk is an independent risk management function that
works in close partnership with the business segments to identify
and monitor market risks throughout the Firm and to define market
risk policies and procedures. The risk management function is
headed by the Firm’s Chief Risk Officer.
Market Risk seeks to facilitate efficient risk/return decisions,
reduce volatility in operating performance and provide transpar-
ency into the Firm’s market risk profile for senior management,
the Board of Directors and regulators. Market Risk is responsible
for the following functions:
• establishing a market risk policy framework
• independent measurement, monitoring and control of line-of-
business market risk
• definition, approval and monitoring of limits
• performance of stress testing and qualitative risk assessments
Risk identification and classification
Each line of business is responsible for the comprehensive identifi-
cation and verification of market risks within its units. The Firm’s
market risks arise primarily from the activities in IB, Mortgage
Banking, and CIO in Corporate/Private Equity.
IB makes markets and trades its products across the fixed income,
foreign exchange, equities and commodities markets. This trading
activity may lead to a potential decline in net income due to ad-
verse changes in market rates. In addition to these trading risks,
there are risks in IB’s credit portfolio from retained loans and com-
mitments, derivative credit valuation adjustments, hedges of the
credit valuation adjustments and mark-to-market hedges of the
retained loan portfolio. Additional risk positions result from the
debit valuation adjustments taken on certain structured liabilities
and derivatives to reflect the credit quality of the Firm.
The Firm’s Mortgage Banking business includes the Firm’s mortgage
pipeline and warehouse loans, MSRs and all related hedges. These
activities give rise to complex interest rate risks, as well as option
and basis risk. Option risk arises primarily from prepayment options
embedded in mortgages and changes in the probability of newly
originated mortgage commitments actually closing. Basis risk results
from differences in the relative movements of the rate indices under-
lying mortgage exposure and other interest rates.
CIO is primarily concerned with managing structural risks which
arise out of the various business activities of the Firm. Market Risk
measures and monitors the gross structural exposures as well as
the net exposures related to these activities.
Risk measurement Tools used to measure risk
Because no single measure can reflect all aspects of market
risk, the Firm uses various metrics, both statistical and nonsta-
tistical, including:
• Value-at-risk (“VaR”)
• Economic-value stress testing
• Nonstatistical risk measures
• Loss advisories
• Revenue drawdowns
• Risk identification for large exposures (“RIFLEs”)
• Earnings-at-risk stress testing
Value-at-risk
JPMorgan Chase utilizes VaR, a statistical risk measure, to estimate
the potential loss from adverse market moves. Each business day,
as part of its risk management activities, the Firm undertakes a
comprehensive VaR calculation that includes the majority of its
material market risks. VaR provides a consistent cross-business
measure of risk profiles and levels of diversification and is used for
comparing risks across businesses and monitoring limits. These VaR
results are reported to senior management and regulators, and they
feed regulatory capital calculations.
The Firm calculates VaR to estimate possible economic outcomes
for current positions using historical data from the previous twelve
months. This approach assumes that historical changes in market
values are representative of current risk; this assumption may not
always be valid. VaR is calculated using a one-day time horizon and
an expected tail-loss methodology, which approximates a 95%
confidence level. This means the Firm would expect to incur losses
greater than that predicted by VaR estimates five times in every
100 trading days, or about 12 to 13 times a year.
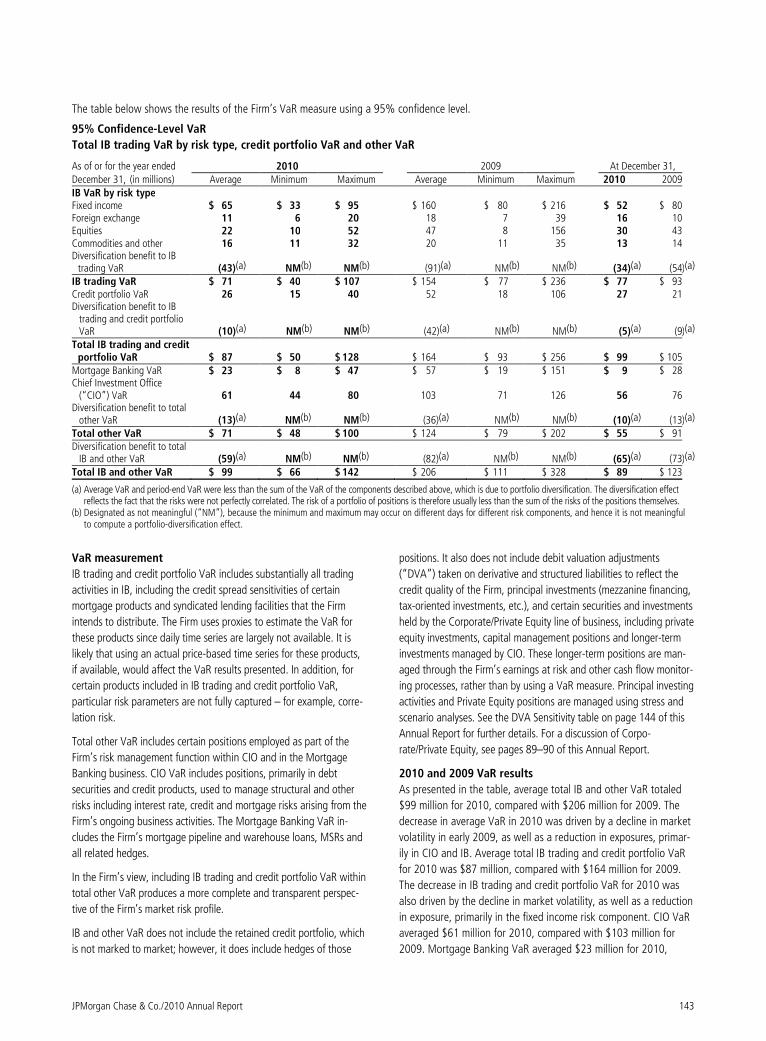
JPMorgan Chase & Co./2010 Annual Report 143
The table below shows the results of the Firm’s VaR measure using a 95% confidence level.
95% Confidence-Level VaR
Total IB trading VaR by risk type, credit portfolio VaR and other VaR
As of or for the year ended 2010 2009 At December 31, December 31, (in millions) Average Minimum Maximum Average Minimum Maximum 2010 2009 IB VaR by risk type Fixed income $ 65 $ 33 $ 95 $ 160 $ 80 $ 216 $ 52 $ 80 Foreign exchange 11 6 20 18 7 39 16 10 Equities 22 10 52 47 8 156 30 43 Commodities and other 16 11 32 20 11 35 13 14 Diversification benefit to IB
trading VaR (43)(a) NM(b) NM(b) (91)(a) NM(b) NM(b) (34)(a) (54)(a)
IB trading VaR $ 71 $ 40 $ 107 $ 154 $ 77 $ 236 $ 77 $ 93 Credit portfolio VaR 26 15 40 52 18 106 27 21 Diversification benefit to IB
trading and credit portfolio VaR (10)(a) NM(b) NM(b) (42)(a) NM(b) NM(b) (5)(a) (9)(a)
Total IB trading and credit portfolio VaR $ 87 $ 50 $ 128 $ 164 $ 93 $ 256 $ 99 $ 105
Mortgage Banking VaR $ 23 $ 8 $ 47 $ 57 $ 19 $ 151 $ 9 $ 28 Chief Investment Office
(“CIO”) VaR 61 44 80 103 71 126 56 76
Diversification benefit to total other VaR (13)(a) NM(b) NM(b) (36)(a) NM(b) NM(b) (10)(a) (13)(a)
Total other VaR $ 71 $ 48 $ 100 $ 124 $ 79 $ 202 $ 55 $ 91 Diversification benefit to total
IB and other VaR (59)(a) NM(b) NM(b) (82)(a) NM(b) NM(b) (65)(a) (73)(a)
Total IB and other VaR $ 99 $ 66 $ 142 $ 206 $ 111 $ 328 $ 89 $ 123
(a) Average VaR and period-end VaR were less than the sum of the VaR of the components described above, which is due to portfolio diversification. The diversification effect reflects the fact that the risks were not perfectly correlated. The risk of a portfolio of positions is therefore usually less than the sum of the risks of the positions themselves.
(b) Designated as not meaningful (“NM”), because the minimum and maximum may occur on different days for different risk components, and hence it is not meaningful to compute a portfolio-diversification effect.
VaR measurement
IB trading and credit portfolio VaR includes substantially all trading
activities in IB, including the credit spread sensitivities of certain
mortgage products and syndicated lending facilities that the Firm
intends to distribute. The Firm uses proxies to estimate the VaR for
these products since daily time series are largely not available. It is
likely that using an actual price-based time series for these products,
if available, would affect the VaR results presented. In addition, for
certain products included in IB trading and credit portfolio VaR,
particular risk parameters are not fully captured – for example, corre-
lation risk.
Total other VaR includes certain positions employed as part of the
Firm’s risk management function within CIO and in the Mortgage
Banking business. CIO VaR includes positions, primarily in debt
securities and credit products, used to manage structural and other
risks including interest rate, credit and mortgage risks arising from the
Firm’s ongoing business activities. The Mortgage Banking VaR in-
cludes the Firm’s mortgage pipeline and warehouse loans, MSRs and
all related hedges.
In the Firm’s view, including IB trading and credit portfolio VaR within
total other VaR produces a more complete and transparent perspec-
tive of the Firm’s market risk profile.
IB and other VaR does not include the retained credit portfolio, which
is not marked to market; however, it does include hedges of those
positions. It also does not include debit valuation adjustments
(“DVA”) taken on derivative and structured liabilities to reflect the
credit quality of the Firm, principal investments (mezzanine financing,
tax-oriented investments, etc.), and certain securities and investments
held by the Corporate/Private Equity line of business, including private
equity investments, capital management positions and longer-term
investments managed by CIO. These longer-term positions are man-
aged through the Firm’s earnings at risk and other cash flow monitor-
ing processes, rather than by using a VaR measure. Principal investing
activities and Private Equity positions are managed using stress and
scenario analyses. See the DVA Sensitivity table on page 144 of this
Annual Report for further details. For a discussion of Corpo-
rate/Private Equity, see pages 89–90 of this Annual Report.
2010 and 2009 VaR results
As presented in the table, average total IB and other VaR totaled
$99 million for 2010, compared with $206 million for 2009. The
decrease in average VaR in 2010 was driven by a decline in market
volatility in early 2009, as well as a reduction in exposures, primar-
ily in CIO and IB. Average total IB trading and credit portfolio VaR
for 2010 was $87 million, compared with $164 million for 2009.
The decrease in IB trading and credit portfolio VaR for 2010 was
also driven by the decline in market volatility, as well as a reduction
in exposure, primarily in the fixed income risk component. CIO VaR
averaged $61 million for 2010, compared with $103 million for
2009. Mortgage Banking VaR averaged $23 million for 2010,
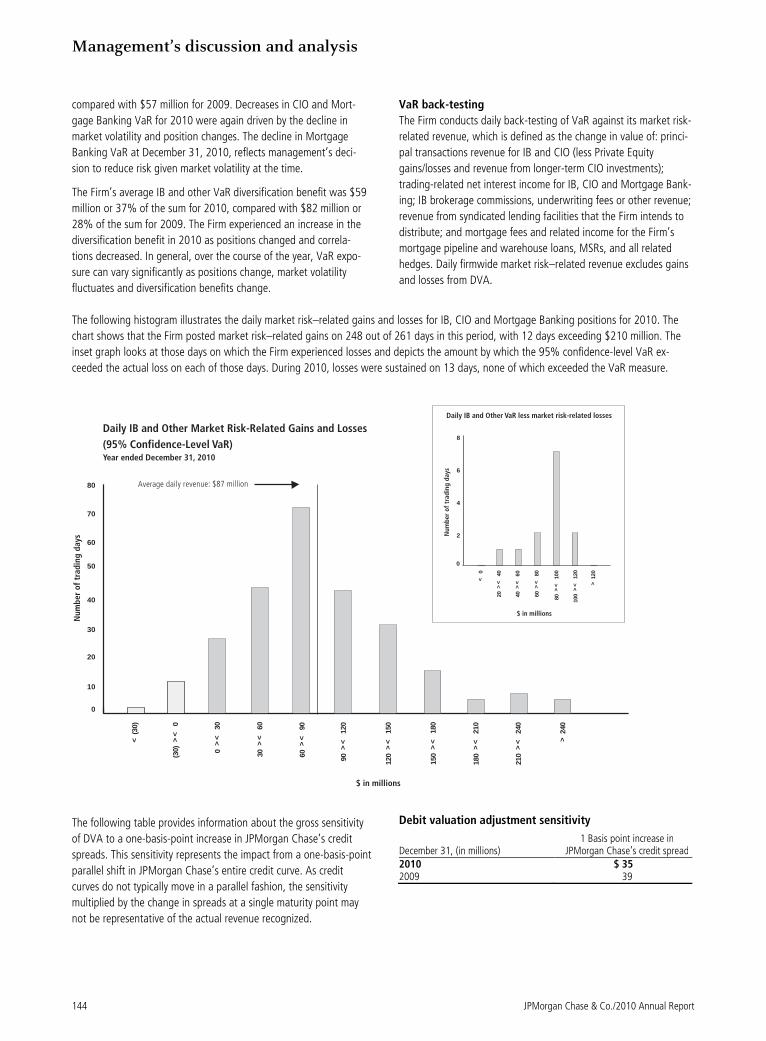
Management’s discussion and analysis
144 JPMorgan Chase & Co./2010 Annual Report
compared with $57 million for 2009. Decreases in CIO and Mort-
gage Banking VaR for 2010 were again driven by the decline in
market volatility and position changes. The decline in Mortgage
Banking VaR at December 31, 2010, reflects management’s deci-
sion to reduce risk given market volatility at the time.
The Firm’s average IB and other VaR diversification benefit was $59
million or 37% of the sum for 2010, compared with $82 million or
28% of the sum for 2009. The Firm experienced an increase in the
diversification benefit in 2010 as positions changed and correla-
tions decreased. In general, over the course of the year, VaR expo-
sure can vary significantly as positions change, market volatility
fluctuates and diversification benefits change.
VaR back-testing
The Firm conducts daily back-testing of VaR against its market risk-
related revenue, which is defined as the change in value of: princi-
pal transactions revenue for IB and CIO (less Private Equity
gains/losses and revenue from longer-term CIO investments);
trading-related net interest income for IB, CIO and Mortgage Bank-
ing; IB brokerage commissions, underwriting fees or other revenue;
revenue from syndicated lending facilities that the Firm intends to
distribute; and mortgage fees and related income for the Firm’s
mortgage pipeline and warehouse loans, MSRs, and all related
hedges. Daily firmwide market risk–related revenue excludes gains
and losses from DVA.
The following histogram illustrates the daily market risk–related gains and losses for IB, CIO and Mortgage Banking positions for 2010. The
chart shows that the Firm posted market risk–related gains on 248 out of 261 days in this period, with 12 days exceeding $210 million. The
inset graph looks at those days on which the Firm experienced losses and depicts the amount by which the 95% confidence-level VaR ex-
ceeded the actual loss on each of those days. During 2010, losses were sustained on 13 days, none of which exceeded the VaR measure.
< (3
0)
90 > <
120
120 > <
150
150 > <
180
180 > <
210
210 > <
240
30 > <
60
(30)
> <
0
Daily IB and Other Market Risk-Related Gains and Losses
(95% Confidence-Level VaR)Year ended December 31, 2010
Nu
mb
er
of
trad
ing
days
Average daily revenue: $87 million
0
10
20
30
40
50
60
70
80
$ in millions
2
4
6
8
< 0
20 > <
40
40 > <
60
60 > <
80
80 > <
100
> 120
$ in millions
Nu
mb
er
of
trad
ing
days
Daily IB and Other VaR less market risk-related losses
100 > <
120
0 > <
30
60 > <
90
0>
240
The following table provides information about the gross sensitivity
of DVA to a one-basis-point increase in JPMorgan Chase’s credit
spreads. This sensitivity represents the impact from a one-basis-point
parallel shift in JPMorgan Chase’s entire credit curve. As credit
curves do not typically move in a parallel fashion, the sensitivity
multiplied by the change in spreads at a single maturity point may
not be representative of the actual revenue recognized.
Debit valuation adjustment sensitivity
1 Basis point increase in December 31, (in millions) JPMorgan Chase’s credit spread 2010 $ 35 2009 39
JPMorgan Chase & Co./2010 Annual Report 145
Economic value stress testing
While VaR reflects the risk of loss due to adverse changes in mar-
kets using recent historical market behavior as an indicator of
losses, stress testing captures the Firm’s exposure to unlikely but
plausible events in abnormal markets using multiple scenarios that
assume significant changes in credit spreads, equity prices, interest
rates, currency rates or commodity prices. Scenarios are updated
dynamically and may be redefined on an ongoing basis to reflect current
market conditions. Along with VaR, stress testing is important in meas-
uring and controlling risk; it enhances understanding of the Firm’s risk
profile and loss potential, as stress losses are monitored against limits.
Stress testing is also employed in cross-business risk management.
Stress-test results, trends and explanations based on current market risk
positions are reported to the Firm’s senior management and to the lines
of business to allow them to better understand event risk–sensitive
positions and manage risks with more transparency.
Nonstatistical risk measures
Nonstatistical risk measures as well as stress testing include sensitivi-
ties to variables used to value positions, such as credit spread sensi-
tivities, interest rate basis point values and market values. These
measures provide granular information on the Firm’s market risk
exposure. They are aggregated by line-of-business and by risk type,
and are used for tactical control and monitoring limits.
Loss advisories and revenue drawdowns
Loss advisories and net revenue drawdowns are tools used to
highlight trading losses above certain levels of risk tolerance. Net
revenue drawdown is defined as the decline in net revenue since
the year-to-date peak revenue level.
Risk identification for large exposures
Individuals who manage risk positions in IB are responsible for
identifying potential losses that could arise from specific, unusual
events, such as a potential change in tax legislation, or a particu-
lar combination of unusual market moves. This information is
aggregated centrally for IB. Trading businesses are responsible for
RIFLEs, thereby permitting the Firm to monitor further earnings
vulnerability not adequately covered by standard risk measures.
Earnings-at-risk stress testing
The VaR and stress-test measures described above illustrate the
total economic sensitivity of the Firm’s Consolidated Balance
Sheets to changes in market variables. The effect of interest rate
exposure on reported net income is also important. Interest rate
risk exposure in the Firm’s core nontrading business activities
(i.e., asset/liability management positions, including accrual loans
within IB and CIO) results from on– and off–balance sheet posi-
tions. ALCO establishes the Firm’s interest rate risk policies, sets
risk guidelines and limits and reviews the risk profile of the Firm.
Treasury, working in partnership with the lines of business, calcu-
lates the Firm’s interest rate risk profile weekly and reports to
senior management.
Interest rate risk for nontrading activities can occur due to a
variety of factors, including:
• Differences in the timing among the maturity or repricing
of assets, liabilities and off–balance sheet instruments. For
example, if liabilities reprice more quickly than assets and fund-
ing interest rates are declining, earnings will increase initially.
• Differences in the amounts of assets, liabilities and off–balance
sheet instruments that are repricing at the same time. For example,
if more deposit liabilities are repricing than assets when general
interest rates are declining, earnings will increase initially.
• Differences in the amounts by which short-term and long-term
market interest rates change (for example, changes in the
slope of the yield curve) because the Firm has the ability to
lend at long-term fixed rates and borrow at variable or short-
term fixed rates. Based on these scenarios, the Firm’s earnings
would be affected negatively by a sudden and unanticipated
increase in short-term rates paid on its liabilities (e.g., depos-
its) without a corresponding increase in long-term rates re-
ceived on its assets (e.g., loans). Conversely, higher long-term
rates received on assets generally are beneficial to earnings,
particularly when the increase is not accompanied by rising
short-term rates paid on liabilities.
• The impact of changes in the maturity of various assets, liabili-
ties or off–balance sheet instruments as interest rates change.
For example, if more borrowers than forecasted pay down
higher-rate loan balances when general interest rates are de-
clining, earnings may decrease initially.
The Firm manages interest rate exposure related to its assets and
liabilities on a consolidated, corporate-wide basis. Business units
transfer their interest rate risk to Treasury through a transfer-
pricing system, which takes into account the elements of interest
rate exposure that can be risk-managed in financial markets.
These elements include asset and liability balances and contrac-
tual rates of interest, contractual principal payment schedules,
expected prepayment experience, interest rate reset dates and
maturities, rate indices used for repricing, and any interest rate
ceilings or floors for adjustable rate products. All transfer-pricing
assumptions are dynamically reviewed.
The Firm conducts simulations of changes in net interest income
from its nontrading activities under a variety of interest rate
scenarios. Earnings-at-risk tests measure the potential change in
the Firm’s net interest income, and the corresponding impact to
the Firm’s pretax earnings, over the following 12 months. These
tests highlight exposures to various rate-sensitive factors, such as
the rates themselves (e.g., the prime lending rate), pricing strate-
gies on deposits, optionality and changes in product mix. The tests
include forecasted balance sheet changes, such as asset sales and
securitizations, as well as prepayment and reinvestment behavior.
Mortgage prepayment assumptions are based on current interest
rates compared with underlying contractual rates, the time since
origination, and other factors which are updated periodically based
on historical experience and forward market expectations. The
balance and pricing assumptions of deposits that have no stated
maturity are based on historical performance, the competitive
environment, customer behavior, and product mix.
Management’s discussion and analysis
146 JPMorgan Chase & Co./2010 Annual Report
Immediate changes in interest rates present a limited view of risk,
and so a number of alternative scenarios are also reviewed. These
scenarios include the implied forward curve, nonparallel rate shifts
and severe interest rate shocks on selected key rates. These scenar-
ios are intended to provide a comprehensive view of JPMorgan
Chase’s earnings at risk over a wide range of outcomes.
JPMorgan Chase’s 12-month pretax earnings sensitivity profiles as
of December 31, 2010 and 2009, were as follows.
Immediate change in rates December 31, (in millions) +200bp +100bp -100bp -200 bp
2010 $ 2,465 $ 1,483 NM(a)(b) NM (a)(b)
2009 (1,594) (554) NM(a) NM (a)
(a) Downward 100- and 200-basis-point parallel shocks result in a Fed Funds target rate of zero, and negative three- and six-month Treasury rates. The earnings-at-risk results of such a low-probability scenario are not meaningful.
(b) Excludes economic value stress losses.
The change in earnings at risk from December 31, 2009, resulted from
investment portfolio repositioning, assumed higher levels of deposit
balances and reduced levels of fixed-rate loans. The Firm’s risk to rising
rates was largely the result of widening deposit margins, which are
currently compressed due to very low short-term interest rates.
Additionally, another interest rate scenario conducted by the Firm –
involving a steeper yield curve with long-term rates rising by 100 basis
points and short-term rates staying at current levels – results in a 12-
month pretax earnings benefit of $770 million. The increase in earnings
under this scenario is due to reinvestment of maturing assets at the
higher long-term rates, with funding costs remaining unchanged.
Risk monitoring and control Limits
Market risk is controlled primarily through a series of limits.
Limits reflect the Firm’s risk appetite in the context of the market
environment and business strategy. In setting limits, the Firm
takes into consideration factors such as senior management risk
appetite, market volatility, product liquidity, accommodation of
client business and management experience.
Market risk management regularly reviews and updates risk limits.
Senior management, including the Firm’s Chief Executive Officer
and Chief Risk Officer, is responsible for reviewing and approving
cetain risk limits on an ongoing basis.
The Firm maintains different levels of limits. Corporate-level limits
include VaR and stress limits. Similarly, line-of-business limits include
VaR and stress limits and may be supplemented by loss advisories,
nonstatistical measurements and profit and loss drawdowns. Busi-
nesses are responsible for adhering to established limits, against
which exposures are monitored and reported. Limit breaches are
reported in a timely manner to senior management, and the affected
line-of-business is required to reduce trading positions or consult with
senior management on the appropriate action.
Model review
Some of the Firm’s financial instruments cannot be valued based on
quoted market prices but are instead valued using pricing models.
These pricing models and VaR models are used for management of
risk positions, such as reporting against limits, as well as for valua-
tion. The Model Risk Group, which is independent of the businesses
and market risk management, reviews the models the Firm uses and
assesses model appropriateness and consistency. The model reviews
consider a number of factors about the model’s suitability for valua-
tion and risk management of a particular product. These factors
include whether the model accurately reflects the characteristics of
the transaction and its significant risks, the suitability and conver-
gence properties of numerical algorithms, reliability of data sources,
consistency of the treatment with models for similar products, and
sensitivity to input parameters and assumptions that cannot be priced
from the market.
Reviews are conducted of new or changed models, as well as previ-
ously accepted models, to assess whether there have been any
changes in the product or market that may affect the model’s validity
and whether there are theoretical or competitive developments that
may require reassessment of the model’s adequacy. For a summary of
valuations based on models, see Critical Accounting Estimates Used
by the Firm on pages 149–154 of this Annual Report.
Risk reporting Nonstatistical risk measures, VaR, loss advisories and limit excesses
are reported daily to the lines of business and to senior manage-
ment. Market risk exposure trends, VaR trends, profit-and-loss
changes and portfolio concentrations are reported weekly. Stress-
test results are also reported weekly to the lines of business and to
senior management.
JPMorgan Chase & Co./2010 Annual Report 147
PRIVATE EQUITY RISK MANAGEMENT
The Firm makes principal investments in private equity. The illiquid
nature and long-term holding periods associated with these in-
vestments differentiates private equity risk from the risk of positions
held in the trading portfolios. The Firm’s approach to managing
private equity risk is consistent with the Firm’s general risk govern-
ance structure. Controls are in place establishing expected levels for
total and annual investment in order to control the overall size of
the portfolios. Industry and geographic concentration limits are in
place and intended to ensure diversification of the portfolios. All
investments are approved by investment committees that include
executives who are not part of the investing businesses. An inde-
pendent valuation function is responsible for reviewing the appro-
priateness of the carrying values of private equity investments in
accordance with relevant accounting policies. At December 31,
2010 and 2009, the carrying value of the Private Equity portfolio
was $8.7 billion and $7.3 billion, respectively, of which $875
million and $762 million, respectively, represented publicly-traded
positions. For further information on the Private Equity portfolio,
see page 90 of this Annual Report.
OPERATIONAL RISK MANAGEMENT
Operational risk is the risk of loss resulting from inadequate or failed
processes or systems, human factors or external events.
Overview
Operational risk is inherent in each of the Firm’s businesses and
support activities. Operational risk can manifest itself in various ways,
including errors, fraudulent acts, business interruptions, inappropriate
behavior of employees, or vendors that do not perform in accordance
with their arrangements. These events could result in financial losses
and other damage to the Firm, including reputational harm.
To monitor and control operational risk, the Firm maintains a system
of comprehensive policies and a control framework designed to
provide a sound and well-controlled operational environment. The
goal is to keep operational risk at appropriate levels, in light of the
Firm’s financial strength, the characteristics of its businesses, the
markets in which it operates, and the competitive and regulatory
environment to which it is subject. Notwithstanding these control
measures, the Firm incurs operational losses.
The Firm’s approach to operational risk management is intended to
mitigate such losses by supplementing traditional control-based
approaches to operational risk with risk measures, tools and disci-
plines that are risk-specific, consistently applied and utilized firmwide.
Key themes are transparency of information, escalation of key issues
and accountability for issue resolution.
One of the ways operational risk is mitigated is through insurance
maintained by the Firm. The Firm purchases insurance to be in com-
pliance with local laws and regulations, as well as to serve other
needs of the Firm. Insurance may also be required by third parties
with whom the Firm does business. The insurance purchased is
reviewed and approved by senior management.
The Firm’s operational risk framework is supported by Phoenix, an
internally designed operational risk software tool. Phoenix integrates
the individual components of the operational risk management
framework into a unified, web-based tool. Phoenix enhances the
capture, reporting and analysis of operational risk data by enabling
risk identification, measurement, monitoring, reporting and analysis
to be done in an integrated manner, thereby enabling efficiencies in
the Firm’s monitoring and management of its operational risk.
For purposes of identification, monitoring, reporting and analysis, the
Firm categorizes operational risk events as follows:
• Client service and selection
• Business practices
• Fraud, theft and malice
• Execution, delivery and process management
• Employee disputes
• Disasters and public safety
• Technology and infrastructure failures
Risk identification
Risk identification is the recognition of the operational risk events that
management believes may give rise to operational losses. All busi-
nesses utilize the Firm’s standard self-assessment process and sup-
porting architecture as a dynamic risk management tool. The goal of
the self-assessment process is for each business to identify the key
operational risks specific to its environment and assess the degree to
which it maintains appropriate controls. Action plans are developed
for control issues that are identified, and businesses are held ac-
countable for tracking and resolving these issues on a timely basis.
Risk measurement
Operational risk is measured for each business on the basis of histori-
cal loss experience using a statistically based loss-distribution ap-
proach. The current business environment, potential stress scenarios
and measures of the control environment are then factored into the
statistical measure in determining firmwide operational risk capital.
This methodology is designed to comply with the advanced meas-
urement rules under the Basel II Framework.
Risk monitoring
The Firm has a process for monitoring operational risk-event data,
permitting analysis of errors and losses as well as trends. Such analy-
sis, performed both at a line-of-business level and by risk-event type,
enables identification of the causes associated with risk events faced
by the businesses. Where available, the internal data can be supple-
mented with external data for comparative analysis with industry
patterns. The data reported enables the Firm to back-test against self-
assessment results. The Firm is a founding member of the Operational
Riskdata eXchange Association, a not-for-profit industry association
formed for the purpose of collecting operational loss data, sharing
data in an anonymous form and benchmarking results back to mem-
Management’s discussion and analysis
148 JPMorgan Chase & Co./2010 Annual Report
bers. Such information supplements the Firm’s ongoing operational
risk measurement and analysis.
Risk reporting and analysis
Operational risk management reports provide timely and accurate
information, including information about actual operational loss levels
and self-assessment results, to the lines of business and senior man-
agement. The purpose of these reports is to enable management to
maintain operational risk at appropriate levels within each line of
business, to escalate issues and to provide consistent data aggrega-
tion across the Firm’s businesses and support areas.
Audit alignment
Internal Audit utilizes a risk-based program of audit coverage to
provide an independent assessment of the design and effectiveness of
key controls over the Firm’s operations, regulatory compliance and
reporting. This includes reviewing the operational risk framework, the
effectiveness of the business self-assessment process, and the loss
data-collection and reporting activities.
REPUTATION AND FIDUCIARY RISK MANAGEMENT
The Firm’s success depends not only on its prudent management of
the liquidity, credit, market and operational risks that are part of its
business risk, but equally on the maintenance among its many
constituents—customers and clients, investors, regulators, as well
as the general public—of a reputation for business practices of the
highest quality. Attention to reputation has always been a key
aspect of the Firm’s practices, and maintenance of the Firm’s repu-
tation is the responsibility of each individual employee at the Firm.
JPMorgan Chase bolsters this individual responsibility in many
ways, including through the Firm’s Code of Conduct, which is
based on the Firm’s fundamental belief that no one should ever
sacrifice integrity—or give the impression that he or she has—even
if one thinks it would help the Firm’s business. The Code requires
prompt reporting of any known or suspected violation of the Code,
any internal Firm policy, or any law or regulation applicable to the
Firm’s business. It also requires the reporting of any illegal conduct,
or conduct that violates the underlying principles of the Code, by
any of our customers, suppliers, contract workers, business partners
or agents. Concerns may be reported anonymously and the Firm
prohibits retaliation against employees for the good faith reporting
of any actual or suspected violations of the Code.
In addition to training of employees with regard to the principles
and requirements of the Code, and requiring annual affirmation by
each employee of compliance with the Code, the Firm has estab-
lished policies and procedures, and has in place various oversight
functions, intended to promote the Firm’s culture of “doing the
right thing”. These include a Conflicts Office which examines
wholesale transactions with the potential to create conflicts of
interest for the Firm. In addition, each line of business has a risk
committee which includes in its mandate oversight of the reputa-
tional risks in its business that may produce significant losses or
reputational damage. In IB, there is a separate Reputation Risk
Office and several regional reputation risk committees, members of
which are senior representatives of businesses and control func-
tions, that focus on transactions that raise reputational issues. Such
transactions may include, for example, complex derivatives and
structured finance transactions. The Firm also established this year
a Consumer Reputational Risk Committee, comprised of senior
management from the Firm’s Operating Committee, including the
heads of its primary consumer facing businesses, RFS and CS,
that helps to ensure that the Firm has a consistent, disciplined
focus on the review of the impact on consumers of Chase products
and practices, including any that could raise reputational issues.
Fiduciary Risk Management
The Fiduciary Risk Management function works with relevant line of
business risk committees, with the goal of ensuring that businesses
providing investment or risk management products or services that
give rise to fiduciary duties to clients perform at the appropriate
standard relative to their fiduciary relationship with a client. Of
particular focus are the policies and practices that address a busi-
ness’ responsibilities to a client, including performance and service
requirements and expectations; client suitability determinations;
and disclosure obligations and communications. In this way, the
relevant line of business risk committees, together with the Fiduci-
ary Risk Management function, provide oversight of the Firm’s
efforts to monitor, measure and control the performance and risks
that may arise in the delivery of products or services to clients that
give rise to such fiduciary duties, as well as those stemming from
any of the Firm’s fiduciary responsibilities under the Firm’s various
employee benefit plans.
JPMorgan Chase & Co./2010 Annual Report 149
CRITICAL ACCOUNTING ESTIMATES USED BY THE FIRM
JPMorgan Chase’s accounting policies and use of estimates are
integral to understanding its reported results. The Firm’s most com-
plex accounting estimates require management’s judgment to ascer-
tain the value of assets and liabilities. The Firm has established
detailed policies and control procedures intended to ensure that
valuation methods, including any judgments made as part of such
methods, are well-controlled, independently reviewed and applied
consistently from period to period. In addition, the policies and pro-
cedures are intended to ensure that the process for changing meth-
odologies occurs in an appropriate manner. The Firm believes its
estimates for determining the value of its assets and liabilities are
appropriate. The following is a brief description of the Firm’s critical
accounting estimates involving significant valuation judgments.
Allowance for credit losses
JPMorgan Chase’s allowance for credit losses covers the retained
wholesale and consumer loan portfolios, as well as the Firm’s
wholesale and consumer lending-related commitments. The allow-
ance for loan losses is intended to adjust the value of the Firm’s
loan assets to reflect probable credit losses inherent in the portfolio
as of the balance sheet date. The allowance for lending-related
commitments is established to cover probable losses in the lending-
related commitments portfolio. For a further discussion of the
methodologies used in establishing the Firm’s allowance for credit
losses, see Note 15 on pages 239–243 of this Annual Report.
Wholesale loans and lending-related commitments
The methodology for calculating the allowance for loan losses and
the allowance for lending-related commitments involves significant
judgment. First and foremost, it involves the early identification of
credits that are deteriorating. Second, it involves judgment in
establishing the inputs used to estimate the allowances. Third, it
involves management judgment to evaluate certain macroeconomic
factors, underwriting standards, and other relevant internal and
external factors affecting the credit quality of the current portfolio,
and to refine loss factors to better reflect these conditions.
The Firm uses a risk-rating system to determine the credit quality of
its wholesale loans. Wholesale loans are reviewed for information
affecting the obligor’s ability to fulfill its obligations. In assessing
the risk rating of a particular loan, among the factors considered
are the obligor’s debt capacity and financial flexibility, the level of
the obligor’s earnings, the amount and sources for repayment, the
level and nature of contingencies, management strength, and the
industry and geography in which the obligor operates. These factors
are based on an evaluation of historical and current information
and involve subjective assessment and interpretation. Emphasizing
one factor over another or considering additional factors could
affect the risk rating assigned by the Firm to that loan.
The Firm applies its judgment to establish loss factors used in calcu-
lating the allowances. Wherever possible, the Firm uses independent,
verifiable data or the Firm’s own historical loss experience in its
models for estimating the allowances. Many factors can affect esti-
mates of loss, including volatility of loss given default, probability of
default and rating migrations. Consideration is given as to whether
the loss estimates should be calculated as an average over the entire
credit cycle or at a particular point in the credit cycle, as well as to
which external data should be used and when they should be used.
Choosing data that are not reflective of the Firm’s specific loan port-
folio characteristics could also affect loss estimates. The application of
different inputs would change the amount of the allowance for credit
losses determined appropriate by the Firm.
Management also applies its judgment to adjust the loss factors
derived, taking into consideration model imprecision, external
factors and economic events that have occurred but are not yet
reflected in the loss factors. Historical experience of both loss given
default and probability of default are considered when estimating
these adjustments. Factors related to concentrated and deteriorat-
ing industries also are incorporated where relevant. These esti-
mates are based on management’s view of uncertainties that relate
to current macroeconomic and political conditions, quality of un-
derwriting standards and other relevant internal and external
factors affecting the credit quality of the current portfolio.
As noted above, the Firm’s wholesale allowance is sensitive to the
risk rating assigned to a loan. As of December 31, 2010, assuming a
one-notch downgrade in the Firm’s internal risk ratings for its entire
wholesale portfolio, the allowance for loan losses for the wholesale
portfolio would increase by approximately $1.3 billion. This sensitivity
analysis is hypothetical. In the Firm’s view, the likelihood of a one-
notch downgrade for all wholesale loans within a short timeframe is
remote. The purpose of this analysis is to provide an indication of the
impact of risk ratings on the estimate of the allowance for loan losses
for wholesale loans. It is not intended to imply management’s expec-
tation of future deterioration in risk ratings. Given the process the
Firm follows in determining the risk ratings of its loans, management
believes the risk ratings currently assigned to wholesale loans are
appropriate.
Consumer loans and lending-related commitments
The allowance for credit losses for the consumer portfolio, including
credit card, is sensitive to changes in the economic environment,
delinquency status, the realizable value of collateral, FICO scores,
borrower behavior and other risk factors, and is intended to represent
management’s best estimate of probable losses inherent in the
portfolio as of the balance sheet date. The credit performance of the
consumer portfolio across the entire consumer credit product spec-
trum has stabilized but high unemployment and weak overall eco-
nomic conditions continue to result in an elevated level of charge-
offs, while weak housing prices continue to negatively affect the
severity of losses realized on residential real estate loans that default.
Significant judgment is required to estimate the duration and severity
Management’s discussion and analysis
150 JPMorgan Chase & Co./2010 Annual Report
of the current economic downturn, as well as its potential impact on
housing prices and the labor market. While the allowance for credit
losses is highly sensitive to both home prices and unemployment
rates, in the current market it is difficult to estimate how potential
changes in one or both of these factors might affect the allowance for
credit losses. For example, while both factors are important determi-
nants of overall allowance levels, changes in one factor or the other
may not occur at the same rate, or changes may be directionally
inconsistent such that improvement in one factor may offset deterio-
ration in the other. In addition, changes in these factors would not
necessarily be consistent across all geographies or product types.
Finally, it is difficult to predict the extent to which changes in both or
either of these factors would ultimately affect the frequency of losses,
the severity of losses or both; overall loss rates are a function of both
the frequency and severity of individual loan losses.
The consumer allowance is calculated by applying statistical loss
factors and other risk indicators to pools of loans with similar risk
characteristics to arrive at an estimate of incurred losses in the
portfolio. Management applies judgment to the statistical loss
estimates for each loan portfolio category, using delinquency trends
and other risk characteristics to estimate probable losses inherent
in the portfolio. Management uses additional statistical methods
and considers portfolio and collateral valuation trends to review the
appropriateness of the primary statistical loss estimate. The statisti-
cal calculation is then adjusted to take into consideration model
imprecision, external factors and current economic events that have
occurred but are not yet reflected in the factors used to derive the
statistical calculation; this adjustment is accomplished in part by
analyzing the historical loss experience for each major product
segment. In the current economic environment, it is difficult to
predict whether historical loss experience is indicative of future loss
levels. Management applies judgment in making this adjustment,
taking into account uncertainties associated with current macro-
economic and political conditions, quality of underwriting stan-
dards, borrower behavior and other relevant internal and external
factors affecting the credit quality of the portfolio. For junior lien
products, management considers the delinquency and/or modifica-
tion status of any senior liens in determining the adjustment. The
application of different inputs into the statistical calculation, and
the assumptions used by management to adjust the statistical
calculation, are subject to management judgment, and emphasizing
one input or assumption over another, or considering other inputs
or assumptions, could affect the estimate of the allowance for loan
losses for the consumer credit portfolio.
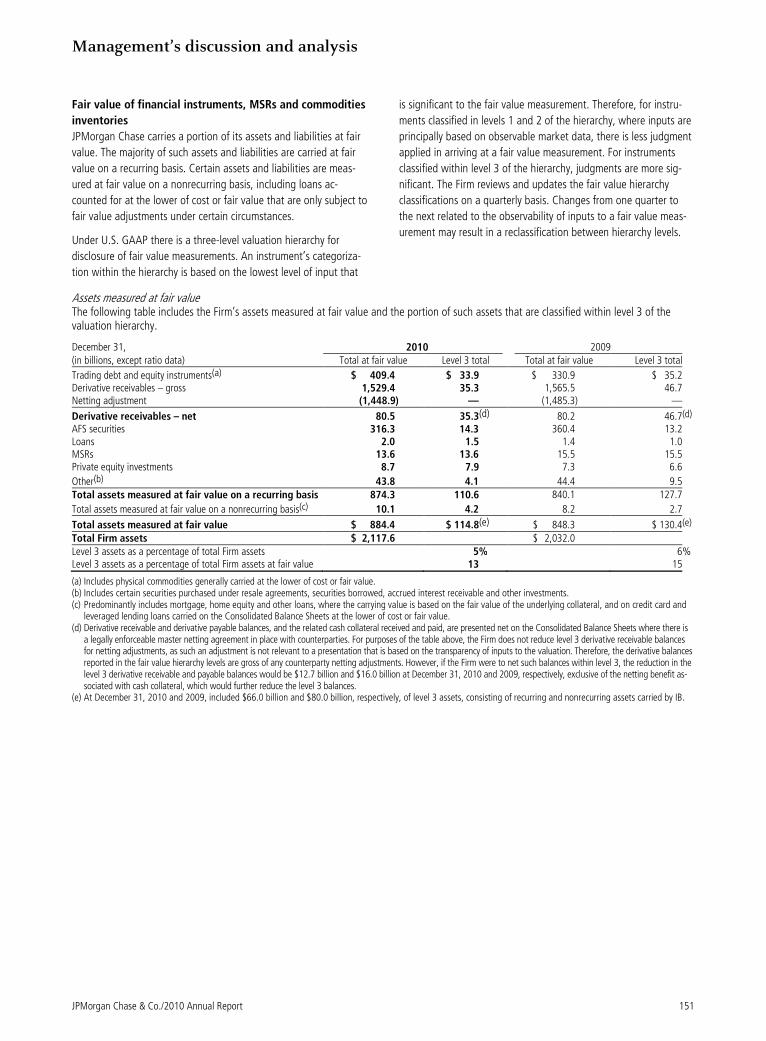
Management’s discussion and analysis
JPMorgan Chase & Co./2010 Annual Report 151
Fair value of financial instruments, MSRs and commodities
inventories
JPMorgan Chase carries a portion of its assets and liabilities at fair
value. The majority of such assets and liabilities are carried at fair
value on a recurring basis. Certain assets and liabilities are meas-
ured at fair value on a nonrecurring basis, including loans ac-
counted for at the lower of cost or fair value that are only subject to
fair value adjustments under certain circumstances.
Under U.S. GAAP there is a three-level valuation hierarchy for
disclosure of fair value measurements. An instrument’s categoriza-
tion within the hierarchy is based on the lowest level of input that
is significant to the fair value measurement. Therefore, for instru-
ments classified in levels 1 and 2 of the hierarchy, where inputs are
principally based on observable market data, there is less judgment
applied in arriving at a fair value measurement. For instruments
classified within level 3 of the hierarchy, judgments are more sig-
nificant. The Firm reviews and updates the fair value hierarchy
classifications on a quarterly basis. Changes from one quarter to
the next related to the observability of inputs to a fair value meas-
urement may result in a reclassification between hierarchy levels.
Assets measured at fair value The following table includes the Firm’s assets measured at fair value and the portion of such assets that are classified within level 3 of the valuation hierarchy.
December 31, 2010 2009 (in billions, except ratio data) Total at fair value Level 3 total Total at fair value Level 3 total
Trading debt and equity instruments(a) $ 409.4 $ 33.9 $ 330.9 $ 35.2Derivative receivables – gross 1,529.4 35.3 1,565.5 46.7Netting adjustment (1,448.9) — (1,485.3) —
Derivative receivables – net 80.5 35.3(d) 80.2 46.7(d)
AFS securities 316.3 14.3 360.4 13.2 Loans 2.0 1.5 1.4 1.0 MSRs 13.6 13.6 15.5 15.5 Private equity investments 8.7 7.9 7.3 6.6
Other(b) 43.8 4.1 44.4 9.5 Total assets measured at fair value on a recurring basis 874.3 110.6 840.1 127.7
Total assets measured at fair value on a nonrecurring basis(c) 10.1 4.2 8.2 2.7
Total assets measured at fair value $ 884.4 $ 114.8(e) $ 848.3 $ 130.4(e)
Total Firm assets $ 2,117.6 $ 2,032.0 Level 3 assets as a percentage of total Firm assets 5% 6% Level 3 assets as a percentage of total Firm assets at fair value 13 15
(a) Includes physical commodities generally carried at the lower of cost or fair value. (b) Includes certain securities purchased under resale agreements, securities borrowed, accrued interest receivable and other investments. (c) Predominantly includes mortgage, home equity and other loans, where the carrying value is based on the fair value of the underlying collateral, and on credit card and
leveraged lending loans carried on the Consolidated Balance Sheets at the lower of cost or fair value. (d) Derivative receivable and derivative payable balances, and the related cash collateral received and paid, are presented net on the Consolidated Balance Sheets where there is
a legally enforceable master netting agreement in place with counterparties. For purposes of the table above, the Firm does not reduce level 3 derivative receivable balances for netting adjustments, as such an adjustment is not relevant to a presentation that is based on the transparency of inputs to the valuation. Therefore, the derivative balances reported in the fair value hierarchy levels are gross of any counterparty netting adjustments. However, if the Firm were to net such balances within level 3, the reduction in the level 3 derivative receivable and payable balances would be $12.7 billion and $16.0 billion at December 31, 2010 and 2009, respectively, exclusive of the netting benefit as-sociated with cash collateral, which would further reduce the level 3 balances.
(e) At December 31, 2010 and 2009, included $66.0 billion and $80.0 billion, respectively, of level 3 assets, consisting of recurring and nonrecurring assets carried by IB.
Management’s discussion and analysis
152 JPMorgan Chase & Co./2010 Annual Report
Valuation
The Firm has an established and well-documented process for
determining fair value. Fair value is based on quoted market prices,
where available. If listed prices or quotes are not available, fair
value is based on internally developed models that primarily use as
inputs market-based or independently sourced market parameters.
The Firm’s process is intended to ensure that all applicable inputs
are appropriately calibrated to market data, including but not
limited to yield curves, interest rates, volatilities, equity or debt
prices, foreign exchange rates and credit curves. In addition to
market information, models also incorporate transaction details,
such as maturity. Valuation adjustments may be made to ensure
that financial instruments are recorded at fair value. These adjust-
ments include amounts to reflect counterparty credit quality, the
Firm’s creditworthiness, constraints on liquidity and unobservable
parameters that are applied consistently over time.
For instruments classified within level 3 of the hierarchy, judgments
used to estimate fair value may be significant. In arriving at an
estimate of fair value for an instrument within level 3, management
must first determine the appropriate model to use. Second, due to
the lack of observability of significant inputs, management must
assess all relevant empirical data in deriving valuation inputs –
including, but not limited to, yield curves, interest rates, volatilities,
equity or debt prices, foreign exchange rates and credit curves. In
addition to market information, models also incorporate transaction
details, such as maturity. Finally, management judgment must be
applied to assess the appropriate level of valuation adjustments to
reflect counterparty credit quality, the Firm’s creditworthiness,
constraints on liquidity and unobservable parameters, where rele-
vant. The judgments made are typically affected by the type of
product and its specific contractual terms, and the level of liquidity
for the product or within the market as a whole. The Firm has
numerous controls in place to ensure that its valuations are appro-
priate. An independent model review group reviews the Firm’s
valuation models and approves them for use for specific products.
All valuation models of the Firm are subject to this review process.
A price verification group, independent from the risk-taking func-
tions, ensures observable market prices and market-based parame-
ters are used for valuation whenever possible. For those products
with material parameter risk for which observable market levels do
not exist, an independent review of the assumptions made on
pricing is performed. Additional review includes deconstruction of
the model valuations for certain structured instruments into their
components; benchmarking valuations, where possible, to similar
products; validating valuation estimates through actual cash set-
tlement; and detailed review and explanation of recorded gains and
losses, which are analyzed daily and over time. Valuation adjust-
ments, which are also determined by the independent price verifica-
tion group, are based on established policies and applied
consistently over time. Any changes to the valuation methodology
are reviewed by management to confirm the changes are justified.
As markets and products develop and the pricing for certain prod-
ucts becomes more transparent, the Firm continues to refine its
valuation methodologies. During 2010, no changes were made to
the Firm’s valuation models that had, or are expected to have, a
material impact on the Firm’s Consolidated Balance Sheets or
results of operations.
Imprecision in estimating unobservable market inputs can affect the
amount of revenue or loss recorded for a particular position. Fur-
thermore, while the Firm believes its valuation methods are appro-
priate and consistent with those of other market participants, the
use of different methodologies or assumptions to determine the fair
value of certain financial instruments could result in a different
estimate of fair value at the reporting date. For a detailed discus-
sion of the determination of fair value for individual financial in-
struments, see Note 3 on pages 170–187 of this Annual Report.
Purchased credit-impaired loans
In connection with the Washington Mutual transaction, JPMorgan
Chase acquired certain loans with evidence of deterioration of
credit quality since origination and for which it was probable, at
acquisition, that the Firm would be unable to collect all contrac-
tually required payments receivable. These loans are considered
to be purchased credit-impaired (“PCI”) loans and are accounted
for as described in Note 14 on pages 220–238 of this Annual
Report. The application of the accounting guidance for PCI loans
requires a number of significant estimates and judgment, such as
determining: (i) which loans are within the scope of PCI account-
ing guidance, (ii) the fair value of the PCI loans at acquisition, (iii)
how loans are aggregated to apply the guidance on accounting
for pools of loans, and (iv) estimates of cash flows to be collected
over the term of the loans.
Determining which loans are in the scope of PCI accounting guidance
is highly subjective and requires significant judgment. In the Washing-
ton Mutual transaction, consumer loans with certain attributes (e.g.,
higher loan-to-value ratios, borrowers with lower FICO scores, delin-
quencies) were determined to be credit-impaired, provided that those
attributes arose subsequent to the loans’ origination dates. A whole-
sale loan was determined to be credit-impaired if it was risk-rated
such that it would otherwise have required an asset-specific allow-
ance for loan losses.
At the acquisition date, the Firm recorded its PCI loans at fair value,
which included an estimate of losses that were then expected to be
incurred over the estimated remaining lives of the loans. The Firm
estimated the fair value of its PCI loans at the acquisition date by
discounting the cash flows expected to be collected at a market-
observable discount rate, when available, adjusted for factors that
a market participant would consider in determining fair value. The
initial estimate of cash flows to be collected was derived from
assumptions such as default rates, loss severities and the amount
and timing of prepayments.
The PCI accounting guidance states that investors may aggregate
loans into pools that have common risk characteristics and
thereby use a composite interest rate and estimate of cash flows
expected to be collected for the pools. The pools then become
the unit of accounting and are considered one loan for purposes
of accounting for these loans at and subsequent to acquisition.
Once a pool is assembled, the integrity of the pool must be
JPMorgan Chase & Co./2010 Annual Report 153
maintained. The Firm has aggregated substantially all of the PCI
loans identified in the Washington Mutual transaction (i.e., the
residential real estate loans) into pools with common risk charac-
teristics. Significant judgment is required to determine whether
individual loans have common risk characteristics for purposes of
establishing pools of loans.
The Firm’s estimate of cash flows expected to be collected must be
updated each reporting period based on updated assumptions
regarding default rates, loss severities, the amounts and timing of
prepayments and other factors that are reflective of current and
expected future market conditions. These estimates are dependent
on assumptions regarding the level of future home price declines,
and the duration and severity of the current economic downturn,
among other factors. These estimates and assumptions require
significant management judgment and certain assumptions are
highly subjective. These estimates of cash flows expected to be
collected may have a significant impact on the recognition of im-
pairment losses and/or interest income. As of December 31, 2010, a
1% decrease in expected future principal cash payments for the entire
portfolio of purchased credit-impaired loans would result in the
recognition of an allowance for loan losses for these loans of ap-
proximately $670 million.
Goodwill impairment
Under U.S. GAAP, goodwill must be allocated to reporting units
and tested for impairment at least annually. The Firm’s process and
methodology used to conduct goodwill impairment testing is de-
scribed in Note 17 on pages 260–263 of this Annual Report.
Management applies significant judgment when estimating the fair
value of its reporting units. Estimates of fair value are dependent
upon estimates of (a) the future earnings potential of the Firm’s
reporting units, including the estimated effects of regulatory and
legislative changes, such as the Dodd-Frank Act, the CARD Act, and
limitations on non-sufficient funds and overdraft fees and (b) the
relevant cost of equity and long-term growth rates. Imprecision in
estimating these factors can affect the estimated fair value of the
reporting units. The fair values of a significant majority of the Firm’s
reporting units exceeded their carrying values by substantial
amounts (fair value as a percent of carrying value ranged from
120% to 380%) and did not indicate a significant risk of goodwill
impairment based on current projections and valuations.
However, the fair value of the Firm’s consumer lending businesses
in RFS and CS each exceeded their carrying values by approximately
25% and 7%, respectively, and the associated goodwill remains at
an elevated risk of impairment due to their exposure to U.S. con-
sumer credit risk and the effects of regulatory and legislative
changes. The assumptions used in the valuation of these businesses
include (a) estimates of future cash flows (which are dependent on
portfolio outstanding balances, net interest margin, operating
expense, credit losses, and the amount of capital necessary given
the risk of business activities to meet regulatory capital require-
ments), (b) the cost of equity used to discount those cash flows to a
present value. Each of these factors requires significant judgment
and the assumptions used are based on management’s best and
most current projections, including those derived from the Firm’s
business forecasting process reviewed with senior management.
These projections are consistent with the short-term assumptions
discussed in Business Outlook on pages 57–58 of this Form 10-K
and, in the longer term, incorporate a set of macroeconomic as-
sumptions (for example, allowing for relatively high but gradually
declining unemployment rates for the next few years) and the
Firm’s best estimates of long-term growth and returns of its busi-
nesses. Where possible, the Firm uses third-party and peer data to
benchmark its assumptions and estimates. The cost of equity used
in the discounted cash flow model reflected the estimated risk and
uncertainty in these businesses and was evaluated in comparison
with relevant market peers.
The Firm did not recognize goodwill impairment as of December
31, 2010, or at anytime during 2010, based on management’s best
estimates. However, deterioration in economic market conditions,
increased estimates of the effects of recent regulatory or legislative
changes, or additional regulatory or legislative changes may result
in declines in projected business performance beyond manage-
ment’s current expectations. For example, in CS such declines could
result from deterioration in economic conditions, such as: increased
unemployment claims or bankruptcy filings that result in increased
credit losses, changes in customer behavior that cause decreased
account activity or receivables balances, or unanticipated effects of
regulatory or legislative changes. In RFS, such declines could result
from deterioration in economic conditions that result in increased
credit losses, including decreases in home prices beyond manage-
ment’s current expectations; or loan repurchase costs that signifi-
cantly exceed management’s current expectations. Such declines in
business performance, or increases in the estimated cost of equity,
could cause the estimated fair values of the Firm’s reporting units
or their associated goodwill to decline, which could result in a
material impairment charge to earnings in a future period related to
some portion of the associated goodwill.
Management’s discussion and analysis
154 JPMorgan Chase & Co./2010 Annual Report
Income taxes
JPMorgan Chase is subject to the income tax laws of the various
jurisdictions in which it operates, including U.S. federal, state and
local and non-U.S. jurisdictions. These laws are often complex and
may be subject to different interpretations. To determine the finan-
cial statement impact of accounting for income taxes, including the
provision for income tax expense and unrecognized tax benefits,
JPMorgan Chase must make assumptions and judgments about
how to interpret and apply these complex tax laws to numerous
transactions and business events, as well as make judgments
regarding the timing of when certain items may affect taxable
income in the U.S. and non-U.S. tax jurisdictions.
JPMorgan Chase’s interpretations of tax laws around the world are
subject to review and examination by the various taxing authorities in
the jurisdictions where the Firm operates, and disputes may occur
regarding its view on a tax position. These disputes over interpreta-
tions with the various taxing authorities may be settled by audit,
administrative appeals or adjudication in the court systems of the tax
jurisdictions in which the Firm operates. JPMorgan Chase regularly
reviews whether it may be assessed additional income taxes as a
result of the resolution of these matters, and the Firm records addi-
tional reserves as appropriate. In addition, the Firm may revise its
estimate of income taxes due to changes in income tax laws, legal
interpretations and tax planning strategies. It is possible that revisions
in the Firm’s estimate of income taxes may materially affect the Firm’s
results of operations in any reporting period.
The Firm’s provision for income taxes is composed of current and
deferred taxes. Deferred taxes arise from differences between assets
and liabilities measured for financial reporting versus income tax
return purposes. Deferred tax assets are recognized if, in manage-
ment’s judgment, their realizability is determined to be more likely
than not. The Firm has also recognized deferred tax assets in con-
nection with certain net operating losses. The Firm performs regular
reviews to ascertain whether deferred tax assets are realizable.
These reviews include management’s estimates and assumptions
regarding future taxable income, which also incorporates various
tax planning strategies, including strategies that may be available
to utilize net operating losses before they expire. In connection with
these reviews, if it is determined that a deferred tax asset is not
realizable, a valuation allowance is established. The valuation
allowance may be reversed in a subsequent reporting period if the
Firm determines that, based on revised estimates of future taxable
income or changes in tax planning strategies, it is more likely than
not that all or part of the deferred tax asset will become realizable.
As of December 31, 2010, management has determined it is more
likely than not that the Firm will realize its deferred tax assets, net
of the existing valuation allowance.
The Firm adjusts its unrecognized tax benefits as necessary when
additional information becomes available. Uncertain tax positions
that meet the more-likely-than-not recognition threshold are meas-
ured to determine the amount of benefit to recognize. An uncertain
tax position is measured at the largest amount of benefit that
management believes is more likely than not to be realized upon
settlement. It is possible that the reassessment of JPMorgan
Chase’s unrecognized tax benefits may have a material impact on
its effective tax rate in the period in which the reassessment occurs.
For additional information on income taxes, see Note 27 on pages
271-273 of this Annual Report.
JPMorgan Chase & Co./2010 Annual Report 155
ACCOUNTING AND REPORTING DEVELOPMENTS
Accounting for transfers of financial assets and
consolidation of variable interest entities
Effective January 1, 2010, the Firm implemented new accounting
guidance that amends the accounting for the transfers of financial
assets and the consolidation of VIEs. Upon adoption of the new
guidance, the Firm consolidated its Firm-sponsored credit card securi-
tization trusts, Firm-administered multi-seller conduits, and certain
mortgage and other consumer loan securitization entities. The Finan-
cial Accounting Standards Board (“FASB”) deferred the requirements
of the new accounting guidance for VIEs for certain investment funds,
including mutual funds, private equity funds and hedge funds, until
the FASB reconsiders the appropriate accounting guidance for these
funds. For additional information about the impact of the adoption
of the new accounting guidance on January 1, 2010, see Note 16 on
pages 244–259 of this Annual Report.
Fair value measurements and disclosures
In January 2010, the FASB issued guidance that requires new
disclosures, and clarifies existing disclosure requirements, about fair
value measurements. The clarifications and the requirement to
separately disclose transfers of instruments between level 1 and
level 2 of the fair value hierarchy are effective for interim reporting
periods beginning after December 15, 2009; the Firm adopted this
guidance in the first quarter of 2010. For additional information
about the impact of the adoption of the new fair value measure-
ments guidance, see Note 3 on pages 170–187 of this Annual
Report. In addition, a new requirement to provide purchases, sales,
issuances and settlements in the level 3 rollforward on a gross basis
is effective for fiscal years beginning after December 15, 2010.
Subsequent events
In May 2009, the FASB issued guidance that established general
standards of accounting for and disclosure of events that occur
after the balance sheet date but before financial statements are
issued or are available to be issued. The guidance was effective for
interim or annual financial periods ending after June 15, 2009. In
February 2010, the FASB amended the guidance by eliminating the
requirement for SEC filers to disclose the date through which it
evaluated subsequent events. The Firm adopted the amended
guidance in the first quarter of 2010. The application of the guid-
ance had no effect on the Firm’s Consolidated Balance Sheets or
results of operations.
Accounting for certain embedded credit derivatives
In March 2010, the FASB issued guidance clarifying the circum-
stances in which a credit derivative embedded in beneficial interests
in securitized financial assets is required to be separately accounted
for as a derivative instrument. The guidance is effective for the first
fiscal quarter beginning after June 15, 2010, with early adoption
permitted. Upon adoption, the new guidance permits the election
of the fair value option for beneficial interests in securitized finan-
cial assets. The Firm adopted the new guidance prospectively,
effective July 1, 2010. The adoption of the guidance did not have a
material impact on the Firm’s Consolidated Balance Sheets or
results of operations. For additional information about the impact
of the adoption of the new guidance, see Note 6 on pages 191–
199 of this Annual Report.
Accounting for troubled debt restructurings of purchased
credit-impaired loans that are part of a pool
In April 2010, the FASB issued guidance that amends the account-
ing for troubled debt restructurings (“TDRs”) of PCI loans ac-
counted for within a pool. The guidance clarifies that modified PCI
loans should not be removed from a pool even if the modification
would otherwise be considered a TDR. Additionally, the guidance
clarifies that the impact of modifications should be included in
evaluating whether a pool of loans is impaired. The guidance was
effective for the Firm beginning in the third quarter of 2010, and is
to be applied prospectively. The guidance is consistent with the
Firm’s previously existing accounting practice and, therefore, had
no impact on the Firm’s Consolidated Balance Sheets or results of
operations.
Disclosures about the credit quality of financing
receivables and the allowance for credit losses
In July 2010, the FASB issued guidance that requires enhanced
disclosures surrounding the credit characteristics of the Firm’s
loan portfolio. Under the new guidance, the Firm is required to
disclose its accounting policies, the methods it uses to determine
the components of the allowance for credit losses, and qualitative
and quantitative information about the credit risk inherent in the
loan portfolio, including additional information on certain types
of loan modifications. For the Firm, the new disclosures became
effective for the 2010 Annual Report. For additional information,
see Notes 14 and 15 on pages 220–243 of this Annual Report.
The adoption of this guidance only affects JPMorgan Chase’s
disclosures of financing receivables and not its Consolidated
Balance Sheets or results of operations. In January 2011, the
FASB issued guidance that deferred the effective date of certain
disclosures in this guidance regarding TDRs, pending resolution
on the FASB’s project to amend the scope of TDR guidance.
Management’s discussion and analysis
156 JPMorgan Chase & Co./2010 Annual Report
NONEXCHANGE-TRADED COMMODITY DERIVATIVE CONTRACTS AT FAIR VALUE
In the normal course of business, JPMorgan Chase trades nonex-
change-traded commodity derivative contracts. To determine the
fair value of these contracts, the Firm uses various fair value esti-
mation techniques, primarily based on internal models with signifi-
cant observable market parameters. The Firm’s nonexchange-
traded commodity derivative contracts are primarily energy-related.
The following table summarizes the changes in fair value for nonex-
change-traded commodity derivative contracts for the year ended
December 31, 2010.
For the year ended December 31, 2010 (in millions) Asset position Liability position Net fair value of contracts outstanding
at January 1, 2010 $ 5,027 $ 1,737 Effect of legally enforceable master netting
agreements 25,282 26,490 Gross fair value of contracts
outstanding at January 1, 2010 30,309 28,227 Contracts realized or otherwise settled (18,309) (17,232) Fair value of new contracts 24,294 23,194 Changes in fair values attributable to
changes in valuation techniques and assumptions — —
Other changes in fair value 13,156 14,914 Gross fair value of contracts
outstanding at December 31, 2010 49,450 49,103 Effect of legally enforceable master netting
agreements (41,284) (41,919) Net fair value of contracts
outstanding at December 31, 2010 $ 8,166 $ 7,184
The following table indicates the maturities of nonexchange-traded
commodity derivative contracts at December 31, 2010.
December 31, 2010 (in millions) Asset position Liability position Maturity less than 1 year $ 22,713 $ 19,402 Maturity 1–3 years 16,689 16,074 Maturity 4–5 years 8,500 7,840 Maturity in excess of 5 years 1,548 5,787 Gross fair value of contracts
outstanding at December 31, 2010 49,450 49,103 Effect of legally enforceable master
netting agreements (41,284) (41,919) Net fair value of contracts
outstanding at December 31, 2010 $ 8,166 $ 7,184

JPMorgan Chase & Co./2010 Annual Report 157
FORWARD-LOOKING STATEMENTS
From time to time, the Firm has made and will make forward-looking
statements. These statements can be identified by the fact that they
do not relate strictly to historical or current facts. Forward-looking
statements often use words such as “anticipate,” “target,” “expect,”
“estimate,” “intend,” “plan,” “goal,” “believe,” or other words of
similar meaning. Forward-looking statements provide JPMorgan
Chase’s current expectations or forecasts of future events, circum-
stances, results or aspirations. JPMorgan Chase’s disclosures in this
Annual Report contain forward-looking statements within the mean-
ing of the Private Securities Litigation Reform Act of 1995. The Firm
also may make forward-looking statements in its other documents
filed or furnished with the Securities and Exchange Commission. In
addition, the Firm’s senior management may make forward-looking
statements orally to analysts, investors, representatives of the media
and others.
All forward-looking statements are, by their nature, subject to risks
and uncertainties, many of which are beyond the Firm’s control.
JPMorgan Chase’s actual future results may differ materially from
those set forth in its forward-looking statements. While there is no
assurance that any list of risks and uncertainties or risk factors is
complete, below are certain factors which could cause actual results
to differ from those in the forward-looking statements:
• local, regional and international business, economic and political
conditions and geopolitical events;
• changes in laws and regulatory requirements, including as a result
of the newly-enacted financial services legislation;
• changes in trade, monetary and fiscal policies and laws;
• securities and capital markets behavior, including changes in
market liquidity and volatility;
• changes in investor sentiment or consumer spending or savings
behavior;
• ability of the Firm to manage effectively its liquidity;
• changes in credit ratings assigned to the Firm or its subsidiaries;
• damage to the Firm’s reputation;
• ability of the Firm to deal effectively with an economic slowdown
or other economic or market disruption;
• technology changes instituted by the Firm, its counterparties or
competitors;
• mergers and acquisitions, including the Firm’s ability to integrate
acquisitions;
• ability of the Firm to develop new products and services, and the
extent to which products or services previously sold by the Firm
require the Firm to incur liabilities or absorb losses not contem-
plated at their initiation or origination;
• acceptance of the Firm’s new and existing products and services
by the marketplace and the ability of the Firm to increase market
share;
• ability of the Firm to attract and retain employees;
• ability of the Firm to control expense;
• competitive pressures;
• changes in the credit quality of the Firm’s customers and
counterparties;
• adequacy of the Firm’s risk management framework;
• adverse judicial or regulatory proceedings;
• changes in applicable accounting policies;
• ability of the Firm to determine accurate values of certain assets
and liabilities;
• occurrence of natural or man-made disasters or calamities or
conflicts, including any effect of any such disasters, calamities or
conflicts on the Firm’s power generation facilities and the Firm’s
other commodity-related activities;
• the other risks and uncertainties detailed in Part 1, Item 1A: Risk
Factors in the Firm’s Annual Report on Form 10-K for the year
ended December 31, 2010.
Any forward-looking statements made by or on behalf of the Firm
speak only as of the date they are made, and JPMorgan Chase does
not undertake to update forward-looking statements to reflect the
impact of circumstances or events that arise after the date the for-
ward-looking statements were made. The reader should, however,
consult any further disclosures of a forward-looking nature the Firm
may make in any subsequent Annual Reports on Form 10-K, Quar-
terly Reports on Form 10-Q, or Current Reports on Form 8-K.
Management’s report on internal control over financial reporting
JPMorgan Chase & Co./2010 Annual Report
158
Management of JPMorgan Chase & Co. (“JPMorgan Chase” or the
“Firm”) is responsible for establishing and maintaining adequate
internal control over financial reporting. Internal control over finan-
cial reporting is a process designed by, or under the supervision of,
the Firm’s principal executive and principal financial officers, or
persons performing similar functions, and effected by JPMorgan
Chase’s Board of Directors, management and other personnel, to
provide reasonable assurance regarding the reliability of financial
reporting and the preparation of financial statements for external
purposes in accordance with accounting principles generally
accepted in the United States of America.
JPMorgan Chase’s internal control over financial reporting includes
those policies and procedures that (1) pertain to the maintenance
of records, that, in reasonable detail, accurately and fairly reflect
the transactions and dispositions of the Firm’s assets; (2) provide
reasonable assurance that transactions are recorded as necessary to
permit preparation of financial statements in accordance with
generally accepted accounting principles, and that receipts and
expenditures of the Firm are being made only in accordance with
authorizations of JPMorgan Chase’s management and directors;
and (3) provide reasonable assurance regarding prevention or
timely detection of unauthorized acquisition, use or disposition of
the Firm’s assets that could have a material effect on the financial
statements.
Because of its inherent limitations, internal control over financial
reporting may not prevent or detect misstatements. Also, projec-
tions of any evaluation of effectiveness to future periods are subject
to the risk that controls may become inadequate because of
changes in conditions, or that the degree of compliance with the
policies or procedures may deteriorate.
Management has completed an assessment of the effectiveness of
the Firm’s internal control over financial reporting as of December
31, 2010. In making the assessment, management used the
framework in “Internal Control – Integrated Framework” promul-
gated by the Committee of Sponsoring Organizations of the Tread-
way Commission, commonly referred to as the “COSO” criteria.
Based upon the assessment performed, management concluded
that as of December 31, 2010, JPMorgan Chase’s internal control
over financial reporting was effective based upon the COSO criteria.
Additionally, based upon management’s assessment, the Firm
determined that there were no material weaknesses in its internal
control over financial reporting as of December 31, 2010.
The effectiveness of the Firm’s internal control over financial
reporting as of December 31, 2010, has been audited by
PricewaterhouseCoopers LLP, an independent registered public
accounting firm, as stated in their report which appears herein.
James Dimon Chairman and Chief Executive Officer
Douglas L. Braunstein Executive Vice President and Chief Financial Officer
February 28, 2011
Report of independent registered public accounting firm
JPMorgan Chase & Co./2010 Annual Report
159
Report of Independent Registered Public Accounting Firm
To the Board of Directors and Stockholders of JPMorgan
Chase & Co.:
In our opinion, the accompanying consolidated balance sheets and
the related consolidated statements of income, changes in stock-
holders’ equity and comprehensive income and cash flows present
fairly, in all material respects, the financial position of JPMorgan
Chase & Co. and its subsidiaries (the “Firm”) at December 31,
2010 and 2009, and the results of their operations and their cash
flows for each of the three years in the period ended December 31,
2010, in conformity with accounting principles generally accepted
in the United States of America. Also in our opinion, the Firm
maintained, in all material respects, effective internal control over
financial reporting as of December 31, 2010, based on criteria
established in Internal Control - Integrated Framework issued by
the Committee of Sponsoring Organizations of the Treadway Com-
mission (COSO). The Firm's management is responsible for these
financial statements, for maintaining effective internal control over
financial reporting and for its assessment of the effectiveness of
internal control over financial reporting, included in the accompany-
ing “Management's report on internal control over financial report-
ing.” Our responsibility is to express opinions on these financial
statements and on the Firm's internal control over financial report-
ing based on our integrated audits. We conducted our audits in
accordance with the standards of the Public Company Accounting
Oversight Board (United States). Those standards require that we
plan and perform the audits to obtain reasonable assurance about
whether the financial statements are free of material misstatement
and whether effective internal control over financial reporting was
maintained in all material respects. Our audits of the financial
statements included examining, on a test basis, evidence support-
ing the amounts and disclosures in the financial statements, assess-
ing the accounting principles used and significant estimates made
by management, and evaluating the overall financial statement
presentation. Our audit of internal control over financial reporting
included obtaining an understanding of internal control over finan-
cial reporting, assessing the risk that a material weakness exists,
and testing and evaluating the design and operating effectiveness
of internal control based on the assessed risk. Our audits also
included performing such other procedures as we considered nec-
essary in the circumstances. We believe that our audits provide a
reasonable basis for our opinions.
A company’s internal control over financial reporting is a process
designed to provide reasonable assurance regarding the reliability of
financial reporting and the preparation of financial statements for
external purposes in accordance with generally accepted accounting
principles. A company’s internal control over financial reporting
includes those policies and procedures that (i) pertain to the mainte-
nance of records that, in reasonable detail, accurately and fairly
reflect the transactions and dispositions of the assets of the com-
pany; (ii) provide reasonable assurance that transactions are re-
corded as necessary to permit preparation of financial statements in
accordance with generally accepted accounting principles, and that
receipts and expenditures of the company are being made only in
accordance with authorizations of management and directors of the
company; and (iii) provide reasonable assurance regarding preven-
tion or timely detection of unauthorized acquisition, use, or disposi-
tion of the company’s assets that could have a material effect on the
financial statements.
Because of its inherent limitations, internal control over financial
reporting may not prevent or detect misstatements. Also, projections
of any evaluation of effectiveness to future periods are subject to the
risk that controls may become inadequate because of changes in
conditions, or that the degree of compliance with the policies or
procedures may deteriorate.
February 28, 2011
PricewaterhouseCoopers LLP • 300 Madison Avenue • New York, NY 10017
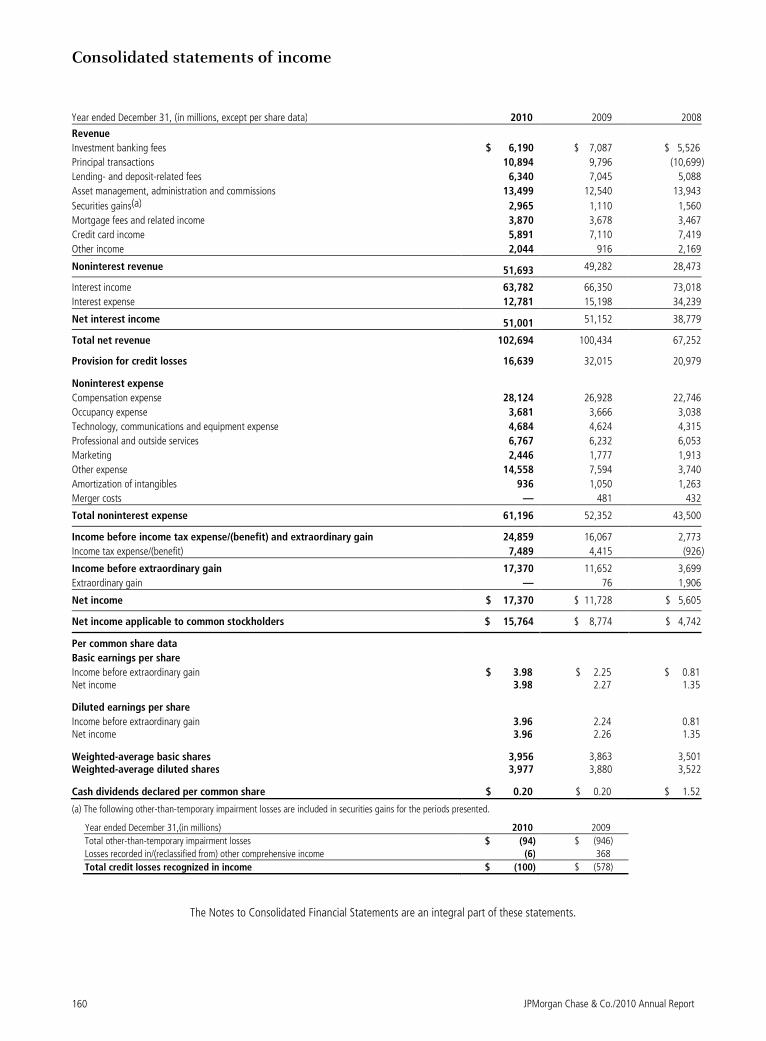
Consolidated statements of income
JPMorgan Chase & Co./2010 Annual Report
160
Year ended December 31, (in millions, except per share data) 2010 2009 2008
Revenue
Investment banking fees $ 6,190 $ 7,087 $ 5,526
Principal transactions 10,894 9,796 (10,699 )
Lending- and deposit-related fees 6,340 7,045 5,088
Asset management, administration and commissions 13,499 12,540 13,943
Securities gains(a) 2,965 1,110 1,560
Mortgage fees and related income 3,870 3,678 3,467
Credit card income 5,891 7,110 7,419
Other income 2,044 916 2,169
Noninterest revenue 51,693 49,282 28,473
Interest income 63,782 66,350 73,018
Interest expense 12,781 15,198 34,239
Net interest income 51,001 51,152 38,779
Total net revenue 102,694 100,434 67,252
Provision for credit losses 16,639 32,015 20,979
Noninterest expense
Compensation expense 28,124 26,928 22,746
Occupancy expense 3,681 3,666 3,038
Technology, communications and equipment expense 4,684 4,624 4,315
Professional and outside services 6,767 6,232 6,053
Marketing 2,446 1,777 1,913
Other expense 14,558 7,594 3,740
Amortization of intangibles 936 1,050 1,263
Merger costs — 481 432
Total noninterest expense 61,196 52,352 43,500
Income before income tax expense/(benefit) and extraordinary gain 24,859 16,067 2,773
Income tax expense/(benefit) 7,489 4,415 (926 )
Income before extraordinary gain 17,370 11,652 3,699
Extraordinary gain — 76 1,906
Net income $ 17,370 $ 11,728 $ 5,605
Net income applicable to common stockholders $ 15,764 $ 8,774 $ 4,742
Per common share data
Basic earnings per share
Income before extraordinary gain $ 3.98 $ 2.25 $ 0.81 Net income 3.98 2.27 1.35
Diluted earnings per share
Income before extraordinary gain 3.96 2.24 0.81 Net income 3.96 2.26 1.35
Weighted-average basic shares 3,956 3,863 3,501 Weighted-average diluted shares 3,977 3,880 3,522
Cash dividends declared per common share $ 0.20 $ 0.20 $ 1.52 (a) The following other-than-temporary impairment losses are included in securities gains for the periods presented.
Year ended December 31,(in millions) 2010 2009
Total other-than-temporary impairment losses $ (94) $ (946)
Losses recorded in/(reclassified from) other comprehensive income (6) 368
Total credit losses recognized in income $ (100) $ (578)
The Notes to Consolidated Financial Statements are an integral part of these statements.
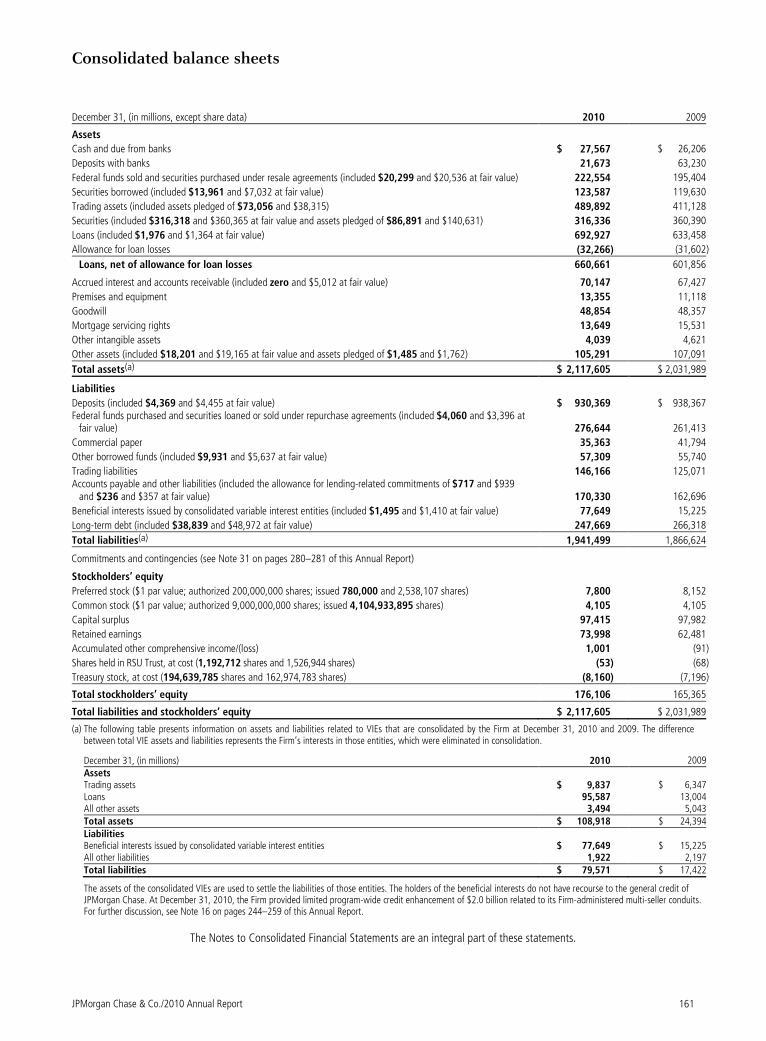
Consolidated balance sheets
JPMorgan Chase & Co./2010 Annual Report
161
December 31, (in millions, except share data) 2010 2009
Assets
Cash and due from banks $ 27,567 $ 26,206
Deposits with banks 21,673 63,230
Federal funds sold and securities purchased under resale agreements (included $20,299 and $20,536 at fair value) 222,554 195,404
Securities borrowed (included $13,961 and $7,032 at fair value) 123,587 119,630
Trading assets (included assets pledged of $73,056 and $38,315) 489,892 411,128
Securities (included $316,318 and $360,365 at fair value and assets pledged of $86,891 and $140,631) 316,336 360,390
Loans (included $1,976 and $1,364 at fair value) 692,927 633,458
Allowance for loan losses (32,266) (31,602 )
Loans, net of allowance for loan losses 660,661 601,856
Accrued interest and accounts receivable (included zero and $5,012 at fair value) 70,147 67,427
Premises and equipment 13,355 11,118
Goodwill 48,854 48,357
Mortgage servicing rights 13,649 15,531
Other intangible assets 4,039 4,621
Other assets (included $18,201 and $19,165 at fair value and assets pledged of $1,485 and $1,762) 105,291 107,091
Total assets(a) $ 2,117,605 $ 2,031,989
Liabilities
Deposits (included $4,369 and $4,455 at fair value) $ 930,369 $ 938,367 Federal funds purchased and securities loaned or sold under repurchase agreements (included $4,060 and $3,396 at
fair value) 276,644 261,413
Commercial paper 35,363 41,794
Other borrowed funds (included $9,931 and $5,637 at fair value) 57,309 55,740
Trading liabilities 146,166 125,071 Accounts payable and other liabilities (included the allowance for lending-related commitments of $717 and $939
and $236 and $357 at fair value) 170,330 162,696
Beneficial interests issued by consolidated variable interest entities (included $1,495 and $1,410 at fair value) 77,649 15,225
Long-term debt (included $38,839 and $48,972 at fair value) 247,669 266,318
Total liabilities(a) 1,941,499 1,866,624
Commitments and contingencies (see Note 31 on pages 280–281 of this Annual Report)
Stockholders’ equity
Preferred stock ($1 par value; authorized 200,000,000 shares; issued 780,000 and 2,538,107 shares) 7,800 8,152
Common stock ($1 par value; authorized 9,000,000,000 shares; issued 4,104,933,895 shares) 4,105 4,105
Capital surplus 97,415 97,982
Retained earnings 73,998 62,481
Accumulated other comprehensive income/(loss) 1,001 (91 )
Shares held in RSU Trust, at cost (1,192,712 shares and 1,526,944 shares) (53) (68 )
Treasury stock, at cost (194,639,785 shares and 162,974,783 shares) (8,160) (7,196 )
Total stockholders’ equity 176,106 165,365
Total liabilities and stockholders’ equity $ 2,117,605 $ 2,031,989
(a) The following table presents information on assets and liabilities related to VIEs that are consolidated by the Firm at December 31, 2010 and 2009. The difference between total VIE assets and liabilities represents the Firm’s interests in those entities, which were eliminated in consolidation.
December 31, (in millions) 2010 2009 Assets Trading assets $ 9,837 $ 6,347 Loans 95,587 13,004 All other assets 3,494 5,043 Total assets $ 108,918 $ 24,394 Liabilities Beneficial interests issued by consolidated variable interest entities $ 77,649 $ 15,225 All other liabilities 1,922 2,197 Total liabilities $ 79,571 $ 17,422
The assets of the consolidated VIEs are used to settle the liabilities of those entities. The holders of the beneficial interests do not have recourse to the general credit of JPMorgan Chase. At December 31, 2010, the Firm provided limited program-wide credit enhancement of $2.0 billion related to its Firm-administered multi-seller conduits. For further discussion, see Note 16 on pages 244–259 of this Annual Report.
The Notes to Consolidated Financial Statements are an integral part of these statements.
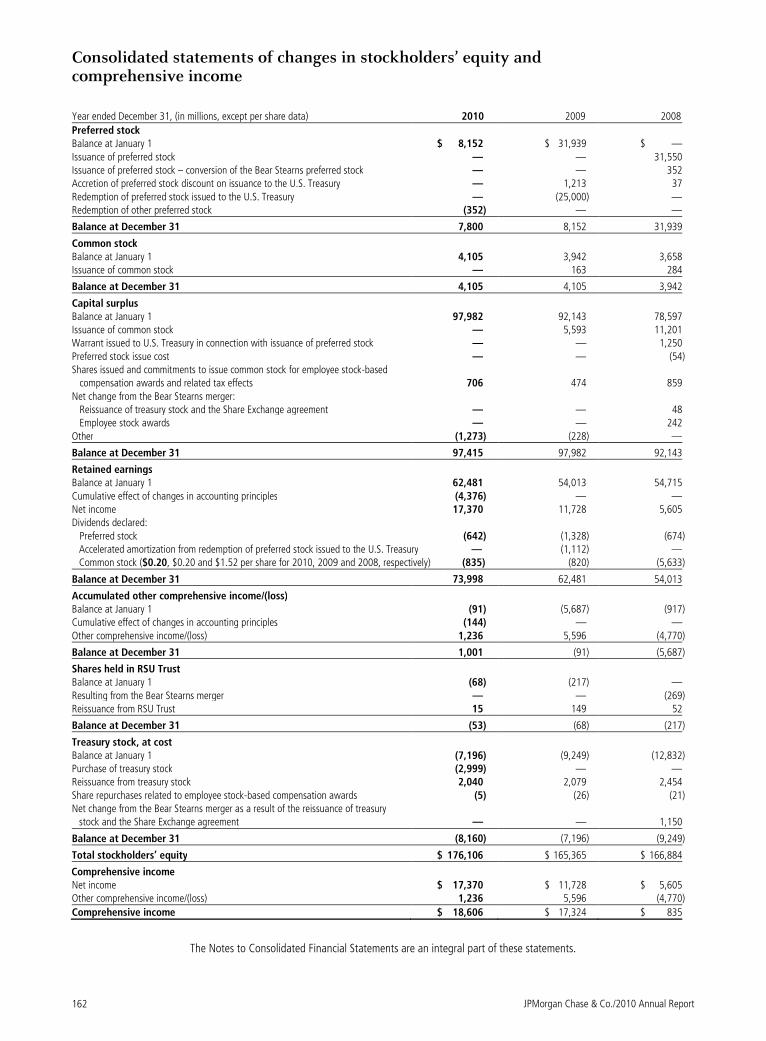
Consolidated statements of changes in stockholders’ equity and comprehensive income
JPMorgan Chase & Co./2010 Annual Report
162
Year ended December 31, (in millions, except per share data) 2010 2009 2008
Preferred stock Balance at January 1 $ 8,152 $ 31,939 $ — Issuance of preferred stock — — 31,550 Issuance of preferred stock – conversion of the Bear Stearns preferred stock — — 352 Accretion of preferred stock discount on issuance to the U.S. Treasury — 1,213 37 Redemption of preferred stock issued to the U.S. Treasury — (25,000) — Redemption of other preferred stock (352) — —
Balance at December 31 7,800 8,152 31,939
Common stock Balance at January 1 4,105 3,942 3,658 Issuance of common stock — 163 284
Balance at December 31 4,105 4,105 3,942
Capital surplus Balance at January 1 97,982 92,143 78,597 Issuance of common stock — 5,593 11,201 Warrant issued to U.S. Treasury in connection with issuance of preferred stock — — 1,250 Preferred stock issue cost — — (54) Shares issued and commitments to issue common stock for employee stock-based compensation awards and related tax effects 706 474 859 Net change from the Bear Stearns merger: Reissuance of treasury stock and the Share Exchange agreement — — 48 Employee stock awards — — 242 Other (1,273) (228) —
Balance at December 31 97,415 97,982 92,143
Retained earnings Balance at January 1 62,481 54,013 54,715 Cumulative effect of changes in accounting principles (4,376) — — Net income 17,370 11,728 5,605 Dividends declared: Preferred stock (642) (1,328) (674)
Accelerated amortization from redemption of preferred stock issued to the U.S. Treasury — (1,112) — Common stock ($0.20, $0.20 and $1.52 per share for 2010, 2009 and 2008, respectively) (835) (820) (5,633)
Balance at December 31 73,998 62,481 54,013
Accumulated other comprehensive income/(loss) Balance at January 1 (91) (5,687) (917) Cumulative effect of changes in accounting principles (144) — — Other comprehensive income/(loss) 1,236 5,596 (4,770)
Balance at December 31 1,001 (91) (5,687)
Shares held in RSU Trust Balance at January 1 (68) (217) — Resulting from the Bear Stearns merger — — (269) Reissuance from RSU Trust 15 149 52
Balance at December 31 (53) (68) (217)
Treasury stock, at cost Balance at January 1 (7,196) (9,249) (12,832) Purchase of treasury stock (2,999) — — Reissuance from treasury stock 2,040 2,079 2,454 Share repurchases related to employee stock-based compensation awards (5) (26) (21) Net change from the Bear Stearns merger as a result of the reissuance of treasury
stock and the Share Exchange agreement — — 1,150
Balance at December 31 (8,160) (7,196) (9,249)
Total stockholders’ equity $ 176,106 $ 165,365 $ 166,884
Comprehensive income Net income $ 17,370 $ 11,728 $ 5,605Other comprehensive income/(loss) 1,236 5,596 (4,770)
Comprehensive income $ 18,606 $ 17,324 $ 835
The Notes to Consolidated Financial Statements are an integral part of these statements.
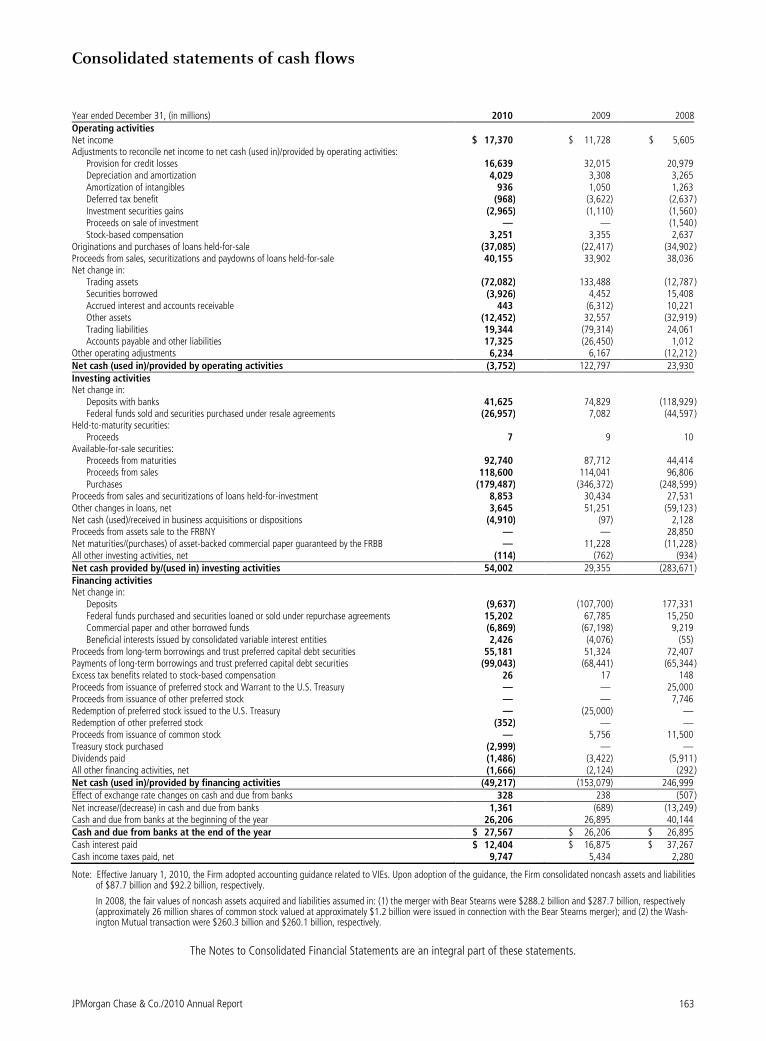
Consolidated statements of cash flows
JPMorgan Chase & Co./2010 Annual Report
163
Note: Effective January 1, 2010, the Firm adopted accounting guidance related to VIEs. Upon adoption of the guidance, the Firm consolidated noncash assets and liabilities of $87.7 billion and $92.2 billion, respectively.
In 2008, the fair values of noncash assets acquired and liabilities assumed in: (1) the merger with Bear Stearns were $288.2 billion and $287.7 billion, respectively (approximately 26 million shares of common stock valued at approximately $1.2 billion were issued in connection with the Bear Stearns merger); and (2) the Wash-ington Mutual transaction were $260.3 billion and $260.1 billion, respectively.
The Notes to Consolidated Financial Statements are an integral part of these statements.
Year ended December 31, (in millions) 2010 2009 2008 Operating activities Net income $ 17,370 $ 11,728 $ 5,605 Adjustments to reconcile net income to net cash (used in)/provided by operating activities: Provision for credit losses 16,639 32,015 20,979 Depreciation and amortization 4,029 3,308 3,265 Amortization of intangibles 936 1,050 1,263 Deferred tax benefit (968) (3,622) (2,637 ) Investment securities gains (2,965) (1,110) (1,560 ) Proceeds on sale of investment — — (1,540 ) Stock-based compensation 3,251 3,355 2,637 Originations and purchases of loans held-for-sale (37,085) (22,417) (34,902 ) Proceeds from sales, securitizations and paydowns of loans held-for-sale 40,155 33,902 38,036 Net change in: Trading assets (72,082) 133,488 (12,787 ) Securities borrowed (3,926) 4,452 15,408 Accrued interest and accounts receivable 443 (6,312) 10,221 Other assets (12,452) 32,557 (32,919 ) Trading liabilities 19,344 (79,314) 24,061 Accounts payable and other liabilities 17,325 (26,450) 1,012 Other operating adjustments 6,234 6,167 (12,212 ) Net cash (used in)/provided by operating activities (3,752) 122,797 23,930 Investing activities Net change in: Deposits with banks 41,625 74,829 (118,929 ) Federal funds sold and securities purchased under resale agreements (26,957) 7,082 (44,597 ) Held-to-maturity securities: Proceeds 7 9 10 Available-for-sale securities: Proceeds from maturities 92,740 87,712 44,414 Proceeds from sales 118,600 114,041 96,806 Purchases (179,487) (346,372) (248,599 ) Proceeds from sales and securitizations of loans held-for-investment 8,853 30,434 27,531 Other changes in loans, net 3,645 51,251 (59,123 ) Net cash (used)/received in business acquisitions or dispositions (4,910) (97) 2,128 Proceeds from assets sale to the FRBNY — — 28,850 Net maturities/(purchases) of asset-backed commercial paper guaranteed by the FRBB — 11,228 (11,228 ) All other investing activities, net (114) (762) (934 ) Net cash provided by/(used in) investing activities 54,002 29,355 (283,671 ) Financing activities Net change in: Deposits (9,637) (107,700) 177,331 Federal funds purchased and securities loaned or sold under repurchase agreements 15,202 67,785 15,250 Commercial paper and other borrowed funds (6,869) (67,198) 9,219 Beneficial interests issued by consolidated variable interest entities 2,426 (4,076) (55) Proceeds from long-term borrowings and trust preferred capital debt securities 55,181 51,324 72,407 Payments of long-term borrowings and trust preferred capital debt securities (99,043) (68,441) (65,344 ) Excess tax benefits related to stock-based compensation 26 17 148 Proceeds from issuance of preferred stock and Warrant to the U.S. Treasury — — 25,000 Proceeds from issuance of other preferred stock — — 7,746 Redemption of preferred stock issued to the U.S. Treasury — (25,000) — Redemption of other preferred stock (352) — — Proceeds from issuance of common stock — 5,756 11,500 Treasury stock purchased (2,999) — — Dividends paid (1,486) (3,422) (5,911 ) All other financing activities, net (1,666) (2,124) (292 ) Net cash (used in)/provided by financing activities (49,217) (153,079) 246,999 Effect of exchange rate changes on cash and due from banks 328 238 (507 ) Net increase/(decrease) in cash and due from banks 1,361 (689) (13,249 ) Cash and due from banks at the beginning of the year 26,206 26,895 40,144 Cash and due from banks at the end of the year $ 27,567 $ 26,206 $ 26,895 Cash interest paid $ 12,404 $ 16,875 $ 37,267 Cash income taxes paid, net 9,747 5,434 2,280
Notes to consolidated financial statements
164 JPMorgan Chase & Co./2010 Annual Report
Note 1 – Basis of presentation JPMorgan Chase & Co. (“JPMorgan Chase” or the “Firm”), a finan-
cial holding company incorporated under Delaware law in 1968, is a
leading global financial services firm and one of the largest banking
institutions in the United States of America (“U.S.”), with operations
worldwide. The Firm is a leader in investment banking, financial
services for consumers, small business and commercial banking,
financial transaction processing, asset management and private
equity. For a discussion of the Firm’s business segment information,
see Note 34 on pages 290–293 of this Annual Report.
The accounting and financial reporting policies of JPMorgan Chase
and its subsidiaries conform to accounting principles generally
accepted in the United States of America (“U.S. GAAP”). Addition-
ally, where applicable, the policies conform to the accounting and
reporting guidelines prescribed by bank regulatory authorities.
Certain amounts in prior periods have been reclassified to conform
to the current presentation.
Consolidation
The Consolidated Financial Statements include the accounts of JPMor-
gan Chase and other entities in which the Firm has a controlling
financial interest. All material intercompany balances and transactions
have been eliminated. The Firm determines whether it has a control-
ling financial interest in an entity by first evaluating whether the entity
is a voting interest entity or a variable interest entity (“VIE”).
Voting Interest Entities Voting interest entities are entities that have sufficient equity and
provide the equity investors voting rights that enable them to make
significant decisions relating to the entity’s operations. For these
types of entities, the Firm’s determination of whether it has a con-
trolling interest is primarily based on the amount of voting equity
interests held. Entities in which the Firm has a controlling financial
interest, through ownership of the majority of the entities’ voting
equity interests, or through other contractual rights that give the
Firm control, are consolidated by the Firm.
Investments in companies in which the Firm has significant influence
over operating and financing decisions (but does not own a majority
of the voting equity interests) are accounted for (i) in accordance
with the equity method of accounting (which requires the Firm to
recognize its proportionate share of the entity’s net earnings), or (ii)
at fair value if the fair value option was elected at the inception of
the Firm’s investment. These investments are generally included in
other assets, with income or loss included in other income.
The Firm-sponsored asset management funds are generally struc-
tured as limited partnerships or limited liability companies, which are
typically considered voting interest entities. For the significant major-
ity of these entities, the Firm is the general partner or managing
member, but the non-affiliated partners or members have the ability
to remove the Firm as the general partner or managing member
without cause (i.e., kick-out rights), based on a simple majority vote,
or the non-affiliated partners or members have rights to participate
in important decisions. Accordingly, the Firm does not consolidate
these funds. In the limited cases where the non-affiliated partners or
members do not have substantive kick-out or participating rights,
the Firm consolidates the funds.
The Firm’s investment companies make investments in both public
and private entities, including investments in buyouts, growth equity
and venture opportunities. These investments are accounted for
under investment company guidelines and accordingly, irrespective
of the percentage of equity ownership interests held, are carried on
the Consolidated Balance Sheets at fair value, and are recorded in
other assets.
Variable Interest Entities VIEs are entities that, by design, either (1) lack sufficient equity to
permit the entity to finance its activities without additional subordi-
nated financial support from other parties, or (2) have equity inves-
tors that do not have the ability to make significant decisions
relating to the entity’s operations through voting rights, or do not
have the obligation to absorb the expected losses, or do not have
the right to receive the residual returns of the entity.
The most common type of VIE is a special purpose entity (“SPE”). SPEs
are commonly used in securitization transactions in order to isolate
certain assets and distribute the cash flows from those assets to
investors. SPEs are an important part of the financial markets, includ-
ing the mortgage- and asset-backed securities and commercial paper
markets, as they provide market liquidity by facilitating investors’
access to specific portfolios of assets and risks. SPEs may be organized
as trusts, partnerships or corporations and are typically established for
a single, discrete purpose. SPEs are not typically operating entities and
usually have a limited life and no employees. The basic SPE structure
involves a company selling assets to the SPE; the SPE funds the pur-
chase of those assets by issuing securities to investors. The legal
documents that govern the transaction specify how the cash earned
on the assets must be allocated to the SPE’s investors and other
parties that have rights to those cash flows. SPEs are generally struc-
tured to insulate investors from claims on the SPE’s assets by creditors
of other entities, including the creditors of the seller of the assets.
On January 1, 2010, the Firm implemented new consolidation ac-
counting guidance related to VIEs. The new guidance eliminates the
concept of qualified special purpose entities (“QSPEs”) that were
previously exempt from consolidation, and introduces a new frame-
work for consolidation of VIEs. The primary beneficiary of a VIE is
required to consolidate the assets and liabilities of the VIE. Under the
new guidance, the primary beneficiary is the party that has both (1)
the power to direct the activities of an entity that most significantly
impact the VIE’s economic performance; and (2) through its interests
in the VIE, the obligation to absorb losses or the right to receive bene-
fits from the VIE that could potentially be significant to the VIE.
To assess whether the Firm has the power to direct the activities of a
VIE that most significantly impact the VIE’s economic performance,
the Firm considers all the facts and circumstances, including its role
in establishing the VIE and its ongoing rights and responsibilities.
This assessment includes, first, identifying the activities that most
significantly impact the VIE’s economic performance; and second,
identifying which party, if any, has power over those activities. In
general, the parties that make the most significant decisions affect-
ing the VIE (such as asset managers, collateral managers, servicers,
or owners of call options or liquidation rights over the VIE’s assets)
or have the right to unilaterally remove those decision-makers are
deemed to have the power to direct the activities of a VIE.
JPMorgan Chase & Co./2010 Annual Report 165
To assess whether the Firm has the obligation to absorb losses of the
VIE or the right to receive benefits from the VIE that could potentially
be significant to the VIE, the Firm considers all of its economic inter-
ests, including debt and equity investments, servicing fees, and deriva-
tive or other arrangements deemed to be variable interests in the VIE.
This assessment requires that the Firm apply judgment in determining
whether these interests, in the aggregate, are considered potentially
significant to the VIE. Factors considered in assessing significance
include: the design of the VIE, including its capitalization structure;
subordination of interests; payment priority; relative share of interests
held across various classes within the VIE’s capital structure; and the
reasons why the interests are held by the Firm.
The Firm performs on-going reassessments of: (1) whether entities
previously evaluated under the majority voting-interest framework
have become VIEs, based on certain events, and therefore subject to
the VIE consolidation framework; and (2) whether changes in the facts
and circumstances regarding the Firm’s involvement with a VIE cause
the Firm’s consolidation conclusion to change.
For further details regarding the Firm’s application of the accounting
guidance effective January 1, 2010, see Note 16 on pages 244–259
of this Annual Report.
The Financial Accounting Standards Board (“FASB”) issued an
amendment which deferred the requirements of the accounting guid-
ance for certain investment funds, including mutual funds, private
equity funds and hedge funds. For the funds to which the deferral
applies, the Firm continues to apply other existing authoritative guid-
ance to determine whether such funds should be consolidated.
Assets held for clients in an agency or fiduciary capacity by the Firm
are not assets of JPMorgan Chase and are not included in the Con-
solidated Balance Sheets.
For reporting periods prior to January 1, 2010, there were two differ-
ent accounting frameworks applicable to SPEs: The qualifying special
purpose entity (“QSPE”) framework and the VIE framework. The
applicable framework depended on the nature of the entity and the
Firm’s relation to that entity. The QSPE framework was applicable
when an entity sold financial assets to an SPE meeting certain defined
criteria that were designed to ensure that the activities of the entity
were essentially predetermined at the inception of the vehicle and that
the transferor of the financial assets could not exercise control over the
entity and the assets therein. QSPEs were not consolidated by the
transferor or other counterparties as long as they did not have the
unilateral ability to liquidate or to cause the entity to no longer meet
the QSPE criteria. The Firm’s securitizations of residential and commer-
cial mortgages, credit card, automobile and student loans generally
were evaluated using the QSPE framework. For further details, see
Note 16 on pages 244–259 of this Annual Report.
Additionally, the other SPEs were evaluated using the VIE framework,
which was based on a risk and reward approach, and required a vari-
able interest holder (i.e., an investor or other counterparty to a VIE)
to consolidate the VIE if that party absorbed a majority of the ex-
pected losses of the VIE, received the majority of the expected
residual returns of the VIE, or both. In making the determination of
whether the Firm should consolidate a VIE, the Firm evaluated the
VIE’s design, capital structure and relationships among the variable
interest holders. If the Firm could not identify the party that consoli-
dates a VIE through a qualitative analysis, the Firm performed a
quantitative analysis, which computed and allocated expected losses
or residual returns to variable interest holders. The allocation of
expected cash flows in this analysis was based on the relative rights
and preferences of each variable interest holder in the VIE’s capital
structure. The Firm reconsidered whether it was the primary benefi-
ciary of a VIE only when certain defined events occurred.
Use of estimates in the preparation of consolidated finan-
cial statements
The preparation of Consolidated Financial Statements requires
management to make estimates and assumptions that affect the
reported amounts of assets and liabilities, revenue and expense, and
disclosures of contingent assets and liabilities. Actual results could
be different from these estimates.
Foreign currency translation
JPMorgan Chase revalues assets, liabilities, revenue and expense
denominated in non-U.S. currencies into U.S. dollars using applica-
ble exchange rates.
Gains and losses relating to translating functional currency financial
statements for U.S. reporting are included in other comprehensive
income/(loss) within stockholders’ equity. Gains and losses relating
to nonfunctional currency transactions, including non-U.S. opera-
tions where the functional currency is the U.S. dollar, are reported in
the Consolidated Statements of Income.
Statements of cash flows
For JPMorgan Chase’s Consolidated Statements of Cash Flows, cash
is defined as those amounts included in cash and due from banks.
Significant accounting policies
The following table identifies JPMorgan Chase’s other significant
accounting policies and the Note and page where a detailed descrip-
tion of each policy can be found. Business changes and developments Note 2 Page 166
Fair value measurement Note 3 Page 170
Fair value option Note 4 Page 187
Derivative instruments Note 6 Page 191
Noninterest revenue Note 7 Page 199
Interest income and interest expense Note 8 Page 200
Pension and other postretirement employee
benefit plans Note 9 Page 201
Employee stock-based incentives Note 10 Page 210
Securities Note 12 Page 214
Securities financing activities Note 13 Page 219
Loans Note 14 Page 220
Allowance for credit losses Note 15 Page 239
Variable interest entities Note 16 Page 244
Goodwill and other intangible assets Note 17 Page 260
Premises and equipment Note 18 Page 263
Long-term debt Note 22 Page 265
Income taxes Note 27 Page 271
Off–balance sheet lending-related financial instruments, guarantees and other commitments Note 30 Page 275
Litigation Note 32 Page 282
Notes to consolidated financial statements
166 JPMorgan Chase & Co./2010 Annual Report
Note 2 – Business changes and developments
Decrease in common stock dividend
On February 23, 2009, the Board of Directors reduced the Firm’s
quarterly common stock dividend from $0.38 to $0.05 per share,
effective with the dividend paid on April 30, 2009, to shareholders
of record on April 6, 2009.
Acquisition of the banking operations of Washington
Mutual Bank
On September 25, 2008, JPMorgan Chase acquired the banking
operations of Washington Mutual Bank (“Washington Mutual”)
from the FDIC for $1.9 billion. The acquisition expanded JPMorgan
Chase’s consumer branch network into several states, including
California, Florida Washington, Georgia, Idaho, Nevada and Oregon
and created the third largest branch network in the U.S. The acquisi-
tion also extended the reach of the Firm’s business banking, com-
mercial banking, credit card, consumer lending and wealth
management businesses.
The acquisition was accounted for under the purchase method of
accounting, which requires that the assets and liabilities of Washing-
ton Mutual be initially reported at fair value.
In 2008, the $1.9 billion purchase price was preliminarily allocated
to the Washington Mutual assets acquired and liabilities assumed,
which resulted in negative goodwill. In accordance with U.S. GAAP
for business combinations that was in effect at the time of the
acquisition, noncurrent nonfinancial assets acquired in the Washing-
ton Mutual transaction that were not held-for-sale, such as the
premises and equipment and other intangibles, were written down
against the negative goodwill. The negative goodwill that remained
after writing down the nonfinancial assets was recognized as an
extraordinary gain of $1.9 billion at December 31, 2008. The final
total extraordinary gain that resulted from the Washington Mutual
transaction was $2.0 billion.
The final summary computation of the purchase price and the allocation of the final total purchase price of $1.9 billion to the net assets acquired of Wash-
ington Mutual – based on their respective fair values as of September 25, 2008, and the resulting final negative goodwill of $2.0 billion are
presented below.
September 25, 2008 (in millions) Purchase price Purchase price $ 1,938 Direct acquisition costs 3 Total purchase price 1,941 Net assets acquired: Washington Mutual’s net assets before fair value adjustments $ 39,186 Washington Mutual’s goodwill and other intangible assets (7,566) Subtotal 31,620
Adjustments to reflect assets acquired at fair value: Securities (16) Trading assets (591) Loans (30,998) Allowance for loan losses 8,216 Premises and equipment 680 Accrued interest and accounts receivable (243) Other assets 4,010
Adjustments to reflect liabilities assumed at fair value: Deposits (686) Other borrowed funds 68 Accounts payable, accrued expense and other liabilities (1,124) Long-term debt 1,063
Fair value of net assets acquired 11,999 Negative goodwill before allocation to nonfinancial assets (10,058 )
Negative goodwill allocated to nonfinancial assets(a) 8,076
Negative goodwill resulting from the acquisition(b) $ (1,982 )
(a) The acquisition was accounted for as a purchase business combination, which requires the assets (including identifiable intangible assets) and liabilities (including executory contracts and other commitments) of an acquired business to be recorded at their respective fair values as of the effective date of the acquisition and consoli-dated with those of JPMorgan Chase. The fair value of the net assets of Washington Mutual’s banking operations exceeded the $1.9 billion purchase price, resulting in negative goodwill. Noncurrent, nonfinancial assets not held-for-sale, such as premises and equipment and other intangibles, were written down against the negative goodwill. The negative goodwill that remained after writing down transaction-related core deposit intangibles of approximately $4.9 billion and premises and equip-ment of approximately $3.2 billion was recognized as an extraordinary gain of $2.0 billion.
(b) The extraordinary gain was recorded net of tax expense in Corporate/Private Equity.
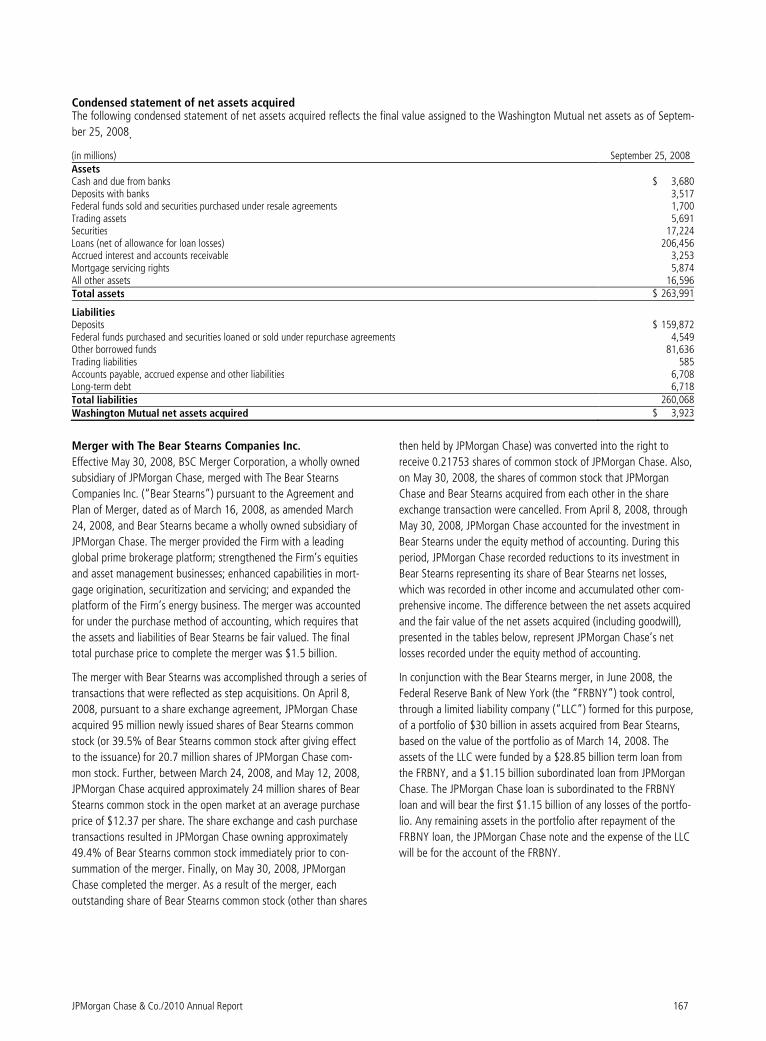
JPMorgan Chase & Co./2010 Annual Report 167
Condensed statement of net assets acquired The following condensed statement of net assets acquired reflects the final value assigned to the Washington Mutual net assets as of Septem-
ber 25, 2008.
(in millions) September 25, 2008 Assets Cash and due from banks $ 3,680Deposits with banks 3,517Federal funds sold and securities purchased under resale agreements 1,700Trading assets 5,691Securities 17,224Loans (net of allowance for loan losses) 206,456Accrued interest and accounts receivable 3,253Mortgage servicing rights 5,874All other assets 16,596Total assets $ 263,991
Liabilities Deposits $ 159,872Federal funds purchased and securities loaned or sold under repurchase agreements 4,549Other borrowed funds 81,636Trading liabilities 585Accounts payable, accrued expense and other liabilities 6,708Long-term debt 6,718Total liabilities 260,068
Washington Mutual net assets acquired $ 3,923
Merger with The Bear Stearns Companies Inc.
Effective May 30, 2008, BSC Merger Corporation, a wholly owned
subsidiary of JPMorgan Chase, merged with The Bear Stearns
Companies Inc. (“Bear Stearns”) pursuant to the Agreement and
Plan of Merger, dated as of March 16, 2008, as amended March
24, 2008, and Bear Stearns became a wholly owned subsidiary of
JPMorgan Chase. The merger provided the Firm with a leading
global prime brokerage platform; strengthened the Firm’s equities
and asset management businesses; enhanced capabilities in mort-
gage origination, securitization and servicing; and expanded the
platform of the Firm’s energy business. The merger was accounted
for under the purchase method of accounting, which requires that
the assets and liabilities of Bear Stearns be fair valued. The final
total purchase price to complete the merger was $1.5 billion.
The merger with Bear Stearns was accomplished through a series of
transactions that were reflected as step acquisitions. On April 8,
2008, pursuant to a share exchange agreement, JPMorgan Chase
acquired 95 million newly issued shares of Bear Stearns common
stock (or 39.5% of Bear Stearns common stock after giving effect
to the issuance) for 20.7 million shares of JPMorgan Chase com-
mon stock. Further, between March 24, 2008, and May 12, 2008,
JPMorgan Chase acquired approximately 24 million shares of Bear
Stearns common stock in the open market at an average purchase
price of $12.37 per share. The share exchange and cash purchase
transactions resulted in JPMorgan Chase owning approximately
49.4% of Bear Stearns common stock immediately prior to con-
summation of the merger. Finally, on May 30, 2008, JPMorgan
Chase completed the merger. As a result of the merger, each
outstanding share of Bear Stearns common stock (other than shares
then held by JPMorgan Chase) was converted into the right to
receive 0.21753 shares of common stock of JPMorgan Chase. Also,
on May 30, 2008, the shares of common stock that JPMorgan
Chase and Bear Stearns acquired from each other in the share
exchange transaction were cancelled. From April 8, 2008, through
May 30, 2008, JPMorgan Chase accounted for the investment in
Bear Stearns under the equity method of accounting. During this
period, JPMorgan Chase recorded reductions to its investment in
Bear Stearns representing its share of Bear Stearns net losses,
which was recorded in other income and accumulated other com-
prehensive income. The difference between the net assets acquired
and the fair value of the net assets acquired (including goodwill),
presented in the tables below, represent JPMorgan Chase’s net
losses recorded under the equity method of accounting.
In conjunction with the Bear Stearns merger, in June 2008, the
Federal Reserve Bank of New York (the “FRBNY”) took control,
through a limited liability company (“LLC”) formed for this purpose,
of a portfolio of $30 billion in assets acquired from Bear Stearns,
based on the value of the portfolio as of March 14, 2008. The
assets of the LLC were funded by a $28.85 billion term loan from
the FRBNY, and a $1.15 billion subordinated loan from JPMorgan
Chase. The JPMorgan Chase loan is subordinated to the FRBNY
loan and will bear the first $1.15 billion of any losses of the portfo-
lio. Any remaining assets in the portfolio after repayment of the
FRBNY loan, the JPMorgan Chase note and the expense of the LLC
will be for the account of the FRBNY.
Notes to consolidated financial statements
168 JPMorgan Chase & Co./2010 Annual Report
As a result of step acquisition accounting, the final total purchase price of $1.5 billion was allocated to the Bear Stearns assets acquired and
liabilities assumed using their fair values as of April 8, 2008, and May 30, 2008, respectively. The final summary computation of the purchase
price and the allocation of the final total purchase price of $1.5 billion to the net assets acquired of Bear Stearns are presented below.
May 30, 2008 (in millions, except shares, per share amounts, ratios and where otherwise noted)
Purchase price Shares exchanged in the Share Exchange transaction (April 8, 2008) 95,000 Other Bear Stearns shares outstanding 145,759 Total Bear Stearns stock outstanding 240,759 Cancellation of shares issued in the Share Exchange transaction (95,000 ) Cancellation of shares acquired by JPMorgan Chase for cash in the open market (24,061 ) Bear Stearns common stock exchanged as of May 30, 2008 121,698 Exchange ratio 0.21753 JPMorgan Chase common stock issued 26,473
Average purchase price per JPMorgan Chase common share(a) $ 45.26 Total fair value of JPMorgan Chase common stock issued $ 1,198 Bear Stearns common stock acquired for cash in the open market (24 million shares at an
average share price of $12.37 per share) 298
Fair value of employee stock awards (largely to be settled by shares held in the RSU Trust(b)) 242 Direct acquisition costs 27 Less: Fair value of Bear Stearns common stock held in the RSU Trust and included in the
exchange of common stock (269 )(b) Total purchase price 1,496 Net assets acquired Bear Stearns common stockholders’ equity $ 6,052 Adjustments to reflect assets acquired at fair value: Trading assets (3,877 ) Premises and equipment 509 Other assets (288 ) Adjustments to reflect liabilities assumed at fair value: Long-term debt 504 Other liabilities (2,289 ) Fair value of net assets acquired excluding goodwill 611
Goodwill resulting from the merger(c) $ 885
(a) The value of JPMorgan Chase common stock was determined by averaging the closing prices of JPMorgan Chase’s common stock for the four trading days during the period March 19 through 25, 2008.
(b) Represents shares of Bear Stearns common stock held in an irrevocable grantor trust (the “RSU Trust”), to be used to settle stock awards granted to selected employees and certain key executives under certain heritage Bear Stearns employee stock plans. Shares in the RSU Trust were exchanged for 6 million shares of JPMorgan Chase common stock at the merger exchange ratio of 0.21753. For further discussion of the RSU Trust, see Note 10 on pages 210–212 of this Annual Report.
(c) The goodwill was recorded in Investment Bank and is not tax-deductible.
Condensed statement of net assets acquired
The following condensed statement of net assets acquired reflects the final values assigned to the Bear Stearns net assets as of May 30, 2008.
(in millions) May 30, 2008 Assets Cash and due from banks $ 534 Federal funds sold and securities purchased under resale agreements 21,204 Securities borrowed 55,195 Trading assets 136,489 Loans 4,407 Accrued interest and accounts receivable 34,677 Goodwill 885 All other assets 35,377 Total assets $ 288,768 Liabilities Federal funds purchased and securities loaned or sold under repurchase agreements $ 54,643 Other borrowings 16,166 Trading liabilities 24,267 Beneficial interests issued by consolidated VIEs 47,042 Long-term debt 67,015 Accounts payable and other liabilities 78,569 Total liabilities 287,702 Bear Stearns net assets(a) $ 1,066
(a) Reflects the fair value assigned to 49.4% of the Bear Stearns net assets acquired on April 8, 2008 (net of related amortization), and the fair value assigned to the remaining 50.6% of the Bear Stearns net assets acquired on May 30, 2008. The difference between the net assets acquired, as presented above, and the fair value of the net assets acquired (including goodwill), presented in the previous table, represents JPMorgan Chase’s net losses recorded under the equity method of accounting.
JPMorgan Chase & Co./2010 Annual Report 169
Unaudited pro forma condensed combined financial
information reflecting the Bear Stearns merger and
Washington Mutual transaction
The following unaudited pro forma condensed combined finan-
cial information presents the 2008 results of operations of the
Firm as they may have appeared, if the Bear Stearns merger and
the Washington Mutual transaction had been completed on
January 1, 2008.
Year ended December 31, (in millions, except per share data) 2008 Total net revenue $ 68,149 Loss before extraordinary gain (14,090) Net loss (12,184)
Net loss per common share data: Basic earnings per share Loss before extraordinary gain $ (4.26) Net loss (3.72)
Diluted earnings per share(a) Loss before extraordinary gain (4.26) Net loss (3.72) Average common shares issued and outstanding Basic 3,510.5 Diluted 3,510.5
(a) Common equivalent shares have been excluded from the pro forma compu-tation of diluted loss per share for the year ended December 31, 2008, as the effect would be antidilutive.
The unaudited pro forma combined financial information is pre-
sented for illustrative purposes only and does not indicate the
financial results of the combined company had the companies
actually been combined as of January 1, 2008, nor is it indicative
of the results of operations in future periods. Included in the
unaudited pro forma combined financial information for the year
ended December 31, 2008, were pro forma adjustments to reflect
the results of operations of Bear Stearns and Washington Mu-
tual’s banking operations, considering the purchase accounting,
valuation and accounting conformity adjustments. For the Wash-
ington Mutual transaction, the amortization of purchase account-
ing adjustments to report interest-earning assets acquired and
interest-bearing liabilities assumed at current interest rates is
reflected for the year ended December 31, 2008. Valuation
adjustments and the adjustment to conform allowance method-
ologies in the Washington Mutual transaction, and valuation and
accounting conformity adjustments related to the Bear Stearns
merger are reflected in the results for the year ended December
31, 2008.
Internal reorganization related to the Bear Stearns
merger
On June 30, 2008, JPMorgan Chase fully and unconditionally
guaranteed each series of outstanding preferred stock of Bear
Stearns, as well as all of Bear Stearns’ outstanding U.S. Securities
and Exchange Commission (“SEC”) registered U.S. debt securities
and obligations relating to trust preferred capital debt securities.
Subsequently, on July 15, 2008, JPMorgan Chase completed an
internal merger transaction, which resulted in each series of
outstanding preferred stock of Bear Stearns being automatically
exchanged into newly-issued shares of JPMorgan Chase preferred
stock having substantially identical terms. In addition, pursuant to
internal transactions in July 2008 and the first quarter of 2009,
JPMorgan Chase assumed or guaranteed the remaining out-
standing securities of Bear Stearns and its subsidiaries, in each
case in accordance with the indentures and other agreements
governing those securities. As discussed below, all of the above
series of preferred stock, and the depositary shares representing
such preferred stock, were redeemed on August 20, 2010.
Other business events
Redemption of Series E, F and G cumulative preferred
stock
On August 20, 2010, JPMorgan Chase redeemed at stated
redemption value, all outstanding shares of its Series E 6.15%
Cumulative Preferred Stock; Series F 5.72% Cumulative Preferred
Stock; and Series G 5.49% Cumulative Preferred Stock. For a
further discussion of preferred stock, see Note 23 on pages 267–
268 of this Annual Report.
RBS Sempra transaction
On July 1, 2010, JPMorgan Chase completed the acquisition of
RBS Sempra Commodities’ global oil, global metals and European
power and gas businesses. The Firm acquired approximately $1.7
billion of net assets which included $3.3 billion of debt which was
immediately repaid. This acquisition almost doubled the number
of clients the Firm’s commodities business can serve and will
enable the Firm to offer clients more products in more regions of
the world.
Purchase of remaining interest in J.P. Morgan Cazenove
On January 4, 2010, JPMorgan Chase purchased the remaining
interest in J.P. Morgan Cazenove, an investment banking busi-
ness partnership formed in 2005, which resulted in an adjustment
to the Firm’s capital surplus of approximately $1.3 billion.
Notes to consolidated financial statements
170 JPMorgan Chase & Co./2010 Annual Report
Termination of Chase Paymentech Solutions joint
venture
The dissolution of the Chase Paymentech Solutions joint venture,
a global payments and merchant acquiring joint venture between
JPMorgan Chase and First Data Corporation, was completed on
November 1, 2008. JPMorgan Chase retained approximately 51%
of the business, which it operates under the name Chase Pay-
mentech Solutions. The dissolution of the Chase Paymentech
Solutions joint venture was accounted for as a step acquisition in
accordance with U.S. GAAP for business combinations, and the
Firm recognized an after-tax gain of $627 million in the fourth
quarter of 2008 as a result of the dissolution. The gain represents
the amount by which the fair value of the net assets acquired
(predominantly intangible assets and goodwill) exceeded JPMor-
gan Chase’s carrying value in the net assets transferred to First
Data Corporation. Upon dissolution, the Firm consolidated the
retained Chase Paymentech Solutions business.
Proceeds from Visa Inc. shares
On March 19, 2008, Visa Inc. (“Visa”) completed its initial public
offering (“IPO”). Prior to the IPO, JPMorgan Chase held approxi-
mately a 13% equity interest in Visa. On March 28, 2008, Visa
used a portion of the proceeds from the offering to redeem a
portion of the Firm’s equity interest, which resulted in the recog-
nition of a pretax gain of $1.5 billion (recorded in other income).
In conjunction with the IPO, Visa placed $3.0 billion in escrow to
cover liabilities related to certain litigation matters. The escrow
was increased by $1.1 billion in 2008, $700 million in 2009 and
by $1.3 billion in 2010. Increases in Visa’s escrow account results
in a dilution of the value of the Firm’s ownership of Visa Inc.
JPMorgan Chase’s interest in the escrow was recorded as a
reduction of other expense and reported net to the extent of
established litigation reserves.
Purchase of remaining interest in Highbridge Capital
Management
In January 2008, JPMorgan Chase purchased an additional equity
interest in Highbridge Capital Management, LLC (“Highbridge”),
which resulted in the Firm owning 77.5% of Highbridge. In July
2009, JPMorgan Chase completed its purchase of the remaining
interest in Highbridge, which resulted in a $228 million adjustment
to capital surplus.
Note 3 – Fair value measurement
JPMorgan Chase carries a portion of its assets and liabilities at
fair value. The majority of such assets and liabilities are carried at
fair value on a recurring basis. Certain assets and liabilities are
carried at fair value on a nonrecurring basis, including held-for-
sale loans, which are accounted for at the lower of cost or fair
value and that are only subject to fair value adjustments under
certain circumstances.
The Firm has an established and well-documented process for
determining fair values. Fair value is defined as the price that
would be received to sell an asset or paid to transfer a liability
in an orderly transaction between market participants at the
measurement date. Fair value is based on quoted market prices,
where available. If listed prices or quotes are not available, fair
value is based on internally developed models that primarily
use, as inputs, market-based or independently sourced market
parameters, including but not limited to yield curves, interest
rates, volatilities, equity or debt prices, foreign exchange rates
and credit curves. In addition to market information, models
also incorporate transaction details, such as maturity of the
instrument. Valuation adjustments may be made to ensure that
financial instruments are recorded at fair value. These adjust-
ments include amounts to reflect counterparty credit quality,
the Firm’s creditworthiness, constraints on liquidity and unob-
servable parameters. Valuation adjustments are applied consis-
tently over time.
• Credit valuation adjustments (“CVA”) are necessary when the
market price (or parameter) is not indicative of the credit qual-
ity of the counterparty. As few classes of derivative contracts
are listed on an exchange, the majority of derivative positions
are valued using internally developed models that use as their
basis observable market parameters. An adjustment is neces-
sary to reflect the credit quality of each derivative counterparty
to arrive at fair value. The adjustment also takes into account
contractual factors designed to reduce the Firm’s credit expo-
sure to each counterparty, such as collateral and legal rights
of offset.
• Debit valuation adjustments (“DVA”) are necessary to reflect
the credit quality of the Firm in the valuation of liabilities
measured at fair value. The methodology to determine the ad-
justment is consistent with CVA and incorporates JPMorgan
Chase’s credit spread as observed through the credit default
swap market.

JPMorgan Chase & Co./2010 Annual Report 171
• Liquidity valuation adjustments are necessary when the Firm
may not be able to observe a recent market price for a fi-
nancial instrument that trades in inactive (or less active)
markets or to reflect the cost of exiting larger-than-normal
market-size risk positions (liquidity adjustments are not
taken for positions classified within level 1 of the fair value
hierarchy; see below). The Firm estimates the amount of un-
certainty in the initial valuation based on the degree of li-
quidity in the market in which the financial instrument
trades and makes liquidity adjustments to the carrying value
of the financial instrument. The Firm measures the liquidity
adjustment based on the following factors: (1) the amount
of time since the last relevant pricing point; (2) whether
there was an actual trade or relevant external quote; and (3)
the volatility of the principal risk component of the financial
instrument. Costs to exit larger-than-normal market-size risk
positions are determined based on the size of the adverse
market move that is likely to occur during the period re-
quired to bring a position down to a nonconcentrated level.
• Unobservable parameter valuation adjustments are necessary
when positions are valued using internally developed models
that use as their basis unobservable parameters – that is, pa-
rameters that must be estimated and are, therefore, subject to
management judgment. Such positions are normally traded
less actively. Examples include certain credit products where
parameters such as correlation and recovery rates are unob-
servable. Unobservable parameter valuation adjustments are
applied to mitigate the possibility of error and revision in the
estimate of the market price provided by the model.
The Firm has numerous controls in place intended to ensure that
its fair values are appropriate. An independent model review
group reviews the Firm’s valuation models and approves them for
use for specific products. All valuation models within the Firm are
subject to this review process. A price verification group, inde-
pendent from the risk-taking function, ensures observable market
prices and market-based parameters are used for valuation wher-
ever possible. For those products with material parameter risk for
which observable market levels do not exist, an independent
review of the assumptions made on pricing is performed. Addi-
tional review includes deconstruction of the model valuations for
certain structured instruments into their components and bench-
marking valuations, where possible, to similar products; validat-
ing valuation estimates through actual cash settlement; and
detailed review and explanation of recorded gains and losses,
which are analyzed daily and over time. Valuation adjustments,
which are also determined by the independent price verification
group, are based on established policies and applied consistently
over time. Any changes to the valuation methodology are re-
viewed by management to confirm that the changes are justified.
As markets and products develop and the pricing for certain
products becomes more or less transparent, the Firm continues to
refine its valuation methodologies. During 2010, no changes
were made to the Firm’s valuation models that had, or are ex-
pected to have, a material impact on the Firm’s Consolidated
Balance Sheets or results of operations.
The methods described above to estimate fair value may produce
a fair value calculation that may not be indicative of net realizable
value or reflective of future fair values. Furthermore, while the
Firm believes its valuation methods are appropriate and consis-
tent with other market participants, the use of different method-
ologies or assumptions to determine the fair value of certain
financial instruments could result in a different estimate of fair
value at the reporting date.
Valuation Hierarchy
A three-level valuation hierarchy has been established under U.S.
GAAP for disclosure of fair value measurements. The valuation
hierarchy is based on the transparency of inputs to the valuation
of an asset or liability as of the measurement date. The three
levels are defined as follows.
• Level 1 – inputs to the valuation methodology are quoted
prices (unadjusted) for identical assets or liabilities in active
markets.
• Level 2 – inputs to the valuation methodology include quoted
prices for similar assets and liabilities in active markets, and
inputs that are observable for the asset or liability, either di-
rectly or indirectly, for substantially the full term of the finan-
cial instrument.
• Level 3 – one or more inputs to the valuation methodology are
unobservable and significant to the fair value measurement.
A financial instrument’s categorization within the valuation
hierarchy is based on the lowest level of input that is significant
to the fair value measurement.
Following is a description of the valuation methodologies used by
the Firm to measure instruments at fair value, including the
general classification of such instruments pursuant to the valua-
tion hierarchy.
Assets
Securities purchased under resale agreements (“resale
agreements”) and securities borrowed
To estimate the fair value of resale agreements and securities
borrowed transactions, cash flows are first evaluated taking into
consideration any derivative features of the resale agreement and
are then discounted using the appropriate market rates for the
applicable maturity. As the inputs into the valuation are primarily
based on readily observable pricing information, such resale
agreements are classified within level 2 of the valuation hierarchy.
Loans and unfunded lending-related commitments
The majority of the Firm’s loans and lending-related commitments
are not carried at fair value on a recurring basis on the Consoli-
dated Balance Sheets, nor are they actively traded. The fair value
of such loans and lending-related commitments is included in the
additional disclosures of fair value of certain financial instruments
required by U.S. GAAP on pages 185–186 of this Note. Loans
Notes to consolidated financial statements
172 JPMorgan Chase & Co./2010 Annual Report
carried at fair value on a recurring and nonrecurring basis are
included in the applicable tables that follow.
Wholesale
There is no liquid secondary market for most loans and lending-
related commitments in the Firm's wholesale portfolio. In the
limited circumstances where direct secondary market information
– including pricing of actual market transactions, broker quota-
tions or quoted market prices for similar instruments – is available
(principally for loans in the Firm's secondary trading portfolio),
such information is used in the determination of fair value. For
the remainder of the portfolio, fair value is estimated using a
discounted cash flow (“DCF”) model. In addition to the character-
istics of the underlying loans (including principal, contractual
interest rate and contractual fees), key inputs to the model in-
clude interest rates, prepayment rates and credit spreads. The
credit spread input is derived from the cost of credit default
swaps (“CDS”) and, as a result, also incorporates the effects of
secondary market liquidity. As many of the Firm’s clients do not
have bonds traded with sufficient liquidity in the public markets
to have observable CDS spreads, the Firm principally develops
benchmark credit curves by industry and credit rating to estimate
fair value. Also incorporated into the valuation process are addi-
tional adjustments to account for the difference in loss severity
rates between bonds, on which the cost of credit derivatives is
based, and loans as well as loan equivalents (which represent the
portion of an unused commitment expected, based on the Firm's
average portfolio historical experience, to become outstanding
prior to an obligor default). Certain floating rate loans that are
not carried on the balance sheet at fair value are carried at
amounts that approximate fair value due to their short term
nature and negligible credit risk (e.g. based on historical experi-
ence or collateralization).
The Firm's loans and unfunded lending-related commitments
carried at fair value are classified within level 2 or 3 of the valua-
tion hierarchy, depending on the level of liquidity and activity in
the markets for a particular product.
Consumer
The only products in the Firm’s consumer loan portfolio with a
meaningful level of secondary market activity in the current
economic environment are certain conforming residential mort-
gages. These loans are classified as trading assets and carried at
fair value on the Consolidated Balance Sheets. They are predomi-
nantly classified within level 2 of the valuation hierarchy based on
the level of market liquidity and activity.
The fair value of the Firm’s other consumer loans (except for
credit card receivables) is generally determined by discounting the
loan principal and interest cash flows expected to be collected at
a market observable discount rate, when available. Portfolio-
specific factors that a market participant would consider in de-
termining fair value (e.g., expected lifetime credit losses, esti-
mated prepayments, servicing costs and market liquidity) are
either modeled into the cash flow projections or incorporated as
an adjustment to the discount rate. For products that continue to
be offered in the market, discount rates are derived from market-
observable primary origination rates. Where primary origination
rates are not available (i.e., subprime mortgages, subprime home
equity and option adjustable-rate mortgages (“option ARMs”))
the valuation is based on the Firm’s estimate of a market partici-
pant’s required return on equity for similar products (i.e., a hypo-
thetical origination spread). Estimated lifetime credit losses
consider expected and current default rates for existing portfolios,
collateral prices (where applicable) and expectations about
changes in the economic environment (e.g., unemployment
rates).
The fair value of credit card receivables is determined using a
discounted expected cash flow methodology. Key estimates and
assumptions include: projected interest income and late fee
revenue, funding, servicing, credit costs, and loan payment rates.
The projected loan payment rates are used to determine the
estimated life of the credit card loan receivables, which are then
discounted using a risk-appropriate discount rate. The discount
rate is derived from the Firm's estimate of a market participant's
expected return on credit card receivables. As the credit card
portfolio has a short-term life, an amount equal to the allowance
for loan losses is considered a reasonable proxy for the credit cost
component.
Loans that are not carried on the Consolidated Balance Sheets at
fair value are not classified within the fair value hierarchy.
Mortgage loans carried at fair value
For certain loans that are expected to be securitized, fair value is
estimated using a combination of observed transaction prices,
independent pricing services and relevant broker quotes. Consid-
eration is given to the nature of the quotes (e.g., indicative or
firm) and the relationship of recently evidenced market activity to
the prices provided from independent pricing services. When
relevant market activity is not occurring or is limited, fair value is
estimated by projecting the expected cash flows and discounting
those cash flows at a rate reflective of current market liquidity. To
estimate the projected cash flows of a residential mortgage loan
(inclusive of assumptions of prepayment, default rates and loss
severity), specific consideration is given to both borrower-specific
and other market factors, including, but not limited to: the bor-
rower’s FICO score; the type of collateral supporting the loans;
the level of documentation for the loan; and market-derived
expectations for home price appreciation or depreciation in the
respective geography of the borrower. For commercial mortgages,
consideration is given to both borrower-specific and other market
factors, including but not limited to: the borrower’s debt-to-
service coverage ratio; the type of commercial property (e.g.,
retail, office, lodging, multi-family, etc.); an estimate of the cur-
rent loan-to-value ratio; and market-derived expectations for
property price appreciation or depreciation in the respective
geographic location. In addition, commercial mortgage loans
typically have lock-out periods where the borrower is restricted
from prepaying the loan due to prepayment penalties. These
features reduce prepayment risk for commercial mortgages rela-
JPMorgan Chase & Co./2010 Annual Report 173
tive to that of residential mortgages. These loans are classified
within level 2 or 3 of the valuation hierarchy, depending on the
level of liquidity and activity in the markets for the particular
product.
Securities
Where quoted prices for identical securities are available in an
active market, securities are classified in level 1 of the valuation
hierarchy. Level 1 securities include highly liquid government
bonds; mortgage products for which there are quoted prices in
active markets such as U.S. government agency or U.S. govern-
ment-sponsored enterprise (collectively, “U.S. government agen-
cies”) markets; pass-through mortgage-backed securities
(“MBS”); and exchange-traded equities (e.g., common and
preferred stocks).
If quoted market prices are not available for the specific security,
the Firm may estimate the value of such instruments using a
combination of observed transaction prices, independent pricing
services and relevant broker quotes. Consideration is given to the
nature of the quotes (e.g., indicative or firm) and the relationship
of recently evidenced market activity to the prices provided from
independent pricing services. The Firm may also use pricing
models or discounted cash flows. The majority of such instru-
ments are classified within level 2 of the valuation hierarchy;
however, in cases where there is limited activity or less transpar-
ency around inputs to the valuation, securities are classified
within level 3 of the valuation hierarchy.
For mortgage-backed securities, where market activity is not
occurring or is limited, fair value is estimated considering the
value of the collateral and the specific attributes of the securities
held by the Firm. The value of the collateral pool supporting the
securities is analyzed using the same techniques and factors
described above for residential mortgage loans, albeit in a more
aggregated manner across the pool. For example, for residential
MBS, factors evaluated may include average FICO scores, average
delinquency rates, average loss severities and prepayment rates,
among other metrics. For commercial MBS, factors evaluated may
include average delinquencies, loan or geographic concentrations,
and average debt-service coverage ratios, among other metrics.
In addition, as each securitization vehicle distributes cash in a
manner or order that is predetermined at the inception of the
vehicle, the priority in which each particular MBS is allocated cash
flows, and the level of credit enhancement in place to support
those cash flows, are key considerations in deriving the value of
MBS. Finally, the risk premium that investors demand for securi-
tized products in the current market is factored into the valuation.
To benchmark its valuations, the Firm looks to transactions for
similar instruments and uses independent pricing provided by
third-party vendors, broker quotes and relevant market indices,
such as the ABX index, as applicable. While none of those
sources are solely indicative of fair value, they serve as directional
indicators for the appropriateness of the Firm’s estimates.
For certain collateralized mortgage and debt obligations, asset-
backed securities (“ABS”) and high-yield debt securities, the
determination of fair value may require benchmarking to similar
instruments or analyzing default and recovery rates. For cash
collateralized debt obligations (“CDOs”), external price infor-
mation is not available. Therefore, cash CDOs are valued using
market-standard models, such as Intex, to model the specific
collateral composition and cash flow structure of each deal; key
inputs to the model are market spread data for each credit
rating, collateral type and other relevant contractual features.
Asset-backed securities are valued based on external prices or
market spread data, using current market assumptions on
prepayments and defaults. For ABS where the external price
data is not observable or the limited available data is opaque,
the collateral performance is monitored and considered in the
valuation of the security. To benchmark its valuations, the Firm
looks to transactions for similar instruments and uses inde-
pendent prices provided by third-party vendors, broker quotes
and relevant market indices, such as the ABX index, as applica-
ble. While none of those sources are solely indicative of fair
value, they serve as directional indicators for the appropriate-
ness of the Firm’s estimates. The majority of collateralized
mortgage and debt obligations, high-yield debt securities and
ABS are currently classified in level 3 of the valuation hierarchy.
Collateralized loan obligations (“CLOs”) are securities backed by
corporate loans, and they are predominantly held in the Firm’s
available-for-sale (“AFS”) securities portfolio. For these securities,
external pricing information is not readily available. They are there-
fore valued using market-standard models to model the specific
collateral composition and cash flow structure of each deal; key
inputs to the model are market spread data for each credit rating,
collateral type and other relevant contractual features. For further
discussion, see Note 12 on pages 214–218 of this Annual Report.
Commodities
Commodities inventory is generally carried at the lower of cost or
fair value. The fair value of commodities inventory is determined
primarily using pricing and data derived from the markets on
which the commodities are traded. The majority of commodities
inventory is classified within level 1 of the valuation hierarchy.
The Firm also has positions in commodities-based derivatives that
can be traded on an exchange or over-the-counter (“OTC”) and
carried at fair value. The pricing inputs to these derivatives in-
clude forward curves of underlying commodities, basis curves,
volatilities, correlations, and occasionally other model parameters.
The valuation of these derivatives is based on calibrating to
market transactions, as well as to independent pricing informa-
tion from sources such as brokers and consensus pricing services.
Where inputs are historical time series data, they are adjusted for
uncertainty where appropriate. The majority of commodities-
based derivatives are classified within level 2 of the valuation
hierarchy.
Notes to consolidated financial statements
174 JPMorgan Chase & Co./2010 Annual Report
Derivatives
Exchange-traded derivatives valued using quoted prices are
classified within level 1 of the valuation hierarchy. However, few
classes of derivative contracts are listed on an exchange; thus, the
majority of the Firm’s derivative positions are valued using inter-
nally developed models that use as their basis readily observable
market parameters – that is, parameters that are actively quoted
and can be validated to external sources, including industry
pricing services. Depending on the types and contractual terms of
derivatives, fair value can be modeled using a series of tech-
niques, such as the Black-Scholes option pricing model, simula-
tion models or a combination of various models, which are
consistently applied. Where derivative products have been estab-
lished for some time, the Firm uses models that are widely ac-
cepted in the financial services industry. These models reflect the
contractual terms of the derivatives, including the period to
maturity, and market-based parameters such as interest rates,
volatility, and the credit quality of the counterparty. Further, many
of these models do not contain a high level of subjectivity, as the
methodologies used in the models do not require significant
judgment, and inputs to the models are readily observable from
actively quoted markets, as is the case for “plain vanilla” interest
rate swaps, option contracts and CDS. Such instruments are
generally classified within level 2 of the valuation hierarchy.
Derivatives that are valued based on models with significant
unobservable market parameters and that are normally traded
less actively, have trade activity that is one way, and/or are traded
in less-developed markets are classified within level 3 of the
valuation hierarchy. Level 3 derivatives include, for example, CDS
referenced to certain MBS, certain types of CDO transactions,
options on baskets of single-name stocks, and callable exotic
interest rate options.
Other complex products, such as those sensitive to correlation
between two or more underlying parameters, also fall within level
3 of the valuation hierarchy, and include structured credit deriva-
tives which are illiquid and non-standard in nature (e.g., synthetic
CDOs collateralized by a portfolio of credit default swaps “CDS”).
For most CDO transactions, while inputs such as CDS spreads
may be observable, the correlation between the underlying debt
instruments is unobservable. Correlation levels are modeled on a
transaction basis and calibrated to liquid benchmark tranche
indices. For all structured credit derivatives, actual transactions,
where available, are used regularly to recalibrate all unobservable
parameters.
Correlation sensitivity is also material to the overall valuation of
options on baskets of single-name stocks; the valuation of these
baskets is typically not observable due to their non-standardized
structuring. Correlation for products such as these is typically esti-
mated based on an observable basket of stocks and then adjusted
to reflect the differences between the underlying equities.
For callable exotic interest rate options, while most of the as-
sumptions in the valuation can be observed in active markets
(e.g., interest rates and volatility), the callable option transaction
flow is essentially one-way, and as such, price observability is
limited. As pricing information is limited, assumptions are based
on the dynamics of the underlying markets (e.g., the interest rate
markets) including the range and possible outcomes of the appli-
cable inputs. In addition, the models used are calibrated, as
relevant, to liquid benchmarks, and valuation is tested against
monthly independent pricing services and actual transactions.
Mortgage servicing rights and certain retained interests
in securitizations
Mortgage servicing rights (“MSRs”) and certain retained interests
from securitization activities do not trade in an active, open
market with readily observable prices. Accordingly, the Firm
estimates the fair value of MSRs and certain other retained inter-
ests in securitizations using DCF models.
• For MSRs, the Firm uses an option-adjusted spread (“OAS”)
valuation model in conjunction with the Firm’s proprietary
prepayment model to project MSR cash flows over multiple in-
terest rate scenarios; these scenarios are then discounted at
risk-adjusted rates to estimate the fair value of the MSRs. The
OAS model considers portfolio characteristics, contractually
specified servicing fees, prepayment assumptions, delinquency
rates, late charges, other ancillary revenue, costs to service
and other economic factors. The Firm reassesses and periodi-
cally adjusts the underlying inputs and assumptions used in
the OAS model to reflect market conditions and assumptions
that a market participant would consider in valuing the MSR
asset. Due to the nature of the valuation inputs, MSRs are
classified within level 3 of the valuation hierarchy.
• For certain retained interests in securitizations, the Firm esti-
mates the fair value for those retained interests by calculating
the present value of future expected cash flows using model-
ing techniques. Such models incorporate management's best
estimates of key variables, such as expected credit losses, pre-
payment speeds and the appropriate discount rates, consider-
ing the risk involved. Changes in the assumptions used may
have a significant impact on the Firm's valuation of retained
interests, and such interests are therefore typically classified
within level 3 of the valuation hierarchy.
For both MSRs and certain other retained interests in securitiza-
tions, the Firm compares its fair value estimates and assumptions
to observable market data where available and to recent market
activity and actual portfolio experience. For further discussion of
the most significant assumptions used to value retained interests
and MSRs, as well as the applicable stress tests for those assump-
tions, see Note 16 on pages 244–259, and Note 17 on pages
260–263 of this Annual Report.
JPMorgan Chase & Co./2010 Annual Report 175
Private equity investments
The valuation of nonpublic private equity investments, which are
held primarily by the Private Equity business within the Corpo-
rate/Private Equity line of business, requires significant manage-
ment judgment due to the absence of quoted market prices, the
inherent lack of liquidity and the long-term nature of such assets.
As such, nonpublic private equity investments are valued initially
based on cost. Each quarter, valuations are reviewed using avail-
able and relevant market data to determine if the carrying value
of these investments should be adjusted. Such market data pri-
marily include observations of the trading multiples of public
companies considered comparable to the private companies being
valued and the operating performance of the underlying portfolio
company, including its historical and projected net income and its
earnings before interest, taxes, depreciation and amortization
(“EBITDA”). Valuations are adjusted to account for company-
specific issues, the lack of liquidity inherent in a nonpublic in-
vestment, and the fact that comparable public companies are not
identical to the companies being valued. In addition, a variety of
additional factors are reviewed by management, including, but
not limited to, financing and sales transactions with third parties,
future expectations of the particular investment, changes in
market outlook and the third-party financing environment. Non-
public private equity investments are included in level 3 of the
valuation hierarchy.
Private equity investments also include publicly held equity in-
vestments, generally obtained through the initial public offering
of privately held equity investments. Investments in securities of
publicly held companies that trade in liquid markets are marked
to market at the quoted public value less adjustments for regula-
tory or contractual sales restrictions. Discounts for restrictions are
quantified by analyzing the length of the restriction period and
the volatility of the equity security. Publicly held investments are
predominantly classified in level 2 of the valuation hierarchy.
Other fund investments
The Firm holds investments in mutual/collective investment funds,
private equity funds, hedge funds and real estate funds. Where
the funds produce a daily net asset value (“NAV”) that is vali-
dated by a sufficient level of observable activity (purchases and
sales at NAV), the NAV is used to value the fund investment and
it is classified in level 1 of the valuation hierarchy. Where adjust-
ments to the NAV are required, for example, with respect to
interests in funds subject to restrictions on redemption (such as
lock-up periods or withdrawal limitations) and/or observable
activity for the fund investment is limited, investments are classi-
fied within level 2 or 3 of the valuation hierarchy.
Liabilities
Securities sold under repurchase agreements (“repur-
chase agreements”)
To estimate the fair value of repurchase agreements, cash flows
are first evaluated taking into consideration any derivative fea-
tures of the repurchase agreements and are then discounted
using the appropriate market rates for the applicable maturity.
Generally, for these types of agreements, there is a requirement
that collateral be maintained with a market value equal to, or in
excess of, the principal amount loaned; as a result, there would
be no adjustment, or an immaterial adjustment, to reflect the
credit quality of the Firm (i.e., DVA) related to these agreements.
As the inputs into the valuation are primarily based on observable
pricing information, repurchase agreements are classified within
level 2 of the valuation hierarchy.
Beneficial interests issued by consolidated VIEs
The fair value of beneficial interests issued by consolidated VIEs
(“beneficial interests”) is estimated based on the fair value of the
underlying assets held by the VIEs. The valuation of beneficial
interests does not include an adjustment to reflect the credit
quality of the Firm, as the holders of these beneficial interests do
not have recourse to the general credit of JPMorgan Chase.
Where the inputs into the valuation are based on observable
market pricing information, the beneficial interests are classified
within level 2 of the valuation hierarchy. Where significant inputs
into the valuation are unobservable, the beneficial interests are
classified within level 3 of the valuation hierarchy.
Deposits, other borrowed funds and long-term debt
To estimate the fair value of long-term debt, cash flows are
discounted using the appropriate market rates for the applicable
maturities, with an adjustment to reflect the credit quality of the
Firm (i.e., the DVA). Included within deposits, other borrowed
funds and long-term debt are structured notes issued by the Firm
that are financial instruments containing embedded derivatives.
In addition to the above, the estimation of the fair value of struc-
tured notes takes into consideration any derivative features.
Where the inputs into the valuation are primarily based on observ-
able market prices, the structured notes are classified within level 2
of the valuation hierarchy. Where significant inputs are unobserv-
able, the structured notes are classified within level 3 of the valua-
tion hierarchy.
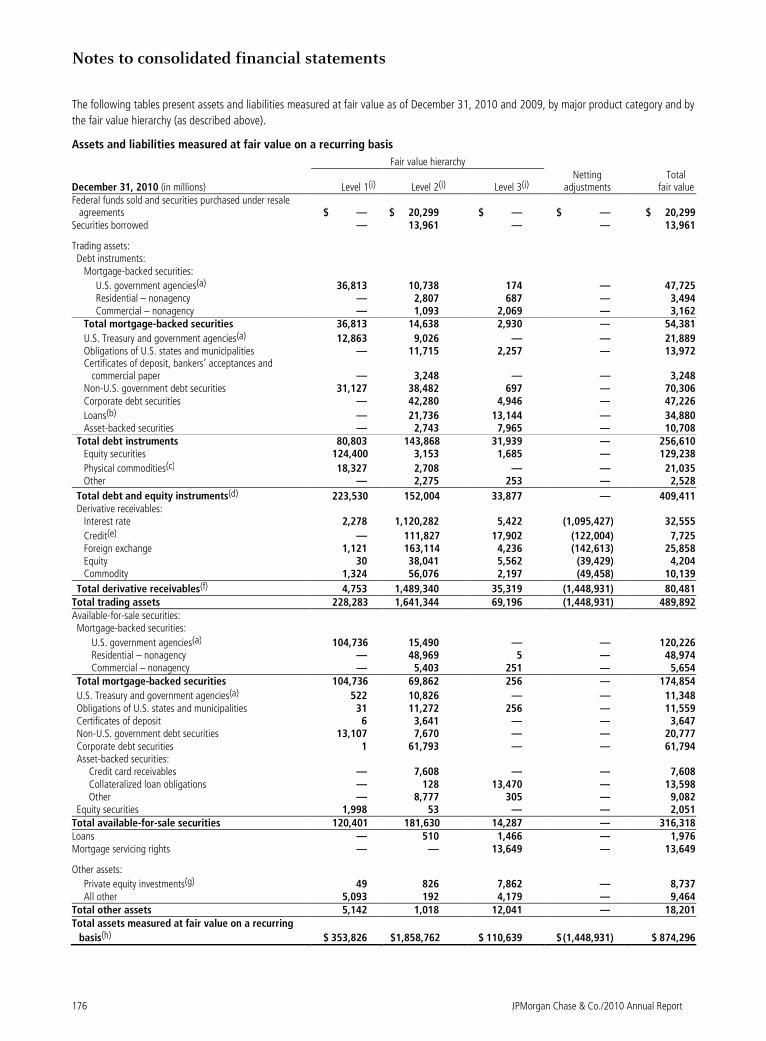
Notes to consolidated financial statements
176 JPMorgan Chase & Co./2010 Annual Report
The following tables present assets and liabilities measured at fair value as of December 31, 2010 and 2009, by major product category and by
the fair value hierarchy (as described above).
Assets and liabilities measured at fair value on a recurring basis
Fair value hierarchy
December 31, 2010 (in millions) Level 1(i) Level 2(i) Level 3(i) Netting
adjustments Total
fair value Federal funds sold and securities purchased under resale
agreements $ — $ 20,299 $ — $ — $ 20,299 Securities borrowed — 13,961 — — 13,961
Trading assets: Debt instruments:
Mortgage-backed securities:
U.S. government agencies(a) 36,813 10,738 174 — 47,725 Residential – nonagency — 2,807 687 — 3,494 Commercial – nonagency — 1,093 2,069 — 3,162
Total mortgage-backed securities 36,813 14,638 2,930 — 54,381
U.S. Treasury and government agencies(a) 12,863 9,026 — — 21,889 Obligations of U.S. states and municipalities — 11,715 2,257 — 13,972 Certificates of deposit, bankers’ acceptances and commercial paper — 3,248 — — 3,248 Non-U.S. government debt securities 31,127 38,482 697 — 70,306 Corporate debt securities — 42,280 4,946 — 47,226
Loans(b) — 21,736 13,144 — 34,880 Asset-backed securities — 2,743 7,965 — 10,708
Total debt instruments 80,803 143,868 31,939 — 256,610 Equity securities 124,400 3,153 1,685 — 129,238
Physical commodities(c) 18,327 2,708 — — 21,035 Other — 2,275 253 — 2,528
Total debt and equity instruments(d) 223,530 152,004 33,877 — 409,411 Derivative receivables:
Interest rate 2,278 1,120,282 5,422 (1,095,427) 32,555
Credit(e) — 111,827 17,902 (122,004) 7,725 Foreign exchange 1,121 163,114 4,236 (142,613) 25,858 Equity 30 38,041 5,562 (39,429) 4,204 Commodity 1,324 56,076 2,197 (49,458) 10,139
Total derivative receivables(f) 4,753 1,489,340 35,319 (1,448,931) 80,481 Total trading assets 228,283 1,641,344 69,196 (1,448,931) 489,892 Available-for-sale securities: Mortgage-backed securities:
U.S. government agencies(a) 104,736 15,490 — — 120,226 Residential – nonagency — 48,969 5 — 48,974 Commercial – nonagency — 5,403 251 — 5,654
Total mortgage-backed securities 104,736 69,862 256 — 174,854
U.S. Treasury and government agencies(a) 522 10,826 — — 11,348 Obligations of U.S. states and municipalities 31 11,272 256 — 11,559 Certificates of deposit 6 3,641 — — 3,647 Non-U.S. government debt securities 13,107 7,670 — — 20,777 Corporate debt securities 1 61,793 — — 61,794 Asset-backed securities:
Credit card receivables — 7,608 — — 7,608 Collateralized loan obligations — 128 13,470 — 13,598 Other — 8,777 305 — 9,082
Equity securities 1,998 53 — — 2,051 Total available-for-sale securities 120,401 181,630 14,287 — 316,318 Loans — 510 1,466 — 1,976 Mortgage servicing rights — — 13,649 — 13,649
Other assets:
Private equity investments(g) 49 826 7,862 — 8,737 All other 5,093 192 4,179 — 9,464
Total other assets 5,142 1,018 12,041 — 18,201 Total assets measured at fair value on a recurring
basis(h) $ 353,826 $1,858,762 $ 110,639 $ (1,448,931) $ 874,296
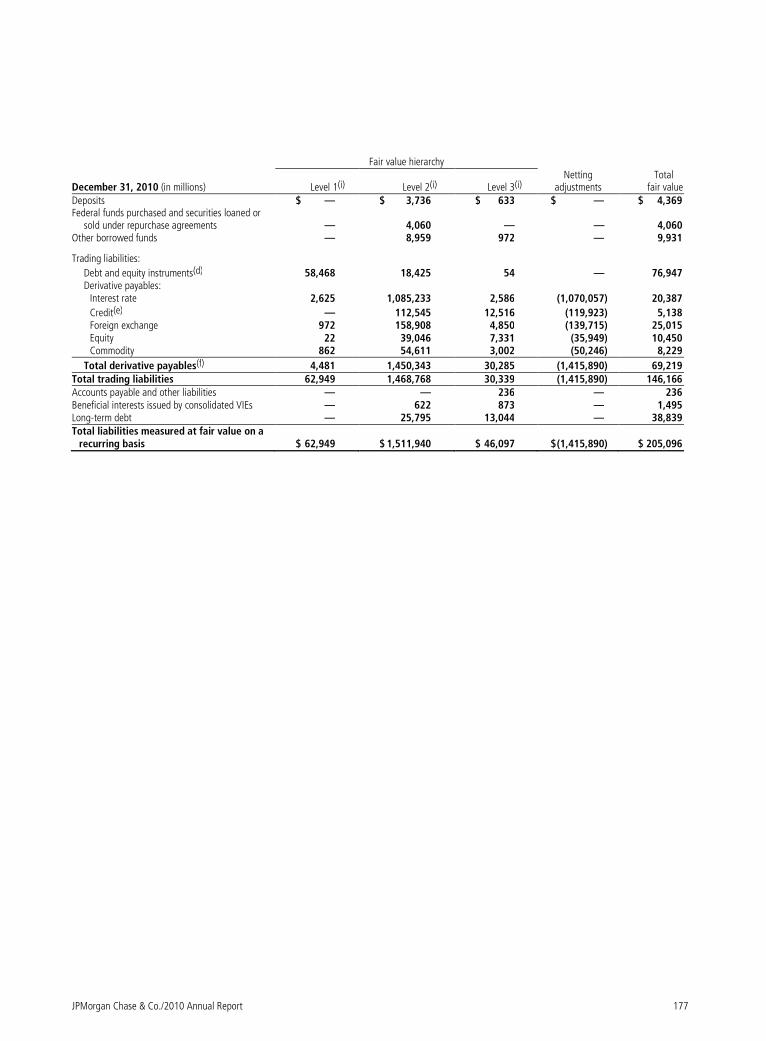
JPMorgan Chase & Co./2010 Annual Report 177
Fair value hierarchy
December 31, 2010 (in millions) Level 1(i) Level 2(i) Level 3(i) Netting
adjustments Total
fair value Deposits $ — $ 3,736 $ 633 $ — $ 4,369 Federal funds purchased and securities loaned or
sold under repurchase agreements — 4,060 — — 4,060 Other borrowed funds — 8,959 972 — 9,931
Trading liabilities:
Debt and equity instruments(d) 58,468 18,425 54 — 76,947 Derivative payables:
Interest rate 2,625 1,085,233 2,586 (1,070,057) 20,387
Credit(e) — 112,545 12,516 (119,923) 5,138 Foreign exchange 972 158,908 4,850 (139,715) 25,015 Equity 22 39,046 7,331 (35,949) 10,450 Commodity 862 54,611 3,002 (50,246) 8,229
Total derivative payables(f) 4,481 1,450,343 30,285 (1,415,890) 69,219 Total trading liabilities 62,949 1,468,768 30,339 (1,415,890) 146,166 Accounts payable and other liabilities — — 236 — 236 Beneficial interests issued by consolidated VIEs — 622 873 — 1,495 Long-term debt — 25,795 13,044 — 38,839 Total liabilities measured at fair value on a
recurring basis $ 62,949 $ 1,511,940 $ 46,097 $ (1,415,890) $ 205,096
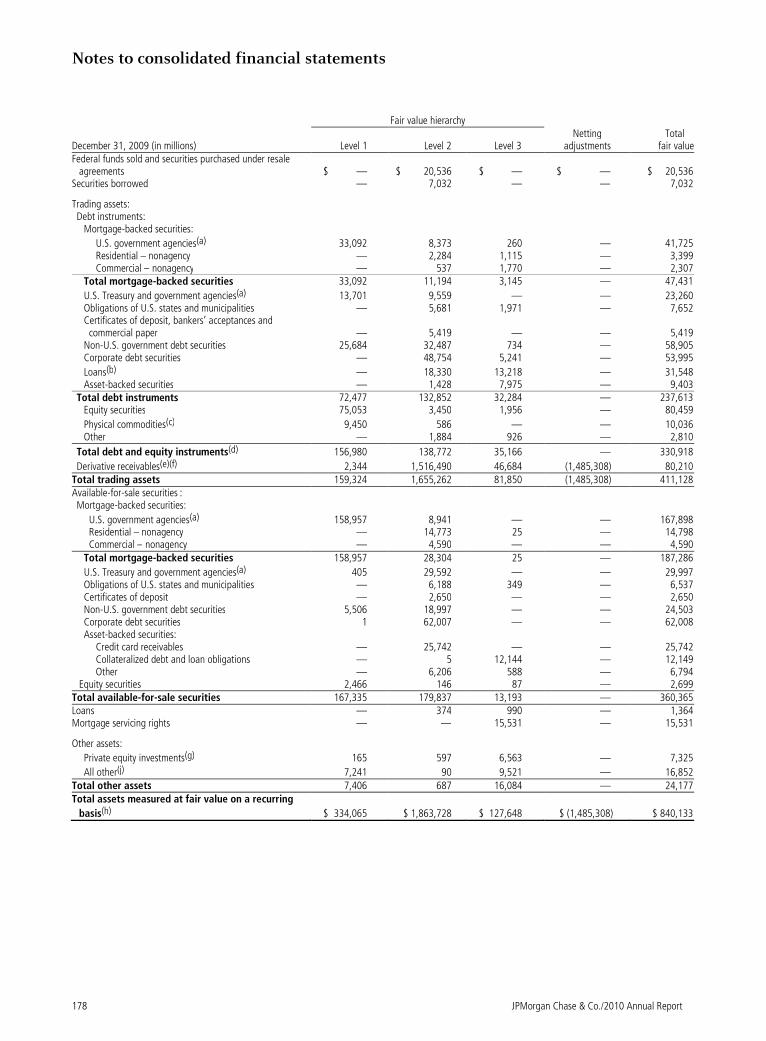
Notes to consolidated financial statements
178 JPMorgan Chase & Co./2010 Annual Report
Fair value hierarchy
December 31, 2009 (in millions) Level 1 Level 2 Level 3 Netting
adjustments Total
fair value Federal funds sold and securities purchased under resale
agreements $ — $ 20,536 $ — $ — $ 20,536 Securities borrowed — 7,032 — — 7,032
Trading assets: Debt instruments:
Mortgage-backed securities:
U.S. government agencies(a) 33,092 8,373 260 — 41,725 Residential – nonagency — 2,284 1,115 — 3,399 Commercial – nonagency — 537 1,770 — 2,307
Total mortgage-backed securities 33,092 11,194 3,145 — 47,431
U.S. Treasury and government agencies(a) 13,701 9,559 — — 23,260 Obligations of U.S. states and municipalities — 5,681 1,971 — 7,652 Certificates of deposit, bankers’ acceptances and commercial paper — 5,419 — — 5,419 Non-U.S. government debt securities 25,684 32,487 734 — 58,905 Corporate debt securities — 48,754 5,241 — 53,995
Loans(b) — 18,330 13,218 — 31,548 Asset-backed securities — 1,428 7,975 — 9,403
Total debt instruments 72,477 132,852 32,284 — 237,613 Equity securities 75,053 3,450 1,956 — 80,459
Physical commodities(c) 9,450 586 — — 10,036 Other — 1,884 926 — 2,810
Total debt and equity instruments(d) 156,980 138,772 35,166 — 330,918
Derivative receivables(e)(f) 2,344 1,516,490 46,684 (1,485,308) 80,210 Total trading assets 159,324 1,655,262 81,850 (1,485,308) 411,128 Available-for-sale securities
:
Mortgage-backed securities:
U.S. government agencies(a) 158,957 8,941 — — 167,898 Residential – nonagency — 14,773 25 — 14,798 Commercial – nonagency — 4,590 — — 4,590 Total mortgage-backed securities 158,957 28,304 25 — 187,286
U.S. Treasury and government agencies(a) 405 29,592 — — 29,997 Obligations of U.S. states and municipalities — 6,188 349 — 6,537 Certificates of deposit — 2,650 — — 2,650 Non-U.S. government debt securities 5,506 18,997 — — 24,503 Corporate debt securities 1 62,007 — — 62,008 Asset-backed securities:
Credit card receivables — 25,742 — — 25,742 Collateralized debt and loan obligations — 5 12,144 — 12,149 Other — 6,206 588 — 6,794
Equity securities 2,466 146 87 — 2,699 Total available-for-sale securities 167,335 179,837 13,193 — 360,365 Loans — 374 990 — 1,364 Mortgage servicing rights — — 15,531 — 15,531
Other assets:
Private equity investments(g) 165 597 6,563 — 7,325
All other(j) 7,241 90 9,521 — 16,852 Total other assets 7,406 687 16,084 — 24,177 Total assets measured at fair value on a recurring
basis(h) $ 334,065 $ 1,863,728 $ 127,648 $ (1,485,308) $ 840,133
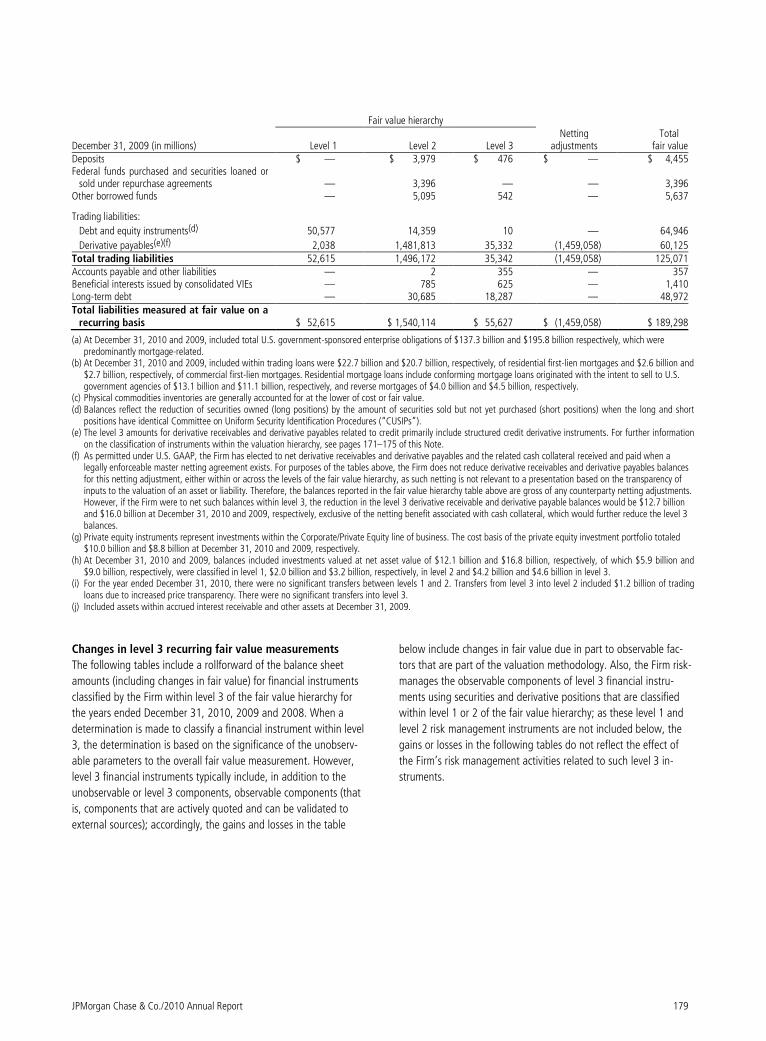
JPMorgan Chase & Co./2010 Annual Report 179
Fair value hierarchy
December 31, 2009 (in millions) Level 1 Level 2 Level 3 Netting
adjustments Total fair value
Deposits $ — $ 3,979 $ 476 $ — $ 4,455Federal funds purchased and securities loaned or
sold under repurchase agreements — 3,396 — — 3,396Other borrowed funds — 5,095 542 — 5,637
Trading liabilities:
Debt and equity instruments(d) 50,577 14,359 10 — 64,946
Derivative payables(e)(f) 2,038 1,481,813 35,332 (1,459,058) 60,125Total trading liabilities 52,615 1,496,172 35,342 (1,459,058) 125,071Accounts payable and other liabilities — 2 355 — 357Beneficial interests issued by consolidated VIEs — 785 625 — 1,410Long-term debt — 30,685 18,287 — 48,972Total liabilities measured at fair value on a
recurring basis $ 52,615 $ 1,540,114 $ 55,627 $ (1,459,058) $ 189,298 (a) At December 31, 2010 and 2009, included total U.S. government-sponsored enterprise obligations of $137.3 billion and $195.8 billion respectively, which were
predominantly mortgage-related. (b) At December 31, 2010 and 2009, included within trading loans were $22.7 billion and $20.7 billion, respectively, of residential first-lien mortgages and $2.6 billion and
$2.7 billion, respectively, of commercial first-lien mortgages. Residential mortgage loans include conforming mortgage loans originated with the intent to sell to U.S. government agencies of $13.1 billion and $11.1 billion, respectively, and reverse mortgages of $4.0 billion and $4.5 billion, respectively.
(c) Physical commodities inventories are generally accounted for at the lower of cost or fair value. (d) Balances reflect the reduction of securities owned (long positions) by the amount of securities sold but not yet purchased (short positions) when the long and short
positions have identical Committee on Uniform Security Identification Procedures (“CUSIPs”). (e) The level 3 amounts for derivative receivables and derivative payables related to credit primarily include structured credit derivative instruments. For further information
on the classification of instruments within the valuation hierarchy, see pages 171–175 of this Note. (f) As permitted under U.S. GAAP, the Firm has elected to net derivative receivables and derivative payables and the related cash collateral received and paid when a
legally enforceable master netting agreement exists. For purposes of the tables above, the Firm does not reduce derivative receivables and derivative payables balances for this netting adjustment, either within or across the levels of the fair value hierarchy, as such netting is not relevant to a presentation based on the transparency of inputs to the valuation of an asset or liability. Therefore, the balances reported in the fair value hierarchy table above are gross of any counterparty netting adjustments. However, if the Firm were to net such balances within level 3, the reduction in the level 3 derivative receivable and derivative payable balances would be $12.7 billion and $16.0 billion at December 31, 2010 and 2009, respectively, exclusive of the netting benefit associated with cash collateral, which would further reduce the level 3 balances.
(g) Private equity instruments represent investments within the Corporate/Private Equity line of business. The cost basis of the private equity investment portfolio totaled $10.0 billion and $8.8 billion at December 31, 2010 and 2009, respectively.
(h) At December 31, 2010 and 2009, balances included investments valued at net asset value of $12.1 billion and $16.8 billion, respectively, of which $5.9 billion and $9.0 billion, respectively, were classified in level 1, $2.0 billion and $3.2 billion, respectively, in level 2 and $4.2 billion and $4.6 billion in level 3.
(i) For the year ended December 31, 2010, there were no significant transfers between levels 1 and 2. Transfers from level 3 into level 2 included $1.2 billion of trading loans due to increased price transparency. There were no significant transfers into level 3.
(j) Included assets within accrued interest receivable and other assets at December 31, 2009.
Changes in level 3 recurring fair value measurements
The following tables include a rollforward of the balance sheet
amounts (including changes in fair value) for financial instruments
classified by the Firm within level 3 of the fair value hierarchy for
the years ended December 31, 2010, 2009 and 2008. When a
determination is made to classify a financial instrument within level
3, the determination is based on the significance of the unobserv-
able parameters to the overall fair value measurement. However,
level 3 financial instruments typically include, in addition to the
unobservable or level 3 components, observable components (that
is, components that are actively quoted and can be validated to
external sources); accordingly, the gains and losses in the table
below include changes in fair value due in part to observable fac-
tors that are part of the valuation methodology. Also, the Firm risk-
manages the observable components of level 3 financial instru-
ments using securities and derivative positions that are classified
within level 1 or 2 of the fair value hierarchy; as these level 1 and
level 2 risk management instruments are not included below, the
gains or losses in the following tables do not reflect the effect of
the Firm’s risk management activities related to such level 3 in-
struments.
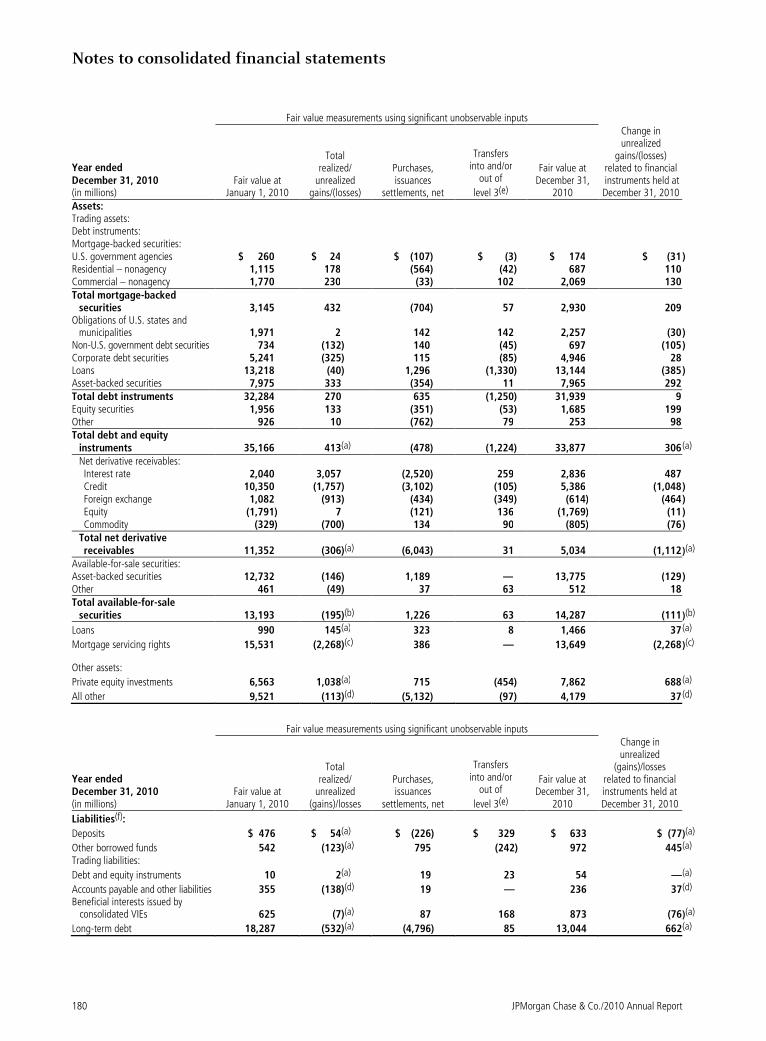
Notes to consolidated financial statements
180 JPMorgan Chase & Co./2010 Annual Report
Fair value measurements using significant unobservable inputs
Year ended December 31, 2010 (in millions)
Fair value at January 1, 2010
Total realized/
unrealized gains/(losses)
Purchases, issuances
settlements, net
Transfers into and/or
out of
level 3(e)
Fair value at December 31,
2010
Change in unrealized
gains/(losses) related to financial instruments held at December 31, 2010
Assets: Trading assets: Debt instruments: Mortgage-backed securities: U.S. government agencies $ 260 $ 24 $ (107) $ (3) $ 174 $ (31 ) Residential – nonagency 1,115 178 (564) (42) 687 110 Commercial – nonagency 1,770 230 (33) 102 2,069 130 Total mortgage-backed
securities 3,145 432 (704) 57 2,930 209 Obligations of U.S. states and
municipalities 1,971 2 142 142 2,257 (30 ) Non-U.S. government debt securities 734 (132) 140 (45) 697 (105 ) Corporate debt securities 5,241 (325) 115 (85) 4,946 28 Loans 13,218 (40) 1,296 (1,330) 13,144 (385 ) Asset-backed securities 7,975 333 (354) 11 7,965 292 Total debt instruments 32,284 270 635 (1,250) 31,939 9 Equity securities 1,956 133 (351) (53) 1,685 199 Other 926 10 (762) 79 253 98 Total debt and equity
instruments 35,166 413(a) (478) (1,224) 33,877 306 (a) Net derivative receivables: Interest rate 2,040 3,057 (2,520) 259 2,836 487 Credit 10,350 (1,757) (3,102) (105) 5,386 (1,048 ) Foreign exchange 1,082 (913) (434) (349) (614) (464 ) Equity (1,791) 7 (121) 136 (1,769) (11 ) Commodity (329) (700) 134 90 (805) (76 )
Total net derivative receivables 11,352 (306)(a) (6,043) 31 5,034 (1,112 )(a)
Available-for-sale securities: Asset-backed securities 12,732 (146) 1,189 — 13,775 (129 ) Other 461 (49) 37 63 512 18 Total available-for-sale
securities 13,193 (195)(b) 1,226 63 14,287 (111 )(b)
Loans 990 145(a) 323 8 1,466 37 (a)
Mortgage servicing rights 15,531 (2,268)(c) 386 — 13,649 (2,268 )(c)
Other assets:
Private equity investments 6,563 1,038(a) 715 (454) 7,862 688 (a)
All other 9,521 (113)(d) (5,132) (97) 4,179 37 (d)
Fair value measurements using significant unobservable inputs
Year ended December 31, 2010 (in millions)
Fair value at January 1, 2010
Total realized/
unrealized (gains)/losses
Purchases, issuances
settlements, net
Transfers into and/or
out of
level 3(e)
Fair value at December 31,
2010
Change in unrealized
(gains)/losses related to financial instruments held at December 31, 2010
Liabilities(f):
Deposits $ 476 $ 54(a) $ (226) $ 329 $ 633 $ (77 )(a)
Other borrowed funds 542 (123)(a) 795 (242) 972 445 (a)
Trading liabilities:
Debt and equity instruments 10 2(a) 19 23 54 — (a)
Accounts payable and other liabilities 355 (138)(d) 19 — 236 37 (d)
Beneficial interests issued by consolidated VIEs 625 (7)(a) 87 168 873 (76 )(a)
Long-term debt 18,287 (532)(a) (4,796) 85 13,044 662 (a)
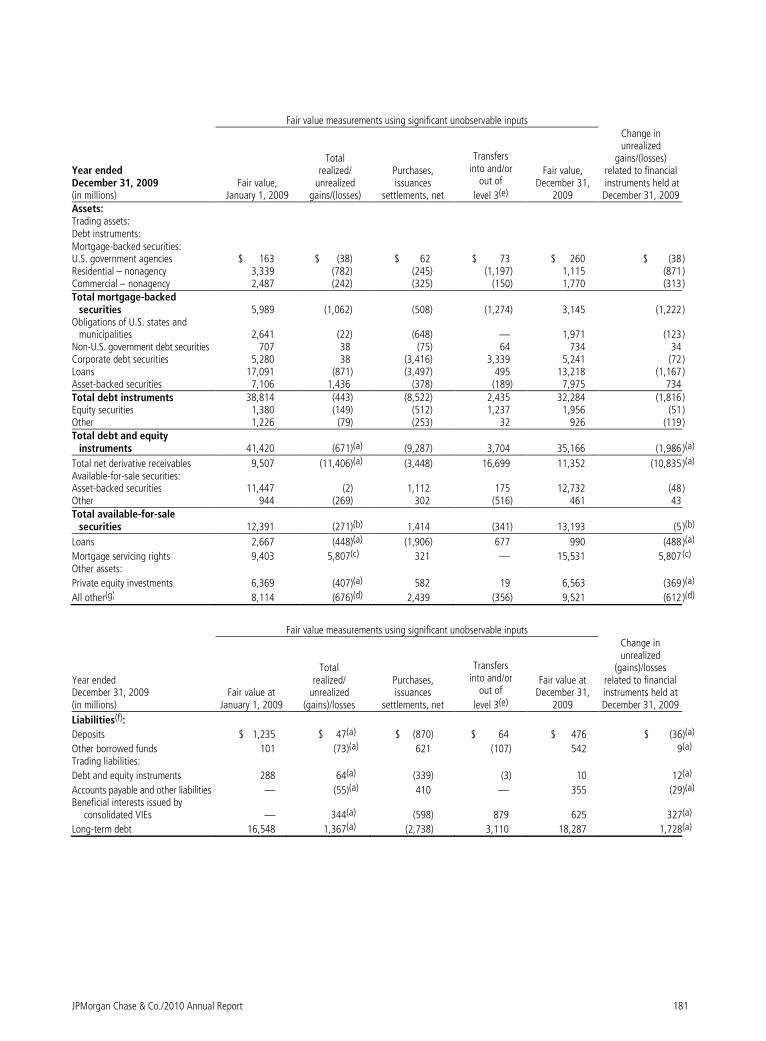
JPMorgan Chase & Co./2010 Annual Report 181
Fair value measurements using significant unobservable inputs
Year ended December 31, 2009 (in millions)
Fair value, January 1, 2009
Total realized/
unrealized gains/(losses)
Purchases, issuances
settlements, net
Transfers into and/or
out of
level 3(e)
Fair value, December 31,
2009
Change in unrealized
gains/(losses) related to financial instruments held at December 31, 2009
Assets: Trading assets: Debt instruments: Mortgage-backed securities: U.S. government agencies $ 163 $ (38) $ 62 $ 73 $ 260 $ (38 ) Residential – nonagency 3,339 (782) (245) (1,197) 1,115 (871 ) Commercial – nonagency 2,487 (242) (325) (150) 1,770 (313 ) Total mortgage-backed
securities 5,989 (1,062) (508) (1,274) 3,145 (1,222 ) Obligations of U.S. states and
municipalities 2,641 (22) (648) — 1,971 (123 ) Non-U.S. government debt securities 707 38 (75) 64 734 34 Corporate debt securities 5,280 38 (3,416) 3,339 5,241 (72 ) Loans 17,091 (871) (3,497) 495 13,218 (1,167 ) Asset-backed securities 7,106 1,436 (378) (189) 7,975 734 Total debt instruments 38,814 (443) (8,522) 2,435 32,284 (1,816 ) Equity securities 1,380 (149) (512) 1,237 1,956 (51 ) Other 1,226 (79) (253) 32 926 (119 ) Total debt and equity
instruments 41,420 (671)(a) (9,287) 3,704 35,166 (1,986 )(a)
Total net derivative receivables 9,507 (11,406)(a) (3,448) 16,699 11,352 (10,835 )(a) Available-for-sale securities: Asset-backed securities 11,447 (2) 1,112 175 12,732 (48 ) Other 944 (269) 302 (516) 461 43 Total available-for-sale
securities 12,391 (271)(b) 1,414 (341) 13,193 (5 )(b)
Loans 2,667 (448)(a) (1,906) 677 990 (488 )(a)
Mortgage servicing rights 9,403 5,807(c) 321 — 15,531 5,807 (c)
Other assets:
Private equity investments 6,369 (407)(a) 582 19 6,563 (369 )(a)
All other(g) 8,114 (676)(d) 2,439 (356) 9,521 (612 )(d)
Fair value measurements using significant unobservable inputs
Year ended December 31, 2009 (in millions)
Fair value at January 1, 2009
Total realized/
unrealized (gains)/losses
Purchases, issuances
settlements, net
Transfers into and/or
out of
level 3(e)
Fair value at December 31,
2009
Change in unrealized
(gains)/losses related to financial instruments held at December 31, 2009
Liabilities(f):
Deposits $ 1,235 $ 47(a) $ (870) $ 64 $ 476 $ (36)(a)
Other borrowed funds 101 (73)(a) 621 (107) 542 9(a)
Trading liabilities:
Debt and equity instruments 288 64(a) (339) (3) 10 12(a)
Accounts payable and other liabilities — (55)(a) 410 — 355 (29)(a)
Beneficial interests issued by consolidated VIEs — 344(a) (598) 879 625 327(a)
Long-term debt 16,548 1,367(a) (2,738) 3,110 18,287 1,728(a)
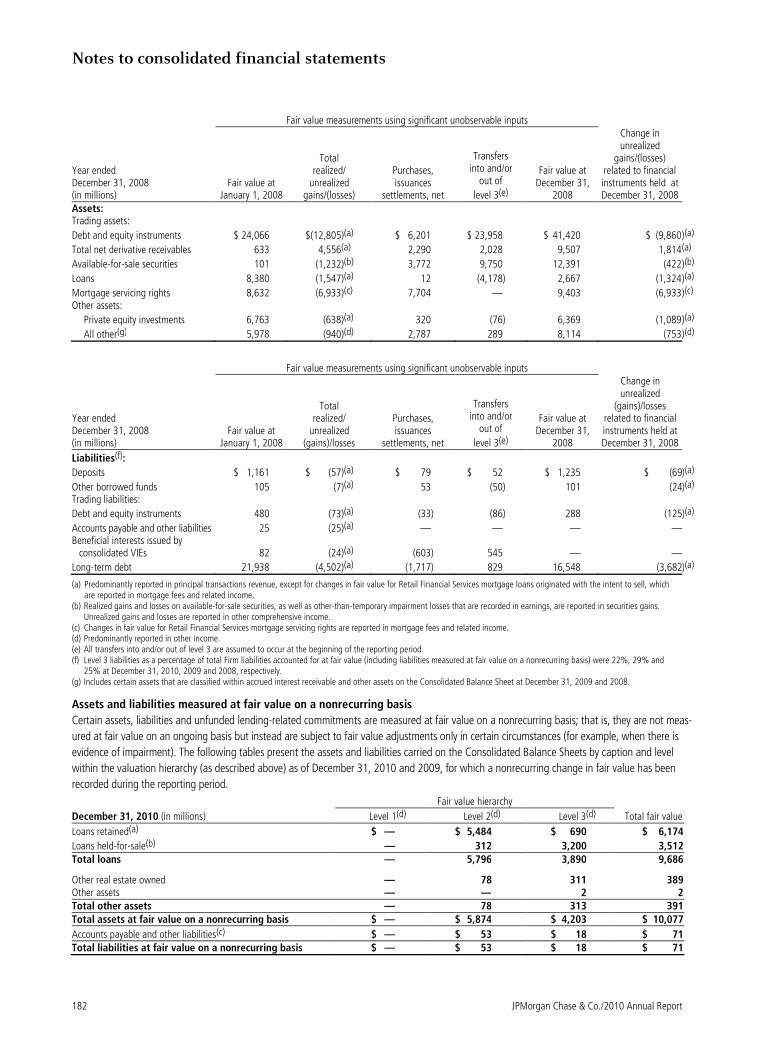
Notes to consolidated financial statements
182 JPMorgan Chase & Co./2010 Annual Report
Fair value measurements using significant unobservable inputs
Year ended December 31, 2008 (in millions)
Fair value at January 1, 2008
Total realized/
unrealized gains/(losses)
Purchases, issuances
settlements, net
Transfers into and/or
out of
level 3(e)
Fair value at December 31,
2008
Change in unrealized
gains/(losses) related to financial instruments held at December 31, 2008
Assets: Trading assets:
Debt and equity instruments $ 24,066 $(12,805)(a) $ 6,201 $ 23,958 $ 41,420 $ (9,860 )(a)
Total net derivative receivables 633 4,556(a) 2,290 2,028 9,507 1,814 (a)
Available-for-sale securities 101 (1,232)(b) 3,772 9,750 12,391 (422 )(b)
Loans 8,380 (1,547)(a) 12 (4,178) 2,667 (1,324 )(a)
Mortgage servicing rights 8,632 (6,933)(c) 7,704 — 9,403 (6,933 )(c) Other assets:
Private equity investments 6,763 (638)(a) 320 (76) 6,369 (1,089 )(a)
All other(g) 5,978 (940)(d) 2,787 289 8,114 (753 )(d)
Fair value measurements using significant unobservable inputs
Year ended December 31, 2008 (in millions)
Fair value at January 1, 2008
Total realized/
unrealized (gains)/losses
Purchases, issuances
settlements, net
Transfers into and/or
out of
level 3(e)
Fair value at December 31,
2008
Change in unrealized
(gains)/losses related to financial instruments held at December 31, 2008
Liabilities(f):
Deposits $ 1,161 $ (57)(a) $ 79 $ 52 $ 1,235 $ (69)(a)
Other borrowed funds 105 (7)(a) 53 (50) 101 (24)(a) Trading liabilities:
Debt and equity instruments 480 (73)(a) (33) (86) 288 (125)(a)
Accounts payable and other liabilities 25 (25)(a) — — — —Beneficial interests issued by
consolidated VIEs 82 (24)(a) (603) 545 — —
Long-term debt 21,938 (4,502)(a) (1,717) 829 16,548 (3,682)(a)
(a) Predominantly reported in principal transactions revenue, except for changes in fair value for Retail Financial Services mortgage loans originated with the intent to sell, which are reported in mortgage fees and related income.
(b) Realized gains and losses on available-for-sale securities, as well as other-than-temporary impairment losses that are recorded in earnings, are reported in securities gains. Unrealized gains and losses are reported in other comprehensive income.
(c) Changes in fair value for Retail Financial Services mortgage servicing rights are reported in mortgage fees and related income. (d) Predominantly reported in other income. (e) All transfers into and/or out of level 3 are assumed to occur at the beginning of the reporting period. (f) Level 3 liabilities as a percentage of total Firm liabilities accounted for at fair value (including liabilities measured at fair value on a nonrecurring basis) were 22%, 29% and
25% at December 31, 2010, 2009 and 2008, respectively. (g) Includes certain assets that are classified within accrued interest receivable and other assets on the Consolidated Balance Sheet at December 31, 2009 and 2008.
Assets and liabilities measured at fair value on a nonrecurring basis
Certain assets, liabilities and unfunded lending-related commitments are measured at fair value on a nonrecurring basis; that is, they are not meas-
ured at fair value on an ongoing basis but instead are subject to fair value adjustments only in certain circumstances (for example, when there is
evidence of impairment). The following tables present the assets and liabilities carried on the Consolidated Balance Sheets by caption and level
within the valuation hierarchy (as described above) as of December 31, 2010 and 2009, for which a nonrecurring change in fair value has been
recorded during the reporting period.
Fair value hierarchy
December 31, 2010 (in millions) Level 1(d) Level 2(d) Level 3(d) Total fair value
Loans retained(a) $ — $ 5,484 $ 690 $ 6,174
Loans held-for-sale(b) — 312 3,200 3,512 Total loans — 5,796 3,890 9,686
Other real estate owned — 78 311 389 Other assets — — 2 2 Total other assets — 78 313 391 Total assets at fair value on a nonrecurring basis $ — $ 5,874 $ 4,203 $ 10,077
Accounts payable and other liabilities(c) $ — $ 53 $ 18 $ 71 Total liabilities at fair value on a nonrecurring basis $ — $ 53 $ 18 $ 71
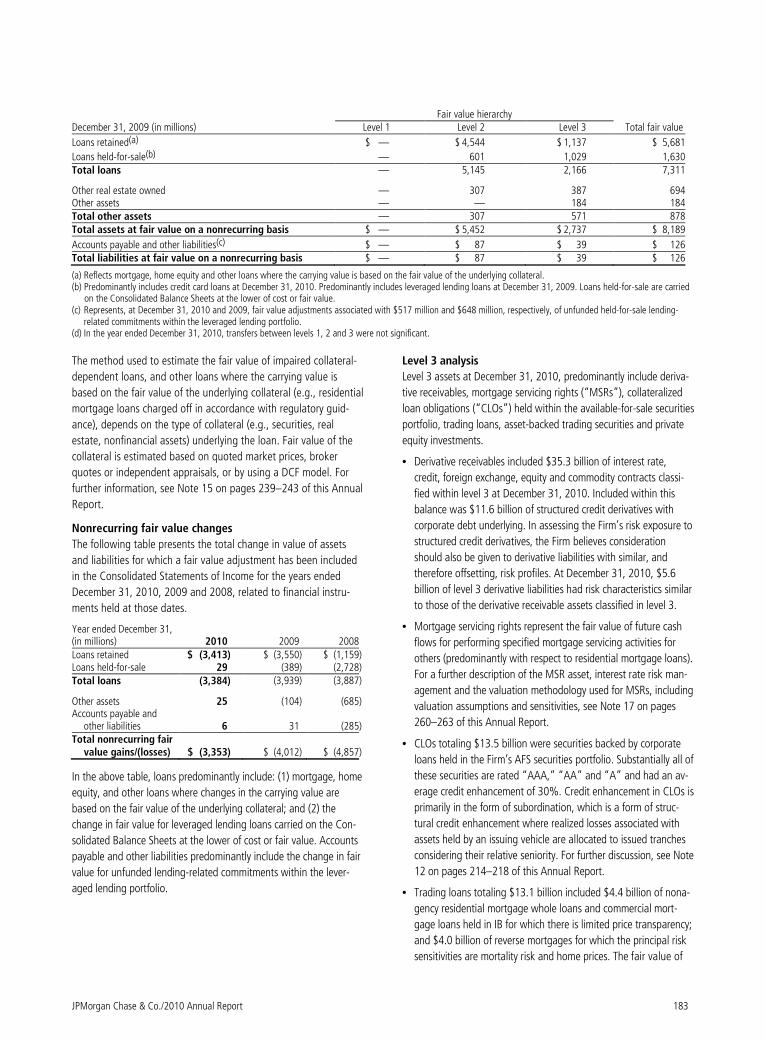
JPMorgan Chase & Co./2010 Annual Report 183
Fair value hierarchy December 31, 2009 (in millions) Level 1 Level 2 Level 3 Total fair value
Loans retained(a) $ — $ 4,544 $ 1,137 $ 5,681
Loans held-for-sale(b) — 601 1,029 1,630Total loans — 5,145 2,166 7,311
Other real estate owned — 307 387 694Other assets — — 184 184Total other assets — 307 571 878Total assets at fair value on a nonrecurring basis $ — $ 5,452 $ 2,737 $ 8,189
Accounts payable and other liabilities(c) $ — $ 87 $ 39 $ 126Total liabilities at fair value on a nonrecurring basis $ — $ 87 $ 39 $ 126
(a) Reflects mortgage, home equity and other loans where the carrying value is based on the fair value of the underlying collateral. (b) Predominantly includes credit card loans at December 31, 2010. Predominantly includes leveraged lending loans at December 31, 2009. Loans held-for-sale are carried
on the Consolidated Balance Sheets at the lower of cost or fair value. (c) Represents, at December 31, 2010 and 2009, fair value adjustments associated with $517 million and $648 million, respectively, of unfunded held-for-sale lending-
related commitments within the leveraged lending portfolio. (d) In the year ended December 31, 2010, transfers between levels 1, 2 and 3 were not significant.
The method used to estimate the fair value of impaired collateral-
dependent loans, and other loans where the carrying value is
based on the fair value of the underlying collateral (e.g., residential
mortgage loans charged off in accordance with regulatory guid-
ance), depends on the type of collateral (e.g., securities, real
estate, nonfinancial assets) underlying the loan. Fair value of the
collateral is estimated based on quoted market prices, broker
quotes or independent appraisals, or by using a DCF model. For
further information, see Note 15 on pages 239–243 of this Annual
Report.
Nonrecurring fair value changes
The following table presents the total change in value of assets
and liabilities for which a fair value adjustment has been included
in the Consolidated Statements of Income for the years ended
December 31, 2010, 2009 and 2008, related to financial instru-
ments held at those dates.
Year ended December 31, (in millions) 2010 2009 2008 Loans retained $ (3,413) $ (3,550) $ (1,159) Loans held-for-sale 29 (389) (2,728) Total loans (3,384) (3,939) (3,887)
Other assets 25 (104) (685) Accounts payable and
other liabilities 6 31 (285) Total nonrecurring fair
value gains/(losses) $ (3,353) $ (4,012) $ (4,857)
In the above table, loans predominantly include: (1) mortgage, home
equity, and other loans where changes in the carrying value are
based on the fair value of the underlying collateral; and (2) the
change in fair value for leveraged lending loans carried on the Con-
solidated Balance Sheets at the lower of cost or fair value. Accounts
payable and other liabilities predominantly include the change in fair
value for unfunded lending-related commitments within the lever-
aged lending portfolio.
Level 3 analysis
Level 3 assets at December 31, 2010, predominantly include deriva-
tive receivables, mortgage servicing rights (“MSRs”), collateralized
loan obligations (“CLOs”) held within the available-for-sale securities
portfolio, trading loans, asset-backed trading securities and private
equity investments.
• Derivative receivables included $35.3 billion of interest rate,
credit, foreign exchange, equity and commodity contracts classi-
fied within level 3 at December 31, 2010. Included within this
balance was $11.6 billion of structured credit derivatives with
corporate debt underlying. In assessing the Firm’s risk exposure to
structured credit derivatives, the Firm believes consideration
should also be given to derivative liabilities with similar, and
therefore offsetting, risk profiles. At December 31, 2010, $5.6
billion of level 3 derivative liabilities had risk characteristics similar
to those of the derivative receivable assets classified in level 3.
• Mortgage servicing rights represent the fair value of future cash
flows for performing specified mortgage servicing activities for
others (predominantly with respect to residential mortgage loans).
For a further description of the MSR asset, interest rate risk man-
agement and the valuation methodology used for MSRs, including
valuation assumptions and sensitivities, see Note 17 on pages
260–263 of this Annual Report.
• CLOs totaling $13.5 billion were securities backed by corporate
loans held in the Firm’s AFS securities portfolio. Substantially all of
these securities are rated “AAA,” “AA” and “A” and had an av-
erage credit enhancement of 30%. Credit enhancement in CLOs is
primarily in the form of subordination, which is a form of struc-
tural credit enhancement where realized losses associated with
assets held by an issuing vehicle are allocated to issued tranches
considering their relative seniority. For further discussion, see Note
12 on pages 214–218 of this Annual Report.
• Trading loans totaling $13.1 billion included $4.4 billion of nona-
gency residential mortgage whole loans and commercial mort-
gage loans held in IB for which there is limited price transparency;
and $4.0 billion of reverse mortgages for which the principal risk
sensitivities are mortality risk and home prices. The fair value of
Notes to consolidated financial statements
184 JPMorgan Chase & Co./2010 Annual Report
the commercial and residential mortgage loans is estimated by
projecting expected cash flows, considering relevant borrower-
specific and market factors, and discounting those cash flows at
a rate reflecting current market liquidity. Loans are partially
hedged by level 2 instruments, including credit default swaps
and interest rate derivatives, which are observable and liquid.
Consolidated Balance Sheets changes
Level 3 assets (including assets measured at fair value on a nonrecur-
ring basis) were 5% of total Firm assets at December 31, 2010.
The following describes significant changes to level 3 assets during
the year.
For the year ended December 31, 2010
Level 3 assets decreased by $15.5 billion during 2010, due to the
following:
• $11.4 billion decrease in derivative receivables, predominantly
driven by changes in credit spreads;
• A net decrease of $3.5 billion due to the adoption of new ac-
counting guidance related to VIEs. As a result of the adoption of
the new guidance, there was a decrease of $5.0 billion in accrued
interest and accounts receivable related to retained securitization
interests in Firm-sponsored credit card securitization trusts that
were eliminated upon consolidation, partially offset by an increase
of $1.5 billion in trading debt and equity instruments;
• $2.8 billion decrease in trading assets – debt and equity instru-
ments, driven by sales, securitizations and transfers of trading
loans to level 2 due to increased price transparency;
• $1.9 billion decrease in MSRs. For a further discussion of the
change, refer to Note 17 on pages 260–263 of this Annual Re-
port;
• $2.2 billion increase in nonrecurring loans held-for-sale, largely
driven by an increase in credit card loans;
• $1.3 billion increase in private equity investments, largely driven
by additional follow-on investments and net gains in the portfolio;
and
• $1.0 billion increase in asset-backed AFS securities, predominantly
driven by purchases of CLOs.
Gains and Losses
Gains and losses included in the tables for 2010, 2009 and 2008
included:
2010
Included in the tables for the year ended December 31, 2010
• $2.3 billion of losses on MSRs; and
• $1.0 billion gain in private equity, largely driven by gains on
investments in the portfolio.
2009
Included in the tables for the year ended December 31, 2009
• $11.4 billion of net losses on derivatives, primarily related to the
tightening of credit spreads;
• Net losses on trading – debt and equity instruments of $671
million, consisting of $2.1 billion of losses, primarily related to
residential and commercial loans and MBS, principally driven by
markdowns and sales, partially offset by gains of $1.4 billion,
reflecting increases in the fair value of other ABS;
• $5.8 billion of gains on MSRs; and
• $1.4 billion of losses related to structured note liabilities, pre-
dominantly due to volatility in the equity markets.
2008
Included in the tables for the year ended December 31, 2008
• Losses on trading-debt and equity instruments of approximately
$12.8 billion, principally from mortgage-related transactions and
auction-rate securities;
• Losses of $6.9 billion on MSRs;
• Losses of approximately $3.9 billion on leveraged loans;
• Net gains of $4.6 billion related to derivatives, principally due to
changes in credit spreads and rate curves;
• Gains of $4.5 billion related to structured notes, principally due to
significant volatility in the fixed income, commodities and equity
markets; and
• Private equity losses of $638 million.
For further information on changes in the fair value of the MSRs, see
Note 17 on pages 260–263 of this Annual Report.
Credit adjustments
When determining the fair value of an instrument, it may be necessary
to record a valuation adjustment to arrive at an exit price under U.S.
GAAP. Valuation adjustments include, but are not limited to, amounts
to reflect counterparty credit quality and the Firm’s own creditworthi-
ness. The market’s view of the Firm’s credit quality is reflected in credit
spreads observed in the credit default swap market. For a detailed
discussion of the valuation adjustments the Firm considers, see the
valuation discussion at the beginning of this Note.
The following table provides the credit adjustments, excluding the
effect of any hedging activity, reflected within the Consolidated
Balance Sheets as of the dates indicated.
December 31, (in millions) 2010 2009 Derivative receivables balance $ 80,481 $ 80,210
Derivatives CVA(a) (4,362) (3,697 ) Derivative payables balance 69,219 60,125
Derivatives DVA (882) (841 )(d)
Structured notes balance(b)(c) 53,139 59,064
Structured notes DVA (1,153) (685 )(d)
(a) Derivatives credit valuation adjustments (“CVA”), gross of hedges, includes results managed by credit portfolio and other lines of business within IB.
(b) Structured notes are recorded within long-term debt, other borrowed funds or deposits on the Consolidated Balance Sheets, based on the tenor and legal form of the note.
(c) Structured notes are measured at fair value based on the Firm’s election under the fair value option. For further information on these elections, see Note 4 on pages 187–189 of this Annual Report.
(d) The prior period has been revised.
JPMorgan Chase & Co./2010 Annual Report 185
The following table provides the impact of credit adjustments on
earnings in the respective periods, excluding the effect of any
hedging activity.
Year ended December 31, (in millions) 2010 2009 2008 Credit adjustments:
Derivative CVA(a) $ (665) $ 5,869 $ (7,561 )
Derivative DVA 41 (548)(c) 789
Structured note DVA(b) 468 (1,748)(c) 1,211
(a) Derivatives CVA, gross of hedges, includes results managed by credit portfo-lio and other lines of business within IB.
(b) Structured notes are measured at fair value based on the Firm’s election under the fair value option. For further information on these elections, see Note 4 on pages 187–189 of this Annual Report.
(c) The 2009 prior period has been revised.
Additional disclosures about the fair value of financial
instruments (including financial instruments not carried at
fair value)
U.S. GAAP requires disclosure of the estimated fair value of certain
financial instruments, and the methods and significant assump-
tions used to estimate their fair value. Financial instruments within
the scope of these disclosure requirements are included in the
following table. However, certain financial instruments and all
nonfinancial instruments are excluded from the scope of these
disclosure requirements. Accordingly, the fair value disclosures
provided in the following table include only a partial estimate of
the fair value of JPMorgan Chase’s assets and liabilities. For exam-
ple, the Firm has developed long-term relationships with its cus-
tomers through its deposit base and credit card accounts,
commonly referred to as core deposit intangibles and credit card
relationships. In the opinion of management, these items, in the
aggregate, add significant value to JPMorgan Chase, but their fair
value is not disclosed in this Note.
Financial instruments for which carrying value approximates fair value Certain financial instruments that are not carried at fair value on
the Consolidated Balance Sheets are carried at amounts that
approximate fair value, due to their short-term nature and gen-
erally negligible credit risk. These instruments include cash and
due from banks; deposits with banks; federal funds sold; securi-
ties purchased under resale agreements and securities borrowed
with short-dated maturities; short-term receivables and accrued
interest receivable; commercial paper; federal funds purchased;
securities loaned and sold under repurchase agreements with
short-dated maturities; other borrowed funds (excluding ad-
vances from the Federal Home Loan Banks (“FHLBs”)); accounts
payable; and accrued liabilities. In addition, U.S. GAAP requires
that the fair value for deposit liabilities with no stated maturity
(i.e., demand, savings and certain money market deposits) be
equal to their carrying value; recognition of the inherent funding
value of these instruments is not permitted.
Notes to consolidated financial statements
186 JPMorgan Chase & Co./2010 Annual Report
The following table presents the carrying value and estimated fair values of financial assets and liabilities.
2010 2009
December 31, (in billions) Carrying
value Estimated fair value
Appreciation/ (depreciation)
Carrying value
Estimated fair value
Appreciation/ (depreciation)
Financial assets Assets for which fair value approximates carrying value $ 49.2 $ 49.2 $ — $ 89.4 $ 89.4 $ — Accrued interest and accounts receivable (included zero
and $5.0 at fair value) 70.1 70.1 — 67.4 67.4 — Federal funds sold and securities purchased under resale
agreements (included $20.3 and $20.5 at fair value) 222.6 222.6 — 195.4 195.4 — Securities borrowed (included $14.0 and $7.0 at fair value) 123.6 123.6 — 119.6 119.6 — Trading assets 489.9 489.9 — 411.1 411.1 — Securities (included $316.3 and $360.4 at fair value) 316.3 316.3 — 360.4 360.4 —
Loans (included $2.0 and $1.4 at fair value)(a)(b) 660.7 663.5 2.8 601.9 598.3 (3.6 ) Mortgage servicing rights at fair value 13.6 13.6 — 15.5 15.5 — Other (included $18.2 and $19.2 at fair value) 64.9 65.0 0.1 73.4 73.2 (0.2 ) Total financial assets $ 2,010.9 $ 2,013.8 $ 2.9 $ 1,934.1 $ 1,930.3 $ (3.8 ) Financial liabilities Deposits (included $4.4 and $4.5 at fair value) $ 930.4 $ 931.5 $ (1.1) $ 938.4 $ 939.5 $ (1.1 ) Federal funds purchased and securities loaned or sold
under repurchase agreements (included $4.1 and $3.4 at fair value) 276.6 276.6 — 261.4 261.4 —
Commercial paper 35.4 35.4 — 41.8 41.8 — Other borrowed funds (included $9.9 and $5.6 at fair
value) 57.3 57.2 0.1 55.7 55.9 (0.2 ) Trading liabilities 146.2 146.2 — 125.1 125.1 — Accounts payable and other liabilities (included $0.2 and
$0.4 at fair value) 138.2 138.2 — 136.8 136.8 — Beneficial interests issued by consolidated VIEs (included
$1.5 and $1.4 at fair value) 77.6 77.9 (0.3) 15.2 15.2 — Long-term debt and junior subordinated deferrable interest
debentures (included $38.8 and $49.0 at fair value) 247.7 249.0 (1.3) 266.3 268.4 (2.1 ) Total financial liabilities $ 1,909.4 $ 1,912.0 $ (2.6) $ 1,840.7 $ 1,844.1 $ (3.4 ) Net appreciation/(depreciation) $ 0.3 $ (7.2 )
(a) For originated or purchased loans held for investment, other than PCI loans, the carrying value is the principal amount outstanding, net of the allowance for loan losses, net charge-offs, interest applied to principal (for loans accounted for on the cost recovery method), unamortized discounts and premiums, and deferred loan fees or costs. For a further discussion of the Firm’s loan accounting framework, see Note 14 on pages 220–238 of this Annual Report.
(b) Fair value is typically estimated using a discounted cash flow model that incorporates the characteristics of the underlying loans (including principal, contractual interest rate and contractual fees) and key inputs, including expected lifetime credit losses, interest rates, prepayment rates, and primary origination or secondary market spreads. The dif-ference between the estimated fair value and carrying value is the result of the different methodologies used to determine fair value as compared to carrying value. For example, credit losses are estimated for the asset’s remaining life in a fair value calculation but are estimated for a loss emergence period in a loan loss reserve calcula-tion; future loan income (interest and fees) is incorporated in a fair value calculation but is generally not considered in a loan loss reserve calculation. For a further dis-cussion of the Firm’s methodologies for estimating the fair value of loans and lending-related commitments, see pages 171–173 of this Note.
The majority of the Firm’s unfunded lending-related commitments are not carried at fair value on a recurring basis on the Consolidated Balance
Sheets, nor are they actively traded. The carrying value and estimated fair value of the Firm’s wholesale lending-related commitments were as
follows for the periods indicated. 2010 2009
December 31, (in billions)
Carrying
value(a) Estimated fair value
Carrying
value(a) Estimated fair value
Wholesale lending-related commitments $ 0.7 $ 0.9 $ 0.9 $ 1.3
(a) Represents the allowance for wholesale unfunded lending-related commitments. Excludes the current carrying values of the guarantee liability and the offsetting asset each recognized at fair value at the inception of guarantees.
The Firm does not estimate the fair value of consumer lending-related commitments. In many cases, the Firm can reduce or cancel these com-
mitments by providing the borrower prior notice or, in some cases, without notice as permitted by law. For a further discussion of the valuation
of lending-related commitments, see pages 171–173 of this Note.
JPMorgan Chase & Co./2010 Annual Report 187
Trading assets and liabilities
Trading assets include debt and equity instruments held for trading
purposes that JPMorgan Chase owns (“long” positions), certain
loans managed on a fair value basis and for which the Firm has
elected the fair value option, and physical commodities inventories
that are generally accounted for at the lower of cost or fair value.
Trading liabilities include debt and equity instruments that the Firm
has sold to other parties but does not own (“short” positions). The
Firm is obligated to purchase instruments at a future date to cover
the short positions. Included in trading assets and trading liabilities
are the reported receivables (unrealized gains) and payables (unre-
alized losses) related to derivatives. Trading assets and liabilities
are carried at fair value on the Consolidated Balance Sheets. Bal-
ances reflect the reduction of securities owned (long positions) by
the amount of securities sold but not yet purchased (short posi-
tions) when the long and short positions have identical Committee
on Uniform Security Identification Procedures (“CUSIPs”).
Trading assets and liabilities–average balances
Average trading assets and liabilities were as follows for the periods indicated.
Year ended December 31, (in millions) 2010 2009 2008
Trading assets – debt and equity instruments(a) $ 354,441 $ 318,063 $ 384,102 Trading assets – derivative receivables 84,676 110,457 121,417
Trading liabilities – debt and equity instruments(a) (b) 78,159 60,224 78,841 Trading liabilities – derivative payables 65,714 77,901 93,200
(a) Balances reflect the reduction of securities owned (long positions) by the amount of securities sold, but not yet purchased (short positions) when the long and short positions have identical CUSIPs.
(b) Primarily represent securities sold, not yet purchased.
Note 4 – Fair value option
The fair value option provides an option to elect fair value as an
alternative measurement for selected financial assets, financial
liabilities, unrecognized firm commitments, and written loan com-
mitments not previously carried at fair value.
Elections
Elections were made by the Firm to:
• Mitigate income statement volatility caused by the differences in
the measurement basis of elected instruments (for example, cer-
tain instruments elected were previously accounted for on an
accrual basis) while the associated risk management arrange-
ments are accounted for on a fair value basis;
• Eliminate the complexities of applying certain accounting models
(e.g., hedge accounting or bifurcation accounting for hybrid in-
struments); and
• Better reflect those instruments that are managed on a fair value
basis.
Elections include the following:
• Loans purchased or originated as part of securitization ware-
housing activity, subject to bifurcation accounting, or man-
aged on a fair value basis.
• Securities financing arrangements with an embedded deriva-
tive and/or a maturity of greater than one year.
• Owned beneficial interests in securitized financial assets that
contain embedded credit derivatives, which would otherwise
be required to be separately accounted for as a derivative in-
strument.
• Certain tax credits and other equity investments acquired as
part of the Washington Mutual transaction.
• Structured notes issued as part of IB’s client-driven activities.
(Structured notes are financial instruments that contain em-
bedded derivatives.)
• Long-term beneficial interests issued by IB’s consolidated
securitization trusts where the underlying assets are carried at
fair value.
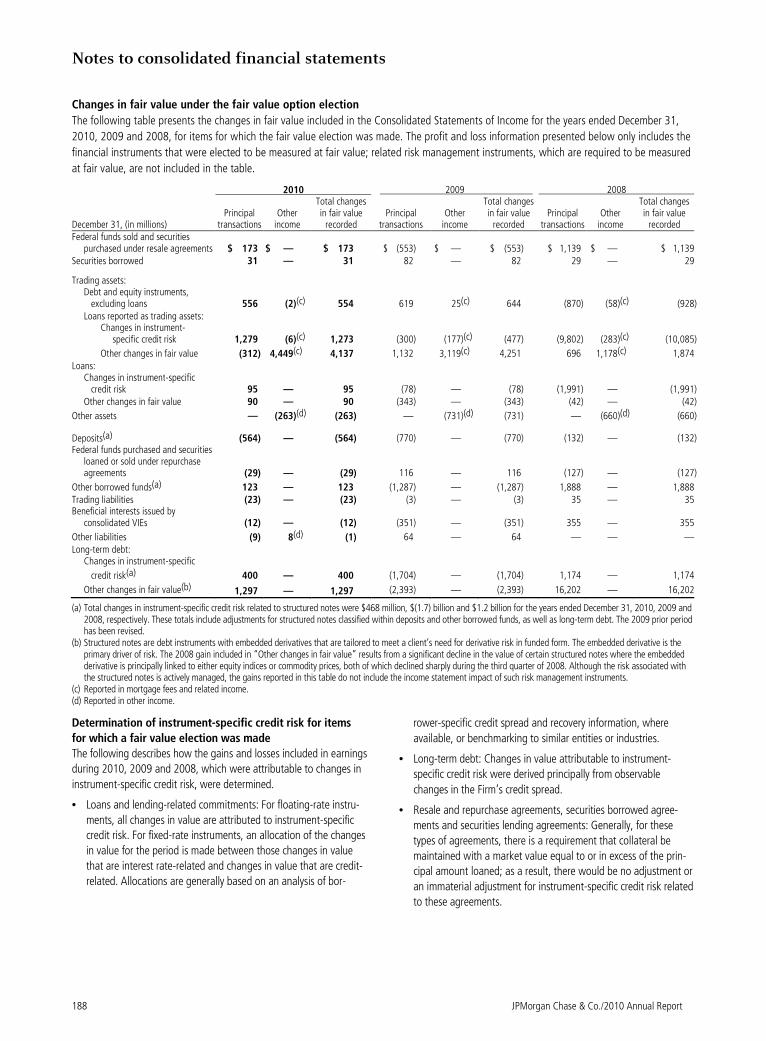
Notes to consolidated financial statements
188 JPMorgan Chase & Co./2010 Annual Report
Changes in fair value under the fair value option election
The following table presents the changes in fair value included in the Consolidated Statements of Income for the years ended December 31,
2010, 2009 and 2008, for items for which the fair value election was made. The profit and loss information presented below only includes the
financial instruments that were elected to be measured at fair value; related risk management instruments, which are required to be measured
at fair value, are not included in the table.
2010 2009 2008
Principal transactions
Other income
Total changes in fair value
recorded Principal
transactions Other
income
Total changes in fair value
recorded Principal
transactions Other
income
Total changes in fair value
recorded
December 31, (in millions) Federal funds sold and securities
purchased under resale agreements $ 173 $ — $ 173 $ (553) $ — $ (553) $ 1,139 $ — $ 1,139 Securities borrowed 31 — 31 82 — 82 29 — 29
Trading assets: Debt and equity instruments,
excluding loans 556 (2)(c) 554 619 25(c) 644 (870) (58)(c) (928) Loans reported as trading assets: Changes in instrument-
specific credit risk 1,279 (6)(c) 1,273 (300) (177)(c) (477) (9,802) (283)(c) (10,085)
Other changes in fair value (312) 4,449(c) 4,137 1,132 3,119(c) 4,251 696 1,178(c) 1,874 Loans: Changes in instrument-specific
credit risk 95 — 95 (78) — (78) (1,991) — (1,991) Other changes in fair value 90 — 90 (343) — (343) (42) — (42)
Other assets — (263)(d) (263) — (731)(d) (731) — (660)(d) (660)
Deposits(a) (564) — (564) (770) — (770) (132) — (132) Federal funds purchased and securities
loaned or sold under repurchase agreements (29) — (29) 116 — 116 (127) — (127)
Other borrowed funds(a) 123 — 123 (1,287) — (1,287) 1,888 — 1,888 Trading liabilities (23) — (23) (3) — (3) 35 — 35 Beneficial interests issued by
consolidated VIEs (12) — (12) (351) — (351) 355 — 355
Other liabilities (9) 8(d) (1) 64 — 64 — — — Long-term debt:
Changes in instrument-specific
credit risk(a) 400 — 400 (1,704) — (1,704) 1,174 — 1,174
Other changes in fair value(b) 1,297 — 1,297 (2,393) — (2,393) 16,202 — 16,202
(a) Total changes in instrument-specific credit risk related to structured notes were $468 million, $(1.7) billion and $1.2 billion for the years ended December 31, 2010, 2009 and 2008, respectively. These totals include adjustments for structured notes classified within deposits and other borrowed funds, as well as long-term debt. The 2009 prior period has been revised.
(b) Structured notes are debt instruments with embedded derivatives that are tailored to meet a client’s need for derivative risk in funded form. The embedded derivative is the primary driver of risk. The 2008 gain included in “Other changes in fair value” results from a significant decline in the value of certain structured notes where the embedded derivative is principally linked to either equity indices or commodity prices, both of which declined sharply during the third quarter of 2008. Although the risk associated with the structured notes is actively managed, the gains reported in this table do not include the income statement impact of such risk management instruments.
(c) Reported in mortgage fees and related income. (d) Reported in other income.
Determination of instrument-specific credit risk for items
for which a fair value election was made
The following describes how the gains and losses included in earnings
during 2010, 2009 and 2008, which were attributable to changes in
instrument-specific credit risk, were determined.
• Loans and lending-related commitments: For floating-rate instru-
ments, all changes in value are attributed to instrument-specific
credit risk. For fixed-rate instruments, an allocation of the changes
in value for the period is made between those changes in value
that are interest rate-related and changes in value that are credit-
related. Allocations are generally based on an analysis of bor-
rower-specific credit spread and recovery information, where
available, or benchmarking to similar entities or industries.
• Long-term debt: Changes in value attributable to instrument-
specific credit risk were derived principally from observable
changes in the Firm’s credit spread.
• Resale and repurchase agreements, securities borrowed agree-
ments and securities lending agreements: Generally, for these
types of agreements, there is a requirement that collateral be
maintained with a market value equal to or in excess of the prin-
cipal amount loaned; as a result, there would be no adjustment or
an immaterial adjustment for instrument-specific credit risk related
to these agreements.
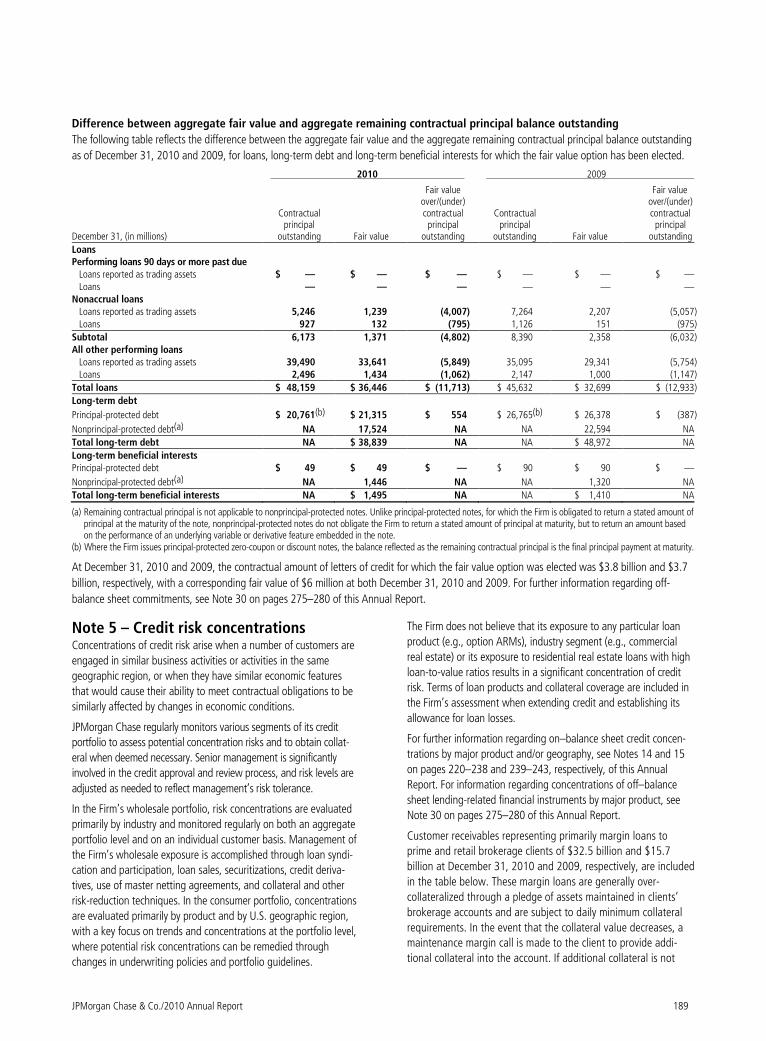
JPMorgan Chase & Co./2010 Annual Report 189
Difference between aggregate fair value and aggregate remaining contractual principal balance outstanding
The following table reflects the difference between the aggregate fair value and the aggregate remaining contractual principal balance outstanding
as of December 31, 2010 and 2009, for loans, long-term debt and long-term beneficial interests for which the fair value option has been elected.
2010 2009
Contractual principal
outstanding Fair value
Fair value over/(under) contractual principal
outstanding
Contractual principal
outstanding Fair value
Fair value over/(under) contractual principal outstanding
December 31, (in millions)
Loans Performing loans 90 days or more past due Loans reported as trading assets $ — $ — $ — $ — $ — $ — Loans — — — — — — Nonaccrual loans Loans reported as trading assets 5,246 1,239 (4,007) 7,264 2,207 (5,057 ) Loans 927 132 (795) 1,126 151 (975 )
Subtotal 6,173 1,371 (4,802) 8,390 2,358 (6,032 ) All other performing loans Loans reported as trading assets 39,490 33,641 (5,849) 35,095 29,341 (5,754 ) Loans 2,496 1,434 (1,062) 2,147 1,000 (1,147 )
Total loans $ 48,159 $ 36,446 $ (11,713) $ 45,632 $ 32,699 $ (12,933 )
Long-term debt
Principal-protected debt $ 20,761(b) $ 21,315 $ 554 $ 26,765(b) $ 26,378 $ (387 )
Nonprincipal-protected debt(a) NA 17,524 NA NA 22,594 NA
Total long-term debt NA $ 38,839 NA NA $ 48,972 NA
Long-term beneficial interests Principal-protected debt $ 49 $ 49 $ — $ 90 $ 90 $ —
Nonprincipal-protected debt(a) NA 1,446 NA NA 1,320 NA
Total long-term beneficial interests NA $ 1,495 NA NA $ 1,410 NA
(a) Remaining contractual principal is not applicable to nonprincipal-protected notes. Unlike principal-protected notes, for which the Firm is obligated to return a stated amount of principal at the maturity of the note, nonprincipal-protected notes do not obligate the Firm to return a stated amount of principal at maturity, but to return an amount based on the performance of an underlying variable or derivative feature embedded in the note.
(b) Where the Firm issues principal-protected zero-coupon or discount notes, the balance reflected as the remaining contractual principal is the final principal payment at maturity.
At December 31, 2010 and 2009, the contractual amount of letters of credit for which the fair value option was elected was $3.8 billion and $3.7
billion, respectively, with a corresponding fair value of $6 million at both December 31, 2010 and 2009. For further information regarding off-
balance sheet commitments, see Note 30 on pages 275–280 of this Annual Report.
Note 5 – Credit risk concentrations Concentrations of credit risk arise when a number of customers are
engaged in similar business activities or activities in the same
geographic region, or when they have similar economic features
that would cause their ability to meet contractual obligations to be
similarly affected by changes in economic conditions.
JPMorgan Chase regularly monitors various segments of its credit
portfolio to assess potential concentration risks and to obtain collat-
eral when deemed necessary. Senior management is significantly
involved in the credit approval and review process, and risk levels are
adjusted as needed to reflect management’s risk tolerance.
In the Firm’s wholesale portfolio, risk concentrations are evaluated
primarily by industry and monitored regularly on both an aggregate
portfolio level and on an individual customer basis. Management of
the Firm’s wholesale exposure is accomplished through loan syndi-
cation and participation, loan sales, securitizations, credit deriva-
tives, use of master netting agreements, and collateral and other
risk-reduction techniques. In the consumer portfolio, concentrations
are evaluated primarily by product and by U.S. geographic region,
with a key focus on trends and concentrations at the portfolio level,
where potential risk concentrations can be remedied through
changes in underwriting policies and portfolio guidelines.
The Firm does not believe that its exposure to any particular loan
product (e.g., option ARMs), industry segment (e.g., commercial
real estate) or its exposure to residential real estate loans with high
loan-to-value ratios results in a significant concentration of credit
risk. Terms of loan products and collateral coverage are included in
the Firm’s assessment when extending credit and establishing its
allowance for loan losses.
For further information regarding on–balance sheet credit concen-
trations by major product and/or geography, see Notes 14 and 15
on pages 220–238 and 239–243, respectively, of this Annual
Report. For information regarding concentrations of off–balance
sheet lending-related financial instruments by major product, see
Note 30 on pages 275–280 of this Annual Report.
Customer receivables representing primarily margin loans to
prime and retail brokerage clients of $32.5 billion and $15.7
billion at December 31, 2010 and 2009, respectively, are included
in the table below. These margin loans are generally over-
collateralized through a pledge of assets maintained in clients’
brokerage accounts and are subject to daily minimum collateral
requirements. In the event that the collateral value decreases, a
maintenance margin call is made to the client to provide addi-
tional collateral into the account. If additional collateral is not
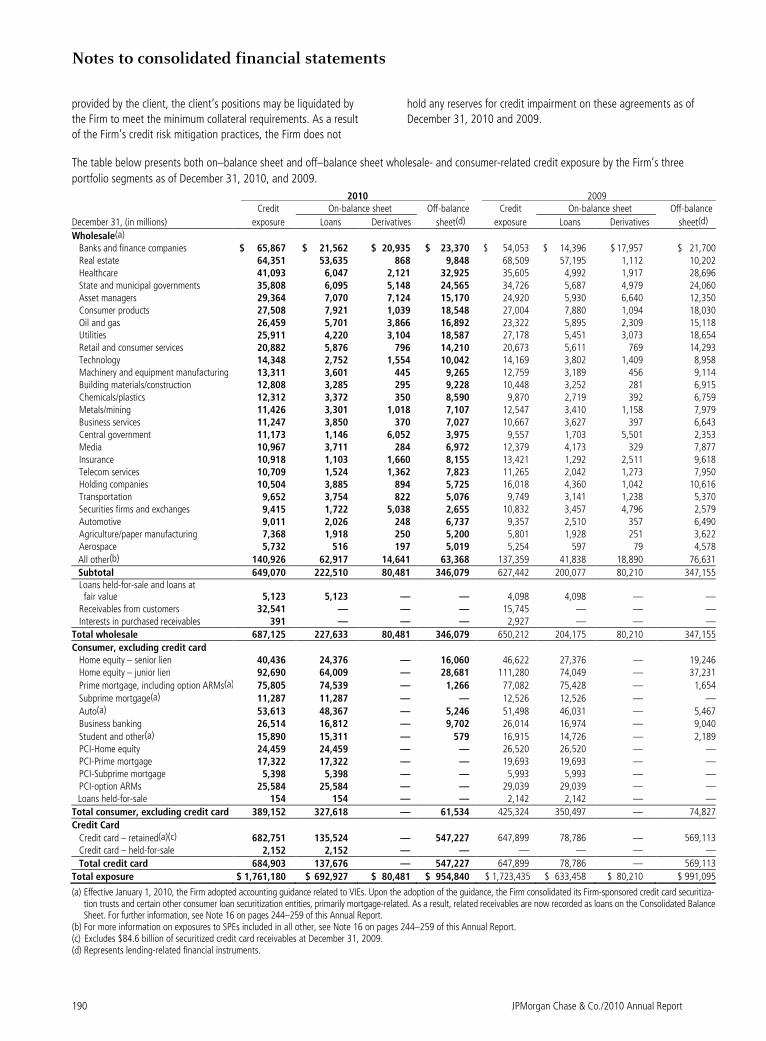
Notes to consolidated financial statements
190 JPMorgan Chase & Co./2010 Annual Report
provided by the client, the client’s positions may be liquidated by
the Firm to meet the minimum collateral requirements. As a result
of the Firm’s credit risk mitigation practices, the Firm does not
hold any reserves for credit impairment on these agreements as of
December 31, 2010 and 2009.
The table below presents both on–balance sheet and off–balance sheet wholesale- and consumer-related credit exposure by the Firm’s three
portfolio segments as of December 31, 2010, and 2009.
2010 2009 Credit On-balance sheet Off-balance Credit On-balance sheet Off-balance
December 31, (in millions) exposure Loans Derivatives sheet(d) exposure Loans Derivatives sheet(d)
Wholesale(a) Banks and finance companies $ 65,867 $ 21,562 $ 20,935 $ 23,370 $ 54,053 $ 14,396 $ 17,957 $ 21,700Real estate 64,351 53,635 868 9,848 68,509 57,195 1,112 10,202Healthcare 41,093 6,047 2,121 32,925 35,605 4,992 1,917 28,696State and municipal governments 35,808 6,095 5,148 24,565 34,726 5,687 4,979 24,060Asset managers 29,364 7,070 7,124 15,170 24,920 5,930 6,640 12,350Consumer products 27,508 7,921 1,039 18,548 27,004 7,880 1,094 18,030Oil and gas 26,459 5,701 3,866 16,892 23,322 5,895 2,309 15,118Utilities 25,911 4,220 3,104 18,587 27,178 5,451 3,073 18,654Retail and consumer services 20,882 5,876 796 14,210 20,673 5,611 769 14,293Technology 14,348 2,752 1,554 10,042 14,169 3,802 1,409 8,958Machinery and equipment manufacturing 13,311 3,601 445 9,265 12,759 3,189 456 9,114Building materials/construction 12,808 3,285 295 9,228 10,448 3,252 281 6,915Chemicals/plastics 12,312 3,372 350 8,590 9,870 2,719 392 6,759Metals/mining 11,426 3,301 1,018 7,107 12,547 3,410 1,158 7,979Business services 11,247 3,850 370 7,027 10,667 3,627 397 6,643Central government 11,173 1,146 6,052 3,975 9,557 1,703 5,501 2,353Media 10,967 3,711 284 6,972 12,379 4,173 329 7,877Insurance 10,918 1,103 1,660 8,155 13,421 1,292 2,511 9,618Telecom services 10,709 1,524 1,362 7,823 11,265 2,042 1,273 7,950Holding companies 10,504 3,885 894 5,725 16,018 4,360 1,042 10,616Transportation 9,652 3,754 822 5,076 9,749 3,141 1,238 5,370Securities firms and exchanges 9,415 1,722 5,038 2,655 10,832 3,457 4,796 2,579Automotive 9,011 2,026 248 6,737 9,357 2,510 357 6,490Agriculture/paper manufacturing 7,368 1,918 250 5,200 5,801 1,928 251 3,622Aerospace 5,732 516 197 5,019 5,254 597 79 4,578
All other(b) 140,926 62,917 14,641 63,368 137,359 41,838 18,890 76,631
Subtotal 649,070 222,510 80,481 346,079 627,442 200,077 80,210 347,155Loans held-for-sale and loans at fair value 5,123 5,123 — — 4,098 4,098 — —Receivables from customers 32,541 — — — 15,745 — — —Interests in purchased receivables 391 — — — 2,927 — — —
Total wholesale 687,125 227,633 80,481 346,079 650,212 204,175 80,210 347,155
Consumer, excluding credit card Home equity – senior lien 40,436 24,376 — 16,060 46,622 27,376 — 19,246Home equity – junior lien 92,690 64,009 — 28,681 111,280 74,049 — 37,231
Prime mortgage, including option ARMs(a) 75,805 74,539 — 1,266 77,082 75,428 — 1,654
Subprime mortgage(a) 11,287 11,287 — — 12,526 12,526 — —
Auto(a) 53,613 48,367 — 5,246 51,498 46,031 — 5,467Business banking 26,514 16,812 — 9,702 26,014 16,974 — 9,040
Student and other(a) 15,890 15,311 — 579 16,915 14,726 — 2,189PCI-Home equity 24,459 24,459 — — 26,520 26,520 — —PCI-Prime mortgage 17,322 17,322 — — 19,693 19,693 — —PCI-Subprime mortgage 5,398 5,398 — — 5,993 5,993 — —PCI-option ARMs 25,584 25,584 — — 29,039 29,039 — —Loans held-for-sale 154 154 — — 2,142 2,142 — —
Total consumer, excluding credit card 389,152 327,618 — 61,534 425,324 350,497 — 74,827
Credit Card Credit card – retained(a)(c) 682,751 135,524 — 547,227 647,899 78,786 — 569,113
Credit card – held-for-sale 2,152 2,152 — — — — — —
Total credit card 684,903 137,676 — 547,227 647,899 78,786 — 569,113
Total exposure $ 1,761,180 $ 692,927 $ 80,481 $ 954,840 $ 1,723,435 $ 633,458 $ 80,210 $ 991,095
(a) Effective January 1, 2010, the Firm adopted accounting guidance related to VIEs. Upon the adoption of the guidance, the Firm consolidated its Firm-sponsored credit card securitiza-tion trusts and certain other consumer loan securitization entities, primarily mortgage-related. As a result, related receivables are now recorded as loans on the Consolidated Balance Sheet. For further information, see Note 16 on pages 244–259 of this Annual Report.
(b) For more information on exposures to SPEs included in all other, see Note 16 on pages 244–259 of this Annual Report. (c) Excludes $84.6 billion of securitized credit card receivables at December 31, 2009. (d) Represents lending-related financial instruments.
JPMorgan Chase & Co./2010 Annual Report 191
Note 6 – Derivative instruments
Derivative instruments enable end-users to modify or mitigate
exposure to credit or market risks. Counterparties to a derivative
contract seek to obtain risks and rewards similar to those that
could be obtained from purchasing or selling a related cash instru-
ment without having to exchange upfront the full purchase or sales
price. JPMorgan Chase makes markets in derivatives for customers
and also uses derivatives to hedge or manage its own market risk
exposures. The majority of the Firm’s derivatives are entered into
for market-making purposes.
Trading derivatives
The Firm makes markets in a variety of derivatives in its trading
portfolios to meet the needs of customers (both dealers and clients)
and to generate revenue through this trading activity (“client de-
rivatives”). Customers use derivatives to mitigate or modify interest
rate, credit, foreign exchange, equity and commodity risks. The Firm
actively manages the risks from its exposure to these derivatives by
entering into other derivative transactions or by purchasing or
selling other financial instruments that partially or fully offset the
exposure from client derivatives. The Firm also seeks to earn a
spread between the client derivatives and offsetting positions, and
from the remaining open risk positions.
Risk management derivatives
The Firm manages its market risk exposures using various derivative
instruments.
Interest rate contracts are used to minimize fluctuations in earnings
that are caused by changes in interest rates. Fixed-rate assets and
liabilities appreciate or depreciate in market value as interest rates
change. Similarly, interest income and expense increase or decrease
as a result of variable-rate assets and liabilities resetting to current
market rates, and as a result of the repayment and subsequent
origination or issuance of fixed-rate assets and liabilities at current
market rates. Gains or losses on the derivative instruments that are
related to such assets and liabilities are expected to substantially
offset this variability in earnings. The Firm generally uses interest
rate swaps, forwards and futures to manage the impact of interest
rate fluctuations on earnings.
Foreign currency forward contracts are used to manage the foreign
exchange risk associated with certain foreign currency–
denominated (i.e., non-U.S.) assets and liabilities and forecasted
transactions, as well as the Firm’s net investments in certain non-
U.S. subsidiaries or branches whose functional currencies are not
the U.S. dollar. As a result of fluctuations in foreign currencies, the
U.S. dollar–equivalent values of the foreign currency–denominated
assets and liabilities or forecasted revenue or expense increase or
decrease. Gains or losses on the derivative instruments related to
these foreign currency–denominated assets or liabilities, or forecasted
transactions, are expected to substantially offset this variability.
Commodities based forward and futures contracts are used to
manage the price risk of certain inventory, including gold and base
metals, in the Firm's commodities portfolio. Gains or losses on the
forwards and futures are expected to substantially offset the depre-
ciation or appreciation of the related inventory. Also in the com-
modities portfolio, electricity and natural gas futures and forwards
contracts are used to manage price risk associated with energy-
related tolling and load-serving contracts and investments.
The Firm uses credit derivatives to manage the counterparty credit
risk associated with loans and lending-related commitments. Credit
derivatives compensate the purchaser when the entity referenced in
the contract experiences a credit event, such as bankruptcy or a
failure to pay an obligation when due. For a further discussion of
credit derivatives, see the discussion in the Credit derivatives sec-
tion on pages 197–199 of this Note.
For more information about risk management derivatives, see the
risk management derivatives gains and losses table on page 196 of
this Annual Report, and the hedge accounting gains and losses
tables on pages 194–195 of this Note.
Accounting for derivatives
All free-standing derivatives are required to be recorded on the
Consolidated Balance Sheets at fair value. As permitted under U.S.
GAAP, the Firm nets derivative assets and liabilities, and the related
cash collateral received and paid, when a legally enforceable mas-
ter netting agreement exists between the Firm and the derivative
counterparty. The accounting for changes in value of a derivative
depends on whether or not the transaction has been designated
and qualifies for hedge accounting. Derivatives that are not desig-
nated as hedges are marked to market through earnings. The
tabular disclosures on pages 192–199 of this Note provide addi-
tional information on the amount of, and reporting for, derivative
assets, liabilities, gains and losses. For further discussion of deriva-
tives embedded in structured notes, see Notes 3 and 4 on pages
170–187 and 187–189, respectively, of this Annual Report.
Derivatives designated as hedges
The Firm applies hedge accounting to certain derivatives executed
for risk management purposes – generally interest rate, foreign
exchange and gold and base metal derivatives. However, JPMorgan
Chase does not seek to apply hedge accounting to all of the deriva-
tives involved in the Firm’s risk management activities. For exam-
ple, the Firm does not apply hedge accounting to purchased credit
default swaps used to manage the credit risk of loans and commit-
ments, because of the difficulties in qualifying such contracts as
hedges. For the same reason, the Firm does not apply hedge ac-
counting to certain interest rate and commodity derivatives used for
risk management purposes.
To qualify for hedge accounting, a derivative must be highly effec-
tive at reducing the risk associated with the exposure being
hedged. In addition, for a derivative to be designated as a hedge,
the risk management objective and strategy must be documented.
Hedge documentation must identify the derivative hedging instru-
ment, the asset or liability or forecasted transaction and type of risk
to be hedged, and how the effectiveness of the derivative is as-
sessed prospectively and retrospectively. To assess effectiveness,
the Firm uses statistical methods such as regression analysis, as
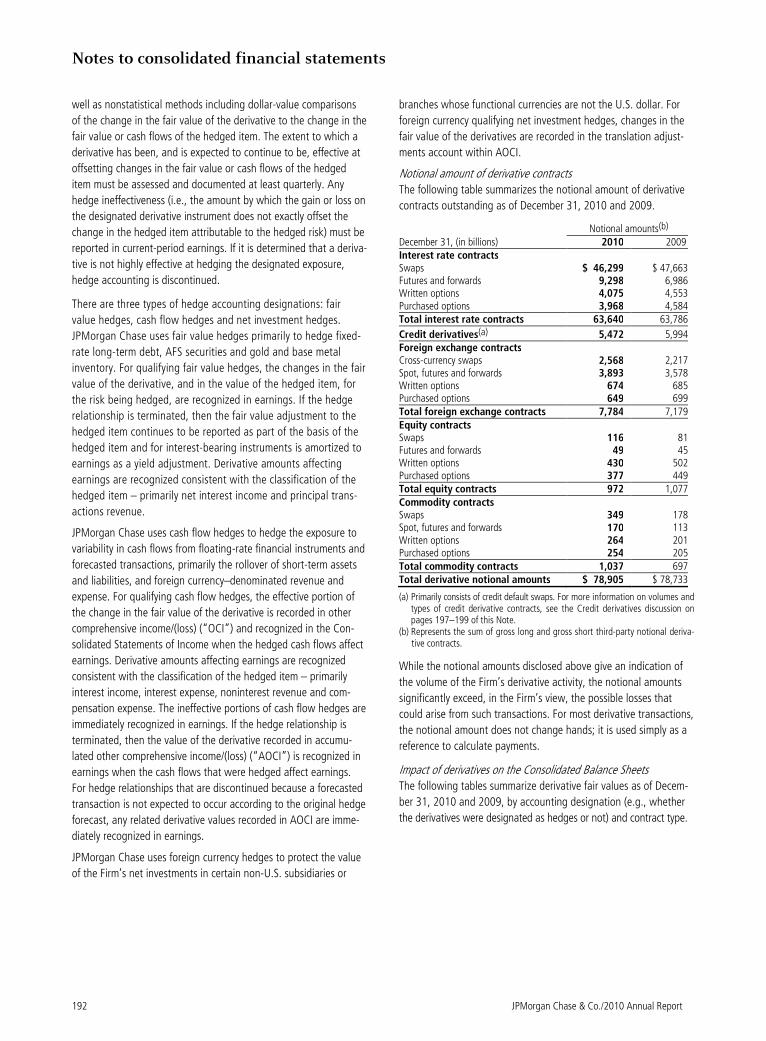
Notes to consolidated financial statements
192 JPMorgan Chase & Co./2010 Annual Report
well as nonstatistical methods including dollar-value comparisons
of the change in the fair value of the derivative to the change in the
fair value or cash flows of the hedged item. The extent to which a
derivative has been, and is expected to continue to be, effective at
offsetting changes in the fair value or cash flows of the hedged
item must be assessed and documented at least quarterly. Any
hedge ineffectiveness (i.e., the amount by which the gain or loss on
the designated derivative instrument does not exactly offset the
change in the hedged item attributable to the hedged risk) must be
reported in current-period earnings. If it is determined that a deriva-
tive is not highly effective at hedging the designated exposure,
hedge accounting is discontinued.
There are three types of hedge accounting designations: fair
value hedges, cash flow hedges and net investment hedges.
JPMorgan Chase uses fair value hedges primarily to hedge fixed-
rate long-term debt, AFS securities and gold and base metal
inventory. For qualifying fair value hedges, the changes in the fair
value of the derivative, and in the value of the hedged item, for
the risk being hedged, are recognized in earnings. If the hedge
relationship is terminated, then the fair value adjustment to the
hedged item continues to be reported as part of the basis of the
hedged item and for interest-bearing instruments is amortized to
earnings as a yield adjustment. Derivative amounts affecting
earnings are recognized consistent with the classification of the
hedged item – primarily net interest income and principal trans-
actions revenue.
JPMorgan Chase uses cash flow hedges to hedge the exposure to
variability in cash flows from floating-rate financial instruments and
forecasted transactions, primarily the rollover of short-term assets
and liabilities, and foreign currency–denominated revenue and
expense. For qualifying cash flow hedges, the effective portion of
the change in the fair value of the derivative is recorded in other
comprehensive income/(loss) (“OCI”) and recognized in the Con-
solidated Statements of Income when the hedged cash flows affect
earnings. Derivative amounts affecting earnings are recognized
consistent with the classification of the hedged item – primarily
interest income, interest expense, noninterest revenue and com-
pensation expense. The ineffective portions of cash flow hedges are
immediately recognized in earnings. If the hedge relationship is
terminated, then the value of the derivative recorded in accumu-
lated other comprehensive income/(loss) (“AOCI”) is recognized in
earnings when the cash flows that were hedged affect earnings.
For hedge relationships that are discontinued because a forecasted
transaction is not expected to occur according to the original hedge
forecast, any related derivative values recorded in AOCI are imme-
diately recognized in earnings.
JPMorgan Chase uses foreign currency hedges to protect the value
of the Firm’s net investments in certain non-U.S. subsidiaries or
branches whose functional currencies are not the U.S. dollar. For
foreign currency qualifying net investment hedges, changes in the
fair value of the derivatives are recorded in the translation adjust-
ments account within AOCI.
Notional amount of derivative contracts
The following table summarizes the notional amount of derivative
contracts outstanding as of December 31, 2010 and 2009.
Notional amounts(b) December 31, (in billions) 2010 2009 Interest rate contracts Swaps $ 46,299 $ 47,663Futures and forwards 9,298 6,986Written options 4,075 4,553Purchased options 3,968 4,584Total interest rate contracts 63,640 63,786
Credit derivatives(a) 5,472 5,994Foreign exchange contracts Cross-currency swaps 2,568 2,217Spot, futures and forwards 3,893 3,578Written options 674 685Purchased options 649 699Total foreign exchange contracts 7,784 7,179Equity contracts Swaps 116 81Futures and forwards 49 45Written options 430 502Purchased options 377 449Total equity contracts 972 1,077Commodity contracts Swaps 349 178Spot, futures and forwards 170 113Written options 264 201Purchased options 254 205Total commodity contracts 1,037 697Total derivative notional amounts $ 78,905 $ 78,733
(a) Primarily consists of credit default swaps. For more information on volumes and types of credit derivative contracts, see the Credit derivatives discussion on pages 197–199 of this Note.
(b) Represents the sum of gross long and gross short third-party notional deriva-tive contracts.
While the notional amounts disclosed above give an indication of
the volume of the Firm’s derivative activity, the notional amounts
significantly exceed, in the Firm’s view, the possible losses that
could arise from such transactions. For most derivative transactions,
the notional amount does not change hands; it is used simply as a
reference to calculate payments.
Impact of derivatives on the Consolidated Balance Sheets
The following tables summarize derivative fair values as of Decem-
ber 31, 2010 and 2009, by accounting designation (e.g., whether
the derivatives were designated as hedges or not) and contract type.
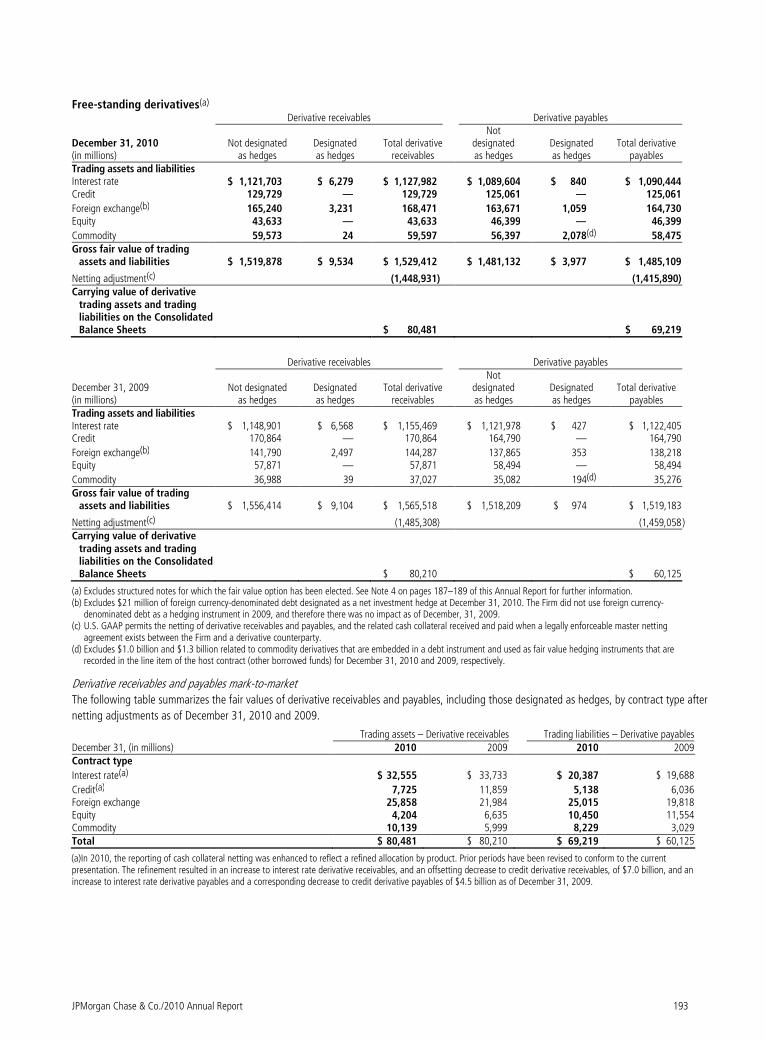
JPMorgan Chase & Co./2010 Annual Report 193
Free-standing derivatives(a)
Derivative receivables Derivative payables
December 31, 2010 (in millions)
Not designated as hedges
Designated as hedges
Total derivative receivables
Not designated as hedges
Designated as hedges
Total derivative payables
Trading assets and liabilities Interest rate $ 1,121,703 $ 6,279 $ 1,127,982 $ 1,089,604 $ 840 $ 1,090,444 Credit 129,729 — 129,729 125,061 — 125,061
Foreign exchange(b) 165,240 3,231 168,471 163,671 1,059 164,730 Equity 43,633 — 43,633 46,399 — 46,399
Commodity 59,573 24 59,597 56,397 2,078(d) 58,475 Gross fair value of trading
assets and liabilities $ 1,519,878 $ 9,534 $ 1,529,412 $ 1,481,132 $ 3,977 $ 1,485,109
Netting adjustment(c) (1,448,931) (1,415,890) Carrying value of derivative
trading assets and trading liabilities on the Consolidated Balance Sheets $ 80,481 $ 69,219
Derivative receivables Derivative payables
December 31, 2009 (in millions)
Not designated as hedges
Designated as hedges
Total derivative receivables
Not designated as hedges
Designated as hedges
Total derivative payables
Trading assets and liabilities Interest rate $ 1,148,901 $ 6,568 $ 1,155,469 $ 1,121,978 $ 427 $ 1,122,405 Credit 170,864 — 170,864 164,790 — 164,790
Foreign exchange(b) 141,790 2,497 144,287 137,865 353 138,218 Equity 57,871 — 57,871 58,494 — 58,494
Commodity 36,988 39 37,027 35,082 194(d) 35,276 Gross fair value of trading
assets and liabilities $ 1,556,414 $ 9,104 $ 1,565,518 $ 1,518,209 $ 974 $ 1,519,183
Netting adjustment(c) (1,485,308) (1,459,058 ) Carrying value of derivative
trading assets and trading liabilities on the Consolidated Balance Sheets $ 80,210 $ 60,125
(a) Excludes structured notes for which the fair value option has been elected. See Note 4 on pages 187–189 of this Annual Report for further information. (b) Excludes $21 million of foreign currency-denominated debt designated as a net investment hedge at December 31, 2010. The Firm did not use foreign currency-
denominated debt as a hedging instrument in 2009, and therefore there was no impact as of December, 31, 2009. (c) U.S. GAAP permits the netting of derivative receivables and payables, and the related cash collateral received and paid when a legally enforceable master netting
agreement exists between the Firm and a derivative counterparty. (d) Excludes $1.0 billion and $1.3 billion related to commodity derivatives that are embedded in a debt instrument and used as fair value hedging instruments that are
recorded in the line item of the host contract (other borrowed funds) for December 31, 2010 and 2009, respectively.
Derivative receivables and payables mark-to-market
The following table summarizes the fair values of derivative receivables and payables, including those designated as hedges, by contract type after
netting adjustments as of December 31, 2010 and 2009.
Trading assets – Derivative receivables Trading liabilities – Derivative payablesDecember 31, (in millions) 2010 2009 2010 2009 Contract type
Interest rate(a) $ 32,555 $ 33,733 $ 20,387 $ 19,688
Credit(a) 7,725 11,859 5,138 6,036 Foreign exchange 25,858 21,984 25,015 19,818 Equity 4,204 6,635 10,450 11,554 Commodity 10,139 5,999 8,229 3,029 Total $ 80,481 $ 80,210 $ 69,219 $ 60,125
(a)In 2010, the reporting of cash collateral netting was enhanced to reflect a refined allocation by product. Prior periods have been revised to conform to the current presentation. The refinement resulted in an increase to interest rate derivative receivables, and an offsetting decrease to credit derivative receivables, of $7.0 billion, and an increase to interest rate derivative payables and a corresponding decrease to credit derivative payables of $4.5 billion as of December 31, 2009.
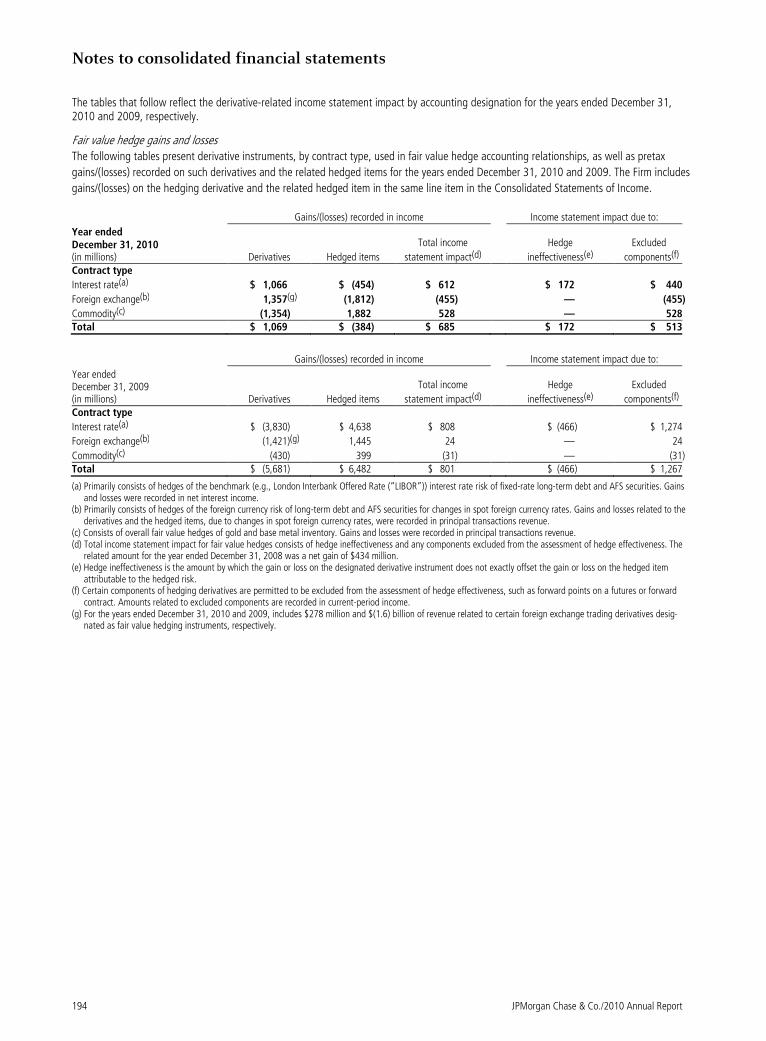
Notes to consolidated financial statements
194 JPMorgan Chase & Co./2010 Annual Report
The tables that follow reflect the derivative-related income statement impact by accounting designation for the years ended December 31, 2010 and 2009, respectively.
Fair value hedge gains and losses
The following tables present derivative instruments, by contract type, used in fair value hedge accounting relationships, as well as pretax
gains/(losses) recorded on such derivatives and the related hedged items for the years ended December 31, 2010 and 2009. The Firm includes
gains/(losses) on the hedging derivative and the related hedged item in the same line item in the Consolidated Statements of Income.
Gains/(losses) recorded in income Income statement impact due to:
Year ended December 31, 2010 (in millions) Derivatives Hedged items
Total income
statement impact(d)
Hedge
ineffectiveness(e)
Excluded
components(f) Contract type
Interest rate(a) $ 1,066 $ (454) $ 612 $ 172 $ 440
Foreign exchange(b) 1,357(g) (1,812) (455) — (455)
Commodity(c) (1,354) 1,882 528 — 528 Total $ 1,069 $ (384) $ 685 $ 172 $ 513
Gains/(losses) recorded in income Income statement impact due to:
Year ended December 31, 2009 (in millions) Derivatives Hedged items
Total income
statement impact(d)
Hedge
ineffectiveness(e)
Excluded
components(f) Contract type
Interest rate(a) $ (3,830) $ 4,638 $ 808 $ (466) $ 1,274
Foreign exchange(b) (1,421)(g) 1,445 24 — 24
Commodity(c) (430) 399 (31) — (31) Total $ (5,681) $ 6,482 $ 801 $ (466) $ 1,267
(a) Primarily consists of hedges of the benchmark (e.g., London Interbank Offered Rate (“LIBOR”)) interest rate risk of fixed-rate long-term debt and AFS securities. Gains and losses were recorded in net interest income.
(b) Primarily consists of hedges of the foreign currency risk of long-term debt and AFS securities for changes in spot foreign currency rates. Gains and losses related to the derivatives and the hedged items, due to changes in spot foreign currency rates, were recorded in principal transactions revenue.
(c) Consists of overall fair value hedges of gold and base metal inventory. Gains and losses were recorded in principal transactions revenue. (d) Total income statement impact for fair value hedges consists of hedge ineffectiveness and any components excluded from the assessment of hedge effectiveness. The
related amount for the year ended December 31, 2008 was a net gain of $434 million. (e) Hedge ineffectiveness is the amount by which the gain or loss on the designated derivative instrument does not exactly offset the gain or loss on the hedged item
attributable to the hedged risk. (f) Certain components of hedging derivatives are permitted to be excluded from the assessment of hedge effectiveness, such as forward points on a futures or forward
contract. Amounts related to excluded components are recorded in current-period income. (g) For the years ended December 31, 2010 and 2009, includes $278 million and $(1.6) billion of revenue related to certain foreign exchange trading derivatives desig-
nated as fair value hedging instruments, respectively.
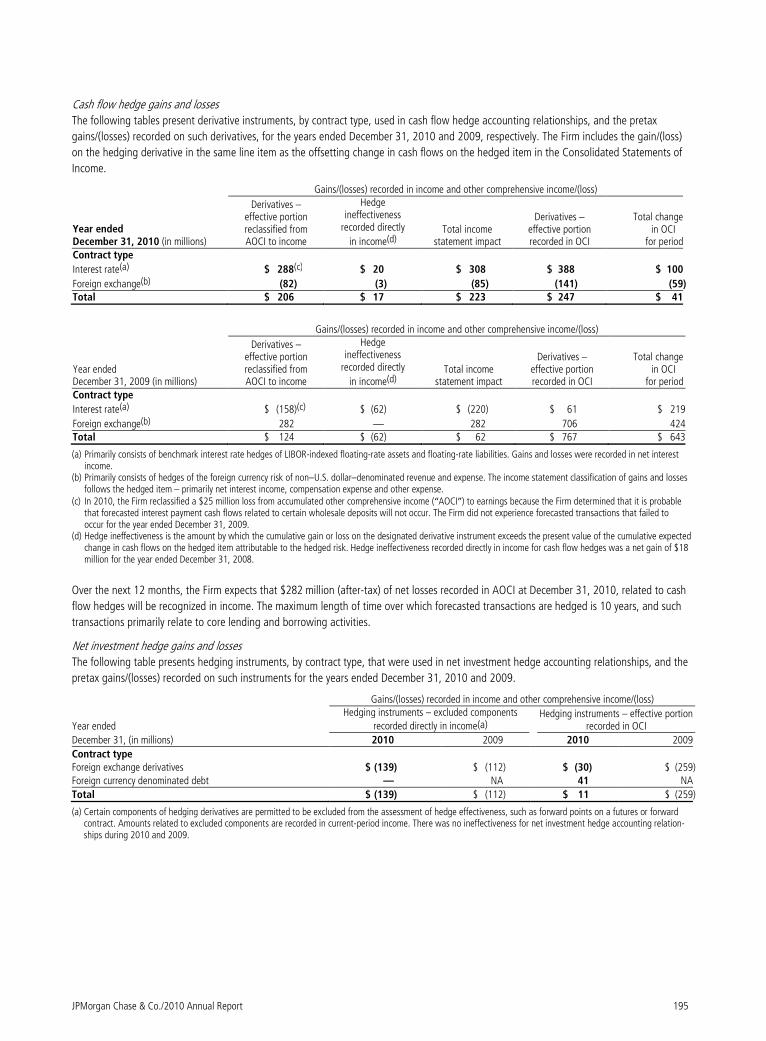
JPMorgan Chase & Co./2010 Annual Report 195
Cash flow hedge gains and losses
The following tables present derivative instruments, by contract type, used in cash flow hedge accounting relationships, and the pretax
gains/(losses) recorded on such derivatives, for the years ended December 31, 2010 and 2009, respectively. The Firm includes the gain/(loss)
on the hedging derivative in the same line item as the offsetting change in cash flows on the hedged item in the Consolidated Statements of
Income.
Gains/(losses) recorded in income and other comprehensive income/(loss)
Year ended December 31, 2010 (in millions)
Derivatives – effective portion reclassified from AOCI to income
Hedge ineffectiveness
recorded directly
in income(d)
Total income
statement impact
Derivatives – effective portion recorded in OCI
Total change in OCI .
for period Contract type
Interest rate(a) $ 288(c) $ 20 $ 308 $ 388 $ 100
Foreign exchange(b) (82) (3) (85) (141) (59) Total $ 206 $ 17 $ 223 $ 247 $ 41
Gains/(losses) recorded in income and other comprehensive income/(loss)
Year ended December 31, 2009 (in millions)
Derivatives – effective portion reclassified from AOCI to income
Hedge ineffectiveness
recorded directly
in income(d)
Total income
statement impact
Derivatives – effective portion recorded in OCI
Total change in OCI .
for period Contract type
Interest rate(a) $ (158)(c) $ (62) $ (220) $ 61 $ 219
Foreign exchange(b) 282 — 282 706 424Total $ 124 $ (62) $ 62 $ 767 $ 643
(a) Primarily consists of benchmark interest rate hedges of LIBOR-indexed floating-rate assets and floating-rate liabilities. Gains and losses were recorded in net interest income.
(b) Primarily consists of hedges of the foreign currency risk of non–U.S. dollar–denominated revenue and expense. The income statement classification of gains and losses follows the hedged item – primarily net interest income, compensation expense and other expense.
(c) In 2010, the Firm reclassified a $25 million loss from accumulated other comprehensive income (“AOCI”) to earnings because the Firm determined that it is probable that forecasted interest payment cash flows related to certain wholesale deposits will not occur. The Firm did not experience forecasted transactions that failed to occur for the year ended December 31, 2009.
(d) Hedge ineffectiveness is the amount by which the cumulative gain or loss on the designated derivative instrument exceeds the present value of the cumulative expected change in cash flows on the hedged item attributable to the hedged risk. Hedge ineffectiveness recorded directly in income for cash flow hedges was a net gain of $18 million for the year ended December 31, 2008.
Over the next 12 months, the Firm expects that $282 million (after-tax) of net losses recorded in AOCI at December 31, 2010, related to cash
flow hedges will be recognized in income. The maximum length of time over which forecasted transactions are hedged is 10 years, and such
transactions primarily relate to core lending and borrowing activities.
Net investment hedge gains and losses
The following table presents hedging instruments, by contract type, that were used in net investment hedge accounting relationships, and the
pretax gains/(losses) recorded on such instruments for the years ended December 31, 2010 and 2009.
Gains/(losses) recorded in income and other comprehensive income/(loss)
Year ended
Hedging instruments – excluded components
recorded directly in income(a)
Hedging instruments – effective portion recorded in OCI
December 31, (in millions) 2010 2009 2010 2009
Contract type Foreign exchange derivatives $ (139) $ (112) $ (30) $ (259) Foreign currency denominated debt — NA 41 NA
Total $ (139) $ (112) $ 11 $ (259)
(a) Certain components of hedging derivatives are permitted to be excluded from the assessment of hedge effectiveness, such as forward points on a futures or forward contract. Amounts related to excluded components are recorded in current-period income. There was no ineffectiveness for net investment hedge accounting relation-ships during 2010 and 2009.
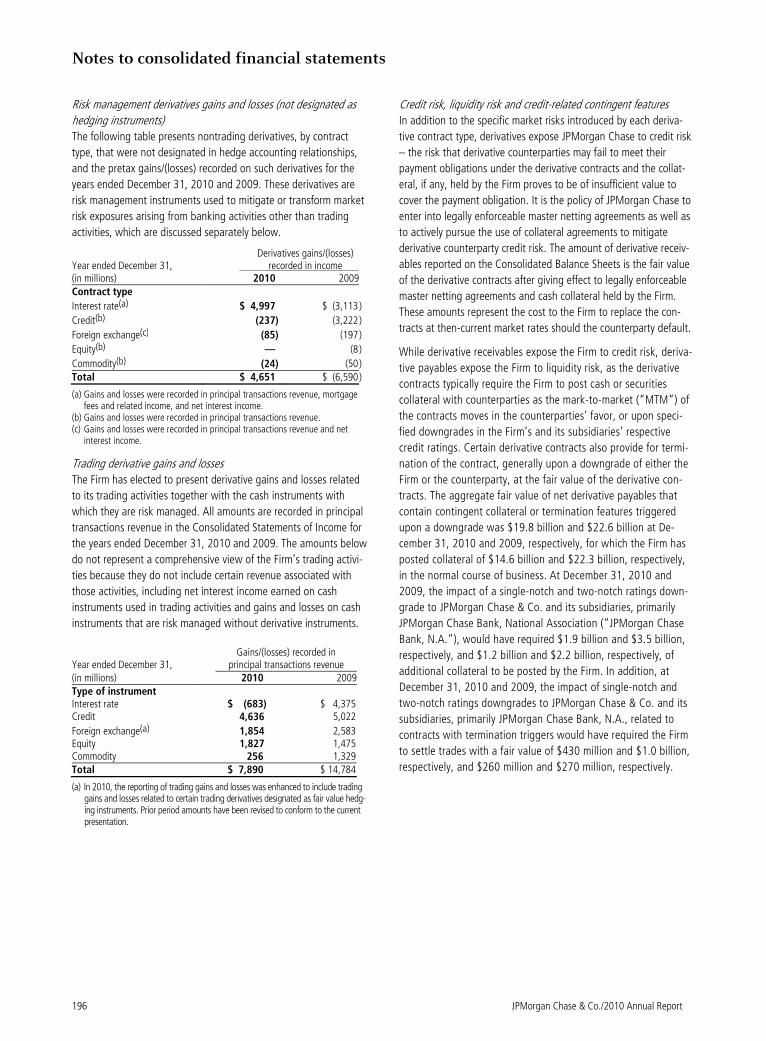
Notes to consolidated financial statements
196 JPMorgan Chase & Co./2010 Annual Report
Risk management derivatives gains and losses (not designated as
hedging instruments)
The following table presents nontrading derivatives, by contract
type, that were not designated in hedge accounting relationships,
and the pretax gains/(losses) recorded on such derivatives for the
years ended December 31, 2010 and 2009. These derivatives are
risk management instruments used to mitigate or transform market
risk exposures arising from banking activities other than trading
activities, which are discussed separately below.
Year ended December 31, Derivatives gains/(losses) recorded in income
(in millions) 2010 2009Contract type
Interest rate(a) $ 4,997 $ (3,113 )
Credit(b) (237) (3,222 )
Foreign exchange(c) (85) (197 )
Equity(b) — (8 )
Commodity(b) (24) (50 ) Total $ 4,651 $ (6,590 )
(a) Gains and losses were recorded in principal transactions revenue, mortgage fees and related income, and net interest income.
(b) Gains and losses were recorded in principal transactions revenue. (c) Gains and losses were recorded in principal transactions revenue and net
interest income.
Trading derivative gains and losses
The Firm has elected to present derivative gains and losses related
to its trading activities together with the cash instruments with
which they are risk managed. All amounts are recorded in principal
transactions revenue in the Consolidated Statements of Income for
the years ended December 31, 2010 and 2009. The amounts below
do not represent a comprehensive view of the Firm’s trading activi-
ties because they do not include certain revenue associated with
those activities, including net interest income earned on cash
instruments used in trading activities and gains and losses on cash
instruments that are risk managed without derivative instruments.
Year ended December 31, Gains/(losses) recorded in
principal transactions revenue (in millions) 2010 2009Type of instrument Interest rate $ (683) $ 4,375 Credit 4,636 5,022
Foreign exchange(a) 1,854 2,583 Equity 1,827 1,475 Commodity 256 1,329 Total $ 7,890 $ 14,784
(a) In 2010, the reporting of trading gains and losses was enhanced to include trading gains and losses related to certain trading derivatives designated as fair value hedg-ing instruments. Prior period amounts have been revised to conform to the current presentation.
Credit risk, liquidity risk and credit-related contingent features
In addition to the specific market risks introduced by each deriva-
tive contract type, derivatives expose JPMorgan Chase to credit risk
– the risk that derivative counterparties may fail to meet their
payment obligations under the derivative contracts and the collat-
eral, if any, held by the Firm proves to be of insufficient value to
cover the payment obligation. It is the policy of JPMorgan Chase to
enter into legally enforceable master netting agreements as well as
to actively pursue the use of collateral agreements to mitigate
derivative counterparty credit risk. The amount of derivative receiv-
ables reported on the Consolidated Balance Sheets is the fair value
of the derivative contracts after giving effect to legally enforceable
master netting agreements and cash collateral held by the Firm.
These amounts represent the cost to the Firm to replace the con-
tracts at then-current market rates should the counterparty default.
While derivative receivables expose the Firm to credit risk, deriva-
tive payables expose the Firm to liquidity risk, as the derivative
contracts typically require the Firm to post cash or securities
collateral with counterparties as the mark-to-market (“MTM”) of
the contracts moves in the counterparties’ favor, or upon speci-
fied downgrades in the Firm’s and its subsidiaries’ respective
credit ratings. Certain derivative contracts also provide for termi-
nation of the contract, generally upon a downgrade of either the
Firm or the counterparty, at the fair value of the derivative con-
tracts. The aggregate fair value of net derivative payables that
contain contingent collateral or termination features triggered
upon a downgrade was $19.8 billion and $22.6 billion at De-
cember 31, 2010 and 2009, respectively, for which the Firm has
posted collateral of $14.6 billion and $22.3 billion, respectively,
in the normal course of business. At December 31, 2010 and
2009, the impact of a single-notch and two-notch ratings down-
grade to JPMorgan Chase & Co. and its subsidiaries, primarily
JPMorgan Chase Bank, National Association (“JPMorgan Chase
Bank, N.A.”), would have required $1.9 billion and $3.5 billion,
respectively, and $1.2 billion and $2.2 billion, respectively, of
additional collateral to be posted by the Firm. In addition, at
December 31, 2010 and 2009, the impact of single-notch and
two-notch ratings downgrades to JPMorgan Chase & Co. and its
subsidiaries, primarily JPMorgan Chase Bank, N.A., related to
contracts with termination triggers would have required the Firm
to settle trades with a fair value of $430 million and $1.0 billion,
respectively, and $260 million and $270 million, respectively.
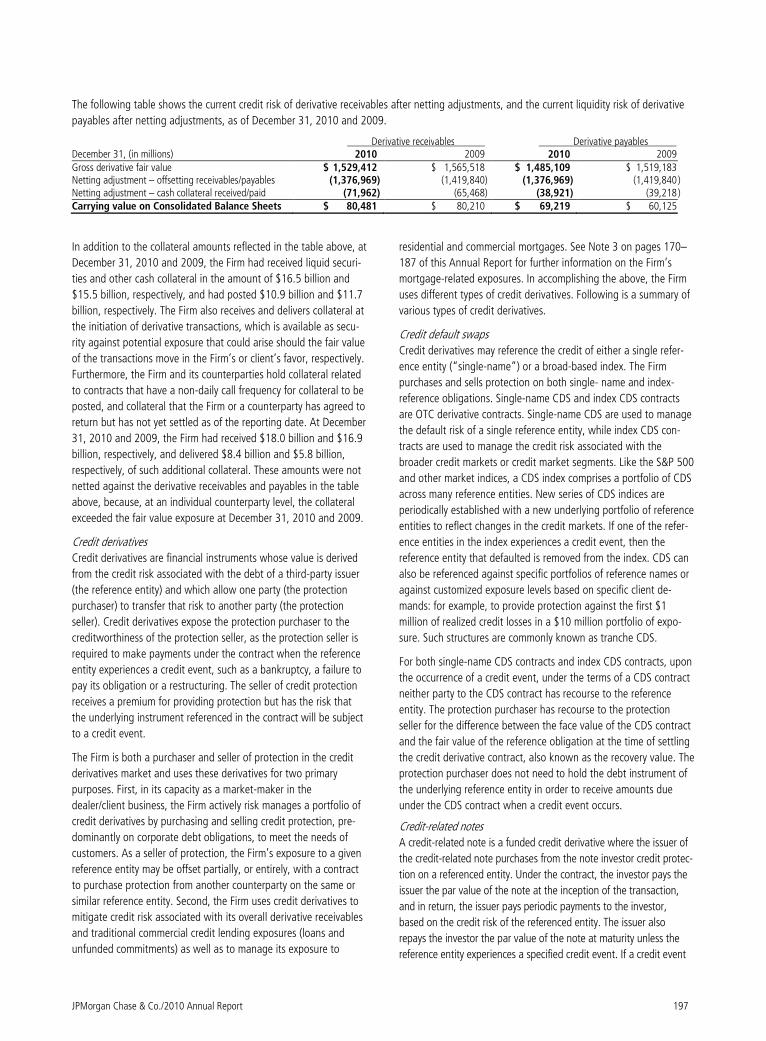
JPMorgan Chase & Co./2010 Annual Report 197
The following table shows the current credit risk of derivative receivables after netting adjustments, and the current liquidity risk of derivative
payables after netting adjustments, as of December 31, 2010 and 2009.
Derivative receivables Derivative payables December 31, (in millions) 2010 2009 2010 2009 Gross derivative fair value $ 1,529,412 $ 1,565,518 $ 1,485,109 $ 1,519,183 Netting adjustment – offsetting receivables/payables (1,376,969) (1,419,840) (1,376,969) (1,419,840 ) Netting adjustment – cash collateral received/paid (71,962) (65,468) (38,921) (39,218 ) Carrying value on Consolidated Balance Sheets $ 80,481 $ 80,210 $ 69,219 $ 60,125
In addition to the collateral amounts reflected in the table above, at
December 31, 2010 and 2009, the Firm had received liquid securi-
ties and other cash collateral in the amount of $16.5 billion and
$15.5 billion, respectively, and had posted $10.9 billion and $11.7
billion, respectively. The Firm also receives and delivers collateral at
the initiation of derivative transactions, which is available as secu-
rity against potential exposure that could arise should the fair value
of the transactions move in the Firm’s or client’s favor, respectively.
Furthermore, the Firm and its counterparties hold collateral related
to contracts that have a non-daily call frequency for collateral to be
posted, and collateral that the Firm or a counterparty has agreed to
return but has not yet settled as of the reporting date. At December
31, 2010 and 2009, the Firm had received $18.0 billion and $16.9
billion, respectively, and delivered $8.4 billion and $5.8 billion,
respectively, of such additional collateral. These amounts were not
netted against the derivative receivables and payables in the table
above, because, at an individual counterparty level, the collateral
exceeded the fair value exposure at December 31, 2010 and 2009.
Credit derivatives
Credit derivatives are financial instruments whose value is derived
from the credit risk associated with the debt of a third-party issuer
(the reference entity) and which allow one party (the protection
purchaser) to transfer that risk to another party (the protection
seller). Credit derivatives expose the protection purchaser to the
creditworthiness of the protection seller, as the protection seller is
required to make payments under the contract when the reference
entity experiences a credit event, such as a bankruptcy, a failure to
pay its obligation or a restructuring. The seller of credit protection
receives a premium for providing protection but has the risk that
the underlying instrument referenced in the contract will be subject
to a credit event.
The Firm is both a purchaser and seller of protection in the credit
derivatives market and uses these derivatives for two primary
purposes. First, in its capacity as a market-maker in the
dealer/client business, the Firm actively risk manages a portfolio of
credit derivatives by purchasing and selling credit protection, pre-
dominantly on corporate debt obligations, to meet the needs of
customers. As a seller of protection, the Firm’s exposure to a given
reference entity may be offset partially, or entirely, with a contract
to purchase protection from another counterparty on the same or
similar reference entity. Second, the Firm uses credit derivatives to
mitigate credit risk associated with its overall derivative receivables
and traditional commercial credit lending exposures (loans and
unfunded commitments) as well as to manage its exposure to
residential and commercial mortgages. See Note 3 on pages 170–
187 of this Annual Report for further information on the Firm’s
mortgage-related exposures. In accomplishing the above, the Firm
uses different types of credit derivatives. Following is a summary of
various types of credit derivatives.
Credit default swaps
Credit derivatives may reference the credit of either a single refer-
ence entity (“single-name”) or a broad-based index. The Firm
purchases and sells protection on both single- name and index-
reference obligations. Single-name CDS and index CDS contracts
are OTC derivative contracts. Single-name CDS are used to manage
the default risk of a single reference entity, while index CDS con-
tracts are used to manage the credit risk associated with the
broader credit markets or credit market segments. Like the S&P 500
and other market indices, a CDS index comprises a portfolio of CDS
across many reference entities. New series of CDS indices are
periodically established with a new underlying portfolio of reference
entities to reflect changes in the credit markets. If one of the refer-
ence entities in the index experiences a credit event, then the
reference entity that defaulted is removed from the index. CDS can
also be referenced against specific portfolios of reference names or
against customized exposure levels based on specific client de-
mands: for example, to provide protection against the first $1
million of realized credit losses in a $10 million portfolio of expo-
sure. Such structures are commonly known as tranche CDS.
For both single-name CDS contracts and index CDS contracts, upon
the occurrence of a credit event, under the terms of a CDS contract
neither party to the CDS contract has recourse to the reference
entity. The protection purchaser has recourse to the protection
seller for the difference between the face value of the CDS contract
and the fair value of the reference obligation at the time of settling
the credit derivative contract, also known as the recovery value. The
protection purchaser does not need to hold the debt instrument of
the underlying reference entity in order to receive amounts due
under the CDS contract when a credit event occurs.
Credit-related notes
A credit-related note is a funded credit derivative where the issuer of
the credit-related note purchases from the note investor credit protec-
tion on a referenced entity. Under the contract, the investor pays the
issuer the par value of the note at the inception of the transaction,
and in return, the issuer pays periodic payments to the investor,
based on the credit risk of the referenced entity. The issuer also
repays the investor the par value of the note at maturity unless the
reference entity experiences a specified credit event. If a credit event
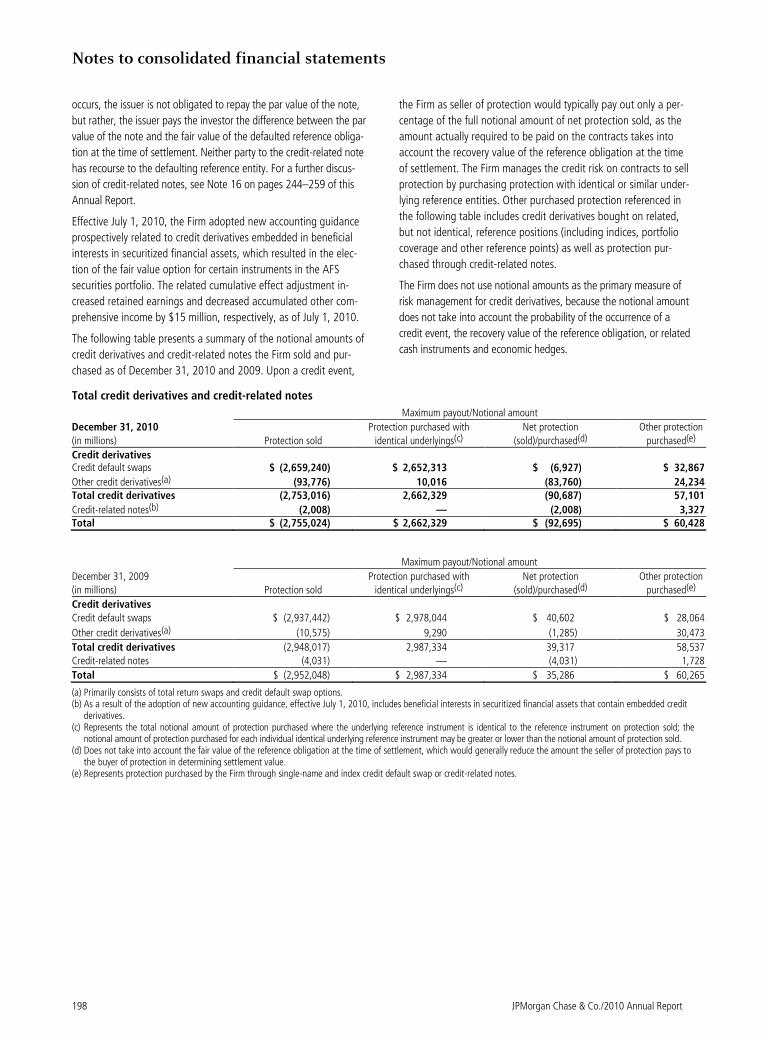
Notes to consolidated financial statements
198 JPMorgan Chase & Co./2010 Annual Report
occurs, the issuer is not obligated to repay the par value of the note,
but rather, the issuer pays the investor the difference between the par
value of the note and the fair value of the defaulted reference obliga-
tion at the time of settlement. Neither party to the credit-related note
has recourse to the defaulting reference entity. For a further discus-
sion of credit-related notes, see Note 16 on pages 244–259 of this
Annual Report.
Effective July 1, 2010, the Firm adopted new accounting guidance
prospectively related to credit derivatives embedded in beneficial
interests in securitized financial assets, which resulted in the elec-
tion of the fair value option for certain instruments in the AFS
securities portfolio. The related cumulative effect adjustment in-
creased retained earnings and decreased accumulated other com-
prehensive income by $15 million, respectively, as of July 1, 2010.
The following table presents a summary of the notional amounts of
credit derivatives and credit-related notes the Firm sold and pur-
chased as of December 31, 2010 and 2009. Upon a credit event,
the Firm as seller of protection would typically pay out only a per-
centage of the full notional amount of net protection sold, as the
amount actually required to be paid on the contracts takes into
account the recovery value of the reference obligation at the time
of settlement. The Firm manages the credit risk on contracts to sell
protection by purchasing protection with identical or similar under-
lying reference entities. Other purchased protection referenced in
the following table includes credit derivatives bought on related,
but not identical, reference positions (including indices, portfolio
coverage and other reference points) as well as protection pur-
chased through credit-related notes.
The Firm does not use notional amounts as the primary measure of
risk management for credit derivatives, because the notional amount
does not take into account the probability of the occurrence of a
credit event, the recovery value of the reference obligation, or related
cash instruments and economic hedges.
Total credit derivatives and credit-related notes
Maximum payout/Notional amount
December 31, 2010
(in millions)
Protection sold
Protection purchased with
identical underlyings(c)
Net protection
(sold)/purchased(d)
Other protection
purchased(e)
Credit derivatives Credit default swaps $ (2,659,240) $ 2,652,313 $ (6,927) $ 32,867
Other credit derivatives(a) (93,776) 10,016 (83,760) 24,234 Total credit derivatives (2,753,016) 2,662,329 (90,687) 57,101
Credit-related notes(b) (2,008) — (2,008) 3,327 Total $ (2,755,024) $ 2,662,329 $ (92,695) $ 60,428
Maximum payout/Notional amount
December 31, 2009
(in millions)
Protection sold
Protection purchased with
identical underlyings(c)
Net protection
(sold)/purchased(d)
Other protection
purchased(e)
Credit derivatives
Credit default swaps $ (2,937,442) $ 2,978,044 $ 40,602 $ 28,064
Other credit derivatives(a) (10,575) 9,290 (1,285) 30,473
Total credit derivatives (2,948,017) 2,987,334 39,317 58,537
Credit-related notes (4,031) — (4,031) 1,728
Total $ (2,952,048) $ 2,987,334 $ 35,286 $ 60,265
(a) Primarily consists of total return swaps and credit default swap options. (b) As a result of the adoption of new accounting guidance, effective July 1, 2010, includes beneficial interests in securitized financial assets that contain embedded credit
derivatives. (c) Represents the total notional amount of protection purchased where the underlying reference instrument is identical to the reference instrument on protection sold; the
notional amount of protection purchased for each individual identical underlying reference instrument may be greater or lower than the notional amount of protection sold. (d) Does not take into account the fair value of the reference obligation at the time of settlement, which would generally reduce the amount the seller of protection pays to
the buyer of protection in determining settlement value. (e) Represents protection purchased by the Firm through single-name and index credit default swap or credit-related notes.
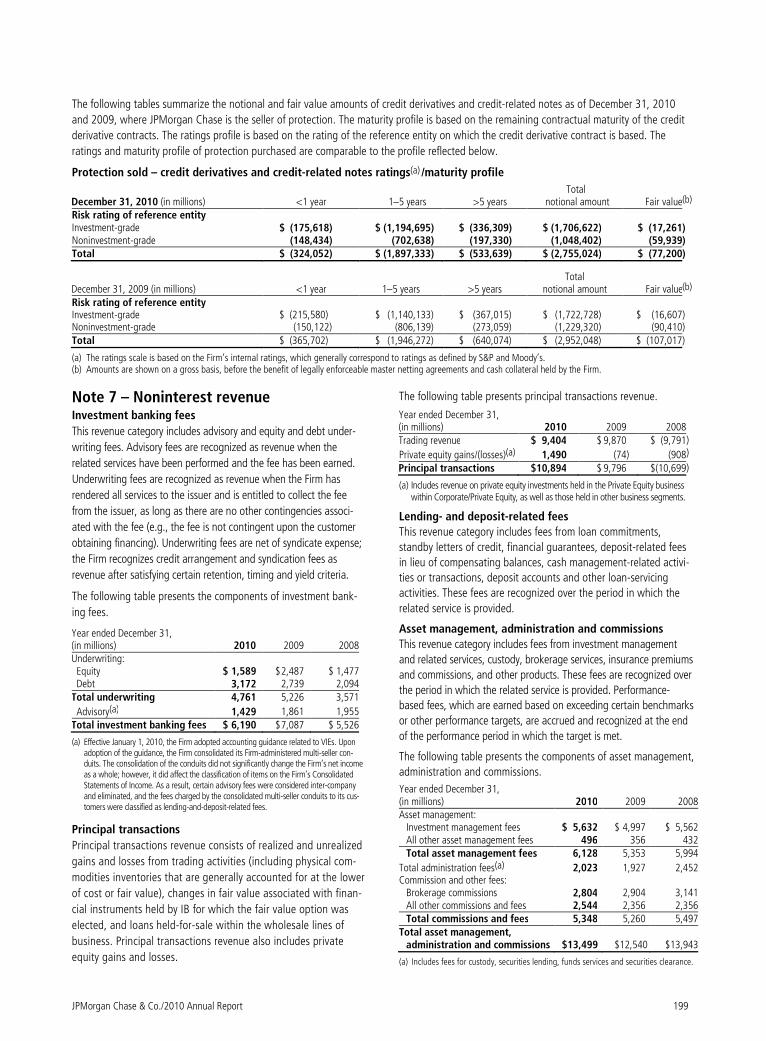
JPMorgan Chase & Co./2010 Annual Report 199
The following tables summarize the notional and fair value amounts of credit derivatives and credit-related notes as of December 31, 2010
and 2009, where JPMorgan Chase is the seller of protection. The maturity profile is based on the remaining contractual maturity of the credit
derivative contracts. The ratings profile is based on the rating of the reference entity on which the credit derivative contract is based. The
ratings and maturity profile of protection purchased are comparable to the profile reflected below.
Protection sold – credit derivatives and credit-related notes ratings(a) /maturity profile
December 31, 2010 (in millions) <1 year 1–5 years >5 years Total
notional amount Fair value(b)
Risk rating of reference entity Investment-grade $ (175,618) $ (1,194,695) $ (336,309) $ (1,706,622) $ (17,261) Noninvestment-grade (148,434) (702,638) (197,330) (1,048,402) (59,939) Total $ (324,052) $ (1,897,333) $ (533,639) $ (2,755,024) $ (77,200)
December 31, 2009 (in millions) <1 year 1–5 years >5 years Total
notional amount Fair value(b)
Risk rating of reference entity Investment-grade $ (215,580) $ (1,140,133) $ (367,015) $ (1,722,728) $ (16,607) Noninvestment-grade (150,122) (806,139) (273,059) (1,229,320) (90,410) Total $ (365,702) $ (1,946,272) $ (640,074) $ (2,952,048) $ (107,017)
(a) The ratings scale is based on the Firm’s internal ratings, which generally correspond to ratings as defined by S&P and Moody’s. (b) Amounts are shown on a gross basis, before the benefit of legally enforceable master netting agreements and cash collateral held by the Firm.
Note 7 – Noninterest revenue Investment banking fees
This revenue category includes advisory and equity and debt under-
writing fees. Advisory fees are recognized as revenue when the
related services have been performed and the fee has been earned.
Underwriting fees are recognized as revenue when the Firm has
rendered all services to the issuer and is entitled to collect the fee
from the issuer, as long as there are no other contingencies associ-
ated with the fee (e.g., the fee is not contingent upon the customer
obtaining financing). Underwriting fees are net of syndicate expense;
the Firm recognizes credit arrangement and syndication fees as
revenue after satisfying certain retention, timing and yield criteria.
The following table presents the components of investment bank-
ing fees.
Year ended December 31, (in millions) 2010 2009 2008Underwriting: Equity $ 1,589 $ 2,487 $ 1,477 Debt 3,172 2,739 2,094Total underwriting 4,761 5,226 3,571
Advisory(a) 1,429 1,861 1,955Total investment banking fees $ 6,190 $ 7,087 $ 5,526
(a) Effective January 1, 2010, the Firm adopted accounting guidance related to VIEs. Upon adoption of the guidance, the Firm consolidated its Firm-administered multi-seller con-duits. The consolidation of the conduits did not significantly change the Firm’s net income as a whole; however, it did affect the classification of items on the Firm’s Consolidated Statements of Income. As a result, certain advisory fees were considered inter-company and eliminated, and the fees charged by the consolidated multi-seller conduits to its cus-tomers were classified as lending-and-deposit-related fees.
Principal transactions
Principal transactions revenue consists of realized and unrealized
gains and losses from trading activities (including physical com-
modities inventories that are generally accounted for at the lower
of cost or fair value), changes in fair value associated with finan-
cial instruments held by IB for which the fair value option was
elected, and loans held-for-sale within the wholesale lines of
business. Principal transactions revenue also includes private
equity gains and losses.
The following table presents principal transactions revenue.
Year ended December 31, (in millions) 2010 2009 2008
Trading revenue $ 9,404 $ 9,870 $ (9,791)
Private equity gains/(losses)(a) 1,490 (74) (908)
Principal transactions $10,894 $ 9,796 $(10,699)
(a) Includes revenue on private equity investments held in the Private Equity business within Corporate/Private Equity, as well as those held in other business segments.
Lending- and deposit-related fees
This revenue category includes fees from loan commitments,
standby letters of credit, financial guarantees, deposit-related fees
in lieu of compensating balances, cash management-related activi-
ties or transactions, deposit accounts and other loan-servicing
activities. These fees are recognized over the period in which the
related service is provided.
Asset management, administration and commissions
This revenue category includes fees from investment management
and related services, custody, brokerage services, insurance premiums
and commissions, and other products. These fees are recognized over
the period in which the related service is provided. Performance-
based fees, which are earned based on exceeding certain benchmarks
or other performance targets, are accrued and recognized at the end
of the performance period in which the target is met.
The following table presents the components of asset management,
administration and commissions.
Year ended December 31, (in millions) 2010 2009 2008Asset management:
Investment management fees $ 5,632 $ 4,997 $ 5,562All other asset management fees 496 356 432Total asset management fees 6,128 5,353 5,994
Total administration fees(a) 2,023 1,927 2,452Commission and other fees:
Brokerage commissions 2,804 2,904 3,141All other commissions and fees 2,544 2,356 2,356Total commissions and fees 5,348 5,260 5,497
Total asset management, administration and commissions $13,499 $12,540 $13,943
(a) Includes fees for custody, securities lending, funds services and securities clearance.
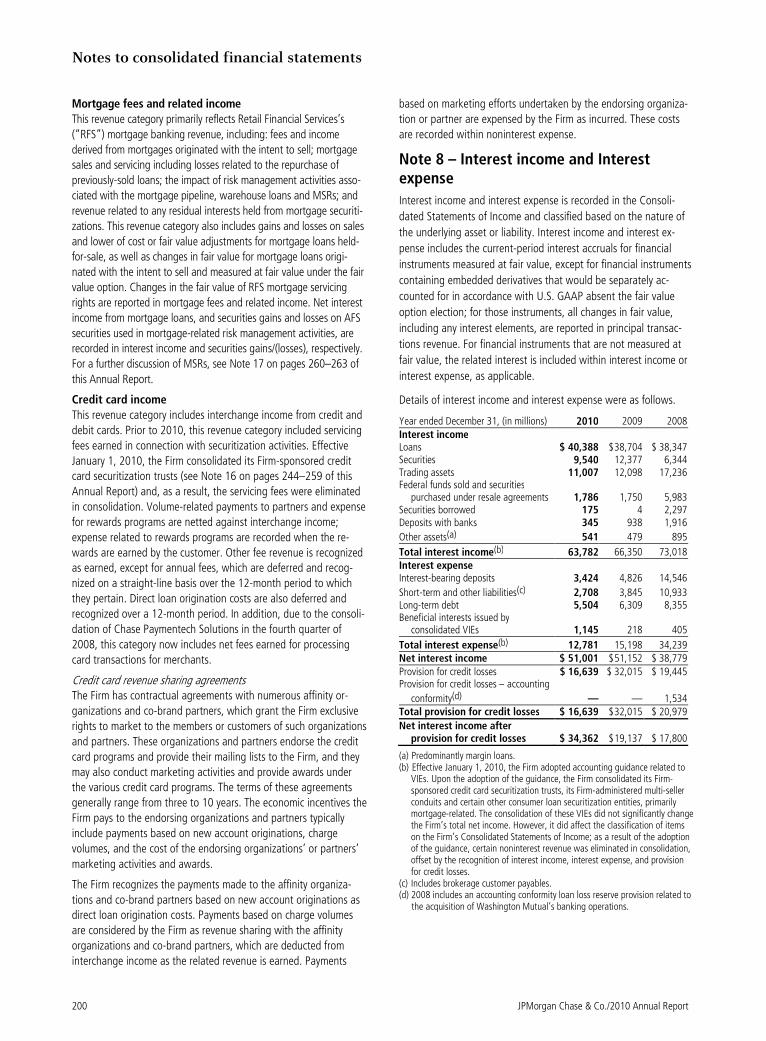
Notes to consolidated financial statements
200 JPMorgan Chase & Co./2010 Annual Report
Mortgage fees and related income
This revenue category primarily reflects Retail Financial Services’s
(“RFS”) mortgage banking revenue, including: fees and income
derived from mortgages originated with the intent to sell; mortgage
sales and servicing including losses related to the repurchase of
previously-sold loans; the impact of risk management activities asso-
ciated with the mortgage pipeline, warehouse loans and MSRs; and
revenue related to any residual interests held from mortgage securiti-
zations. This revenue category also includes gains and losses on sales
and lower of cost or fair value adjustments for mortgage loans held-
for-sale, as well as changes in fair value for mortgage loans origi-
nated with the intent to sell and measured at fair value under the fair
value option. Changes in the fair value of RFS mortgage servicing
rights are reported in mortgage fees and related income. Net interest
income from mortgage loans, and securities gains and losses on AFS
securities used in mortgage-related risk management activities, are
recorded in interest income and securities gains/(losses), respectively.
For a further discussion of MSRs, see Note 17 on pages 260–263 of
this Annual Report.
Credit card income
This revenue category includes interchange income from credit and
debit cards. Prior to 2010, this revenue category included servicing
fees earned in connection with securitization activities. Effective
January 1, 2010, the Firm consolidated its Firm-sponsored credit
card securitization trusts (see Note 16 on pages 244–259 of this
Annual Report) and, as a result, the servicing fees were eliminated
in consolidation. Volume-related payments to partners and expense
for rewards programs are netted against interchange income;
expense related to rewards programs are recorded when the re-
wards are earned by the customer. Other fee revenue is recognized
as earned, except for annual fees, which are deferred and recog-
nized on a straight-line basis over the 12-month period to which
they pertain. Direct loan origination costs are also deferred and
recognized over a 12-month period. In addition, due to the consoli-
dation of Chase Paymentech Solutions in the fourth quarter of
2008, this category now includes net fees earned for processing
card transactions for merchants.
Credit card revenue sharing agreements The Firm has contractual agreements with numerous affinity or-
ganizations and co-brand partners, which grant the Firm exclusive
rights to market to the members or customers of such organizations
and partners. These organizations and partners endorse the credit
card programs and provide their mailing lists to the Firm, and they
may also conduct marketing activities and provide awards under
the various credit card programs. The terms of these agreements
generally range from three to 10 years. The economic incentives the
Firm pays to the endorsing organizations and partners typically
include payments based on new account originations, charge
volumes, and the cost of the endorsing organizations’ or partners’
marketing activities and awards.
The Firm recognizes the payments made to the affinity organiza-
tions and co-brand partners based on new account originations as
direct loan origination costs. Payments based on charge volumes
are considered by the Firm as revenue sharing with the affinity
organizations and co-brand partners, which are deducted from
interchange income as the related revenue is earned. Payments
based on marketing efforts undertaken by the endorsing organiza-
tion or partner are expensed by the Firm as incurred. These costs
are recorded within noninterest expense.
Note 8 – Interest income and Interest expense
Interest income and interest expense is recorded in the Consoli-
dated Statements of Income and classified based on the nature of
the underlying asset or liability. Interest income and interest ex-
pense includes the current-period interest accruals for financial
instruments measured at fair value, except for financial instruments
containing embedded derivatives that would be separately ac-
counted for in accordance with U.S. GAAP absent the fair value
option election; for those instruments, all changes in fair value,
including any interest elements, are reported in principal transac-
tions revenue. For financial instruments that are not measured at
fair value, the related interest is included within interest income or
interest expense, as applicable.
Details of interest income and interest expense were as follows.
Year ended December 31, (in millions) 2010 2009 2008 Interest income Loans $ 40,388 $ 38,704 $ 38,347 Securities 9,540 12,377 6,344 Trading assets 11,007 12,098 17,236 Federal funds sold and securities
purchased under resale agreements 1,786 1,750 5,983 Securities borrowed 175 4 2,297 Deposits with banks 345 938 1,916
Other assets(a) 541 479 895
Total interest income(b) 63,782 66,350 73,018 Interest expense Interest-bearing deposits 3,424 4,826 14,546
Short-term and other liabilities(c) 2,708 3,845 10,933 Long-term debt 5,504 6,309 8,355 Beneficial interests issued by
consolidated VIEs 1,145 218 405
Total interest expense(b) 12,781 15,198 34,239 Net interest income $ 51,001 $ 51,152 $ 38,779 Provision for credit losses $ 16,639 $ 32,015 $ 19,445 Provision for credit losses – accounting
conformity(d) — — 1,534 Total provision for credit losses $ 16,639 $ 32,015 $ 20,979
Net interest income after provision for credit losses $ 34,362 $ 19,137 $ 17,800
(a) Predominantly margin loans. (b) Effective January 1, 2010, the Firm adopted accounting guidance related to
VIEs. Upon the adoption of the guidance, the Firm consolidated its Firm-sponsored credit card securitization trusts, its Firm-administered multi-seller conduits and certain other consumer loan securitization entities, primarily mortgage-related. The consolidation of these VIEs did not significantly change the Firm’s total net income. However, it did affect the classification of items on the Firm’s Consolidated Statements of Income; as a result of the adoption of the guidance, certain noninterest revenue was eliminated in consolidation, offset by the recognition of interest income, interest expense, and provision for credit losses.
(c) Includes brokerage customer payables. (d) 2008 includes an accounting conformity loan loss reserve provision related to
the acquisition of Washington Mutual’s banking operations.
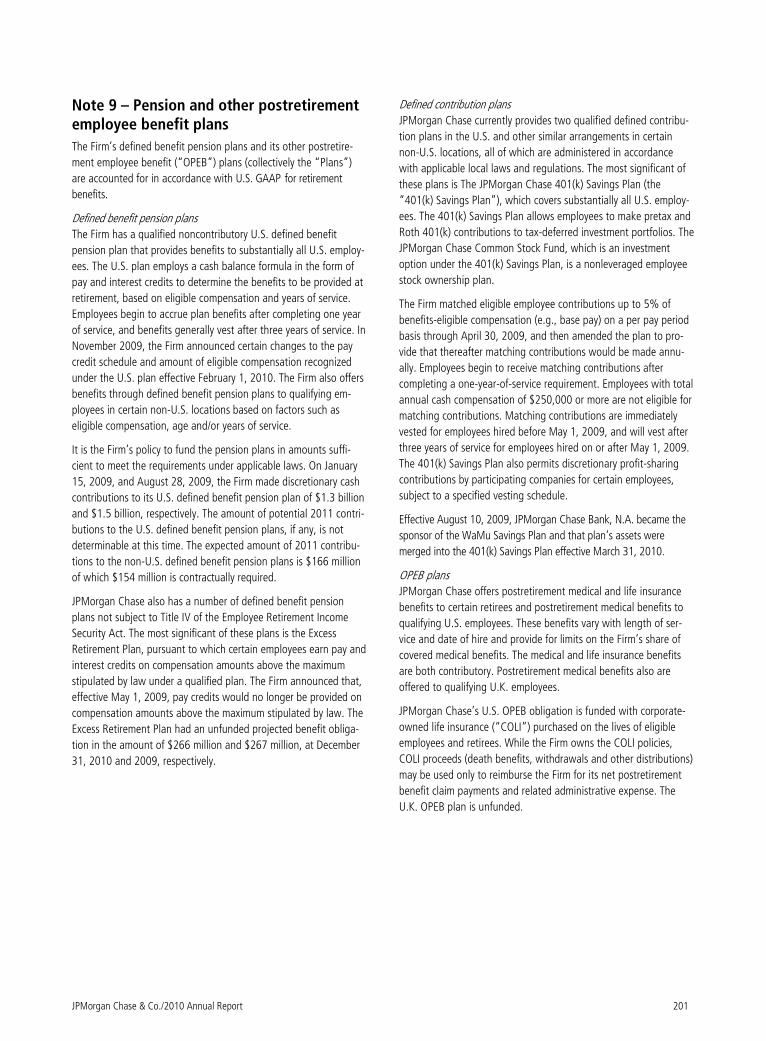
JPMorgan Chase & Co./2010 Annual Report 201
Note 9 – Pension and other postretirement employee benefit plans
The Firm’s defined benefit pension plans and its other postretire-
ment employee benefit (“OPEB”) plans (collectively the “Plans”)
are accounted for in accordance with U.S. GAAP for retirement
benefits.
Defined benefit pension plans
The Firm has a qualified noncontributory U.S. defined benefit
pension plan that provides benefits to substantially all U.S. employ-
ees. The U.S. plan employs a cash balance formula in the form of
pay and interest credits to determine the benefits to be provided at
retirement, based on eligible compensation and years of service.
Employees begin to accrue plan benefits after completing one year
of service, and benefits generally vest after three years of service. In
November 2009, the Firm announced certain changes to the pay
credit schedule and amount of eligible compensation recognized
under the U.S. plan effective February 1, 2010. The Firm also offers
benefits through defined benefit pension plans to qualifying em-
ployees in certain non-U.S. locations based on factors such as
eligible compensation, age and/or years of service.
It is the Firm’s policy to fund the pension plans in amounts suffi-
cient to meet the requirements under applicable laws. On January
15, 2009, and August 28, 2009, the Firm made discretionary cash
contributions to its U.S. defined benefit pension plan of $1.3 billion
and $1.5 billion, respectively. The amount of potential 2011 contri-
butions to the U.S. defined benefit pension plans, if any, is not
determinable at this time. The expected amount of 2011 contribu-
tions to the non-U.S. defined benefit pension plans is $166 million
of which $154 million is contractually required.
JPMorgan Chase also has a number of defined benefit pension
plans not subject to Title IV of the Employee Retirement Income
Security Act. The most significant of these plans is the Excess
Retirement Plan, pursuant to which certain employees earn pay and
interest credits on compensation amounts above the maximum
stipulated by law under a qualified plan. The Firm announced that,
effective May 1, 2009, pay credits would no longer be provided on
compensation amounts above the maximum stipulated by law. The
Excess Retirement Plan had an unfunded projected benefit obliga-
tion in the amount of $266 million and $267 million, at December
31, 2010 and 2009, respectively.
Defined contribution plans
JPMorgan Chase currently provides two qualified defined contribu-
tion plans in the U.S. and other similar arrangements in certain
non-U.S. locations, all of which are administered in accordance
with applicable local laws and regulations. The most significant of
these plans is The JPMorgan Chase 401(k) Savings Plan (the
“401(k) Savings Plan”), which covers substantially all U.S. employ-
ees. The 401(k) Savings Plan allows employees to make pretax and
Roth 401(k) contributions to tax-deferred investment portfolios. The
JPMorgan Chase Common Stock Fund, which is an investment
option under the 401(k) Savings Plan, is a nonleveraged employee
stock ownership plan.
The Firm matched eligible employee contributions up to 5% of
benefits-eligible compensation (e.g., base pay) on a per pay period
basis through April 30, 2009, and then amended the plan to pro-
vide that thereafter matching contributions would be made annu-
ally. Employees begin to receive matching contributions after
completing a one-year-of-service requirement. Employees with total
annual cash compensation of $250,000 or more are not eligible for
matching contributions. Matching contributions are immediately
vested for employees hired before May 1, 2009, and will vest after
three years of service for employees hired on or after May 1, 2009.
The 401(k) Savings Plan also permits discretionary profit-sharing
contributions by participating companies for certain employees,
subject to a specified vesting schedule.
Effective August 10, 2009, JPMorgan Chase Bank, N.A. became the
sponsor of the WaMu Savings Plan and that plan’s assets were
merged into the 401(k) Savings Plan effective March 31, 2010.
OPEB plans
JPMorgan Chase offers postretirement medical and life insurance
benefits to certain retirees and postretirement medical benefits to
qualifying U.S. employees. These benefits vary with length of ser-
vice and date of hire and provide for limits on the Firm’s share of
covered medical benefits. The medical and life insurance benefits
are both contributory. Postretirement medical benefits also are
offered to qualifying U.K. employees.
JPMorgan Chase’s U.S. OPEB obligation is funded with corporate-
owned life insurance (“COLI”) purchased on the lives of eligible
employees and retirees. While the Firm owns the COLI policies,
COLI proceeds (death benefits, withdrawals and other distributions)
may be used only to reimburse the Firm for its net postretirement
benefit claim payments and related administrative expense. The
U.K. OPEB plan is unfunded.
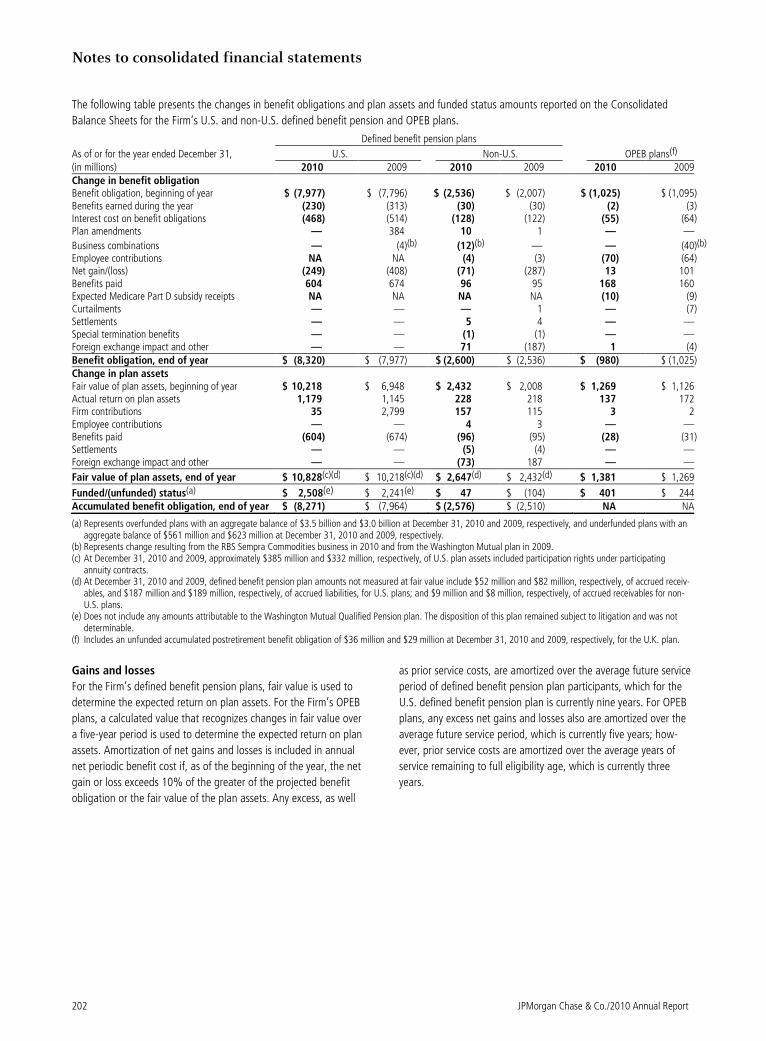
Notes to consolidated financial statements
202 JPMorgan Chase & Co./2010 Annual Report
The following table presents the changes in benefit obligations and plan assets and funded status amounts reported on the Consolidated
Balance Sheets for the Firm’s U.S. and non-U.S. defined benefit pension and OPEB plans.
Defined benefit pension plans
As of or for the year ended December 31, U.S. Non-U.S. OPEB plans(f) (in millions) 2010 2009 2010 2009 2010 2009
Change in benefit obligation Benefit obligation, beginning of year $ (7,977) $ (7,796) $ (2,536) $ (2,007) $ (1,025) $ (1,095) Benefits earned during the year (230) (313) (30) (30) (2) (3) Interest cost on benefit obligations (468) (514) (128) (122) (55) (64) Plan amendments — 384 10 1 — —
Business combinations — (4)(b) (12)(b) — — (40)(b) Employee contributions NA NA (4) (3) (70) (64) Net gain/(loss) (249) (408) (71) (287) 13 101 Benefits paid 604 674 96 95 168 160 Expected Medicare Part D subsidy receipts NA NA NA NA (10) (9) Curtailments — — — 1 — (7) Settlements — — 5 4 — — Special termination benefits — — (1) (1) — — Foreign exchange impact and other — — 71 (187) 1 (4) Benefit obligation, end of year $ (8,320) $ (7,977) $ (2,600) $ (2,536) $ (980) $ (1,025) Change in plan assets Fair value of plan assets, beginning of year $ 10,218 $ 6,948 $ 2,432 $ 2,008 $ 1,269 $ 1,126 Actual return on plan assets 1,179 1,145 228 218 137 172 Firm contributions 35 2,799 157 115 3 2Employee contributions — — 4 3 — —Benefits paid (604) (674) (96) (95) (28) (31) Settlements — — (5) (4) — —Foreign exchange impact and other — — (73) 187 — —
Fair value of plan assets, end of year $ 10,828(c)(d) $ 10,218(c)(d) $ 2,647(d) $ 2,432(d) $ 1,381 $ 1,269
Funded/(unfunded) status(a) $ 2,508(e) $ 2,241(e) $ 47 $ (104) $ 401 $ 244 Accumulated benefit obligation, end of year $ (8,271) $ (7,964) $ (2,576) $ (2,510) NA NA
(a) Represents overfunded plans with an aggregate balance of $3.5 billion and $3.0 billion at December 31, 2010 and 2009, respectively, and underfunded plans with an aggregate balance of $561 million and $623 million at December 31, 2010 and 2009, respectively.
(b) Represents change resulting from the RBS Sempra Commodities business in 2010 and from the Washington Mutual plan in 2009. (c) At December 31, 2010 and 2009, approximately $385 million and $332 million, respectively, of U.S. plan assets included participation rights under participating
annuity contracts. (d) At December 31, 2010 and 2009, defined benefit pension plan amounts not measured at fair value include $52 million and $82 million, respectively, of accrued receiv-
ables, and $187 million and $189 million, respectively, of accrued liabilities, for U.S. plans; and $9 million and $8 million, respectively, of accrued receivables for non-U.S. plans.
(e) Does not include any amounts attributable to the Washington Mutual Qualified Pension plan. The disposition of this plan remained subject to litigation and was not determinable.
(f) Includes an unfunded accumulated postretirement benefit obligation of $36 million and $29 million at December 31, 2010 and 2009, respectively, for the U.K. plan.
Gains and losses
For the Firm’s defined benefit pension plans, fair value is used to
determine the expected return on plan assets. For the Firm’s OPEB
plans, a calculated value that recognizes changes in fair value over
a five-year period is used to determine the expected return on plan
assets. Amortization of net gains and losses is included in annual
net periodic benefit cost if, as of the beginning of the year, the net
gain or loss exceeds 10% of the greater of the projected benefit
obligation or the fair value of the plan assets. Any excess, as well
as prior service costs, are amortized over the average future service
period of defined benefit pension plan participants, which for the
U.S. defined benefit pension plan is currently nine years. For OPEB
plans, any excess net gains and losses also are amortized over the
average future service period, which is currently five years; how-
ever, prior service costs are amortized over the average years of
service remaining to full eligibility age, which is currently three
years.
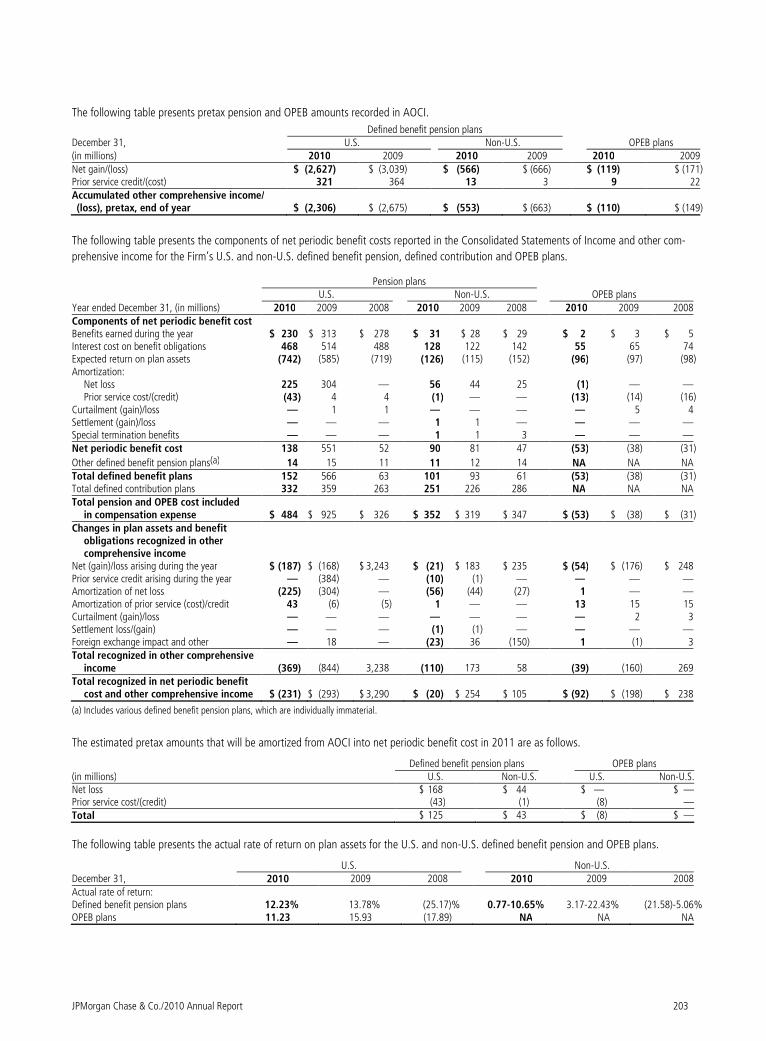
JPMorgan Chase & Co./2010 Annual Report 203
The following table presents pretax pension and OPEB amounts recorded in AOCI. Defined benefit pension plans
December 31, U.S. Non-U.S. OPEB plans (in millions) 2010 2009 2010 2009 2010 2009
Net gain/(loss) $ (2,627) $ (3,039) $ (566) $ (666) $ (119) $ (171 ) Prior service credit/(cost) 321 364 13 3 9 22 Accumulated other comprehensive income/ (loss), pretax, end of year $ (2,306) $ (2,675) $ (553) $ (663) $ (110) $ (149 )
The following table presents the components of net periodic benefit costs reported in the Consolidated Statements of Income and other com-
prehensive income for the Firm’s U.S. and non-U.S. defined benefit pension, defined contribution and OPEB plans.
Pension plans U.S. Non-U.S. OPEB plans
Year ended December 31, (in millions) 2010 2009 2008 2010 2009 2008 2010 2009 2008 Components of net periodic benefit cost Benefits earned during the year $ 230 $ 313 $ 278 $ 31 $ 28 $ 29 $ 2 $ 3 $ 5 Interest cost on benefit obligations 468 514 488 128 122 142 55 65 74 Expected return on plan assets (742) (585) (719) (126) (115) (152) (96) (97) (98) Amortization:
Net loss 225 304 — 56 44 25 (1) — — Prior service cost/(credit) (43) 4 4 (1) — — (13) (14) (16)
Curtailment (gain)/loss — 1 1 — — — — 5 4 Settlement (gain)/loss — — — 1 1 — — — — Special termination benefits — — — 1 1 3 — — — Net periodic benefit cost 138 551 52 90 81 47 (53) (38) (31)
Other defined benefit pension plans(a) 14 15 11 11 12 14 NA NA NA Total defined benefit plans 152 566 63 101 93 61 (53) (38) (31) Total defined contribution plans 332 359 263 251 226 286 NA NA NA Total pension and OPEB cost included
in compensation expense $ 484 $ 925 $ 326 $ 352 $ 319 $ 347 $ (53) $ (38) $ (31) Changes in plan assets and benefit
obligations recognized in other comprehensive income
Net (gain)/loss arising during the year $ (187) $ (168) $ 3,243 $ (21) $ 183 $ 235 $ (54) $ (176) $ 248 Prior service credit arising during the year — (384) — (10) (1) — — — — Amortization of net loss (225) (304) — (56) (44) (27) 1 — — Amortization of prior service (cost)/credit 43 (6) (5) 1 — — 13 15 15 Curtailment (gain)/loss — — — — — — — 2 3 Settlement loss/(gain) — — — (1) (1) — — — — Foreign exchange impact and other — 18 — (23) 36 (150) 1 (1) 3 Total recognized in other comprehensive
income (369) (844) 3,238 (110) 173 58 (39) (160) 269 Total recognized in net periodic benefit
cost and other comprehensive income $ (231) $ (293) $ 3,290 $ (20) $ 254 $ 105 $ (92) $ (198) $ 238
(a) Includes various defined benefit pension plans, which are individually immaterial. The estimated pretax amounts that will be amortized from AOCI into net periodic benefit cost in 2011 are as follows.
Defined benefit pension plans OPEB plans (in millions) U.S. Non-U.S. U.S. Non-U.S. Net loss $ 168 $ 44 $ — $ — Prior service cost/(credit) (43) (1) (8) — Total $ 125 $ 43 $ (8) $ —
The following table presents the actual rate of return on plan assets for the U.S. and non-U.S. defined benefit pension and OPEB plans.
U.S. Non-U.S. December 31, 2010 2009 2008 2010 2009 2008 Actual rate of return: Defined benefit pension plans 12.23% 13.78% (25.17)% 0.77-10.65% 3.17-22.43% (21.58)-5.06% OPEB plans 11.23 15.93 (17.89) NA NA NA
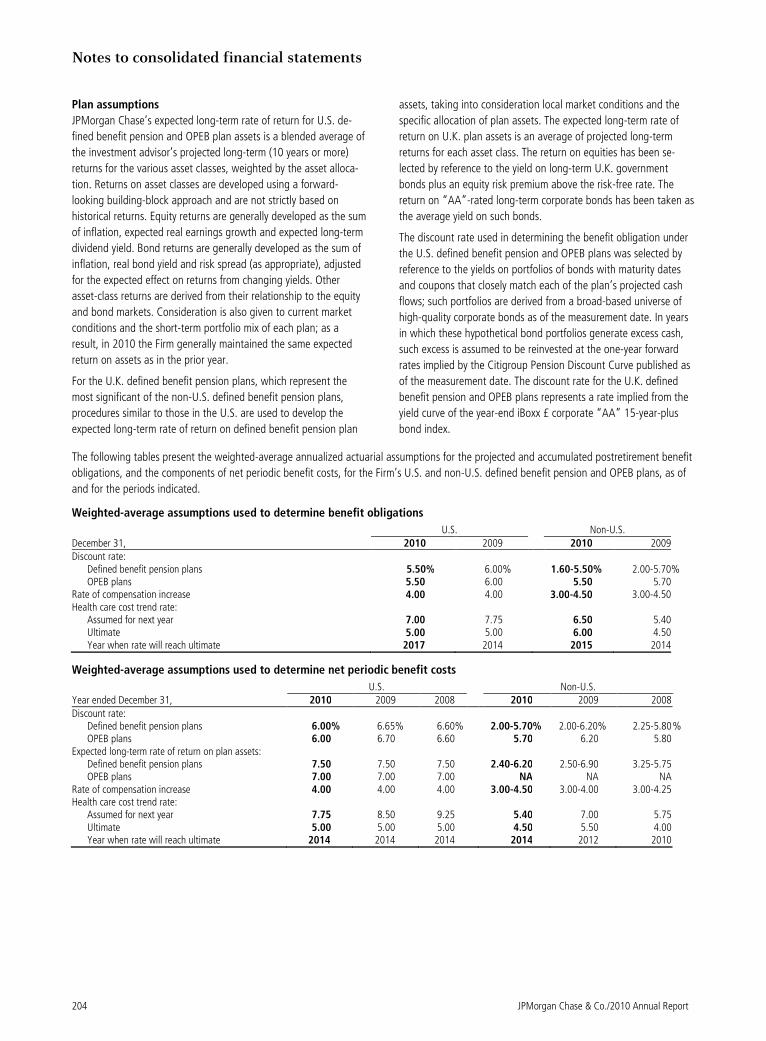
Notes to consolidated financial statements
204 JPMorgan Chase & Co./2010 Annual Report
Plan assumptions
JPMorgan Chase’s expected long-term rate of return for U.S. de-
fined benefit pension and OPEB plan assets is a blended average of
the investment advisor’s projected long-term (10 years or more)
returns for the various asset classes, weighted by the asset alloca-
tion. Returns on asset classes are developed using a forward-
looking building-block approach and are not strictly based on
historical returns. Equity returns are generally developed as the sum
of inflation, expected real earnings growth and expected long-term
dividend yield. Bond returns are generally developed as the sum of
inflation, real bond yield and risk spread (as appropriate), adjusted
for the expected effect on returns from changing yields. Other
asset-class returns are derived from their relationship to the equity
and bond markets. Consideration is also given to current market
conditions and the short-term portfolio mix of each plan; as a
result, in 2010 the Firm generally maintained the same expected
return on assets as in the prior year.
For the U.K. defined benefit pension plans, which represent the
most significant of the non-U.S. defined benefit pension plans,
procedures similar to those in the U.S. are used to develop the
expected long-term rate of return on defined benefit pension plan
assets, taking into consideration local market conditions and the
specific allocation of plan assets. The expected long-term rate of
return on U.K. plan assets is an average of projected long-term
returns for each asset class. The return on equities has been se-
lected by reference to the yield on long-term U.K. government
bonds plus an equity risk premium above the risk-free rate. The
return on “AA”-rated long-term corporate bonds has been taken as
the average yield on such bonds.
The discount rate used in determining the benefit obligation under
the U.S. defined benefit pension and OPEB plans was selected by
reference to the yields on portfolios of bonds with maturity dates
and coupons that closely match each of the plan’s projected cash
flows; such portfolios are derived from a broad-based universe of
high-quality corporate bonds as of the measurement date. In years
in which these hypothetical bond portfolios generate excess cash,
such excess is assumed to be reinvested at the one-year forward
rates implied by the Citigroup Pension Discount Curve published as
of the measurement date. The discount rate for the U.K. defined
benefit pension and OPEB plans represents a rate implied from the
yield curve of the year-end iBoxx £ corporate “AA” 15-year-plus
bond index.
The following tables present the weighted-average annualized actuarial assumptions for the projected and accumulated postretirement benefit
obligations, and the components of net periodic benefit costs, for the Firm’s U.S. and non-U.S. defined benefit pension and OPEB plans, as of
and for the periods indicated.
Weighted-average assumptions used to determine benefit obligations
U.S. Non-U.S. December 31, 2010 2009 2010 2009
Discount rate: Defined benefit pension plans 5.50% 6.00% 1.60-5.50% 2.00-5.70% OPEB plans 5.50 6.00 5.50 5.70 Rate of compensation increase 4.00 4.00 3.00-4.50 3.00-4.50 Health care cost trend rate: Assumed for next year 7.00 7.75 6.50 5.40 Ultimate 5.00 5.00 6.00 4.50 Year when rate will reach ultimate 2017 2014 2015 2014
Weighted-average assumptions used to determine net periodic benefit costs
U.S. Non-U.S. Year ended December 31, 2010 2009 2008 2010 2009 2008
Discount rate: Defined benefit pension plans 6.00% 6.65% 6.60% 2.00-5.70% 2.00-6.20% 2.25-5.80 % OPEB plans 6.00 6.70 6.60 5.70 6.20 5.80 Expected long-term rate of return on plan assets: Defined benefit pension plans 7.50 7.50 7.50 2.40-6.20 2.50-6.90 3.25-5.75 OPEB plans 7.00 7.00 7.00 NA NA NA Rate of compensation increase 4.00 4.00 4.00 3.00-4.50 3.00-4.00 3.00-4.25 Health care cost trend rate: Assumed for next year 7.75 8.50 9.25 5.40 7.00 5.75 Ultimate 5.00 5.00 5.00 4.50 5.50 4.00 Year when rate will reach ultimate 2014 2014 2014 2014 2012 2010
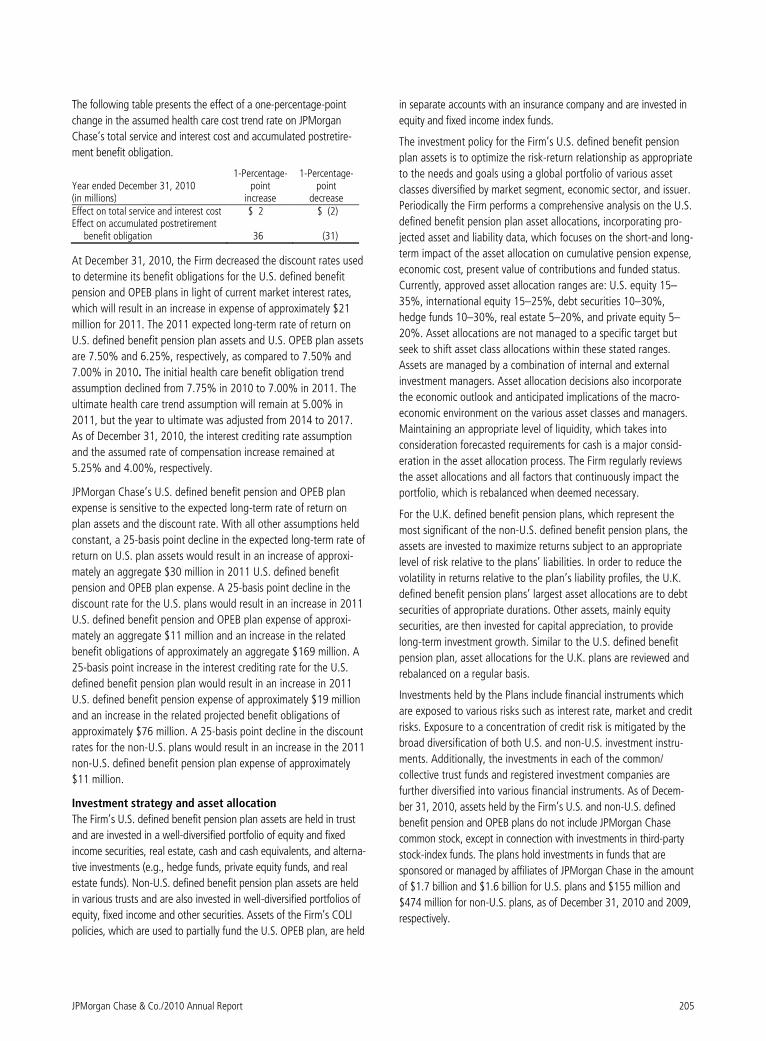
JPMorgan Chase & Co./2010 Annual Report 205
The following table presents the effect of a one-percentage-point
change in the assumed health care cost trend rate on JPMorgan
Chase’s total service and interest cost and accumulated postretire-
ment benefit obligation.
1-Percentage- 1-Percentage- Year ended December 31, 2010 point point (in millions) increase decrease Effect on total service and interest cost $ 2 $ (2) Effect on accumulated postretirement
benefit obligation 36 (31)
At December 31, 2010, the Firm decreased the discount rates used
to determine its benefit obligations for the U.S. defined benefit
pension and OPEB plans in light of current market interest rates,
which will result in an increase in expense of approximately $21
million for 2011. The 2011 expected long-term rate of return on
U.S. defined benefit pension plan assets and U.S. OPEB plan assets
are 7.50% and 6.25%, respectively, as compared to 7.50% and
7.00% in 2010. The initial health care benefit obligation trend
assumption declined from 7.75% in 2010 to 7.00% in 2011. The
ultimate health care trend assumption will remain at 5.00% in
2011, but the year to ultimate was adjusted from 2014 to 2017.
As of December 31, 2010, the interest crediting rate assumption
and the assumed rate of compensation increase remained at
5.25% and 4.00%, respectively.
JPMorgan Chase’s U.S. defined benefit pension and OPEB plan
expense is sensitive to the expected long-term rate of return on
plan assets and the discount rate. With all other assumptions held
constant, a 25-basis point decline in the expected long-term rate of
return on U.S. plan assets would result in an increase of approxi-
mately an aggregate $30 million in 2011 U.S. defined benefit
pension and OPEB plan expense. A 25-basis point decline in the
discount rate for the U.S. plans would result in an increase in 2011
U.S. defined benefit pension and OPEB plan expense of approxi-
mately an aggregate $11 million and an increase in the related
benefit obligations of approximately an aggregate $169 million. A
25-basis point increase in the interest crediting rate for the U.S.
defined benefit pension plan would result in an increase in 2011
U.S. defined benefit pension expense of approximately $19 million
and an increase in the related projected benefit obligations of
approximately $76 million. A 25-basis point decline in the discount
rates for the non-U.S. plans would result in an increase in the 2011
non-U.S. defined benefit pension plan expense of approximately
$11 million.
Investment strategy and asset allocation
The Firm’s U.S. defined benefit pension plan assets are held in trust
and are invested in a well-diversified portfolio of equity and fixed
income securities, real estate, cash and cash equivalents, and alterna-
tive investments (e.g., hedge funds, private equity funds, and real
estate funds). Non-U.S. defined benefit pension plan assets are held
in various trusts and are also invested in well-diversified portfolios of
equity, fixed income and other securities. Assets of the Firm’s COLI
policies, which are used to partially fund the U.S. OPEB plan, are held
in separate accounts with an insurance company and are invested in
equity and fixed income index funds.
The investment policy for the Firm’s U.S. defined benefit pension
plan assets is to optimize the risk-return relationship as appropriate
to the needs and goals using a global portfolio of various asset
classes diversified by market segment, economic sector, and issuer.
Periodically the Firm performs a comprehensive analysis on the U.S.
defined benefit pension plan asset allocations, incorporating pro-
jected asset and liability data, which focuses on the short-and long-
term impact of the asset allocation on cumulative pension expense,
economic cost, present value of contributions and funded status.
Currently, approved asset allocation ranges are: U.S. equity 15–
35%, international equity 15–25%, debt securities 10–30%,
hedge funds 10–30%, real estate 5–20%, and private equity 5–
20%. Asset allocations are not managed to a specific target but
seek to shift asset class allocations within these stated ranges.
Assets are managed by a combination of internal and external
investment managers. Asset allocation decisions also incorporate
the economic outlook and anticipated implications of the macro-
economic environment on the various asset classes and managers.
Maintaining an appropriate level of liquidity, which takes into
consideration forecasted requirements for cash is a major consid-
eration in the asset allocation process. The Firm regularly reviews
the asset allocations and all factors that continuously impact the
portfolio, which is rebalanced when deemed necessary.
For the U.K. defined benefit pension plans, which represent the
most significant of the non-U.S. defined benefit pension plans, the
assets are invested to maximize returns subject to an appropriate
level of risk relative to the plans’ liabilities. In order to reduce the
volatility in returns relative to the plan’s liability profiles, the U.K.
defined benefit pension plans’ largest asset allocations are to debt
securities of appropriate durations. Other assets, mainly equity
securities, are then invested for capital appreciation, to provide
long-term investment growth. Similar to the U.S. defined benefit
pension plan, asset allocations for the U.K. plans are reviewed and
rebalanced on a regular basis.
Investments held by the Plans include financial instruments which
are exposed to various risks such as interest rate, market and credit
risks. Exposure to a concentration of credit risk is mitigated by the
broad diversification of both U.S. and non-U.S. investment instru-
ments. Additionally, the investments in each of the common/
collective trust funds and registered investment companies are
further diversified into various financial instruments. As of Decem-
ber 31, 2010, assets held by the Firm’s U.S. and non-U.S. defined
benefit pension and OPEB plans do not include JPMorgan Chase
common stock, except in connection with investments in third-party
stock-index funds. The plans hold investments in funds that are
sponsored or managed by affiliates of JPMorgan Chase in the amount
of $1.7 billion and $1.6 billion for U.S. plans and $155 million and
$474 million for non-U.S. plans, as of December 31, 2010 and 2009,
respectively.
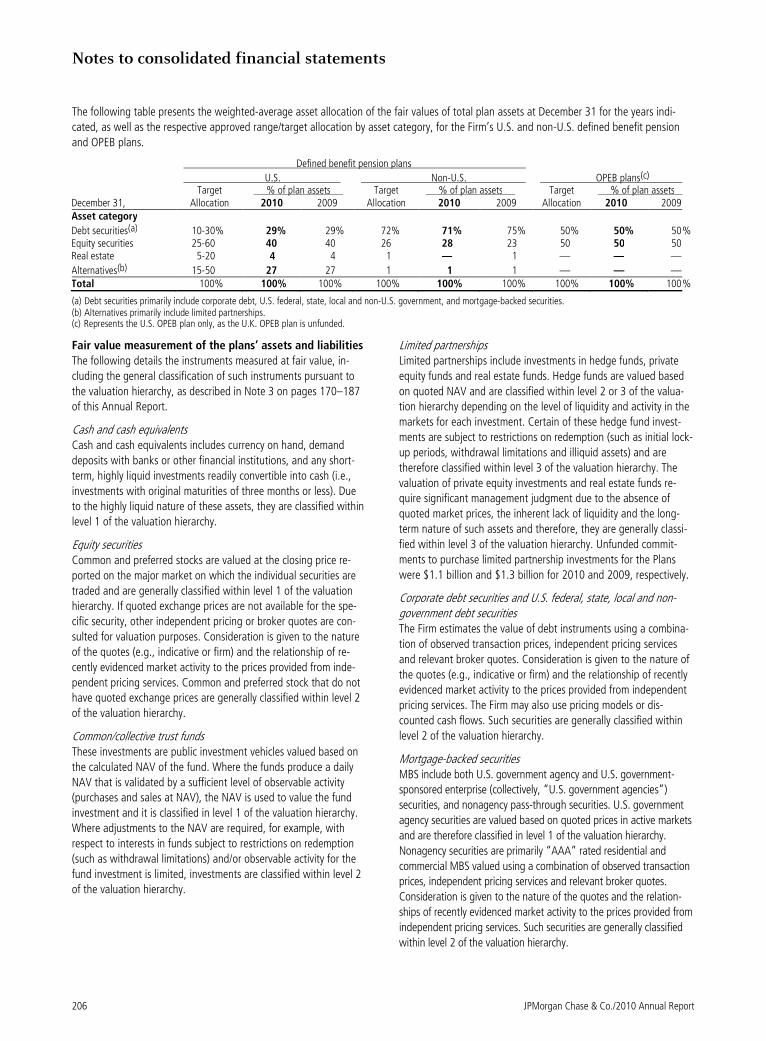
Notes to consolidated financial statements
206 JPMorgan Chase & Co./2010 Annual Report
The following table presents the weighted-average asset allocation of the fair values of total plan assets at December 31 for the years indi-
cated, as well as the respective approved range/target allocation by asset category, for the Firm’s U.S. and non-U.S. defined benefit pension
and OPEB plans.
Defined benefit pension plans
U.S. Non-U.S. OPEB plans(c)
Target % of plan assets Target % of plan assets Target % of plan assets December 31, Allocation 2010 2009 Allocation 2010 2009 Allocation 2010 2009 Asset category
Debt securities(a) 10-30% 29% 29% 72% 71% 75% 50% 50% 50 % Equity securities 25-60 40 40 26 28 23 50 50 50 Real estate 5-20 4 4 1 — 1 — — —
Alternatives(b) 15-50 27 27 1 1 1 — — — Total 100% 100% 100% 100% 100% 100% 100% 100% 100 %
(a) Debt securities primarily include corporate debt, U.S. federal, state, local and non-U.S. government, and mortgage-backed securities. (b) Alternatives primarily include limited partnerships. (c) Represents the U.S. OPEB plan only, as the U.K. OPEB plan is unfunded.
Fair value measurement of the plans’ assets and liabilities
The following details the instruments measured at fair value, in-
cluding the general classification of such instruments pursuant to
the valuation hierarchy, as described in Note 3 on pages 170–187
of this Annual Report.
Cash and cash equivalents Cash and cash equivalents includes currency on hand, demand
deposits with banks or other financial institutions, and any short-
term, highly liquid investments readily convertible into cash (i.e.,
investments with original maturities of three months or less). Due
to the highly liquid nature of these assets, they are classified within
level 1 of the valuation hierarchy.
Equity securities Common and preferred stocks are valued at the closing price re-
ported on the major market on which the individual securities are
traded and are generally classified within level 1 of the valuation
hierarchy. If quoted exchange prices are not available for the spe-
cific security, other independent pricing or broker quotes are con-
sulted for valuation purposes. Consideration is given to the nature
of the quotes (e.g., indicative or firm) and the relationship of re-
cently evidenced market activity to the prices provided from inde-
pendent pricing services. Common and preferred stock that do not
have quoted exchange prices are generally classified within level 2
of the valuation hierarchy.
Common/collective trust funds These investments are public investment vehicles valued based on
the calculated NAV of the fund. Where the funds produce a daily
NAV that is validated by a sufficient level of observable activity
(purchases and sales at NAV), the NAV is used to value the fund
investment and it is classified in level 1 of the valuation hierarchy.
Where adjustments to the NAV are required, for example, with
respect to interests in funds subject to restrictions on redemption
(such as withdrawal limitations) and/or observable activity for the
fund investment is limited, investments are classified within level 2
of the valuation hierarchy.
Limited partnerships Limited partnerships include investments in hedge funds, private
equity funds and real estate funds. Hedge funds are valued based
on quoted NAV and are classified within level 2 or 3 of the valua-
tion hierarchy depending on the level of liquidity and activity in the
markets for each investment. Certain of these hedge fund invest-
ments are subject to restrictions on redemption (such as initial lock-
up periods, withdrawal limitations and illiquid assets) and are
therefore classified within level 3 of the valuation hierarchy. The
valuation of private equity investments and real estate funds re-
quire significant management judgment due to the absence of
quoted market prices, the inherent lack of liquidity and the long-
term nature of such assets and therefore, they are generally classi-
fied within level 3 of the valuation hierarchy. Unfunded commit-
ments to purchase limited partnership investments for the Plans
were $1.1 billion and $1.3 billion for 2010 and 2009, respectively.
Corporate debt securities and U.S. federal, state, local and non-government debt securities The Firm estimates the value of debt instruments using a combina-
tion of observed transaction prices, independent pricing services
and relevant broker quotes. Consideration is given to the nature of
the quotes (e.g., indicative or firm) and the relationship of recently
evidenced market activity to the prices provided from independent
pricing services. The Firm may also use pricing models or dis-
counted cash flows. Such securities are generally classified within
level 2 of the valuation hierarchy.
Mortgage-backed securities MBS include both U.S. government agency and U.S. government-
sponsored enterprise (collectively, “U.S. government agencies”)
securities, and nonagency pass-through securities. U.S. government
agency securities are valued based on quoted prices in active markets
and are therefore classified in level 1 of the valuation hierarchy.
Nonagency securities are primarily “AAA” rated residential and
commercial MBS valued using a combination of observed transaction
prices, independent pricing services and relevant broker quotes.
Consideration is given to the nature of the quotes and the relation-
ships of recently evidenced market activity to the prices provided from
independent pricing services. Such securities are generally classified
within level 2 of the valuation hierarchy.
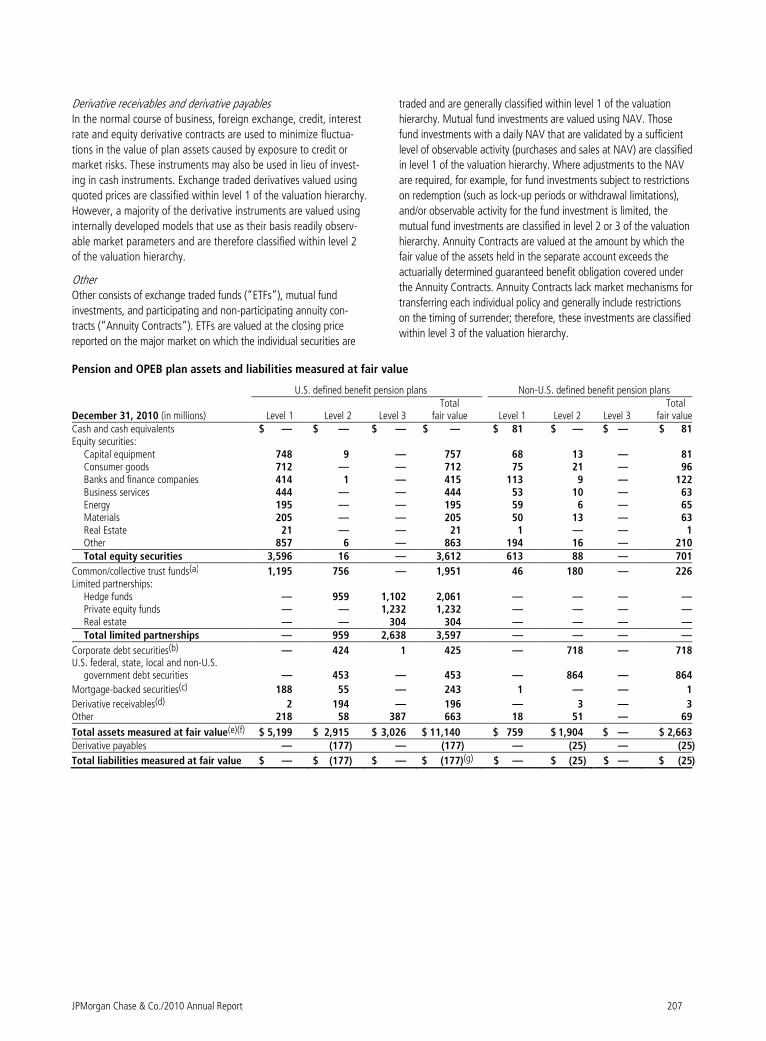
JPMorgan Chase & Co./2010 Annual Report 207
Derivative receivables and derivative payables In the normal course of business, foreign exchange, credit, interest
rate and equity derivative contracts are used to minimize fluctua-
tions in the value of plan assets caused by exposure to credit or
market risks. These instruments may also be used in lieu of invest-
ing in cash instruments. Exchange traded derivatives valued using
quoted prices are classified within level 1 of the valuation hierarchy.
However, a majority of the derivative instruments are valued using
internally developed models that use as their basis readily observ-
able market parameters and are therefore classified within level 2
of the valuation hierarchy.
Other Other consists of exchange traded funds (“ETFs”), mutual fund
investments, and participating and non-participating annuity con-
tracts (“Annuity Contracts”). ETFs are valued at the closing price
reported on the major market on which the individual securities are
traded and are generally classified within level 1 of the valuation
hierarchy. Mutual fund investments are valued using NAV. Those
fund investments with a daily NAV that are validated by a sufficient
level of observable activity (purchases and sales at NAV) are classified
in level 1 of the valuation hierarchy. Where adjustments to the NAV
are required, for example, for fund investments subject to restrictions
on redemption (such as lock-up periods or withdrawal limitations),
and/or observable activity for the fund investment is limited, the
mutual fund investments are classified in level 2 or 3 of the valuation
hierarchy. Annuity Contracts are valued at the amount by which the
fair value of the assets held in the separate account exceeds the
actuarially determined guaranteed benefit obligation covered under
the Annuity Contracts. Annuity Contracts lack market mechanisms for
transferring each individual policy and generally include restrictions
on the timing of surrender; therefore, these investments are classified
within level 3 of the valuation hierarchy.
Pension and OPEB plan assets and liabilities measured at fair value
U.S. defined benefit pension plans Non-U.S. defined benefit pension plans
December 31, 2010 (in millions)
Level 1 Level 2 Level 3 Total
fair value
Level 1
Level 2
Level 3 Total fair value
Cash and cash equivalents $ — $ — $ — $ — $ 81 $ — $ — $ 81 Equity securities:
Capital equipment 748 9 — 757 68 13 — 81 Consumer goods 712 — — 712 75 21 — 96 Banks and finance companies 414 1 — 415 113 9 — 122 Business services 444 — — 444 53 10 — 63 Energy 195 — — 195 59 6 — 65 Materials 205 — — 205 50 13 — 63 Real Estate 21 — — 21 1 — — 1 Other 857 6 — 863 194 16 — 210 Total equity securities 3,596 16 — 3,612 613 88 — 701
Common/collective trust funds(a) 1,195 756 — 1,951 46 180 — 226 Limited partnerships:
Hedge funds — 959 1,102 2,061 — — — — Private equity funds — — 1,232 1,232 — — — — Real estate — — 304 304 — — — — Total limited partnerships — 959 2,638 3,597 — — — —
Corporate debt securities(b) — 424 1 425 — 718 — 718 U.S. federal, state, local and non-U.S.
government debt securities — 453 — 453 — 864 — 864
Mortgage-backed securities(c) 188 55 — 243 1 — — 1
Derivative receivables(d) 2 194 — 196 — 3 — 3 Other 218 58 387 663 18 51 — 69
Total assets measured at fair value(e)(f) $ 5,199 $ 2,915 $ 3,026 $ 11,140 $ 759 $ 1,904 $ — $ 2,663
Derivative payables — (177) — (177) — (25) — (25 )
Total liabilities measured at fair value $ — $ (177) $ — $ (177)(g) $ — $ (25) $ — $ (25 )
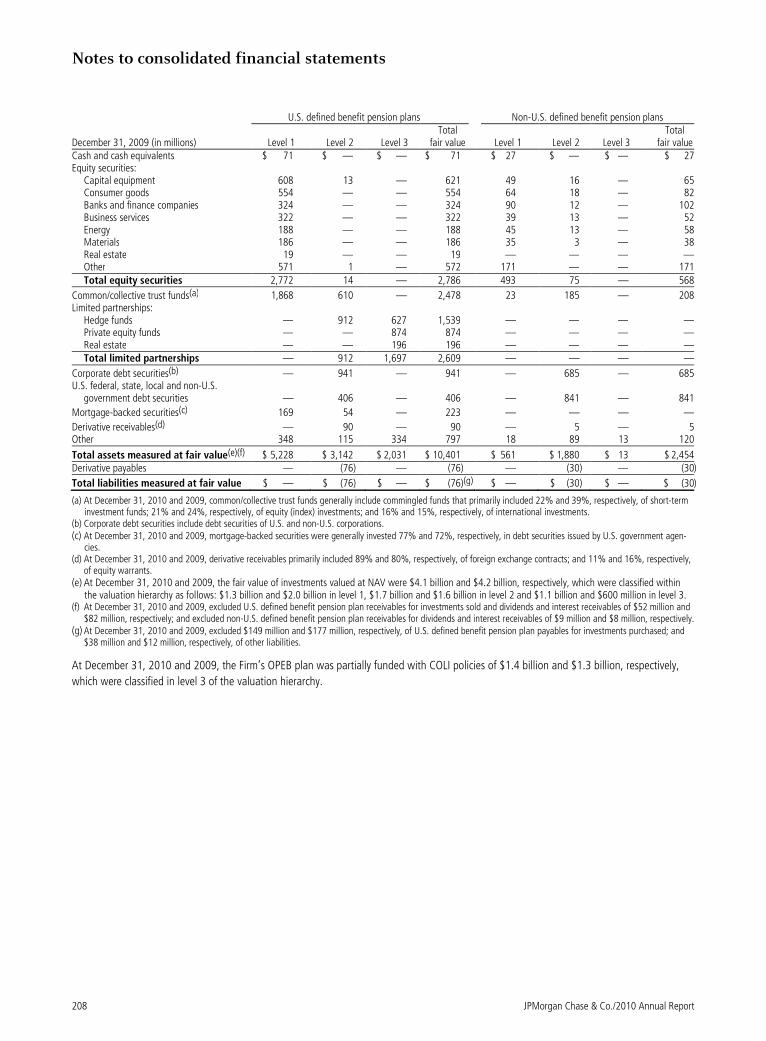
Notes to consolidated financial statements
208 JPMorgan Chase & Co./2010 Annual Report
U.S. defined benefit pension plans Non-U.S. defined benefit pension plans
December 31, 2009 (in millions)
Level 1 Level 2 Level 3 Total
fair value Level 1 Level 2
Level 3 Total fair value
Cash and cash equivalents $ 71 $ — $ — $ 71 $ 27 $ — $ — $ 27Equity securities:
Capital equipment 608 13 — 621 49 16 — 65Consumer goods 554 — — 554 64 18 — 82Banks and finance companies 324 — — 324 90 12 — 102Business services 322 — — 322 39 13 — 52Energy 188 — — 188 45 13 — 58Materials 186 — — 186 35 3 — 38Real estate 19 — — 19 — — — —Other 571 1 — 572 171 — — 171Total equity securities 2,772 14 — 2,786 493 75 — 568
Common/collective trust funds(a) 1,868 610 — 2,478 23 185 — 208Limited partnerships:
Hedge funds — 912 627 1,539 — — — —Private equity funds — — 874 874 — — — —Real estate — — 196 196 — — — —Total limited partnerships — 912 1,697 2,609 — — — —
Corporate debt securities(b) — 941 — 941 — 685 — 685U.S. federal, state, local and non-U.S.
government debt securities — 406 — 406 — 841 — 841
Mortgage-backed securities(c) 169 54 — 223 — — — —
Derivative receivables(d) — 90 — 90 — 5 — 5Other 348 115 334 797 18 89 13 120
Total assets measured at fair value(e)(f) $ 5,228 $ 3,142 $ 2,031 $ 10,401 $ 561 $ 1,880 $ 13 $ 2,454
Derivative payables — (76) — (76) — (30) — (30)
Total liabilities measured at fair value $ — $ (76) $ — $ (76)(g) $ — $ (30) $ — $ (30)
(a) At December 31, 2010 and 2009, common/collective trust funds generally include commingled funds that primarily included 22% and 39%, respectively, of short-term investment funds; 21% and 24%, respectively, of equity (index) investments; and 16% and 15%, respectively, of international investments.
(b) Corporate debt securities include debt securities of U.S. and non-U.S. corporations. (c) At December 31, 2010 and 2009, mortgage-backed securities were generally invested 77% and 72%, respectively, in debt securities issued by U.S. government agen-
cies. (d) At December 31, 2010 and 2009, derivative receivables primarily included 89% and 80%, respectively, of foreign exchange contracts; and 11% and 16%, respectively,
of equity warrants. (e) At December 31, 2010 and 2009, the fair value of investments valued at NAV were $4.1 billion and $4.2 billion, respectively, which were classified within
the valuation hierarchy as follows: $1.3 billion and $2.0 billion in level 1, $1.7 billion and $1.6 billion in level 2 and $1.1 billion and $600 million in level 3. (f) At December 31, 2010 and 2009, excluded U.S. defined benefit pension plan receivables for investments sold and dividends and interest receivables of $52 million and
$82 million, respectively; and excluded non-U.S. defined benefit pension plan receivables for dividends and interest receivables of $9 million and $8 million, respectively. (g) At December 31, 2010 and 2009, excluded $149 million and $177 million, respectively, of U.S. defined benefit pension plan payables for investments purchased; and
$38 million and $12 million, respectively, of other liabilities.
At December 31, 2010 and 2009, the Firm’s OPEB plan was partially funded with COLI policies of $1.4 billion and $1.3 billion, respectively,
which were classified in level 3 of the valuation hierarchy.
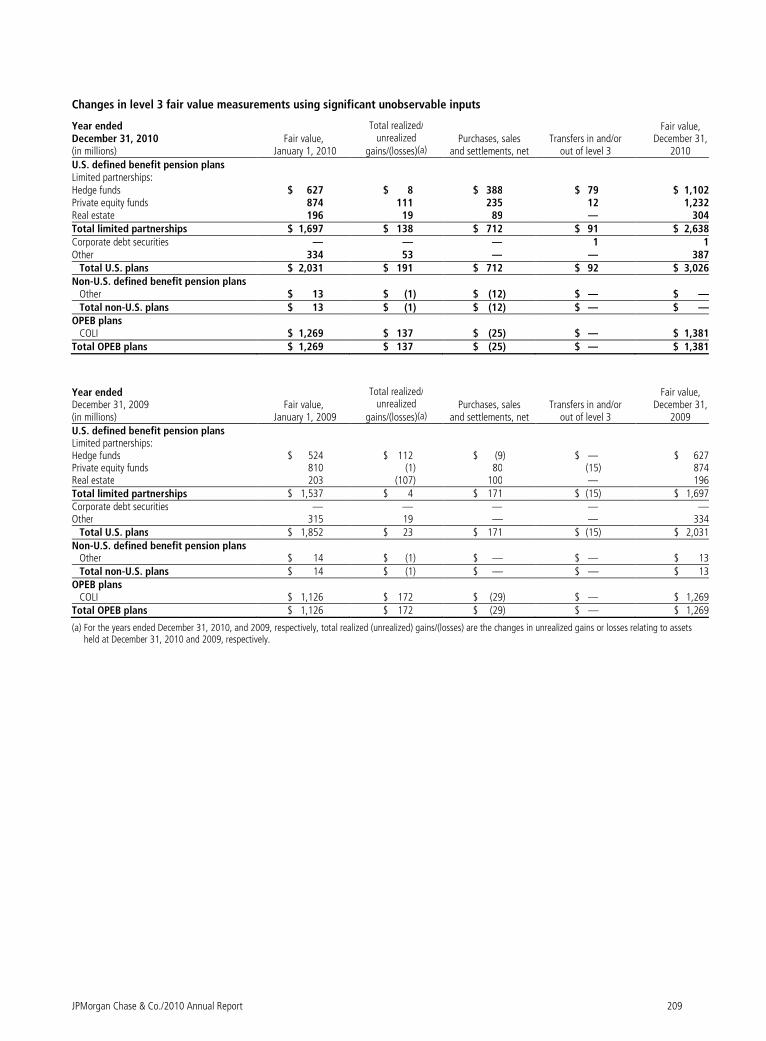
JPMorgan Chase & Co./2010 Annual Report 209
Changes in level 3 fair value measurements using significant unobservable inputs
Year ended December 31, 2010 (in millions)
Fair value, January 1, 2010
Total realized/ unrealized
gains/(losses)(a) Purchases, sales
and settlements, net Transfers in and/or
out of level 3
Fair value, December 31, 2010
U.S. defined benefit pension plans Limited partnerships: Hedge funds $ 627 $ 8 $ 388 $ 79 $ 1,102Private equity funds 874 111 235 12 1,232Real estate 196 19 89 — 304Total limited partnerships $ 1,697 $ 138 $ 712 $ 91 $ 2,638Corporate debt securities — — — 1 1Other 334 53 — — 387 Total U.S. plans $ 2,031 $ 191 $ 712 $ 92 $ 3,026Non-U.S. defined benefit pension plans Other $ 13 $ (1) $ (12) $ — $ — Total non-U.S. plans $ 13 $ (1) $ (12) $ — $ —OPEB plans COLI $ 1,269 $ 137 $ (25) $ — $ 1,381Total OPEB plans $ 1,269 $ 137 $ (25) $ — $ 1,381
Year ended December 31, 2009 (in millions)
Fair value, January 1, 2009
Total realized/ unrealized
gains/(losses)(a) Purchases, sales
and settlements, net Transfers in and/or
out of level 3
Fair value, December 31, 2009
U.S. defined benefit pension plans Limited partnerships: Hedge funds $ 524 $ 112 $ (9) $ — $ 627Private equity funds 810 (1) 80 (15) 874Real estate 203 (107) 100 — 196Total limited partnerships $ 1,537 $ 4 $ 171 $ (15) $ 1,697Corporate debt securities — — — — —Other 315 19 — — 334 Total U.S. plans $ 1,852 $ 23 $ 171 $ (15) $ 2,031Non-U.S. defined benefit pension plans Other $ 14 $ (1) $ — $ — $ 13 Total non-U.S. plans $ 14 $ (1) $ — $ — $ 13OPEB plans COLI $ 1,126 $ 172 $ (29) $ — $ 1,269Total OPEB plans $ 1,126 $ 172 $ (29) $ — $ 1,269
(a) For the years ended December 31, 2010, and 2009, respectively, total realized (unrealized) gains/(losses) are the changes in unrealized gains or losses relating to assets held at December 31, 2010 and 2009, respectively.
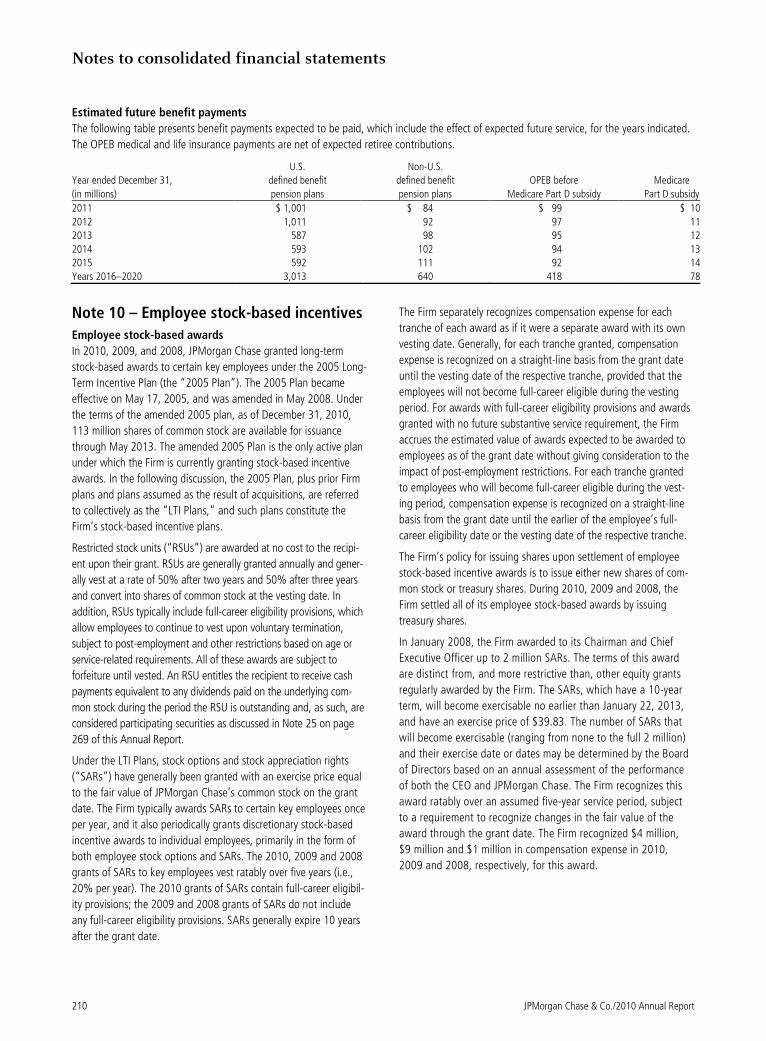
Notes to consolidated financial statements
210 JPMorgan Chase & Co./2010 Annual Report
Estimated future benefit payments
The following table presents benefit payments expected to be paid, which include the effect of expected future service, for the years indicated.
The OPEB medical and life insurance payments are net of expected retiree contributions.
U.S. Non-U.S.
Year ended December 31, defined benefit defined benefit OPEB before Medicare
(in millions) pension plans pension plans Medicare Part D subsidy Part D subsidy
2011 $ 1,001 $ 84 $ 99 $ 10
2012 1,011 92 97 11
2013 587 98 95 12
2014 593 102 94 13
2015 592 111 92 14
Years 2016–2020 3,013 640 418 78
Note 10 – Employee stock-based incentives
Employee stock-based awards
In 2010, 2009, and 2008, JPMorgan Chase granted long-term
stock-based awards to certain key employees under the 2005 Long-
Term Incentive Plan (the “2005 Plan”). The 2005 Plan became
effective on May 17, 2005, and was amended in May 2008. Under
the terms of the amended 2005 plan, as of December 31, 2010,
113 million shares of common stock are available for issuance
through May 2013. The amended 2005 Plan is the only active plan
under which the Firm is currently granting stock-based incentive
awards. In the following discussion, the 2005 Plan, plus prior Firm
plans and plans assumed as the result of acquisitions, are referred
to collectively as the “LTI Plans,” and such plans constitute the
Firm’s stock-based incentive plans.
Restricted stock units (“RSUs”) are awarded at no cost to the recipi-
ent upon their grant. RSUs are generally granted annually and gener-
ally vest at a rate of 50% after two years and 50% after three years
and convert into shares of common stock at the vesting date. In
addition, RSUs typically include full-career eligibility provisions, which
allow employees to continue to vest upon voluntary termination,
subject to post-employment and other restrictions based on age or
service-related requirements. All of these awards are subject to
forfeiture until vested. An RSU entitles the recipient to receive cash
payments equivalent to any dividends paid on the underlying com-
mon stock during the period the RSU is outstanding and, as such, are
considered participating securities as discussed in Note 25 on page
269 of this Annual Report.
Under the LTI Plans, stock options and stock appreciation rights
(“SARs”) have generally been granted with an exercise price equal
to the fair value of JPMorgan Chase’s common stock on the grant
date. The Firm typically awards SARs to certain key employees once
per year, and it also periodically grants discretionary stock-based
incentive awards to individual employees, primarily in the form of
both employee stock options and SARs. The 2010, 2009 and 2008
grants of SARs to key employees vest ratably over five years (i.e.,
20% per year). The 2010 grants of SARs contain full-career eligibil-
ity provisions; the 2009 and 2008 grants of SARs do not include
any full-career eligibility provisions. SARs generally expire 10 years
after the grant date.
The Firm separately recognizes compensation expense for each
tranche of each award as if it were a separate award with its own
vesting date. Generally, for each tranche granted, compensation
expense is recognized on a straight-line basis from the grant date
until the vesting date of the respective tranche, provided that the
employees will not become full-career eligible during the vesting
period. For awards with full-career eligibility provisions and awards
granted with no future substantive service requirement, the Firm
accrues the estimated value of awards expected to be awarded to
employees as of the grant date without giving consideration to the
impact of post-employment restrictions. For each tranche granted
to employees who will become full-career eligible during the vest-
ing period, compensation expense is recognized on a straight-line
basis from the grant date until the earlier of the employee’s full-
career eligibility date or the vesting date of the respective tranche.
The Firm’s policy for issuing shares upon settlement of employee
stock-based incentive awards is to issue either new shares of com-
mon stock or treasury shares. During 2010, 2009 and 2008, the
Firm settled all of its employee stock-based awards by issuing
treasury shares.
In January 2008, the Firm awarded to its Chairman and Chief
Executive Officer up to 2 million SARs. The terms of this award
are distinct from, and more restrictive than, other equity grants
regularly awarded by the Firm. The SARs, which have a 10-year
term, will become exercisable no earlier than January 22, 2013,
and have an exercise price of $39.83. The number of SARs that
will become exercisable (ranging from none to the full 2 million)
and their exercise date or dates may be determined by the Board
of Directors based on an annual assessment of the performance
of both the CEO and JPMorgan Chase. The Firm recognizes this
award ratably over an assumed five-year service period, subject
to a requirement to recognize changes in the fair value of the
award through the grant date. The Firm recognized $4 million,
$9 million and $1 million in compensation expense in 2010,
2009 and 2008, respectively, for this award.
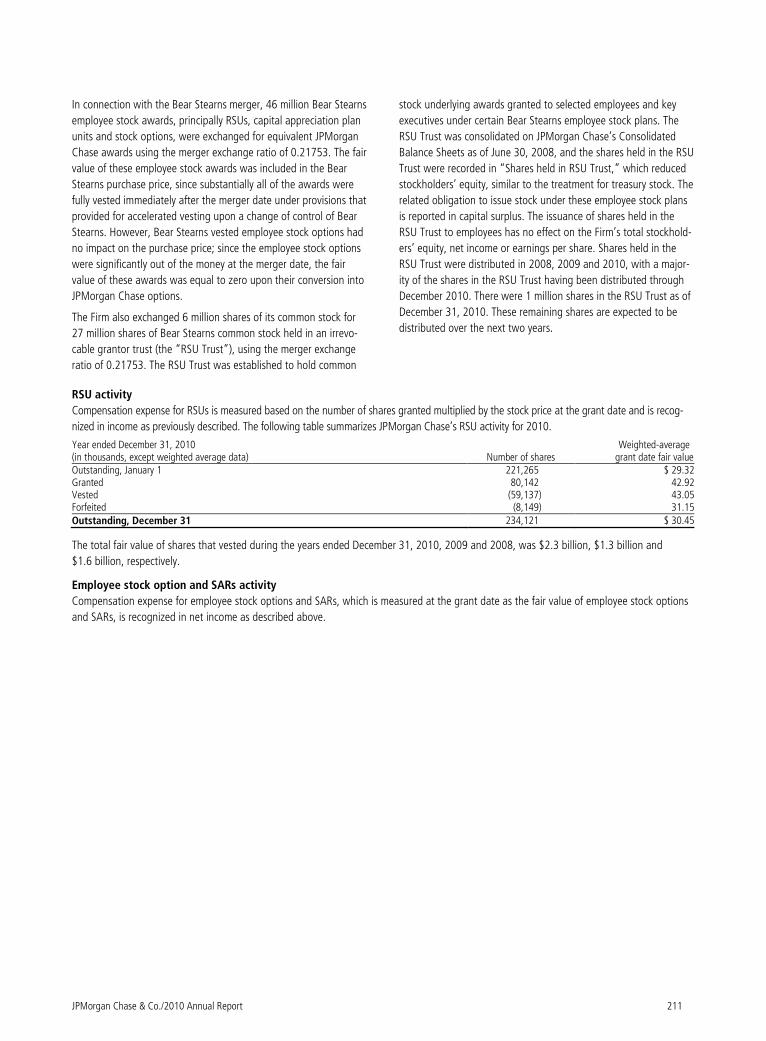
JPMorgan Chase & Co./2010 Annual Report 211
In connection with the Bear Stearns merger, 46 million Bear Stearns
employee stock awards, principally RSUs, capital appreciation plan
units and stock options, were exchanged for equivalent JPMorgan
Chase awards using the merger exchange ratio of 0.21753. The fair
value of these employee stock awards was included in the Bear
Stearns purchase price, since substantially all of the awards were
fully vested immediately after the merger date under provisions that
provided for accelerated vesting upon a change of control of Bear
Stearns. However, Bear Stearns vested employee stock options had
no impact on the purchase price; since the employee stock options
were significantly out of the money at the merger date, the fair
value of these awards was equal to zero upon their conversion into
JPMorgan Chase options.
The Firm also exchanged 6 million shares of its common stock for
27 million shares of Bear Stearns common stock held in an irrevo-
cable grantor trust (the “RSU Trust”), using the merger exchange
ratio of 0.21753. The RSU Trust was established to hold common
stock underlying awards granted to selected employees and key
executives under certain Bear Stearns employee stock plans. The
RSU Trust was consolidated on JPMorgan Chase’s Consolidated
Balance Sheets as of June 30, 2008, and the shares held in the RSU
Trust were recorded in “Shares held in RSU Trust,” which reduced
stockholders’ equity, similar to the treatment for treasury stock. The
related obligation to issue stock under these employee stock plans
is reported in capital surplus. The issuance of shares held in the
RSU Trust to employees has no effect on the Firm’s total stockhold-
ers’ equity, net income or earnings per share. Shares held in the
RSU Trust were distributed in 2008, 2009 and 2010, with a major-
ity of the shares in the RSU Trust having been distributed through
December 2010. There were 1 million shares in the RSU Trust as of
December 31, 2010. These remaining shares are expected to be
distributed over the next two years.
RSU activity
Compensation expense for RSUs is measured based on the number of shares granted multiplied by the stock price at the grant date and is recog-
nized in income as previously described. The following table summarizes JPMorgan Chase’s RSU activity for 2010.
Year ended December 31, 2010 (in thousands, except weighted average data) Number of shares
Weighted-average grant date fair value
Outstanding, January 1 221,265 $ 29.32Granted 80,142 42.92Vested (59,137) 43.05Forfeited (8,149) 31.15Outstanding, December 31 234,121 $ 30.45
The total fair value of shares that vested during the years ended December 31, 2010, 2009 and 2008, was $2.3 billion, $1.3 billion and
$1.6 billion, respectively.
Employee stock option and SARs activity
Compensation expense for employee stock options and SARs, which is measured at the grant date as the fair value of employee stock options
and SARs, is recognized in net income as described above.
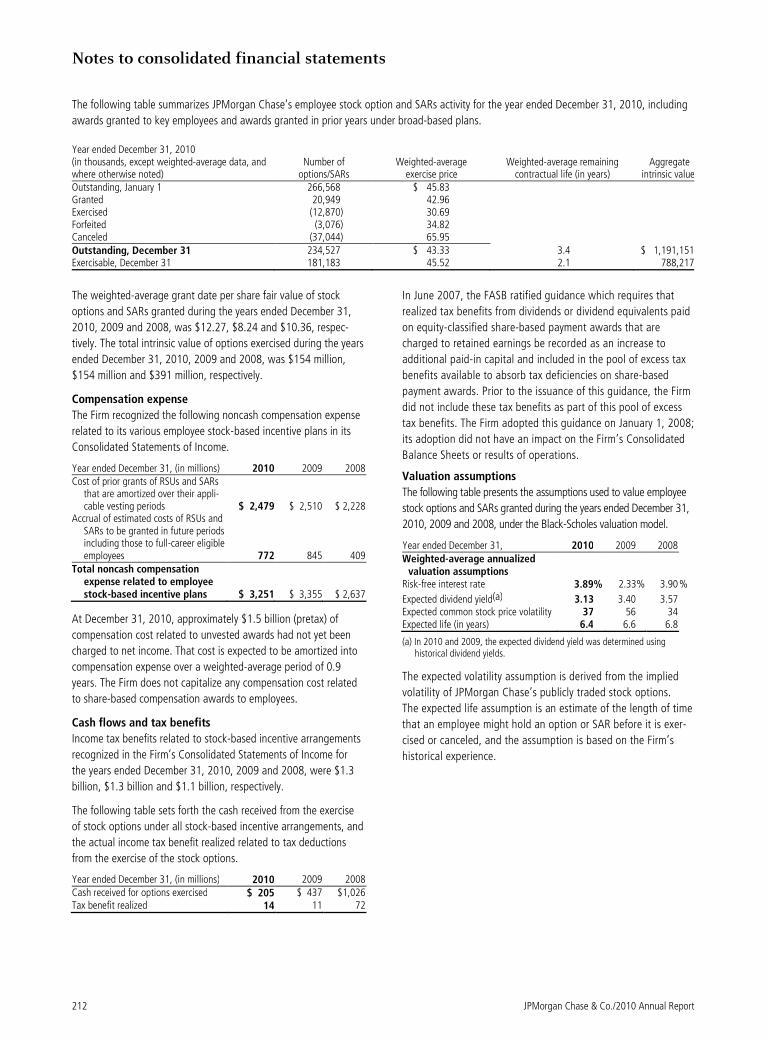
Notes to consolidated financial statements
212 JPMorgan Chase & Co./2010 Annual Report
The following table summarizes JPMorgan Chase’s employee stock option and SARs activity for the year ended December 31, 2010, including
awards granted to key employees and awards granted in prior years under broad-based plans.
Year ended December 31, 2010 (in thousands, except weighted-average data, and where otherwise noted)
Number of options/SARs
Weighted-average exercise price
Weighted-average remaining contractual life (in years)
Aggregate intrinsic value
Outstanding, January 1 266,568 $ 45.83 Granted 20,949 42.96 Exercised (12,870) 30.69 Forfeited (3,076) 34.82 Canceled (37,044) 65.95 Outstanding, December 31 234,527 $ 43.33 3.4 $ 1,191,151Exercisable, December 31 181,183 45.52 2.1 788,217
The weighted-average grant date per share fair value of stock
options and SARs granted during the years ended December 31,
2010, 2009 and 2008, was $12.27, $8.24 and $10.36, respec-
tively. The total intrinsic value of options exercised during the years
ended December 31, 2010, 2009 and 2008, was $154 million,
$154 million and $391 million, respectively.
Compensation expense
The Firm recognized the following noncash compensation expense
related to its various employee stock-based incentive plans in its
Consolidated Statements of Income.
Year ended December 31, (in millions) 2010 2009 2008 Cost of prior grants of RSUs and SARs
that are amortized over their appli-cable vesting periods $ 2,479 $ 2,510 $ 2,228
Accrual of estimated costs of RSUs and SARs to be granted in future periods including those to full-career eligible employees 772 845 409
Total noncash compensation expense related to employee stock-based incentive plans $ 3,251 $ 3,355 $ 2,637
At December 31, 2010, approximately $1.5 billion (pretax) of
compensation cost related to unvested awards had not yet been
charged to net income. That cost is expected to be amortized into
compensation expense over a weighted-average period of 0.9
years. The Firm does not capitalize any compensation cost related
to share-based compensation awards to employees.
Cash flows and tax benefits
Income tax benefits related to stock-based incentive arrangements
recognized in the Firm’s Consolidated Statements of Income for
the years ended December 31, 2010, 2009 and 2008, were $1.3
billion, $1.3 billion and $1.1 billion, respectively.
The following table sets forth the cash received from the exercise
of stock options under all stock-based incentive arrangements, and
the actual income tax benefit realized related to tax deductions
from the exercise of the stock options.
Year ended December 31, (in millions) 2010 2009 2008 Cash received for options exercised $ 205 $ 437 $1,026 Tax benefit realized 14 11 72
In June 2007, the FASB ratified guidance which requires that
realized tax benefits from dividends or dividend equivalents paid
on equity-classified share-based payment awards that are
charged to retained earnings be recorded as an increase to
additional paid-in capital and included in the pool of excess tax
benefits available to absorb tax deficiencies on share-based
payment awards. Prior to the issuance of this guidance, the Firm
did not include these tax benefits as part of this pool of excess
tax benefits. The Firm adopted this guidance on January 1, 2008;
its adoption did not have an impact on the Firm’s Consolidated
Balance Sheets or results of operations.
Valuation assumptions
The following table presents the assumptions used to value employee
stock options and SARs granted during the years ended December 31,
2010, 2009 and 2008, under the Black-Scholes valuation model.
Year ended December 31, 2010 2009 2008 Weighted-average annualized
valuation assumptions Risk-free interest rate 3.89% 2.33% 3.90 %
Expected dividend yield(a) 3.13 3.40 3.57 Expected common stock price volatility
37 56 34
Expected life (in years) 6.4 6.6 6.8
(a) In 2010 and 2009, the expected dividend yield was determined using historical dividend yields.
The expected volatility assumption is derived from the implied
volatility of JPMorgan Chase’s publicly traded stock options.
The expected life assumption is an estimate of the length of time
that an employee might hold an option or SAR before it is exer-
cised or canceled, and the assumption is based on the Firm’s
historical experience.
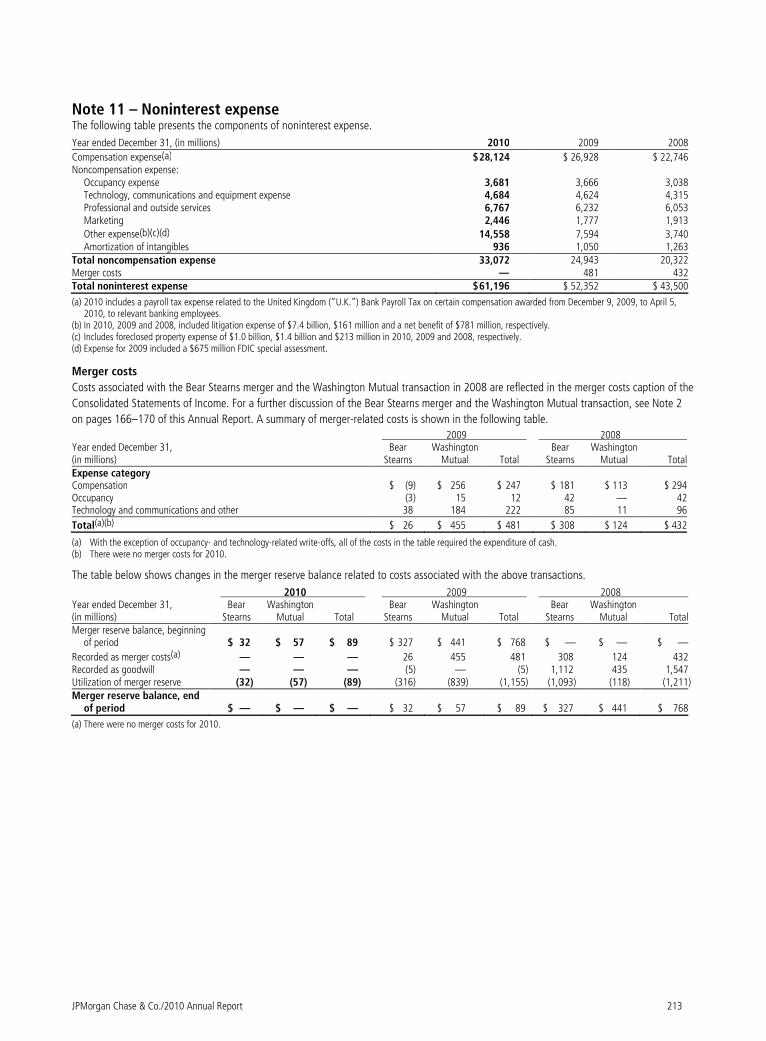
JPMorgan Chase & Co./2010 Annual Report 213
Note 11 – Noninterest expense The following table presents the components of noninterest expense.
Year ended December 31, (in millions) 2010 2009 2008
Compensation expense(a) $ 28,124 $ 26,928 $ 22,746Noncompensation expense:
Occupancy expense 3,681 3,666 3,038Technology, communications and equipment expense 4,684 4,624 4,315Professional and outside services 6,767 6,232 6,053Marketing 2,446 1,777 1,913
Other expense(b)(c)(d) 14,558 7,594 3,740Amortization of intangibles 936 1,050 1,263
Total noncompensation expense 33,072 24,943 20,322Merger costs — 481 432Total noninterest expense $ 61,196 $ 52,352 $ 43,500
(a) 2010 includes a payroll tax expense related to the United Kingdom (“U.K.”) Bank Payroll Tax on certain compensation awarded from December 9, 2009, to April 5, 2010, to relevant banking employees.
(b) In 2010, 2009 and 2008, included litigation expense of $7.4 billion, $161 million and a net benefit of $781 million, respectively. (c) Includes foreclosed property expense of $1.0 billion, $1.4 billion and $213 million in 2010, 2009 and 2008, respectively. (d) Expense for 2009 included a $675 million FDIC special assessment.
Merger costs
Costs associated with the Bear Stearns merger and the Washington Mutual transaction in 2008 are reflected in the merger costs caption of the
Consolidated Statements of Income. For a further discussion of the Bear Stearns merger and the Washington Mutual transaction, see Note 2
on pages 166–170 of this Annual Report. A summary of merger-related costs is shown in the following table.
2009 2008 Year ended December 31, (in millions)
Bear Stearns
Washington Mutual Total
Bear Stearns
Washington Mutual Total
Expense category Compensation $ (9) $ 256 $ 247 $ 181 $ 113 $ 294 Occupancy (3) 15 12 42 — 42 Technology and communications and other 38 184 222 85 11 96
Total(a)(b) $ 26 $ 455 $ 481 $ 308 $ 124 $ 432
(a) With the exception of occupancy- and technology-related write-offs, all of the costs in the table required the expenditure of cash. (b) There were no merger costs for 2010.
The table below shows changes in the merger reserve balance related to costs associated with the above transactions.
2010 2009 2008 Year ended December 31, (in millions)
Bear Stearns
Washington Mutual Total
Bear Stearns
Washington Mutual Total
Bear Stearns
Washington Mutual Total
Merger reserve balance, beginning of period $ 32 $ 57 $ 89 $ 327 $ 441 $ 768 $ — $ — $ —
Recorded as merger costs(a) — — — 26 455 481 308 124 432Recorded as goodwill — — — (5) — (5) 1,112 435 1,547 Utilization of merger reserve (32) (57) (89) (316) (839) (1,155) (1,093) (118) (1,211) Merger reserve balance, end
of period $ — $ — $ — $ 32 $ 57 $ 89 $ 327 $ 441 $ 768
(a) There were no merger costs for 2010.
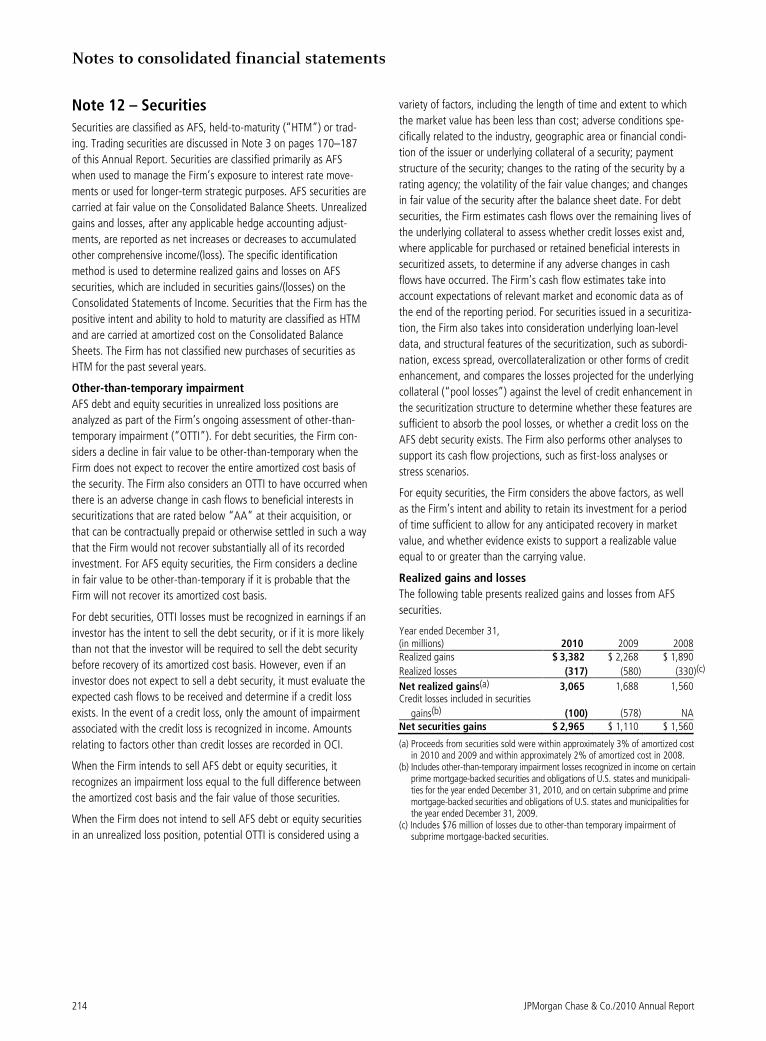
Notes to consolidated financial statements
214 JPMorgan Chase & Co./2010 Annual Report
Note 12 – Securities
Securities are classified as AFS, held-to-maturity (“HTM”) or trad-
ing. Trading securities are discussed in Note 3 on pages 170–187
of this Annual Report. Securities are classified primarily as AFS
when used to manage the Firm’s exposure to interest rate move-
ments or used for longer-term strategic purposes. AFS securities are
carried at fair value on the Consolidated Balance Sheets. Unrealized
gains and losses, after any applicable hedge accounting adjust-
ments, are reported as net increases or decreases to accumulated
other comprehensive income/(loss). The specific identification
method is used to determine realized gains and losses on AFS
securities, which are included in securities gains/(losses) on the
Consolidated Statements of Income. Securities that the Firm has the
positive intent and ability to hold to maturity are classified as HTM
and are carried at amortized cost on the Consolidated Balance
Sheets. The Firm has not classified new purchases of securities as
HTM for the past several years.
Other-than-temporary impairment
AFS debt and equity securities in unrealized loss positions are
analyzed as part of the Firm’s ongoing assessment of other-than-
temporary impairment (“OTTI”). For debt securities, the Firm con-
siders a decline in fair value to be other-than-temporary when the
Firm does not expect to recover the entire amortized cost basis of
the security. The Firm also considers an OTTI to have occurred when
there is an adverse change in cash flows to beneficial interests in
securitizations that are rated below “AA” at their acquisition, or
that can be contractually prepaid or otherwise settled in such a way
that the Firm would not recover substantially all of its recorded
investment. For AFS equity securities, the Firm considers a decline
in fair value to be other-than-temporary if it is probable that the
Firm will not recover its amortized cost basis.
For debt securities, OTTI losses must be recognized in earnings if an
investor has the intent to sell the debt security, or if it is more likely
than not that the investor will be required to sell the debt security
before recovery of its amortized cost basis. However, even if an
investor does not expect to sell a debt security, it must evaluate the
expected cash flows to be received and determine if a credit loss
exists. In the event of a credit loss, only the amount of impairment
associated with the credit loss is recognized in income. Amounts
relating to factors other than credit losses are recorded in OCI.
When the Firm intends to sell AFS debt or equity securities, it
recognizes an impairment loss equal to the full difference between
the amortized cost basis and the fair value of those securities.
When the Firm does not intend to sell AFS debt or equity securities
in an unrealized loss position, potential OTTI is considered using a
variety of factors, including the length of time and extent to which
the market value has been less than cost; adverse conditions spe-
cifically related to the industry, geographic area or financial condi-
tion of the issuer or underlying collateral of a security; payment
structure of the security; changes to the rating of the security by a
rating agency; the volatility of the fair value changes; and changes
in fair value of the security after the balance sheet date. For debt
securities, the Firm estimates cash flows over the remaining lives of
the underlying collateral to assess whether credit losses exist and,
where applicable for purchased or retained beneficial interests in
securitized assets, to determine if any adverse changes in cash
flows have occurred. The Firm’s cash flow estimates take into
account expectations of relevant market and economic data as of
the end of the reporting period. For securities issued in a securitiza-
tion, the Firm also takes into consideration underlying loan-level
data, and structural features of the securitization, such as subordi-
nation, excess spread, overcollateralization or other forms of credit
enhancement, and compares the losses projected for the underlying
collateral (“pool losses”) against the level of credit enhancement in
the securitization structure to determine whether these features are
sufficient to absorb the pool losses, or whether a credit loss on the
AFS debt security exists. The Firm also performs other analyses to
support its cash flow projections, such as first-loss analyses or
stress scenarios.
For equity securities, the Firm considers the above factors, as well
as the Firm’s intent and ability to retain its investment for a period
of time sufficient to allow for any anticipated recovery in market
value, and whether evidence exists to support a realizable value
equal to or greater than the carrying value.
Realized gains and losses
The following table presents realized gains and losses from AFS
securities.
Year ended December 31, (in millions) 2010 2009 2008 Realized gains $ 3,382 $ 2,268 $ 1,890
Realized losses (317) (580) (330 )(c)
Net realized gains(a) 3,065 1,688 1,560 Credit losses included in securities
gains(b) (100) (578) NA Net securities gains $ 2,965 $ 1,110 $ 1,560
(a) Proceeds from securities sold were within approximately 3% of amortized cost in 2010 and 2009 and within approximately 2% of amortized cost in 2008.
(b) Includes other-than-temporary impairment losses recognized in income on certain prime mortgage-backed securities and obligations of U.S. states and municipali-ties for the year ended December 31, 2010, and on certain subprime and prime mortgage-backed securities and obligations of U.S. states and municipalities for the year ended December 31, 2009.
(c) Includes $76 million of losses due to other-than temporary impairment of subprime mortgage-backed securities.
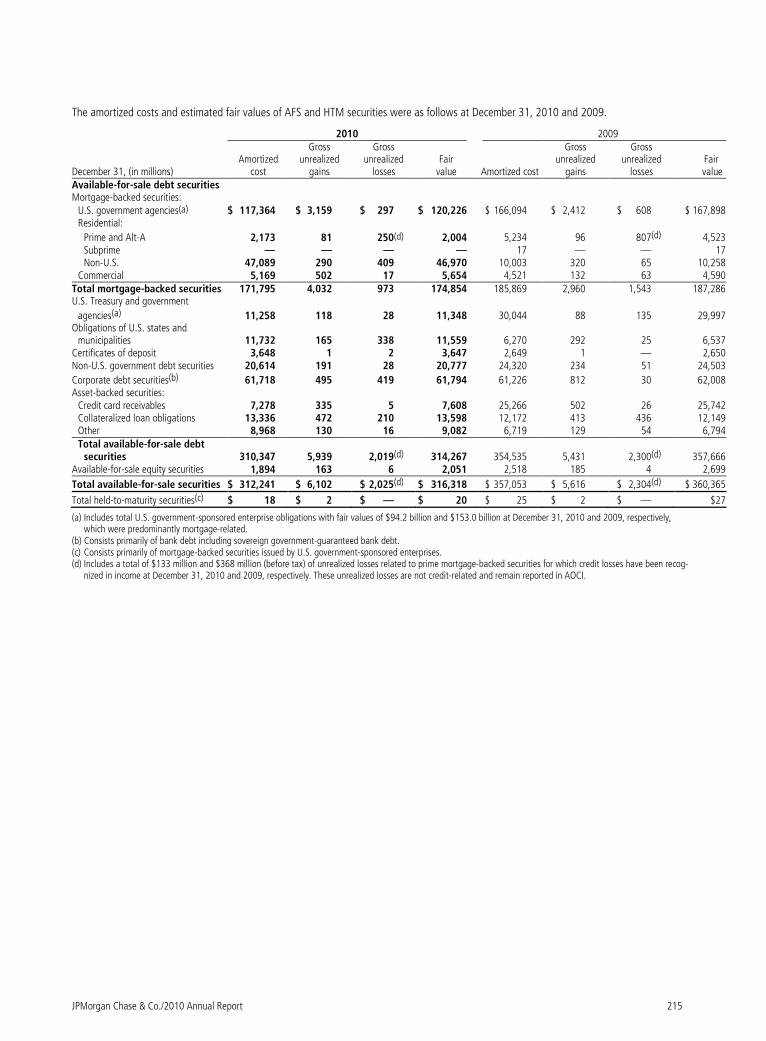
JPMorgan Chase & Co./2010 Annual Report 215
The amortized costs and estimated fair values of AFS and HTM securities were as follows at December 31, 2010 and 2009.
2010 2009
December 31, (in millions) Amortized
cost
Gross unrealized
gains
Gross unrealized
losses Fair
value Amortized cost
Gross unrealized
gains
Gross unrealized
losses Fair. value
Available-for-sale debt securities Mortgage-backed securities:
U.S. government agencies(a) $ 117,364 $ 3,159 $ 297 $ 120,226 $ 166,094 $ 2,412 $ 608 $ 167,898 Residential:
Prime and Alt-A 2,173 81 250(d) 2,004 5,234 96 807(d) 4,523 Subprime — — — — 17 — — 17 Non-U.S. 47,089 290 409 46,970 10,003 320 65 10,258
Commercial 5,169 502 17 5,654 4,521 132 63 4,590 Total mortgage-backed securities 171,795 4,032 973 174,854 185,869 2,960 1,543 187,286 U.S. Treasury and government
agencies(a) 11,258 118 28 11,348 30,044 88 135 29,997 Obligations of U.S. states and
municipalities 11,732 165 338 11,559 6,270 292 25 6,537 Certificates of deposit 3,648 1 2 3,647 2,649 1 — 2,650 Non-U.S. government debt securities 20,614 191 28 20,777 24,320 234 51 24,503
Corporate debt securities(b) 61,718 495 419 61,794 61,226 812 30 62,008 Asset-backed securities:
Credit card receivables 7,278 335 5 7,608 25,266 502 26 25,742 Collateralized loan obligations 13,336 472 210 13,598 12,172 413 436 12,149 Other 8,968 130 16 9,082 6,719 129 54 6,794 Total available-for-sale debt
securities 310,347 5,939 2,019(d) 314,267 354,535 5,431 2,300(d) 357,666 Available-for-sale equity securities 1,894 163 6 2,051 2,518 185 4 2,699
Total available-for-sale securities $ 312,241 $ 6,102 $ 2,025(d) $ 316,318 $ 357,053 $ 5,616 $ 2,304(d) $ 360,365
Total held-to-maturity securities(c) $ 18 $ 2 $ — $ 20 $ 25 $ 2 $ — $27
(a) Includes total U.S. government-sponsored enterprise obligations with fair values of $94.2 billion and $153.0 billion at December 31, 2010 and 2009, respectively, which were predominantly mortgage-related.
(b) Consists primarily of bank debt including sovereign government-guaranteed bank debt. (c) Consists primarily of mortgage-backed securities issued by U.S. government-sponsored enterprises. (d) Includes a total of $133 million and $368 million (before tax) of unrealized losses related to prime mortgage-backed securities for which credit losses have been recog-
nized in income at December 31, 2010 and 2009, respectively. These unrealized losses are not credit-related and remain reported in AOCI.
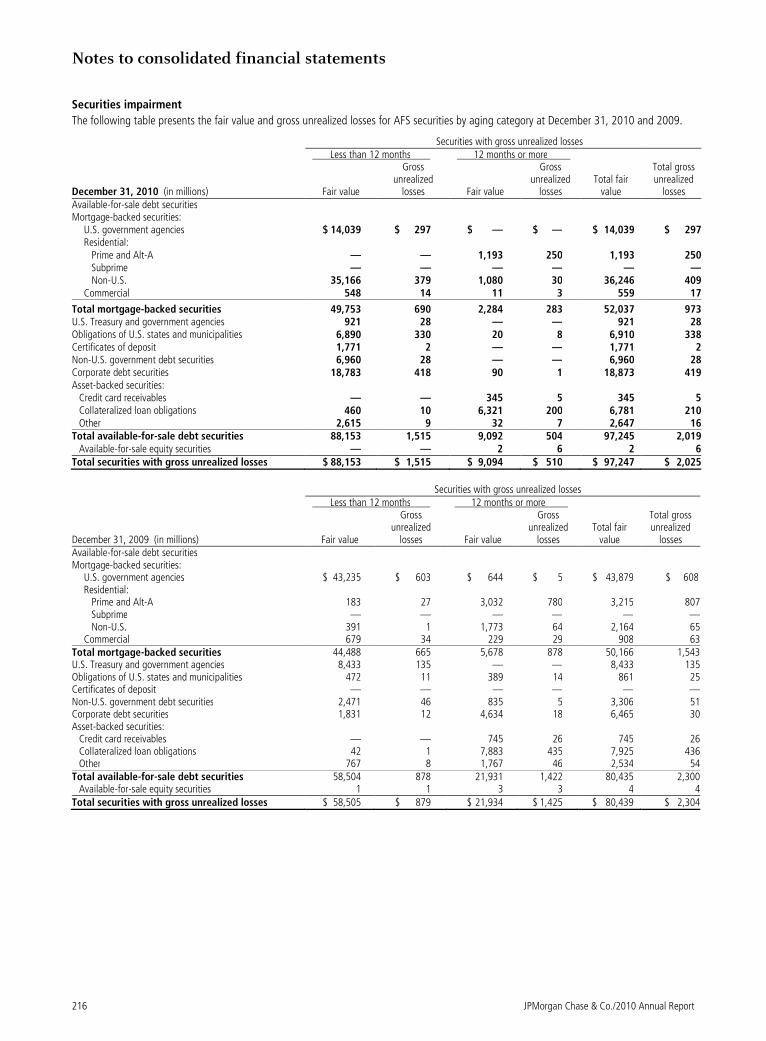
Notes to consolidated financial statements
216 JPMorgan Chase & Co./2010 Annual Report
Securities impairment
The following table presents the fair value and gross unrealized losses for AFS securities by aging category at December 31, 2010 and 2009.
Securities with gross unrealized losses Less than 12 months 12 months or more
December 31, 2010 (in millions) Fair value
Gross unrealized
losses Fair value
Gross unrealized
losses Total fair
value
Total gross unrealized
losses Available-for-sale debt securities Mortgage-backed securities:
U.S. government agencies $ 14,039 $ 297 $ — $ — $ 14,039 $ 297Residential: Prime and Alt-A — — 1,193 250 1,193 250 Subprime — — — — — — Non-U.S. 35,166 379 1,080 30 36,246 409Commercial 548 14 11 3 559 17
Total mortgage-backed securities 49,753 690 2,284 283 52,037 973U.S. Treasury and government agencies 921 28 — — 921 28Obligations of U.S. states and municipalities 6,890 330 20 8 6,910 338Certificates of deposit 1,771 2 — — 1,771 2Non-U.S. government debt securities 6,960 28 — — 6,960 28Corporate debt securities 18,783 418 90 1 18,873 419Asset-backed securities:
Credit card receivables — — 345 5 345 5Collateralized loan obligations 460 10 6,321 200 6,781 210Other 2,615 9 32 7 2,647 16
Total available-for-sale debt securities 88,153 1,515 9,092 504 97,245 2,019Available-for-sale equity securities — — 2 6 2 6
Total securities with gross unrealized losses $ 88,153 $ 1,515 $ 9,094 $ 510 $ 97,247 $ 2,025
Securities with gross unrealized losses Less than 12 months 12 months or more
December 31, 2009 (in millions) Fair value
Gross unrealized
losses Fair value
Gross unrealized
losses Total fair
value
Total gross unrealized
losses Available-for-sale debt securities Mortgage-backed securities:
U.S. government agencies $ 43,235 $ 603 $ 644 $ 5 $ 43,879 $ 608 Residential: Prime and Alt-A 183 27 3,032 780 3,215 807 Subprime — — — — — — Non-U.S. 391 1 1,773 64 2,164 65 Commercial 679 34 229 29 908 63
Total mortgage-backed securities 44,488 665 5,678 878 50,166 1,543 U.S. Treasury and government agencies 8,433 135 — — 8,433 135 Obligations of U.S. states and municipalities 472 11 389 14 861 25 Certificates of deposit — — — — — — Non-U.S. government debt securities 2,471 46 835 5 3,306 51 Corporate debt securities 1,831 12 4,634 18 6,465 30 Asset-backed securities:
Credit card receivables — — 745 26 745 26 Collateralized loan obligations 42 1 7,883 435 7,925 436 Other 767 8 1,767 46 2,534 54
Total available-for-sale debt securities 58,504 878 21,931 1,422 80,435 2,300 Available-for-sale equity securities 1 1 3 3 4 4
Total securities with gross unrealized losses $ 58,505 $ 879 $ 21,934 $ 1,425 $ 80,439 $ 2,304
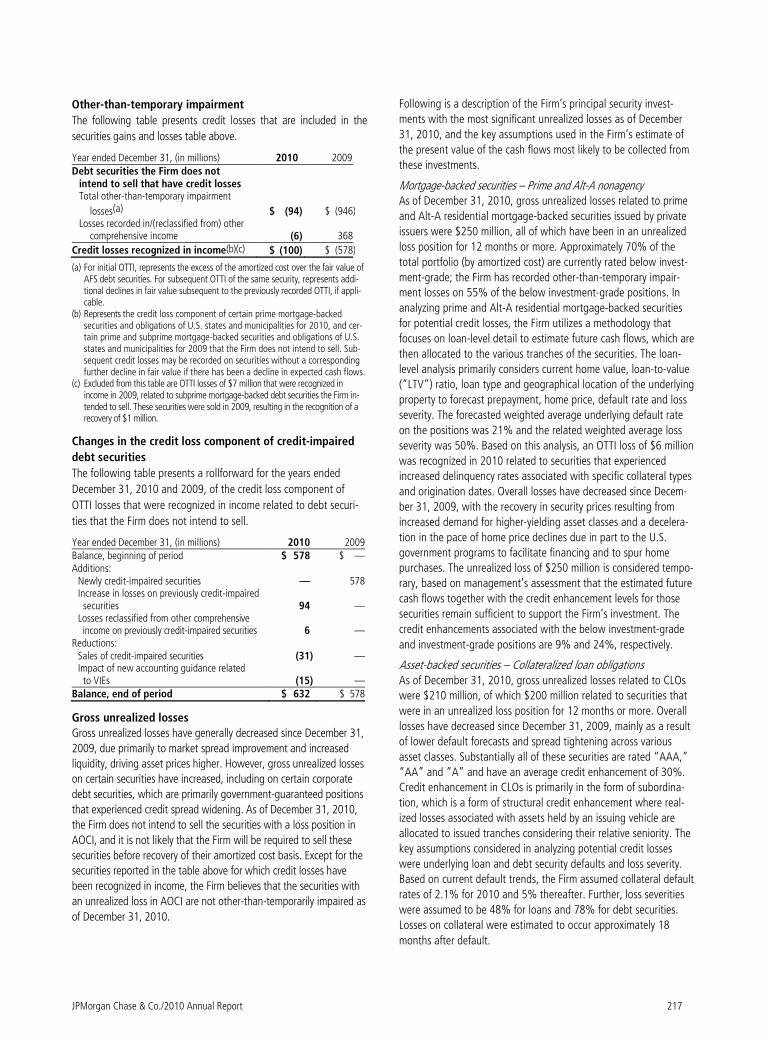
JPMorgan Chase & Co./2010 Annual Report 217
Other-than-temporary impairment
The following table presents credit losses that are included in the
securities gains and losses table above.
Year ended December 31, (in millions) 2010 2009 Debt securities the Firm does not
intend to sell that have credit losses Total other-than-temporary impairment
losses(a) $ (94) $ (946 ) Losses recorded in/(reclassified from) other
comprehensive income (6) 368
Credit losses recognized in income(b)(c) $ (100) $ (578 )
(a) For initial OTTI, represents the excess of the amortized cost over the fair value of AFS debt securities. For subsequent OTTI of the same security, represents addi-tional declines in fair value subsequent to the previously recorded OTTI, if appli-cable.
(b) Represents the credit loss component of certain prime mortgage-backed securities and obligations of U.S. states and municipalities for 2010, and cer-tain prime and subprime mortgage-backed securities and obligations of U.S. states and municipalities for 2009 that the Firm does not intend to sell. Sub-sequent credit losses may be recorded on securities without a corresponding further decline in fair value if there has been a decline in expected cash flows.
(c) Excluded from this table are OTTI losses of $7 million that were recognized in income in 2009, related to subprime mortgage-backed debt securities the Firm in-tended to sell. These securities were sold in 2009, resulting in the recognition of a recovery of $1 million.
Changes in the credit loss component of credit-impaired
debt securities
The following table presents a rollforward for the years ended
December 31, 2010 and 2009, of the credit loss component of
OTTI losses that were recognized in income related to debt securi-
ties that the Firm does not intend to sell.
Year ended December 31, (in millions) 2010 2009 Balance, beginning of period $ 578 $ — Additions:
Newly credit-impaired securities — 578 Increase in losses on previously credit-impaired securities 94 — Losses reclassified from other comprehensive income on previously credit-impaired securities 6 —
Reductions: Sales of credit-impaired securities (31) — Impact of new accounting guidance related to VIEs (15) —
Balance, end of period $ 632 $ 578
Gross unrealized losses
Gross unrealized losses have generally decreased since December 31,
2009, due primarily to market spread improvement and increased
liquidity, driving asset prices higher. However, gross unrealized losses
on certain securities have increased, including on certain corporate
debt securities, which are primarily government-guaranteed positions
that experienced credit spread widening. As of December 31, 2010,
the Firm does not intend to sell the securities with a loss position in
AOCI, and it is not likely that the Firm will be required to sell these
securities before recovery of their amortized cost basis. Except for the
securities reported in the table above for which credit losses have
been recognized in income, the Firm believes that the securities with
an unrealized loss in AOCI are not other-than-temporarily impaired as
of December 31, 2010.
Following is a description of the Firm’s principal security invest-
ments with the most significant unrealized losses as of December
31, 2010, and the key assumptions used in the Firm’s estimate of
the present value of the cash flows most likely to be collected from
these investments.
Mortgage-backed securities – Prime and Alt-A nonagency As of December 31, 2010, gross unrealized losses related to prime
and Alt-A residential mortgage-backed securities issued by private
issuers were $250 million, all of which have been in an unrealized
loss position for 12 months or more. Approximately 70% of the
total portfolio (by amortized cost) are currently rated below invest-
ment-grade; the Firm has recorded other-than-temporary impair-
ment losses on 55% of the below investment-grade positions. In
analyzing prime and Alt-A residential mortgage-backed securities
for potential credit losses, the Firm utilizes a methodology that
focuses on loan-level detail to estimate future cash flows, which are
then allocated to the various tranches of the securities. The loan-
level analysis primarily considers current home value, loan-to-value
(“LTV”) ratio, loan type and geographical location of the underlying
property to forecast prepayment, home price, default rate and loss
severity. The forecasted weighted average underlying default rate
on the positions was 21% and the related weighted average loss
severity was 50%. Based on this analysis, an OTTI loss of $6 million
was recognized in 2010 related to securities that experienced
increased delinquency rates associated with specific collateral types
and origination dates. Overall losses have decreased since Decem-
ber 31, 2009, with the recovery in security prices resulting from
increased demand for higher-yielding asset classes and a decelera-
tion in the pace of home price declines due in part to the U.S.
government programs to facilitate financing and to spur home
purchases. The unrealized loss of $250 million is considered tempo-
rary, based on management’s assessment that the estimated future
cash flows together with the credit enhancement levels for those
securities remain sufficient to support the Firm’s investment. The
credit enhancements associated with the below investment-grade
and investment-grade positions are 9% and 24%, respectively.
Asset-backed securities – Collateralized loan obligations As of December 31, 2010, gross unrealized losses related to CLOs
were $210 million, of which $200 million related to securities that
were in an unrealized loss position for 12 months or more. Overall
losses have decreased since December 31, 2009, mainly as a result
of lower default forecasts and spread tightening across various
asset classes. Substantially all of these securities are rated “AAA,”
“AA” and “A” and have an average credit enhancement of 30%.
Credit enhancement in CLOs is primarily in the form of subordina-
tion, which is a form of structural credit enhancement where real-
ized losses associated with assets held by an issuing vehicle are
allocated to issued tranches considering their relative seniority. The
key assumptions considered in analyzing potential credit losses
were underlying loan and debt security defaults and loss severity.
Based on current default trends, the Firm assumed collateral default
rates of 2.1% for 2010 and 5% thereafter. Further, loss severities
were assumed to be 48% for loans and 78% for debt securities.
Losses on collateral were estimated to occur approximately 18
months after default.
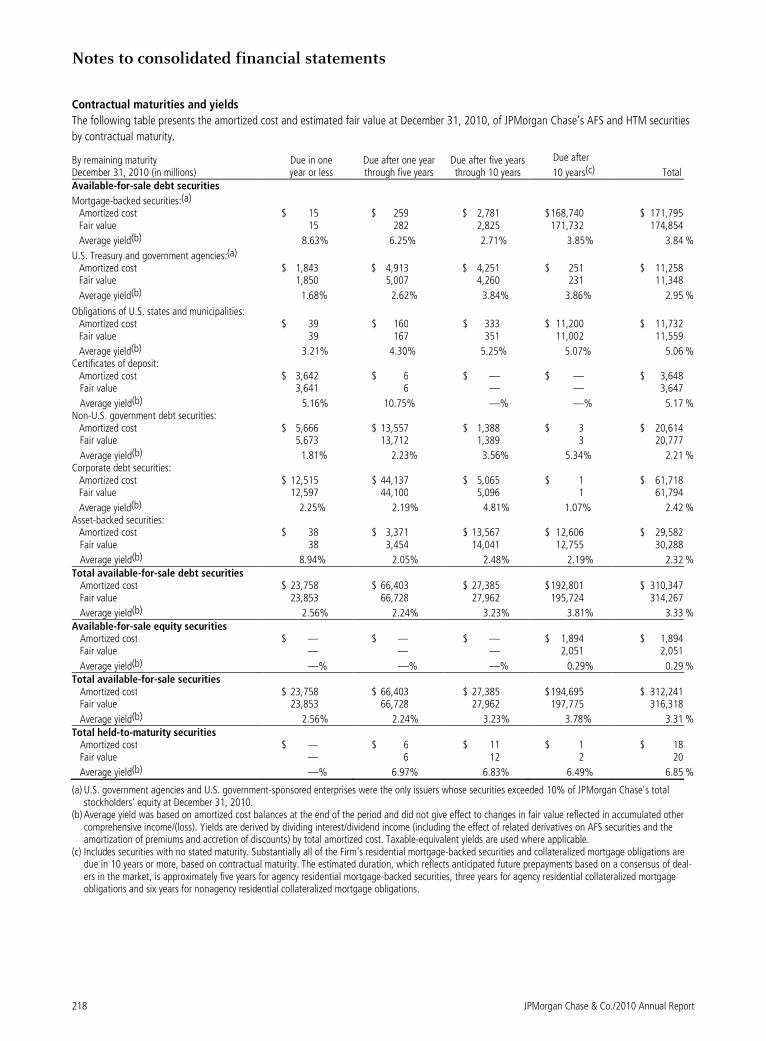
Notes to consolidated financial statements
218 JPMorgan Chase & Co./2010 Annual Report
Contractual maturities and yields
The following table presents the amortized cost and estimated fair value at December 31, 2010, of JPMorgan Chase’s AFS and HTM securities
by contractual maturity.
By remaining maturity December 31, 2010 (in millions)
Due in one year or less
Due after one year through five years
Due after five years through 10 years
Due after
10 years(c) Total Available-for-sale debt securities
Mortgage-backed securities:(a) Amortized cost $ 15 $ 259 $ 2,781 $ 168,740 $ 171,795 Fair value 15 282 2,825 171,732 174,854
Average yield(b) 8.63% 6.25% 2.71% 3.85% 3.84 %
U.S. Treasury and government agencies:(a) Amortized cost $ 1,843 $ 4,913 $ 4,251 $ 251 $ 11,258 Fair value 1,850 5,007 4,260 231 11,348
Average yield(b) 1.68% 2.62% 3.84% 3.86% 2.95 %
Obligations of U.S. states and municipalities: Amortized cost $ 39 $ 160 $ 333 $ 11,200 $ 11,732 Fair value 39 167 351 11,002 11,559
Average yield(b) 3.21% 4.30% 5.25% 5.07% 5.06 % Certificates of deposit:
Amortized cost $ 3,642 $ 6 $ — $ — $ 3,648 Fair value 3,641 6 — — 3,647
Average yield(b) 5.16% 10.75% —% —% 5.17 % Non-U.S. government debt securities:
Amortized cost $ 5,666 $ 13,557 $ 1,388 $ 3 $ 20,614 Fair value 5,673 13,712 1,389 3 20,777
Average yield(b) 1.81% 2.23% 3.56% 5.34% 2.21 % Corporate debt securities:
Amortized cost $ 12,515 $ 44,137 $ 5,065 $ 1 $ 61,718 Fair value 12,597 44,100 5,096 1 61,794
Average yield(b) 2.25% 2.19% 4.81% 1.07% 2.42 % Asset-backed securities:
Amortized cost $ 38 $ 3,371 $ 13,567 $ 12,606 $ 29,582 Fair value 38 3,454 14,041 12,755 30,288
Average yield(b) 8.94% 2.05% 2.48% 2.19% 2.32 % Total available-for-sale debt securities
Amortized cost $ 23,758 $ 66,403 $ 27,385 $ 192,801 $ 310,347 Fair value 23,853 66,728 27,962 195,724 314,267
Average yield(b) 2.56% 2.24% 3.23% 3.81% 3.33 % Available-for-sale equity securities
Amortized cost $ — $ — $ — $ 1,894 $ 1,894 Fair value — — — 2,051 2,051
Average yield(b) —% —% —% 0.29% 0.29 % Total available-for-sale securities
Amortized cost $ 23,758 $ 66,403 $ 27,385 $ 194,695 $ 312,241 Fair value 23,853 66,728 27,962 197,775 316,318
Average yield(b) 2.56% 2.24% 3.23% 3.78% 3.31 % Total held-to-maturity securities
Amortized cost $ — $ 6 $ 11 $ 1 $ 18 Fair value — 6 12 2 20
Average yield(b) —% 6.97% 6.83% 6.49% 6.85 %
(a) U.S. government agencies and U.S. government-sponsored enterprises were the only issuers whose securities exceeded 10% of JPMorgan Chase’s total stockholders’ equity at December 31, 2010.
(b) Average yield was based on amortized cost balances at the end of the period and did not give effect to changes in fair value reflected in accumulated other comprehensive income/(loss). Yields are derived by dividing interest/dividend income (including the effect of related derivatives on AFS securities and the amortization of premiums and accretion of discounts) by total amortized cost. Taxable-equivalent yields are used where applicable.
(c) Includes securities with no stated maturity. Substantially all of the Firm’s residential mortgage-backed securities and collateralized mortgage obligations are due in 10 years or more, based on contractual maturity. The estimated duration, which reflects anticipated future prepayments based on a consensus of deal-ers in the market, is approximately five years for agency residential mortgage-backed securities, three years for agency residential collateralized mortgage obligations and six years for nonagency residential collateralized mortgage obligations.
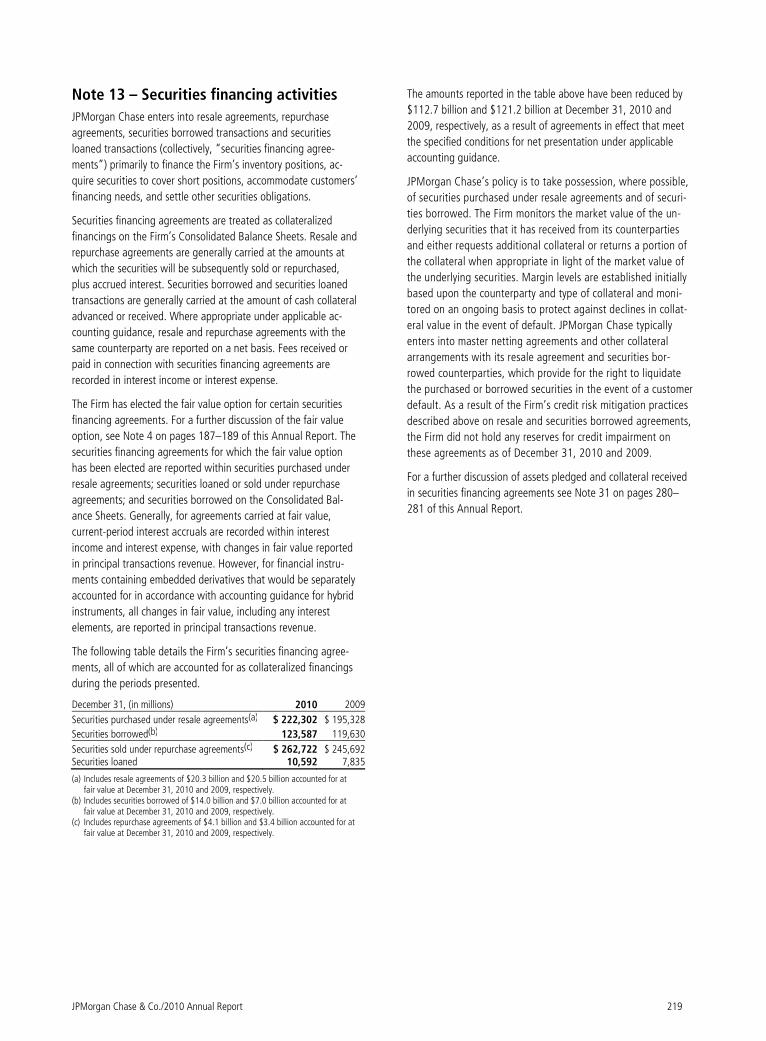
JPMorgan Chase & Co./2010 Annual Report 219
Note 13 – Securities financing activities
JPMorgan Chase enters into resale agreements, repurchase
agreements, securities borrowed transactions and securities
loaned transactions (collectively, “securities financing agree-
ments”) primarily to finance the Firm’s inventory positions, ac-
quire securities to cover short positions, accommodate customers’
financing needs, and settle other securities obligations.
Securities financing agreements are treated as collateralized
financings on the Firm’s Consolidated Balance Sheets. Resale and
repurchase agreements are generally carried at the amounts at
which the securities will be subsequently sold or repurchased,
plus accrued interest. Securities borrowed and securities loaned
transactions are generally carried at the amount of cash collateral
advanced or received. Where appropriate under applicable ac-
counting guidance, resale and repurchase agreements with the
same counterparty are reported on a net basis. Fees received or
paid in connection with securities financing agreements are
recorded in interest income or interest expense.
The Firm has elected the fair value option for certain securities
financing agreements. For a further discussion of the fair value
option, see Note 4 on pages 187–189 of this Annual Report. The
securities financing agreements for which the fair value option
has been elected are reported within securities purchased under
resale agreements; securities loaned or sold under repurchase
agreements; and securities borrowed on the Consolidated Bal-
ance Sheets. Generally, for agreements carried at fair value,
current-period interest accruals are recorded within interest
income and interest expense, with changes in fair value reported
in principal transactions revenue. However, for financial instru-
ments containing embedded derivatives that would be separately
accounted for in accordance with accounting guidance for hybrid
instruments, all changes in fair value, including any interest
elements, are reported in principal transactions revenue.
The following table details the Firm’s securities financing agree-
ments, all of which are accounted for as collateralized financings
during the periods presented.
December 31, (in millions) 2010 2009
Securities purchased under resale agreements(a) $ 222,302 $ 195,328
Securities borrowed(b) 123,587 119,630
Securities sold under repurchase agreements(c) $ 262,722 $ 245,692Securities loaned 10,592 7,835
(a) Includes resale agreements of $20.3 billion and $20.5 billion accounted for at fair value at December 31, 2010 and 2009, respectively.
(b) Includes securities borrowed of $14.0 billion and $7.0 billion accounted for at fair value at December 31, 2010 and 2009, respectively.
(c) Includes repurchase agreements of $4.1 billion and $3.4 billion accounted for at fair value at December 31, 2010 and 2009, respectively.
The amounts reported in the table above have been reduced by
$112.7 billion and $121.2 billion at December 31, 2010 and
2009, respectively, as a result of agreements in effect that meet
the specified conditions for net presentation under applicable
accounting guidance.
JPMorgan Chase’s policy is to take possession, where possible,
of securities purchased under resale agreements and of securi-
ties borrowed. The Firm monitors the market value of the un-
derlying securities that it has received from its counterparties
and either requests additional collateral or returns a portion of
the collateral when appropriate in light of the market value of
the underlying securities. Margin levels are established initially
based upon the counterparty and type of collateral and moni-
tored on an ongoing basis to protect against declines in collat-
eral value in the event of default. JPMorgan Chase typically
enters into master netting agreements and other collateral
arrangements with its resale agreement and securities bor-
rowed counterparties, which provide for the right to liquidate
the purchased or borrowed securities in the event of a customer
default. As a result of the Firm’s credit risk mitigation practices
described above on resale and securities borrowed agreements,
the Firm did not hold any reserves for credit impairment on
these agreements as of December 31, 2010 and 2009.
For a further discussion of assets pledged and collateral received
in securities financing agreements see Note 31 on pages 280–
281 of this Annual Report.

Notes to consolidated financial statements
220 JPMorgan Chase & Co./2010 Annual Report
Note 14 – Loans
Loan accounting framework
The accounting for a loan depends on management’s strategy for
the loan, and on whether the loan was credit-impaired at the
date of acquisition. The Firm accounts for loans based on the
following categories:
• Originated or purchased loans held-for-investment (other than
purchased credit-impaired (“PCI”) loans);
• Loans held-for-sale;
• Fair value loans;
• PCI loans held-for-investment
The following provides a detailed accounting discussion of these
loan categories:
Loans held-for-investment (other than PCI loans) Originated or purchased loans held-for-investment, other than PCI
loans, are measured at the principal amount outstanding, net of the
following: allowance for loan losses; net charge-offs; interest applied
to principal (for loans accounted for on the cost recovery method);
unamortized discounts and premiums; and deferred loan fees or cost.
Interest income Interest income on performing loans held-for-investment, other
than PCI loans, is accrued and recognized as interest income at
the contractual rate of interest. Purchase price discounts or pre-
miums, as well as net deferred loan fees or costs, are amortized
into interest income over the life of the loan to produce a level
rate of return.
Nonaccrual loans Nonaccrual loans are those on which the accrual of interest has
been suspended. Loans (other than credit card loans and certain
consumer loans insured by U.S. government agencies) are placed
on nonaccrual status and considered nonperforming when full
payment of principal and interest is in doubt, which is generally
determined when principal or interest is 90 days or more past due
and collateral, if any, is insufficient to cover principal and interest.
A loan is determined to be past due when the minimum payment
is not received from the borrower by the contractually specified
due date or for certain loans (e.g., residential real estate loans),
when a monthly payment is due and unpaid for 30 days or more.
All interest accrued but not collected is reversed against interest
income at the date a loan is placed on nonaccrual status. In
addition, the amortization of deferred amounts is suspended. In
certain cases, interest income on nonaccrual loans may be recog-
nized to the extent cash is received (i.e., cash basis) when the
recorded loan balance is deemed fully collectible; however, if
there is doubt regarding the ultimate collectability of the recorded
loan balance, all interest cash receipts are applied to reduce the
carrying value of the loan (the cost recovery method).
A loan may be returned to accrual status when repayment is
reasonably assured and there has been demonstrated perform-
ance under the terms of the loan or, if applicable, the terms of
the restructured loan.
As permitted by regulatory guidance, credit card loans are generally
exempt from being placed on nonaccrual status; accordingly, inter-
est and fees related to credit card loans continue to accrue until the
loan is charged off or paid in full. However, the Firm separately
establishes an allowance for the estimated uncollectible portion of
billed and accrued interest and fee income on credit card loans.
Allowance for loan losses The allowance for loan losses represents the estimated probable
losses on held-for-investment loans. Changes in the allowance for
loan losses are recorded in the Provision for credit losses on the
Firm’s Consolidated Statements of Income. See Note 15 on pages
239–243 for further information on the Firm’s accounting polices
for the allowance for loan losses.
Charge-offs Wholesale loans and risk-rated business banking and auto loans
are charged off against the allowance for loan losses when it is
highly certain that a loss has been realized. This determination
includes many factors, including the prioritization of the Firm’s
claim in bankruptcy, expectations of the workout/restructuring of
the loan and valuation of the borrower's equity.
Consumer loans, other than risk-rated business banking and auto
loans and PCI loans, are generally charged off to the allowance
for loan losses upon reaching specified stages of delinquency, in
accordance with the Federal Financial Institutions Examination
Council (“FFIEC”) policy. Residential mortgage loans and scored
business banking loans are generally charged down to estimated
net realizable value at no later than 180 days past due. Certain
consumer loans, including auto loans and non-government guar-
anteed student loans, are generally charged down to estimated
net realizable value at 120 days past due. The Firm regularly
assesses the assumptions that it uses to estimate these net realiz-
able values, and updates the underlying assumptions as necessary
to further refine its estimates.
Credit card loans are charged off by the end of the month in
which the account becomes 180 days past due, or within 60 days
from receiving notification about a specified event (e.g., bank-
ruptcy of the borrower), whichever is earlier.
Certain impaired loans are deemed collateral-dependent because
repayment of the loan is expected to be provided solely by the
underlying collateral, rather than by cash flows from the bor-
rower’s operations, income or other resources. Impaired collat-
eral-dependent loans are charged-off to the fair value of the
collateral, less costs to sell. See Note 15 on pages 239–243 for
information on the Firm’s charge-off and valuation policies for
collateral-dependent loans.
JPMorgan Chase & Co./2010 Annual Report 221
Loans held-for-sale Held-for-sale loans are measured at the lower of cost or fair
value, with valuation changes recorded in noninterest revenue.
For wholesale loans, the valuation is performed on an individual
loan basis. For consumer loans, the valuation is performed on a
portfolio basis.
Interest income on loans held-for-sale is accrued and recognized
based on the contractual rate of interest.
Loan origination fees or costs and purchase price discounts or
premiums are deferred in a contra loan account until the related
loan is sold. The deferred fees and discounts or premiums are an
adjustment to the basis of the loan and therefore are included in
the periodic determination of the lower of cost or fair value
adjustments and/or the gain or losses recognized at the time of
sale.
Held-for-sale loans are subject to the nonaccrual policies de-
scribed above.
Because held-for-sale loans are recognized at the lower of cost or
fair value, the Firm’s allowance for loan losses and charge-off
policies do not apply to these loans.
Fair value loans Loans used in a trading strategy or risk managed on a fair value
basis are measured at fair value, with changes in fair value re-
corded in noninterest revenue.
For these loans, the earned current contractual interest payment
is recognized in interest income. Changes in fair value are recog-
nized in noninterest revenue. Loan origination fees are recognized
upfront in noninterest revenue. Loan origination costs are recog-
nized in the associated expense category as incurred.
Because these loans are recognized at fair value, the Firm’s
nonaccrual, allowance for loan losses, and charge-off policies do
not apply to these loans.
See Note 4 on pages 187–189 of this Annual Report for further
information on the Firm’s elections of fair value accounting under
the fair value option. See Note 3 and Note 4 on pages 170–187
and 187–189 of this Annual Report for further information on
loans carried at fair value and classified as trading assets.
PCI loans PCI loans held-for-investment are initially measured at fair value.
PCI loans have evidence of credit deterioration since the loan’s
origination date and therefore it is probable, at acquisition, that all
contractually required payments will not be collected. Because PCI
loans are initially measured at fair value, which includes an estimate
of future credit losses, no allowance for loan losses related to PCI
loans is recorded at the acquisition date. See page 233 of this Note
for information on accounting for PCI loans subsequent to their
acquisition.
Loan classification changes
Loans in the held-for-investment portfolio that management
decides to sell are transferred to the held-for-sale portfolio at the
lower of cost or fair value on the date of transfer. Credit-related
losses are charged against the allowance for loan losses; losses
due to changes in interest rates or foreign currency exchange
rates are recognized in noninterest revenue.
In certain limited cases, loans in the held-for-sale portfolio that
management decides to retain are transferred to the held-for-
investment portfolio at the lower of cost or fair value on the date of
transfer. These loans are subsequently assessed for impairment
based on the Firm’s allowance methodology. For a further discus-
sion of the methodologies used in establishing the Firm’s allowance
for loan losses, see Note 15 on pages 239–243 of this Annual
Report.
Loan modifications
The Firm seeks to modify certain loans in conjunction with its
loss-mitigation activities. Through the modification, JPMorgan
Chase grants one or more concessions to a borrower who is
experiencing financial difficulty in order to minimize the Firm’s
economic loss, avoid foreclosure or repossession of the collateral
and to ultimately maximize payments received by the Firm from
the borrower. The concessions granted vary by program and by
borrower-specific characteristics, and may include interest rate
reductions, term extensions, payment deferrals, or the acceptance
of equity or other assets in lieu of payments. In certain limited
circumstances, loan modifications include principal forgiveness.
Such modifications are accounted for and reported as troubled
debt restructurings (“TDRs”). A loan that has been modified in a
TDR is generally considered to be impaired until it matures, is
repaid, or is otherwise liquidated, regardless of whether the
borrower performs under the modified terms. In certain limited
cases, the effective interest rate applicable to the modified loan is
at or above the current market rate at the time of the restructur-
ing. In such circumstances, and assuming that the loan subse-
quently performs under its modified terms and the Firm expects to
collect all contractual principal and interest cash flows, the loan is
disclosed as impaired and as a TDR only during the year of the
modification; in subsequent years, the loan is not disclosed as an
impaired loan or as a TDR so long as repayment of the restruc-
tured loan under its modified terms is reasonably assured.
Loans, except for credit card loans, modified in a TDR are gener-
ally placed on nonaccrual status, although in most cases such
loans were already on nonaccrual status prior to modification.
These loans may be returned to performing status (resuming the
accrual of interest) if the following criteria are met: (a) the bor-
rower has performed under the modified terms for a minimum of
six months and/or six payments, and (b) the Firm has an expecta-
tion that repayment of the modified loan is reasonably assured
based on, for example, the borrower’s debt capacity and level of
future earnings, collateral values, LTV ratios, and other current
market considerations.

Notes to consolidated financial statements
222 JPMorgan Chase & Co./2010 Annual Report
Because TDRs are considered to be impaired, these loans are
evaluated for an asset-specific allowance, which considers the
expected re-default rates for the modified loans and is deter-
mined based on the same methodology used to estimate the
Firm’s asset-specific allowance component regardless of whether
the loan is performing and has been returned to accrual status.
For further discussion of the methodology used to estimate the
Firm’s asset-specific allowance, see Note 15 on pages 239–243
of this Annual Report.
Foreclosed property
The Firm acquires property from borrowers through loan restructur-
ings, workouts, and foreclosures. Property acquired may include
real property (e.g., residential real estate, land, buildings, and
fixtures) and commercial and personal property (e.g., aircraft,
railcars, and ships).
At the time JPMorgan Chase takes physical possession, the
property is recorded in other assets on the Consolidated Balance
Sheets at fair value less estimated costs to sell. Each quarter the
fair value of the acquired property is reviewed and adjusted, if
necessary. Subsequent changes to fair value are charged/credited
to noninterest revenue. Operating expense, such as real estate
taxes and maintenance, are charged to other expense.
Loan Portfolio
The Firm’s loan portfolio is divided into three portfolio segments, which are the same segments used by the Firm to determine the allowance
for loan losses: Wholesale; Consumer, excluding credit card; and Credit Card. Within each portfolio segment, the Firm monitors and assesses the
credit risk in the following classes of loans, based on the risk characteristics of each loan class:
Wholesale(a) Consumer, excluding
credit card(b) Credit Card
• Commercial and industrial • Real estate • Financial institutions • Government agencies • Other
Residential real estate – excluding PCI • Home equity – senior lien • Home equity – junior lien • Prime mortgage, including option
ARMs • Subprime mortgage Other consumer loans
• Auto(c)
• Business banking(c) • Student and other Residential real estate – PCI • Home equity • Prime mortgage • Subprime mortgage • Option ARMs
• Chase, excluding accounts origi-
nated by Washington Mutual • Accounts originated by Washington
Mutual
(a) Includes loans reported in Investment Bank, Commercial Banking, Treasury & Securities Services, Asset Management and Corporate/Private Equity segments.
(b) Includes RFS and residential real estate loans reported in the Corporate/Private Equity segment. (c) Includes risk-rated loans that apply the Firm’s wholesale methodology for determining the allowance for loan losses; these loans are managed
by RFS, and therefore for consistency in presentation, are included with the other consumer loan classes.
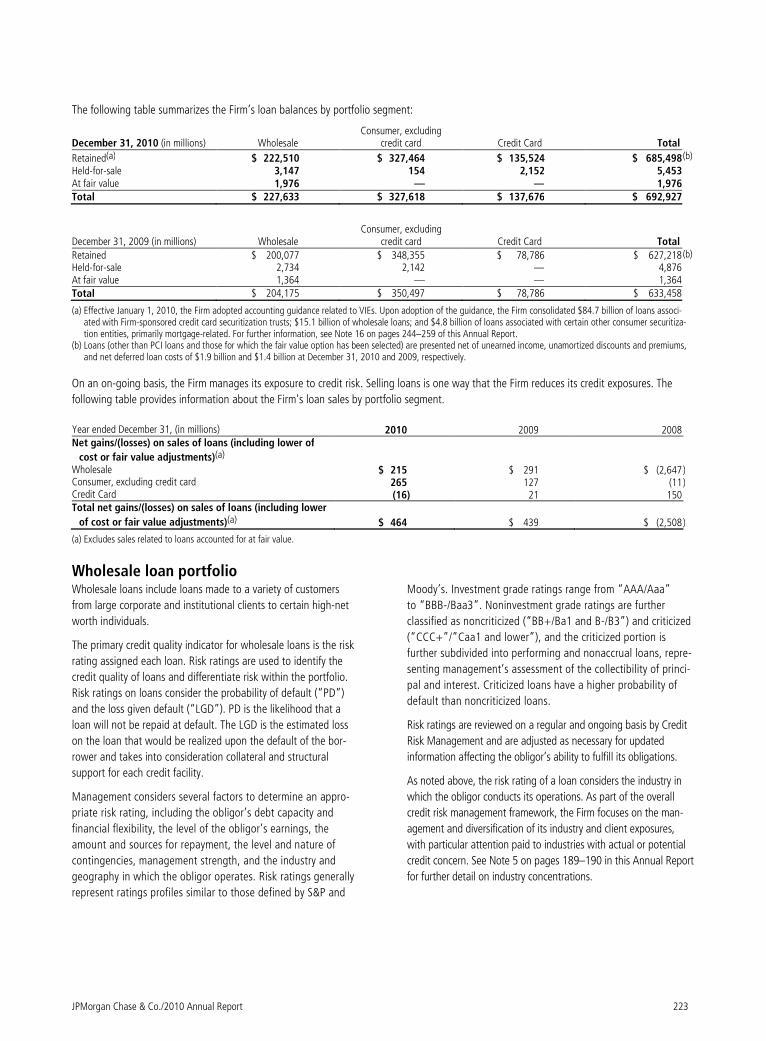
JPMorgan Chase & Co./2010 Annual Report 223
The following table summarizes the Firm’s loan balances by portfolio segment:
December 31, 2010 (in millions) Wholesale Consumer, excluding
credit card Credit Card Total
Retained(a) $ 222,510 $ 327,464 $ 135,524 $ 685,498 (b) Held-for-sale 3,147 154 2,152 5,453 At fair value 1,976 — — 1,976 Total $ 227,633 $ 327,618 $ 137,676 $ 692,927
December 31, 2009 (in millions) Wholesale Consumer, excluding
credit card Credit Card Total
Retained $ 200,077 $ 348,355 $ 78,786 $ 627,218 (b) Held-for-sale 2,734 2,142 — 4,876 At fair value 1,364 — — 1,364 Total $ 204,175 $ 350,497 $ 78,786 $ 633,458
(a) Effective January 1, 2010, the Firm adopted accounting guidance related to VIEs. Upon adoption of the guidance, the Firm consolidated $84.7 billion of loans associ-ated with Firm-sponsored credit card securitization trusts; $15.1 billion of wholesale loans; and $4.8 billion of loans associated with certain other consumer securitiza-tion entities, primarily mortgage-related. For further information, see Note 16 on pages 244–259 of this Annual Report.
(b) Loans (other than PCI loans and those for which the fair value option has been selected) are presented net of unearned income, unamortized discounts and premiums, and net deferred loan costs of $1.9 billion and $1.4 billion at December 31, 2010 and 2009, respectively.
On an on-going basis, the Firm manages its exposure to credit risk. Selling loans is one way that the Firm reduces its credit exposures. The
following table provides information about the Firm's loan sales by portfolio segment.
Year ended December 31, (in millions) 2010 2009 2008
Net gains/(losses) on sales of loans (including lower of
cost or fair value adjustments)(a) Wholesale $ 215 $ 291 $ (2,647 ) Consumer, excluding credit card 265 127 (11 ) Credit Card (16) 21 150 Total net gains/(losses) on sales of loans (including lower
of cost or fair value adjustments)(a) $ 464 $ 439 $ (2,508 )
(a) Excludes sales related to loans accounted for at fair value.
Wholesale loan portfolio Wholesale loans include loans made to a variety of customers
from large corporate and institutional clients to certain high-net
worth individuals.
The primary credit quality indicator for wholesale loans is the risk
rating assigned each loan. Risk ratings are used to identify the
credit quality of loans and differentiate risk within the portfolio.
Risk ratings on loans consider the probability of default (“PD”)
and the loss given default (“LGD”). PD is the likelihood that a
loan will not be repaid at default. The LGD is the estimated loss
on the loan that would be realized upon the default of the bor-
rower and takes into consideration collateral and structural
support for each credit facility.
Management considers several factors to determine an appro-
priate risk rating, including the obligor’s debt capacity and
financial flexibility, the level of the obligor’s earnings, the
amount and sources for repayment, the level and nature of
contingencies, management strength, and the industry and
geography in which the obligor operates. Risk ratings generally
represent ratings profiles similar to those defined by S&P and
Moody’s. Investment grade ratings range from “AAA/Aaa”
to “BBB-/Baa3”. Noninvestment grade ratings are further
classified as noncriticized (“BB+/Ba1 and B-/B3”) and criticized
(“CCC+”/”Caa1 and lower”), and the criticized portion is
further subdivided into performing and nonaccrual loans, repre-
senting management’s assessment of the collectibility of princi-
pal and interest. Criticized loans have a higher probability of
default than noncriticized loans.
Risk ratings are reviewed on a regular and ongoing basis by Credit
Risk Management and are adjusted as necessary for updated
information affecting the obligor’s ability to fulfill its obligations.
As noted above, the risk rating of a loan considers the industry in
which the obligor conducts its operations. As part of the overall
credit risk management framework, the Firm focuses on the man-
agement and diversification of its industry and client exposures,
with particular attention paid to industries with actual or potential
credit concern. See Note 5 on pages 189–190 in this Annual Report
for further detail on industry concentrations.
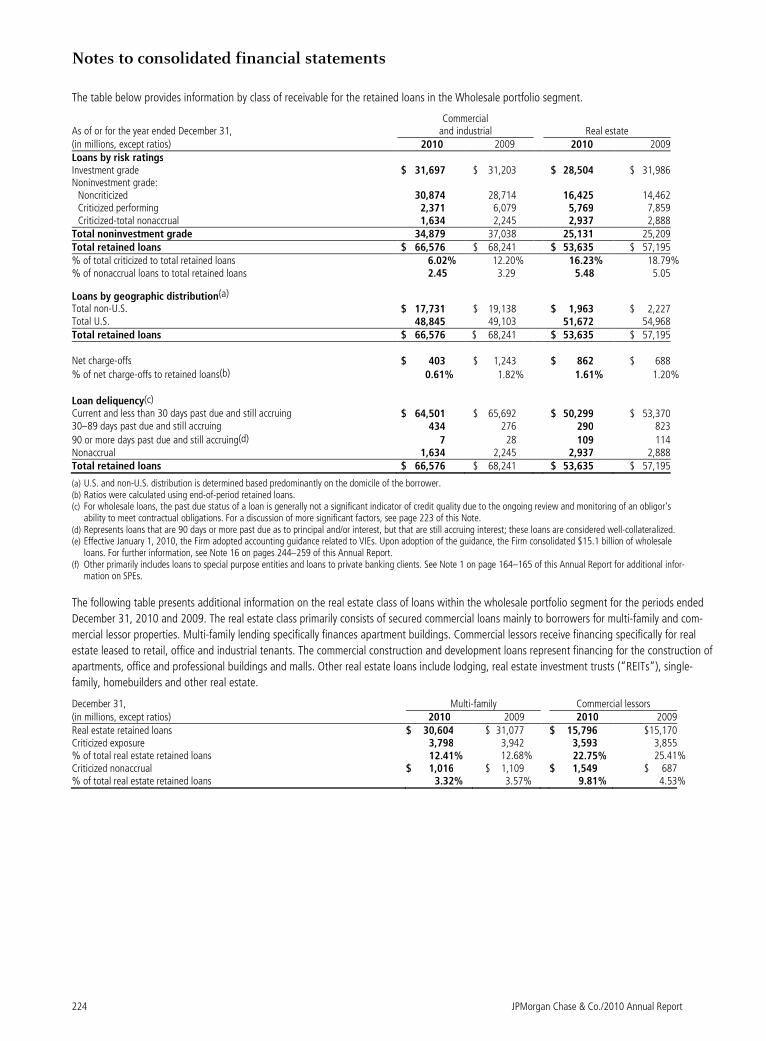
Notes to consolidated financial statements
224 JPMorgan Chase & Co./2010 Annual Report
The table below provides information by class of receivable for the retained loans in the Wholesale portfolio segment.
As of or for the year ended December 31, Commercial
and industrial Real estate (in millions, except ratios) 2010 2009 2010 2009 Loans by risk ratings Investment grade $ 31,697 $ 31,203 $ 28,504 $ 31,986 Noninvestment grade:
Noncriticized 30,874 28,714 16,425 14,462 Criticized performing 2,371 6,079 5,769 7,859 Criticized-total nonaccrual 1,634 2,245 2,937 2,888
Total noninvestment grade 34,879 37,038 25,131 25,209 Total retained loans $ 66,576 $ 68,241 $ 53,635 $ 57,195 % of total criticized to total retained loans 6.02% 12.20% 16.23% 18.79 % % of nonaccrual loans to total retained loans 2.45 3.29 5.48 5.05
Loans by geographic distribution(a) Total non-U.S. $ 17,731 $ 19,138 $ 1,963 $ 2,227 Total U.S. 48,845 49,103 51,672 54,968 Total retained loans $ 66,576 $ 68,241 $ 53,635 $ 57,195 Net charge-offs $ 403 $ 1,243 $ 862 $ 688
% of net charge-offs to retained loans(b) 0.61% 1.82% 1.61% 1.20 %
Loan deliquency(c) Current and less than 30 days past due and still accruing $ 64,501 $ 65,692 $ 50,299 $ 53,370 30–89 days past due and still accruing 434 276 290 823
90 or more days past due and still accruing(d) 7 28 109 114 Nonaccrual 1,634 2,245 2,937 2,888 Total retained loans $ 66,576 $ 68,241 $ 53,635 $ 57,195
(a) U.S. and non-U.S. distribution is determined based predominantly on the domicile of the borrower. (b) Ratios were calculated using end-of-period retained loans. (c) For wholesale loans, the past due status of a loan is generally not a significant indicator of credit quality due to the ongoing review and monitoring of an obligor's
ability to meet contractual obligations. For a discussion of more significant factors, see page 223 of this Note. (d) Represents loans that are 90 days or more past due as to principal and/or interest, but that are still accruing interest; these loans are considered well-collateralized. (e) Effective January 1, 2010, the Firm adopted accounting guidance related to VIEs. Upon adoption of the guidance, the Firm consolidated $15.1 billion of wholesale
loans. For further information, see Note 16 on pages 244–259 of this Annual Report. (f) Other primarily includes loans to special purpose entities and loans to private banking clients. See Note 1 on page 164–165 of this Annual Report for additional infor-
mation on SPEs.
The following table presents additional information on the real estate class of loans within the wholesale portfolio segment for the periods ended
December 31, 2010 and 2009. The real estate class primarily consists of secured commercial loans mainly to borrowers for multi-family and com-
mercial lessor properties. Multi-family lending specifically finances apartment buildings. Commercial lessors receive financing specifically for real
estate leased to retail, office and industrial tenants. The commercial construction and development loans represent financing for the construction of
apartments, office and professional buildings and malls. Other real estate loans include lodging, real estate investment trusts (“REITs”), single-
family, homebuilders and other real estate.
December 31, Multi-family Commercial lessors (in millions, except ratios) 2010 2009 2010 2009 Real estate retained loans $ 30,604 $ 31,077 $ 15,796 $15,170 Criticized exposure 3,798 3,942 3,593 3,855 % of total real estate retained loans 12.41% 12.68% 22.75% 25.41% Criticized nonaccrual $ 1,016 $ 1,109 $ 1,549 $ 687 % of total real estate retained loans 3.32% 3.57% 9.81% 4.53%

JPMorgan Chase & Co./2010 Annual Report 225
(table continued from previous page)
Financial institutions Government agencies Other(e)(f)
Total
retained loans(e) 2010 2009 2010 2009 2010 2009 2010 2009 $ 22,525 $ 14,878 $ 6,871 $ 6,684 $ 56,450 $ 33,780 $ 146,047 $ 118,531
8,480 8,319 382 624 6,012 6,704 62,173 58,823 317 1,201 3 28 320 997 8,780 16,164 136 729 22 5 781 692 5,510 6,559 8,933 10,249 407 657 7,113 8,393 76,463 81,546 $ 31,458 $ 25,127 $ 7,278 $ 7,341 $ 63,563 $ 42,173 $ 222,510 $ 200,077 1.44% 7.68% 0.34% 0.45% 1.73% 4.00% 6.42% 11.36% 0.43 2.90 0.30 0.07 1.23 1.64 2.48 3.28
$ 19,756 $ 11,755 $ 870 $ 1,707 $ 25,831 $ 18,790 $ 66,151 $ 53,617 11,702 13,372 6,408 5,634 37,732 23,383 156,359 146,460$ 31,458 $ 25,127 $ 7,278 $ 7,341 $ 63,563 $ 42,173 $ 222,510 $ 200,077 $ 72 $ 734 $ 2 $ — $ 388 $ 467 $ 1,727 $ 3,132 0.23% 2.92% 0.03% —% 0.61% 1.11% 0.78% 1.57% $ 31,289 $ 24,324 $ 7,222 $ 7,321 $ 61,837 $ 40,785 $ 215,148 $ 191,492 31 68 34 15 704 512 1,493 1,694 2 6 — — 241 184 359 332 136 729 22 5 781 692 5,510 6,559$ 31,458 $ 25,127 $ 7,278 $ 7,341 $ 63,563 $ 42,173 $ 222,510 $ 200,077
(table continued from previous page)
Commercial construction and development Other Total real estate loans 2010 2009 2010 2009 2010 2009
$ 3,395 $ 4,599 $ 3,840 $ 6,349 $ 53,635 $ 57,195 619 1,359 696 1,591 8,706 10,747 18.23% 29.55% 18.13% 25.06% 16.23% 18.79%
$ 174 $ 313 $ 198 $ 779 $ 2,937 $ 2,888 5.13% 6.81% 5.16% 12.27% 5.48% 5.05%
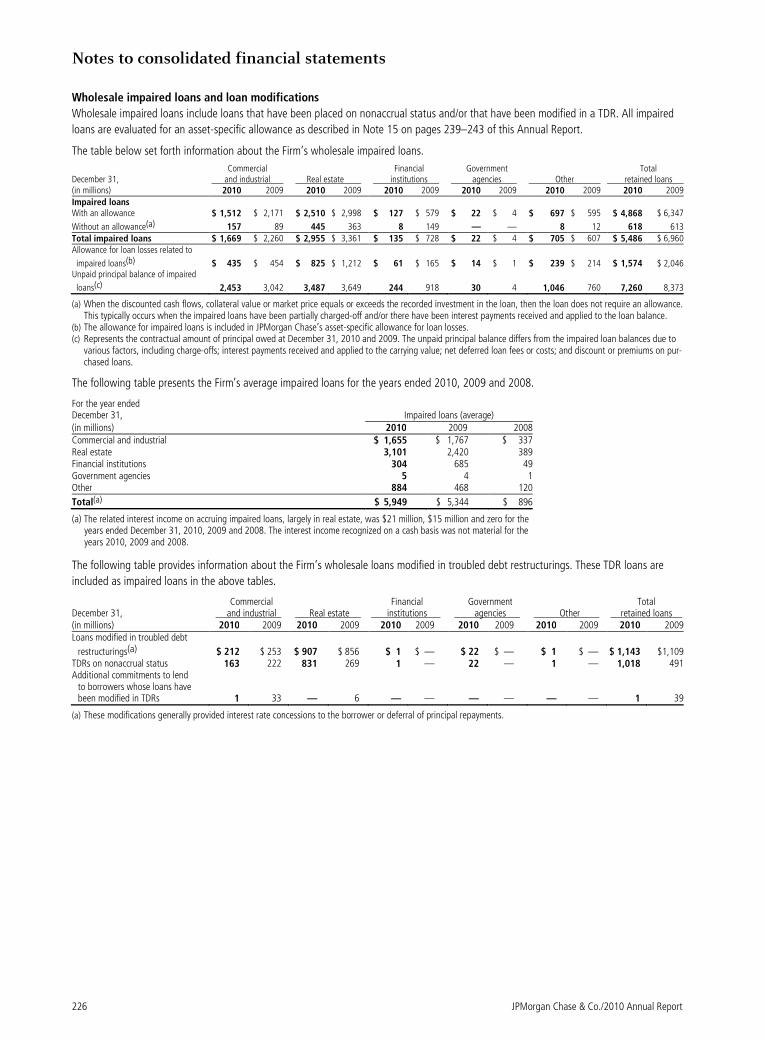
Notes to consolidated financial statements
226 JPMorgan Chase & Co./2010 Annual Report
Wholesale impaired loans and loan modifications
Wholesale impaired loans include loans that have been placed on nonaccrual status and/or that have been modified in a TDR. All impaired
loans are evaluated for an asset-specific allowance as described in Note 15 on pages 239–243 of this Annual Report.
The table below set forth information about the Firm’s wholesale impaired loans.
December 31,
Commercial and industrial Real estate
Financial institutions
Government agencies Other
Total retained loans
(in millions) 2010 2009 2010 2009 2010 2009 2010 2009 2010 2009 2010 2009
Impaired loans With an allowance $ 1,512 $ 2,171 $ 2,510 $ 2,998 $ 127 $ 579 $ 22 $ 4 $ 697 $ 595 $ 4,868 $ 6,347
Without an allowance(a) 157 89 445 363 8 149 — — 8 12 618 613
Total impaired loans $ 1,669 $ 2,260 $ 2,955 $ 3,361 $ 135 $ 728 $ 22 $ 4 $ 705 $ 607 $ 5,486 $ 6,960Allowance for loan losses related to
impaired loans(b) $ 435 $ 454 $ 825 $ 1,212 $ 61 $ 165 $ 14 $ 1 $ 239 $ 214 $ 1,574 $ 2,046Unpaid principal balance of impaired
loans(c) 2,453 3,042 3,487 3,649 244 918 30 4 1,046 760 7,260 8,373
(a) When the discounted cash flows, collateral value or market price equals or exceeds the recorded investment in the loan, then the loan does not require an allowance. This typically occurs when the impaired loans have been partially charged-off and/or there have been interest payments received and applied to the loan balance.
(b) The allowance for impaired loans is included in JPMorgan Chase’s asset-specific allowance for loan losses. (c) Represents the contractual amount of principal owed at December 31, 2010 and 2009. The unpaid principal balance differs from the impaired loan balances due to
various factors, including charge-offs; interest payments received and applied to the carrying value; net deferred loan fees or costs; and discount or premiums on pur-chased loans.
The following table presents the Firm’s average impaired loans for the years ended 2010, 2009 and 2008.
For the year ended December 31, Impaired loans (average) (in millions) 2010 2009 2008 Commercial and industrial $ 1,655 $ 1,767 $ 337 Real estate 3,101 2,420 389 Financial institutions 304 685 49 Government agencies 5 4 1 Other 884 468 120
Total(a) $ 5,949 $ 5,344 $ 896
(a) The related interest income on accruing impaired loans, largely in real estate, was $21 million, $15 million and zero for the years ended December 31, 2010, 2009 and 2008. The interest income recognized on a cash basis was not material for the years 2010, 2009 and 2008.
The following table provides information about the Firm’s wholesale loans modified in troubled debt restructurings. These TDR loans are
included as impaired loans in the above tables.
December 31,
Commercial and industrial Real estate
Financial institutions
Government agencies Other
Total retained loans
(in millions) 2010 2009 2010 2009 2010 2009 2010 2009 2010 2009 2010 2009Loans modified in troubled debt
restructurings(a) $ 212 $ 253 $ 907 $ 856 $ 1 $ — $ 22 $ — $ 1 $ — $ 1,143 $1,109TDRs on nonaccrual status 163 222 831 269 1 — 22 — 1 — 1,018 491Additional commitments to lend
to borrowers whose loans have been modified in TDRs 1 33 — 6 — — — — — — 1 39
(a) These modifications generally provided interest rate concessions to the borrower or deferral of principal repayments.
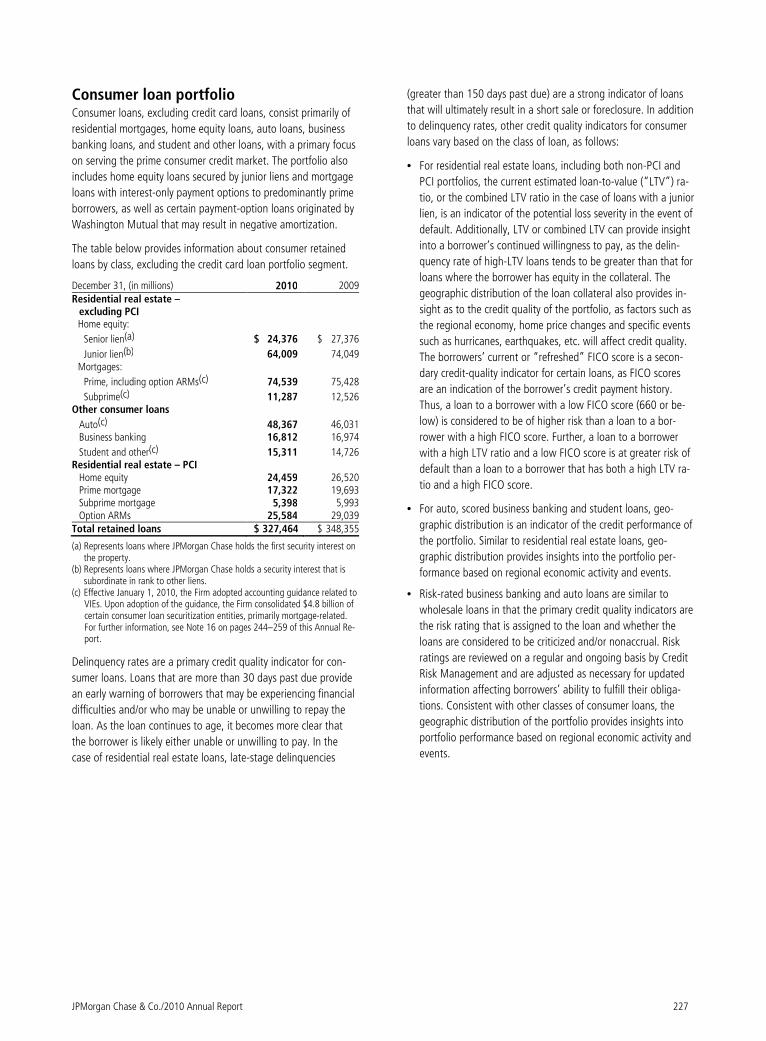
JPMorgan Chase & Co./2010 Annual Report 227
Consumer loan portfolio Consumer loans, excluding credit card loans, consist primarily of
residential mortgages, home equity loans, auto loans, business
banking loans, and student and other loans, with a primary focus
on serving the prime consumer credit market. The portfolio also
includes home equity loans secured by junior liens and mortgage
loans with interest-only payment options to predominantly prime
borrowers, as well as certain payment-option loans originated by
Washington Mutual that may result in negative amortization.
The table below provides information about consumer retained
loans by class, excluding the credit card loan portfolio segment.
December 31, (in millions) 2010 2009Residential real estate –
excluding PCI Home equity:
Senior lien(a) $ 24,376 $ 27,376
Junior lien(b) 64,009 74,049Mortgages:
Prime, including option ARMs(c) 74,539 75,428
Subprime(c) 11,287 12,526Other consumer loans
Auto(c) 48,367 46,031Business banking 16,812 16,974
Student and other(c) 15,311 14,726Residential real estate – PCI
Home equity 24,459 26,520Prime mortgage 17,322 19,693Subprime mortgage 5,398 5,993Option ARMs 25,584 29,039
Total retained loans $ 327,464 $ 348,355
(a) Represents loans where JPMorgan Chase holds the first security interest on the property.
(b) Represents loans where JPMorgan Chase holds a security interest that is subordinate in rank to other liens.
(c) Effective January 1, 2010, the Firm adopted accounting guidance related to VIEs. Upon adoption of the guidance, the Firm consolidated $4.8 billion of certain consumer loan securitization entities, primarily mortgage-related. For further information, see Note 16 on pages 244–259 of this Annual Re-port.
Delinquency rates are a primary credit quality indicator for con-
sumer loans. Loans that are more than 30 days past due provide
an early warning of borrowers that may be experiencing financial
difficulties and/or who may be unable or unwilling to repay the
loan. As the loan continues to age, it becomes more clear that
the borrower is likely either unable or unwilling to pay. In the
case of residential real estate loans, late-stage delinquencies
(greater than 150 days past due) are a strong indicator of loans
that will ultimately result in a short sale or foreclosure. In addition
to delinquency rates, other credit quality indicators for consumer
loans vary based on the class of loan, as follows:
• For residential real estate loans, including both non-PCI and
PCI portfolios, the current estimated loan-to-value (“LTV”) ra-
tio, or the combined LTV ratio in the case of loans with a junior
lien, is an indicator of the potential loss severity in the event of
default. Additionally, LTV or combined LTV can provide insight
into a borrower’s continued willingness to pay, as the delin-
quency rate of high-LTV loans tends to be greater than that for
loans where the borrower has equity in the collateral. The
geographic distribution of the loan collateral also provides in-
sight as to the credit quality of the portfolio, as factors such as
the regional economy, home price changes and specific events
such as hurricanes, earthquakes, etc. will affect credit quality.
The borrowers’ current or “refreshed” FICO score is a secon-
dary credit-quality indicator for certain loans, as FICO scores
are an indication of the borrower’s credit payment history.
Thus, a loan to a borrower with a low FICO score (660 or be-
low) is considered to be of higher risk than a loan to a bor-
rower with a high FICO score. Further, a loan to a borrower
with a high LTV ratio and a low FICO score is at greater risk of
default than a loan to a borrower that has both a high LTV ra-
tio and a high FICO score.
• For auto, scored business banking and student loans, geo-
graphic distribution is an indicator of the credit performance of
the portfolio. Similar to residential real estate loans, geo-
graphic distribution provides insights into the portfolio per-
formance based on regional economic activity and events.
• Risk-rated business banking and auto loans are similar to
wholesale loans in that the primary credit quality indicators are
the risk rating that is assigned to the loan and whether the
loans are considered to be criticized and/or nonaccrual. Risk
ratings are reviewed on a regular and ongoing basis by Credit
Risk Management and are adjusted as necessary for updated
information affecting borrowers’ ability to fulfill their obliga-
tions. Consistent with other classes of consumer loans, the
geographic distribution of the portfolio provides insights into
portfolio performance based on regional economic activity and
events.
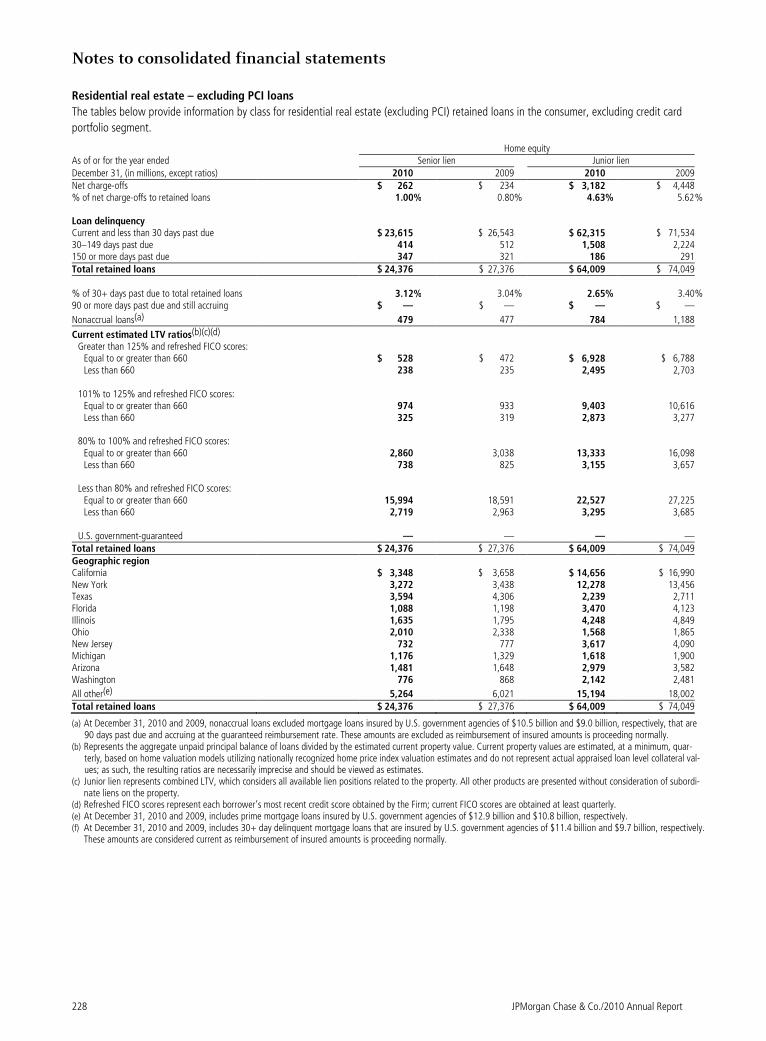
Notes to consolidated financial statements
228 JPMorgan Chase & Co./2010 Annual Report
Residential real estate – excluding PCI loans
The tables below provide information by class for residential real estate (excluding PCI) retained loans in the consumer, excluding credit card
portfolio segment.
Home equity As of or for the year ended Senior lien Junior lien December 31, (in millions, except ratios) 2010 2009 2010 2009 Net charge-offs $ 262 $ 234 $ 3,182 $ 4,448 % of net charge-offs to retained loans 1.00% 0.80% 4.63% 5.62 % Loan delinquency Current and less than 30 days past due $ 23,615 $ 26,543 $ 62,315 $ 71,534 30–149 days past due 414 512 1,508 2,224 150 or more days past due 347 321 186 291 Total retained loans $ 24,376 $ 27,376 $ 64,009 $ 74,049 % of 30+ days past due to total retained loans 3.12% 3.04% 2.65% 3.40 % 90 or more days past due and still accruing $ — $ — $ — $ —
Nonaccrual loans(a) 479 477 784 1,188
Current estimated LTV ratios(b)(c)(d) Greater than 125% and refreshed FICO scores:
Equal to or greater than 660 $ 528 $ 472 $ 6,928 $ 6,788 Less than 660 238 235 2,495 2,703
101% to 125% and refreshed FICO scores:
Equal to or greater than 660 974 933 9,403 10,616 Less than 660 325 319 2,873 3,277
80% to 100% and refreshed FICO scores:
Equal to or greater than 660 2,860 3,038 13,333 16,098 Less than 660 738 825 3,155 3,657
Less than 80% and refreshed FICO scores:
Equal to or greater than 660 15,994 18,591 22,527 27,225 Less than 660 2,719 2,963 3,295 3,685
U.S. government-guaranteed — — — —
Total retained loans $ 24,376 $ 27,376 $ 64,009 $ 74,049 Geographic region California $ 3,348 $ 3,658 $ 14,656 $ 16,990 New York 3,272 3,438 12,278 13,456 Texas 3,594 4,306 2,239 2,711 Florida 1,088 1,198 3,470 4,123 Illinois 1,635 1,795 4,248 4,849 Ohio 2,010 2,338 1,568 1,865 New Jersey 732 777 3,617 4,090 Michigan 1,176 1,329 1,618 1,900 Arizona 1,481 1,648 2,979 3,582 Washington 776 868 2,142 2,481
All other(e) 5,264 6,021 15,194 18,002 Total retained loans $ 24,376 $ 27,376 $ 64,009 $ 74,049
(a) At December 31, 2010 and 2009, nonaccrual loans excluded mortgage loans insured by U.S. government agencies of $10.5 billion and $9.0 billion, respectively, that are 90 days past due and accruing at the guaranteed reimbursement rate. These amounts are excluded as reimbursement of insured amounts is proceeding normally.
(b) Represents the aggregate unpaid principal balance of loans divided by the estimated current property value. Current property values are estimated, at a minimum, quar-terly, based on home valuation models utilizing nationally recognized home price index valuation estimates and do not represent actual appraised loan level collateral val-ues; as such, the resulting ratios are necessarily imprecise and should be viewed as estimates.
(c) Junior lien represents combined LTV, which considers all available lien positions related to the property. All other products are presented without consideration of subordi-nate liens on the property.
(d) Refreshed FICO scores represent each borrower’s most recent credit score obtained by the Firm; current FICO scores are obtained at least quarterly. (e) At December 31, 2010 and 2009, includes prime mortgage loans insured by U.S. government agencies of $12.9 billion and $10.8 billion, respectively. (f) At December 31, 2010 and 2009, includes 30+ day delinquent mortgage loans that are insured by U.S. government agencies of $11.4 billion and $9.7 billion, respectively.
These amounts are considered current as reimbursement of insured amounts is proceeding normally.
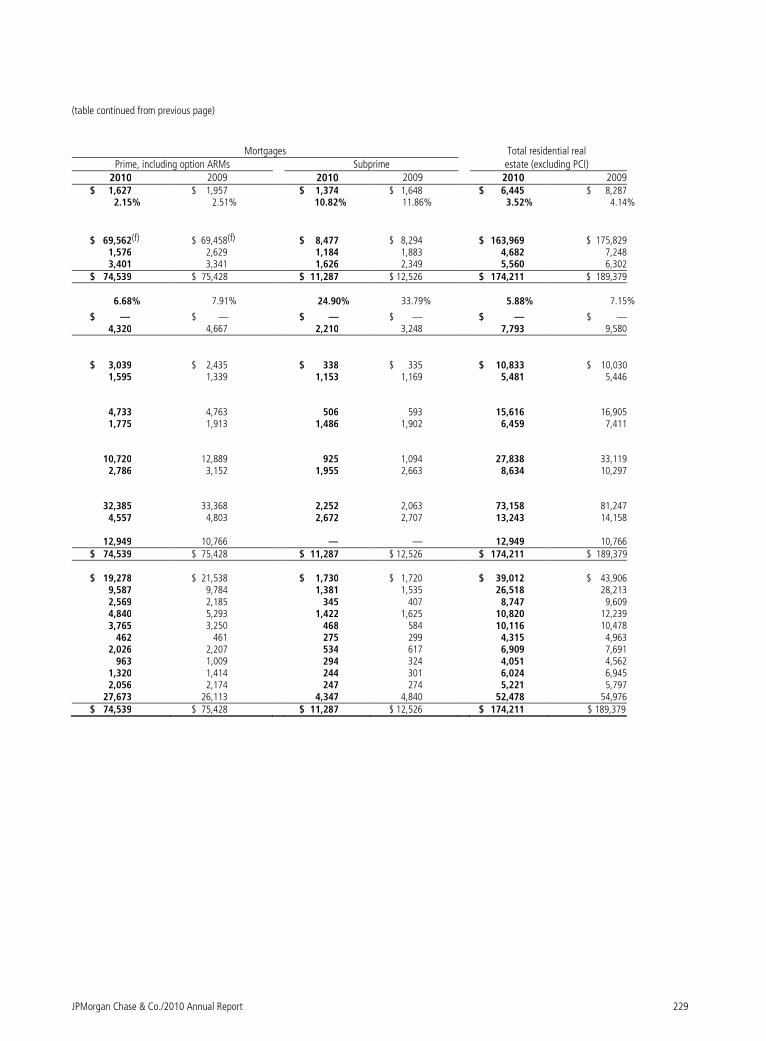
JPMorgan Chase & Co./2010 Annual Report 229
(table continued from previous page)
Mortgages Total residential real
Prime, including option ARMs Subprime estate (excluding PCI)
2010 2009 2010 2009 2010 2009 $ 1,627 $ 1,957 $ 1,374 $ 1,648 $ 6,445 $ 8,287 2.15% 2.51% 10.82% 11.86% 3.52% 4.14%
$ 69,562(f) $ 69,458(f) $ 8,477 $ 8,294 $ 163,969 $ 175,829 1,576 2,629 1,184 1,883 4,682 7,248 3,401 3,341 1,626 2,349 5,560 6,302 $ 74,539 $ 75,428 $ 11,287 $ 12,526 $ 174,211 $ 189,379 6.68% 7.91% 24.90% 33.79% 5.88% 7.15%
$ — $ — $ — $ — $ — $ — 4,320 4,667 2,210 3,248 7,793 9,580 $ 3,039 $ 2,435 $ 338 $ 335 $ 10,833 $ 10,030 1,595 1,339 1,153 1,169 5,481 5,446 4,733 4,763 506 593 15,616 16,905 1,775 1,913 1,486 1,902 6,459 7,411 10,720 12,889 925 1,094 27,838 33,119 2,786 3,152 1,955 2,663 8,634 10,297 32,385 33,368 2,252 2,063 73,158 81,247 4,557 4,803 2,672 2,707 13,243 14,158 12,949 10,766 — — 12,949 10,766 $ 74,539 $ 75,428 $ 11,287 $ 12,526 $ 174,211 $ 189,379 $ 19,278 $ 21,538 $ 1,730 $ 1,720 $ 39,012 $ 43,906 9,587 9,784 1,381 1,535 26,518 28,213 2,569 2,185 345 407 8,747 9,609 4,840 5,293 1,422 1,625 10,820 12,239 3,765 3,250 468 584 10,116 10,478 462 461 275 299 4,315 4,963 2,026 2,207 534 617 6,909 7,691 963 1,009 294 324 4,051 4,562 1,320 1,414 244 301 6,024 6,945 2,056 2,174 247 274 5,221 5,797 27,673 26,113 4,347 4,840 52,478 54,976 $ 74,539 $ 75,428 $ 11,287 $ 12,526 $ 174,211 $ 189,379
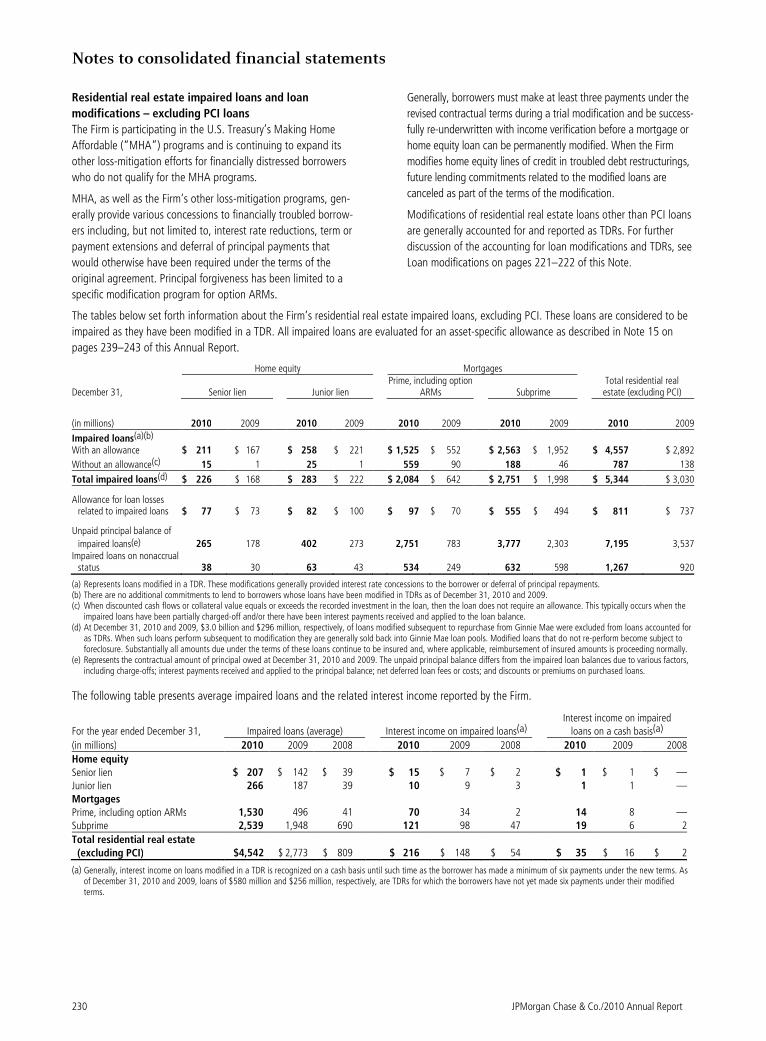
Notes to consolidated financial statements
230 JPMorgan Chase & Co./2010 Annual Report
Residential real estate impaired loans and loan
modifications – excluding PCI loans
The Firm is participating in the U.S. Treasury’s Making Home
Affordable (“MHA”) programs and is continuing to expand its
other loss-mitigation efforts for financially distressed borrowers
who do not qualify for the MHA programs.
MHA, as well as the Firm’s other loss-mitigation programs, gen-
erally provide various concessions to financially troubled borrow-
ers including, but not limited to, interest rate reductions, term or
payment extensions and deferral of principal payments that
would otherwise have been required under the terms of the
original agreement. Principal forgiveness has been limited to a
specific modification program for option ARMs.
Generally, borrowers must make at least three payments under the
revised contractual terms during a trial modification and be success-
fully re-underwritten with income verification before a mortgage or
home equity loan can be permanently modified. When the Firm
modifies home equity lines of credit in troubled debt restructurings,
future lending commitments related to the modified loans are
canceled as part of the terms of the modification.
Modifications of residential real estate loans other than PCI loans
are generally accounted for and reported as TDRs. For further
discussion of the accounting for loan modifications and TDRs, see
Loan modifications on pages 221–222 of this Note.
The tables below set forth information about the Firm’s residential real estate impaired loans, excluding PCI. These loans are considered to be
impaired as they have been modified in a TDR. All impaired loans are evaluated for an asset-specific allowance as described in Note 15 on
pages 239–243 of this Annual Report.
Home equity Mortgages
December 31, Senior lien Junior lien Prime, including option
ARMs Subprime Total residential real estate (excluding PCI)
(in millions) 2010 2009 2010 2009 2010 2009 2010 2009 2010 2009
Impaired loans(a)(b) With an allowance $ 211 $ 167 $ 258 $ 221 $ 1,525 $ 552 $ 2,563 $ 1,952 $ 4,557 $ 2,892
Without an allowance(c) 15 1 25 1 559 90 188 46 787 138
Total impaired loans(d) $ 226 $ 168 $ 283 $ 222 $ 2,084 $ 642 $ 2,751 $ 1,998 $ 5,344 $ 3,030
Allowance for loan losses related to impaired loans $ 77 $ 73 $ 82 $ 100 $ 97 $ 70 $ 555 $ 494 $ 811 $ 737
Unpaid principal balance of
impaired loans(e) 265 178 402 273 2,751 783
3,777 2,303 7,195 3,537
Impaired loans on nonaccrual status 38 30 63 43
534 249 632 598 1,267 920
(a) Represents loans modified in a TDR. These modifications generally provided interest rate concessions to the borrower or deferral of principal repayments. (b) There are no additional commitments to lend to borrowers whose loans have been modified in TDRs as of December 31, 2010 and 2009. (c) When discounted cash flows or collateral value equals or exceeds the recorded investment in the loan, then the loan does not require an allowance. This typically occurs when the
impaired loans have been partially charged-off and/or there have been interest payments received and applied to the loan balance. (d) At December 31, 2010 and 2009, $3.0 billion and $296 million, respectively, of loans modified subsequent to repurchase from Ginnie Mae were excluded from loans accounted for
as TDRs. When such loans perform subsequent to modification they are generally sold back into Ginnie Mae loan pools. Modified loans that do not re-perform become subject to foreclosure. Substantially all amounts due under the terms of these loans continue to be insured and, where applicable, reimbursement of insured amounts is proceeding normally.
(e) Represents the contractual amount of principal owed at December 31, 2010 and 2009. The unpaid principal balance differs from the impaired loan balances due to various factors, including charge-offs; interest payments received and applied to the principal balance; net deferred loan fees or costs; and discounts or premiums on purchased loans.
The following table presents average impaired loans and the related interest income reported by the Firm.
For the year ended December 31, Impaired loans (average) Interest income on impaired loans(a) Interest income on impaired
loans on a cash basis(a)
(in millions) 2010 2009 2008 2010 2009 2008 2010 2009 2008
Home equity
Senior lien $ 207 $ 142 $ 39 $ 15 $ 7 $ 2 $ 1 $ 1 $ —
Junior lien 266 187 39 10 9 3 1 1 —Mortgages
Prime, including option ARMs 1,530 496 41 70 34 2 14 8 —
Subprime 2,539 1,948 690 121 98 47 19 6 2
Total residential real estate (excluding PCI) $4,542 $ 2,773 $ 809 $ 216 $ 148 $ 54 $ 35 $ 16 $ 2
(a) Generally, interest income on loans modified in a TDR is recognized on a cash basis until such time as the borrower has made a minimum of six payments under the new terms. As of December 31, 2010 and 2009, loans of $580 million and $256 million, respectively, are TDRs for which the borrowers have not yet made six payments under their modified terms.
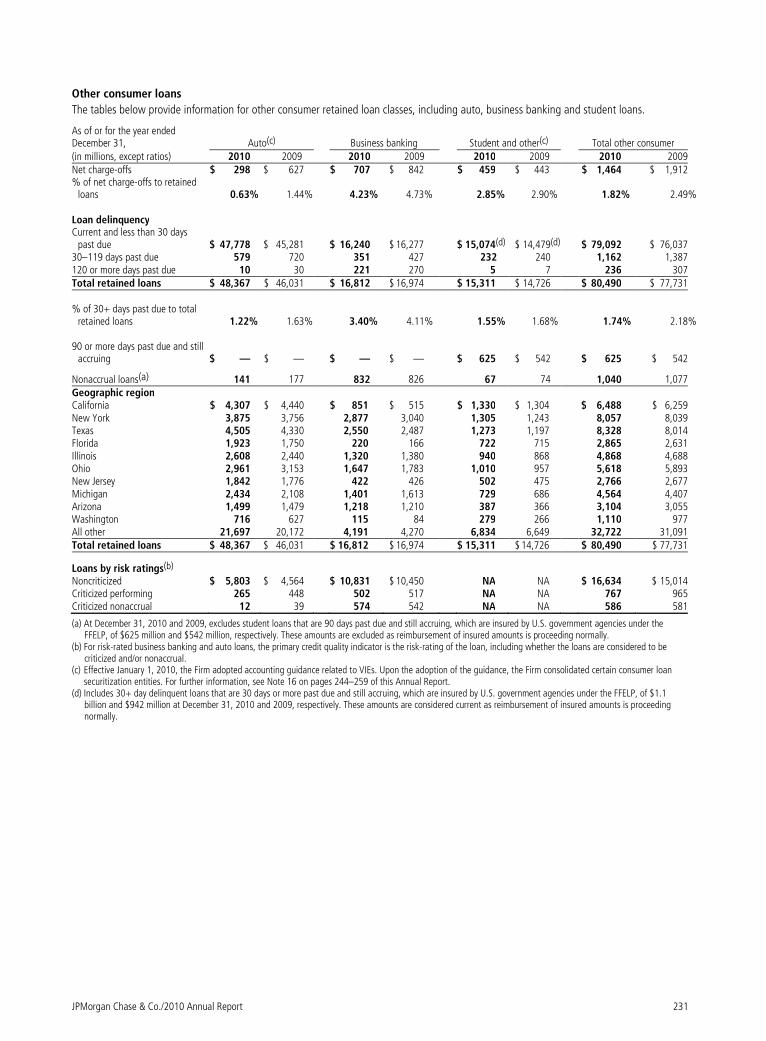
JPMorgan Chase & Co./2010 Annual Report 231
Other consumer loans
The tables below provide information for other consumer retained loan classes, including auto, business banking and student loans.
As of or for the year ended December 31, Auto(c) Business banking Student and other(c) Total other consumer (in millions, except ratios) 2010 2009 2010 2009 2010 2009 2010 2009 Net charge-offs $ 298 $ 627 $ 707 $ 842 $ 459 $ 443 $ 1,464 $ 1,912 % of net charge-offs to retained
loans 0.63% 1.44% 4.23% 4.73% 2.85% 2.90% 1.82% 2.49% Loan delinquency Current and less than 30 days
past due $ 47,778 $ 45,281 $ 16,240 $ 16,277 $ 15,074(d) $ 14,479(d) $ 79,092 $ 76,037 30–119 days past due 579 720 351 427 232 240 1,162 1,387 120 or more days past due 10 30 221 270 5 7 236 307 Total retained loans $ 48,367 $ 46,031 $ 16,812 $ 16,974 $ 15,311 $ 14,726 $ 80,490 $ 77,731
% of 30+ days past due to total
retained loans 1.22% 1.63% 3.40% 4.11% 1.55% 1.68% 1.74% 2.18%
90 or more days past due and still accruing $ — $ — $ — $ — $ 625 $ 542 $ 625 $ 542
Nonaccrual loans(a) 141 177 832 826 67 74 1,040 1,077 Geographic region California $ 4,307 $ 4,440 $ 851 $ 515 $ 1,330 $ 1,304 $ 6,488 $ 6,259 New York 3,875 3,756 2,877 3,040 1,305 1,243 8,057 8,039 Texas 4,505 4,330 2,550 2,487 1,273 1,197 8,328 8,014 Florida 1,923 1,750 220 166 722 715 2,865 2,631 Illinois 2,608 2,440 1,320 1,380 940 868 4,868 4,688 Ohio 2,961 3,153 1,647 1,783 1,010 957 5,618 5,893 New Jersey 1,842 1,776 422 426 502 475 2,766 2,677 Michigan 2,434 2,108 1,401 1,613 729 686 4,564 4,407 Arizona 1,499 1,479 1,218 1,210 387 366 3,104 3,055 Washington 716 627 115 84 279 266 1,110 977 All other 21,697 20,172 4,191 4,270 6,834 6,649 32,722 31,091 Total retained loans $ 48,367 $ 46,031 $ 16,812 $ 16,974 $ 15,311 $ 14,726 $ 80,490 $ 77,731
Loans by risk ratings(b) Noncriticized $ 5,803 $ 4,564 $ 10,831 $ 10,450 NA NA $ 16,634 $ 15,014 Criticized performing 265 448 502 517 NA NA 767 965 Criticized nonaccrual 12 39 574 542 NA NA 586 581
(a) At December 31, 2010 and 2009, excludes student loans that are 90 days past due and still accruing, which are insured by U.S. government agencies under the FFELP, of $625 million and $542 million, respectively. These amounts are excluded as reimbursement of insured amounts is proceeding normally.
(b) For risk-rated business banking and auto loans, the primary credit quality indicator is the risk-rating of the loan, including whether the loans are considered to be criticized and/or nonaccrual.
(c) Effective January 1, 2010, the Firm adopted accounting guidance related to VIEs. Upon the adoption of the guidance, the Firm consolidated certain consumer loan securitization entities. For further information, see Note 16 on pages 244–259 of this Annual Report.
(d) Includes 30+ day delinquent loans that are 30 days or more past due and still accruing, which are insured by U.S. government agencies under the FFELP, of $1.1 billion and $942 million at December 31, 2010 and 2009, respectively. These amounts are considered current as reimbursement of insured amounts is proceeding normally.
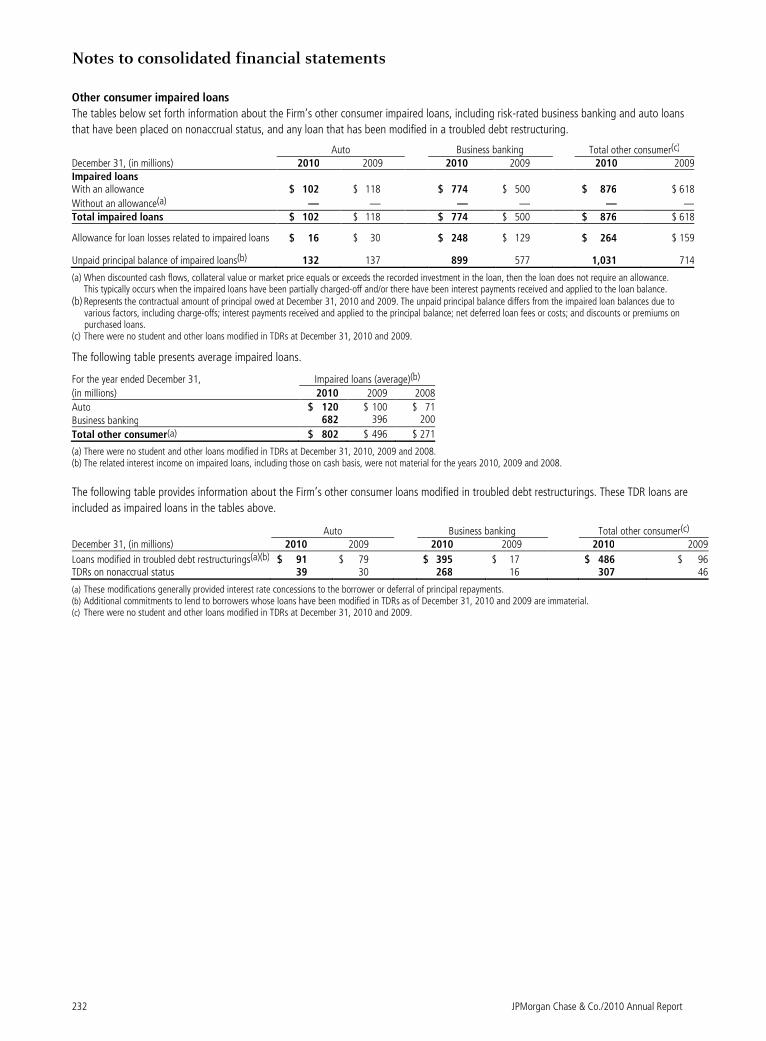
Notes to consolidated financial statements
232 JPMorgan Chase & Co./2010 Annual Report
Other consumer impaired loans
The tables below set forth information about the Firm’s other consumer impaired loans, including risk-rated business banking and auto loans
that have been placed on nonaccrual status, and any loan that has been modified in a troubled debt restructuring.
Auto Business banking Total other consumer(c) December 31, (in millions) 2010 2009 2010 2009 2010 2009Impaired loans With an allowance $ 102 $ 118 $ 774 $ 500 $ 876 $ 618
Without an allowance(a) — — — — — —Total impaired loans $ 102 $ 118 $ 774 $ 500 $ 876 $ 618
Allowance for loan losses related to impaired loans $ 16 $ 30 $ 248 $ 129 $ 264 $ 159
Unpaid principal balance of impaired loans(b) 132 137 899 577 1,031 714
(a) When discounted cash flows, collateral value or market price equals or exceeds the recorded investment in the loan, then the loan does not require an allowance. This typically occurs when the impaired loans have been partially charged-off and/or there have been interest payments received and applied to the loan balance.
(b) Represents the contractual amount of principal owed at December 31, 2010 and 2009. The unpaid principal balance differs from the impaired loan balances due to various factors, including charge-offs; interest payments received and applied to the principal balance; net deferred loan fees or costs; and discounts or premiums on purchased loans.
(c) There were no student and other loans modified in TDRs at December 31, 2010 and 2009.
The following table presents average impaired loans.
For the year ended December 31, Impaired loans (average)(b)
(in millions) 2010 2009 2008
Auto $ 120 $ 100 $ 71Business banking 682 396 200
Total other consumer(a) $ 802 $ 496 $ 271
(a) There were no student and other loans modified in TDRs at December 31, 2010, 2009 and 2008. (b) The related interest income on impaired loans, including those on cash basis, were not material for the years 2010, 2009 and 2008.
The following table provides information about the Firm’s other consumer loans modified in troubled debt restructurings. These TDR loans are
included as impaired loans in the tables above.
Auto Business banking Total other consumer(c) December 31, (in millions) 2010 2009 2010 2009 2010 2009
Loans modified in troubled debt restructurings(a)(b) $ 91 $ 79 $ 395 $ 17 $ 486 $ 96 TDRs on nonaccrual status 39 30 268 16 307 46
(a) These modifications generally provided interest rate concessions to the borrower or deferral of principal repayments. (b) Additional commitments to lend to borrowers whose loans have been modified in TDRs as of December 31, 2010 and 2009 are immaterial. (c) There were no student and other loans modified in TDRs at December 31, 2010 and 2009.
JPMorgan Chase & Co./2010 Annual Report 233
Purchased credit-impaired (“PCI”) loans
PCI loans were determined to be credit-impaired upon acquisition
based on specific risk characteristics of the loan, including prod-
uct type, loan-to-value ratios, FICO scores, and past-due status.
Upon acquisition, credit-impaired loans acquired in the same
fiscal quarter may be aggregated into one or more pools, pro-
vided that the loans have common risk characteristics. A pool is
then accounted for as a single asset with a single composite
interest rate and an aggregate expectation of cash flows. With
respect to the Washington Mutual transaction, all of the con-
sumer loans were aggregated into pools of loans with common
risk characteristics.
PCI loans are initially recorded at fair value upon acquisition. For
each PCI loan, or pool of loans, the Firm is required to estimate the
total cash flows (both principal and interest) expected to be col-
lected over the remaining life of the loan or pool. These estimates
incorporate assumptions regarding default rates, loss severities, the
amounts and timing of prepayments and other factors that reflect
then-current market conditions.
The excess of cash flows expected to be collected over the carrying
value of the underlying loans is referred to as the accretable yield.
This amount is not reported on the Firm’s Consolidated Balance
Sheets but is accreted into interest income at a level rate of return
over the remaining estimated lives of the underlying pools of loans.
For variable-rate loans, expected future cash flows were initially
based on the rate in effect at acquisition; expected future cash
flows are recalculated as rates change over the lives of the loans.
On a quarterly basis, the Firm updates the amount of loan princi-
pal and interest cash flows expected to be collected. Probable
decreases in expected loan principal cash flows trigger the recog-
nition of impairment, which is then measured as the present
value of the expected principal loss plus any related foregone
interest cash flows, discounted at the pool’s effective interest
rate. Impairments are recognized through the provision and
allowance for loan losses. Probable and significant increases in
expected cash flows (e.g., decreased principal credit losses, the
net benefit of modifications) would first reverse any previously
recorded allowance for loan losses with any remaining increases
recognized prospectively as a yield adjustment over the remaining
estimated lives of the underlying loans. The impacts of (i) pre-
payments, (ii) changes in variable interest rates, and (iii) any other
changes in the timing of expected cash flows are recognized
prospectively as adjustments to interest income. Disposals of
loans – which may include sales of loans, receipt of payments in
full by the borrower, or foreclosure – result in removal of the loan
from the PCI portfolio.
If the timing and/or amounts of expected cash flows on PCI loans
were determined not to be reasonably estimable, no interest
would be accreted and the loans would be reported as nonac-
crual loans; however, since the timing and amounts of expected
cash flows for the Firm’s PCI consumer loans are reasonably
estimable, interest is being accreted and the loans are being
reported as performing loans.
Charge-offs are not recorded on PCI loans until actual losses
exceed the estimated losses that were recorded as purchase
accounting adjustments at acquisition date. To date, no charge-
offs have been recorded for these consumer loans.
The PCI portfolio affects the Firm’s results of operations primarily
through: (i) contribution to net interest margin; (ii) expense re-
lated to defaults and servicing resulting from the liquidation of
the loans; and (iii) any provision for loan losses. The PCI loans
acquired in the Washington Mutual transaction were funded
based on the interest rate characteristics of the loans. For exam-
ple, variable-rate loans were funded with variable-rate liabilities
and fixed-rate loans were funded with fixed-rate liabilities with a
similar maturity profile. A net spread will be earned on the declin-
ing balance of the portfolio, which is estimated as of December
31, 2010, to have a remaining weighted-average life of 7.0
years.
The Firm continues to modify certain PCI loans. The impact of
these modifications is incorporated into the Firm’s quarterly
assessment of whether a probable and significant change in
expected cash flows has occurred, and the loans continue to be
accounted for and reported as PCI loans. The impact of modifica-
tions on expected cash flows is estimated using the Firm’s experi-
ence with previously modified loans and other relevant data.
Additionally, the Firm monitors the performance of modifications
and updates and/or refines assumptions as experience and
changes in circumstances or data warrant.
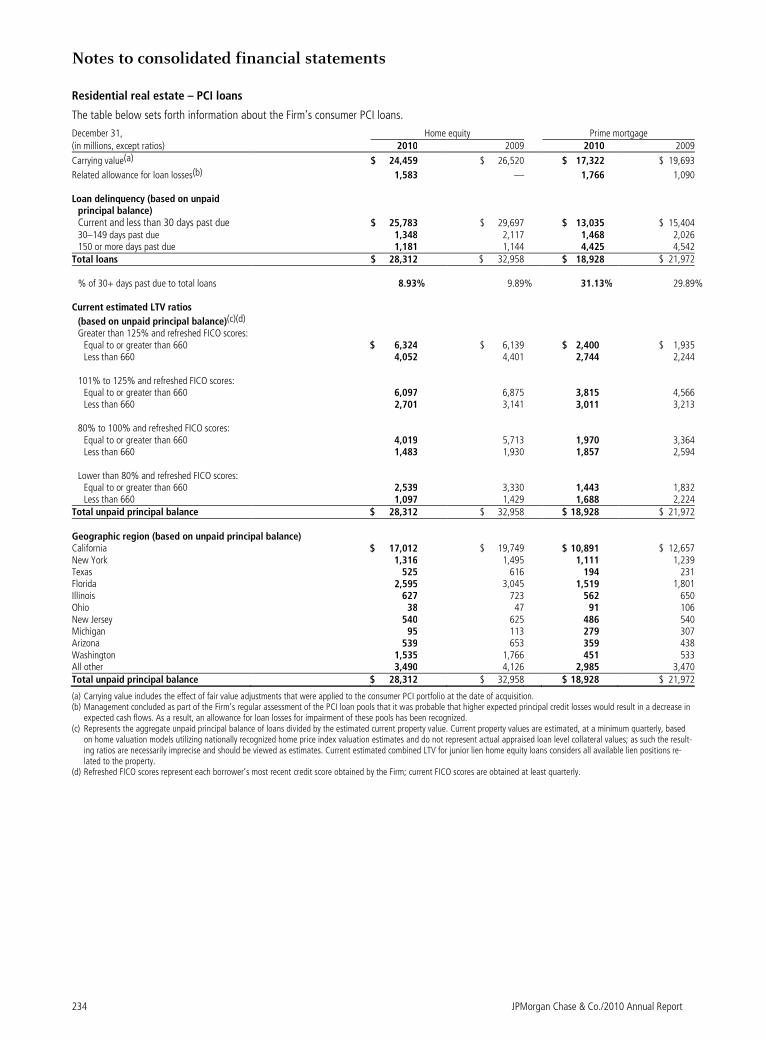
Notes to consolidated financial statements
234 JPMorgan Chase & Co./2010 Annual Report
Residential real estate – PCI loans
The table below sets forth information about the Firm’s consumer PCI loans.
December 31, Home equity Prime mortgage (in millions, except ratios) 2010 2009 2010 2009
Carrying value(a) $ 24,459 $ 26,520 $ 17,322 $ 19,693
Related allowance for loan losses(b) 1,583 — 1,766 1,090 Loan delinquency (based on unpaid
principal balance)
Current and less than 30 days past due $ 25,783 $ 29,697 $ 13,035 $ 15,404
30–149 days past due 1,348 2,117 1,468 2,026 150 or more days past due 1,181 1,144 4,425 4,542 Total loans $ 28,312 $ 32,958 $ 18,928 $ 21,972
% of 30+ days past due to total loans 8.93% 9.89% 31.13% 29.89% Current estimated LTV ratios
(based on unpaid principal balance)(c)(d) Greater than 125% and refreshed FICO scores:
Equal to or greater than 660 $ 6,324 $ 6,139 $ 2,400 $ 1,935 Less than 660 4,052 4,401 2,744 2,244
101% to 125% and refreshed FICO scores:
Equal to or greater than 660 6,097 6,875 3,815 4,566 Less than 660 2,701 3,141 3,011 3,213
80% to 100% and refreshed FICO scores:
Equal to or greater than 660 4,019 5,713 1,970 3,364 Less than 660 1,483 1,930 1,857 2,594
Lower than 80% and refreshed FICO scores:
Equal to or greater than 660 2,539 3,330 1,443 1,832 Less than 660 1,097 1,429 1,688 2,224
Total unpaid principal balance $ 28,312 $ 32,958 $ 18,928 $ 21,972
Geographic region (based on unpaid principal balance) California $ 17,012 $ 19,749 $ 10,891 $ 12,657 New York 1,316 1,495 1,111 1,239 Texas 525 616 194 231 Florida 2,595 3,045 1,519 1,801 Illinois 627 723 562 650 Ohio 38 47 91 106 New Jersey 540 625 486 540 Michigan 95 113 279 307 Arizona 539 653 359 438 Washington 1,535 1,766 451 533 All other 3,490 4,126 2,985 3,470 Total unpaid principal balance $ 28,312 $ 32,958 $ 18,928 $ 21,972
(a) Carrying value includes the effect of fair value adjustments that were applied to the consumer PCI portfolio at the date of acquisition. (b) Management concluded as part of the Firm’s regular assessment of the PCI loan pools that it was probable that higher expected principal credit losses would result in a decrease in
expected cash flows. As a result, an allowance for loan losses for impairment of these pools has been recognized. (c) Represents the aggregate unpaid principal balance of loans divided by the estimated current property value. Current property values are estimated, at a minimum quarterly, based
on home valuation models utilizing nationally recognized home price index valuation estimates and do not represent actual appraised loan level collateral values; as such the result-ing ratios are necessarily imprecise and should be viewed as estimates. Current estimated combined LTV for junior lien home equity loans considers all available lien positions re-lated to the property.
(d) Refreshed FICO scores represent each borrower’s most recent credit score obtained by the Firm; current FICO scores are obtained at least quarterly.
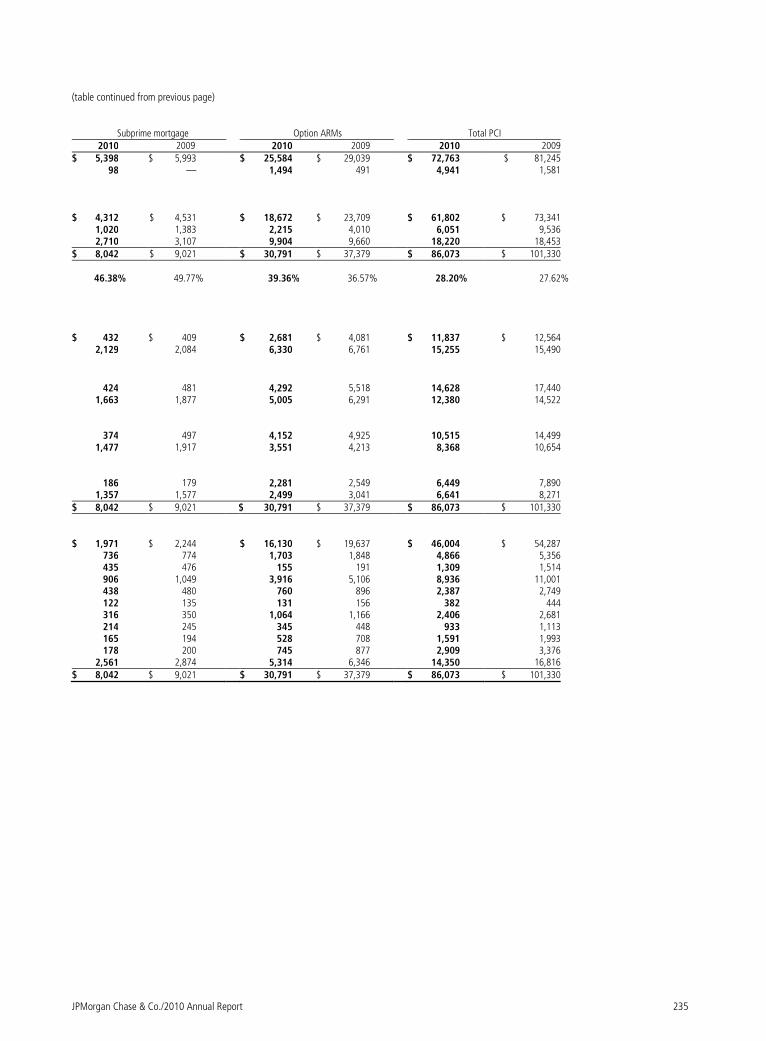
JPMorgan Chase & Co./2010 Annual Report 235
(table continued from previous page)
Subprime mortgage Option ARMs Total PCI 2010 2009 2010 2009 2010 2009 $ 5,398 $ 5,993 $ 25,584 $ 29,039 $ 72,763 $ 81,245 98 — 1,494 491 4,941 1,581
$ 4,312 $ 4,531 $ 18,672 $ 23,709 $ 61,802 $ 73,341 1,020 1,383 2,215 4,010 6,051 9,536 2,710 3,107 9,904 9,660 18,220 18,453 $ 8,042 $ 9,021 $ 30,791 $ 37,379 $ 86,073 $ 101,330 46.38% 49.77% 39.36% 36.57% 28.20% 27.62% $ 432 $ 409 $ 2,681 $ 4,081 $ 11,837 $ 12,564 2,129 2,084 6,330 6,761 15,255 15,490
424 481 4,292 5,518 14,628 17,440 1,663 1,877 5,005 6,291 12,380 14,522 374 497 4,152 4,925 10,515 14,499 1,477 1,917 3,551 4,213 8,368 10,654 186 179 2,281 2,549 6,449 7,890 1,357 1,577 2,499 3,041 6,641 8,271 $ 8,042 $ 9,021 $ 30,791 $ 37,379 $ 86,073 $ 101,330 $ 1,971 $ 2,244 $ 16,130 $ 19,637 $ 46,004 $ 54,287 736 774 1,703 1,848 4,866 5,356 435 476 155 191 1,309 1,514 906 1,049 3,916 5,106 8,936 11,001 438 480 760 896 2,387 2,749 122 135 131 156 382 444 316 350 1,064 1,166 2,406 2,681 214 245 345 448 933 1,113 165 194 528 708 1,591 1,993 178 200 745 877 2,909 3,376 2,561 2,874 5,314 6,346 14,350 16,816 $ 8,042 $ 9,021 $ 30,791 $ 37,379 $ 86,073 $ 101,330

Notes to consolidated financial statements
236 JPMorgan Chase & Co./2010 Annual Report
The table below sets forth the accretable yield activity for the Firm’s PCI consumer loans for the years ended December 31, 2010, 2009 and
2008.
Year ended December 31, Total PCI (in millions, except ratios) 2010 2009 2008
Balance, January 1 $ 25,544 $ 32,619 $ — Washington Mutual acquisition — — 39,454 Accretion into interest income (3,232) (4,363) (1,292) Changes in interest rates on variable rate loans (819) (4,849) (5,543)
Other changes in expected cash flows(a) (2,396) 2,137 —
Balance, December 31 $ 19,097 $ 25,544 $ 32,619 Accretable yield percentage 4.35% 5.14% 5.81%
(a) Other changes in expected cash flows may vary from period to period as the Firm continues to refine its cash flow model and periodically updates model assumptions. For the years ended December 31, 2010 and 2009, other changes in expected cash flows were principally driven by changes in prepayment assumptions, as well as reclassification to the nonaccretable difference. Such changes are expected to have an insignificant impact on the accretable yield percentage.
The factors that most significantly affect estimates of gross cash
flows expected to be collected, and accordingly the accretable
yield balance, include: (i) changes in the benchmark interest
rate indices for variable rate products such as option ARM and
home equity loans; and (ii) changes in prepayment assump-
tions.
To date, the decrease in the accretable yield percentage has
been primarily related to a decrease in interest rates on vari-
able-rate loans and, to a lesser extent, extended loan liquida-
tion periods. Certain events, such as extended loan liquidation
periods, affect the timing of expected cash flows but not the
amount of cash expected to be received (i.e., the accretable
yield balance). Extended loan liquidation periods reduce the
accretable yield percentage because the same accretable yield
balance is recognized against a higher-than-expected loan
balance over a longer-than-expected period of time.
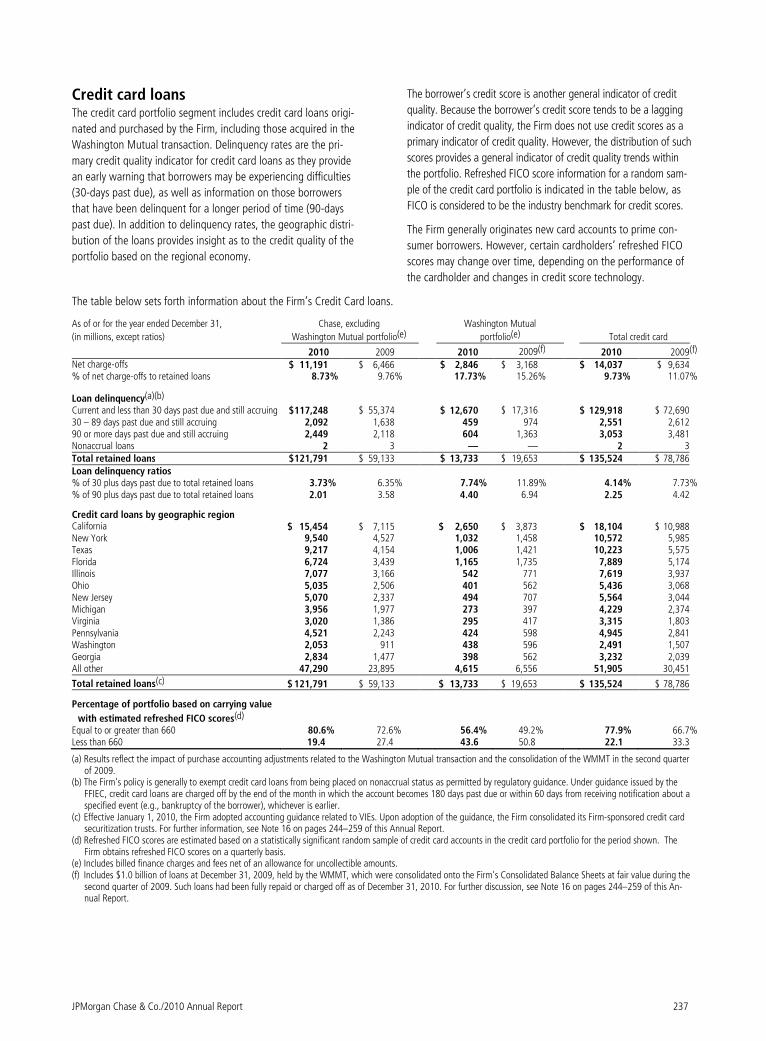
JPMorgan Chase & Co./2010 Annual Report 237
Credit card loans The credit card portfolio segment includes credit card loans origi-
nated and purchased by the Firm, including those acquired in the
Washington Mutual transaction. Delinquency rates are the pri-
mary credit quality indicator for credit card loans as they provide
an early warning that borrowers may be experiencing difficulties
(30-days past due), as well as information on those borrowers
that have been delinquent for a longer period of time (90-days
past due). In addition to delinquency rates, the geographic distri-
bution of the loans provides insight as to the credit quality of the
portfolio based on the regional economy.
The borrower’s credit score is another general indicator of credit
quality. Because the borrower’s credit score tends to be a lagging
indicator of credit quality, the Firm does not use credit scores as a
primary indicator of credit quality. However, the distribution of such
scores provides a general indicator of credit quality trends within
the portfolio. Refreshed FICO score information for a random sam-
ple of the credit card portfolio is indicated in the table below, as
FICO is considered to be the industry benchmark for credit scores.
The Firm generally originates new card accounts to prime con-
sumer borrowers. However, certain cardholders’ refreshed FICO
scores may change over time, depending on the performance of
the cardholder and changes in credit score technology.
The table below sets forth information about the Firm’s Credit Card loans.
As of or for the year ended December 31,
(in millions, except ratios)
Chase, excluding
Washington Mutual portfolio(e)
Washington Mutual
portfolio(e) Total credit card
2010 2009 2010 2009(f) 2010 2009(f) Net charge-offs $ 11,191 $ 6,466 $ 2,846 $ 3,168 $ 14,037 $ 9,634 % of net charge-offs to retained loans 8.73% 9.76% 17.73% 15.26% 9.73% 11.07%
Loan delinquency(a)(b) Current and less than 30 days past due and still accruing $ 117,248 $ 55,374 $ 12,670 $ 17,316 $ 129,918 $ 72,690 30 – 89 days past due and still accruing 2,092 1,638 459 974 2,551 2,612 90 or more days past due and still accruing 2,449 2,118 604 1,363 3,053 3,481 Nonaccrual loans 2 3 — — 2 3 Total retained loans $ 121,791 $ 59,133 $ 13,733 $ 19,653 $ 135,524 $ 78,786 Loan delinquency ratios % of 30 plus days past due to total retained loans 3.73% 6.35% 7.74% 11.89% 4.14% 7.73% % of 90 plus days past due to total retained loans 2.01 3.58 4.40 6.94 2.25 4.42
Credit card loans by geographic region California $ 15,454 $ 7,115 $ 2,650 $ 3,873 $ 18,104 $ 10,988 New York 9,540 4,527 1,032 1,458 10,572 5,985 Texas 9,217 4,154 1,006 1,421 10,223 5,575 Florida 6,724 3,439 1,165 1,735 7,889 5,174 Illinois 7,077 3,166 542 771 7,619 3,937 Ohio 5,035 2,506 401 562 5,436 3,068 New Jersey 5,070 2,337 494 707 5,564 3,044 Michigan 3,956 1,977 273 397 4,229 2,374 Virginia 3,020 1,386 295 417 3,315 1,803 Pennsylvania 4,521 2,243 424 598 4,945 2,841 Washington 2,053 911 438 596 2,491 1,507 Georgia 2,834 1,477 398 562 3,232 2,039 All other 47,290 23,895 4,615 6,556 51,905 30,451
Total retained loans(c) $ 121,791 $ 59,133 $ 13,733 $ 19,653 $ 135,524 $ 78,786
Percentage of portfolio based on carrying value
with estimated refreshed FICO scores(d) Equal to or greater than 660 80.6% 72.6% 56.4% 49.2% 77.9% 66.7% Less than 660 19.4 27.4 43.6 50.8 22.1 33.3
(a) Results reflect the impact of purchase accounting adjustments related to the Washington Mutual transaction and the consolidation of the WMMT in the second quarter of 2009.
(b) The Firm's policy is generally to exempt credit card loans from being placed on nonaccrual status as permitted by regulatory guidance. Under guidance issued by the FFIEC, credit card loans are charged off by the end of the month in which the account becomes 180 days past due or within 60 days from receiving notification about a specified event (e.g., bankruptcy of the borrower), whichever is earlier.
(c) Effective January 1, 2010, the Firm adopted accounting guidance related to VIEs. Upon adoption of the guidance, the Firm consolidated its Firm-sponsored credit card securitization trusts. For further information, see Note 16 on pages 244–259 of this Annual Report.
(d) Refreshed FICO scores are estimated based on a statistically significant random sample of credit card accounts in the credit card portfolio for the period shown. The Firm obtains refreshed FICO scores on a quarterly basis.
(e) Includes billed finance charges and fees net of an allowance for uncollectible amounts. (f) Includes $1.0 billion of loans at December 31, 2009, held by the WMMT, which were consolidated onto the Firm's Consolidated Balance Sheets at fair value during the
second quarter of 2009. Such loans had been fully repaid or charged off as of December 31, 2010. For further discussion, see Note 16 on pages 244–259 of this An-nual Report.
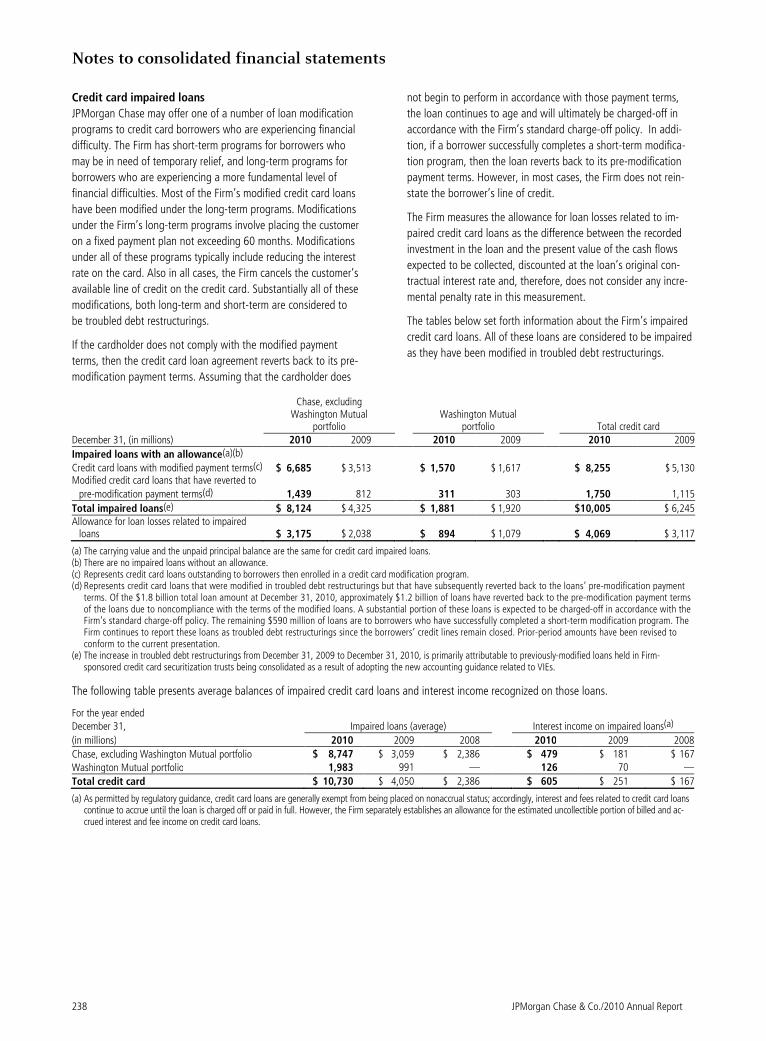
Notes to consolidated financial statements
238 JPMorgan Chase & Co./2010 Annual Report
Credit card impaired loans
JPMorgan Chase may offer one of a number of loan modification
programs to credit card borrowers who are experiencing financial
difficulty. The Firm has short-term programs for borrowers who
may be in need of temporary relief, and long-term programs for
borrowers who are experiencing a more fundamental level of
financial difficulties. Most of the Firm’s modified credit card loans
have been modified under the long-term programs. Modifications
under the Firm’s long-term programs involve placing the customer
on a fixed payment plan not exceeding 60 months. Modifications
under all of these programs typically include reducing the interest
rate on the card. Also in all cases, the Firm cancels the customer’s
available line of credit on the credit card. Substantially all of these
modifications, both long-term and short-term are considered to
be troubled debt restructurings.
If the cardholder does not comply with the modified payment
terms, then the credit card loan agreement reverts back to its pre-
modification payment terms. Assuming that the cardholder does
not begin to perform in accordance with those payment terms,
the loan continues to age and will ultimately be charged-off in
accordance with the Firm’s standard charge-off policy. In addi-
tion, if a borrower successfully completes a short-term modifica-
tion program, then the loan reverts back to its pre-modification
payment terms. However, in most cases, the Firm does not rein-
state the borrower’s line of credit.
The Firm measures the allowance for loan losses related to im-
paired credit card loans as the difference between the recorded
investment in the loan and the present value of the cash flows
expected to be collected, discounted at the loan’s original con-
tractual interest rate and, therefore, does not consider any incre-
mental penalty rate in this measurement.
The tables below set forth information about the Firm’s impaired
credit card loans. All of these loans are considered to be impaired
as they have been modified in troubled debt restructurings.
Chase, excluding Washington Mutual
portfolio Washington Mutual
portfolio Total credit card December 31, (in millions) 2010 2009 2010 2009 2010 2009
Impaired loans with an allowance(a)(b)
Credit card loans with modified payment terms(c) $ 6,685 $ 3,513 $ 1,570 $ 1,617 $ 8,255 $ 5,130 Modified credit card loans that have reverted to
pre-modification payment terms(d) 1,439 812 311 303 1,750 1,115
Total impaired loans(e) $ 8,124 $ 4,325 $ 1,881 $ 1,920 $10,005 $ 6,245 Allowance for loan losses related to impaired
loans $ 3,175 $ 2,038 $ 894 $ 1,079 $ 4,069 $ 3,117
(a) The carrying value and the unpaid principal balance are the same for credit card impaired loans. (b) There are no impaired loans without an allowance. (c) Represents credit card loans outstanding to borrowers then enrolled in a credit card modification program. (d) Represents credit card loans that were modified in troubled debt restructurings but that have subsequently reverted back to the loans’ pre-modification payment
terms. Of the $1.8 billion total loan amount at December 31, 2010, approximately $1.2 billion of loans have reverted back to the pre-modification payment terms of the loans due to noncompliance with the terms of the modified loans. A substantial portion of these loans is expected to be charged-off in accordance with the Firm’s standard charge-off policy. The remaining $590 million of loans are to borrowers who have successfully completed a short-term modification program. The Firm continues to report these loans as troubled debt restructurings since the borrowers’ credit lines remain closed. Prior-period amounts have been revised to conform to the current presentation.
(e) The increase in troubled debt restructurings from December 31, 2009 to December 31, 2010, is primarily attributable to previously-modified loans held in Firm-sponsored credit card securitization trusts being consolidated as a result of adopting the new accounting guidance related to VIEs.
The following table presents average balances of impaired credit card loans and interest income recognized on those loans.
For the year ended December 31, Impaired loans (average) Interest income on impaired loans(a)
(in millions) 2010 2009 2008 2010 2009 2008
Chase, excluding Washington Mutual portfolio $ 8,747 $ 3,059 $ 2,386 $ 479 $ 181 $ 167
Washington Mutual portfolio 1,983 991 — 126 70 —
Total credit card $ 10,730 $ 4,050 $ 2,386 $ 605 $ 251 $ 167
(a) As permitted by regulatory guidance, credit card loans are generally exempt from being placed on nonaccrual status; accordingly, interest and fees related to credit card loans continue to accrue until the loan is charged off or paid in full. However, the Firm separately establishes an allowance for the estimated uncollectible portion of billed and ac-crued interest and fee income on credit card loans.
JPMorgan Chase & Co./2010 Annual Report 239
Note 15 – Allowance for credit losses
JPMorgan Chase’s allowance for loan losses covers the wholesale
and consumer, including credit card loan portfolios, and represents
management’s estimate of probable credit losses inherent in the
Firm’s loan portfolio. Management also computes an allowance for
wholesale and consumer lending-related commitments using meth-
odologies similar to those used to compute the allowance on the
underlying loans. During 2010, the Firm did not make any significant
changes to the methodologies or policies used to determine its al-
lowance for credit losses, which policies are described in the follow-
ing paragraphs.
The allowance for loan losses includes an asset-specific component, a
formula-based component and a component related to PCI loans.
The asset-specific component relates to loans considered to be im-
paired, which includes loans that have been modified in a troubled
debt restructuring as well as risk-rated loans that have been placed
on nonaccrual status. An asset-specific allowance for impaired loans
is established when the loan’s discounted cash flows (or, in certain
cases, the loan’s observable market price) is lower than the recorded
investment in the loan. To compute the asset-specific component of
the allowance, larger loans are evaluated individually, while smaller
loans are evaluated as pools using historical loss experience for the
respective class of assets. Risk-rated loans (primarily wholesale loans)
are pooled by risk rating, while scored loans (i.e., consumer loans)
are pooled by product type.
The Firm generally measures the asset-specific allowance as the
difference between the recorded investment in the loan and the
present value of the cash flows expected to be collected, discounted
at the loan’s original effective interest rate. Subsequent changes in
impairment due to the impact of discounting are reported as an
adjustment to the provision for loan losses, not as an adjustment to
interest income. An asset-specific allowance for an impaired loan that
is determined using an observable market price is measured as the
difference between the recorded investment in the loan and the
loan’s fair value.
Certain loans are deemed collateral-dependent because repay-
ment of the loan is expected to be provided solely by the underly-
ing collateral, rather than by cash flows from the borrower’s
operations, income or other resources. Impaired collateral-
dependent loans are charged-off to the fair value of the collateral,
less costs to sell, rather than being subject to an asset-specific
reserve as for other impaired loans.
The determination of the fair value of the collateral depends on
the type of collateral (e.g., securities, real estate). In cases where
the collateral is in the form of liquid securities, the fair value is
based on quoted market prices or broker quotes. For illiquid
securities or other financial assets, the fair value of the collateral
is estimated using a discounted cash flow model.
For residential real estate loans, collateral values are based upon
external valuation sources. When it becomes likely that a bor-
rower is either unable or unwilling to pay, the Firm obtains a
broker’s price opinion of the home based on an exterior-only
valuation (“exterior opinions”). As soon as practicable after
taking physical possession of the property through foreclosure,
the Firm obtains an appraisal based on an inspection that in-
cludes the interior of the home (“interior appraisals”). Exterior
opinions and interior appraisals are discounted based upon the
Firm’s experience with actual liquidation values as compared to
the estimated values provided by exterior opinions and interior
appraisals, considering state- and product-specific factors.
For commercial real estate loans, the collateral value is generally
based on appraisals from internal and external valuation sources.
Collateral values are typically updated every six to twelve months,
either by obtaining a new appraisal or by performing an internal
analysis, in accordance with the Firm’s policies. The Firm also
considers both borrower- and market-specific factors, which may
result in obtaining appraisal updates or broker price opinions at
more frequent intervals.
See Note 3 on pages 170–187 of this Annual Report for further
information on the fair value hierarchy for impaired collateral-
dependent loans.
The formula-based component is based on a statistical calculation to
provide for probable principal losses inherent in performing risk-rated
loans and consumer loans, except for loans restructured in troubled
debt restructurings and PCI loans. See Note 14 on pages 220–238 of
this Annual Report for more information on PCI loans.
For risk-rated loans, the statistical calculation is the product of an
estimated probability of default and an estimated loss given default.
These factors are differentiated by risk rating and expected maturity.
In assessing the risk rating of a particular loan, among the factors
considered are the obligor’s debt capacity and financial flexibility, the
level of the obligor’s earnings, the amount and sources for repay-
ment, the level and nature of contingencies, management strength,
and the industry and geography in which the obligor operates. These
factors are based on an evaluation of historical and current informa-
tion, and involve subjective assessment and interpretation. Emphasiz-
ing one factor over another or considering additional factors could
impact the risk rating assigned by the Firm to that loan. PD estimates
are based on observable external through-the-cycle data, using
credit-rating agency default statistics. LGD estimates are based on the
Firm’s history of actual credit losses over more than one credit cycle.
For scored loans, the statistical calculation is performed on pools of
loans with similar risk characteristics (e.g., product type) and gener-
ally computed as the product of actual outstandings, an expected-
loss factor and an estimated-loss coverage period. Expected-loss
factors are statistically derived and consider historical factors such as
loss frequency and severity. In developing loss frequency and severity
assumptions, the Firm considers known and anticipated changes in
the economic environment, including changes in housing prices,
unemployment rates and other risk indicators.
A nationally recognized home price index measure is used to develop
loss severity estimates on defaulted residential real estate loans at
the metropolitan statistical areas (“MSA”) level. These loss severity
estimates are regularly validated by comparison to actual losses
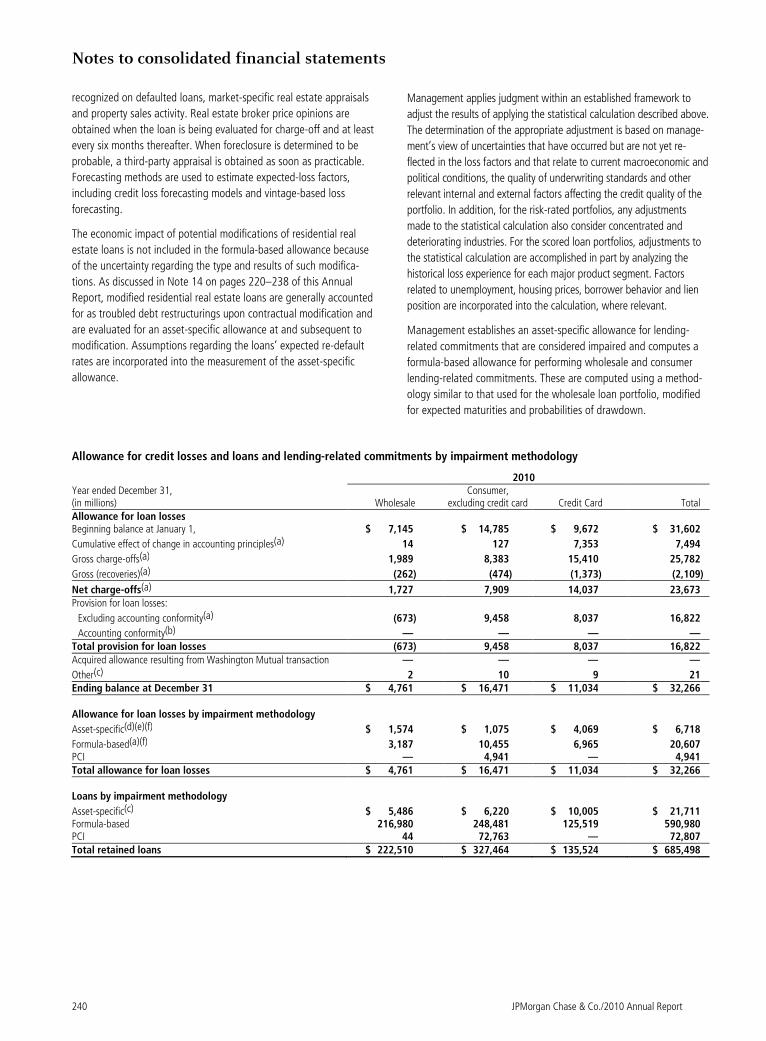
Notes to consolidated financial statements
240 JPMorgan Chase & Co./2010 Annual Report
recognized on defaulted loans, market-specific real estate appraisals
and property sales activity. Real estate broker price opinions are
obtained when the loan is being evaluated for charge-off and at least
every six months thereafter. When foreclosure is determined to be
probable, a third-party appraisal is obtained as soon as practicable.
Forecasting methods are used to estimate expected-loss factors,
including credit loss forecasting models and vintage-based loss
forecasting.
The economic impact of potential modifications of residential real
estate loans is not included in the formula-based allowance because
of the uncertainty regarding the type and results of such modifica-
tions. As discussed in Note 14 on pages 220–238 of this Annual
Report, modified residential real estate loans are generally accounted
for as troubled debt restructurings upon contractual modification and
are evaluated for an asset-specific allowance at and subsequent to
modification. Assumptions regarding the loans’ expected re-default
rates are incorporated into the measurement of the asset-specific
allowance.
Management applies judgment within an established framework to
adjust the results of applying the statistical calculation described above.
The determination of the appropriate adjustment is based on manage-
ment’s view of uncertainties that have occurred but are not yet re-
flected in the loss factors and that relate to current macroeconomic and
political conditions, the quality of underwriting standards and other
relevant internal and external factors affecting the credit quality of the
portfolio. In addition, for the risk-rated portfolios, any adjustments
made to the statistical calculation also consider concentrated and
deteriorating industries. For the scored loan portfolios, adjustments to
the statistical calculation are accomplished in part by analyzing the
historical loss experience for each major product segment. Factors
related to unemployment, housing prices, borrower behavior and lien
position are incorporated into the calculation, where relevant.
Management establishes an asset-specific allowance for lending-
related commitments that are considered impaired and computes a
formula-based allowance for performing wholesale and consumer
lending-related commitments. These are computed using a method-
ology similar to that used for the wholesale loan portfolio, modified
for expected maturities and probabilities of drawdown.
Allowance for credit losses and loans and lending-related commitments by impairment methodology
2010 Year ended December 31, (in millions) Wholesale
Consumer, excluding credit card Credit Card Total
Allowance for loan losses Beginning balance at January 1, $ 7,145 $ 14,785 $ 9,672 $ 31,602
Cumulative effect of change in accounting principles(a) 14 127 7,353 7,494
Gross charge-offs(a) 1,989 8,383 15,410 25,782
Gross (recoveries)(a) (262) (474) (1,373) (2,109)
Net charge-offs(a) 1,727 7,909 14,037 23,673 Provision for loan losses:
Excluding accounting conformity(a) (673) 9,458 8,037 16,822
Accounting conformity(b) — — — — Total provision for loan losses (673) 9,458 8,037 16,822 Acquired allowance resulting from Washington Mutual transaction — — — —
Other(c) 2 10 9 21 Ending balance at December 31 $ 4,761 $ 16,471 $ 11,034 $ 32,266 Allowance for loan losses by impairment methodology
Asset-specific(d)(e)(f) $ 1,574 $ 1,075 $ 4,069 $ 6,718
Formula-based(a)(f) 3,187 10,455 6,965 20,607 PCI — 4,941 — 4,941 Total allowance for loan losses $ 4,761 $ 16,471 $ 11,034 $ 32,266 Loans by impairment methodology
Asset-specific(c) $ 5,486 $ 6,220 $ 10,005 $ 21,711 Formula-based 216,980 248,481 125,519 590,980 PCI 44 72,763 — 72,807 Total retained loans $ 222,510 $ 327,464 $ 135,524 $ 685,498
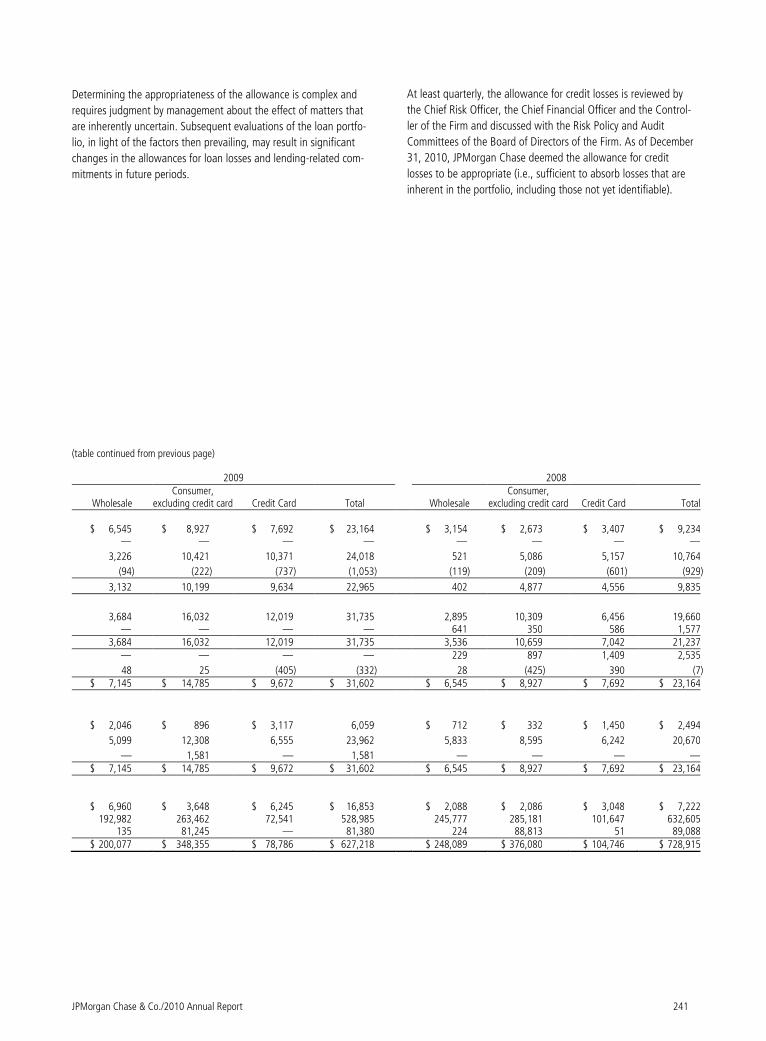
JPMorgan Chase & Co./2010 Annual Report 241
Determining the appropriateness of the allowance is complex and
requires judgment by management about the effect of matters that
are inherently uncertain. Subsequent evaluations of the loan portfo-
lio, in light of the factors then prevailing, may result in significant
changes in the allowances for loan losses and lending-related com-
mitments in future periods.
At least quarterly, the allowance for credit losses is reviewed by
the Chief Risk Officer, the Chief Financial Officer and the Control-
ler of the Firm and discussed with the Risk Policy and Audit
Committees of the Board of Directors of the Firm. As of December
31, 2010, JPMorgan Chase deemed the allowance for credit
losses to be appropriate (i.e., sufficient to absorb losses that are
inherent in the portfolio, including those not yet identifiable).
(table continued from previous page)
2009 2008
Wholesale Consumer,
excluding credit card Credit Card Total Wholesale Consumer,
excluding credit card Credit Card Total $ 6,545 $ 8,927 $ 7,692 $ 23,164 $ 3,154 $ 2,673 $ 3,407 $ 9,234 — — — — — — — —
3,226 10,421 10,371 24,018 521 5,086 5,157 10,764
(94) (222) (737) (1,053) (119) (209) (601) (929)
3,132 10,199 9,634 22,965 402 4,877 4,556 9,835
3,684 16,032 12,019 31,735 2,895 10,309 6,456 19,660 — — — — 641 350 586 1,577 3,684 16,032 12,019 31,735 3,536 10,659 7,042 21,237 — — — — 229 897 1,409 2,535
48 25 (405) (332) 28 (425) 390 (7) $ 7,145 $ 14,785 $ 9,672 $ 31,602 $ 6,545 $ 8,927 $ 7,692 $ 23,164
$ 2,046 $ 896 $ 3,117 6,059 $ 712 $ 332 $ 1,450 $ 2,494
5,099 12,308 6,555 23,962 5,833 8,595 6,242 20,670
— 1,581 — 1,581 — — — — $ 7,145 $ 14,785 $ 9,672 $ 31,602 $ 6,545 $ 8,927 $ 7,692 $ 23,164 $ 6,960 $ 3,648 $ 6,245 $ 16,853 $ 2,088 $ 2,086 $ 3,048 $ 7,222 192,982 263,462 72,541 528,985 245,777 285,181 101,647 632,605 135 81,245 — 81,380 224 88,813 51 89,088 $ 200,077 $ 348,355 $ 78,786 $ 627,218 $ 248,089 $ 376,080 $ 104,746 $ 728,915
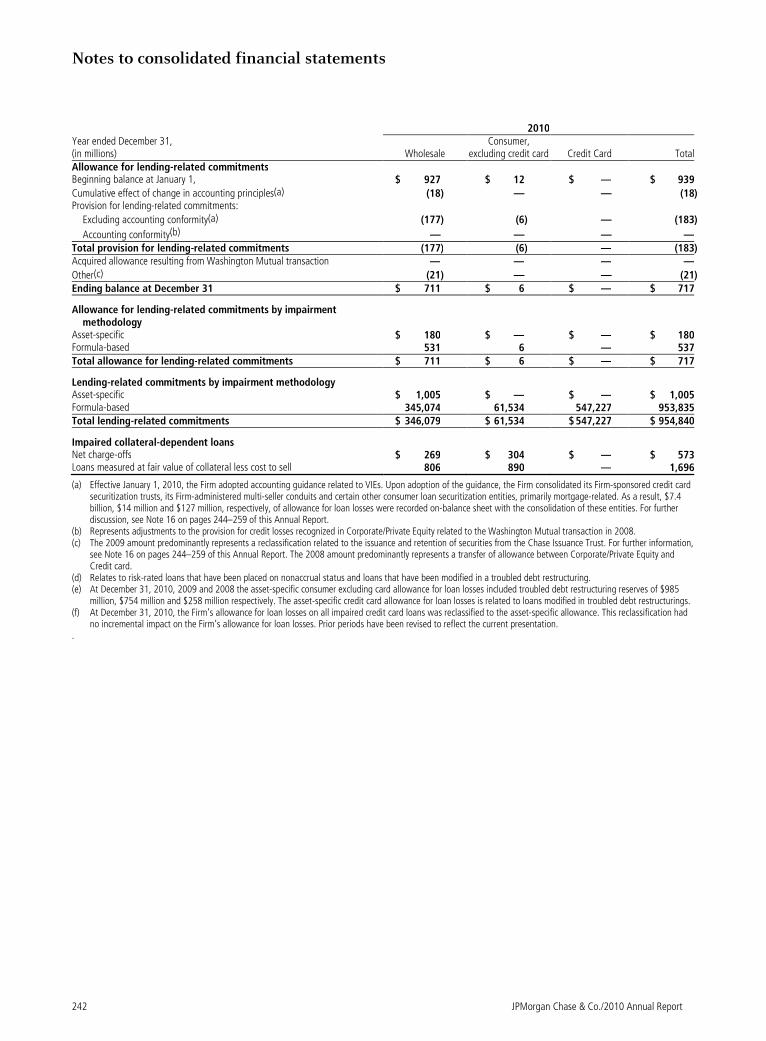
Notes to consolidated financial statements
242 JPMorgan Chase & Co./2010 Annual Report
2010 Year ended December 31, (in millions) Wholesale
Consumer, excluding credit card Credit Card Total
Allowance for lending-related commitments Beginning balance at January 1, $ 927 $ 12 $ — $ 939
Cumulative effect of change in accounting principles(a) (18) — — (18) Provision for lending-related commitments:
Excluding accounting conformity(a) (177) (6) — (183)
Accounting conformity(b) — — — — Total provision for lending-related commitments (177) (6) — (183) Acquired allowance resulting from Washington Mutual transaction — — — —
Other(c) (21) — — (21) Ending balance at December 31 $ 711 $ 6 $ — $ 717
Allowance for lending-related commitments by impairment methodology
Asset-specific $ 180 $ — $ — $ 180 Formula-based 531 6 — 537 Total allowance for lending-related commitments $ 711 $ 6 $ — $ 717
Lending-related commitments by impairment methodology Asset-specific $ 1,005 $ — $ — $ 1,005 Formula-based 345,074 61,534 547,227 953,835 Total lending-related commitments $ 346,079 $ 61,534 $ 547,227 $ 954,840
Impaired collateral-dependent loans Net charge-offs $ 269 $ 304 $ — $ 573 Loans measured at fair value of collateral less cost to sell 806 890 — 1,696
(a) Effective January 1, 2010, the Firm adopted accounting guidance related to VIEs. Upon adoption of the guidance, the Firm consolidated its Firm-sponsored credit card securitization trusts, its Firm-administered multi-seller conduits and certain other consumer loan securitization entities, primarily mortgage-related. As a result, $7.4 billion, $14 million and $127 million, respectively, of allowance for loan losses were recorded on-balance sheet with the consolidation of these entities. For further discussion, see Note 16 on pages 244–259 of this Annual Report.
(b) Represents adjustments to the provision for credit losses recognized in Corporate/Private Equity related to the Washington Mutual transaction in 2008. (c) The 2009 amount predominantly represents a reclassification related to the issuance and retention of securities from the Chase Issuance Trust. For further information,
see Note 16 on pages 244–259 of this Annual Report. The 2008 amount predominantly represents a transfer of allowance between Corporate/Private Equity and Credit card.
(d) Relates to risk-rated loans that have been placed on nonaccrual status and loans that have been modified in a troubled debt restructuring. (e) At December 31, 2010, 2009 and 2008 the asset-specific consumer excluding card allowance for loan losses included troubled debt restructuring reserves of $985
million, $754 million and $258 million respectively. The asset-specific credit card allowance for loan losses is related to loans modified in troubled debt restructurings. (f) At December 31, 2010, the Firm’s allowance for loan losses on all impaired credit card loans was reclassified to the asset-specific allowance. This reclassification had
no incremental impact on the Firm’s allowance for loan losses. Prior periods have been revised to reflect the current presentation. .
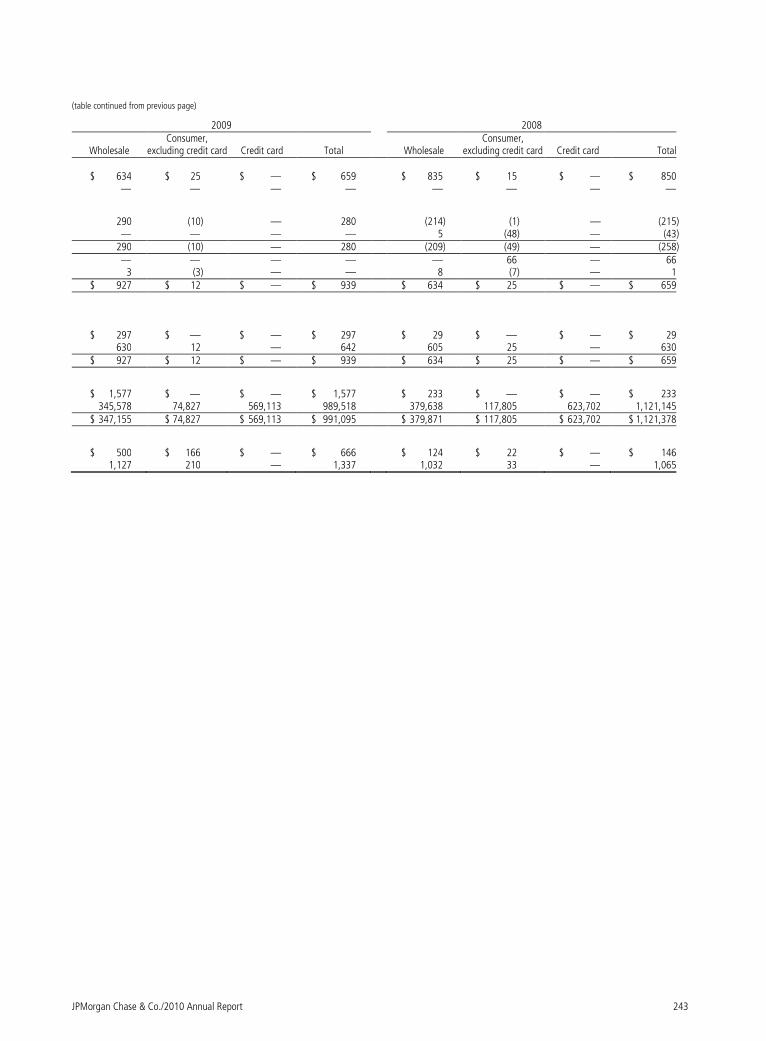
JPMorgan Chase & Co./2010 Annual Report 243
(table continued from previous page)
2009 2008
Wholesale Consumer,
excluding credit card Credit card Total Wholesale Consumer,
excluding credit card Credit card Total $ 634 $ 25 $ — $ 659 $ 835 $ 15 $ — $ 850 — — — — — — — —
290 (10) — 280 (214) (1) — (215) — — — — 5 (48) — (43) 290 (10) — 280 (209) (49) — (258) — — — — — 66 — 66 3 (3) — — 8 (7) — 1 $ 927 $ 12 $ — $ 939 $ 634 $ 25 $ — $ 659
$ 297 $ — $ — $ 297 $ 29 $ — $ — $ 29 630 12 — 642 605 25 — 630 $ 927 $ 12 $ — $ 939 $ 634 $ 25 $ — $ 659
$ 1,577 $ — $ — $ 1,577 $ 233 $ — $ — $ 233 345,578 74,827 569,113 989,518 379,638 117,805 623,702 1,121,145 $ 347,155 $ 74,827 $ 569,113 $ 991,095 $ 379,871 $ 117,805 $ 623,702 $ 1,121,378
$ 500 $ 166 $ — $ 666 $ 124 $ 22 $ — $ 146 1,127 210 — 1,337 1,032 33 — 1,065
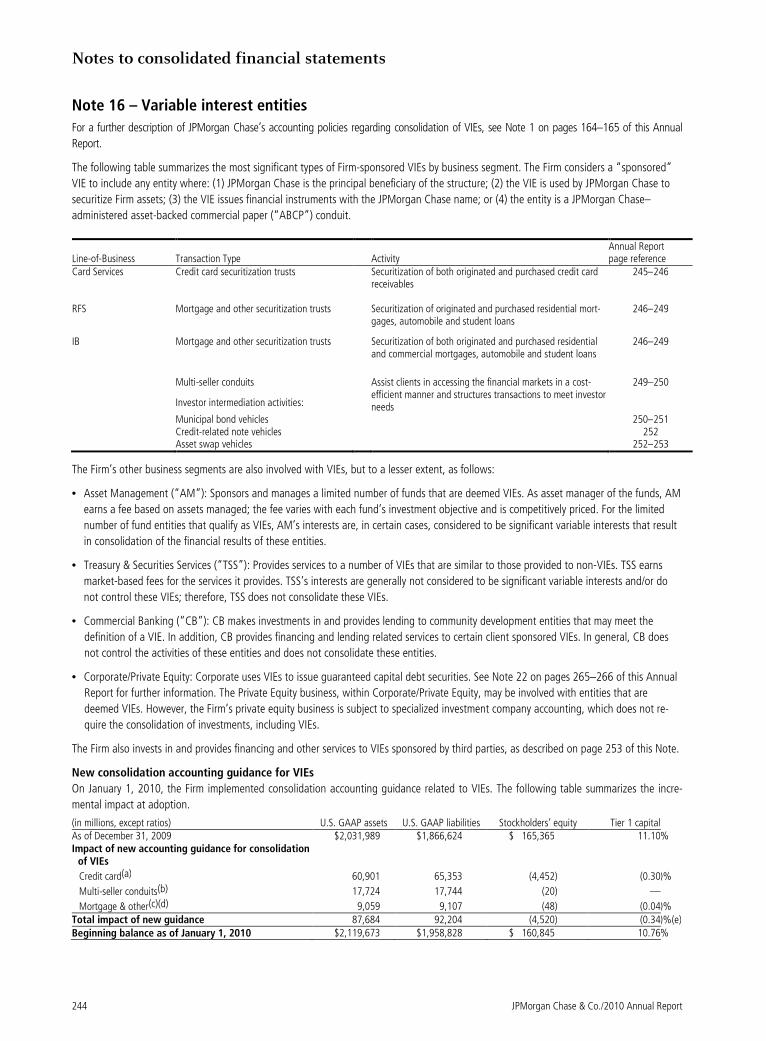
Notes to consolidated financial statements
244 JPMorgan Chase & Co./2010 Annual Report
Note 16 – Variable interest entities
For a further description of JPMorgan Chase’s accounting policies regarding consolidation of VIEs, see Note 1 on pages 164–165 of this Annual
Report.
The following table summarizes the most significant types of Firm-sponsored VIEs by business segment. The Firm considers a “sponsored”
VIE to include any entity where: (1) JPMorgan Chase is the principal beneficiary of the structure; (2) the VIE is used by JPMorgan Chase to
securitize Firm assets; (3) the VIE issues financial instruments with the JPMorgan Chase name; or (4) the entity is a JPMorgan Chase–
administered asset-backed commercial paper (“ABCP”) conduit.
Line-of-Business Transaction Type Activity Annual Report page reference
Card Services Credit card securitization trusts Securitization of both originated and purchased credit card receivables
245–246
RFS Mortgage and other securitization trusts Securitization of originated and purchased residential mort-gages, automobile and student loans
246–249
IB Mortgage and other securitization trusts Securitization of both originated and purchased residential and commercial mortgages, automobile and student loans
246–249
Multi-seller conduits
Investor intermediation activities:
Assist clients in accessing the financial markets in a cost-efficient manner and structures transactions to meet investor needs
249–250
Municipal bond vehicles 250–251 Credit-related note vehicles 252 Asset swap vehicles 252–253
The Firm’s other business segments are also involved with VIEs, but to a lesser extent, as follows:
• Asset Management (“AM”): Sponsors and manages a limited number of funds that are deemed VIEs. As asset manager of the funds, AM
earns a fee based on assets managed; the fee varies with each fund’s investment objective and is competitively priced. For the limited
number of fund entities that qualify as VIEs, AM’s interests are, in certain cases, considered to be significant variable interests that result
in consolidation of the financial results of these entities.
• Treasury & Securities Services (“TSS”): Provides services to a number of VIEs that are similar to those provided to non-VIEs. TSS earns
market-based fees for the services it provides. TSS’s interests are generally not considered to be significant variable interests and/or do
not control these VIEs; therefore, TSS does not consolidate these VIEs.
• Commercial Banking (“CB”): CB makes investments in and provides lending to community development entities that may meet the
definition of a VIE. In addition, CB provides financing and lending related services to certain client sponsored VIEs. In general, CB does
not control the activities of these entities and does not consolidate these entities.
• Corporate/Private Equity: Corporate uses VIEs to issue guaranteed capital debt securities. See Note 22 on pages 265–266 of this Annual
Report for further information. The Private Equity business, within Corporate/Private Equity, may be involved with entities that are
deemed VIEs. However, the Firm’s private equity business is subject to specialized investment company accounting, which does not re-
quire the consolidation of investments, including VIEs.
The Firm also invests in and provides financing and other services to VIEs sponsored by third parties, as described on page 253 of this Note.
New consolidation accounting guidance for VIEs
On January 1, 2010, the Firm implemented consolidation accounting guidance related to VIEs. The following table summarizes the incre-
mental impact at adoption.
(in millions, except ratios) U.S. GAAP assets U.S. GAAP liabilities Stockholders’ equity Tier 1 capital As of December 31, 2009 $2,031,989 $1,866,624 $ 165,365 11.10 % Impact of new accounting guidance for consolidation
of VIEs
Credit card(a) 60,901 65,353 (4,452) (0.30 )%
Multi-seller conduits(b) 17,724 17,744 (20) —
Mortgage & other(c)(d) 9,059 9,107 (48) (0.04 )% Total impact of new guidance 87,684 92,204 (4,520) (0.34 )%(e) Beginning balance as of January 1, 2010 $2,119,673 $1,958,828 $ 160,845 10.76 %
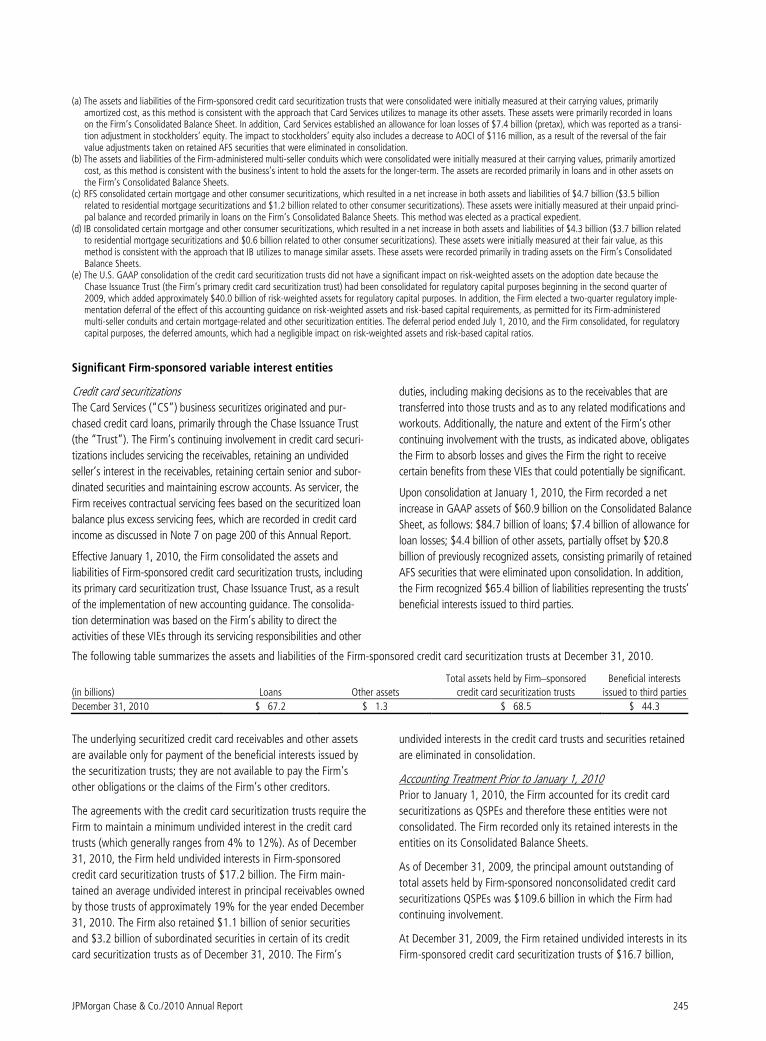
JPMorgan Chase & Co./2010 Annual Report 245
(a) The assets and liabilities of the Firm-sponsored credit card securitization trusts that were consolidated were initially measured at their carrying values, primarily amortized cost, as this method is consistent with the approach that Card Services utilizes to manage its other assets. These assets were primarily recorded in loans on the Firm’s Consolidated Balance Sheet. In addition, Card Services established an allowance for loan losses of $7.4 billion (pretax), which was reported as a transi-tion adjustment in stockholders’ equity. The impact to stockholders’ equity also includes a decrease to AOCI of $116 million, as a result of the reversal of the fair value adjustments taken on retained AFS securities that were eliminated in consolidation.
(b) The assets and liabilities of the Firm-administered multi-seller conduits which were consolidated were initially measured at their carrying values, primarily amortized cost, as this method is consistent with the business’s intent to hold the assets for the longer-term. The assets are recorded primarily in loans and in other assets on the Firm’s Consolidated Balance Sheets.
(c) RFS consolidated certain mortgage and other consumer securitizations, which resulted in a net increase in both assets and liabilities of $4.7 billion ($3.5 billion related to residential mortgage securitizations and $1.2 billion related to other consumer securitizations). These assets were initially measured at their unpaid princi-pal balance and recorded primarily in loans on the Firm’s Consolidated Balance Sheets. This method was elected as a practical expedient.
(d) IB consolidated certain mortgage and other consumer securitizations, which resulted in a net increase in both assets and liabilities of $4.3 billion ($3.7 billion related to residential mortgage securitizations and $0.6 billion related to other consumer securitizations). These assets were initially measured at their fair value, as this method is consistent with the approach that IB utilizes to manage similar assets. These assets were recorded primarily in trading assets on the Firm’s Consolidated Balance Sheets.
(e) The U.S. GAAP consolidation of the credit card securitization trusts did not have a significant impact on risk-weighted assets on the adoption date because the Chase Issuance Trust (the Firm’s primary credit card securitization trust) had been consolidated for regulatory capital purposes beginning in the second quarter of 2009, which added approximately $40.0 billion of risk-weighted assets for regulatory capital purposes. In addition, the Firm elected a two-quarter regulatory imple-mentation deferral of the effect of this accounting guidance on risk-weighted assets and risk-based capital requirements, as permitted for its Firm-administered multi-seller conduits and certain mortgage-related and other securitization entities. The deferral period ended July 1, 2010, and the Firm consolidated, for regulatory capital purposes, the deferred amounts, which had a negligible impact on risk-weighted assets and risk-based capital ratios.
Significant Firm-sponsored variable interest entities
Credit card securitizations
The Card Services (“CS”) business securitizes originated and pur-
chased credit card loans, primarily through the Chase Issuance Trust
(the “Trust”). The Firm’s continuing involvement in credit card securi-
tizations includes servicing the receivables, retaining an undivided
seller’s interest in the receivables, retaining certain senior and subor-
dinated securities and maintaining escrow accounts. As servicer, the
Firm receives contractual servicing fees based on the securitized loan
balance plus excess servicing fees, which are recorded in credit card
income as discussed in Note 7 on page 200 of this Annual Report.
Effective January 1, 2010, the Firm consolidated the assets and
liabilities of Firm-sponsored credit card securitization trusts, including
its primary card securitization trust, Chase Issuance Trust, as a result
of the implementation of new accounting guidance. The consolida-
tion determination was based on the Firm’s ability to direct the
activities of these VIEs through its servicing responsibilities and other
duties, including making decisions as to the receivables that are
transferred into those trusts and as to any related modifications and
workouts. Additionally, the nature and extent of the Firm’s other
continuing involvement with the trusts, as indicated above, obligates
the Firm to absorb losses and gives the Firm the right to receive
certain benefits from these VIEs that could potentially be significant.
Upon consolidation at January 1, 2010, the Firm recorded a net
increase in GAAP assets of $60.9 billion on the Consolidated Balance
Sheet, as follows: $84.7 billion of loans; $7.4 billion of allowance for
loan losses; $4.4 billion of other assets, partially offset by $20.8
billion of previously recognized assets, consisting primarily of retained
AFS securities that were eliminated upon consolidation. In addition,
the Firm recognized $65.4 billion of liabilities representing the trusts’
beneficial interests issued to third parties.
The following table summarizes the assets and liabilities of the Firm-sponsored credit card securitization trusts at December 31, 2010.
(in billions) Loans Other assets
Total assets held by Firm–sponsored
credit card securitization trusts
Beneficial interests
issued to third parties
December 31, 2010 $ 67.2 $ 1.3 $ 68.5 $ 44.3
The underlying securitized credit card receivables and other assets
are available only for payment of the beneficial interests issued by
the securitization trusts; they are not available to pay the Firm’s
other obligations or the claims of the Firm’s other creditors.
The agreements with the credit card securitization trusts require the
Firm to maintain a minimum undivided interest in the credit card
trusts (which generally ranges from 4% to 12%). As of December
31, 2010, the Firm held undivided interests in Firm-sponsored
credit card securitization trusts of $17.2 billion. The Firm main-
tained an average undivided interest in principal receivables owned
by those trusts of approximately 19% for the year ended December
31, 2010. The Firm also retained $1.1 billion of senior securities
and $3.2 billion of subordinated securities in certain of its credit
card securitization trusts as of December 31, 2010. The Firm’s
undivided interests in the credit card trusts and securities retained
are eliminated in consolidation.
Accounting Treatment Prior to January 1, 2010
Prior to January 1, 2010, the Firm accounted for its credit card
securitizations as QSPEs and therefore these entities were not
consolidated. The Firm recorded only its retained interests in the
entities on its Consolidated Balance Sheets.
As of December 31, 2009, the principal amount outstanding of
total assets held by Firm-sponsored nonconsolidated credit card
securitizations QSPEs was $109.6 billion in which the Firm had
continuing involvement.
At December 31, 2009, the Firm retained undivided interests in its
Firm-sponsored credit card securitization trusts of $16.7 billion,
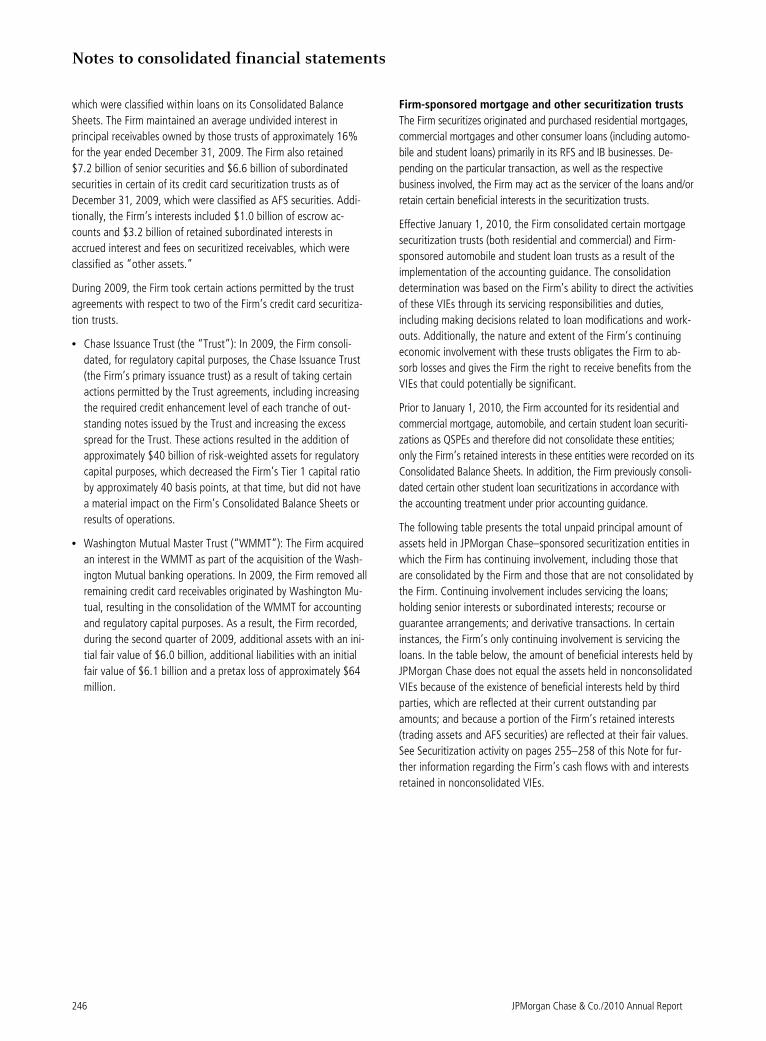
Notes to consolidated financial statements
246 JPMorgan Chase & Co./2010 Annual Report
which were classified within loans on its Consolidated Balance
Sheets. The Firm maintained an average undivided interest in
principal receivables owned by those trusts of approximately 16%
for the year ended December 31, 2009. The Firm also retained
$7.2 billion of senior securities and $6.6 billion of subordinated
securities in certain of its credit card securitization trusts as of
December 31, 2009, which were classified as AFS securities. Addi-
tionally, the Firm’s interests included $1.0 billion of escrow ac-
counts and $3.2 billion of retained subordinated interests in
accrued interest and fees on securitized receivables, which were
classified as “other assets.”
During 2009, the Firm took certain actions permitted by the trust
agreements with respect to two of the Firm’s credit card securitiza-
tion trusts.
• Chase Issuance Trust (the “Trust”): In 2009, the Firm consoli-
dated, for regulatory capital purposes, the Chase Issuance Trust
(the Firm’s primary issuance trust) as a result of taking certain
actions permitted by the Trust agreements, including increasing
the required credit enhancement level of each tranche of out-
standing notes issued by the Trust and increasing the excess
spread for the Trust. These actions resulted in the addition of
approximately $40 billion of risk-weighted assets for regulatory
capital purposes, which decreased the Firm’s Tier 1 capital ratio
by approximately 40 basis points, at that time, but did not have
a material impact on the Firm’s Consolidated Balance Sheets or
results of operations.
• Washington Mutual Master Trust (“WMMT”): The Firm acquired
an interest in the WMMT as part of the acquisition of the Wash-
ington Mutual banking operations. In 2009, the Firm removed all
remaining credit card receivables originated by Washington Mu-
tual, resulting in the consolidation of the WMMT for accounting
and regulatory capital purposes. As a result, the Firm recorded,
during the second quarter of 2009, additional assets with an ini-
tial fair value of $6.0 billion, additional liabilities with an initial
fair value of $6.1 billion and a pretax loss of approximately $64
million.
Firm-sponsored mortgage and other securitization trusts
The Firm securitizes originated and purchased residential mortgages,
commercial mortgages and other consumer loans (including automo-
bile and student loans) primarily in its RFS and IB businesses. De-
pending on the particular transaction, as well as the respective
business involved, the Firm may act as the servicer of the loans and/or
retain certain beneficial interests in the securitization trusts.
Effective January 1, 2010, the Firm consolidated certain mortgage
securitization trusts (both residential and commercial) and Firm-
sponsored automobile and student loan trusts as a result of the
implementation of the accounting guidance. The consolidation
determination was based on the Firm’s ability to direct the activities
of these VIEs through its servicing responsibilities and duties,
including making decisions related to loan modifications and work-
outs. Additionally, the nature and extent of the Firm’s continuing
economic involvement with these trusts obligates the Firm to ab-
sorb losses and gives the Firm the right to receive benefits from the
VIEs that could potentially be significant.
Prior to January 1, 2010, the Firm accounted for its residential and
commercial mortgage, automobile, and certain student loan securiti-
zations as QSPEs and therefore did not consolidate these entities;
only the Firm’s retained interests in these entities were recorded on its
Consolidated Balance Sheets. In addition, the Firm previously consoli-
dated certain other student loan securitizations in accordance with
the accounting treatment under prior accounting guidance.
The following table presents the total unpaid principal amount of
assets held in JPMorgan Chase–sponsored securitization entities in
which the Firm has continuing involvement, including those that
are consolidated by the Firm and those that are not consolidated by
the Firm. Continuing involvement includes servicing the loans;
holding senior interests or subordinated interests; recourse or
guarantee arrangements; and derivative transactions. In certain
instances, the Firm’s only continuing involvement is servicing the
loans. In the table below, the amount of beneficial interests held by
JPMorgan Chase does not equal the assets held in nonconsolidated
VIEs because of the existence of beneficial interests held by third
parties, which are reflected at their current outstanding par
amounts; and because a portion of the Firm’s retained interests
(trading assets and AFS securities) are reflected at their fair values.
See Securitization activity on pages 255–258 of this Note for fur-
ther information regarding the Firm’s cash flows with and interests
retained in nonconsolidated VIEs.
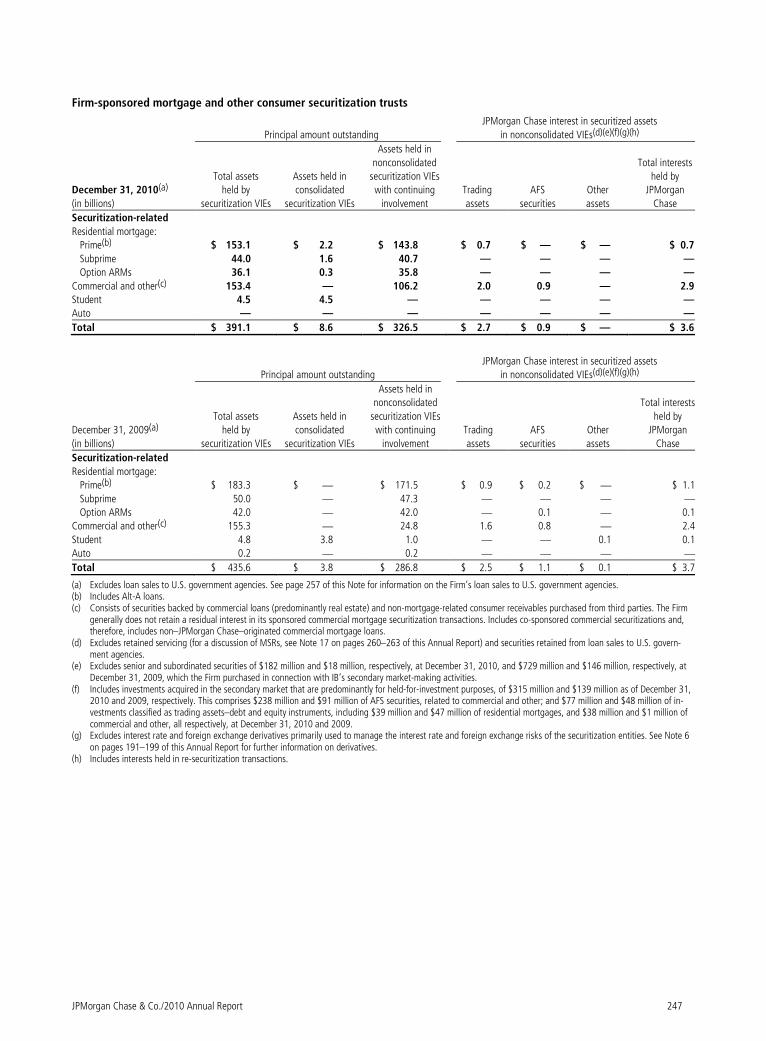
JPMorgan Chase & Co./2010 Annual Report 247
Firm-sponsored mortgage and other consumer securitization trusts
Principal amount outstanding
JPMorgan Chase interest in securitized assets
in nonconsolidated VIEs(d)(e)(f)(g)(h)
December 31, 2010(a)
(in billions)
Total assets
held by
securitization VIEs
Assets held in
consolidated
securitization VIEs
Assets held in
nonconsolidated
securitization VIEs
with continuing
involvement
Trading
assets
AFS
securities
Other
assets
Total interests
held by
JPMorgan
Chase
Securitization-related
Residential mortgage:
Prime(b) $ 153.1 $ 2.2 $ 143.8 $ 0.7 $ — $ — $ 0.7
Subprime 44.0 1.6 40.7 — — — —
Option ARMs 36.1 0.3 35.8 — — — —
Commercial and other(c) 153.4 — 106.2 2.0 0.9 — 2.9
Student 4.5 4.5 — — — — —
Auto — — — — — — —
Total $ 391.1 $ 8.6 $ 326.5 $ 2.7 $ 0.9 $ — $ 3.6
Principal amount outstanding
JPMorgan Chase interest in securitized assets
in nonconsolidated VIEs(d)(e)(f)(g)(h)
December 31, 2009(a)
(in billions)
Total assets
held by
securitization VIEs
Assets held in
consolidated
securitization VIEs
Assets held in
nonconsolidated
securitization VIEs
with continuing
involvement
Trading
assets
AFS
securities
Other
assets
Total interests
held by
JPMorgan
Chase
Securitization-related
Residential mortgage:
Prime(b) $ 183.3 $ — $ 171.5 $ 0.9 $ 0.2 $ — $ 1.1
Subprime 50.0 — 47.3 — — — —Option ARMs 42.0 — 42.0 — 0.1 — 0.1
Commercial and other(c) 155.3 — 24.8 1.6 0.8 — 2.4
Student 4.8 3.8 1.0 — — 0.1 0.1
Auto 0.2 — 0.2 — — — —Total $ 435.6 $ 3.8 $ 286.8 $ 2.5 $ 1.1 $ 0.1 $ 3.7
(a) Excludes loan sales to U.S. government agencies. See page 257 of this Note for information on the Firm’s loan sales to U.S. government agencies. (b) Includes Alt-A loans. (c) Consists of securities backed by commercial loans (predominantly real estate) and non-mortgage-related consumer receivables purchased from third parties. The Firm
generally does not retain a residual interest in its sponsored commercial mortgage securitization transactions. Includes co-sponsored commercial securitizations and, therefore, includes non–JPMorgan Chase–originated commercial mortgage loans.
(d) Excludes retained servicing (for a discussion of MSRs, see Note 17 on pages 260–263 of this Annual Report) and securities retained from loan sales to U.S. govern-ment agencies.
(e) Excludes senior and subordinated securities of $182 million and $18 million, respectively, at December 31, 2010, and $729 million and $146 million, respectively, at December 31, 2009, which the Firm purchased in connection with IB’s secondary market-making activities.
(f) Includes investments acquired in the secondary market that are predominantly for held-for-investment purposes, of $315 million and $139 million as of December 31, 2010 and 2009, respectively. This comprises $238 million and $91 million of AFS securities, related to commercial and other; and $77 million and $48 million of in-vestments classified as trading assets–debt and equity instruments, including $39 million and $47 million of residential mortgages, and $38 million and $1 million of commercial and other, all respectively, at December 31, 2010 and 2009.
(g) Excludes interest rate and foreign exchange derivatives primarily used to manage the interest rate and foreign exchange risks of the securitization entities. See Note 6 on pages 191–199 of this Annual Report for further information on derivatives.
(h) Includes interests held in re-securitization transactions.

Notes to consolidated financial statements
248 JPMorgan Chase & Co./2010 Annual Report
Residential mortgage The Firm securitizes residential mortgage loans originated by RFS,
as well as residential mortgage loans purchased from third parties
by either RFS or IB. RFS generally retains servicing for all residential
mortgage loans originated or purchased by RFS, and for certain
mortgage loans purchased by IB.
For securitizations serviced by RFS, the Firm has the power to direct
the significant activities of the VIE because it is responsible for
decisions related to loan modifications and workouts. In a limited
number of these securitizations, RFS also retains an interest in the
VIE that could potentially be significant to the VIE. In these in-
stances, the Firm is deemed to be the primary beneficiary. At
December 31, 2010, approximately $2.9 billion of assets and $3.0
billion of liabilities of Firm-sponsored residential mortgage securiti-
zation trusts were consolidated on balance sheet. For Firm-
sponsored securitizations serviced by unrelated third parties, the
Firm does not consolidate the VIE as the power to direct the signifi-
cant activities resides with the third party servicer. At December 31,
2009, RFS did not consolidate any VIEs in accordance with the
accounting treatment under prior accounting rules. RFS held re-
tained interests of approximately $205 million and $537 million as
of December 31, 2010 and 2009, respectively, in nonconsolidated
residential mortgage securitization entities. See pages 257–258 of
this Note for further information on retained interests held in non-
consolidated VIEs; these retained interests are classified as trading
assets or AFS securities.
The Firm’s mortgage loan sales are primarily nonrecourse, thereby
effectively transferring the risk of future credit losses to the pur-
chaser of the mortgage-backed securities issued by the trust. How-
ever, for a limited number of loan sales, the Firm is obligated to
share a portion of the credit risk associated with the sold loans with
the purchaser. See Note 30 on pages 275–280 of this Annual
Report for additional information on loans sold with recourse, as
well as information on indemnification liability for breaches of
representations and warranties. See page 257 of this Note for
further information on loans sold to U.S. government agencies.
IB engages in underwriting and trading activities involving securi-
ties issued by Firm-sponsored securitization trusts. As a result, IB at
times retains senior and/or subordinated interests (including resid-
ual interests) in residential mortgage securitizations upon securiti-
zation, and/or reacquires positions in the secondary market in the
normal course of business. In certain instances, as a result of the
positions retained or reacquired by IB, when considered together
with the servicing arrangements entered into by RFS, the Firm is
deemed to be the primary beneficiary of certain securitization
trusts. At December 31, 2010, $1.2 billion of VIE assets and $702
million of liabilities were consolidated due to IB’s involvement with
such trusts. IB did not consolidate any residential securitization VIEs
at December 31, 2009, in accordance with the accounting treat-
ment under prior accounting rules. IB held approximately $461
million, and $479 million of senior and subordinated interests at
December 31, 2010 and 2009, respectively, in nonconsolidated
residential mortgage securitization entities. This includes approxi-
mately $1 million and $2 million of residual interests at December
31, 2010 and 2009, respectively. See pages 257–258 of this Note
for further information on interests held in nonconsolidated securi-
tizations. These retained interests are accounted for at fair value
and classified as trading assets.
Commercial mortgages and other consumer securitizations IB originates and securitizes commercial mortgage loans, and
engages in underwriting and trading activities involving the securi-
ties issued by securitization trusts. IB may retain unsold senior
and/or subordinated interests in commercial mortgage securitiza-
tions at the time of securitization but, generally, the Firm does not
service commercial loan securitizations. For commercial mortgage
securitizations the power to direct the significant activities of the
VIE generally is held by the servicer or investors in a specified class
of securities (“controlling class”). At December 31, 2010, approxi-
mately $84 million of VIE assets and $82 million of VIE liabilities of
commercial mortgage securitization trusts were consolidated due to
the Firm holding certain subordinated interests that give the Firm
the power to direct the activities of these entities as well as a
significant interest. IB did not consolidate any commercial mort-
gage securitization VIEs at December 31, 2009, in accordance with
the accounting treatment under prior accounting rules. At Decem-
ber 31, 2010 and 2009, the Firm held $2.0 billion and $1.6 billion,
respectively, of retained interests in nonconsolidated commercial
mortgage securitizations. This included approximately zero and $22
million of residual interests as of December 31, 2010 and 2009,
respectively.
The Firm also securitizes automobile and student loans originated by
RFS, and consumer loans (including automobile and student loans)
purchased by IB. The Firm retains servicing responsibilities for all
originated and certain purchased student and automobile loans and
has the power to direct the activities of these VIEs through these
servicing responsibilities. At December 31, 2010, $4.5 billion of
assets and $3.2 billion of liabilities of student loan securitizations
were consolidated due to the combination of retained interests held
by the Firm and servicing responsibilities. Auto loans previously
securitized were repurchased by the Firm during 2010 as these
securitization entities were terminated. As of December 31, 2009,
the Firm held $9 million and $49 million of retained interests in
securitized automobile and student loan securitizations, respectively,
which were not consolidated in accordance with the accounting
treatment under prior accounting rules. These retained interests were
reported in other assets. In addition, at December 31, 2009, the Firm
held interests in other student loans which resulted in $3.8 billion of
other student loans being consolidated on the balance sheet in
accordance with the accounting treatment under prior accounting
rules.
Re-securitizations The Firm engages in re-securitization transactions in which securi-
ties are transferred to a VIE in exchange for new beneficial inter-
ests. Re-securitizations involve the repackaging of securities
previously issued by both agency sponsored (Fannie Mae, Freddie
Mac and Ginnie Mae) and nonagency (private-label) VIEs that are
generally backed by either residential or commercial mortgages. A
re-securitization entity receives principal and interest payments
JPMorgan Chase & Co./2010 Annual Report 249
from the securities held in the entity and passes them to the benefi-
cial interest holders. These entities are not actively managed and
are passive in nature. Re-securitization entities are often estab-
lished to the specifications of the investors. In a re-securitization
entity, the most significant power is in the design of the entity (i.e.,
the decision as to the specific security or securities to be repack-
aged and the terms of the beneficial interests issued). The power
over a re-securitization entity is often considered to be shared
between the sponsor and investor(s) that are significantly involved
in the creation and design of the re-securitization entity. At Decem-
ber 31, 2010, the Firm did not consolidate any agency re-
securitizations, as it did not have the unilateral power to direct the
significant activities of the re-securitization entity. At December 31,
2010, the Firm consolidated $477 million of assets and $230
million of liabilities of private-label re-securitizations, as the Firm
had both the unilateral power to direct the significant activities of,
and retained a significant interest in, these re-securitization entities.
As of December 31, 2009, the Firm did not consolidate any re-
securitization entities (agency or private-label) in accordance with
the accounting treatment under prior accounting rules.
During the years ended December 31, 2010, 2009, and 2008, the
Firm transferred $33.9 billion, $19.1 billion and $16.8 billion,
respectively, of securities to agency re-securitization entities and
$1.3 billion, $4.0 billion and $2.7 billion to private-label re-
securitization entities. At December 31, 2010 and 2009, the Firm
held approximately $3.5 billion and $1.6 billion of both senior and
subordinated interests in nonconsolidated agency re-securitization
entities and $46 million and $220 million of both senior and subor-
dinated interests, in nonconsolidated private-label re-securitization
entities. See pages 257–258 of this Note for further information on
interests held in nonconsolidated securitization VIEs.
Multi-seller conduits
The Firm is an active participant in the asset-backed securities
business, and it helps customers meet their financing needs by
providing access to the commercial paper markets through VIEs
known as multi-seller conduits. Multi-seller conduit entities are
separate bankruptcy remote entities that purchase interests in, and
make loans secured by, pools of receivables and other financial
assets pursuant to agreements with customers of the Firm. The
conduits fund their purchases and loans through the issuance of
highly rated commercial paper to third-party investors. The primary
source of repayment of the commercial paper is the cash flows from
the pools of assets. In most instances, the assets are structured
with deal-specific credit enhancements provided by the customers
(i.e., sellers) to the conduits or other third parties. Deal-specific
credit enhancements are generally structured to cover a multiple of
historical losses expected on the pool of assets, and are typically in
the form of overcollateralization provided by the seller, but also
may include any combination of the following: recourse to the seller
or originator, cash collateral accounts, letters of credit, excess
spread, retention of subordinated interests or third-party guaran-
tees. The deal-specific credit enhancements mitigate the Firm’s
potential losses on its agreements with the conduits.
To ensure timely repayment of the commercial paper, each asset
pool financed by the conduits has a minimum 100% deal-specific
liquidity facility associated with it. Deal-specific liquidity facilities
are the primary source of liquidity support for the conduits and are
typically in the form of asset purchase agreements. They are gener-
ally structured so the liquidity that will be provided by the Firm (as
liquidity provider) will be effected by the Firm purchasing, or lend-
ing against, a pool of nondefaulted, performing assets. In limited
circumstances, the Firm may provide unconditional liquidity.
The conduit’s administrative agent can require the liquidity provider
to perform under its asset purchase agreement with the conduit at
any time. These agreements may cause the liquidity provider, which
is generally the Firm, to purchase an asset from the conduit at an
amount above the asset’s then current fair value – in effect, provid-
ing a guarantee of the asset’s initial value.
The Firm also provides the multi-seller conduit vehicles with program-
wide liquidity facilities in the form of uncommitted short-term revolv-
ing facilities established to handle funding increments too small to be
funded by commercial paper and that can be accessed by the con-
duits only in the event of short-term disruptions in the commercial
paper market.
Because the majority of the deal-specific liquidity facilities will only
fund nondefaulted assets, program-wide credit enhancement is
required to absorb losses on defaulted receivables in excess of losses
absorbed by any deal-specific credit enhancement. Program-wide
credit enhancement may be provided by JPMorgan Chase in the form
of standby letters of credit or by third-party surety bond providers. The
amount of program-wide credit enhancement required varies by
conduit and ranges between 5% and 10% of the applicable commer-
cial paper that is outstanding. The Firm provided $2.0 billion and
$2.4 billion of program-wide credit enhancement at December 31,
2010 and 2009, respectively.
JPMorgan Chase receives fees for structuring multi-seller conduit
transactions and compensation from the multi-seller conduits for its
role as administrative agent, liquidity provider, and provider of
program-wide credit enhancement.
Effective January 1, 2010, the Firm consolidated its Firm-
administered multi-seller conduits, as the Firm has both the power
to direct the significant activities of the conduits and a potentially
significant economic interest in the conduits. The Firm directs the
economic performance of the conduits as administrative agent and
in its role in structuring transactions for the conduits. In these roles,
the Firm makes decisions regarding concentration of asset types
and credit quality of transactions, and is responsible for managing
the commercial paper funding needs of the conduits. The Firm’s
interests that could potentially be significant to the VIEs include the
fees received as administrative agent, liquidity provider and pro-
vider of program-wide credit enhancement, as well as the Firm’s
potential exposure as a result of the liquidity and credit enhance-
ment facilities provided to the conduits.
Notes to consolidated financial statements
250 JPMorgan Chase & Co./2010 Annual Report
December 31, 2010 (in billions) Loans Other assets
Total assets held by Firm-
administered multi-seller conduits
Commercial paper
issued to third parties
Consolidated(a) $ 21.1 $ 0.6 $ 21.7 $ 21.6
(a) The Firm provided certain deal-specific liquidity facilities (primarily asset purchase agreements); program-wide liquidity facilities; and program-wide credit enhancements that were eliminated in consolidation.
Accounting Treatment Prior to January 1, 2010
Prior to January 1, 2010, the Firm had consolidated one of its
multi-seller conduits; all other Firm-administered multi-seller con-
duits were not consolidated in accordance with prior accounting
rules. Under prior accounting rules, the party that absorbed the
majority of the entity’s expected losses, received a majority of the
entity’s residual returns, or both, would consolidate. Each noncon-
solidated multi-seller conduit administered by the Firm at December
31, 2009 had issued Expected Loss Notes (“ELNs”), the holders of
which were committed to absorbing the majority of the expected
loss of each respective conduit. The total amounts of ELNs out-
standing for nonconsolidated conduits at December 31, 2009 was
$96 million.
At December 31, 2009, total assets funded and commercial paper
issued by Firm-sponsored multi-seller conduits were as follows.
December 31, 2009 (in billions) Total
assets funded Commercial paper issued
Consolidated $ 5.1 $ 5.1
Non-consolidated(a) 17.8 17.8
(a) The Firm provided certain deal-specific liquidity facilities (primarily asset purchase agreements) of $24.2 billion. Additionally, the Firm provided program-wide liquidity facilities of $13.0 billion and program-wide credit enhancements of $2.0 billion.
The Firm’s maximum exposure to loss on nonconsolidated Firm-
administered multi-seller conduits was $24.8 billion at December 31,
2009. The maximum exposure to loss, calculated separately for each
multi-seller conduit, included the Firm’s exposure to both deal-specific
liquidity facilities and program wide credit enhancements. For pur-
poses of calculating maximum exposure to loss, Firm-provided pro-
gram-wide credit enhancement was limited to deal-specific liquidity
facilities provided to third parties.
VIEs associated with investor intermediation activities
As a financial intermediary, the Firm creates certain types of VIEs
and also structures transactions, typically using derivatives, with
these VIEs to meet investor needs. The Firm may also provide
liquidity and other support. The risks inherent in the derivative
instruments or liquidity commitments are managed similarly to
other credit, market or liquidity risks to which the Firm is ex-
posed. The principal types of VIEs for which the Firm is engaged
in on behalf of clients are municipal bond vehicles, credit-related
note vehicles and asset swap vehicles.
Municipal bond vehicles
The Firm has created a series of trusts that provide short-term
investors with qualifying tax-exempt investments, and that allow
investors in tax-exempt securities to finance their investments at
short-term tax-exempt rates. In a typical transaction, the vehicle
purchases fixed-rate longer-term highly rated municipal bonds and
funds the purchase by issuing two types of securities: (1) putable
floating-rate certificates and (2) inverse floating-rate residual inter-
ests (“residual interests”). The maturity of each of the putable
floating-rate certificates and the residual interests is equal to the
life of the vehicle, while the maturity of the underlying municipal
bonds is longer. Holders of the putable floating-rate certificates
may “put,” or tender, the certificates if the remarketing agent
cannot successfully remarket the floating-rate certificates to an-
other investor. A liquidity facility conditionally obligates the liquidity
provider to fund the purchase of the tendered floating-rate certifi-
cates. If funded, the liquidity facility would be repaid by the pro-
ceeds from the sale of the underlying municipal bonds upon
termination of the vehicle. In certain transactions, if the proceeds
from the sale of the underlying municipal bonds are not sufficient
to repay the liquidity facility, the liquidity provider has recourse to
the residual interest holders for reimbursement.
The holders of the residual interests in these vehicles could experi-
ence losses if the face amount of the putable floating-rate certifi-
cates exceeds the market value of the municipal bonds upon
termination of the vehicle. Certain vehicles require a smaller initial
investment by the residual interest holders and thus do not result in
excess collateralization. For these vehicles there exists a reim-
bursement obligation which requires the residual interest holders to
post, during the life of the vehicle, additional collateral to the Firm,
as liquidity provider, on a daily basis should the market value of the
municipal bonds decline.
JPMorgan Chase Bank, N.A. often serves as the sole liquidity pro-
vider, and J.P. Morgan Securities LLC as remarketing agent, of the
putable floating-rate certificates. The liquidity provider’s obligation to
perform is conditional and is limited by certain termination events,
which include bankruptcy or failure to pay by the municipal bond
issuer or credit enhancement provider, an event of taxability on the
municipal bonds or the immediate downgrade of the municipal bond
to below investment grade. A downgrade of JPMorgan Chase Bank,
N.A.’s short-term rating does not affect the Firm’s obligation under
the liquidity facility. However, in the event of a downgrade in the
Firm’s credit ratings, holders of the putable floating-rate certificates
supported by those liquidity facility commitments might choose to sell
their instruments, which could increase the likelihood that the liquid-
ity commitments could be drawn. In vehicles in which third-party
investors own the residual interests, in addition to the termination
events, the Firm’s exposure as liquidity provider is further limited by
JPMorgan Chase & Co./2010 Annual Report 251
the high credit quality of the underlying municipal bonds, the excess
collateralization in the vehicle or in certain transactions the reim-
bursement agreements with the residual interest holders.
As remarketing agent, the Firm may hold putable floating-rate
certificates of the municipal bond vehicles. At December 31, 2010
and 2009, respectively, the Firm held $248 million and $72 million
of these certificates on its Consolidated Balance Sheets. The largest
amount held by the Firm at any time during 2010 was $796 mil-
lion, or 6%, of the municipal bond vehicles’ aggregate outstanding
putable floating-rate certificates. The Firm did not have and contin-
ues not to have any intent to protect any residual interest holder
from potential losses on any of the municipal bond holdings.
The long-term credit ratings of the putable floating-rate certificates
are directly related to the credit ratings of the underlying municipal
bonds, and to the credit rating of any insurer of the underlying mu-
nicipal bond. A downgrade of a bond insurer would result in a down-
grade of the insured municipal bonds, which would affect the rating
of the putable floating-rate certificates. This could cause demand for
these certificates by investors to decline or disappear, as putable
floating-rate certificate holders typically require an “AA-” bond
rating. At December 31, 2010 and 2009, 96% and 98%, respec-
tively, of the municipal bonds held by vehicles for which the Firm
served as liquidity provider were rated “AA-” or better, based on
either the rating of the underlying municipal bond itself or the bond
rating including any credit enhancement. At December 31, 2010
and 2009, $3.4 billion and $2.3 billion, respectively, of the bonds
were insured by monoline bond insurers.
The Firm consolidates municipal bond vehicles if it owns the residual
interest. The residual interest generally allows the owner to make
decisions that significantly impact the economic performance of the
municipal bond vehicle, primarily by directing the sale of the munici-
pal bonds owned by the vehicle. In addition, the residual interest
owners have the right to receive benefits and bear losses that could
potentially be significant to the municipal bond vehicle. The Firm does
not consolidate municipal bond vehicles if it does not own the resid-
ual interests, since the Firm does not have the power to make deci-
sions that significantly impact the economic performance of the
municipal bond vehicle.
The Firm’s exposure to nonconsolidated municipal bond VIEs at December 31, 2010 and 2009, including the ratings profile of the VIEs’ assets,
was as follows.
December 31, (in billions)
Fair value of assets held by VIEs Liquidity facilities(b) Excess/(deficit)(c)
Maximum exposure
Nonconsolidated municipal bond vehicles(a) 2010 $ 13.7 $ 8.8 $ 4.9 $ 8.8 2009 13.2 8.4 4.8 8.4
Ratings profile of VIE assets(d)
December 31, Investment-grade
Noninvestment-grade Fair
value of Wt. avg. expected life
(in billions, except where otherwise noted)
AAA to AAA-
AA+ to AA-
A+ to A-
BBB to BBB-
BB+ and below
assets held by VIEs
of assets (years)
Nonconsolidated municipal bond vehicles(a)
2010 $ 1.9 $ 11.2 $ 0.6 $ — $ — $ 13.7 15.5
2009 1.6 11.4 0.2 — — 13.2 10.1
(a) Excluded $4.6 billion and $2.8 billion, as of December 31, 2010 and 2009, respectively, which were consolidated due to the Firm owning the residual interests. (b) The Firm may serve as credit enhancement provider to municipal bond vehicles in which it serves as liquidity provider. The Firm provided insurance on underlying
municipal bonds, in the form of letters of credit, of $10 million at both December 31, 2010 and 2009. (c) Represents the excess/(deficit) of the fair values of municipal bond assets available to repay the liquidity facilities, if drawn. (d) The ratings scale is based on the Firm’s internal risk ratings and is presented on an S&P-equivalent basis.
Notes to consolidated financial statements
252 JPMorgan Chase & Co./2010 Annual Report
Credit-related note vehicles
The Firm structures transactions with credit-related note vehicles in
which the VIE purchases highly rated assets, such as asset-backed
securities, and enters into a credit derivative contract with the Firm
to obtain exposure to a referenced credit which the VIE otherwise
does not hold. The VIE then issues credit-linked notes (“CLNs”)
with maturities predominantly ranging from one to 10 years in
order to transfer the risk of the referenced credit to the VIE’s inves-
tors. Clients and investors often prefer using a CLN vehicle since
the CLNs issued by the VIE generally carry a higher credit rating
than such notes would if issued directly by JPMorgan Chase. The
Firm’s exposure to the CLN vehicles is generally limited to its rights
and obligations under the credit derivative contract with the VIE, as
the Firm does not provide any additional contractual financial
support to the VIE. In addition, the Firm has not historically pro-
vided any financial support to the CLN vehicles over and above its
contractual obligations. Accordingly, the Firm typically does not
consolidate the CLN vehicles. As a derivative counterparty in a
credit-related note structure, the Firm has a senior claim on the
collateral of the VIE and reports such derivatives on its balance
sheet at fair value. The collateral purchased by such VIEs is largely
investment-grade, with a significant amount being rated “AAA.”
The Firm divides its credit-related note structures broadly into two
types: static and managed.
In a static credit-related note structure, the CLNs and associated
credit derivative contract either reference a single credit (e.g., a
multi-national corporation), or all or part of a fixed portfolio of
credits. The Firm generally buys protection from the VIE under the
credit derivative. In a managed credit-related note structure, the
CLNs and associated credit derivative generally reference all or part
of an actively managed portfolio of credits. An agreement exists
between a portfolio manager and the VIE that gives the portfolio
manager the ability to substitute each referenced credit in the
portfolio for an alternative credit. By participating in a structure
where a portfolio manager has the ability to substitute credits
within pre-agreed terms, the investors who own the CLNs seek to
reduce the risk that any single credit in the portfolio will default.
The Firm does not act as portfolio manager; its involvement with
the VIE is generally limited to being a derivative counterparty. As a
net buyer of credit protection, in both static and managed credit-
related note structures, the Firm pays a premium to the VIE in
return for the receipt of a payment (up to the notional of the de-
rivative) if one or more of the credits within the portfolio defaults,
or if the losses resulting from the default of reference credits exceed
specified levels. Since each CLN is established to the specifications
of the investors, the investors have the power over the activities of
that VIE that most significantly affect the performance of the CLN.
Accordingly, the Firm does not generally consolidate these credit-
related note entities. Furthermore, the Firm does not have a vari-
able interest that could potentially be significant. As a derivative
counterparty, the Firm has a senior claim on the collateral of the
VIE and reports such derivatives on its balance sheet at fair value.
Substantially all of the assets purchased by such VIEs are invest-
ment-grade.
Exposure to nonconsolidated credit-related note VIEs at December 31, 2010 and 2009, was as follows.
Net derivative Trading Total Par value of collateral
December 31, 2010 (in billions) receivables assets(b) exposure(c) held by VIEs(d)
Credit-related notes(a) Static structure $ 1.0 $ — $ 1.0 $ 9.5Managed structure 2.8 — 2.8 10.7 Total $ 3.8 $ — $ 3.8 $ 20.2
Net derivative Trading Total Par value of collateral
December 31, 2009 (in billions) receivables assets(b) exposure(c) held by VIEs(d)
Credit-related notes(a) Static structure $ 1.9 $ 0.7 $ 2.6 $ 10.8Managed structure 5.0 0.6 5.6 15.2 Total $ 6.9 $ 1.3 $ 8.2 $ 26.0
(a) Excluded collateral with a fair value of $142 million and $855 million at December 31, 2010 and 2009, respectively, which was consolidated, as the Firm, in its role as secondary market-maker, held a majority of the issued credit-related notes of certain vehicles.
(b) Trading assets principally comprise notes issued by VIEs, which from time to time are held as part of the termination of a deal or to support limited market-making. (c) On–balance sheet exposure that includes net derivative receivables and trading assets – debt and equity instruments. (d) The Firm’s maximum exposure arises through the derivatives executed with the VIEs; the exposure varies over time with changes in the fair value of the derivatives. The
Firm relies on the collateral held by the VIEs to pay any amounts due under the derivatives; the vehicles are structured at inception so that the par value of the collateral is expected to be sufficient to pay amounts due under the derivative contracts.
Asset swap vehicles
The Firm structures and executes transactions with asset swap vehi-
cles on behalf of investors. In such transactions, the VIE purchases a
specific asset or assets and then enters into a derivative with the Firm
in order to tailor the interest rate or foreign exchange currency risk, or
both, according to investors’ requirements. Generally, the assets are
held by the VIE to maturity, and the tenor of the derivatives would
match the maturity of the assets. Investors typically invest in the notes
issued by such VIEs in order to obtain exposure to the credit risk of
the specific assets, as well as exposure to foreign exchange and
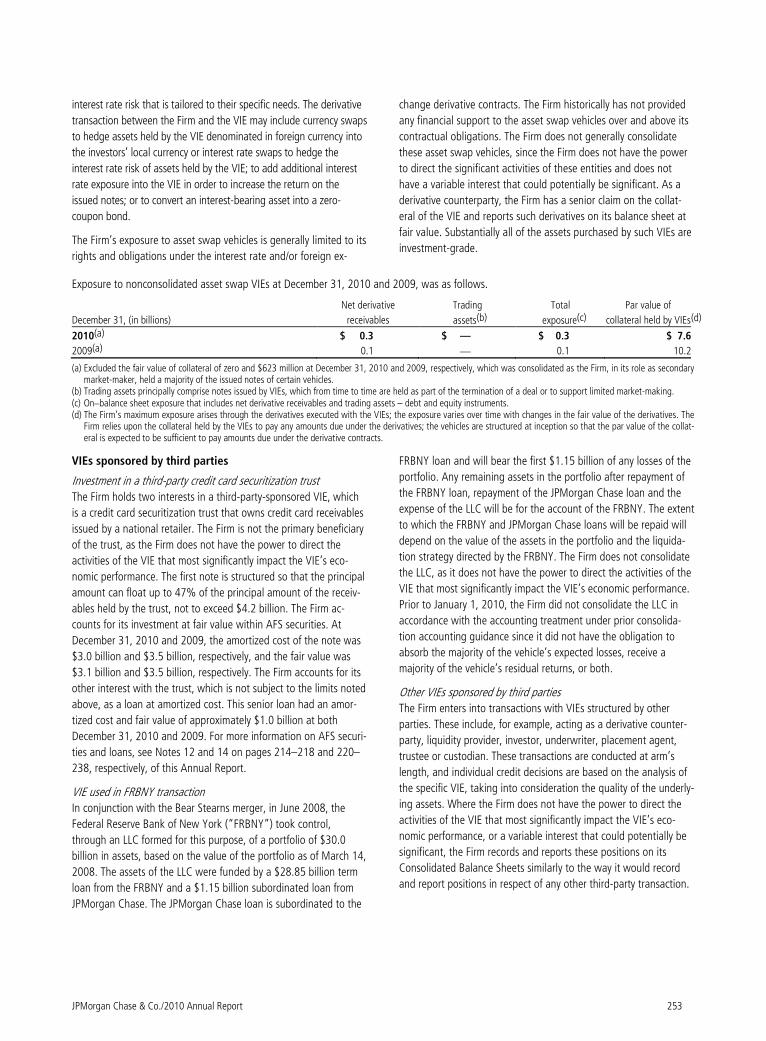
JPMorgan Chase & Co./2010 Annual Report 253
interest rate risk that is tailored to their specific needs. The derivative
transaction between the Firm and the VIE may include currency swaps
to hedge assets held by the VIE denominated in foreign currency into
the investors’ local currency or interest rate swaps to hedge the
interest rate risk of assets held by the VIE; to add additional interest
rate exposure into the VIE in order to increase the return on the
issued notes; or to convert an interest-bearing asset into a zero-
coupon bond.
The Firm’s exposure to asset swap vehicles is generally limited to its
rights and obligations under the interest rate and/or foreign ex-
change derivative contracts. The Firm historically has not provided
any financial support to the asset swap vehicles over and above its
contractual obligations. The Firm does not generally consolidate
these asset swap vehicles, since the Firm does not have the power
to direct the significant activities of these entities and does not
have a variable interest that could potentially be significant. As a
derivative counterparty, the Firm has a senior claim on the collat-
eral of the VIE and reports such derivatives on its balance sheet at
fair value. Substantially all of the assets purchased by such VIEs are
investment-grade.
Exposure to nonconsolidated asset swap VIEs at December 31, 2010 and 2009, was as follows.
Net derivative Trading Total Par value of
December 31, (in billions) receivables assets(b) exposure(c) collateral held by VIEs (d)
2010(a) $ 0.3 $ — $ 0.3 $ 7.6
2009(a) 0.1 — 0.1 10.2
(a) Excluded the fair value of collateral of zero and $623 million at December 31, 2010 and 2009, respectively, which was consolidated as the Firm, in its role as secondary market-maker, held a majority of the issued notes of certain vehicles.
(b) Trading assets principally comprise notes issued by VIEs, which from time to time are held as part of the termination of a deal or to support limited market-making. (c) On–balance sheet exposure that includes net derivative receivables and trading assets – debt and equity instruments. (d) The Firm’s maximum exposure arises through the derivatives executed with the VIEs; the exposure varies over time with changes in the fair value of the derivatives. The
Firm relies upon the collateral held by the VIEs to pay any amounts due under the derivatives; the vehicles are structured at inception so that the par value of the collat-eral is expected to be sufficient to pay amounts due under the derivative contracts.
VIEs sponsored by third parties
Investment in a third-party credit card securitization trust
The Firm holds two interests in a third-party-sponsored VIE, which
is a credit card securitization trust that owns credit card receivables
issued by a national retailer. The Firm is not the primary beneficiary
of the trust, as the Firm does not have the power to direct the
activities of the VIE that most significantly impact the VIE’s eco-
nomic performance. The first note is structured so that the principal
amount can float up to 47% of the principal amount of the receiv-
ables held by the trust, not to exceed $4.2 billion. The Firm ac-
counts for its investment at fair value within AFS securities. At
December 31, 2010 and 2009, the amortized cost of the note was
$3.0 billion and $3.5 billion, respectively, and the fair value was
$3.1 billion and $3.5 billion, respectively. The Firm accounts for its
other interest with the trust, which is not subject to the limits noted
above, as a loan at amortized cost. This senior loan had an amor-
tized cost and fair value of approximately $1.0 billion at both
December 31, 2010 and 2009. For more information on AFS securi-
ties and loans, see Notes 12 and 14 on pages 214–218 and 220–
238, respectively, of this Annual Report.
VIE used in FRBNY transaction
In conjunction with the Bear Stearns merger, in June 2008, the
Federal Reserve Bank of New York (“FRBNY”) took control,
through an LLC formed for this purpose, of a portfolio of $30.0
billion in assets, based on the value of the portfolio as of March 14,
2008. The assets of the LLC were funded by a $28.85 billion term
loan from the FRBNY and a $1.15 billion subordinated loan from
JPMorgan Chase. The JPMorgan Chase loan is subordinated to the
FRBNY loan and will bear the first $1.15 billion of any losses of the
portfolio. Any remaining assets in the portfolio after repayment of
the FRBNY loan, repayment of the JPMorgan Chase loan and the
expense of the LLC will be for the account of the FRBNY. The extent
to which the FRBNY and JPMorgan Chase loans will be repaid will
depend on the value of the assets in the portfolio and the liquida-
tion strategy directed by the FRBNY. The Firm does not consolidate
the LLC, as it does not have the power to direct the activities of the
VIE that most significantly impact the VIE’s economic performance.
Prior to January 1, 2010, the Firm did not consolidate the LLC in
accordance with the accounting treatment under prior consolida-
tion accounting guidance since it did not have the obligation to
absorb the majority of the vehicle’s expected losses, receive a
majority of the vehicle’s residual returns, or both.
Other VIEs sponsored by third parties
The Firm enters into transactions with VIEs structured by other
parties. These include, for example, acting as a derivative counter-
party, liquidity provider, investor, underwriter, placement agent,
trustee or custodian. These transactions are conducted at arm’s
length, and individual credit decisions are based on the analysis of
the specific VIE, taking into consideration the quality of the underly-
ing assets. Where the Firm does not have the power to direct the
activities of the VIE that most significantly impact the VIE’s eco-
nomic performance, or a variable interest that could potentially be
significant, the Firm records and reports these positions on its
Consolidated Balance Sheets similarly to the way it would record
and report positions in respect of any other third-party transaction.
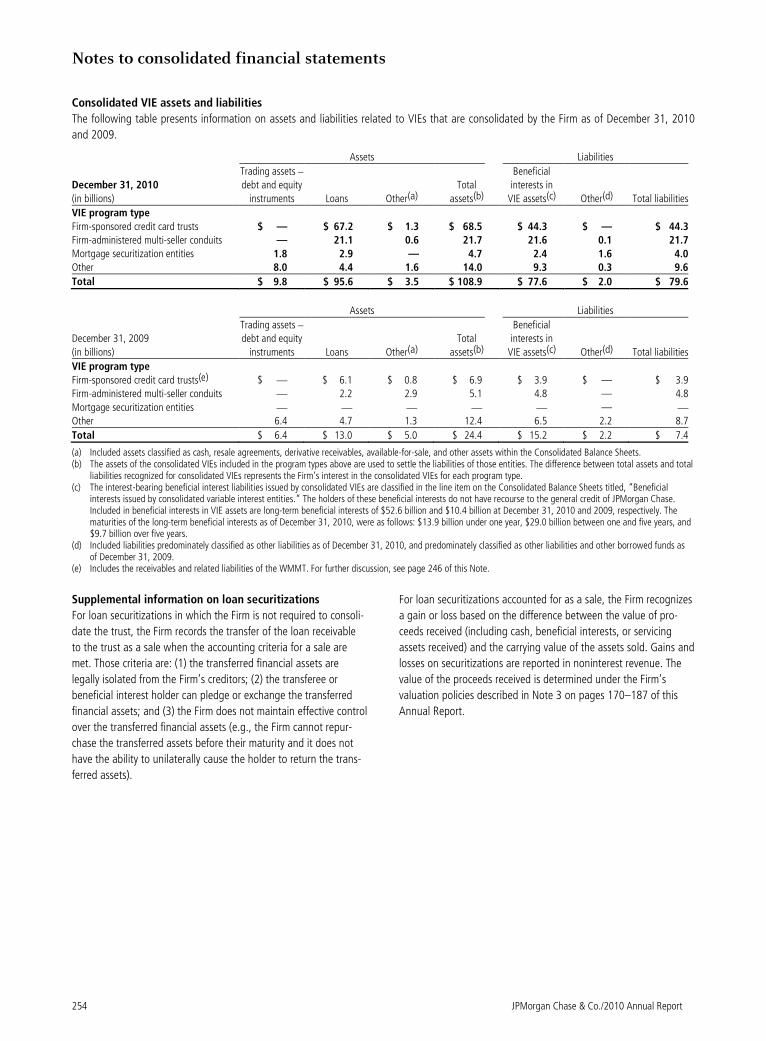
Notes to consolidated financial statements
254 JPMorgan Chase & Co./2010 Annual Report
Consolidated VIE assets and liabilities
The following table presents information on assets and liabilities related to VIEs that are consolidated by the Firm as of December 31, 2010
and 2009.
Assets Liabilities
December 31, 2010
(in billions)
Trading assets –
debt and equity
instruments Loans Other(a)
Total
assets(b)
Beneficial
interests in
VIE assets(c) Other(d) Total liabilities
VIE program type
Firm-sponsored credit card trusts $ — $ 67.2 $ 1.3 $ 68.5 $ 44.3 $ — $ 44.3
Firm-administered multi-seller conduits — 21.1 0.6 21.7 21.6 0.1 21.7
Mortgage securitization entities 1.8 2.9 — 4.7 2.4 1.6 4.0
Other 8.0 4.4 1.6 14.0 9.3 0.3 9.6
Total $ 9.8 $ 95.6 $ 3.5 $ 108.9 $ 77.6 $ 2.0 $ 79.6
Assets Liabilities
December 31, 2009
(in billions)
Trading assets –
debt and equity
instruments Loans Other(a)
Total
assets(b)
Beneficial
interests in
VIE assets(c) Other(d) Total liabilities
VIE program type
Firm-sponsored credit card trusts(e) $ — $ 6.1 $ 0.8 $ 6.9 $ 3.9 $ — $ 3.9
Firm-administered multi-seller conduits — 2.2 2.9 5.1 4.8 — 4.8
Mortgage securitization entities — — — — — — —Other 6.4 4.7 1.3 12.4 6.5 2.2 8.7
Total $ 6.4 $ 13.0 $ 5.0 $ 24.4 $ 15.2 $ 2.2 $ 7.4
(a) Included assets classified as cash, resale agreements, derivative receivables, available-for-sale, and other assets within the Consolidated Balance Sheets. (b) The assets of the consolidated VIEs included in the program types above are used to settle the liabilities of those entities. The difference between total assets and total
liabilities recognized for consolidated VIEs represents the Firm’s interest in the consolidated VIEs for each program type. (c) The interest-bearing beneficial interest liabilities issued by consolidated VIEs are classified in the line item on the Consolidated Balance Sheets titled, “Beneficial
interests issued by consolidated variable interest entities.” The holders of these beneficial interests do not have recourse to the general credit of JPMorgan Chase. Included in beneficial interests in VIE assets are long-term beneficial interests of $52.6 billion and $10.4 billion at December 31, 2010 and 2009, respectively. The maturities of the long-term beneficial interests as of December 31, 2010, were as follows: $13.9 billion under one year, $29.0 billion between one and five years, and $9.7 billion over five years.
(d) Included liabilities predominately classified as other liabilities as of December 31, 2010, and predominately classified as other liabilities and other borrowed funds as of December 31, 2009.
(e) Includes the receivables and related liabilities of the WMMT. For further discussion, see page 246 of this Note.
Supplemental information on loan securitizations
For loan securitizations in which the Firm is not required to consoli-
date the trust, the Firm records the transfer of the loan receivable
to the trust as a sale when the accounting criteria for a sale are
met. Those criteria are: (1) the transferred financial assets are
legally isolated from the Firm’s creditors; (2) the transferee or
beneficial interest holder can pledge or exchange the transferred
financial assets; and (3) the Firm does not maintain effective control
over the transferred financial assets (e.g., the Firm cannot repur-
chase the transferred assets before their maturity and it does not
have the ability to unilaterally cause the holder to return the trans-
ferred assets).
For loan securitizations accounted for as a sale, the Firm recognizes
a gain or loss based on the difference between the value of pro-
ceeds received (including cash, beneficial interests, or servicing
assets received) and the carrying value of the assets sold. Gains and
losses on securitizations are reported in noninterest revenue. The
value of the proceeds received is determined under the Firm’s
valuation policies described in Note 3 on pages 170–187 of this
Annual Report.
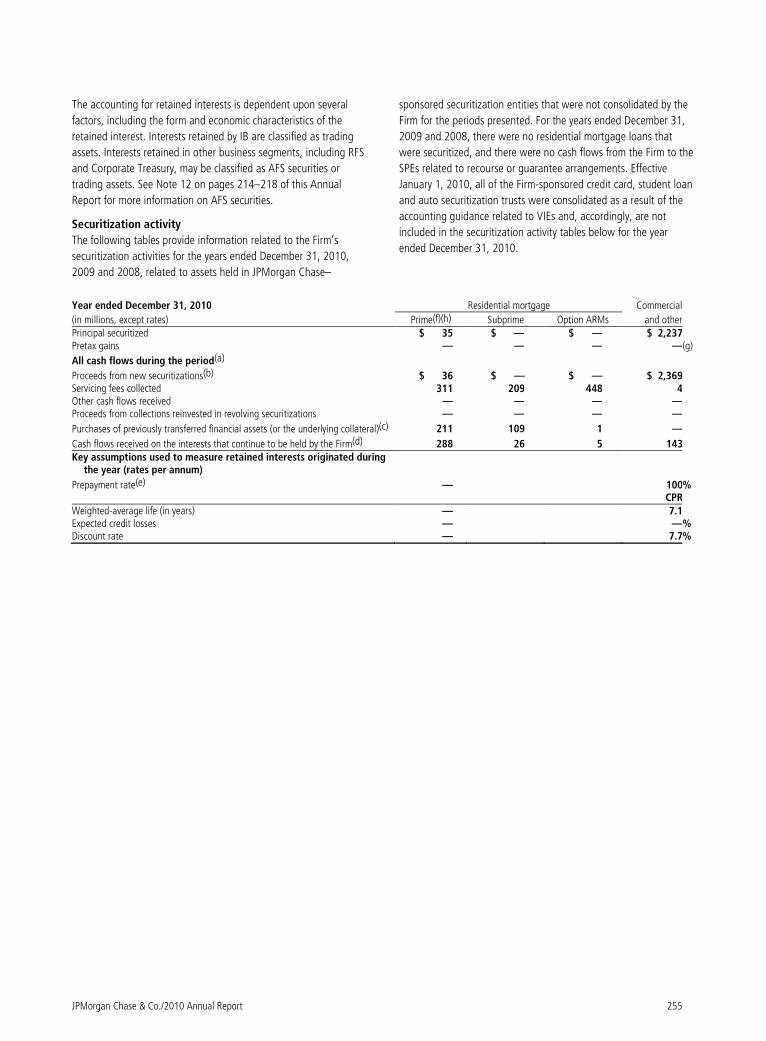
JPMorgan Chase & Co./2010 Annual Report 255
The accounting for retained interests is dependent upon several
factors, including the form and economic characteristics of the
retained interest. Interests retained by IB are classified as trading
assets. Interests retained in other business segments, including RFS
and Corporate Treasury, may be classified as AFS securities or
trading assets. See Note 12 on pages 214–218 of this Annual
Report for more information on AFS securities.
Securitization activity
The following tables provide information related to the Firm’s
securitization activities for the years ended December 31, 2010,
2009 and 2008, related to assets held in JPMorgan Chase–
sponsored securitization entities that were not consolidated by the
Firm for the periods presented. For the years ended December 31,
2009 and 2008, there were no residential mortgage loans that
were securitized, and there were no cash flows from the Firm to the
SPEs related to recourse or guarantee arrangements. Effective
January 1, 2010, all of the Firm-sponsored credit card, student loan
and auto securitization trusts were consolidated as a result of the
accounting guidance related to VIEs and, accordingly, are not
included in the securitization activity tables below for the year
ended December 31, 2010.
Year ended December 31, 2010 Residential mortgage Commercial
(in millions, except rates) Prime(f)(h) Subprime Option ARMs and other Principal securitized $ 35 $ — $ — $ 2,237 Pretax gains — — — —(g)
All cash flows during the period(a)
Proceeds from new securitizations(b) $ 36 $ — $ — $ 2,369 Servicing fees collected 311 209 448 4 Other cash flows received — — — — Proceeds from collections reinvested in revolving securitizations — — — —
Purchases of previously transferred financial assets (or the underlying collateral)(c) 211 109 1 —
Cash flows received on the interests that continue to be held by the Firm(d) 288 26 5 143 Key assumptions used to measure retained interests originated during
the year (rates per annum)
Prepayment rate(e) — 100% CPR Weighted-average life (in years) — 7.1 Expected credit losses — —% Discount rate — 7.7%
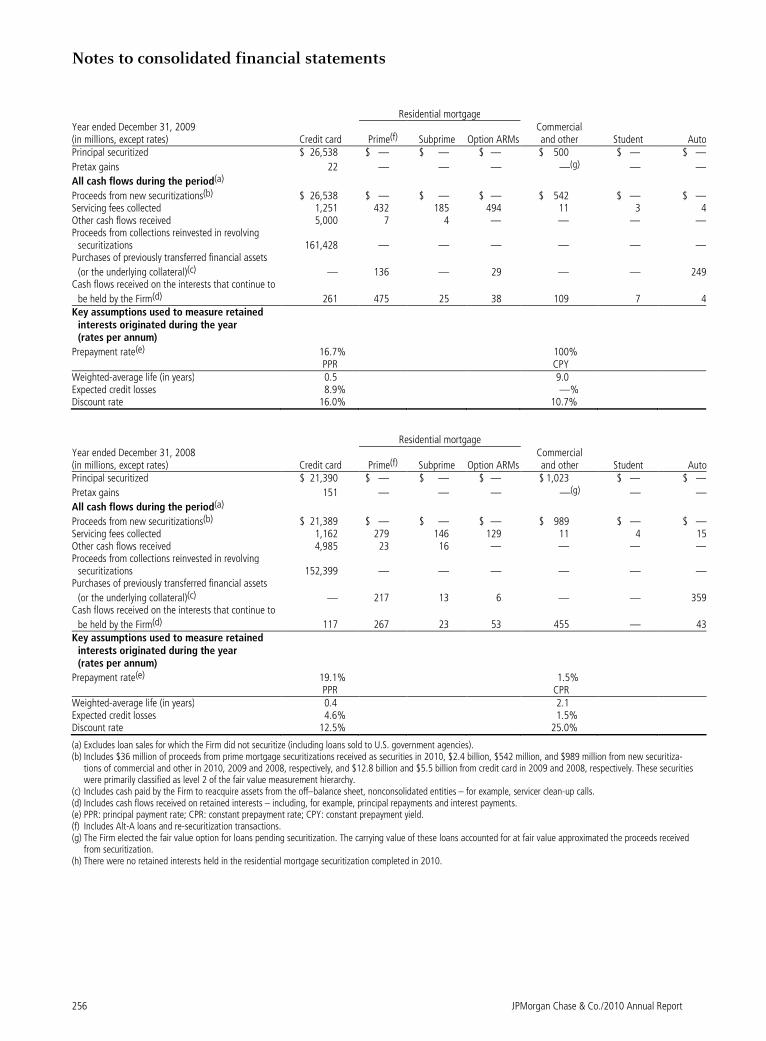
Notes to consolidated financial statements
256 JPMorgan Chase & Co./2010 Annual Report
Residential mortgage Year ended December 31, 2009 (in millions, except rates) Credit card Prime(f) Subprime Option ARMs
Commercial and other Student Auto
Principal securitized $ 26,538 $ — $ — $ — $ 500 $ — $ —
Pretax gains 22 — — — —(g) — —
All cash flows during the period(a)
Proceeds from new securitizations(b) $ 26,538 $ — $ — $ — $ 542 $ — $ —Servicing fees collected 1,251 432 185 494 11 3 4Other cash flows received 5,000 7 4 — — — —Proceeds from collections reinvested in revolving
securitizations 161,428 — — — — — —Purchases of previously transferred financial assets
(or the underlying collateral)(c) — 136 — 29 — — 249Cash flows received on the interests that continue to
be held by the Firm(d) 261 475 25 38 109 7 4Key assumptions used to measure retained
interests originated during the year (rates per annum)
Prepayment rate(e) 16.7% 100% PPR CPY Weighted-average life (in years) 0.5 9.0 Expected credit losses 8.9% —% Discount rate 16.0% 10.7%
Residential mortgage Year ended December 31, 2008 (in millions, except rates) Credit card Prime(f) Subprime Option ARMs
Commercial and other Student Auto
Principal securitized $ 21,390 $ — $ — $ — $ 1,023 $ — $ —
Pretax gains 151 — — — —(g) — —
All cash flows during the period(a)
Proceeds from new securitizations(b) $ 21,389 $ — $ — $ — $ 989 $ — $ —Servicing fees collected 1,162 279 146 129 11 4 15Other cash flows received 4,985 23 16 — — — —Proceeds from collections reinvested in revolving
securitizations 152,399 — — — — — —Purchases of previously transferred financial assets
(or the underlying collateral)(c) — 217 13 6 — — 359Cash flows received on the interests that continue to
be held by the Firm(d) 117 267 23 53 455 — 43Key assumptions used to measure retained
interests originated during the year (rates per annum)
Prepayment rate(e) 19.1% 1.5% PPR CPR Weighted-average life (in years) 0.4 2.1 Expected credit losses 4.6% 1.5% Discount rate 12.5% 25.0%
(a) Excludes loan sales for which the Firm did not securitize (including loans sold to U.S. government agencies). (b) Includes $36 million of proceeds from prime mortgage securitizations received as securities in 2010, $2.4 billion, $542 million, and $989 million from new securitiza-
tions of commercial and other in 2010, 2009 and 2008, respectively, and $12.8 billion and $5.5 billion from credit card in 2009 and 2008, respectively. These securities were primarily classified as level 2 of the fair value measurement hierarchy.
(c) Includes cash paid by the Firm to reacquire assets from the off–balance sheet, nonconsolidated entities – for example, servicer clean-up calls. (d) Includes cash flows received on retained interests – including, for example, principal repayments and interest payments. (e) PPR: principal payment rate; CPR: constant prepayment rate; CPY: constant prepayment yield. (f) Includes Alt-A loans and re-securitization transactions. (g) The Firm elected the fair value option for loans pending securitization. The carrying value of these loans accounted for at fair value approximated the proceeds received
from securitization. (h) There were no retained interests held in the residential mortgage securitization completed in 2010.
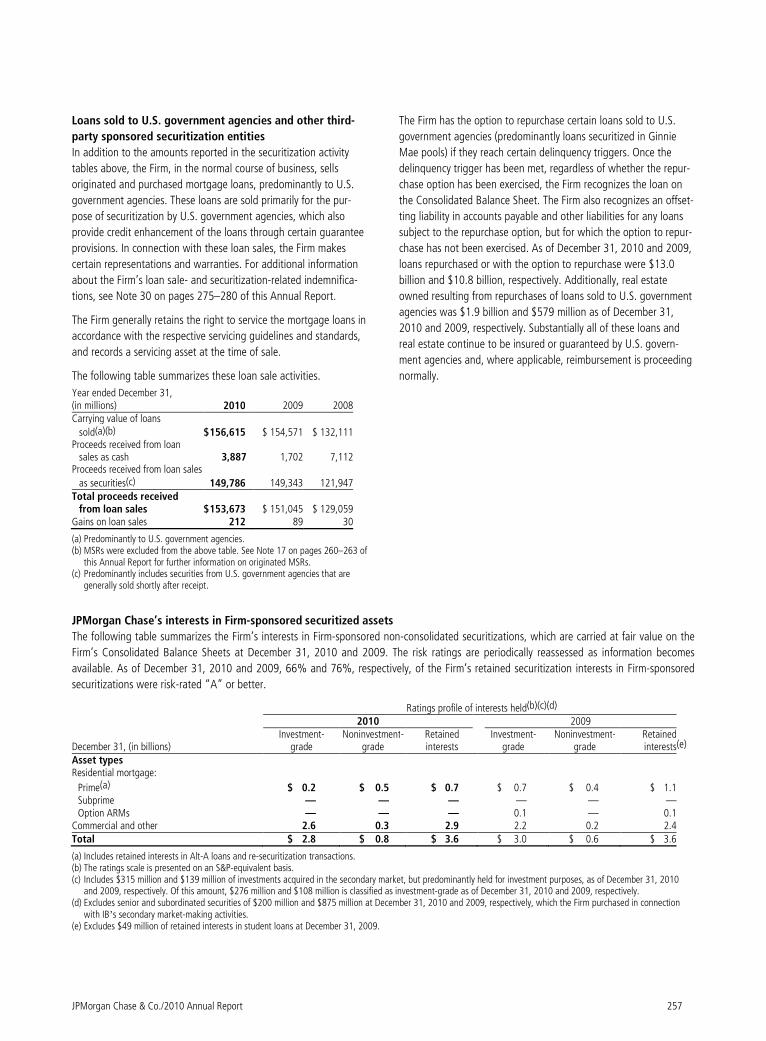
JPMorgan Chase & Co./2010 Annual Report 257
Loans sold to U.S. government agencies and other third-
party sponsored securitization entities
In addition to the amounts reported in the securitization activity
tables above, the Firm, in the normal course of business, sells
originated and purchased mortgage loans, predominantly to U.S.
government agencies. These loans are sold primarily for the pur-
pose of securitization by U.S. government agencies, which also
provide credit enhancement of the loans through certain guarantee
provisions. In connection with these loan sales, the Firm makes
certain representations and warranties. For additional information
about the Firm’s loan sale- and securitization-related indemnifica-
tions, see Note 30 on pages 275–280 of this Annual Report.
The Firm generally retains the right to service the mortgage loans in
accordance with the respective servicing guidelines and standards,
and records a servicing asset at the time of sale.
The following table summarizes these loan sale activities.
Year ended December 31, (in millions) 2010 2009 2008Carrying value of loans
sold(a)(b) $ 156,615 $ 154,571 $ 132,111Proceeds received from loan
sales as cash 3,887 1,702 7,112Proceeds received from loan sales
as securities(c) 149,786 149,343 121,947Total proceeds received
from loan sales $ 153,673 $ 151,045 $ 129,059Gains on loan sales 212 89 30
(a) Predominantly to U.S. government agencies. (b) MSRs were excluded from the above table. See Note 17 on pages 260–263 of
this Annual Report for further information on originated MSRs. (c) Predominantly includes securities from U.S. government agencies that are
generally sold shortly after receipt.
The Firm has the option to repurchase certain loans sold to U.S.
government agencies (predominantly loans securitized in Ginnie
Mae pools) if they reach certain delinquency triggers. Once the
delinquency trigger has been met, regardless of whether the repur-
chase option has been exercised, the Firm recognizes the loan on
the Consolidated Balance Sheet. The Firm also recognizes an offset-
ting liability in accounts payable and other liabilities for any loans
subject to the repurchase option, but for which the option to repur-
chase has not been exercised. As of December 31, 2010 and 2009,
loans repurchased or with the option to repurchase were $13.0
billion and $10.8 billion, respectively. Additionally, real estate
owned resulting from repurchases of loans sold to U.S. government
agencies was $1.9 billion and $579 million as of December 31,
2010 and 2009, respectively. Substantially all of these loans and
real estate continue to be insured or guaranteed by U.S. govern-
ment agencies and, where applicable, reimbursement is proceeding
normally.
JPMorgan Chase’s interests in Firm-sponsored securitized assets
The following table summarizes the Firm’s interests in Firm-sponsored non-consolidated securitizations, which are carried at fair value on the
Firm’s Consolidated Balance Sheets at December 31, 2010 and 2009. The risk ratings are periodically reassessed as information becomes
available. As of December 31, 2010 and 2009, 66% and 76%, respectively, of the Firm’s retained securitization interests in Firm-sponsored
securitizations were risk-rated “A” or better.
Ratings profile of interests held(b)(c)(d) 2010 2009
December 31, (in billions) Investment-
grade Noninvestment-
grade Retained interests
Investment- grade
Noninvestment- grade
Retainedinterests(e)
Asset types Residential mortgage:
Prime(a) $ 0.2 $ 0.5 $ 0.7 $ 0.7 $ 0.4 $ 1.1 Subprime — — — — — — Option ARMs — — — 0.1 — 0.1
Commercial and other 2.6 0.3 2.9 2.2 0.2 2.4 Total $ 2.8 $ 0.8 $ 3.6 $ 3.0 $ 0.6 $ 3.6
(a) Includes retained interests in Alt-A loans and re-securitization transactions. (b) The ratings scale is presented on an S&P-equivalent basis. (c) Includes $315 million and $139 million of investments acquired in the secondary market, but predominantly held for investment purposes, as of December 31, 2010
and 2009, respectively. Of this amount, $276 million and $108 million is classified as investment-grade as of December 31, 2010 and 2009, respectively. (d) Excludes senior and subordinated securities of $200 million and $875 million at December 31, 2010 and 2009, respectively, which the Firm purchased in connection
with IB’s secondary market-making activities. (e) Excludes $49 million of retained interests in student loans at December 31, 2009.
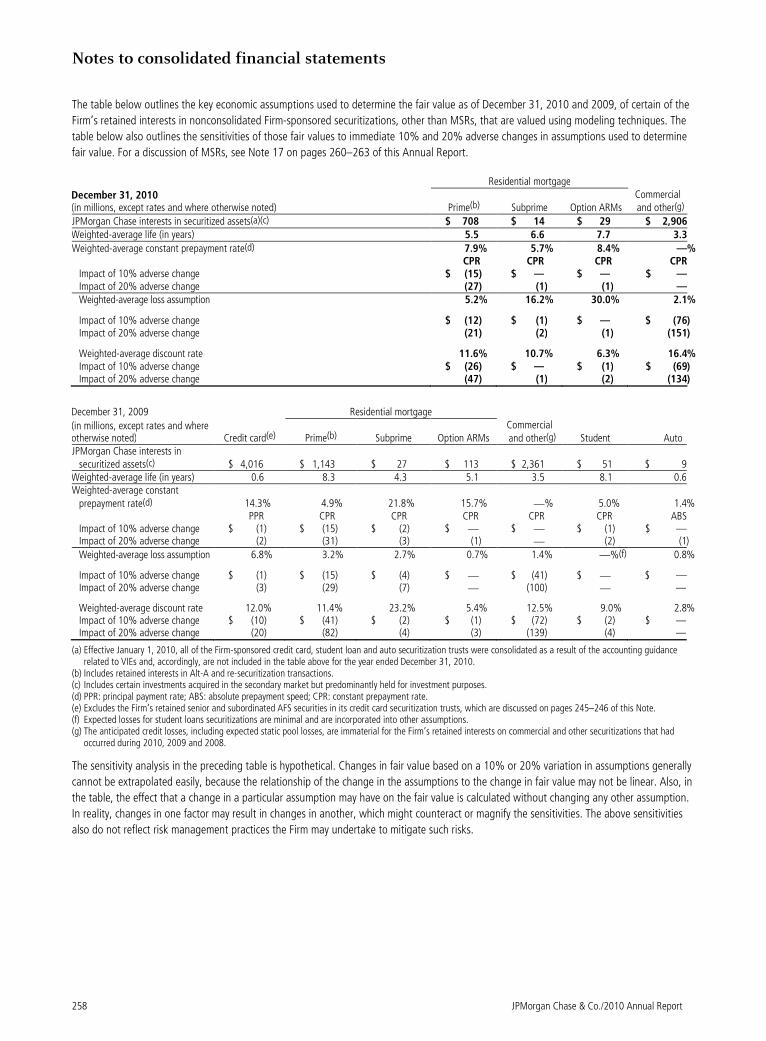
Notes to consolidated financial statements
258 JPMorgan Chase & Co./2010 Annual Report
The table below outlines the key economic assumptions used to determine the fair value as of December 31, 2010 and 2009, of certain of the
Firm’s retained interests in nonconsolidated Firm-sponsored securitizations, other than MSRs, that are valued using modeling techniques. The
table below also outlines the sensitivities of those fair values to immediate 10% and 20% adverse changes in assumptions used to determine
fair value. For a discussion of MSRs, see Note 17 on pages 260–263 of this Annual Report.
Residential mortgage
December 31, 2010 (in millions, except rates and where otherwise noted) Prime(b) Subprime Option ARMs
Commercial and other(g)
JPMorgan Chase interests in securitized assets(a)(c) $ 708 $ 14 $ 29 $ 2,906 Weighted-average life (in years) 5.5 6.6 7.7 3.3
Weighted-average constant prepayment rate(d) 7.9% 5.7% 8.4% — % CPR CPR CPR CPR
Impact of 10% adverse change $ (15) $ — $ — $ — Impact of 20% adverse change (27) (1) (1) — Weighted-average loss assumption 5.2% 16.2% 30.0% 2.1 %
Impact of 10% adverse change $ (12) $ (1) $ — $ (76 ) Impact of 20% adverse change (21) (2) (1) (151 )
Weighted-average discount rate 11.6% 10.7% 6.3% 16.4 % Impact of 10% adverse change $ (26) $ — $ (1) $ (69 ) Impact of 20% adverse change (47) (1) (2) (134 )
December 31, 2009 Residential mortgage
(in millions, except rates and where otherwise noted) Credit card(e) Prime(b) Subprime Option ARMs
Commercial and other(g) Student Auto
JPMorgan Chase interests in securitized assets(c) $ 4,016 $ 1,143 $ 27 $ 113 $ 2,361 $ 51 $ 9
Weighted-average life (in years) 0.6 8.3 4.3 5.1 3.5 8.1 0.6 Weighted-average constant
prepayment rate(d) 14.3% 4.9% 21.8% 15.7% —% 5.0% 1.4% PPR CPR CPR CPR CPR CPR ABS
Impact of 10% adverse change $ (1) $ (15) $ (2) $ — $ — $ (1) $ — Impact of 20% adverse change (2) (31) (3) (1) — (2) (1)
Weighted-average loss assumption 6.8% 3.2% 2.7% 0.7% 1.4% —%(f) 0.8%
Impact of 10% adverse change $ (1) $ (15) $ (4) $ — $ (41) $ — $ — Impact of 20% adverse change (3) (29) (7) — (100) — —
Weighted-average discount rate 12.0% 11.4% 23.2% 5.4% 12.5% 9.0% 2.8% Impact of 10% adverse change $ (10) $ (41) $ (2) $ (1) $ (72) $ (2) $ — Impact of 20% adverse change (20) (82) (4) (3) (139) (4) —
(a) Effective January 1, 2010, all of the Firm-sponsored credit card, student loan and auto securitization trusts were consolidated as a result of the accounting guidance related to VIEs and, accordingly, are not included in the table above for the year ended December 31, 2010.
(b) Includes retained interests in Alt-A and re-securitization transactions. (c) Includes certain investments acquired in the secondary market but predominantly held for investment purposes. (d) PPR: principal payment rate; ABS: absolute prepayment speed; CPR: constant prepayment rate. (e) Excludes the Firm’s retained senior and subordinated AFS securities in its credit card securitization trusts, which are discussed on pages 245–246 of this Note. (f) Expected losses for student loans securitizations are minimal and are incorporated into other assumptions. (g) The anticipated credit losses, including expected static pool losses, are immaterial for the Firm’s retained interests on commercial and other securitizations that had
occurred during 2010, 2009 and 2008.
The sensitivity analysis in the preceding table is hypothetical. Changes in fair value based on a 10% or 20% variation in assumptions generally
cannot be extrapolated easily, because the relationship of the change in the assumptions to the change in fair value may not be linear. Also, in
the table, the effect that a change in a particular assumption may have on the fair value is calculated without changing any other assumption.
In reality, changes in one factor may result in changes in another, which might counteract or magnify the sensitivities. The above sensitivities
also do not reflect risk management practices the Firm may undertake to mitigate such risks.
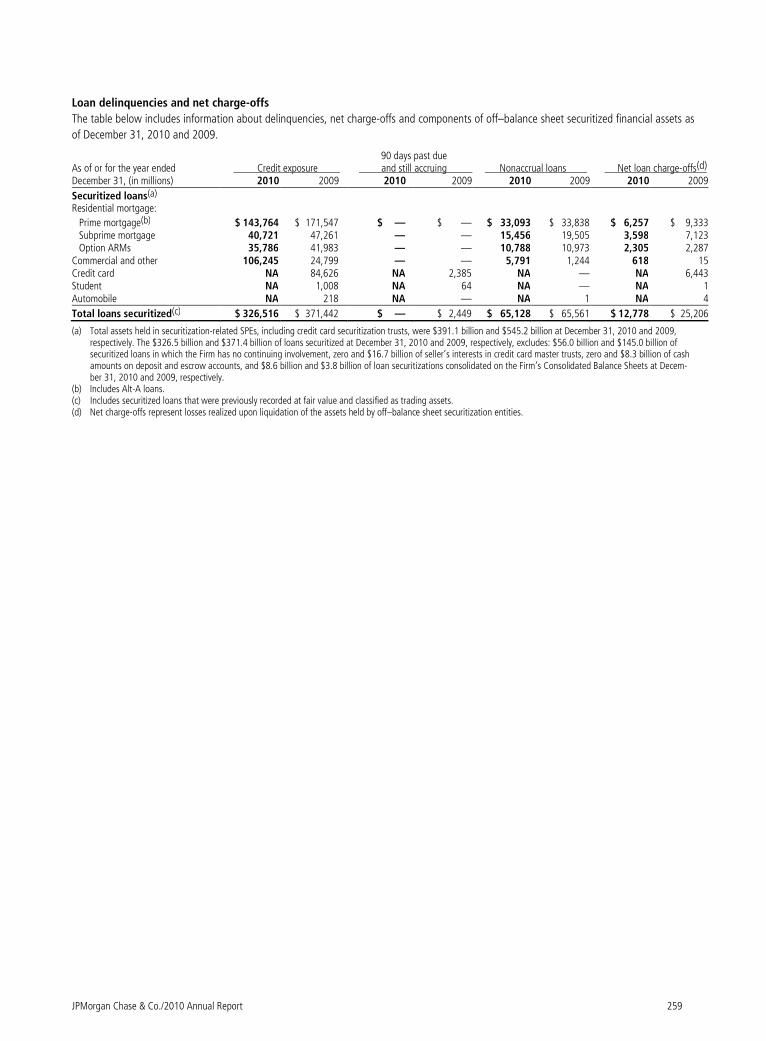
JPMorgan Chase & Co./2010 Annual Report 259
Loan delinquencies and net charge-offs
The table below includes information about delinquencies, net charge-offs and components of off–balance sheet securitized financial assets as
of December 31, 2010 and 2009.
As of or for the year ended Credit exposure 90 days past due and still accruing Nonaccrual loans Net loan charge-offs(d)
December 31, (in millions) 2010 2009 2010 2009 2010 2009 2010 2009
Securitized loans(a) Residential mortgage:
Prime mortgage(b) $ 143,764 $ 171,547 $ — $ — $ 33,093 $ 33,838 $ 6,257 $ 9,333Subprime mortgage 40,721 47,261 — — 15,456 19,505 3,598 7,123Option ARMs 35,786 41,983 — — 10,788 10,973 2,305 2,287
Commercial and other 106,245 24,799 — — 5,791 1,244 618 15Credit card NA 84,626 NA 2,385 NA — NA 6,443Student NA 1,008 NA 64 NA — NA 1Automobile NA 218 NA — NA 1 NA 4
Total loans securitized(c) $ 326,516 $ 371,442 $ — $ 2,449 $ 65,128 $ 65,561 $ 12,778 $ 25,206
(a) Total assets held in securitization-related SPEs, including credit card securitization trusts, were $391.1 billion and $545.2 billion at December 31, 2010 and 2009, respectively. The $326.5 billion and $371.4 billion of loans securitized at December 31, 2010 and 2009, respectively, excludes: $56.0 billion and $145.0 billion of securitized loans in which the Firm has no continuing involvement, zero and $16.7 billion of seller’s interests in credit card master trusts, zero and $8.3 billion of cash amounts on deposit and escrow accounts, and $8.6 billion and $3.8 billion of loan securitizations consolidated on the Firm’s Consolidated Balance Sheets at Decem-ber 31, 2010 and 2009, respectively.
(b) Includes Alt-A loans. (c) Includes securitized loans that were previously recorded at fair value and classified as trading assets. (d) Net charge-offs represent losses realized upon liquidation of the assets held by off–balance sheet securitization entities.
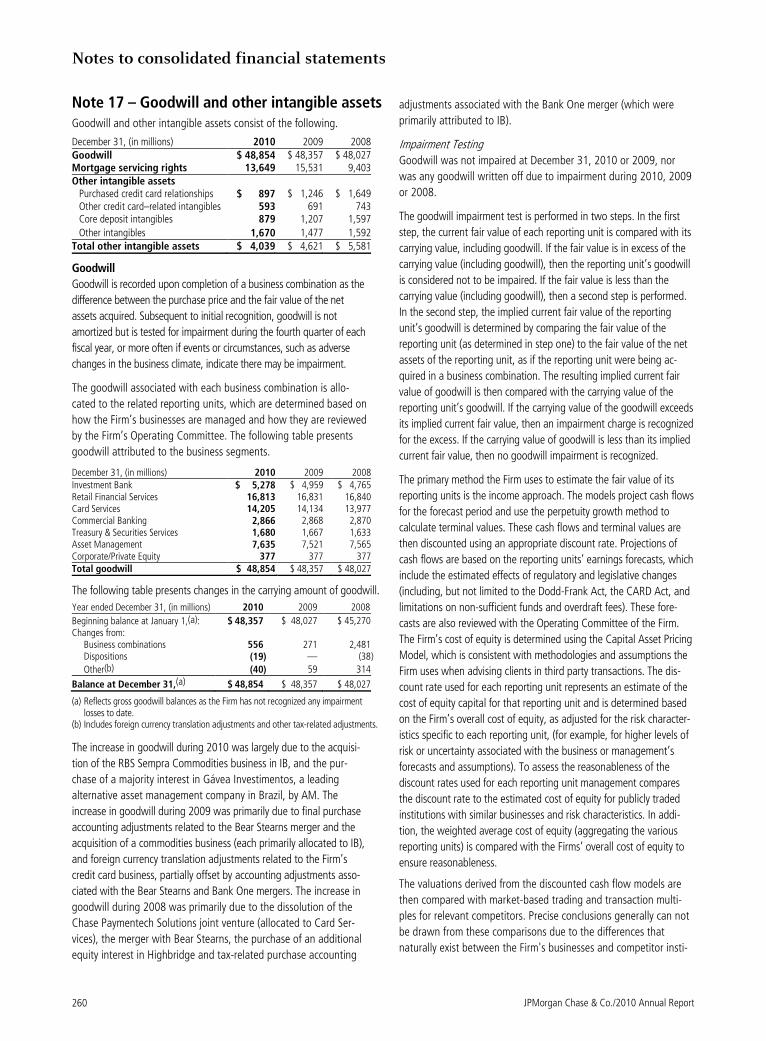
Notes to consolidated financial statements
JPMorgan Chase & Co./2010 Annual Report 260
Note 17 – Goodwill and other intangible assets Goodwill and other intangible assets consist of the following.
December 31, (in millions) 2010 2009 2008Goodwill $ 48,854 $ 48,357 $ 48,027Mortgage servicing rights 13,649 15,531 9,403Other intangible assets
Purchased credit card relationships $ 897 $ 1,246 $ 1,649Other credit card–related intangibles 593 691 743Core deposit intangibles 879 1,207 1,597
Other intangibles 1,670 1,477 1,592Total other intangible assets $ 4,039 $ 4,621 $ 5,581
Goodwill
Goodwill is recorded upon completion of a business combination as the
difference between the purchase price and the fair value of the net
assets acquired. Subsequent to initial recognition, goodwill is not
amortized but is tested for impairment during the fourth quarter of each
fiscal year, or more often if events or circumstances, such as adverse
changes in the business climate, indicate there may be impairment.
The goodwill associated with each business combination is allo-
cated to the related reporting units, which are determined based on
how the Firm’s businesses are managed and how they are reviewed
by the Firm’s Operating Committee. The following table presents
goodwill attributed to the business segments.
December 31, (in millions) 2010 2009 2008Investment Bank $ 5,278 $ 4,959 $ 4,765Retail Financial Services 16,813 16,831 16,840Card Services 14,205 14,134 13,977Commercial Banking 2,866 2,868 2,870Treasury & Securities Services 1,680 1,667 1,633Asset Management 7,635 7,521 7,565Corporate/Private Equity 377 377 377Total goodwill $ 48,854 $ 48,357 $ 48,027
The following table presents changes in the carrying amount of goodwill.
Year ended December 31, (in millions) 2010 2009 2008
Beginning balance at January 1,(a): $ 48,357 $ 48,027 $ 45,270 Changes from:
Business combinations 556 271 2,481 Dispositions (19) — (38 )
Other(b) (40) 59 314
Balance at December 31,(a) $ 48,854 $ 48,357 $ 48,027
(a) Reflects gross goodwill balances as the Firm has not recognized any impairment losses to date.
(b) Includes foreign currency translation adjustments and other tax-related adjustments.
The increase in goodwill during 2010 was largely due to the acquisi-
tion of the RBS Sempra Commodities business in IB, and the pur-
chase of a majority interest in Gávea Investimentos, a leading
alternative asset management company in Brazil, by AM. The
increase in goodwill during 2009 was primarily due to final purchase
accounting adjustments related to the Bear Stearns merger and the
acquisition of a commodities business (each primarily allocated to IB),
and foreign currency translation adjustments related to the Firm’s
credit card business, partially offset by accounting adjustments asso-
ciated with the Bear Stearns and Bank One mergers. The increase in
goodwill during 2008 was primarily due to the dissolution of the
Chase Paymentech Solutions joint venture (allocated to Card Ser-
vices), the merger with Bear Stearns, the purchase of an additional
equity interest in Highbridge and tax-related purchase accounting
adjustments associated with the Bank One merger (which were
primarily attributed to IB).
Impairment Testing
Goodwill was not impaired at December 31, 2010 or 2009, nor
was any goodwill written off due to impairment during 2010, 2009
or 2008.
The goodwill impairment test is performed in two steps. In the first
step, the current fair value of each reporting unit is compared with its
carrying value, including goodwill. If the fair value is in excess of the
carrying value (including goodwill), then the reporting unit’s goodwill
is considered not to be impaired. If the fair value is less than the
carrying value (including goodwill), then a second step is performed.
In the second step, the implied current fair value of the reporting
unit’s goodwill is determined by comparing the fair value of the
reporting unit (as determined in step one) to the fair value of the net
assets of the reporting unit, as if the reporting unit were being ac-
quired in a business combination. The resulting implied current fair
value of goodwill is then compared with the carrying value of the
reporting unit’s goodwill. If the carrying value of the goodwill exceeds
its implied current fair value, then an impairment charge is recognized
for the excess. If the carrying value of goodwill is less than its implied
current fair value, then no goodwill impairment is recognized.
The primary method the Firm uses to estimate the fair value of its
reporting units is the income approach. The models project cash flows
for the forecast period and use the perpetuity growth method to
calculate terminal values. These cash flows and terminal values are
then discounted using an appropriate discount rate. Projections of
cash flows are based on the reporting units’ earnings forecasts, which
include the estimated effects of regulatory and legislative changes
(including, but not limited to the Dodd-Frank Act, the CARD Act, and
limitations on non-sufficient funds and overdraft fees). These fore-
casts are also reviewed with the Operating Committee of the Firm.
The Firm’s cost of equity is determined using the Capital Asset Pricing
Model, which is consistent with methodologies and assumptions the
Firm uses when advising clients in third party transactions. The dis-
count rate used for each reporting unit represents an estimate of the
cost of equity capital for that reporting unit and is determined based
on the Firm’s overall cost of equity, as adjusted for the risk character-
istics specific to each reporting unit, (for example, for higher levels of
risk or uncertainty associated with the business or management’s
forecasts and assumptions). To assess the reasonableness of the
discount rates used for each reporting unit management compares
the discount rate to the estimated cost of equity for publicly traded
institutions with similar businesses and risk characteristics. In addi-
tion, the weighted average cost of equity (aggregating the various
reporting units) is compared with the Firms’ overall cost of equity to
ensure reasonableness.
The valuations derived from the discounted cash flow models are
then compared with market-based trading and transaction multi-
ples for relevant competitors. Precise conclusions generally can not
be drawn from these comparisons due to the differences that
naturally exist between the Firm's businesses and competitor insti-
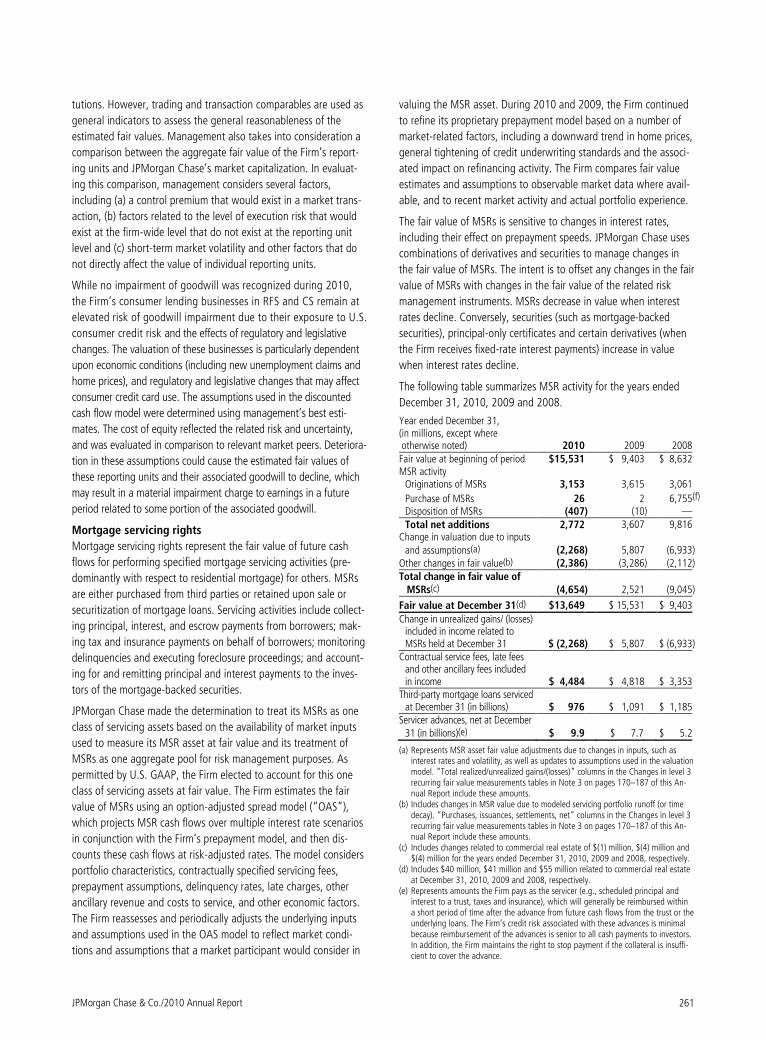
JPMorgan Chase & Co./2010 Annual Report 261
tutions. However, trading and transaction comparables are used as
general indicators to assess the general reasonableness of the
estimated fair values. Management also takes into consideration a
comparison between the aggregate fair value of the Firm’s report-
ing units and JPMorgan Chase’s market capitalization. In evaluat-
ing this comparison, management considers several factors,
including (a) a control premium that would exist in a market trans-
action, (b) factors related to the level of execution risk that would
exist at the firm-wide level that do not exist at the reporting unit
level and (c) short-term market volatility and other factors that do
not directly affect the value of individual reporting units.
While no impairment of goodwill was recognized during 2010,
the Firm’s consumer lending businesses in RFS and CS remain at
elevated risk of goodwill impairment due to their exposure to U.S.
consumer credit risk and the effects of regulatory and legislative
changes. The valuation of these businesses is particularly dependent
upon economic conditions (including new unemployment claims and
home prices), and regulatory and legislative changes that may affect
consumer credit card use. The assumptions used in the discounted
cash flow model were determined using management’s best esti-
mates. The cost of equity reflected the related risk and uncertainty,
and was evaluated in comparison to relevant market peers. Deteriora-
tion in these assumptions could cause the estimated fair values of
these reporting units and their associated goodwill to decline, which
may result in a material impairment charge to earnings in a future
period related to some portion of the associated goodwill.
Mortgage servicing rights
Mortgage servicing rights represent the fair value of future cash
flows for performing specified mortgage servicing activities (pre-
dominantly with respect to residential mortgage) for others. MSRs
are either purchased from third parties or retained upon sale or
securitization of mortgage loans. Servicing activities include collect-
ing principal, interest, and escrow payments from borrowers; mak-
ing tax and insurance payments on behalf of borrowers; monitoring
delinquencies and executing foreclosure proceedings; and account-
ing for and remitting principal and interest payments to the inves-
tors of the mortgage-backed securities.
JPMorgan Chase made the determination to treat its MSRs as one
class of servicing assets based on the availability of market inputs
used to measure its MSR asset at fair value and its treatment of
MSRs as one aggregate pool for risk management purposes. As
permitted by U.S. GAAP, the Firm elected to account for this one
class of servicing assets at fair value. The Firm estimates the fair
value of MSRs using an option-adjusted spread model (“OAS”),
which projects MSR cash flows over multiple interest rate scenarios
in conjunction with the Firm’s prepayment model, and then dis-
counts these cash flows at risk-adjusted rates. The model considers
portfolio characteristics, contractually specified servicing fees,
prepayment assumptions, delinquency rates, late charges, other
ancillary revenue and costs to service, and other economic factors.
The Firm reassesses and periodically adjusts the underlying inputs
and assumptions used in the OAS model to reflect market condi-
tions and assumptions that a market participant would consider in
valuing the MSR asset. During 2010 and 2009, the Firm continued
to refine its proprietary prepayment model based on a number of
market-related factors, including a downward trend in home prices,
general tightening of credit underwriting standards and the associ-
ated impact on refinancing activity. The Firm compares fair value
estimates and assumptions to observable market data where avail-
able, and to recent market activity and actual portfolio experience.
The fair value of MSRs is sensitive to changes in interest rates,
including their effect on prepayment speeds. JPMorgan Chase uses
combinations of derivatives and securities to manage changes in
the fair value of MSRs. The intent is to offset any changes in the fair
value of MSRs with changes in the fair value of the related risk
management instruments. MSRs decrease in value when interest
rates decline. Conversely, securities (such as mortgage-backed
securities), principal-only certificates and certain derivatives (when
the Firm receives fixed-rate interest payments) increase in value
when interest rates decline.
The following table summarizes MSR activity for the years ended
December 31, 2010, 2009 and 2008.
Year ended December 31, (in millions, except where otherwise noted) 2010 2009 2008 Fair value at beginning of period $15,531 $ 9,403 $ 8,632 MSR activity
Originations of MSRs 3,153 3,615 3,061
Purchase of MSRs 26 2 6,755(f)
Disposition of MSRs (407) (10) —
Total net additions 2,772 3,607 9,816 Change in valuation due to inputs
and assumptions(a) (2,268) 5,807 (6,933) Other changes in fair value(b) (2,386) (3,286) (2,112) Total change in fair value of MSRs(c) (4,654) 2,521 (9,045)
Fair value at December 31(d) $13,649 $ 15,531 $ 9,403
Change in unrealized gains/ (losses) included in income related to MSRs held at December 31 $ (2,268) $ 5,807 $ (6,933)
Contractual service fees, late fees and other ancillary fees included in income $ 4,484 $ 4,818 $ 3,353
Third-party mortgage loans serviced at December 31 (in billions) $ 976 $ 1,091 $ 1,185
Servicer advances, net at December 31 (in billions)(e) $ 9.9 $ 7.7 $ 5.2
(a) Represents MSR asset fair value adjustments due to changes in inputs, such as interest rates and volatility, as well as updates to assumptions used in the valuation model. “Total realized/unrealized gains/(losses)” columns in the Changes in level 3 recurring fair value measurements tables in Note 3 on pages 170–187 of this An-nual Report include these amounts.
(b) Includes changes in MSR value due to modeled servicing portfolio runoff (or time decay). “Purchases, issuances, settlements, net” columns in the Changes in level 3 recurring fair value measurements tables in Note 3 on pages 170–187 of this An-nual Report include these amounts.
(c) Includes changes related to commercial real estate of $(1) million, $(4) million and $(4) million for the years ended December 31, 2010, 2009 and 2008, respectively.
(d) Includes $40 million, $41 million and $55 million related to commercial real estate at December 31, 2010, 2009 and 2008, respectively.
(e) Represents amounts the Firm pays as the servicer (e.g., scheduled principal and interest to a trust, taxes and insurance), which will generally be reimbursed within a short period of time after the advance from future cash flows from the trust or the underlying loans. The Firm’s credit risk associated with these advances is minimal because reimbursement of the advances is senior to all cash payments to investors. In addition, the Firm maintains the right to stop payment if the collateral is insuffi-cient to cover the advance.
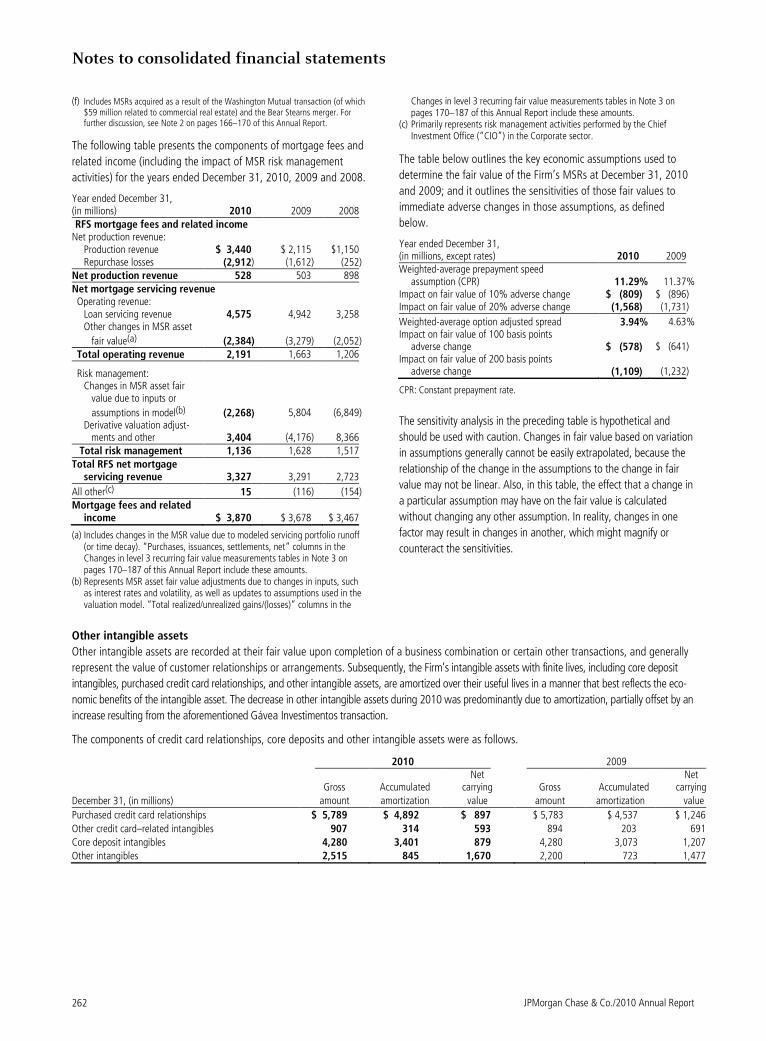
Notes to consolidated financial statements
JPMorgan Chase & Co./2010 Annual Report 262
(f) Includes MSRs acquired as a result of the Washington Mutual transaction (of which $59 million related to commercial real estate) and the Bear Stearns merger. For further discussion, see Note 2 on pages 166–170 of this Annual Report.
The following table presents the components of mortgage fees and
related income (including the impact of MSR risk management
activities) for the years ended December 31, 2010, 2009 and 2008.
Year ended December 31, (in millions) 2010 2009 2008 RFS mortgage fees and related income
Net production revenue: Production revenue $ 3,440 $ 2,115 $1,150 Repurchase losses (2,912) (1,612) (252)
Net production revenue 528 503 898 Net mortgage servicing revenue Operating revenue:
Loan servicing revenue 4,575 4,942 3,258 Other changes in MSR asset
fair value(a) (2,384) (3,279) (2,052) Total operating revenue 2,191 1,663 1,206
Risk management: Changes in MSR asset fair value due to inputs or
assumptions in model(b) (2,268) 5,804 (6,849) Derivative valuation adjust- ments and other 3,404 (4,176) 8,366
Total risk management 1,136 1,628 1,517 Total RFS net mortgage
servicing revenue 3,327 3,291 2,723 All other(c) 15 (116) (154) Mortgage fees and related
income $ 3,870 $ 3,678 $ 3,467 (a) Includes changes in the MSR value due to modeled servicing portfolio runoff
(or time decay). “Purchases, issuances, settlements, net” columns in the Changes in level 3 recurring fair value measurements tables in Note 3 on pages 170–187 of this Annual Report include these amounts.
(b) Represents MSR asset fair value adjustments due to changes in inputs, such as interest rates and volatility, as well as updates to assumptions used in the valuation model. “Total realized/unrealized gains/(losses)” columns in the
Changes in level 3 recurring fair value measurements tables in Note 3 on pages 170–187 of this Annual Report include these amounts.
(c) Primarily represents risk management activities performed by the Chief Investment Office (“CIO”) in the Corporate sector.
The table below outlines the key economic assumptions used to
determine the fair value of the Firm’s MSRs at December 31, 2010
and 2009; and it outlines the sensitivities of those fair values to
immediate adverse changes in those assumptions, as defined
below.
Year ended December 31, (in millions, except rates) 2010 2009 Weighted-average prepayment speed
assumption (CPR) 11.29% 11.37% Impact on fair value of 10% adverse change $ (809) $ (896) Impact on fair value of 20% adverse change (1,568) (1,731)
Weighted-average option adjusted spread 3.94% 4.63% Impact on fair value of 100 basis points
adverse change $ (578) $ (641) Impact on fair value of 200 basis points
adverse change (1,109) (1,232)
CPR: Constant prepayment rate.
The sensitivity analysis in the preceding table is hypothetical and
should be used with caution. Changes in fair value based on variation
in assumptions generally cannot be easily extrapolated, because the
relationship of the change in the assumptions to the change in fair
value may not be linear. Also, in this table, the effect that a change in
a particular assumption may have on the fair value is calculated
without changing any other assumption. In reality, changes in one
factor may result in changes in another, which might magnify or
counteract the sensitivities.
Other intangible assets
Other intangible assets are recorded at their fair value upon completion of a business combination or certain other transactions, and generally
represent the value of customer relationships or arrangements. Subsequently, the Firm’s intangible assets with finite lives, including core deposit
intangibles, purchased credit card relationships, and other intangible assets, are amortized over their useful lives in a manner that best reflects the eco-
nomic benefits of the intangible asset. The decrease in other intangible assets during 2010 was predominantly due to amortization, partially offset by an
increase resulting from the aforementioned Gávea Investimentos transaction.
The components of credit card relationships, core deposits and other intangible assets were as follows.
2010 2009
Gross Accumulated
Net carrying Gross Accumulated
Net carrying
December 31, (in millions) amount amortization value amount amortization value
Purchased credit card relationships $ 5,789 $ 4,892 $ 897 $ 5,783 $ 4,537 $ 1,246
Other credit card–related intangibles 907 314 593 894 203 691
Core deposit intangibles 4,280 3,401 879 4,280 3,073 1,207
Other intangibles 2,515 845 1,670 2,200 723 1,477
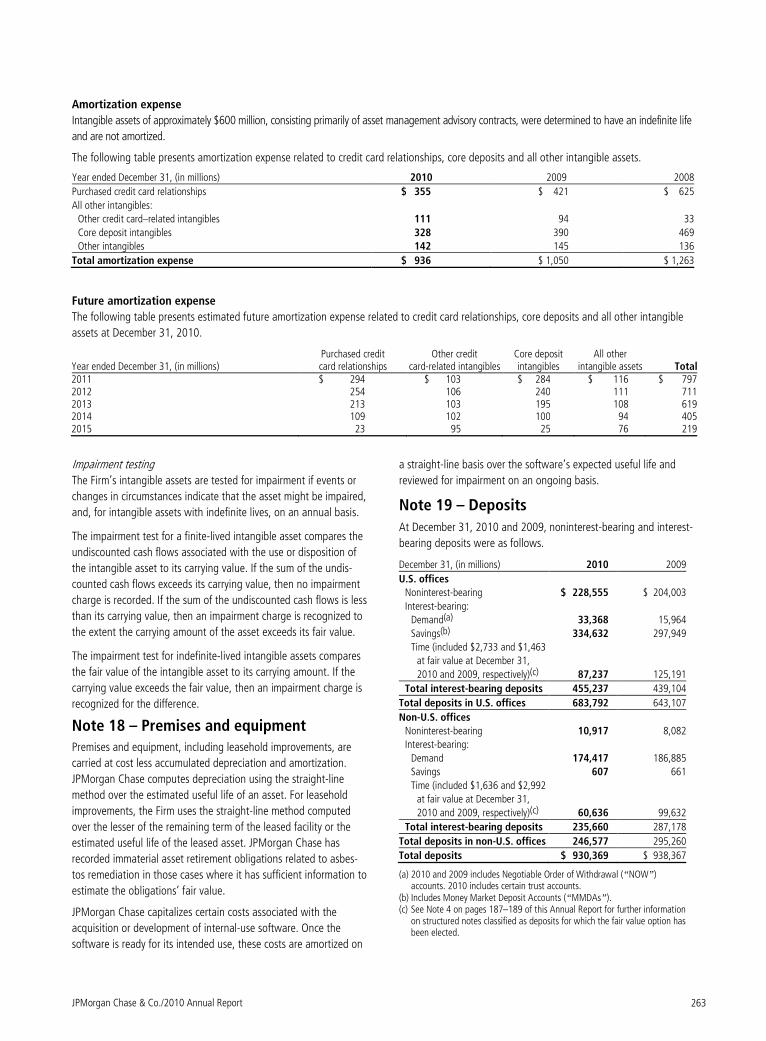
JPMorgan Chase & Co./2010 Annual Report 263
Amortization expense
Intangible assets of approximately $600 million, consisting primarily of asset management advisory contracts, were determined to have an indefinite life
and are not amortized.
The following table presents amortization expense related to credit card relationships, core deposits and all other intangible assets.
Year ended December 31, (in millions) 2010 2009 2008
Purchased credit card relationships $ 355 $ 421 $ 625
All other intangibles:
Other credit card–related intangibles 111 94 33
Core deposit intangibles 328 390 469
Other intangibles 142 145 136
Total amortization expense $ 936 $ 1,050 $ 1,263
Future amortization expense
The following table presents estimated future amortization expense related to credit card relationships, core deposits and all other intangible
assets at December 31, 2010.
Year ended December 31, (in millions) Purchased credit card relationships
Other credit card-related intangibles
Core deposit intangibles
All other intangible assets Total
2011 $ 294 $ 103 $ 284 $ 116 $ 797 2012 254 106 240 111 711 2013 213 103 195 108 619 2014 109 102 100 94 405 2015 23 95 25 76 219
Impairment testing
The Firm’s intangible assets are tested for impairment if events or
changes in circumstances indicate that the asset might be impaired,
and, for intangible assets with indefinite lives, on an annual basis.
The impairment test for a finite-lived intangible asset compares the
undiscounted cash flows associated with the use or disposition of
the intangible asset to its carrying value. If the sum of the undis-
counted cash flows exceeds its carrying value, then no impairment
charge is recorded. If the sum of the undiscounted cash flows is less
than its carrying value, then an impairment charge is recognized to
the extent the carrying amount of the asset exceeds its fair value.
The impairment test for indefinite-lived intangible assets compares
the fair value of the intangible asset to its carrying amount. If the
carrying value exceeds the fair value, then an impairment charge is
recognized for the difference.
Note 18 – Premises and equipment Premises and equipment, including leasehold improvements, are
carried at cost less accumulated depreciation and amortization.
JPMorgan Chase computes depreciation using the straight-line
method over the estimated useful life of an asset. For leasehold
improvements, the Firm uses the straight-line method computed
over the lesser of the remaining term of the leased facility or the
estimated useful life of the leased asset. JPMorgan Chase has
recorded immaterial asset retirement obligations related to asbes-
tos remediation in those cases where it has sufficient information to
estimate the obligations’ fair value.
JPMorgan Chase capitalizes certain costs associated with the
acquisition or development of internal-use software. Once the
software is ready for its intended use, these costs are amortized on
a straight-line basis over the software’s expected useful life and
reviewed for impairment on an ongoing basis.
Note 19 – Deposits
At December 31, 2010 and 2009, noninterest-bearing and interest-
bearing deposits were as follows.
December 31, (in millions) 2010 2009
U.S. offices
Noninterest-bearing $ 228,555 $ 204,003
Interest-bearing:
Demand(a) 33,368 15,964
Savings(b) 334,632 297,949
Time (included $2,733 and $1,463
at fair value at December 31,
2010 and 2009, respectively)(c) 87,237 125,191
Total interest-bearing deposits 455,237 439,104
Total deposits in U.S. offices 683,792 643,107
Non-U.S. offices
Noninterest-bearing 10,917 8,082
Interest-bearing:
Demand 174,417 186,885
Savings 607 661
Time (included $1,636 and $2,992
at fair value at December 31,
2010 and 2009, respectively)(c) 60,636 99,632
Total interest-bearing deposits 235,660 287,178
Total deposits in non-U.S. offices 246,577 295,260
Total deposits $ 930,369 $ 938,367
(a) 2010 and 2009 includes Negotiable Order of Withdrawal (“ NOW” ) accounts. 2010 includes certain trust accounts.
(b) Includes Money Market Deposit Accounts (“ MMDAs” ). (c) See Note 4 on pages 187–189 of this Annual Report for further information
on structured notes classified as deposits for which the fair value option has been elected.
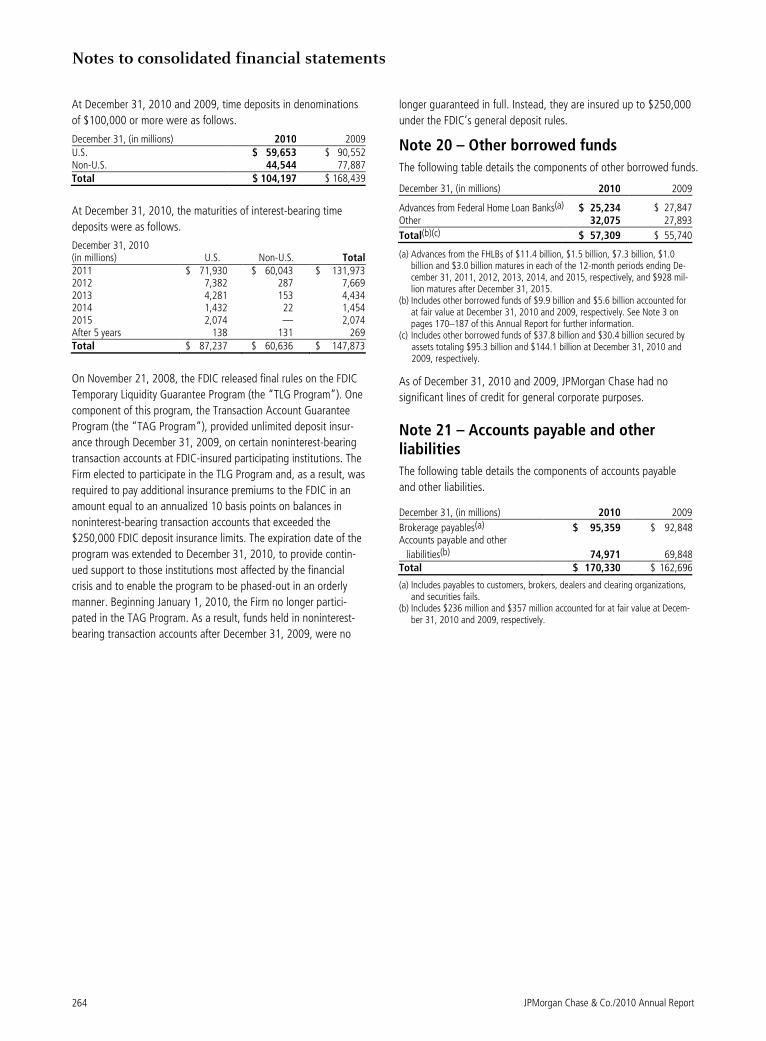
Notes to consolidated financial statements
JPMorgan Chase & Co./2010 Annual Report 264
At December 31, 2010 and 2009, time deposits in denominations
of $100,000 or more were as follows.
December 31, (in millions) 2010 2009U.S. $ 59,653 $ 90,552Non-U.S. 44,544 77,887Total $ 104,197 $ 168,439
At December 31, 2010, the maturities of interest-bearing time
deposits were as follows.
December 31, 2010 (in millions) U.S. Non-U.S. Total 2011 $ 71,930 $ 60,043 $ 131,973 2012 7,382 287 7,669 2013 4,281 153 4,434 2014 1,432 22 1,454 2015 2,074 — 2,074 After 5 years 138 131 269 Total $ 87,237 $ 60,636 $ 147,873
On November 21, 2008, the FDIC released final rules on the FDIC
Temporary Liquidity Guarantee Program (the “TLG Program”). One
component of this program, the Transaction Account Guarantee
Program (the “TAG Program”), provided unlimited deposit insur-
ance through December 31, 2009, on certain noninterest-bearing
transaction accounts at FDIC-insured participating institutions. The
Firm elected to participate in the TLG Program and, as a result, was
required to pay additional insurance premiums to the FDIC in an
amount equal to an annualized 10 basis points on balances in
noninterest-bearing transaction accounts that exceeded the
$250,000 FDIC deposit insurance limits. The expiration date of the
program was extended to December 31, 2010, to provide contin-
ued support to those institutions most affected by the financial
crisis and to enable the program to be phased-out in an orderly
manner. Beginning January 1, 2010, the Firm no longer partici-
pated in the TAG Program. As a result, funds held in noninterest-
bearing transaction accounts after December 31, 2009, were no
longer guaranteed in full. Instead, they are insured up to $250,000
under the FDIC’s general deposit rules.
Note 20 – Other borrowed funds
The following table details the components of other borrowed funds.
December 31, (in millions) 2010 2009
Advances from Federal Home Loan Banks(a) $ 25,234 $ 27,847 Other 32,075 27,893
Total(b)(c) $ 57,309 $ 55,740
(a) Advances from the FHLBs of $11.4 billion, $1.5 billion, $7.3 billion, $1.0 billion and $3.0 billion matures in each of the 12-month periods ending De-cember 31, 2011, 2012, 2013, 2014, and 2015, respectively, and $928 mil-lion matures after December 31, 2015.
(b) Includes other borrowed funds of $9.9 billion and $5.6 billion accounted for at fair value at December 31, 2010 and 2009, respectively. See Note 3 on pages 170–187 of this Annual Report for further information.
(c) Includes other borrowed funds of $37.8 billion and $30.4 billion secured by assets totaling $95.3 billion and $144.1 billion at December 31, 2010 and 2009, respectively.
As of December 31, 2010 and 2009, JPMorgan Chase had no
significant lines of credit for general corporate purposes.
Note 21 – Accounts payable and other liabilities
The following table details the components of accounts payable
and other liabilities.
December 31, (in millions) 2010 2009
Brokerage payables(a) $ 95,359 $ 92,848Accounts payable and other
liabilities(b) 74,971 69,848Total $ 170,330 $ 162,696
(a) Includes payables to customers, brokers, dealers and clearing organizations, and securities fails.
(b) Includes $236 million and $357 million accounted for at fair value at Decem-ber 31, 2010 and 2009, respectively.
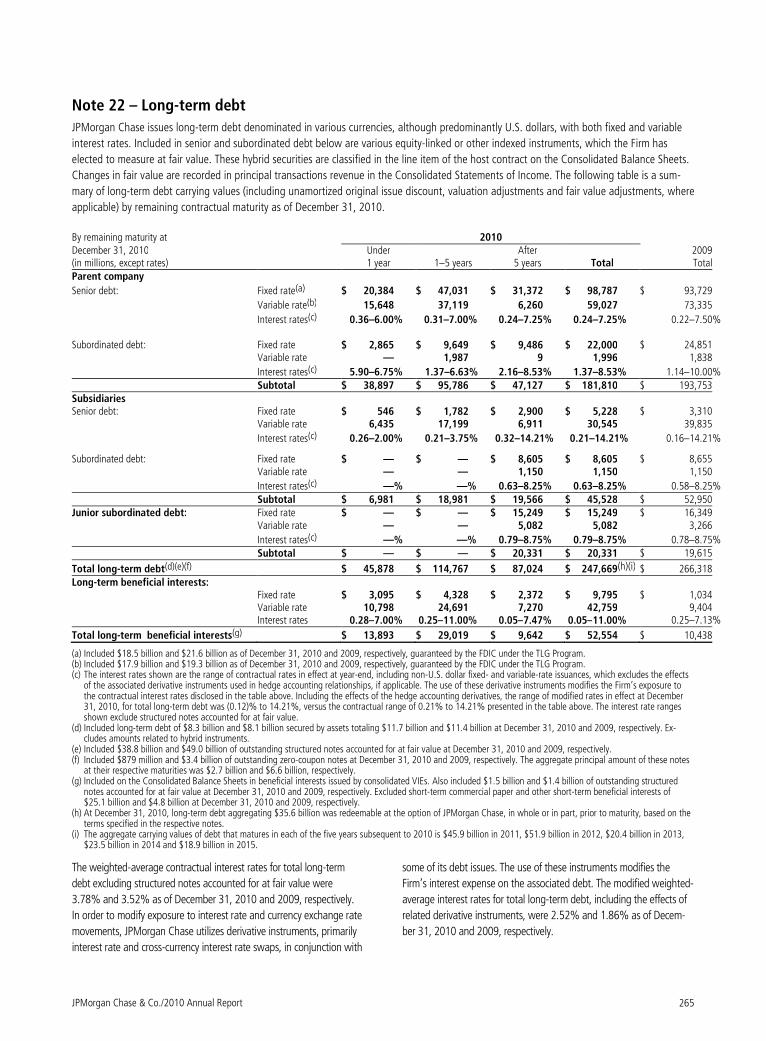
JPMorgan Chase & Co./2010 Annual Report 265
Note 22 – Long-term debt
JPMorgan Chase issues long-term debt denominated in various currencies, although predominantly U.S. dollars, with both fixed and variable
interest rates. Included in senior and subordinated debt below are various equity-linked or other indexed instruments, which the Firm has
elected to measure at fair value. These hybrid securities are classified in the line item of the host contract on the Consolidated Balance Sheets.
Changes in fair value are recorded in principal transactions revenue in the Consolidated Statements of Income. The following table is a sum-
mary of long-term debt carrying values (including unamortized original issue discount, valuation adjustments and fair value adjustments, where
applicable) by remaining contractual maturity as of December 31, 2010.
By remaining maturity at 2010 December 31, 2010 Under After 2009 (in millions, except rates) 1 year 1–5 years 5 years Total Total Parent company
Senior debt: Fixed rate(a) $ 20,384 $ 47,031 $ 31,372 $ 98,787 $ 93,729
Variable rate(b) 15,648 37,119 6,260 59,027 73,335
Interest rates(c) 0.36–6.00% 0.31–7.00% 0.24–7.25% 0.24–7.25% 0.22–7.50% Subordinated debt: Fixed rate $ 2,865 $ 9,649 $ 9,486 $ 22,000 $ 24,851 Variable rate — 1,987 9 1,996 1,838
Interest rates(c) 5.90–6.75% 1.37–6.63% 2.16–8.53% 1.37–8.53% 1.14–10.00% Subtotal $ 38,897 $ 95,786 $ 47,127 $ 181,810 $ 193,753 Subsidiaries Senior debt: Fixed rate $ 546 $ 1,782 $ 2,900 $ 5,228 $ 3,310 Variable rate 6,435 17,199 6,911 30,545 39,835
Interest rates(c) 0.26–2.00% 0.21–3.75% 0.32–14.21% 0.21–14.21% 0.16–14.21%
Subordinated debt: Fixed rate $ — $ — $ 8,605 $ 8,605 $ 8,655 Variable rate — — 1,150 1,150 1,150
Interest rates(c) —% —% 0.63–8.25% 0.63–8.25% 0.58–8.25% Subtotal $ 6,981 $ 18,981 $ 19,566 $ 45,528 $ 52,950 Junior subordinated debt: Fixed rate $ — $ — $ 15,249 $ 15,249 $ 16,349 Variable rate — — 5,082 5,082 3,266
Interest rates(c) —% —% 0.79–8.75% 0.79–8.75% 0.78–8.75% Subtotal $ — $ — $ 20,331 $ 20,331 $ 19,615
Total long-term debt(d)(e)(f) $ 45,878 $ 114,767 $ 87,024 $ 247,669(h)(i) $ 266,318
Long-term beneficial interests: Fixed rate $ 3,095 $ 4,328 $ 2,372 $ 9,795 $ 1,034 Variable rate 10,798 24,691 7,270 42,759 9,404 Interest rates 0.28–7.00% 0.25–11.00% 0.05–7.47% 0.05–11.00% 0.25–7.13%
Total long-term beneficial interests(g) $ 13,893 $ 29,019 $ 9,642 $ 52,554 $ 10,438
(a) Included $18.5 billion and $21.6 billion as of December 31, 2010 and 2009, respectively, guaranteed by the FDIC under the TLG Program. (b) Included $17.9 billion and $19.3 billion as of December 31, 2010 and 2009, respectively, guaranteed by the FDIC under the TLG Program. (c) The interest rates shown are the range of contractual rates in effect at year-end, including non-U.S. dollar fixed- and variable-rate issuances, which excludes the effects
of the associated derivative instruments used in hedge accounting relationships, if applicable. The use of these derivative instruments modifies the Firm’s exposure to the contractual interest rates disclosed in the table above. Including the effects of the hedge accounting derivatives, the range of modified rates in effect at December 31, 2010, for total long-term debt was (0.12)% to 14.21%, versus the contractual range of 0.21% to 14.21% presented in the table above. The interest rate ranges shown exclude structured notes accounted for at fair value.
(d) Included long-term debt of $8.3 billion and $8.1 billion secured by assets totaling $11.7 billion and $11.4 billion at December 31, 2010 and 2009, respectively. Ex-cludes amounts related to hybrid instruments.
(e) Included $38.8 billion and $49.0 billion of outstanding structured notes accounted for at fair value at December 31, 2010 and 2009, respectively. (f) Included $879 million and $3.4 billion of outstanding zero-coupon notes at December 31, 2010 and 2009, respectively. The aggregate principal amount of these notes
at their respective maturities was $2.7 billion and $6.6 billion, respectively. (g) Included on the Consolidated Balance Sheets in beneficial interests issued by consolidated VIEs. Also included $1.5 billion and $1.4 billion of outstanding structured
notes accounted for at fair value at December 31, 2010 and 2009, respectively. Excluded short-term commercial paper and other short-term beneficial interests of $25.1 billion and $4.8 billion at December 31, 2010 and 2009, respectively.
(h) At December 31, 2010, long-term debt aggregating $35.6 billion was redeemable at the option of JPMorgan Chase, in whole or in part, prior to maturity, based on the terms specified in the respective notes.
(i) The aggregate carrying values of debt that matures in each of the five years subsequent to 2010 is $45.9 billion in 2011, $51.9 billion in 2012, $20.4 billion in 2013, $23.5 billion in 2014 and $18.9 billion in 2015.
The weighted-average contractual interest rates for total long-term
debt excluding structured notes accounted for at fair value were
3.78% and 3.52% as of December 31, 2010 and 2009, respectively.
In order to modify exposure to interest rate and currency exchange rate
movements, JPMorgan Chase utilizes derivative instruments, primarily
interest rate and cross-currency interest rate swaps, in conjunction with
some of its debt issues. The use of these instruments modifies the
Firm’s interest expense on the associated debt. The modified weighted-
average interest rates for total long-term debt, including the effects of
related derivative instruments, were 2.52% and 1.86% as of Decem-
ber 31, 2010 and 2009, respectively.
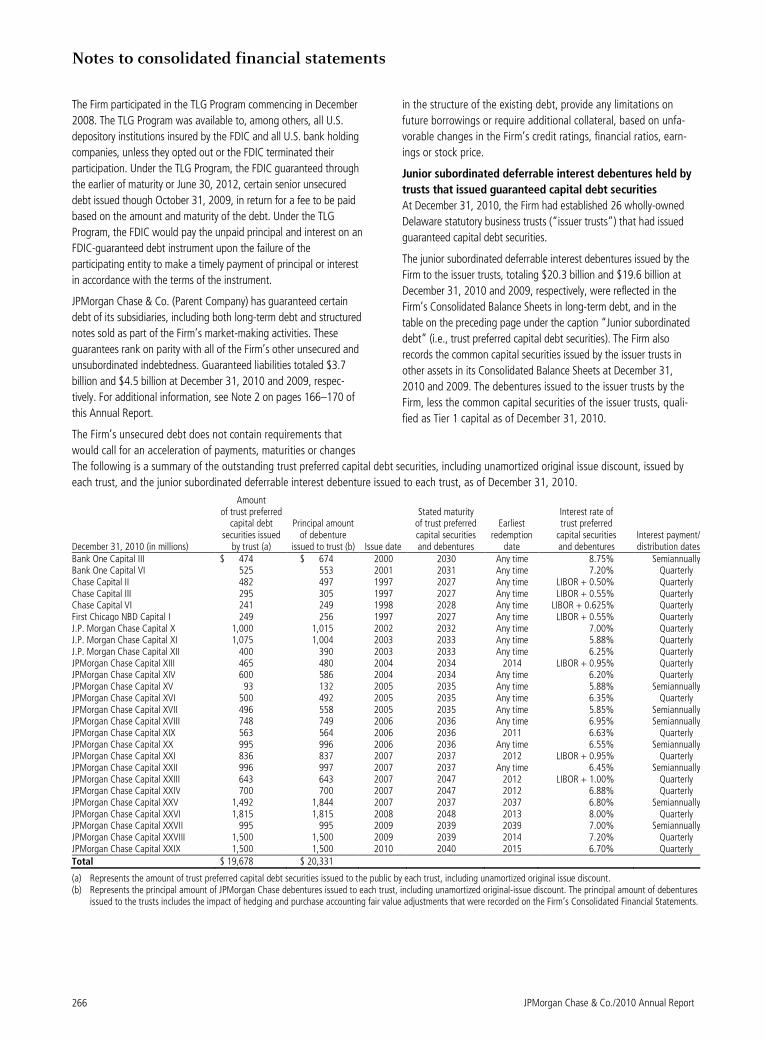
Notes to consolidated financial statements
JPMorgan Chase & Co./2010 Annual Report 266
The Firm participated in the TLG Program commencing in December
2008. The TLG Program was available to, among others, all U.S.
depository institutions insured by the FDIC and all U.S. bank holding
companies, unless they opted out or the FDIC terminated their
participation. Under the TLG Program, the FDIC guaranteed through
the earlier of maturity or June 30, 2012, certain senior unsecured
debt issued though October 31, 2009, in return for a fee to be paid
based on the amount and maturity of the debt. Under the TLG
Program, the FDIC would pay the unpaid principal and interest on an
FDIC-guaranteed debt instrument upon the failure of the
participating entity to make a timely payment of principal or interest
in accordance with the terms of the instrument.
JPMorgan Chase & Co. (Parent Company) has guaranteed certain
debt of its subsidiaries, including both long-term debt and structured
notes sold as part of the Firm’s market-making activities. These
guarantees rank on parity with all of the Firm’s other unsecured and
unsubordinated indebtedness. Guaranteed liabilities totaled $3.7
billion and $4.5 billion at December 31, 2010 and 2009, respec-
tively. For additional information, see Note 2 on pages 166–170 of
this Annual Report.
The Firm’s unsecured debt does not contain requirements that
would call for an acceleration of payments, maturities or changes
in the structure of the existing debt, provide any limitations on
future borrowings or require additional collateral, based on unfa-
vorable changes in the Firm’s credit ratings, financial ratios, earn-
ings or stock price.
Junior subordinated deferrable interest debentures held by
trusts that issued guaranteed capital debt securities
At December 31, 2010, the Firm had established 26 wholly-owned
Delaware statutory business trusts (“issuer trusts”) that had issued
guaranteed capital debt securities.
The junior subordinated deferrable interest debentures issued by the
Firm to the issuer trusts, totaling $20.3 billion and $19.6 billion at
December 31, 2010 and 2009, respectively, were reflected in the
Firm’s Consolidated Balance Sheets in long-term debt, and in the
table on the preceding page under the caption “Junior subordinated
debt” (i.e., trust preferred capital debt securities). The Firm also
records the common capital securities issued by the issuer trusts in
other assets in its Consolidated Balance Sheets at December 31,
2010 and 2009. The debentures issued to the issuer trusts by the
Firm, less the common capital securities of the issuer trusts, quali-
fied as Tier 1 capital as of December 31, 2010.
The following is a summary of the outstanding trust preferred capital debt securities, including unamortized original issue discount, issued by
each trust, and the junior subordinated deferrable interest debenture issued to each trust, as of December 31, 2010.
December 31, 2010 (in millions)
Amount of trust preferred
capital debt securities issued
by trust (a)
Principal amount of debenture
issued to trust (b) Issue date
Stated maturity of trust preferred capital securities and debentures
Earliest redemption
date
Interest rate of trust preferred
capital securities and debentures
Interest payment/ distribution dates
Bank One Capital III $ 474 $ 674 2000 2030 Any time 8.75% Semiannually Bank One Capital VI 525 553 2001 2031 Any time 7.20% Quarterly Chase Capital II 482 497 1997 2027 Any time LIBOR + 0.50% Quarterly Chase Capital III 295 305 1997 2027 Any time LIBOR + 0.55% Quarterly Chase Capital VI 241 249 1998 2028 Any time LIBOR + 0.625% Quarterly First Chicago NBD Capital I 249 256 1997 2027 Any time LIBOR + 0.55% Quarterly J.P. Morgan Chase Capital X 1,000 1,015 2002 2032 Any time 7.00% Quarterly J.P. Morgan Chase Capital XI 1,075 1,004 2003 2033 Any time 5.88% Quarterly J.P. Morgan Chase Capital XII 400 390 2003 2033 Any time 6.25% Quarterly JPMorgan Chase Capital XIII 465 480 2004 2034 2014 LIBOR + 0.95% Quarterly JPMorgan Chase Capital XIV 600 586 2004 2034 Any time 6.20% Quarterly JPMorgan Chase Capital XV 93 132 2005 2035 Any time 5.88% Semiannually JPMorgan Chase Capital XVI 500 492 2005 2035 Any time 6.35% Quarterly JPMorgan Chase Capital XVII 496 558 2005 2035 Any time 5.85% Semiannually JPMorgan Chase Capital XVIII 748 749 2006 2036 Any time 6.95% Semiannually JPMorgan Chase Capital XIX 563 564 2006 2036 2011 6.63% Quarterly JPMorgan Chase Capital XX 995 996 2006 2036 Any time 6.55% Semiannually JPMorgan Chase Capital XXI 836 837 2007 2037 2012 LIBOR + 0.95% Quarterly JPMorgan Chase Capital XXII 996 997 2007 2037 Any time 6.45% Semiannually JPMorgan Chase Capital XXIII 643 643 2007 2047 2012 LIBOR + 1.00% Quarterly JPMorgan Chase Capital XXIV 700 700 2007 2047 2012 6.88% Quarterly JPMorgan Chase Capital XXV 1,492 1,844 2007 2037 2037 6.80% Semiannually JPMorgan Chase Capital XXVI 1,815 1,815 2008 2048 2013 8.00% Quarterly JPMorgan Chase Capital XXVII 995 995 2009 2039 2039 7.00% Semiannually JPMorgan Chase Capital XXVIII 1,500 1,500 2009 2039 2014 7.20% Quarterly JPMorgan Chase Capital XXIX 1,500 1,500 2010 2040 2015 6.70% Quarterly Total $ 19,678 $ 20,331
(a) Represents the amount of trust preferred capital debt securities issued to the public by each trust, including unamortized original issue discount. (b) Represents the principal amount of JPMorgan Chase debentures issued to each trust, including unamortized original-issue discount. The principal amount of debentures
issued to the trusts includes the impact of hedging and purchase accounting fair value adjustments that were recorded on the Firm’s Consolidated Financial Statements.
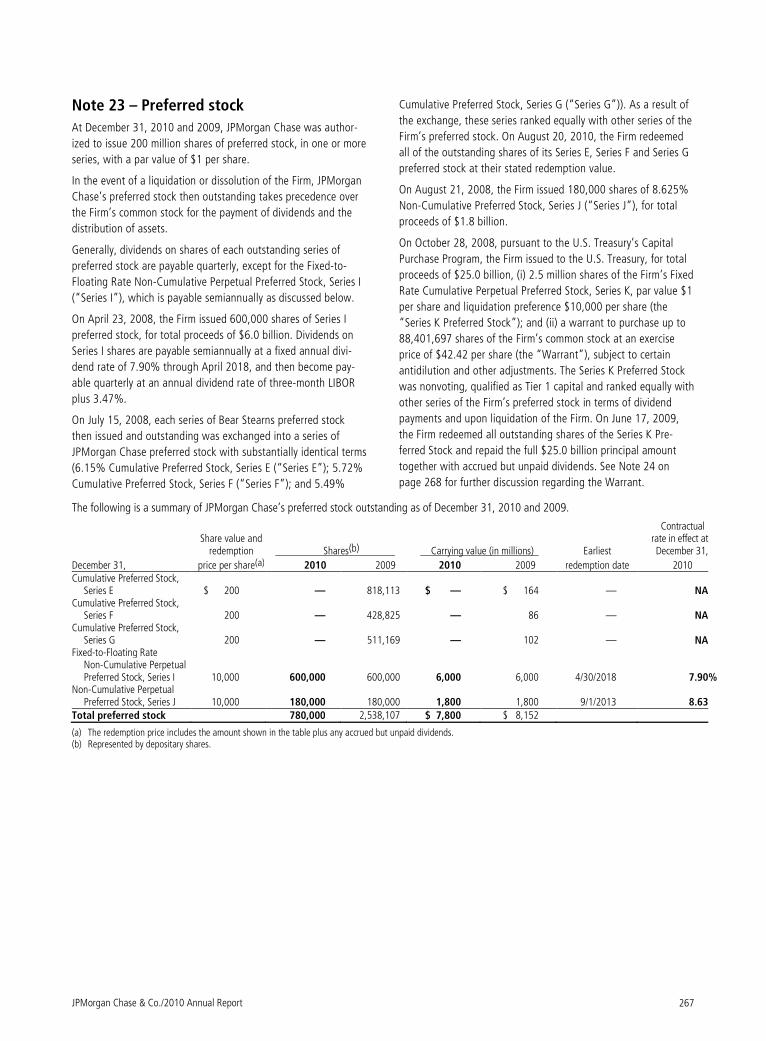
JPMorgan Chase & Co./2010 Annual Report 267
Note 23 – Preferred stock
At December 31, 2010 and 2009, JPMorgan Chase was author-
ized to issue 200 million shares of preferred stock, in one or more
series, with a par value of $1 per share.
In the event of a liquidation or dissolution of the Firm, JPMorgan
Chase’s preferred stock then outstanding takes precedence over
the Firm’s common stock for the payment of dividends and the
distribution of assets.
Generally, dividends on shares of each outstanding series of
preferred stock are payable quarterly, except for the Fixed-to-
Floating Rate Non-Cumulative Perpetual Preferred Stock, Series I
(“Series I”), which is payable semiannually as discussed below.
On April 23, 2008, the Firm issued 600,000 shares of Series I
preferred stock, for total proceeds of $6.0 billion. Dividends on
Series I shares are payable semiannually at a fixed annual divi-
dend rate of 7.90% through April 2018, and then become pay-
able quarterly at an annual dividend rate of three-month LIBOR
plus 3.47%.
On July 15, 2008, each series of Bear Stearns preferred stock
then issued and outstanding was exchanged into a series of
JPMorgan Chase preferred stock with substantially identical terms
(6.15% Cumulative Preferred Stock, Series E (“Series E”); 5.72%
Cumulative Preferred Stock, Series F (“Series F”); and 5.49%
Cumulative Preferred Stock, Series G (“Series G”)). As a result of
the exchange, these series ranked equally with other series of the
Firm’s preferred stock. On August 20, 2010, the Firm redeemed
all of the outstanding shares of its Series E, Series F and Series G
preferred stock at their stated redemption value.
On August 21, 2008, the Firm issued 180,000 shares of 8.625%
Non-Cumulative Preferred Stock, Series J (“Series J”), for total
proceeds of $1.8 billion.
On October 28, 2008, pursuant to the U.S. Treasury’s Capital
Purchase Program, the Firm issued to the U.S. Treasury, for total
proceeds of $25.0 billion, (i) 2.5 million shares of the Firm’s Fixed
Rate Cumulative Perpetual Preferred Stock, Series K, par value $1
per share and liquidation preference $10,000 per share (the
“Series K Preferred Stock”); and (ii) a warrant to purchase up to
88,401,697 shares of the Firm’s common stock at an exercise
price of $42.42 per share (the “Warrant”), subject to certain
antidilution and other adjustments. The Series K Preferred Stock
was nonvoting, qualified as Tier 1 capital and ranked equally with
other series of the Firm’s preferred stock in terms of dividend
payments and upon liquidation of the Firm. On June 17, 2009,
the Firm redeemed all outstanding shares of the Series K Pre-
ferred Stock and repaid the full $25.0 billion principal amount
together with accrued but unpaid dividends. See Note 24 on
page 268 for further discussion regarding the Warrant.
The following is a summary of JPMorgan Chase’s preferred stock outstanding as of December 31, 2010 and 2009.
Share value and
redemption Shares(b) Carrying value (in millions) Earliest
Contractual rate in effect at December 31,
December 31, price per share(a) 2010 2009 2010 2009 redemption date 2010 Cumulative Preferred Stock,
Series E $ 200 — 818,113 $ — $ 164 — NA Cumulative Preferred Stock,
Series F 200 — 428,825 — 86 — NA Cumulative Preferred Stock,
Series G 200 — 511,169 — 102 — NA Fixed-to-Floating Rate
Non-Cumulative Perpetual Preferred Stock, Series I 10,000 600,000 600,000 6,000 6,000 4/30/2018 7.90 %
Non-Cumulative Perpetual Preferred Stock, Series J 10,000 180,000 180,000 1,800 1,800 9/1/2013 8.63
Total preferred stock 780,000 2,538,107 $ 7,800 $ 8,152
(a) The redemption price includes the amount shown in the table plus any accrued but unpaid dividends. (b) Represented by depositary shares.
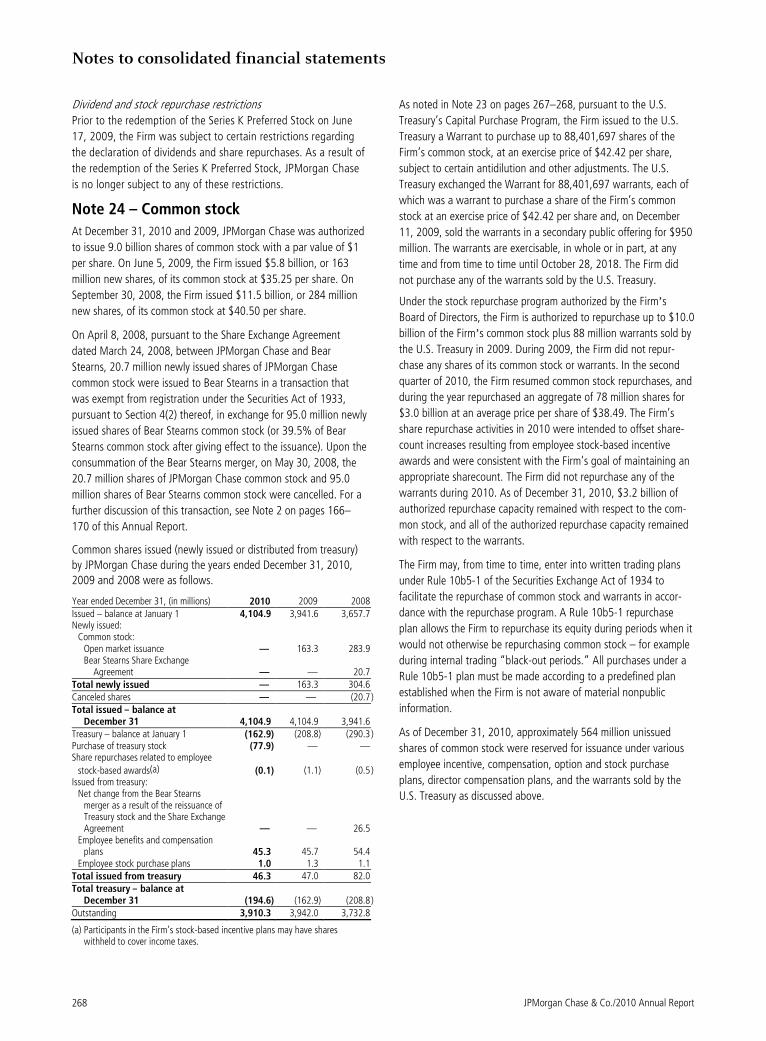
Notes to consolidated financial statements
JPMorgan Chase & Co./2010 Annual Report 268
Dividend and stock repurchase restrictions
Prior to the redemption of the Series K Preferred Stock on June
17, 2009, the Firm was subject to certain restrictions regarding
the declaration of dividends and share repurchases. As a result of
the redemption of the Series K Preferred Stock, JPMorgan Chase
is no longer subject to any of these restrictions.
Note 24 – Common stock
At December 31, 2010 and 2009, JPMorgan Chase was authorized
to issue 9.0 billion shares of common stock with a par value of $1
per share. On June 5, 2009, the Firm issued $5.8 billion, or 163
million new shares, of its common stock at $35.25 per share. On
September 30, 2008, the Firm issued $11.5 billion, or 284 million
new shares, of its common stock at $40.50 per share.
On April 8, 2008, pursuant to the Share Exchange Agreement
dated March 24, 2008, between JPMorgan Chase and Bear
Stearns, 20.7 million newly issued shares of JPMorgan Chase
common stock were issued to Bear Stearns in a transaction that
was exempt from registration under the Securities Act of 1933,
pursuant to Section 4(2) thereof, in exchange for 95.0 million newly
issued shares of Bear Stearns common stock (or 39.5% of Bear
Stearns common stock after giving effect to the issuance). Upon the
consummation of the Bear Stearns merger, on May 30, 2008, the
20.7 million shares of JPMorgan Chase common stock and 95.0
million shares of Bear Stearns common stock were cancelled. For a
further discussion of this transaction, see Note 2 on pages 166–
170 of this Annual Report.
Common shares issued (newly issued or distributed from treasury)
by JPMorgan Chase during the years ended December 31, 2010,
2009 and 2008 were as follows.
Year ended December 31, (in millions) 2010 2009 2008 Issued – balance at January 1 4,104.9 3,941.6 3,657.7 Newly issued:
Common stock: Open market issuance — 163.3 283.9 Bear Stearns Share Exchange
Agreement — — 20.7 Total newly issued — 163.3 304.6 Canceled shares — — (20.7 ) Total issued – balance at
December 31 4,104.9 4,104.9 3,941.6 Treasury – balance at January 1 (162.9) (208.8) (290.3 ) Purchase of treasury stock (77.9) — — Share repurchases related to employee
stock-based awards(a) (0.1) (1.1) (0.5 ) Issued from treasury:
Net change from the Bear Stearns merger as a result of the reissuance of Treasury stock and the Share Exchange Agreement — — 26.5
Employee benefits and compensation plans 45.3 45.7 54.4
Employee stock purchase plans 1.0 1.3 1.1 Total issued from treasury 46.3 47.0 82.0 Total treasury – balance at
December 31 (194.6) (162.9) (208.8 ) Outstanding 3,910.3 3,942.0 3,732.8
(a) Participants in the Firm’s stock-based incentive plans may have shares withheld to cover income taxes.
As noted in Note 23 on pages 267–268, pursuant to the U.S.
Treasury’s Capital Purchase Program, the Firm issued to the U.S.
Treasury a Warrant to purchase up to 88,401,697 shares of the
Firm’s common stock, at an exercise price of $42.42 per share,
subject to certain antidilution and other adjustments. The U.S.
Treasury exchanged the Warrant for 88,401,697 warrants, each of
which was a warrant to purchase a share of the Firm’s common
stock at an exercise price of $42.42 per share and, on December
11, 2009, sold the warrants in a secondary public offering for $950
million. The warrants are exercisable, in whole or in part, at any
time and from time to time until October 28, 2018. The Firm did
not purchase any of the warrants sold by the U.S. Treasury.
Under the stock repurchase program authorized by the Firm’s Board of Directors, the Firm is authorized to repurchase up to $10.0
billion of the Firm’s common stock plus 88 million warrants sold by
the U.S. Treasury in 2009. During 2009, the Firm did not repur-
chase any shares of its common stock or warrants. In the second
quarter of 2010, the Firm resumed common stock repurchases, and
during the year repurchased an aggregate of 78 million shares for
$3.0 billion at an average price per share of $38.49. The Firm’s
share repurchase activities in 2010 were intended to offset share-
count increases resulting from employee stock-based incentive
awards and were consistent with the Firm’s goal of maintaining an
appropriate sharecount. The Firm did not repurchase any of the
warrants during 2010. As of December 31, 2010, $3.2 billion of
authorized repurchase capacity remained with respect to the com-
mon stock, and all of the authorized repurchase capacity remained
with respect to the warrants.
The Firm may, from time to time, enter into written trading plans
under Rule 10b5-1 of the Securities Exchange Act of 1934 to
facilitate the repurchase of common stock and warrants in accor-
dance with the repurchase program. A Rule 10b5-1 repurchase
plan allows the Firm to repurchase its equity during periods when it
would not otherwise be repurchasing common stock – for example
during internal trading “black-out periods.” All purchases under a
Rule 10b5-1 plan must be made according to a predefined plan
established when the Firm is not aware of material nonpublic
information.
As of December 31, 2010, approximately 564 million unissued
shares of common stock were reserved for issuance under various
employee incentive, compensation, option and stock purchase
plans, director compensation plans, and the warrants sold by the
U.S. Treasury as discussed above.
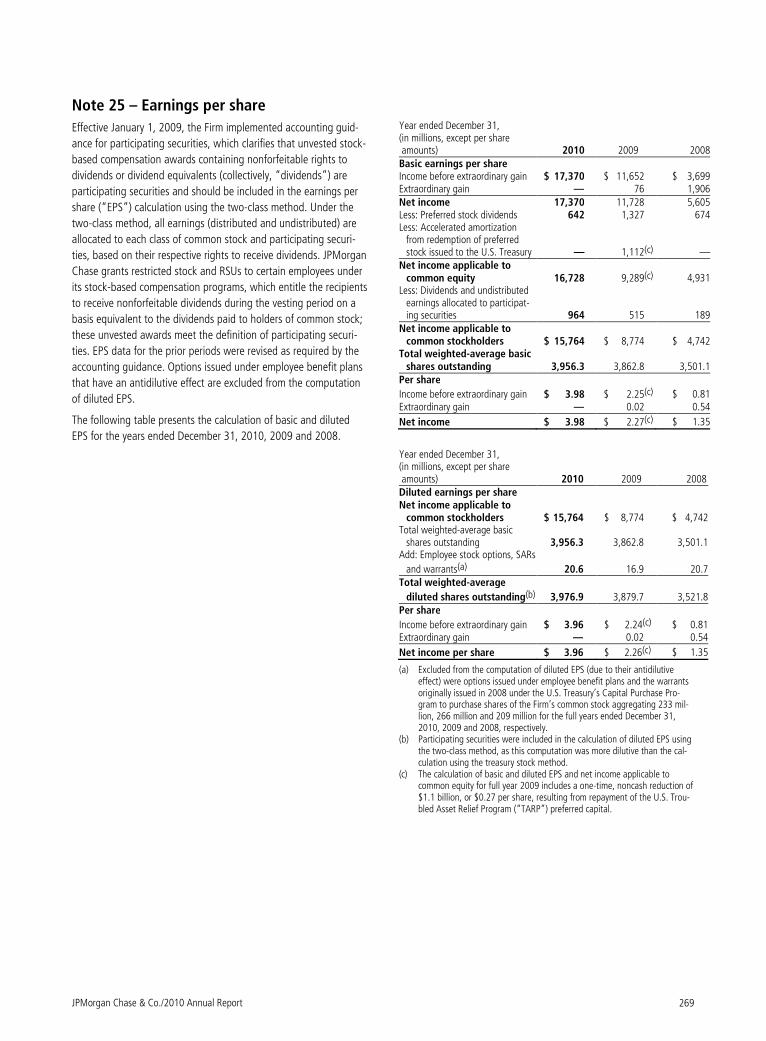
JPMorgan Chase & Co./2010 Annual Report 269
Note 25 – Earnings per share
Effective January 1, 2009, the Firm implemented accounting guid-
ance for participating securities, which clarifies that unvested stock-
based compensation awards containing nonforfeitable rights to
dividends or dividend equivalents (collectively, “dividends”) are
participating securities and should be included in the earnings per
share (“EPS”) calculation using the two-class method. Under the
two-class method, all earnings (distributed and undistributed) are
allocated to each class of common stock and participating securi-
ties, based on their respective rights to receive dividends. JPMorgan
Chase grants restricted stock and RSUs to certain employees under
its stock-based compensation programs, which entitle the recipients
to receive nonforfeitable dividends during the vesting period on a
basis equivalent to the dividends paid to holders of common stock;
these unvested awards meet the definition of participating securi-
ties. EPS data for the prior periods were revised as required by the
accounting guidance. Options issued under employee benefit plans
that have an antidilutive effect are excluded from the computation
of diluted EPS.
The following table presents the calculation of basic and diluted
EPS for the years ended December 31, 2010, 2009 and 2008.
Year ended December 31, (in millions, except per share amounts) 2010 2009 2008Basic earnings per share Income before extraordinary gain $ 17,370 $ 11,652 $ 3,699Extraordinary gain — 76 1,906Net income 17,370 11,728 5,605Less: Preferred stock dividends 642 1,327 674Less: Accelerated amortization
from redemption of preferred stock issued to the U.S. Treasury — 1,112(c) —
Net income applicable to common equity 16,728 9,289(c) 4,931
Less: Dividends and undistributed earnings allocated to participat-ing securities 964 515 189
Net income applicable to common stockholders $ 15,764 $ 8,774 $ 4,742
Total weighted-average basic shares outstanding 3,956.3 3,862.8 3,501.1
Per share
Income before extraordinary gain $ 3.98 $ 2.25(c) $ 0.81Extraordinary gain — 0.02 0.54
Net income $ 3.98 $ 2.27(c) $ 1.35
Year ended December 31, (in millions, except per share amounts) 2010
2009 2008
Diluted earnings per share Net income applicable to
common stockholders $ 15,764 $ 8,774 $ 4,742 Total weighted-average basic
shares outstanding 3,956.3 3,862.8 3,501.1 Add: Employee stock options, SARs
and warrants(a) 20.6 16.9 20.7 Total weighted-average
diluted shares outstanding(b) 3,976.9 3,879.7 3,521.8 Per share
Income before extraordinary gain $ 3.96 $ 2.24(c) $ 0.81 Extraordinary gain — 0.02 0.54
Net income per share $ 3.96 $ 2.26(c) $ 1.35
(a) Excluded from the computation of diluted EPS (due to their antidilutive effect) were options issued under employee benefit plans and the warrants originally issued in 2008 under the U.S. Treasury’s Capital Purchase Pro-gram to purchase shares of the Firm’s common stock aggregating 233 mil-lion, 266 million and 209 million for the full years ended December 31, 2010, 2009 and 2008, respectively.
(b) Participating securities were included in the calculation of diluted EPS using the two-class method, as this computation was more dilutive than the cal-culation using the treasury stock method.
(c) The calculation of basic and diluted EPS and net income applicable to common equity for full year 2009 includes a one-time, noncash reduction of $1.1 billion, or $0.27 per share, resulting from repayment of the U.S. Trou-bled Asset Relief Program (“TARP”) preferred capital.
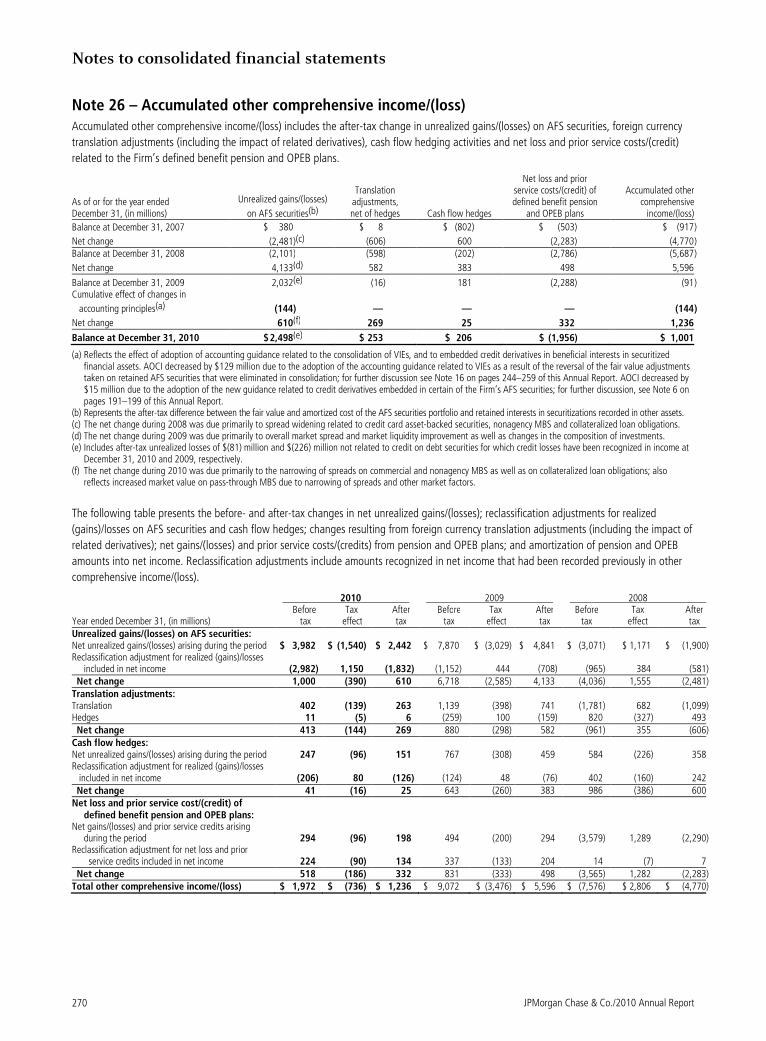
Notes to consolidated financial statements
JPMorgan Chase & Co./2010 Annual Report 270
Note 26 – Accumulated other comprehensive income/(loss) Accumulated other comprehensive income/(loss) includes the after-tax change in unrealized gains/(losses) on AFS securities, foreign currency
translation adjustments (including the impact of related derivatives), cash flow hedging activities and net loss and prior service costs/(credit)
related to the Firm’s defined benefit pension and OPEB plans.
As of or for the year ended December 31, (in millions)
Unrealized gains/(losses)
on AFS securities(b)
Translation adjustments, net of hedges Cash flow hedges
Net loss and prior service costs/(credit) of defined benefit pension
and OPEB plans
Accumulated other comprehensive
income/(loss)
Balance at December 31, 2007 $ 380 $ 8 $ (802) $ (503) $ (917 )
Net change (2,481)(c) (606) 600 (2,283) (4,770 ) Balance at December 31, 2008 (2,101) (598) (202) (2,786) (5,687 )
Net change 4,133(d) 582 383 498 5,596
Balance at December 31, 2009 2,032(e) (16) 181 (2,288) (91 ) Cumulative effect of changes in
accounting principles(a) (144) — — — (144 )
Net change 610(f) 269 25 332 1,236
Balance at December 31, 2010 $ 2,498(e) $ 253 $ 206 $ (1,956) $ 1,001
(a) Reflects the effect of adoption of accounting guidance related to the consolidation of VIEs, and to embedded credit derivatives in beneficial interests in securitized financial assets. AOCI decreased by $129 million due to the adoption of the accounting guidance related to VIEs as a result of the reversal of the fair value adjustments taken on retained AFS securities that were eliminated in consolidation; for further discussion see Note 16 on pages 244–259 of this Annual Report. AOCI decreased by $15 million due to the adoption of the new guidance related to credit derivatives embedded in certain of the Firm’s AFS securities; for further discussion, see Note 6 on pages 191–199 of this Annual Report.
(b) Represents the after-tax difference between the fair value and amortized cost of the AFS securities portfolio and retained interests in securitizations recorded in other assets. (c) The net change during 2008 was due primarily to spread widening related to credit card asset-backed securities, nonagency MBS and collateralized loan obligations. (d) The net change during 2009 was due primarily to overall market spread and market liquidity improvement as well as changes in the composition of investments. (e) Includes after-tax unrealized losses of $(81) million and $(226) million not related to credit on debt securities for which credit losses have been recognized in income at
December 31, 2010 and 2009, respectively. (f) The net change during 2010 was due primarily to the narrowing of spreads on commercial and nonagency MBS as well as on collateralized loan obligations; also
reflects increased market value on pass-through MBS due to narrowing of spreads and other market factors.
The following table presents the before- and after-tax changes in net unrealized gains/(losses); reclassification adjustments for realized
(gains)/losses on AFS securities and cash flow hedges; changes resulting from foreign currency translation adjustments (including the impact of
related derivatives); net gains/(losses) and prior service costs/(credits) from pension and OPEB plans; and amortization of pension and OPEB
amounts into net income. Reclassification adjustments include amounts recognized in net income that had been recorded previously in other
comprehensive income/(loss).
2010 2009 2008 Before Tax After Before Tax After Before Tax After Year ended December 31, (in millions) tax effect tax tax effect tax tax effect tax Unrealized gains/(losses) on AFS securities: Net unrealized gains/(losses) arising during the period $ 3,982 $ (1,540) $ 2,442 $ 7,870 $ (3,029) $ 4,841 $ (3,071) $ 1,171 $ (1,900) Reclassification adjustment for realized (gains)/losses
included in net income (2,982) 1,150 (1,832) (1,152) 444 (708) (965) 384 (581) Net change 1,000 (390) 610 6,718 (2,585) 4,133 (4,036) 1,555 (2,481) Translation adjustments: Translation 402 (139) 263 1,139 (398) 741 (1,781) 682 (1,099) Hedges 11 (5) 6 (259) 100 (159) 820 (327) 493 Net change 413 (144) 269 880 (298) 582 (961) 355 (606) Cash flow hedges: Net unrealized gains/(losses) arising during the period 247 (96) 151 767 (308) 459 584 (226) 358 Reclassification adjustment for realized (gains)/losses included in net income (206) 80 (126) (124) 48 (76) 402 (160) 242 Net change 41 (16) 25 643 (260) 383 986 (386) 600 Net loss and prior service cost/(credit) of
defined benefit pension and OPEB plans: Net gains/(losses) and prior service credits arising
during the period 294 (96) 198 494 (200) 294 (3,579) 1,289 (2,290) Reclassification adjustment for net loss and prior
service credits included in net income 224 (90) 134 337 (133) 204 14 (7) 7 Net change 518 (186) 332 831 (333) 498 (3,565) 1,282 (2,283) Total other comprehensive income/(loss) $ 1,972 $ (736) $ 1,236 $ 9,072 $ (3,476) $ 5,596 $ (7,576) $ 2,806 $ (4,770)
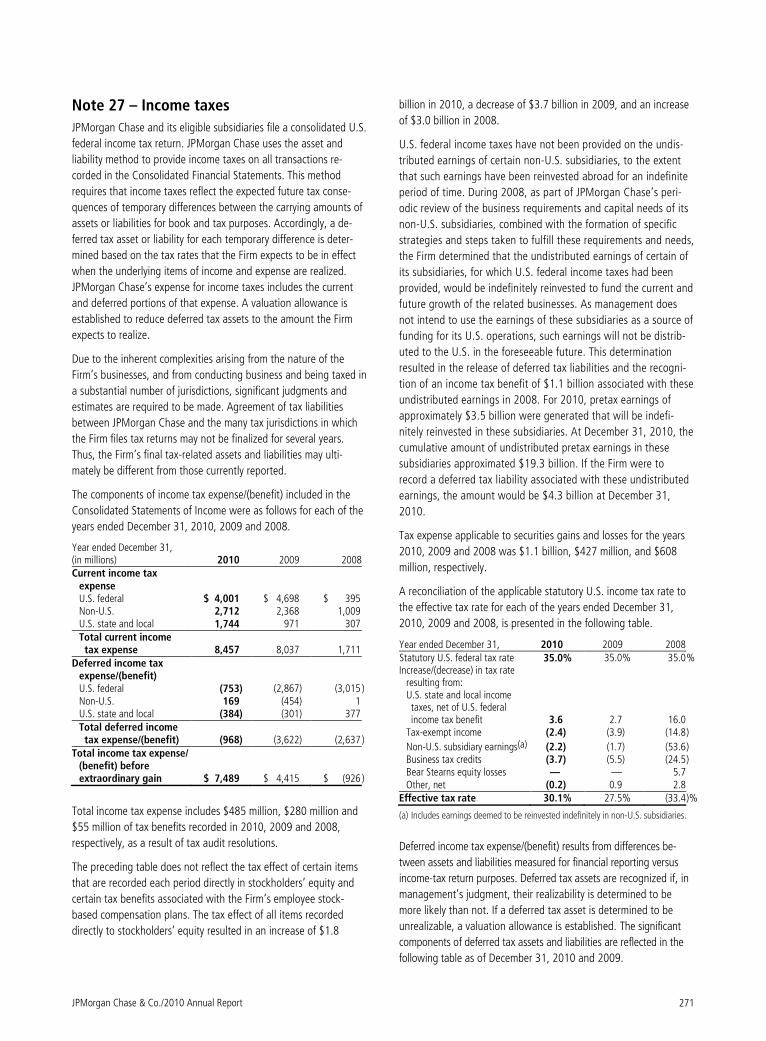
JPMorgan Chase & Co./2010 Annual Report 271
Note 27 – Income taxes
JPMorgan Chase and its eligible subsidiaries file a consolidated U.S.
federal income tax return. JPMorgan Chase uses the asset and
liability method to provide income taxes on all transactions re-
corded in the Consolidated Financial Statements. This method
requires that income taxes reflect the expected future tax conse-
quences of temporary differences between the carrying amounts of
assets or liabilities for book and tax purposes. Accordingly, a de-
ferred tax asset or liability for each temporary difference is deter-
mined based on the tax rates that the Firm expects to be in effect
when the underlying items of income and expense are realized.
JPMorgan Chase’s expense for income taxes includes the current
and deferred portions of that expense. A valuation allowance is
established to reduce deferred tax assets to the amount the Firm
expects to realize.
Due to the inherent complexities arising from the nature of the
Firm’s businesses, and from conducting business and being taxed in
a substantial number of jurisdictions, significant judgments and
estimates are required to be made. Agreement of tax liabilities
between JPMorgan Chase and the many tax jurisdictions in which
the Firm files tax returns may not be finalized for several years.
Thus, the Firm’s final tax-related assets and liabilities may ulti-
mately be different from those currently reported.
The components of income tax expense/(benefit) included in the
Consolidated Statements of Income were as follows for each of the
years ended December 31, 2010, 2009 and 2008.
Year ended December 31, (in millions) 2010 2009 2008Current income tax
expense U.S. federal $ 4,001 $ 4,698 $ 395 Non-U.S. 2,712 2,368 1,009 U.S. state and local 1,744 971 307 Total current income tax expense 8,457 8,037 1,711
Deferred income tax expense/(benefit) U.S. federal (753) (2,867) (3,015 ) Non-U.S. 169 (454) 1 U.S. state and local (384) (301) 377 Total deferred income tax expense/(benefit) (968) (3,622) (2,637 )
Total income tax expense/ (benefit) before extraordinary gain $ 7,489 $ 4,415 $ (926 )
Total income tax expense includes $485 million, $280 million and
$55 million of tax benefits recorded in 2010, 2009 and 2008,
respectively, as a result of tax audit resolutions.
The preceding table does not reflect the tax effect of certain items
that are recorded each period directly in stockholders’ equity and
certain tax benefits associated with the Firm’s employee stock-
based compensation plans. The tax effect of all items recorded
directly to stockholders’ equity resulted in an increase of $1.8
billion in 2010, a decrease of $3.7 billion in 2009, and an increase
of $3.0 billion in 2008.
U.S. federal income taxes have not been provided on the undis-
tributed earnings of certain non-U.S. subsidiaries, to the extent
that such earnings have been reinvested abroad for an indefinite
period of time. During 2008, as part of JPMorgan Chase’s peri-
odic review of the business requirements and capital needs of its
non-U.S. subsidiaries, combined with the formation of specific
strategies and steps taken to fulfill these requirements and needs,
the Firm determined that the undistributed earnings of certain of
its subsidiaries, for which U.S. federal income taxes had been
provided, would be indefinitely reinvested to fund the current and
future growth of the related businesses. As management does
not intend to use the earnings of these subsidiaries as a source of
funding for its U.S. operations, such earnings will not be distrib-
uted to the U.S. in the foreseeable future. This determination
resulted in the release of deferred tax liabilities and the recogni-
tion of an income tax benefit of $1.1 billion associated with these
undistributed earnings in 2008. For 2010, pretax earnings of
approximately $3.5 billion were generated that will be indefi-
nitely reinvested in these subsidiaries. At December 31, 2010, the
cumulative amount of undistributed pretax earnings in these
subsidiaries approximated $19.3 billion. If the Firm were to
record a deferred tax liability associated with these undistributed
earnings, the amount would be $4.3 billion at December 31,
2010.
Tax expense applicable to securities gains and losses for the years
2010, 2009 and 2008 was $1.1 billion, $427 million, and $608
million, respectively.
A reconciliation of the applicable statutory U.S. income tax rate to
the effective tax rate for each of the years ended December 31,
2010, 2009 and 2008, is presented in the following table.
Year ended December 31, 2010 2009 2008
Statutory U.S. federal tax rate 35.0% 35.0% 35.0 % Increase/(decrease) in tax rate
resulting from: U.S. state and local income taxes, net of U.S. federal income tax benefit 3.6 2.7 16.0
Tax-exempt income (2.4) (3.9) (14.8 )
Non-U.S. subsidiary earnings(a) (2.2) (1.7) (53.6 ) Business tax credits (3.7) (5.5) (24.5 ) Bear Stearns equity losses — — 5.7 Other, net (0.2) 0.9 2.8
Effective tax rate 30.1% 27.5% (33.4 )%
(a) Includes earnings deemed to be reinvested indefinitely in non-U.S. subsidiaries.
Deferred income tax expense/(benefit) results from differences be-
tween assets and liabilities measured for financial reporting versus
income-tax return purposes. Deferred tax assets are recognized if, in
management’s judgment, their realizability is determined to be
more likely than not. If a deferred tax asset is determined to be
unrealizable, a valuation allowance is established. The significant
components of deferred tax assets and liabilities are reflected in the
following table as of December 31, 2010 and 2009.
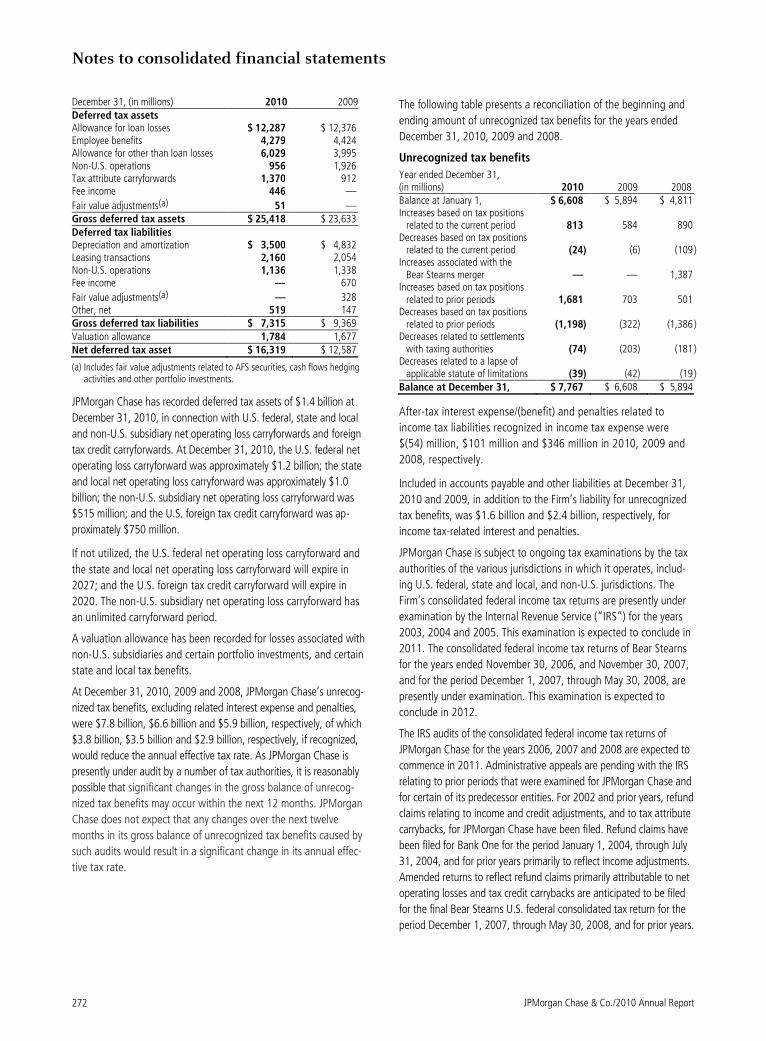
Notes to consolidated financial statements
JPMorgan Chase & Co./2010 Annual Report 272
December 31, (in millions) 2010 2009 Deferred tax assets Allowance for loan losses $ 12,287 $ 12,376 Employee benefits 4,279 4,424 Allowance for other than loan losses 6,029 3,995 Non-U.S. operations 956 1,926 Tax attribute carryforwards 1,370 912 Fee income 446 —
Fair value adjustments(a) 51 — Gross deferred tax assets $ 25,418 $ 23,633 Deferred tax liabilities Depreciation and amortization $ 3,500 $ 4,832 Leasing transactions 2,160 2,054 Non-U.S. operations 1,136 1,338 Fee income — 670
Fair value adjustments(a) — 328 Other, net 519 147 Gross deferred tax liabilities $ 7,315 $ 9,369 Valuation allowance 1,784 1,677 Net deferred tax asset $ 16,319 $ 12,587
(a) Includes fair value adjustments related to AFS securities, cash flows hedging activities and other portfolio investments.
JPMorgan Chase has recorded deferred tax assets of $1.4 billion at
December 31, 2010, in connection with U.S. federal, state and local
and non-U.S. subsidiary net operating loss carryforwards and foreign
tax credit carryforwards. At December 31, 2010, the U.S. federal net
operating loss carryforward was approximately $1.2 billion; the state
and local net operating loss carryforward was approximately $1.0
billion; the non-U.S. subsidiary net operating loss carryforward was
$515 million; and the U.S. foreign tax credit carryforward was ap-
proximately $750 million.
If not utilized, the U.S. federal net operating loss carryforward and
the state and local net operating loss carryforward will expire in
2027; and the U.S. foreign tax credit carryforward will expire in
2020. The non-U.S. subsidiary net operating loss carryforward has
an unlimited carryforward period.
A valuation allowance has been recorded for losses associated with
non-U.S. subsidiaries and certain portfolio investments, and certain
state and local tax benefits.
At December 31, 2010, 2009 and 2008, JPMorgan Chase’s unrecog-
nized tax benefits, excluding related interest expense and penalties,
were $7.8 billion, $6.6 billion and $5.9 billion, respectively, of which
$3.8 billion, $3.5 billion and $2.9 billion, respectively, if recognized,
would reduce the annual effective tax rate. As JPMorgan Chase is
presently under audit by a number of tax authorities, it is reasonably
possible that significant changes in the gross balance of unrecog-
nized tax benefits may occur within the next 12 months. JPMorgan
Chase does not expect that any changes over the next twelve
months in its gross balance of unrecognized tax benefits caused by
such audits would result in a significant change in its annual effec-
tive tax rate.
The following table presents a reconciliation of the beginning and
ending amount of unrecognized tax benefits for the years ended
December 31, 2010, 2009 and 2008.
Unrecognized tax benefits
Year ended December 31, (in millions) 2010 2009 2008 Balance at January 1, $ 6,608 $ 5,894 $ 4,811 Increases based on tax positions
related to the current period 813 584 890 Decreases based on tax positions
related to the current period (24) (6) (109
) Increases associated with the
Bear Stearns merger — — 1,387 Increases based on tax positions
related to prior periods 1,681 703 501 Decreases based on tax positions
related to prior periods (1,198) (322) (1,386
) Decreases related to settlements
with taxing authorities (74) (203) (181
) Decreases related to a lapse of
applicable statute of limitations (39) (42) (19
) Balance at December 31, $ 7,767 $ 6,608 $ 5,894
After-tax interest expense/(benefit) and penalties related to
income tax liabilities recognized in income tax expense were
$(54) million, $101 million and $346 million in 2010, 2009 and
2008, respectively.
Included in accounts payable and other liabilities at December 31,
2010 and 2009, in addition to the Firm’s liability for unrecognized
tax benefits, was $1.6 billion and $2.4 billion, respectively, for
income tax-related interest and penalties.
JPMorgan Chase is subject to ongoing tax examinations by the tax
authorities of the various jurisdictions in which it operates, includ-
ing U.S. federal, state and local, and non-U.S. jurisdictions. The
Firm’s consolidated federal income tax returns are presently under
examination by the Internal Revenue Service (“IRS”) for the years
2003, 2004 and 2005. This examination is expected to conclude in
2011. The consolidated federal income tax returns of Bear Stearns
for the years ended November 30, 2006, and November 30, 2007,
and for the period December 1, 2007, through May 30, 2008, are
presently under examination. This examination is expected to
conclude in 2012.
The IRS audits of the consolidated federal income tax returns of
JPMorgan Chase for the years 2006, 2007 and 2008 are expected to
commence in 2011. Administrative appeals are pending with the IRS
relating to prior periods that were examined for JPMorgan Chase and
for certain of its predecessor entities. For 2002 and prior years, refund
claims relating to income and credit adjustments, and to tax attribute
carrybacks, for JPMorgan Chase have been filed. Refund claims have
been filed for Bank One for the period January 1, 2004, through July
31, 2004, and for prior years primarily to reflect income adjustments.
Amended returns to reflect refund claims primarily attributable to net
operating losses and tax credit carrybacks are anticipated to be filed
for the final Bear Stearns U.S. federal consolidated tax return for the
period December 1, 2007, through May 30, 2008, and for prior years.
JPMorgan Chase & Co./2010 Annual Report 273
The following table presents the U.S. and non-U.S. components of
income before income tax expense/(benefit) and extraordinary gain
for the years ended December 31, 2010, 2009 and 2008.
Year ended December 31, (in millions) 2010 2009 2008 U.S. $ 16,568 $ 6,263 $ (2,094) Non-U.S.(a) 8,291 9,804 4,867 Income before income tax
expense/(benefit) and extraordinary gain $ 24,859 $ 16,067 $ 2,773
(a) For purposes of this table, non-U.S. income is defined as income generated from operations located outside the U.S.
Note 28 – Restrictions on cash and intercompany funds transfers
The business of JPMorgan Chase Bank, National Association
(“JPMorgan Chase Bank, N.A.”) is subject to examination and
regulation by the Office of the Comptroller of the Currency
(“OCC”). The Bank is a member of the U.S. Federal Reserve Sys-
tem, and its deposits in the U.S. are insured by the FDIC.
The Board of Governors of the Federal Reserve System (the “Fed-
eral Reserve”) requires depository institutions to maintain cash
reserves with a Federal Reserve Bank. The average amount of
reserve balances deposited by the Firm’s bank subsidiaries with
various Federal Reserve Banks was approximately $803 million and
$821 million in 2010 and 2009, respectively.
Restrictions imposed by U.S. federal law prohibit JPMorgan Chase
and certain of its affiliates from borrowing from banking subsidiar-
ies unless the loans are secured in specified amounts. Such secured
loans to the Firm or to other affiliates are generally limited to 10%
of the banking subsidiary’s total capital, as determined by the risk-
based capital guidelines; the aggregate amount of all such loans is
limited to 20% of the banking subsidiary’s total capital.
The principal sources of JPMorgan Chase’s income (on a parent
company–only basis) are dividends and interest from JPMorgan
Chase Bank, N.A., and the other banking and nonbanking subsidi-
aries of JPMorgan Chase. In addition to dividend restrictions set
forth in statutes and regulations, the Federal Reserve, the OCC and
the FDIC have authority under the Financial Institutions Supervisory
Act to prohibit or to limit the payment of dividends by the banking
organizations they supervise, including JPMorgan Chase and its
subsidiaries that are banks or bank holding companies, if, in the
banking regulator’s opinion, payment of a dividend would consti-
tute an unsafe or unsound practice in light of the financial condi-
tion of the banking organization.
At January 1, 2011, JPMorgan Chase’s banking subsidiaries could
pay, in the aggregate, $2.0 billion in dividends to their respective
bank holding companies without the prior approval of their relevant
banking regulators. The capacity to pay dividends in 2011 will be
supplemented by the banking subsidiaries’ earnings during the
year.
In compliance with rules and regulations established by U.S. and
non-U.S. regulators, as of December 31, 2010 and 2009, cash in
the amount of $25.0 billion and $24.0 billion, respectively, and
securities with a fair value of $9.7 billion and $10.2 billion, respec-
tively, were segregated in special bank accounts for the benefit of
securities and futures brokerage customers.
Note 29 – Capital
The Federal Reserve establishes capital requirements, including
well-capitalized standards for the consolidated financial holding
company. The OCC establishes similar capital requirements and
standards for the Firm’s national banks, including JPMorgan Chase
Bank, N.A., and Chase Bank USA, N.A.
There are two categories of risk-based capital: Tier 1 capital and
Tier 2 capital. Tier 1 capital consists of common stockholders’
equity, perpetual preferred stock, noncontrolling interests in sub-
sidiaries and trust preferred capital debt securities, less goodwill
and certain other adjustments. Tier 2 capital consists of preferred
stock not qualifying as Tier 1, subordinated long-term debt and
other instruments qualifying as Tier 2, and the aggregate allowance
for credit losses up to a certain percentage of risk-weighted assets.
Total capital is Tier 1 capital plus Tier 2 capital. Under the risk-
based capital guidelines of the Federal Reserve, JPMorgan Chase is
required to maintain minimum ratios of Tier 1 and Total capital to
risk-weighted assets, as well as minimum leverage ratios (which are
defined as Tier 1 capital divided by adjusted quarterly average
assets). Failure to meet these minimum requirements could cause
the Federal Reserve to take action. Banking subsidiaries also are
subject to these capital requirements by their respective primary
regulators. As of December 31, 2010 and 2009, JPMorgan Chase
and all of its banking subsidiaries were well-capitalized and met all
capital requirements to which each was subject.
Notes to consolidated financial statements
JPMorgan Chase & Co./2010 Annual Report 274
The following table presents the regulatory capital, assets and risk-based capital ratios for JPMorgan Chase and its significant banking subsidiaries at
December 31, 2010 and 2009. These amounts are determined in accordance with regulations issued by the Federal Reserve and/or OCC.
Well- capitalized
ratios(g)
Minimum capital
ratios(g) December 31, JPMorgan Chase & Co.(e) JPMorgan Chase Bank, N.A.(e) Chase Bank USA, N.A.(e) (in millions, except ratios) 2010 2009 2010 2009 2010 2009 Regulatory capital
Tier 1(a) $ 142,450 $ 132,971 $ 91,764 $ 96,372 $ 12,966 $ 15,534 Total 182,216 177,073 130,444 136,646 16,659 19,198
Assets
Risk-weighted(b)(c) 1,174,978(f) 1,198,006 965,897 1,011,995 116,992 114,693
Adjusted average(d) 2,024,515(f) 1,933,767 1,611,486 1,609,081 117,368 74,087
Capital ratios
Tier 1(a) 12.1%(f) 11.1% 9.5% 9.5% 11.1% 13.5% 6.0% 4.0 % Total 15.5 14.8 13.5 13.5 14.2 16.7 10.0 8.0
Tier 1 leverage 7.0 6.9 5.7 6.0 11.0 21.0 5.0(h) 3.0 (i)
(a) At December 31, 2010, for JPMorgan Chase and JPMorgan Chase Bank, N.A., trust preferred capital debt securities were $19.8 billion and $600 million, respec-tively. If these securities were excluded from the calculation at December 31, 2010, Tier 1 capital would be $122.7 billion and $91.2 billion, respectively, and the Tier 1 capital ratio would be 10.4% and 9.4%, respectively. At December 31, 2010, Chase Bank USA, N.A. had no trust preferred capital debt securities.
(b) Risk-weighted assets consist of on– and off–balance sheet assets that are assigned to one of several broad risk categories and weighted by factors representing their risk and potential for default. On–balance sheet assets are risk-weighted based on the perceived credit risk associated with the obligor or counterparty, the nature of any collateral, and the guarantor, if any. Off–balance sheet assets such as lending-related commitments, guarantees, derivatives and other applicable off–balance sheet positions are risk-weighted by multiplying the contractual amount by the appropriate credit conversion factor to determine the on–balance sheet credit-equivalent amount, which is then risk-weighted based on the same factors used for on–balance sheet assets. Risk-weighted assets also incorporate a measure for the market risk related to applicable trading assets—debt and equity instruments, and foreign exchange and commodity derivatives. The resulting risk-weighted val-ues for each of the risk categories are then aggregated to determine total risk-weighted assets.
(c) Includes off–balance sheet risk-weighted assets at December 31, 2010, of $282.9 billion, $274.2 billion and $31 million, and at December 31, 2009, of $367.4 billion, $312.3 billion and $49.9 billion, for JPMorgan Chase, JPMorgan Chase Bank, N.A. and Chase Bank USA, N.A., respectively.
(d) Adjusted average assets, for purposes of calculating the leverage ratio, include total quarterly average assets adjusted for unrealized gains/(losses) on securities, less deductions for disallowed goodwill and other intangible assets, investments in certain subsidiaries, and the total adjusted carrying value of nonfinancial equity in-vestments that are subject to deductions from Tier 1 capital.
(e) Asset and capital amounts for JPMorgan Chase’s banking subsidiaries reflect intercompany transactions; whereas the respective amounts for JPMorgan Chase reflect the elimination of intercompany transactions.
(f) Effective January 1, 2010, the Firm adopted new guidance that amended the accounting for the consolidation of VIEs, which resulted in a decrease in the Tier 1 capital ratio of 34 basis points. See Note 16 on pages 244–259 of this Annual Report for further information.
(g) As defined by the regulations issued by the Federal Reserve, OCC and FDIC. (h) Represents requirements for banking subsidiaries pursuant to regulations issued under the FDIC Improvement Act. There is no Tier 1 leverage component in the
definition of a well-capitalized bank holding company. (i) The minimum Tier 1 leverage ratio for bank holding companies and banks is 3% or 4%, depending on factors specified in regulations issued by the Federal Reserve
and OCC. Note: Rating agencies allow measures of capital to be adjusted upward for deferred tax liabilities, which have resulted from both nontaxable business combinations and
from tax-deductible goodwill. The Firm had deferred tax liabilities resulting from nontaxable business combinations totaling $647 million and $812 million at December 31, 2010 and 2009, respectively; and deferred tax liabilities resulting from tax-deductible goodwill of $1.9 billion and $1.7 billion at December 31, 2010 and 2009, respectively.
A reconciliation of the Firm’s Total stockholders’ equity to Tier 1 capital and Total qualifying capital is presented in the table below.
December 31, (in millions) 2010 2009
Tier 1 capital Total stockholders’ equity $ 176,106 $ 165,365Effect of certain items in accumulated other comprehensive income/(loss) excluded from Tier 1 capital (748) 75
Qualifying hybrid securities and noncontrolling interests(a) 19,887 19,535
Less: Goodwill(b) 46,915 46,630Fair value DVA on derivative and structured note liabilities related to the Firm’s credit quality 1,261 912Investments in certain subsidiaries and other 1,032 802
Other intangible assets(b) 3,587 3,660Total Tier 1 capital 142,450 132,971Tier 2 capital Long-term debt and other instruments qualifying as Tier 2 25,018 28,977Qualifying allowance for credit losses 14,959 15,296Adjustment for investments in certain subsidiaries and other (211) (171) Total Tier 2 capital 39,766 44,102Total qualifying capital $ 182,216 $ 177,073
(a) Primarily includes trust preferred capital debt securities of certain business trusts. (b) Goodwill and other intangible assets are net of any associated deferred tax liabilities.
JPMorgan Chase & Co./2010 Annual Report 275
Note 30 – Off–balance sheet lending-related financial instruments, guarantees and other commitments
JPMorgan Chase utilizes lending-related financial instruments (e.g.,
commitments and guarantees) to meet the financing needs of its
customers. The contractual amount of these financial instruments
represents the Firm’s maximum possible credit risk should the
counterparty draw upon the commitment or the Firm be required to
fulfill its obligation under the guarantee, and should the counter-
party subsequently fail to perform according to the terms of the
contract. Most of these commitments and guarantees expire with-
out being drawn or a default occurring. As a result, the total con-
tractual amount of these instruments is not, in the Firm’s view,
representative of its actual future credit exposure or funding re-
quirements.
To provide for the risk of loss inherent in wholesale and consumer
(excluding credit card) related contracts, an allowance for credit
losses on lending-related commitments is maintained. See Note 15
on pages 239–243 of this Annual Report for further discussion
regarding the allowance for credit losses on lending-related com-
mitments.
The following table summarizes the contractual amounts and
carrying values of off-balance sheet lending-related financial in-
struments, guarantees and other commitments at December 31,
2010 and 2009. The amounts in the table below for credit card and
home equity lending-related commitments represent the total
available credit for these products. The Firm has not experienced,
and does not anticipate, that all available lines of credit for these
products will be utilized at the same time. The Firm can reduce or
cancel credit card lines of credit by providing the borrower prior
notice or, in some cases, without notice as permitted by law. The
Firm may reduce or close home equity lines of credit when there are
significant decreases in the value of the underlying property or
when there has been a demonstrable decline in the creditworthi-
ness of the borrower.
Off–balance sheet lending-related financial instruments, guarantees and other commitments
Contractual amount Carrying value(l) December 31, (in millions) 2010 2009 2010 2009 Lending-related Consumer, excluding credit card:
Home equity — senior lien $ 16,060 $ 19,246 $ — $ — Home equity — junior lien 28,681 37,231 — — Prime mortgage 1,266 1,654 — — Subprime mortgage — — — — Auto 5,246 5,467 2 7 Business banking 9,702 9,040 4 5 Student and other 579 2,189 — —
Total consumer, excluding credit card 61,534 74,827 6 12 Credit card 547,227 569,113 — — Total consumer 608,761 643,940 6 12 Wholesale:
Other unfunded commitments to extend credit(a)(b)(c) 199,859 192,145 364 356
Asset purchase agreements(b) — 22,685 — 126
Standby letters of credit and other financial guarantees(a)(c)(d)(e) 94,837 91,485 705 919 Unused advised lines of credit 44,720 35,673 — —
Other letters of credit(a)(e) 6,663 5,167 2 1 Total wholesale 346,079 347,155 1,071 1,402 Total lending-related $ 954,840 $ 991,095 $ 1,077 $ 1,414 Other guarantees and commitments
Securities lending indemnifications(f) $ 181,717 $ 170,777 $ NA $ NA
Derivatives qualifying as guarantees(g) 87,768 98,052(k) 294 896(k)
Unsettled reverse repurchase and securities borrowing agreements 39,927 48,187 — —
Equity investment commitments(h) 2,468 2,374 — — Building purchase commitments 258 670 — —
Other guarantees and commitments(i) 3,766 3,671 6 6 Loan sale and securitization-related indemnifications:
Repurchase liability(j) NA NA 3,285 1,705 Loans sold with recourse 10,982 13,544 153 271
(a) At December 31, 2010 and 2009, represents the contractual amount net of risk participations totaling $542 million and $643 million, respectively, for other unfunded com-mitments to extend credit; $22.4 billion and $24.6 billion, respectively, for standby letters of credit and other financial guarantees; and $1.1 billion and $690 million, respec-tively, for other letters of credit. In regulatory filings with the Federal Reserve Board these commitments are shown gross of risk participations.
(b) Upon the adoption of the accounting guidance related to VIEs, $24.2 billion of lending-related commitments between the Firm and Firm-administered multi-seller conduits were eliminated upon consolidation. The decrease in lending-related commitments was partially offset by the addition of $6.5 billion of unfunded commit-ments directly between the multi-seller conduits and clients; these unfunded commitments of the consolidated conduits are now included as off–balance sheet lending-related commitments of the Firm. The carrying value of asset purchase agreements of $126 million at December 31, 2009 was comprised of $18 million for the allowance for lending-related commitments; and $108 million for the guarantee liability and corresponding asset.
Notes to consolidated financial statements
JPMorgan Chase & Co./2010 Annual Report 276
(c) Includes credit enhancements and bond and commercial paper liquidity commitments to U.S. states and municipalities, hospitals and other not-for-profit entities of $43.4 billion and $44.1 billion, at December 31, 2010 and 2009, respectively.
(d) At December 31, 2010 and 2009, includes unissued standby letters of credit commitments of $41.6 billion and $38.4 billion, respectively. (e) At December 31, 2010 and 2009, JPMorgan Chase held collateral relating to $37.8 billion and $31.5 billion, respectively, of standby letters of credit; and $2.1 billion and
$1.3 billion, respectively, of other letters of credit. (f) At December 31, 2010 and 2009, collateral held by the Firm in support of securities lending indemnification agreements was $185.0 billion and $173.2 billion, respectively.
Securities lending collateral comprises primarily cash, and securities issued by governments that are members of the Organisation for Economic Co-operation and Development (“OECD”) and U.S. government agencies.
(g) Represents notional amounts of derivatives qualifying as guarantees. The carrying value at December 31, 2010 and 2009, reflects derivative payables of $390 million and $974 million, respectively, less derivative receivables of $96 million and $78 million, respectively.
(h) At December 31, 2010 and 2009, includes unfunded commitments of $1.0 billion and $1.5 billion, respectively, to third-party private equity funds that are generally fair valued at net asset value as discussed in Note 3 on pages 170–187 of this Annual Report; and $1.4 billion and $897 million, respectively, to other equity investments.
(i) Amounts include letters of credit hedged by derivative transactions and managed on a market risk basis. (j) Represents estimated repurchase liability related to indemnifications for breaches of representations and warranties in loan sale and securitization agreements. For
additional information, see Loan sale and securitization-related indemnifications on pages 278–279 of this Note. (k) The prior period has been revised to conform to current presentation. (l) For lending-related products the carrying value represents the allowance for lending-related commitments and the fair value of the guarantee liability, for derivative-related
products the carrying value represents the fair value. For all other products the carrying value represents the valuation reserve.
Other unfunded commitments to extend credit
Other unfunded commitments to extend credit are generally com-
prised of commitments for working capital and general corporate
purposes as well as extensions of credit to support commercial
paper facilities and bond financings in the event that those obliga-
tions cannot be remarketed to new investors.
Also included in other unfunded commitments to extend credit are
commitments to noninvestment-grade counterparties in connection
with leveraged and acquisition finance activities which were $5.9
billion and $7.0 billion at December 31, 2010 and 2009, respec-
tively. For further information, see Note 3 and Note 4 on pages
170–187 and 187–189 respectively, of this Annual Report.
Guarantees
U.S. GAAP requires that a guarantor recognize, at the inception of
a guarantee, a liability in an amount equal to the fair value of the
obligation undertaken in issuing the guarantee. U.S. GAAP defines
a guarantee as a contract that contingently requires the guarantor
to pay a guaranteed party based upon: (a) changes in an underlying
asset, liability or equity security of the guaranteed party; or (b) a
third party’s failure to perform under a specified agreement. The
Firm considers the following off–balance sheet lending-related
arrangements to be guarantees under U.S. GAAP: certain asset
purchase agreements, standby letters of credit and financial guar-
antees, securities lending indemnifications, certain indemnification
agreements included within third-party contractual arrangements
and certain derivative contracts.
As required by U.S. GAAP, the Firm initially records guarantees at
the inception date fair value of the obligation assumed (e.g., the
amount of consideration received, the net present value of the
premium receivable). For certain types of guarantees, the Firm
records this fair value amount in other liabilities with an offsetting
entry recorded in cash (for premiums received), or other assets (for
premiums receivable). Any premium receivable recorded in other
assets is reduced as cash is received under the contract, and the fair
value of the liability recorded at inception is amortized into income
as lending- and deposit-related fees over the life of the guarantee
contract. For indemnifications provided in sales agreements, a
portion of the sale proceeds is allocated to the guarantee, which
adjusts the gain or loss that would otherwise result from the trans-
action. For these indemnifications, the initial liability is amortized to
income as the Firm’s risk is reduced (i.e., over time or when the
indemnification expires). Any contingent liability that exists as a
result of issuing the guarantee or indemnification is recognized
when it become probable and reasonably estimable. The contingent
portion of the liability is not recognized if the estimated amount is
less than the carrying amount of the liability recognized at inception
(adjusted for any amortization). The recorded amounts of the
liabilities related to guarantees and indemnifications at December
31, 2010 and 2009, excluding the allowance for credit losses on
lending-related commitments, are discussed in footnote (b) to the
table above and below in this Note on pages 276–280.
Standby letters of credit
Standby letters of credit (“SBLC”) and other financial guarantees
are conditional lending commitments issued by the Firm to guaran-
tee the performance of a customer to a third party under certain
arrangements, such as commercial paper facilities, bond financings,
acquisition financings, trade and similar transactions. The carrying
values of standby and other letters of credit were $707 million and
$920 million at December 31, 2010 and 2009, respectively, which
were classified in accounts payable and other liabilities on the
Consolidated Balance Sheets; these carrying values include $347
million and $553 million, respectively, for the allowance for lend-
ing-related commitments, and $360 million and $367 million,
respectively, for the guarantee liability and corresponding asset.
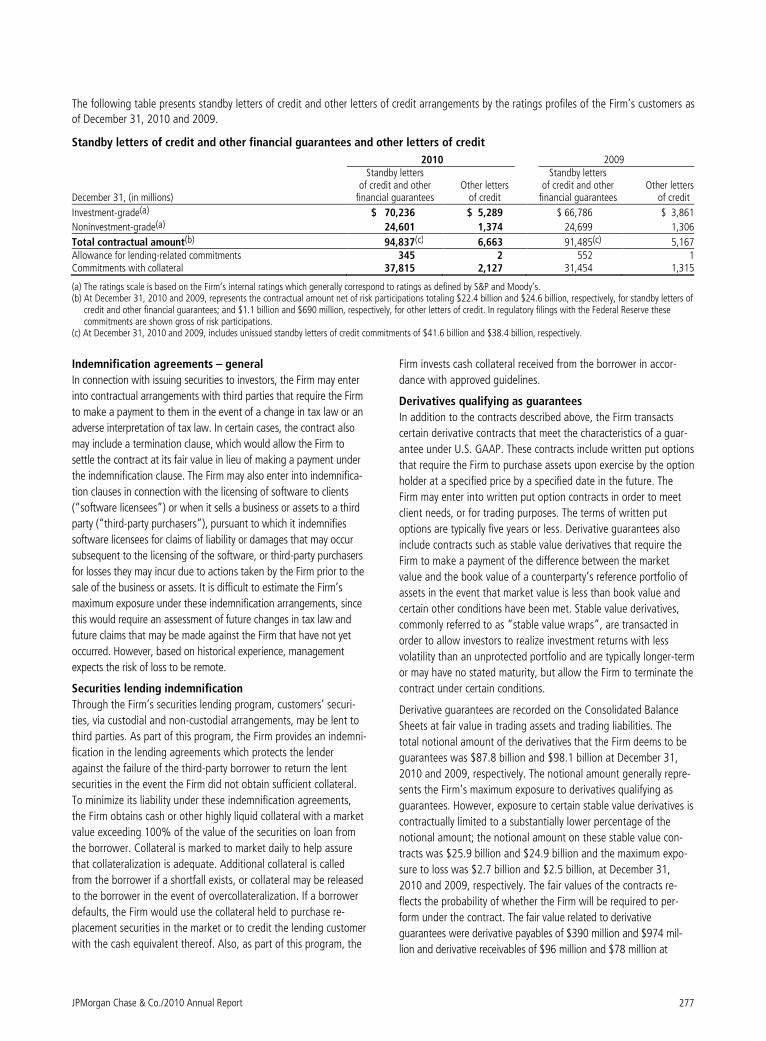
JPMorgan Chase & Co./2010 Annual Report 277
The following table presents standby letters of credit and other letters of credit arrangements by the ratings profiles of the Firm’s customers as
of December 31, 2010 and 2009.
Standby letters of credit and other financial guarantees and other letters of credit
2010 2009
December 31, (in millions)
Standby letters of credit and other
financial guarantees Other letters
of credit
Standby letters of credit and other financial guarantees
Other letters of credit
Investment-grade(a) $ 70,236 $ 5,289 $ 66,786 $ 3,861
Noninvestment-grade(a) 24,601 1,374 24,699 1,306
Total contractual amount(b) 94,837(c) 6,663 91,485(c) 5,167Allowance for lending-related commitments 345 2 552 1Commitments with collateral 37,815 2,127 31,454 1,315
(a) The ratings scale is based on the Firm’s internal ratings which generally correspond to ratings as defined by S&P and Moody’s. (b) At December 31, 2010 and 2009, represents the contractual amount net of risk participations totaling $22.4 billion and $24.6 billion, respectively, for standby letters of
credit and other financial guarantees; and $1.1 billion and $690 million, respectively, for other letters of credit. In regulatory filings with the Federal Reserve these commitments are shown gross of risk participations.
(c) At December 31, 2010 and 2009, includes unissued standby letters of credit commitments of $41.6 billion and $38.4 billion, respectively.
Indemnification agreements – general
In connection with issuing securities to investors, the Firm may enter
into contractual arrangements with third parties that require the Firm
to make a payment to them in the event of a change in tax law or an
adverse interpretation of tax law. In certain cases, the contract also
may include a termination clause, which would allow the Firm to
settle the contract at its fair value in lieu of making a payment under
the indemnification clause. The Firm may also enter into indemnifica-
tion clauses in connection with the licensing of software to clients
(“software licensees”) or when it sells a business or assets to a third
party (“third-party purchasers”), pursuant to which it indemnifies
software licensees for claims of liability or damages that may occur
subsequent to the licensing of the software, or third-party purchasers
for losses they may incur due to actions taken by the Firm prior to the
sale of the business or assets. It is difficult to estimate the Firm’s
maximum exposure under these indemnification arrangements, since
this would require an assessment of future changes in tax law and
future claims that may be made against the Firm that have not yet
occurred. However, based on historical experience, management
expects the risk of loss to be remote.
Securities lending indemnification
Through the Firm’s securities lending program, customers’ securi-
ties, via custodial and non-custodial arrangements, may be lent to
third parties. As part of this program, the Firm provides an indemni-
fication in the lending agreements which protects the lender
against the failure of the third-party borrower to return the lent
securities in the event the Firm did not obtain sufficient collateral.
To minimize its liability under these indemnification agreements,
the Firm obtains cash or other highly liquid collateral with a market
value exceeding 100% of the value of the securities on loan from
the borrower. Collateral is marked to market daily to help assure
that collateralization is adequate. Additional collateral is called
from the borrower if a shortfall exists, or collateral may be released
to the borrower in the event of overcollateralization. If a borrower
defaults, the Firm would use the collateral held to purchase re-
placement securities in the market or to credit the lending customer
with the cash equivalent thereof. Also, as part of this program, the
Firm invests cash collateral received from the borrower in accor-
dance with approved guidelines.
Derivatives qualifying as guarantees
In addition to the contracts described above, the Firm transacts
certain derivative contracts that meet the characteristics of a guar-
antee under U.S. GAAP. These contracts include written put options
that require the Firm to purchase assets upon exercise by the option
holder at a specified price by a specified date in the future. The
Firm may enter into written put option contracts in order to meet
client needs, or for trading purposes. The terms of written put
options are typically five years or less. Derivative guarantees also
include contracts such as stable value derivatives that require the
Firm to make a payment of the difference between the market
value and the book value of a counterparty’s reference portfolio of
assets in the event that market value is less than book value and
certain other conditions have been met. Stable value derivatives,
commonly referred to as “stable value wraps”, are transacted in
order to allow investors to realize investment returns with less
volatility than an unprotected portfolio and are typically longer-term
or may have no stated maturity, but allow the Firm to terminate the
contract under certain conditions.
Derivative guarantees are recorded on the Consolidated Balance
Sheets at fair value in trading assets and trading liabilities. The
total notional amount of the derivatives that the Firm deems to be
guarantees was $87.8 billion and $98.1 billion at December 31,
2010 and 2009, respectively. The notional amount generally repre-
sents the Firm’s maximum exposure to derivatives qualifying as
guarantees. However, exposure to certain stable value derivatives is
contractually limited to a substantially lower percentage of the
notional amount; the notional amount on these stable value con-
tracts was $25.9 billion and $24.9 billion and the maximum expo-
sure to loss was $2.7 billion and $2.5 billion, at December 31,
2010 and 2009, respectively. The fair values of the contracts re-
flects the probability of whether the Firm will be required to per-
form under the contract. The fair value related to derivative
guarantees were derivative payables of $390 million and $974 mil-
lion and derivative receivables of $96 million and $78 million at
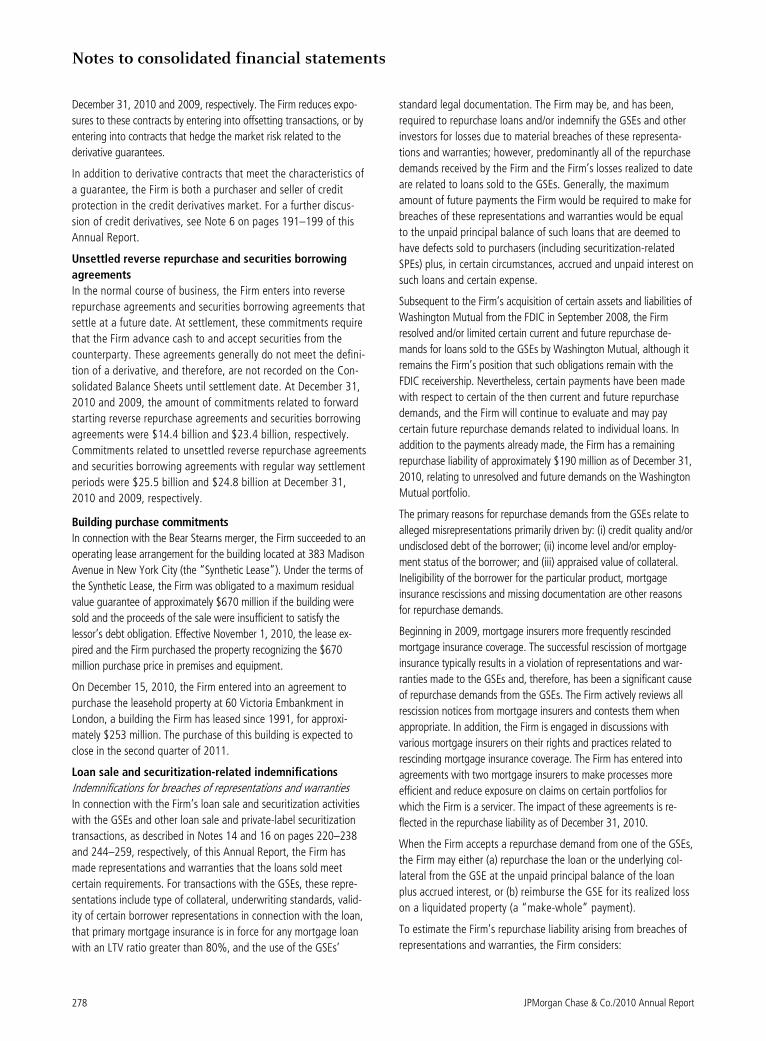
Notes to consolidated financial statements
JPMorgan Chase & Co./2010 Annual Report 278
December 31, 2010 and 2009, respectively. The Firm reduces expo-
sures to these contracts by entering into offsetting transactions, or by
entering into contracts that hedge the market risk related to the
derivative guarantees.
In addition to derivative contracts that meet the characteristics of
a guarantee, the Firm is both a purchaser and seller of credit
protection in the credit derivatives market. For a further discus-
sion of credit derivatives, see Note 6 on pages 191–199 of this
Annual Report.
Unsettled reverse repurchase and securities borrowing
agreements
In the normal course of business, the Firm enters into reverse
repurchase agreements and securities borrowing agreements that
settle at a future date. At settlement, these commitments require
that the Firm advance cash to and accept securities from the
counterparty. These agreements generally do not meet the defini-
tion of a derivative, and therefore, are not recorded on the Con-
solidated Balance Sheets until settlement date. At December 31,
2010 and 2009, the amount of commitments related to forward
starting reverse repurchase agreements and securities borrowing
agreements were $14.4 billion and $23.4 billion, respectively.
Commitments related to unsettled reverse repurchase agreements
and securities borrowing agreements with regular way settlement
periods were $25.5 billion and $24.8 billion at December 31,
2010 and 2009, respectively.
Building purchase commitments
In connection with the Bear Stearns merger, the Firm succeeded to an
operating lease arrangement for the building located at 383 Madison
Avenue in New York City (the “Synthetic Lease”). Under the terms of
the Synthetic Lease, the Firm was obligated to a maximum residual
value guarantee of approximately $670 million if the building were
sold and the proceeds of the sale were insufficient to satisfy the
lessor’s debt obligation. Effective November 1, 2010, the lease ex-
pired and the Firm purchased the property recognizing the $670
million purchase price in premises and equipment.
On December 15, 2010, the Firm entered into an agreement to
purchase the leasehold property at 60 Victoria Embankment in
London, a building the Firm has leased since 1991, for approxi-
mately $253 million. The purchase of this building is expected to
close in the second quarter of 2011.
Loan sale and securitization-related indemnifications
Indemnifications for breaches of representations and warranties
In connection with the Firm’s loan sale and securitization activities
with the GSEs and other loan sale and private-label securitization
transactions, as described in Notes 14 and 16 on pages 220–238
and 244–259, respectively, of this Annual Report, the Firm has
made representations and warranties that the loans sold meet
certain requirements. For transactions with the GSEs, these repre-
sentations include type of collateral, underwriting standards, valid-
ity of certain borrower representations in connection with the loan,
that primary mortgage insurance is in force for any mortgage loan
with an LTV ratio greater than 80%, and the use of the GSEs’
standard legal documentation. The Firm may be, and has been,
required to repurchase loans and/or indemnify the GSEs and other
investors for losses due to material breaches of these representa-
tions and warranties; however, predominantly all of the repurchase
demands received by the Firm and the Firm’s losses realized to date
are related to loans sold to the GSEs. Generally, the maximum
amount of future payments the Firm would be required to make for
breaches of these representations and warranties would be equal
to the unpaid principal balance of such loans that are deemed to
have defects sold to purchasers (including securitization-related
SPEs) plus, in certain circumstances, accrued and unpaid interest on
such loans and certain expense.
Subsequent to the Firm’s acquisition of certain assets and liabilities of
Washington Mutual from the FDIC in September 2008, the Firm
resolved and/or limited certain current and future repurchase de-
mands for loans sold to the GSEs by Washington Mutual, although it
remains the Firm’s position that such obligations remain with the
FDIC receivership. Nevertheless, certain payments have been made
with respect to certain of the then current and future repurchase
demands, and the Firm will continue to evaluate and may pay
certain future repurchase demands related to individual loans. In
addition to the payments already made, the Firm has a remaining
repurchase liability of approximately $190 million as of December 31,
2010, relating to unresolved and future demands on the Washington
Mutual portfolio.
The primary reasons for repurchase demands from the GSEs relate to
alleged misrepresentations primarily driven by: (i) credit quality and/or
undisclosed debt of the borrower; (ii) income level and/or employ-
ment status of the borrower; and (iii) appraised value of collateral.
Ineligibility of the borrower for the particular product, mortgage
insurance rescissions and missing documentation are other reasons
for repurchase demands.
Beginning in 2009, mortgage insurers more frequently rescinded
mortgage insurance coverage. The successful rescission of mortgage
insurance typically results in a violation of representations and war-
ranties made to the GSEs and, therefore, has been a significant cause
of repurchase demands from the GSEs. The Firm actively reviews all
rescission notices from mortgage insurers and contests them when
appropriate. In addition, the Firm is engaged in discussions with
various mortgage insurers on their rights and practices related to
rescinding mortgage insurance coverage. The Firm has entered into
agreements with two mortgage insurers to make processes more
efficient and reduce exposure on claims on certain portfolios for
which the Firm is a servicer. The impact of these agreements is re-
flected in the repurchase liability as of December 31, 2010.
When the Firm accepts a repurchase demand from one of the GSEs,
the Firm may either (a) repurchase the loan or the underlying col-
lateral from the GSE at the unpaid principal balance of the loan
plus accrued interest, or (b) reimburse the GSE for its realized loss
on a liquidated property (a “make-whole” payment).
To estimate the Firm’s repurchase liability arising from breaches of
representations and warranties, the Firm considers:
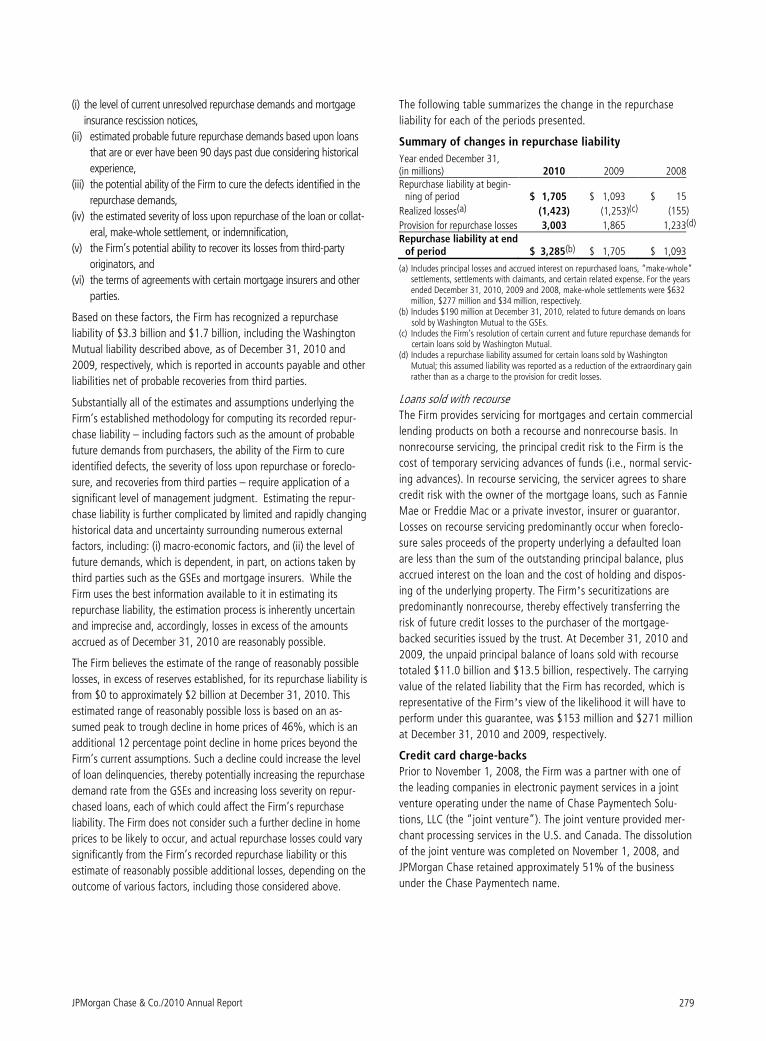
JPMorgan Chase & Co./2010 Annual Report 279
(i) the level of current unresolved repurchase demands and mortgage
insurance rescission notices,
(ii) estimated probable future repurchase demands based upon loans
that are or ever have been 90 days past due considering historical
experience,
(iii) the potential ability of the Firm to cure the defects identified in the
repurchase demands,
(iv) the estimated severity of loss upon repurchase of the loan or collat-
eral, make-whole settlement, or indemnification,
(v) the Firm’s potential ability to recover its losses from third-party
originators, and
(vi) the terms of agreements with certain mortgage insurers and other
parties.
Based on these factors, the Firm has recognized a repurchase
liability of $3.3 billion and $1.7 billion, including the Washington
Mutual liability described above, as of December 31, 2010 and
2009, respectively, which is reported in accounts payable and other
liabilities net of probable recoveries from third parties.
Substantially all of the estimates and assumptions underlying the
Firm’s established methodology for computing its recorded repur-
chase liability – including factors such as the amount of probable
future demands from purchasers, the ability of the Firm to cure
identified defects, the severity of loss upon repurchase or foreclo-
sure, and recoveries from third parties – require application of a
significant level of management judgment. Estimating the repur-
chase liability is further complicated by limited and rapidly changing
historical data and uncertainty surrounding numerous external
factors, including: (i) macro-economic factors, and (ii) the level of
future demands, which is dependent, in part, on actions taken by
third parties such as the GSEs and mortgage insurers. While the
Firm uses the best information available to it in estimating its
repurchase liability, the estimation process is inherently uncertain
and imprecise and, accordingly, losses in excess of the amounts
accrued as of December 31, 2010 are reasonably possible.
The Firm believes the estimate of the range of reasonably possible
losses, in excess of reserves established, for its repurchase liability is
from $0 to approximately $2 billion at December 31, 2010. This
estimated range of reasonably possible loss is based on an as-
sumed peak to trough decline in home prices of 46%, which is an
additional 12 percentage point decline in home prices beyond the
Firm’s current assumptions. Such a decline could increase the level
of loan delinquencies, thereby potentially increasing the repurchase
demand rate from the GSEs and increasing loss severity on repur-
chased loans, each of which could affect the Firm’s repurchase
liability. The Firm does not consider such a further decline in home
prices to be likely to occur, and actual repurchase losses could vary
significantly from the Firm’s recorded repurchase liability or this
estimate of reasonably possible additional losses, depending on the
outcome of various factors, including those considered above.
The following table summarizes the change in the repurchase
liability for each of the periods presented.
Summary of changes in repurchase liability
Year ended December 31, (in millions) 2010 2009 2008 Repurchase liability at begin-
ning of period $ 1,705 $ 1,093 $ 15
Realized losses(a) (1,423) (1,253)(c) (155)
Provision for repurchase losses 3,003 1,865 1,233(d) Repurchase liability at end
of period $ 3,285(b) $ 1,705 $ 1,093
(a) Includes principal losses and accrued interest on repurchased loans, “make-whole” settlements, settlements with claimants, and certain related expense. For the years ended December 31, 2010, 2009 and 2008, make-whole settlements were $632 million, $277 million and $34 million, respectively.
(b) Includes $190 million at December 31, 2010, related to future demands on loans sold by Washington Mutual to the GSEs.
(c) Includes the Firm’s resolution of certain current and future repurchase demands for certain loans sold by Washington Mutual.
(d) Includes a repurchase liability assumed for certain loans sold by Washington Mutual; this assumed liability was reported as a reduction of the extraordinary gain rather than as a charge to the provision for credit losses.
Loans sold with recourse
The Firm provides servicing for mortgages and certain commercial
lending products on both a recourse and nonrecourse basis. In
nonrecourse servicing, the principal credit risk to the Firm is the
cost of temporary servicing advances of funds (i.e., normal servic-
ing advances). In recourse servicing, the servicer agrees to share
credit risk with the owner of the mortgage loans, such as Fannie
Mae or Freddie Mac or a private investor, insurer or guarantor.
Losses on recourse servicing predominantly occur when foreclo-
sure sales proceeds of the property underlying a defaulted loan
are less than the sum of the outstanding principal balance, plus
accrued interest on the loan and the cost of holding and dispos-
ing of the underlying property. The Firm’ s securitizations are
predominantly nonrecourse, thereby effectively transferring the
risk of future credit losses to the purchaser of the mortgage-
backed securities issued by the trust. At December 31, 2010 and
2009, the unpaid principal balance of loans sold with recourse
totaled $11.0 billion and $13.5 billion, respectively. The carrying
value of the related liability that the Firm has recorded, which is
representative of the Firm’ s view of the likelihood it will have to
perform under this guarantee, was $153 million and $271 million
at December 31, 2010 and 2009, respectively.
Credit card charge-backs
Prior to November 1, 2008, the Firm was a partner with one of
the leading companies in electronic payment services in a joint
venture operating under the name of Chase Paymentech Solu-
tions, LLC (the “joint venture”). The joint venture provided mer-
chant processing services in the U.S. and Canada. The dissolution
of the joint venture was completed on November 1, 2008, and
JPMorgan Chase retained approximately 51% of the business
under the Chase Paymentech name.
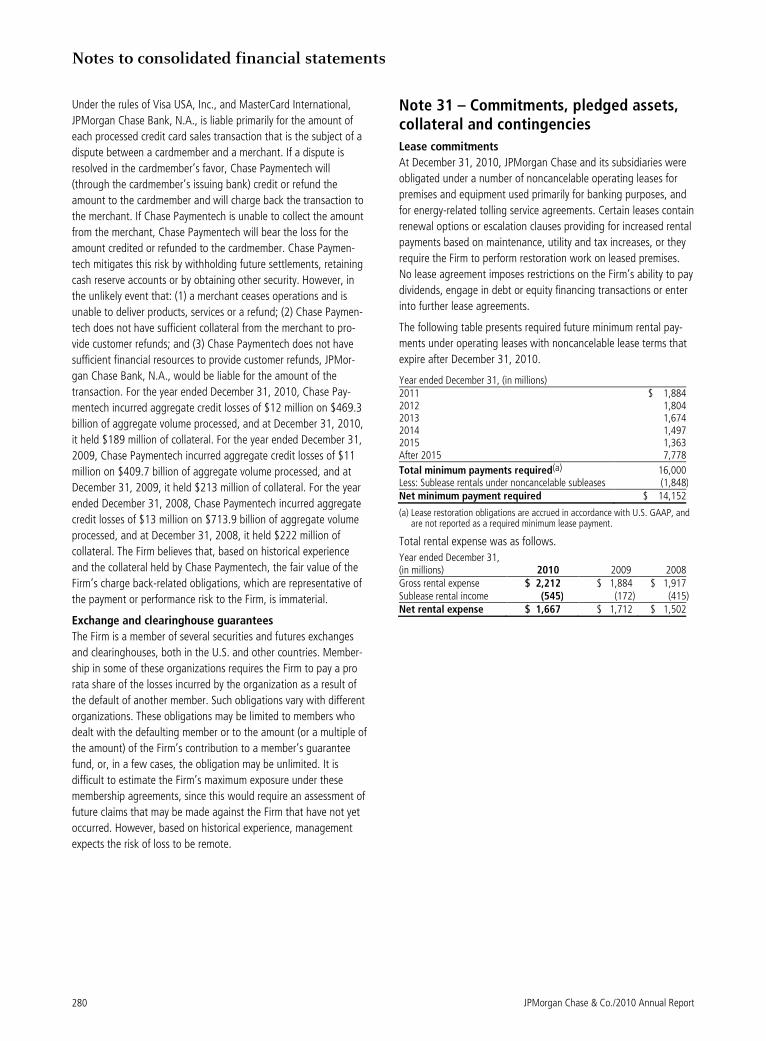
Notes to consolidated financial statements
JPMorgan Chase & Co./2010 Annual Report 280
Under the rules of Visa USA, Inc., and MasterCard International,
JPMorgan Chase Bank, N.A., is liable primarily for the amount of
each processed credit card sales transaction that is the subject of a
dispute between a cardmember and a merchant. If a dispute is
resolved in the cardmember’s favor, Chase Paymentech will
(through the cardmember’s issuing bank) credit or refund the
amount to the cardmember and will charge back the transaction to
the merchant. If Chase Paymentech is unable to collect the amount
from the merchant, Chase Paymentech will bear the loss for the
amount credited or refunded to the cardmember. Chase Paymen-
tech mitigates this risk by withholding future settlements, retaining
cash reserve accounts or by obtaining other security. However, in
the unlikely event that: (1) a merchant ceases operations and is
unable to deliver products, services or a refund; (2) Chase Paymen-
tech does not have sufficient collateral from the merchant to pro-
vide customer refunds; and (3) Chase Paymentech does not have
sufficient financial resources to provide customer refunds, JPMor-
gan Chase Bank, N.A., would be liable for the amount of the
transaction. For the year ended December 31, 2010, Chase Pay-
mentech incurred aggregate credit losses of $12 million on $469.3
billion of aggregate volume processed, and at December 31, 2010,
it held $189 million of collateral. For the year ended December 31,
2009, Chase Paymentech incurred aggregate credit losses of $11
million on $409.7 billion of aggregate volume processed, and at
December 31, 2009, it held $213 million of collateral. For the year
ended December 31, 2008, Chase Paymentech incurred aggregate
credit losses of $13 million on $713.9 billion of aggregate volume
processed, and at December 31, 2008, it held $222 million of
collateral. The Firm believes that, based on historical experience
and the collateral held by Chase Paymentech, the fair value of the
Firm’s charge back-related obligations, which are representative of
the payment or performance risk to the Firm, is immaterial.
Exchange and clearinghouse guarantees
The Firm is a member of several securities and futures exchanges
and clearinghouses, both in the U.S. and other countries. Member-
ship in some of these organizations requires the Firm to pay a pro
rata share of the losses incurred by the organization as a result of
the default of another member. Such obligations vary with different
organizations. These obligations may be limited to members who
dealt with the defaulting member or to the amount (or a multiple of
the amount) of the Firm’s contribution to a member’s guarantee
fund, or, in a few cases, the obligation may be unlimited. It is
difficult to estimate the Firm’s maximum exposure under these
membership agreements, since this would require an assessment of
future claims that may be made against the Firm that have not yet
occurred. However, based on historical experience, management
expects the risk of loss to be remote.
Note 31 – Commitments, pledged assets, collateral and contingencies
Lease commitments
At December 31, 2010, JPMorgan Chase and its subsidiaries were
obligated under a number of noncancelable operating leases for
premises and equipment used primarily for banking purposes, and
for energy-related tolling service agreements. Certain leases contain
renewal options or escalation clauses providing for increased rental
payments based on maintenance, utility and tax increases, or they
require the Firm to perform restoration work on leased premises.
No lease agreement imposes restrictions on the Firm’s ability to pay
dividends, engage in debt or equity financing transactions or enter
into further lease agreements.
The following table presents required future minimum rental pay-
ments under operating leases with noncancelable lease terms that
expire after December 31, 2010.
Year ended December 31, (in millions) 2011 $ 1,884 2012 1,804 2013 1,674 2014 1,497 2015 1,363 After 2015 7,778
Total minimum payments required(a) 16,000 Less: Sublease rentals under noncancelable subleases (1,848) Net minimum payment required $ 14,152
(a) Lease restoration obligations are accrued in accordance with U.S. GAAP, and are not reported as a required minimum lease payment.
Total rental expense was as follows.
Year ended December 31, (in millions) 2010 2009 2008 Gross rental expense $ 2,212 $ 1,884 $ 1,917 Sublease rental income (545) (172) (415) Net rental expense $ 1,667 $ 1,712 $ 1,502
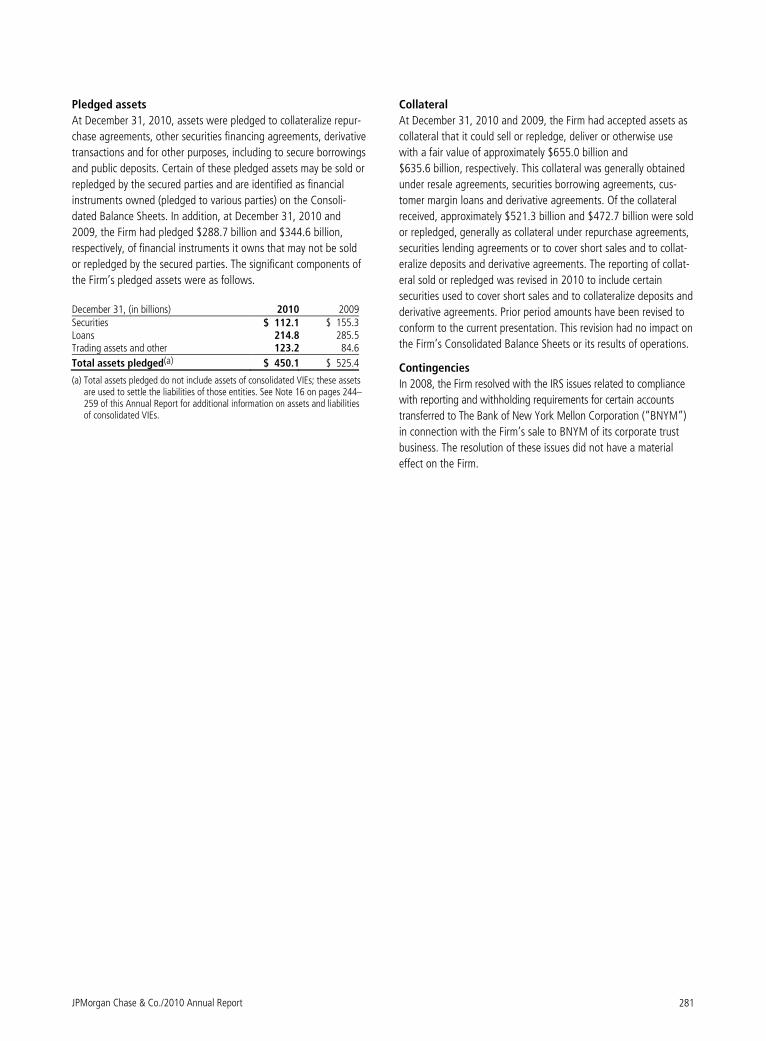
JPMorgan Chase & Co./2010 Annual Report 281
Pledged assets
At December 31, 2010, assets were pledged to collateralize repur-
chase agreements, other securities financing agreements, derivative
transactions and for other purposes, including to secure borrowings
and public deposits. Certain of these pledged assets may be sold or
repledged by the secured parties and are identified as financial
instruments owned (pledged to various parties) on the Consoli-
dated Balance Sheets. In addition, at December 31, 2010 and
2009, the Firm had pledged $288.7 billion and $344.6 billion,
respectively, of financial instruments it owns that may not be sold
or repledged by the secured parties. The significant components of
the Firm’s pledged assets were as follows.
December 31, (in billions) 2010 2009Securities $ 112.1 $ 155.3Loans 214.8 285.5Trading assets and other 123.2 84.6
Total assets pledged(a) $ 450.1 $ 525.4
(a) Total assets pledged do not include assets of consolidated VIEs; these assets are used to settle the liabilities of those entities. See Note 16 on pages 244–259 of this Annual Report for additional information on assets and liabilities of consolidated VIEs.
Collateral
At December 31, 2010 and 2009, the Firm had accepted assets as
collateral that it could sell or repledge, deliver or otherwise use
with a fair value of approximately $655.0 billion and
$635.6 billion, respectively. This collateral was generally obtained
under resale agreements, securities borrowing agreements, cus-
tomer margin loans and derivative agreements. Of the collateral
received, approximately $521.3 billion and $472.7 billion were sold
or repledged, generally as collateral under repurchase agreements,
securities lending agreements or to cover short sales and to collat-
eralize deposits and derivative agreements. The reporting of collat-
eral sold or repledged was revised in 2010 to include certain
securities used to cover short sales and to collateralize deposits and
derivative agreements. Prior period amounts have been revised to
conform to the current presentation. This revision had no impact on
the Firm’s Consolidated Balance Sheets or its results of operations.
Contingencies
In 2008, the Firm resolved with the IRS issues related to compliance
with reporting and withholding requirements for certain accounts
transferred to The Bank of New York Mellon Corporation (“BNYM”)
in connection with the Firm’s sale to BNYM of its corporate trust
business. The resolution of these issues did not have a material
effect on the Firm.
Notes to consolidated financial statements
282 JPMorgan Chase & Co./2010 Annual Report
Note 32 – Litigation
As of December 31, 2010, the Firm and its subsidiaries are defen-
dants or putative defendants in more than 10,000 legal proceed-
ings, in the form of regulatory/government investigations as well as
private, civil litigations. The litigations range from individual actions
involving a single plaintiff to class action lawsuits with potentially
millions of class members. Investigations involve both formal and
informal proceedings, by both governmental agencies and self-
regulatory organizations. These legal proceedings are at varying
stages of adjudication, arbitration or investigation, and involve
each of the Firm’s lines of business and geographies and a wide
variety of claims (including common law tort and contract claims
and statutory antitrust, securities and consumer protection claims),
some of which present novel claims or legal theories.
The Firm believes the estimate of the aggregate range of reasona-
bly possible losses, in excess of reserves established, for its legal
proceedings is from $0 to approximately $4.5 billion at December
31, 2010. This estimated aggregate range of reasonably possible
losses is based upon currently available information for those
proceedings in which the Firm is involved, taking into account the
Firm’s best estimate of such losses for those cases for which such
estimate can be made. For certain cases, the Firm does not believe
that an estimate can currently be made. The Firm’s estimate in-
volves significant judgment, given the varying stages of the pro-
ceedings (including the fact that many of them are currently in
preliminary stages), the existence of multiple defendants (including
the Firm) in many of such proceedings whose share of liability has
yet to be determined, the numerous yet-unresolved issues in many
of the proceedings (including issues regarding class certification
and the scope of many of the claims), and the attendant uncer-
tainty of the various potential outcomes of such proceedings.
Accordingly, the Firm’s estimate will change from time to time, and
actual losses may be more than the current estimate.
Set forth below are descriptions of the Firm’s material legal pro-
ceedings.
Auction-Rate Securities Investigations and Litigation. Beginning in
March 2008, several regulatory authorities initiated investigations
of a number of industry participants, including the Firm, concerning
possible state and federal securities law violations in connection
with the sale of auction-rate securities. The market for many such
securities had frozen and a significant number of auctions for those
securities began to fail in February 2008.
The Firm, on behalf of itself and affiliates, agreed to a settlement in
principle with the New York Attorney General’s Office which pro-
vided, among other things, that the Firm would offer to purchase at
par certain auction-rate securities purchased from J.P. Morgan
Securities LLC (“JPMorgan Securities”; formerly J.P. Morgan Securi-
ties Inc.), Chase Investment Services Corp. and Bear, Stearns & Co.
Inc. by individual investors, charities and small- to medium-sized
businesses. The Firm also agreed to a substantively similar settle-
ment in principle with the Office of Financial Regulation for the
State of Florida and the North American Securities Administrator
Association (“NASAA”) Task Force, which agreed to recommend
approval of the settlement to all remaining states, Puerto Rico and
the U.S. Virgin Islands. The Firm has finalized the settlement
agreements with the New York Attorney General’s Office and the
Office of Financial Regulation for the State of Florida. The settle-
ment agreements provide for the payment of penalties totaling $25
million to all states. The Firm is currently in the process of finalizing
consent agreements with NASAA’s member states; over 40 of these
consent agreements have been finalized to date.
The Firm also faces a number of civil actions relating to the Firm’s
sales of auction-rate securities, including a putative securities class
action in the United States District Court for the Southern District of
New York that seeks unspecified damages, and individual arbitrations
and lawsuits in various forums brought by institutional and individual
investors that, together, seek damages totaling more than $200
million relating to the Firm’s sales of auction-rate securities. One
action is brought by an issuer of auction-rate securities. The actions
generally allege that the Firm and other firms manipulated the market
for auction-rate securities by placing bids at auctions that affected
these securities’ clearing rates or otherwise supported the auctions
without properly disclosing these activities. Some actions also allege
that the Firm misrepresented that auction-rate securities were short-
term instruments. The Firm has filed motions to dismiss each of the
actions, which are being coordinated before the Southern District.
These motions are currently pending.
Additionally, the Firm was named in two putative antitrust class
actions in the United States District Court for the Southern District
of New York. The actions allege that the Firm, along with numerous
other financial institution defendants, colluded to maintain and
stabilize the auction-rate securities market and then to withdraw
their support for the auction-rate securities market. In January
2010, the District Court dismissed both actions. The Second Circuit
Court of Appeals consolidated the two appeals. That appeal is
currently pending.
Bear Stearns Hedge Fund Matters. Bear Stearns, certain current or
former subsidiaries of Bear Stearns, including Bear Stearns Asset
Management, Inc. (“BSAM”) and Bear, Stearns & Co. Inc., and
certain current or former Bear Stearns employees are named defen-
dants (collectively the “Bear Stearns defendants”) in multiple civil
actions and arbitrations relating to alleged losses of more than $1
billion resulting from the failure of the Bear Stearns High Grade
Structured Credit Strategies Master Fund, Ltd. (the “High Grade
Fund”) and the Bear Stearns High Grade Structured Credit Strate-
gies Enhanced Leverage Master Fund, Ltd. (the “Enhanced Lever-
age Fund”) (collectively, the “Funds”). BSAM served as investment
manager for both of the Funds, which were organized such that
there were U.S. and Cayman Islands “feeder funds” that invested
substantially all their assets, directly or indirectly, in the Funds. The
Funds are in liquidation.
There are currently four civil actions pending in the United States
District Court for the Southern District of New York relating to the
Funds. Two of these actions involve derivative lawsuits brought on
behalf of purchasers of partnership interests in the two U.S. feeder
JPMorgan Chase & Co./2010 Annual Report 283
funds, alleging that the Bear Stearns defendants mismanaged the
Funds and made material misrepresentations to and/or withheld
information from investors in the feeder funds. These actions seek,
among other things, unspecified compensatory damages based on
alleged investor losses. The third action, brought by the Joint Vol-
untary Liquidators of the Cayman Islands feeder funds, makes
allegations similar to those asserted in the derivative lawsuits
related to the U.S. feeder funds, and seeks compensatory and
punitive damages. Motions to dismiss in these three cases have
been granted in part and denied in part. An agreement in principle
has been reached, pursuant to which BSAM would pay a maximum
of approximately $19 million to settle the one derivative action
relating to the feeder fund to the High Grade Fund. BSAM has
reserved the right not to proceed with this settlement if plaintiff is
unable to secure the participation of investors whose net contribu-
tions meet a prescribed percentage of the aggregate net contribu-
tions to the High Grade Fund. The agreement in principle remains
subject to documentation and approval by the Court. Discovery in
the other two actions is ongoing.
The fourth action was brought by Bank of America and Banc of
America Securities LLC (together “BofA”) alleging breach of contract
and fraud in connection with a May 2007 $4 billion securitization,
known as a “CDO-squared,” for which BSAM served as collateral
manager. This securitization was composed of certain collateralized
debt obligation (“CDO”) holdings that were purchased by BofA from
the Funds. Bank of America seeks in excess of $3 billion in damages.
Defendants’ motion to dismiss in this action was largely denied, an
amended complaint was filed and discovery is ongoing.
Bear Stearns Shareholder Litigation and Related Matters. Various
shareholders of Bear Stearns have commenced purported class
actions against Bear Stearns and certain of its former officers
and/or directors on behalf of all persons who purchased or other-
wise acquired common stock of Bear Stearns between December
14, 2006 and March 14, 2008 (the “Class Period”). During the
Class Period Bear Stearns had between 115 and 120 million com-
mon shares outstanding, and the price of those securities declined
from a high of $172.61 to a low of $30 at the end of the period.
The actions, originally commenced in several federal courts, allege
that the defendants issued materially false and misleading state-
ments regarding Bear Stearns’ business and financial results and
that, as a result of those false statements, Bear Stearns’ common
stock traded at artificially inflated prices during the Class Period.
Separately, several individual shareholders of Bear Stearns have
commenced or threatened to commence arbitration proceedings
and lawsuits asserting claims similar to those in the putative class
actions. In addition, Bear Stearns and certain of its former officers
and/or directors have also been named as defendants in a number
of purported class actions commenced in the United States District
Court for the Southern District of New York seeking to represent
the interests of participants in the Bear Stearns Employee Stock
Ownership Plan (“ESOP”) during the time period of December
2006 to March 2008. These actions, brought under the Employee
Retirement Income Security Act (“ERISA”), allege that defendants
breached their fiduciary duties to plaintiffs and to the other partici-
pants and beneficiaries of the ESOP by (a) failing to manage pru-
dently the ESOP’s investment in Bear Stearns securities; (b) failing
to communicate fully and accurately about the risks of the ESOP’s
investment in Bear Stearns stock; (c) failing to avoid or address
alleged conflicts of interest; and (d) failing to monitor those who
managed and administered the ESOP.
Bear Stearns, former members of Bear Stearns’ Board of Directors
and certain of Bear Stearns’ former executive officers have also
been named as defendants in two purported shareholder derivative
suits, subsequently consolidated into one action, pending in the
United States District Court for the Southern District of New York.
Plaintiffs are asserting claims for breach of fiduciary duty, violations
of federal securities laws, waste of corporate assets and gross
mismanagement, unjust enrichment, abuse of control and indemni-
fication and contribution in connection with the losses sustained by
Bear Stearns as a result of its purchases of subprime loans and
certain repurchases of its own common stock. Certain individual
defendants are also alleged to have sold their holdings of Bear
Stearns common stock while in possession of material nonpublic
information. Plaintiffs seek compensatory damages in an unspeci-
fied amount. Plaintiffs later filed a second amended complaint
asserting, for the first time, purported class action claims, as well as
new allegations concerning events that took place in March 2008.
All of the above-described actions filed in federal courts were
ordered transferred and joined for pre-trial purposes before the
United States District Court for the Southern District of New York.
Defendants moved to dismiss the purported securities class action,
the shareholders’ derivative action and the ERISA action. In January
2011, the District Court granted the motions to dismiss the deriva-
tive and ERISA actions, and denied the motion as to the securities
action. Plaintiffs in the derivative action have filed a motion for
reconsideration of the dismissal. Discovery will now commence in
the securities action.
City of Milan Litigation and Criminal Investigation. In January 2009,
the City of Milan, Italy (the “City”) issued civil proceedings against
(among others) JPMorgan Chase Bank, N.A. and J.P. Morgan
Securities Ltd. (together, “JPMorgan Chase”) in the District Court
of Milan. The proceedings relate to (a) a bond issue by the City in
June 2005 (the “Bond”) and (b) an associated swap transaction,
which was subsequently restructured on a number of occasions
between 2005 and 2007 (the “Swap”). The City seeks damages
and/or other remedies against JPMorgan Chase (among others) on
the grounds of alleged “fraudulent and deceitful acts” and alleged
breach of advisory obligations by JPMorgan Chase (among others)
in connection with the Swap and the Bond, together with related
swap transactions with other counterparties. The civil proceedings
continue and there will be an initial hearing on March 9, 2011.
JPMorgan Chase Bank, N.A. will seek an adjournment on the
grounds that it has filed a challenge to the Italian Supreme Court’s
jurisdiction over JPMorgan Chase Bank, N.A., which has yet to be
decided. The judge directed four current and former JPMorgan
Chase personnel and JPMorgan Chase Bank, N.A. (as well as other
individuals and three other banks) to go forward to a full trial that
Notes to consolidated financial statements
284 JPMorgan Chase & Co./2010 Annual Report
started in May 2010. Although the Firm is not charged with any
crime and does not face criminal liability, if one or more of its
employees were found guilty, the Firm could be subject to adminis-
trative sanctions, including restrictions on its ability to conduct
business in Italy and monetary penalties. In the initial hearings, the
City successfully applied to join some of the claims in the civil
proceedings against the individuals and JPMorgan Chase Bank,
N.A. to the criminal proceedings. In addition, a consumer associa-
tion has also been given leave to join the criminal proceedings to
seek damages from the defendant banks.
Enron Litigation. JPMorgan Chase and certain of its officers and
directors are involved in several lawsuits that together seek sub-
stantial damages arising out of the Firm’s banking relationships
with Enron Corp. and its subsidiaries (“Enron”). A number of
actions and other proceedings against the Firm previously were
resolved, including a class action lawsuit captioned Newby v. Enron
Corp. and adversary proceedings brought by Enron’s bankruptcy
estate. The remaining Enron-related actions include individual
actions by Enron investors, an action by an Enron counterparty, and
a purported class action filed on behalf of JPMorgan Chase em-
ployees who participated in the Firm’s 401(k) plan asserting claims
under the ERISA for alleged breaches of fiduciary duties by JPMor-
gan Chase, its directors and named officers. That action has been
dismissed, and is on appeal to the United States Court of Appeals
for the Second Circuit.
Interchange Litigation. A group of merchants has filed a series of
putative class action complaints in several federal courts. The
complaints allege that VISA and MasterCard, as well as certain
other banks and their respective bank holding companies, con-
spired to set the price of credit and debit card interchange fees,
enacted respective association rules in violation of anti-trust laws,
and engaged in tying/bundling and exclusive dealing. The com-
plaint seeks unspecified damages and injunctive relief based on the
theory that interchange would be lower or eliminated but for the
challenged conduct. Based on publicly available estimates, Visa and
MasterCard branded payment cards generated approximately $40
billion of interchange fees industry-wide in 2009. All cases have
been consolidated in the United States District Court for the Eastern
District of New York for pretrial proceedings. The Court has dis-
missed all claims relating to periods prior to January 2004. The
Court has not yet ruled on motions relating to the remainder of the
case. Fact and expert discovery in the case have closed. The plain-
tiffs have filed a motion seeking class certification, and the defen-
dants have opposed that motion. The Court has not yet ruled on
the class certification motion.
In addition to the consolidated class action complaint, plaintiffs
filed supplemental complaints challenging the initial public offer-
ings (“IPOs”) of MasterCard and Visa (the “IPO Complaints”). With
respect to the MasterCard IPO, plaintiffs allege that the offering
violated Section 7 of the Clayton Act and Section 1 of the Sherman
Act and that the offering was a fraudulent conveyance. With re-
spect to the Visa IPO, plaintiffs are challenging the Visa IPO on
antitrust theories parallel to those articulated in the MasterCard
IPO pleading. Defendants have filed motions to dismiss the IPO
Complaints. The Court has not yet ruled on those motions.
Investment Management Litigation. Four cases have been filed
claiming that investment portfolios managed by JPMorgan Invest-
ment Management Inc. (“JPMorgan Investment Management”)
were inappropriately invested in securities backed by subprime
residential real estate collateral. Plaintiffs claim that JPMorgan
Investment Management and related defendants are liable for
losses of more than $1 billion in market value of these securities.
The first case was filed by NM Homes One, Inc. in federal District
Court in New York, and the Court granted JPMorgan Chase Bank,
N.A.’s motion to dismiss nine of plaintiff’s ten causes of action,
leaving a breach of contract claim. The Court thereafter granted the
plaintiff’s motion for reconsideration and reinstated the common
law non-fraud claims for breach of fiduciary duty, negligence, and
gross negligence. The plaintiff withdrew its claim for negligent
misrepresentation. The Firm has filed a renewed motion to dismiss
the common law non-fraud claims and a motion for judgment on
the pleadings as to the breach of contract claim. In the second
case, which was filed by Assured Guaranty (U.K.) in New York state
court, the New York State Appellate Division allowed plaintiff to
proceed with its claims for breach of fiduciary duty and gross negli-
gence, and for breach of contract based on alleged violations of the
Delaware Insurance Code. The Firm sought and has obtained leave
to appeal to the New York State Court of Appeals the decision by
the Appellate Division to allow the breach of fiduciary duty and
gross negligence claims to proceed. In the third case, filed by
Ambac Assurance UK Limited in New York state court, the lower
court granted JPMorgan Investment Management’s motion to
dismiss, and plaintiff has filed a notice of appeal. The fourth case
was filed by CMMF LLP in New York state court; the lower court
granted JPMorgan Investment Management’s motion to dismiss the
claims, other than claims for breach of contract and negligent
misrepresentation. The Appellate Division affirmed the lower
court’s decision. Plaintiff has since filed an amended complaint
seeking to assert claims under New York law for breach of fiduciary
duty, gross negligence, breach of contract and negligent misrepre-
sentation.
Lehman Brothers Bankruptcy Proceedings. In March 2010, the
Examiner appointed by the Bankruptcy Court presiding over the
Chapter 11 bankruptcy proceedings of Lehman Brothers Holdings
Inc (“LBHI”) and several of its subsidiaries (collectively, “Lehman”)
released a report as to his investigation into Lehman’s failure and
related matters. The Examiner concluded that one common law
claim potentially could be asserted against the Firm for contributing
to Lehman’s failure, though he characterized the claim as “not
strong.” The Examiner also opined that certain cash and securities
collateral provided by LBHI to the Firm in the weeks and days
preceding LBHI’s demise potentially could be challenged under the
Bankruptcy Code’s fraudulent conveyance or preference provisions,
though the Firm is of the view that its right to such collateral is
protected by the Bankruptcy Code’s safe harbor provisions. In May
2010, LBHI and its Official Committee of Unsecured Creditors filed
an adversary proceeding against JPMorgan Chase Bank, N.A. in the
JPMorgan Chase & Co./2010 Annual Report 285
United States Bankruptcy Court for the Southern District of New
York. The complaint asserts both federal bankruptcy law and state
common law claims, and seeks, among other relief, to recover $8.6
billion in collateral that was transferred to JPMorgan Chase Bank,
N.A. in the week preceding LBHI’s bankruptcy. The complaint also
seeks unspecified damages on the grounds that JPMorgan Chase
Bank, N.A.’s collateral requests hastened LBHI’s demise. The Firm
has moved to dismiss plaintiffs’ amended complaint in its entirety.
The Firm also filed counterclaims against LBHI alleging that LBHI
fraudulently induced the Firm to make large clearing advances to
Lehman against inappropriate collateral, which left the Firm with
more than $25 billion in claims against the estate of Lehman's
broker-dealer, which could be unpaid if the Firm is required to
return any collateral to Lehman. The case is in the early stages,
with a trial scheduled for 2012. In addition, the Firm may also face
claims in the liquidation proceeding pending before the same
Bankruptcy Court under the Securities Investor Protection Act
(“SIPA”) for LBHI’s U.S. broker-dealer subsidiary, Lehman Brothers
Inc. (“LBI”). The SIPA Trustee has advised the Firm that certain of
the securities and cash pledged as collateral for the Firm’s claims
against LBI may be customer property free from any security inter-
est in favor of the Firm. The Firm has also responded to various
regulatory inquiries regarding the Lehman matter.
Madoff Litigation. JPMorgan Chase & Co., JPMorgan Chase Bank,
N.A., JPMorgan Securities LLC, and JPMorgan Securities Ltd. have
been named as defendants in a lawsuit brought by the trustee for
the liquidation of Bernard L. Madoff Investment Securities LLC (the
“Trustee”). The Trustee asserts 28 causes of action against JPMor-
gan Chase, 16 of which seek to avoid certain transfers (direct or
indirect) made to JPMorgan Chase that are alleged to have been
preferential or fraudulent under the federal Bankruptcy Code and
the New York Debtor and Creditor Law. The remaining causes of
action are for, among other things, aiding and abetting fraud,
aiding and abetting breach of fiduciary duty, conversion and unjust
enrichment. The complaint generally alleges that JPMorgan Chase,
as Madoff’s long-time bank, facilitated the maintenance of Mad-
off’s Ponzi scheme and overlooked signs of wrongdoing in order to
obtain profits and fees. The complaint purports to seek approxi-
mately $6 billion in damages from JPMorgan Chase, and to recover
approximately $425 million in transfers that JPMorgan Chase
allegedly received directly or indirectly from Bernard Madoff’s
brokerage firm. JPMorgan Chase has filed a motion to return the
case from the Bankruptcy Court to the District Court, and intends to
seek the dismissal of all or most of the Trustee’s claims once that
motion is decided.
Separately, J.P. Morgan Trust Company (Cayman) Limited, JPMor-
gan (Suisse) SA, and J.P. Morgan Securities Ltd. have been named
as defendants in several suits in Bankruptcy Court and state and
federal courts in New York arising out of the liquidation proceed-
ings of Fairfield Sentry Limited and Fairfield Sigma Limited (to-
gether, “Fairfield”), so-called Madoff feeder funds. These actions
advance theories of mistake and restitution and seek to recover
payments previously made to defendants by the funds totaling
approximately $140 million.
Mortgage-Backed Securities Litigation and Regulatory Investiga-
tions. JPMorgan Chase and affiliates, Bear Stearns and affiliates
and Washington Mutual and affiliates have been named as defen-
dants in a number of cases in their various roles as issuer and/or
underwriter in mortgage-backed securities (“MBS”) offerings.
These cases include purported class action suits, actions by individ-
ual purchasers of securities and actions by insurance companies
that guaranteed payments of principal and interest for particular
tranches. Although the allegations vary by lawsuit, these cases
generally allege that the offering documents for more than $100
billion of securities issued by dozens of securitization trusts con-
tained material misrepresentations and omissions, including state-
ments regarding the underwriting standards pursuant to which the
underlying mortgage loans were issued.
In the actions against the Firm as an MBS issuer (and, in some
cases, also as an underwriter of its own MBS offerings), three
purported class actions are pending against JPMorgan Chase and
Bear Stearns, and/or certain of their affiliates and current and
former employees, in the United States District Courts for the
Eastern and Southern Districts of New York. Defendants have
moved to dismiss these actions. In addition, Washington Mutual
affiliates, WaMu Asset Acceptance Corp. and WaMu Capital Corp.,
are defendants, along with certain former officers or directors of
WaMu Asset Acceptance Corp., have been named as defendants in
three now-consolidated purported class action cases pending in the
Western District of Washington. Defendants’ motion to dismiss was
granted in part to dismiss all claims relating to MBS offerings in
which a named plaintiff was not a purchaser. Discovery is ongoing.
In other actions brought against the Firm as an MBS issuer (and, in
some cases, also as an underwriter) certain JPMorgan Chase enti-
ties, several Bear Stearns entities, and certain Washington Mutual
affiliates are defendants in nine separate individual actions com-
menced by the Federal Home Loan Banks of Pittsburgh, Seattle,
San Francisco, Chicago, Indianapolis and Atlanta in various state
courts around the country; and certain JPMorgan Chase, Bear
Stearns and Washington Mutual entities are also among the defen-
dants named in separate individual actions commenced by Cam-
bridge Place Investment Management Inc. in Massachusetts state
court, by The Charles Schwab Corporation in state court in Califor-
nia and by Allstate in state court in New York.
EMC Mortgage Corporation (“EMC”), a subsidiary of JPMorgan
Chase, is a defendant in four pending actions commenced by bond
insurers that guaranteed payments of principal and interest on
approximately $3.6 billion of certain classes of seven different MBS
offerings sponsored by EMC. Three of those actions, commenced by
Assured Guaranty Corp., Ambac Assurance Corporation and Syn-
cora Guarantee, Inc., respectively, are pending in the United States
District Court for the Southern District of New York. The fourth
action, commenced by CIFG Assurance North America, Inc., is
pending in state court in Texas. In each action, plaintiff claims that
the underlying mortgage loans had origination defects that pur-
portedly violate certain representations and warranties given by
EMC to plaintiffs, and that EMC has breached the relevant agree-
Notes to consolidated financial statements
286 JPMorgan Chase & Co./2010 Annual Report
ments between the parties by failing to repurchase allegedly defec-
tive mortgage loans. Each action seeks unspecified damages and
an order compelling EMC to repurchase those loans.
In the actions against the Firm solely as an underwriter of other
issuers’ MBS offerings, the Firm has contractual rights to indemnifi-
cation from the issuers, but those indemnity rights may prove
effectively unenforceable where the issuers are now defunct, such
as affiliates of IndyMac Bancorp (“IndyMac Trusts”) and Thornburg
Mortgage (“Thornburg”). With respect to the IndyMac Trusts,
JPMorgan Securities, along with numerous other underwriters and
individuals, is named as a defendant, both in its own capacity and
as successor to Bear Stearns in a purported class action pending in
the United States District Court for the Southern District of New
York brought on behalf of purchasers of securities in various Indy-
Mac Trust MBS offerings. The Court in that action has dismissed
claims as to certain such securitizations, including all offerings in
which no named plaintiff purchased securities, and allowed claims
as to other offerings to proceed. Plaintiffs’ motion to certify a class
of investors in certain offerings is pending, and discovery is ongo-
ing. In addition, JPMorgan Securities and JPMorgan Chase are
named as defendants in an individual action filed by the Federal
Home Loan Bank of Pittsburgh in connection with a single offering
by an affiliate of IndyMac Bancorp. Discovery in that action is
ongoing. Separately, JPMorgan Securities, as successor to Bear,
Stearns & Co. Inc., along with other underwriters and certain
individuals, are defendants in an action pending in state court in
California brought by MBIA Insurance Corp. (“MBIA”). The action
relates to certain securities issued by IndyMac trusts in offerings in
which Bear Stearns was an underwriter, and as to which MBIA
provided guaranty insurance policies. MBIA purports to be subro-
gated to the rights of the MBS holders, and seeks recovery of sums
it has paid and will pay pursuant to those policies. Discovery is
ongoing. With respect to Thornburg, a Bear Stearns subsidiary is a
named defendant in a purported class action pending in the United
States District Court for the District of New Mexico along with a
number of other financial institutions that served as depositors
and/or underwriters for three Thornburg MBS offerings.
In addition to the above-described litigation, the Firm has also
received, and responded to, a number of subpoenas and informal
requests for information from federal authorities concerning mort-
gage-related matters, including inquiries concerning a number of
transactions involving the Firm’s underwriting and issuance of MBS
and its participation in offerings of certain collateralized debt
obligations.
In addition to the above mortgage-related matters, the Firm is now a
defendant in an action commenced by Deutsche Bank, described in
more detail below with respect to the Washington Mutual Litigations.
Mortgage Foreclosure Investigations and Litigation. Multiple state
and federal officials have announced investigations into the proce-
dures followed by mortgage servicing companies and banks, includ-
ing JPMorgan Chase & Co. and its affiliates, relating to foreclosure
and loss mitigation processes. The Firm is cooperating with these
investigations, and these investigations could result in material fines,
penalties, equitable remedies (including requiring default servicing or
other process changes), or other enforcement actions, as well as
significant legal costs in responding to governmental investigations
and additional litigation. Three purported class action lawsuits have
also been filed against the Firm relating to its mortgage foreclosure
procedures.
These investigations and actions follow the Firm’s decision in late
September 2010 to commence a temporary suspension of obtaining
mortgage foreclosure judgments in the states and territories that
require a judicial foreclosure process. Subsequently, the Firm ex-
tended this temporary suspension to foreclosure sales in those
states and territories that require a judicial foreclosure process, and
to foreclosures and foreclosure sales in the majority of remaining
states where a judicial process is not required, but where affidavits
signed by Firm personnel may have been used as part of the fore-
closure process. In mid-October, the Firm also temporarily sus-
pended evictions in the states and territories in which it had
suspended foreclosures and foreclosure sales, as well as in certain
additional states in which an affidavit signed by Firm personnel may
have been used in connection with eviction proceedings.
The Firm’s temporary suspension arose out of certain questions
about affidavits of indebtedness prepared by local foreclosure
counsel, signed by Firm employees and filed or used in mortgage
foreclosure proceedings in certain states. Although the Firm be-
lieves, based on its work to date, that the statements in those
affidavits of indebtedness regarding the fact of default and amount
of indebtedness were materially accurate, in certain instances, the
underlying review and verification of this information was per-
formed by Firm personnel other than the affiants, or the affidavits
may not have been properly notarized.
As of January 2011, the Firm has resumed initiation of new foreclo-
sure proceedings in nearly all states in which it had previously
suspended such proceedings, utilizing revised procedures in con-
nection with the execution of affidavits and other documents used
by Firm employees in the foreclosure process. The Firm is also in the
process of reviewing pending foreclosure matters in these states to
determine whether remediation of specific documentation is neces-
sary, and intends to resume pending foreclosures as the review,
and if necessary, remediation, of each pending matter is completed.
The Firm intends to begin taking these same actions in all remain-
ing states in the near future.
Municipal Derivatives Investigations and Litigation. The Department
of Justice (in conjunction with the Internal Revenue Service), the
Securities and Exchange Commission (“SEC”), a group of state
attorneys general and the Office of the Comptroller of the Currency
(“OCC”) have been investigating JPMorgan Chase and Bear
Stearns for possible antitrust, securities and tax-related violations in
connection with the bidding or sale of guaranteed investment
contracts and derivatives to municipal issuers. The Philadelphia
Office of the SEC provided notice to JPMorgan Securities that it
intends to recommend that the SEC bring civil charges in connec-
tion with its investigation. JPMorgan Securities has responded to
that notice, as well as to a separate notice that that Philadelphia
JPMorgan Chase & Co./2010 Annual Report 287
Office of the SEC provided to Bear, Stearns & Co. Inc. The Firm has
been cooperating with all of these investigations, and is seeking to
resolve them on a negotiated basis.
Purported class action lawsuits and individual actions (the “Munici-
pal Derivatives Actions”) have been filed against JPMorgan Chase
and Bear Stearns, as well as numerous other providers and brokers,
alleging antitrust violations in the reportedly $100 billion to $300
billion annual market for financial instruments related to municipal
bond offerings referred to collectively as “municipal derivatives.”
The Municipal Derivatives Actions have been consolidated in the
United States District Court for the Southern District of New York.
The Court denied in part and granted in part defendants’ motions
to dismiss the purported class and individual actions, permitting
certain claims to proceed against the Firm and others under federal
and California state antitrust laws and under the California false
claims act. Subsequently, a number of additional individual actions
asserting substantially similar claims, including claims under New
York and West Virginia state antitrust statutes, were filed against
JPMorgan Chase, Bear Stearns and numerous other defendants.
Most of these cases have been coordinated for pretrial purposes in
the United States District Court for the Southern District of New
York. The Firm is seeking to have the balance of these cases coor-
dinated before the same court. Discovery is ongoing.
Following JPMorgan Securities’ settlement with the SEC in connec-
tion with certain Jefferson County, Alabama (the “County”) war-
rant underwritings and swap transactions, the County filed a
complaint against the Firm and several other defendants in the
Circuit Court of Jefferson County, Alabama. The suit alleges that
the Firm made payments to certain third parties in exchange for
being chosen to underwrite more than $3 billion in warrants issued
by the County and chosen as the counterparty for certain swaps
executed by the County. In its complaint, Jefferson County alleges
that the Firm concealed these third-party payments and that, but
for this concealment, the County would not have entered into the
transactions. The County further alleges that the transactions
increased the risks of its capital structure and that, following the
downgrade of certain insurers that insured the warrants, the
County’s interest obligations increased and the principal due on a
portion of its outstanding warrants was accelerated. The Court
denied the Firm’s motion to dismiss the complaint. The Firm filed a
mandamus petition with the Alabama Supreme Court, seeking
immediate appellate review of this decision. The petition is now
fully briefed and all proceedings have been stayed pending adjudi-
cation of the petition.
A putative class action was filed on behalf of sewer ratepayers
against JPMorgan Chase and Bear Stearns and numerous other
defendants, based on substantially the same alleged conduct
described above. The Firm’s motion to dismiss the complaint for
lack of standing was denied in January 2011.
Two insurance companies that guaranteed the payment of principal
and interest on warrants issued by Jefferson County have filed sepa-
rate actions against JPMorgan Chase (and one of the insurers has
also named Jefferson County) in New York state court asserting that
defendants fraudulently misled them into issuing the insurance cover-
age, based upon substantially the same alleged conduct described
above and other alleged non-disclosures. One insurer claims that it
insured an aggregate principal amount of nearly $1.2 billion in war-
rants, and seeks unspecified damages in excess of $400 million, as
well as unspecified punitive damages. The other insurer claims that it
insured an aggregate principal amount of more than $378 million
and seeks recovery of $4 million that it alleges it paid under the
policies to date as well as any payments it will make in the future and
unspecified punitive damages. In December 2010, the court denied
the Firm’s motions to dismiss each of the complaints and the parties
are currently engaged in discovery.
The Alabama Public Schools and College Authority (“APSCA”)
brought a declaratory judgment action in the United States District
Court for the Northern District of Alabama claiming that certain
interest rate swaption transactions entered into with JPMorgan
Chase Bank, N.A. are void on the grounds that the APSCA purport-
edly did not have the authority to enter into the transactions or,
alternatively, are voidable at the APSCA’s option because of its
alleged inability to issue refunding bonds in relation to the swaption.
The action was settled in December 2010 for a payment by APSCA
to the Firm and, pursuant to the settlement, the court dismissed the
action by order dated December 27, 2010.
Overdraft Fee/Debit Posting Order Litigation. JPMorgan Chase Bank,
N.A. has been named as a defendant in several purported class
actions relating to its practices in posting debit card transactions to
customers’ deposit accounts. Plaintiffs allege that the Firm improperly
re-ordered debit card transactions from the highest amount to lowest
amount before processing these transactions in order to generate
unwarranted overdraft fees. Plaintiffs contend that the Firm should
have processed such transactions in the chronological order they were
authorized. Plaintiffs seek the disgorgement of all overdraft fees paid
to the Firm by plaintiffs, since approximately 2003, as a result of the
re-ordering of debit card transactions. The claims against the Firm
have been consolidated with numerous complaints against other
national banks in Multi-District Litigation pending in the United States
District Court for the Southern District of Florida. The Firm’s motion to
compel arbitration of certain plaintiffs’ claims was denied by the
District Court. That ruling is currently on appeal. Discovery is proceed-
ing in the District Court. Plaintiffs’ motion for class certification is due
to be filed in April 2011.
Petters Bankruptcy and Related Matters. JPMorgan Chase and certain
of its affiliates, including One Equity Partners, LLC (“OEP”), have
been named as defendants in several actions filed in connection with
the receivership and bankruptcy proceedings pertaining to Thomas J.
Petters and certain entities affiliated with Petters (collectively, “Pet-
ters”) and the Polaroid Corporation. The principal actions against
JPMorgan Chase and its affiliates have been brought by the receiver
and bankruptcy trustee for Petters and generally seek to avoid, on
fraudulent transfer and preference grounds, certain purported trans-
fers in connection with (i) the 2005 acquisition of Polaroid by Petters,
which at the time was majority-owned by OEP; (ii) two credit facilities
that JPMorgan Chase and other financial institutions entered into
Notes to consolidated financial statements
288 JPMorgan Chase & Co./2010 Annual Report
with Polaroid; and (iii) a credit line and investment accounts held by
Petters. The actions collectively seek recovery of approximately $450
million.
Securities Lending Litigation. JPMorgan Chase Bank, N.A. has been
named as a defendant in four putative class actions asserting ERISA
and other claims pending in the United States District Court for the
Southern District of New York brought by participants in the Firm’s
securities lending business. A fifth lawsuit was filed in New York
state court by an individual participant in the program. Three of the
purported class actions, which have been consolidated, relate to
investments of approximately $500 million in medium-term notes
of Sigma Finance Inc. (“Sigma”). In August 2010, the Court certi-
fied a plaintiff class consisting of all securities lending participants
that held Sigma medium-term notes on September 30, 2008,
including those that held the notes by virtue of participation in the
investment of cash collateral through a collective fund, as well as
those that held the notes by virtue of the investment of cash collat-
eral through individual accounts. All discovery has been completed.
The Court has set a schedule for filing summary judgment briefs,
pursuant to which the Firm’s motion is to be fully briefed by April
2011.
The fourth putative class action concerns investments of approxi-
mately $500 million in Lehman Brothers medium-term notes. The
Firm has moved to dismiss the amended complaint and is awaiting
a decision. The Magistrate Judge ordered discovery to proceed
while the motion is pending, but this ruling is on appeal to the
District Judge and also is awaiting a decision. The New York state
court action, which is not a class action, concerns the plaintiff’s
alleged loss of money in both Sigma and Lehman Brothers medium-
term notes. The Firm has answered the complaint. The Court de-
nied the Firm’s motion to stay this action pending resolution of the
proceedings in federal court, and discovery has commenced.
Service Members Civil Relief Act and Housing and Economic Recov-
ery Act Investigations and Litigation. Multiple government officials
have announced their intent to commence, or have commenced,
inquiries into the Firm’s procedures related to the Service Members
Civil Relief Act (“SCRA”) and the Housing and Economic Recovery
Act of 2008 (“HERA”). These inquiries have been prompted by the
Firm’s public statements about its SCRA and HERA compliance and
actions to remedy certain instances in which the Firm mistakenly
charged active or recently-active military personnel mortgage
interest and fees in excess of that permitted by SCRA and HERA,
and in a number of instances, foreclosed on borrowers protected by
SCRA and HERA. The Firm has implemented a number of proce-
dural enhancements and controls to strengthen its SCRA and HERA
compliance and is still reviewing the circumstances under which
these issues arose. In addition, an individual borrower has filed a
purported nationwide class action in United States District Court for
South Carolina against the Firm alleging violations of the SCRA.
Washington Mutual Litigations. Subsequent to JPMorgan Chase’s
acquisition from the Federal Deposit Insurance Corporation
(“FDIC”) of substantially all of the assets and certain specified
liabilities of Washington Mutual Bank, Henderson Nevada (“Wash-
ington Mutual Bank”), in September 2008, Washington Mutual
Bank’s parent holding company, Washington Mutual, Inc. (“WMI”)
and its wholly-owned subsidiary, WMI Investment Corp. (together,
the “Debtors”), both commenced voluntary cases under Chapter 11
of Title 11 of the United States Code in the United States Bank-
ruptcy Court for the District of Delaware (the “Bankruptcy Case”).
In the Bankruptcy Case, the Debtors have asserted rights and
interests in certain assets. The assets in dispute include principally
the following: (a) approximately $4 billion in trust securities con-
tributed by WMI to Washington Mutual Bank (the “Trust Securi-
ties”); (b) the right to tax refunds arising from overpayments
attributable to operations of Washington Mutual Bank and its
subsidiaries; (c) ownership of and other rights in approximately $4
billion that WMI contends are deposit accounts at Washington
Mutual Bank and one of its subsidiaries; and (d) ownership of and
rights in various other contracts and other assets (collectively, the
“Disputed Assets”).
WMI, JPMorgan Chase and the FDIC have since been involved in
litigations over these and other claims pending in the Bankruptcy
Court and the United States District Court for the District of Columbia.
In May 2010, WMI, JPMorgan Chase and the FDIC announced a
global settlement agreement among themselves and significant
creditor groups (the “Global Settlement Agreement”). The Global
Settlement Agreement is incorporated into WMI’s proposed Chapter
11 plan (“the Plan”) that has been submitted to the Bankruptcy
Court. If approved by the Bankruptcy Court, the Global Settlement
would resolve numerous disputes among WMI, JPMorgan Chase, the
FDIC in its capacity as receiver for Washington Mutual Bank and the
FDIC in its corporate capacity, as well as those of significant creditor
groups, including disputes relating to the Disputed Assets.
Other proceedings related to Washington Mutual’s failure are also
pending before the Bankruptcy Court. Among other actions, in July
2010, certain holders of the Trust Securities commenced an adver-
sary proceeding in the Bankruptcy Court against JPMorgan Chase,
WMI, and other entities seeking, among other relief, a declaratory
judgment that WMI and JPMorgan Chase do not have any right,
title or interest in the Trust Securities. In early January 2011, the
Bankruptcy Court granted summary judgment to JPMorgan Chase
and denied summary judgment to the plaintiffs in the Trust Securi-
ties adversary proceeding.
The Bankruptcy Court considered confirmation of the Plan, including
the Global Settlement Agreement, in hearings in early December
2010. In early January 2011, the Bankruptcy Court issued an opinion
in which it concluded that the Global Settlement Agreement is fair
and reasonable, but that the Plan cannot be confirmed until the
parties correct certain deficiencies, which include the scope of re-
leases. None of these deficiencies relate to the Disputed Assets. The
Equity Committee has filed a petition seeking a direct appeal to the
United States Court of Appeals for the Third Circuit from so much of
the Bankruptcy Court’s ruling that found the settlement to be fair and
reasonable. A revised Plan was filed with the Bankruptcy Court in
February 2011, and the Bankruptcy Court has scheduled a hearing for
May 2, 2011. If the Global Settlement is effected and the Plan is

JPMorgan Chase & Co./2010 Annual Report 289
confirmed, the Firm currently estimates it will not incur additional
obligations beyond those already reflected in its liabilities for the
numerous disputes covered by the Global Settlement.
Other proceedings related to Washington Mutual’s failure are
pending before the United States District Court for the District of
Columbia include a lawsuit brought by Deutsche Bank National
Trust Company, initially against the FDIC, asserting an estimated $6
billion to $10 billion in damages based upon alleged breach of
various mortgage securitization agreements and alleged violation of
certain representations and warranties given by certain WMI sub-
sidiaries in connection with those securitization agreements.
Deutsche Bank filed an amended complaint in August 2010, adding
JPMorgan Chase Bank, N.A. as a party. The amended complaint
includes assertions that JPMorgan Chase may have assumed liabili-
ties relating to the mortgage securitization agreements. In Novem-
ber 2010, JPMorgan Chase and the FDIC moved to dismiss the
complaint. JPMorgan Chase also moved for a partial summary
judgment holding that the FDIC retained liability for Deutsche
Bank’s claims.
In addition, JPMorgan Chase was sued in an action originally filed
in State District Court in Texas (the “Texas Action”) by certain
holders of WMI common stock and debt of WMI and Washington
Mutual Bank who seek unspecified damages alleging that JPMor-
gan Chase acquired substantially all of the assets of Washington
Mutual Bank from the FDIC at an allegedly too-low price. The Texas
Action was transferred to the United States District Court for the
District of Columbia, which ultimately granted JPMorgan Chase’s
and the FDIC’s motions to dismiss the complaint. Plaintiffs have
appealed this dismissal to the United States Court of Appeals for
the District of Columbia Circuit. Oral argument is currently sched-
uled for April 5, 2011.
* * *
In addition to the various legal proceedings discussed above, JPMor-
gan Chase and its subsidiaries are named as defendants or otherwise
involved in a substantial number of other legal proceedings. The Firm
believes it has meritorious defenses to the claims asserted against it
in its currently outstanding legal proceedings and it intends to defend
itself vigorously in all such matters. Additional legal proceedings may
be initiated from time to time in the future.
The Firm has established reserves for several hundred of its cur-
rently outstanding legal proceedings. The Firm accrues for potential
liability arising from such proceedings when it is probable that such
liability has been incurred and the amount of the loss can be rea-
sonably estimated. The Firm evaluates its outstanding legal pro-
ceedings each quarter to assess its litigation reserves, and makes
adjustments in such reserves, upwards or downwards, as appropri-
ate, based on management’s best judgment after consultation with
counsel. During the years ended December 31, 2010 and 2009, the
Firm incurred $7.4 billion and $161 million, respectively, of litiga-
tion expense. During the year ended December 31, 2008, the Firm
recorded a net benefit of $781 million to litigation expense. There
is no assurance that the Firm’s litigation reserves will not need to
be adjusted in the future.
In view of the inherent difficulty of predicting the outcome of legal
proceedings, particularly where the claimants seek very large or
indeterminate damages, or where the matters present novel legal
theories, involve a large number of parties or are in early stages of
discovery, the Firm cannot state with confidence what the eventual
outcome of the currently pending matters will be, what the timing
of the ultimate resolution of these pending matters will be or what
the eventual loss, fines, penalties or impact related to each cur-
rently pending matter may be. JPMorgan Chase believes, based
upon its current knowledge, after consultation with counsel and
after taking into account its current litigation reserves, that the
legal proceedings currently pending against it should not have a
material adverse effect on the Firm’s consolidated financial condi-
tion. The Firm notes, however, that in light of the uncertainties
involved in such proceedings, there is no assurance the ultimate
resolution of these matters will not significantly exceed the reserves
currently accrued by the Firm; as a result, the outcome of a particu-
lar matter may be material to JPMorgan Chase’s operating results
for a particular period, depending on, among other factors, the size
of the loss or liability imposed and the level of JPMorgan Chase’s
income for that period.
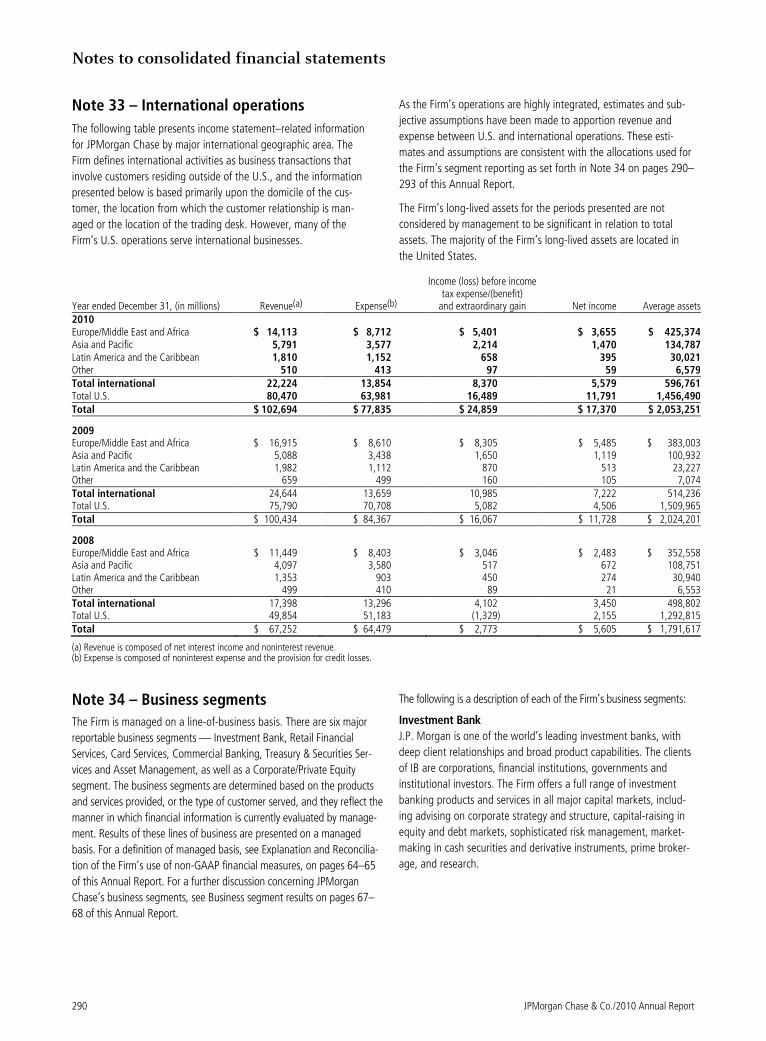
Notes to consolidated financial statements
290 JPMorgan Chase & Co./2010 Annual Report
Note 33 – International operations
The following table presents income statement–related information
for JPMorgan Chase by major international geographic area. The
Firm defines international activities as business transactions that
involve customers residing outside of the U.S., and the information
presented below is based primarily upon the domicile of the cus-
tomer, the location from which the customer relationship is man-
aged or the location of the trading desk. However, many of the
Firm’s U.S. operations serve international businesses.
As the Firm’s operations are highly integrated, estimates and sub-
jective assumptions have been made to apportion revenue and
expense between U.S. and international operations. These esti-
mates and assumptions are consistent with the allocations used for
the Firm’s segment reporting as set forth in Note 34 on pages 290–
293 of this Annual Report.
The Firm’s long-lived assets for the periods presented are not
considered by management to be significant in relation to total
assets. The majority of the Firm’s long-lived assets are located in
the United States.
Year ended December 31, (in millions) Revenue(a) Expense(b)
Income (loss) before income tax expense/(benefit)
and extraordinary gain Net income Average assets 2010 Europe/Middle East and Africa $ 14,113 $ 8,712 $ 5,401 $ 3,655 $ 425,374 Asia and Pacific 5,791 3,577 2,214 1,470 134,787 Latin America and the Caribbean 1,810 1,152 658 395 30,021 Other 510 413 97 59 6,579 Total international 22,224 13,854 8,370 5,579 596,761 Total U.S. 80,470 63,981 16,489 11,791 1,456,490 Total $ 102,694 $ 77,835 $ 24,859 $ 17,370 $ 2,053,251
2009 Europe/Middle East and Africa $ 16,915 $ 8,610 $ 8,305 $ 5,485 $ 383,003 Asia and Pacific 5,088 3,438 1,650 1,119 100,932 Latin America and the Caribbean 1,982 1,112 870 513 23,227 Other 659 499 160 105 7,074 Total international 24,644 13,659 10,985 7,222 514,236 Total U.S. 75,790 70,708 5,082 4,506 1,509,965 Total $ 100,434 $ 84,367 $ 16,067 $ 11,728 $ 2,024,201
2008 Europe/Middle East and Africa $ 11,449 $ 8,403 $ 3,046 $ 2,483 $ 352,558 Asia and Pacific 4,097 3,580 517 672 108,751 Latin America and the Caribbean 1,353 903 450 274 30,940 Other 499 410 89 21 6,553 Total international 17,398 13,296 4,102 3,450 498,802 Total U.S. 49,854 51,183 (1,329) 2,155 1,292,815 Total $ 67,252 $ 64,479 $ 2,773 $ 5,605 $ 1,791,617
(a) Revenue is composed of net interest income and noninterest revenue. (b) Expense is composed of noninterest expense and the provision for credit losses.
Note 34 – Business segments
The Firm is managed on a line-of-business basis. There are six major
reportable business segments — Investment Bank, Retail Financial
Services, Card Services, Commercial Banking, Treasury & Securities Ser-
vices and Asset Management, as well as a Corporate/Private Equity
segment. The business segments are determined based on the products
and services provided, or the type of customer served, and they reflect the
manner in which financial information is currently evaluated by manage-
ment. Results of these lines of business are presented on a managed
basis. For a definition of managed basis, see Explanation and Reconcilia-
tion of the Firm’s use of non-GAAP financial measures, on pages 64–65
of this Annual Report. For a further discussion concerning JPMorgan
Chase’s business segments, see Business segment results on pages 67–
68 of this Annual Report.
The following is a description of each of the Firm’s business segments:
Investment Bank
J.P. Morgan is one of the world’s leading investment banks, with
deep client relationships and broad product capabilities. The clients
of IB are corporations, financial institutions, governments and
institutional investors. The Firm offers a full range of investment
banking products and services in all major capital markets, includ-
ing advising on corporate strategy and structure, capital-raising in
equity and debt markets, sophisticated risk management, market-
making in cash securities and derivative instruments, prime broker-
age, and research.
JPMorgan Chase & Co./2010 Annual Report 291
Retail Financial Services
RFS serves consumers and businesses through personal service at
bank branches and through ATMs, online banking and telephone
banking, as well as through auto dealerships and school financial-
aid offices. Customers can use more than 5,200 bank branches
(third-largest nationally) and 16,100 ATMs (second-largest nation-
ally), as well as online and mobile banking around the clock. More
than 28,900 branch salespeople assist customers with checking
and savings accounts, mortgages, home equity and business loans,
and investments across the 23-state footprint from New York and
Florida to California. Consumers also can obtain loans through
more than 16,200 auto dealerships and 2,200 schools and universi-
ties nationwide.
Card Services
CS is one of the nation’s largest credit card issuers, with over $137
billion in loans and over 90 million open accounts. Customers used
Chase cards to meet $313 billion of their spending needs in 2010.
Through its merchant acquiring business, Chase Paymentech Solu-
tions, CS is a global leader in payment processing and merchant
acquiring.
Commercial Banking
CB delivers extensive industry knowledge, local expertise and dedi-
cated service to nearly 24,000 clients nationally, including corpora-
tions, municipalities, financial institutions and not-for-profit entities
with annual revenue generally ranging from $10 million to $2 billion,
and nearly 35,000 real estate investors/owners. CB partners with the
Firm’s other businesses to provide comprehensive solutions, including
lending, treasury services, investment banking and asset manage-
ment to meet its clients’ domestic and international financial needs.
Treasury & Securities Services
TSS is a global leader in transaction, investment and information
services. TSS is one of the world’s largest cash management pro-
viders and a leading global custodian. Treasury Services (“TS”)
provides cash management, trade, wholesale card and liquidity
products and services to small- and mid-sized companies, multina-
tional corporations, financial institutions and government entities.
TS partners with IB, CB, RFS and AM businesses to serve clients
firmwide. Certain TS revenue is included in other segments’ results.
Worldwide Securities Services holds, values, clears and services
securities, cash and alternative investments for investors and bro-
ker-dealers, and manages depositary receipt programs globally.
Asset Management
AM, with assets under supervision of $1.8 trillion, is a global leader in
investment and wealth management. AM clients include institutions,
retail investors and high-net-worth individuals in every major market
throughout the world. AM offers global investment management in
equities, fixed income, real estate, hedge funds, private equity and
liquidity products, including money-market instruments and bank
deposits. AM also provides trust and estate, banking and brokerage
services to high-net-worth clients, and retirement services for corpora-
tions and individuals. The majority of AM’s client assets are in ac-
tively managed portfolios.
Corporate/Private Equity
The Corporate/Private Equity sector comprises Private Equity,
Treasury, the Chief Investment Office, corporate staff units and
expense that is centrally managed. Treasury and the Chief Invest-
ment Office manage capital, liquidity, and structural risks of the
Firm. The corporate staff units include Central Technology and
Operations, Internal Audit, Executive Office, Finance, Human Re-
sources, Marketing & Communications, Legal & Compliance, Cor-
porate Real Estate and General Services, Risk Management,
Corporate Responsibility and Strategy & Development. Other cen-
trally managed expense includes the Firm’s occupancy and pension-
related expense, net of allocations to the business.
Effective January 1, 2010, the Firm enhanced its line-of-business equity
framework to better align equity assigned to each line of business with
changes anticipated to occur in the business and in the competitive and
regulatory landscape. The lines of business are now capitalized based
on the Tier 1 common standard, rather than the Tier 1 capital standard.
Line-of-business equity increased during the second quarter of 2008 in
IB and AM due to the Bear Stearns merger and for AM, the purchase of
the additional equity interest in Highbridge. At the end of the third
quarter of 2008, equity was increased for each line of business with a
view toward the future implementation of the new Basel II capital
rules. In addition, equity allocated to RFS, CS and CB was increased as
a result of the Washington Mutual transaction.
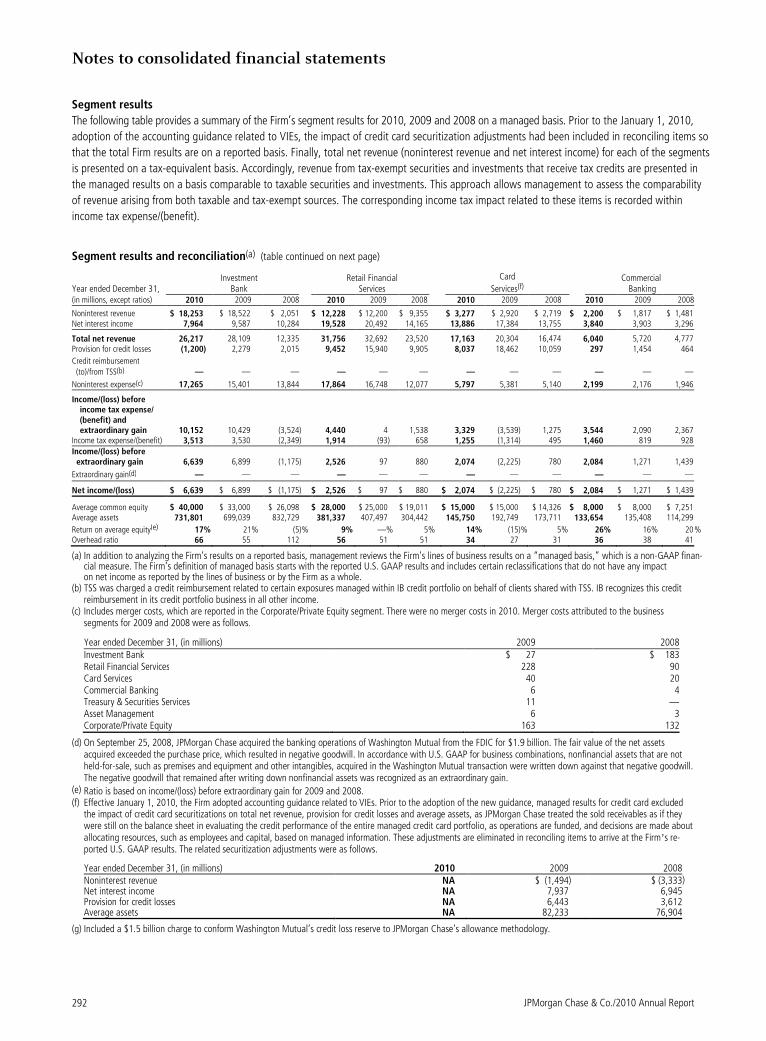
Notes to consolidated financial statements
JPMorgan Chase & Co./2010 Annual Report 292
Segment results
The following table provides a summary of the Firm’s segment results for 2010, 2009 and 2008 on a managed basis. Prior to the January 1, 2010,
adoption of the accounting guidance related to VIEs, the impact of credit card securitization adjustments had been included in reconciling items so
that the total Firm results are on a reported basis. Finally, total net revenue (noninterest revenue and net interest income) for each of the segments
is presented on a tax-equivalent basis. Accordingly, revenue from tax-exempt securities and investments that receive tax credits are presented in
the managed results on a basis comparable to taxable securities and investments. This approach allows management to assess the comparability
of revenue arising from both taxable and tax-exempt sources. The corresponding income tax impact related to these items is recorded within
income tax expense/(benefit).
Segment results and reconciliation(a) (table continued on next page)
Year ended December 31, Investment
Bank Retail Financial
Services
Card
Services(f) Commercial
Banking (in millions, except ratios) 2010 2009 2008 2010 2009 2008 2010 2009 2008 2010 2009 2008
Noninterest revenue $ 18,253 $ 18,522 $ 2,051 $ 12,228 $ 12,200 $ 9,355 $ 3,277 $ 2,920 $ 2,719 $ 2,200 $ 1,817 $ 1,481 Net interest income 7,964 9,587 10,284 19,528 20,492 14,165 13,886 17,384 13,755 3,840 3,903 3,296
Total net revenue 26,217 28,109 12,335 31,756 32,692 23,520 17,163 20,304 16,474 6,040 5,720 4,777 Provision for credit losses (1,200) 2,279 2,015 9,452 15,940 9,905 8,037 18,462 10,059 297 1,454 464
Credit reimbursement
(to)/from TSS(b) — — — — — — — — — — — —
Noninterest expense(c) 17,265 15,401 13,844 17,864 16,748 12,077 5,797 5,381 5,140 2,199 2,176 1,946
Income/(loss) before income tax expense/ (benefit) and extraordinary gain 10,152 10,429 (3,524) 4,440 4 1,538 3,329 (3,539) 1,275 3,544 2,090 2,367
Income tax expense/(benefit) 3,513 3,530 (2,349) 1,914 (93) 658 1,255 (1,314) 495 1,460 819 928
Income/(loss) before extraordinary gain 6,639 6,899 (1,175) 2,526 97 880 2,074 (2,225) 780 2,084 1,271 1,439
Extraordinary gain(d) — — — — — — — — — — — —
Net income/(loss) $ 6,639 $ 6,899 $ (1,175) $ 2,526 $ 97 $ 880 $ 2,074 $ (2,225) $ 780 $ 2,084 $ 1,271 $ 1,439
Average common equity $ 40,000 $ 33,000 $ 26,098 $ 28,000 $ 25,000 $ 19,011 $ 15,000 $ 15,000 $ 14,326 $ 8,000 $ 8,000 $ 7,251 Average assets 731,801 699,039 832,729 381,337 407,497 304,442 145,750 192,749 173,711 133,654 135,408 114,299
Return on average equity(e) 17% 21% (5)% 9% —% 5% 14% (15)% 5% 26% 16% 20 % Overhead ratio 66 55 112 56 51 51 34 27 31 36 38 41
(a) In addition to analyzing the Firm’s results on a reported basis, management reviews the Firm’s lines of business results on a “managed basis,” which is a non-GAAP finan-cial measure. The Firm’s definition of managed basis starts with the reported U.S. GAAP results and includes certain reclassifications that do not have any impact on net income as reported by the lines of business or by the Firm as a whole.
(b) TSS was charged a credit reimbursement related to certain exposures managed within IB credit portfolio on behalf of clients shared with TSS. IB recognizes this credit reimbursement in its credit portfolio business in all other income.
(c) Includes merger costs, which are reported in the Corporate/Private Equity segment. There were no merger costs in 2010. Merger costs attributed to the business segments for 2009 and 2008 were as follows.
Year ended December 31, (in millions) 2009 2008 Investment Bank $ 27 $ 183 Retail Financial Services 228 90 Card Services 40 20 Commercial Banking 6 4 Treasury & Securities Services 11 — Asset Management 6 3 Corporate/Private Equity 163 132
(d) On September 25, 2008, JPMorgan Chase acquired the banking operations of Washington Mutual from the FDIC for $1.9 billion. The fair value of the net assets acquired exceeded the purchase price, which resulted in negative goodwill. In accordance with U.S. GAAP for business combinations, nonfinancial assets that are not held-for-sale, such as premises and equipment and other intangibles, acquired in the Washington Mutual transaction were written down against that negative goodwill. The negative goodwill that remained after writing down nonfinancial assets was recognized as an extraordinary gain.
(e) Ratio is based on income/(loss) before extraordinary gain for 2009 and 2008.
(f) Effective January 1, 2010, the Firm adopted accounting guidance related to VIEs. Prior to the adoption of the new guidance, managed results for credit card excluded the impact of credit card securitizations on total net revenue, provision for credit losses and average assets, as JPMorgan Chase treated the sold receivables as if they were still on the balance sheet in evaluating the credit performance of the entire managed credit card portfolio, as operations are funded, and decisions are made about allocating resources, such as employees and capital, based on managed information. These adjustments are eliminated in reconciling items to arrive at the Firm’s re-ported U.S. GAAP results. The related securitization adjustments were as follows.
Year ended December 31, (in millions) 2010 2009 2008 Noninterest revenue NA $ (1,494) $ (3,333) Net interest income NA 7,937 6,945 Provision for credit losses NA 6,443 3,612 Average assets NA 82,233 76,904
(g) Included a $1.5 billion charge to conform Washington Mutual’s credit loss reserve to JPMorgan Chase’s allowance methodology.
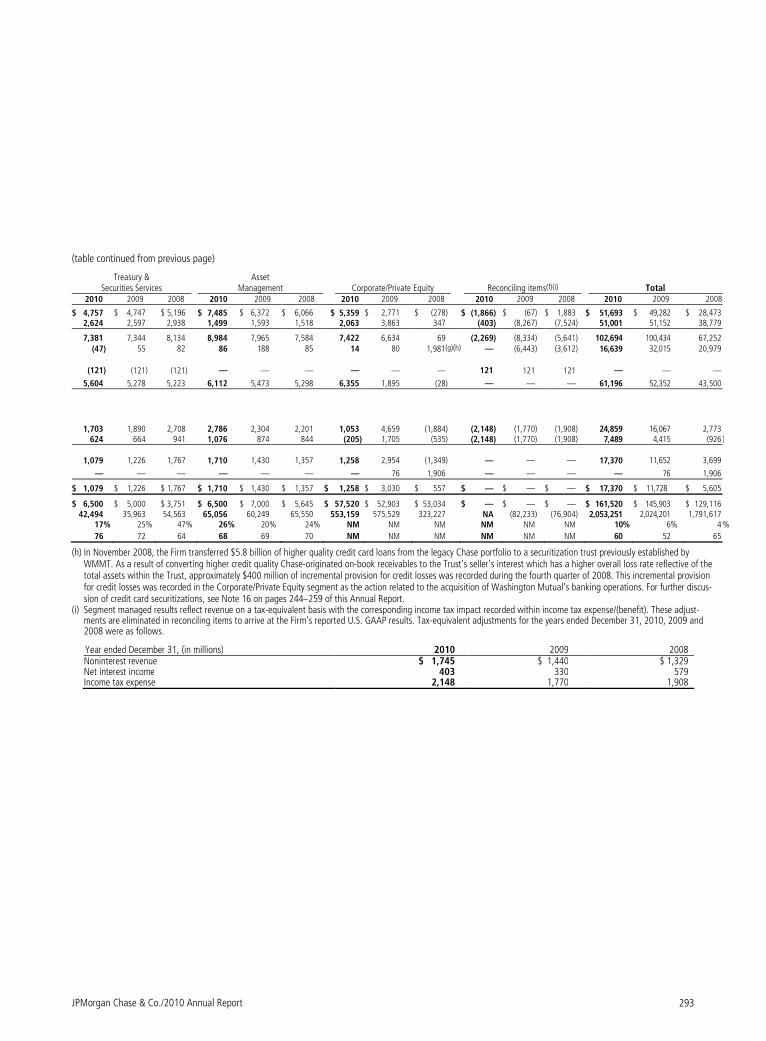
JPMorgan Chase & Co./2010 Annual Report 293
(table continued from previous page)
Treasury & Securities Services
Asset Management Corporate/Private Equity Reconciling items(f)(i) Total
2010 2009 2008 2010 2009 2008 2010 2009 2008 2010 2009 2008 2010 2009 2008
$ 4,757 $ 4,747 $ 5,196 $ 7,485 $ 6,372 $ 6,066 $ 5,359 $ 2,771 $ (278) $ (1,866) $ (67) $ 1,883 $ 51,693 $ 49,282 $ 28,473 2,624 2,597 2,938 1,499 1,593 1,518 2,063 3,863 347 (403) (8,267) (7,524) 51,001 51,152 38,779
7,381 7,344 8,134 8,984 7,965 7,584 7,422 6,634 69 (2,269) (8,334) (5,641) 102,694 100,434 67,252
(47) 55 82 86 188 85 14 80 1,981(g)(h) — (6,443) (3,612) 16,639 32,015 20,979
(121) (121) (121) — — — — — — 121 121 121 — — —
5,604 5,278 5,223 6,112 5,473 5,298 6,355 1,895 (28) — — — 61,196 52,352 43,500
1,703 1,890 2,708 2,786 2,304 2,201 1,053 4,659 (1,884) (2,148) (1,770) (1,908) 24,859 16,067 2,773 624 664 941 1,076 874 844 (205) 1,705 (535) (2,148) (1,770) (1,908) 7,489 4,415 (926 )
1,079 1,226 1,767 1,710 1,430 1,357 1,258 2,954 (1,349) — — — 17,370 11,652 3,699
— — — — — — — 76 1,906 — — — — 76 1,906
$ 1,079 $ 1,226 $ 1,767 $ 1,710 $ 1,430 $ 1,357 $ 1,258 $ 3,030 $ 557 $ — $ — $ — $ 17,370 $ 11,728 $ 5,605
$ 6,500 $ 5,000 $ 3,751 $ 6,500 $ 7,000 $ 5,645 $ 57,520 $ 52,903 $ 53,034 $ — $ — $ — $ 161,520 $ 145,903 $ 129,116 42,494 35,963 54,563 65,056 60,249 65,550 553,159 575,529 323,227 NA (82,233) (76,904) 2,053,251 2,024,201 1,791,617
17% 25% 47% 26% 20% 24% NM NM NM NM NM NM 10% 6% 4 %
76 72 64 68 69 70 NM NM NM NM NM NM 60 52 65
(h) In November 2008, the Firm transferred $5.8 billion of higher quality credit card loans from the legacy Chase portfolio to a securitization trust previously established by WMMT. As a result of converting higher credit quality Chase-originated on-book receivables to the Trust’s seller’s interest which has a higher overall loss rate reflective of the total assets within the Trust, approximately $400 million of incremental provision for credit losses was recorded during the fourth quarter of 2008. This incremental provision for credit losses was recorded in the Corporate/Private Equity segment as the action related to the acquisition of Washington Mutual’s banking operations. For further discus-sion of credit card securitizations, see Note 16 on pages 244–259 of this Annual Report.
(i) Segment managed results reflect revenue on a tax-equivalent basis with the corresponding income tax impact recorded within income tax expense/(benefit). These adjust-ments are eliminated in reconciling items to arrive at the Firm’s reported U.S. GAAP results. Tax-equivalent adjustments for the years ended December 31, 2010, 2009 and 2008 were as follows.
Year ended December 31, (in millions) 2010 2009 2008 Noninterest revenue $ 1,745 $ 1,440 $ 1,329 Net interest income 403 330 579 Income tax expense 2,148 1,770 1,908
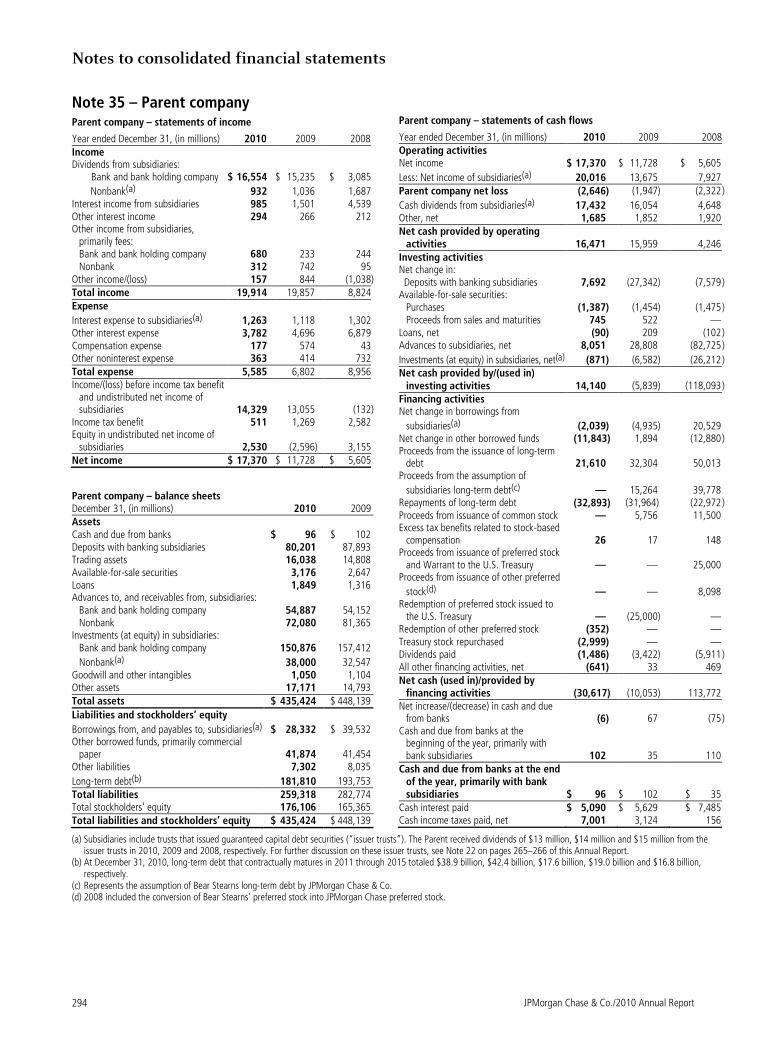
Notes to consolidated financial statements
JPMorgan Chase & Co./2010 Annual Report 294
Note 35 – Parent company Parent company – statements of income
Year ended December 31, (in millions) 2010 2009 2008 Income Dividends from subsidiaries: Bank and bank holding company $ 16,554 $ 15,235 $ 3,085
Nonbank(a) 932 1,036 1,687 Interest income from subsidiaries 985 1,501 4,539 Other interest income 294 266 212 Other income from subsidiaries,
primarily fees: Bank and bank holding company 680 233 244 Nonbank 312 742 95 Other income/(loss) 157 844 (1,038) Total income 19,914 19,857 8,824 Expense
Interest expense to subsidiaries(a) 1,263 1,118 1,302 Other interest expense 3,782 4,696 6,879 Compensation expense 177 574 43 Other noninterest expense 363 414 732 Total expense 5,585 6,802 8,956 Income/(loss) before income tax benefit
and undistributed net income of subsidiaries 14,329
13,055 (132))
Income tax benefit 511 1,269 2,582 Equity in undistributed net income of
subsidiaries 2,530 (2,596) 3,155 Net income $ 17,370 $ 11,728 $ 5,605
Parent company – balance sheets December 31, (in millions) 2010 2009 Assets Cash and due from banks $ 96 $ 102 Deposits with banking subsidiaries 80,201 87,893 Trading assets 16,038 14,808 Available-for-sale securities 3,176 2,647 Loans 1,849 1,316 Advances to, and receivables from, subsidiaries:
Bank and bank holding company 54,887 54,152 Nonbank 72,080 81,365
Investments (at equity) in subsidiaries: Bank and bank holding company 150,876 157,412
Nonbank(a) 38,000 32,547 Goodwill and other intangibles 1,050 1,104 Other assets 17,171 14,793 Total assets $ 435,424 $ 448,139
Liabilities and stockholders’ equity
Borrowings from, and payables to, subsidiaries(a) $ 28,332 $ 39,532 Other borrowed funds, primarily commercial
paper 41,874 41,454 Other liabilities 7,302 8,035
Long-term debt(b) 181,810 193,753 Total liabilities 259,318 282,774 Total stockholders’ equity 176,106 165,365 Total liabilities and stockholders’ equity $ 435,424 $ 448,139
Parent company – statements of cash flows
Year ended December 31, (in millions) 2010 2009 2008 Operating activities Net income $ 17,370 $ 11,728 $ 5,605
Less: Net income of subsidiaries(a) 20,016 13,675 7,927 Parent company net loss (2,646) (1,947) (2,322 )
Cash dividends from subsidiaries(a) 17,432 16,054 4,648 Other, net 1,685 1,852 1,920 Net cash provided by operating
activities 16,471 15,959 4,246 Investing activities Net change in: Deposits with banking subsidiaries 7,692 (27,342) (7,579 ) Available-for-sale securities:
Purchases (1,387) (1,454) (1,475 ) Proceeds from sales and maturities 745 522 —
Loans, net (90) 209 (102 ) Advances to subsidiaries, net 8,051 28,808 (82,725 )
Investments (at equity) in subsidiaries, net(a) (871) (6,582) (26,212 ) Net cash provided by/(used in)
investing activities 14,140 (5,839) (118,093 ) Financing activities Net change in borrowings from
subsidiaries(a) (2,039) (4,935) 20,529 Net change in other borrowed funds (11,843) 1,894 (12,880 ) Proceeds from the issuance of long-term
debt 21,610 32,304 50,013 Proceeds from the assumption of
subsidiaries long-term debt(c) — 15,264 39,778 Repayments of long-term debt (32,893) (31,964) (22,972 ) Proceeds from issuance of common stock — 5,756 11,500 Excess tax benefits related to stock-based
compensation 26 17 148 Proceeds from issuance of preferred stock
and Warrant to the U.S. Treasury — — 25,000 Proceeds from issuance of other preferred
stock(d) — — 8,098 Redemption of preferred stock issued to
the U.S. Treasury — (25,000) — Redemption of other preferred stock (352) — — Treasury stock repurchased (2,999) — — Dividends paid (1,486) (3,422) (5,911 ) All other financing activities, net (641) 33 469 Net cash (used in)/provided by
financing activities (30,617) (10,053) 113,772 Net increase/(decrease) in cash and due
from banks (6) 67 (75 ) Cash and due from banks at the
beginning of the year, primarily with bank subsidiaries 102 35 110
Cash and due from banks at the end of the year, primarily with bank subsidiaries $ 96 $ 102 $ 35
Cash interest paid $ 5,090 $ 5,629 $ 7,485 Cash income taxes paid, net 7,001 3,124 156
(a) Subsidiaries include trusts that issued guaranteed capital debt securities (“issuer trusts”). The Parent received dividends of $13 million, $14 million and $15 million from the issuer trusts in 2010, 2009 and 2008, respectively. For further discussion on these issuer trusts, see Note 22 on pages 265–266 of this Annual Report.
(b) At December 31, 2010, long-term debt that contractually matures in 2011 through 2015 totaled $38.9 billion, $42.4 billion, $17.6 billion, $19.0 billion and $16.8 billion, respectively.
(c) Represents the assumption of Bear Stearns long-term debt by JPMorgan Chase & Co. (d) 2008 included the conversion of Bear Stearns’ preferred stock into JPMorgan Chase preferred stock.
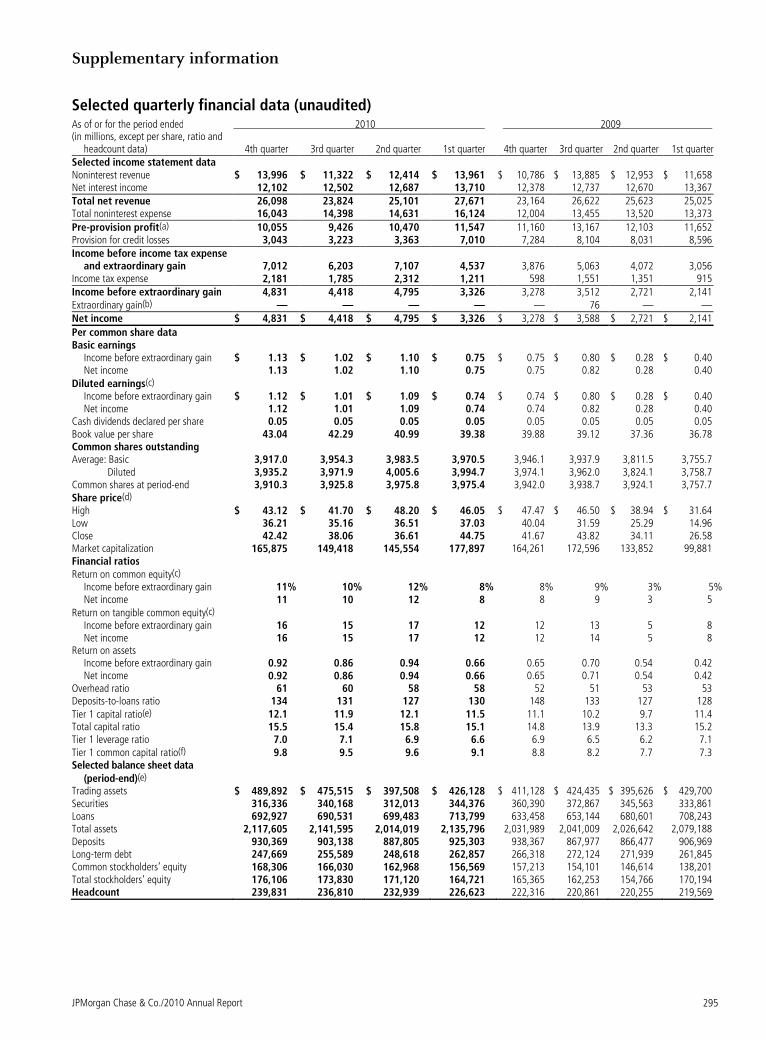
Supplementary information
JPMorgan Chase & Co./2010 Annual Report 295
Selected quarterly financial data (unaudited) As of or for the period ended 2010 2009 (in millions, except per share, ratio and
headcount data) 4th quarter 3rd quarter 2nd quarter 1st quarter 4th quarter 3rd quarter 2nd quarter 1st quarterSelected income statement data Noninterest revenue $ 13,996 $ 11,322 $ 12,414 $ 13,961 $ 10,786 $ 13,885 $ 12,953 $ 11,658 Net interest income 12,102 12,502 12,687 13,710 12,378 12,737 12,670 13,367 Total net revenue 26,098 23,824 25,101 27,671 23,164 26,622 25,623 25,025 Total noninterest expense 16,043 14,398 14,631 16,124 12,004 13,455 13,520 13,373
Pre-provision profit(a) 10,055 9,426 10,470 11,547 11,160 13,167 12,103 11,652 Provision for credit losses 3,043 3,223 3,363 7,010 7,284 8,104 8,031 8,596 Income before income tax expense
and extraordinary gain 7,012 6,203 7,107 4,537 3,876 5,063 4,072 3,056 Income tax expense 2,181 1,785 2,312 1,211 598 1,551 1,351 915 Income before extraordinary gain 4,831 4,418 4,795 3,326 3,278 3,512 2,721 2,141 Extraordinary gain(b) — — — — — 76 — — Net income $ 4,831 $ 4,418 $ 4,795 $ 3,326 $ 3,278 $ 3,588 $ 2,721 $ 2,141
Per common share data Basic earnings
Income before extraordinary gain $ 1.13 $ 1.02 $ 1.10 $ 0.75 $ 0.75 $ 0.80 $ 0.28 $ 0.40 Net income 1.13 1.02 1.10 0.75 0.75 0.82 0.28 0.40
Diluted earnings(c) Income before extraordinary gain $ 1.12 $ 1.01 $ 1.09 $ 0.74 $ 0.74 $ 0.80 $ 0.28 $ 0.40 Net income 1.12 1.01 1.09 0.74 0.74 0.82 0.28 0.40
Cash dividends declared per share 0.05 0.05 0.05 0.05 0.05 0.05 0.05 0.05 Book value per share 43.04 42.29 40.99 39.38 39.88 39.12 37.36 36.78 Common shares outstanding Average: Basic 3,917.0 3,954.3 3,983.5 3,970.5 3,946.1 3,937.9 3,811.5 3,755.7 Diluted 3,935.2 3,971.9 4,005.6 3,994.7 3,974.1 3,962.0 3,824.1 3,758.7 Common shares at period-end 3,910.3 3,925.8 3,975.8 3,975.4 3,942.0 3,938.7 3,924.1 3,757.7 Share price(d) High $ 43.12 $ 41.70 $ 48.20 $ 46.05 $ 47.47 $ 46.50 $ 38.94 $ 31.64 Low 36.21 35.16 36.51 37.03 40.04 31.59 25.29 14.96 Close 42.42 38.06 36.61 44.75 41.67 43.82 34.11 26.58 Market capitalization 165,875 149,418 145,554 177,897 164,261 172,596 133,852 99,881 Financial ratios Return on common equity(c)
Income before extraordinary gain 11% 10% 12% 8% 8% 9% 3% 5% Net income 11 10 12 8 8 9 3 5
Return on tangible common equity(c) Income before extraordinary gain 16 15 17 12 12 13 5 8 Net income 16 15 17 12 12 14 5 8
Return on assets Income before extraordinary gain 0.92 0.86 0.94 0.66 0.65 0.70 0.54 0.42 Net income 0.92 0.86 0.94 0.66 0.65 0.71 0.54 0.42
Overhead ratio 61 60 58 58 52 51 53 53 Deposits-to-loans ratio 134 131 127 130 148 133 127 128 Tier 1 capital ratio(e) 12.1 11.9 12.1 11.5 11.1 10.2 9.7 11.4 Total capital ratio 15.5 15.4 15.8 15.1 14.8 13.9 13.3 15.2 Tier 1 leverage ratio 7.0 7.1 6.9 6.6 6.9 6.5 6.2 7.1 Tier 1 common capital ratio(f) 9.8 9.5 9.6 9.1 8.8 8.2 7.7 7.3 Selected balance sheet data
(period-end)(e) Trading assets $ 489,892 $ 475,515 $ 397,508 $ 426,128 $ 411,128 $ 424,435 $ 395,626 $ 429,700 Securities 316,336 340,168 312,013 344,376 360,390 372,867 345,563 333,861 Loans 692,927 690,531 699,483 713,799 633,458 653,144 680,601 708,243 Total assets 2,117,605 2,141,595 2,014,019 2,135,796 2,031,989 2,041,009 2,026,642 2,079,188 Deposits 930,369 903,138 887,805 925,303 938,367 867,977 866,477 906,969 Long-term debt 247,669 255,589 248,618 262,857 266,318 272,124 271,939 261,845 Common stockholders’ equity 168,306 166,030 162,968 156,569 157,213 154,101 146,614 138,201 Total stockholders’ equity 176,106 173,830 171,120 164,721 165,365 162,253 154,766 170,194 Headcount 239,831 236,810 232,939 226,623 222,316 220,861 220,255 219,569
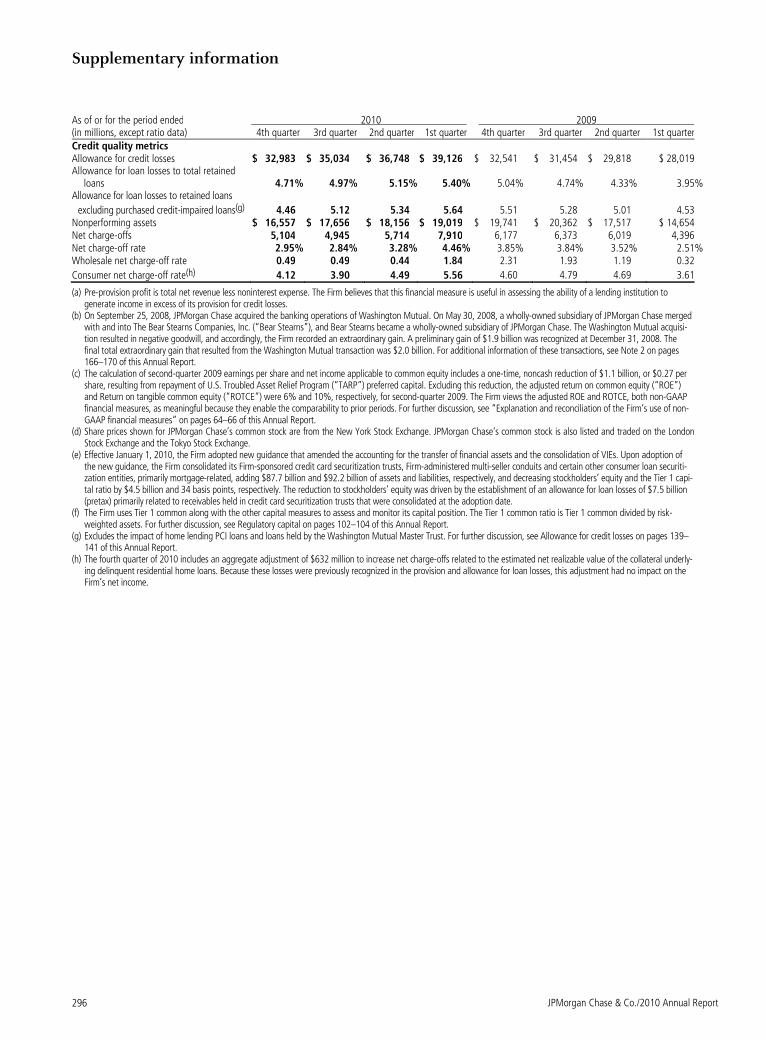
Supplementary information
JPMorgan Chase & Co./2010 Annual Report 296
As of or for the period ended 2010 2009 (in millions, except ratio data) 4th quarter 3rd quarter 2nd quarter 1st quarter 4th quarter 3rd quarter 2nd quarter 1st quarterCredit quality metrics Allowance for credit losses $ 32,983 $ 35,034 $ 36,748 $ 39,126 $ 32,541 $ 31,454 $ 29,818 $ 28,019 Allowance for loan losses to total retained
loans 4.71% 4.97% 5.15% 5.40% 5.04% 4.74% 4.33% 3.95% Allowance for loan losses to retained loans
excluding purchased credit-impaired loans(g) 4.46 5.12 5.34 5.64 5.51 5.28 5.01 4.53 Nonperforming assets $ 16,557 $ 17,656 $ 18,156 $ 19,019 $ 19,741 $ 20,362 $ 17,517 $ 14,654Net charge-offs 5,104 4,945 5,714 7,910 6,177 6,373 6,019 4,396 Net charge-off rate 2.95% 2.84% 3.28% 4.46% 3.85% 3.84% 3.52% 2.51% Wholesale net charge-off rate 0.49 0.49 0.44 1.84 2.31 1.93 1.19 0.32
Consumer net charge-off rate(h) 4.12 3.90 4.49 5.56 4.60 4.79 4.69 3.61
(a) Pre-provision profit is total net revenue less noninterest expense. The Firm believes that this financial measure is useful in assessing the ability of a lending institution to generate income in excess of its provision for credit losses.
(b) On September 25, 2008, JPMorgan Chase acquired the banking operations of Washington Mutual. On May 30, 2008, a wholly-owned subsidiary of JPMorgan Chase merged with and into The Bear Stearns Companies, Inc. (“Bear Stearns”), and Bear Stearns became a wholly-owned subsidiary of JPMorgan Chase. The Washington Mutual acquisi-tion resulted in negative goodwill, and accordingly, the Firm recorded an extraordinary gain. A preliminary gain of $1.9 billion was recognized at December 31, 2008. The final total extraordinary gain that resulted from the Washington Mutual transaction was $2.0 billion. For additional information of these transactions, see Note 2 on pages 166–170 of this Annual Report.
(c) The calculation of second-quarter 2009 earnings per share and net income applicable to common equity includes a one-time, noncash reduction of $1.1 billion, or $0.27 per share, resulting from repayment of U.S. Troubled Asset Relief Program (“TARP”) preferred capital. Excluding this reduction, the adjusted return on common equity (“ROE”) and Return on tangible common equity (“ROTCE”) were 6% and 10%, respectively, for second-quarter 2009. The Firm views the adjusted ROE and ROTCE, both non-GAAP financial measures, as meaningful because they enable the comparability to prior periods. For further discussion, see “Explanation and reconciliation of the Firm’s use of non-GAAP financial measures” on pages 64–66 of this Annual Report.
(d) Share prices shown for JPMorgan Chase’s common stock are from the New York Stock Exchange. JPMorgan Chase’s common stock is also listed and traded on the London Stock Exchange and the Tokyo Stock Exchange.
(e) Effective January 1, 2010, the Firm adopted new guidance that amended the accounting for the transfer of financial assets and the consolidation of VIEs. Upon adoption of the new guidance, the Firm consolidated its Firm-sponsored credit card securitization trusts, Firm-administered multi-seller conduits and certain other consumer loan securiti-zation entities, primarily mortgage-related, adding $87.7 billion and $92.2 billion of assets and liabilities, respectively, and decreasing stockholders’ equity and the Tier 1 capi-tal ratio by $4.5 billion and 34 basis points, respectively. The reduction to stockholders’ equity was driven by the establishment of an allowance for loan losses of $7.5 billion (pretax) primarily related to receivables held in credit card securitization trusts that were consolidated at the adoption date.
(f) The Firm uses Tier 1 common along with the other capital measures to assess and monitor its capital position. The Tier 1 common ratio is Tier 1 common divided by risk-weighted assets. For further discussion, see Regulatory capital on pages 102–104 of this Annual Report.
(g) Excludes the impact of home lending PCI loans and loans held by the Washington Mutual Master Trust. For further discussion, see Allowance for credit losses on pages 139–141 of this Annual Report.
(h) The fourth quarter of 2010 includes an aggregate adjustment of $632 million to increase net charge-offs related to the estimated net realizable value of the collateral underly-ing delinquent residential home loans. Because these losses were previously recognized in the provision and allowance for loan losses, this adjustment had no impact on the Firm’s net income.
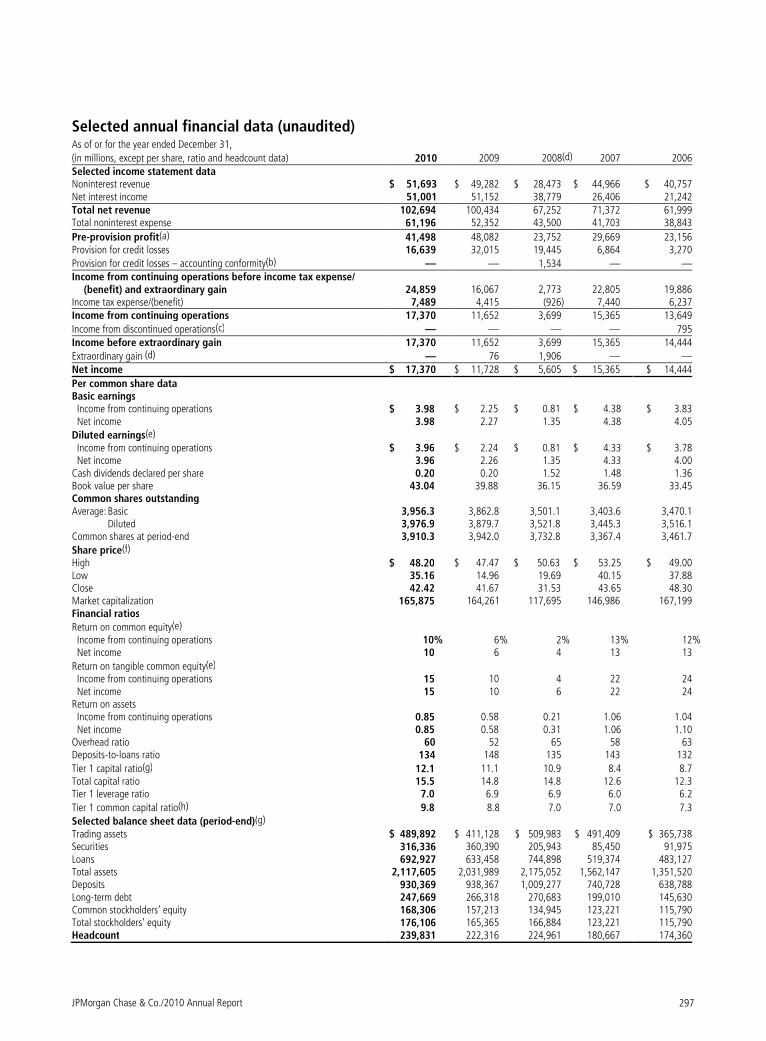
JPMorgan Chase & Co./2010 Annual Report 297
Selected annual financial data (unaudited)
As of or for the year ended December 31,
(in millions, except per share, ratio and headcount data) 2010 2009 2008(d) 2007 2006 Selected income statement data Noninterest revenue $ 51,693 $ 49,282 $ 28,473 $ 44,966 $ 40,757Net interest income 51,001 51,152 38,779 26,406 21,242Total net revenue 102,694 100,434 67,252 71,372 61,999Total noninterest expense 61,196 52,352 43,500 41,703 38,843
Pre-provision profit(a) 41,498 48,082 23,752 29,669 23,156Provision for credit losses 16,639 32,015 19,445 6,864 3,270
Provision for credit losses – accounting conformity(b) — — 1,534 — —Income from continuing operations before income tax expense/
(benefit) and extraordinary gain 24,859 16,067 2,773 22,805 19,886Income tax expense/(benefit) 7,489 4,415 (926) 7,440 6,237Income from continuing operations 17,370 11,652 3,699 15,365 13,649
Income from discontinued operations(c) — — — — 795Income before extraordinary gain 17,370 11,652 3,699 15,365 14,444
Extraordinary gain (d) — 76 1,906 — —Net income $ 17,370 $ 11,728 $ 5,605 $ 15,365 $ 14,444
Per common share data Basic earnings Income from continuing operations $ 3.98 $ 2.25 $ 0.81 $ 4.38 $ 3.83 Net income 3.98 2.27 1.35 4.38 4.05
Diluted earnings(e) Income from continuing operations $ 3.96 $ 2.24 $ 0.81 $ 4.33 $ 3.78 Net income 3.96 2.26 1.35 4.33 4.00 Cash dividends declared per share 0.20 0.20 1.52 1.48 1.36 Book value per share 43.04 39.88 36.15 36.59 33.45 Common shares outstanding Average: Basic 3,956.3 3,862.8 3,501.1 3,403.6 3,470.1 Diluted 3,976.9 3,879.7 3,521.8 3,445.3 3,516.1 Common shares at period-end 3,910.3 3,942.0 3,732.8 3,367.4 3,461.7
Share price(f) High $ 48.20 $ 47.47 $ 50.63 $ 53.25 $ 49.00 Low 35.16 14.96 19.69 40.15 37.88 Close 42.42 41.67 31.53 43.65 48.30 Market capitalization 165,875 164,261 117,695 146,986 167,199Financial ratios
Return on common equity(e) Income from continuing operations 10% 6% 2% 13% 12% Net income 10 6 4 13 13
Return on tangible common equity(e) Income from continuing operations 15 10 4 22 24 Net income 15 10 6 22 24Return on assets Income from continuing operations 0.85 0.58 0.21 1.06 1.04 Net income 0.85 0.58 0.31 1.06 1.10Overhead ratio 60 52 65 58 63Deposits-to-loans ratio 134 148 135 143 132
Tier 1 capital ratio(g) 12.1 11.1 10.9 8.4 8.7 Total capital ratio 15.5 14.8 14.8 12.6 12.3 Tier 1 leverage ratio 7.0 6.9 6.9 6.0 6.2
Tier 1 common capital ratio(h) 9.8 8.8 7.0 7.0 7.3
Selected balance sheet data (period-end)(g) Trading assets $ 489,892 $ 411,128 $ 509,983 $ 491,409 $ 365,738 Securities 316,336 360,390 205,943 85,450 91,975Loans 692,927 633,458 744,898 519,374 483,127Total assets 2,117,605 2,031,989 2,175,052 1,562,147 1,351,520 Deposits 930,369 938,367 1,009,277 740,728 638,788Long-term debt 247,669 266,318 270,683 199,010 145,630Common stockholders’ equity 168,306 157,213 134,945 123,221 115,790Total stockholders’ equity 176,106 165,365 166,884 123,221 115,790Headcount 239,831 222,316 224,961 180,667 174,360
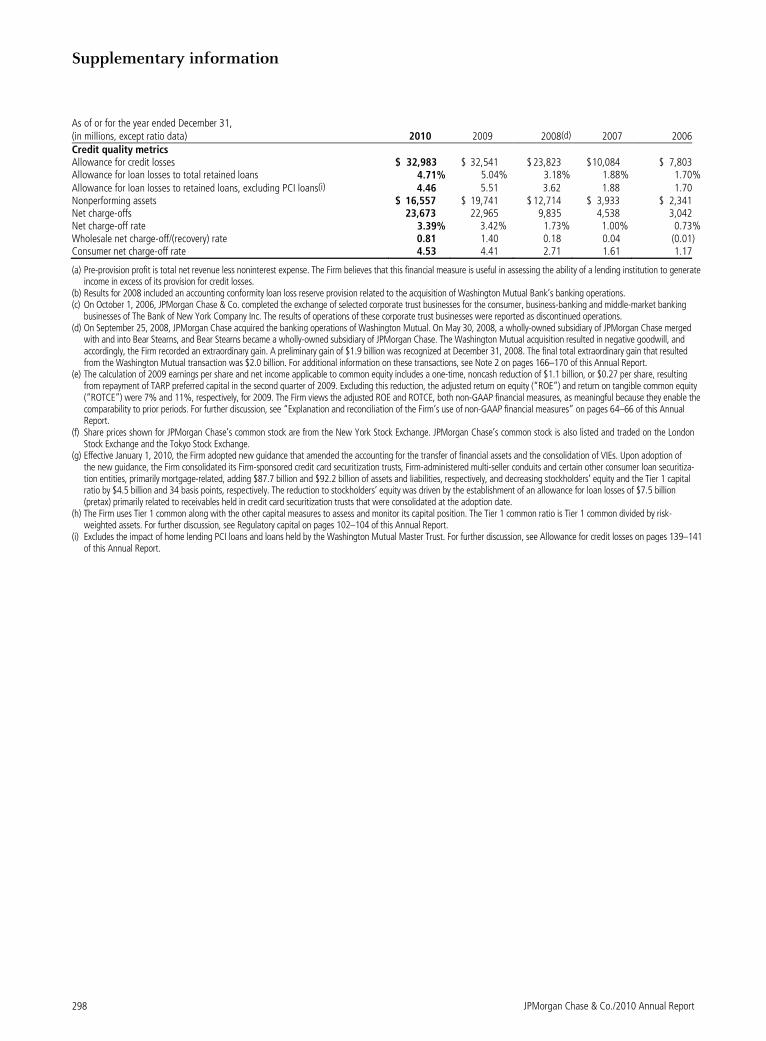
Supplementary information
JPMorgan Chase & Co./2010 Annual Report 298
As of or for the year ended December 31, (in millions, except ratio data) 2010 2009 2008(d) 2007 2006 Credit quality metrics Allowance for credit losses $ 32,983 $ 32,541 $ 23,823 $ 10,084 $ 7,803 Allowance for loan losses to total retained loans 4.71% 5.04% 3.18% 1.88% 1.70% Allowance for loan losses to retained loans, excluding PCI loans(i) 4.46 5.51 3.62 1.88 1.70 Nonperforming assets $ 16,557 $ 19,741 $ 12,714 $ 3,933 $ 2,341Net charge-offs 23,673 22,965 9,835 4,538 3,042 Net charge-off rate 3.39% 3.42% 1.73% 1.00% 0.73% Wholesale net charge-off/(recovery) rate 0.81 1.40 0.18 0.04 (0.01) Consumer net charge-off rate 4.53 4.41 2.71 1.61 1.17
(a) Pre-provision profit is total net revenue less noninterest expense. The Firm believes that this financial measure is useful in assessing the ability of a lending institution to generate income in excess of its provision for credit losses.
(b) Results for 2008 included an accounting conformity loan loss reserve provision related to the acquisition of Washington Mutual Bank’s banking operations. (c) On October 1, 2006, JPMorgan Chase & Co. completed the exchange of selected corporate trust businesses for the consumer, business-banking and middle-market banking
businesses of The Bank of New York Company Inc. The results of operations of these corporate trust businesses were reported as discontinued operations. (d) On September 25, 2008, JPMorgan Chase acquired the banking operations of Washington Mutual. On May 30, 2008, a wholly-owned subsidiary of JPMorgan Chase merged
with and into Bear Stearns, and Bear Stearns became a wholly-owned subsidiary of JPMorgan Chase. The Washington Mutual acquisition resulted in negative goodwill, and accordingly, the Firm recorded an extraordinary gain. A preliminary gain of $1.9 billion was recognized at December 31, 2008. The final total extraordinary gain that resulted from the Washington Mutual transaction was $2.0 billion. For additional information on these transactions, see Note 2 on pages 166–170 of this Annual Report.
(e) The calculation of 2009 earnings per share and net income applicable to common equity includes a one-time, noncash reduction of $1.1 billion, or $0.27 per share, resulting from repayment of TARP preferred capital in the second quarter of 2009. Excluding this reduction, the adjusted return on equity (“ROE”) and return on tangible common equity (“ROTCE”) were 7% and 11%, respectively, for 2009. The Firm views the adjusted ROE and ROTCE, both non-GAAP financial measures, as meaningful because they enable the comparability to prior periods. For further discussion, see “Explanation and reconciliation of the Firm’s use of non-GAAP financial measures” on pages 64–66 of this Annual Report.
(f) Share prices shown for JPMorgan Chase’s common stock are from the New York Stock Exchange. JPMorgan Chase’s common stock is also listed and traded on the London Stock Exchange and the Tokyo Stock Exchange.
(g) Effective January 1, 2010, the Firm adopted new guidance that amended the accounting for the transfer of financial assets and the consolidation of VIEs. Upon adoption of the new guidance, the Firm consolidated its Firm-sponsored credit card securitization trusts, Firm-administered multi-seller conduits and certain other consumer loan securitiza-tion entities, primarily mortgage-related, adding $87.7 billion and $92.2 billion of assets and liabilities, respectively, and decreasing stockholders’ equity and the Tier 1 capital ratio by $4.5 billion and 34 basis points, respectively. The reduction to stockholders’ equity was driven by the establishment of an allowance for loan losses of $7.5 billion (pretax) primarily related to receivables held in credit card securitization trusts that were consolidated at the adoption date.
(h) The Firm uses Tier 1 common along with the other capital measures to assess and monitor its capital position. The Tier 1 common ratio is Tier 1 common divided by risk-weighted assets. For further discussion, see Regulatory capital on pages 102–104 of this Annual Report.
(i) Excludes the impact of home lending PCI loans and loans held by the Washington Mutual Master Trust. For further discussion, see Allowance for credit losses on pages 139–141 of this Annual Report.
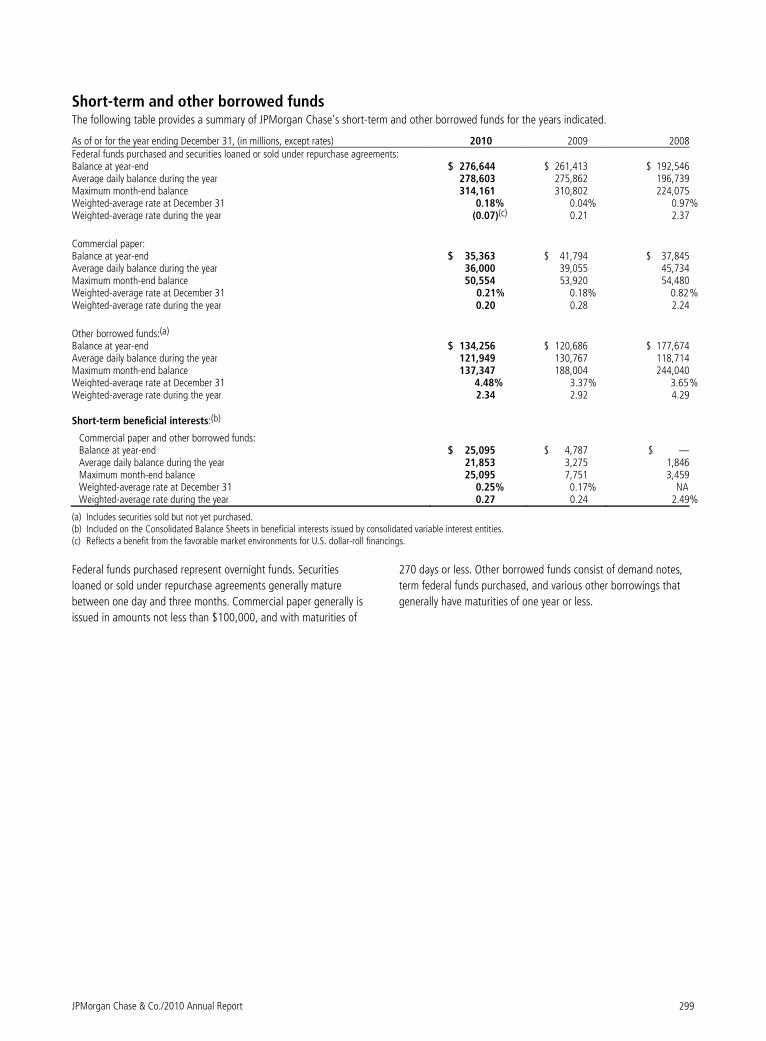
JPMorgan Chase & Co./2010 Annual Report 299
Short-term and other borrowed funds The following table provides a summary of JPMorgan Chase’s short-term and other borrowed funds for the years indicated.
(a) Includes securities sold but not yet purchased. (b) Included on the Consolidated Balance Sheets in beneficial interests issued by consolidated variable interest entities. (c) Reflects a benefit from the favorable market environments for U.S. dollar-roll financings.
Federal funds purchased represent overnight funds. Securities
loaned or sold under repurchase agreements generally mature
between one day and three months. Commercial paper generally is
issued in amounts not less than $100,000, and with maturities of
270 days or less. Other borrowed funds consist of demand notes,
term federal funds purchased, and various other borrowings that
generally have maturities of one year or less.
As of or for the year ending December 31, (in millions, except rates) 2010 2009 2008 Federal funds purchased and securities loaned or sold under repurchase agreements: Balance at year-end $ 276,644 $ 261,413 $ 192,546 Average daily balance during the year 278,603 275,862 196,739 Maximum month-end balance 314,161 310,802 224,075 Weighted-average rate at December 31 0.18% 0.04% 0.97% Weighted-average rate during the year (0.07)(c) 0.21 2.37
Commercial paper: Balance at year-end $ 35,363 $ 41,794 $ 37,845 Average daily balance during the year 36,000 39,055 45,734 Maximum month-end balance 50,554 53,920 54,480 Weighted-average rate at December 31 0.21% 0.18% 0.82 % Weighted-average rate during the year 0.20 0.28 2.24
Other borrowed funds:(a)
Balance at year-end $ 134,256 $ 120,686 $ 177,674 Average daily balance during the year 121,949 130,767 118,714 Maximum month-end balance 137,347 188,004 244,040 Weighted-average rate at December 31 4.48% 3.37% 3.65 % Weighted-average rate during the year 2.34 2.92 4.29
Short-term beneficial interests:(b)
Commercial paper and other borrowed funds: Balance at year-end $ 25,095 $ 4,787 $ — Average daily balance during the year 21,853 3,275 1,846 Maximum month-end balance 25,095 7,751 3,459 Weighted-average rate at December 31 0.25% 0.17% NA Weighted-average rate during the year 0.27 0.24 2.49%
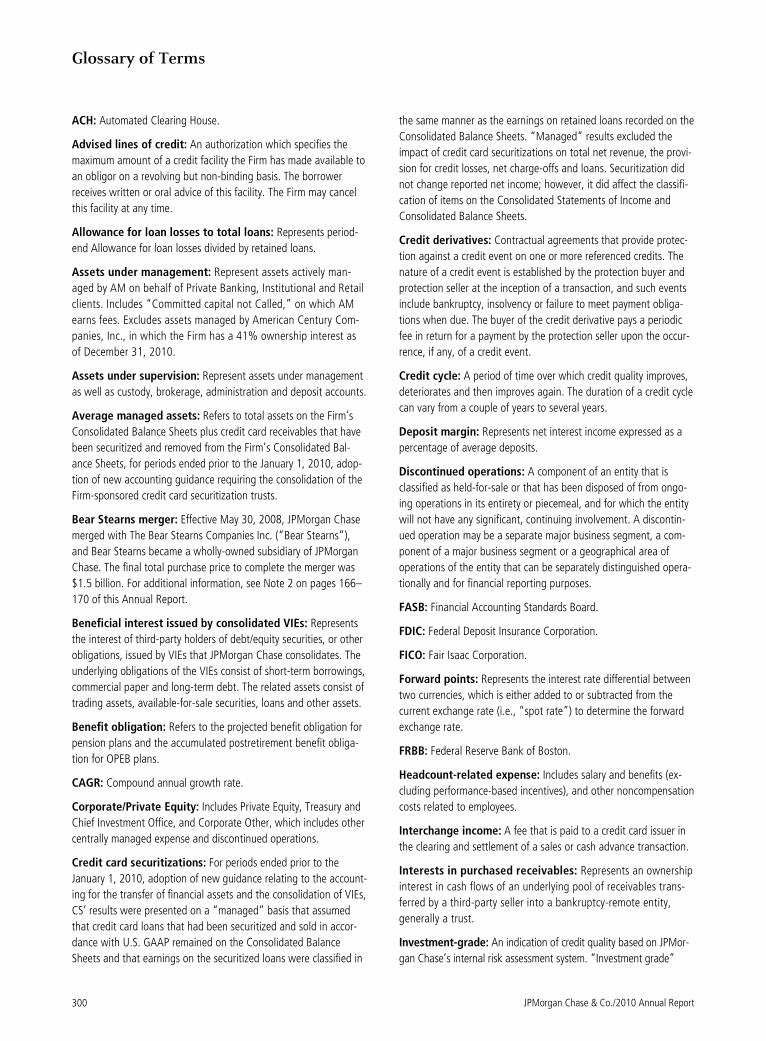
Glossary of Terms
JPMorgan Chase & Co./2010 Annual Report 300
ACH: Automated Clearing House.
Advised lines of credit: An authorization which specifies the
maximum amount of a credit facility the Firm has made available to
an obligor on a revolving but non-binding basis. The borrower
receives written or oral advice of this facility. The Firm may cancel
this facility at any time.
Allowance for loan losses to total loans: Represents period-
end Allowance for loan losses divided by retained loans.
Assets under management: Represent assets actively man-
aged by AM on behalf of Private Banking, Institutional and Retail
clients. Includes “Committed capital not Called,” on which AM
earns fees. Excludes assets managed by American Century Com-
panies, Inc., in which the Firm has a 41% ownership interest as
of December 31, 2010.
Assets under supervision: Represent assets under management
as well as custody, brokerage, administration and deposit accounts.
Average managed assets: Refers to total assets on the Firm’s
Consolidated Balance Sheets plus credit card receivables that have
been securitized and removed from the Firm’s Consolidated Bal-
ance Sheets, for periods ended prior to the January 1, 2010, adop-
tion of new accounting guidance requiring the consolidation of the
Firm-sponsored credit card securitization trusts.
Bear Stearns merger: Effective May 30, 2008, JPMorgan Chase
merged with The Bear Stearns Companies Inc. (“Bear Stearns”),
and Bear Stearns became a wholly-owned subsidiary of JPMorgan
Chase. The final total purchase price to complete the merger was
$1.5 billion. For additional information, see Note 2 on pages 166–
170 of this Annual Report.
Beneficial interest issued by consolidated VIEs: Represents
the interest of third-party holders of debt/equity securities, or other
obligations, issued by VIEs that JPMorgan Chase consolidates. The
underlying obligations of the VIEs consist of short-term borrowings,
commercial paper and long-term debt. The related assets consist of
trading assets, available-for-sale securities, loans and other assets.
Benefit obligation: Refers to the projected benefit obligation for
pension plans and the accumulated postretirement benefit obliga-
tion for OPEB plans.
CAGR: Compound annual growth rate.
Corporate/Private Equity: Includes Private Equity, Treasury and
Chief Investment Office, and Corporate Other, which includes other
centrally managed expense and discontinued operations.
Credit card securitizations: For periods ended prior to the
January 1, 2010, adoption of new guidance relating to the account-
ing for the transfer of financial assets and the consolidation of VIEs,
CS’ results were presented on a “managed” basis that assumed
that credit card loans that had been securitized and sold in accor-
dance with U.S. GAAP remained on the Consolidated Balance
Sheets and that earnings on the securitized loans were classified in
the same manner as the earnings on retained loans recorded on the
Consolidated Balance Sheets. “Managed” results excluded the
impact of credit card securitizations on total net revenue, the provi-
sion for credit losses, net charge-offs and loans. Securitization did
not change reported net income; however, it did affect the classifi-
cation of items on the Consolidated Statements of Income and
Consolidated Balance Sheets.
Credit derivatives: Contractual agreements that provide protec-
tion against a credit event on one or more referenced credits. The
nature of a credit event is established by the protection buyer and
protection seller at the inception of a transaction, and such events
include bankruptcy, insolvency or failure to meet payment obliga-
tions when due. The buyer of the credit derivative pays a periodic
fee in return for a payment by the protection seller upon the occur-
rence, if any, of a credit event.
Credit cycle: A period of time over which credit quality improves,
deteriorates and then improves again. The duration of a credit cycle
can vary from a couple of years to several years.
Deposit margin: Represents net interest income expressed as a
percentage of average deposits.
Discontinued operations: A component of an entity that is
classified as held-for-sale or that has been disposed of from ongo-
ing operations in its entirety or piecemeal, and for which the entity
will not have any significant, continuing involvement. A discontin-
ued operation may be a separate major business segment, a com-
ponent of a major business segment or a geographical area of
operations of the entity that can be separately distinguished opera-
tionally and for financial reporting purposes.
FASB: Financial Accounting Standards Board.
FDIC: Federal Deposit Insurance Corporation.
FICO: Fair Isaac Corporation.
Forward points: Represents the interest rate differential between
two currencies, which is either added to or subtracted from the
current exchange rate (i.e., “spot rate”) to determine the forward
exchange rate.
FRBB: Federal Reserve Bank of Boston.
Headcount-related expense: Includes salary and benefits (ex-
cluding performance-based incentives), and other noncompensation
costs related to employees.
Interchange income: A fee that is paid to a credit card issuer in
the clearing and settlement of a sales or cash advance transaction.
Interests in purchased receivables: Represents an ownership
interest in cash flows of an underlying pool of receivables trans-
ferred by a third-party seller into a bankruptcy-remote entity,
generally a trust.
Investment-grade: An indication of credit quality based on JPMor-
gan Chase’s internal risk assessment system. “Investment grade”
JPMorgan Chase & Co./2010 Annual Report 301
generally represents a risk profile similar to a rating of a “BBB-”/
”Baa3” or better, as defined by independent rating agencies.
LLC: Limited Liability Company.
Loan-to-value (“LTV”) ratio: For residential real estate loans,
the relationship expressed as a percent, between the principal
amount of a loan and the appraised value of the collateral (i.e.,
residential real estate) securing the loan.
Origination date LTV ratio
The LTV ratio at the origination date of the loan. Origination date
LTV ratios are calculated based on the actual appraised values of
collateral (i.e., loan-level data) at the origination date.
Current estimated LTV ratio
An estimate of the LTV as of a certain date. The current estimated
LTV ratios are calculated using estimated collateral values derived
from a nationally recognized home price index measured at the MSA
level. These MSA-level home price indices comprise actual data to the
extent available and forecasted data where actual data is not avail-
able. As a result, the estimated collateral values used to calculate
these ratios do not represent actual appraised loan-level collateral
values; as such, the resulting LTV ratios are necessarily imprecise and
should therefore be viewed as estimates.
Combined LTV ratio
The LTV ratio considering all lien positions related to the property.
Combined LTV ratios are used for junior lien home equity products.
Managed basis: A non-GAAP presentation of financial results
that includes reclassifications to present revenue on a fully taxable-
equivalent basis, and for periods ended prior to the January 1,
2010, adoption of accounting guidance relating to the accounting
for the transfer of financial assets and the consolidation of VIEs
related to credit card securitizations. Management uses this non-
GAAP financial measure at the segment level, because it believes
this provides information to enable investors to understand the
underlying operational performance and trends of the particular
business segment and facilitates a comparison of the business
segment with the performance of competitors.
Managed credit card portfolio: Refers to credit card receivables
on the Firm’s Consolidated Balance Sheets plus credit card receiv-
ables that have been securitized and removed from the Firm’s
Consolidated Balance Sheets, for periods ended prior to the January
1, 2010, adoption of new guidance requiring the consolidation of
the Firm-sponsored credit card securitization trusts.
Mark-to-market exposure: A measure, at a point in time, of the
value of a derivative or foreign exchange contract in the open
market. When the MTM value is positive, it indicates the counter-
party owes JPMorgan Chase and, therefore, creates credit risk for
the Firm. When the MTM value is negative, JPMorgan Chase owes
the counterparty; in this situation, the Firm has liquidity risk.
Master netting agreement: An agreement between two coun-
terparties who have multiple derivative contracts with each other
that provides for the net settlement of all contracts, as well as cash
collateral, through a single payment, in a single currency, in the
event of default on or termination of any one contract.
Merger costs: Reflects costs associated with the Bear Stearns
merger and the Washington Mutual transaction in 2008.
Mortgage product types:
Alt-A
Alt-A loans are generally higher in credit quality than subprime loans
but have characteristics that would disqualify the borrower from a
traditional prime loan. Alt-A lending characteristics may include one
or more of the following: (i) limited documentation; (ii) high com-
bined-loan-to-value (“CLTV”) ratio; (iii) loans secured by non-owner
occupied properties; or (iv) debt-to-income ratio above normal limits.
Perhaps the most important characteristic is limited documentation. A
substantial proportion of traditional Alt-A loans are those where a
borrower does not provide complete documentation of his or her
assets or the amount or source of his or her income.
Option ARMs
The option ARM real estate loan product is an adjustable-rate
mortgage loan that provides the borrower with the option each
month to make a fully amortizing, interest-only, or minimum
payment. The minimum payment on an option ARM loan is based
on the interest rate charged during the introductory period. This
introductory rate is usually significantly below the fully indexed
rate. The fully indexed rate is calculated using an index rate plus
a margin. Once the introductory period ends, the contractual
interest rate charged on the loan increases to the fully indexed
rate and adjusts monthly to reflect movements in the index. The
minimum payment is typically insufficient to cover interest ac-
crued in the prior month, and any unpaid interest is deferred and
added to the principal balance of the loan. Option ARM loans are
subject to payment recast, which converts the loan to a variable-
rate fully amortizing loan upon meeting specified loan balance
and anniversary date triggers.
Prime
Prime mortgage loans generally have low default risk and are made
to borrowers with good credit records and a monthly income that is
at least three to four times greater than their monthly housing
expense (mortgage payments plus taxes and other debt payments).
These borrowers provide full documentation and generally have
reliable payment histories.
Subprime
Subprime loans are designed for customers with one or more high
risk characteristics, including but not limited to: (i) unreliable or
poor payment histories; (ii) a high LTV ratio of greater than 80%
(without borrower-paid mortgage insurance); (iii) a high debt-to-
income ratio; (iv) an occupancy type for the loan is other than the
borrower’s primary residence; or (v) a history of delinquencies or
late payments on the loan.
MSR risk management revenue: Includes changes in MSR asset
fair value due to market-based inputs, such as interest rates and
volatility, as well as updates to assumptions used in the MSR
Glossary of Terms
JPMorgan Chase & Co./2010 Annual Report 302
valuation model; and derivative valuation adjustments and other,
which represents changes in the fair value of derivative instruments
used to offset the impact of changes in the market-based inputs to
the MSR valuation model.
Multi-asset: Any fund or account that allocates assets under
management to more than one asset class (e.g., long-term fixed
income, equity, cash, real assets, private equity, or hedge funds).
NA: Data is not applicable or available for the period presented.
Net charge-off ratio: Represents net charge-offs (annualized)
divided by average retained loans for the reporting period.
Net yield on interest-earning assets: The average rate for
interest-earning assets less the average rate paid for all sources of
funds.
NM: Not meaningful.
Nonconforming mortgage loans: Mortgage loans that do not
meet the requirements for sale to U.S. government agencies and
U.S. government sponsored enterprises. These requirements include
limits on loan-to-value ratios, loan terms, loan amounts, down
payments, borrower creditworthiness and other requirements.
OPEB: Other postretirement employee benefits.
Overhead ratio: Noninterest expense as a percentage of total net
revenue.
Participating securities: Represent unvested stock-based com-
pensation awards containing nonforfeitable rights to dividends or
dividend equivalents (collectively,”dividends”), which are included
in the earnings per share calculation using the two-class method.
JPMorgan Chase grants restricted stock and RSUs to certain em-
ployees under its stock-based compensation programs, which
entitle the recipients to receive nonforfeitable dividends during the
vesting period on a basis equivalent to the dividends paid to hold-
ers of common stock. These unvested awards meet the definition of
participating securities. Under the two-class method, all earnings
(distributed and undistributed) are allocated to each class of com-
mon stock and participating securities, based on their respective
rights to receive dividends.
Personal bankers: Retail branch office personnel who acquire,
retain and expand new and existing customer relationships by
assessing customer needs and recommending and selling appropri-
ate banking products and services.
Portfolio activity: Describes changes to the risk profile of existing
lending-related exposures and their impact on the allowance for
credit losses from changes in customer profiles and inputs used to
estimate the allowances.
Pre-provision profit: The Firm believes that this financial meas-
ure is useful in assessing the ability of a lending institution to
generate income in excess of its provision for credit losses.
Pretax margin: Represents income before income tax expense
divided by total net revenue, which is, in management’s view, a
comprehensive measure of pretax performance derived by measur-
ing earnings after all costs are taken into consideration. It is, there-
fore, another basis that management uses to evaluate the
performance of TSS and AM against the performance of their
respective competitors.
Principal transactions: Realized and unrealized gains and losses
from trading activities (including physical commodities inventories
that are accounted for at the lower of cost or fair value) and
changes in fair value associated with financial instruments held
predominantly by IB for which the fair value option was elected.
Principal transactions revenue also includes private equity gains and
losses.
Purchased credit-impaired (“PCI“) loans: Acquired loans
deemed to be credit-impaired under the FASB guidance for PCI
loans. The guidance allows purchasers to aggregate credit-impaired
loans acquired in the same fiscal quarter into one or more pools,
provided that the loans have common risk characteristics (e.g.,
FICO score, geographic location). A pool is then accounted for as a
single asset with a single composite interest rate and an aggregate
expectation of cash flows. Wholesale loans are determined to be
credit-impaired if they meet the definition of an impaired loan
under U.S. GAAP at the acquisition date. Consumer loans are
determined to be credit-impaired based on specific risk characteris-
tics of the loan, including product type, LTV ratios, FICO scores, and
past due status.
Real estate investment trust (“REIT”): A special purpose
investment vehicle that provides investors with the ability to par-
ticipate directly in the ownership or financing of real-estate related
assets by pooling their capital to purchase and manage income
property (i.e., equity REIT) and/or mortgage loans (i.e., mortgage
REIT). REITs can be publicly- or privately-held and they also qualify
for certain favorable tax considerations.
Receivables from customers: Primarily represents margin loans
to prime and retail brokerage customers which are included in
accrued interest and accounts receivable on the Consolidated
Balance Sheets for the wholesale lines of business.
Reported basis: Financial statements prepared under U.S. GAAP,
which excludes the impact of taxable-equivalent adjustments. For
periods ended prior to the January 1, 2010, adoption of new guid-
ance requiring the consolidation of the Firm-sponsored credit card
securitization trusts, the reported basis included the impact of credit
card securitizations.
Retained loans: Loans that are held for investment excluding
loans held-for-sale and loans at fair value.
Sales specialists: Retail branch office personnel who specialize in
the marketing of a single product, including mortgages, invest-
ments and business banking, by partnering with the personal
bankers.
Seed capital: Initial JPMorgan capital invested in products, such
as mutual funds, with the intention of ensuring the fund is of
JPMorgan Chase & Co./2010 Annual Report 303
sufficient size to represent a viable offering to clients, enabling
pricing of its shares, and allowing the manager to develop a com-
mercially attractive track record. After these goals are achieved, the
intent is to remove the Firm’s capital from the investment.
Stress testing: A scenario that measures market risk under
unlikely but plausible events in abnormal markets.
TARP: Troubled Asset Relief Program.
Taxable-equivalent basis: Total net revenue for each of the
business segments and the Firm is presented on a tax-equivalent
basis. Accordingly, revenue from tax-exempt securities and invest-
ments that receive tax credits is presented in the managed results
on a basis comparable to fully taxable securities and investments.
This non-GAAP financial measure allows management to assess the
comparability of revenue arising from both taxable and tax-exempt
sources. The corresponding income tax impact related to these
items is recorded within income tax expense.
Troubled debt restructuring (“TDR”): Occurs when the Firm
modifies the original terms of a loan agreement by granting a
concession to a borrower that is experiencing financial difficulty.
Unaudited: Financial statements and information that have not
been subjected to auditing procedures sufficient to permit an
independent certified public accountant to express an opinion.
U.S. GAAP: Accounting principles generally accepted in the United
States of America.
U.S. government and federal agency obligations: Obliga-
tions of the U.S. government or an instrumentality of the U.S.
government whose obligations are fully and explicitly guaranteed
as to the timely payment of principal and interest by the full faith
and credit of the U.S. government.
U.S. government-sponsored enterprise obligations: Obliga-
tions of agencies originally established or chartered by the U.S.
government to serve public purposes as specified by the U.S. Con-
gress; these obligations are not explicitly guaranteed as to the
timely payment of principal and interest by the full faith and credit
of the U.S. government.
U.S. Treasury: U.S. Department of the Treasury.
Value-at-risk (“VaR”): A measure of the dollar amount of poten-
tial loss from adverse market moves in an ordinary market envi-
ronment.
Washington Mutual transaction: On September 25, 2008,
JPMorgan Chase acquired the banking operations of Washington
Mutual Bank (“Washington Mutual”) from the FDIC for $1.9 bil-
lion. The final allocation of the purchase price resulted in the rec-
ognition of negative goodwill and an extraordinary gain of $2.0
billion. For additional information, see Note 2 on pages 166–170
of this Annual Report.

304 JPMorgan Chase & Co./2010 Annual Report
As of December 31, 2010
Rt. Hon. Tony BlairChairman of the CouncilQuartet Representative and Former Prime Minister of Great Britain and Northern IrelandLondon, United Kingdom
Khalid A. Al-FalihPresident and Chief Executive OfficerSaudi AramcoDhahran, Saudi Arabia
Kofi AnnanChairman Kofi Annan FoundationGeneva, Switzerland
Riley P. BechtelChairman and Chief Executive OfficerBechtel Group, Inc.San Francisco, California
Hon. Bill BradleyFormer U.S. SenatorAllen & Company, LLCNew York, New York
Michael A. ChaneyChairmanNational Australia Bank LimitedPerth, Western Australia
Anatoly B. ChubaisDirector GeneralRussian Corporation of Nanotechnologies – RUSNANOMoscow, Russian Federation
Martin FeldsteinPresident EmeritusNational Bureau of Economic Research, Inc. Cambridge, Massachusetts
Arminio Fraga NetoFounding PartnerGávea InvestimentosRio de Janeiro, Brazil
Gao Xi-QingVice Chairman, President and Chief Investment OfficerChina Investment CorporationBeijing, The People’s Republic of China
Jürgen GrossmannChief Executive OfficerRWE AGEssen, Germany
William B. Harrison, Jr.Former Chairman and Chief Executive OfficerJPMorgan Chase & Co.New York, New York
Carla A. HillsChairman and Chief Executive OfficerHills & Company International ConsultantsWashington, D.C.
Franz B. HumerChairmanRoche Holding Ltd.Basel, Switzerland
Hon. Henry A. KissingerChairmanKissinger Associates, Inc.New York, New York
Mustafa V. KoçChairman of the Board of DirectorsKoç Holding A.S .Istanbul, Turkey
Hon. Lee Kuan YewMinister MentorSingapore, Republic of Singapore
Akio MimuraRepresentative Director and ChairmanNippon Steel CorporationTokyo, Japan
Patrice MotsepeExecutive ChairmanAfrican Rainbow Minerals LimitedChislehurston, Sandton, South Africa
Michael Pram RasmussenChairman of the BoardA.P. Møller-Maersk GroupCopenhagen, Denmark
Sir John RoseChief ExecutiveRolls-Royce plcLondon, United Kingdom
Ratan Naval TataChairmanTata Sons LimitedMumbai, India
Hon. Tung Chee Hwa GBMVice ChairmanNational Committee of the Chinese People’s PoliticalConsultative ConferenceThe People’s Republic of China
Cees J.A. van LedeFormer Chairman and Chief Executive Officer, Board of ManagementAkzo NobelArnhem, The Netherlands
Douglas A. Warner IIIFormer Chairman of the BoardJPMorgan Chase & Co.New York, New York
John S. WatsonChairman and Chief Executive OfficerChevron CorporationSan Ramon, California
Jaime Augusto Zobel de AyalaChairman and Chief Executive OfficerAyala CorporationMakati City, Philippines
Ex-Officio Members
James DimonChairman and Chief Executive OfficerJPMorgan Chase & Co.New York, New York
Andrew D. CrockettSpecial Advisor to the ChairmanJPMorgan Chase & Co.San Francisco, California
Dr. Jacob A. FrenkelChairman, InternationalJPMorgan Chase & Co.New York, New York
Walter A. GubertVice ChairmanJPMorgan Chase & Co.London, United Kingdom
David MayhewChairman, J.P. Morgan CazenoveJPMorgan Chase & Co.London, United Kingdom
J.P. Morgan International Council

JPMorgan Chase & Co./2010 Annual Report 305
Richard A. BernsteinChairman and Chief Executive OfficerP&E Capital, Inc.
Rod BraymanPresidentWindmill Distributing Company L.P.
Christopher B. CombeChairman Combe Incorporated
Joseph J. CorasantiPresident and Chief Executive OfficerCONMED Corporation
Emil DudaSenior Executive Vice Presidentand Chief Financial OfficerLifetime Healthcare Company/Excellus Health Plan Inc.
Roger N. FarahPresident and Chief Operating OfficerPolo Ralph Lauren
James FernandezExecutive Vice President and Chief Financial OfficerTiffany & Co.
Stanley FleishmanChief Executive Officer Jetro Cash & Carry Enterprises, LLC
Martin E. FranklinChairman and Chief Executive OfficerJarden Corporation
Rachelle FriedmanPresident and Co-Chief Executive OfficerJ&R Music and Computer World
Neil GolubChief Executive Officer and Chairman of the BoardThe Golub Corporation
David R. JaffePresident and Chief Executive OfficerThe Dress Barn, Inc.
Tod JohnsonChairman and Chief Executive OfficerThe NPD Group, Inc.
Richard W. KunesExecutive Vice President, Chief Financial OfficerThe Estée Lauder Companies Inc.
Richard S. LeFrakChairman and Chief Executive OfficerLeFrak Organization
Richard B. LeventhalChairman and Chief Executive OfficerFedway Associates, Inc.
John LiDestriPresident and Chief Executive OfficerLiDestri Foods, Inc.
Leo LiebowitzChief Executive OfficerGetty Realty Corp.
William L. MackFounder and Chairman AREA Property Partners
Peter MarksonChairman and Chief Executive OfficerParis Accessories, Inc.
James F. McCannChief Executive Officer1-800-Flowers.com
John MorphySenior Vice President, Chief Financial Officer and SecretaryPaychex, Inc.
James L. NederlanderPresidentNederlander Producing Company of America, Inc.
Samuel I. Newhouse IIIGeneral ManagerAdvance Publications Inc.
William C. RudinVice Chairman and Chief Executive OfficerRudin Management Company, Inc.
C. David SammonsPresident and Chief Executive OfficerSubaru Distributors Corp.
John ShalamFounder and ChairmanAudiovox Corporation
Julie A. ShimerPresident and Chief Executive OfficerWelch Allyn, Inc.
Kenneth L. WallachChairman and Chief Executive Officer Central National-Gottesman Inc.
Fred WilponChairmanSterling Equities, Inc.
Frank Lourenso Chairman Regional Advisory Board
Regional Advisory Board

306 JPMorgan Chase & Co./2010 Annual Report
Crandall C. Bowles 1
ChairmanSprings Industries, Inc. (Window fashions)
Stephen B. Burke 2, 3
Chief Executive OfficerNBCUniversal, LLC Executive Vice President Comcast Corporation (Television and entertainment)
David M. Cote 4, 5
Chairman and Chief Executive Officer Honeywell International Inc. (Diversified technology and manufacturing)
James S. Crown 4, 5
President Henry Crown and Company (Diversified investments)
James Dimon Chairman and Chief Executive Officer JPMorgan Chase & Co.
Ellen V. Futter 4, 5
President and Trustee American Museum of Natural History (Museum)
William H. Gray, III 1, 4
Co-Chairman GrayLoeffler, LLC (Consulting and advisory)
Laban P. Jackson, Jr. 1
Chairman and Chief Executive Officer Clear Creek Properties, Inc. (Real estate development)
David C. Novak 2, 3
Chairman and Chief Executive Officer Yum! Brands, Inc. (Franchised restaurants)
Lee R. Raymond 2, 3
Retired Chairman and Chief Executive Officer Exxon Mobil Corporation (Oil and gas)
William C. Weldon 2, 3
Chairman and Chief Executive Officer Johnson & Johnson (Health care products)
Board of Directors
Member of:
1 Audit Committee
2 Compensation & Management Development Committee
3 Corporate Governance & Nominating Committee
4 Public Responsibility Committee
5 Risk Policy Committee
James Dimon*Chairman and Chief Executive Officer
Gaby A. AbdelnourAsia Pacific
Nicolas AguzinLatin America
Peter K. BarkerCalifornia
Paul T. BatemanAsset Management
Frank J. Bisignano*Chief Administrative Officer and Home Lending
Philip F. BleserGlobal Corporate Bank
Douglas L. Braunstein*Chief Financial Officer
Clive S. BrownAsset Management
Phyllis J. CampbellPacific Northwest
Richard M. CashinOne Equity Partners
Michael J. Cavanagh*Treasury & Securities Services
Guy ChiarelloChief Information Officer
Michael J. ClearyBusiness Banking
Stephen M. Cutler*General Counsel
Kimberly B. DavisGlobal Philanthropy
Klaus DiederichsInvestment Bank
Phil Di IorioAsset Management
John L. Donnelly*Human Resources
Ina R. Drew*Chief Investment Officer
Althea L. DuerstenChief Investment Office
Mary Callahan Erdoes*Asset Management
Joseph M. EvangelistiCorporate Communications
Dr. Jacob A. FrenkelJPMorgan Chase International
Martha J. GalloGeneral Auditor
Scott GellerCommercial Banking/Risk Management
Walter A. GubertEurope, Middle East and Africa
Gregory L. GuyettGlobal Corporate Bank
Carlos M. HernandezInvestment Bank
John J. HoganInvestment Bank/ Risk Management
Rob C. HolmesCommercial Banking
Catherine M. KeatingAsset Management
Conrad J. KozakWorldwide Securities Services
James B. Lee, Jr.Investment Bank
David B. LowmanHome Lending
S. Todd Maclin*Commercial Banking
Achilles O. MacrisChief Investment Office
Jay Mandelbaum*Strategy & Marketing
Mel R. MartinezFlorida, Mexico, Central America and Caribbean
Blythe S. MastersInvestment Bank
Donald H. McCree, IIITreasury Services
Ryan McInerneyConsumer Banking
Heidi Miller*International
Stephanie B. MudickConsumer Practices
Michael O’BrienAsset Management
Douglas B. PetnoCommercial Banking
Daniel E. PintoInvestment Bank
Scott E. PowellChase Operations
Louis RauchenbergerController
Richard SaboChief Investment Office
Emilio SarachoInvestment Bank
Charles W. Scharf*Retail Financial Services
Peter L. ScherGlobal Government Relations & Public Policy
Eileen M. SerraCard Services
Marc SheinbaumAuto Finance and Student Loans
Gordon A. Smith*Card Services
Barry SommersChase Wealth Management
James E. Staley*Investment Bank
Jack M. StephensonMobile, E-commerce and Payments
Irene TseChief Investment Office
Jeffrey H. UrwinInvestment Bank
William S. WallaceCard Services
Kevin P. WattersHome Lending
Kevin D. WillseyInvestment Bank
Douglas WurthAsset Management
Matthew E. ZamesInvestment Bank
Barry L. Zubrow*Chief Risk Officer
Executive Committee (*denotes member of Operating Committee)
Other Corporate OfficersJoseph S. Bonocore Treasurer
Anthony J. HoranSecretary
Lauren M. TylerInvestor Relations

JPMorgan Chase & Co.
©2011 JPMorgan Chase & Co. All rights reserved.Printed in the U.S.A.
Corporate headquarters270 Park Avenue New York, NY 10017-2070 Telephone: 212-270-6000 jpmorganchase.com
Principal subsidiariesJPMorgan Chase Bank, National Association Chase Bank USA, National Association J.P. Morgan Securities LLC
Annual Report on Form 10-KThe Annual Report on Form 10-K of JPMorgan Chase & Co. as filed with the U.S. Securities and Exchange Commission will be made available without charge upon request to:
Office of the Secretary JPMorgan Chase & Co. 270 Park Avenue New York, NY 10017-2070
Stock listingNew York Stock Exchange London Stock Exchange Tokyo Stock Exchange
The New York Stock Exchange ticker symbol for the common stock of JPMorgan Chase & Co. is JPM.
Financial information about JPMorgan Chase & Co. can be accessed by visiting the Investor Relations web site at jpmorganchase.com. Additional questions should be addressed to:
Investor Relations JPMorgan Chase & Co. 270 Park Avenue New York, NY 10017-2070 Telephone: 212-270-6000
DirectorsTo contact any of the Board members or committee chairs, the Presiding Director or the non-management directors as a group, please mail correspondence to:
JPMorgan Chase & Co. Attention (Board member(s)) Office of the Secretary 270 Park Avenue New York, NY 10017-2070
The Corporate Governance Principles of the Board, the charters of the principal Board committees, the Code of Conduct, the Code of Ethics for Finance Professionals and other governance information can be accessed by visiting our web site at jpmorganchase.com and clicking on “Governance” under the “About us” tab.
Transfer agent and registrarBNY Mellon 480 Washington Boulevard Jersey City, NJ 07310-1900 Telephone: 800-758-4651 bnymellon.com/shareowner/equityaccess
Investor Services Program JPMorgan Chase & Co.’s Investor Services Program offers a variety of convenient, low-cost services to make it easier to reinvest dividends and buy and sell shares of JPMorgan Chase & Co. common stock. A brochure and enroll- ment materials may be obtained by contacting the Program Administrator, BNY Mellon, by calling 800-758-4651, by writing to the address indicated above or by visiting its web site at bnymellon.com/shareowner/equityaccess.
Direct deposit of dividendsFor information about direct deposit of dividends, please contact BNY Mellon.
Stockholder inquiriesContact BNY Mellon:
By telephone:
Within the United States, Canada and Puerto Rico: 800-758-4651 (toll free)
From all other locations: 201-680-6889 (collect)
TDD service for the hearing impaired within the United States, Canada and Puerto Rico: 800-231-5469 (toll free)
All other locations: 201-680-6610 (collect)
By mail:
BNY Mellon 480 Washington Boulevard Jersey City, NJ 07310-1900
Duplicate mailingsIf you receive duplicate mailings because you have more than one account listing and you wish to consolidate your accounts, please write to BNY Mellon at the address above.
Independent registered public accounting firmPricewaterhouseCoopers LLP 300 Madison Avenue New York, NY 10017-6204
As of the beginning of 2009, JPMorgan Chase & Co. has distributed shareholder information under the U.S. Securities and Exchange Commission “Notice and Access” rule. As a result, the firm prints 700,000 fewer Annual Reports and Proxy Statements, which saves on an annual basis approximately 6,400 trees and 800 metric tons of CO2 emissions.
This Annual Report is printed on paper made from well-managed forests and other controlled sources. The paper is independently certified by BVQI to the Forest Stewardship Council (FSC) standards. The paper contains a minimum of 20% post-consumer waste recycled fibers.
As of or for the year ended December 31,(in millions, except per share, ratio data and headcount) 2010 2009
Reported basis (a)
Total net revenue $ 102,694 $ 100,434Total noninterest expense 61,196 52,352Pre-provision profit 41,498 48,082 Provision for credit losses 16,639 32,015Income before extraordinary gain 17,370 11,652Extraordinary gain — 76Net income $ 17,370 $ 11,728
Per common share dataBasic earnings Income before extraordinary gain $ 3.98 $ 2.25 Net income 3.98 2.27Diluted earnings Income before extraordinary gain $ 3.96 $ 2.24 Net income 3.96 2.26Cash dividends declared 0.20 0.20Book value 43.04 39.88
Selected ratiosReturn on common equity Income before extraordinary gain 10% 6 % Net income 10 6Return on tangible common equity(b)
Income before extraordinary gain 15% 10 % Net income 15 10Tier 1 Capital ratio 12.1 11.1Total Capital ratio 15.5 14.8Tier 1 Common Capital ratio(b) 9.8 8.8
Selected balance sheet data (period-end)Total assets $ 2,117,605 $ 2,031,989Loans 692,927 633,458Deposits 930,369 938,367Total stockholders’ equity 176,106 165,365
Headcount 239,831 222,316
(a) Results are presented in accordance with accounting principles generally accepted in the United States of America, except where otherwise noted. (b) Non-GAAP financial measure. For further discussion, see “Explanation and reconciliation of the firm’s use of non-GAAP financial measures” and “Regulatory capital” in this Annual Report.
Financial Highlights
JPMorgan Chase & Co. (NYSE: JPM) is a leading global financial services firm with assets of $2.1 trillion and operations in more than 60 countries. The firm is a leader in investment banking, financial services for consumers, small business and commercial banking, financial transaction processing, asset management and private equity. A component of the Dow Jones Industrial Average, JPMorgan Chase & Co. serves millions of consumers in the United States and many of the world’s most prominent corporate, institutional and government clients under its J.P. Morgan and Chase brands.
Information about J.P. Morgan capabilities can be found at jpmorgan.com and about Chase capabilities at chase.com. Information about the firm is available at jpmorganchase.com.
Rev1_11-0309_AR10_IFC_IBC_UG.indd 1 4/4/11 9:49 PM

JPMorgan Chase & Co. 2010 Annual Report
jpmorganchase.com
2010 Annual Report
Rev1_11-0309_AR10_outsidecover_UG.indd 1 4/4/11 7:02 PM


