
2011 Disability Status Report
United States
USUnited States
2011
www.disabilitystatistics.org Employment and Disability Institute at the Cornell University ILR School

Contents
Introduction2011 Annual Disability Status Report 2ACS Disability Questions 3Notes 4
SummaryUnited States Summary 5Prevalence by State: Ages 21 to 64 7Employment by State: Ages 21 to 64 8
DemographicsPrevalence: All Ages 9Prevalence: Ages 4 and under 11Prevalence: Ages 5 to 15 13Prevalence: Ages 16 to 20 15Prevalence: Ages 21 to 64 (Working-Age) 17Prevalence: Ages 65 to 74 19Prevalence: Ages 75 and Older 21Prevalence: Gender and Age 23Prevalence: Hispanic / Latino Origin and Age 26Prevalence: Race 29
OutcomesEmployment 29Not Working but Actively Looking for Work 33Full-Time / Full-Year Employment 35Annual Earnings (Full-Time / Full-Year workers) 37Annual Household Income 39Poverty 41Supplemental Security Income (SSI) 43Education: High School Diploma / Equivalent 45Education: Some College / Associate's Degree 47Education: Bachelor's Degree or More 49Veterans Service-Connected Disability 51Health Insurance Coverage 53Type of Health Insurance Coverage 55
Glossary 58
About the Disability Status Report 64
2011 Disability Status Report - United States | © 2012 Cornell University 1
The 2011 AnnualDisability Status ReportThe Annual Disability Status Reports provide policy makers, disability advocates,reporters, and the public with a summary of the most recent demographic andeconomic statistics on the non-institutionalized population with disabilities. Theycontain information on the population size and disability prevalence for variousdemographic subpopulations, as well as statistics related to employment, earnings,household income, veterans' service-connected disability and health insurance.Comparisons are made to people without disabilities and across disability types.Disability Status Reports and other statistics are available for the United States overall,each state, the District of Columbia, and Puerto Rico at www.disabilitystatistics.org.
The Status Reports primarily look at the working-age population because theemployment gap between people with and without disabilities is a major focus ofgovernment programs and advocacy efforts. Employment is also a key factor in thesocial integration and economic self-sufficiency of working-age people with disabilities.
The estimates in the 2011 Disability Status Reports are based on American CommunitySurvey (ACS) data - a US Census Bureau survey that has replaced the DecennialCensus long form. See the ACS User Guide on www.disabilitystatistics.org foradditional information on the ACS.
The estimates in these reports are based on responses from a sample of the populationand may differ from actual population values because of sampling variability and otherfactors. Differences observed between the estimates for two or more groups may notbe statistically significant.
Finally, the 2011 Disability Status Report estimates should not be compared toestimates based on ACS data collected prior to 2008. In 2008, the US Census Bureaumade a number of significant changes to the ACS. These changes included an entirelynew set of disability questions as described on the following page. For a summary of allchanges to the ACS 2008 survey see the following Census Bureau document: http://www.census.gov/acs/www/Downloads/methodology/content_test/SummaryResultsACS2006ContentTest.pdf
Suggested Citation
Erickson, W., Lee, C., & von Schrader, S. (2012). 2011 Disability Status Report: UnitedStates. Ithaca, NY: Cornell University Employment and Disability Institute(EDI).
We would like to thank Sara VanLooy, Jason Criss, and Joe Williams for their assistancewith editing and production of this document.
2011 Disability Status Report - United States | © 2012 Cornell University 2
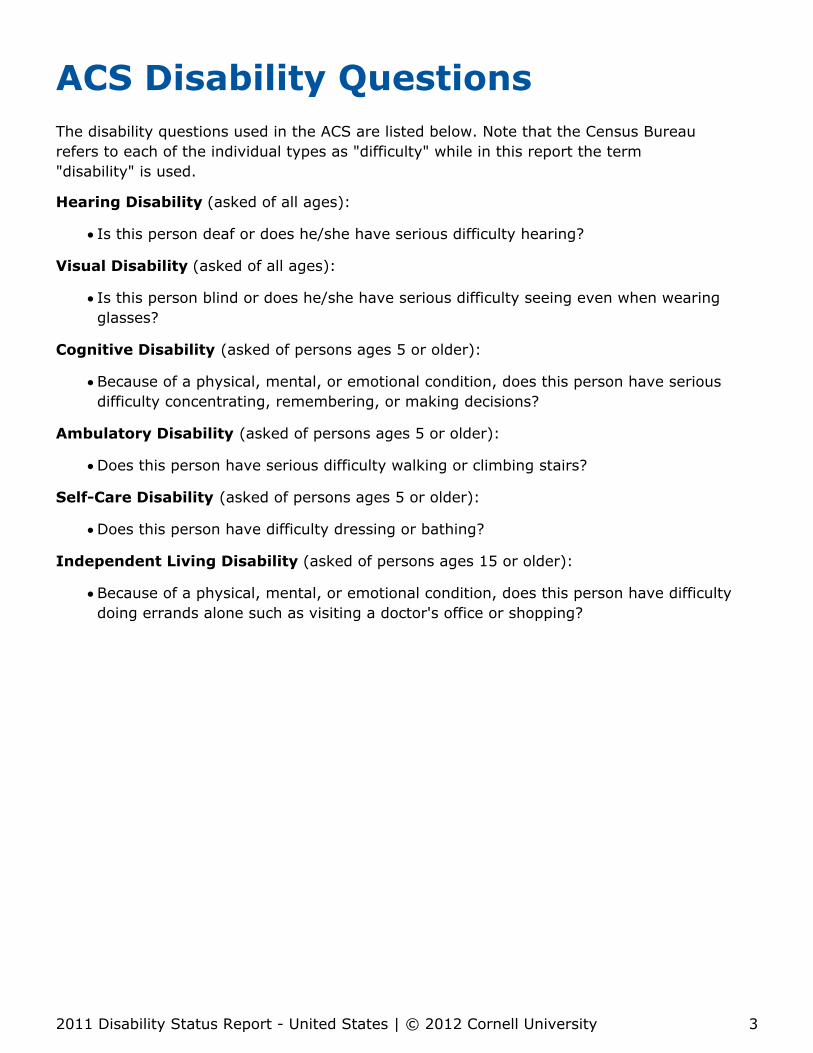
ACS Disability QuestionsThe disability questions used in the ACS are listed below. Note that the Census Bureaurefers to each of the individual types as "difficulty" while in this report the term"disability" is used.
Hearing Disability (asked of all ages):
Is this person deaf or does he/she have serious difficulty hearing?
Visual Disability (asked of all ages):
Is this person blind or does he/she have serious difficulty seeing even when wearingglasses?
Cognitive Disability (asked of persons ages 5 or older):
Because of a physical, mental, or emotional condition, does this person have seriousdifficulty concentrating, remembering, or making decisions?
Ambulatory Disability (asked of persons ages 5 or older):
Does this person have serious difficulty walking or climbing stairs?
Self-Care Disability (asked of persons ages 5 or older):
Does this person have difficulty dressing or bathing?
Independent Living Disability (asked of persons ages 15 or older):
Because of a physical, mental, or emotional condition, does this person have difficultydoing errands alone such as visiting a doctor's office or shopping?
2011 Disability Status Report - United States | © 2012 Cornell University 3

NotesSpanish Language Reports: Spanish language versions of the Annual DisabilityStatus Reports for the US, all 50 states, Puerto Rico, and Washington D.C. can bedownloaded at the same location as the English Status Reports. The Spanishtranslation was made possible through funding from the Northeast Disability TechnicalAssistance Center (DBTAC) and NIDRR.
Puerto Rico: A Puerto Rico Disability Status Report, based on the parallel 2011 PuertoRico Community Survey (PRCS), is available again this year in English as well asSpanish. However, please note that the Puerto Rico sample is not included in any U.S.population estimates included in these reports.
Group Quarters: In 2006, the ACS began surveying the group quarters population.We include the non-institutionalized group quarters population, but due to small statelevel sample sizes exclude the institutionalized group quarters population (see glossary) in the Disability Status Reports.
Margin of Error (MOE): As in previous years' reports we provide the 90% MOE tobetter illustrate sampling variability. See the glossary entry for more information onthis topic.
Glossary: As in previous years, we provide a comprehensive glossary at the back ofthis report defining the terms used in the Disability Status Report (see glossary).
Note: According to the Census Bureau, estimates based on the ACS Public UseMicrodata Sample (PUMS) file such as those included in this report may differ slightlyfrom the ACS summary tables produced by the Census Bureau, because they aresubject to additional sampling error and further data processing operations. Please seehttp://www.disabilitystatistics.org/faq.cfm#Q4 for further information.
2011 Disability Status Report - United States | © 2012 Cornell University 4
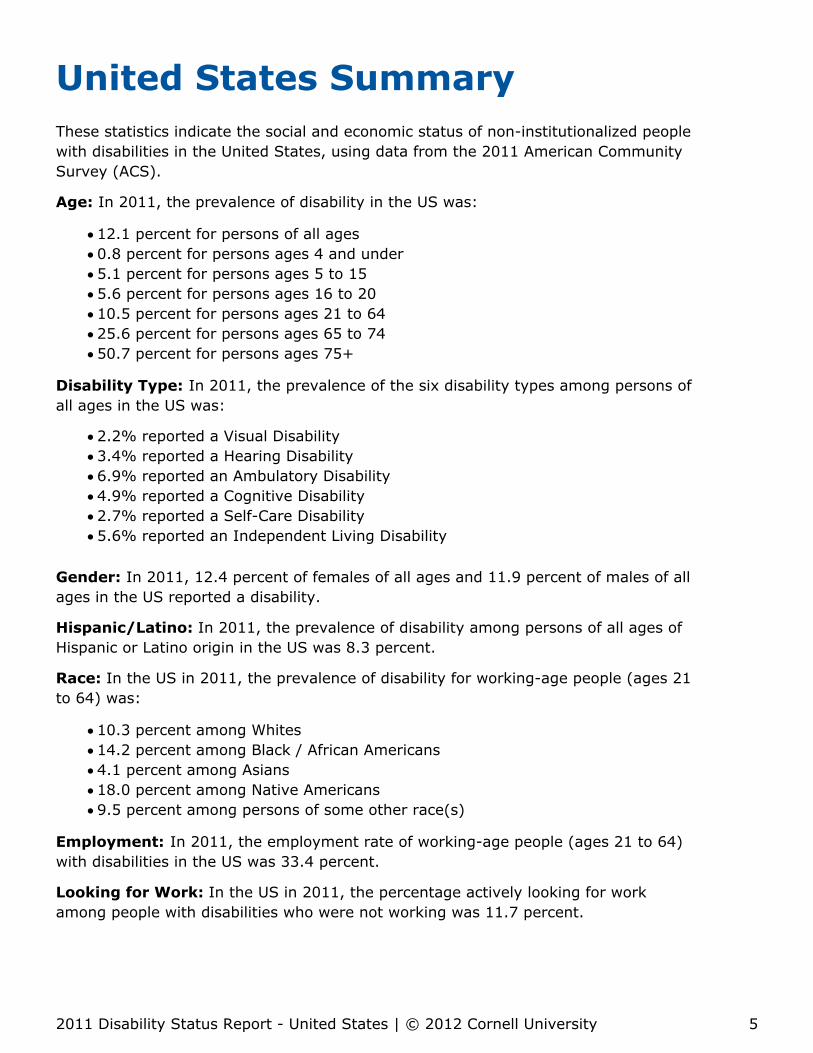
United States SummaryThese statistics indicate the social and economic status of non-institutionalized peoplewith disabilities in the United States, using data from the 2011 American CommunitySurvey (ACS).
Age: In 2011, the prevalence of disability in the US was:
12.1 percent for persons of all ages0.8 percent for persons ages 4 and under5.1 percent for persons ages 5 to 155.6 percent for persons ages 16 to 2010.5 percent for persons ages 21 to 64 25.6 percent for persons ages 65 to 7450.7 percent for persons ages 75+
Disability Type: In 2011, the prevalence of the six disability types among persons ofall ages in the US was:
2.2% reported a Visual Disability3.4% reported a Hearing Disability6.9% reported an Ambulatory Disability4.9% reported a Cognitive Disability2.7% reported a Self-Care Disability5.6% reported an Independent Living Disability
Gender: In 2011, 12.4 percent of females of all ages and 11.9 percent of males of allages in the US reported a disability.
Hispanic/Latino: In 2011, the prevalence of disability among persons of all ages ofHispanic or Latino origin in the US was 8.3 percent.
Race: In the US in 2011, the prevalence of disability for working-age people (ages 21to 64) was:
10.3 percent among Whites14.2 percent among Black / African Americans4.1 percent among Asians18.0 percent among Native Americans9.5 percent among persons of some other race(s)
Employment: In 2011, the employment rate of working-age people (ages 21 to 64)with disabilities in the US was 33.4 percent.
Looking for Work: In the US in 2011, the percentage actively looking for workamong people with disabilities who were not working was 11.7 percent.
2011 Disability Status Report - United States | © 2012 Cornell University 5

Full-Time/Full-Year Employment: In the US in 2011, the percentage ofworking-age people with disabilities working full-time/full-year was 20.7 percent.
Annual Earnings: In 2011, the median annual earnings of working-age people withdisabilities working full-time/full-year in the US was $36,700.
Annual Household Income: In the US in 2011, the median annual income ofhouseholds with working-age people with disabilities was $36,700.
Poverty: In the US in 2011, the poverty rate of working-age people with disabilitieswas 27.8 percent.
Supplemental Security Income: In 2011, the percentage of working-age peoplewith disabilities receiving SSI payments in the US was 19.6 percent.
Educational Attainment: In 2011, the percentage of working-age people withdisabilities in the US:
with only a high school diploma or equivalent was 34.5 percentwith only some college or an associate degree was 30.6 percentwith a bachelor's degree or more was 12.5 percent.
Veterans Service-Connected Disability: In 2011, the percentage of working-agecivilian veterans with a VA determined Service-Connected Disability was 19.1 percentin the US.
Health Insurance Coverage: In 2011 in the US, 82.5 percent of working-age peoplewith disabilities had health insurance.
2011 Disability Status Report - United States | © 2012 Cornell University 6

Prevalence: Ages 21 - 64This summary lists percentages by state of non-institutionalized working-age (ages 21to 64) people with disabilities using data from the 2011 American Community Survey(ACS). The US disability prevalence rate for this population was 10.5%
Location 2011 (%) Location 2011 (%)
Alabama 15.5 Montana 10.8
Alaska 10.6 Nebraska 8.8
Arizona 10.1 Nevada 10.3
Arkansas 15.5 New Hampshire 9.3
California 8.2 New Jersey 7.7
Colorado 8.8 New Mexico 11.8
Connecticut 8.3 New York 8.7
Delaware 10.5 North Carolina 11.9
District of Columbia 8.6 North Dakota 7.4
Florida 10.2 Ohio 12.1
Georgia 11.2 Oklahoma 15.0
Hawaii 7.3 Oregon 11.8
Idaho 11.2 Pennsylvania 11.4
Illinois 8.5 Puerto Rico 18.6
Indiana 11.9 Rhode Island 10.3
Iowa 9.4 South Carolina 13.0
Kansas 10.8 South Dakota 9.6
Kentucky 16.6 Tennessee 14.1
Louisiana 13.9 Texas 10.4
Maine 13.1 Utah 8.3
Maryland 8.5 Vermont 10.3
Massachusetts 9.3 Virginia 9.1
Michigan 12.7 Washington 10.8
Minnesota 7.9 West Virginia 17.8
Mississippi 15.6 Wisconsin 9.3
Missouri 12.8 Wyoming 9.9
2011 Disability Status Report - United States | © 2012 Cornell University 7
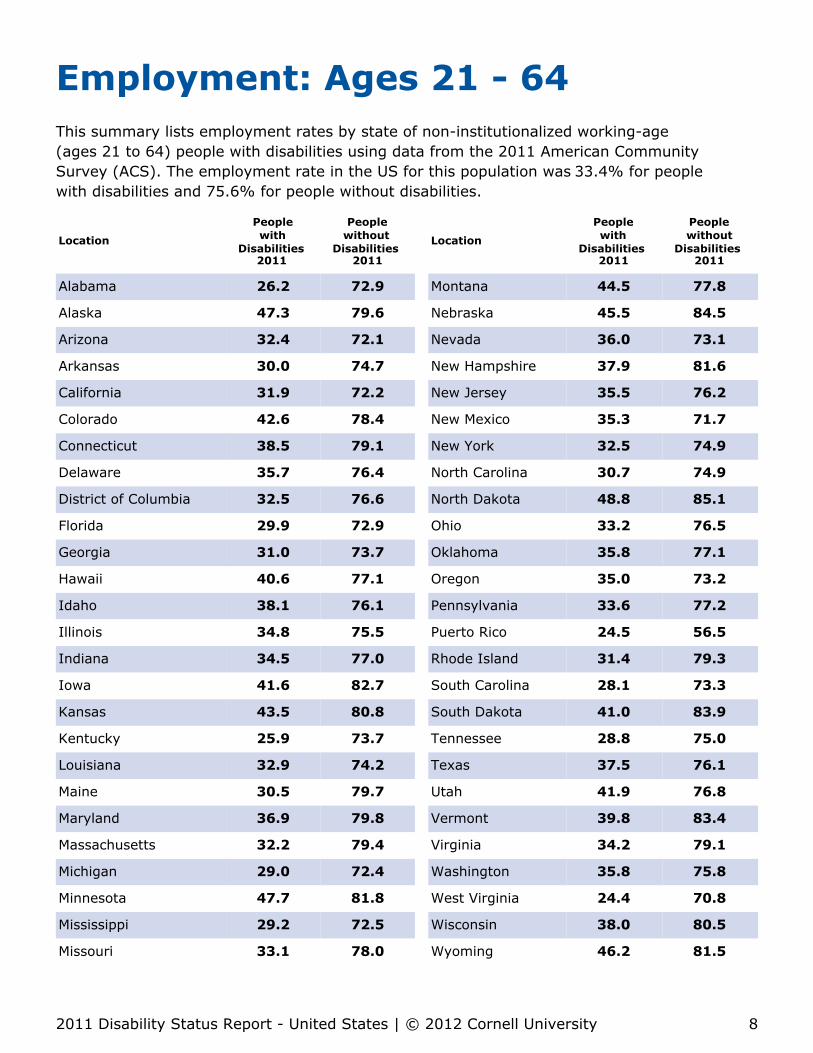
Employment: Ages 21 - 64This summary lists employment rates by state of non-institutionalized working-age(ages 21 to 64) people with disabilities using data from the 2011 American CommunitySurvey (ACS). The employment rate in the US for this population was 33.4% for peoplewith disabilities and 75.6% for people without disabilities.
Location
Peoplewith
Disabilities 2011
Peoplewithout
Disabilities 2011
Location
Peoplewith
Disabilities 2011
Peoplewithout
Disabilities 2011
Alabama 26.2 72.9 Montana 44.5 77.8
Alaska 47.3 79.6 Nebraska 45.5 84.5
Arizona 32.4 72.1 Nevada 36.0 73.1
Arkansas 30.0 74.7 New Hampshire 37.9 81.6
California 31.9 72.2 New Jersey 35.5 76.2
Colorado 42.6 78.4 New Mexico 35.3 71.7
Connecticut 38.5 79.1 New York 32.5 74.9
Delaware 35.7 76.4 North Carolina 30.7 74.9
District of Columbia 32.5 76.6 North Dakota 48.8 85.1
Florida 29.9 72.9 Ohio 33.2 76.5
Georgia 31.0 73.7 Oklahoma 35.8 77.1
Hawaii 40.6 77.1 Oregon 35.0 73.2
Idaho 38.1 76.1 Pennsylvania 33.6 77.2
Illinois 34.8 75.5 Puerto Rico 24.5 56.5
Indiana 34.5 77.0 Rhode Island 31.4 79.3
Iowa 41.6 82.7 South Carolina 28.1 73.3
Kansas 43.5 80.8 South Dakota 41.0 83.9
Kentucky 25.9 73.7 Tennessee 28.8 75.0
Louisiana 32.9 74.2 Texas 37.5 76.1
Maine 30.5 79.7 Utah 41.9 76.8
Maryland 36.9 79.8 Vermont 39.8 83.4
Massachusetts 32.2 79.4 Virginia 34.2 79.1
Michigan 29.0 72.4 Washington 35.8 75.8
Minnesota 47.7 81.8 West Virginia 24.4 70.8
Mississippi 29.2 72.5 Wisconsin 38.0 80.5
Missouri 33.1 78.0 Wyoming 46.2 81.5
2011 Disability Status Report - United States | © 2012 Cornell University 8

PrevalenceAll Ages
Introduction
This section addresses the prevalence of disability amongnon-institutionalized people of all ages in the United States, using datafrom the 2011 American Community Survey (ACS). For definitions ofterms, see Glossary.
Quick Statistics
Prevalence:All Ages
12.1%
In 2011, the overall percentage (prevalence rate) ofpeople with a disability of all ages in the US was 12.1percent.In other words, in 2011, 37,326,100 of the307,593,600 individuals of all ages in the US reportedone or more disabilities.In the US in 2011, among the six types of disabilitiesidentified in the ACS, the highest prevalence rate wasfor "Ambulatory Disability," 6.9 percent. The lowestprevalence rate was for "Visual Disability," 2.2percent.
2011 Disability Status Report - United States | © 2012 Cornell University 9
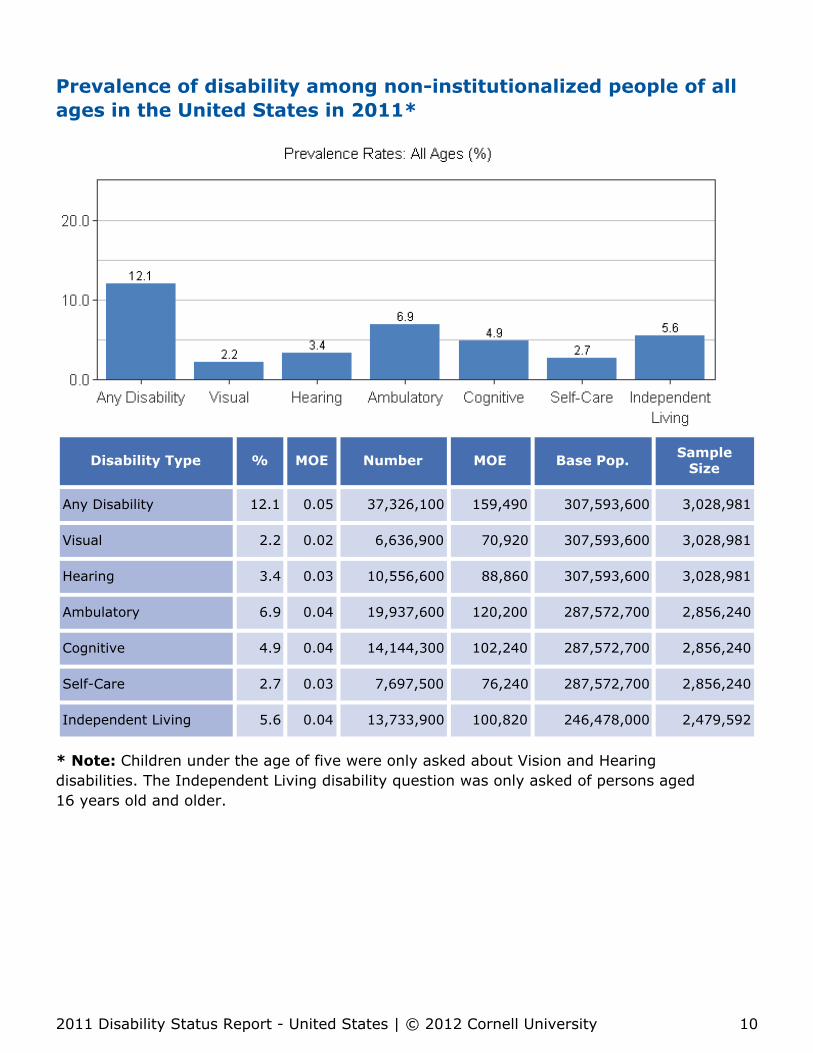
Prevalence of disability among non-institutionalized people of allages in the United States in 2011*
Disability Type % MOE Number MOE Base Pop. SampleSize
Any Disability 12.1 0.05 37,326,100 159,490 307,593,600 3,028,981
Visual 2.2 0.02 6,636,900 70,920 307,593,600 3,028,981
Hearing 3.4 0.03 10,556,600 88,860 307,593,600 3,028,981
Ambulatory 6.9 0.04 19,937,600 120,200 287,572,700 2,856,240
Cognitive 4.9 0.04 14,144,300 102,240 287,572,700 2,856,240
Self-Care 2.7 0.03 7,697,500 76,240 287,572,700 2,856,240
Independent Living 5.6 0.04 13,733,900 100,820 246,478,000 2,479,592
* Note: Children under the age of five were only asked about Vision and Hearingdisabilities. The Independent Living disability question was only asked of persons aged16 years old and older.
2011 Disability Status Report - United States | © 2012 Cornell University 10

PrevalenceAges 4 years and under
Introduction
This section focuses on the prevalence of disability amongnon-institutionalized children ages 4 and under in the United States,using data from the 2011 American Community Survey (ACS). Only thetwo sensory disability questions were asked of this population. Fordefinitions of terms, see Glossary.
Quick Statistics
Prevalence:Ages 4 and
under
0.8%
In 2011, the overall percentage (prevalence rate) ofchildren with a visual and/or hearing disability ages 0 to4 in the US was 0.8 percent.In other words, in 2011, 159,000 of the 20,020,800children ages 0 to 4 in the US reported one or moredisabilities.In the US in 2011, 0.5 percent reported a visualdisabilityIn the US in 2011, 0.6 percent reported a hearingdisability
2011 Disability Status Report - United States | © 2012 Cornell University 11
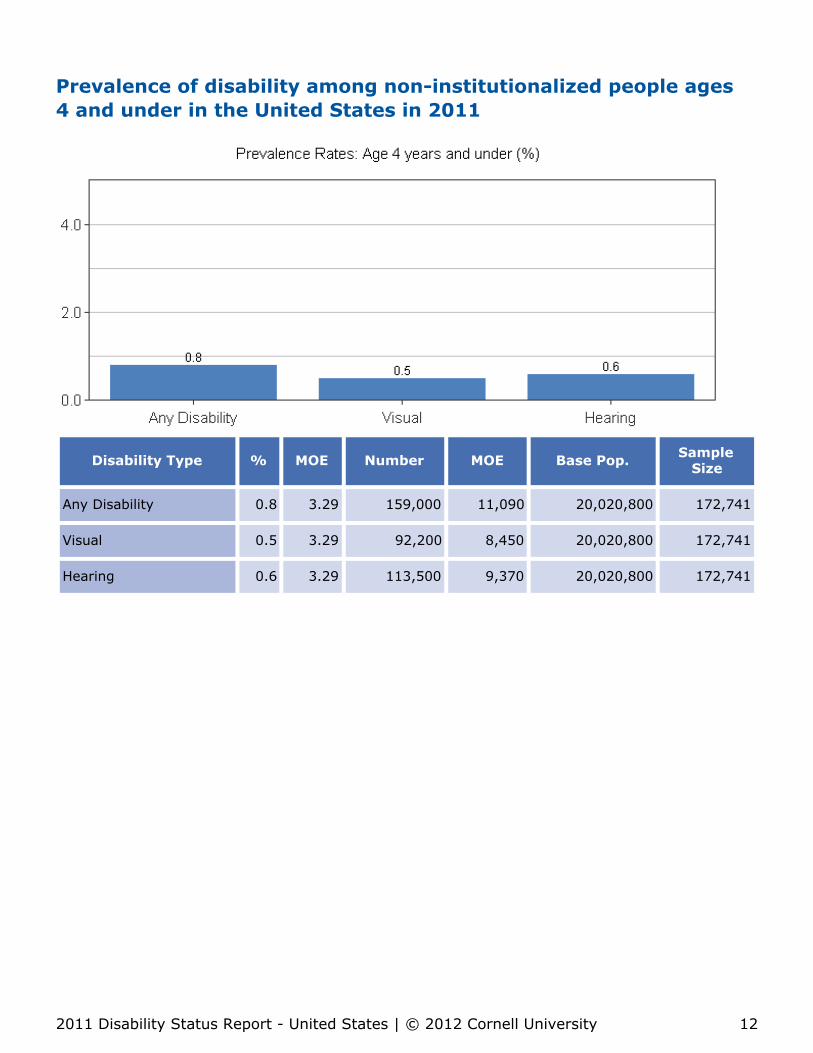
Prevalence of disability among non-institutionalized people ages4 and under in the United States in 2011
Disability Type % MOE Number MOE Base Pop. SampleSize
Any Disability 0.8 3.29 159,000 11,090 20,020,800 172,741
Visual 0.5 3.29 92,200 8,450 20,020,800 172,741
Hearing 0.6 3.29 113,500 9,370 20,020,800 172,741
2011 Disability Status Report - United States | © 2012 Cornell University 12

PrevalenceAges 5 to 15 years
Introduction
This section focuses on the prevalence of disability amongnon-institutionalized children ages 5 to 15 in the United States, usingdata from the 2011 American Community Survey (ACS)*. For definitionsof terms, see Glossary.
Quick Statistics
Prevalence:Ages 5 to15 years
5.1%
In 2011, the overall percentage (prevalence rate) ofchildren with a disability ages 5 to 15 in the US was 5.1percent.In other words, in 2011, 2,328,700 of the 45,269,500individuals ages 5 to 15 in the US reported one or moredisabilities.In the US in 2011, among the five types of disabilities*identified in the ACS, the highest prevalence rate wasfor "Cognitive Disability," 3.9 percent. The lowestprevalence rate was for "Ambulatory Disability," 0.6percent.
* Note: The "Independent Living Disability" question was not asked of children ages15 years and younger.
2011 Disability Status Report - United States | © 2012 Cornell University 13
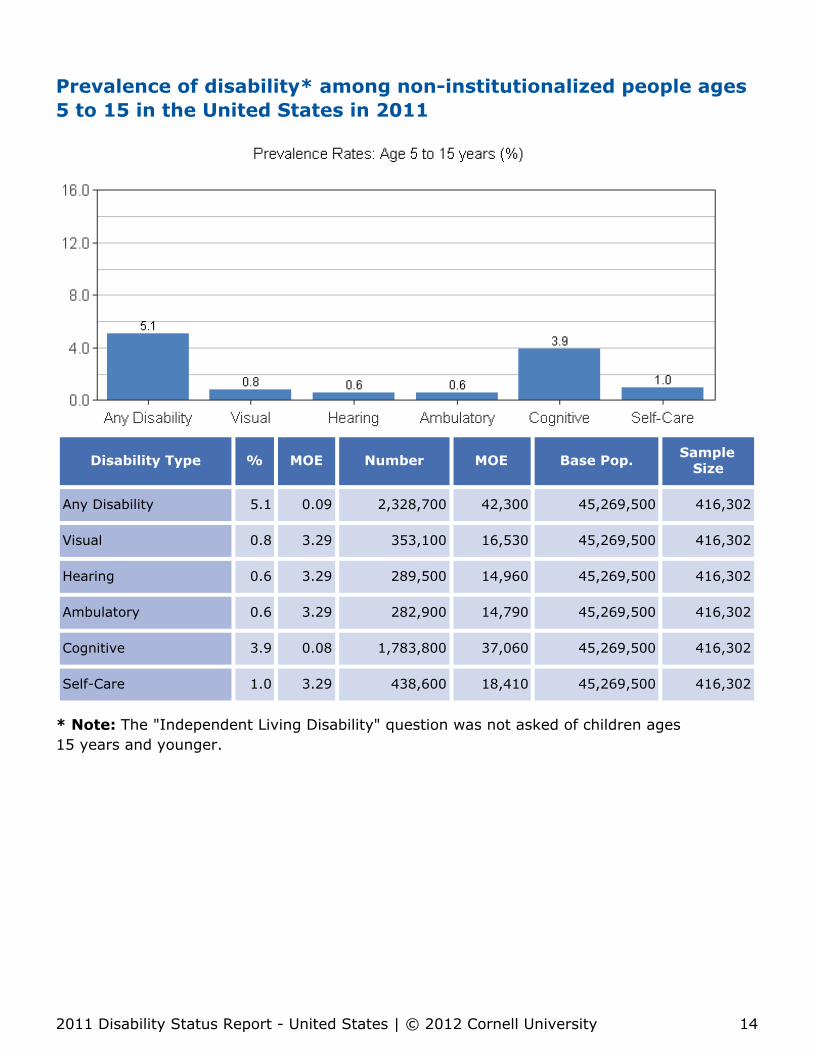
Prevalence of disability* among non-institutionalized people ages5 to 15 in the United States in 2011
Disability Type % MOE Number MOE Base Pop. SampleSize
Any Disability 5.1 0.09 2,328,700 42,300 45,269,500 416,302
Visual 0.8 3.29 353,100 16,530 45,269,500 416,302
Hearing 0.6 3.29 289,500 14,960 45,269,500 416,302
Ambulatory 0.6 3.29 282,900 14,790 45,269,500 416,302
Cognitive 3.9 0.08 1,783,800 37,060 45,269,500 416,302
Self-Care 1.0 3.29 438,600 18,410 45,269,500 416,302
* Note: The "Independent Living Disability" question was not asked of children ages15 years and younger.
2011 Disability Status Report - United States | © 2012 Cornell University 14
PrevalenceAges 16 to 20 years
Introduction
This section focuses on the prevalence of disability amongnon-institutionalized people ages 16 to 20 in the United States, usingdata from the 2011 American Community Survey (ACS). For definitions ofterms, see Glossary.
Quick Statistics
Prevalence:Ages 16 to20 years
5.6%
In 2011, the overall percentage (prevalence rate) ofpeople with a disability ages 16 to 20 in the US was 5.6percent.In other words, in 2011, 1,245,200 of the 22,177,100individuals ages 16 to 20 in the US reported one ormore disabilities.In the US in 2011, among the six types of disabilitiesidentified in the ACS, the highest prevalence rate wasfor "Cognitive Disability," 3.9 percent. The lowestprevalence rate was for "Hearing Disability," 0.7 percent.
2011 Disability Status Report - United States | © 2012 Cornell University 15

Prevalence of disability among non-institutionalized people ages16 to 20 in the United States in 2011
Disability Type % MOE Number MOE Base Pop. SampleSize
Any Disability 5.6 0.14 1,245,200 30,990 22,177,100 216,901
Visual 1.0 3.29 210,800 12,770 22,177,100 216,901
Hearing 0.7 3.29 152,200 10,850 22,177,100 216,901
Ambulatory 0.8 3.29 184,100 11,940 22,177,100 216,901
Cognitive 3.9 0.11 862,000 25,800 22,177,100 216,901
Self-Care 0.8 3.29 169,400 11,450 22,177,100 216,901
Independent Living 2.0 3.29 436,700 18,370 22,177,100 216,901
2011 Disability Status Report - United States | © 2012 Cornell University 16
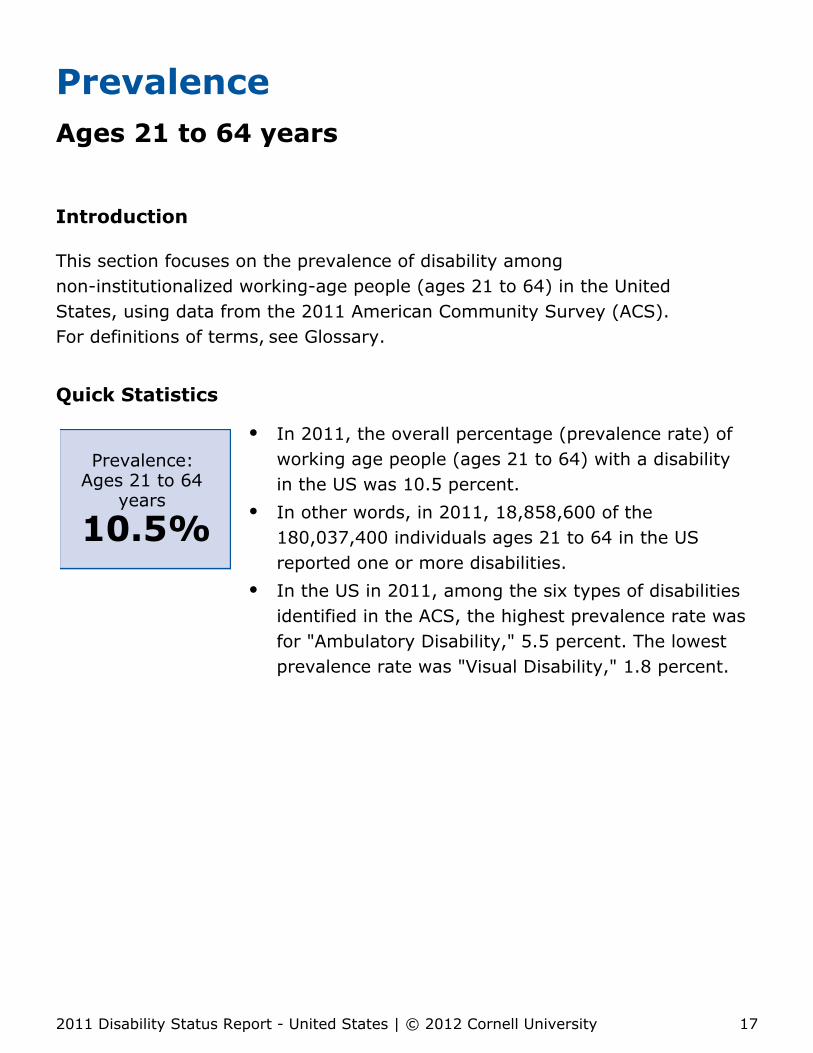
PrevalenceAges 21 to 64 years
Introduction
This section focuses on the prevalence of disability amongnon-institutionalized working-age people (ages 21 to 64) in the UnitedStates, using data from the 2011 American Community Survey (ACS).For definitions of terms, see Glossary.
Quick Statistics
Prevalence:Ages 21 to 64
years
10.5%
In 2011, the overall percentage (prevalence rate) ofworking age people (ages 21 to 64) with a disabilityin the US was 10.5 percent.In other words, in 2011, 18,858,600 of the180,037,400 individuals ages 21 to 64 in the USreported one or more disabilities.In the US in 2011, among the six types of disabilitiesidentified in the ACS, the highest prevalence rate wasfor "Ambulatory Disability," 5.5 percent. The lowestprevalence rate was "Visual Disability," 1.8 percent.
2011 Disability Status Report - United States | © 2012 Cornell University 17

Prevalence of disability among non-institutionalized people ages21 to 64 in the United States in 2011
Disability Type % MOE Number MOE Base Pop. SampleSize
Any Disability 10.5 0.06 18,858,600 117,120 180,037,400 1,727,008
Visual 1.8 3.29 3,237,100 49,800 180,037,400 1,727,008
Hearing 2.2 0.03 3,935,200 54,850 180,037,400 1,727,008
Ambulatory 5.5 0.05 9,969,000 86,440 180,037,400 1,727,008
Cognitive 4.3 0.04 7,684,000 76,170 180,037,400 1,727,008
Self-Care 2.0 3.29 3,525,400 51,950 180,037,400 1,727,008
Independent Living 3.7 0.04 6,671,300 71,090 180,037,400 1,727,008
2011 Disability Status Report - United States | © 2012 Cornell University 18
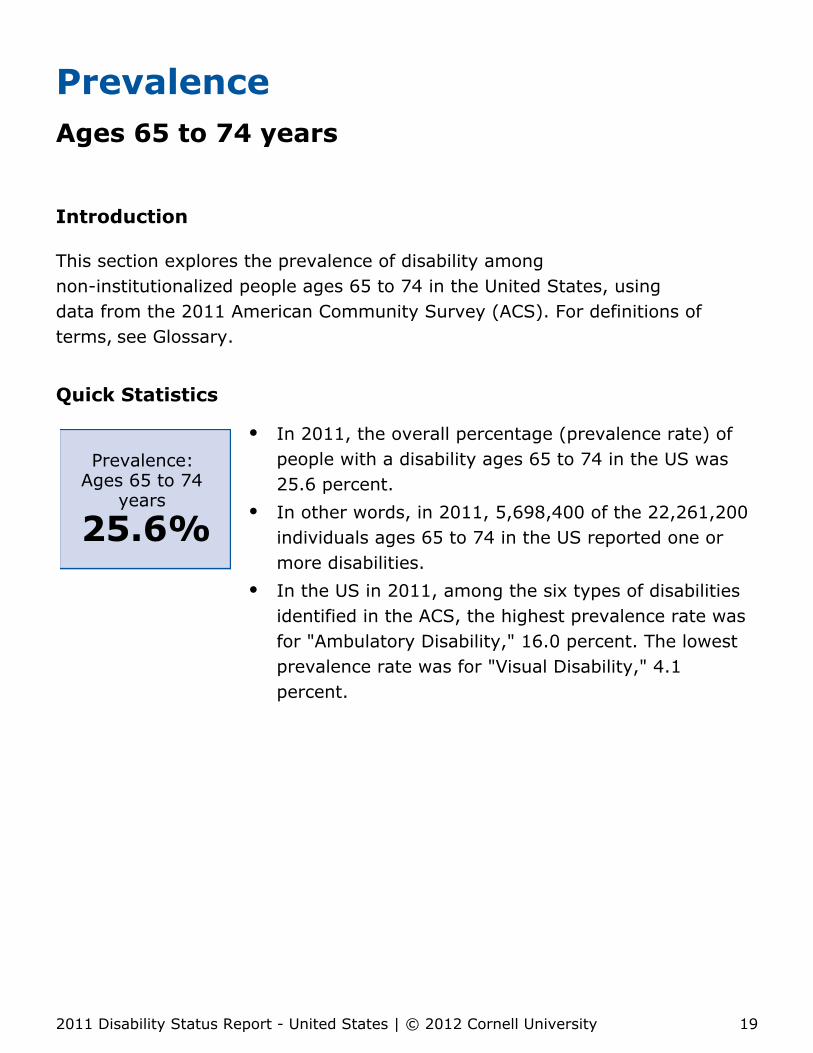
PrevalenceAges 65 to 74 years
Introduction
This section explores the prevalence of disability amongnon-institutionalized people ages 65 to 74 in the United States, usingdata from the 2011 American Community Survey (ACS). For definitions ofterms, see Glossary.
Quick Statistics
Prevalence:Ages 65 to 74
years
25.6%
In 2011, the overall percentage (prevalence rate) ofpeople with a disability ages 65 to 74 in the US was25.6 percent.In other words, in 2011, 5,698,400 of the 22,261,200individuals ages 65 to 74 in the US reported one ormore disabilities.In the US in 2011, among the six types of disabilitiesidentified in the ACS, the highest prevalence rate wasfor "Ambulatory Disability," 16.0 percent. The lowestprevalence rate was for "Visual Disability," 4.1percent.
2011 Disability Status Report - United States | © 2012 Cornell University 19

Prevalence of disability among non-institutionalized people ages65 to 74 in the United States in 2011
Disability Type % MOE Number MOE Base Pop. SampleSize
Any Disability 25.6 0.26 5,698,400 65,810 22,261,200 273,391
Visual 4.1 0.12 906,400 26,450 22,261,200 273,391
Hearing 9.1 0.17 2,024,400 39,460 22,261,200 273,391
Ambulatory 16.0 0.22 3,556,000 52,170 22,261,200 273,391
Cognitive 5.5 0.13 1,223,100 30,710 22,261,200 273,391
Self-Care 4.7 0.12 1,045,200 28,400 22,261,200 273,391
Independent Living 8.3 0.16 1,840,200 37,630 22,261,200 273,391
2011 Disability Status Report - United States | © 2012 Cornell University 20

PrevalenceAges 75 and Older
Introduction
This section focuses on the prevalence of disability amongnon-institutionalized people ages 75 and older in the United States, usingdata from the 2011 American Community Survey (ACS). For definitions ofterms, see Glossary.
Quick Statistics
Prevalence:Ages 75 and
Older
50.7%
In 2011, the overall percentage (prevalence rate) ofpeople with a disability ages 75 and older in the USwas 50.7 percent.In other words, in 2011, 9,036,200 of the 17,827,500individuals ages 75 and older in the US reported oneor more disabilities.In the US in 2011, among the six types of disabilitiesidentified in the ACS, the highest prevalence rate wasfor "Ambulatory Disability," 33.4 percent. The lowestprevalence rate was for "Visual Disability," 10.3percent.
2011 Disability Status Report - United States | © 2012 Cornell University 21
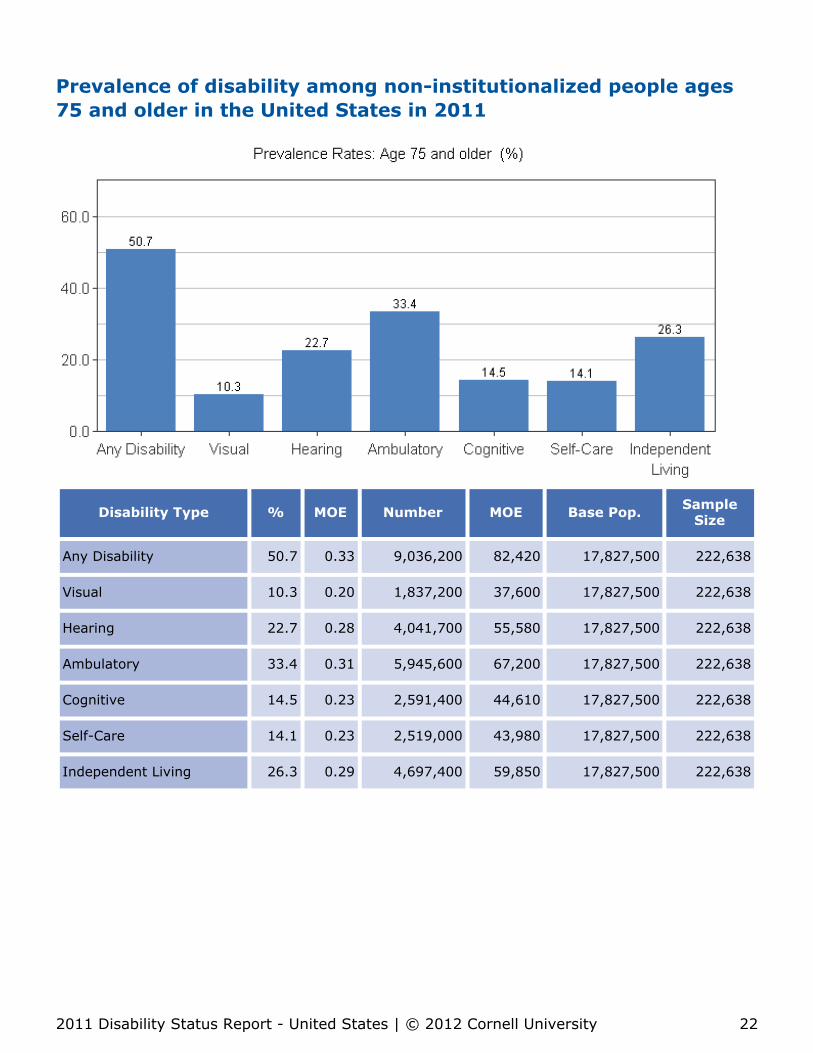
Prevalence of disability among non-institutionalized people ages75 and older in the United States in 2011
Disability Type % MOE Number MOE Base Pop. SampleSize
Any Disability 50.7 0.33 9,036,200 82,420 17,827,500 222,638
Visual 10.3 0.20 1,837,200 37,600 17,827,500 222,638
Hearing 22.7 0.28 4,041,700 55,580 17,827,500 222,638
Ambulatory 33.4 0.31 5,945,600 67,200 17,827,500 222,638
Cognitive 14.5 0.23 2,591,400 44,610 17,827,500 222,638
Self-Care 14.1 0.23 2,519,000 43,980 17,827,500 222,638
Independent Living 26.3 0.29 4,697,400 59,850 17,827,500 222,638
2011 Disability Status Report - United States | © 2012 Cornell University 22

PrevalenceGender and Age
Introduction
This section examines the prevalence of disability among people bygender and age group in the United States, using data from the 2011American Community Survey (ACS)*. For definitions of terms, seeGlossary.
Quick Statistics
Prevalence:Males All
Ages
11.9%
Prevalence:Female All
Ages
12.4%
In the US in 2011, the overall percentage (prevalencerate) of males with a disability of all ages was 11.9percent.In other words, in 2011, 17,845,600 of the150,504,500 males of all ages in the US reported oneor more disabilities.In the US in 2011, the overall percentage (prevalencerate) of females with a disability of all ages was 12.4percent.In other words, in 2011, 19,480,500 of the157,089,100 females of all ages in the US reportedone or more disabilities.
* Note: Children ages 0-4 were only asked about visual and hearing disabilities,children ages 5-15 were not asked the "Independent Living Disability" question.
2011 Disability Status Report - United States | © 2012 Cornell University 23

Prevalence of disability among non-institutionalized people bygender and age group in the United States in 2011
2011 Disability Status Report - United States | © 2012 Cornell University 24
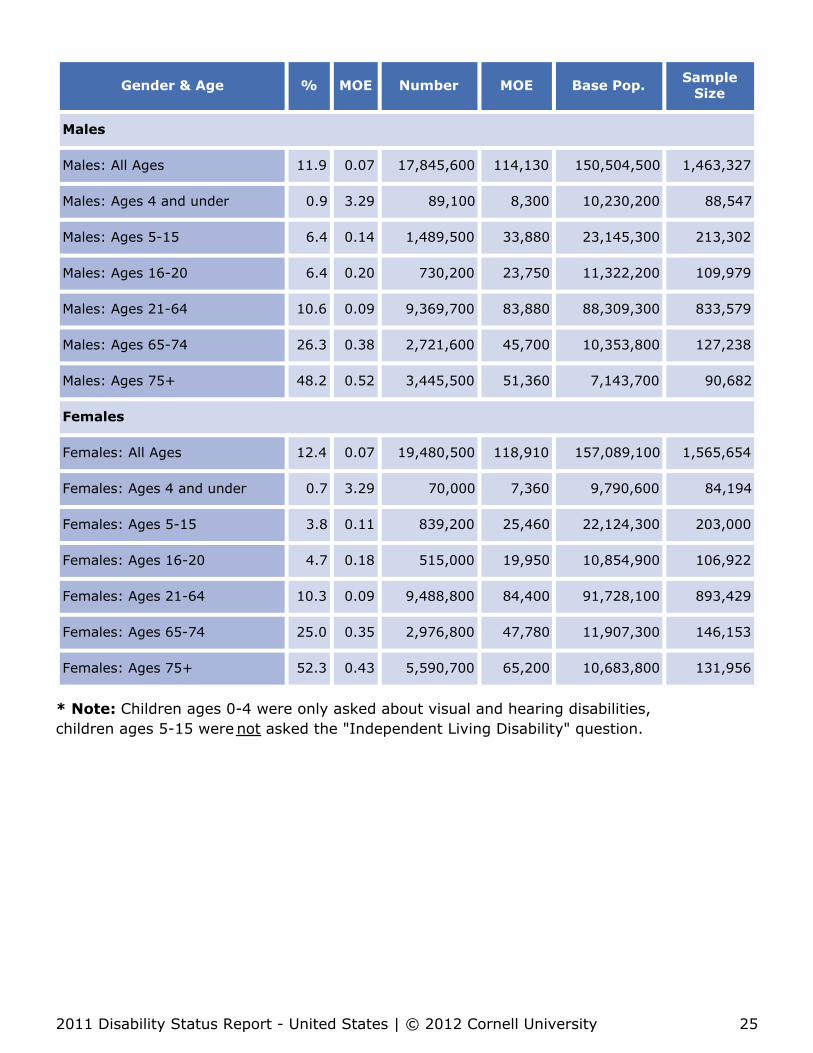
Gender & Age % MOE Number MOE Base Pop. SampleSize
Males
Males: All Ages 11.9 0.07 17,845,600 114,130 150,504,500 1,463,327
Males: Ages 4 and under 0.9 3.29 89,100 8,300 10,230,200 88,547
Males: Ages 5-15 6.4 0.14 1,489,500 33,880 23,145,300 213,302
Males: Ages 16-20 6.4 0.20 730,200 23,750 11,322,200 109,979
Males: Ages 21-64 10.6 0.09 9,369,700 83,880 88,309,300 833,579
Males: Ages 65-74 26.3 0.38 2,721,600 45,700 10,353,800 127,238
Males: Ages 75+ 48.2 0.52 3,445,500 51,360 7,143,700 90,682
Females
Females: All Ages 12.4 0.07 19,480,500 118,910 157,089,100 1,565,654
Females: Ages 4 and under 0.7 3.29 70,000 7,360 9,790,600 84,194
Females: Ages 5-15 3.8 0.11 839,200 25,460 22,124,300 203,000
Females: Ages 16-20 4.7 0.18 515,000 19,950 10,854,900 106,922
Females: Ages 21-64 10.3 0.09 9,488,800 84,400 91,728,100 893,429
Females: Ages 65-74 25.0 0.35 2,976,800 47,780 11,907,300 146,153
Females: Ages 75+ 52.3 0.43 5,590,700 65,200 10,683,800 131,956
* Note: Children ages 0-4 were only asked about visual and hearing disabilities,children ages 5-15 were not asked the "Independent Living Disability" question.
2011 Disability Status Report - United States | © 2012 Cornell University 25
PrevalenceHispanic/Latino Origin and Age
Introduction
This section examines the prevalence of disability among people byHispanic/Latino origin and age group in the United States, using datafrom the 2011 American Community Survey (ACS)*. For definitions ofterms, see Glossary.
Quick Statistics
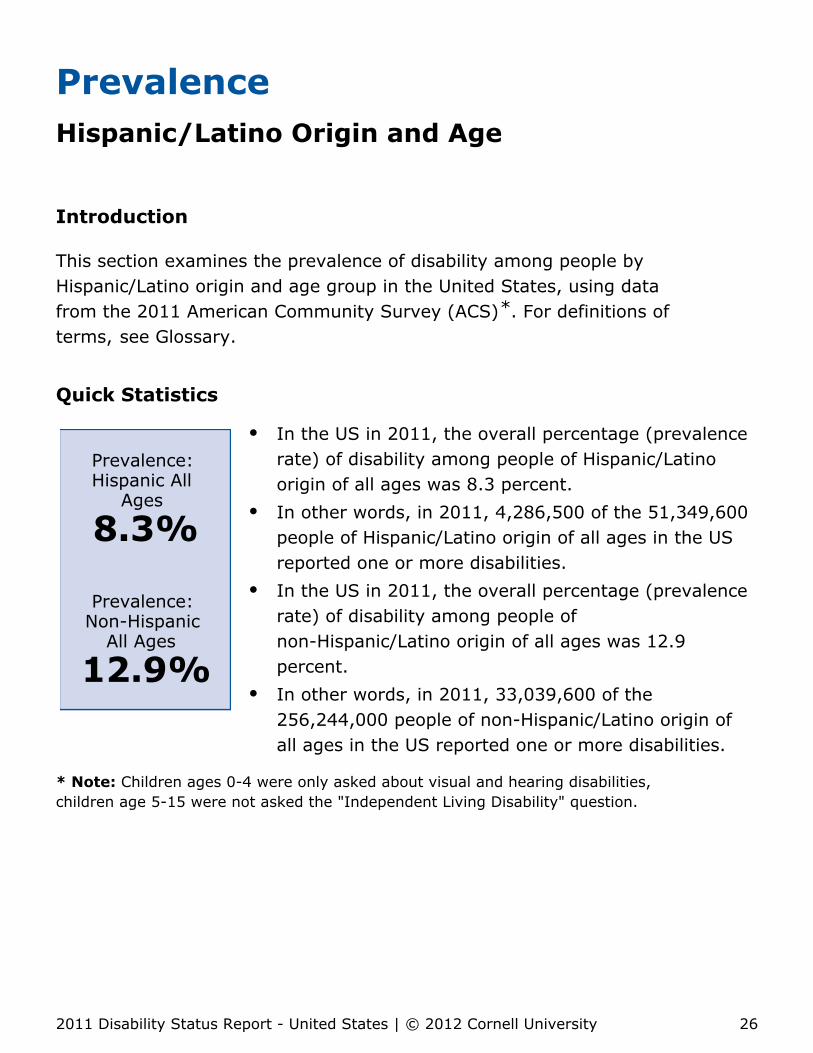
Prevalence:Hispanic All
Ages
8.3%
Prevalence:Non-Hispanic
All Ages
12.9%
In the US in 2011, the overall percentage (prevalencerate) of disability among people of Hispanic/Latinoorigin of all ages was 8.3 percent.In other words, in 2011, 4,286,500 of the 51,349,600people of Hispanic/Latino origin of all ages in the USreported one or more disabilities.In the US in 2011, the overall percentage (prevalencerate) of disability among people ofnon-Hispanic/Latino origin of all ages was 12.9percent.In other words, in 2011, 33,039,600 of the256,244,000 people of non-Hispanic/Latino origin ofall ages in the US reported one or more disabilities.
* Note: Children ages 0-4 were only asked about visual and hearing disabilities,children age 5-15 were not asked the "Independent Living Disability" question.
2011 Disability Status Report - United States | © 2012 Cornell University 26
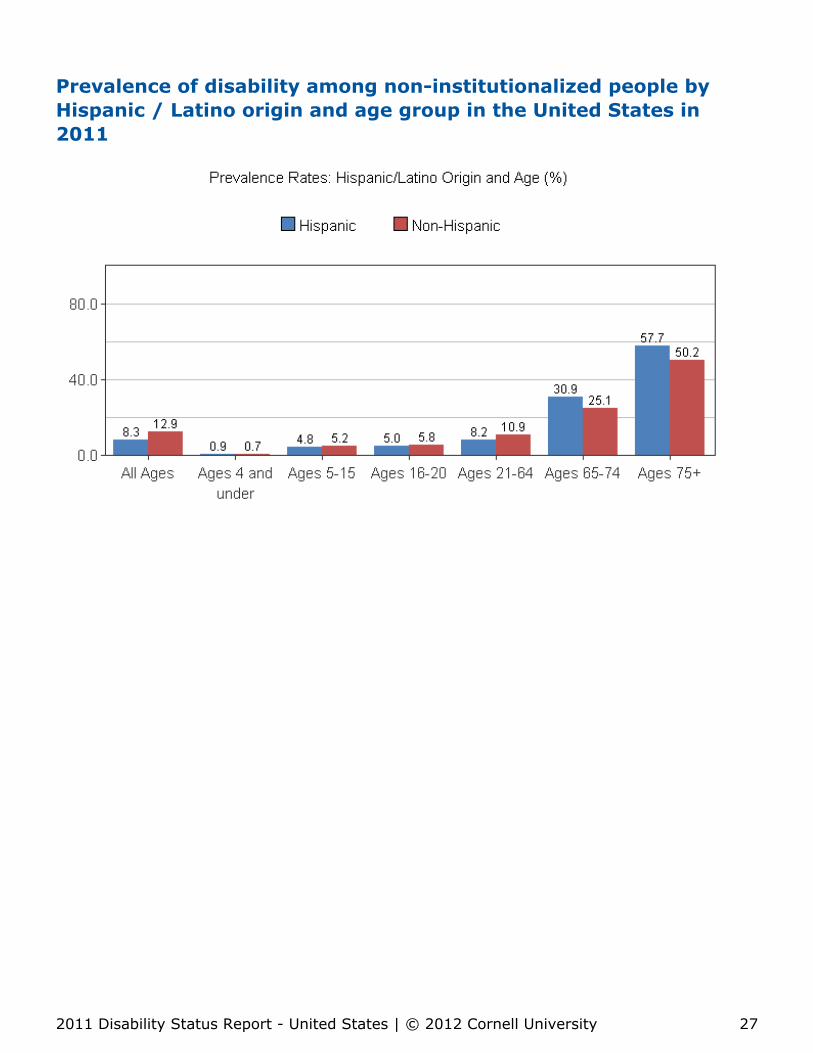
Prevalence of disability among non-institutionalized people byHispanic / Latino origin and age group in the United States in2011
2011 Disability Status Report - United States | © 2012 Cornell University 27

Hispanic/Latino Origin & Age % MOE Number MOE Base Pop. Sample
Size
Hispanic
Hispanic - All Ages 8.3 0.11 4,286,500 57,210 51,349,600 415,931
Hispanic - Ages 4 and under 0.9 3.29 48,200 6,110 5,141,000 38,279
Hispanic - Ages 5-15 4.8 0.18 502,800 19,710 10,423,200 84,330
Hispanic - Ages 16-20 5.0 0.28 231,300 13,380 4,668,100 38,500
Hispanic - Ages 21-64 8.2 0.14 2,303,300 42,070 28,234,700 224,062
Hispanic - Ages 65-74 30.9 0.98 534,700 20,330 1,728,500 18,094
Hispanic - Ages 75+ 57.7 1.28 666,200 22,690 1,154,100 12,666
Non-Hispanic
Non-Hispanic - All Ages 12.9 0.06 33,039,600 151,220 256,244,000 2,613,050
Non-Hispanic - Ages 4 and under 0.7 3.29 110,900 9,260 14,879,900 134,462
Non-Hispanic - Ages 5-15 5.2 0.11 1,825,900 37,490 34,846,400 331,972
Non-Hispanic - Ages 16-20 5.8 0.16 1,013,900 27,970 17,509,000 178,401
Non-Hispanic - Ages 21-64 10.9 0.07 16,555,300 110,170 151,802,700 1,502,946
Non-Hispanic - Ages 65-74 25.1 0.27 5,163,700 62,700 20,532,700 255,297
Non-Hispanic - Ages 75+ 50.2 0.34 8,369,900 79,410 16,673,400 209,972
* Note: Children ages 0-4 were only asked about visual and hearing disabilities,children ages 5-15 were not asked the "Independent Living Disability" question.
2011 Disability Status Report - United States | © 2012 Cornell University 28
PrevalenceRace
Introduction
This section presents the disability prevalence rate amongnon-institutionalized working-age people (ages 21 to 64) by racecategory in the US, using data from the 2011 American CommunitySurvey (ACS). For definitions of terms, see Glossary.
Quick Statistics
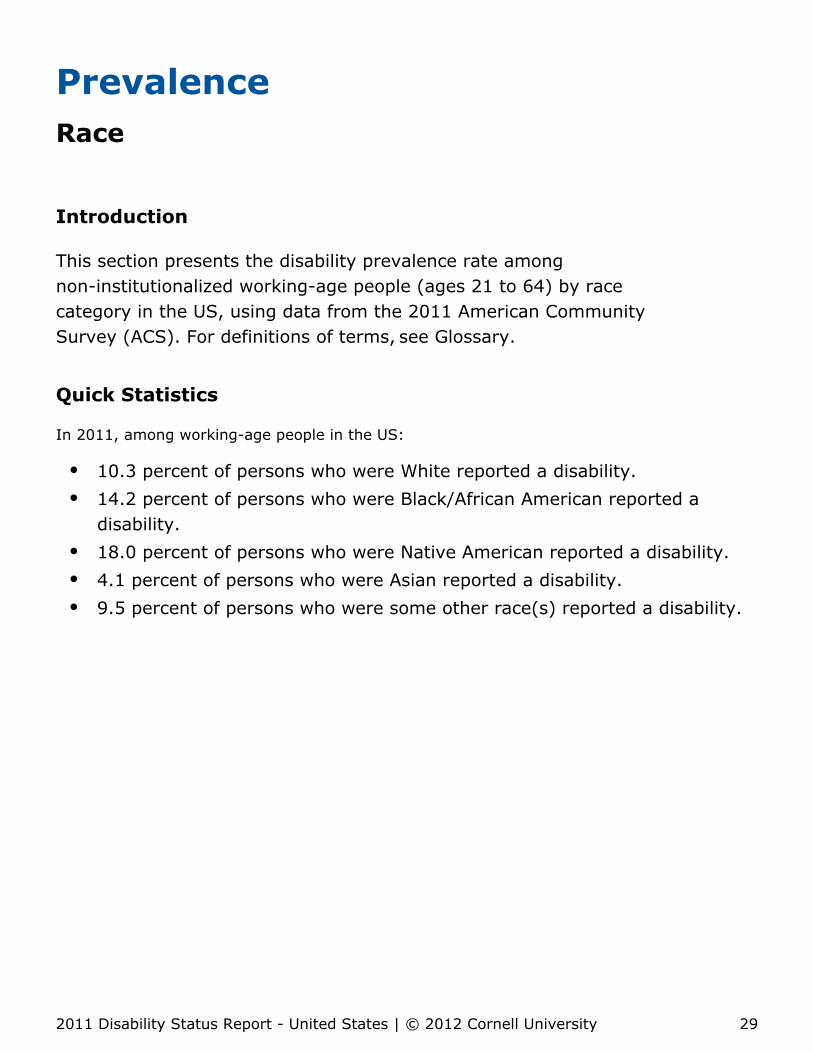
In 2011, among working-age people in the US:
10.3 percent of persons who were White reported a disability.14.2 percent of persons who were Black/African American reported adisability.18.0 percent of persons who were Native American reported a disability.4.1 percent of persons who were Asian reported a disability.9.5 percent of persons who were some other race(s) reported a disability.
2011 Disability Status Report - United States | © 2012 Cornell University 29
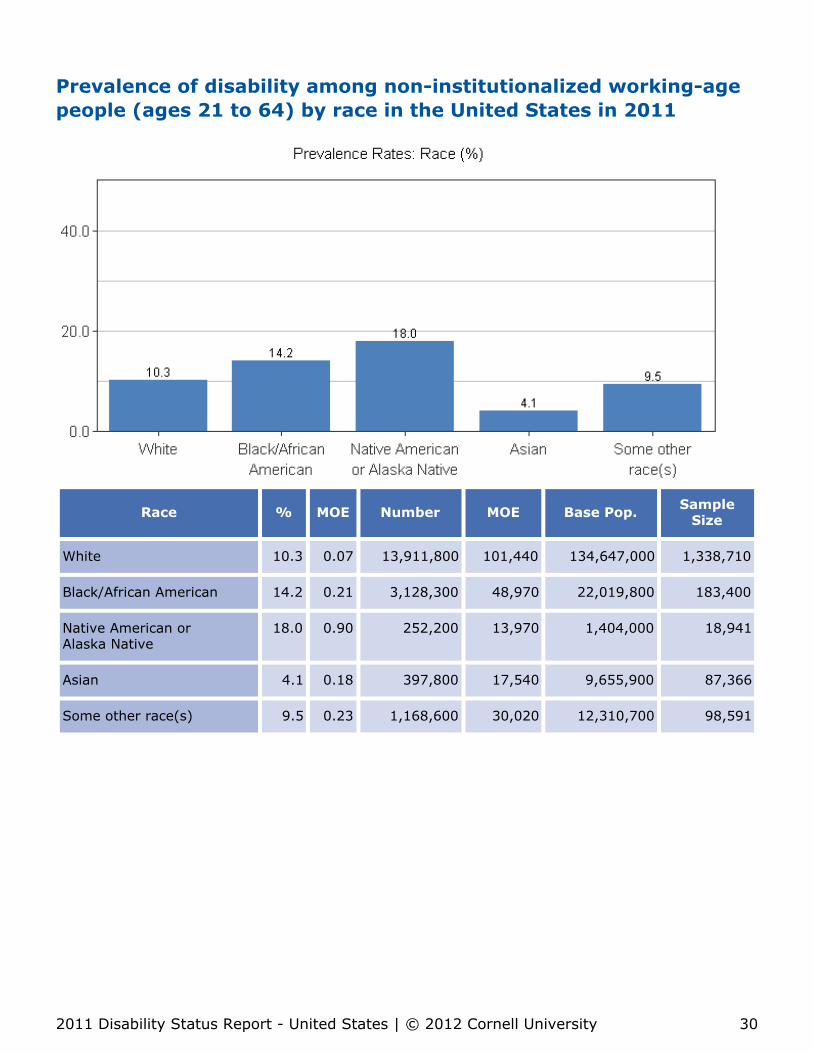
Prevalence of disability among non-institutionalized working-agepeople (ages 21 to 64) by race in the United States in 2011
Race % MOE Number MOE Base Pop. SampleSize
White 10.3 0.07 13,911,800 101,440 134,647,000 1,338,710
Black/African American 14.2 0.21 3,128,300 48,970 22,019,800 183,400
Native American orAlaska Native
18.0 0.90 252,200 13,970 1,404,000 18,941
Asian 4.1 0.18 397,800 17,540 9,655,900 87,366
Some other race(s) 9.5 0.23 1,168,600 30,020 12,310,700 98,591
2011 Disability Status Report - United States | © 2012 Cornell University 30
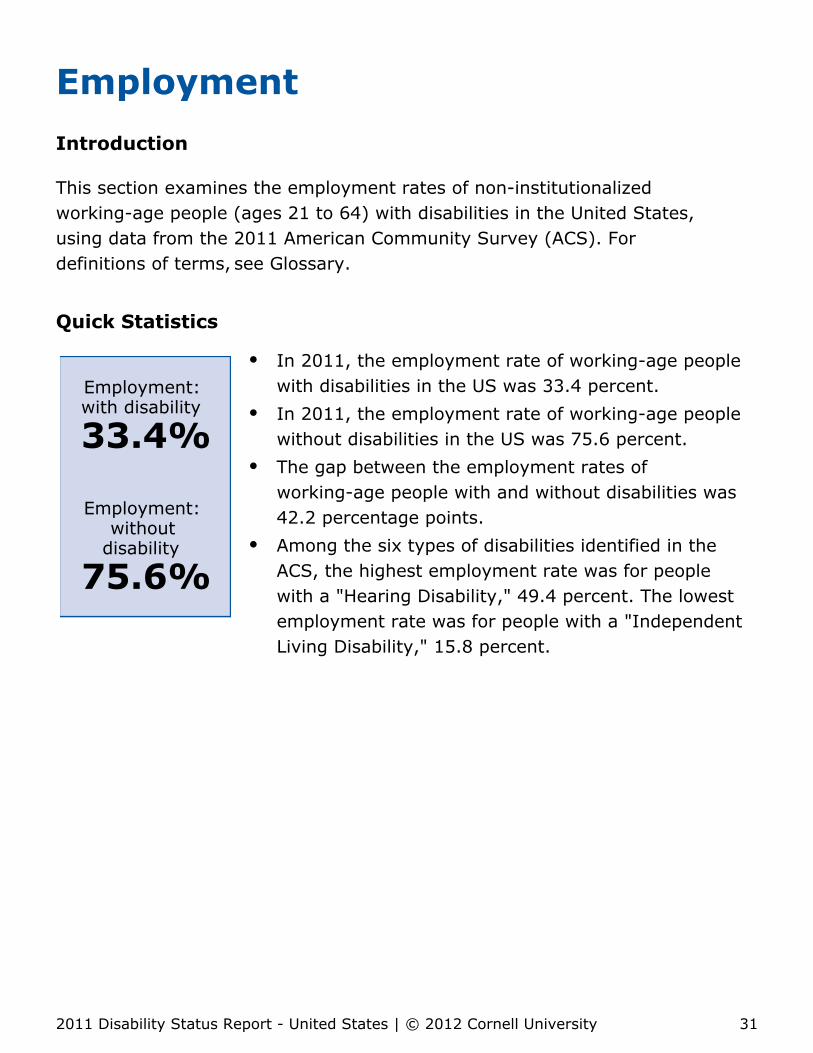
EmploymentIntroduction
This section examines the employment rates of non-institutionalizedworking-age people (ages 21 to 64) with disabilities in the United States,using data from the 2011 American Community Survey (ACS). Fordefinitions of terms, see Glossary.
Quick Statistics
Employment:with disability
33.4%
Employment:without
disability
75.6%
In 2011, the employment rate of working-age peoplewith disabilities in the US was 33.4 percent.In 2011, the employment rate of working-age peoplewithout disabilities in the US was 75.6 percent.The gap between the employment rates ofworking-age people with and without disabilities was42.2 percentage points.Among the six types of disabilities identified in theACS, the highest employment rate was for peoplewith a "Hearing Disability," 49.4 percent. The lowestemployment rate was for people with a "IndependentLiving Disability," 15.8 percent.
2011 Disability Status Report - United States | © 2012 Cornell University 31
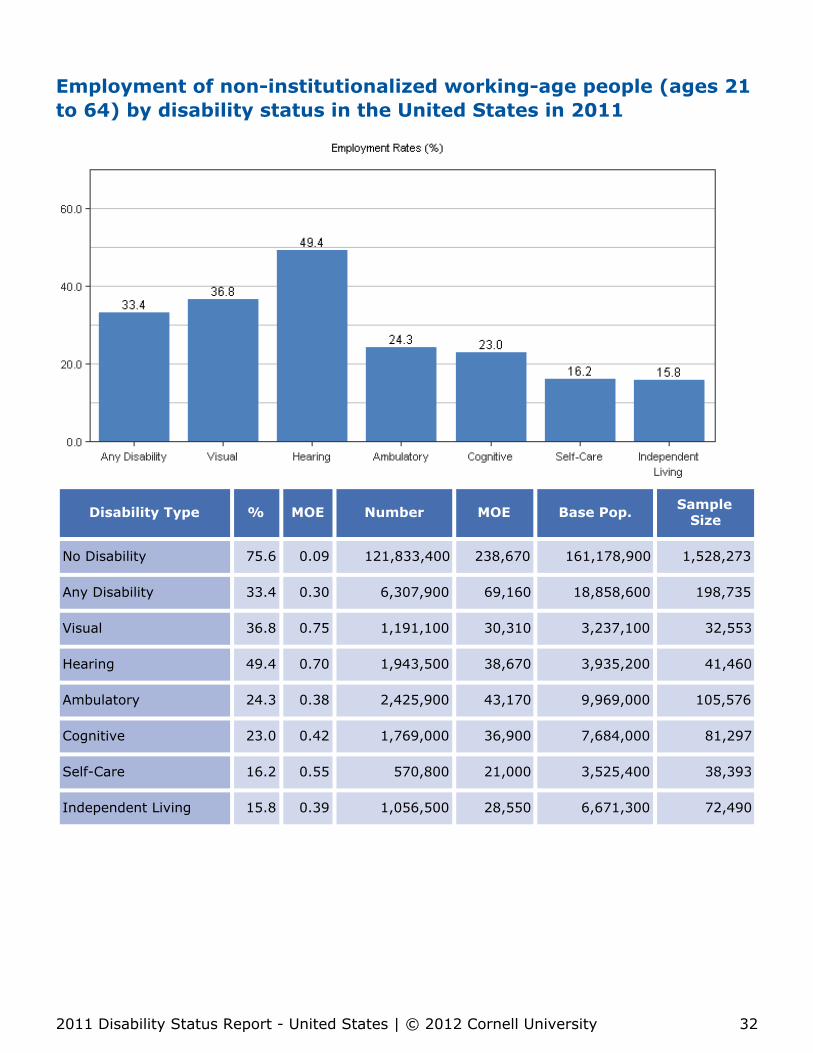
Employment of non-institutionalized working-age people (ages 21to 64) by disability status in the United States in 2011
Disability Type % MOE Number MOE Base Pop. SampleSize
No Disability 75.6 0.09 121,833,400 238,670 161,178,900 1,528,273
Any Disability 33.4 0.30 6,307,900 69,160 18,858,600 198,735
Visual 36.8 0.75 1,191,100 30,310 3,237,100 32,553
Hearing 49.4 0.70 1,943,500 38,670 3,935,200 41,460
Ambulatory 24.3 0.38 2,425,900 43,170 9,969,000 105,576
Cognitive 23.0 0.42 1,769,000 36,900 7,684,000 81,297
Self-Care 16.2 0.55 570,800 21,000 3,525,400 38,393
Independent Living 15.8 0.39 1,056,500 28,550 6,671,300 72,490
2011 Disability Status Report - United States | © 2012 Cornell University 32

Not Working but Actively Lookingfor WorkIntroduction
This section focuses on the percentage of non-institutionalizedworking-age people (ages 21 to 64) with disabilities in the United Stateswho are not working but actively looking for work, using data from the2011 American Community Survey (ACS). For definitions of terms, seeGlossary.
Quick Statistics
ActivelyLooking: with
disability
11.7%
ActivelyLooking:without
disability
29.4%
In 2011 in the US, the percentage of working-agepeople with disabilities who were not working butactively looking for work was 11.7 percent.In 2011 in the US, the percentage of working-agepeople without disabilities who were not working butactively looking for work was 29.4 percent.The difference in the percentage of not working butactively looking for work between working-agepeople with and without disabilities was 17.7percentage points.Among the six types of disabilities identified in theACS, the highest percentage of not working butactively looking for work was for people with a"Hearing Disability," 14.8 percent. The lowestpercentage was for people with a "Self-CareDisability," 5.1 percent.
2011 Disability Status Report - United States | © 2012 Cornell University 33
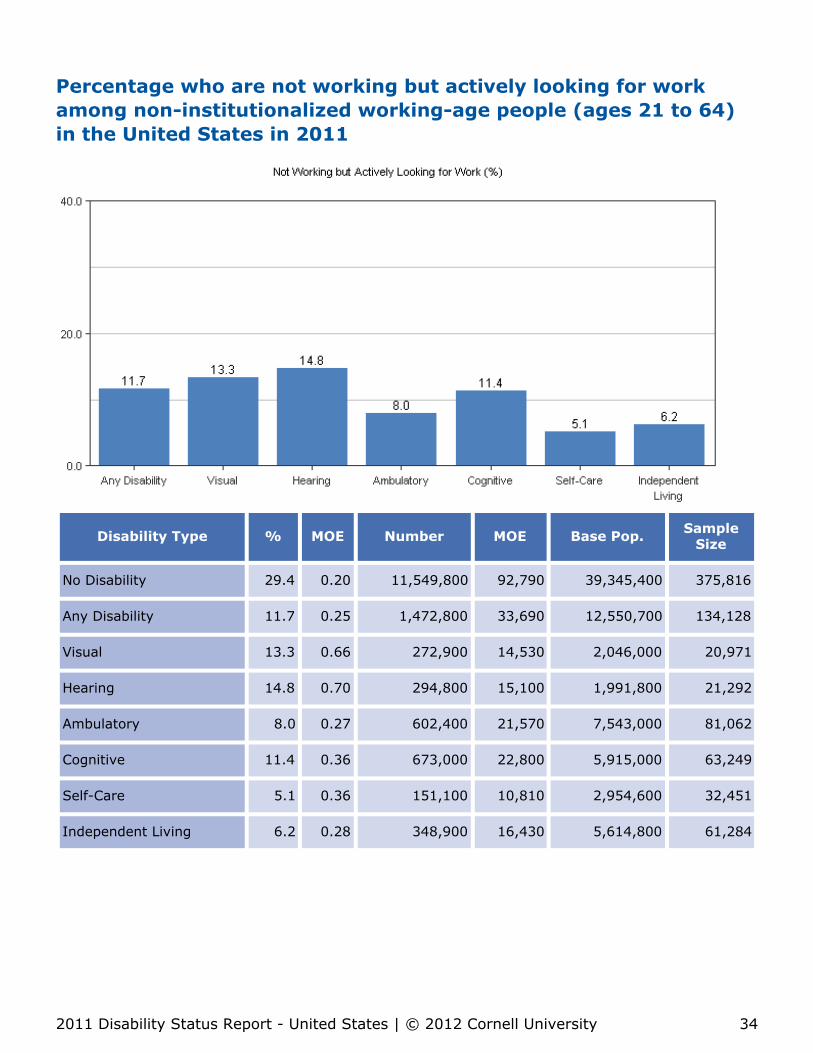
Percentage who are not working but actively looking for workamong non-institutionalized working-age people (ages 21 to 64)in the United States in 2011
Disability Type % MOE Number MOE Base Pop. SampleSize
No Disability 29.4 0.20 11,549,800 92,790 39,345,400 375,816
Any Disability 11.7 0.25 1,472,800 33,690 12,550,700 134,128
Visual 13.3 0.66 272,900 14,530 2,046,000 20,971
Hearing 14.8 0.70 294,800 15,100 1,991,800 21,292
Ambulatory 8.0 0.27 602,400 21,570 7,543,000 81,062
Cognitive 11.4 0.36 673,000 22,800 5,915,000 63,249
Self-Care 5.1 0.36 151,100 10,810 2,954,600 32,451
Independent Living 6.2 0.28 348,900 16,430 5,614,800 61,284
2011 Disability Status Report - United States | © 2012 Cornell University 34
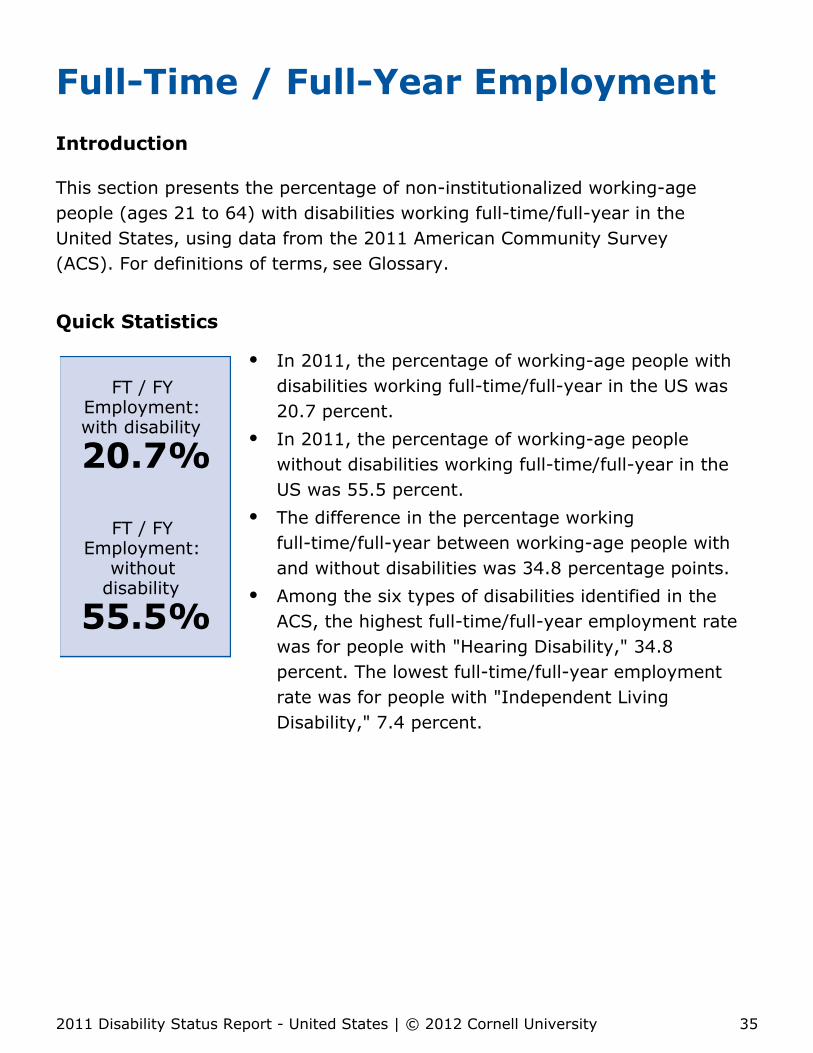
Full-Time / Full-Year EmploymentIntroduction
This section presents the percentage of non-institutionalized working-agepeople (ages 21 to 64) with disabilities working full-time/full-year in theUnited States, using data from the 2011 American Community Survey(ACS). For definitions of terms, see Glossary.
Quick Statistics
FT / FYEmployment:with disability
20.7%
FT / FYEmployment:
withoutdisability
55.5%
In 2011, the percentage of working-age people withdisabilities working full-time/full-year in the US was20.7 percent.In 2011, the percentage of working-age peoplewithout disabilities working full-time/full-year in theUS was 55.5 percent.The difference in the percentage workingfull-time/full-year between working-age people withand without disabilities was 34.8 percentage points.Among the six types of disabilities identified in theACS, the highest full-time/full-year employment ratewas for people with "Hearing Disability," 34.8percent. The lowest full-time/full-year employmentrate was for people with "Independent LivingDisability," 7.4 percent.
2011 Disability Status Report - United States | © 2012 Cornell University 35
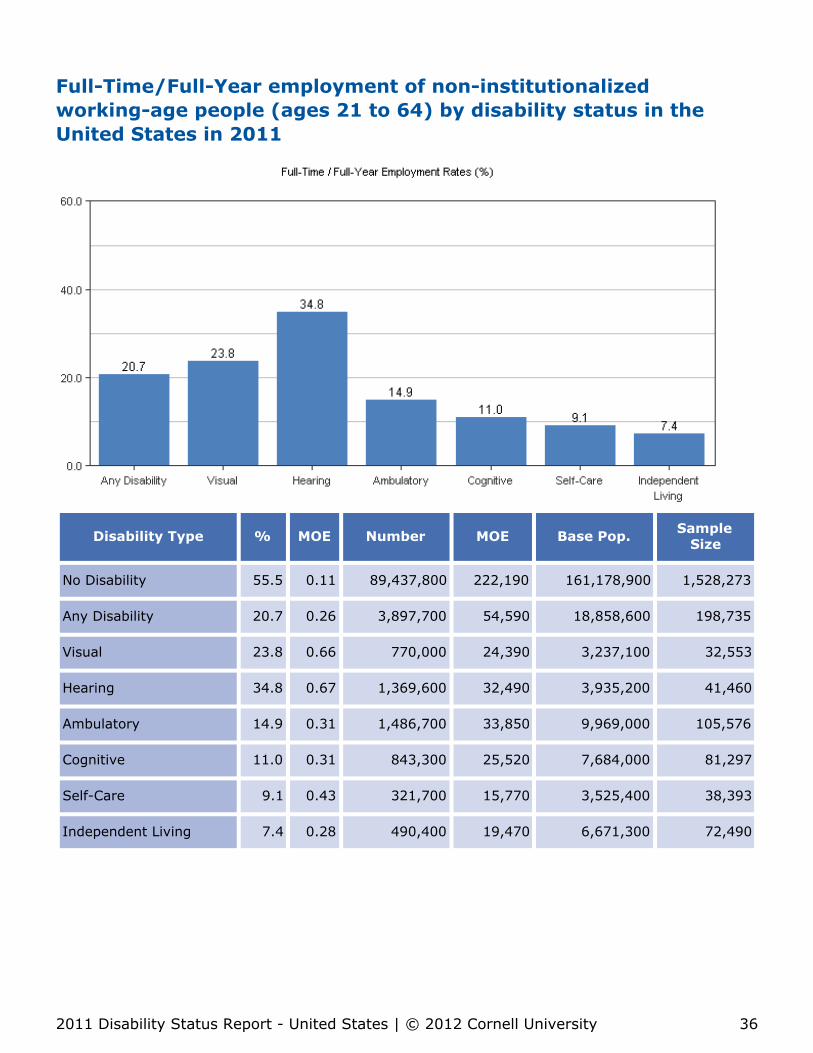
Full-Time/Full-Year employment of non-institutionalizedworking-age people (ages 21 to 64) by disability status in theUnited States in 2011
Disability Type % MOE Number MOE Base Pop. SampleSize
No Disability 55.5 0.11 89,437,800 222,190 161,178,900 1,528,273
Any Disability 20.7 0.26 3,897,700 54,590 18,858,600 198,735
Visual 23.8 0.66 770,000 24,390 3,237,100 32,553
Hearing 34.8 0.67 1,369,600 32,490 3,935,200 41,460
Ambulatory 14.9 0.31 1,486,700 33,850 9,969,000 105,576
Cognitive 11.0 0.31 843,300 25,520 7,684,000 81,297
Self-Care 9.1 0.43 321,700 15,770 3,525,400 38,393
Independent Living 7.4 0.28 490,400 19,470 6,671,300 72,490
2011 Disability Status Report - United States | © 2012 Cornell University 36

Annual Earnings (Full-Time /Full-Year workers)Introduction
This section examines the median annual earnings ofnon-institutionalized working-age people (ages 21 to 64) with disabilitieswho work full-time/full-year in the United States, using data from the2011 American Community Survey (ACS). For definitions of terms, seeGlossary.
Quick Statistics
Earnings: withdisability
$36,700
Earnings:without disability
$42,800
In 2011, the median earnings of working-agepeople with disabilities who workedfull-time/full-year in the US was $36,700.In 2011, the median earnings of working-agepeople without disabilities who workedfull-time/full-year in the US was $42,800.The difference in the median earnings betweenworking-age people with and without disabilitieswho worked full-time/full-year was $6,100.Among the six types of disabilities identified in theACS, the highest annual earnings was for peoplewith "Hearing Disability," $40,700. The lowestannual earnings was for people with "CognitiveDisability," $30,500.
2011 Disability Status Report - United States | © 2012 Cornell University 37
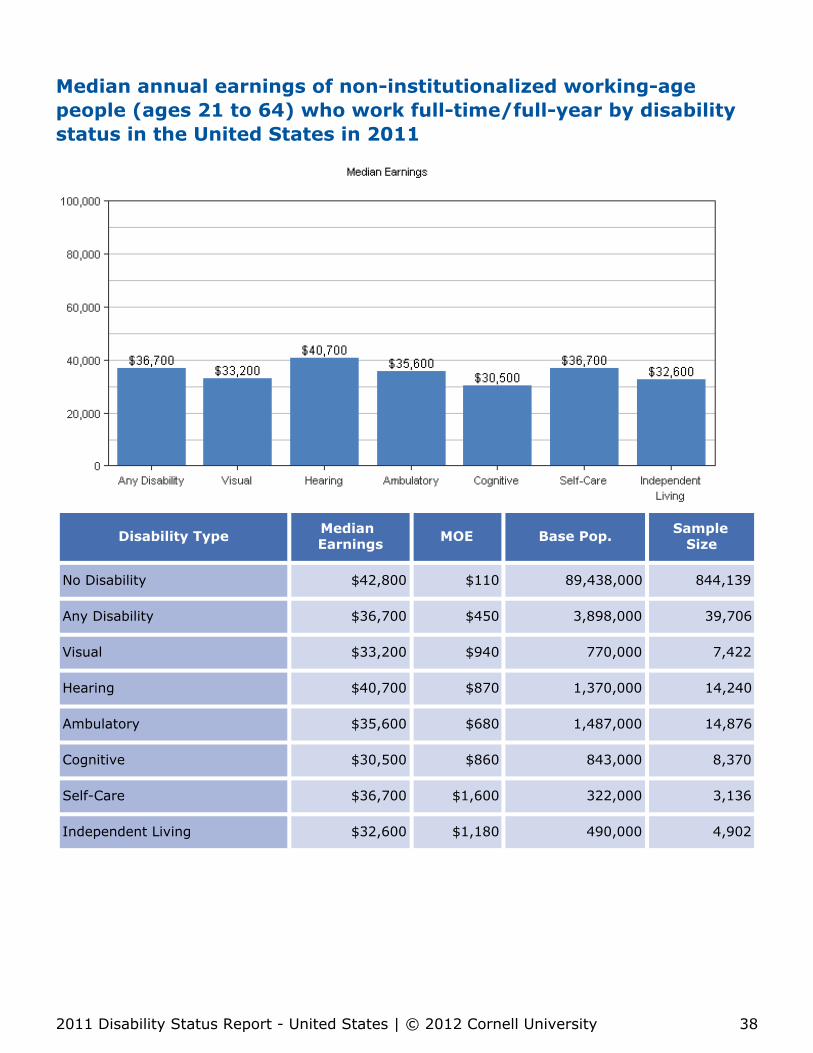
Median annual earnings of non-institutionalized working-agepeople (ages 21 to 64) who work full-time/full-year by disabilitystatus in the United States in 2011
Disability Type Median Earnings MOE Base Pop. Sample
Size
No Disability $42,800 $110 89,438,000 844,139
Any Disability $36,700 $450 3,898,000 39,706
Visual $33,200 $940 770,000 7,422
Hearing $40,700 $870 1,370,000 14,240
Ambulatory $35,600 $680 1,487,000 14,876
Cognitive $30,500 $860 843,000 8,370
Self-Care $36,700 $1,600 322,000 3,136
Independent Living $32,600 $1,180 490,000 4,902
2011 Disability Status Report - United States | © 2012 Cornell University 38
Annual Household IncomeIntroduction
This section illustrates the median annual income* of households thatinclude any working-age people (ages 21 to 64) with disabilities in theUnited States, using data from the 2011 American Community Survey(ACS). For definitions of terms, see Glossary.
Quick Statistics
HouseholdIncome: with
disability
$36,700
HouseholdIncome: without
disability
$60,400
In 2011, the median income of households thatinclude any working-age people with disabilities inthe US was $36,700.In 2011, the median income of households that donot include any working-age people withdisabilities in the US was $60,400.The difference in the median income betweenhouseholds including and not includingworking-age people with disabilities was $23,700.Among the six types of disabilities identified in theACS, the highest median income was forhouseholds including persons with a "HearingDisability," $47,200. The lowest median incomewas for households containing persons with a"Cognitive Disability" $30,500 .
* Note: Household income is not available for persons living in group quarters.
2011 Disability Status Report - United States | © 2012 Cornell University 39
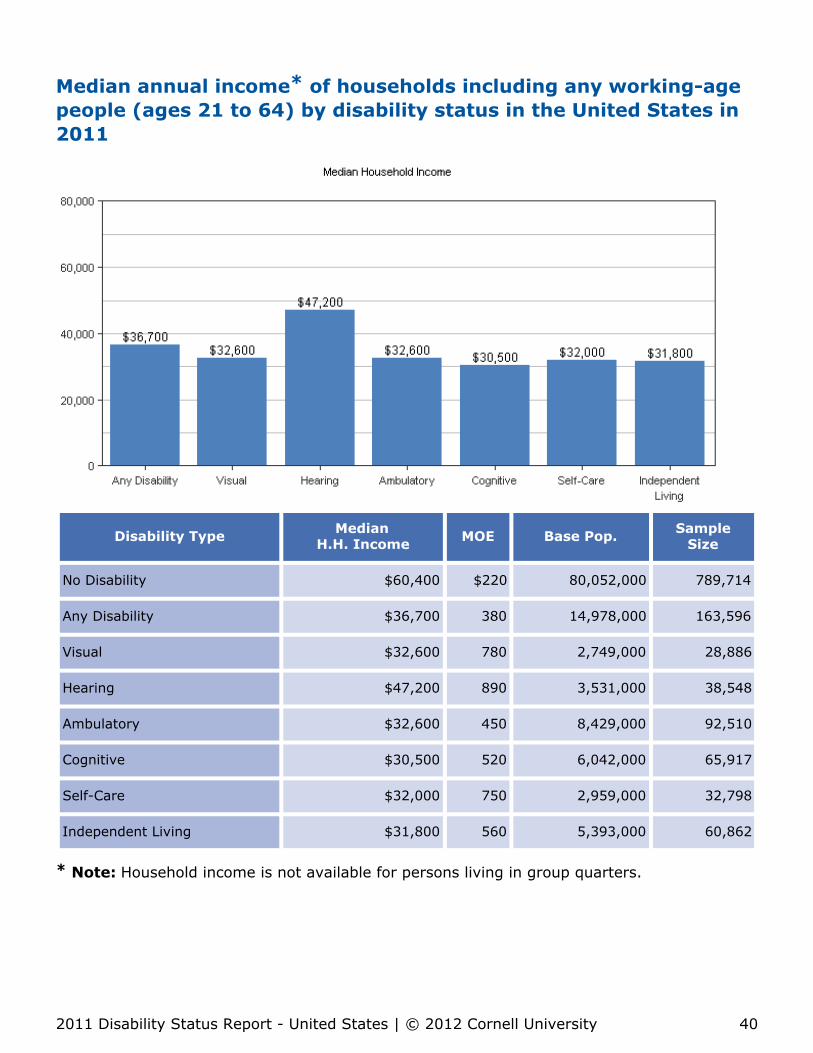
Median annual income* of households including any working-agepeople (ages 21 to 64) by disability status in the United States in2011
Disability Type MedianH.H. Income MOE Base Pop. Sample
Size
No Disability $60,400 $220 80,052,000 789,714
Any Disability $36,700 380 14,978,000 163,596
Visual $32,600 780 2,749,000 28,886
Hearing $47,200 890 3,531,000 38,548
Ambulatory $32,600 450 8,429,000 92,510
Cognitive $30,500 520 6,042,000 65,917
Self-Care $32,000 750 2,959,000 32,798
Independent Living $31,800 560 5,393,000 60,862
* Note: Household income is not available for persons living in group quarters.
2011 Disability Status Report - United States | © 2012 Cornell University 40
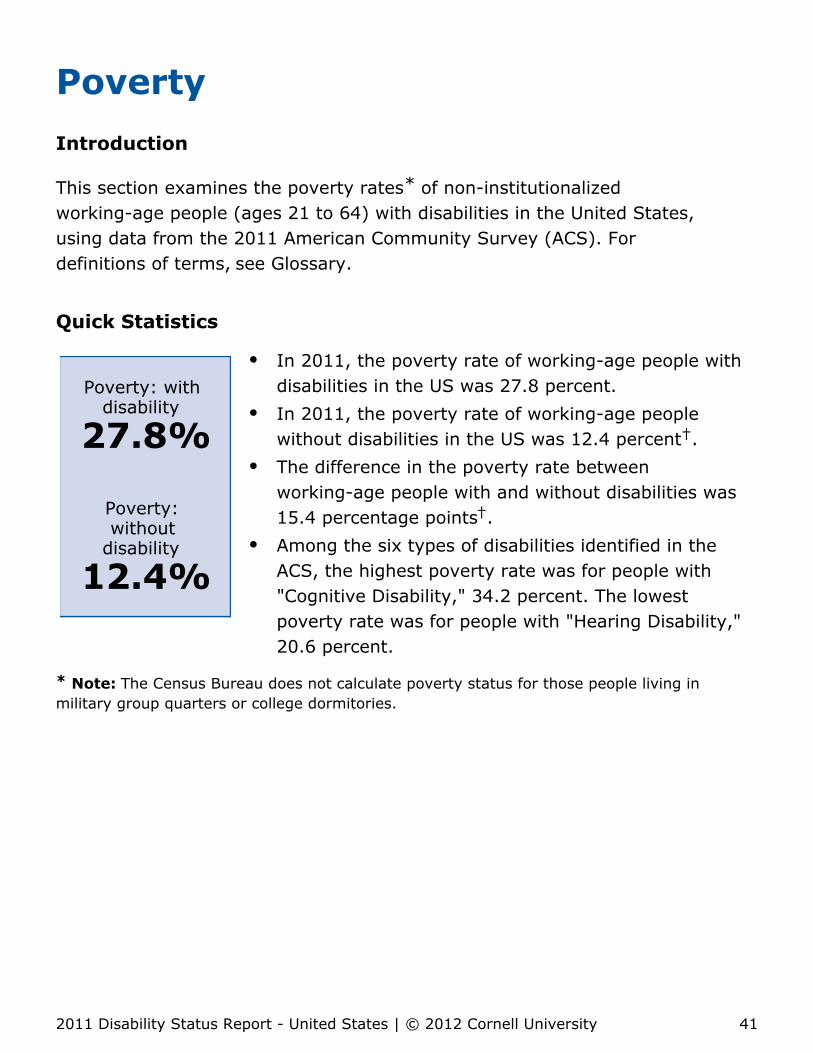
PovertyIntroduction
This section examines the poverty rates* of non-institutionalizedworking-age people (ages 21 to 64) with disabilities in the United States,using data from the 2011 American Community Survey (ACS). Fordefinitions of terms, see Glossary.
Quick Statistics
Poverty: withdisability
27.8%
Poverty:without
disability
12.4%
In 2011, the poverty rate of working-age people withdisabilities in the US was 27.8 percent.In 2011, the poverty rate of working-age peoplewithout disabilities in the US was 12.4 percent†.The difference in the poverty rate betweenworking-age people with and without disabilities was15.4 percentage points†.Among the six types of disabilities identified in theACS, the highest poverty rate was for people with"Cognitive Disability," 34.2 percent. The lowestpoverty rate was for people with "Hearing Disability,"20.6 percent.
* Note: The Census Bureau does not calculate poverty status for those people living inmilitary group quarters or college dormitories.
2011 Disability Status Report - United States | © 2012 Cornell University 41
Poverty rates* of non-institutionalized working-age people (ages21 to 64) by disability status in the United States in 2011
Disability Type % MOE Number MOE Base Pop. SampleSize
No Disability 12.4 0.07 19,909,200 120,120 160,438,400 1,514,953
Any Disability 27.8 0.29 5,241,700 63,170 18,825,800 198,122
Visual 31.0 0.72 1,002,700 27,820 3,230,100 32,428
Hearing 20.6 0.57 807,700 24,970 3,927,600 41,321
Ambulatory 29.8 0.40 2,965,100 47,680 9,961,400 105,438
Cognitive 34.2 0.48 2,625,100 44,890 7,667,700 80,982
Self-Care 31.9 0.69 1,122,900 29,430 3,523,600 38,354
Independent Living 32.1 0.50 2,137,900 40,540 6,666,600 72,403
* Note: The Census Bureau does not calculate poverty status for those people living inmilitary group quarters or college dormitories.
2011 Disability Status Report - United States | © 2012 Cornell University 42

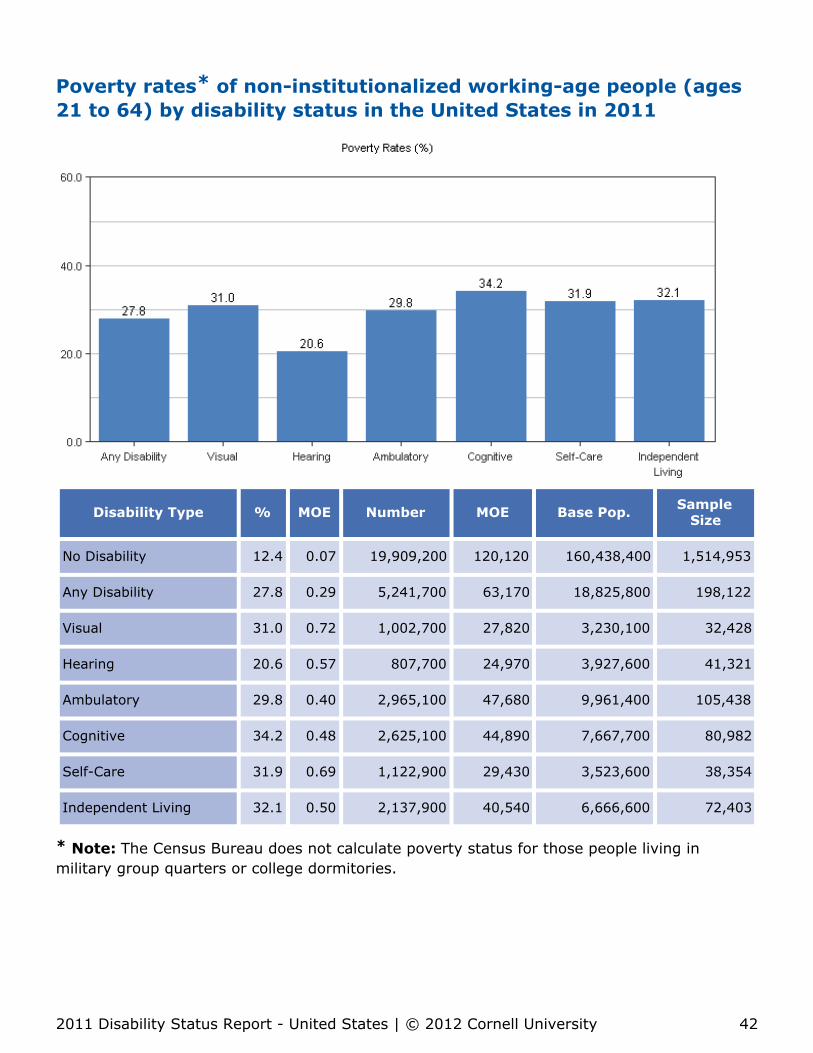
Supplemental Security Income(SSI)Introduction
This section focuses on the percentage of non-institutionalizedworking-age people (ages 21 to 64) with disabilities who receiveSupplemental Security Income (SSI) payments in the United States,using data from the 2011 American Community Survey (ACS). Fordefinitions of terms, see Glossary. Please note that these results willdiffer from official Social Security Administration reports for severalreasons. For additional information, please [email protected].
Quick Statistics
SSIRecipients:
with disability
19.6%
In 2011, the percentage of working-age people withdisabilities receiving Supplemental Security Incomepayments in the US was 19.6 percent.In 2011, the number of working-age people withdisabilities receiving Supplemental Security Incomepayments in the US was 3,693,300.Among the six types of disabilities identified in theACS, the highest percentage that received SSI waspeople with "Independent Living Disability," 30.2percent. The lowest percentage that received SSI waspeople with "Hearing Disability," 12.1 percent.
2011 Disability Status Report - United States | © 2012 Cornell University 43
Percentage of non-institutionalized working-age people (ages 21to 64) with disabilities who receive Supplemental SecurityIncome (SSI) payments in the United States in 2011
Disability Type % MOE Number MOE Base Pop. SampleSize
Any Disability 19.6 0.25 3,693,300 53,160 18,858,600 198,735
Visual 18.7 0.60 604,700 21,620 3,237,100 32,553
Hearing 12.1 0.46 476,800 19,200 3,935,200 41,460
Ambulatory 21.6 0.36 2,150,100 40,660 9,969,000 105,576
Cognitive 27.9 0.45 2,143,500 40,600 7,684,000 81,297
Self-Care 28.6 0.67 1,007,100 27,880 3,525,400 38,393
Independent Living 30.2 0.49 2,012,100 39,340 6,671,300 72,490
2011 Disability Status Report - United States | © 2012 Cornell University 44

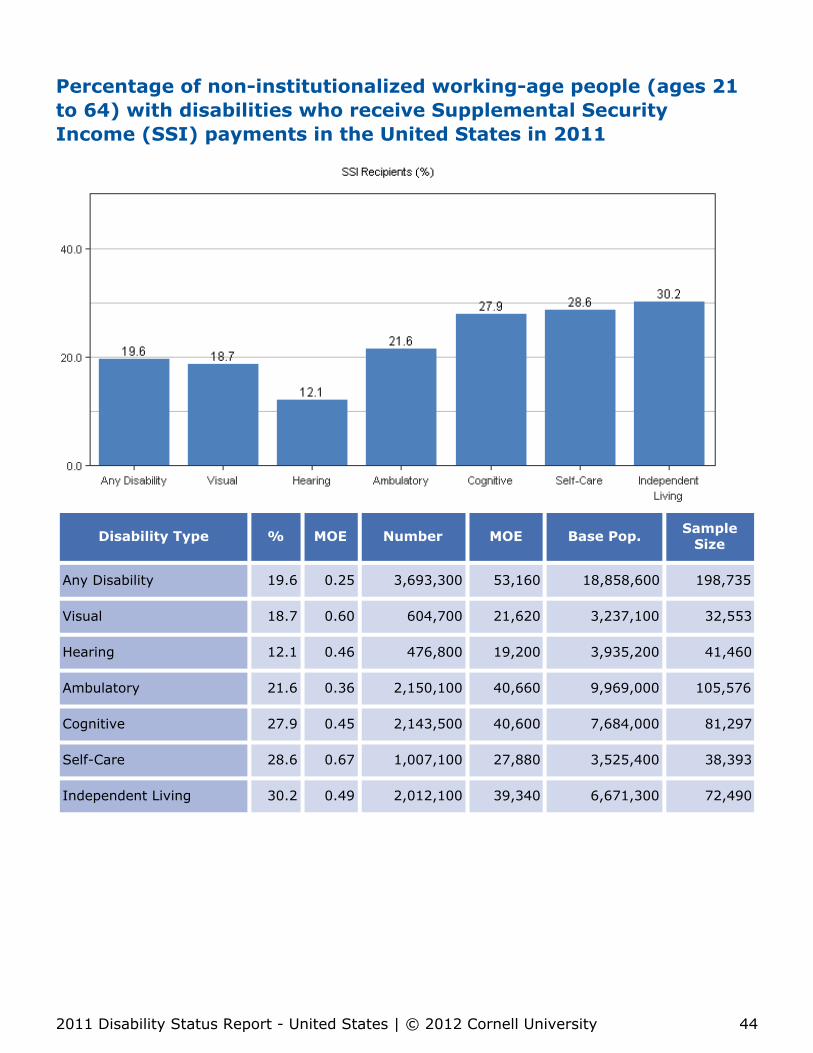
EducationHigh School Diploma/Equivalent
Introduction
This section explores the percentage of non-institutionalized working-agepeople (ages 21 to 64) with disabilities with only a high school diploma orequivalent in the United States, using data from the 2011 AmericanCommunity Survey (ACS). For definitions of terms, see Glossary.
Quick Statistics
High SchoolOnly: withdisability
34.5%
High SchoolOnly: without
disability
25.9%
In 2011, the percentage of working-age people withdisabilities with only a high school diploma orequivalent in the US was 34.5 percent.In 2011, the percentage of working-age peoplewithout disabilities with only a high school diploma orequivalent in the US was 25.9 percent.The difference in the percentage with only a highschool diploma or equivalent between working-agepeople with and without disabilities was 8.6percentage points.Among the six types of disabilities identified in theACS, the highest percentage with only a high schooldiploma or equivalent was for people with"Independent Living Disability," 36.4 percent. Thelowest percentage with only a high school diploma orequivalent was for people with "Visual Disability,"32.8 percent.
2011 Disability Status Report - United States | © 2012 Cornell University 45
Percentage of non-institutionalized working-age people (ages 21to 64) with only a high school diploma or equivalent by disabilitystatus in the US in 2011
Disability Type % MOE Number MOE Base Pop. SampleSize
No Disability 25.9 0.10 41,703,900 167,230 161,178,900 1,528,273
Any Disability 34.5 0.30 6,507,200 70,230 18,858,600 198,735
Visual 32.8 0.73 1,061,600 28,620 3,237,100 32,553
Hearing 33.0 0.66 1,298,200 31,640 3,935,200 41,460
Ambulatory 34.6 0.42 3,447,300 51,380 9,969,000 105,576
Cognitive 35.9 0.48 2,756,200 45,990 7,684,000 81,297
Self-Care 34.3 0.70 1,210,100 30,550 3,525,400 38,393
Independent Living 36.4 0.52 2,425,600 43,170 6,671,300 72,490
2011 Disability Status Report - United States | © 2012 Cornell University 46

EducationSome College/Associate's Degree
Introduction
This section examines the percentage of non-institutionalizedworking-age people (ages 21 to 64) with disabilities with only somecollege or an Associate's degree in the United States, using data from the2011 American Community Survey (ACS). For definitions of terms, seeGlossary.
Quick Statistics
SomeCollege: with
disability
30.6%
SomeCollege:without
disability
32.4%
In 2011, the percentage of working-age people withdisabilities with only some college or an Associate'sdegree in the US was 30.6 percent.In 2011, the percentage of working-age peoplewithout disabilities with only some college or anAssociate's degree in the US was 32.4 percent.The difference in the percentage with only somecollege or an Associate's degree betweenworking-age people with and without disabilities was1.8 percentage points.Among the six types of disabilities identified in theACS, the highest percentage with only some collegeor an Associate's degree was for people with "HearingDisability," 32.3 percent. The lowest percentage withonly some college or Associate's degree was forpeople with "Independent Living Disability," 27.1percent.
2011 Disability Status Report - United States | © 2012 Cornell University 47

Percentage of non-institutionalized working-age people (ages 21to 64) with only some college or an Associate's degree bydisability status in the United States in 2011
Disability Type % MOE Number MOE Base Pop. SampleSize
No Disability 32.4 0.10 52,168,300 183,380 161,178,900 1,528,273
Any Disability 30.6 0.30 5,763,200 66,180 18,858,600 198,735
Visual 29.0 0.70 939,700 26,930 3,237,100 32,553
Hearing 32.3 0.66 1,269,300 31,280 3,935,200 41,460
Ambulatory 30.7 0.41 3,060,800 48,440 9,969,000 105,576
Cognitive 27.9 0.45 2,144,600 40,610 7,684,000 81,297
Self-Care 28.2 0.67 995,600 27,720 3,525,400 38,393
Independent Living 27.1 0.48 1,805,400 37,280 6,671,300 72,490
2011 Disability Status Report - United States | © 2012 Cornell University 48

EducationBachelor's Degree or More
Introduction
This section presents the percentage of non-institutionalized working-agepeople (ages 21 to 64) with disabilities with a Bachelor's degree or morein the United States, using data from the 2011 American CommunitySurvey (ACS). For definitions of terms, see Glossary.
Quick Statistics
Bachelor'sDegree orMore: withdisability
12.5%
Bachelor'sDegree or
More: withoutdisability
31.2%
In 2011, the percentage of working-age people withdisabilities with a Bachelor's degree or more in the USwas 12.5 percent.In 2011, the percentage of working-age peoplewithout disabilities with a Bachelor's degree or morein the US was 31.2 percent.The difference in the percentage with a Bachelor'sdegree or more between working-age people withand without disabilities was 18.7 percentage points.Among the six types of disabilities identified in theACS, the highest percentage with a Bachelor's degreeor more was for people with "Hearing Disability," 16.0percent. The lowest percentage with a Bachelor'sdegree or more was for people with "CognitiveDisability," 9.2 percent.
2011 Disability Status Report - United States | © 2012 Cornell University 49

Percentage of non-institutionalized working-age people (ages 21to 64) with a Bachelor's degree or more by disability status in theUnited States in 2011
Disability Type % MOE Number MOE Base Pop. SampleSize
No Disability 31.2 0.10 50,249,400 180,640 161,178,900 1,528,273
Any Disability 12.5 0.21 2,356,000 42,550 18,858,600 198,735
Visual 11.6 0.50 374,400 17,020 3,237,100 32,553
Hearing 16.0 0.51 629,800 22,060 3,935,200 41,460
Ambulatory 11.1 0.28 1,106,800 29,220 9,969,000 105,576
Cognitive 9.2 0.29 707,200 23,370 7,684,000 81,297
Self-Care 10.8 0.46 382,200 17,190 3,525,400 38,393
Independent Living 9.6 0.32 641,300 22,260 6,671,300 72,490
2011 Disability Status Report - United States | © 2012 Cornell University 50
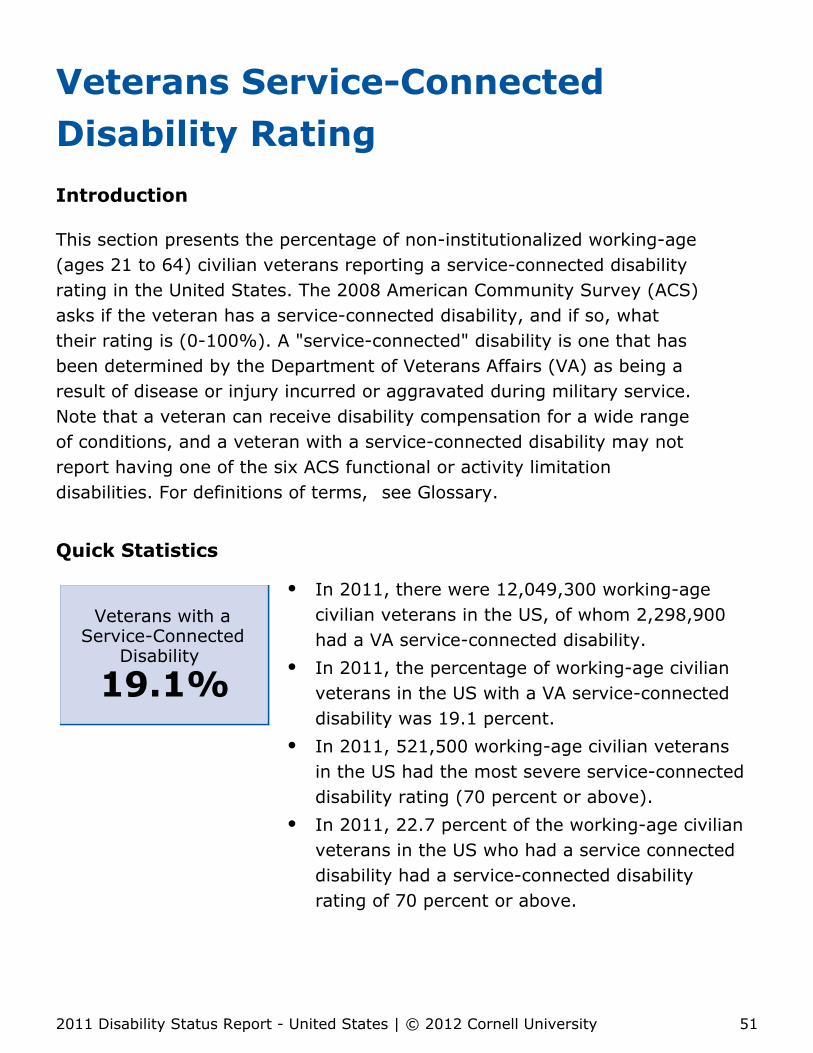
Veterans Service-ConnectedDisability RatingIntroduction
This section presents the percentage of non-institutionalized working-age(ages 21 to 64) civilian veterans reporting a service-connected disabilityrating in the United States. The 2008 American Community Survey (ACS)asks if the veteran has a service-connected disability, and if so, whattheir rating is (0-100%). A "service-connected" disability is one that hasbeen determined by the Department of Veterans Affairs (VA) as being aresult of disease or injury incurred or aggravated during military service.Note that a veteran can receive disability compensation for a wide rangeof conditions, and a veteran with a service-connected disability may notreport having one of the six ACS functional or activity limitationdisabilities. For definitions of terms, see Glossary.
Quick Statistics
Veterans with aService-Connected
Disability
19.1%
In 2011, there were 12,049,300 working-agecivilian veterans in the US, of whom 2,298,900had a VA service-connected disability.In 2011, the percentage of working-age civilianveterans in the US with a VA service-connecteddisability was 19.1 percent.In 2011, 521,500 working-age civilian veteransin the US had the most severe service-connecteddisability rating (70 percent or above).In 2011, 22.7 percent of the working-age civilianveterans in the US who had a service connecteddisability had a service-connected disabilityrating of 70 percent or above.
2011 Disability Status Report - United States | © 2012 Cornell University 51

Disability rating of working-age civilian veterans (ages 21 to 64)with a service-connected disability in the United States in 2011
Service-Connected Disability % MOE Number MOE Base Pop. Sample
Size
Has a service-connected disability rating(0-100%)
19.1 0.32 2,298,900 42,030 12,049,300 121,711
Disability rating of veterans with a service connected-disability
0 percent 5.9 0.43 135,100 10,230 2,298,900 23,776
10 or 20 percent 32.1 0.86 738,400 23,880 2,298,900 23,776
30 or 40 percent 20.0 0.73 458,700 18,830 2,298,900 23,776
50 or 60 percent 12.1 0.60 278,800 14,680 2,298,900 23,776
70 percent or higher 22.7 0.77 521,500 20,080 2,298,900 23,776
Rating not reported 7.2 0.47 166,400 11,350 2,298,900 23,776
2011 Disability Status Report - United States | © 2012 Cornell University 52

Health Insurance CoverageIntroduction
This section examines the health insurance coverage ofnon-institutionalized working-age people (ages 21 to 64) with disabilitiesin the United States, using data from the 2011 American CommunitySurvey (ACS). For definitions of terms, see Glossary.
Quick Statistics
HealthCoverage:
with Disability
82.5%
HealthCoverage:
withoutDisability
78.8%
In 2011, 82.5 percent of working-age people withdisabilities in the US had some type of healthinsurance coverage.In 2011, 78.8 percent of working-age people withoutdisabilities in the US had some type of healthinsurance coverage.The difference in the health insurance coverage ratebetween working-age people with and withoutdisabilities was 3.7 percentage points.Among the six types of disabilities identified in theACS, the highest health insurance coverage rate wasfor people with "Self-Care Disability," 87.8 percent.The lowest health insurance coverage rate was forpeople with "Visual Disability," 77.1 percent.
2011 Disability Status Report - United States | © 2012 Cornell University 53

Health Insurance Coverage of non-institutionalized working-agepeople (ages 21 to 64) by disability status in the United States in2011
Disability Type % MOE Number MOE Base Pop. SampleSize
No Disability 78.8 0.09 126,998,300 241,350 161,178,900 1,528,273
Any Disability 82.5 0.24 15,555,000 106,970 18,858,600 198,735
Visual 77.1 0.65 2,496,600 43,790 3,237,100 32,553
Hearing 82.8 0.53 3,260,100 49,980 3,935,200 41,460
Ambulatory 84.6 0.32 8,435,500 79,710 9,969,000 105,576
Cognitive 83.4 0.37 6,411,100 69,720 7,684,000 81,297
Self-Care 87.8 0.49 3,094,800 48,710 3,525,400 38,393
Independent Living 87.1 0.36 5,810,200 66,440 6,671,300 72,490
2011 Disability Status Report - United States | © 2012 Cornell University 54
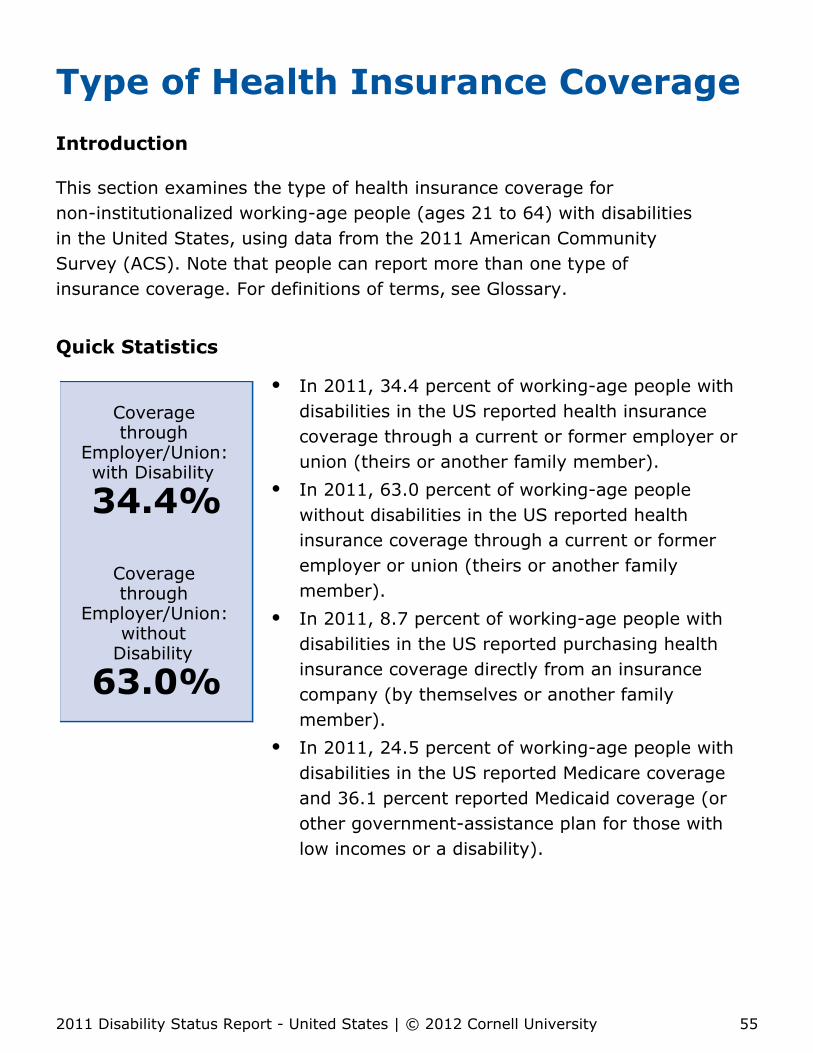
Type of Health Insurance CoverageIntroduction
This section examines the type of health insurance coverage fornon-institutionalized working-age people (ages 21 to 64) with disabilitiesin the United States, using data from the 2011 American CommunitySurvey (ACS). Note that people can report more than one type ofinsurance coverage. For definitions of terms, see Glossary.
Quick Statistics
Coveragethrough
Employer/Union:with Disability
34.4%
Coveragethrough
Employer/Union:without
Disability
63.0%
In 2011, 34.4 percent of working-age people withdisabilities in the US reported health insurancecoverage through a current or former employer orunion (theirs or another family member).In 2011, 63.0 percent of working-age peoplewithout disabilities in the US reported healthinsurance coverage through a current or formeremployer or union (theirs or another familymember).In 2011, 8.7 percent of working-age people withdisabilities in the US reported purchasing healthinsurance coverage directly from an insurancecompany (by themselves or another familymember).In 2011, 24.5 percent of working-age people withdisabilities in the US reported Medicare coverageand 36.1 percent reported Medicaid coverage (orother government-assistance plan for those withlow incomes or a disability).
2011 Disability Status Report - United States | © 2012 Cornell University 55

Type of Health Insurance Coverage of non-institutionalizedworking-age people (ages 21 to 64) by disability status in theUnited States in 2011
2011 Disability Status Report - United States | © 2012 Cornell University 56
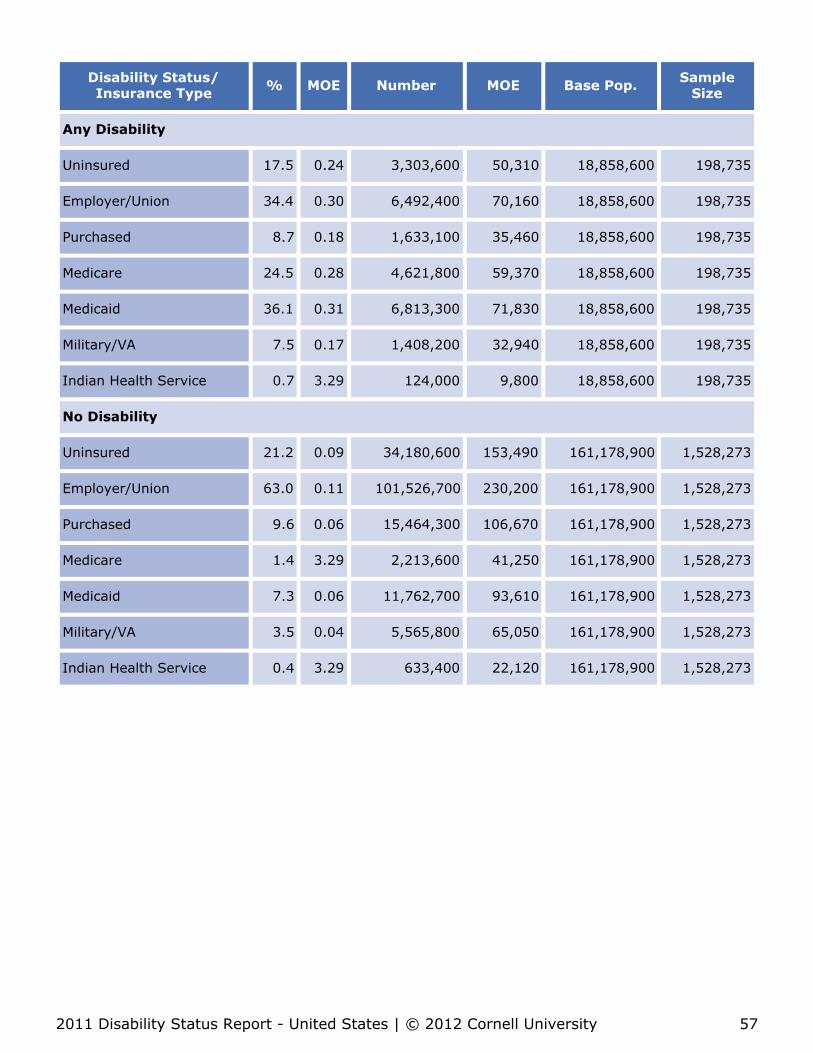
Disability Status/Insurance Type % MOE Number MOE Base Pop. Sample
Size
Any Disability
Uninsured 17.5 0.24 3,303,600 50,310 18,858,600 198,735
Employer/Union 34.4 0.30 6,492,400 70,160 18,858,600 198,735
Purchased 8.7 0.18 1,633,100 35,460 18,858,600 198,735
Medicare 24.5 0.28 4,621,800 59,370 18,858,600 198,735
Medicaid 36.1 0.31 6,813,300 71,830 18,858,600 198,735
Military/VA 7.5 0.17 1,408,200 32,940 18,858,600 198,735
Indian Health Service 0.7 3.29 124,000 9,800 18,858,600 198,735
No Disability
Uninsured 21.2 0.09 34,180,600 153,490 161,178,900 1,528,273
Employer/Union 63.0 0.11 101,526,700 230,200 161,178,900 1,528,273
Purchased 9.6 0.06 15,464,300 106,670 161,178,900 1,528,273
Medicare 1.4 3.29 2,213,600 41,250 161,178,900 1,528,273
Medicaid 7.3 0.06 11,762,700 93,610 161,178,900 1,528,273
Military/VA 3.5 0.04 5,565,800 65,050 161,178,900 1,528,273
Indian Health Service 0.4 3.29 633,400 22,120 161,178,900 1,528,273
2011 Disability Status Report - United States | © 2012 Cornell University 57

Glossary
Actively Looking for Work
A person is defined as ACTIVELY looking for work if he or she reports looking for workduring the last four weeks.
Ambulatory Disability
This disability type is based on the question (asked of persons ages 5 or older): Doesthis person have serious difficulty walking or climbing stairs?
Base Population (Base Pop.)
The estimated number of individuals upon which the calculation is based. (Forpercentages, this is the denominator).
Cognitive Disability
This disability type is based on the question (asked of persons ages 5 or older):Because of a physical, mental, or emotional condition, does this person have seriousdifficulty concentrating, remembering, or making decisions?
Disability and Disability Types
The ACS definition of disability is based on six questions. A person is coded as having adisability if he or she or a proxy respondent answers affirmatively for one or more ofthese six categories.
Hearing Disability (asked of all ages): Is this person deaf or does he/she have serious difficulty hearing?Visual Disability (asked of all ages): Is this person blind or does he/she have serious difficulty seeing even whenwearing glasses?Cognitive Disability (asked of persons ages 5 or older): Because of a physical, mental, or emotional condition,does this person have serious difficulty concentrating, remembering, or making decisions?Ambulatory Disability (asked of persons ages 5 or older): Does this person have serious difficulty walking orclimbing stairs?Self-care Disability (asked of persons ages 5 or older): Does this person have difficulty dressing or bathing?Independent Living Disability (asked of persons ages 15 or older): Because of a physical, mental, or emotionalcondition, does this person have difficulty doing errands alone such as visiting a doctor’s office or shopping?
Earnings
Earnings are defined as wages, salary, commissions, bonuses, or tips from all jobsincluding self-employment income (NET income after business expenses) from ownnonfarm businesses or farm businesses, including proprietorships and partnerships.
2011 Disability Status Report - United States | © 2012 Cornell University 58

Education
Our definition is based on the responses to the question: "What is the highest degreeor level of school this person has completed? If currently enrolled, mark the previousgrade or highest degree received." Our category "high school diploma/equivalent"includes those marking the ACS option "Regular high school diploma — GED oralternative credential." Our category "Some college/Associate's degree" includes thosemarking the ACS options: some college credit, but less than 1 year of college credit;one or more years of college credit but no degree, or "Associate's degree (for example:AA, AS)." Our category "a Bachelor's or more" includes those marking the ACSoptions: "Bachelor's degree (for example: BA, BS)"; "Master's degree (for example:MA, MS, MEng, MEd, MSW, MBA)"; "Professional degree (for example: MD, DDS, DVM,LLB, JD)"; or "Doctorate degree (for example: PhD, EdD)." Note in 2008 changes weremade to some of the response categories and the layout of this question.
Employment
A person is considered employed if he or she is either
“at work”: those who did any work at all during the reference week as a paid employee (worked in his orher own business or profession, worked on his or her own farm, or worked 15 or more hours as an unpaidworker on a family farm or business) or
a.
were “with a job but not at work,” : had a job but temporarily did not work at that job during the referenceweek due to illness, bad weather, industrial dispute, vacation or other personal reasons. The reference weekis defined as the week preceding the date the questionnaire was completed.
b.
Full-Time/Full-Year Employment
A person is considered employed full-time/full-year if he or she worked 35 hours ormore per week (full-time) and 50 or more weeks per year (full-year). The referenceperiod is defined as the year preceding the date the questionnaire was completed.Note: this does not signify whether a person is eligible for fringe benefits. The questionand response categories regarding weeks worked per year was changed in 2008.
Group Quarters (GQ)
A GQ is a place where people live or stay that is normally owned or managed by anentity or organization providing housing and/or services for the residents. Theseservices may include custodial or medical care as well as other types of assistance, andresidency is commonly restricted to those receiving these services. People living ingroup quarters are usually not related to each other. Group quarters include suchplaces as college residence halls, residential treatment centers, skilled nursingfacilities, group homes, military barracks, correctional facilities, and workers'dormitories. See the definitions of institutional GQs and non-institutional GQs for moreinformation. In addition, a description of the types of group quarters included in the2008 ACS is located on the U.S. Census Bureau's Web site atwww.census.gov/acs/www/Downloads/
2008_ACS_GQ_Definitions.pdf.
2011 Disability Status Report - United States | © 2012 Cornell University 59

2008_ACS_GQ_Definitions.pdf.
Health Insurance Coverage
Is based on the following question: Is this person CURRENTLY covered by any of thefollowing types of health insurance or health coverage plans? Mark "Yes" or "No" forEACH type of coverage in items a – h.
Insurance through a current or former employer or union (of this person or another family member)a.Insurance purchased directly from an insurance company (by this person or another family member)b.Medicare, for people 65 and older, or people with certain disabilitiesc.Medicaid, Medical Assistance, or any kind of government-assistance plan for those with low incomes or adisability
d.
VA (including those who have ever used or enrolled for VA health care)e.TRICARE or other military health caref.Indian Health Serviceg.Any other type of health insurance or health coverage plan – Specify (Note: “Other type” were recoded intoone of the categories a-g by the Census Bureau)
h.
Hearing Disability
This disability type is based on the question (asked of all ages): Is this person deaf ordoes he/she have serious difficulty hearing?
Hispanic or Latino Origin
People of Hispanic or Latino origin are those who classify themselves in a specificHispanic or Latino category in response to the question, "Is this personSpanish/Hispanic/Latino?" Specifically, those of Hispanic or Latino origin are those whoare Cuban; Mexican, Mexican American, Chicano; Puerto Rican; or otherSpanish/Hispanic/Latino. Origin may be the heritage, nationality group, lineage, orcountry of birth of the person or the person's parents or ancestors before their arrivalin the United States. People who identify their origin as Spanish, Hispanic, or Latinomay be of any race.
Household Income
Household Income is defined as the total income of a household including: wages,salary, commissions, bonuses, or tips from all jobs; self-employment income (NETincome after business expenses) from own non-farm or farm businesses, includingproprietorships and partnerships; interest, dividends, net rental income, royaltyincome, or income from real estates and trusts; Social Security or Railroad Retirement;Supplemental Security Income; any public assistance or welfare payments from thestate or local welfare office; retirement, survivor or disability pensions; and any otherregularly received income (e.g., Veterans' payments, unemployment compensation,child support or alimony). Median household income is calculated with the household asthe unit of analysis, using household weights without adjusting for household size.
2011 Disability Status Report - United States | © 2012 Cornell University 60
Independent Living Disability
This disability type is based on the question (asked of persons ages 15 or older):Because of a physical, mental, or emotional condition, does this person have difficultydoing errands alone such as visiting a doctors office or shopping?
Institutional Group Quarters (GQs)
Includes facilities for people under formally authorized, supervised care or custody atthe time of enumeration. Generally, restricted to the institution, under the care orsupervision of trained staff, and classified as "patients" or "inmates." Includes:correctional, nursing, and in-patient hospice facilities, psychiatric hospitals, juvenilegroup homes and residential treatment centers.
Margin of Error (MOE)
Data, such as data from the American Community Survey, is based on a sample, andtherefore statistics derived from this data are subject to sampling variability. Themargin of error (MOE) is a measure of the degree of sampling variability. In a randomsample, the degree of sampling variation is determined by the underlying variability ofthe phenomena being estimated (e.g., income) and the size of the sample (i.e., thenumber of survey participants used to calculate the statistic). The smaller the marginof error, the lower the sampling variability and the more "precise" the estimate. Amargin of error is the difference between an estimate and its upper or lowerconfidence bounds. Confidence bounds are calculated by adding the MOE to theestimate (upper bound) and subtracting the MOE from the estimate (lower bound). Allmargins of error in this report are based on a 90 percent confidence level. This meansthat there is a 90% certainty that the actual value lies somewhere between the upperand lower confidence bounds.
Non-Institutional Group Quarters (GQs)
Includes facilities that are not classified as institutional group quarters; such ascollege/university housing, group homes intended for adults, residential treatmentfacilities for adults, workers' group living quarters and Job Corps centers and religiousgroup quarters.
Not Working but Actively Looking for Work
A person is defined as not working but actively looking for work if he or she reports notbeing employed, but has been looking for work during the last four weeks.
Number
This term appears in the tables; it refers to estimated number of people in thecategory. (for percentages, this is the numerator).
2011 Disability Status Report - United States | © 2012 Cornell University 61
Poverty
The poverty measure is computed based upon the standards defined in Directive 14from the Office of Management and Budget. These standards use poverty thresholdscreated in 1982 and index these thresholds to 2008 dollars using poverty factors basedupon the Consumer Price Index. They use the family as the income sharing unit andfamily income is the sum of total income from each family member living in thehousehold. The poverty threshold depends upon the size of the family; the age of thehouseholder; and the number of related children under the age of 18.
Race
Race categories are based on the question, "[w]hat is this person's race? Mark (X) oneor more races to indicate what this person considers himself/herself to be." Responsesinclude the following: White; Black or African-American; American Indian or AlaskaNative (print name of enrolled or principal tribe); Asian Indian; Chinese; Filipino;Japanese; Korean; Vietnamese; Other Asian (Print Race); Native Hawaiian; Guamanianor Chamarro; Samoan; Other Pacific Islander (Print Race Below); Some other race(print race below). "Other race" also contains people who report more than one race.
Sample Size
The number of survey participants used to calculate the statistic.
Self-care Disability
This disability type is based on the question (asked of persons ages 5 or older): 17c.Does this person have difficulty dressing or bathing?
Supplemental Security Income (SSI)
A person is defined as receiving SSI payments if he or she reports receiving (SSI)income in the 12 months prior to the survey.
Note: The Supplemental Security Income (SSI) does not apply to Puerto Rico. SSI is afederal cash assistance program that provides monthly payments to low-income aged,blind, or disabled persons in the 50 states, the District of Columbia, and the NorthernMariana Islands.
Veteran Service-Connected Disability
A disease or injury determined to have occurred in or to have been aggravated bymilitary service. A disability is evaluated according to the VA Schedule for RatingDisabilities in Title 38, CFR, and Part 4. Extent of disability is expressed as apercentage from 0% (for conditions that exist but are not disabling to a compensable
2011 Disability Status Report - United States | © 2012 Cornell University 62
percentage from 0% (for conditions that exist but are not disabling to a compensabledegree) to 100%, in increments of 10%. This information was determined by thefollowing two part question:
Does this person have a VA service-connected disability rating?Yes (such as 0%, 10%, 20%, ... , 100%)No SKIP to question 28a
a.
What is this person’s service-connected disability rating?”Responses included: 0 percent; 10 or 20 percent; 30 or 40 percent; 50 or 60 percent; 70 percent or higher
b.
Visual Disability
This disability type is based on the question:(asked of all ages): Is this person blind ordoes he/she have serious difficulty seeing even when wearing glasses?
2011 Disability Status Report - United States | © 2012 Cornell University 63

About the Disability Status ReportsThe Cornell University Disability Status Reports is produced and funded by theEmployment and Disability Institute at the Cornell University ILR School. This effortoriginated as a product of the Rehabilitation Research and Training Center on DisabilityDemographics and Statistics (StatsRRTC) funded to the Employment and DisabilityInstitute in the ILR School at Cornell University by the U.S. Department of Education,National Institute on Disability and Rehabilitation Research (grant No. H133B031111).
The contents of this report do not necessarily represent the policy of the Department ofEducation, and you should not assume endorsement by the Federal Government(Edgar, 75.620 (b)).
Contact Us
Employment and Disability Institute Cornell University Ithaca, New York 14853 Phone: 607.255.7727Email: [email protected]: www.disabilitystatistics.org
2011 Disability Status Report - United States | © 2012 Cornell University 64


