
SUSTAINABLE TRANSPORT & INTEGRATED
LAND USE PLANNING
ACTIVE TRANSPORTATION GREEN REGION
UNESCAP Capacity Building Workshop, Colombo
Overview of Planning and designing for sustainable
urban transport systems and services
Prof. Sanjay Gupta, Ph. D
Head, Transport Planning Department
School of Planning and Architecture
( an institute of National Importance by Act of Parliament)
New Delhi, India
30th October - 2017
11/15/2017 Dr Sanjay Gupta, SPA

� Urban transport is probably the most important single component instrumental in shaping urban development and urban living (NCU).
� The urban form and structure affects the need for and selection of appropriate transport systems
Importance of Urban Transport
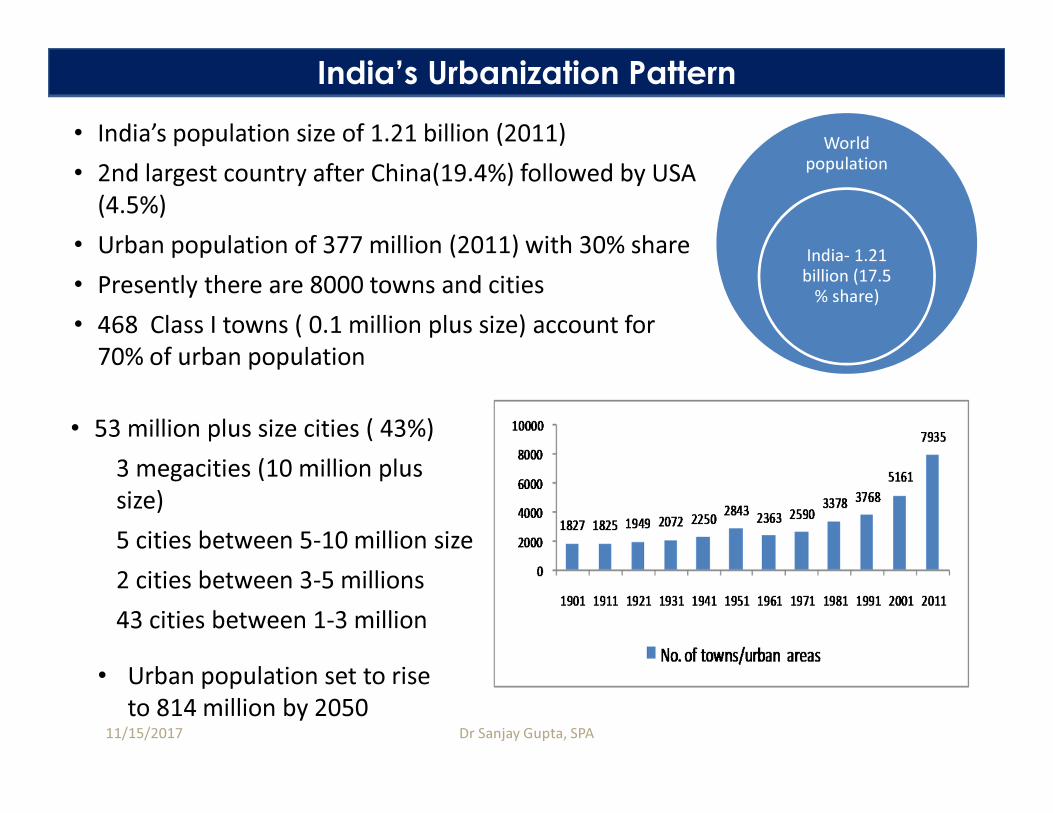
• India’s population size of 1.21 billion (2011)
• 2nd largest country after China(19.4%) followed by USA
(4.5%)
• Urban population of 377 million (2011) with 30% share
• Presently there are 8000 towns and cities
• 468 Class I towns ( 0.1 million plus size) account for
70% of urban population
World
population
India- 1.21
billion (17.5
% share)
• 53 million plus size cities ( 43%)
3 megacities (10 million plus
size)
5 cities between 5-10 million size
2 cities between 3-5 millions
43 cities between 1-3 million
• Urban population set to rise
to 814 million by 2050
India’s Urbanization Pattern
11/15/2017 Dr Sanjay Gupta, SPA

0
50
100
150
1951 1961 1971 1981 1991 2001 2011
Vehicles Growth in India, 1951- 2011 (in Millions)
Two Wheelers Cars, Jeeps and Taxis Buses Goods Vehicles Others
141.866
54.991
21.374
5.3911.8650.6650.306
Source: Ministry of Road Transport and Highway 2015; Wilbur Smith 2008
Two wheelers account for 72% share
Year / Veh. (in
mill.)1998 1999 2000 2001 2002 2003 2004 2005 2006 2007 2008 2009 2010 2011 2012
Two Wheelers 28.64 31.33 34.12 38.56 41.58 47.52 51.92 58.80 64.74 69.13 75.34 82.40 91.60 101.87 115.42
Cars, Jeeps and
Taxis 5.14 5.56 6.14 7.06 7.61 8.60 9.45 10.32 11.53 12.65 13.95 15.31 17.11 19.23 21.57
Buses 0.54 0.54 0.56 0.63 0.64 0.72 0.77 0.89 0.99 1.35 1.43 1.49 1.53 1.60 1.68
Goods Vehicles 2.54 2.55 2.72 2.95 2.97 3.49 3.75 4.03 4.44 5.12 5.60 6.04 6.43 7.06 7.66
Others 4.51 4.90 5.32 5.80 6.12 6.68 6.83 7.46 7.92 8.46 9.04 9.71 11.08 12.10 13.17
All Vehicles 41.37 44.88 48.86 54.99 58.92 67.01 72.72 81.50 89.62 96.71 105.35 114.95 127.75 141.87 159.49
Motorisation Trends in India
11/15/2017 Dr Sanjay Gupta, SPA

City Parameters Hyderabad Banglaore Ahmedabad
Population Density (Urban
Built in Persons/Sq.km )
10,526 9,378 17,441
Population Density (Urban
Sprawl in Persons/Sq.km)
6,265 5,869 15,574
Compactness Index 0.60 0.63 0.90
Public Transport Use 48% 51 24%
NMV Use 21% 24% 32%
Trip Length (Total) km 10.5 11 5.7
Vehicle km/capita 10.81 8.90 6.4
Population (Million) 8.5 8.5 6.0
Hyderabad (760Sq.km) Bangalore (853Sq.km) Ahmedabad (344Sq.km)
Urb
an
Sp
raw
l Tre
nd
s in
Me
ga
Cit
ies
11/15/2017 Dr Sanjay Gupta, SPA

Source : Literature Review
Urban Density Patterns and Impact on Vehicle ownerships
11/15/2017 Dr Sanjay Gupta, SPA

0%
50%
100%
Mega Metro Others
Modal Split across cities
Walk Cycle Tw PT Car IPT0
0.5
1
1.5
2
Mega Metro Others
PC
TR
PCTR across cities
0
5
10
15
Mega Metro Others
AT
L (
kms.
)
Avg.Trip Length across cities
0
100
200
300
Mega Metro Others
Veh
icle
Den
sity
(v
eh./1
000
po
p.)
Vehicle Density (veh./1000 pop.)
• Cycle trips are higher in medium towns
• Public Transport share is higher in mega cities
• Two wheeler trips are higher in medium towns
• Trip rate increases with city size.
Source: Wilbur Smith study 2007
• Trip length increases with the city • Vehicular concentration increases with city size
Travel demand grown faster than population
Travel Patterns of Indian Cities
11/15/2017 Dr Sanjay Gupta, SPA

• Urban Sprawl
More car dependency
Increased trip lengths
High costs for extending infrastructure and services
• Climate Change
Global warming
Higher emission levels
Air and noise pollution
• Growing Economy
Increased Car Ownership
Increased Traffic Volumes
Increased congestion
• Road Safety
Increased speed
Increased conflicts among modes
Increased accidents and fatalities
• Energy Consumption
Transport consumes 30% of total energy
Increased demand for fossil fuel
Increased GHG emissions
To address the dynamic complexities of urban systems,
a multi-disciplinary Planning Process is needed
Perspectives of Urban Transport Challenges
11/15/2017 Dr Sanjay Gupta, SPA

• Absence of Land use transport integration
• Inadequate public transport systems
• Inequities in delivery of transport services, for disadvantaged groups
• Inadequate attention to non- motorized transport (NMT’s)
• Inadequate attention to road safety
• Energy and environment related problems
• Multiplicity of authorities with no defined responsibilities and
accountabilities, lack of coordination and absence of appropriate strategy
• Non availability of adequate financial resources
• lack of systematic traffic data and information
Urban Transport Issues
11/15/2017 Dr Sanjay Gupta, SPA

Known as
Automobile Approach
Traditional Approach Sustainable Approach
Contemporary Approach
Urban Transport Planning Approaches
11/15/2017 Dr Sanjay Gupta, SPA

Definition� Process seeking to satisfy or modify the demand for movement
of people and goods by devising plans for the form andfunctioning of transport systems taking account of their impacton community.
Process
� A survey and analysis stage◦ establishes the present demand and develops relationships
� A prediction and plan formulation stage◦ projects the likely demand and puts forward transport
proposals
� An evaluation stage◦ Assesses whether the proposals enhances safety, capacity
and levels of service, and provide the maximum benefits to the community for minimum costs
Transport Planning Concepts
11/15/2017 Dr Sanjay Gupta, SPA

Primary Surveys
1. Road Network Inventory
2. Speed and Delay Study
3. Classified Traffic Volume Survey
4. Origin and Destination Survey
5. Household Survey
6. Parking Survey
7. Public Transport System Study
8. Terminal Studies
9. Intersection Studies
Secondary Data
1. Physical and Land Use Characteristics
2. Demographic and Socio-Economic Characteristics
3. Transport System Characteristics
4. Past relevant data, reports, plans etc.
Data Base Required
11/15/2017 Dr Sanjay Gupta, SPA

Rail Rapid Transit
Light Rail
Fixed Route Bus
Jitney
/ RTV
Van Pool
Subscription Bus
Car Pool
Taxi, Auto
rickshaws , Cycle
Rickshaw
Dial-a-ride
Auto Rental
Time
Space
Variable
Fixed
Fixed
Variable
11/15/2017
Family of Regular Transit modes
Dr Sanjay Gupta, SPA

• City size , form and structure
• Travel Demand along corridor (phpdt)
upto 5000 : Standard bus
5000-15000 : Standard bus with exclusive
lane/ETB/Trams
15,000- 25,000 : BRT/Mono Rail
20,000-30,000 : Light Rail Transit
30,000 + : Elevated BRTS
30,000-80,000 : Heavy Rail
• Costs constraints and construction time
• Flexibility of expansion/upgradation in
future
11/15/2017
Broad Mass Transit system Selection Criteria
Dr Sanjay Gupta, SPA

Long Term Environ
Practices Better quality of life
for all members of
society
Eco-development
combined with
sustainable
transport system
bringing
economic growth
ENVIRONMENT
Livable Cities and
Communication
SOCIETY
Social
inclusion
bringing
economic
prosperity
Business
Practices
with environ
impacts
ECONOMY
Sustainable Transport : Efficient, Equitable and Environmentally friendly transport
Sustainable Development
Sustainable Development and Sustainable Transport
11/15/2017 Dr Sanjay Gupta, SPA

1. Walk the walk Create great pedestrian environment
2. Powered by people Create great environ for cycle and NMT
3. Get on the bus Provide great cost effective PT
4. Cruise controlProvide access for clean part vehicle at safe speeds and
insignificantly reduced nos.
5. Deliver the goods Service the city in cleanest and safest manner
6. Mix it up Mix people, buildings and spaces
7. Fill it in Build dense people and transit oriented urban districts that
are desirable
8. Get real Preserve and enhance local natured cultural, social and
historical assets
9. Connect the BlocksMake trips more direct, interesting and productive with
small size permeable buildings and block to.
10. Make it last Build for long term (Sustainable cities bridge generation,
Source : ITDP
Principles for Transport in Urban Life
11/15/2017 Dr Sanjay Gupta, SPA

Source: TDM Encyclopedia, Victoria Transport Policy Institute http://www.vtpi.org/tdm/tdm67.htm
A sustainable transport system is one that :
• allows the basic access needs of individuals and societies to
be met safely and in a manner consistent with human and
ecosystem health, and with equity within and between
generations.
• is affordable, operates efficiently, offers choices of transport
mode, and supports a vibrant economy.
• limits emissions and waste within the planet’s ability to absorb
them, minimizes consumption of non-renewable resources,
limits consumption of renewable resources to the sustainable
yield level, reuses and recycles its components, and minimizes
the use of land
Sustainable Transport
11/15/2017 Dr Sanjay Gupta, SPA

Performance measures
• Transit Accessibility
• Cycle and Pedestrian modal share
• Vehicle miles per capita
• Carbon intensity
• Mixed land use
• Transportation affordability
• Benefits by income groups
• Land consumption
• Cycle and pedestrian safety
• Average vehicle occupancy
• Transit productivity
Sustainable Transportation Performance Measures
11/15/2017 Dr Sanjay Gupta, SPA

Avoid Strategies
• Integrated Landuse and Transport
• Mixed Use Development
• Information and CommunicationTechnology
Shift Strategies
• Non Motorized Transport
• Public Transport
• Transportation Demand Management
Improve Strategies
• Cleaner Fuels and Technologies
• Inspection and Maintenance
• Intelligent Transportation System
AVOID
Reducing the need to travel
SHIFT
Changing mode choice
IMPROVE
Increasing the energy efficiency of vehicles,
fuels, and transport operations
Source: GIZ
SUTP Strategies : A-S-I APPROACH
11/15/2017 Dr Sanjay Gupta, SPA

� It is the use of policies, programs, services and products
to influence whether, why, when, where and how people
travel.
� It is the implementation of programmes of measures
which seek to change travel demand patterns by:
◦ Trip reduction
◦ Reduction in vehicle use
◦ Increase in vehicle occupancy
◦ Increased travel by alternative modes
◦ Trip retiming
◦ Offering alternative destinations
◦ Reduction in trip length
11/15/2017
Concept of Travel Demand Management
Dr Sanjay Gupta, SPA

Bike Sharing Systems
System for Bike Sharing
Integrated system for bike
sharing is connected
through mobility cards
Cycle sharing
system to
encourage
people to use
cycles
Bicycles - Environment Friendly Transport Modes
Cycle sharing station: Card punching mechanism with
route and station map
Cycle sharing stations are often
placed near public transport
systems to provide last-mile
connectivity
11/15/2017 Dr Sanjay Gupta, SPA

Public Bike Sharing Guidelines
Key Imperatives
· A dense network of stations across the coverage area, with a spacing of approximately
300 m between stations
• Cycles with specially designed parts and sizes to discourage theft
• A fully automated locking system at stations that allows users to check cycles in or out
without the need for staffing at the station
• Electronic tags to track where a cycle is picked up, the identity of the user, and the
station where it is returned.
• Redistribution of cycles to ensure availability of cycles and empty docking points
• Real-time monitoring of station occupancy rates through information technology (IT)
systems, used to guide the redistribution and provide user information through the
web, mobile phones, etc.
• Pricing structures that incentivise short trips, helping to maximize the number of trips
per cycle per day
Source: Public Bike Sharing System – A Planning toolkit for Indian Cities , MoUD, GoI (2012)

Case Study : Eco Cabs, Fazilka ( North India)
Innovative features
• Light Weight-Reduced to
65 kg instead of existing
90kg
• More Luggage Space
• Better Safety :Reflectors
• Comfort for both
commuter and traction
men
• Facilities like Water Cooler,
Magazine
• More advertisement space
for more revenue
• Micro credit schemes
• rickshaw drivers and the
coordinator provided with
digital communication
services
Cycle Rickshaws – Environment Friendly Transport Modes
11/15/2017 Dr Sanjay Gupta, SPA

Case Study : Eco Cabs, Fazilka
Operational Scheme
City divided into 9 zones. Each zone
comprising 1km x 1km
• Five Ecocab call centers are
established within the city mainly north,
south, east, west and central to
provide dial-a-rickshaw facility.
• Each centre is serving almost 1500
households.
• centers are strategically placed so that
after a phone call within 10 minutes
Ecocab shall reach to desired location.
• At present fleet of 500 registered
traction men are self employed under
Fazilka Ecocab project.
Cycle Rickshaws – Environment Friendly Transport Modes
11/15/2017 Dr Sanjay Gupta, SPA

Case Study : Eco Cabs, Fazilka
Cycle Rickshaws – Environment Friendly Transport Modes
11/15/2017 Dr Sanjay Gupta, SPA
• Tea vendor acted as a coordinator,
responsible for answering calls and
dispatching rickshaws.
• BSNL sponsor all the calls under a closed
user group scheme, where all the calls
within the group are
Communication System

E- Rickshaws
DelhiPakistan
Cyber Hub, Gurgaon China
utilizes batteries
as the sole
source of
power for
vehicle
movement and
other auxiliary
uses.
Electric Rickshaws– Environment Friendly Transport Modes
11/15/2017 Dr Sanjay Gupta, SPA
Brief Characteristics in Delhi
(2014)
• Average passengers carried per
Rickshaw = 60
• Average route length = 7 km
• Average round trips = 10
• Majority use for work and
education
• Majority use as first/ last mile
mode

Electric Cars
A Battery Electric
Vehicle is a vehicle
that utilizes batteries
as the sole source of
power for vehicle
movement and
other auxiliary uses.
Electric Cars– Environment Friendly Transport Modes
11/15/2017 Dr Sanjay Gupta, SPA

1. Integrated Land use and transport strategy
� TOD
2. Network Development and Mobility Corridor
Strategy
3. Public Transport Strategy
� Bus augmentation, MRTS
� Intermodal Integration
4. Non Motorised Strategy
5. Freight Management Strategy
6. Parking Strategy
7. IPT Strategy
8. Traffic Management
9. Travel Demand Management Strategy
Planning
Strategies
Network
Development &
Mobility Corridors
Freight
Management
Strategy
Non-Motorized
Transport Strategy
Public Transit
Improvement
Strategy
Travel Demand
Management
Strategy
Land Use &
Transport Strategy
Traffic
Engineering
Measures
Suggested Transport Planning Strategies
11/15/2017 Dr Sanjay Gupta, SPA

• Encourage movement of “people” rather than “vehicles”
• Ensure an integrated land use transport development in
urban areas
• Ensure inclusive mobility environment
• Encourage environment friendly modes in urban areas
including pedestrianisation
• Evolve transit systems based on urban form, city size
and corridor travel demand which are economically and
financially sustainable to operate
• Comprehensive Mobility Planning approach needs to be
promoted
Suggested Sustainable Transport Planning Imperatives
11/15/2017 Dr Sanjay Gupta, SPA


