Download - 19 July 2016 Netflix, Inc. - Credit Suisse

DISCLOSURE APPENDIX AT THE BACK OF THIS REPORT CONTAINS IMPORTANT DISCLOSURES, ANALYST CERTIFICATIONS, LEGAL ENTITY DISCLOSURE AND THE STATUS OF NON-US ANALYSTS. US Disclosure: Credit Suisse does and seeks to do business with companies covered in its research reports. As a result, investors should be aware that the Firm may have a conflict of interest that could affect the objectivity of this report. Investors should consider this report as only a single factor in making their investment decision.
19 July 2016Americas/United States
Equity ResearchNew Media
Netflix, Inc. (NFLX)
INCREASE TARGET PRICE Rating NEUTRAL [V]Price (18-Jul-16,US$) 98.81Target price (US$) (from 119.00) 122.0052-week price range 130.93 - 82.79Market cap (US$ m) 42,320.20*Stock ratings are relative to the coverage universe in each analyst's or each team's respective sector.¹Target price is for 12 months.[V] = Stock Considered Volatile (see Disclosure Appendix)
Research AnalystsStephen Ju
212 325 [email protected]
Christopher Ford212 538 8446
Bo Yang 212 538 4468
Higher-Than-Expected Churn, but Gross Adds Remain Stable■ Event: Netflix reported 2Q16 results with revenue and EPS at $2.11b/$0.09
vs. CS $2.13b/$0.06. Domestic paid streaming subscribers were 46.0m vs. guidance 46.4m and domestic streaming revenue was $1.21b in line with guidance of $1.21b. Int'l paid streaming subscribers were 33.9m vs. guidance 34.29m and Int'l streaming revenue was $758.2m ahead of guidance $754.0m. Our FY16 adj. EPS estimate is now $0.51 vs. prior $0.59.
■ Investment Case: Citing un-grandfathering in the US, as well as larger International markets, and the upcoming Olympics, Netflix provided lower-than-expected sub growth guidance for Int'l for 3Q16 – that said as it continues to see within-expectations gross adds, this suggests that demand for Netflix's services remains robust and once this period of elevated churn due to price hikes is behind us, it should resume normalized net add growth. Hence, contrary to the guidance of 2Q16, we have not decreased the slope of Int'l growth for 2017 and beyond. This compounded with lower-than-expected content costs drive our price target modestly higher. We remain on the sidelines for now on valuation and maintain our Neutral rating.
■ Changes to Estimates: Our updated revenue and Adj. EPS projections for FY16 are now $8.88 billion and $0.51 vs. prior $9.04 billion and $0.59.
■ Valuation: Our updated DCF-derived target, which uses an 11.5% WACC and 3% terminal growth rate is now $122 vs. prior $119.
Share price performance
N FLX.O Q S& P 5 0 0 IN D EX
O ct - 1 5 Jan - 1 6 A p r - 1 6 Ju l - 1 68 0
1 0 0
1 2 0
1 4 0
On 18-Jul-2016 the S&P 500 INDEX closed at 2166.89Daily Jul20, 2015 - Jul18, 2016, 07/20/15 = US$110.55
Quarterly EPS Q1 Q2 Q3 Q42015A 0.11 0.10 0.12 0.272016E 0.13 0.17 0.12 0.082017E 0.39 0.32 0.32 0.36
Financial and valuation metricsYear 12/15A 12/16E 12/17E 12/18EEPS (Excl. ESO) (US$) 0.60 0.51 1.39 2.84EPS (CS adj., ) 0.60 0.51 1.39 2.84Prev. EPS (CS adj., US$) - 0.59 1.83 3.28P/E (CS adj.) (x) 163.9 195.0 71.3 34.8P/E rel. (CS adj., %) 919.5 1104.6 459.0 251.4Revenue (US$ m) 6,779.5 8,877.5 11,753.7 14,111.7EBITDA (US$ m) 492.8 458.6 1,192.5 2,353.4Net Debt (US$ m) 61 193 1,099 -351OCFPS (US$) -1.47 -1.14 -1.79 3.29P/OCF (x) -77.8 -86.8 -55.1 30.0
Number of shares (m) 428.30 Price/Sales (x) 5.48BV/share (Next Qtr., US$) 6.9 P/BVPS (x) 16.0Net debt (Next Qtr., US$ m) 262.3 Dividend (current, US$) -Dividend yield (%) -Source: Company data, Thomson Reuters, Credit Suisse estimates

19 July 2016
Netflix, Inc. (NFLX) 2
Investment CaseCiting un-grandfathering in the US, as well as larger International markets, and the upcoming Olympics, Netflix provided lower-than-expected sub growth guidance for Int'l for 3Q16 – that said as it continues to see within-expectations gross adds, this suggests that demand for Netflix's services remains robust and once this period of elevated churn due to price hikes is behind us, it should resume normalized net add growth.
Hence, contrary to the guidance of 2Q16, we have not decreased the slope of Int'l growth for 2017 and beyond. This compounded with lower-than-expected content costs drive our price target modestly higher to $122 vs. prior $119.
We remain on the sidelines for now on valuation and maintain our Neutral rating. And as we have noted earlier, we will be looking at the following factors to see if a change in our investment stance is warranted:
1. Faster-than-expected realization of target operating margins both domestically and Internationally
2. Acceleration of consumer adoption especially in International markets due to the proliferation of connected devices
3. Greater-than-expected moderation of content spend due to decreased reliance on licensed content in favor of its original programming
3Q16 Guidance and Changes to EstimatesDomestic Streaming:Netflix management offered 3Q16 guidance contemplating net addition of 0.3 million domestic streaming customers, with paid subscribers at 46.40 million and total subscribers at 47.43 million. Streaming revenue guidance as a result calls for $1.31 billion:
Figure 1: Netflix, Inc. – Quarterly Paid Domestic Streaming Subscribers and Year Over Year Growthin millions, unless otherwise stated
Figure 2: Netflix, Inc. – Quarterly Domestic Streaming Revenue and Year Over Year GrowthUSD in millions, unless otherwise stated
36.3 37.7 40.3 41.1 42.1 43.4 45.7 46.0 46.4
21%
19%17% 17%
16%15%
13%12%
10%
0%
5%
10%
15%
20%
25%
0
5
10
15
20
25
30
35
40
45
50
3Q14A 4Q14A 1Q15A 2Q15A 3Q15A 4Q15A 1Q16A 2Q16A 3Q16E
877.2 917.4 984.5 1,025.9 1,064.0 1,105.9 1,161.2 1,208.3 1,315.1
25%24% 23% 22%
21% 21%
18% 18%
24%
0%
5%
10%
15%
20%
25%
30%
0
200
400
600
800
1000
1200
1400
3Q14A 4Q14A 1Q15A 2Q15A 3Q15A 4Q15A 1Q16A 2Q16A 3Q16E
Source: Company data, Credit Suisse estimates Source: Company data, Credit Suisse estimates
CS estimates for paid Domestic Streaming subscribers and revenue are at 46.4 million and $1.32 billion respectively.

19 July 2016
Netflix, Inc. (NFLX) 3
International Streaming:3Q16 guidance calls for a net addition of 2.0 million International streaming customers, with paid subscribers at 35.99 million and total subscribers at 38.05 million. International Streaming revenue guidance is $846.0 million.
Figure 3: Netflix, Inc. – Quarterly Paid International Streaming Subscribers and Year Over Year GrowthIn millions
Figure 4: Netflix, Inc. – Quarterly International Streaming Revenue and Year Over Year GrowthUS$ in millions
14.4 16.8 19.3 21.6 24.0 27.4 32.0 33.9 36.0
78%73%
64%68% 66%
64% 66%
57%50%
0%
10%
20%
30%
40%
50%
60%
70%
80%
90%
0
5
10
15
20
25
30
35
40
3Q14A 4Q14A 1Q15A 2Q15A 3Q15A 4Q15A 1Q16A 2Q16A 3Q16E
345.7 387.8 415.4 454.8 516.9 566.4 651.7 758.2 848.2
89%
75%
56%48% 50%
46%
57%
67% 64%
0%
10%
20%
30%
40%
50%
60%
70%
80%
90%
100%
0
100
200
300
400
500
600
700
800
900
3Q14A 4Q14A 1Q15A 2Q15A 3Q15A 4Q15A 1Q16A 2Q16A 3Q16E
Source: Company data, Credit Suisse estimates Source: Company data, Credit Suisse estimates
CS estimates for paid International Streaming subscribers and revenue are at 36.0 million and $848.2 million, respectively.
DVD Segment:Although management does not offer explicit guidance for the DVD segment, our estimates for paid subscribers and revenue are as shown below.
Figure 5: Netflix, Inc. – Quarterly Paid DVD Subscribers and Year Over Year GrowthIn millions
Figure 6: Netflix, Inc. – Quarterly DVD Revenue and Year Over Year GrowthUS$ in millions
5.9 5.7 5.5 5.2 5.0 4.8 4.6 4.4 4.2
-16%
-16%
-16%
-15%
-16%
-16%
-15% -15%
-15%
-16%
-16%
-16%
-16%
-16%
-15%
-15%
-15%
-15%
-15%
-14%
0
1
2
3
4
5
6
7
3Q14A 4Q14A 1Q15A 2Q15A 3Q15A 4Q15A 1Q16A 2Q16A 3Q16E
186.6 179.7 173.2 164.0 157.5 151.0 144.7 138.7 131.5
-16%
-16%
-15%
-16%
-16%
-16%
-16%
-15%
-16%
-17%
-16%
-16%
-16%
-16%
-16%
-15%
-15%
-15%
-15%
-15%
0
20
40
60
80
100
120
140
160
180
200
3Q14A 4Q14A 1Q15A 2Q15A 3Q15A 4Q15A 1Q16A 2Q16A 3Q16E
Source: Company data, Credit Suisse estimates Source: Company data, Credit Suisse estimates
We have modeled a continued decrease to 4.2 million subscribers for 3Q16 and revenue as a result at $131.5 million.

19 July 2016
Netflix, Inc. (NFLX) 4
Changes to our 2016 estimates financial and operating metrics are as summarized below:
Figure 7: Netflix, Inc. – Summary Changes to CS 2016 EstimatesUSD in millions, unless otherwise stated
2016 2016Prior Current % Δ
Domestic Streaming Revenue 5199.6 5096.4 -2.0%Paid Subscribers (mm) 49.0 47.8 -2.4%
International Streaming Revenue 3305.5 3240.7 -2.0%Paid Subscribers (mm) 41.4 39.9 -3.7%
DVD Revenue 538.7 540.3 0.3%Paid Subscribers 4.0 4.0 0.6%
Revenue 9043.8 8877.5 -1.8%Cost of Revenue 6502.1 6323.2 -2.8%Gross Profit 2541.7 2554.3 0.5%Operating Income 289.9 217.6Net Income 146.3 100.5 -31.3%
Basic EPS $0.34 $0.23 -31.5%Basic Shares Outstanding 434.6 431.6 -0.7%Diluted EPS $0.33 $0.23 -31.0%Shares Outstanding 444.7 441.6 -0.7%
Adjusted EBITDA 534.9 458.6 -14.3%
Pro Forma Net Income 262.1 223.7 -14.6%
Adjusted EPS - Diluted $0.59 $0.51 -14.1%Source: Company data, Credit Suisse estimates
2Q16 Reported ResultsDomestic Streaming Results:Netflix reported Domestic Streaming revenue of $1.208 billion versus our $1.22 billion and guidance $1.21 billion as paid subscribers were 46.0 million versus guidance and CS 46.4 million.
Figure 8: Netflix, Inc. - 2Q16 Domestic Streaming Operating Metrics Variance vs CS EstimatesUSD in millions, unless otherwise stated
2Q16E 2Q16A % Δ AnalysisDomestic Streaming Revenue 1219.7 1208.3 -0.9% Versus guidance: $1.21bContribution Profit 402.4 414.4 3.0% Versus guidance: $403mPaid Subscribers (mm) 46.4 46.0 -0.9% Versus guidance: 46.41mTotal Subscribers (mm) 47.5 47.1 -0.8% Versus guidance: 47.47m
Source: Company data, Credit Suisse estimates
Domestic Contribution Profit was $414.4 million versus our $402.4 million and guidance $403 million.

19 July 2016
Netflix, Inc. (NFLX) 5
International Streaming Results:International Streaming revenue was $758.2 million versus our $771.3 million and guidance $754 million. Paid subscribers were 33.9 million versus guidance and CS 34.3 million.
Figure 9: Netflix, Inc. – 2Q16 International Streaming Operating Metrics Variance vs. CS EstimatesUSD in millions, unless otherwise stated
2Q16E 2Q16A % Δ AnalysisInternational Streaming Revenue 771.3 758.2 -1.7% Versus guidance: $754mContribution Profit (61.1) (69.2) -13.1% Versus guidance: ($80m)Paid Subscribers (mm) 34.3 33.9 -1.1% Versus guidance: 34.29mTotal Subscribers (mm) 36.6 36.0 -1.4% Versus guidance: 36.53m
Source: Company data, Credit Suisse estimates
International Contribution Profit dollars was a loss of ($69.2) million versus our ($61.1) million and guidance ($80) million.
DVD Segment Results:Lastly, Netflix's DVD segment reported $138.7 million in revenue versus our $138.1 million as paid subscribers came in at 4.4 million in line with our 4.4 million.
Figure 10: Netflix, Inc. - 2Q16 DVD Segment Operating Metrics Variance vs CS EstimatesUSD in millions, unless otherwise stated
2Q16E 2Q16A % Δ AnalysisDVD Revenue 138.1 138.7 0.4%Paid Subscribers 4.4 4.4 0.2%Total Subscribers 4.5 4.5 0.5%
Source: Company data, Credit Suisse estimates
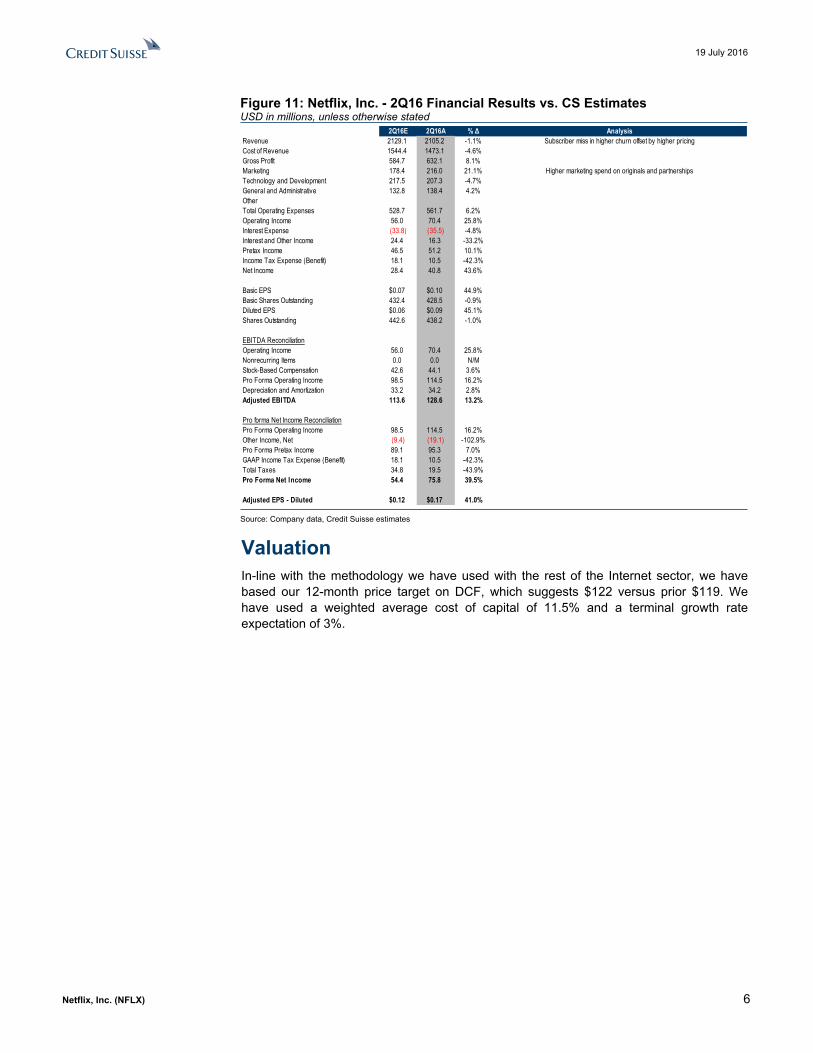
Reported Financials:As a result, Netflix's P&L variance versus our estimates are as shown below:
19 July 2016
Netflix, Inc. (NFLX) 6
Figure 11: Netflix, Inc. - 2Q16 Financial Results vs. CS EstimatesUSD in millions, unless otherwise stated
2Q16E 2Q16A % Δ AnalysisRevenue 2129.1 2105.2 -1.1% Subscriber miss in higher churn offset by higher pricingCost of Revenue 1544.4 1473.1 -4.6%Gross Profit 584.7 632.1 8.1%Marketing 178.4 216.0 21.1% Higher marketing spend on originals and partnershipsTechnology and Development 217.5 207.3 -4.7%General and Administrative 132.8 138.4 4.2%OtherTotal Operating Expenses 528.7 561.7 6.2%Operating Income 56.0 70.4 25.8%Interest Expense (33.8) (35.5) -4.8%Interest and Other Income 24.4 16.3 -33.2%Pretax Income 46.5 51.2 10.1%Income Tax Expense (Benefit) 18.1 10.5 -42.3%Net Income 28.4 40.8 43.6%
Basic EPS $0.07 $0.10 44.9%Basic Shares Outstanding 432.4 428.5 -0.9%Diluted EPS $0.06 $0.09 45.1%Shares Outstanding 442.6 438.2 -1.0%
EBITDA ReconciliationOperating Income 56.0 70.4 25.8%Nonrecurring Items 0.0 0.0 N/MStock-Based Compensation 42.6 44.1 3.6%Pro Forma Operating Income 98.5 114.5 16.2%Depreciation and Amortization 33.2 34.2 2.8%Adjusted EBITDA 113.6 128.6 13.2%
Pro forma Net Income ReconciliationPro Forma Operating Income 98.5 114.5 16.2%Other Income, Net (9.4) (19.1) -102.9%Pro Forma Pretax Income 89.1 95.3 7.0%GAAP Income Tax Expense (Benefit) 18.1 10.5 -42.3%Total Taxes 34.8 19.5 -43.9%Pro Forma Net Income 54.4 75.8 39.5%
Adjusted EPS - Diluted $0.12 $0.17 41.0%
Source: Company data, Credit Suisse estimates
ValuationIn-line with the methodology we have used with the rest of the Internet sector, we have based our 12-month price target on DCF, which suggests $122 versus prior $119. We have used a weighted average cost of capital of 11.5% and a terminal growth rate expectation of 3%.

19 July 2016
Netflix, Inc. (NFLX) 7
Figure 12: Netflix, Inc. -- Discounted Cash Flow AnalysisUS$ in millions, unless otherwise stated
CAGR 2016E 2017E 2018E 2019E 2020E 2021E '16-'21
EBITDA 458.6 1192.5 2353.4 3930.5 5666.3 7502.0 74.9%Net Income 100.5 523.4 1204.5 2199.9 3352.6 4641.6 115.2%Depreciation & Amortization 5051.9 6249.6 6848.1 7198.3 7417.3 7546.0 8.4%Other Non-Cash Charges (Benefits) 2548.1 3231.2 4057.8 4775.9 5382.3 5892.4 18.3%Interest Expense (Income) 73.9 94.6 95.8 (5.4) (207.2) (533.7)Changes in Operating Assets & Liabilities (8203.1) (10821.2) (10565.2) (10294.5) (10000.4) (9542.0)Unlevered Cash Flows (428.8) (722.3) 1640.9 3874.3 5944.6 8004.3Capital Expenditures 102.1 89.6 95.1 101.1 108.0 116.3Unlevered Free Cash Flows (530.8) (812.0) 1545.8 3773.2 5836.6 7888.0Y/Y % Change 18.0% -53.0% 290.4% 144.1% 54.7% 35.1%
Weighted Average Cost of Capital 11.5%Perpetual UFCF Growth Rate ("G") 3.0%
2016ENPV of Unlevered Free Cash Flows 11059.6Present Value of Terminal Value 55463.9Enterprise Value 66523.5Off-Balance Sheet Assets (12337.8)Adjusted Enterprise Value 54185.7Year End Net Debt (Cash) 192.5Equity Value 53993.2Diluted Shares Outstanding 441.6Equity Value Per Share $122
Source: Company data, Credit Suisse estimates
Risks to our price target for NFLX shares include the following factors:
Slower-than-expected rate of consumer adoption in any of the launched regions
Faster-than-expected adoption of competitive offerings
As Netflix becomes more global in its reach, the strengthening of the USD versus major currencies can also exert a headwind

19 July 2016
Netflix, Inc. (NFLX) 8
Figure 13: Netflix, Inc. – Quarterly Income StatementUSD in millions, unless otherwise stated
1Q15A 2Q15A 3Q15A 4Q15A 1Q16A 2Q16A 3Q16E 4Q16E 1Q17E 2Q17E 3Q17E 4Q17EDomestic Streaming Revenue 984.5 1025.9 1064.0 1105.9 1161.2 1208.3 1315.1 1411.8 1465.7 1508.5 1533.5 1569.4International Streaming Revenue 415.4 454.8 516.9 566.4 651.7 758.2 848.2 982.6 1161.1 1260.3 1346.4 1464.9Domestic DVD Revenue 173.2 164.0 157.5 151.0 144.7 138.7 131.5 125.3 119.9 114.4 107.9 101.6Revenue 1573.1 1644.7 1738.4 1823.3 1957.7 2105.2 2294.9 2519.7 2746.8 2883.2 2987.8 3135.9Total Cost of Goods Sold 1046.4 1121.8 1174.0 1249.4 1369.5 1473.1 1660.4 1820.2 1894.6 1972.0 2034.6 2097.3Gross Profit 526.7 522.9 564.4 574.0 588.2 632.1 634.5 699.5 852.1 911.2 953.2 1038.6Technology and Development 143.1 155.1 171.8 180.9 203.5 207.3 221.4 234.0 241.5 242.5 254.4 262.6Marketing 194.7 197.1 208.1 224.2 208.0 216.0 202.9 292.6 203.5 298.5 326.9 371.3General and Administrative 91.5 95.9 110.9 109.0 127.2 138.4 141.5 143.9 142.6 150.2 153.4 155.1Total Operating Expenses 429.3 448.1 490.8 514.1 538.7 561.7 565.7 670.5 587.6 691.3 734.7 789.0Operating Income (Loss) 97.5 74.8 73.6 59.9 49.5 70.4 68.8 29.0 264.6 220.0 218.5 249.6Interest and Other Income (32.3) 0.9 3.9 (3.7) 26.0 16.3 15.1 29.3 30.1 25.3 23.0 21.0Interest and Other Expense (26.7) (35.2) (35.3) (35.4) (35.5) (35.5) (41.2) (48.5) (48.5) (48.5) (48.5) (48.5)Total Other Income (Expense) (59.0) (34.3) (31.4) (39.2) (9.6) (19.1) (26.0) (19.2) (18.4) (23.2) (25.5) (27.5)Pretax Income 38.4 40.5 42.2 20.7 39.9 51.2 42.7 9.8 246.2 196.7 193.0 222.1Income Tax Provision (Benefit) 14.7 14.2 12.8 (22.4) 12.2 10.5 16.7 3.8 96.0 76.7 75.3 86.6Net Income to Common 23.7 26.3 29.4 43.2 27.7 40.8 26.1 6.0 150.2 120.0 117.7 135.5
Basic EPS $0.06 $0.06 $0.07 $0.10 $0.06 $0.10 $0.06 $0.01 $0.34 $0.27 $0.26 $0.30Shares Outstanding 423.6 425.3 426.9 427.7 428.1 428.5 432.8 437.1 440.4 443.7 447.0 450.4Diluted EPS $0.05 $0.06 $0.07 $0.10 $0.06 $0.09 $0.06 $0.01 $0.33 $0.26 $0.26 $0.29Shares Outstanding 433.8 436.1 437.6 438.3 438.0 438.2 443.0 447.3 450.6 453.9 457.2 460.5
EBITDA ReconciliationGAAP Operating Income 97.5 74.8 73.6 59.9 49.5 70.4 68.8 29.0 264.6 220.0 218.5 249.6Depreciation of PP&E 15.2 15.6 16.0 15.5 14.8 14.1 14.4 14.8 15.2 15.6 16.1 16.6Amortization of Intangibles 0.0 0.0 0.0 0.0 0.0 0.0 0.0 0.0 0.0 0.0 0.0 0.0EBITDA 112.6 90.4 89.7 75.4 64.3 84.5 83.2 43.8 279.8 235.6 234.6 266.2Nonrecurring Items 0.0 0.0 0.0 0.0 0.0 0.0 0.0 0.0 0.0 0.0 0.0 0.0Stock Based Compensation 27.4 28.6 32.8 35.9 42.4 44.1 45.9 50.4 41.2 43.2 44.8 47.0Proforma Operating Income 124.9 103.4 106.5 95.8 91.9 114.5 114.7 79.4 305.8 263.2 263.3 296.6Amortization of DVD Library 21.2 20.8 18.6 18.8 20.4 20.0 17.4 14.9 8.3 7.9 7.5 7.1Non-Cash Charges for Equity Granted to Non-Employees 0.0 0.0 0.0 0.0 0.0 0.0 0.0 0.0 0.0 0.0 0.0 0.0Adjusted EBITDA 140.0 119.0 122.5 111.2 106.7 128.6 129.1 94.2 321.0 278.9 279.4 313.2
Adjusted Net Income ReconciliationPro Forma Operating Income 124.9 103.4 106.5 95.8 91.9 114.5 114.7 79.4 305.8 263.2 263.3 296.6Interest and Other Income (32.3) 0.9 3.9 (3.7) 26.0 16.3 15.1 29.3 30.1 25.3 23.0 21.0Interest and Other Expense (26.7) (35.2) (35.3) (35.4) (35.5) (35.5) (41.2) (48.5) (48.5) (48.5) (48.5) (48.5)Pro Forma Pretax Income 65.8 69.1 75.1 56.6 82.3 95.3 88.6 60.2 287.4 240.0 237.8 269.1GAAP Tax Provision 7.3 14.2 12.8 (22.4) 12.2 10.5 16.7 3.8 96.0 76.7 75.3 86.6Income Tax Effect of Stock-Based Comp 17.9 10.0 10.0 (38.8) 13.0 9.0 17.9 19.7 16.1 16.9 17.5 18.3Implied Tax Rate 38.3% 35.0% 30.3% -108.3% 30.6% 20.5% 39.0% 39.0% 39.0% 39.0% 39.0% 39.0%Pro Forma Net Income Attributable to Common 48.0 44.9 52.3 117.9 57.1 75.8 54.1 36.7 175.3 146.4 145.1 164.2
Adjusted EPS - Diluted $0.11 $0.10 $0.12 $0.27 $0.13 $0.17 $0.12 $0.08 $0.39 $0.32 $0.32 $0.36
Y/Y % ChangeDomestic Streaming Revenue 23.3% 4.2% 3.7% 3.9% 17.9% 4.0% 8.8% 7.4% 26.2% 2.9% 1.7% 2.3%International Streaming Revenue 55.5% 9.5% 13.7% 9.6% 56.9% 16.3% 11.9% 15.8% 78.2% 8.5% 6.8% 8.8%Domestic DVD Revenue (15.2)% (5.3)% (4.0)% (4.1)% (16.4)% (4.2)% (5.2)% (4.8)% (17.1)% (4.6)% (5.7)% (5.8)%Revenue 23.9% 4.5% 5.7% 4.9% 24.4% 7.5% 9.0% 9.8% 40.3% 5.0% 3.6% 5.0%Total Cost of Goods Sold 20.4% 7.2% 4.7% 6.4% 30.9% 7.6% 12.7% 9.6% 38.3% 4.1% 3.2% 3.1%Gross Profit 31.4% (0.7)% 7.9% 1.7% 11.7% 7.5% 0.4% 10.2% 44.9% 6.9% 4.6% 9.0%Technology and Development 29.7% 8.4% 10.8% 5.3% 42.2% 1.9% 6.8% 5.7% 18.7% 0.4% 4.9% 3.2%Marketing 42.0% 1.3% 5.6% 7.7% 6.8% 3.9% (6.1)% 44.2% (2.2)% 46.7% 9.5% 13.6%General and Administrative 63.7% 4.8% 15.6% (1.7)% 39.1% 8.8% 2.2% 1.7% 12.1% 5.3% 2.1% 1.1%Operating Income (0.1)% (23.2)% (1.6)% (18.7)% (49.3)% 42.3% (2.3)% (57.8)% 435.0% (16.9)% (0.7)% 14.2%Net Income to Common (55.4)% 11.1% 11.8% 46.7% 16.7% 47.4% (36.1)% (77.0)% 442.9% (20.1)% (1.9)% 15.1%Pro Forma Operating Income 1.2% (17.2)% 2.9% (10.1)% (26.4)% 24.6% 0.2% (30.7)% 232.8% (13.9)% 0.0% 12.7%Adjusted EBITDA 3.1% (15.0)% 3.0% (9.2)% (23.8)% 20.6% 0.4% (27.0)% 200.9% (13.1)% 0.2% 12.1%Pro Forma Net Income Attributable to Common (30.0)% (6.4)% 16.4% 125.3% 18.9% 32.9% (28.7)% (32.0)% 207.1% (16.5)% (0.9)% 13.2%
MarginsGross Margin 33.5% 31.8% 32.5% 31.5% 30.0% 30.0% 27.6% 27.8% 31.0% 31.6% 31.9% 33.1%GAAP Operating Margin 6.2% 4.6% 4.2% 3.3% 2.5% 3.3% 3.0% 1.2% 9.6% 7.6% 7.3% 8.0%Pro Forma Operating Margin 7.9% 6.3% 6.1% 5.3% 4.7% 5.4% 5.0% 3.2% 11.1% 9.1% 8.8% 9.5%Adjusted EBITDA Margin 8.9% 7.2% 7.0% 6.1% 5.4% 6.1% 5.6% 3.7% 11.7% 9.7% 9.4% 10.0%Net Income Margin 1.5% 1.6% 1.7% 2.4% 1.4% 1.9% 1.1% 0.2% 5.5% 4.2% 3.9% 4.3%Adjusted Net Income Margin 3.1% 2.7% 3.0% 6.5% 2.9% 3.6% 2.4% 1.5% 6.4% 5.1% 4.9% 5.2%
2017E2016E2015A
Source: Company data, Credit Suisse estimates
19 July 2016
Netflix, Inc. (NFLX) 9
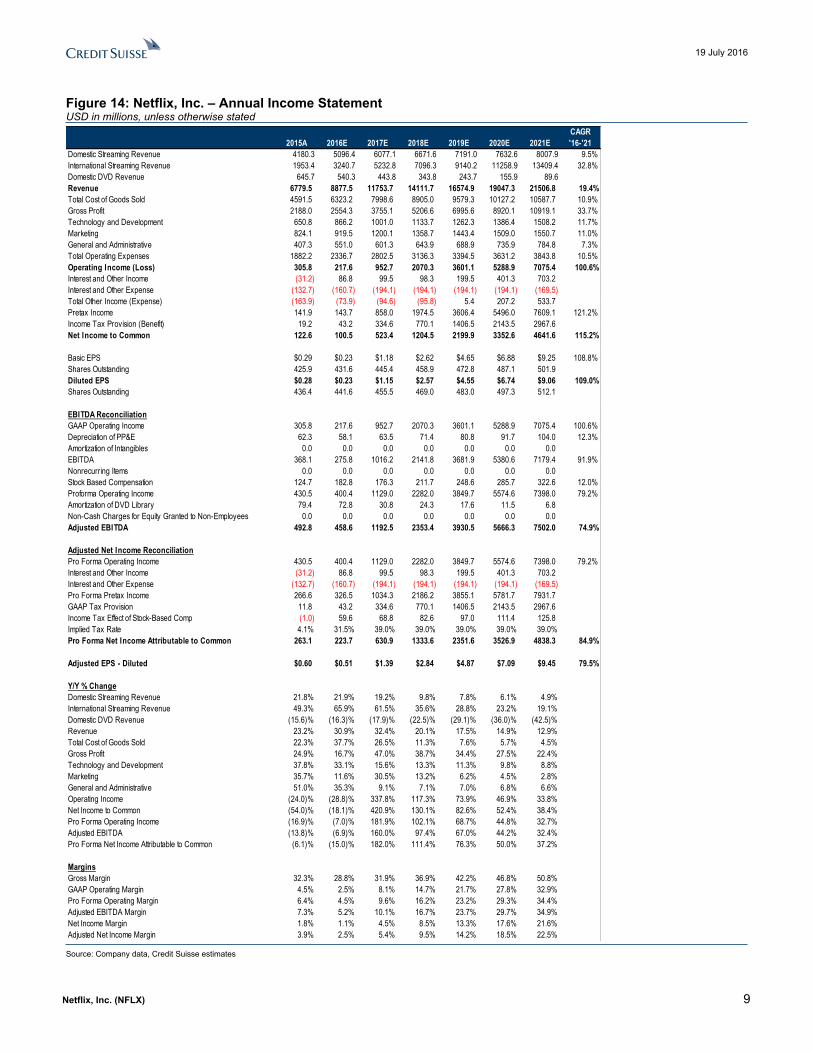
Figure 14: Netflix, Inc. – Annual Income StatementUSD in millions, unless otherwise stated
CAGR2015A 2016E 2017E 2018E 2019E 2020E 2021E '16-'21
Domestic Streaming Revenue 4180.3 5096.4 6077.1 6671.6 7191.0 7632.6 8007.9 9.5%International Streaming Revenue 1953.4 3240.7 5232.8 7096.3 9140.2 11258.9 13409.4 32.8%Domestic DVD Revenue 645.7 540.3 443.8 343.8 243.7 155.9 89.6Revenue 6779.5 8877.5 11753.7 14111.7 16574.9 19047.3 21506.8 19.4%Total Cost of Goods Sold 4591.5 6323.2 7998.6 8905.0 9579.3 10127.2 10587.7 10.9%Gross Profit 2188.0 2554.3 3755.1 5206.6 6995.6 8920.1 10919.1 33.7%Technology and Development 650.8 866.2 1001.0 1133.7 1262.3 1386.4 1508.2 11.7%Marketing 824.1 919.5 1200.1 1358.7 1443.4 1509.0 1550.7 11.0%General and Administrative 407.3 551.0 601.3 643.9 688.9 735.9 784.8 7.3%Total Operating Expenses 1882.2 2336.7 2802.5 3136.3 3394.5 3631.2 3843.8 10.5%Operating Income (Loss) 305.8 217.6 952.7 2070.3 3601.1 5288.9 7075.4 100.6%Interest and Other Income (31.2) 86.8 99.5 98.3 199.5 401.3 703.2Interest and Other Expense (132.7) (160.7) (194.1) (194.1) (194.1) (194.1) (169.5)Total Other Income (Expense) (163.9) (73.9) (94.6) (95.8) 5.4 207.2 533.7Pretax Income 141.9 143.7 858.0 1974.5 3606.4 5496.0 7609.1 121.2%Income Tax Provision (Benefit) 19.2 43.2 334.6 770.1 1406.5 2143.5 2967.6Net Income to Common 122.6 100.5 523.4 1204.5 2199.9 3352.6 4641.6 115.2%
Basic EPS $0.29 $0.23 $1.18 $2.62 $4.65 $6.88 $9.25 108.8%Shares Outstanding 425.9 431.6 445.4 458.9 472.8 487.1 501.9Diluted EPS $0.28 $0.23 $1.15 $2.57 $4.55 $6.74 $9.06 109.0%Shares Outstanding 436.4 441.6 455.5 469.0 483.0 497.3 512.1
EBITDA ReconciliationGAAP Operating Income 305.8 217.6 952.7 2070.3 3601.1 5288.9 7075.4 100.6%Depreciation of PP&E 62.3 58.1 63.5 71.4 80.8 91.7 104.0 12.3%Amortization of Intangibles 0.0 0.0 0.0 0.0 0.0 0.0 0.0EBITDA 368.1 275.8 1016.2 2141.8 3681.9 5380.6 7179.4 91.9%Nonrecurring Items 0.0 0.0 0.0 0.0 0.0 0.0 0.0Stock Based Compensation 124.7 182.8 176.3 211.7 248.6 285.7 322.6 12.0%Proforma Operating Income 430.5 400.4 1129.0 2282.0 3849.7 5574.6 7398.0 79.2%Amortization of DVD Library 79.4 72.8 30.8 24.3 17.6 11.5 6.8Non-Cash Charges for Equity Granted to Non-Employees 0.0 0.0 0.0 0.0 0.0 0.0 0.0Adjusted EBITDA 492.8 458.6 1192.5 2353.4 3930.5 5666.3 7502.0 74.9%
Adjusted Net Income ReconciliationPro Forma Operating Income 430.5 400.4 1129.0 2282.0 3849.7 5574.6 7398.0 79.2%Interest and Other Income (31.2) 86.8 99.5 98.3 199.5 401.3 703.2Interest and Other Expense (132.7) (160.7) (194.1) (194.1) (194.1) (194.1) (169.5)Pro Forma Pretax Income 266.6 326.5 1034.3 2186.2 3855.1 5781.7 7931.7GAAP Tax Provision 11.8 43.2 334.6 770.1 1406.5 2143.5 2967.6Income Tax Effect of Stock-Based Comp (1.0) 59.6 68.8 82.6 97.0 111.4 125.8Implied Tax Rate 4.1% 31.5% 39.0% 39.0% 39.0% 39.0% 39.0%Pro Forma Net Income Attributable to Common 263.1 223.7 630.9 1333.6 2351.6 3526.9 4838.3 84.9%
Adjusted EPS - Diluted $0.60 $0.51 $1.39 $2.84 $4.87 $7.09 $9.45 79.5%
Y/Y % ChangeDomestic Streaming Revenue 21.8% 21.9% 19.2% 9.8% 7.8% 6.1% 4.9%International Streaming Revenue 49.3% 65.9% 61.5% 35.6% 28.8% 23.2% 19.1%Domestic DVD Revenue (15.6)% (16.3)% (17.9)% (22.5)% (29.1)% (36.0)% (42.5)%Revenue 23.2% 30.9% 32.4% 20.1% 17.5% 14.9% 12.9%Total Cost of Goods Sold 22.3% 37.7% 26.5% 11.3% 7.6% 5.7% 4.5%Gross Profit 24.9% 16.7% 47.0% 38.7% 34.4% 27.5% 22.4%Technology and Development 37.8% 33.1% 15.6% 13.3% 11.3% 9.8% 8.8%Marketing 35.7% 11.6% 30.5% 13.2% 6.2% 4.5% 2.8%General and Administrative 51.0% 35.3% 9.1% 7.1% 7.0% 6.8% 6.6%Operating Income (24.0)% (28.8)% 337.8% 117.3% 73.9% 46.9% 33.8%Net Income to Common (54.0)% (18.1)% 420.9% 130.1% 82.6% 52.4% 38.4%Pro Forma Operating Income (16.9)% (7.0)% 181.9% 102.1% 68.7% 44.8% 32.7%Adjusted EBITDA (13.8)% (6.9)% 160.0% 97.4% 67.0% 44.2% 32.4%Pro Forma Net Income Attributable to Common (6.1)% (15.0)% 182.0% 111.4% 76.3% 50.0% 37.2%
MarginsGross Margin 32.3% 28.8% 31.9% 36.9% 42.2% 46.8% 50.8%GAAP Operating Margin 4.5% 2.5% 8.1% 14.7% 21.7% 27.8% 32.9%Pro Forma Operating Margin 6.4% 4.5% 9.6% 16.2% 23.2% 29.3% 34.4%Adjusted EBITDA Margin 7.3% 5.2% 10.1% 16.7% 23.7% 29.7% 34.9%Net Income Margin 1.8% 1.1% 4.5% 8.5% 13.3% 17.6% 21.6%Adjusted Net Income Margin 3.9% 2.5% 5.4% 9.5% 14.2% 18.5% 22.5%
Source: Company data, Credit Suisse estimates

19 July 2016
Netflix, Inc. (NFLX) 10
Figure 15: Netflix, Inc. – Balance SheetUSD in millions, unless otherwise stated
2015A 2016E 2017E 2018E 2019E 2020E 2021EASSETSCash and Equivalents 1809.3 2764.2 1857.8 3308.0 7086.8 13130.8 21552.7Short-Term Investments 501.4 443.3 443.3 443.3 443.3 443.3 443.3Prepaid Expenses 0.0 20.1 23.7 26.6 28.8 30.8 32.5Prepaid Revenue-Sharing Expenses 0.0 0.0 0.0 0.0 0.0 0.0 0.0Current Content Library, Net 2906.0 3696.8 5317.7 6246.5 6622.0 6569.4 6069.3Other Current Assets 215.1 203.4 203.4 203.4 203.4 203.4 203.4Total Current Assets 5431.8 7127.8 7845.9 10227.9 14384.3 20377.7 28301.3DVD Library, Net 4312.8 7049.4 10289.9 13351.4 16329.9 19222.8 21976.3Intangible Assets, Net 0.0 0.1 0.0 0.0 0.0 0.0 0.0Property and Equipment, Net 173.4 158.5 155.4 156.4 160.8 166.9 173.4Deposits 0.0 0.0 0.0 0.0 0.0 0.0 0.0Other Assets 284.8 300.8 300.8 300.8 300.8 300.8 300.8Total Assets 10202.9 14636.6 18591.9 24036.5 31175.8 40068.2 50751.8
LIABILITIES & STOCKHOLDERS' EQUITYAccounts Payable 253.5 294.7 346.8 390.3 422.5 451.5 476.7Content Accounts Payable 2789.0 3921.6 6264.9 9650.8 13862.2 18724.8 24117.3Accrued Expenses 140.4 221.0 260.1 292.7 316.9 338.6 357.5Deferred Revenue 346.7 446.2 555.7 661.8 768.6 875.2 980.3Current Portion of Capital Lease Obligations 0.0 0.0 0.0 0.0 0.0 0.0 0.0Notes Payable 0.0 0.0 0.0 0.0 0.0 0.0 0.0Total Current Liabilities 3529.6 4883.6 7427.5 10995.6 15370.1 20390.0 25931.9Long-Term Debt 2371.4 3400.0 3400.0 3400.0 3400.0 3400.0 2900.0Long-Term Debt Due to Related Party 0.0 0.0 0.0 0.0 0.0 0.0 0.0Deferred Rent 0.0 0.0 0.0 0.0 0.0 0.0 0.0Capital Lease Obligations, Less Current 0.0 0.0 0.0 0.0 0.0 0.0 0.0Non-Current Content Liabilities 2026.4 3240.2 3951.8 4412.0 4728.0 4961.9 5139.3Other Non-Current Liabilities 52.1 54.2 54.2 54.2 54.2 54.2 54.2Total Liabilities 7979.4 11578.1 14833.6 18861.8 23552.3 28806.2 34025.4
Stockholders' EquityCommon Stock 0.0 0.4 0.5 0.5 0.5 0.5 0.5Additional Paid-In Capital 1324.8 2053.9 2230.3 2442.2 2691.0 2977.0 3799.8Deferred Stock-Based Compensation 0.0 0.0 0.0 0.0 0.0 0.0 0.0Accumulated Other Comprehensive Income (43.3) (38.2) (38.2) (38.2) (38.2) (38.2) (38.2)Retained Earnings 941.9 1042.4 1565.8 2770.3 4970.2 8322.8 12964.3Treasury Stock 0.0 0.0 0.0 0.0 0.0 0.0 0.0Total Shareholder Equity: 2223.4 3058.5 3758.4 5174.7 7623.5 11262.0 16726.4Total Liabilities and Shareholder's Equity 10202.9 14636.6 18591.9 24036.5 31175.8 40068.2 50751.8
Source: Company data, Credit Suisse estimates

19 July 2016
Netflix, Inc. (NFLX) 11
Figure 16: Netflix, Inc. – Cash Flow StatementUSD in millions, unless otherwise stated
2015A 2016E 2017E 2018E 2019E 2020E 2021ECash Flows from Operating Activities:Net Income (Loss) 122.6 100.5 523.4 1204.5 2199.9 3352.6 4641.6Depreciation of Property and Equipment 62.3 58.1 63.5 71.4 80.8 91.7 104.0Amortization of DVD Library 79.4 72.8 30.8 24.3 17.6 11.5 6.8Amortization of Streaming Content Library 3405.4 4921.0 6155.3 6752.4 7099.9 7314.1 7435.2Change in Streaming Content Liabilities 1162.4 2365.2 3054.9 3846.1 4527.3 5096.6 5569.8Stock-Based Compensation Expense 124.7 182.8 176.3 211.7 248.6 285.7 322.6Other 0.0 0.0 0.0 0.0 0.0 0.0 0.0Changes in Operating Assets and Liabilities:Prepaid Content 0.0 0.0 0.0 0.0 0.0 0.0 0.0Prepaid Expenses and Other Current Assets 0.0 (20.1) (3.6) (3.0) (2.2) (2.0) (1.7)Acquisition of Streaming Content Library (5744.9) (8423.9) (11018.2) (10744.4) (10455.5) (10155.7) (9689.7)Accounts Payable 51.6 43.2 52.1 43.5 32.2 29.0 25.3Accrued Expenses 48.8 92.3 39.1 32.6 24.2 21.7 19.0Deferred Revenue 72.1 99.5 109.5 106.1 106.8 106.6 105.2Deferred Rent and Other (26.5) 5.9 0.0 0.0 0.0 0.0 0.0Cash Provided by Operating Activities: (641.9) (502.7) (817.0) 1545.1 3879.7 6151.8 8538.0
Cash Flows from Investing Activities:Proceeds from Sale of Short-Term Investments 363.8 114.6 0.0 0.0 0.0 0.0 0.0Purchase of Short-Term Investments 0.0 0.0 0.0 0.0 0.0 0.0 0.0Purchases of Property and Equipment (91.2) (44.0) (60.4) (72.5) (85.1) (97.8) (110.5)Acquisitions of DVD Library (78.0) (58.1) (29.3) (22.6) (16.0) (10.2) (5.8)Proceeds from Sale of DVDs 0.0 0.0 0.0 0.0 0.0 0.0 0.0Deposits and Other Assets (1.9) 0.6 0.0 0.0 0.0 0.0 0.0Cash Provided by Investing Activities (179.2) (40.3) (89.6) (95.1) (101.1) (108.0) (116.3)
Cash Flows from Financing Activities:Proceeds from Issuance of Common Stock 158.5 32.4 0.0 0.0 0.0 0.0 0.0Principal Payments on Notes Payable and Capital Lease Obligations(0.9) 0.2 0.2 0.2 0.2 0.2 0.2Repurchases of Common Stock, Other 0.0 0.0 0.0 0.0 0.0 0.0 0.0Net Cash Provided by Financing Activities 1640.3 1532.6 0.2 0.2 0.2 0.2 0.2
Effect of Exchange Rate on Cash 0.0 0.0 0.0 0.0 0.0 0.0 0.0
Net Increase (Decrease) in Cash and Cash Equivalents 695.7 954.9 (906.4) 1450.2 3778.8 6044.0 8422.0
Cash and Cash Equivalents Beginning of Period 1113.6 1809.3 2764.2 1857.8 3308.0 7086.8 13130.8Cash and Cash Equivalents End of Period 1809.3 2764.2 1857.8 3308.0 7086.8 13130.8 21552.7
Source: Company data, Credit Suisse estimates
19 July 2016
Netflix, Inc. (NFLX) 12
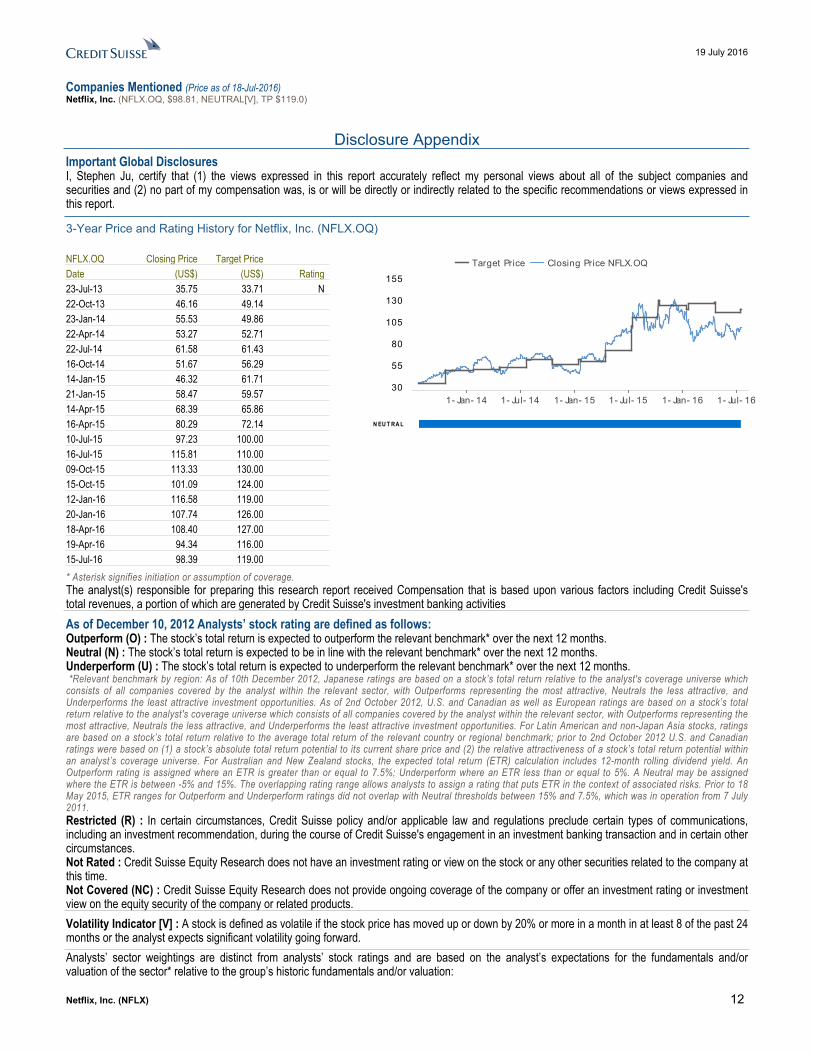
Companies Mentioned (Price as of 18-Jul-2016)Netflix, Inc. (NFLX.OQ, $98.81, NEUTRAL[V], TP $119.0)
Disclosure AppendixImportant Global Disclosures I, Stephen Ju, certify that (1) the views expressed in this report accurately reflect my personal views about all of the subject companies and securities and (2) no part of my compensation was, is or will be directly or indirectly related to the specific recommendations or views expressed in this report.
3-Year Price and Rating History for Netflix, Inc. (NFLX.OQ)
NFLX.OQ Closing Price Target Price Date (US$) (US$) Rating 23-Jul-13 35.75 33.71 N 22-Oct-13 46.16 49.14 23-Jan-14 55.53 49.86 22-Apr-14 53.27 52.71 22-Jul-14 61.58 61.43 16-Oct-14 51.67 56.29 14-Jan-15 46.32 61.71 21-Jan-15 58.47 59.57 14-Apr-15 68.39 65.86 16-Apr-15 80.29 72.14 10-Jul-15 97.23 100.00 16-Jul-15 115.81 110.00 09-Oct-15 113.33 130.00 15-Oct-15 101.09 124.00 12-Jan-16 116.58 119.00 20-Jan-16 107.74 126.00 18-Apr-16 108.40 127.00 19-Apr-16 94.34 116.00 15-Jul-16 98.39 119.00 * Asterisk signifies initiation or assumption of coverage.
Target Price Closing Price NFLX.OQ
1- Jan- 14 1- Jul- 14 1- Jan- 15 1- Jul- 15 1- Jan- 16 1- Jul- 1630
55
80
105
130
155
N EU T RA L
The analyst(s) responsible for preparing this research report received Compensation that is based upon various factors including Credit Suisse's total revenues, a portion of which are generated by Credit Suisse's investment banking activitiesAs of December 10, 2012 Analysts’ stock rating are defined as follows:Outperform (O) : The stock’s total return is expected to outperform the relevant benchmark* over the next 12 months.Neutral (N) : The stock’s total return is expected to be in line with the relevant benchmark* over the next 12 months.Underperform (U) : The stock’s total return is expected to underperform the relevant benchmark* over the next 12 months. *Relevant benchmark by region: As of 10th December 2012, Japanese ratings are based on a stock’s total return relative to the analyst's coverage universe which consists of all companies covered by the analyst within the relevant sector, with Outperforms representing the most attractive, Neutrals the less attractive, and Underperforms the least attractive investment opportunities. As of 2nd October 2012, U.S. and Canadian as well as European ratings are based on a stock’s total return relative to the analyst's coverage universe which consists of all companies covered by the analyst within the relevant sector, with Outperforms representing the most attractive, Neutrals the less attractive, and Underperforms the least attractive investment opportunities. For Latin American and non-Japan Asia stocks, ratings are based on a stock’s total return relative to the average total return of the relevant country or regional benchmark; prior to 2nd October 2012 U.S. and Canadian ratings were based on (1) a stock’s absolute total return potential to its current share price and (2) the relative attractiveness of a stock’s total return potential within an analyst’s coverage universe. For Australian and New Zealand stocks, the expected total return (ETR) calculation includes 12-month rolling dividend yield. An Outperform rating is assigned where an ETR is greater than or equal to 7.5%; Underperform where an ETR less than or equal to 5%. A Neutral may be assigned where the ETR is between -5% and 15%. The overlapping rating range allows analysts to assign a rating that puts ETR in the context of associated risks. Prior to 18 May 2015, ETR ranges for Outperform and Underperform ratings did not overlap with Neutral thresholds between 15% and 7.5%, which was in operation from 7 July 2011.Restricted (R) : In certain circumstances, Credit Suisse policy and/or applicable law and regulations preclude certain types of communications, including an investment recommendation, during the course of Credit Suisse's engagement in an investment banking transaction and in certain other circumstances.Not Rated : Credit Suisse Equity Research does not have an investment rating or view on the stock or any other securities related to the company at this time.Not Covered (NC) : Credit Suisse Equity Research does not provide ongoing coverage of the company or offer an investment rating or investment view on the equity security of the company or related products.Volatility Indicator [V] : A stock is defined as volatile if the stock price has moved up or down by 20% or more in a month in at least 8 of the past 24 months or the analyst expects significant volatility going forward.Analysts’ sector weightings are distinct from analysts’ stock ratings and are based on the analyst’s expectations for the fundamentals and/or valuation of the sector* relative to the group’s historic fundamentals and/or valuation:

19 July 2016
Netflix, Inc. (NFLX) 13
Overweight : The analyst’s expectation for the sector’s fundamentals and/or valuation is favorable over the next 12 months.Market Weight : The analyst’s expectation for the sector’s fundamentals and/or valuation is neutral over the next 12 months.Underweight : The analyst’s expectation for the sector’s fundamentals and/or valuation is cautious over the next 12 months. *An analyst’s coverage sector consists of all companies covered by the analyst within the relevant sector. An analyst may cover multiple sectors.
Credit Suisse's distribution of stock ratings (and banking clients) is:
Global Ratings DistributionRating Versus universe (%) Of which banking clients (%)Outperform/Buy* 51% (43% banking clients)Neutral/Hold* 35% (17% banking clients)Underperform/Sell* 13% (38% banking clients)Restricted 1%*For purposes of the NYSE and NASD ratings distribution disclosure requirements, our stock ratings of Outperform, Neutral, and Underperform most closely correspond to Buy, Hold, and Sell, respectively; however, the meanings are not the same, as our stock ratings are determined on a relative basis. (Please refer to definitions above.) An investor's decision to buy or sell a security should be based on investment objectives, current holdings, and other individual factors.
Credit Suisse’s policy is to update research reports as it deems appropriate, based on developments with the subject company, the sector or the market that may have a material impact on the research views or opinions stated herein. Credit Suisse's policy is only to publish investment research that is impartial, independent, clear, fair and not misleading. For more detail please refer to Credit Suisse's Policies for Managing Conflicts of Interest in connection with Investment Research: http://www.csfb.com/research-and-analytics/disclaimer/managing_conflicts_disclaimer.htmlCredit Suisse does not provide any tax advice. Any statement herein regarding any US federal tax is not intended or written to be used, and cannot be used, by any taxpayer for the purposes of avoiding any penalties.
Target Price and RatingValuation Methodology and Risks: (12 months) for Netflix, Inc. (NFLX.OQ)
Method: Our $119 target price for Netflix is calculated using discounted cash flow. We use a 3% terminal growth rate, a 11.5% weighted average cost of capital. We maintain our Neutral stance primarily on valuation and factors which can get us to change our stance include: 1) Faster-than-expected realization of target operating margins both domestically and Internationally, 2) Acceleration of consumer adoption especially in International markets due to the proliferation of connected devices, 3) Moderation of content spends due to traction of its original programming.
Risk: Risks to our $119 target price for Netflix shares include the following factors: 1) Slower-than-expected rate of consumer adoption in any of the launched regions, 2) Faster-than-expected adoption of competitive offerings, 3) As Netflix becomes more global in its reach, the strengthening of the USD versus major currencies can also exert a headwind.
Please refer to the firm's disclosure website at https://rave.credit-suisse.com/disclosures for the definitions of abbreviations typically used in the target price method and risk sections. See the Companies Mentioned section for full company names The subject company (NFLX.OQ) currently is, or was during the 12-month period preceding the date of distribution of this report, a client of Credit Suisse.Credit Suisse expects to receive or intends to seek investment banking related compensation from the subject company (NFLX.OQ) within the next 3 months.As of the date of this report, Credit Suisse makes a market in the following subject companies (NFLX.OQ).For a history of recommendations for the subject company(ies) featured in this report, disseminated within the past 12 months, please refer to https://rave.credit-suisse.com/disclosures/view/report?i=238460&v=-582ahbcuyoyulmfc69vx0g3wh . Important Regional Disclosures Singapore recipients should contact Credit Suisse AG, Singapore Branch for any matters arising from this research report.The analyst(s) involved in the preparation of this report may participate in events hosted by the subject company, including site visits. Credit Suisse does not accept or permit analysts to accept payment or reimbursement for travel expenses associated with these events.Restrictions on certain Canadian securities are indicated by the following abbreviations: NVS--Non-Voting shares; RVS--Restricted Voting Shares; SVS--Subordinate Voting Shares.Individuals receiving this report from a Canadian investment dealer that is not affiliated with Credit Suisse should be advised that this report may not contain regulatory disclosures the non-affiliated Canadian investment dealer would be required to make if this were its own report.For Credit Suisse Securities (Canada), Inc.'s policies and procedures regarding the dissemination of equity research, please visit https://www.credit-suisse.com/sites/disclaimers-ib/en/canada-research-policy.html.As of the date of this report, Credit Suisse acts as a market maker or liquidity provider in the equities securities that are the subject of this report.Principal is not guaranteed in the case of equities because equity prices are variable.Commission is the commission rate or the amount agreed with a customer when setting up an account or at any time after that.This research report is authored by:Credit Suisse Securities (USA) LLC ........................................................................................................................................................Stephen Ju

19 July 2016
Netflix, Inc. (NFLX) 14
For Credit Suisse disclosure information on other companies mentioned in this report, please visit the website at https://rave.credit-suisse.com/disclosures or call +1 (877) 291-2683.

19 July 2016
Netflix, Inc. (NFLX) 15
This report is produced by subsidiaries and affiliates of Credit Suisse operating under its Global Markets Division. For more information on our structure, please use the following link: https://www.credit-suisse.com/who-we-are This report may contain material that is not directed to, or intended for distribution to or use by, any person or entity who is a citizen or resident of or located in any locality, state, country or other jurisdiction where such distribution, publication, availability or use would be contrary to law or regulation or which would subject Credit Suisse or its affiliates ("CS") to any registration or licensing requirement within such jurisdiction. All material presented in this report, unless specifically indicated otherwise, is under copyright to CS. None of the material, nor its content, nor any copy of it, may be altered in any way, transmitted to, copied or distributed to any other party, without the prior express written permission of CS. All trademarks, service marks and logos used in this report are trademarks or service marks or registered trademarks or service marks of CS or its affiliates.The information, tools and material presented in this report are provided to you for information purposes only and are not to be used or considered as an offer or the solicitation of an offer to sell or to buy or subscribe for securities or other financial instruments. CS may not have taken any steps to ensure that the securities referred to in this report are suitable for any particular investor. CS will not treat recipients of this report as its customers by virtue of their receiving this report. The investments and services contained or referred to in this report may not be suitable for you and it is recommended that you consult an independent investment advisor if you are in doubt about such investments or investment services. Nothing in this report constitutes investment, legal, accounting or tax advice, or a representation that any investment or strategy is suitable or appropriate to your individual circumstances, or otherwise constitutes a personal recommendation to you. CS does not advise on the tax consequences of investments and you are advised to contact an independent tax adviser. Please note in particular that the bases and levels of taxation may change. Information and opinions presented in this report have been obtained or derived from sources believed by CS to be reliable, but CS makes no representation as to their accuracy or completeness. CS accepts no liability for loss arising from the use of the material presented in this report, except that this exclusion of liability does not apply to the extent that such liability arises under specific statutes or regulations applicable to CS. This report is not to be relied upon in substitution for the exercise of independent judgment. CS may have issued, and may in the future issue, other communications that are inconsistent with, and reach different conclusions from, the information presented in this report. Those communications reflect the different assumptions, views and analytical methods of the analysts who prepared them and CS is under no obligation to ensure that such other communications are brought to the attention of any recipient of this report. Some investments referred to in this report will be offered solely by a single entity and in the case of some investments solely by CS, or an associate of CS or CS may be the only market maker in such investments. Past performance should not be taken as an indication or guarantee of future performance, and no representation or warranty, express or implied, is made regarding future performance. Information, opinions and estimates contained in this report reflect a judgment at its original date of publication by CS and are subject to change without notice. The price, value of and income from any of the securities or financial instruments mentioned in this report can fall as well as rise. The value of securities and financial instruments is subject to exchange rate fluctuation that may have a positive or adverse effect on the price or income of such securities or financial instruments. Investors in securities such as ADR's, the values of which are influenced by currency volatility, effectively assume this risk. Structured securities are complex instruments, typically involve a high degree of risk and are intended for sale only to sophisticated investors who are capable of understanding and assuming the risks involved. The market value of any structured security may be affected by changes in economic, financial and political factors (including, but not limited to, spot and forward interest and exchange rates), time to maturity, market conditions and volatility, and the credit quality of any issuer or reference issuer. Any investor interested in purchasing a structured product should conduct their own investigation and analysis of the product and consult with their own professional advisers as to the risks involved in making such a purchase. Some investments discussed in this report may have a high level of volatility. High volatility investments may experience sudden and large falls in their value causing losses when that investment is realised. Those losses may equal your original investment. Indeed, in the case of some investments the potential losses may exceed the amount of initial investment and, in such circumstances, you may be required to pay more money to support those losses. Income yields from investments may fluctuate and, in consequence, initial capital paid to make the investment may be used as part of that income yield. Some investments may not be readily realisable and it may be difficult to sell or realise those investments, similarly it may prove difficult for you to obtain reliable information about the value, or risks, to which such an investment is exposed. This report may provide the addresses of, or contain hyperlinks to, websites. Except to the extent to which the report refers to website material of CS, CS has not reviewed any such site and takes no responsibility for the content contained therein. Such address or hyperlink (including addresses or hyperlinks to CS's own website material) is provided solely for your convenience and information and the content of any such website does not in any way form part of this document. Accessing such website or following such link through this report or CS's website shall be at your own risk.
This report is issued and distributed in European Union (except Switzerland): by Credit Suisse Securities (Europe) Limited, One Cabot Square, London E14 4QJ, England, which is authorised by the Prudential Regulation Authority and regulated by the Financial Conduct Authority and the Prudential Regulation Authority. Germany: Credit Suisse Securities (Europe) Limited Niederlassung Frankfurt am Main regulated by the Bundesanstalt fuer Finanzdienstleistungsaufsicht ("BaFin"). United States and Canada: Credit Suisse Securities (USA) LLC; Switzerland: Credit Suisse AG; Brazil: Banco de Investimentos Credit Suisse (Brasil) S.A or its affiliates; Mexico: Banco Credit Suisse (México), S.A. (transactions related to the securities mentioned in this report will only be effected in compliance with applicable regulation); Japan: by Credit Suisse Securities (Japan) Limited, Financial Instruments Firm, Director-General of Kanto Local Finance Bureau ( Kinsho) No. 66, a member of Japan Securities Dealers Association, The Financial Futures Association of Japan, Japan Investment Advisers Association, Type II Financial Instruments Firms Association; Hong Kong: Credit Suisse (Hong Kong) Limited; Australia: Credit Suisse Equities (Australia) Limited; Thailand: Credit Suisse Securities (Thailand) Limited, regulated by the Office of the Securities and Exchange Commission, Thailand, having registered address at 990 Abdulrahim Place, 27th Floor, Unit 2701, Rama IV Road, Silom, Bangrak, Bangkok10500, Thailand, Tel. +66 2614 6000; Malaysia: Credit Suisse Securities (Malaysia) Sdn Bhd, Credit Suisse AG, Singapore Branch; India: Credit Suisse Securities (India) Private Limited (CIN no.U67120MH1996PTC104392) regulated by the Securities and Exchange Board of India as Research Analyst (registration no. INH 000001030) and as Stock Broker (registration no. INB230970637; INF230970637; INB010970631; INF010970631), having registered address at 9th Floor, Ceejay House, Dr.A.B. Road, Worli, Mumbai - 18, India, T- +91-22 6777 3777; South Korea: Credit Suisse Securities (Europe) Limited, Seoul Branch; Taiwan: Credit Suisse AG Taipei Securities Branch; Indonesia: PT Credit Suisse Securities Indonesia; Philippines: Credit Suisse Securities (Philippines ) Inc., and elsewhere in the world by the relevant authorised affiliate of the above. Additional Regional DisclaimersHong Kong: Credit Suisse (Hong Kong) Limited ("CSHK") is licensed and regulated by the Securities and Futures Commission of Hong Kong under the laws of Hong Kong, which differ from Australian laws. CSHKL does not hold an Australian financial services licence (AFSL) and is exempt from the requirement to hold an AFSL under the Corporations Act 2001 (the Act) under Class Order 03/1103 published by the ASIC in respect of financial services provided to Australian wholesale clients (within the meaning of section 761G of the Act). Research on Taiwanese securities produced by Credit Suisse AG, Taipei Securities Branch has been prepared by a registered Senior Business Person. Malaysia: Research provided to residents of Malaysia is authorised by the Head of Research for Credit Suisse Securities (Malaysia) Sdn Bhd, to whom they should direct any queries on +603 2723 2020. Singapore: This report has been prepared and issued for distribution in Singapore to institutional investors, accredited investors and expert investors (each as defined under the Financial Advisers Regulations) only, and is also distributed by Credit Suisse AG, Singapore branch to overseas investors (as defined under the Financial Advisers Regulations). By virtue of your status as an institutional investor, accredited investor, expert investor or overseas investor, Credit Suisse AG, Singapore branch is exempted from complying with certain compliance requirements under the Financial Advisers Act, Chapter 110 of Singapore (the "FAA"), the Financial Advisers Regulations and the relevant Notices and Guidelines issued thereunder, in respect of any financial advisory service which Credit Suisse AG, Singapore branch may provide to you. UAE: This information is being distributed by Credit Suisse AG (DIFC Branch), duly licensed and regulated by the Dubai Financial Services Authority (“DFSA”). Related financial services or products are only made available to Professional Clients or Market Counterparties, as defined by the DFSA, and are not intended for any other persons. Credit Suisse AG (DIFC Branch) is located on Level 9 East, The Gate Building, DIFC, Dubai, United Arab Emirates. EU: This report has been produced by subsidiaries and affiliates of Credit Suisse operating under its Global Markets Division This research may not conform to Canadian disclosure requirements. In jurisdictions where CS is not already registered or licensed to trade in securities, transactions will only be effected in accordance with applicable securities legislation, which will vary from jurisdiction to jurisdiction and may require that the trade be made in accordance with applicable exemptions from registration or licensing requirements. Non-US customers wishing to effect a transaction should contact a CS entity in their local jurisdiction unless governing law permits otherwise. US customers wishing to effect a transaction should do so only by contacting a representative at Credit Suisse Securities (USA) LLC in the US. Please note that this research was originally prepared and issued by CS for distribution to their market professional and institutional investor customers. Recipients who are not market professional or institutional investor customers of CS should seek the advice of their independent financial advisor prior to taking any investment decision based on this report or for any necessary explanation of its contents. This research may relate to investments or services of a person outside of the UK or to other matters which are not authorised by the Prudential Regulation Authority and regulated by the Financial Conduct Authority and the Prudential Regulation Authority or in respect of which the protections of the Prudential Regulation Authority and Financial Conduct Authority for private customers and/or the UK compensation scheme may not be available, and further details as to where this may be the case are available upon request in respect of this report. CS may provide various services to US municipal entities or obligated persons ("municipalities"), including suggesting individual transactions or trades and entering into such transactions. Any services CS provides to municipalities are not viewed as "advice" within the meaning of Section 975 of the Dodd-Frank Wall Street Reform and Consumer Protection Act. CS is providing any such services and related information solely on an arm's length basis and not as an advisor or fiduciary to the municipality. In connection with the provision of the any such services, there is no agreement, direct or indirect, between any municipality (including the officials,management, employees or agents thereof) and CS for CS to provide advice to the municipality. Municipalities should consult with their financial, accounting and legal advisors regarding any such services provided by CS. In addition, CS is not acting for direct or indirect compensation to solicit the municipality on behalf of an unaffiliated broker, dealer, municipal securities dealer, municipal advisor, or investment adviser for the purpose of obtaining or retaining an engagement by the municipality for or in connection with Municipal Financial Products, the issuance of municipal securities, or of an investment adviser to provide investment advisory services to or on behalf of the municipality. If this report is being distributed by a financial institution other than Credit Suisse AG, or its affiliates, that financial institution is solely responsible for distribution. Clients of that institution should contact that institution to effect a transaction in the securities mentioned in this report or require further information. This report does not constitute investment advice by Credit Suisse to the clients of the distributing financial institution, and neither Credit Suisse AG, its affiliates, and their respective officers, directors and employees accept any liability whatsoever for any direct or consequential loss arising from their use of this report or its content. Principal is not guaranteed. Commission is the commission rate or the amount agreed with a customer when setting up an account or at any time after that. Copyright © 2016 CREDIT SUISSE AG and/or its affiliates. All rights reserved. Investment principal on bonds can be eroded depending on sale price or market price. In addition, there are bonds on which investment principal can be eroded due to changes in redemption amounts. Care is required when investing in such instruments. When you purchase non-listed Japanese fixed income securities (Japanese government bonds, Japanese municipal bonds, Japanese government guaranteed bonds, Japanese corporate bonds) from CS as a seller, you will be requested to pay the purchase price only.


