
15-1
Nuclear Nuclear Magnetic Magnetic
ResonanceResonanceChapter 15Chapter 15

15-2
Electromagnetic RadiationElectromagnetic Radiation Electromagnetic radiation: light and other
forms of radiant energy = c & E = h
Wavelength (): the distance between consecutive identical points on a wave
Frequency (): the number of full cycles of a wave that pass a point in a second
Hertz (Hz): the unit in which radiation frequency is reported; s-1 (read “per second”)

15-3
Electromagnetic RadiationElectromagnetic Radiation Wavelength

15-4
Molecular SpectroscopyMolecular Spectroscopy We study three types of molecular
spectroscopy
nuclear spin energy levels
vibrational energy levels
electronic energy levels
radio frequency
infrared
ultraviolet-visible
Absorption of Electromagnetic Radiation Results
in Transition Between
Region of the Electromagnetic
Spectrum

15-5
A pictorial view of UV/VisA pictorial view of UV/Vis
UV/Vis radiation is measured in nm UV/Vis radiation is measured in nm (wavelength)(wavelength)

15-6
IR SpectroscopyIR Spectroscopy
IR radiation is measured in cm-1
This is actually a frequency. Remember that frequency and wavelength are inversely proportional.

15-7
NMR SpectroscopyNMR Spectroscopy NMR uses radiowaves, measured in MHz

15-8
Nuclear Magnetic Resonance Spectroscopy
• When a charged particle such as a proton spins on its axis, it creates a magnetic field. Thus, the nucleus can be considered to be a tiny bar magnet.
• Normally, these tiny bar magnets are randomly oriented in space. However, in the presence of a magnetic field B0, they are oriented with or against this applied field.
• The energy difference between these two states is very small (<0.1 cal).
Introduction to NMR

15-9
Nuclear Spins in BNuclear Spins in B00
For 1H and 13C, only two orientations are allowed.
En
erg
y
spin -1/2 (aligned against the applied field
spin +1/2 (aligned with the applied field
higher energy state
lower energy state

15-10
Nuclear Spins in BNuclear Spins in B00
In an applied field strength of 7.05T, which is readily available with present-day superconducting electromagnets, the difference in energy between nuclear spin states for • 1H is approximately 0.0286 cal/mol, which
corresponds to electromagnetic radiation of 300 MHz (300,000,000 Hz)(300MHz)
• 13C is approximately 0.00715 cal/mol, which corresponds to electromagnetic radiation of 75MHz (75,000,000 Hz)(75 MHz)

15-11
Population in high vs lowPopulation in high vs low E= 0.0286 cal/mol RT=582cal/mol If pop in high E state is 1,000,000 then pop in
low energy state is 1,000,049
RTEestateElowinnuclei
stateEhighinnuclei /

15-12
NMR SpectroscopyNMR Spectroscopy NMR uses radiowaves, measured in MHz The energy transitions depend on the
strength of the magnetic field which is different from machine to machine
We define the machine independent ppm as
610
frequencyOscillator
15-13
Nuclear Magnetic ResonanceNuclear Magnetic Resonance
If we were dealing with 1H nuclei isolated from all other atoms and electrons, any combination of applied field and radiation that produces a signal for one 1H would produce a signal for all 1H. The same is true of 13C nuclei
But hydrogens in organic molecules are not isolated from all other atoms; they are surrounded by electrons, which are caused to circulate by the presence of the applied field

15-14
Electrons ShieldElectrons ShieldWhat causes differences?
Electrons shield. Remove electrons they de-shield.
15-15
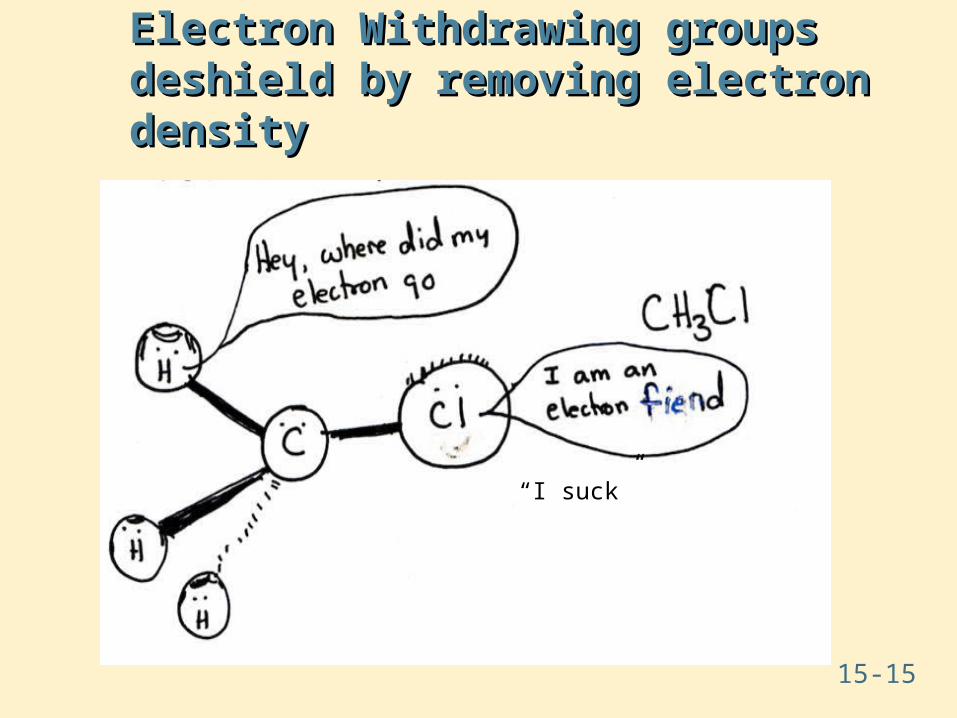
Electron Withdrawing groups deshield Electron Withdrawing groups deshield by removing electron densityby removing electron density
“I suck”

15-16
Electron density can be added or Electron density can be added or removed through the removed through the or or systems systems
15-17
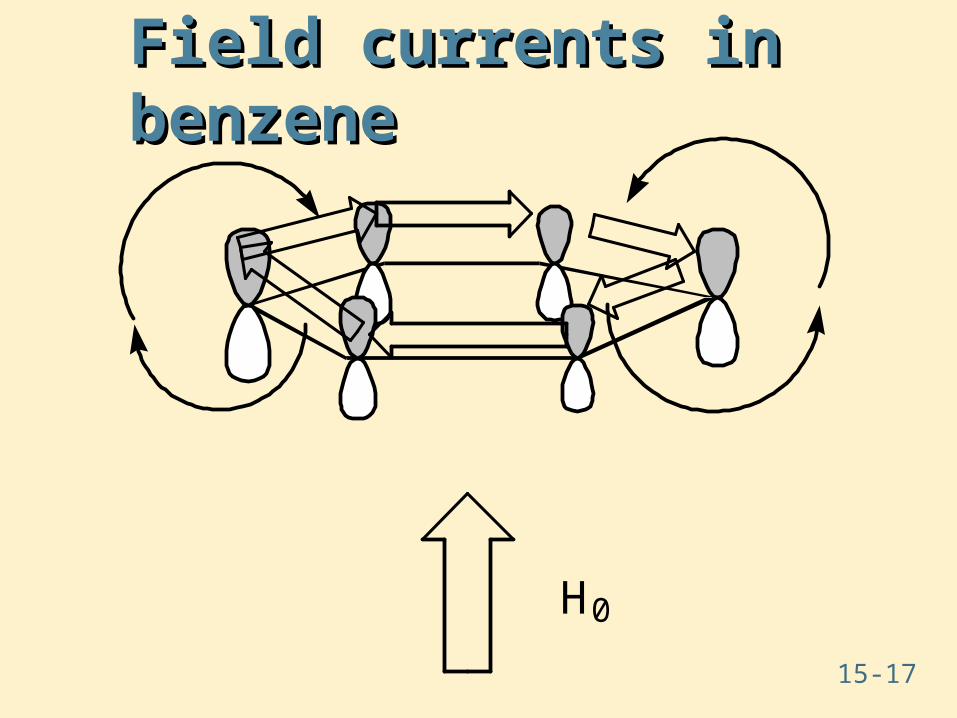
Field currents in benzeneField currents in benzene
H0

15-18
Ring currents usually deshieldRing currents usually deshield

15-19
AlkenesAlkenes

15-20
Nuclear Magnetic ResonanceNuclear Magnetic Resonance
It is customary to measure the resonance frequency (signal) of individual nuclei relative to the resonance frequency (signal) of a reference compound
The reference compound now universally accepted is tetramethylsilane (TMS)
Tetramethylsilane (TMS)
CH3
Si CH3
CH3
H3C

15-21
Nuclear Magnetic Resonance Spectroscopy
• An NMR spectrum is a plot of the intensity of a peak against its chemical shift, measured in parts per million (ppm).
1H NMR—The Spectrum

15-22
Nuclear Magnetic ResonanceNuclear Magnetic Resonance For a 1H-NMR spectrum, signals are reported
by their shift from the 12 H signal in TMS For a 13C-NMR spectrum, signals are
reported by their shift from the 4 C signal in TMS
Chemical shift (): the shift in ppm of an NMR signal from the signal of TMS
=Shift in frequency from TMS (Hz)Frequency of spectrometer (Hz)
15-23
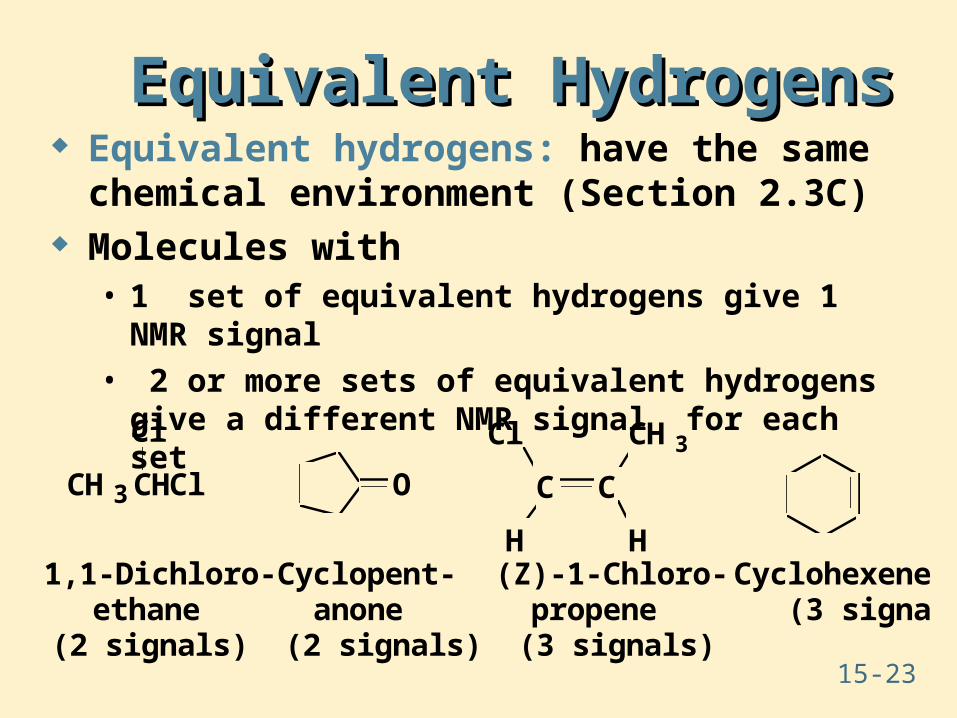
Equivalent HydrogensEquivalent Hydrogens Equivalent hydrogens: have the same
chemical environment (Section 2.3C) Molecules with
• 1 set of equivalent hydrogens give 1 NMR signal• 2 or more sets of equivalent hydrogens give a
different NMR signal for each set
1,1-Dichloro- ethane
(2 signals)
(Z)-1-Chloro- propene
(3 signals)
Cl
C
H
C
H
CH3Cl
CH3CHCl O
Cyclopent- anone
(2 signals)
Cyclohexene (3 signals)

15-24
Nuclear Magnetic Resonance Spectroscopy
1H NMR—Chemical Shift Values

15-25

15-26
Chemical ShiftChemical Shift Depends on (1) electronegativity of nearby atoms,
(2) the hybridization of adjacent atoms, and (3) magnetic induction within an adjacent pi bond
Electronegativity
Electroneg- ativity of X of H
4.03.53.1
2.82.52.1
1.8
4.263.473.05
2.682.160.86
0.00 (by definition
CH3OHCH3F
CH3Cl
CH3BrCH3I
(CH3)4C
(CH3)4Si
CH3-X

15-27
Methyl AcetateMethyl Acetate

15-28
Signal Splitting (n + 1)Signal Splitting (n + 1) Peak: the units into which an NMR signal is
split; doublet, triplet, quartet, etc.
Signal splitting: splitting of an NMR signal into a set of peaks by the influence of neighboring nonequivalent hydrogens
(n + 1) rule: the 1H-NMR signal of a hydrogen or set of equivalent hydrogens is split into (n + 1) peaks by a nonequivalent set of n equivalent neighboring hydrogens

15-29
Signal Splitting (n + 1)Signal Splitting (n + 1)
Problem: predict the number of 1H-NMR signals and the splitting pattern of eachO O
O
(a) CH3CCH2CH3 (b) CH3CH2CCH2CH3
(c) CH3CCH(CH3)2
n = 3. Its signal is split into (3 + 1) or 4 peaks; a quartet
n = 1. Their signal is split into (1 + 1) or 2 peaks ; a doublet
CH3-CH-Cl
Cl

15-30
Origins of Signal SplittingOrigins of Signal Splitting When the chemical shift of one nucleus is
influenced by the spin of another, the two are said to be coupled
Consider nonequivalent hydrogens Ha and Hb on adjacent carbons
• the chemical shift of Ha is influenced by whether the spin of Hb is aligned with or against the applied field
C C
Ha Hb

15-31
Origins of Signal SplittingOrigins of Signal Splitting
Magnetic field of H b adds to the applied field; Ha signal appears at a lower applied field
Magnetic field of H b subtracts from the applied field; Hb signal appears at a higher applied field
Hb
Hb
Ha
B0

15-32
Origins of Signal SplittingOrigins of Signal Splitting Table 13.8 Observed signal splitting
patterns for an H with 0, 1, 2, and 3 equivalent neighboring hydrogens
Structure
1 1
Spin States of Hb Signal of Ha
C C
HbHa
C C
Ha

15-33
Origins of Signal SplittingOrigins of Signal Splitting Table 13.8 (contd.)
1 3 3 1
1 2 1C C Hb
HbHa
C C
Ha Hb
Hb
Hb

15-34
Coupling ConstantsCoupling Constants Coupling constant (J): the distance between peaks
in an NMR multiplet, expressed in hertz• J is a quantitative measure of the magnetic
interaction of nuclei whose spins are coupled
8-14 Hz 0-5 Hz6-8 Hz
11-18 Hz 5-10 Hz 0-5 Hz
HaHb
CC
HaC C
HbHaC
Hb
C
Ha
Hb
Ha
Hb
Ha
Hb-C-C-
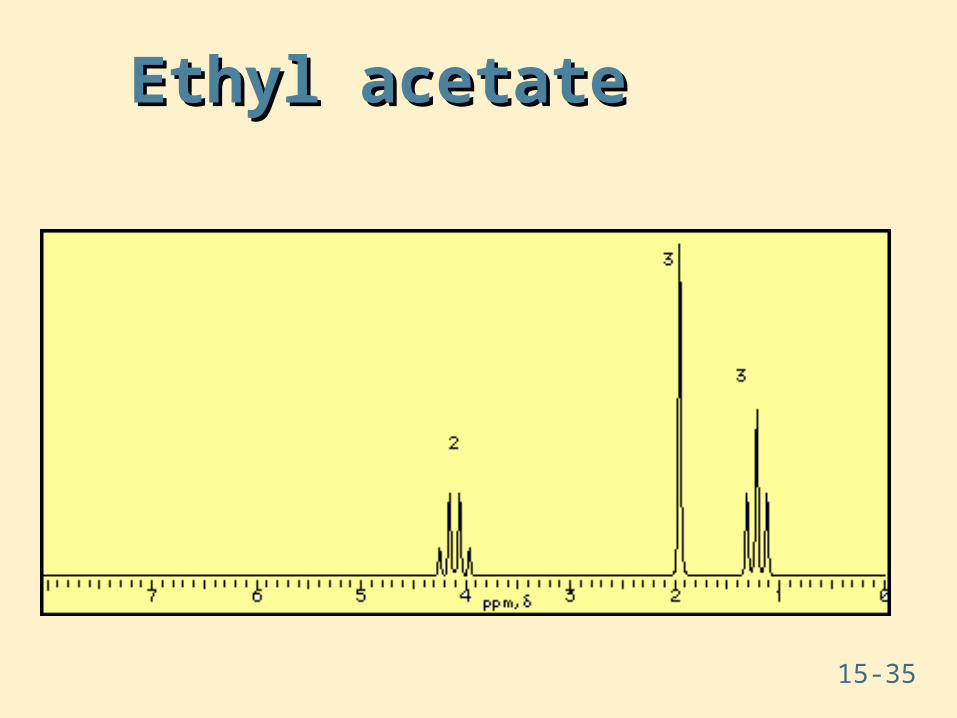
15-35
Ethyl acetateEthyl acetate

15-36
Isopropyl alcoholIsopropyl alcohol

15-37
1313C-NMR SpectroscopyC-NMR Spectroscopy Each nonequivalent 13C gives a different
signal A 13C is split by the 1H bonded to it
according to the (n + 1) rule Coupling constants of 100-250 Hz are
common, which means that there is often significant overlap between signals, and splitting patterns can be very difficult to determine
The most common mode of operation of a 13C-NMR spectrometer is a hydrogen-decoupled mode

15-38
1313C-NMR SpectroscopyC-NMR Spectroscopy In a hydrogen-decoupled mode, a sample is
irradiated with two different radio frequencies• one to excite all 13C nuclei• a second is a broad spectrum of frequencies that
causes all hydrogens in the molecule to undergo rapid transitions between their nuclear spin states
On the time scale of a 13C-NMR spectrum, each hydrogen is in an average or effectively constant nuclear spin state, with the result that 1H-13C spin-spin interactions are not observed; they are decoupled

15-39
Carbon – 13 shiftsCarbon – 13 shifts

15-40

15-41
C8H10C8H10

15-42
C7H12O4C7H12O4

15-43
C7H14OC7H14O


