
1
TEACHER PERCEPTIONS OF A
TECHNOLOGY-BASED GOOGLE CLASSROOM
A Dissertation
Presented to
The Faculty of the Education Department
Carson-Newman University
In Partial Fulfillment
Of the
Requirements for the Degree
Doctor of Education
By
Tracy D. Ballew
March 2017

2

3
Copyright © 2017 Tracy Diane Ballew
All Right Reserved.

4
Abstract
As technology becomes more pervasive in society, it is also more frequently integrated into
schools across the globe. Many schools are moving toward a one-to-one computer to student
ratio. These integrations have been studied for more than two decades; however, both qualitative
and quantitative studies have reported mixed effects of the use of technology in the classroom.
As schools endeavor to prepare students for life after graduation and as a means to stay abreast
with current trends, student computer usage is at an all-time high. However, the role of facilitator
and keeper of classroom technology still lies in the hands of the teacher. As teachers attempt to
integrate technology and its uses in their classrooms, they also carry with them their
preconceived notions and prior experiences with technology. Therefore, the teachers’ perceptions
can possibly affect the efficacy of the implementation. This study analyzed a school district’s
Google Classroom integration which included three different grade levels across the district.
Teacher perceptions regarding the Google Classroom and its effects on the classroom were
measured via a voluntary Likert scale survey. The study aimed to determine whether teachers’
years of experience, grade level assignment, and subject matter influenced their perceptions of
the technology-based Google Classroom. The chi-square test of independence was utilized to
determine if a relationship was found between teachers’ perceptions and the three variables. In
fact, all three variables were found to have a relationship with teacher perceptions, thereby
causing the null hypotheses to be rejected. The teacher participants’ responses regarding Google
Classroom were found to be dependent upon their years of experience, grade level assignment,
and subject matter.

5
Acknowledgments and Dedication
I am truly blessed to have been surrounded by such wonderful people. In His infinite
wisdom, the Lord knew exactly what I needed and when, and I am grateful for His ever-guiding
and protecting hand. My husband Hans has championed this cause, even during the
overwhelming times of career advancements and family life. Hans, you were my catalyst, and I
will always consider you my beloved. As we journeyed this road together, we have proven even
more our eternal bond for which I am so grateful. There is no place in the world I would rather
be than with you. My two children, Elijah and Maddy, my great blessings, you have watched us
as we completed our various graduate degrees, culminating here. I am hopeful that our quest for
learning is something now intrinsic in you, as well as appreciative of the sacrifices you have
made in order for this to be fulfilled. I love you all.
I would also like to thank my committee, Drs. Murphree, Shon, and Jackson for their
guidance and encouragement. I appreciate your insight and feedback, as I asked my numerous
questions. You helped straighten the way for my study, as I knew only what I wanted to research
at the outset and not necessarily how to get there. On an informal level and beyond the
committee, I appreciate you, Andy (Dr. Jackson) for tolerating my walking into your classroom
with many questions and sending you various pieces of the puzzle for your perusal and input.
You were a calming and supportive friend and colleague.
Finally, I would like to dedicate this to my late mother, Martha Harman, who was the
epitome of a Christian wife, mother, and woman. May I continue to grow in His grace, as you
exemplified.

6
Table of Contents
Abstract ........................................................................................................................................... 4
Acknowledgments and Dedication ................................................................................................. 5
Chapter 1: Introduction ................................................................................................................... 8
Statement of the Problem ............................................................................................................ 9
Significance of the Study .......................................................................................................... 11
Theoretical Framework ............................................................................................................. 11
Research Question ..................................................................................................................... 13
Limitations and Delimitations ................................................................................................... 13
Null Hypotheses ........................................................................................................................ 14
Definition of Terms ................................................................................................................... 14
Assumptions .............................................................................................................................. 15
Organization of the Document .................................................................................................. 15
Chapter 2: Literature Review ........................................................................................................ 16
History of One-to-one ............................................................................................................... 16
21st Century Skills ..................................................................................................................... 17
Students Today .......................................................................................................................... 18
Web and Cloud-Based Learning Applications .......................................................................... 20
Measured Achievement Effects of Integrations ........................................................................ 24
Perceived Outcomes of Integrations ......................................................................................... 25
Role of Teachers........................................................................................................................ 28
Conclusion ................................................................................................................................. 34
Chapter 3: Methodology ............................................................................................................... 36

7
Introduction ............................................................................................................................... 36
Population and Sample .............................................................................................................. 37
Description of Instruments ........................................................................................................ 38
Research Procedures and Time Period of the Study ................................................................. 38
Data Analysis ............................................................................................................................ 39
Chapter 4: Findings ....................................................................................................................... 42
Selection of Participants ............................................................................................................ 43
Brief Summary of Survey Prompts and Responses .................................................................. 43
Variable One: Teachers’ Years of Experience .......................................................................... 47
Years of Experience Chi-square Tests ...................................................................................... 51
Variable Two: Teacher’s Grade Level Assignment .................................................................. 55
Grade Level Assignment Chi-square Results............................................................................ 59
Variable Three: Teachers’ Subject Matter ................................................................................ 64
Teachers’ Subject Matter Chi-square Results ........................................................................... 69
Summary of Findings ................................................................................................................ 76
Chapter 5: Conclusion .................................................................................................................. 78
Summary of Findings ................................................................................................................ 79
Discussion and Implications...................................................................................................... 80
Conclusions ............................................................................................................................... 83
Recommendations for Further Research ................................................................................... 84
References ..................................................................................................................................... 85

8
Chapter 1: Introduction
The integration of technology is not a necessarily new trend in the field of education. For
decades, schools around the world have attempted to implement technology plans which aim to
supply more frequent use of technology to their students. The assumption is that technology can
not only improve day-to-day classroom instruction but also that its interactive nature and
necessity for life after school have lasting effects on the students (Iftakhar, 2016; Keppler,
Weiler, & Maas, 2014). Implementation strategies, as well as technological advances, are as
varied as they are vast (Penuel, 2006). Many schools began with simple computer labs stationed
within the school building for periodic use scheduled by the teachers (Bebell & Kay, 2010; Sell,
Cornelius-White, Chang, McLean, & Roworth, 2012). Then, as the personal computing trend
continued to grow and as an effort to stay abreast of the 21st century skills, schools began
purchasing even more computers and other technologies with the goal of a much more pervasive
student usage (Bebell & Kay, 2010; Bebell & O'Dwyer, 2010; Keppler et al., 2014).
As the depth and breadth of the capabilities of technology continue to grow each year,
most K-12 schools are attempting more and more to include technological resources as much as
possible. Common in educational settings today are desktop computer labs, wireless internet, and
even laptop computers for student use (Sell et al., 2012). With many culminating assessments
and college and career readiness tools available only online, educators understand the importance
of preparing students for a society rich in technology usage (Keppler et al., 2014). To this end,
many schools across the globe have undertaken a particularly pervasive and practical
technological integration: one-to-one laptop computers for their students as a means to improve
and enhance their learning (Weston & Bain, 2010).

9
However, implementation of such large-scale programs differs greatly among schools, as
do the intended results (Penuel, 2006; Weston & Bain, 2010). These larger implementations
created issues to be discussed such as necessary prior training for teachers, best implementation
and support strategies, and technology’s overall effectiveness in the classroom (Spires, Oliver, &
Corn, 2012; Wright & Wislon, 2011). Although district personnel and funding options typically
define the timing and quantity of such programs, the disconnect remains between purchasing the
tools and implementing the tools (Anthony, 2012; Bebell & O'Dwyer, 2010). In fact, teachers
remain in the classroom with student users and represent the facilitators of such implementations
(Ertmer, 2005; Gorder, 2008; Shin, Han, & Kim, 2014). To this end, many researchers declare
professional development for teachers paramount to successful integration of classroom
technology (Bebell & O'Dwyer, 2010; Owen, Farsaii, Knezek, & Christensen, 2006; Spire et al.,
2012). Furthermore, with teachers as the primary implementers of new computer-based
classrooms, both the technological savviness of the teacher and his/her views toward a
technology-centered classroom must be examined (Anthony, 2012; Ertmer, 2005; Gorder, 2008;
Ismail, 2015; Kayalar, 2016).
Statement of the Problem
Schools across the nation have spent billions in purchasing and implementing technology
as a means to improve student learning and student technology skills (Bebell & Kay, 2010; Sell
et al., 2012). In addition to the claims that computers can increase achievement for students in
school, some researchers proposed that utilizing technology in K-12 classrooms better prepares
students for a technology-rich society after their secondary education (Ismail, 2015; Kayalar,
2016; Keppler et al., 2014). However, even after hundreds of studies aimed at validating these
claims, the time, money, and effort spent in piloting new technological roll-outs has yet to

10
produce conclusive results that name specific technological integrations as the catalyst for
improved achievement and utilization (Penuel, 2006; Weston & Bain, 2010). Results of
effectiveness vary as widely as do implementation procedures. Clearly, successful integration of
computers in the classroom requires more than simply purchasing the technology (Anthony,
2012; Bebell & O'Dwyer, 2010).
One apparent factor remains constant: the most pivotal role in teaching students to use
technology to enhance their learning still lies predominantly with the classroom teacher (Cox,
2013; Ertmer, 2005; Kayalar, 2016; Osler, Hollowell, & Nichols, 2012). Moreover, despite
professional developments created to alleviate some of the angst among teachers who find
themselves as the sole facilitator of a technology-based classroom, many teachers amid a one-to-
one technology program still report pressures and barriers to successful integration (Anthony,
2012; Gulek & Demirtas, 2005; MacKinnon, 2002; Wright & Wislon, 2011). To many teachers,
technology use is a part of everyday life, but to others, it still remains a learning-process wherein
they learn with the students they teach. In addition to various teaching styles and personalities,
teacher perceptions of technology stand to have a large effect on their ability to integrate well the
computers and technologies that have been entrusted them. Because classroom teachers are still
the chief originator for the students’ use of computer-based learning and because prior
experiences and interactions of the teacher shape their views of these technologies, perceptions
may distort or enhance the implementation process, thereby possibly skewing any quantitative
effect data designed to prove the program’s efficacy (Ertmer, 2005; Ismail, 2015; Kayalar, 2016;
Gorder, 2008).

11
Significance of the Study
The purpose of this study was to assess teacher perceptions regarding implementing a
technology-based course in the classroom via Google Classroom and Google Chromebooks.
Several researchers held that technology integration in the classroom can not only familiarize
students with the utilization of technology that will be necessary after schooling but that it can
also improve student engagement within lessons (Bakia, Means, Gallagher, Chen, & Jones,
2009; Sauers & McLeod, 2012; Storz & Hoffman, 2013). Many researchers argued that
increasing student engagement can be seen as a precursor to increasing performance (Bebell &
Kay, 2010; Owen et al., 2006). This study aimed to quantify teachers’ perceived effects of an
ongoing pilot program reaching grade levels 4, 7, and 10 and spanning various subjects to
determine if any correlations exist between their perceptions and the independent variables, years
of experience, school assignment, and subject matter.
The results of this study added to the existing body of research regarding technology
implementation in the classroom which is relatively new and underdeveloped (Penuel, 2006; Sell
et al., 2012). Furthermore, this study attempted to establish certain demographic identifiers
which may pre-dispose teachers to either a positive or negative perception of the integration of
technology. Such identification enhanced the current research regarding the use of technology in
education by affording a view of what possible barriers should be mitigated prior to introducing
an integration program.
Theoretical Framework
This study utilized a theoretical framework based largely on social constructivism which
attributes much of human beings’ learning to their surroundings and experiences. John Dewey,
as well as Lev Vygotsky assumed that humans’ learning is inseparable from their experience

12
(Liu & Chen, 2010). With this in mind, technology integration and the very hands-on nature of it
rest primarily on the constructivists’ theory in its original form (Schcolnik, Kol, & Abarbanel,
2006). In other words, as students engage in the technology-centered classroom, they learn from
the interactivity and experiences therein. Students learn more, constructivists hold, when they are
able to construct the information for themselves, rather than hearing and repeating it.
Knowledge, therefore, is not transferred to them via a professor or teacher, but rather through an
experiential involvement in the acquisition of knowledge (Lin & Jou, 2013). Various forms of
this theory have been utilized in education, with the focus of the classroom morphing from
teacher-centered to student-centered learning (Ouyang & Stanley, 2014).
Technology-based classrooms and their integration serve the parameters of
constructivism well in more ways than simply the hands-on, student-centered approach. In fact,
the teachers and/or facilitators of said technology also engage in constructivism as they pull on
prior knowledge and experience (Liu & Chen, 2010). Due to the constructivist belief that prior
interactions shape future learning, the very facilitators of technology integration, teachers, also
bring a myriad of experiential lessons to the computer-based classroom atmosphere (Schcolnik et
al., 2006). Furthermore, due to drawing understanding and conclusions based upon prior
environments and interactions, teachers may, even inadvertently, apply prior experiences and
attitudes toward a particular subject (e.g., technology) to the present setting. These beliefs and
attitudes held by the teacher then form a viewpoint which decides how the teacher feels,
implements, and utilizes certain in-class methods. In short, an understanding of constructivism
and how humans create meaning from prior experiences, in turn, shapes the way teachers
perceive and implement new tools such as technology in their classrooms (Lin & Jou, 2013;
Ouyang & Stanley, 2014).

13
Research Question
The research question that framed this study:
Do teachers’ years of experience, grade level assignment, and subject matter influence
teacher perceptions of a technology-based Google Classroom?
Limitations and Delimitations
There were several factors that limited this study. Due to the nature of Likert scales, the
possibility of the error of generosity and the error of severity were both possible limitations (Ary,
Jacobs, Sorenson, & Walker, 2013). In other words, raters may have rated overly positively or
negatively. Furthermore, the schools in the pilot program were new to the technology-based
classroom initiative; therefore, answers may have reflected the bias of inexperience. The study
was limited to using Google Chromebooks as the technology about which the teachers were
surveyed. The study was limited to technology in the classroom because the Chromebooks were
not allowed to go home, preventing an exploration of a true one-to-one initiative. Finally, not all
sample participants completed the survey, as the survey was not mandatory.
This study delimited the participants to only those teachers instructing grades fourth,
seventh, and tenth, as those grades were selected specifically for the pilot roll-out by the school
district for the year the study was conducted. Also, the timing and data of the study was
delimited to one survey given in the middle of the year. It is possible that perceptions could have
changed from the beginning of the year and could have also changed by the end of the year. The
study was delimited to one school district for convenience sampling, but the same study could
yield different results in another school district.

14
Null Hypotheses
Specific hypotheses for this study included:
H01. Teachers’ years of experience does not have a statistically significant relationship to teacher
perceptions of a technology-based Google Classroom.
H02. Teachers’ school assignment does not have a statistically significant relationship to teacher
perceptions of a technology-based Google Classroom.
H03. Teachers’ subject matter does not have a statistically significant relationship to teacher
perceptions of a technology-based Google Classroom.
Definition of Terms
Google Chromebook. A laptop computer which relies on internet access, allowing users
to save and run cloud-based applications (Google.com, 2016)
Laptop computer. A small, portable computer with all components in one device which
performs normal computing tasks (Merriam-Webster.com, 2015)
One-to-one (1:1) laptop initiative. A program which provides laptops or other small
computing devices to students for use both in and out of school (Bebell & Kay, 2010)
Perceptions. Views, feelings, awareness, and/or observations noticed by the participants
regarding the study’s context (Merriam-Webster.com, 2015)
Pilot program. Initial, experimental implementation of a new device as a means of testing
suitability or efficacy (Bakia et al., 2009)
Technology Integration. The intentional use of various types of technology in a setting
such as schools and classrooms (Bakia et al., 2009)

15
Assumptions
It was assumed that all teachers surveyed had been using the Google Chromebooks in
their technology-based classroom at the time of the survey. Likewise, the responses were
assumed to accurately reflect the perceptions of the teachers at that moment in the initiative.
Teacher demographics were also assumed as accurate since the information was provided by the
individual teachers. Lastly, it was assumed that the teachers were utilizing the technology in the
manner reflected by the survey prompts. For instance, if the prompt questioned whether
technology had an effect on assessment scores, it was assumed that the teacher used the
technology for assessment.
Organization of the Document
Chapter 1 introduces technological integration in an educational setting. The researcher
then states the problem and gives the significance for the study. The researcher discusses the
theoretical framework for the study and supplies the research questions, hypotheses, definition of
terms, limitations and delimitations, and assumptions of the study. Chapter 2 is a review of
literature exploring the use of technology in schools. The researcher also discusses literature
related to years of experience, school assignment, and subject matter in the review of literature.
Chapter 3 explains the methodology of the study. The chapter details the data collection
procedures, data analysis, population and sampling, and how the study was conducted. Chapter 4
discusses the specific findings of the study. Chapter 5 specifies the conclusions of the study, the
value of the findings, the generalizability of the research, and the recommendations for further
research.

16
Chapter 2: Literature Review
Everyday use of technology in education was once a novel idea, available only to an elite
few. However, in the past few decades and with the introduction of laptop computers, this has
changed drastically. In fact, in many schools across the globe, students utilize laptop computers
or hand held tablets daily as a part of the class curriculum, and many of these computing devices
go home with the students at the end of the school day (Bebell & Kay, 2010). Since the nineties,
school districts have spent billions of dollars attempting to keep up with the personal computing
craze and the belief that engaging students in the use of technology in the classroom promotes
learning and preparedness for life in the 21st century (Bebell & Kay, 2010; Sell, Cornelius-
White, Chang, McLean, & Roworth, 2012). In some programs, various corporations and even the
federal government have supplied the funds or the tools for the sole purpose of integrating
personal computing in the classroom (Gulek & Demirtas, 2005; Penuel, 2006). Although
technology-based classroom initiatives are prevalent, the research behind them remains mixed in
its description of the best way to integrate personal laptops or tablets into the classroom and the
definitive effects on student learning (Bebell & Kay, 2010; Goodwin, 2011).
History of One-to-one
One of the first districts to introduce a one-to-one initiative, Beaufort County in South
Carolina began with a pilot program by supplying sixth graders with laptops in 1994 and then
widened their initiative to all middle school grades by 2000 (Gulek & Demirtas, 2005). Similar
programs were implemented in 1996 in New York and California. In 2000, Maine began one of
the largest student laptop pilot programs which then spread to include 36,000 laptops across the
state for middle school students and teachers (Gulek & Demirtas, 2005). School leaders in
Virginia and Texas then quickly followed the trend by providing laptops for all secondary

17
students (Penuel, 2006). Microsoft also partnered with the laptop initiative by supplying student
laptops for 52 schools across the country in 1996 and then widening that scope to 800 schools by
the year 2000 (Gulek & Demirtas, 2005). Bebell and Kay (2010) of Boston College reported that
by the 2003-2004 school years, approximately 4% of the nation’s schools had implemented a
one-to-one laptop initiative. They estimated that this percentage grew to almost a quarter of the
schools in the country by 2006 (Bebell & Kay, 2010). As part of the 2002 No Child Left Behind
Act (NCLB), the federal government also began a student technology initiative in schools,
allotting 3.4 billion dollars to the project’s implementation in “high-need” schools (Bakia,
Means, Gallagher, Chen, & Jones, 2009, p. vii). The number of laptop initiatives across the
country still continues to rise, and with that, the ratio of students to laptops comes ever closer to
one-to-one (Bebell & Kay, 2010).
21st Century Skills
Technology’s influence and impact has continually expanded in the last three decades,
especially prominent in business and communication. As technology and its influence grow, so
do the voices calling for the same influx in the field of education. Business owners, government
officials, and educational leaders all appear to agree that students must learn to use modern
technology, including computers, in order to best prepare themselves for life after graduation. As
a means to be considered global participants and/or competitors, researchers argued that students
must utilize the very tools which connect nations (Keppler, Weiler, & Maas, 2014). To this end,
schools have responded with integrations focused on answering business owners’ assertion that
workers who possess 21st Century skills can effectively utilize technology to research, learn, and
connect globally (Ismail, 2015).

18
Likewise, Fethi Kayalar (2016) suggested that parents, teachers, and students demand
technological integration into schools so that students may be equipped to do the following:
Prepare themselves for their future careers, keep pace with the other students who have
technology in their schools, have the chance to interact with their classmates, access to
up-to-date information, become more active and engaged in the course, and utilize
multiple types of resources online. (p. 18)
He asserted that education must now place more importance on students’ personalized learning,
rather than on teaching and that students can and should benefit from an education combined
with modern technology (Kayalar, 2016). Similarly, Keppler et al. (2014) expanded upon this
same view of the necessity of technology in schools by stating that even the, “students desire a
technology-rich learning environment, [one] which provides them opportunities to explore, learn,
and take responsibility for their progress” (p. 279). Shampa Iftakhar (2016) summed his research
sentiments succinctly: “Teaching in the 21st century does mean teaching 21st generation. It
means helping and monitoring the students to learn and implement 21st century skill[s]” (p. 17).
Students Today
Amid the growing trend of computers in the classroom, various justifications for their use
have been made, some of which include increasing students’ technological proficiency,
improving academic performance, focusing on student-centered activities, allowing for use in
and outside of the classroom, promoting collaborative learning, and preparing students for life
after their K-12 education (Sell, Cornelius-White, Chang, McLean, & Roworth, 2012). However,
few researchers cite an even more obvious matter as the very reason why students should learn
via technology.

19
Today’s students, often called digital natives or the Net Generation, grow up with
technology. Most of them have never known life without the Internet. They have spent
their entire lives using computers, cell phones, and other digital media and have
integrated technology into almost everything they do. It is obvious that technology is an
integral part of their lives. To engage them in learning, there has been increased emphasis
on the integration of technology into K–12 classrooms. (An & Reigeluth, 2011, p. 54)
Similarly, Hariadi, Dewiyani, and Sudarmaningtyas (2016) concur that students in school
today, students considered part of Generation Z, have quite a different perspective on technology
than those of previous generations mostly due to the pervasive nature of it. They claimed current
students should be educated differently than their priors based upon their cultural knowledge of
technology. They outlined certain characteristics of Generation Z students and what they are
already capable of doing:
(1) Comfortable and very dependent on technology, it [sic] is because Generation Z grew
surrounded by technology, (2) multitasking with a variety of online products and
sophisticated technology equipments, and appreciate simplicity and the interactive
design, (3) have a higher social responsibility with the amount of information that can be
accessed online, (4) always connect, communicate through social networks, cross country
and culture that indirectly affect their thought and decision-making process. (Hariadi et
al., 2016, p. 60)
The researchers continued by calling for a less conventional view of schooling and a more
integrative “learning process” which no longer relies solely on “faculty-centered learning”,
calling it inappropriate and outdated (Hariadi et al., 2016, p. 60). They suggested an entirely new
model for education, one which builds upon what students of today already know and do.

20
Web and Cloud-Based Learning Applications
The rise in distance learning at the university level during the past decade has prompted
technology companies to incorporate and even create new ways for teachers and students to
communicate regarding education online (Lin & Jou, 2013). From this rise sprang many new
programs and web-based tools which aim to diminish the separation of distance learning and
make the online experience more integrative. Applications and programs designed to facilitate
connectivity and communication are considered Web 2.0 applications (Lin & Jou, 2013). Of
these, universities and online public schools have utilized SkyDrive, Evernote, Dropbox,
Blackboard, and Google Apps (Lin & Jou, 2013). The newest of these, according to Lin and Jou,
must be user-firendly and support a learning environment through connectivity and participation.
As distance or online students log in to the class from their homes and complete interactive
assignments, research, and discussions via a web-based application, the programs allow more
freedom in their learning process and are considered examples of student-centered learning
(Knowlton, 2000). In other words, the teacher or professor may assign tasks and texts, but the
responsibility to retain and apply the knowledge found in the texts lies with the student. The
student then submits coursework via the online portal for teacher assessment (Knowlton, 2000).
Cloud-based learning portals offer an even more interactive approach because they allow
for multiple participants and collaboration across the Internet. Cloud-based programs do not
require storage on a student’s hard-drive (Shinsky & Stevens, 2011; Vickers, Field, &
Melakoski, 2015). The sole purpose of cloud-based programs is that the information is stored and
shared via the Internet and not reliant on one single technological machine (Vickers et al., 2015).
Many students who now attend online classes come to the new online portals with previous
knowledge of cloud-based apps due to cell phone usage. Sharing via a cloud-based app allows

21
mulitple participants to work on a live document rather than having to save it and send it
(Hariadi et al., 2016; Vickers et al., 2015). Participants can edit, revise, add, and delete portions.
This particularly novel notion lends itself well to the roles of teaching and learning whereas
professors and teachers may supply immediate feedback for the students regarding their work, as
well as suggest certain revisions and/or further research (Vickers et al., 2015).
Google, a front-runner in the field of technology, has created and honed a series of cloud-
based applications designed specifically for teachers and students (Hariadi et al., 2016; Shinsky
& Stevens, 2011). According to Shinsky and Stevens (2011), Google has created a complete
suite of applications that not only align but enhance teaching and learning in the 21st century,
based solely on Web 2.0 abilities:
Google Apps for Education is a suite of cloud-based applications that Google provides
free to educational institutions. Unlike traditional computer programs which must be
installed on the user's computer, cloud-based applications are available to users from any
Internet-connected computer using a browser. Because the software and data exist on the
web, cloud-based programs can run seamlessly from a wide variety of computers and
mobile devices.
The Google Apps for Education cloud-based suite includes e-mail, a calendar, website
creation software, and a set of office applications for word processing, spreadsheets,
drawings, slideshows, and surveys. The online workspace also can function as a file
locker, where a variety of documents can be uploaded for storage and sharing. Since
these applications and the associated work files reside in the cloud, we had access to our
work from any Internet-connected computer, providing maximum flexibility to our team.
Also, several of the tools include real-time collaboration capabilities, with integrated chat

22
and the ability for multiple team members to work on a product simultaneously. This
appealed to us as busy professionals. (Shinsky & Stevens, 2011, p. 205)
Moreover, Shinsky and Stevens (2011) held that due to the progressive nature of online learning,
faculty and school personnel are in a distinct position to impact the learning of students by
utilizing such interactive tools.
Responses to such innovations in both technology and the classroom have been reported
as not only positive but timely. One particular study at a Taiwanese university interviewed both
students and teachers to determine their views regarding web and cloud-based implementations
in the classroom (Lin & Jou, 2013). The study concluded that not only was the learning of the
students supported by the technological integration while in school but that it also improved
support after class via connectivity. Furthermore, the web-based support was reported to help
overcome limitations of class time interactions between teacher and student, thereby
strengthening the learning atmosphere of the course by way of online interaction (Lin & Jou,
2013).
In a similar experimental study, Suwantarathrip and Wichadee (2014) “compared writing
abilities of students who collaborated on writing assignments using Google Docs with those
working in groups in a face-to-face classroom” (p. 148). One group utilized the Google app by
collaborating outside of normal school hours as the other group used group writing time in class.
The researchers not only found positive student attitudes toward the web-based collaboration but
also found that students in the collaborative web-based group scored significantly higher on the
various writing activities than did the face-to-face group (Suwantarathip & Wichadee, 2014).
The researchers credited the format of Google Docs: “Since Google Docs is stored online,
students can work at school and at home from any computer with an Internet connection, and

23
they are more likely to revisit their work if they know someone else will be commenting on it”
(Suwantarathip & Wichadee, 2014, p. 149). The researchers concluded that the live, “real time”
collaboration gave the students confidence and support necessary for improving their writing
(Suwantarathip & Wichadee, 2014, p. 149).
Hariadi et al. (2016) furthered touted the benefits of utilizing online collaborative
applications with students by commending the Google Apps for Education. “The benefits of
GAfE include (1) stay [sic] connected wherever, uniting students and lecturers quickly without
space and time constraints, (2) ease of managing tasks, grades and courses, and (3) unlimited
learning sources, for both students and lecturers” (p. 61). From their study, they concluded that
79% of their participants considered the applications easy to use, and 82% of the lecturers
believed the applications enhanced their instruction (Hariadi et al., 2016). The researchers
recommend further incorporation of these applications into classrooms, as they may improve the
educational process and are quite suitable for this generation of students (Hariadi et al., 2016).
Google Classroom takes the web-based applications, namely the Google Apps for
Education, one step further for education by compiling them in to one virtual, interactive
platform designed for students as an online classroom. In his study, “Google Classroom: What
Works and How?”, Shampa Iftakhar (2016) stated, “Google Classroom is meant to help teachers
manage the creation and collection of student assignments in a paperless environment, basically
leveraging the framework of Google Docs, Drive and other apps. Google classroom allows
teachers to spend more time with their students and less time on the paperwork, and it is now
even better” (Iftakhar, 2016, p. 12). His research recounted experiences from classrooms of
various subjects who utilized the brand new Google Classroom in 2014. He asked various
questions of his participants, all relating to the integration of the virtual classroom. Overall, his

24
participants reported positively regarding the integration as a way to promote “blended learning”
with technology, notwithstanding a few possible integration hindrances (Iftakhar, 2016, p. 16).
Most salient in his report were the possible benefits to students and teachers of Google
Classroom. He itemized the benefits as follows:
• Google Classroom has the potential to streamline communication and workflow for
students by providing a single access point to discussion threads and assigned work.
• Google Classroom can help students to keep their files more organized because all their
work can be stored paperlessly in a single program.
• Faculty can more quickly identify which students may be struggling with their
assignments due to the tracking mechanisms associated with assigned tasks.
• Grading processes can be simplified because of the grading features associated with
student submissions. (Iftakhar, 2016, p. 16)
However, he cautioned that in order to fully observe the advantage of it, participants in a Google
Classroom should hold an optimistic view of technology’s integration into classroom instruction
(Iftakhar, 2016).
Measured Achievement Effects of Integrations
Researchers offer numerous reasons and critiques as to why one-to-one student laptop
programs studied receive varying performance results. Researchers from the Ozarks Educational
Research Initiative contended in their meta-analysis of several studies that the discrepancy in
actual quantitative output from studies may have been the studies themselves (Sell et al., 2012).
In other words, some studies used systematic approaches while others non-systematic. Also
notable, as Penuel (2006) hypothesized, not all implementations were designed and directed to
solely increase academic achievement. Similarly, as other researchers also posited, each study’s

25
population may have integrated the student laptops differently (Penuel, 2006; Sell et al., 2012;
Weston & Bain, 2010). However, studies designed to measure gains in achievement deserve
mention.
Maine’s large-scale one-to-one middle school program yielded mixed quantitative results
in all tested subjects except in the subject of writing which improved 3.44 points after five years
(Goodwin, 2011). According to Keppler, Weiler, and Maas (2014), writing scores also improved
in Littleton, Colorado. However, this one-to-one program had a specifically designed goal of
improving student writing (Keppler et al., 2014). Gulek and Demirtas (2005) found that in
Pleasantown, California achievement scores improved for laptop users in math subjects and
English language arts (ELA), as well as improved grade point averages for users, after only one
year of integration (Gulek & Demirtas, 2005). Likewise, science scores in an urban middle
school rose significantly after implementation; however, the math scores showed no change
(Dunleavy & Heinecke, 2007). Furthermore, Texas’ Technology Immersion Program reported
significant gains in middle school ELA scores but not in math (Bebell & Kay, 2010). Although
the quantitative results of one-to-one laptop programs across the country offer mixed test-based
achievement effects, other integration benefits coincided in the studies.
Perceived Outcomes of Integrations
Despite differing data regarding achievement measured through culminating tests,
researchers do find several common benefits of a one-to-one laptop implementation. For
instance, some studies of integration programs revealed that the main goal of implementation
was the use of technology itself, not as a means to produce higher achievement scores (Sauers &
McLeod, 2012). For instance, after a six-year implementation funded by the federal
government’s Enhancing Education through Technology (EETT) program, students who were

26
considered high-risk gained access to in-school technology at a rate comparable to those schools
not considered high-risk (Bakia, Means, Gallagher, Chen, & Jones, 2009). The EETT required
only that students who received computers meet literacy standards set by the state by the end of
their eighth grade year. Assessing the adequate integration of the laptop computers was left up to
the individual states, most of which required students to competently complete a technology
course via the new computers. Not all of the schools receiving funds tracked the literacy data, but
the schools which assessed the students’ technology literacy had an 88% pass rate by 2007
(Bakia et al., 2009). Similarly, Gulek and Demirtas (2005) cited the ability to use technology
with more flexibility and with deeper understanding as one of the most prominent benefits they
found for student laptop users. Due simply to immediate and everyday access, schools in a Texas
study reported student mastery of common technological tools such as word-processing, slide
presentations, Internet searches, and more (Shapley et al., 2006).
Student response. One-to-one laptops’ direct effect on student motivation served as
another common theme among researchers. For instance, Dunleavy and Heinecke (2007) posited
that laptops give immediate response to unanswered questions and, therefore, afford a deeper
learning experience. Keppler, Weiler, and Maas (2014) found similar positive effects when they
utilized student surveys in their study of the Littleton Public Schools. Student responses were
largely favorable, crediting the laptops to simplifying lessons and homework such as essays
(Keppler, Weiler, & Maas, 2014). Shapley et al. (2006) studied 44 middle schools in Texas’
technology program. Of the schools involved, 22 were control schools, and 22 were one-to-one
recipients. By way of student surveys, the researchers found that students’ interest in school and
overall satisfaction improved considerably as a result of the one-to-one implementation (Shapley
et al., 2006).

27
Storz and Hoffman (2013) interviewed students in an initial one-to-one pilot program.
Although mostly positive, some interviewed students admitted that everyday technology use in
class can become repetitive. In this same school, one student lamented the overuse of
presentation software as “boring” while another replied that she was “doing the same thing, just
[now] on computers” (Storz & Hoffman, 2013, p. 9). Furthermore, students admit to spending
time off-task with their laptops, playing games or chatting with peers; however, the observers did
not note any more off-task behavior than is typical in middle school classrooms. Nevertheless,
some students said they appreciated the ease with which they could contact the teacher with
questions, even from home. One student stated that he believed he was receiving a “better
education” (Storz & Hoffman, 2013, p. 9).
Teacher response. Bebell and Kay (2010) reported, after quantifying their survey results,
that teachers in Massachusetts’s one-to-one initiative overwhelmingly believed that the laptop
program improved classroom teaching and learning. In fact, of the respondents, 83% believed
that their students were more engaged in class and in their own learning as a result of the one-to-
one initiative. The researchers summarized their findings from teacher surveys as, “Student
engagement increased dramatically in response to the enhanced educational access and
opportunities afforded by 1:1 computing through the pilot program” (Bebell & Kay, 2010, p. 3).
In addition, 71% of teachers reported their students having improved motivation with the
implementation of laptop usage. Engagement appeared to increase even more so with typically
low achieving students. Teachers also noted a rise in students’ ability to work independently
(Bebell & Kay, 2010). In other studies, teachers touted enhanced communication with their
students via email and teacher webpages (Spires, Oliver, & Corn, 2012; Storz & Hoffman,
2013). In one mid-western school that was studied during its pilot phase, teachers reported doing

28
less lecturing and more project-based learning (Storz & Hoffman, 2013). This is concurrent with
findings of Gulek and Demirtas (2005) and Owen, Farsaii, Knezek, and Christensen (2006) who
found that teachers of one-to-one classrooms rely less on direct instruction and more on inquiry-
based assignments where the students must actively seek out information.
Some of the teachers interviewed expressed concerns about off task behavior, while
others mentioned the environment of a one-to-one classroom to be quieter and less disruptive
(Storz & Hoffman, 2013). Several teachers mentioned the ability for students to online chat with
their peers while in class. Of those, some found it a great hindrance, while others likened it to
passing notes in class (Storz & Hoffman, 2013). The researchers of the study in Irving, Texas
recounted that some teachers had a difficult time switching to a one-to-one based classroom
because of the “locus of control” being dramatically shifted from teacher to students (Owen,
Farsaii, Knezek, & Christensen, 2006, p. 15). Several studies and teachers mentioned the
necessity for preparedness (Bebell & O'Dwyer, 2010; Owen et al., 2006; Spires et al., 2012). In
other words, teachers must not only understand the content material well but also how to deliver
and assess the content via laptop use (Weston & Bain, 2010). This reflects similar sentiments
echoed by teachers desiring more training before and during the implementation process (Owen,
Farsaii, Knezek, & Christensen, 2006; Spires, Oliver, & Corn, 2012; Storz & Hoffman, 2013).
Role of Teachers
Implementing large amounts of technology into schools for student use is not a simple
task; in fact, it is one that requires much planning, funding, and supporting. However, the role of
facilitator and implementer of technology consistently falls to one position: the teacher. The
teachers in the classroom with the students play the most pivotal role in their integrated learning,
most likely due to simple proximity. In his study regarding experienced teachers integrating

29
technology into their classrooms, Jerad Cox (2013) explained the roles of both teachers and
technology.
Teachers and technology are widely considered as the two of the most impactful
educational resources in schools today. Teachers are education's biggest resource and its
biggest expense; they balance the needs of individual students and whole classrooms,
parental and administrative whims, and personal and district ideologies. Technology,
meanwhile, is at its very center an idea of change, a constantly moving matrix of
hardware, software, and human interaction, and is expanding at a rate never before seen
in education or history. The ever-changing relationship between teachers and the
technology they integrate in their classroom has become a vital function of the education
system. (p. 209)
The pivotal role of teachers and their influence on the integration of classroom computers
and technology was echoed by Bebell and Kay (2010) and Shapley et al. (2010) who found that
teachers were the sole determiner of when and how students use technology for learning
purposes. From their study of the Berkshire Wireless Learning Initiative, they concluded that it
was “impossible to overstate the power of individual teacher in the success or failure of 1:1
computing” (Bebell & Kay, 2010, p. 47). Moreover, due to teachers being tasked with lesson
planning, educational researching, teaching and applying technological skills, and allowing time
for technology’s usage in class, teachers were deemed the “gatekeepers” of their students’
introduction and usage of technology (Bebell & Kay, 2010, p. 16).
Teachers’ beliefs. Technology integration remains a complex system void of one
standardized procedural implementation. However, researchers have noted that in light of their
pivotal role in the integration, teachers’ views and perceptions regarding technology as a whole

30
have the susceptibility to influence the integration (Anthony, 2012; Cox, 2013; Tsai, 2015). In
other words, whether a teacher is adept at not only using technology but also teaching it may
influence the implementations’ success or failure (Gorder, 2008; Ismail, 2015; Kayalar, 2016).
Ester Aflalo (2014) differentiated between the commonly interchanged terms beliefs and
perceptions of teachers. He held that teachers’ beliefs toward technology are shaped by prior
perceptions of it, perceptions which are generally attributed to previous interactions (or lack of
interactions) with computers and technology. Furthermore, he insisted that knowledge of
technology, including its uses and its integrations, does not necessarily overcome the teachers’
beliefs toward it. As teachers discover the possibilities of a technology-based classroom, they
will utilize it more, and this usage influences their view of it (Aflalo, 2014). Other researchers
echoed this same connection between teachers’ attitudes and perceptions of technology
influencing their implementation of it (Shin, Han, & Kim, 2014). In fact, teachers’ knowledge of
their subject and/or of technology did not necessarily equate to successful integration. The most
prominent factor affecting integrations was found to be teachers’ beliefs and perceptions of
technology in general (Aflalo, 2014; Ertmer, 2005; Shin et al., 2014).
Years of Experience. Experience in any career affords the veteran worker with an
understanding of the tasks at hand and ability to handle various situations that arise. In education,
tenured teachers often serve as mentors to newly hired teachers, teaching them procedures and
modeling management techniques; however, novice teachers who have been in their preservice
educational courses more recently than the experienced teachers may also bring with them tips
and tools of the trade that are more representative of the current culture in which they teach. To
this end, Wright and Wilson (2011) studied teacher education programs and their instruction
regarding technology. They suggested that all preservice teacher courses now not only integrate

31
technology for the aspiring teachers but also that they supply the novices with how best to
integrate technology in their own future classrooms. Furthermore, they found that the more
access and usage preservice teachers have with technology, the more likely they are to utilize it
more often in class (Wright & Wislon, 2011).
Studies also depicted mixed results when attempting to identify which teachers were
better suited at integrating technology in the classroom. Some researchers found that experienced
teachers incorporated technology more, attributing this to their comfort level with other things
such as curriculum and procedures (Gilakjani, 2013). Other studies, however, proposed that
senior teachers, or those with the most experience, are more reticent to integrate technology
because of their lack of technological skills.
It is reasonable that a senior teacher with insufficient technology skills considers subject
content knowledge and learning effectiveness as the key factors in whether to implement
technology integration. However, poor technology management is likely to reduce the
willingness of senior teachers to implement innovative teaching technology. (Tsai, 2015,
p. 158)
Still, Tsai (2015) found this reticence to be mutable, indicating that when the tenured teachers,
although admittedly more concerned with subject matter than integration, perceived positive
outcomes from the technology-based classroom, their perceptions and willingness to adapt also
improved. Jerad Cox (2013) reported that although several studies have sought to determine a
link between “age-based generational attitudes of teachers towards technology and their
professional technology use”, the biggest factor influencing classroom technology integration is
the possibility of it to create “more problems and fewer solutions for teachers” (p. 210). He

32
furthered that this may be especially true with experienced teachers who have long-established
routines and goals (Cox, 2013).
Subject matter. In studies of one-to-one technology implementations across the nation,
school subjects and the influence of technology on the subject material has been varied.
Although the integration of technology certainly improves students’ skills and ability to utilize
technologies, the research does not clearly define which subjects are best suited for a technology-
based classroom. English language arts showed the most promise in that researchers of several
studies found that collaborative writing activities and the interconnectivity of a technology-based
classroom supplied students with support for their writing, which translated into increased
writing scores (Bebell & O'Dwyer, 2010; Suwantarathip & Wichadee, 2014). Bebell and Kay
(2010) found that “7th graders participating in the computer writing study wrote both longer and
more highly scored open response essays when using their laptops than students responding to
the same prompt using traditional paper and pencil” (p. 45). Furthermore, the school
administration of the pilot program proclaimed that students were far more willing to write and
revise “second drafts when using a computer” (Bebell & Kay, 2010, p. 30). In their study of the
Texas Technology Immersion Pilot, Shapley et al. (2006) found statistically significant gains in
the subject of science but not the other four subjects studied. Donna and Miller (2013) held that
in addition to aligning with the National Science Education Standards, integrating technology
into the science classroom can also “help support collaborative inquiry within science education
and can help model how scientists use technology” (p. 2). Also notable, Gulek and Demirtas
(2005) found positive quantitative gains in several subjects but only after the initial year of the
one-to-one pilot program:

33
The baseline data for all measures showed that there was no statistically significant
difference in English language arts, mathematics, writing, and overall grade point average
achievement between laptop and non-laptop students prior to enrollment in the program.
However, laptop students showed significantly higher achievement in nearly all measures
after one year in the program. (Gulek & Demirtas, 2005, p. 3)
Because of the mixed results of research studies, Dunleavy and Heinecke (2007) called for more
studies to be aimed at identifying which subjects lend themselves best to a technology-based
classroom. Furthermore, they contended that their “results draw attention to the need to focus on
differences of the impact of technology in different content areas. The application of technology
to different content areas may have differential effects” (Dunleavy & Heinecke, 2007, p. 18).
Grade level assignment. In the effort to incorporate computer technology into schools,
many initial pilot programs began with either middle or high school students, but now programs
span the K-12 spectrum. Bebell and Kay (2010) studied one particularly well-known pilot
program in Massachusetts aimed entirely at middle school students:
The overall aim of the pilot program was to determine the efficacy of a one-to-one laptop
initiative in transforming teaching and learning in a traditional middle school setting.
Specifically, the targeted outcomes of the BWLI included: enhancing student
achievement, improving student engagement, improving classroom management,
enhancing students’ capabilities to conduct independent research and collaborate with
their peers, as well as creating fundamental changes in teaching strategies and curriculum
delivery. (Bebell & Kay, 2010, p. 7)
From the study, the researchers found considerable gains after a year of implementation. One
researcher found that although one-to-one technology implementations are becoming prevalent

34
in elementary grades, a ratio of one-to-two computing is more than sufficient with younger
students (Larkin, 2011). Through interviews and data collection, Larkin found that students ages
11-13 worked well in pairs, while still learning the technological skills one would learn from a
one-to-one classroom. He concluded that, for this age of students, “one-to-two computing is
preferable to one-to-one computing to achieve a balance between productivity, student
engagement, social activity, and individualized learning” (Larkin, 2011, p. 101). Finally, Gorder
(2008) commented on teachers’ use of technology-based classrooms in the secondary setting:
“The only significant difference in technology integration and uses is based on grade level.
Teachers in grades 9-12 tend to integrate and use technology more than teachers in grades K-5 or
grades 6-8” (Gorder, 2008, p. 73). In all, she found that many demographic differences of
teachers have no bearing on technology’s integration, with the exception of grade levels.
“Teachers at the various grade levels differ in how technology is integrated and used in the
classroom” (Gorder, 2008, p. 74).
Conclusion
Although one-to-one initiatives are increasing in popularity and prevalence, the study of
such settings remains relatively new and unestablished. However, most researchers agreed on
this: the laptop revolution has endless possibilities for the education of students and even
communities. In fact, Owen, Farsaii, Knezek, & Christensen (2006) found in a study of Irving
Independent School District that students were enthusiastically taking their laptops home and
teaching other family members how to use them too. Bebell and O’Dwyer (2010) cautioned that
any implementation of technology must be seen as a supplement to solid, previously established
teaching practices, not a standalone fix. Furthermore, the role that teachers play in technology’s
integration cannot be understated. Many researchers contended that the very attitudes and beliefs

35
that the classroom facilitators hold have the potential to largely influence and affect the
integrations’ successes or failures (Aflalo, 2014; Cox, 2013; Gilakjani, 2013; Kayalar, 2016;
Ouyang & Stanley, 2014; Wright & Wislon, 2011). Several researchers call for deeper study into
this initiative and its effects, holding that the unprecedented nature of technology leaves
possibilities for an even greater educational reach (Penuel, 2006; Shapley et al., 2006; Weston &
Bain, 2010). Finally, as Yun An recommended, “Further studies might test the generalizability of
these results by examining K–12 teachers’ beliefs, perceptions, barriers, and support needs in the
context of creating technology-enhanced, learner-centered classrooms in different school
districts, states, or countries” (p. 61).

36
Chapter 3: Methodology
Introduction
This study was designed as correlational research to determine if teacher years of
experience, grade level assignment, and subject matter influence teacher perceptions of a
technology-based Google Classroom. The researcher utilized the chi-square test separately for
each independent variable. The chi-square test was used because “there is just one variable […]
divided into any number of categories” (Tanner, Using Statistics to Make Educational Decisions,
2012, p. 333). The chi-square test is one of the most widely used tests of significance when
dealing with nominal data (Ary D. , Jacobs, Sorenson, & Walker, 2014). Additionally, this test
can be used with samples of various sizes, including small samples (Tanner, 2012). The
independent variables in this study include teachers’ years of experience, grade level assignment,
and subject matter. Teacher perceptions represent the dependent variable.
Teacher participants reported their years of experience, counting only completed years.
School years in the district studied begin in mid-August and end in early June. School
assignments were separated into intermediate schools, K-8 schools, primary schools, middle
schools, and high schools. Intermediate schools generally host grades 3-5. K-8 schools host
kindergarten through 8th grade. Only one primary school was included because it is the only
primary school in the district that hosts 4th grade. Any school hosting 10th grade was considered a
high school, and any school hosting a 7th grade was considered a middle school, regardless of
grade level infrastructure. Subject matter was categorized as (a) English language arts, (b)
mathematics, (c) science, or (d) social studies. Likert scale survey responses gauged teacher
perceptions regarding the technology-based Google Classroom.

37
Population and Sample
Due to a district-wide pilot program in grade levels fourth, seventh, and tenth,
participants in the study included the teachers of those grade levels implementing the Google
Classroom across the district. Due to the nature of the study and the pilot program, the sample
was preselected based upon teacher assignment. The number of participants chosen to implement
the Google Classroom included 136 teachers throughout the district, comprised of only those
teachers assigned to the pilot grades at the time of the survey. Furthermore, not all participants
responded to the survey, as the survey’s completion was not mandatory. Teacher responses
represented various grade-level assignments, subject matter, and years of experience.
The population of the study represented all teachers in the pre-K through 12th grade
school system of the selected district. This population included teachers from eight K-8 schools,
four primary schools (although only one serves students in 4th grade), three intermediate schools,
four middle schools, five high schools, and other specialty schools that were not used in the
study. In total, there are 28 schools in the school district. The population for this school district is
967 teachers. The school district serves approximately 15,000 students.
The accessible population for the study was delimited to fourth, seventh, and tenth grade
teachers due to those grades being chosen as participants in the pilot program for Google
Classroom utilizing Google Chromebooks. Therefore, the researcher used nonprobability
sampling as the sampling technique. The researcher used convenience sampling as the sampling
procedure because of the limited population and sample (Tanner, Using Statistics to Make
Educational Decisions, 2012).
38
Description of Instruments
The instrument used for the correlational study was a Likert scale survey directly asking
teachers to rate how strongly they agree or disagree with the prompts (Ary D. , Jacobs, Sorenson,
& Walker, 2014). The prompts were created based upon reviewing the literature regarding
implementing technology in the classroom, similar pilot programs, and teachers’ perceptions
regarding technology. Furthermore, the researcher field-tested the survey by asking various
educators not included in the study to complete and comment on the survey, so as to remove any
ambiguity or redundancies within the nine prompts. The survey also included demographic
entries for years of experience, grade level assignment, and subject matter. The instrument used
was a five point Likert scale ranging from (1) Strongly Agree to (5) Strongly Disagree. The
survey was created and administered using the Google Forms questionnaire format which
automatically collates data into a Google Sheets spreadsheet form as respondents submit their
answers. Moreover, the Google Form format allowed the researcher to send the survey directly to
the teachers’ facilitator Chromebook.
Research Procedures and Time Period of the Study
Teacher perceptions of the technology-based Google Classroom served as the dependent
variable. Teachers’ years of experience, grade level assignment, and subject matter represented
the independent variables. For the purposes of collecting quantitative data, the researcher used
Likert scale surveys and made them available via district supplied email accounts to the teachers
of classrooms included in the pilot program. These were coupled with communication to the
teachers which gave instructions for completing the survey. Teachers of the participating grade
levels were sent an email link to the Google Form survey on which they rated their perceptions
regarding the implementation. In order to gather as many responses as possible within the

39
sample, the researcher sent follow-up emails to those participants who had not responded after a
week. Furthermore, the researcher utilized the districts’ email system to send reminder requests
specifically to several pilot teachers who had not responded even after the second request.
Teachers’ years of experience was categorized according to the following four groups: 0-
5 years’ experience, 6-15 years’ experience, 16-25 years’ experience, and more than 25 years’
experience. The researcher categorized the grade level assignments of the teachers into fourth,
seventh, and tenth grades. English language arts, mathematics, science, and social studies were
the four categorized groups of subject matter. The time period for the study was the 2016-2017
school year. The survey was given in the middle of the school year. This time frame gave the
teachers a full semester of experience with implementing the technology-based Google
Classroom into their instruction classrooms while not adding to their end-of-year duties.
Data Analysis
The survey was designed to measure the participants’ perceptions regarding the
technological focus and instructional applicability of the Google Classroom. The survey listed
nine prompts specific to various uses of the student Chromebooks and Google Classroom. Since
the Likert scale was designed to measure attitudes and perceptions of participants, the survey
supplied the participants with five options ranging from (1) Strongly Agree to (5) Strongly
Disagree (Ary et al., 2014). The teacher responses automatically populated into a Google Sheet
spreadsheet drawn from the Google Form survey. These were identified by prompt number and
demographic information. In fact, the Google Form totaled percentages of the five Likert
responses, including all respondents. Then, the data was transferred into Microsoft Excel and
separated into the variable groups for the purposes of retaining anonymity of the teachers and
conducting the statistical test.

40
The researcher also tallied the frequency of each of the five responses for each question
to provide a view of the teacher perceptions. Next, the responses were categorized by the four
years of experience groups, three grade level assignments, and four subject areas to gain a clearer
picture of teacher perception in each of the school categories. In order to determine which
responses were chosen most frequently, sums were totaled by each response and by each of the
variable groups.
The chi-square test of independence was performed to determine if a relationship existed
between the three teacher background variables and the teachers’ perception of the technology-
based Google Classroom. The chi-square test aimed to determine the relationships between
teacher years of experience, grade level assignment, and subject matter on the teachers’
perceptions of a technology-based Google Classroom. The chi square test compared expected
frequencies with observed frequencies (Ary D. , Jacobs, Sorenson, & Walker, 2014). Each chi
square test assumed that frequencies were distributed evenly among categories for each
independent variable. The test of significance indicated to the researcher which variables had a
statistically significant relationship at the .05 confidence interval with the dependent variable of
teacher perception as measured by the Likert scale survey. A chi-square test was also run on the
nine prompts within the variables to determine if the individual prompts had a significant
relationship to the perceptions of that group.
This study met the assumptions of a chi square test (Ary et al., 2014). First, the
observations were independent and the participants were chosen based on their grade level
assignment due to the school district’s implementation plan for Google Chromebooks. Secondly,
the categories were mutually exclusive. Teachers could only choose one grade level assignment,

41
one years of experience category, and one subject level in the survey. Lastly, the independent
variable data were recorded as frequencies for each category.
The level of significance for this study was set at .05 (Ary et al., 2014). The teachers’
years of experience were divided into four categories supplying 3 as the degree of freedom. In
order for the test of significance to reject the null hypothesis for teachers’ years of experience,
the x2 value needed to equal 21.026 or greater. The grade level assignment information was
divided into three categories, indicating the degree of freedom of 2. For the test of significance to
reject the null hypothesis for school assignment, the x2 value needed to equal 15.507 or greater.
The subject matter was divided into four categories giving the degree of freedom of 3 again. For
the test of significance to reject the null hypothesis for subject matter taught, the x2 value needed
to equal 21.026 or greater. These decision rules determined the level of significance of the
relationship between teacher years of experience, school assignment, and subject matter, as well
as gave a basis to reject the null hypotheses.

42
Chapter 4: Findings
The purpose of this study was to identify teachers’ perceptions of the technology-based
Google Classroom implementation and to determine if those perceptions were independent of the
three chosen variables: years of experience, grade level assignment, and subject matter. In order
to collect and compare responses, an electronic survey was created using Google Forms. The
survey consisted of nine prompts to which the teachers could rate their agreement or
disagreement via Likert scale (Ary D. , Jacobs, Sorenson, & Walker, 2014). The Google Form
survey was sent to the teachers involved in the Google Classroom roll-out by way of their school
district email address. Their first-hand account of the implementation of Google Classroom
afforded the teachers a unique perspective of the technology’s integration into the classroom.
The responses to the survey were tabulated for frequency and then examined using the chi-
squared test of independence. The analysis was in an effort to answer the research question
which framed the study:
Do teachers’ years of experience, grade level assignment, and subject matter influence
teacher perceptions of a technology-based Google Classroom?
Specific null hypotheses for this study included:
H01. Teachers’ years of experience does not have a statistically significant relationship to
teacher perceptions of a technology-based Google Classroom.
H02. Teachers’ school assignment does not have a statistically significant relationship to
teacher perceptions of a technology-based Google Classroom.
H03. Teachers’ subject matter does not have a statistically significant relationship to
teacher perceptions of a technology-based Google Classroom.
The results of these analyses, as well as other findings, are discussed in this chapter.

43
Selection of Participants
The accessible population included all teachers in the district who taught one of the three
grade levels chosen for the Google Classroom roll-out, grades four, seven, and ten. All 136
teachers received the voluntary survey via their district email. Some responded after one request,
while others responded after the second or third request. Twenty-nine of the roll-out teachers
chose not to respond at all. Individual responses were kept confidential to ensure anonymity, and
responses were only analyzed by groups.
Brief Summary of Survey Prompts and Responses
At the close of the survey, 107 responses had been collected. Each of the respondents
answered nine different prompts regarding their utilization of the technology-based Google
Classroom with their students. Teacher respondents were varied in many ways such as
educational background, school placement, and teaching style. Furthermore, per the study’s
driving questions, the teachers were among three different grade levels, four subject areas, and
four ranges of years of experience. Teacher respondents reported that 25 were tenth grade
teachers, 43 were seventh grade teachers, and 39 were fourth grade teachers. The four subject
areas represented in the survey were English language arts which included 43 teachers, math
including 39 teachers, science comprising 13 teachers, and social studies totaling 12 teachers.
Finally, teachers’ years of experience ranges were grouped into four categories with 30 teachers
in the 0-5 category, 40 in the 6-15 years, 28 in the 16-25 years category, and 9 in the 25 or more
years category. The electronic Google Form used to collect the responses collated the group
responses into pie graphs of percentages of each answer, not yet separated by the study’s
variables.

44
Prompt 1. The technology-based Google Classroom has increased my productivity as a
teacher (planning, grading, etc.).
Of the 107 teachers who responded to the survey, more than half chose a positive response
regarding their productivity within Google Classroom. In fact, 20.6% chose (1) Strongly Agree,
and 34.6% chose (2) Agree Somewhat. Next, 31.8% of the teachers chose the response (3)
Neither Agree nor Disagree. Only 11.2% chose (4) Disagree Somewhat, while only 1.9% of the
teachers chose (5) Strongly Disagree to the prompt stating that Google Classroom increased
teacher productivity.
Prompt 2. The technology-based Google Classroom has increased my students’
productivity.
Regarding student productivity while using Google Classroom, the teachers’ perceptions were
again mainly positive. (1) Strongly Agree was chosen by 16.8% of the teachers in response to the
second prompt. A 43.9% of the teachers chose 2 on the Likert scale for Agree Somewhat, and
24.3% of the teachers chose (3) Neither Agree nor Disagree. The fourth choice had 14% of the
responses for (4) Disagree Somewhat, and only 1 response, .9%, was given for (5) Strongly
Disagree.
Prompt 3. With the technology-based Google Classroom, students have fewer missing
assignments.
The teachers’ perceptions of missing student assignments while using Google Classroom
returned responses close to the middle responses. Strongly Agree had 13.1%. Choices (2) Agree
Somewhat and (4) Disagree Somewhat had the same number of teacher responses, compiling
18.7% each. The majority of responses were (3) Neither Agree nor Disagree at 43%. However,
6.5% of the teachers did choose (5) Strongly Disagree.

45
Prompt 4. Students appear more engaged (asking questions, offering input, researching
to find answers) in class when utilizing Google Classroom.
The teachers’ reported that they felt their students were more engaged in class when using
Google Classroom. This was shown by 71% of teachers choosing to agree with the prompt:
27.1% of teachers chose (1) Strongly Agree, while 43.9% chose (2) Agree Somewhat. In the
middle of the Likert scale, (3) Neither Agree nor Disagree, fell 19.6% of the responses. Only
9.3% selected the (4) Disagree Somewhat category. Finally, there were 0 responses in the (5)
Strongly Disagree category.
Prompt 5. Students perform better on assessments when utilizing the Google Classroom
for test-taking.
Teacher perceptions for student performance on assessments were distinctly undecided. (3)
Neither Agree nor Disagree was chosen by 54.2% of the teachers. No teachers responded that
they (1) Strongly Agree, and 25.2% chose (2) Agree Somewhat. For the disagree options, 15.9%
of teachers chose (4) Disagree Somewhat, and 4.7% chose (5) Strongly Disagree.
Prompt 6. Students write/create more thorough responses when utilizing the Google
Classroom.
Regarding improved student writing within Google Classroom, the teachers responded in every
category. In fact, of the respondents, 9.3% of teachers responded that they (1) Strongly Agree.
The same number of teachers chose (2) Agree Somewhat and (3) Neither Agree nor Disagree at
41 teachers each, or 38.3% for each category. In response to Prompt 6, 10.3% of the teachers
chose the (4) Disagree Somewhat choice, while 3.7% chose (5) Strongly Disagree.

46
Prompt 7. Utilizing the Chromebooks/Google Classroom saves me time in planning.
The prompt regarding planning time for teachers within a Google Classroom elicited various
responses. However, even with the varied responses, this prompt garnered more negative
responses than most of the other prompts. (1) Strongly Agree was selected by 18.7% of the
teachers. (2) Agree Somewhat was selected by 24.3%. The (3) Neither Agree nor Disagree
response was chosen by 20.6% of teachers. Similar to option 2, 25.2% of the teachers chose (4)
Disagree Somewhat, and 11.2% of teachers chose (5) Strongly Disagree.
Prompt 8. Utilizing the Google Classroom improves the efficacy of my teaching
(effectiveness or results of teaching).
Teacher perceptions regarding their efficacy or effectiveness as a Google Classroom teacher
were only somewhat positive. Only 8.4% of respondents chose (1) Strongly Agree, but 37.4%
and 39.3% chose (2) Agree Somewhat and Neither Agree nor Disagree, respectively. The choice
(4) Disagree Somewhat was chosen by 11.2%, and (5) Strongly Disagree was selected by 3.7%
of the teachers.
Prompt 9. Utilizing the Google Classroom improves student retention of the subject
matter.
Teacher responses denoting their perceptions regarding the use of Google Classroom improving
the students’ retention of the subject matter came back unclear, neither specifically positive nor
negative. (1) Strongly Agree was chosen by 4.7% of teacher respondents. (2) Agree Somewhat
was chosen by 40.2% of the teachers. Many teachers chose (3) Neither Agree nor Disagree to
make up 49.5% of the responses. Only 4 teachers chose (4) Disagree Somewhat at 3.7%, and 2
teachers, or 1.9%, chose (5) Strongly Disagree.

47
Table 4.1
Percentage Summary of All Likert Responses
Prompt (1) SA (2) AS (3) NAD (4) DS (5) SD
1 20.6 34.6 31.8 11.2 1.9
2 16.8 43.9 24.3 14 0.9
3 13.1 18.7 43 18.7 6.5
4 27.1 43.9 19.6 9.3 0
5 0 25.2 54.2 15.9 4.7
6 9.3 38.3 38.3 10.3 3.7
7 18.7 24.3 20.6 25.2 11.2
8 8.4 37.4 39.3 11.2 3.7
9 4.7 40.2 49.5 3.7 1.9
Variable One: Teachers’ Years of Experience
Teacher respondents held various years of teaching experience. For the purpose of the
study, ranges of years were given as four different options from which teachers could choose.
These were separated according to the following groups: 0-5 years’ experience, 6-15 years, 16-
25 years, and 25 years or more. Each respondent replied to the nine prompts with a 1-5 ranking
of agreement via the Likert scale which was designed to measure attitudes the respondents have
toward the technology-based Google Classroom (Ary D. , Jacobs, Sorenson, & Walker, 2014).
0-5 years of experience. The teachers in the range with the least experience chose the (2)
Agree Somewhat response most frequently in Prompts 1, 2, 6, 8 and 9. However, in Prompt 3 and
Prompt 5, these teachers chose (3) Neither Agree nor Disagree most often. To Prompt 4

48
regarding student engagement, teachers with 0-5 years of experience chose (1) Strongly Agree
most frequently. However, to Prompt 7 regarding Google Classroom saving teacher planning
time, the highest number of responses fell in the (4) Disagree Somewhat selection.
Table 4.2
0-5 Years Teacher Responses
Prompt (1) SA (2) AS (3) NAD (4) DS (5) SD
1 8 11 7 3 1
2 7 13 5 5 0
3 6 3 15 4 2
4 13 10 5 2 0
5 0 9 15 6 0
6 4 14 7 3 2
7 9 3 5 10 3
8 3 14 9 3 1
9 2 15 10 3 0
6-15 years of experience. The teachers with 6-15 years of experience composed the
largest group. In this group, the selection (3) Neither Agree nor Disagree garnered the most
responses in several of the prompts. This was true in Prompts 1, 3, 5, 8, and 9. Furthermore, two
of the prompts, Prompt 6 and Prompt 7 both had an equal number of responses in the (2) Agree
Somewhat and the (3) Neither Agree nor Disagree column. The other two prompts, Prompt 2 and
Prompt 4 both had the highest number of responses within the (2) Agree Somewhat selection. As

49
shown in Table 4.3, this group had limited responses in both the (1) Strongly Agree and (5)
Strongly Disagree choices.
Table 4.3
6-15 Years Teacher Responses
Prompt (1) SA (2) AS (3) NAD (4) DS (5) SD
1 9 13 14 4 0
2 6 17 11 6 0
3 3 11 15 7 4
4 9 19 8 4 0
5 0 5 25 7 3
6 4 15 15 4 2
7 8 11 11 6 4
8 3 14 18 4 1
9 2 13 23 1 1
16-25 years of experience. There were 28 teachers who responded that had between 16
and 25 years of experience. In response to the nine prompts, many teachers in this group
responded with the (2) Agree Somewhat choice. In fact, five of the prompts, Prompts 1, 2, 4, 8,
and 9 had the highest number of responses in that category. However, four of the prompts,
Prompts 3, 5, 6, and 7 had the highest number of responses in the (3) Neither Agree nor Disagree
category. Very few teachers in this group chose (4) Disagree Somewhat or (5) Strongly Disagree

50
to the prompts, with the exception of Prompt 7, the prompt regarding teacher planning time,
which garnered nine responses in the (4) Disagree Somewhat category.
Table 4.5
16-25 Years Teacher Responses
Prompt (1) SA (2) AS (3) NAD (4) DS (5) SD
1 4 12 10 2 0
2 4 15 7 2 0
3 5 5 11 6 1
4 5 14 6 3 0
5 0 9 15 3 1
6 1 10 14 3 0
7 3 10 4 9 2
8 2 12 11 3 0
9 0 15 13 0 0
More than 25 years of experience. This was the smallest group by far with only nine
respondents. Five of the prompts, Prompts 2, 3, 6, 8, and 9 had the largest number of responses
in the (3) Neither Agree nor Disagree selection. However, Prompt 1 had equal number of
responses in both (3) Neither Agree nor Disagree and (4) Disagree Somewhat. Prompts 4 and 5
had the most responses in the (2) Agree Somewhat selection. Notably, the 25 years of experience
or more group is the only group to have a specific prompt, Prompt 7 regarding planning time,
score highest in the (5) Strongly Disagree selection.

51
Table 4.6
More Than 25 Years Teacher Responses
Prompt (1) SA (2) AS (3) NAD (4) DS (5) SD
1 1 1 3 3 1
2 1 2 3 2 1
3 0 1 5 3 0
4 2 4 2 1 0
5 0 4 3 1 1
6 1 2 5 1 0
7 0 2 2 2 3
8 1 0 4 2 2
9 1 0 7 0 1
Years of Experience Chi-square Tests
Teacher responses to all nine prompts were first collated into one chart for the purposes
of running the chi-square test of independence. The statistical analysis compared the observed
scores in each category and level of experience to the expected scores and rendered a p value. P
values were deemed significant at or below the .05 level (Ary D. , Jacobs, Sorenson, & Walker,
2014; Tanner, Using Statistics to Make Educational Decisions, 2012). In this test, the responses
of the four different groupings of years of experience for teachers were examined. A chi-square
test was performed and the p value of <.01 suggested a relationship between teachers’ years of
experience and their perceptions of Google Classroom. The null hypothesis was then rejected:

52
H01. Teachers’ years of experience does not have a statistically significant relationship to
teacher perceptions of a technology-based Google Classroom.
Table 4.7
Years of Experience Observed Likert Values
Experience (1) (2) (3) (4) (5) Totals
0- 5 Years 52 92 78 39 9 270
6-15 Years 44 118 140 43 15 360
16-25 Years 24 102 91 31 4 252
25+ Years 7 16 34 15 9 81
Totals 127 348 343 128 37 963
Table 4.8
Years of Experience Expected Values
Experience (1) (2) (3) (4) (5) Totals
0- 5 Years 35.61 91.96 96.17 35.89 10.37 270
6-15 Years 47.48 122.62 128.22 47.85 13.83 360
16-25 Years 33.23 85.83 89.76 33.50 9.68 252
25+ Years 10.68 27.59 28.85 10.77 3.11 81
Totals 127 348 343 128 37 963

53
Individual Prompts. In addition to the three variables’ chi-square tests which examined
expected responses as compared to observed responses, the chi-square test was also performed
on each of the nine prompts individually to determine the relationship between the prompts and
the years of experience variable. Any prompt that was found to have a p value of less than .05
was considered to have a significant relationship with the variable of teachers’ years of
experience (Ary D. , Jacobs, Sorenson, & Walker, 2014).
Prompt 1 regarding teacher productivity when utilizing the Google Classroom returned a
p value of .26, suggesting no relationship, based upon the .05 level of significance. No
relationship was found with Prompt 2 and teacher perceptions of student productivity in the
Google Classroom as the p value was .18. Similarly, Prompt 3’s p value calculated as .51,
concerning students’ missing assignments. Prompts 4, 5, and 6 were also determined to
independent of the variable also, as their p values were too large to be considered dependent
upon the variable at .43, .46, and .25 respectively. Prompt 7 also returned a p value which
depicted no relationship between the prompt regarding teachers’ planning time within the Google
Classroom and the years of experience variable, reporting a p value of .11. Prompt 8 regarding
the efficacy of teaching with the technology-based classroom had a p value of .18, depicting no
relationship. However, to the final prompt, Prompt 9, which read, Utilizing the Google
Classroom improves student retention of the subject matter, teachers’ responses returned a p
value of .04. This particular p value is considered significant as it is below the .05 level. Of the
teacher responses to the nine prompts, only Prompt 9 was deemed to be dependent upon the
variable of years of experience.

54
Table 4.9
Teachers’ Perceptions by Years of Experience
Prompt Topic p value
1 Teacher productivity .26
2 Student productivity .18
3 Missing assignments .51
4 Student engagement .43
5 Assessment performance .46
6 Student writing/creating .25
7 Teacher planning .11
8 Teaching efficacy .18
9 Subject retention .04
Prompt 9. Variances in expected and observed values lead to a possibly significant p
value (Ary D. , Jacobs, Sorenson, & Walker, 2014). This was the case with Prompt 9 within the
years of experience variable. The (2) Somewhat Agree response returned differing results from
the expected values in all four of the years of experience categories. For instance, 13 teachers in
the 6-15 years range chose (2) Somewhat Agree whereas 16 were expected. In the 25 or more
years category, 0 teachers chose (2) Somewhat Agree where a 3.6 was expected. Also notable,
the teachers with the least years of experience responses varied from that which was expected in
both (2) Somewhat Agree and (3) Neither Agree nor Disagree responses: 15 and 10 observed,
12.0 and 14.8 expected, respectively.

55
Table 4.10
Prompt 9 Observed Likert Values
Experience (1) (2) (3) (4) (5) Totals
0- 5 Years 2 15 10 3 0 30
6-15 Years 2 13 23 1 1 40
16-25 Years 0 15 13 0 0 28
25+ Years 1 0 7 0 1 9
Totals 5 43 53 4 2 107
Table 4.11
Prompt 9 Expected Values
Experience (1) (2) (3) (4) (5) Totals
0- 5 Years 1.40 12.06 14.86 1.12 0.56 30
6-15 Years 1.87 16.07 19.81 1.50 0.75 40
16-25 Years 1.31 11.25 13.87 1.05 0.52 28
25+ Years 0.42 3.62 4.46 0.34 0.17 9
Totals 5 43 53 4 2 107
Variable Two: Teacher’s Grade Level Assignment
The district’s Google Classroom roll-out was designated for three specific grade levels,
grades four, seven, and ten. The various grade levels allowed the district to begin implementing
the technology in different school settings, such as elementary, middle, and high schools. The

56
district plans to add more Google Classroom grade levels during the 2017- 2018 school year.
Implementing a roll-out at varied school settings allows for the roll-out teachers of this year to
assist their colleagues next year. Of the 107 respondents, 39 taught fourth grade, 43 taught
seventh grade, and 25 taught tenth grade.
Fourth grade. The fourth grade teacher group was comprised of 39 teachers who
responded to the survey, rating their agreement or disagreement with the prompts regarding
Google Classroom via the Likert scale (Ary D. , Jacobs, Sorenson, & Walker, 2014). The
majority of the prompts, in fact, six of the nine prompts were found to have had the highest
number of respondents choose (2) Agree Somewhat, denoting a somewhat positive perceptions to
the technology-based Google Classroom. These prompts included Prompts 1, 2, 4, 6, 7, and 8. In
the three remaining prompts though, the highest number of responses fell into the (3) Neither
Agree nor Disagree category. In both Prompts 3 and 9, which dealt with missing student
assignments and retention of the subject matter respectively, although teachers chose (3) Neither
Agree nor Disagree most frequently, the responses were similar in frequency to the (2) Agree
Somewhat category. This was not the case with Prompt 5. The fifth prompt which asserted that
students perform better on assessments while using the Google Classroom for test-taking, the
fourth grade teachers decidedly chose the middle response, (3) Neither Agree nor Disagree. In
fact, more than half of the fourth grade teacher respondents, 23, chose the one neutral response
field. Table 4.12 depicts the fourth grade teacher responses and the frequency with which each
score on the Likert scale was chosen.

57
Table 4.12
4th Grade Teacher Responses
Prompt (1) SA (2) AS (3) NAD (4) DS (5) SD
1 7 15 14 3 0
2 7 18 10 4 0
3 3 11 14 7 4
4 13 18 6 2 0
5 0 9 23 5 2
6 2 17 10 8 2
7 5 14 8 10 2
8 2 19 14 4 0
9 2 16 18 3 0
Seventh grade. Seventh grade teachers made up the largest group with 43 participants. In
response to the prompts, the teachers chose (3) Neither Agree nor Disagree most often in
Prompts 3, 5, 6, 8, and 9. However, Prompt 9 also had several respondents choose (2) Agree
Somewhat, 18 as compared to the 24 who chose (3) Neither Agree nor Disagree. The (2) Agree
Somewhat category garnered the highest number of responses in Prompts 1, 2, and 4. Notably,
seventh grade teachers chose (4) Disagree Somewhat most frequently for Prompt 7 regarding
teacher planning time, while zero teachers chose option (4) Disagree Somewhat and (5) Strongly
Disagree for Prompt 9 regarding student retention of subject matter.

58
Table 4.13
7th Grade Teacher Responses
Prompt (1) SA (2) AS (3) NAD (4) DS (5) SD
1 9 16 13 4 1
2 6 21 12 4 0
3 3 6 22 10 2
4 7 24 7 5 0
5 0 11 23 9 0
6 5 12 23 2 1
7 9 9 10 14 1
8 4 13 21 4 1
9 1 18 24 0 0
Tenth grade. With 25 respondents teaching tenth grade, this was the smallest of the
grade-level groups. Like some of the other groups, this group had a few prompts where the
highest number of responses fell into the (3) Neither Agree nor Disagree. Those included
Prompts 1, 3, 5, and 9. However, Prompt 3 also had several responses in the (1) Strongly Agree
category. Although other groups were positive about Prompt 4 and student engagement, this
group had the highest number of selections for (1) Strongly Agree. Alternatively, Prompt 7
elicited the highest number of responses in the (5) Strongly Disagree category. The other three
prompts, Prompts 2, 6, and 8 were found to have (2) Agree Somewhat as the most frequently
chosen selection.

59
Table 4.14
10th Grade Teacher Responses
Prompt (1) SA (2) AS (3) NAD (4) DS (5) SD
1 6 6 7 5 1
2 5 8 4 7 1
3 8 3 10 3 1
4 9 5 8 3 0
5 0 7 12 3 3
6 3 12 8 1 1
7 6 3 4 3 9
8 3 8 7 4 3
9 2 9 11 1 2
Grade Level Assignment Chi-square Results
The chi-square test was again performed in Microsoft Excel to determine the relationship
between teachers’ responses to the survey prompts and the variable of grade level. The 963 total
responses were organized into one chart of observed values. From those, the expected values
were determined. The chi-square test was performed, and the p value returned for grade level
assignments and teacher perceptions was <.01. In order for the relationship between the variables
to be considered dependent, the p value must have calculated at or below the .05 level of
significance (Ary D. , Jacobs, Sorenson, & Walker, 2014). Based upon the level of the p value at
<.01, the variables of teachers’ perceptions of the Google Classroom and their assigned grade
level were determined to be dependent. Therefore, the null hypothesis was rejected:

60
H02. Teachers’ grade-level assignment does not have a statistically significant relationship
to teacher perceptions of a technology-based Google Classroom.
Table 4.15
Grade Level Assignment Observed Likert Values
Grade (1) (2) (3) (4) (5) Totals
4th 41 137 117 46 10 351
7th 44 130 155 52 6 387
10th 42 61 71 30 21 225
Totals 127 328 343 128 37 963
Table 4.16
Grade Level Assignment Expected Values
Grade (1) (2) (3) (4) (5) Totals
4th 46.29 119.55 125.02 46.65 13.49 351
7th 51.04 131.81 137.84 51.44 14.87 387
10th 29.67 76.64 80.14 29.91 8.64 225
Totals 127 328 343 128 37 963
Individual Prompts. Teachers’ responses to Prompt 1 regarding their perception of
productivity were determined to be independent of the grade-level variable as the p value was
.72. Likewise, Prompt 2 was also found to be independent of the variable at p=.25. However,
Prompt 3 which probes for teacher perceptions regarding missing assignments while using
Google Classroom returned a p value of .05 which makes it significant and dependent upon the

61
variable. Prompt 4 regarding student engagement, although close to the level of significance, was
independent of the variable due to its p value of .07. Teacher perceptions regarding assessment
performance were deemed independent of the variable as the p value returned was .36. The
student writing/creating prompt, Prompt 6, returned a p value of .07, again too large to be
considered dependent upon the variable. However, Prompt 7, regarding teacher planning,
returned a significant p value at p<.01. This signifies that the teacher perceptions regarding
planning time in the Google Classroom were dependent upon what grade level the teachers were
assigned. Prompts 8 and 9 were both ruled independent due to their insignificant p values of .15
and .17 respectively.
Table 4.17
Teachers’ Perceptions by Grade Level
Prompt Topic p value
1 Teacher productivity .72
2 Student productivity .25
3 Missing assignments .05
4 Student engagement .07
5 Assessment performance .36
6 Student writing/creating .07
7 Teacher planning <.01
8 Teaching efficacy .15
9 Subject retention .17

62
Prompt 3. Although the responses from the teachers were varied, some values were
observed considerably higher or lower than expected. Chi-square tests compare the two,
observed values and expected values, and when the variance is considerable, the test returns a
significant p value (Tanner, 2012). For instance, as shown in Table 4.18 and 4.19, in response to
the prompt about missing student assignments within the Google Classroom, the fourth grade
teachers selected fewer (1) Strongly Agree responses than expected but more (2) Agree
Somewhat and (5) Strongly Disagree than expected. Likewise, the seventh grade teachers
selected (3) Neither Agree nor Disagree and (4) Disagree Somewhat more often than expected
and chose fewer (1) Strongly Agree and (2) Agree Somewhat responses than expected. Tenth
grade teachers, on the other hand, responded more positively to Prompt 3 with 8 teachers
selecting (1) Strongly Agree while only 3 were expected. Consequently, the (2) Agree Somewhat
and (4) Disagree Somewhat were chosen less frequently than expected.
Table 4.18
Prompt 3 Observed Likert Values
Grade (1) (2) (3) (4) (5) Totals
4th 3 11 14 7 4 39
7th 3 6 22 10 2 43
10th 8 3 10 3 1 25
Totals 14 20 46 20 7 107

63
Table 4.19
Prompt 3 Expected Values
Grade (1) (2) (3) (4) (5) Totals
4th 5.10 7.29 16.77 7.29 2.55 39
7th 5.63 8.04 18.49 8.04 2.81 43
10th 3.27 4.67 10.75 4.67 1.64 25
Totals 14 20 46 20 7 107
Prompt 7. Again, as the expected values were contrasted with observed values in
response to prompt regarding the Google Classroom saving teacher planning time, variances
were observed. Tables 4.20 and 4.21 depict the teachers’ responses to Prompt 7 and the expected
values, separated by grade level assignment. The variances between expected values and
observed values were analyzed via the chi-square test which returned a significant p value of
<.01. Tenth grade teachers rated their perceptions considerably more negatively than expected.
In fact, the (5) Strongly Disagree response was the response selected most frequently by the
tenth grade teachers totaling 9 observed responses in that category where only 2.8 were expected.
Seventh grade teachers chose (4) Disagree Somewhat more often than expected with 14 instead
of 10.85, but they did not choose (5) Strongly Disagree as often as expected with only 1 as
compared to 4.82. Conversely, fourth grade teachers’ perceptions regarding the prompt differed
from the expected in the (2) Agree Somewhat response, resulting in 14 observed where 9.4 were
expected.

64
Table 4.20
Prompt 7 Observed Likert Values
Grade (1) (2) (3) (4) (5) Totals
4th 5 14 8 10 2 39
7th 9 9 10 14 1 43
10th 6 3 4 3 9 25
Totals 20 26 22 27 12 107
Table 4.21
Prompt 7 Expected Values
Grade (1) (2) (3) (4) (5) Totals
4th 7.29 9.48 8.02 9.84 4.37 39
7th 8.04 10.45 8.84 10.85 4.82 43
10th 4.67 6.07 5.14 6.31 2.80 25
Totals 20 26 22 27 12 107
Variable Three: Teachers’ Subject Matter
Teachers participating in the Google Classroom roll-out taught one of four subjects:
English language arts, mathematics, science, or social studies. The two largest groups were
English language arts comprised of 43 teachers and mathematics encompassing 39 teachers. The
science and social studies groups were much smaller with 13 and 12 teachers, respectively. This
difference was due to several elementary schools in the county deciding to begin the Google
Classroom roll-out in only two focus subjects, specifically English language arts and

65
mathematics. Each of the teachers rated his or her agreement with the nine prompts of the survey
which dealt specifically with how teachers perceive the Google Classroom implementation. As
reflected in the research question, the relationship between the teachers’ perceptions and their
subject or content matter were examined.
English language arts. Teacher respondents who identified themselves as teachers of the
English language arts subject, the largest group based upon subject matter distinction, answered
mostly positively overall to the survey prompts. In fact, six of the nine prompts had the highest
number of responses in the (2) Agree Somewhat choice. These included Prompts 1, 2, 4, 6, 7, and
8. However, one of these prompts, Prompt 8, which addressed the efficacy or result of teaching
with the technology-based Google Classroom, had the exact same number in both the (2) Agree
Somewhat and the (3) Neither Agree nor Disagree choice field. Although the choice (3) Neither
Agree nor Disagree garnered the highest number of responses for Prompt 3 regarding fewer
missing assignments while utilizing Google Classroom, the other two positive choices were
considerably close with 10 responses of (1) Strongly Agree and 11 responses of (2) Agree
Somewhat. Among the English language arts responses, the (5) Strongly Disagree choice was
chosen rarely. Prompt 3 garnered the highest number of (5) Strongly Disagree responses with 3.
Prompts 5 and 9 regarding assessment performance and subject matter retention also had the
highest number of responses in the (3) Neither Agree nor Disagree category which was chosen
22 times by English language arts respondents in both prompts. Table 4.22 denotes the
responses from teachers of the English language arts subject as well as the frequency for each of
the five Likert selections.

66
Table 4.22
ELA Teacher Responses
Prompt (1) SA (2) AS (3) NAD (4) DS (5) SD
1 12 20 9 2 0
2 14 18 10 1 0
3 10 11 13 6 3
4 18 19 6 0 0
5 0 14 22 5 2
6 6 24 10 2 1
7 11 14 12 5 1
8 6 17 17 3 0
9 3 17 22 1 0
Mathematics. Although six of the prompts were found to have the highest number of
responses in the (3) Neither Agree nor Disagree selection field, some of those responses were
more evenly distributed than others. For instance, Prompt 1 and 8 had 14 and 16 (3) Neither
Agree nor Disagree selections respectively, with close seconds in other selection options.
However, Prompts 3, 5, and 9 elicited 22, 20, and 19 responses in that category; in other words, a
much higher percentage of the group chose that response. Likewise, although Prompt 2 had the
highest number of responses in the (2) Agree Somewhat category, both selections (3) Neither
Agree nor Disagree and (4) Disagree Somewhat held 11 responses. Prompt 4 responses were
similar in their distribution to Prompt 2. Prompt 7, however, had the highest number of responses
in the (4) Disagree Somewhat category.

67
Table 4.23
Math Teacher Responses
Prompt (1) SA (2) AS (3) NAD (4) DS (5) SD
1 4 12 14 7 2
2 2 14 11 11 1
3 2 3 22 8 4
4 5 14 12 8 0
5 0 5 20 11 3
6 1 9 20 6 3
7 3 6 7 12 11
8 2 12 16 5 4
9 1 14 19 3 2
Science. There was only one prompt that elicited the highest number of responses in the
(1) Strongly Agree category; however, it was tied with (2) Agree Somewhat at three responses
each. Four more prompts, Prompts 2, 4, 8, and 9 held the highest number of responses in the (2)
Agree Somewhat selection, with the addition of Prompt 6 which had the same number of
responses in (2) Agree Somewhat and (3) Neither Agree nor Disagree. Prompts 1, 3, and 5 all
held the highest number of science teacher responses in the (3) Neither Agree nor Disagree
category, and zero prompts elicited the highest number of responses in (4) Disagree Somewhat
and (5) Strongly Disagree.
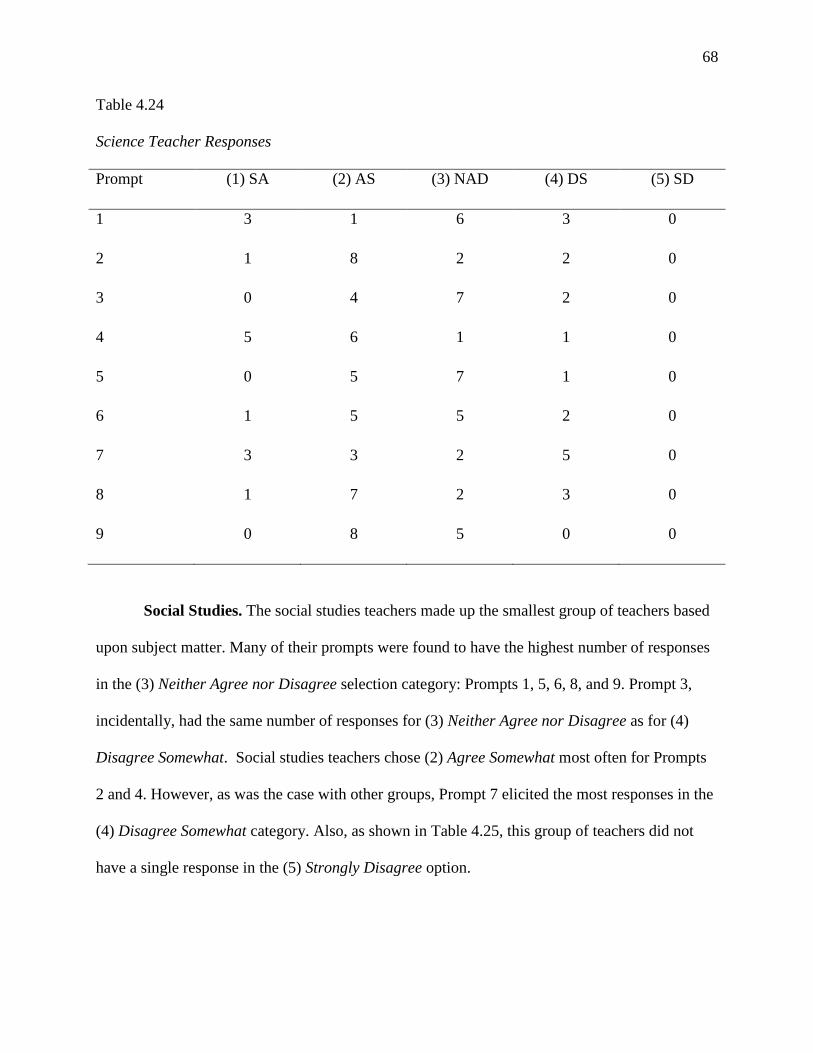
68
Table 4.24
Science Teacher Responses
Prompt (1) SA (2) AS (3) NAD (4) DS (5) SD
1 3 1 6 3 0
2 1 8 2 2 0
3 0 4 7 2 0
4 5 6 1 1 0
5 0 5 7 1 0
6 1 5 5 2 0
7 3 3 2 5 0
8 1 7 2 3 0
9 0 8 5 0 0
Social Studies. The social studies teachers made up the smallest group of teachers based
upon subject matter. Many of their prompts were found to have the highest number of responses
in the (3) Neither Agree nor Disagree selection category: Prompts 1, 5, 6, 8, and 9. Prompt 3,
incidentally, had the same number of responses for (3) Neither Agree nor Disagree as for (4)
Disagree Somewhat. Social studies teachers chose (2) Agree Somewhat most often for Prompts
2 and 4. However, as was the case with other groups, Prompt 7 elicited the most responses in the
(4) Disagree Somewhat category. Also, as shown in Table 4.25, this group of teachers did not
have a single response in the (5) Strongly Disagree option.

69
Table 4.25
Social Studies Teacher Responses
Prompt (1) SA (2) AS (3) NAD (4) DS (5) SD
1 3 4 5 0 0
2 1 7 3 1 0
3 2 2 4 4 0
4 1 8 2 1 0
5 0 3 9 0 0
6 2 3 6 1 0
7 3 3 1 5 0
8 0 4 7 1 0
9 1 4 7 0 0
Teachers’ Subject Matter Chi-square Results
As part of the study’s driving research question, the relationship between the teachers’
subject matter and their perceptions of the Google Classroom was examined by way of the chi-
square test. Within the chi-square test, expected frequencies of the 963 responses were compared
with observed responses to determine the p value (Ary D. , Jacobs, Sorenson, & Walker, 2014).
If the p value returned was less than or equal to .05, the relationship was considered significant.
A significant relationship meant that the responses were dependent upon the variable;
conversely, if a larger p value was found, the variables were independent of each other (Ary D. ,
Jacobs, Sorenson, & Walker, 2014). The teachers’ responses by subject matter were found to be
dependent, as the p value returned was <.01. Therefore, the null hypothesis was rejected:

70
H03. Teachers’ subject matter does not have a statistically significant relationship to
teacher perceptions of a technology-based Google Classroom.
Table 4.26
Subject Matter Observed Likert Values
Subject (1) (2) (3) (4) (5) Totals
ELA 80 154 121 25 7 387
Math 20 89 141 71 30 351
Science 14 47 37 19 0 117
SS 13 38 44 13 0 108
Totals 127 328 343 128 37 963
Table 4.27
Subject Matter Expected Values
Subject (1) (2) (3) (4) (5) Totals
ELA 51.04 131.81 137.84 51.44 14.87 387
Math 46.29 119.55 125.02 46.65 13.49 351
Science 15.43 39.85 41.67 15.55 4.50 117
SS 14.24 36.79 38.47 14.36 4.15 108
Totals 127 328 343 128 37 963
Individual Prompts. Within the variable of subject matter, teacher responses to Prompt
1 were determined to be independent of the variable due to the p value of .06. Prompt 2,

71
regarding student productivity however, was determined to be dependent upon the variable as the
chi-square test returned a p value of .01. Although close again, the teachers’ response to the
students’ missing assignment prompt, Prompt 3, did not result in a significant p value, .06.
Prompt 4 concerning student engagement was ruled dependent based upon a p value of <.01.
Responses to Prompt 5 were deemed independent of the variable with a p value of .13. Prompt 6
also returned a p value greater than .05 (.06) and, was therefore deemed independent. Regarding
planning time, Prompt 7 responses were shown to be dependent upon the variable due to a p
value of <.01. Prompts 8 and 9, concerning teacher efficacy and subject retention, were both
seen to be independent of the variable with p values at .15 and .58, respectively.
Table 4.28
Teachers’ Perceptions by Subject Matter
Prompt Topic p value
1 Teacher productivity .06
2 Student productivity .01
3 Missing assignments .06
4 Student engagement <.01
5 Assessment performance .13
6 Student writing/creating .06
7 Teacher planning <.01
8 Teaching efficacy .15
9 Subject retention .58

72
Prompt 2. Responses to Prompt 2 were considerably different than the expected values.
For instance, English language arts teachers chose (1) Strongly Agree twice as many times as
expected, 14 compared to 7 expected. In fact, the English language arts teachers responded quite
positively, as shown by 74% of their responses being (1) Strongly Agree and (2) Agree
Somewhat and only one response falling into the last two Disagree options. Conversely, only two
math teachers chose (1) Strongly Agree whereas 6.6 were expected. Math teachers were not as
positive and chose (3) Neither Agree nor Disagree as many times as they chose (4) Disagree
Somewhat. Within the last two groups, science and social studies teachers, the largest
inconsistencies were found in the (2) Agree Somewhat response. In response to the prompt
regarding student productivity, eight science teachers chose (2) Agree Somewhat, whereas only
5.3 were expected. Similarly, social studies teachers were expected to choose (2) Agree
Somewhat 5.3 times; however, the observed value was 7.
Table 4.29
Prompt 2 Observed Likert Values
Subject (1) (2) (3) (4) (5) Totals
ELA 14 18 10 1 0 43
Math 2 14 11 11 1 39
Science 1 8 2 2 0 13
SS 1 7 3 1 0 12
Totals 18 47 26 15 1 107

73
Table 4.30
Prompt 2 Expected Values
Subject (1) (2) (3) (4) (5) Totals
ELA 7.23 18.89 10.45 6.03 0.40 43
Math 6.56 17.13 9.48 5.47 0.36 39
Science 2.19 5.27 3.16 1.82 0.12 13
SS 2.02 5.27 2.92 1.68 0.11 12
Totals 18 47 26 15 1 107
Prompt 4. Student engagement was the topic of Prompt 4, and again several variances
between the observed and expected results were present. For example, English language arts
teachers reported their perceptions of student engagement again much more positively than
expected. In fact, 18 English language arts chose that they (1) Strongly Agree that their students
were more engaged with the Google Classroom as compared to the 11.6 expected. Moreover,
there were zero responses in the (4) Disagree Somewhat category for English language arts
teachers. However, the mathematics and social studies teachers chose (2) Agree Somewhat more
often than expected and (1) Strongly Agree less often than expected. Responses from science
teachers, although small in number, were found to be different than expected in the (1) Strongly
Agree category with five responses. As shown by Table 4.31 and 4.32, this variance, as well as
the science teachers’ lower numbers in the (1) Strongly Agree category, caused the chi-square
test to return a significant p value for this prompt, depicting that teachers’ perceptions were
dependent upon the subject matter that they teach.

74
Table 4.31
Prompt 4 Observed Likert Values
Subject (1) (2) (3) (4) (5) Totals
ELA 18 19 6 0 0 43
Math 5 14 12 8 0 39
Science 5 6 1 1 0 13
SS 1 8 2 1 0 12
Totals 29 47 21 10 0 107
Table 4.32
Prompt 4 Expected Values
Subject (1) (2) (3) (4) (5) Totals
ELA 11.65 18.89 8.44 4.02 0 43
Math 10.57 17.13 7.65 3.64 0 39
Science 3.52 5.71 2.55 1.21 0 13
SS 3.25 5.27 2.36 1.12 0 12
Totals 29 47 21 10 0 107
Prompt 7. The prompt regarding planning time for teachers utilizing the Google
Classroom elicited responses that widely varied from the expected outcomes. For instance,
considerably fewer math teachers chose the responses (1) Strongly Agree and (2) Agree

75
Somewhat than what were anticipated. In fact, only three math teachers chose (1) Strongly Agree
and six chose (2) Agree Somewhat, where 7.29 and 9.48 were expected, respectively. Also
distinguishable, the (4) Disagree Somewhat response was chosen more frequently than expected
in every subject except English language arts. The observed responses for (4) Disagree
Somewhat had two more responses than expected in each of the other three subjects. English
teacher perceptions, as with the other prompts, appeared more positive than the other subjects’
responses. Math teachers also chose (5) Strongly Disagree more often than expected at 11
responses where only 4.37 were expected. As shown in Table 4.33 of Prompt 7 responses and
4.34 of Prompt 7 expected values, these variances in observed and expected responses were and
integral component of the chi-square test which returned a significant p value of p<.01.
Table 4.33
Prompt 7 Observed Likert Values
Subject (1) (2) (3) (4) (5) Totals
ELA 11 14 12 5 1 43
Math 3 6 7 12 11 39
Science 3 3 2 5 0 13
SS 3 3 1 5 0 12
Totals 20 26 22 27 12 107

76
Table 4.34
Prompt 7 Expected Values
Subject (1) (2) (3) (4) (5) Totals
ELA 8.04 10.45 8.84 10.85 4.82 43
Math 7.29 9.48 8.02 9.84 4.37 39
Science 2.43 3.16 2.67 3.28 1.46 13
SS 2.24 2.92 2.47 3.03 1.35 12
Totals 20 26 22 27 12 107
Summary of Findings
Teachers utilizing Google Classroom were surveyed for their perceptions regarding the
technology’s integration in their classroom. The 107 responses to the survey were collated,
analyzed, and tested in an effort to answer the study’s driving question: Do teachers’ years of
experience, grade-level assignment, and subject matter influence teacher perceptions of a
technology-based Google Classroom? The chi-square test was performed on the responses for
each of the three variables. All three null hypotheses were rejected, as each chi-square test
returned a significant p value at p<.01. Therefore, it was determined that there was a relationship
found between the variables of years of experience, grade level assignment, and subject matter
and teachers’ perceptions of the technology-based Google Classroom.
Chi-square tests were also performed on individual prompts within the variables. In the
years of experience variable, Prompt 9 regarding student retention of subject matter was
determined to be dependent based upon a statistically significant p value. Teacher perceptions
were also found to be dependent upon grade-level assignments, specifically for Prompts 3

77
regarding missing assignments and Prompt 7 dealing with teacher planning time. Teachers’
subject matter was also found to have a relationship with teacher perceptions of the Google
Classroom as shown by the three prompts’ chi-square tests returning a significant p value:
Prompt 2 on student productivity, Prompt 4 about student engagement, and Prompt 7 regarding
teacher planning time.
78
Chapter 5: Conclusion
Implementing technology into the public school classroom has been the focus of much
research. Schools have tried various ways to integrate computers in the classroom, attempting to
better prepare students for a technology-rich life after high school graduation with growing
trends of online distance classes and technology-based career training (Keppler, Weiler, & Maas,
2014). Furthermore, with technology’s ever-growing prevalence came more global connectivity
which students must be able to navigate (Ismail, 2015). In fact, some proponents of the
integration even claimed that technology should be used to enhance the learning experience and
possibly surpass the capabilities of classroom academics without technology, all the while
preparing the next generations for ubiquitous use of it (Kayalar, 2016). Despite much research, a
definitive process for implementation, or even a clearly identified list of benefits, has not been
established (Penuel, 2006). However, amid the various suggestions for technological integration,
one pivotal role in classroom implementation remains constant: the role of the teacher. Teachers’
perceptions of technology and its uses have been noted to directly affect the implementation
(Cox, 2013; Ismail, 2015; Kayalar, 2016).
The school district chosen for the study had purchased Google Chromebooks for student
use and trained its roll-out teachers on Google Classroom, a technology-based instructional
platform. Three grade levels were included in the roll-out, as a pilot group. As participants in the
district’s pilot group, teachers of the three grade levels were sent a survey which was designed to
gauge their perceptions of the Google Classroom implementation and had been previously field-
tested. The survey was delivered to the roll-out teachers mid-way through the roll-out year, after
one semester’s completion. The district utilizes block scheduling at the high school level, so for
the 10th grade teachers, the semester’s end marked the end of the course. Of the 136 pilot

79
teachers, 107 responded to the voluntary survey, ranking their level of agreement with nine
different prompts via Likert scale. The prompts were designed to elicit teachers’ attitudes
regarding the implementation of the technology-based Google Classroom. The teachers also
answered simple demographic questions regarding their years of teaching experience, grade level
assignment, and subject matter. These were in an effort to answer the study’s driving question:
Do teachers’ years of experience, grade level assignment, and subject matter influence
teacher perceptions of a technology-based Google Classroom?
Summary of Findings
A chi-square test of independence was completed on the three variables of the research
question, and all three tests returned a statistically significant p value, suggesting the dependence
of the variables of years of experience, grade level assignment, and subject matter on teacher
perceptions of Google Classroom; therefore, the null hypotheses were rejected. Moreover, chi-
square tests were also run on the nine different prompts within each of the three variables. In
each test, certain prompts were also shown to be dependent. Within the years of experience
variable, responses to Prompt 9 regarding student retention of subject matter returned a p value
indicating significance. Within the grade level variable, responses to Prompts 3 and 7 were found
to be dependent upon the teachers’ grade level. Finally, within the subject matter variable, three
prompts, Prompts 2, 4, and 7 were found to have a relationship with teachers’ subject matter.
Holistically, the roll-out teachers responded somewhat positively to the nine prompts and
selected the (5) Strongly Disagree option the least frequently. The two most frequently chosen
responses to the prompts were (2) Agree Somewhat and (3) Neither Agree nor Disagree. These
two choices garnered more than 60% of the responses in every prompt but one, Prompt 7, which
dealt with teacher planning time. Prompt 7 was the only prompt which had the highest number of

80
responses in the (4) Disagree Somewhat selection. Conversely, there was also one particular
prompt to which teachers responded very favorably, Prompt 4 regarding student engagement.
This was the only prompt to elicit the highest number of responses in the (1) Strongly Agree
category. In fact, teachers responded overwhelmingly in agreement with the prompt: Students
appear more engaged (asking questions, offering input, researching to find answers) in class
when utilizing Google Classroom. To this prompt, 71% of the teachers chose (1) Strongly Agree
or (2) Agree Somewhat, with an additional 19.6% choosing (3) Neither Agree nor Disagree. In
total, the first three options garnered 90.6% of the responses. Coinciding with this, responses to
these two prompts were also found to be statistically significant within different variables’ chi-
square tests. In fact, responses to Prompt 7 were determined to be dependent upon teachers’
grade level and subject matter, whereas responses to Prompt 4 returned a significant p value in
the variable of subject matter.
Discussion and Implications
Years of Experience. Responses were categorized and analyzed in groups of years of
experience. An analysis of the responses for each category corroborated the chi-square test
results: teachers’ perceptions of the Google Classroom were dependent upon their years of
experience. Of the four categories, the 30 teachers with the least years of experience chose (1)
Strongly Agree more than any other group; 19.3%. In the next group, 12.2% of the teachers with
6-15 selected (1) Strongly Agree. The percentage of (1) Strongly Agree answers continued to
decrease in the 16-25 category at 9.5% and in the 25 years or more category at 8.6%. However,
even more notable, teachers with more than 25 years of experience were considerably less
positive in their responses, selecting both choices (4) Disagree Somewhat and (5) Strongly
Disagree at a much higher rate than the other groups. This finding may imply that younger

81
teachers are more familiar with technology, especially having recently attended college and pre-
service trainings (Ismail, 2015). Furthermore, the teachers with the least amount of experience
have grown up in a technology-rich society, and likely used it while they were in school, whereas
teachers with more than 25 years of experience would have had to make efforts to acquire
technological adeptness (Kayalar, 2016). To mediate this discrepancy, schools may need to
incorporate different levels of technological training for teachers, based upon their proficiency
levels with technology. Furthermore, similar to utilizing mentoring teachers, some teachers with
the least technological experience, or even those with negative presumptions, could be paired
with a colleague with whom to plan and learn the new web-based platform.
Grade Level Assignment. The three grade levels of the district’s Google Classroom roll-
out included grades four, seven, and ten. The chi-square test returned a significant p value,
indicating that teacher perceptions of Google Classroom were, in fact, dependent upon their
grade level assignment. The percentages for responses from teachers of grades four and seven
were distributed similarly throughout the 1-5 Likert choices. However, interestingly, the teachers
of tenth grade had both a higher percentage of strong agreement and strong disagreement than
either of the other groups. Of the high school teachers, 18.7% chose (1) Strongly Agree to the
prompts, as compared to 11.7% of fourth grade and 11.4% of seventh grade. Likewise, tenth
grade teachers also chose (5) Strongly Disagree at a higher rate than the other two groups; the
percentage of 9.3% was more than two times the other two groups combined. This finding may
be reflective of several things. For instance, the high school teachers are the only teachers in the
roll-out group who ended a course at the semester’s end. The groups of fourth and seventh grade
teachers keep their students year-long. The variance in the response choices could also be due to
the high school level teachers’ training and teaching being more subject-specific. Furthermore,

82
tenth grade students are already accustomed to utilizing technology in various ways such as cell
phones, word processing programs, social media, and so on. This previous exposure may help
assist the technological integration at the high school level, especially in light of the constraints
of one semester classes. This inference coincides with previous research which found that the
biggest difference in teachers’ integration of technology was based upon grade level, stating that
secondary level teachers were more likely to use technology in the classroom than elementary
and middle grade teachers (Gorder, 2008).
Subject Matter. One particularly interesting finding was that teachers of mathematics
chose (4) Disagree Somewhat and (5) Strongly Disagree more often than any other subject. In
fact, science and social studies teachers, albeit smaller groups, had zero responses in the (5)
Strongly Disagree category in response to all nine of the prompts. Although the majority of the
math responses fell into the (3) Neither Agree nor Disagree choice, the number of responses in
the last two choices, (4) Disagree Somewhat and (5) Strongly Disagree, total more than all three
of the other subjects combined. This could possibly reflect mathematics teachers’ attitudes that
Google Classroom and its educational suite of online tools do not necessarily lend themselves to
the teaching of mathematical equations and number sequencing. Moreover, English language arts
and science teachers were noticeably more agreeable with their responses. In fact, the (2) Agree
Somewhat choice was selected most frequently for both groups. This corresponds with studies
claiming that science and English skills can be enhanced by the use of technology and tools such
as Google Docs (Bebell & Kay, 2010; Shapley, et al., 2006; Suwantarathip & Wichadee, 2014).
As Google Classroom becomes more widespread in its use, it is possible that more mathematics
tools and extensions could be added, thereby alleviating some of the disconnect between the
subjects.

83
Based upon teacher responses, one positively perceived effect of the technological
integration is improved student engagement. This finding echoes the sentiments of
constructivism (Liu & Chen, 2010). As students participate in the Google Classroom, they are
typing, searching the internet, messaging their teacher and peers, collaborating on projects and
more. These experiences appear more interactive in nature than listening to lectures; therefore,
teachers may perceive that students are more engaged based upon their activity level.
Furthermore, the interactive experience of a technology-based classroom incorporates the skills
students utilize outside of the classroom as digital natives (An & Reigeluth, 2011). In fact, some
research calls for a more student-centered approach which Google Classroom provides based
upon the knowledge that students are used to interacting online with others via cell phones,
email, and social media (Hariadi, Dewiyani, & Sudarmaningtyas, 2016).
Teachers responded negatively in regards to their planning time. This implies that
teachers opined that adding the Google Classroom to their instruction has caused them to spend
more time in creating lessons, planning the collaborative assignments, and so on. However, it
should be noted that these negative perceptions may reflect the fact that the implementation and
the technology was brand new, thus requiring teachers to learn how to create items for the
students for the first time. If the study had taken place after the initial roll-out year, teachers may
have felt more established in the technology and its requirements. Moreover, in ensuing years,
teachers will have their previously created assignments and lessons from which to select. Finally,
as teachers familiarize themselves with Google Classroom, planning time may be reduced.
Conclusions
Although technological benefits are touted widely, there remains a lack of definitive data
to prove that technology enhances student learning. In addition, the lack of a clear procedural

84
plan for implementation suggests that the research regarding technology in the classroom is
unfinished and ever-changing. However, one role remains pivotal in any classroom integration:
the role of the teacher. As teachers undertake the task of teaching via technology, they also bring
with them their preconceived attitudes toward it. In this study, teacher perceptions were found to
be generally positive toward the technology-based Google Classroom implementation.
Furthermore, a chi-square test of independence was performed to analyze the relationship
between teachers’ perceptions and their years of experience, grade level assignment, and subject
matter. The relationships between the variables were significant at the p<.05 significance level.
In response to the study’s driving question, the research found that teachers’ perceptions of the
technology-based Google Classroom were dependent upon their years of experience, grade level
assignment, and subject matter.
Recommendations for Further Research
Further research regarding the integration of technology into the educational classroom is
paramount. Specifically, because this study was implemented in the initial roll-out year, future
years should be observed to determine whether teacher perceptions change after continued use of
Google Classroom. In fact, a study encompassing several years of the roll-out would be
appropriate, especially one that includes a more pervasive integration not limited to a pilot group
of three grade levels. Likewise, because Google Classroom and Google Chromebooks are
relatively new and because technology’s scope is ever-widening, studies should be continued to
assess new upgrades, product longevity, and sustained applicability.
As technology continues to be made more readily available, exposure and usage will
increase, not only for students but also for teachers. Therefore, teacher preparedness trainings
may need to change. For instance, as some teachers who may consider themselves reticent to

85
incorporate technology retire and are replaced by younger, more technologically adept teachers,
pre-service and in-service trainings will have to reflect that change and address not only overall
technological training but also training specific to facilitating and enhancing student use of it.
Furthermore, due to the teacher’s pivotal role in any technological integration, measures should
be taken to assess teacher perceptions prior to implementation, as well as continued
familiarization and support throughout the school year.
Finally, although quantitative studies remain mixed in their reports of increased academic
assessment performance after a technological initiative, further research should attempt to
determine and hone specific practices which increase achievement. Once identified, teacher
trainings and usage should be studied to assess the alignment with such practices. Moreover,
further qualitative studies are in order to provide a rich description of teacher perceptions, in
order to identify certain views and attitudes which may help or hinder full implementation.

86
References
Aflalo, E. (2014). The invisible barrier to integrating computer technology in education. Journal
of Education and Learning, 3(2), 120-134. doi:10.5539/jel.v3n2p120
Aldoobie, N. (2015, December). Technology integration and learning theory. American
International Journal of Contemporary Research, 5(6).
An, Y.-J., & Reigeluth, C. (2011). Creating technology-enhanced, learner-centered
classrooms:K–12 teachers’ beliefs, perceptions, barriers, and support needs. Journal of
Digital Learning in Teacher Education, 28(2), pp. 54-62.
Anthony, A. B. (2012). Activity theory as a framework for investigating district-classroom
system interactions and their influences on technology integration. Journal of Research
on Technology in Education, 44(4), pp. 335-356.
Ary, D., Jacobs, L. C., Sorenson, C., & Walker, D. A. (2014). Introduction to research in
education (9th ed.). Belmont, CA: Cengage.
Ary, D., Jacobs, L. C., Sorenson, C., & Walker, D. A. (2014). Introduction to Research in
Education. Belmont, CA: Wadsworth Cengage Learning.
Bakia, M., Means, B., Gallagher, L., Chen, E., & Jones, K. (2009). Evaluation of the enhancing
education through technology program final report. Washington, DC: Department of
Education, Office of Planning, Evaluation, and Policy Development.
Bass, B. M., & Bass, R. (2009). The Bass handbook of leadership: Theory, reserach &
mangerial applications. New York, NY: Simon & Schuster.
Bebell, D., & Kay, R. (2010, January). One to one computing: A summary of the quantitative
results of the Berkshire Wireless Learning Initiative. The Journal of Technology,
Learning, and Assessment, 9(2), 1-60.

87
Bebell, D., & O'Dwyer, L. M. (2010, January). Educational outcomes and reserach from 1:1
computing settings. The Journal of Technology, Learning, and Assessment, 9(1), 1-16.
Chiang-Lin, T., Hsu, Y.-S., & Cheng, Y.-J. (2011, April). Emerging innovative teacher education
from situated cognition in a web-based environment. The Turkish Online Journal of
Educational Technology, 10(2), pp. 100-112.
Cox, J. (2013). Tenured teachers & technology integration in the classroom. Contemporary
Issues In Education Research, 6(2), pp. 209-218.
Donna, J. D., & Miller, B. G. (2013, Summer). Using cloud-computing applications to support
collaborative scientific inquiry: Examining pre-service teachers' perceived barriers to
integration. Canadian Journal of Learning and Technology, 39(3), 1-17.
Dunleavy, M., & Heinecke, W. F. (2007). The impact of 1:1 laptop use on middle school math
and science standardized test scores. Computers in the Schools, 24(3/4), 7-22.
Ertmer, P. A. (2005). Teacher pedagogical beliefs: The final frontier in our quest for technology
integration. Educational Technology Research & Development, 53(4), pp. 25-39.
Fullan, M. (2011). Change leader: Learning to do what matters most. San Francisco, CA:
Jossey-Bass.
Gilakjani, A. P. (2013). Factors contributing to teachers’ use of computer technology in the
classroom. Universal Journal of Educational Research, 1(3), 262-267.
Goodwin, B. (2011, February). Research says... One to one laptop programs are no silver bullet.
Educational Leadership, 68(5), 78-79.
Google. (2016). About Classroom. Retrieved from Google:
https://support.google.com/edu/classroom/answer/6020279?hl=en

88
Gorder, L. M. (2008, Spring/Summer). A study of teacher perceptions of instructional
technology integration in the classroom. The Delta Pi Epsilon Journal, L(2), pp. 63-76.
Gulek, J. C., & Demirtas, H. (2005, January). Learning with technology: The impact of laptop
use on student achievement. The Journal of Technology, Learning, and Assessment, 3(2),
1-39.
Hariadi, B., Dewiyani, M., & Sudarmaningtyas, P. (2016, March). Development of web-based
learning application for generation Z. International Journal of Evaluation and Research
in Education, 5(1), pp. 60-68.
Iftakhar, S. (2016, February). Google classroom: What works and how? Journal of Education
and Social Sciences, 3, pp. 12-18.
Ismail, N. (2015). The integration of new media in schools: comparing policy with practice.
International Education Studies, 8(12), pp. 231-240. doi:10.5539/ies.v8n12p231
Kayalar, F. (2016, April). Cross-cultural comparison of teachers’ views upon integration and use
of technology in classroom. The Turkish Online Journal of Educational Technology,
15(2), pp. 11-19.
Keppler, M., Weiler, S. C., & Maas, D. (2014). Focused ubiquity: A purposeful approach to
providing students with laptops. Educational Technology & Society, 17(4), 278-288.
Knowlton, D. S. (2000, Winter). A theoretical framework for the online classroom: A defense
and delineation of student-centered pedagogy. New Directions for Teaching and
Learning, pp. 4-14.
Larkin, K. (2011). You use! I use! We use! Questioning the orthodoxy of 1:1 computing in
primary schools. Journal of Research on Technology in Education, 44(2), 101-120.

89
Lin, Y.-T., & Jou, M. (2013, April). Integrating popular web applications in classroom learning
evironments and its effects on teaching, student learning motivation and perfromance.
The Turkish Online Journal of Educational Technology, 12(2), pp. 157-165.
Liu, C. C., & Chen, I. J. (2010, April). Evolution of constructivism. Contemporary Issues In
Education Research, 3(4), pp. 63-66.
MacKinnon, S. (2002, October-December). Technology Integration in the Classroom: Is there
only one way to make it effective? TechKnowLogia, pp. 57-60.
Osler, J., Hollowell, G., & Nichols, S. (2012). Technology engineering in science education:
Where instructional challenges interface nonconforming prodictivity to increase
retention, enhance transfer, and maximize student learning. i-manager's Journal of
Educational Technology, pp. 31-39.
Ouyang, J. R., & Stanley, N. (2014). Theories and research in educational technology and
distance learning instruction through blackboard. Universal Journal of Educational
Research, 2(2), pp. 161-172. doi:10.13189/ujer.2014.020208
Owen, A., Farsaii, S., Knezek, G., & Christensen, R. (2006, January). Teaching in the one-to-one
classroom: It's not about laptops, it's about empowerment! Learning & Leading with
Technology, 33(4), 12-16.
Penuel, W. R. (2006, Spring). Implementation and effects of one-to-one computing intiatives: A
research synthesis. Journal of Research on Technology in Education, 38(3), 329-348.
Prensky, M. (2013, March). Our brains extended. Educational Leadership, 70(6), 22-27.
Sauers, N. J., & McLeod, S. (2012). What does the research say about scool one-to-one
computing initiatives? Lexington, KY: UCEA Center for the Advanced Study of
Technology Leadership in Education.

90
Schcolnik, M., Kol, S., & Abarbanel, J. (2006). Constructivism in theory and practice. English
Teaching Forum, 4, pp. 12-20.
Sell, R. G., Cornelius-White, J., Chang, C.-W., McLean, A., & Roworth, W. R. (2012). A meta-
synthesis of reserach on 1:1 technology initiatives in K-12 education. Missouri State
University, Institute for School Improvement. Springfield, MO: Ozarks Educational
Research Initiative.
Shapley, K., Sheehan, D., Sturges, K., Caranikas-Walker, F., Huntsberger, B., & Maloney, C.
(2006). Evaluation of the Texas Technology Immersion Pilot. Texas Center for
Educational Research. Retrieved from http://www.setda.org/wp-
content/uploads/2013/12/Texas_Year3FinalReport.pdf
Shin, W. S., Han, I., & Kim, I. (2014). Teachers’ technology use and the change of their
pedagogical beliefs in Korean educational context. International Education Studies, 7(8),
pp. 11-22. doi:10.5539/ies.v7n8p11
Shinsky, E. J., & Stevens, H. A. (2011, December). Teaching in educational leadership using
web 2.0 applications: Perspectives on what works. Journal of Research on Leadership
Education, 6(5), pp. 195-215.
Spires, H. A., Oliver, K., & Corn, J. (2012). The new learning ecology of one-to-one computing
environments: Preparing teachers for shifting dynamics and relationships. Journal of
Digital Learning in Teacher Education, 28(2), 63-72.
Storz, M. G., & Hoffman, A. R. (2013). Examining response to a one-to-one computer initiative:
Student and teacher voices. RMLE Online, 36(6), 1-18.

91
Suwantarathip, O., & Wichadee, S. (2014, April). The effects of collaborative writing activity
using Google Docs on students' writing abilities. The Turkish Online Journal of
Educational Technology, 13(2), 148-156.
Tanner, D. (2012). Using Statistics to Make Educational Decisions. Fresno: Sage Publications.
Tanner, D. (2012). Using Statistics to Make Educational Decisions. Thousand Oaks, CA: SAGE
Publications.
Tsai, H.-C. (2015). A senior teacher’s implementation of technology integration. International
Education Studies, 8(6), pp. 151-161. doi:10.5539/ies.v8n6p151
Vickers, R., Field, J., & Melakoski, C. (2015). Media culture 2020: Collaborative teaching and
blended learning using social media and cloud-based technologies. Contemporary
Educational Technology, 6(1), pp. 62-73.
Weston, M. E., & Bain, A. (2010, January). The end of techno-critique: The naked truth about
1:1 laptop initiatives and educational change. The Journal of Technology, Learning, and
Assessment, 9(6), 1-26.
Wright, V. H., & Wislon, E. K. (2011). Teachers’ use of technology: Lessons learned from the
teacher education program to the classroom. SRATE Journal, 20(2), pp. 48-60.


