
11 Minnesota’s State ParkSystem
SUMMARY
Minnesota has an extensive state park system that provides citizenswith recreational and educational opportunities and strives to protectand preserve natural and cultural resources. Park visitors have beenconsistently satisfied with their experiences in state parks. While parkattendance increased in the 1990s, it did not increase as fast as parkoperating expenditures or revenues from park operations. Revenuesfrom park users represent about one-third of the Parks andRecreation Division’s budget.
Itasca State Park was established in 1891, making it one of the first state parksin the nation. Over the past 108 years, Minnesota’s state park system has
grown to encompass 79 state parks, recreation areas, waysides, and trails. Stateparks contain some of Minnesota’s most valued natural and cultural resources,including the headwaters of the Mississippi River, native prairies, stands of oldgrowth pine, and habitat for rare plant and animal species. The Parks andRecreation Division of the Department of Natural Resources (DNR) is responsiblefor planning, developing, operating, and maintaining Minnesota’s state parksystem.
In this chapter we review the history of Minnesota’s state park system and statelaws governing its operation. This chapter also addresses the following questions:
• Who are park users? Are they satisfied with state parks? Whatfacilities and experiences are important to park visitors?
• How is the Parks and Recreation Division organized?
• How have the division’s expenditures and staffing changed over time?
• How does Minnesota’s state park system compare with those inneighboring states?
To answer these questions, we reviewed state statutes and laws, previous reportsand studies, and DNR surveys of park users. We also analyzed financial data andbudget documents, interviewed division staff, and conducted telephone interviewswith representatives of state park management agencies in neighboring states.
The Parks andRecreationDivision ofDNR managesthe stateparks.

HISTORY
The history of state parks in Minnesota began in 1885 when the Legislatureauthorized creation of a state park at Minnehaha Falls.1 The Legislature did notprovide any financing, however, and eventually the City of Minneapolis acquiredthe land and established a local park. In 1891, as noted, the Legislatureestablished Itasca State Park as the first Minnesota state park. (Table 1.1 listsstate parks and recreation areas by the year they were established.) It was not
4 STATE PARK MANAGEMENT
Table 1.1: History of Minnesota’s State Park System
1Although established formally in 1937, these parks were developed as early as 1933.
2Although established formally in later years, Cascade River, Temperance River, and Lac Qui Parle were all developed in the 1930s.
3Forestville and Lake Maria were first established in 1949 and 1947, respectively. No land was acquired, however, and they werereestablished in 1963. Mystery Cave was added to Forestville in 1987.
SOURCES: Roy W. Meyer, Everyone’s Country Estate: A History of Minnesota’s State Parks (St. Paul: Minnesota Historical SocietyPress, 1991), xvii-xviii, 297-298; and Parks and Recreation Division of the Minnesota Department of Natural Resources.
YearEstablished Park Name
1891 Itasca1895 Interstate1905 Minneopa1911 Fort Ridgely1915 Jay Cooke1919 Sibley, Whitewater1921 Scenic1923 Lake Bemidji1925 Department of Conservation
established1931 Charles A. Lindbergh1935 Camden1935 Division of State Parks established19371 Beaver Creek Valley, Blue Mounds,
Buffalo River, Flandrau,Goosesberry Falls, Lake Bronson,Lake Carlos, Lake Shetek, MonsonLake, Old Mill, Split Rock Creek
1941 Father Hennepin1943 St. Croix, St. Croix Island Recreation
Area1945 Kilen Woods, McCarthy Beach,
Nerstrand-Big Woods1947 Myre-Big Island, William O’Brien1949 Carley1955 George Crosby Manitou
YearEstablished Park Name
1957 Cascade River,2 Frontenac, Judge C.R. Magney, Mille Lacs Kathio,Temperance River2
1959 Crow Wing, Lac Qui Parle,2
Schoolcraft, Zippel Bay1961 Bear Head Lake, Big Stone Lake,
Fort Snelling, Savanna Portage1963 Banning, Forestville,3 Glacial Lakes,
Lake Louise, Lake Maria,3
Maplewood, Great River Bluffs, RiceLake, Sakatah Lake, SoudanUnderground Mine, Upper SiouxAgency
1967 Franz Jevne, Hayes Lake, Split RockLighthouse
1969 Afton, Minnesota Valley Trail1969 Department of Natural Resources
established1971 Moose Lake1973 Wild River1979 Tettegouche1989 Hill Annex Mine, Grand Portage1991 Glendalough1993 Cuyuna Country Recreation Area1994 Minnesota Valley Recreation Area1995 John Latsch1998 Garden Island Recreation Area
1 For a complete history of Minnesota state parks see: Roy W. Meyer, Everyone’s Country Es-tate: A History of Minnesota’s State Parks (St. Paul: Minnesota Historical Society Press, 1991).

until 1925 that legislation established the Department of Conservation, thepredecessor of the Department of Natural Resources, placing management of stateparks under its jurisdiction. In 1935, legislation established the Division of StateParks and defined the duties of the director of parks to include acquiring andmanaging park lands and operating park facilities.
Eleven new state parks were added to the state park system in 1937, manydeveloped with assistance from federal work relief agencies such as the CivilianConservation Corps and the Works Progress Administration. A period of slowergrowth followed in the 1940s and early 1950s, during and after World War II.The 1960s was a decade of major change with new state parks established in1961, 1963, 1967, and 1969. The Federal Land and Water Conservation Fund Actof 1965 provided a source of financing for park land purchases.2 During thisperiod, many existing state parks were expanded, eight state parks weretransferred to cities or counties to be managed as local parks, and one waysidewas transferred to the Minnesota Historical Society. Since the 1960s, expansionof Minnesota’s state park system has slowed; legislation authorized three parks inthe 1970s, two in the 1980s, and one park and three recreations areas in the 1990s.In addition, John Latsch Wayside was reclassified as a state park in 1995.
STATE LAWS GOVERNING STATE PARKMANAGEMENT
For the most part, two chapters of Minnesota Statutes govern the creation andmanagement of the state park system: Chapter 85 and Chapter 86A, also calledthe Outdoor Recreation Act of 1975. Only the Legislature can create, expand, orchange the boundaries of state parks, recreation areas, and waysides.3 Chapter 85lists state parks and other areas established in state law. It also governs state parkpermits and fees, special uses of state parks, food and beverage service in certainstate parks, special leases, special revolving fund accounts, and other aspects ofstate park management. In addition, the Commissioner of DNR has promulgatedrules that regulate recreational use, personal behavior, and unlawful activities instate parks.4 It is the responsibility of park managers and other authorizedemployees to enforce park rules.
The Outdoor Recreation Act of 1975 identifies state parks and recreation areas asunits of Minnesota’s outdoor recreation system and designates DNR as themanaging agency for these units.5 The act describes the purposes of state parks,
MINNESOTA’S STATE PARK SYSTEM 5
Only theLegislaturecan create orexpand stateparks.
2 This act requires that land purchased with these funds remain available for recreational use, but itdoes not specify whether the recreational use needs to be state, regionally, or locally operated.
3 Minn. Stat. §§85.01-85.013, and 86A.07. To create a new state park or recreation area or changethe boundaries of an existing area, the Legislature must enact a law describing the area and authoriz-ing land acquisition.
4 See Minn. Stat. §84.03 for rule-making authority; and Minn. Rules (1999), ch. 6100.0100 to6100.2400.
5 Minn. Stat. §86A. Other units in Minnesota’s outdoor recreation system are state trails; scien-tific and natural areas; wilderness areas; forests; wildlife management areas; water access sites; wild,scenic, and recreational rivers; historic sites; rest areas; and aquatic management areas.
criteria for new parks, and how parks should be managed. According to the act,the purposes of state parks are:
. . . to protect and perpetuate extensive areas of the state possessingthose resources which illustrate and exemplify Minnesota’s natural phe-nomena and to provide for the use, enjoyment, and understanding of suchresources without impairment for the enjoyment and recreation of futuregenerations.6
The act also says that a new state park should not be established “unless itsproposed location substantially satisfied the following criteria:”
1. Exemplifies the natural characteristics of the major landscape regions of the state,as shown by accepted classifications, in an essentially unspoiled or restoredcondition or in a condition that will permit restoration in the foreseeable future; orcontains essentially unspoiled natural resources of sufficient extent andimportance to meaningfully contribute to the broad illustration of the state’snatural phenomena; and
2. Contains natural resources, sufficiently diverse and interesting to attract peoplefrom throughout the state; and
3. Is sufficiently large to permit protection of the plant and animal life and othernatural resources which give the park its qualities and provide for a broad range ofopportunities for human enjoyment of these qualities.7
The act directs DNR to manage state parks:
. . . to preserve and perpetuate, and interpret natural features that existedin the area of the park prior to settlement and other significant natural,scenic, scientific, or historical features that are present. . . . to maintain abalance among the plant and animal life of the park and to reestablish de-sirable plants and animals that were formerly indigenous to the park areabut are now missing. Programs to interpret the natural features of thepark shall be provided. . . . Park use shall be primarily for aesthetic, cul-tural, and educational purposes, and shall not be designed to accommo-date all forms or unlimited volumes of recreational use. . . .8
According to the act, state recreation areas should contain natural or artificialresources that provide a broad selection of outdoor recreation opportunities in anatural setting that may be used by large numbers of people.9
The Outdoor Recreation Act requires DNR to prepare a master plan for theadministration of state parks, recreation areas, and waysides before constructionof new facilities or other development of an authorized unit begins.10 The law alsoprovides for the general public’s review and participation in the process ofpreparing park management plans.
6 STATE PARK MANAGEMENT
The OutdoorRecreationAct describesthe purposesof stateparks.
6 Minn. Stat. §86A.05, subd. 2 (a).
7 Minn. Stat. §86A.05, subd. 2 (b).
8 Minn. Stat. §86A.05, subd. 2 (c).
9 Minn. Stat. §86A.05, subd. 3.
10 Minn. Stat. §86A.09, subd. 1.

Minnesota state parks vary in size, facilities, and quality of natural resources.Historical documents indicate that as early as 1939 there were discussions aboutthe quality of land suitable for designation as a state park.11 In 1984, theLegislature amended the Outdoor Recreation Act and “grandfathered” intoMinnesota’s outdoor recreation system state parks that were in existence onJanuary 1, 1984, but did not meet the resource or site criteria in the act.12
MINNESOTA’S CURRENT STATE PARKSYSTEM
Minnesota’s state park system, consisting of 66 state parks, 4 recreation areas, 8waysides, and 1 trail, encompassed over 247,000 acres of land or less than 1percent of the state’s total land area in 1999. Ninety-five percent of the land wasin state parks, which ranged in size from 118 acres at Franz Jevne to nearly34,000 acres at St. Croix, with an average size of 3,572 acres. Half of the stateparks were less than 1,900 acres in size and nine parks were smaller than 500acres in size. Figure 1.1 shows the location of each unit in Minnesota’s state parksystem, along with six DNR geographic regions and regional offices.
Of the four state recreation areas, Islands of the St. Croix Recreation Area islocated in the St. Croix River and is not actively managed, and Garden Island andCuyuna Country are under development. The Minnesota Valley Recreation Areaincludes the Minnesota Valley Trail, which extends from Fort Snelling along theMinnesota River. The eight waysides were set aside for their unique natural orhistorical values. These waysides are smaller than most state parks, ranging insize from 1 to 240 acres, with an average size of 77 acres.
Minnesota’s state parks contain 4,378 campsites, 68 group camps, 1,255 miles oftrail, 332 miles of road, 135 water access sites, over 90 picnic areas with over6,300 picnic sites, 33 fishing piers, over 1,400 buildings including 25 visitorcenters and 595 buildings on the National Register of Historic Places, and 62historic districts or landmarks.13 State parks are open year-round, seven days aweek, 365 days a year, although many parks with modern sanitation facilities turnoff the water and close those buildings in the late fall through early spring.Appendix A summarizes the overnight facilities, trails, and recreation and visitorservices provided in the state parks.
Many of Minnesota’s state parks contain significant natural resources includingprairies, rivers, waterfalls, stands of old growth pine, blufflands, habitat for rareand endangered flora and fauna, and countless lakes. There are also historic andprehistoric sites and structures, and sacred American Indian sites within the statepark system.
MINNESOTA’S STATE PARK SYSTEM 7
In 1999,Minnesotastate parkscovered247,000acres ofland.
11 Meyer, Everyone’s County Estate, 144-145; and Department of Natural Resources and StatePlanning Agency, Minnesota Resource Potentials in State Outdoor Recreation: Project 80 (St. Paul,1971).
12 Minn. Stat. §86A.05, subd. 13.
13 Minnesota state park web site, http://www.dnr.state.mn.us/parks_and_recreation/state_parks/;and Minnesota Department of Natural Resources, A Guide to Minnesota State Parks, 1999-2000.

8 STATE PARK MANAGEMENT
Figure 1.1: Minnesota State Park System, 1999
SOURCE: Parks and Recreation Division, Minnesota Department of Natural Resources.

State Park AttendanceAll state parks attract day users and most offer overnight camping.14 State parkattendance data show that:
• Total visits to Minnesota state parks rose 10 percent between 1990 and1998.
According to DNR estimates, there were about 8.6 million total visits to stateparks in 1998, of which about 914,000 (11 percent) were overnight visits.15 Thiscompares with an estimated 7.8 million total visits and 855,000 overnight visits in1990, reflecting a 10 percent increase in total visits and a 7 percent increase inovernight visits between 1990 and 1998. Figure 1.2 shows total visits to stateparks by DNR region from 1990 to 1998. The 1993 decrease in visits was likelycaused by flooding at several state parks. During the past nine years, over 25percent of all visits were to Region 2 (Northeast) parks, while the other regionseach accounted for between 10 and 16 percent of the remaining visits.
The division estimates the number of total visits to state parks using acombination of car counters, visual checks, and other procedures. Electronicdevices count each car entering a park each day and park staff multiply the count
MINNESOTA’S STATE PARK SYSTEM 9
0
1
2
3
4
5
6
7
8
9
10
1990 1991 1992 1993 1994 1995 1996 1997 1998
Figure 1.2: State Park Attendance by Region,1990-98
SOURCE: Parks and Recreation Division, Minnesota Department of Natural Resources, State ParkAttendance Data, 1990-1998, unpublished.
Millions of Visits
Region 6 (Metropolitan Area)
Region 5 (Southeast)
Region 4 (Southwest)
Region 3 (North Central)
Region 2 (Northeast)
Region 1 (Northwest)
Parks inNortheastMinnesotaaccounted forone-quarter ofall visits tostate parks inthe 1990s.
14 Fort Snelling, Grand Portage, Hill Annex Mine, and Soudan Underground Mine do not offerovernight camping or lodging, and Cuyuna Country Recreation Area is being developed.
15 The number of visits to state parks reflects the number of people entering the park system eachday. When people leave the park and return another day, they are counted again.

by 3.2, the average number of occupants per car. For instance, a family of fivepicnicking in a park for one day would be counted as 3.2 visits and a single hikerdriving into a park would also be counted as 3.2 visits. Because many parks havemultiple entrances or major roads going through them, staff make adjustments todaily car counts to factor out local traffic and park vehicles. Estimates of parkvisits can be further complicated by people entering a park on bike or snowmobiletrails; in some parks, these visitors must be visually counted. In contrast, parkstaff use camping or lodging registration cards to obtain the actual number ofovernight visits. For instance, a party of three camping for two nights is countedas six overnight visits. We determined that:
• Data on overnight visits to state parks are more reliable than data ontotal visits.
Park staff told us that the number of total visits is an estimate and is useful foridentifying trends, but it is not as accurate or reliable as the audited number ofovernight visits. Park staff use overnight visit and revenue data as the basis formost park management decisions. However, DNR frequently uses data on totalvisits to state parks when making legislative presentations.
We examined state park daily visit counts for 1998 and found that:
• The numbers of total and overnight visits varied widely by season, dayof the week, and park in 1998.
In 1998, 62 percent of total visits occurred during the summer season (MemorialDay through Labor Day) and 60 percent of total visits occurred on Friday,Saturday, and Sunday. Fall is the second most popular season, capturing 15percent of total visits. Overnight visits were even more concentrated than totalvisits: 81 percent of overnight visits occurred during the summer season and 59percent of overnight visits occurred on weekends (Friday and Saturday).
10 STATE PARK MANAGEMENT
Most overnight visits to Minnesota state parks occurred during the summer.

During 1998, total visits per park ranged from a high of about 700,000 at FortSnelling to fewer than 8,000 at Schoolcraft. Overnight visits ranged from a highof about 101,000 at Itasca to fewer than 1,000 at Monson Lake. Table 1.2 showsthat when ranked by number of visits, the top six parks accounted for one-third ofall visits in 1998. In contrast, the lowest ranking six parks accounted forapproximately 1 percent of all visits.
State Park VisitorsThe demographic profile of campers and day users in Minnesota’s state parks hasbeen fairly stable since 1987. DNR surveys show that:
• In 1998, the majority of park users were white, well-educated, with atleast moderate incomes, and lived in Minnesota.
In 1998, 97 percent of park users were white, two-thirds had household incomesof $40,000 or more, and more than half were college graduates.16 Generally, park
MINNESOTA’S STATE PARK SYSTEM 11
Table 1.2: Total and Overnight Visits at the Top Six and Bottom SixState Parks, 1998
Total Visits1 Overnight Visits2
Percentage PercentageRank Park Number of Total Rank Park Number of Total
1 Fort Snelling 700,076 8.1% 1 Itasca 101,129 11.1%2 Gooseberry Falls 580,361 6.7 2 St. Croix 56,833 6.23 Itasca 506,340 5.9 3 Whitewater 40,401 4.44 Interstate 377,562 4.4 4 Lake Carlos 37,323 4.15 Whitewater 366,688 4.3 5 Sibley 36,952 4.06 Sibley 325,898 3.8 6 William O’Brien 35,123 3.8
61 Kilen Woods 14,895 0.2 56 Kilen Woods 2,178 0.262 John Latsch 14,526 0.2 57 George Crosby Manitou 1,959 0.263 George Crosby Manitou 14,376 0.2 58 Old Mill 1,825 0.264 Hill Annex Mine 9,537 0.1 59 Schoolcraft 1,680 0.265 Monson Lake 9,370 0.1 60 Carley 1,636 0.266 Schoolcraft 7,551 0.1 61 Monson Lake 949 0.1
1Data on total visits were not reported for Franz Jevne State Park or Cuyuna County Recreation Area.
2Fort Snelling, Grand Portage, Hill Annex Mine, and Soudan Underground Mine state parks do not have camping or lodging. CuyunaCounty Recreation Area is being developed. Overnight visit data were not reported for John Latsch or Franz Jevne state parks.
SOURCE: Parks and Recreation Division, Minnesota Department of Natural Resources, State Park Attendance Data, 1998,unpublished.
16 We examined DNR’s surveys of park users conducted in 1987, 1994, 1996, and 1998 to gatherinformation on park user characteristics, expectations, and satisfaction with state parks. The surveyswere designed to allow comparisons between campers and day users but included too few respon-dents to make comparisons among individual parks. Although each survey had a slightly differentfocus, they shared some common questions. DNR’s survey methodology was reasonable, with theexception of the 1994 survey which had methodological flaws (such as a low response rate andoverrepresentation of campers) that limit its usefulness as a measure of park user attitudes and satis-faction. If data from the 1994 survey are presented carefully they may have some value in reflectingcamper opinions.

users were more highly educated, somewhat more affluent, and more white thanMinnesota’s general population.17 Approximately 80 percent of park visitors werefrom Minnesota. Campers as a percentage of total park visitors decreased fromabout 18 percent in 1987 to about 13 percent in 1997.18 A 1998 Minnesota Officeof Tourism survey of travelers showed that “scenic touring,” “visitingstate/national parks,” and “camping” were the top three spring and summer travelactivities for Minnesota residents, while “visiting state/national parks” rankedfifth for non-Minnesotans.19
DNR surveys also show that:
• For park users, the most important park features were clean facilitiesand grounds, a natural setting, and well-protected natural resources.
Table 1.3 summarizes park user rankings of the most important park features.Over 70 percent of the day users and campers surveyed in 1998 identifiedcleanliness of grounds and facilities, a natural setting for the park, well-protectednatural resources, and beauty of the park as “very important” features.20 Campersalso ranked the quality of the campground as important. In contrast, relativelyfew day users and campers ranked visitor centers, interpretive services, andexhibits as “very important” to their enjoyment of a state park. When asked whatfeatures, facilities, and services should be in a state park, over 90 percent of parkusers selected hiking trails, clean waterways, and native plants and animals.Smaller percentages of survey respondents selected visitor/trail centers (79 to 86percent), naturalist programs (65 to 73 percent), and interpretive displays (63 to72 percent).
When asked about activities and benefits attained from state park visits, campersreported participating in more activities than day users. Table 1.4 shows thathiking, sightseeing, and observing nature were the most popular activities for bothgroups in 1998. The most important experiences and benefits attained fromvisiting state parks included enjoying natural scenery and the smells and sounds ofnature, getting away from life’s usual demands, and spending leisure time withfamily.21
Responses to survey questions about park users’ satisfaction with their visits tostate parks shows that:
• Consistently since 1987, park visitors have expressed high satisfactionwith Minnesota’s state parks and had few complaints about parkfacilities or staff.
12 STATE PARK MANAGEMENT
Most parkusers want toexperiencenature as partof their visit toa state park.
17 U.S. Census Bureau web site, http://www.census.gov/population/estimates/state/
18 The 13 percent reflect DNR data from August 1997.
19 Minnesota Office of Tourism, Department of Trade and Economic Development, “1998Spring-Summer Seasonal Survey,” Travel Partners (St. Paul, July 1999), 4.
20 Park users surveyed in 1987 identified “beauty of the park,” “cleanliness of restrooms,” and“trails to walk and hike” as the most important items contributing to their enjoyment of the park.Different wording of the question and different options, however, limit direct comparisons with theresponses to the 1998 survey.
21 Responses to the 1987 survey were similar, although the question and options were wordeddifferently.

Table 1.5 shows that park users’ satisfaction with state parks has been consistentlyhigh. Since 1987, more than two-thirds of both day users and campers respondedthat their visits to state parks “exceeded expectations” or that they were“completely satisfied” with their visits. Satisfaction levels increase to over 90percent when “mostly satisfied” responses are included. Relatively smallpercentages of respondents indicated that their experience “could have beenbetter” or that they were “dissatisfied.”
When asked to identify factors that detracted from their enjoyment of state parksin 1998, campers and day users differed in their responses. Two-thirds of dayusers said nothing detracted from their enjoyment, compared with 48 percent ofcampers. Campers were more likely than day users to identify problems withpets, bathroom odors, noise, and crowding (see Table 1.6). Few park usersidentified “conflicts with staff” as a distraction from their enjoyment of the park.
The division does not have a centralized system for logging complaints from parkusers; therefore, we were unable to comprehensively assess the number or natureof complaints. Instead, we examined park-related letters sent to the state parks
MINNESOTA’S STATE PARK SYSTEM 13
Table 1.3: Park Features Valued by Park Users, 1998
Percentage RatingEach Option As
Survey Question “Very Important”“How important were each of the following to Dayyour enjoyment of this state park on this visit?” Users Campers
Cleanliness of grounds and facilities 82% 86%A natural setting for the park 81 78Well-protected natural resources 79 74Beauty of the park 79 72Lakes and rivers in the park 67 58Trails 66 56Lack of disturbances by other users 54 66Informational brochure/maps provided 54 44Security provided by park staff 47 52Helpfulness of park staff 47 43Good facilities in the picnic grounds 38 30Quality of the campground 34 73Water recreation opportunities (fishing, boating,
swimming, etc.) 32 44Availability of park staff 31 22Safe places to swim 30 42High-quality facilities in campground 26 48Visitor center 26 12Campground near lake or river 23 52Proper appearance of park staff 23 23Secluded campsites 22 66Historical/archeological sites to see 21 13Interpretive program 18 9Exhibits to see 16 6Variety of daytime activities 10 12
NOTE: Data are ranked by day-user responses.
SOURCE: Office of Planning, Minnesota Department of Natural Resources, 1998 Minnesota StatePark Summer Visitor Survey (St. Paul, 1998).
Park usershave beenconsistentlysatisfied withtheir visits tostate parks.

director between July 1998 and June 1999 and to the DNR Commissionerbetween January 1998 and June 1999. Eight of the 49 letters examined involvedcomplaints about the campground reservation system, park rules, overcrowdedcamping areas and too few bathrooms, lack of deer feeding plots, and poor qualitytrail maps; 6 letters praised park staff or the appearance of a state park; and theremainder requested information or expressed support for park proposals orprojects. The division may want to consider whether a more systematic way oflogging and tracking complaints from park users would help the staff identify andresolve problems in the state parks.
14 STATE PARK MANAGEMENT
Table 1.4: Participation in Park Activities, 1998Percentage Selecting
Survey Question Specific Activity“Which of the following activities did you Dayparticipate in while visiting this park on this trip?" Users Campers
Hiking 57% 77%Sightseeing 44 50Nature observation 40 58Picnicking 36 32Looking at visitor center exhibits 35 34A self-guided nature walk 22 30Swimming 18 44Visiting historic sites 14 24Did nothing/relaxed 14 32Bird watching 13 32Boating/canoeing 10 23Bicycling 5 27Fishing 5 27A naturalist-led program 3 12
NOTE: The questionnaire included a list of 17 options. Data are ranked by day-user responses.
SOURCE: Office of Planning, Minnesota Department of Natural Resources, 1998 Minnesota StatePark Summer Visitor Survey (St. Paul, 1998).
Table 1.5: Park User Satisfaction, 1987, 1996, and 1998
Survey Question 1987 1996 1998“Which statement most closely Day Day Dayreflects your feelings about this visit?"1 Users Campers Users Campers Users Campers
Exceeded expectations; it was agreat experience 14% 21% 21% 23% 15% 19%
Completely satisfied 58 48 52 51 54 51Mostly satisfied 22 24 23 21 26 25OK—could have been better 5 6 2 4 4 5Dissatisfied2 1 1 2 1 1 <1
1There were minor wording differences on the three questionnaires.
2“Dissatisfied” represents a combination of “somewhat,” “very” and “most dissatisfied.”
SOURCES: Office of Planning, Minnesota Department of Natural Resources, 1987 Summer User Survey of Minnesota State ParkVisitors (St. Paul, 1987), Fee Strategy Survey of State Park Visitors (St. Paul, 1996), and 1998 Minnesota State Park Summer VisitorSurvey (St. Paul, 1998).

In addition to DNR’s park user satisfaction data, staff in nearly all parks solicitcomments from park visitors using customer comment cards, camper registrationcards, and oral communications. Written comments from park users are notroutinely summarized or sent to the central office. Park managers told us thatvisitor comments about problems like broken faucets, trees down over trails, orsimilar issues are addressed as soon as possible.
ORGANIZATION, STAFFING, ANDEXPENDITURES
The Parks and Recreation Division relied on about 235 permanent full-time staffand 550 seasonal employees to operate state parks in 1999. About three-fourthsof permanent staff and nearly all seasonal staff worked in state parks or recreationareas. Other staff worked out of the central office in St. Paul or one of sixregional offices. Figure 1.3 shows the division’s organizational structure.
Staff in the St. Paul central office provide leadership, program direction,coordination, budget administration, and general management for the state parksystem.22 The responsibilities of the five administrative management areas aresummarized in Figure 1.3. In 1999, 32 full-time staff worked in the centraloffice.
Each of the six regional offices employ between four and eight full-time staff,generally consisting of a regional parks manager, a regional park operationsspecialist, a regional resource specialist, a regional naturalist, and a clerk.
MINNESOTA’S STATE PARK SYSTEM 15
Table 1.6: Selected Factors Detracting from ParkUser Enjoyment of State Parks, 1998
Percentage SelectingSurvey Question Specific Activity“Which of the following detracted from your Dayenjoyment of this park during this visit?" Users Campers
Too crowded 6% 9%Problems with other people’s pets 5 12Unpleasant odors from dumpsters 4 4Too noisy 3 9Unpleasant odors from restrooms 3 11Unfriendly, discourteous behavior by others 2 7Conflicts with staff 0 1
NOTE: The questionnaire included a list of 20 options. Data are ranked by day-user responses.
SOURCE: Office of Planning, Minnesota Department of Natural Resources, 1998 Minnesota StatePark Summer Visitor Survey (St. Paul, 1998).
Aboutthree-fourthsof the parksdivision staffwork in theparks.
22 Parks and Recreation Division, Minnesota Department of Natural Resources, 1992-93 Job Clas-sification Study (St. Paul, 1993), Director’s Overview, 7.

Regional park managers oversee park operations and are responsible for overallpolicy direction. They also serve as a link between the field and central office,providing a field perspective to the division’s decision-making processes.Regional park operations specialists directly supervise the park managers andoversee administrative and operational activities in a region’s parks. Regionalresource specialists direct and coordinate resource management activities in theparks. Regional naturalists provide program direction and assist with interpretiveservices in parks.
Over the past several years, the division has been evaluating the structure of itsregional offices. As a result, the division is currently consolidating the parkoffices in Regions 5 (Southeast) and 6 (Metropolitan Area) through attrition.Consequently, Region 6 does not have a full-time regional park operationsspecialist. Instead, the regional manager supervises parks in Region 6, with somehelp (about 20 percent time) from the regional park operations specialist inRegion 5. Similarly, in the past year, one regional naturalist has been workingwith parks in both Regions 5 and 6.
16 STATE PARK MANAGEMENT
Figure 1.3: Organization of the Parks and Recreation Division
Director
Developmentand
AcquisitionOperations
Public Affairsand
MarketingAdministration
Planning andManagement
Information Systems
• Development
• Real estatemanagement
• Archaeological/cultural resourcesreviews
• Design andgraphics
• Statewidepark operations
• Resourcemanagement
• Interpretiveservices
• Public relationsandcommunications
• Park Partners
• Marketing
• Merchandise
• Personnel andlabor relations
• Budget andfinancialmanagement
• Continuingeducation andtraining
• Strategic, unit,and specialplanning
• Park policies
• Management andgeographicinformation systems
• Environmentalreview process
Region 1Bemidji
(Northwest)
Region 2Grand Rapids
(Northeast)
Region 3Brainerd
(North Central)
Region 4New Ulm
(Southwest)
Region 5Rochester
(Southeast)
Region 6St. Paul
(Metropolitan Area)
11 parks 16 parks 11 parks 13 parks 12 parks 3 parks2 recreation areas 5 waysides 1 wayside 2 recreation areas2 waysides 1 trail
SOURCE: Parks and Recreation Division, Minnesota Department of Natural Resources.

Of the 79 units in Minnesota’s state park system, 66 state parks and 2 recreationareas are managed by professional staff.23 Park managers are responsible formanaging individual parks and are accountable for all day-to-day park operationsand programs. Park managers and assistant managers share responsibility forsupervising full-time and seasonal staff. The number of permanent staff assignedto a state park or recreation area varies depending on the size, complexity, and useof the unit (see Figure 1.4). Nearly two-thirds of the parks and recreation areas
are assigned two ormore permanentstaff. Eight parks(12 percent) haveno permanent staffand are managed assatellites of largernearby parks.
In addition to itscomplement offull-time staff, thedivision relies onabout 180full-time-equivalentseasonal positionsto operate parks.These positions are
either part-time union represented staff or participants in work training programs.Common positions filled by seasonal employees are buildings and groundsworker, parks worker, and clerk. Issues related to seasonal staffing are discussedfurther in Chapter 2.
Changes in StaffingThe division experienced modest growth in permanent personnel between 1992and 1999. We found that:
• Permanent personnel in the Parks and Recreation Division increased11 percent, from 211 to 235 positions, between 1992 and 1999.
Table 1.7 shows that staff in regional parks offices increased the most between1992 and 1999 (9.5 positions were added for an increase of 38 percent). Severalfactors explain this increase. First, clerical staff previously funded through DNRregional administration were shifted to the division’s budget in 1993. Second, thedivision added several regional resource management staff who work in multipleparks. Permanent positions in state parks, which accounted for 72 to 74 percent ofall positions, increased about 8 percent (or nearly 13 positions) between 1992 and1999.
MINNESOTA’S STATE PARK SYSTEM 17
0
5
1 0
1 5
2 0
2 5
3 0
Figure 1.4: Permanent Staff in MinnesotaState Parks, 1999
8
2321
Number of Parks
These parks are managed as satellites of larger nearby parks. Two of these parks,Big Stone Lake and Monson Lake, have seasonal park managers.
SOURCE: Office of the Legislative Auditor’s summary of Parks and RecreationDivision Personnel Data, 1999, unpublished.
1
Permanent Staff
16
None1 One Two More Than Two
Nearlytwo-thirds ofall parks havetwo or morepermanentstaff.
23 Waysides and Islands of the St. Croix Recreation Area are not staffed and Garden Island Recre-ation Area is under development.
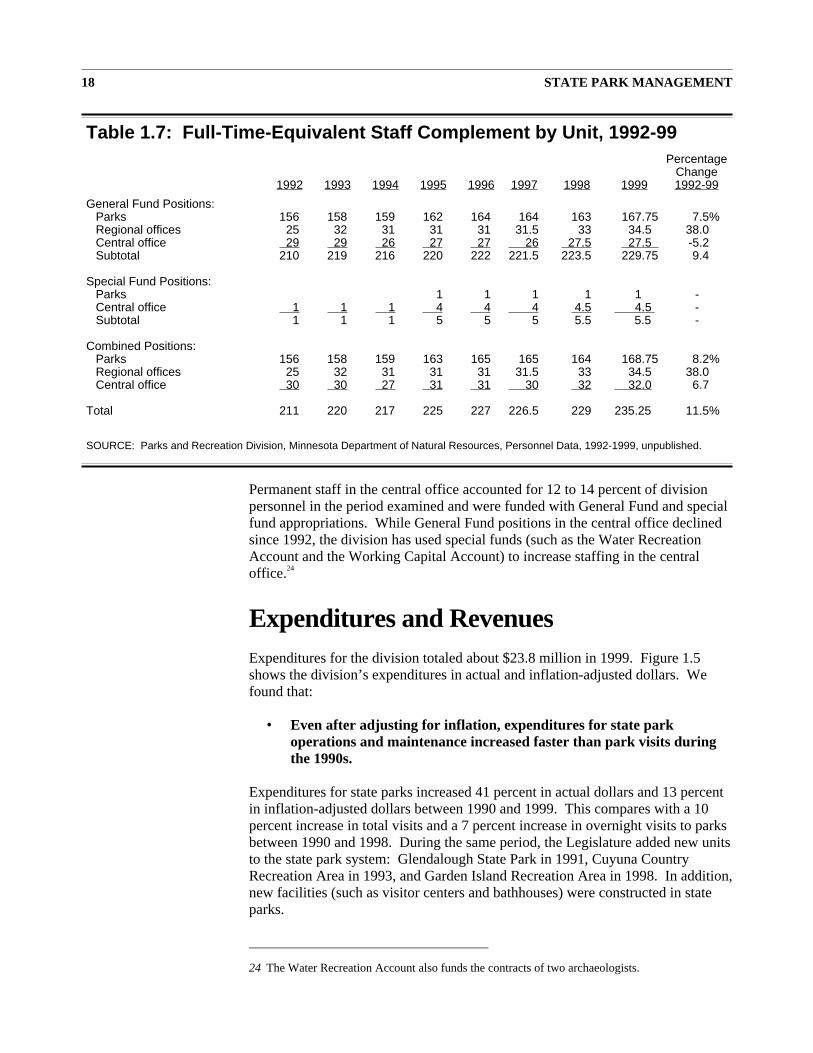
Permanent staff in the central office accounted for 12 to 14 percent of divisionpersonnel in the period examined and were funded with General Fund and specialfund appropriations. While General Fund positions in the central office declinedsince 1992, the division has used special funds (such as the Water RecreationAccount and the Working Capital Account) to increase staffing in the centraloffice.24
Expenditures and RevenuesExpenditures for the division totaled about $23.8 million in 1999. Figure 1.5shows the division’s expenditures in actual and inflation-adjusted dollars. Wefound that:
• Even after adjusting for inflation, expenditures for state parkoperations and maintenance increased faster than park visits duringthe 1990s.
Expenditures for state parks increased 41 percent in actual dollars and 13 percentin inflation-adjusted dollars between 1990 and 1999. This compares with a 10percent increase in total visits and a 7 percent increase in overnight visits to parksbetween 1990 and 1998. During the same period, the Legislature added new unitsto the state park system: Glendalough State Park in 1991, Cuyuna CountryRecreation Area in 1993, and Garden Island Recreation Area in 1998. In addition,new facilities (such as visitor centers and bathhouses) were constructed in stateparks.
18 STATE PARK MANAGEMENT
Table 1.7: Full-Time-Equivalent Staff Complement by Unit, 1992-99Percentage
Change1992 1993 1994 1995 1996 1997 1998 1999 1992-99
General Fund Positions:Parks 156 158 159 162 164 164 163 167.75 7.5%Regional offices 25 32 31 31 31 31.5 33 34.5 38.0Central office 29 29 26 27 27 26 27.5 27.5 -5.2Subtotal 210 219 216 220 222 221.5 223.5 229.75 9.4
Special Fund Positions:Parks 1 1 1 1 1 -Central office 1 1 1 4 4 4 4.5 4.5 -Subtotal 1 1 1 5 5 5 5.5 5.5 -
Combined Positions:Parks 156 158 159 163 165 165 164 168.75 8.2%Regional offices 25 32 31 31 31 31.5 33 34.5 38.0Central office 30 30 27 31 31 30 32 32.0 6.7
Total 211 220 217 225 227 226.5 229 235.25 11.5%
SOURCE: Parks and Recreation Division, Minnesota Department of Natural Resources, Personnel Data, 1992-1999, unpublished.
24 The Water Recreation Account also funds the contracts of two archaeologists.

Figure 1.6 showsthat the cost ofoperating individualparks representednearly 80 percent ofthe division’s totalexpenditures in1999—73 percentin direct costs and 6percent for the costsof unemployment,workerscompensation, andother park expensespaid out of thecentral office.Salaries andbenefits for full-and part-time staff represented over 73 percent of total expenditures, thedivision’s largest expenditure category in 1999.25
Comparing these expenditures with revenues shows that:
• Revenues generated from park operations represented between 30 and33 percent of Parks and Recreation Division expenditures in the 1990s.
General Fund revenues from state park operations totaled $7.4 million in 1999, or31 percent of expenditures; appropriations from the state General Fund financedthe remainder of the division’s expenditures. Between 1990 and 1999, parkrevenues increased 41 percent in actual dollars and 13 percent ininflation-adjusted dollars.
State park operations generate revenues from the sale of park permits, camping,and other sources. In 1998, annual and daily permits combined generated 41percent (or nearly $3 million) of park General Fund revenues, with annual permitsaccounting for two-thirds of all permit revenues. Camping fees generated 38percent ($2.8 million) of all revenues. Concession fees, sales taxes collected, andother fees accounted for the remaining 21 percent of park revenues. We alsofound that:
• Between 1990 and 1998, the sales of annual park permits increasedslightly, while sales of daily park permits declined.
In 1998, the division sold 107,785 annual permits and 271,118 daily permits.Sales of both annual and daily permits fluctuated during the 1990s. For example,sales declined in 1992 and 1993, likely due to increased fees in 1992 and floodingin 1993. The sale of annual permits increased 3 percent and the sale of dailypermits declined 4.5 percent between 1990 and 1998.
MINNESOTA’S STATE PARK SYSTEM 19
$0
$5
$10
$15
$20
$25
$30
1990 1991 1992 1993 1994 1995 1996 1997 1998 1999
Figure 1.5: Parks and Recreation DivisionExpenditures, 1990-99
NOTE: Actual dollars were adjusted for inflation (to 1999 dollars) using the nationalprice deflator for state and local government expenditures and gross investment.
SOURCE: Minnesota Department of Natural Resources, Managers FinancialReports, Statewide Accounting System, 1990-1999.
Actual Dollars
Inflation-Adjusted Dollars
Millions of Dollars
The sale ofannual anddaily permitsgenerate moststate parkrevenues.
25 The costs of seasonal staff in work training programs were included in purchased services.
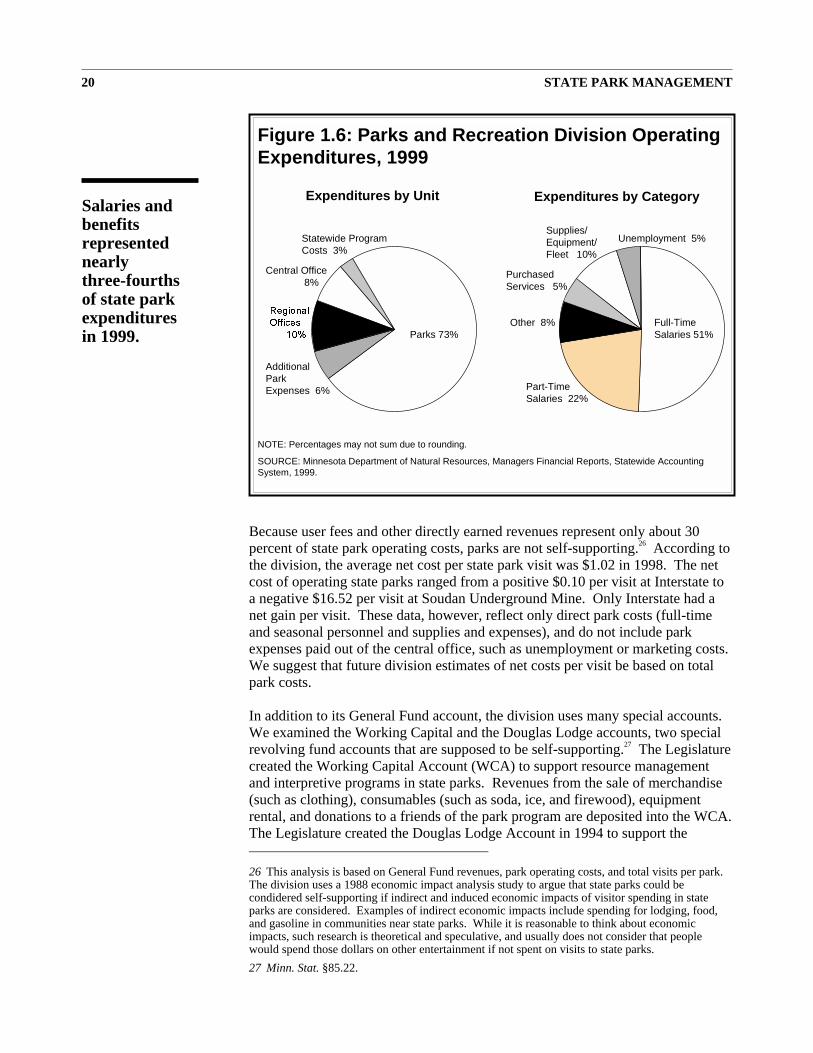
Because user fees and other directly earned revenues represent only about 30percent of state park operating costs, parks are not self-supporting.26 According tothe division, the average net cost per state park visit was $1.02 in 1998. The netcost of operating state parks ranged from a positive $0.10 per visit at Interstate toa negative $16.52 per visit at Soudan Underground Mine. Only Interstate had anet gain per visit. These data, however, reflect only direct park costs (full-timeand seasonal personnel and supplies and expenses), and do not include parkexpenses paid out of the central office, such as unemployment or marketing costs.We suggest that future division estimates of net costs per visit be based on totalpark costs.
In addition to its General Fund account, the division uses many special accounts.We examined the Working Capital and the Douglas Lodge accounts, two specialrevolving fund accounts that are supposed to be self-supporting.27 The Legislaturecreated the Working Capital Account (WCA) to support resource managementand interpretive programs in state parks. Revenues from the sale of merchandise(such as clothing), consumables (such as soda, ice, and firewood), equipmentrental, and donations to a friends of the park program are deposited into the WCA.The Legislature created the Douglas Lodge Account in 1994 to support the
20 STATE PARK MANAGEMENT
Figure 1.6: Parks and Recreation Division OperatingExpenditures, 1999
Expenditures by Unit Expenditures by Category
Central Office8%
Regional
Offices
10%
AdditionalParkExpenses 6%
Parks 73%
Statewide ProgramCosts 3%
PurchasedServices 5%
Other 8%
Supplies/Equipment/Fleet 10%
Unemployment 5%
NOTE: Percentages may not sum due to rounding.
SOURCE: Minnesota Department of Natural Resources, Managers Financial Reports, Statewide AccountingSystem, 1999.
Part-TimeSalaries 22%
Full-TimeSalaries 51%
Salaries andbenefitsrepresentednearlythree-fourthsof state parkexpendituresin 1999.
26 This analysis is based on General Fund revenues, park operating costs, and total visits per park.The division uses a 1988 economic impact analysis study to argue that state parks could becondidered self-supporting if indirect and induced economic impacts of visitor spending in stateparks are considered. Examples of indirect economic impacts include spending for lodging, food,and gasoline in communities near state parks. While it is reasonable to think about economicimpacts, such research is theoretical and speculative, and usually does not consider that peoplewould spend those dollars on other entertainment if not spent on visits to state parks.
27 Minn. Stat. §85.22.

operations of Itasca State Park’s historic lodge. Revenues from the operation ofDouglas Lodge and two gift shops are deposited into this account. We found that:
• While the Working Capital Account has generated net revenues tosupport resource management and interpretive programs,performance of the Douglas Lodge Account has fluctuated.
In 1999, the WCA made a profit of $373,000 on revenues of $1.8 million. Since1994, when retail activity at Itasca State Park was directed to the Douglas LodgeAccount, WCA profits averaged over $288,000 annually and increased 12 percenta year in inflation-adjusted dollars. In recent years, the sale of merchandiseaccounted for about two-thirds of WCA revenues, while the sale of consumablesgenerated about one-quarter of revenues. Between 1994 and 1999, approximately$1.3 million in WCA revenues (an average of about $214,000 annually) wereappropriated for resource management and interpretive service projects. Theaccount had a fund balance of $843,600 at the end of fiscal year 1999.
In 1998 and 1999, Gooseberry Falls generated the largest share (between 36 and40 percent) of all WCA revenues, followed by Forestville/Mystery Cave (withabout 7 percent). The 15 most heavily used parks accounted for over 70 percentof all WCA revenues, and parks in Region 2 (Northeast) accounted for over 55percent of WCA revenues.
In contrast, the Douglas Lodge operations experienced net losses of about $10,000in 1996 and $75,000 in 1997. In 1999, this account had $16,000 in profits on $1.5million in revenues. The division’s 1999 analysis of lodge operations showed thatlodging and souvenir sales were profitable between 1994 and 1997, while food
MINNESOTA’S STATE PARK SYSTEM 21
The sale of merchandise accounts for two-thirds of Working Capital Account revenues.
Fifteen parksaccountedfor over 70percent of allrevenues tothe WorkingCapitalAccount in1999.

services were not.28 The account had a fund balance of $147,500 at the end offiscal year 1999.
COMPARISON WITH OTHER STATES
Comparisons with other states can be difficult because park systems differ in theirnature and organization. For instance, in addition to managing state parks,Wisconsin’s park division manages some state forest land. In a comparison of 10Midwestern states, Minnesota’s park system ranked third in total acres behindIllinois and Michigan, second in acres per 1,000 state residents behind SouthDakota, and fifth in proportion of state land dedicated to park use in 1998 (seeTable 1.8).
Minnesota ranked eighth in spending per acre for state parks with $94.66 andfourth in spending per capita with $4.83 in 1998. Minnesota, along with Iowa andNorth Dakota, received over two-thirds of the state parks operating budget fromthe state General Fund. In contrast, Wisconsin and three other states receive lessthan one-third of their state park budgets from the General Fund (see Table 1.9).These differences are examined in Chapter 4.
In terms of full-time and total employees per unit, Minnesota ranked in the middlecompared with neighboring states in 1998 (see Table 1.10).
22 STATE PARK MANAGEMENT
Table 1.8: Size of Midwestern State Park Systems, 1998Proportion
Number of Total of State Acres PerNumber Parks and Acres in Land in 1,000
State1 of Parks Other Units All Units Rank All Units Rank Residents Rank
Illinois 62 384 411,156 1 1.15% 1 34 3Indiana 22 33 178,507 5 0.77 3 30 5Iowa 52 173 63,071 9 0.18 9 22 9Michigan 64 92 266,251 2 0.73 4 27 6
Minnesota 66 79 241,137 3 0.47 5 51 2
Missouri 45 85 135,738 6 0.31 7 25 7North Dakota 11 31 20,046 10 0.05 10 31 4Ohio 73 73 204,852 4 0.78 2 18 10South Dakota 11 86 96,099 8 0.20 8 130 1Wisconsin 44 65 127,811 7 0.37 6 24 8
1The parks systems in most states include other units in addition to state parks. Specifically, the Illinois park system includes recreation,natural, historic, and fish/wildlife areas, and forests; Indiana includes one forest and other areas; Iowa includes recreation, historic,environmental education, and scientific areas; Michigan includes recreation, natural, and historic areas; Minnesota includes recreationareas and waysides; Missouri includes historic and miscellaneous areas; North Dakota includes recreation, natural, historic, andmiscellaneous areas; South Dakota includes recreation, natural, historic, and other areas; and Wisconsin includes recreation areas andforests.
SOURCES: National Association of State Park Directors, The 1999 Annual Information Exchange: A Statistical Report of State ParkOperations for the Period July 1, 1997 through June 30, 1998 (Tucson, AZ: NASPD, 1999), 11-14; U.S. Bureau of the Census, “StatePopulation Estimates,” WWW Document, http://www.census.gov/population/estimates/state/st-98-3.txt; and U.S. Bureau of the Census,Statistical Abstract of the United States: 1998 (Washington, D.C.: 1998), 236.
28 The Itasca State Park Douglas Lodge Resort Study Committee, Future Management Options forItasca State Park’s Douglas Lodge Resort, March 1999, 4-5.

MINNESOTA’S STATE PARK SYSTEM 23
Table 1.9: Midwestern State Park Systems Operating Costs, 1998Proportion
of OperatingOperating Budget from Operating Operating
Budget General Costs CostsState (in thousands) Funds Rank Per Acre Rank Per Capita Rank
Illinois $41,230 56% 5 $100.28 7 $ 3.42 6Indiana 23,524 44 6 131.78 5 3.99 5Iowa 9,600 69 2 152.21 3 3.35 8Michigan 33,600 24 8 126.20 6 3.42 7
Minnesota 22,827 68 3 94.66 8 4.83 4
Missouri 28,463 1 10 209.69 2 5.23 3North Dakota 1,815 69 1 90.56 10 2.84 10Ohio 58,748 57 4 286.78 1 5.24 2South Dakota 8,942 21 9 93.05 9 12.11 1Wisconsin 16,899 31 7 132.21 4 3.24 9
SOURCE: National Association of State Park Directors, The 1999 Annual Information Exchange: A Statistical Report of State ParkOperations for the Period July 1, 1997 through June 30, 1998 (Tucson, AZ: NASPD, 1999), 14, 29-30; and U.S. Bureau of the Census,“State Population Estimates,” WWW Document, http://www.census.gov/population/estimates/state/st-98-3.txt.
Table 1.10: Personnel in Midwestern State ParkSystems, 1998
Full-Time TotalEmployees Employees
State Per Unit Rank Per Unit1 Rank
Illinois 1.6 7 3.0 9Indiana 11.7 1 52.6 1Iowa 0.6 10 1.9 10Michigan 3.5 4 7.0 6
Minnesota 2.9 6 7.8 5
Missouri 7.1 3 9.7 4North Dakota 1.3 9 4.6 8Ohio 9.1 2 23.4 2South Dakota 1.5 8 5.9 7Wisconsin 2.9 5 14.7 3
1These numbers include full-time, part-time, and seasonal employees.
SOURCE: National Association of State Park Directors, The 1999 Annual Information Exchange: AStatistical Report of State Park Operations for the Period July 1, 1997 through June 30, 1998(Tucson, AZ: NASPD, 1999), 49.
Park systemsamong thestates differ,makingcomparisonsdifficult.


