
2017/11/16
1
感染症流行データ分析に役立つ統計解析
西浦 博
Hokkaido [email protected]
Discovery Summit Japan 2017Tokyo, 17 November 2017
1997~ Asia and Africa
H5N1 Influenza
2003, China, Hong Kong
SARS
813
deaths
2001~ USA, Canada
West Nile Fever
393
deaths
1998, Malaysia
Nipah Virus Encephalitis
105
deaths Over 600
deaths
1940, Asia
Hemorrhagic fever with renal syndrome
3,000
deaths
1991, Venezuela
Venezuelan hemorrhagic fever
30
deaths
1993~ USA, Canada
Hantavirus pulmonary syndrome
Over 100
deaths
2001~ Africa
Rift Valley Fever
2009~ From Mexico
Swine-origin H1N1 Influenza
Over 18,000
deaths
2005, Angora
Marburg hemorrhagic fever
363
deaths
1976, 2012 DR Congo
Ebola hemorrhagic fever
279
deaths
2012~, Guinea, Liberia, Sierra
Leone, Ebola hemorrhagic fever
3,439
deaths
2001, 2007, 2012 Uganda
Ebola hemorrhagic fever
170
deaths
2013, China
H7N9 Influenza
120
deaths
Over 1,000
deaths
Emerging and Re-emerging Infectious Diseases
北大人獣共通感染症リサーチセンター 伊藤公人先生作成
感染症疫学の神髄2つ
どうしてたくさんモデルが使われるのか
HIV/AIDSの最も単純な疫学的描写
HIV
h(t,t)
AIDS
a(t)
death death
0
( )
1 ( )dt
t
infection
Characteristics:1. HIV infection is silent, unless one undergoes volunteer blood-test2. AIDS is accurately reported in industrialized countries
0.00
0.02
0.04
0.06
0.08
0.10
0 2 4 6 8 10 12 14 16 18 20 22 24
Time since infection (years)
Fre
qu
en
cy
( ) t
Backcalculation (BC)とはReconstruction of epidemic curve
AIDS incidence data at calendar time t, a(t)Density function of the incubation period of length t, (t)
1 1 0a h
2 2 0 1 1a h h
3 3 0 2 1 1 2a h h h
4 4 0 3 1 2 2 1 3a h h h h
First year:
Second year:
Third year:
Fourth year:
0( ) ( ) ( )
t
a t h t dt t t General:
Brookmeyer R, Gail MH. J Am Stat Assoc 1988; 83: 301-308.
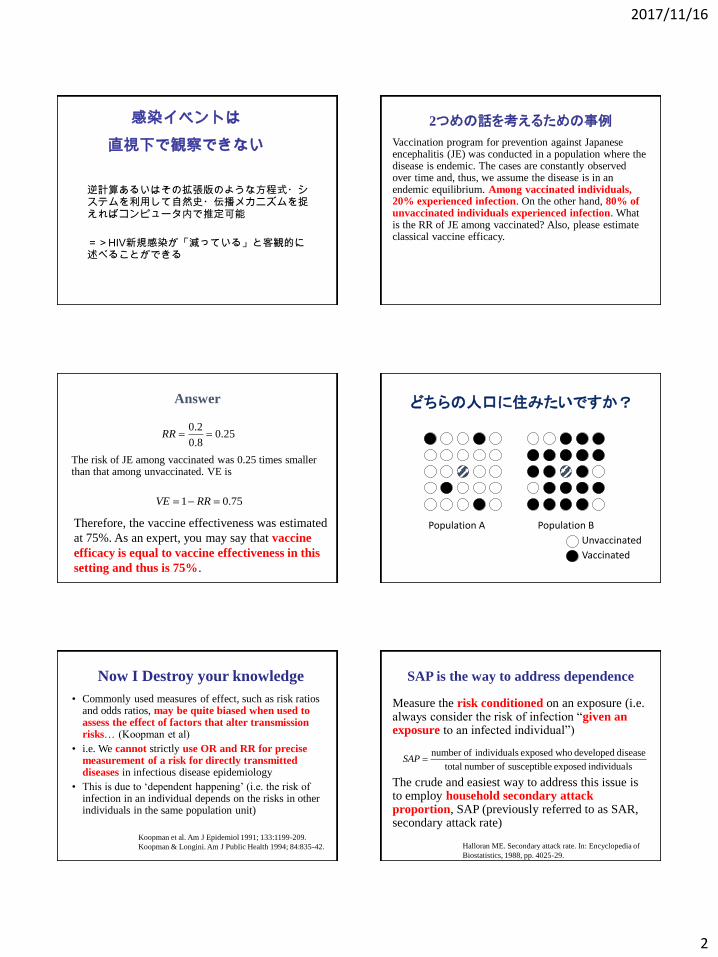
1.感染イベントは直視下で観察できない
感染症疫学の神髄1つめ
2017/11/16
2
逆計算あるいはその拡張版のような方程式・システムを利用して自然史・伝播メカニズムを捉えればコンピュータ内で推定可能
=>HIV新規感染が「減っている」と客観的に述べることができる
感染イベントは
直視下で観察できない
2つめの話を考えるための事例
Vaccination program for prevention against Japanese encephalitis (JE) was conducted in a population where the disease is endemic. The cases are constantly observed over time and, thus, we assume the disease is in an endemic equilibrium. Among vaccinated individuals, 20% experienced infection. On the other hand, 80% of unvaccinated individuals experienced infection. What is the RR of JE among vaccinated? Also, please estimate classical vaccine efficacy.
Answer
The risk of JE among vaccinated was 0.25 times smaller than that among unvaccinated. VE is
0.20.25
0.8RR
1 0.75VE RR
Therefore, the vaccine effectiveness was estimated
at 75%. As an expert, you may say that vaccine
efficacy is equal to vaccine effectiveness in this
setting and thus is 75%.
どちらの人口に住みたいですか?
Population A Population B
Unvaccinated
Vaccinated
Now I Destroy your knowledge
• Commonly used measures of effect, such as risk ratios and odds ratios, may be quite biased when used to assess the effect of factors that alter transmission risks… (Koopman et al)
• i.e. We cannot strictly use OR and RR for precise measurement of a risk for directly transmitted diseases in infectious disease epidemiology
• This is due to ‘dependent happening’ (i.e. the risk of infection in an individual depends on the risks in other individuals in the same population unit)
Koopman et al. Am J Epidemiol 1991; 133:1199-209.
Koopman & Longini. Am J Public Health 1994; 84:835-42.
SAP is the way to address dependence
Measure the risk conditioned on an exposure (i.e. always consider the risk of infection “given an exposure to an infected individual”)
The crude and easiest way to address this issue is to employ household secondary attack proportion, SAP (previously referred to as SAR, secondary attack rate)
number of individuals exposed who developed disease
total number of susceptible exposed individualsSAP
Halloran ME. Secondary attack rate. In: Encyclopedia of
Biostatistics, 1988, pp. 4025-29.

2017/11/16
3
So, the easy and correct calculation is…
Vaccine efficacy is calculated as
where SAP0 and SAP1 are the household secondary attack proportions among unvaccinated contacts and vaccinated contacts, respectively.
1
0
1SAP
VESAP
2.ワタシの感染リスクはあなたのリスクと独立ではない
感染症疫学の神髄いくつか2つめ
目的・概要
目的:
感染症のリスク分析・・・
事例・定量的妥当性・今後の展開
概要:
肺ペスト・・・マダガスカルで何が起こっているのか
Zika熱・・・航空機移動ネットワークと輸入リスク
エボラ出血熱・・・渡航制限は有効だったか
過去の肺ペスト流行規模
現在のマダガスカルは近代で史上2番目21世紀では最大規模
マダガスカル共和国
首都:アンタナナリヴフランスより1960年6月26日独立人口 21,900,000人日本の国土面積の約1.5倍2000年代においても国内においてペストの発生2004年から2009年の間の累積患者数は3,454人。うち死亡者は364人。2017年10月31日までに1,838名の累積患者と64名の死亡
感染症の定量的リスク分析
• どれだけ感染しやすいのか(R0推定)
•感染するとどれだけ死にやすいのか(CFR推定)
•国際的な流行拡大のリスクは大きいのか

2017/11/16
4
Tsuzuki et al., Eurosurveillance 2017; in press
10月31日:1838人が診断、64人が死亡
使用データ(1)パスツール研究所マダガスカル支部(IPM)
肺ペスト感染者数(確定・疑い含む)と死亡者数に関する報告
(2)世界保健機関(WHO)アフリカ地域事務局(AFRO)
肺ペスト感染者数(確定・疑い含む)と死亡者数に関する報告
違い:総数カウント、確定検査、腺ペスト分類
R0推定
•分析時最新(10/17分)までの流行データのみを基に再生方程式を利用
•日付の異なるデータを統合して分析することによって,「発病から報告までの遅れ」を予測モデル内で捉えられるように定式化し,推測された「報告遅れ」を加味することで最新の疫学データから基本再生産数を推定
0
0
( ( )) ( ) ( )
t
E j t R j t g dt t t
R0推定の原理
再生産方程式
遅れを加味したとき
, ( )t x tc j F x t , '
,( ) ( )( ' )
t x
t x
cE c F x t
F x t
max max
1max
, 0 ,
1 max
( )[ ]
( )
t
t x t x
F x tE c R c g
F x tt t
t t
Tsuzuki et al., Eurosurveillance 2017; in press
R0: 1.1から1.6R0: 1.6

2017/11/16
5
致死率の推定
3, 4, 5, 12, 15, 17 and 31 October 2017の時点で
肺ペスト患者は 67, 86, 106, 353, 512, 573 and 1138うち死亡者は9, 9, 9, 22, 23, 27 and 31
発病から死亡までの分布; Nishiura, IJE (2007)より満州データ
Tsuzuki et al., Eurosurveillance 2017; in press
割り算ではいけない訳未来に死ぬ人を含む
もう既に死ぬべき人は死んでいる
発病から死亡までの分布; Nishiura, IJE (2007)より満州データを抽出
CFR推定の原理
発病から死亡までの遅れhを加味した式
11 1
2 1 2 11
1 1
( ; , ) 1
ti
t t ti ii it
i
i i
i
i
D j Dt tt t
t
t s s t s st t s t s
tt t tt
t tt
t t
j h j hj
L j
j jD
The CFR was estimated at 5.5% (95% CI: 4.7, 6.4).
Country Number PercentageCountry(French)Afghanistan 17 0.013 AFGHANEAlbania 10 0.008 ALBANIENNEAlgeria 92 0.072 ALGERIENNEGerman 3496 2.720 ALLEMANDAmerica 4165 3.241 AMERICAINEAndorra 5 0.004 ANDORREEngland 3167 2.464 ANGLAISEAngola 13 0.010 ANGOLAISEArgentina 56 0.044 ARGENTINEArmenia 3 0.002 ARMENIENNE
Australia 1098 0.854 AUSTRALIENNEAustria 64 0.050 AUTRICHIENNE
Bahrain 1 0.001 BAHREINBangladesh 56 0.044 BANGLADESHIBarbados 1 0.001 BARBADIENNE
Belarus 6 0.005 BELARUS
Belgium 2142 1.667 BELGE
Benin 73 0.057 BENINOISE
,365
W D E IM D W
M
N T TE C
P
12
,
1
W W E IO M O m m
m M
C T TI T f p
P W
Exportation
Importation
More sophisticated model by
Dorigatti et al., Eurosurveillance (2017)
2015
Angola 167
Antigua and Barbuda 1
Australia 140
Azerbaijan 2
Bahamas 11
Bahrain 137
Bangladesh
Belarus
Belgium 265
Belgium 305
Benin 756
Top 10 countries at risk
Tsuzuki et al., Eurosurveillance 2017; in press

2017/11/16
6
France 0.025582754 0.010980819Mauritius 0.013036534 0.00558962Italy 0.009070496 0.003983761South Africa 0.006165572 0.002698241India 0.00286406 0.001250218
United States of America 0.002822892 0.001219338Comoros 0.001724324 0.000731603China 0.001589983 0.000690046Germany 0.001465002 0.00064216Belgium 0.001435762 0.000624251Nigeria 0.001378316 0.000593142
United Kingdom 0.001324974 0.000580559Seychelles 0.00120256 0.000531535Canada 0.001169134 0.000507413Kuwait 0.001124927 0.000482835Tanzania, United Republic of 0.000971375 0.000432028Switzerland 0.000905808 0.000398193Benin 0.000737736 0.000324335Saudi Arabia 0.000715679 0.000306819Spain 0.000642556 0.000279423Australia 0.000590996 0.000252126Rwanda 0.000512644 0.000218878Romania 0.00050001 0.000212614Japan 0.000450715 0.000194885
リスク解析のまとめ
• R0=1.1-1.7 => 感染性は他の肺ペストと大きく異ならない
• CFR = 5.5% => 出版されている値(治療がないとほぼ死亡)より低い。治療成功or診断多い
•国際的輸入リスク: 最も大きなフランスでも0.1人未満。国際的な流行拡大リスクは極めて小さい
Risk map
Quantitatively map the potential risk of secondary transmission using ecological data (e.g. Aedes spp)
Conclusion: Wet and warm (at low land) are risky signals.
Bogoch II, Brady OJ, Kraemer MU, German M, Creatore MI, Kulkarni MA, Brownstein JS, Mekaru SR, Hay SI, Groot E, Watts A, Khan K. Anticipating the international spread of Zika virus from Brazil. Lancet. 2016 Jan 14. pii: S0140-6736(16)00080-5.
Hint from past studies
Musso D, Cao-Lormeau VM, Gubler DJ. Lancet 2015;386:243-4.
Purposes
• To predict the risk of importation, and
• To estimate the risk of local transmission
Arrival time
Since Uganda(1947),imported in 78 countriesBrazil:Week 12, 2015Since Brazil (2015),imported in 39 countries
Airline transportation network
Kinoshita & Nishiura, Control and Information 2015

2017/11/16
7
37
( )a effT D P
Deff: Effective distance
Ta: Arrival time
P: Adjacency matrix
To estimate the risk of local transmission
Dengue map(CDC)
Chikungunya map(CDC)
Abundance(Aedes aegypti, Aedes albopictus, Aedes
africana)
MethodHazard of importation in country j
Aedes, dengue, chikungunya
Survival analysis model:
Risk of importation at time t in country j
Risk of local transmission in country j
Effective distance from Brazil
Conditional risk of secondary transmission in country j Nah et al., PeerJ 2016
Evaluation
Nah et al., PeerJ 2016
Findings from Zika epidemics
Highly sensitive model for global spread of Zika virus
Risk of importation for Japan was 15-20% by the end of
2016
Local transmission: intense in countries with a history of
chikungunya epidemic

2017/11/16
8
Global prediction of Ebola: failed
Brockmann et al., Science. 2013, 342.6164
Effective distance from Liberia by airports
Liberia
Morocco
Ghana
Belgium
France
United StatesNigeria
MaliSenegal
Countries with imported cases (by 31 Dec 2014)
Possible explanations
Locally contained
(low transmissibility/ successful case isolation)
Possible impact of other countermeasures (e.g. travel
restrictions)
Countries with travel ban
South AfricaNigeriaKenya
Cape VerdeCameroon
RwandaGhana
NamibiaZambia
Botswana
GambiaCote d'Ivoire
TogoSouth Sudan
GabonSenegal
Equatorial Guinea
Guinea-BissauChad
Mauritania
CanadaAustraliaColombiaSingapore
Dominican RepJamaicaBelize
PanamaHaiti
Mauritius
Trinidad and TobagoAntigua and Barbuda
Saint LuciaSt Kitts and Nevis
KoreaSt Vinc. Grenadines
SurinameSeychelles
Guyana
Before 1 Sep 2014 (n=21) After 1 Sep 2014 (n=19)
Time period of study
15th July 15th Sep 8th Aug(PHEIC)
: Importation of Ebola virus disease
Co
un
trie
s
TimeTravel restrictions
Counterfactual analysis
No intervention(counterfactual)
0
Observed
0
1
Travel restrictions
λ: daily hazard of importation
0 Time
0 Time
,i
ii
effD
Results: Absolute risk reduction and effectiveness

2017/11/16
9
Global distribution of effectiveness Findings from Ebola epidemic
Effectiveness of travel restrictions:
- approximately 17%
- comparable across regions
Very small absolute risk reduction
Substantial risk reduction was not found
Introductory short course from 2014
Free of charge
外国人講師
Laith Abu-Raddad (コーネル大学医学部)
Gerardo Chowell(アリゾナ州立大学)
Nicolas Bacaer(フランス国立開発研究所)
Martin Eichner (チュービンゲン大学)
Alex Cook (シンガポール国立大学)
Gergely Rost(セゲド大学)
Catherine Bauchemin (ライアーソン大学)
日本人講師
井深陽子(東北大学大学院経済学研究科)
遠藤彰(東京大学大学院医学系研究科)
斉藤正也(東京大学大学院医学系研究科)
中田行彦(日本学術振興会)
水本憲治(東京大学大学院総合文化研究科)
増田直紀(ブリストル大学)
中岡慎治(東京大学大学院医学系研究科)
山本健久(動物衛生研究所)
佐々木顕(総合研究大学院大学)
稲葉寿 (東京大学大学院数理科学研究科)
中谷友樹(立命館大学文学部)
伊藤公人(北海道大学)
筒井俊之(動物衛生研究所ウイルス・疫学研究領域)
田中剛平(東京大学大学院工学系研究科)
岩見真吾(九州大学大学院理学研究院)
竹内康博(青山学院大学理工学部)
大森亮介(コーネル大学医学部博士研究員)
大日康史(国立感染症研究所感染症疫学センター)
チュータ
宮松雄一郎(東京大学大学院医学系研究科)
松山亮太(岐阜大学大学院獣医学研究科)
八島健太(総合研究大学院大学 先導科学研究科)
内田満夫(信州大学医学部)
竹内昌平(宮崎大学医学部社会医学講座)
山本奈央(ブリティッシュコロンビア大学)
董岳平(東京大学大学院医学系研究科)
木下諒(東京大学大学院医学系研究科)
江島啓介(東京大学大学院医学系研究科)
磯田典和(北海道大学人獣共通感染症リサーチセンター)
ISM: 1 million JPY/yr
Other fundings:+2 million JPY/yr
2014 2015 2016Student 37 40 37Worker 48 43 40Others 1 2 1
Summary for today
感染症疫学の神髄2つ:Dependence of riskとUnobservable nature of infection
肺ペスト:これまでのものと特性変わらない。国際的な流行拡大リスクも高くない
輸入リスク:航空機移動ネットワーク・分岐過程で定量化
感染症数理モデル短期コース:2018.08.01から08.10


