Download - + WISExplore Data Retreat Middle School June 2013 Billie Finco and Sherri Torkelson Day 1
+WISExplore Data RetreatMiddle School
June 2013
Billie Finco and Sherri Torkelson
Day 1
2
6/25/13
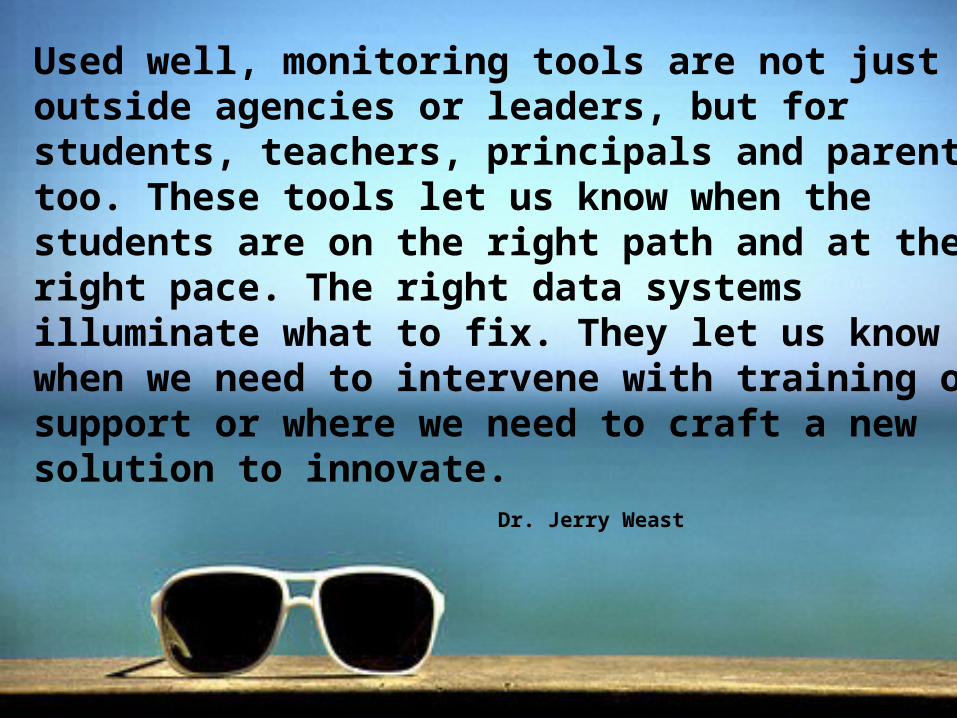
Used well, monitoring tools are not just for outside agencies or leaders, but for students, teachers, principals and parents, too. These tools let us know when the students are on the right path and at the right pace. The right data systems illuminate what to fix. They let us know when we need to intervene with training or support or where we need to craft a new solution to innovate.
Dr. Jerry Weast
3+ Welcome!
Logistics
Introductions
Materials and Resources
Schedule
6/25/13

4+ WISExplore Retreat Materials
1. Original WISExplore Retreat materials are posted in LiveBinder.
2. Go to www.livebinders.com/play/play/899070 (password: wisexplore)
6/25/13
5+ Our ObjectivesLearn how to navigateWISEdash
Use WISEdash to analyze school data
Be introduced to the WISExplore e-learning Modules
Begin the School Improvement Planning process
6/25/13
+ 6Agenda
Opening
Data Inquiry Process
WSAS Dashboard Inquiry
Growth Dashboard Inquiry
Attendance Dashboard Inquiry
Access Dashboard Inquiry
Plan Next Steps
6/25/13
Day One Day Two
7+Norms
Stay engaged
Focus on uncovering/discovering/recovering
Use technology respectfully
Strive for equity of voice
6/25/13

8+Security and Confidentiality
Roles of staff and levels of security
6/25/13
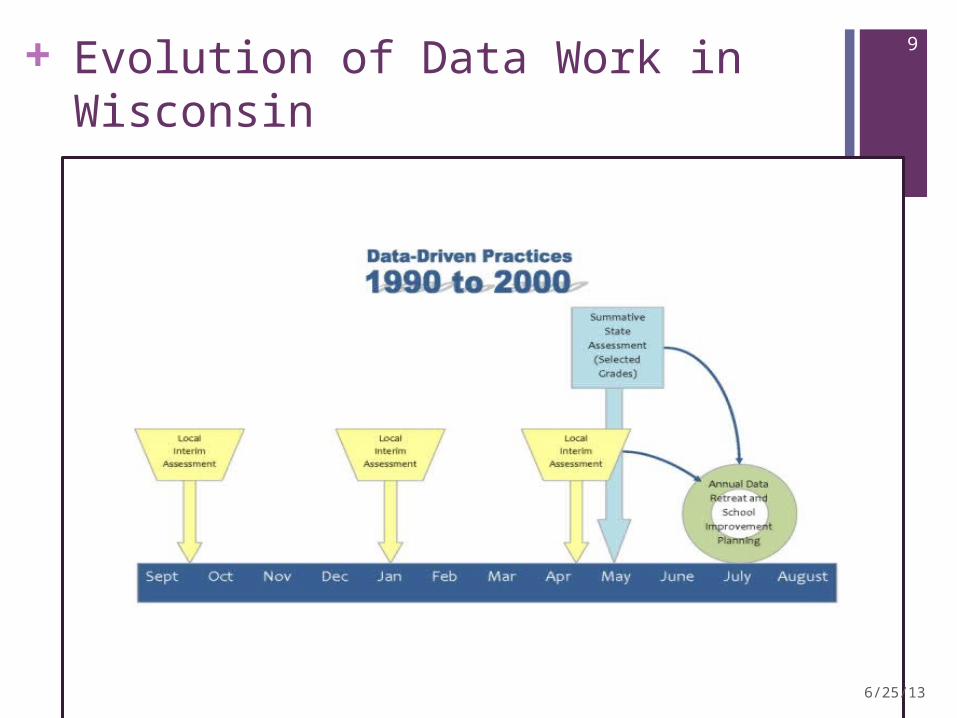
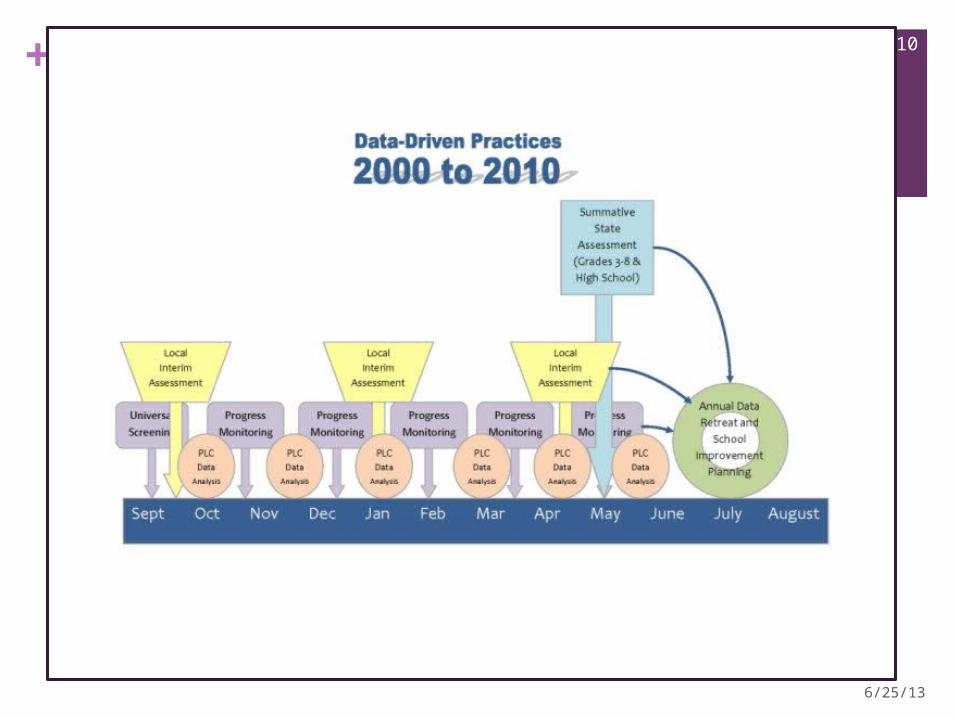
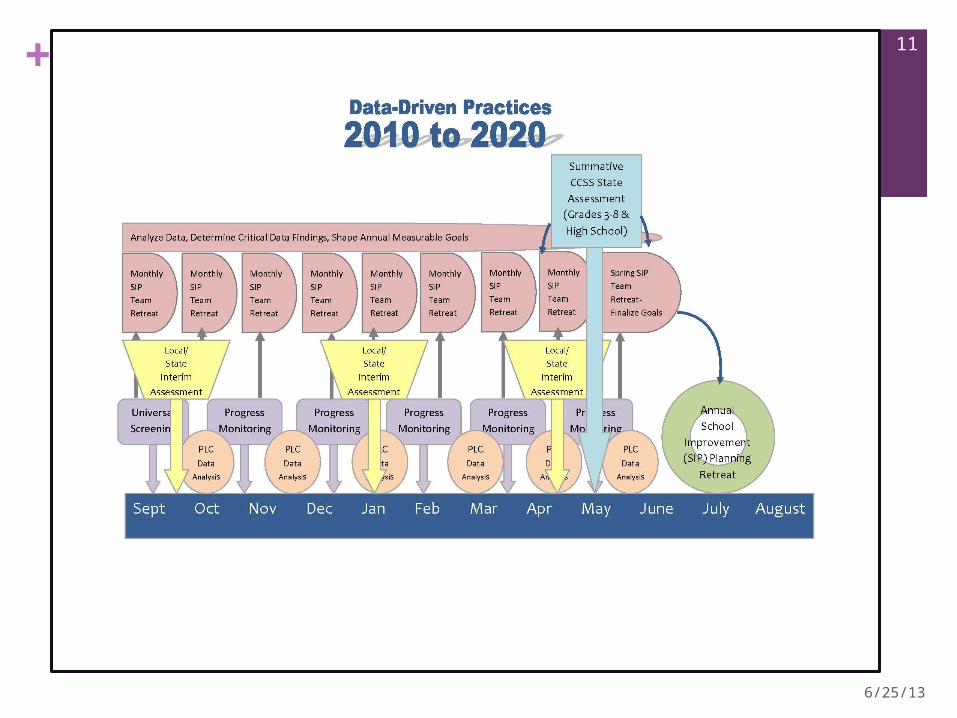
9+ Evolution of Data Work in Wisconsin
6/25/13
10+
6/25/13
11+De
6/25/13
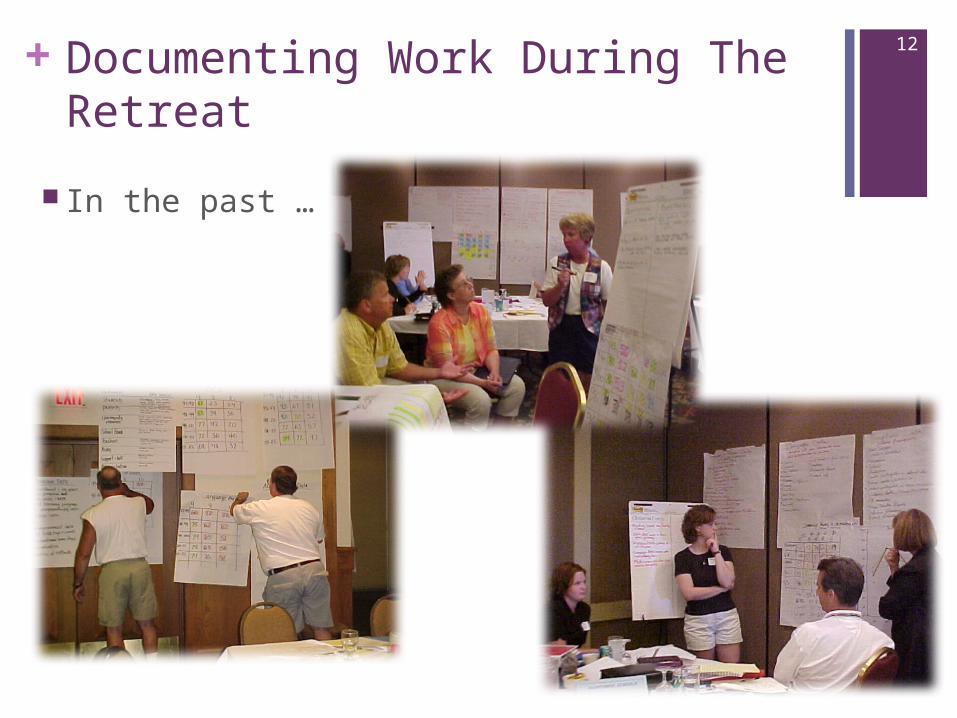
12+Documenting Work During The Retreat
In the past …
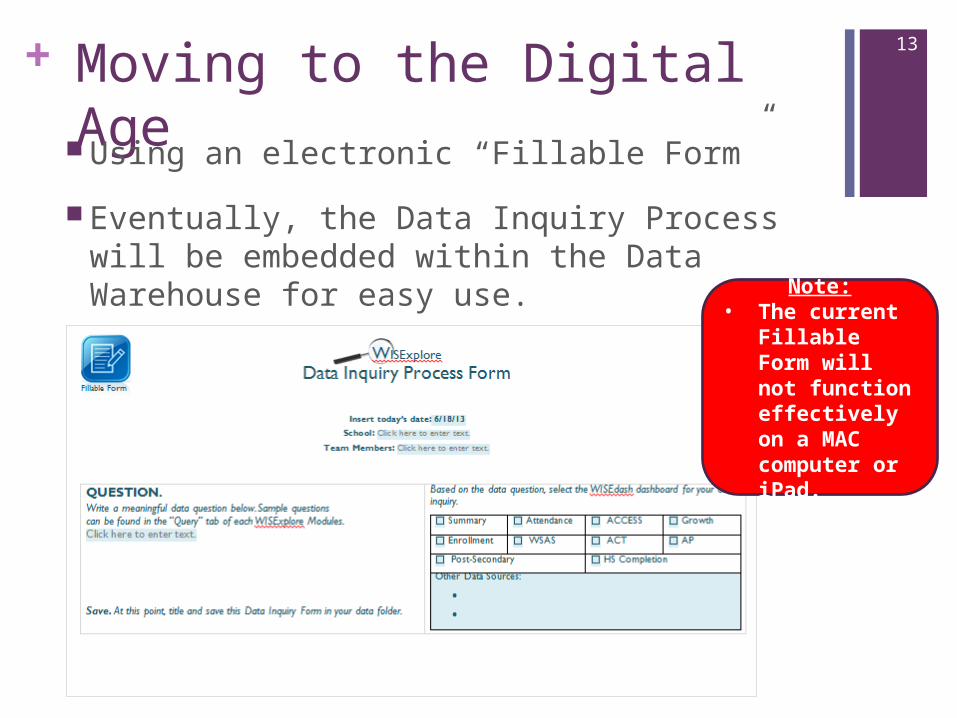
13+ Moving to the Digital Age Using an electronic “Fillable Form”
Eventually, the Data Inquiry Process will be embedded within the Data Warehouse for easy use. Note:
• The current Fillable Form will not function effectively on a MAC computer or iPad.
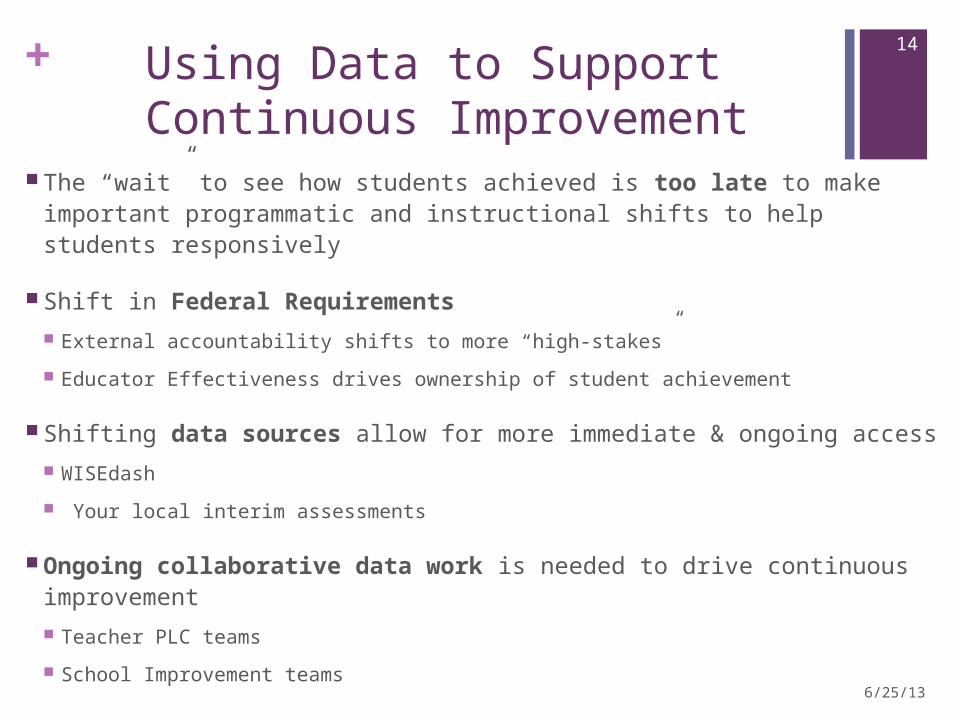
14+ Using Data to Support Continuous Improvement
The “wait” to see how students achieved is too late to make important programmatic and instructional shifts to help students responsively
Shift in Federal Requirements External accountability shifts to more “high-stakes”
Educator Effectiveness drives ownership of student achievement
Shifting data sources allow for more immediate & ongoing access WISEdash
Your local interim assessments
Ongoing collaborative data work is needed to drive continuous improvement Teacher PLC teams
School Improvement teams6/25/13
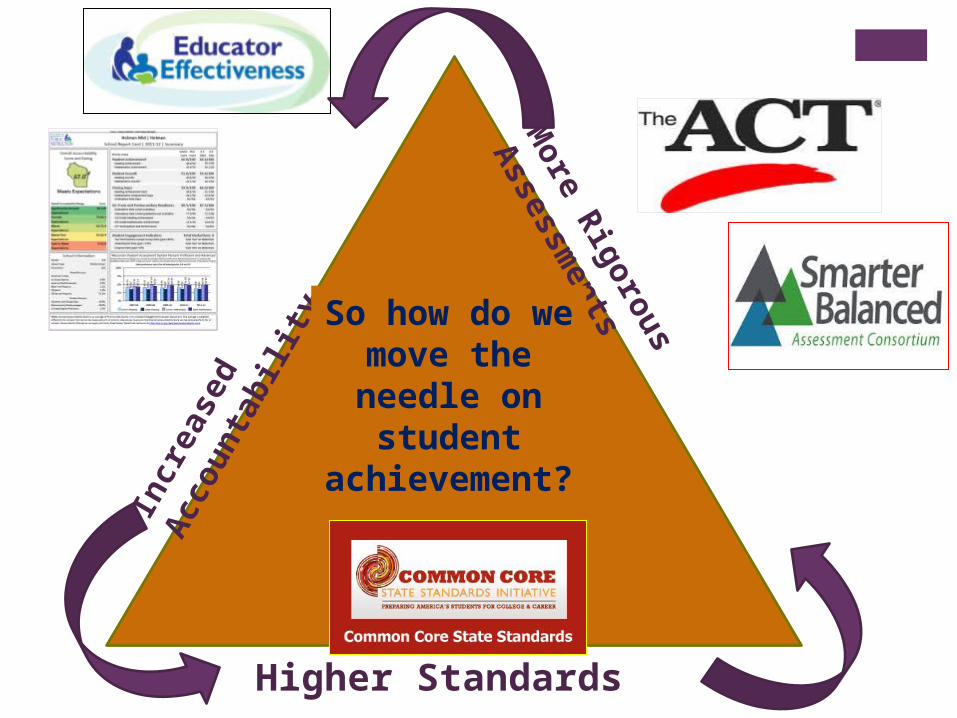
15Higher Standards
Incr
ease
d
Acc
ounta
bilit
y
More
Rig
oro
us
Asse
ssmentsSo how do we move the
needle on student
achievement?
+
Brief Report Card Walk-Through
6/25/13
16
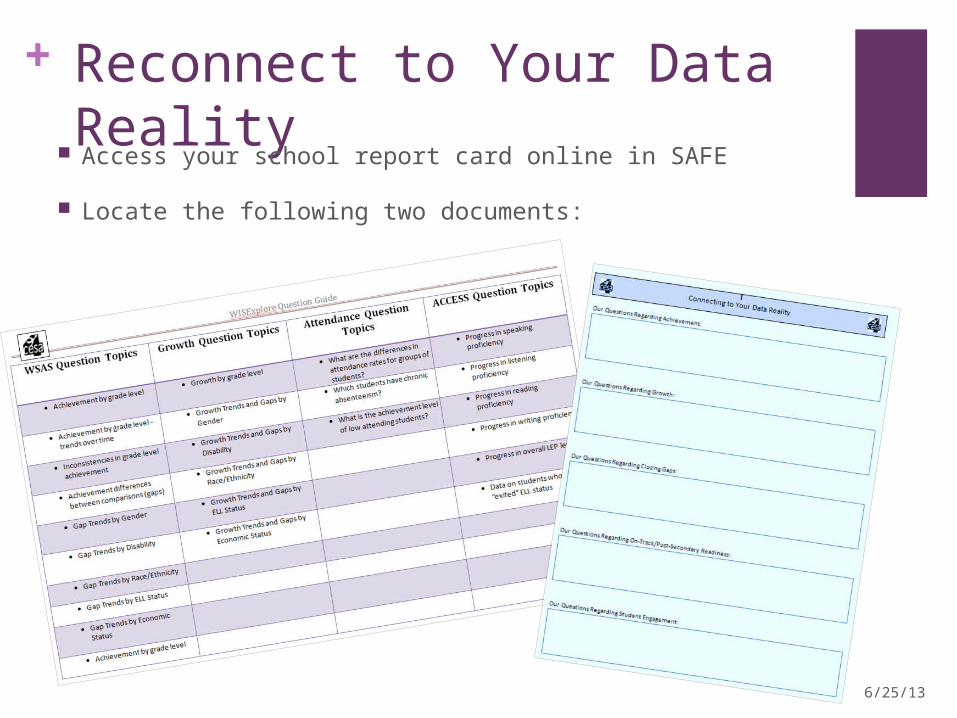
+ Reconnect to Your Data Reality
Access your school report card online in SAFE
Locate the following two documents:
6/25/13
6/25/13
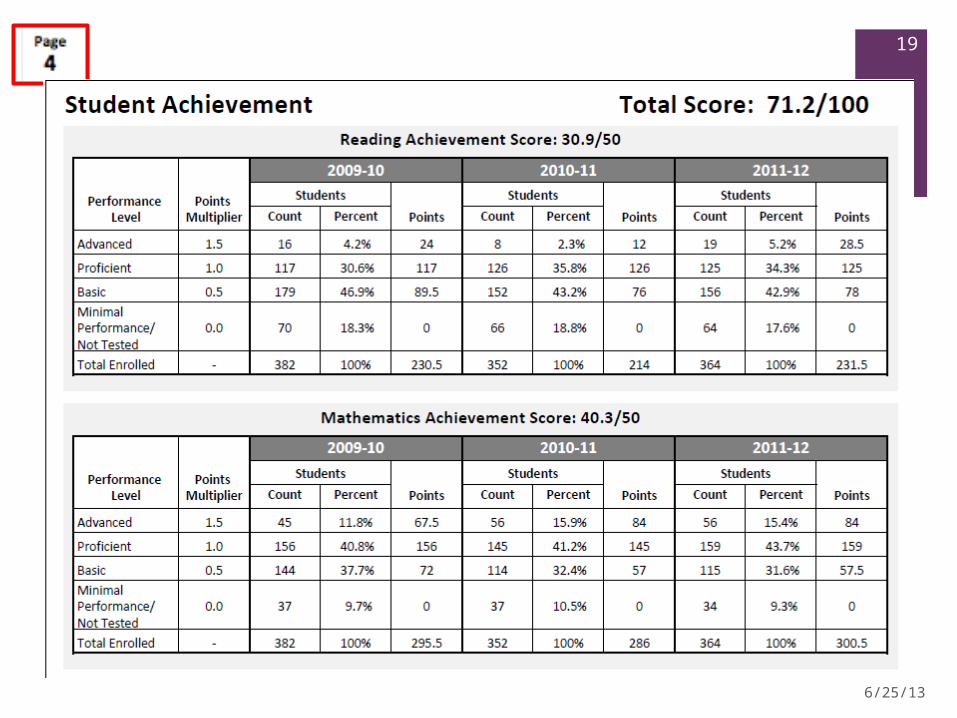
+ 19
6/25/13
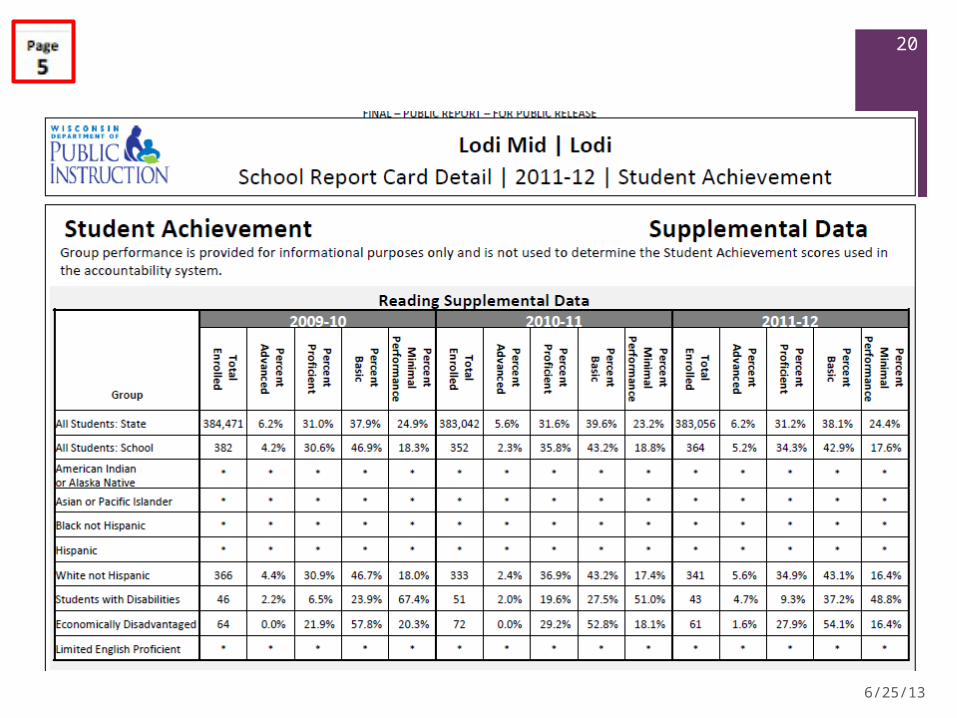
+ 20
6/25/13
+ 21
As you consider last year’s reality…
6/25/13
What are you wondering about this year’s data?

6/25/13
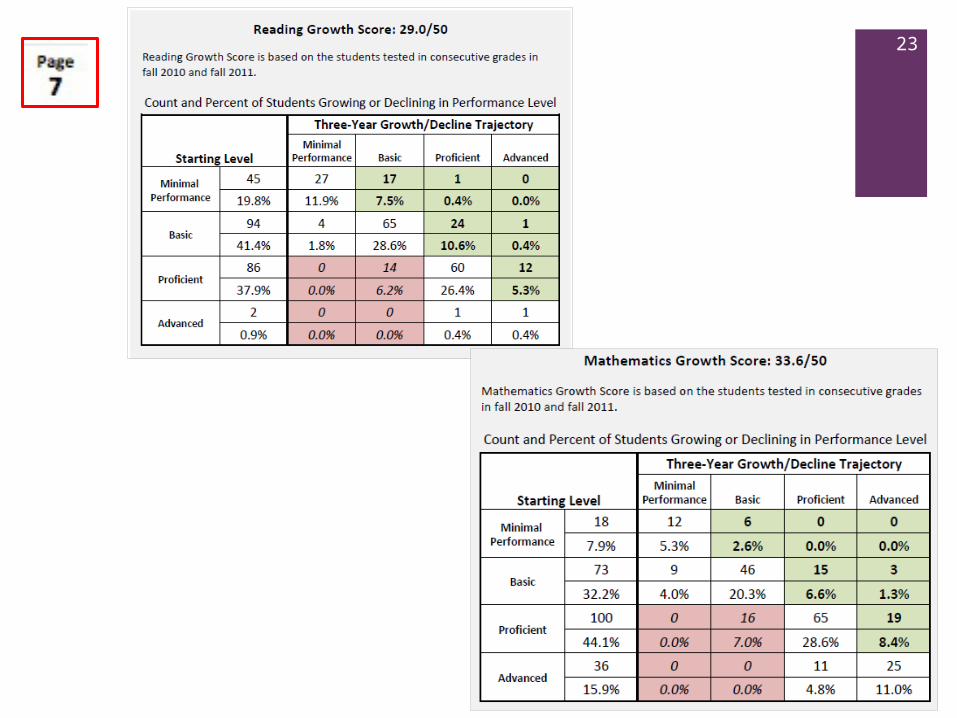
+ 23
6/25/13
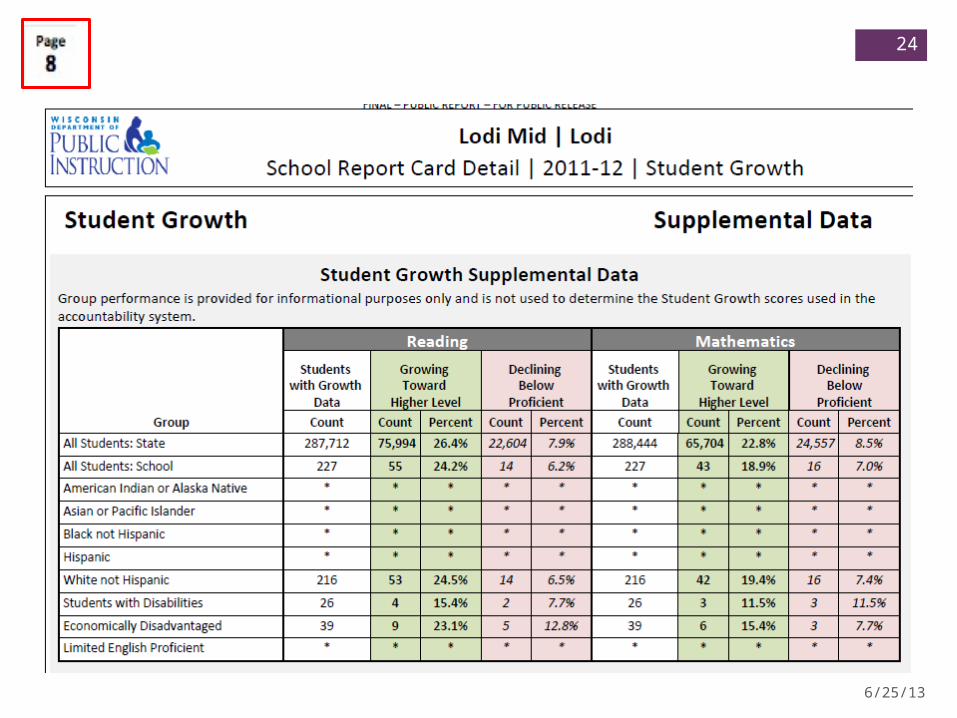
24
6/25/13

+ 25
As you consider last year’s reality…
6/25/13
What are you wondering about this year’s data?
6/25/13
+ 27
6/25/13

+ 28
As you consider last year’s reality…
6/25/13
What are you wondering about this year’s data?
6/25/13
+ 30
6/25/13
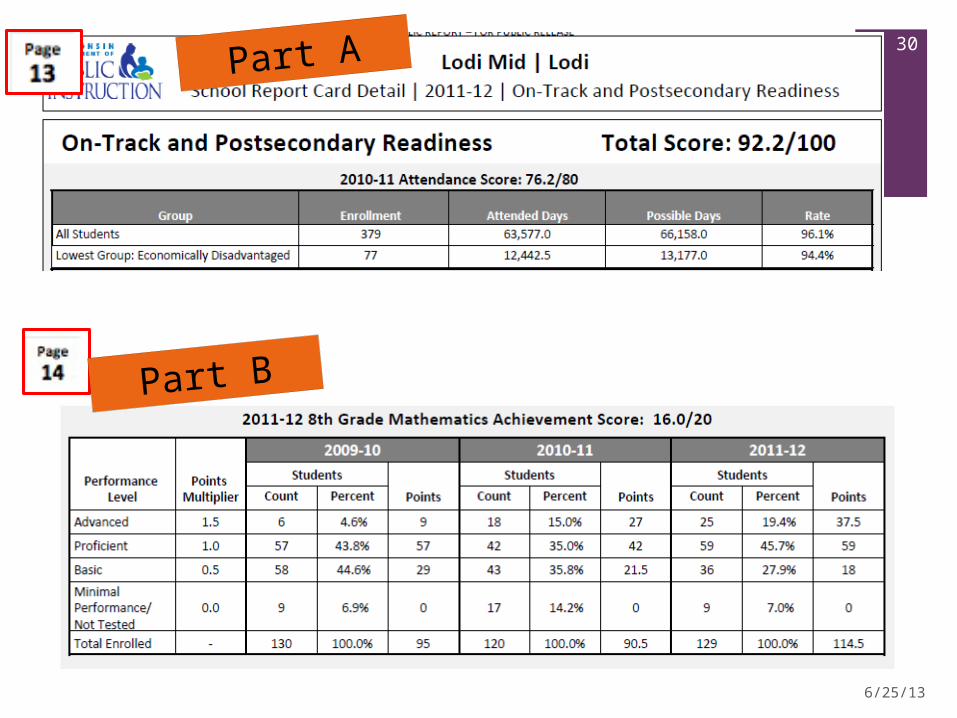
Part A
Part B

+ 31
As you consider last year’s reality…
6/25/13
What are you wondering about this year’s data?
+ 32
6/25/13

+ 33
As you consider last year’s reality…
6/25/13
What are you wondering about this year’s data?
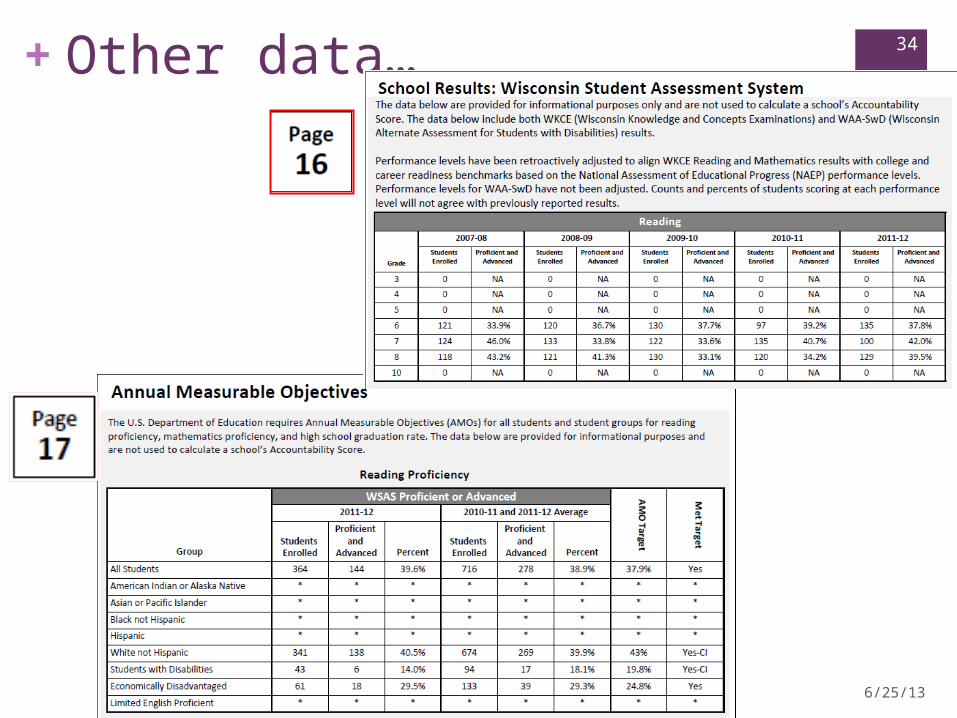
+ 34Other data…
6/25/13

+ 35Here’s Sherri!
June 2013

Finco & Torkelson
+
Data Retreat
Data Inquiry ProcessJune 25, 2013
Data Inquiry Process
36June 2013
Finco & Torkelson
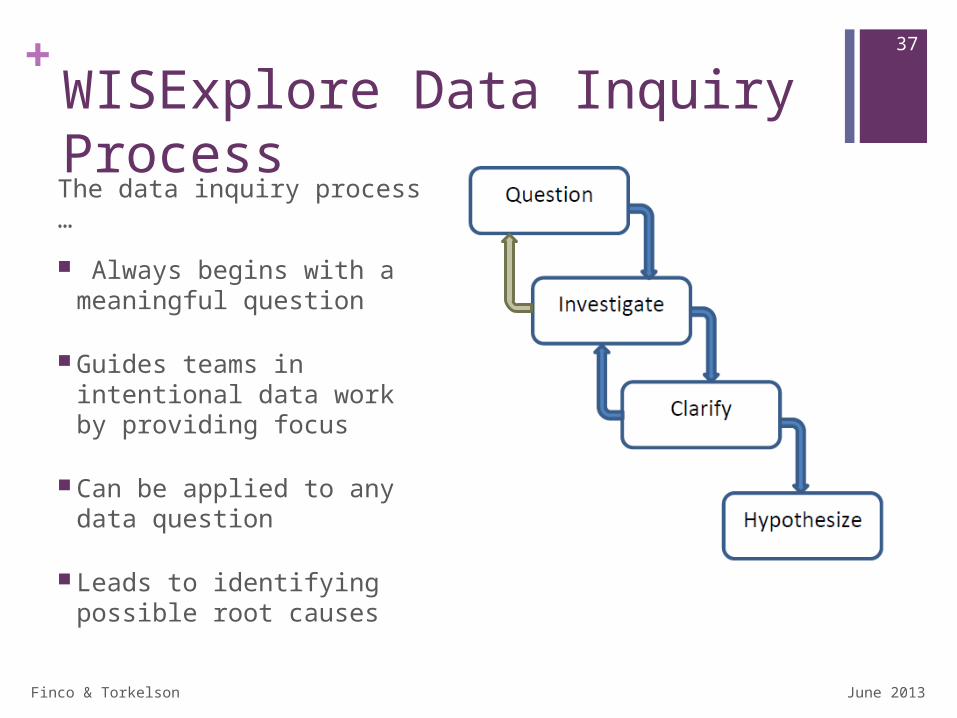
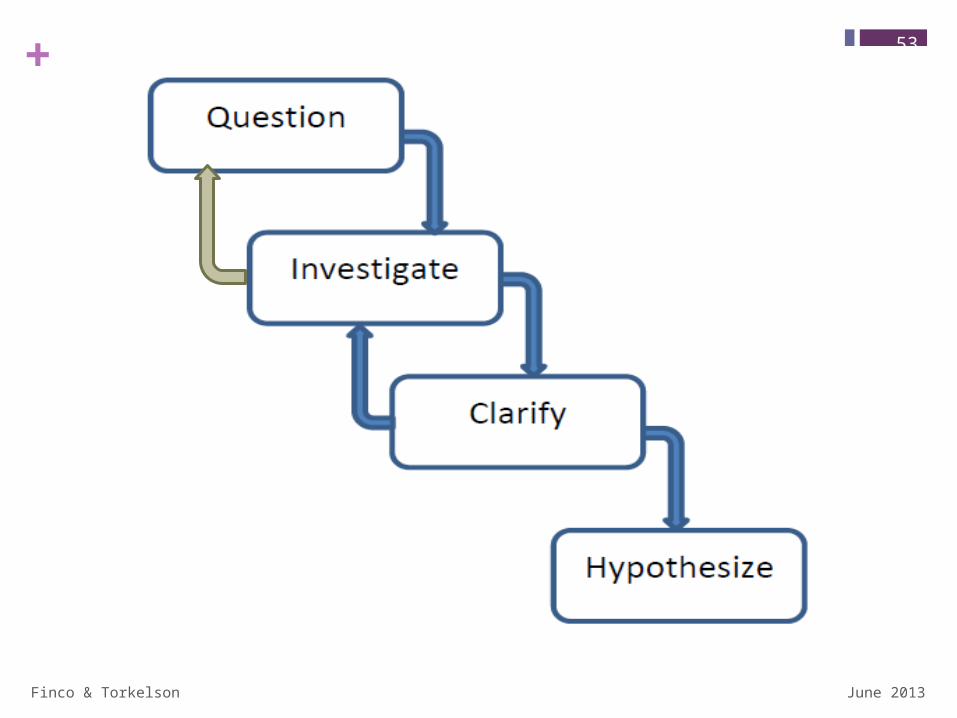
37+WISExplore Data Inquiry ProcessThe data inquiry process …
Always begins with a meaningful question
Guides teams in intentional data work by providing focus
Can be applied to any data question
Leads to identifying possible root causes
June 2013
Finco & Torkelson
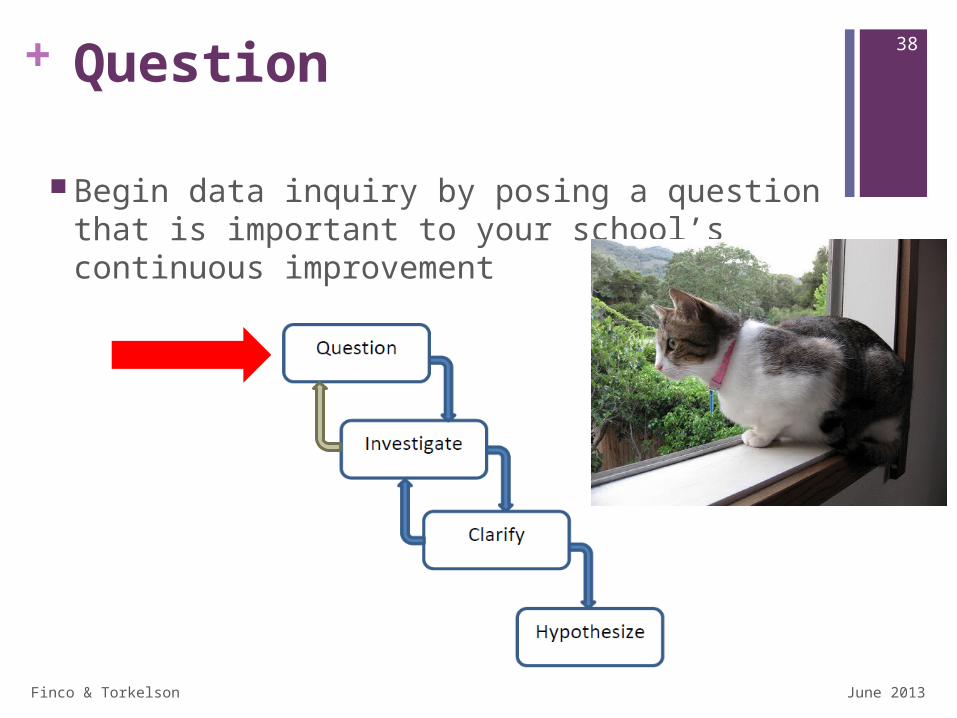
38+ Question
Begin data inquiry by posing a question that is important to your school’s continuous improvement
June 2013
Finco & Torkelson
39+Pose a data question first because … It provides a clear starting
point
It is the first step in a process that will lead to clear goals
It will connect the data inquiry to the vision
It keeps you on track
It clarifies your purpose for data navigation
The process will be both efficient and effective June 2013
Finco & Torkelson
40+Context for a Data Question
Considerations when posing a data question:
Past performance
Current data results
Trends over time
Changes in … the school community school programs standards
June 2013
What do I need to know?
Finco & Torkelson
41+Categories of Data Questions Grade level questions
Gap and subgroup questions
Change, progress and trend questions
General questions
Subject area and skill questions
Course, program questions
Achievement questions
Individual student questions
June 2013
Finco & Torkelson
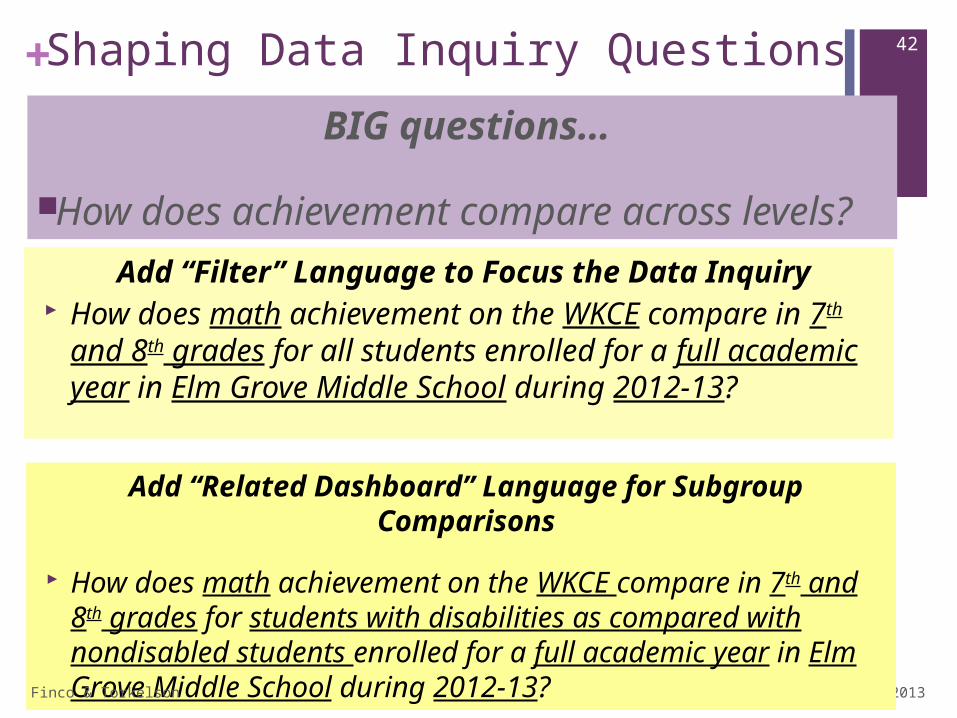
42+Shaping Data Inquiry QuestionsBIG questions…
How does achievement compare across levels?
June 2013
Add “Filter” Language to Focus the Data Inquiry How does math achievement on the WKCE compare in
7th and 8th grades for all students enrolled for a full academic year in Elm Grove Middle School during 2012-13?
Add “Related Dashboard” Language for Subgroup Comparisons
How does math achievement on the WKCE compare in 7th and 8th grades for students with disabilities as compared with nondisabled students enrolled for a full academic year in Elm Grove Middle School during 2012-13?
Finco & Torkelson
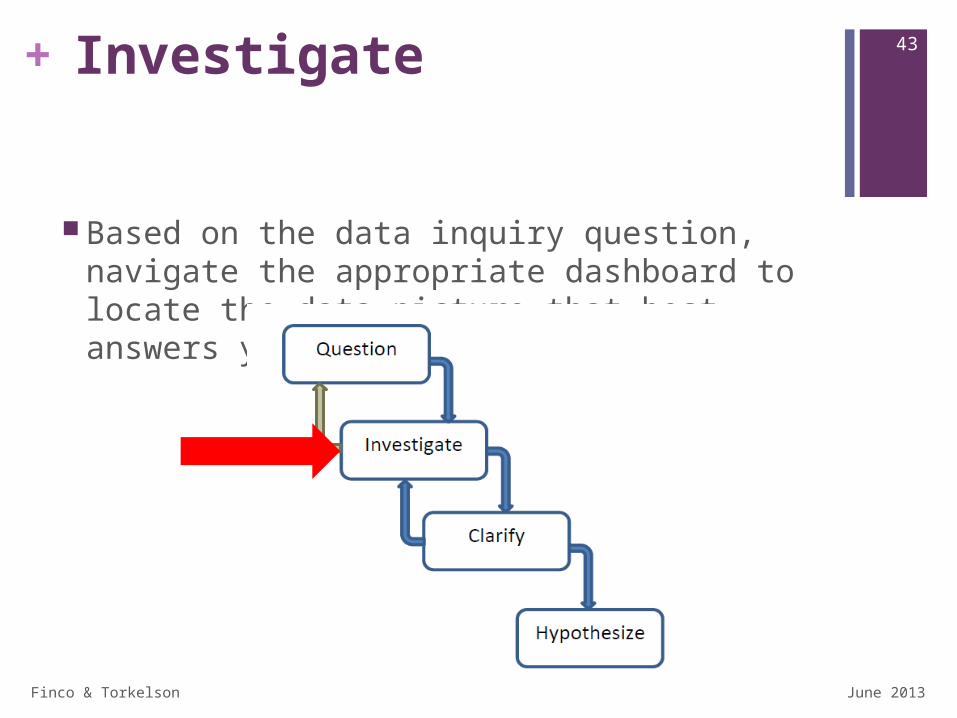
43+ Investigate
Based on the data inquiry question, navigate the appropriate dashboard to locate the data picture that best answers your question.
June 2013
Finco & Torkelson
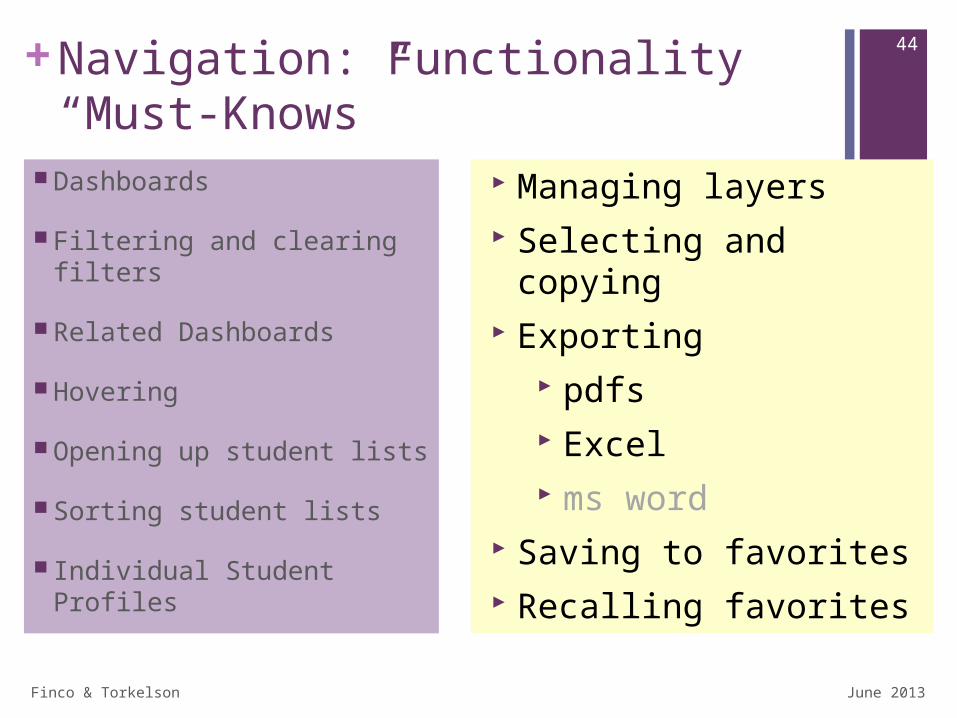
44+Navigation: Functionality “Must-Knows”
Dashboards
Filtering and clearing filters
Related Dashboards
Hovering
Opening up student lists
Sorting student lists
Individual Student Profiles
Managing layers Selecting and copying Exporting
pdfs Excel ms word
Saving to favorites Recalling favorites
June 2013
Finco & Torkelson
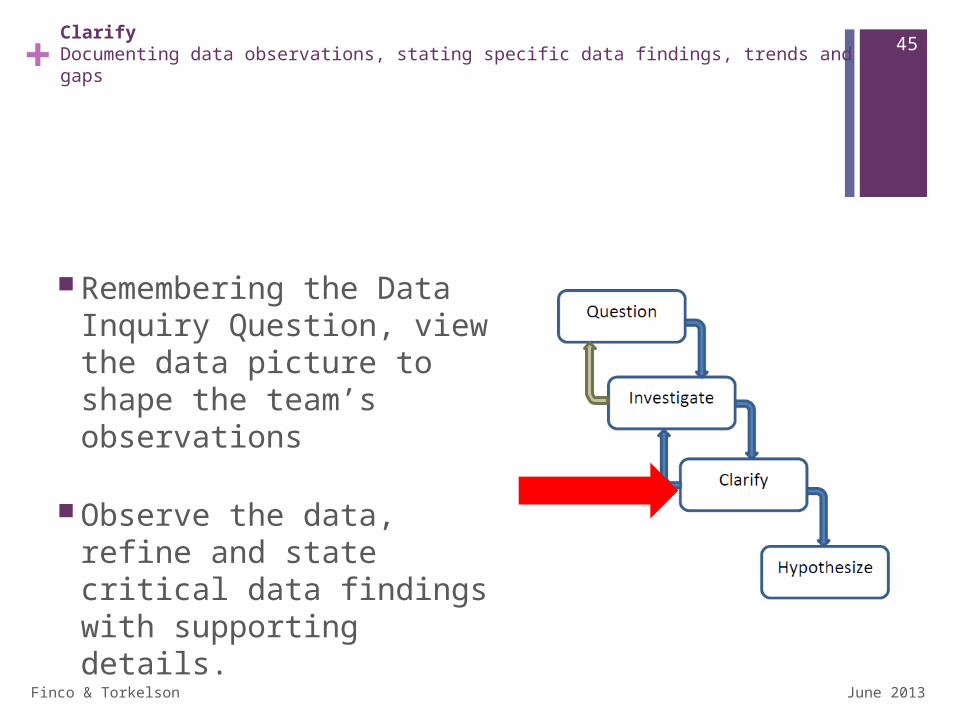
45+ClarifyDocumenting data observations, stating specific data findings, trends and gaps
Remembering the Data Inquiry Question, view the data picture to shape the team’s observations
Observe the data, refine and state critical data findings with supporting details.
June 2013
Finco & Torkelson
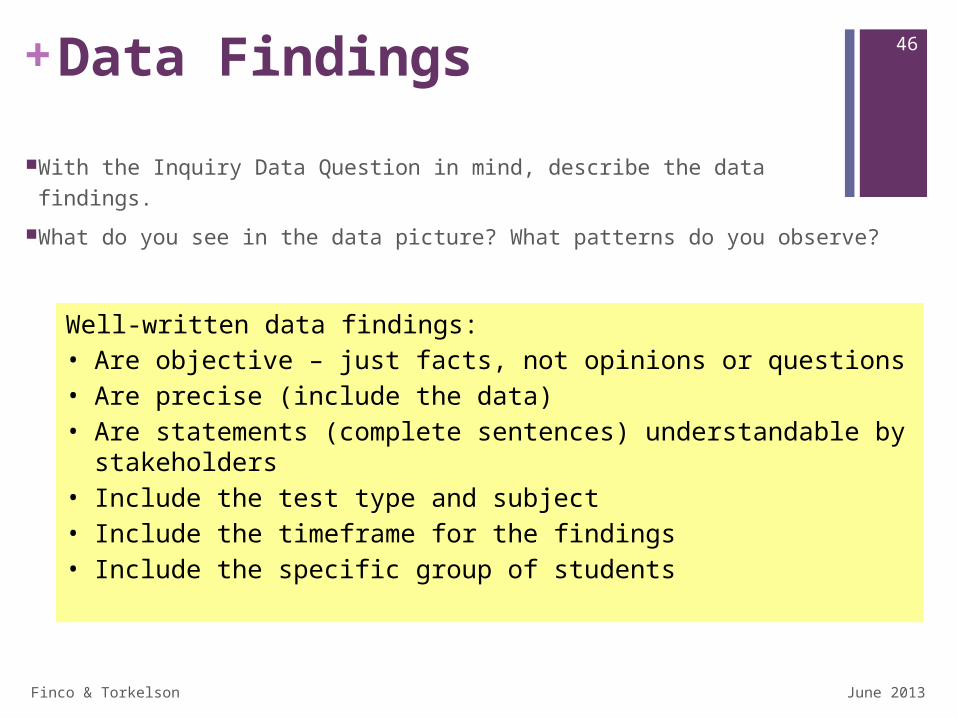
46+Data Findings
With the Inquiry Data Question in mind, describe the data findings.
What do you see in the data picture? What patterns do you observe?
June 2013
Well-written data findings:• Are objective – just facts, not opinions or questions• Are precise (include the data)• Are statements (complete sentences) understandable
by stakeholders• Include the test type and subject• Include the timeframe for the findings• Include the specific group of students
Finco & Torkelson
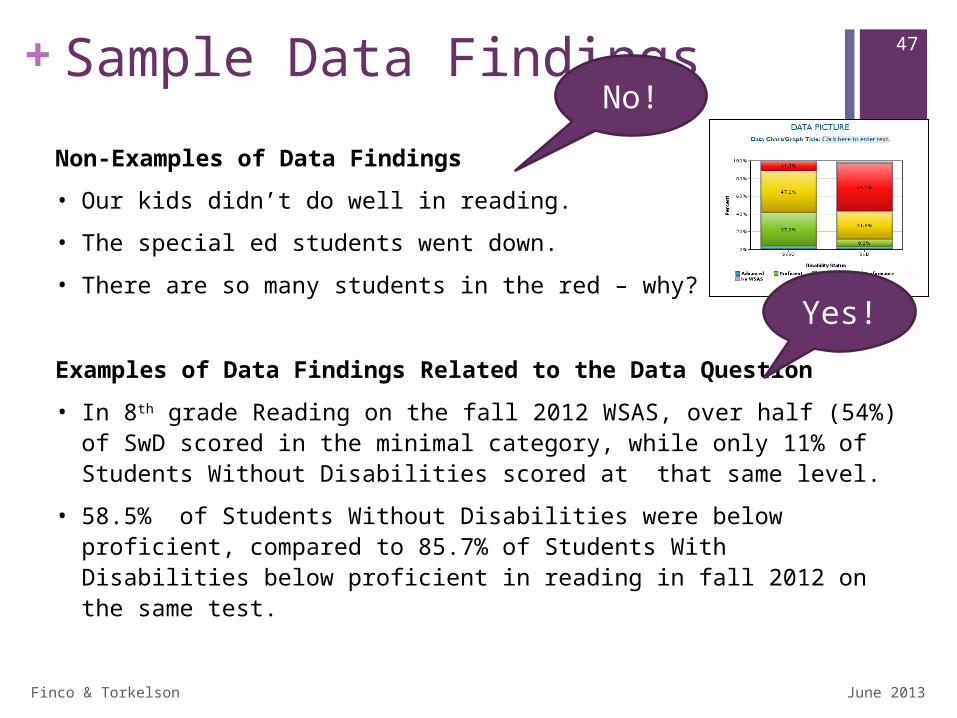
47+Sample Data Findings
Non-Examples of Data Findings
• Our kids didn’t do well in reading.
• The special ed students went down.
• There are so many students in the red – why?
Examples of Data Findings Related to the Data Question
• In 8th grade Reading on the fall 2012 WSAS, over half (54%) of SwD scored in the minimal category, while only 11% of Students Without Disabilities scored at that same level.
• 58.5% of Students Without Disabilities were below proficient, compared to 85.7% of Students With Disabilities below proficient in reading in fall 2012 on the same test.
June 2013
No!
Yes!
Finco & Torkelson
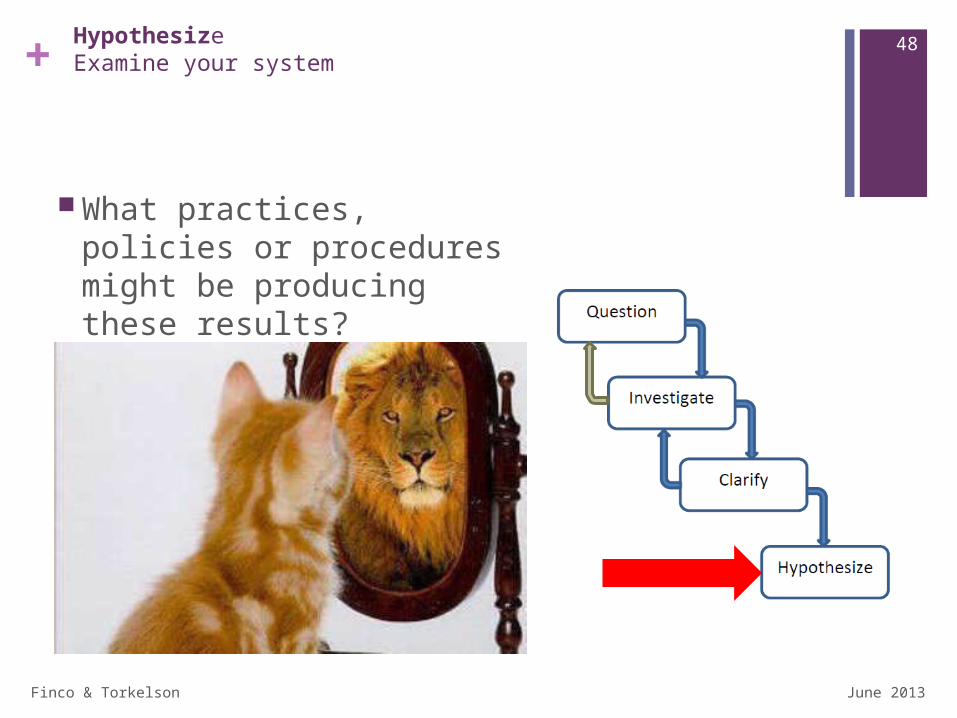
48+ HypothesizeExamine your system
What practices, policies or procedures might be producing these results?
June 2013
Finco & Torkelson
49+Hypotheses of Practice
Posing educated guesses about school or classroom practices as possible underlying root causes for critical data findings.
June 2013
+
Finco & Torkelson
50Posing Hypotheses of Practice
June 2013
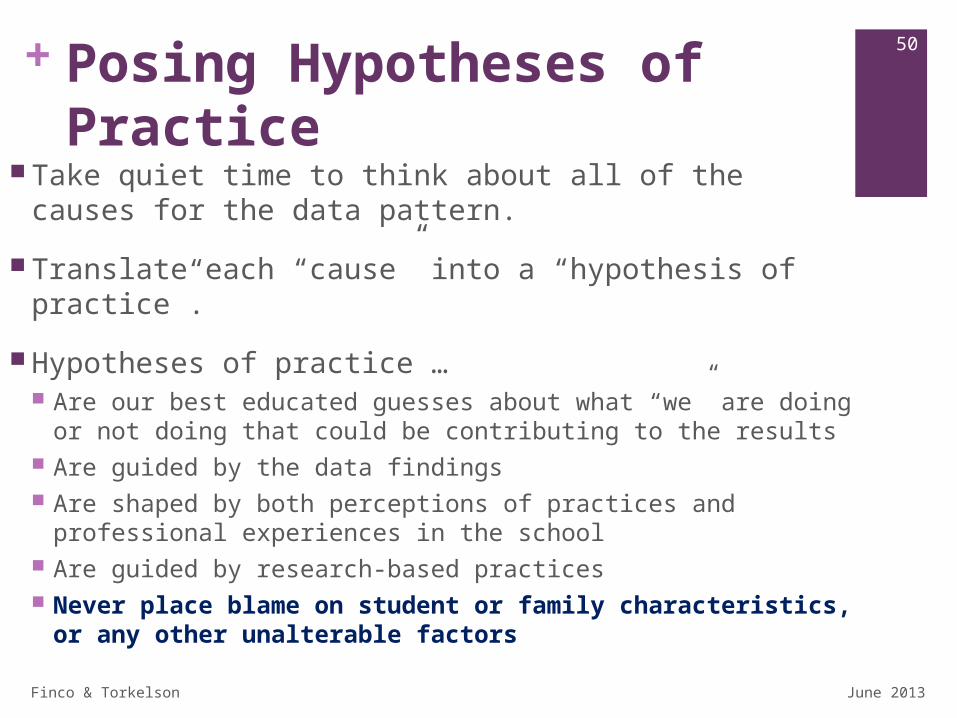
Take quiet time to think about all of the causes for the data pattern.
Translate each “cause” into a “hypothesis of practice”.
Hypotheses of practice … Are our best educated guesses about what “we” are doing
or not doing that could be contributing to the results Are guided by the data findings Are shaped by both perceptions of practices and
professional experiences in the school Are guided by research-based practices Never place blame on student or family
characteristics, or any other unalterable factors
Finco & Torkelson
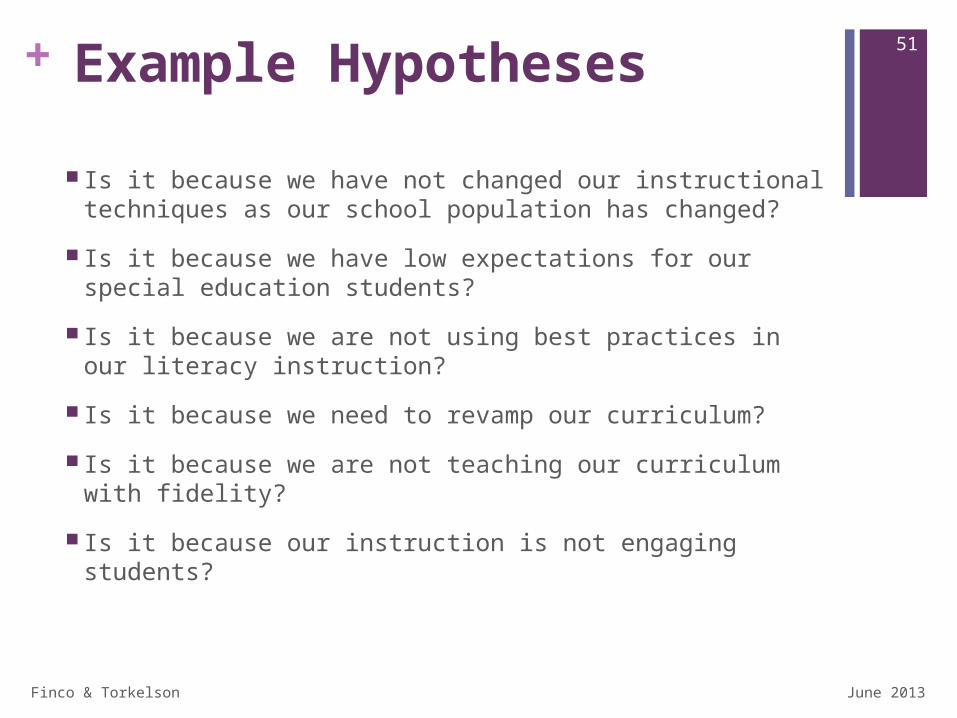
51+ Example Hypotheses
Is it because we have not changed our instructional techniques as our school population has changed?
Is it because we have low expectations for our special education students?
Is it because we are not using best practices in our literacy instruction?
Is it because we need to revamp our curriculum?
Is it because we are not teaching our curriculum with fidelity?
Is it because our instruction is not engaging students?
June 2013
Finco & Torkelson
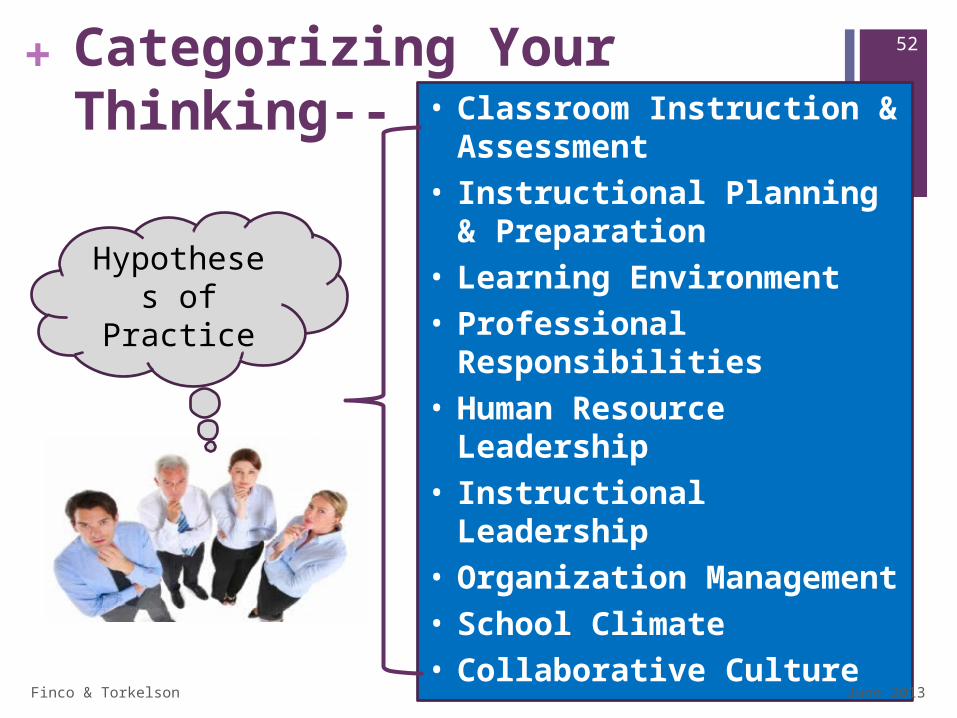
52+ Categorizing Your Thinking--
Hypotheses of
Practice
• Classroom Instruction & Assessment
• Instructional Planning & Preparation
• Learning Environment• Professional
Responsibilities• Human Resource
Leadership• Instructional Leadership• Organization
Management• School Climate• Collaborative Culture• Stakeholder
Relationships
June 2013
Finco & Torkelson
53+
June 2013
Finco & Torkelson
54+2 small tasks and then a break…
Create a data folder for today.
June 2013
My WISExplore Data Folder 2013-14
Log into WISEdash.

55+
June 2013
Finco & Torkelson
+
e Learning Module
Finco & Torkelson
57+ E-Learning Modules
1. For learning 24/7 anytime anywhere
2. Eventually posted on the DPI website
3. Long-term evolving project based on dashboards
4. Can be used by …
Individual educators for self-paced learning
PLC teams
Higher education classes
June 2013
Finco & Torkelson
58+ e-Learning Modules:
1. Overview of WISEdashin LiveBinders under WISExplore
Retreat Grounding tab
2. WSAS Inquiry Module in LiveBinders under WSAS Data Inquiry tab
June 2013

+ 59
June 2013
Finco & Torkelson
+
WISEdash WSAS Data Inquiry
WSAS Dasboard
Inquiry
60
June 2013
Finco & Torkelson
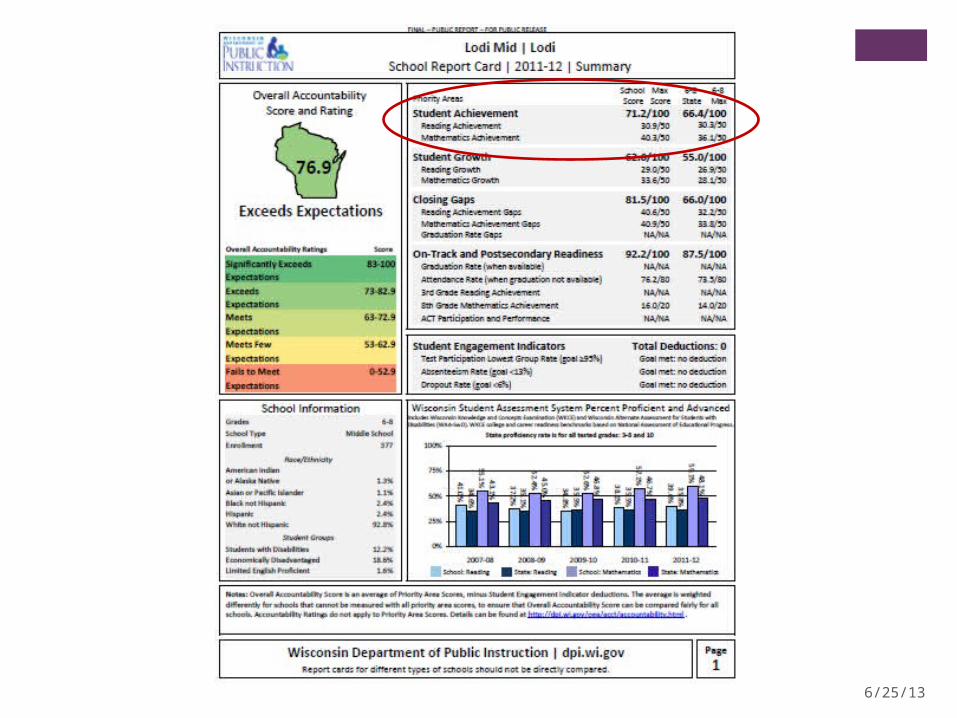
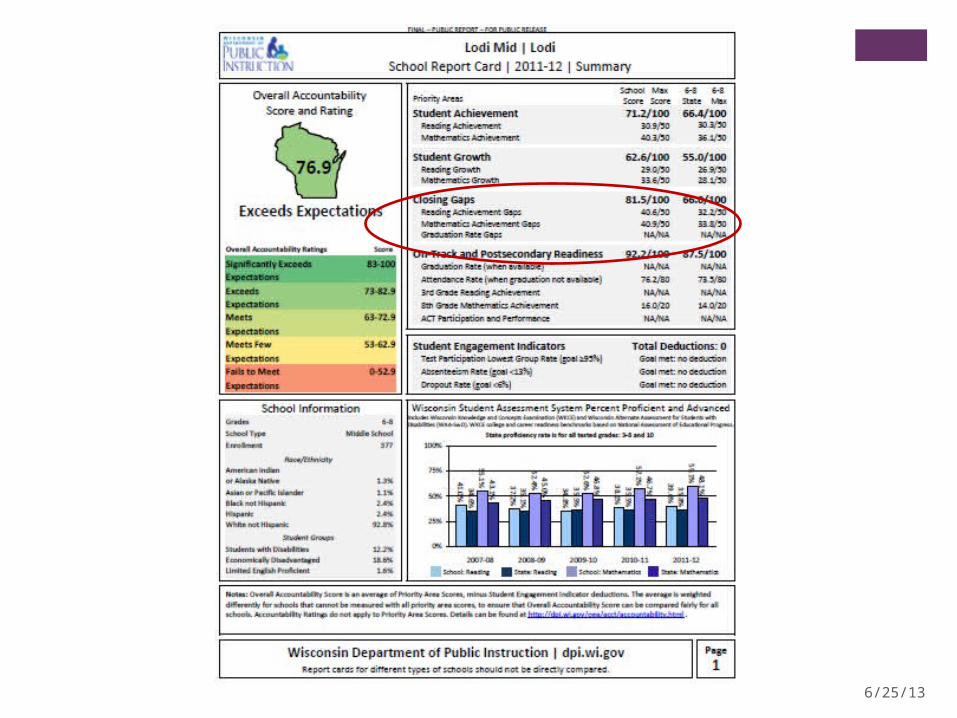
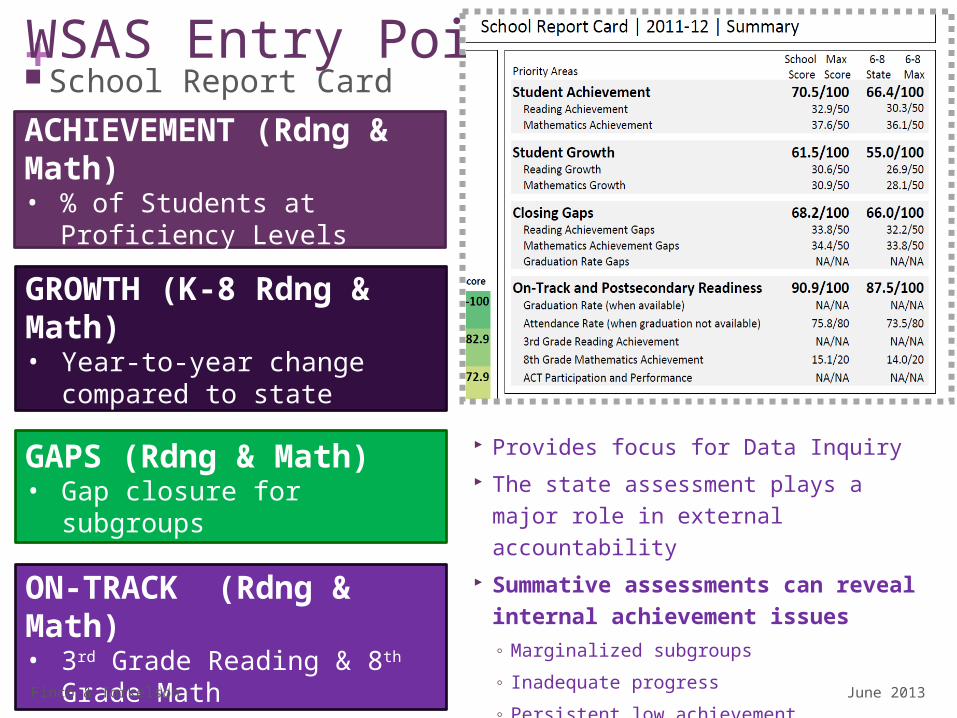
61+WSAS Entry Points School Report Card
ACHIEVEMENT (Rdng & Math)• % of Students at Proficiency
Levels
GROWTH (K-8 Rdng & Math)• Year-to-year change
compared to state
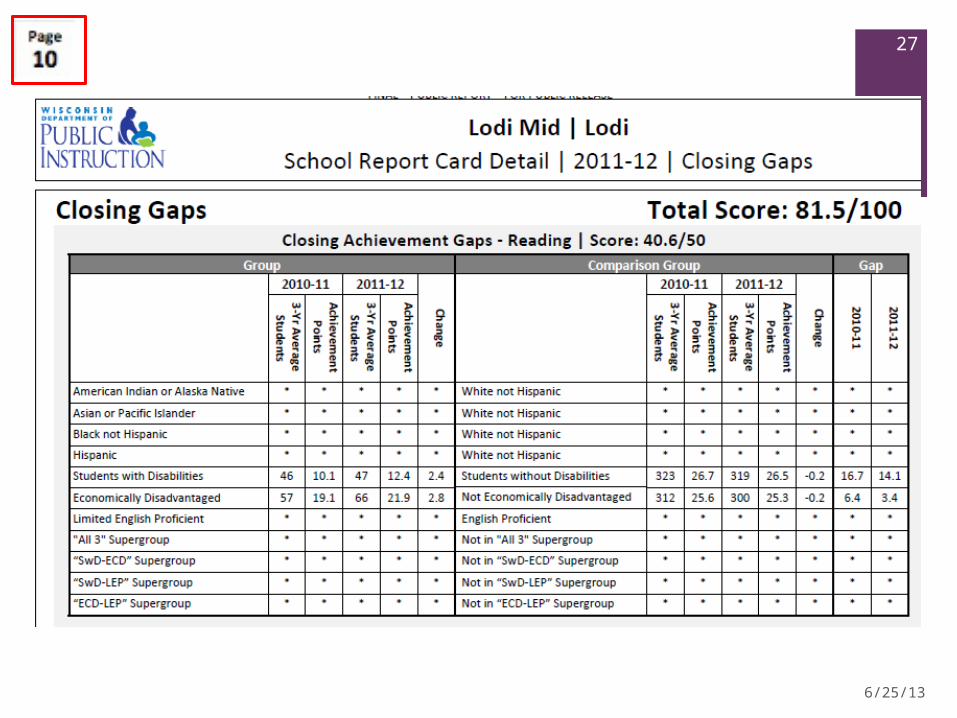
GAPS (Rdng & Math)• Gap closure for subgroups
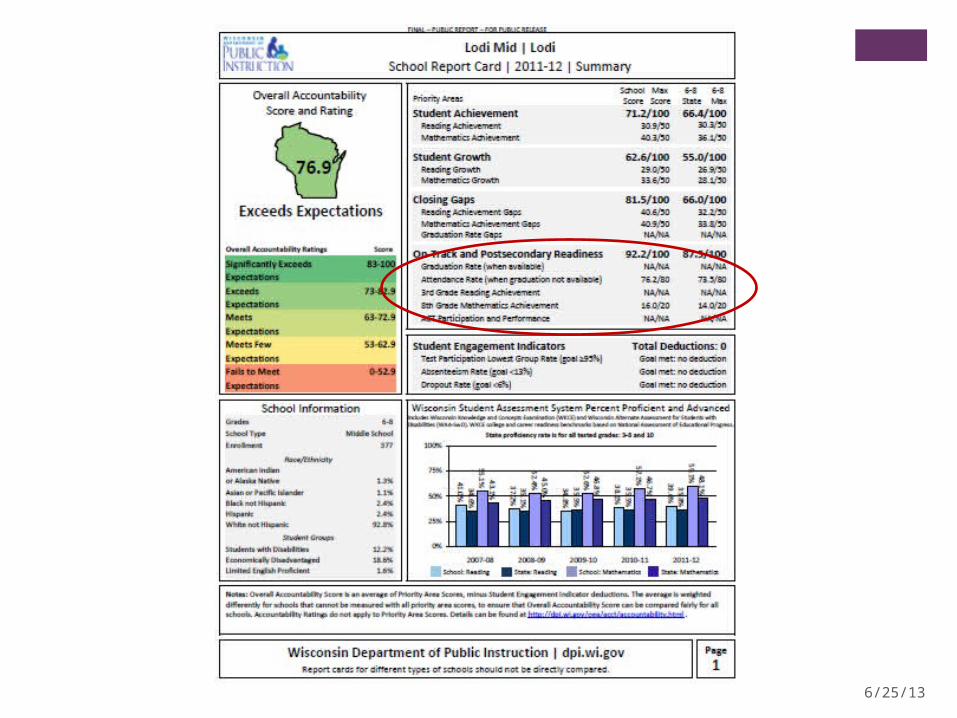
ON-TRACK (Rdng & Math)• 3rd Grade Reading & 8th
Grade Math
Provides focus for Data Inquiry The state assessment plays a major
role in external accountability Summative assessments can
reveal internal achievement issues◦ Marginalized subgroups
◦ Inadequate progress
◦ Persistent low achievement
June 2013
Finco & Torkelson
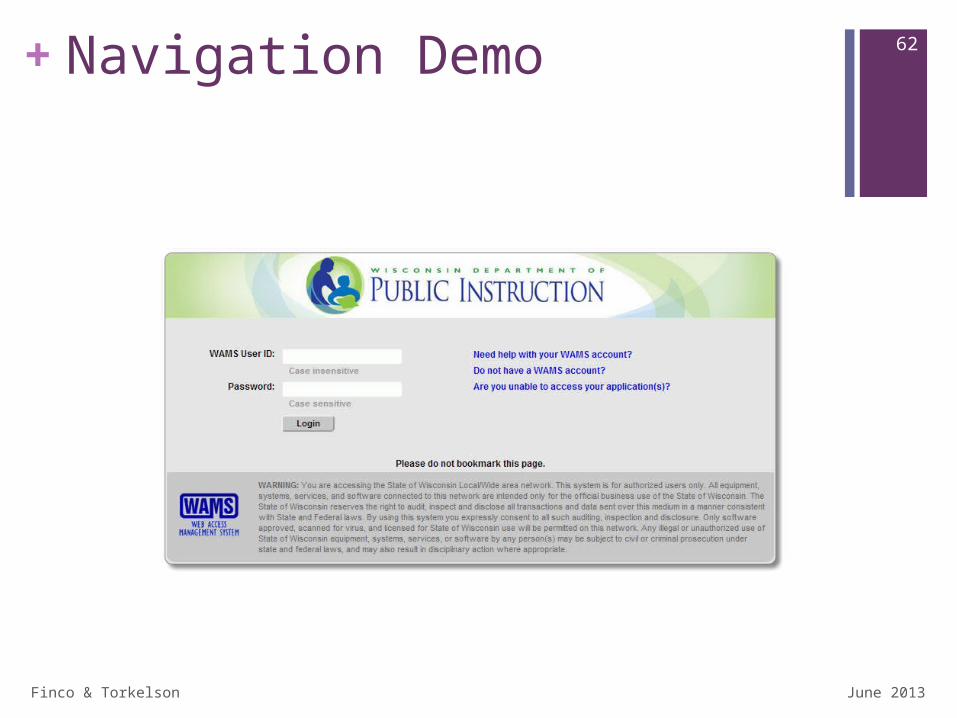
62+Navigation Demo
June 2013
Finco & Torkelson
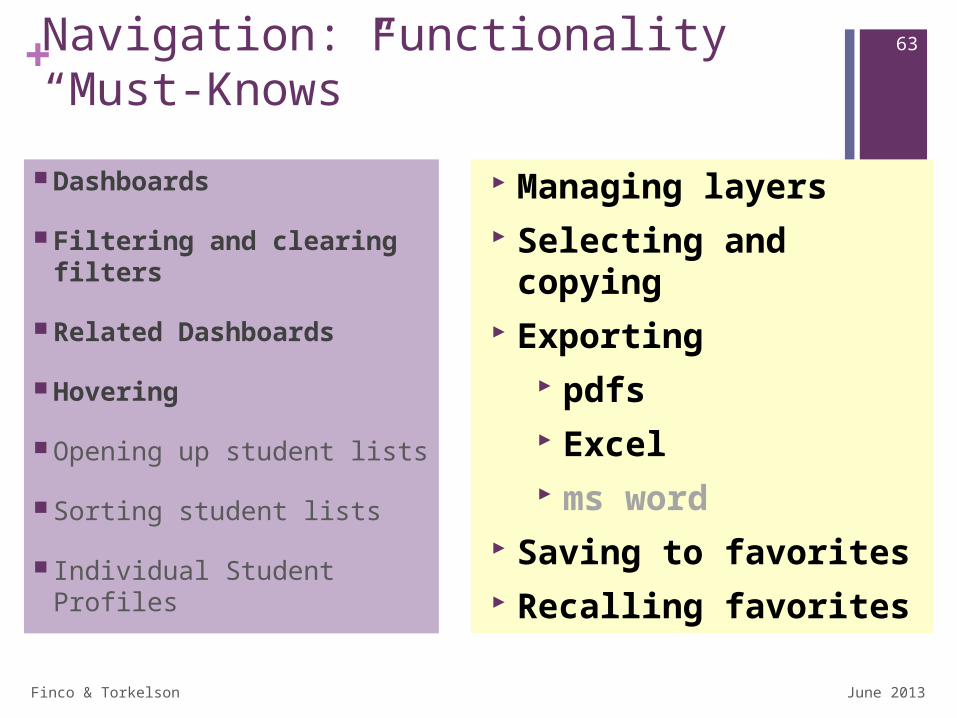
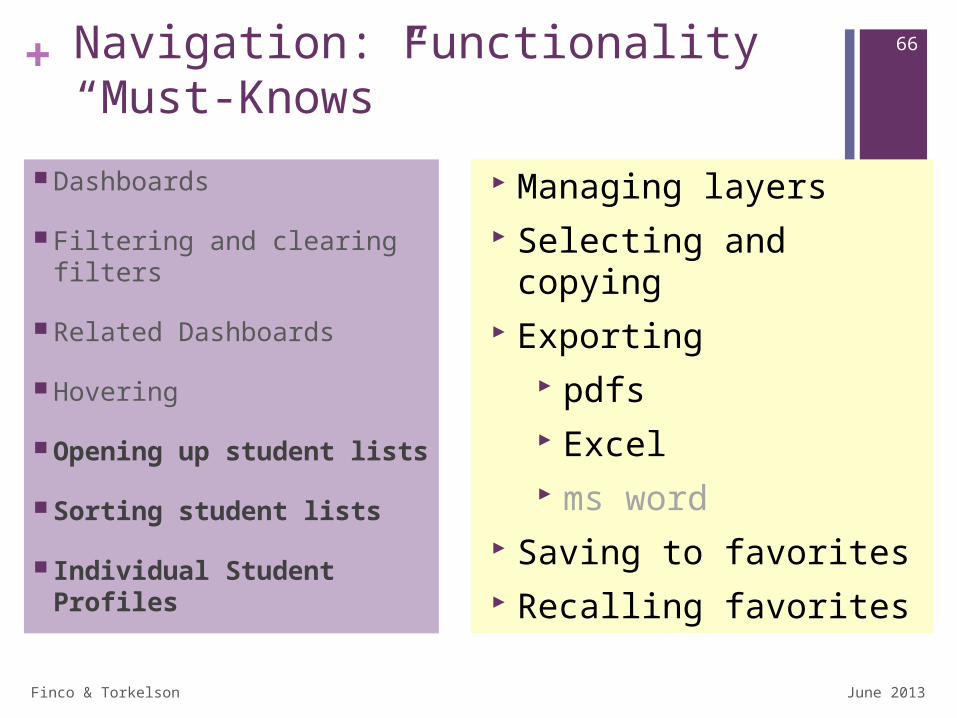
63+Navigation: Functionality “Must-Knows”
Dashboards
Filtering and clearing filters
Related Dashboards
Hovering
Opening up student lists
Sorting student lists
Individual Student Profiles
Managing layers Selecting and
copying Exporting
pdfs Excel ms word
Saving to favorites Recalling favorites
June 2013
Finco & Torkelson
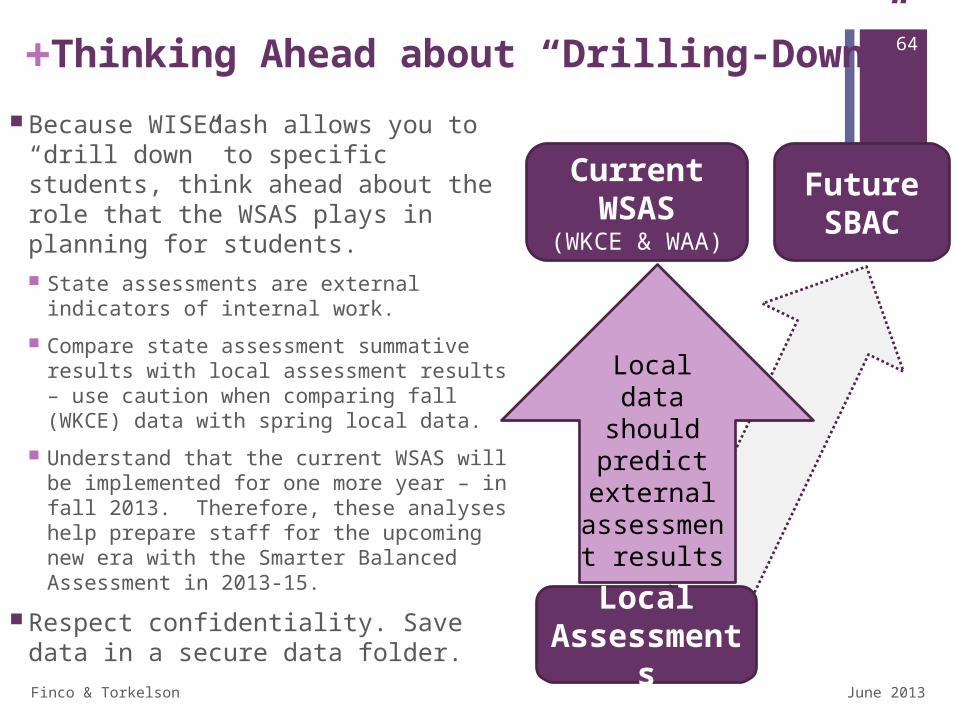
64+Thinking Ahead about “Drilling-Down”
Because WISEdash allows you to “drill down” to specific students, think ahead about the role that the WSAS plays in planning for students. State assessments are external
indicators of internal work.
Compare state assessment summative results with local assessment results – use caution when comparing fall (WKCE) data with spring local data.
Understand that the current WSAS will be implemented for one more year – in fall 2013. Therefore, these analyses help prepare staff for the upcoming new era with the Smarter Balanced Assessment in 2013-15.
Respect confidentiality. Save data in a secure data folder.
CurrentWSAS
(WKCE & WAA)
FutureSBAC
Local Assessme
nts
Local data should predict external
assessment results
June 2013
Finco & Torkelson
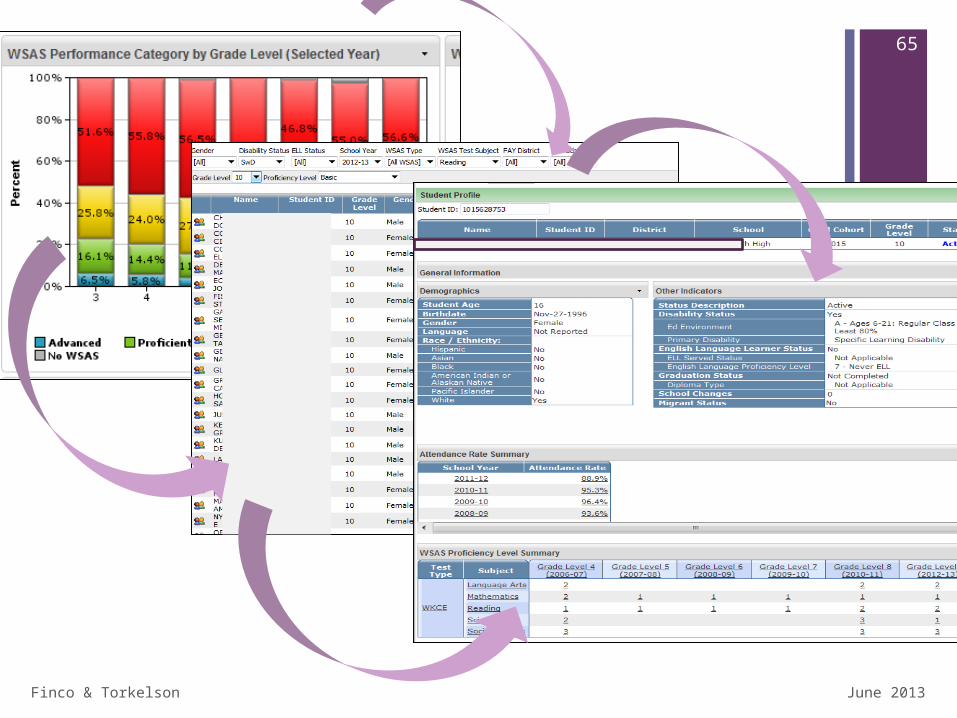
65+
June 2013
Finco & Torkelson
66+ Navigation: Functionality “Must-Knows”
Dashboards
Filtering and clearing filters
Related Dashboards
Hovering
Opening up student lists
Sorting student lists
Individual Student Profiles
Managing layers Selecting and copying Exporting
pdfs Excel ms word
Saving to favorites Recalling favorites
June 2013
Finco & Torkelson
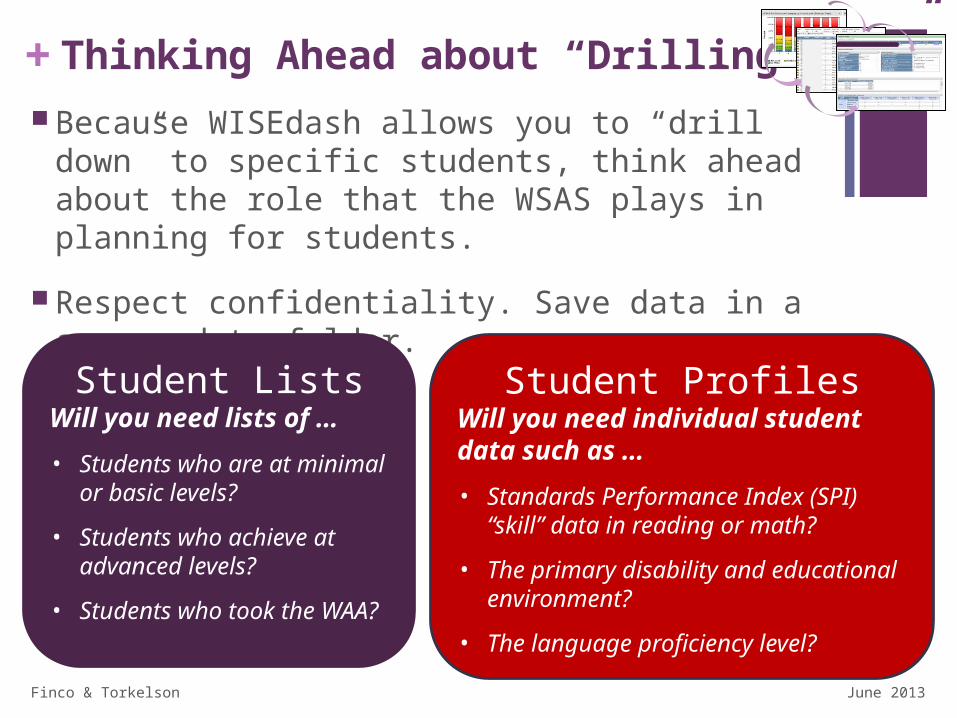
67+Thinking Ahead about “Drilling-Down” Because WISEdash allows you to “drill down” to
specific students, think ahead about the role that the WSAS plays in planning for students.
Respect confidentiality. Save data in a secure data folder.
Student ListsWill you need lists of …
• Students who are at minimal or basic levels?
• Students who achieve at advanced levels?
• Students who took the WAA?
Student ProfilesWill you need individual student data such as …
• Standards Performance Index (SPI) “skill” data in reading or math?
• The primary disability and educational environment?
• The language proficiency level?
June 2013
Finco & Torkelson
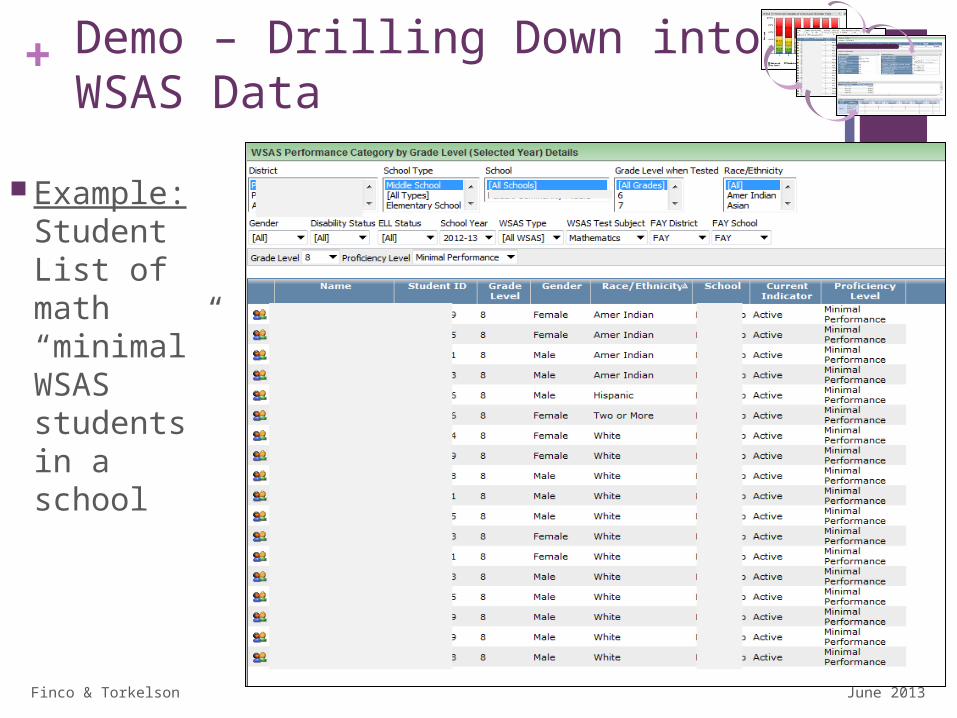
68+ Demo – Drilling Down intoWSAS Data
Example: Student List of math “minimal” WSAS students in a school
June 2013
Finco & Torkelson
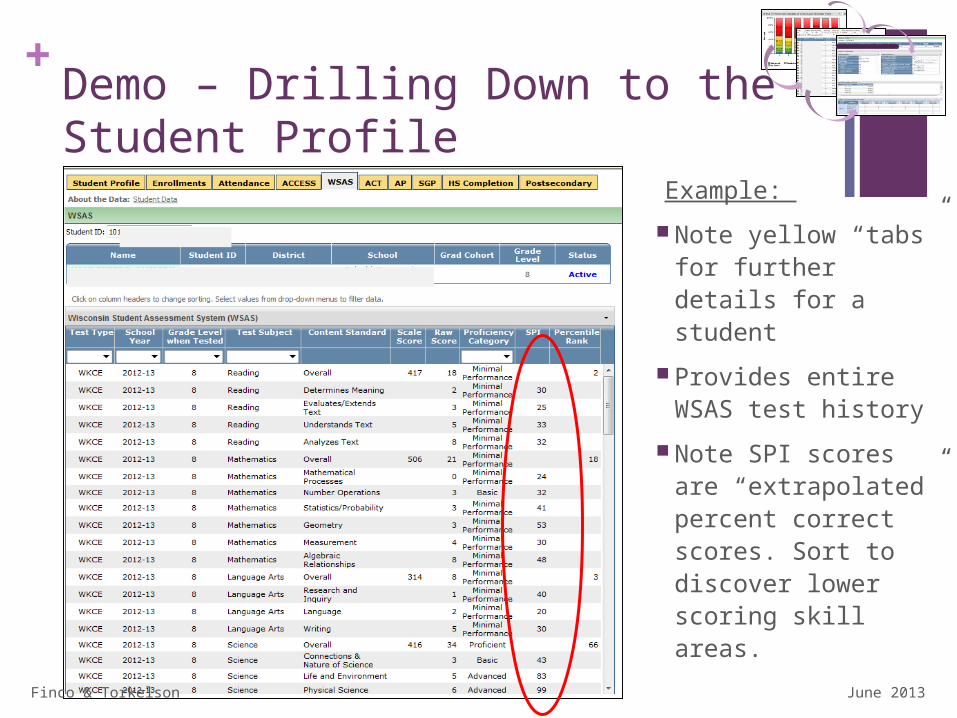
69+Demo – Drilling Down to theStudent Profile
Example:
Note yellow “tabs” for further details for a student
Provides entire WSAS test history
Note SPI scores are “extrapolated” percent correct scores. Sort to discover lower scoring skill areas.
June 2013
Finco & Torkelson
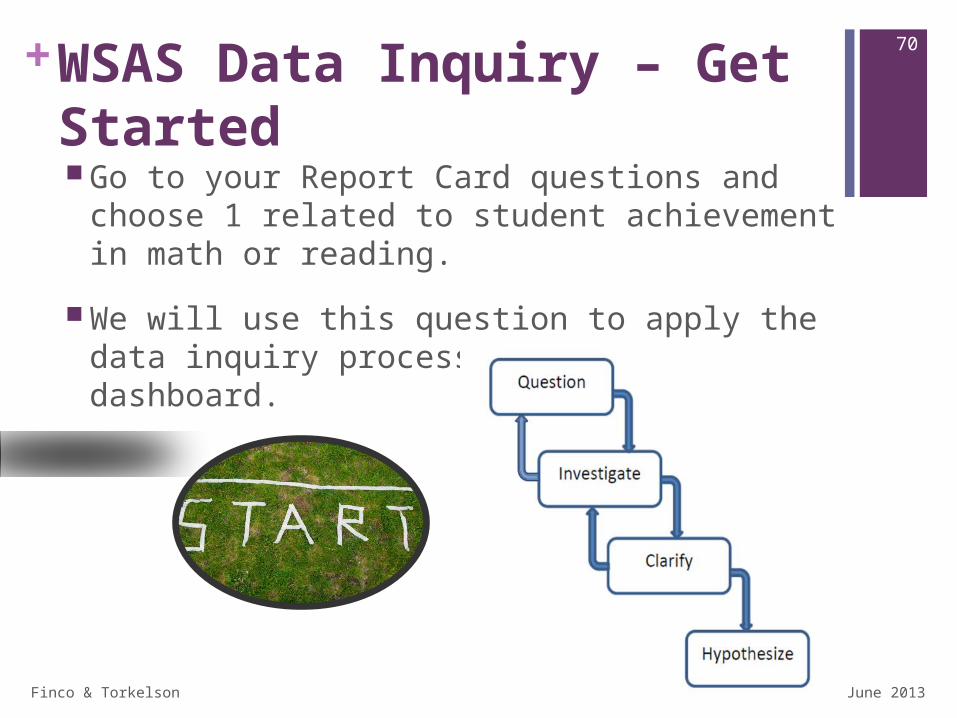
70+WSAS Data Inquiry – Get Started Go to your Report Card questions and choose
1 related to student achievement in math or reading.
We will use this question to apply the data inquiry process to the WSAS dashboard.
June 2013
Finco & Torkelson
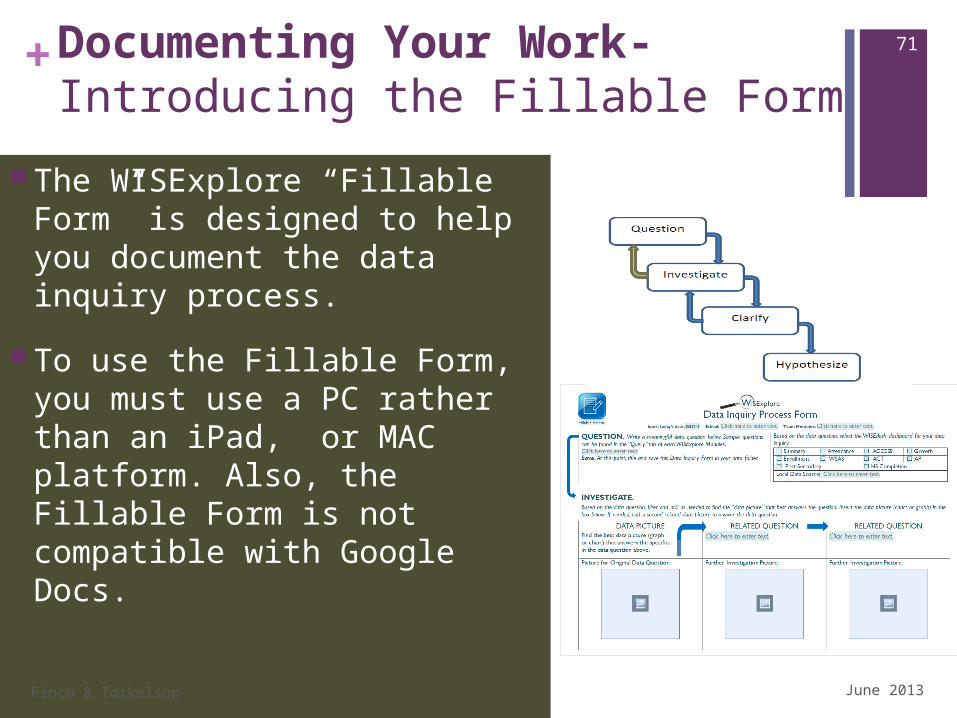
71+Documenting Your Work-Introducing the Fillable Form
The WISExplore “Fillable Form” is designed to help you document the data inquiry process.
To use the Fillable Form, you must use a PC rather than an iPad, or MAC platform. Also, the Fillable Form is not compatible with Google Docs.
June 2013
Finco & Torkelson
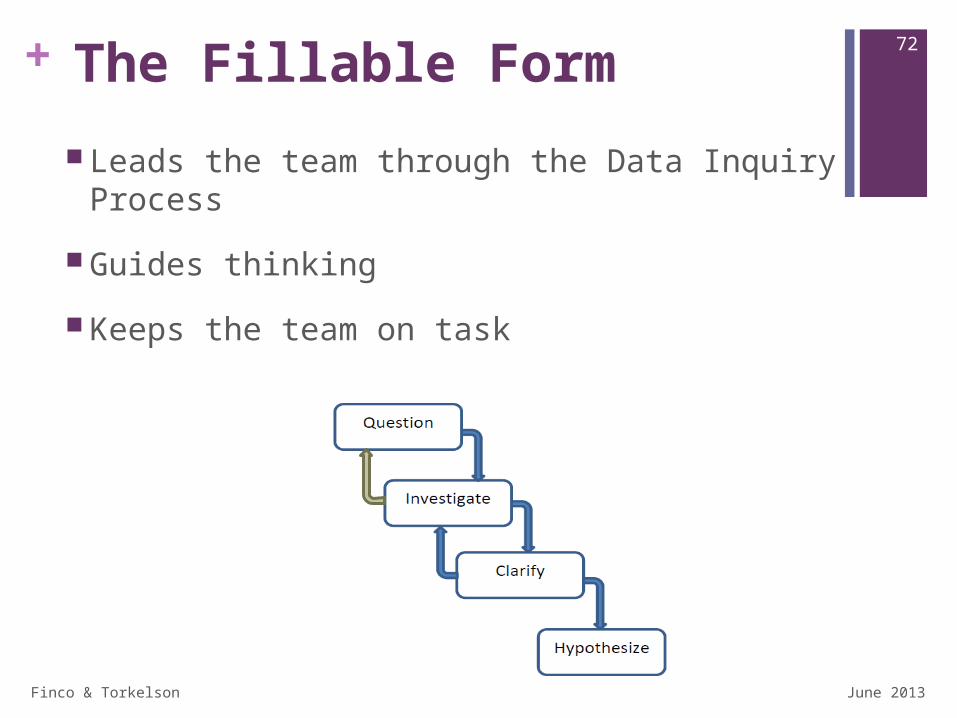
72+ The Fillable Form
Leads the team through the Data Inquiry Process
Guides thinking
Keeps the team on task
June 2013
Finco & Torkelson
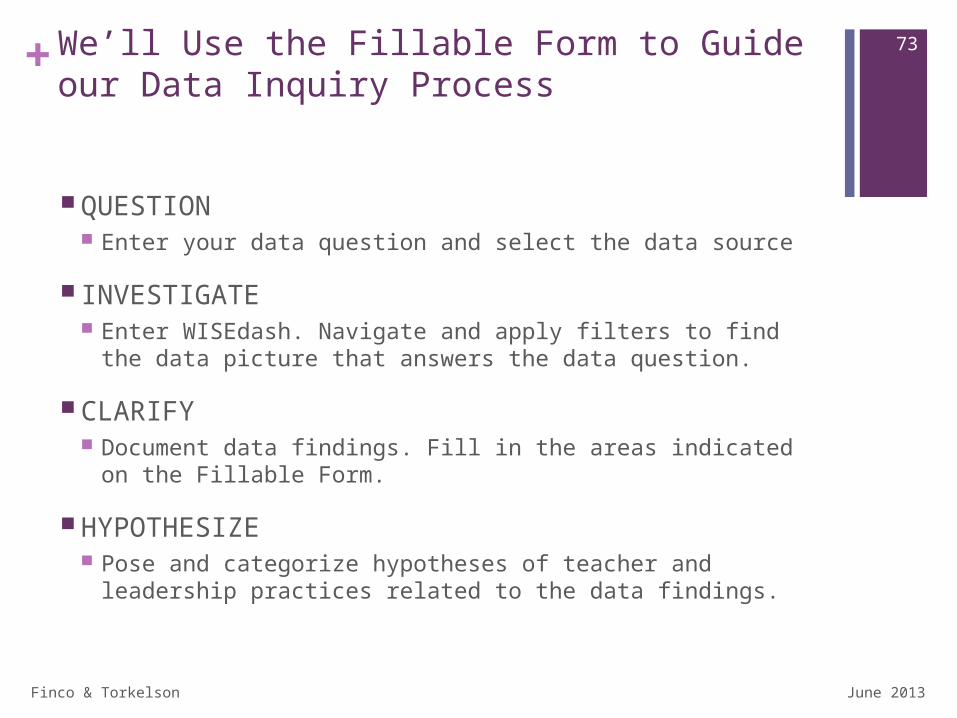
73+We’ll Use the Fillable Form to Guideour Data Inquiry Process
QUESTION Enter your data question and select the data source
INVESTIGATE Enter WISEdash. Navigate and apply filters to find the data
picture that answers the data question.
CLARIFY Document data findings. Fill in the areas indicated on the
Fillable Form.
HYPOTHESIZE Pose and categorize hypotheses of teacher and leadership
practices related to the data findings.
June 2013
Finco & Torkelson
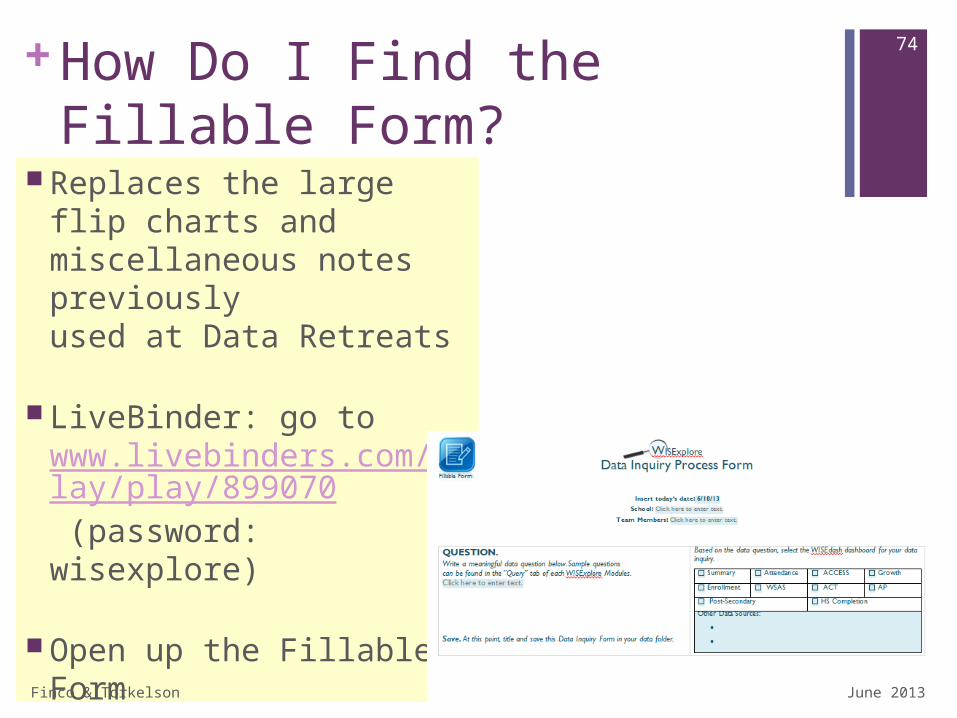
74+How Do I Find the Fillable Form?
Replaces the largeflip charts andmiscellaneous notespreviouslyused at Data Retreats
LiveBinder: go to www.livebinders.com/play/play/899070 (password: wisexplore)
Open up the Fillable Form
June 2013
Finco & Torkelson
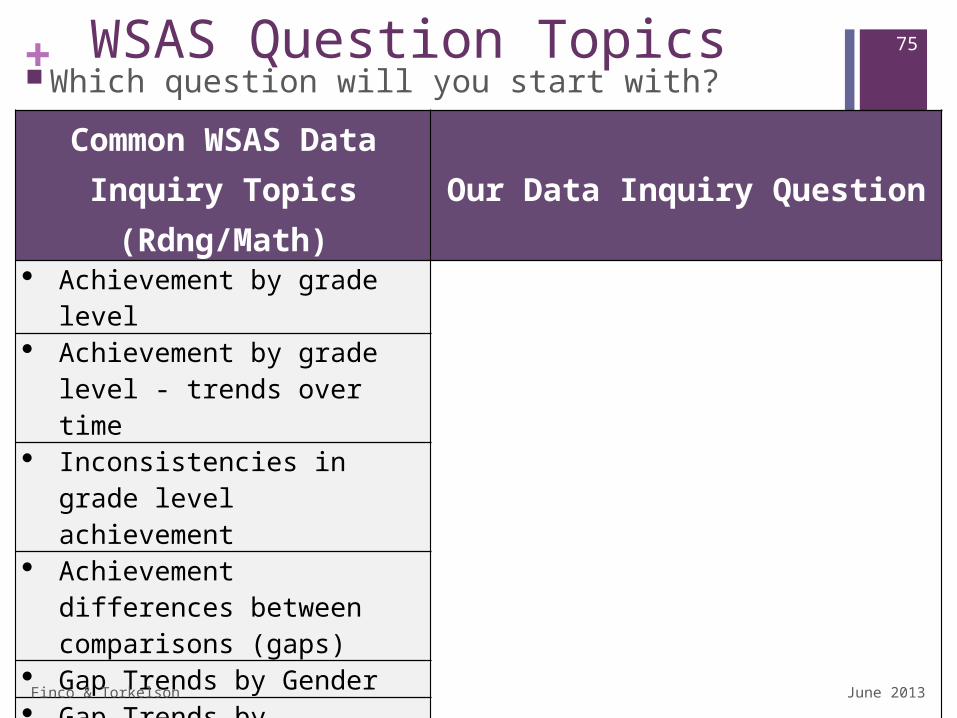
75+ WSAS Question Topics Which question will you start with?
Common WSAS Data Inquiry Topics (Rdng/Math)
Our Data Inquiry Question
Achievement by grade level
Achievement by grade level - trends over time
Inconsistencies in grade level achievement
Achievement differences between comparisons (gaps)
Gap Trends by Gender Gap Trends by Disability Gap Trends by
Race/Ethnicity Gap Trends by ELL Status Gap Trends by Economic
Status
June 2013
Finco & Torkelson
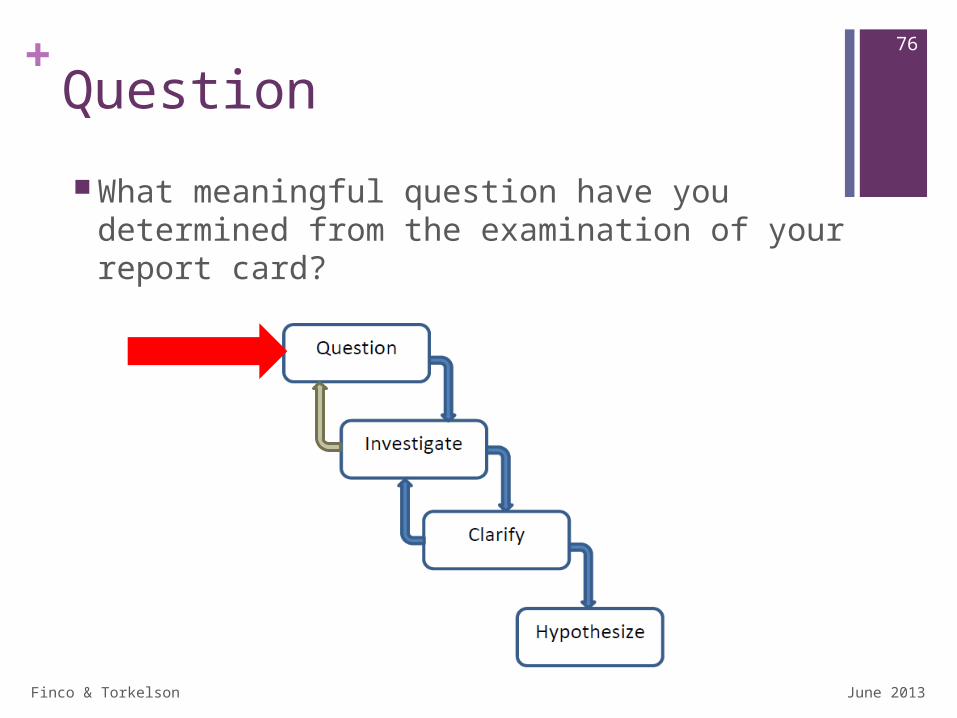
76+Question
What meaningful question have you determined from the examination of your report card?
June 2013
Finco & Torkelson
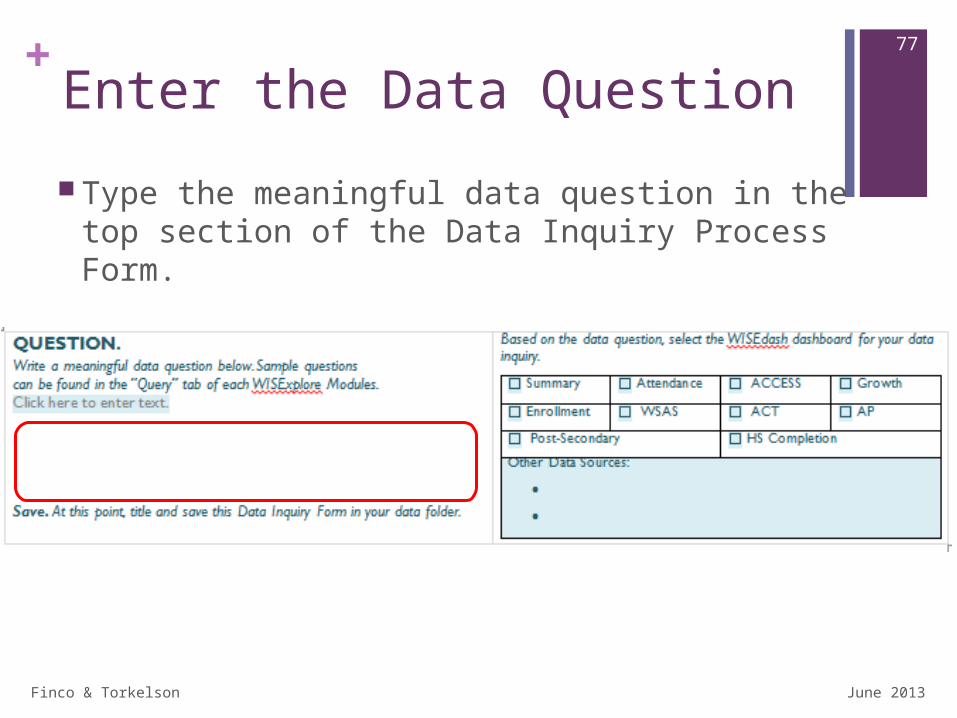
77+Enter the Data Question
Type the meaningful data question in the top section of the Data Inquiry Process Form.
June 2013
Finco & Torkelson
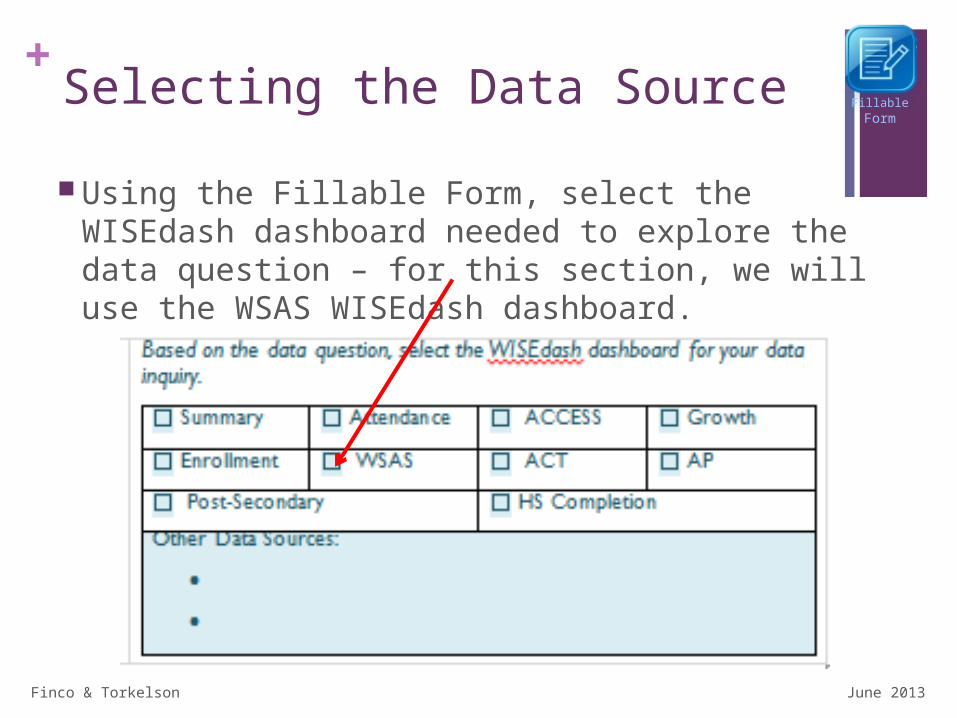
78+Selecting the Data Source
Using the Fillable Form, select the WISEdash dashboard needed to explore the data question – for this section, we will use the WSAS WISEdash dashboard.
June 2013
Fillable Form
Finco & Torkelson
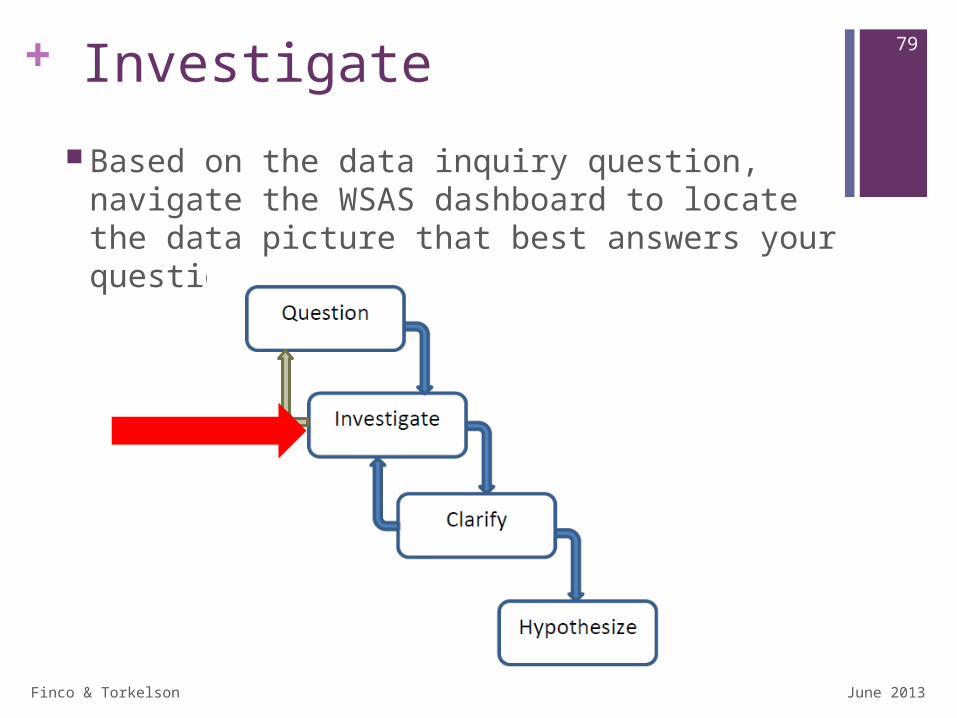
79+ Investigate
Based on the data inquiry question, navigate the WSAS dashboard to locate the data picture that best answers your question.
June 2013
Finco & Torkelson
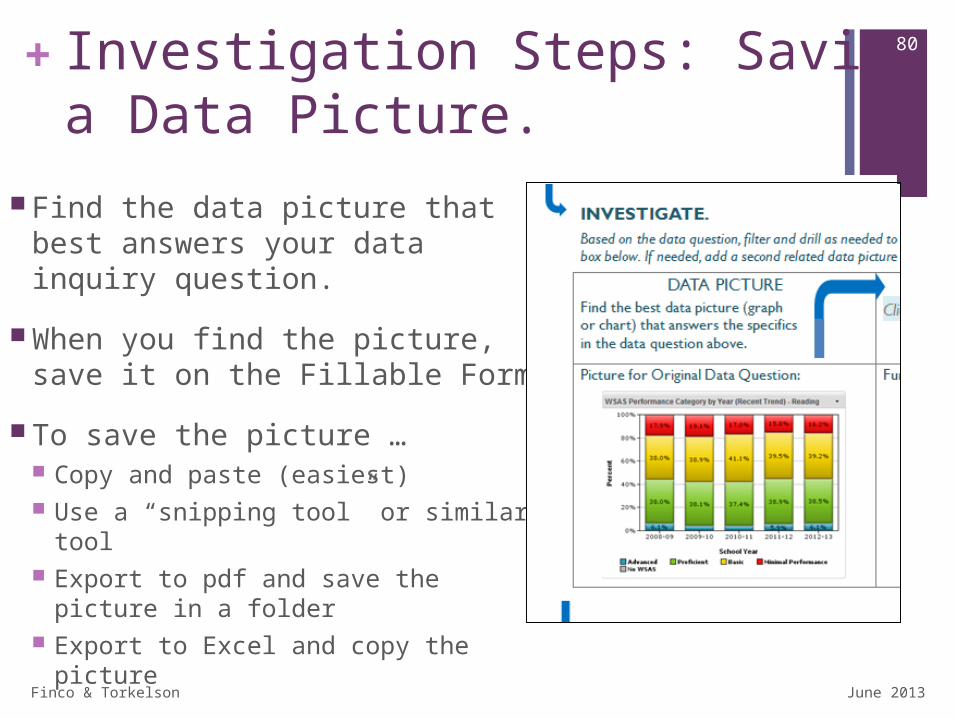
80+Investigation Steps: Saving a Data Picture.
Find the data picture that best answers your data inquiry question.
When you find the picture, save it on the Fillable Form.
To save the picture … Copy and paste (easiest) Use a “snipping tool” or similar tool Export to pdf and save the picture in
a folder Export to Excel and copy the picture
June 2013
Finco & Torkelson
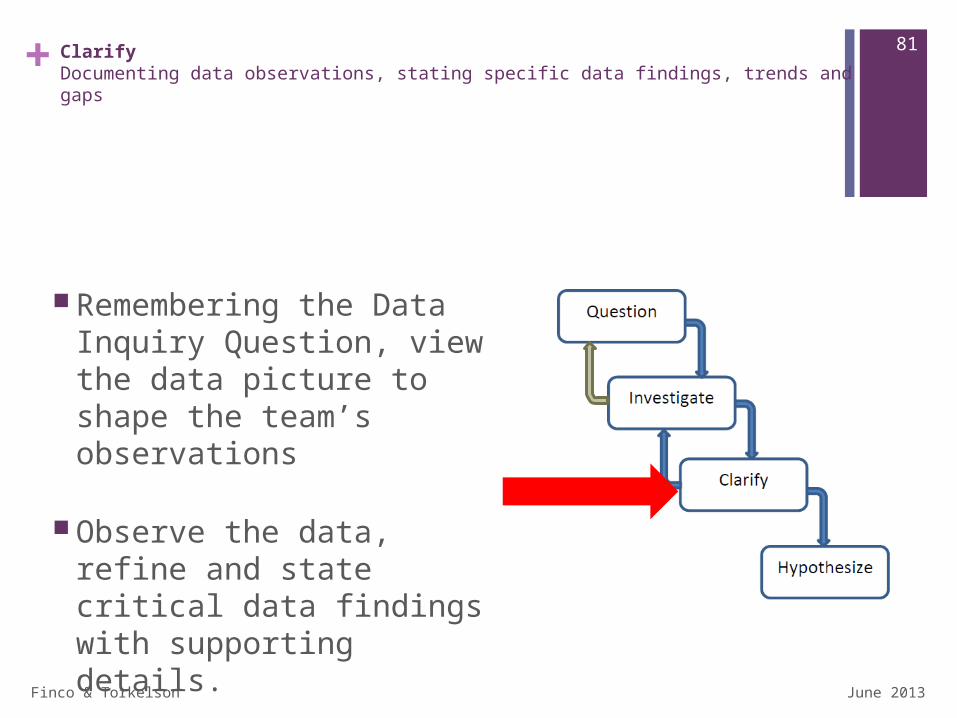
81+ClarifyDocumenting data observations, stating specific data findings, trends and gaps
Remembering the Data Inquiry Question, view the data picture to shape the team’s observations
Observe the data, refine and state critical data findings with supporting details.
June 2013
Finco & Torkelson
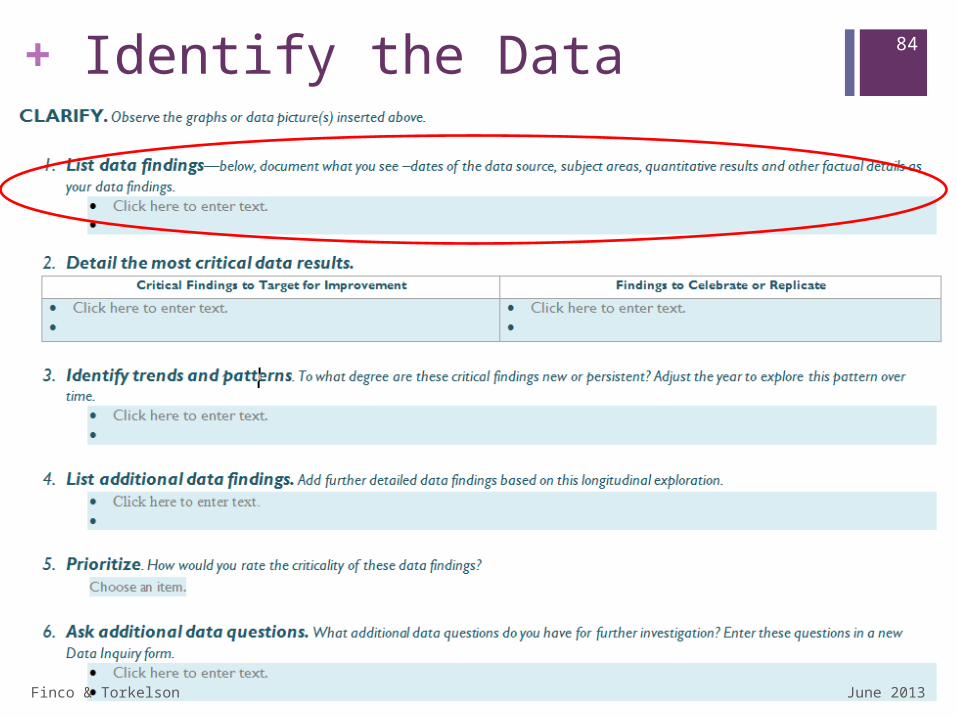
82+ List the Data Findings
With the Inquiry Data Question in mind, describe the data findings.
What do you see in the data picture? What patterns do you observe?
June 2013
Well-written data findings:• Are objective – just facts, not opinions or questions• Are precise (include the data)• Are statements (complete sentences) understandable
by stakeholders• Include the test type and subject• Include the timeframe for the findings• Include the specific group of students
Finco & Torkelson
83+Sample Data Findings
June 2013
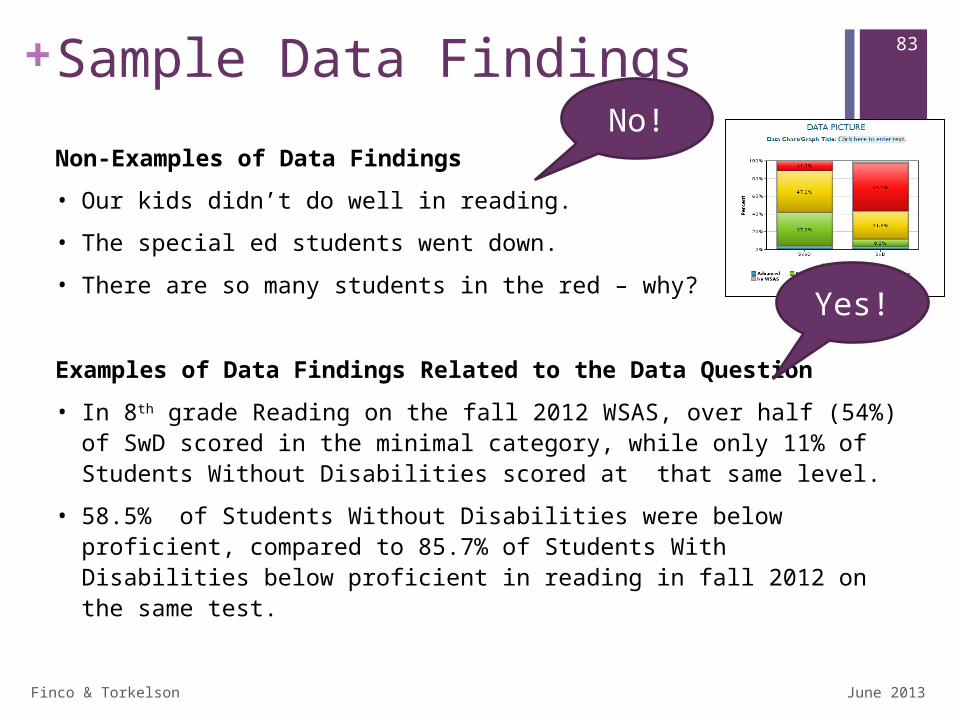
Non-Examples of Data Findings
• Our kids didn’t do well in reading.
• The special ed students went down.
• There are so many students in the red – why?
Examples of Data Findings Related to the Data Question
• In 8th grade Reading on the fall 2012 WSAS, over half (54%) of SwD scored in the minimal category, while only 11% of Students Without Disabilities scored at that same level.
• 58.5% of Students Without Disabilities were below proficient, compared to 85.7% of Students With Disabilities below proficient in reading in fall 2012 on the same test.
No!
Yes!
Finco & Torkelson
84+ Identify the Data Findings
June 2013
Finco & Torkelson
85+ Criticality
June 2013
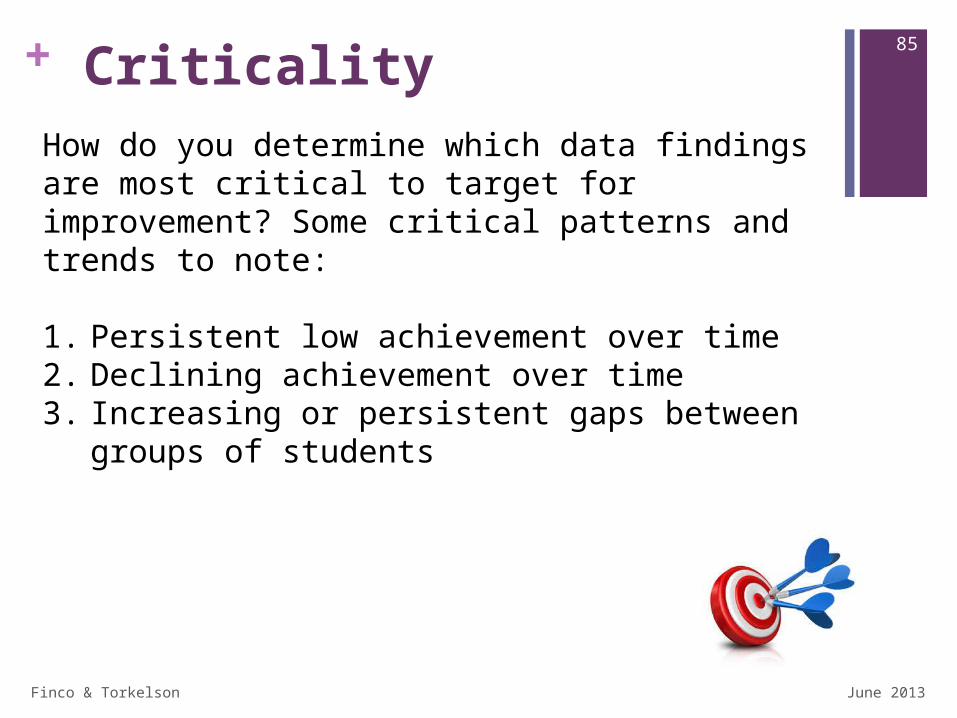
How do you determine which data findings are most critical to target for improvement? Some critical patterns and trends to note:
1. Persistent low achievement over time2. Declining achievement over time3. Increasing or persistent gaps between groups
of students
Finco & Torkelson
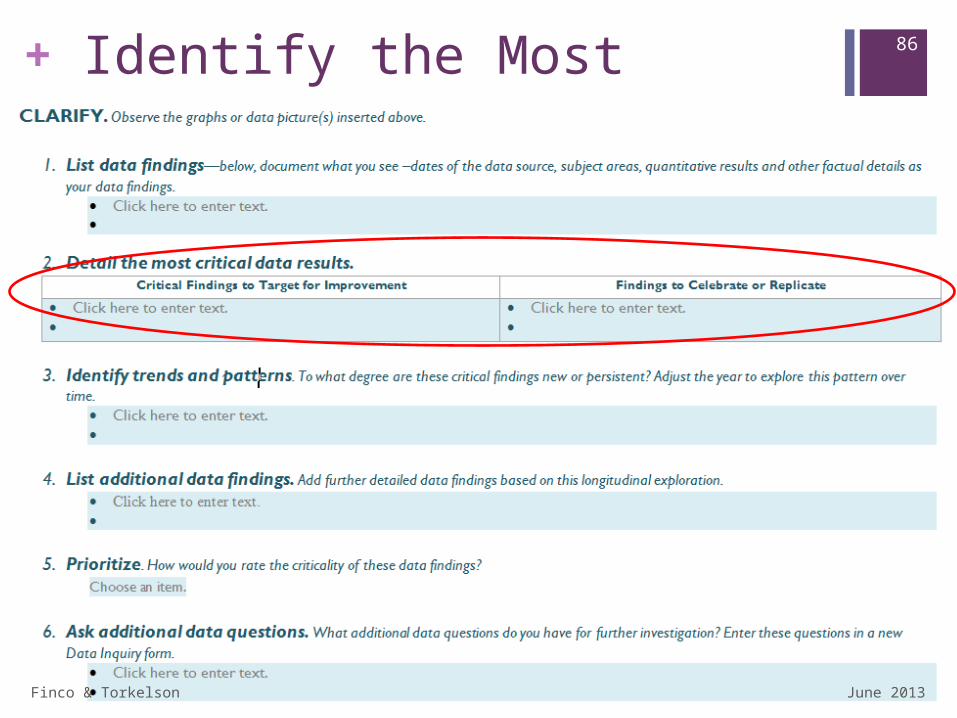
86+ Identify the Most Critical
June 2013
Finco & Torkelson
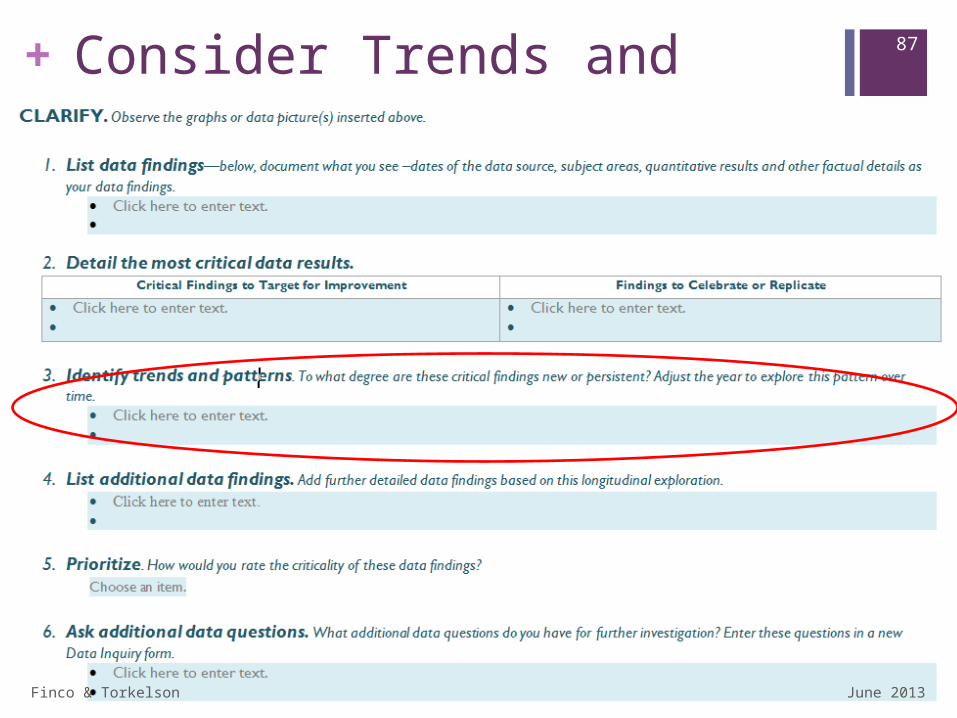
87+ Consider Trends and Patterns
June 2013
Finco & Torkelson
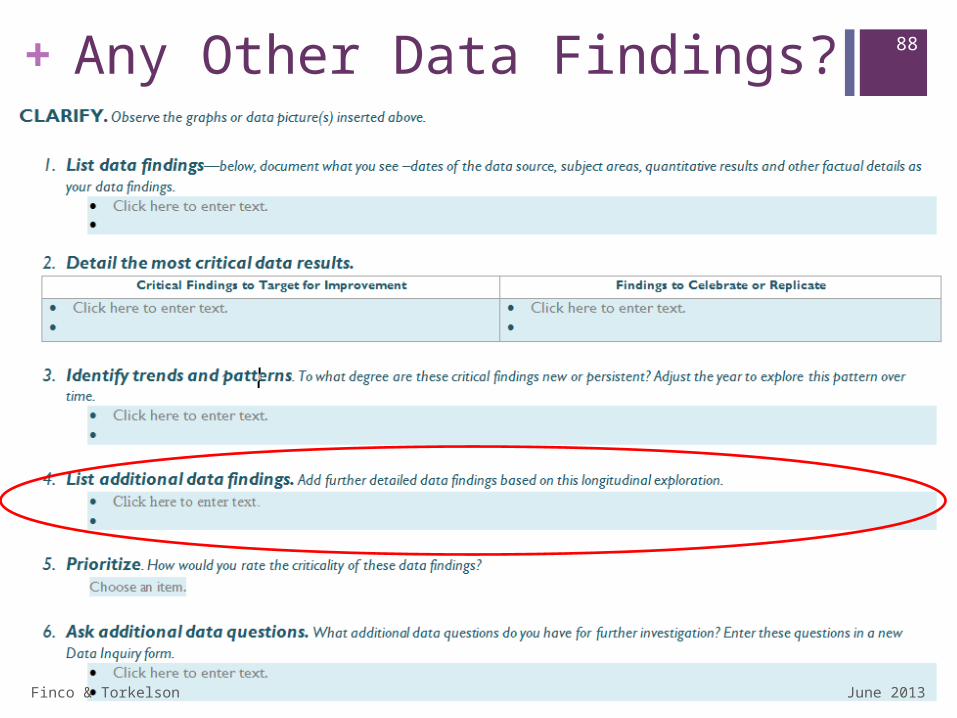
88+ Any Other Data Findings?
June 2013
Finco & Torkelson
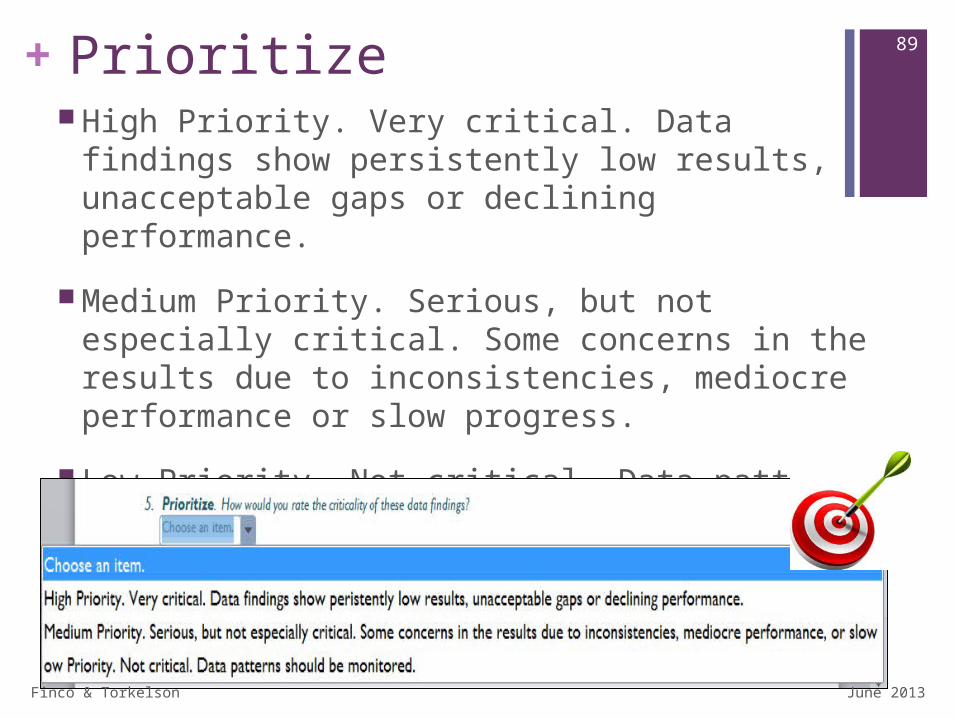
89+Prioritize High Priority. Very critical. Data findings show
persistently low results, unacceptable gaps or declining performance.
Medium Priority. Serious, but not especially critical. Some concerns in the results due to inconsistencies, mediocre performance or slow progress.
Low Priority. Not critical. Data patterns should be monitored.
June 2013
Finco & Torkelson
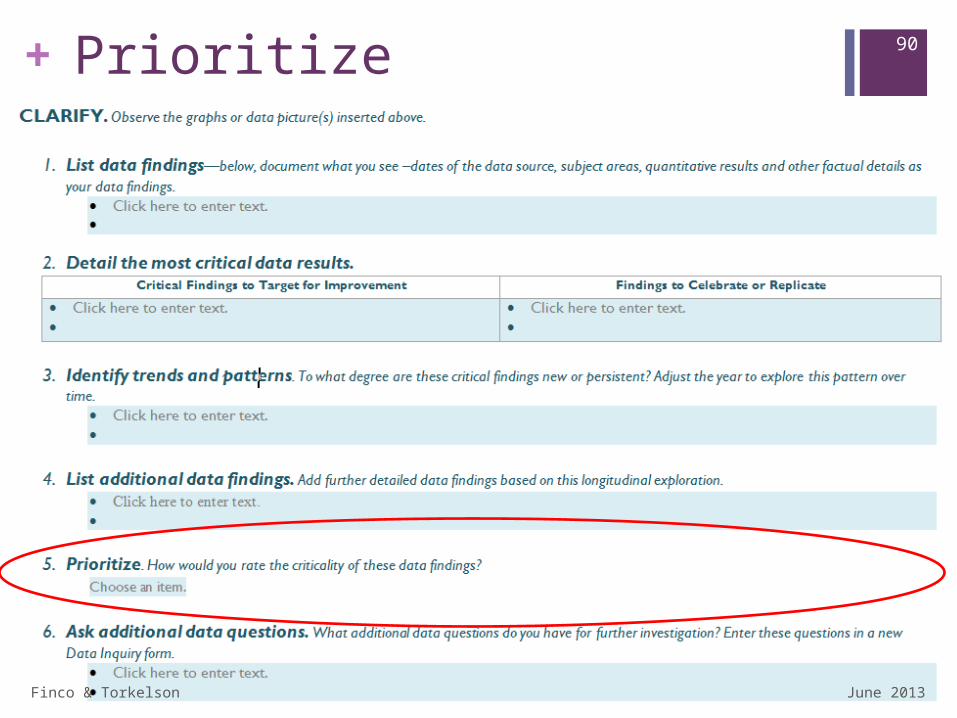
90+ Prioritize
June 2013
Finco & Torkelson
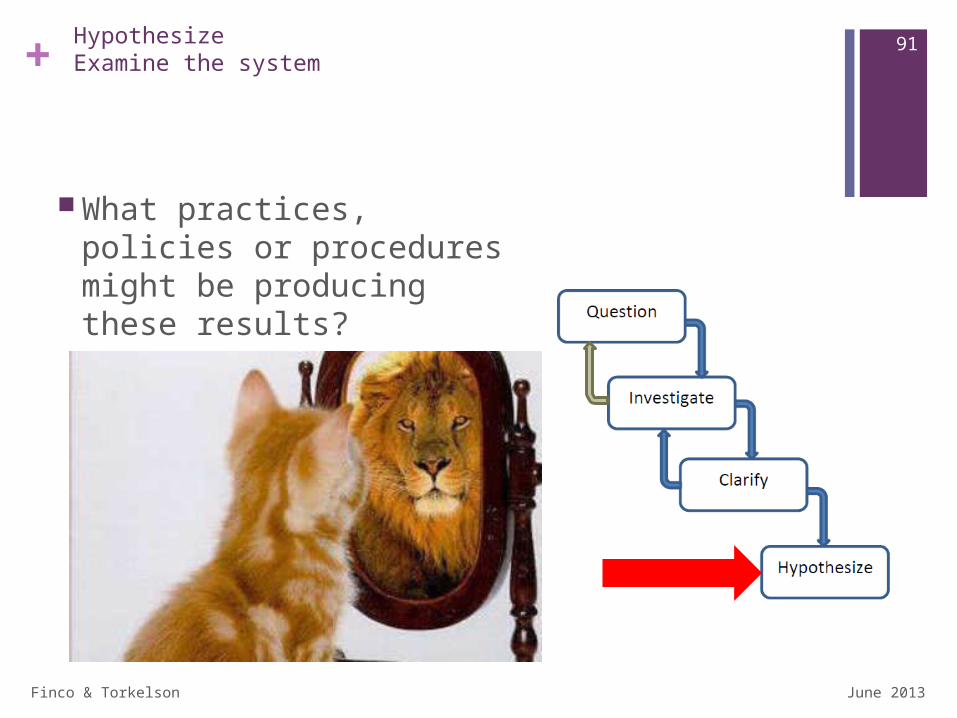
91+ HypothesizeExamine the system
What practices, policies or procedures might be producing these results?
June 2013
Finco & Torkelson
92+Hypothesize Getting to Root Causes
June 2013
Finco & Torkelson
93+ Hypotheses of Practice
Posing educated guesses about school or classroom practices as possible underlying root causes for critical data findings.
June 2013
Finco & Torkelson
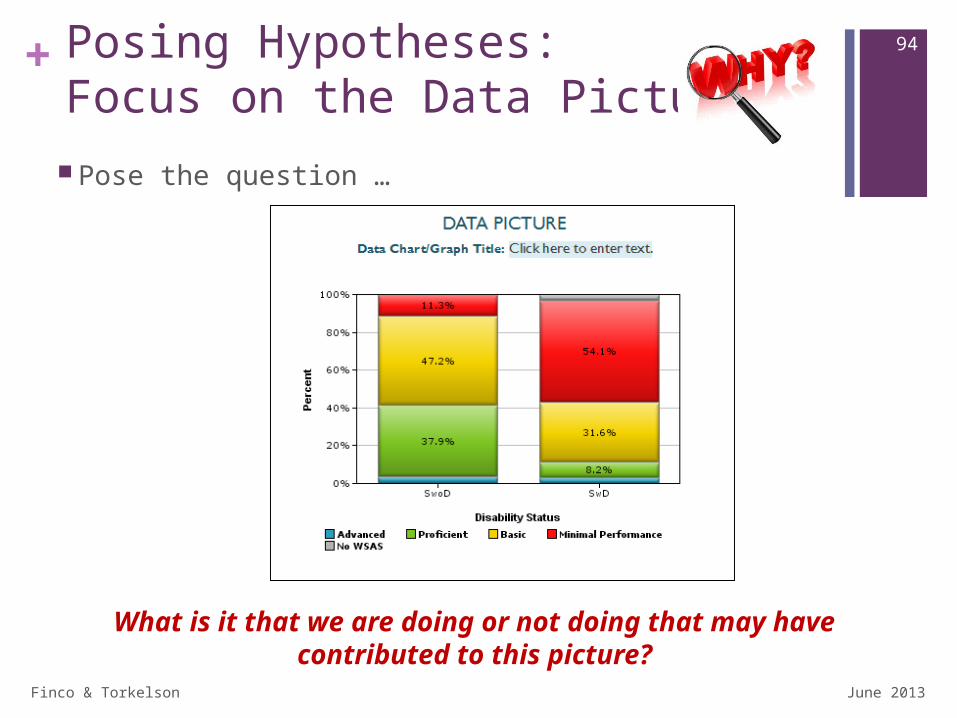
94+Posing Hypotheses: Focus on the Data Picture
Pose the question …
What is it that we are doing or not doing that may have contributed to this picture?
June 2013
Finco & Torkelson
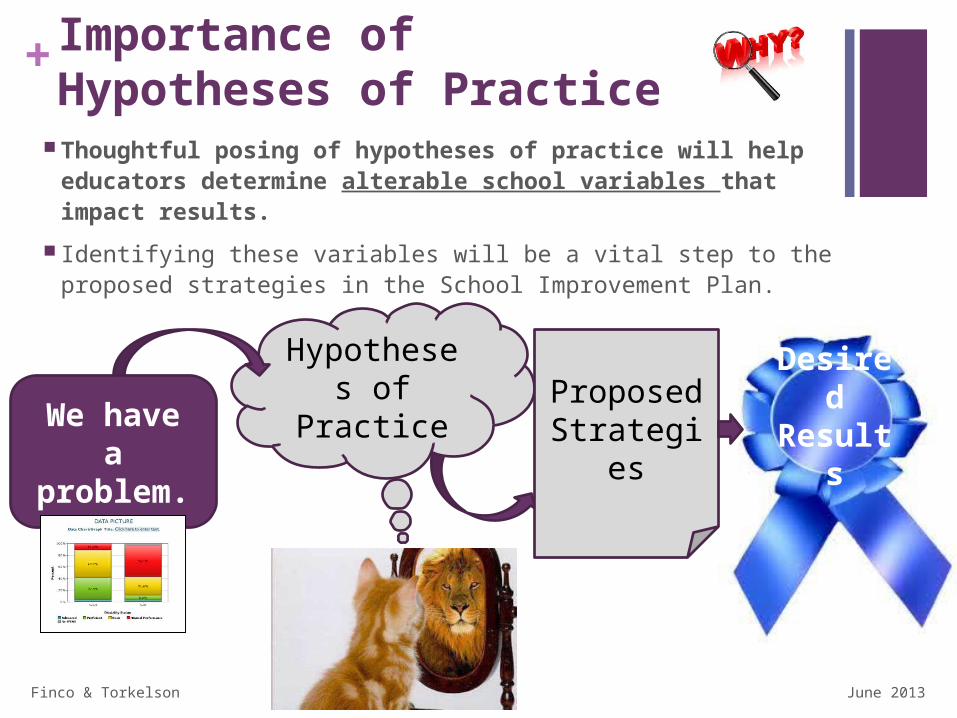
+Importance ofHypotheses of Practice
Thoughtful posing of hypotheses of practice will help educators determine alterable school variables that impact results.
Identifying these variables will be a vital step to the proposed strategies in the School Improvement Plan.
June 201395
We have a
problem.
Hypotheses of
Practice Proposed Strategies
Desired
Results
Finco & Torkelson
+ Posing Hypotheses of Practice
Take quiet time to think about all of the causes for the data pattern.
Translate each “cause” into a “hypothesis of practice”.
Hypotheses of practice … Are our best educated guesses about what “we” are doing
or not doing that could be contributing to the results Are guided by the data findings Are shaped by both perceptions of practices and
professional experiences in the school Are guided by research-based practices Never place blame on student or family characteristics, or
any other unalterable factors June 201396
Finco & Torkelson
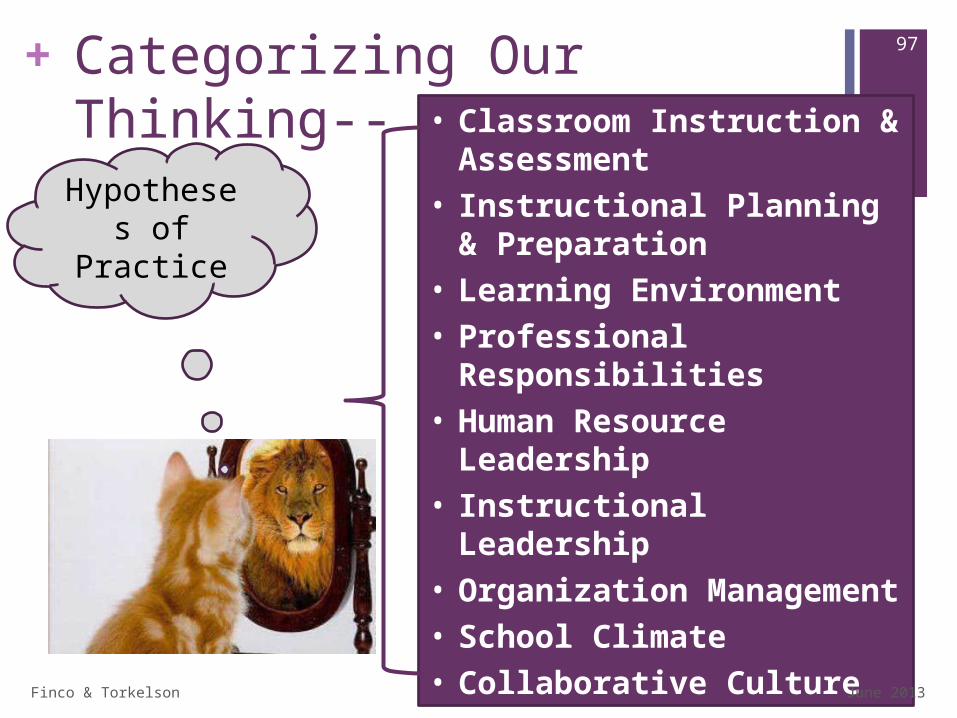
97+ Categorizing Our Thinking--
Hypotheses of
Practice
• Classroom Instruction & Assessment
• Instructional Planning & Preparation
• Learning Environment• Professional
Responsibilities• Human Resource
Leadership• Instructional Leadership• Organization
Management• School Climate• Collaborative Culture• Stakeholder
Relationships
June 2013
Finco & Torkelson
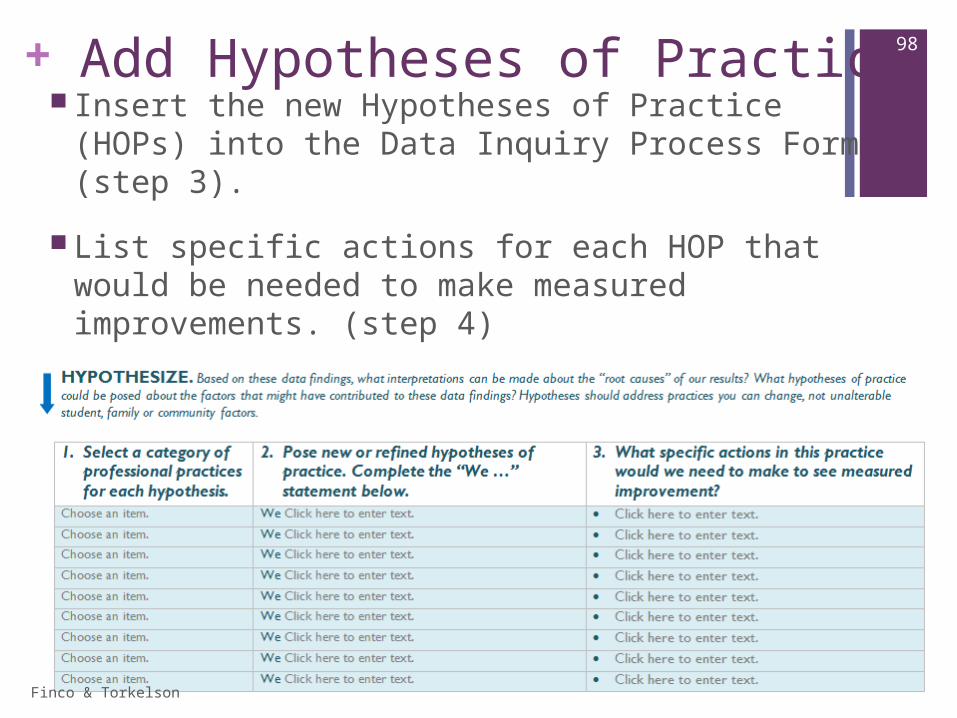
98+ Add Hypotheses of Practice Insert the new Hypotheses of Practice (HOPs) into
the Data Inquiry Process Form (step 3).
List specific actions for each HOP that would be needed to make measured improvements. (step 4)
For each HOP, select the appropriate category of improvement. (step 5).
June 2013
Finco & Torkelson
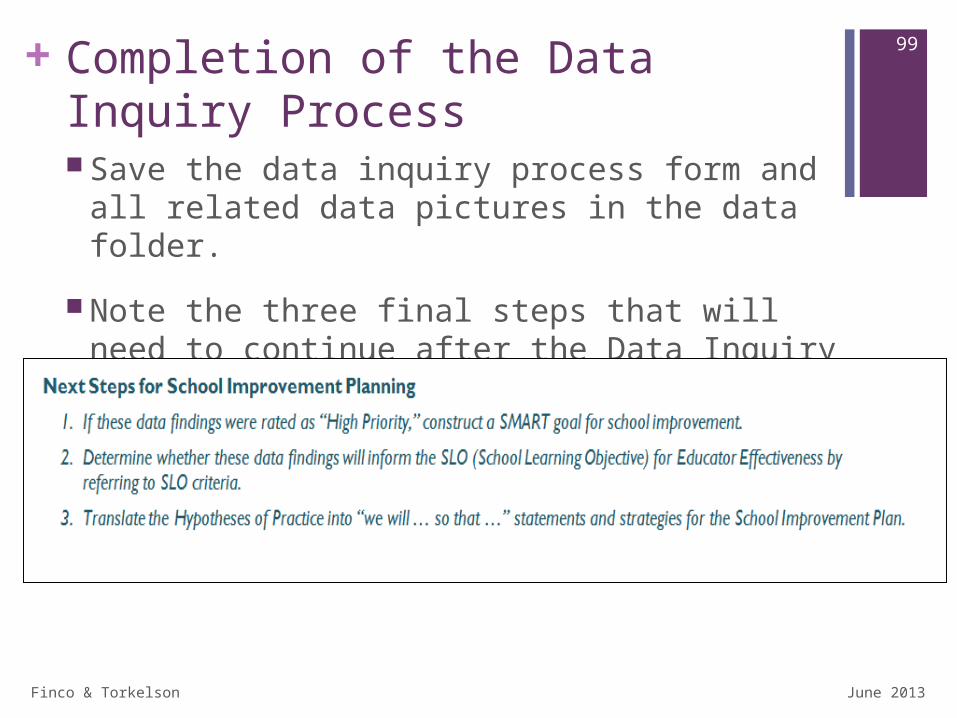
99+Completion of the Data Inquiry Process Save the data inquiry process form and all
related data pictures in the data folder.
Note the three final steps that will need to continue after the Data Inquiry Process.
June 2013

100+
June 2013
Finco & Torkelson
101+
What did you learn through this Inquiry Process?
Reflecting…
June 2013

102+
June 2013
Finco & Torkelson
+
Growth Dashboard Inquiry
103
Summer 2013
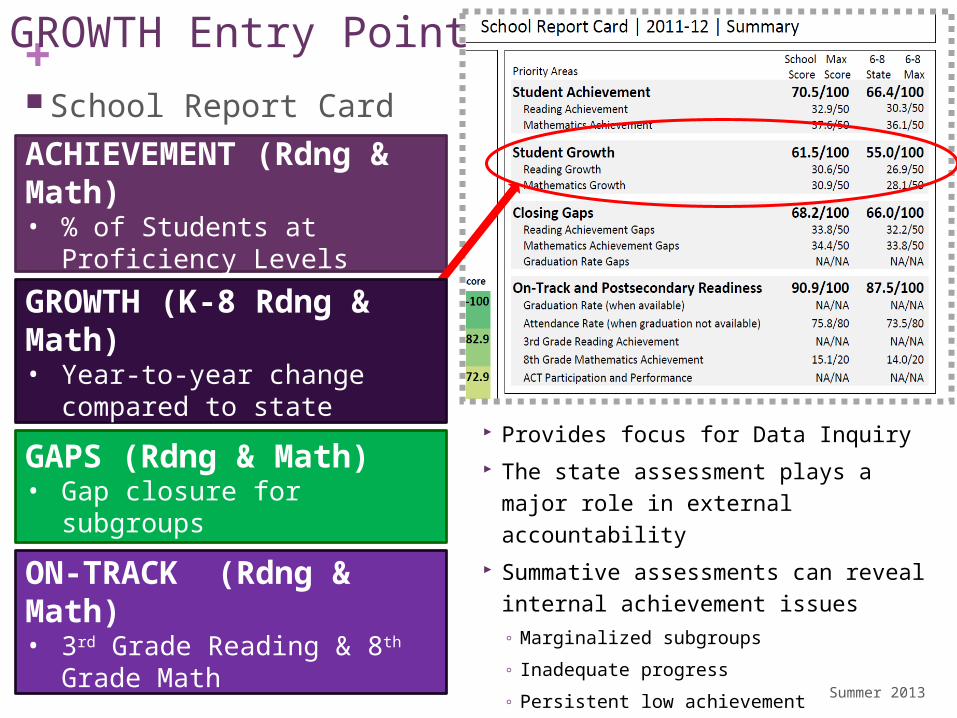
104+GROWTH Entry Points
School Report Card
ACHIEVEMENT (Rdng & Math)• % of Students at Proficiency
Levels
GAPS (Rdng & Math)• Gap closure for subgroups
ON-TRACK (Rdng & Math)• 3rd Grade Reading & 8th
Grade Math
Provides focus for Data Inquiry The state assessment plays a major
role in external accountability Summative assessments can reveal
internal achievement issues◦ Marginalized subgroups
◦ Inadequate progress
◦ Persistent low achievement
GROWTH (K-8 Rdng & Math)• Year-to-year change
compared to state
Summer 2013
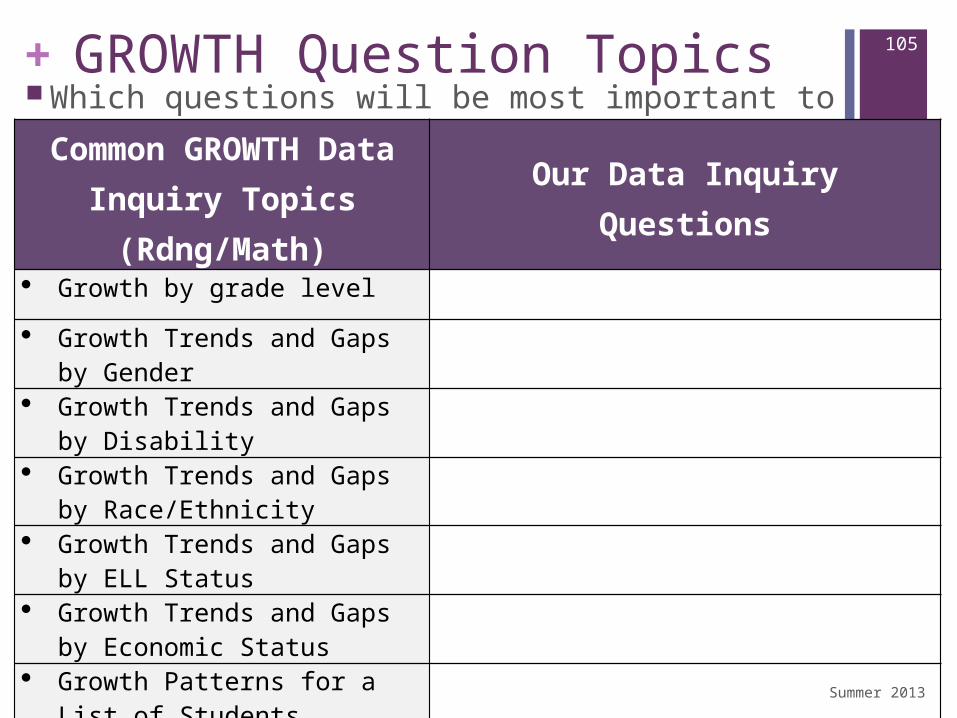
105+ GROWTH Question Topics Which questions will be most important to
explore?Common GROWTH Data Inquiry Topics
(Rdng/Math)Our Data Inquiry Questions
Growth by grade level Growth Trends and Gaps by
Gender
Growth Trends and Gaps by Disability
Growth Trends and Gaps by
Race/Ethnicity
Growth Trends and Gaps by ELL Status
Growth Trends and Gaps by
Economic Status
Growth Patterns for a List of Students
Growth Patterns for an Individual Student Summer 2013
Finco & Torkelson
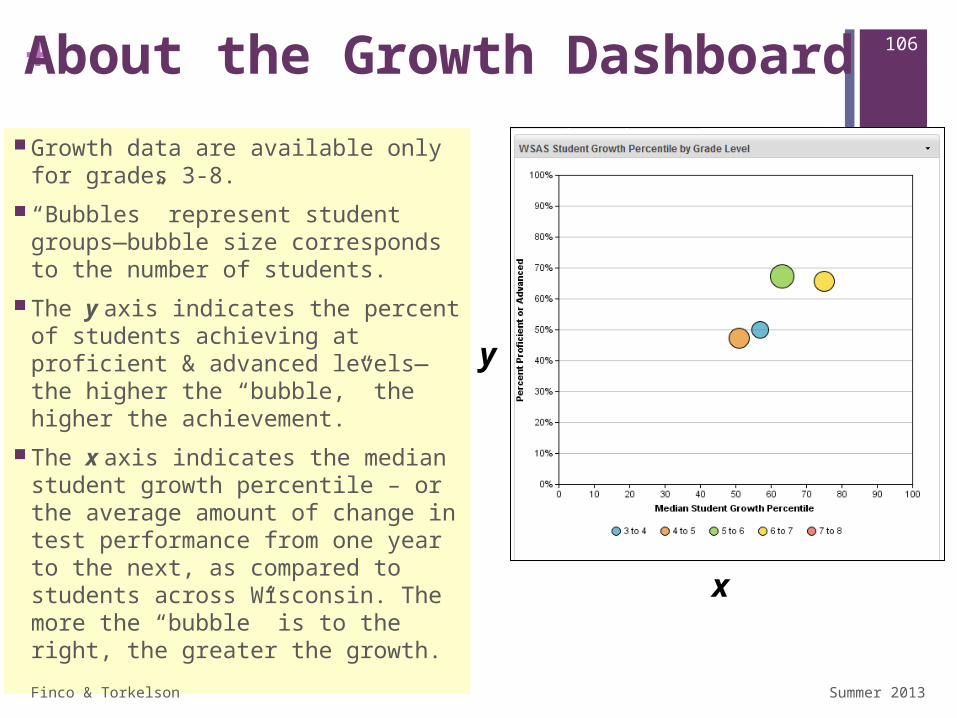
106+ About the Growth Dashboard
Growth data are available only for grades 3-8.
“Bubbles” represent student groups—bubble size corresponds to the number of students.
The y axis indicates the percent of students achieving at proficient & advanced levels—the higher the “bubble,” the higher the achievement.
The x axis indicates the median student growth percentile – or the average amount of change in test performance from one year to the next, as compared to students across Wisconsin. The more the “bubble” is to the right, the greater the growth.
x
y
Summer 2013
Finco & Torkelson
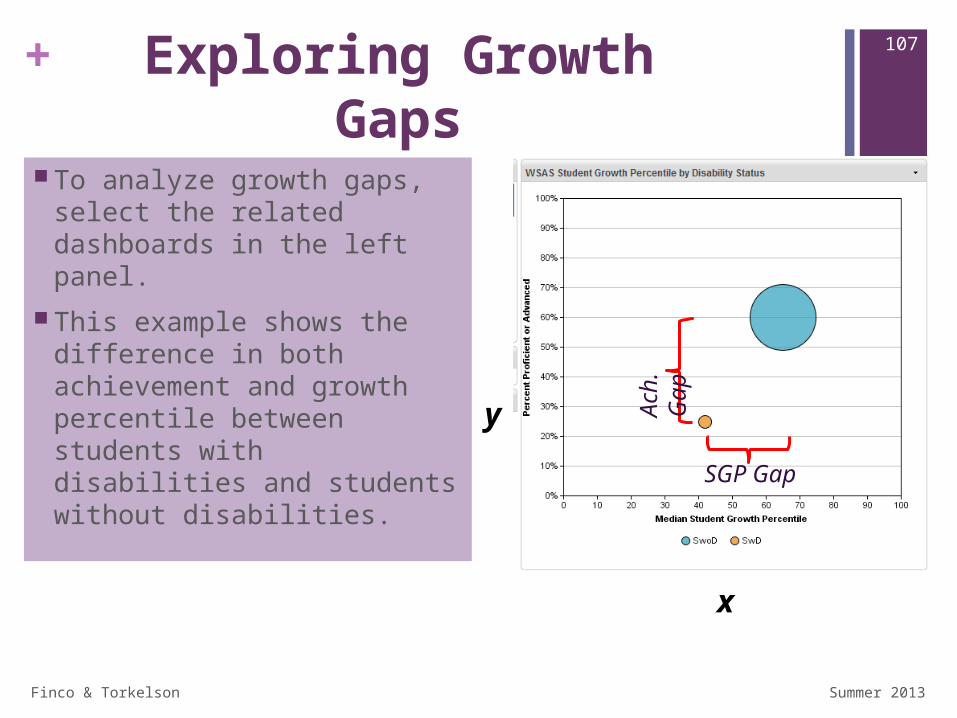
107+ Exploring Growth Gaps
To analyze growth gaps, select the related dashboards in the left panel.
This example shows the difference in both achievement and growth percentile between students with disabilities and students without disabilities.
x
y
SGP Gap
Ach
. G
ap
Summer 2013
Finco & Torkelson
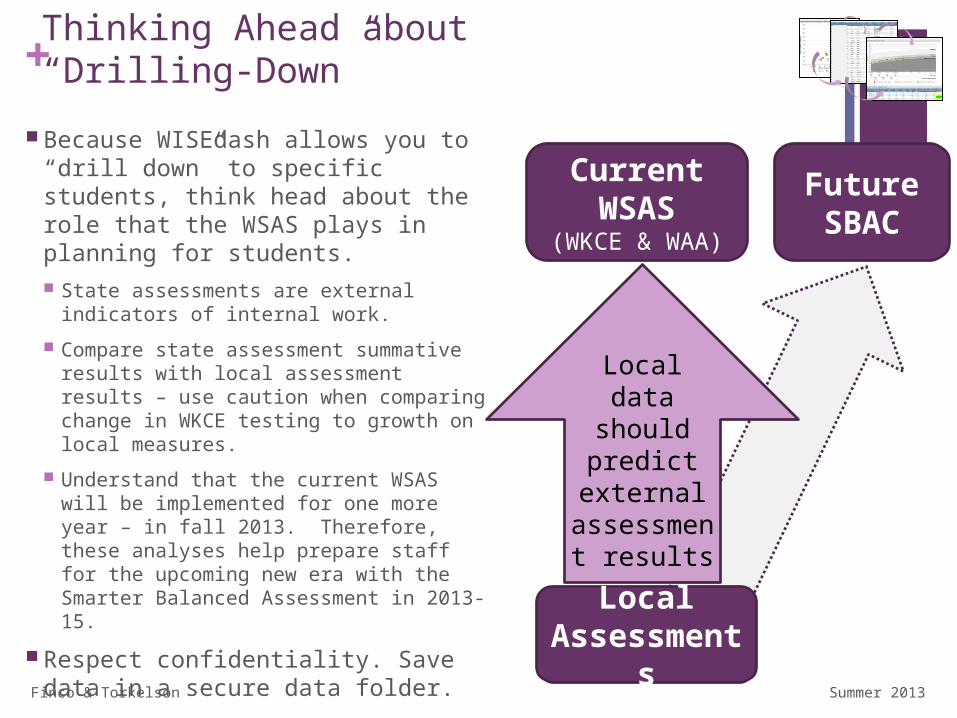
108+Thinking Ahead about“Drilling-Down”
Because WISEdash allows you to “drill down” to specific students, think head about the role that the WSAS plays in planning for students. State assessments are external
indicators of internal work.
Compare state assessment summative results with local assessment results – use caution when comparing change in WKCE testing to growth on local measures.
Understand that the current WSAS will be implemented for one more year – in fall 2013. Therefore, these analyses help prepare staff for the upcoming new era with the Smarter Balanced Assessment in 2013-15.
Respect confidentiality. Save data in a secure data folder.
CurrentWSAS
(WKCE & WAA)
FutureSBAC
Local Assessme
nts
Local data should predict external
assessment results
Summer 2013
Finco & Torkelson
109+
Summer 2013
+Thinking Ahead about“Drilling-Down”
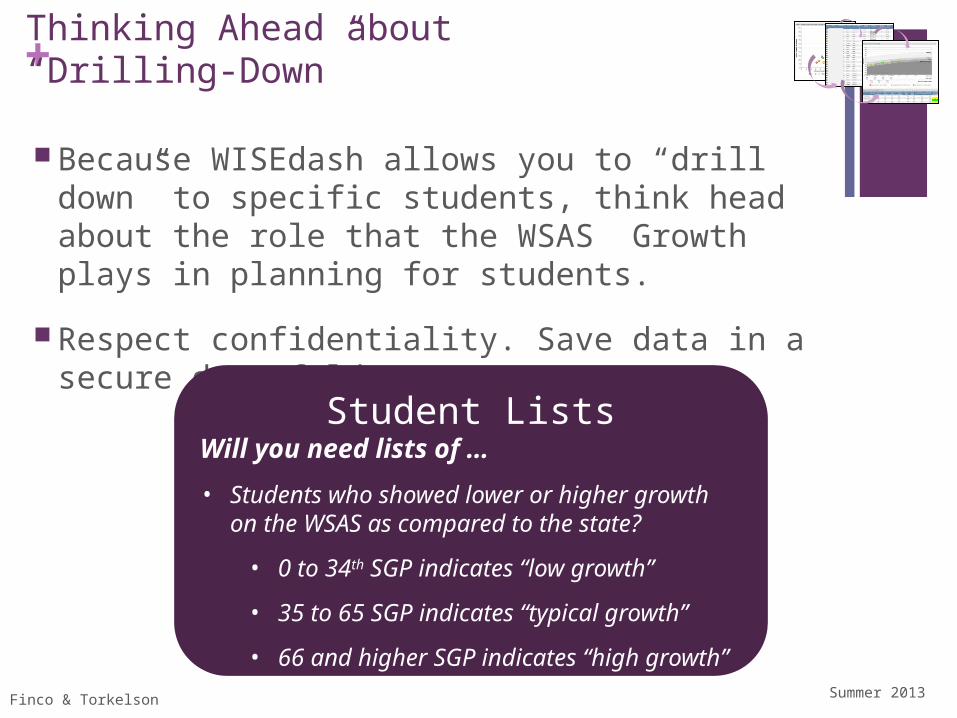
Because WISEdash allows you to “drill down” to specific students, think head about the role that the WSAS Growth plays in planning for students.
Respect confidentiality. Save data in a secure data folder.
110
Student ListsWill you need lists of …
• Students who showed lower or higher growth on the WSAS as compared to the state?
• 0 to 34th SGP indicates “low growth”
• 35 to 65 SGP indicates “typical growth”
• 66 and higher SGP indicates “high growth”
Summer 2013Finco & Torkelson
Finco & Torkelson
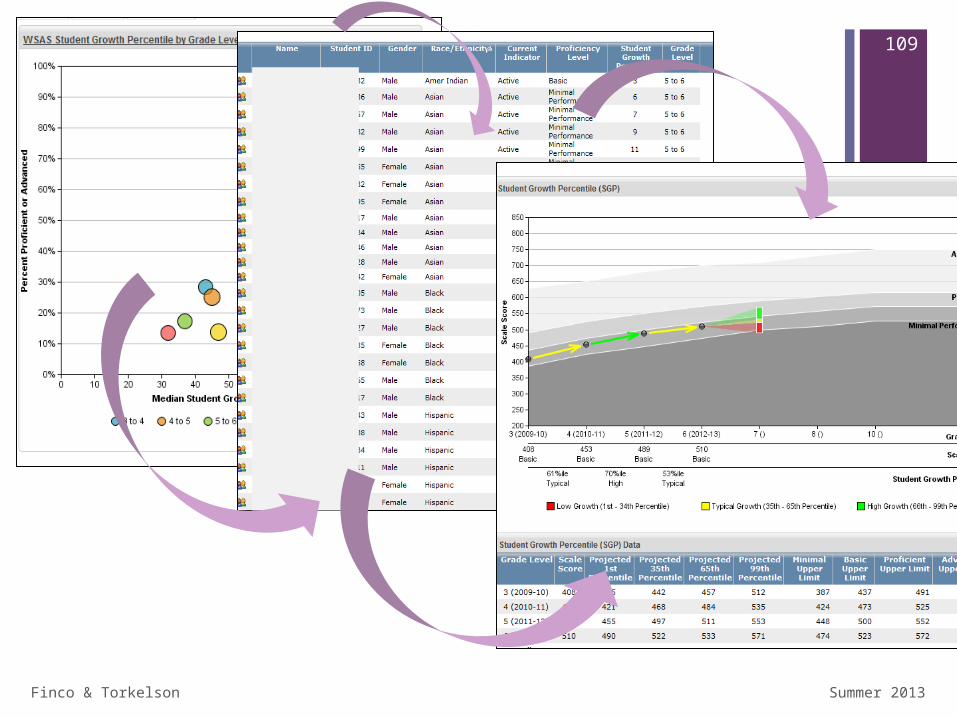
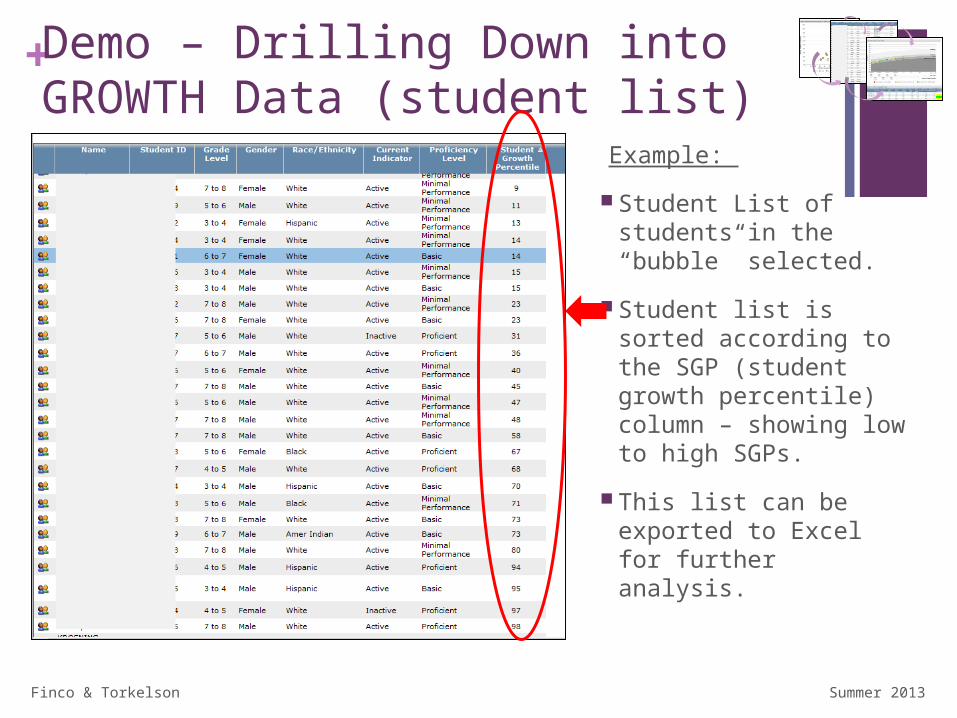
111+Demo – Drilling Down into GROWTH Data (student list)
Example:
Student List of students in the “bubble” selected.
Student list is sorted according to the SGP (student growth percentile) column – showing low to high SGPs.
This list can be exported to Excel for further analysis.
Summer 2013
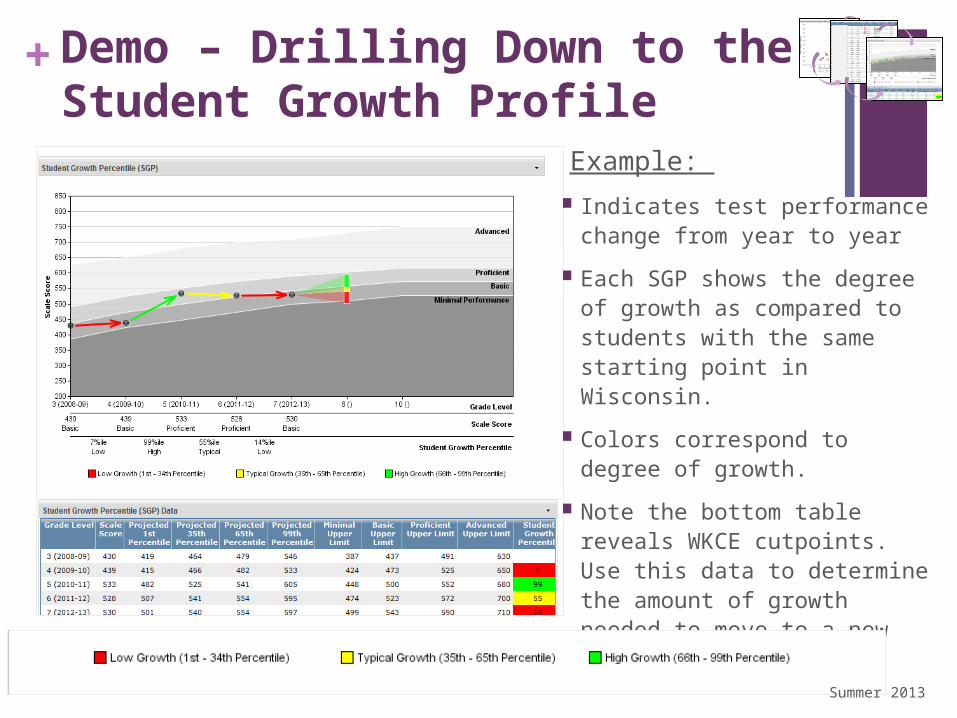
112+Demo – Drilling Down to theStudent Growth Profile
Example: Indicates test performance
change from year to year
Each SGP shows the degree of growth as compared to students with the same starting point in Wisconsin.
Colors correspond to degree of growth.
Note the bottom table reveals WKCE cutpoints. Use this data to determine the amount of growth needed to move to a new proficiency level.
Summer 2013
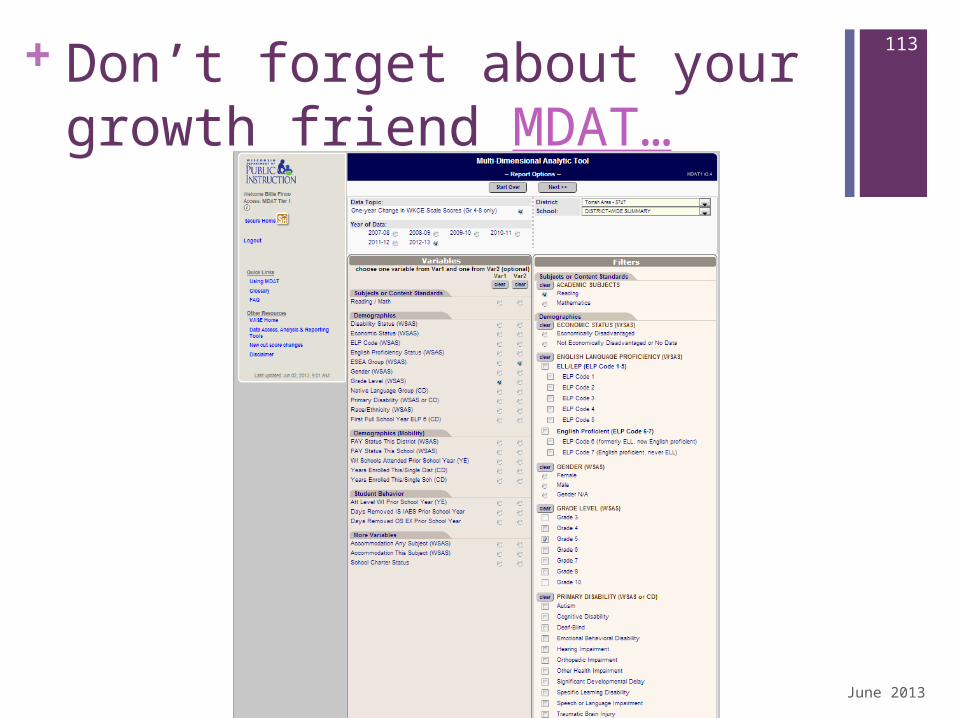
113+Don’t forget about your growth friend MDAT…
June 2013
Finco & Torkelson
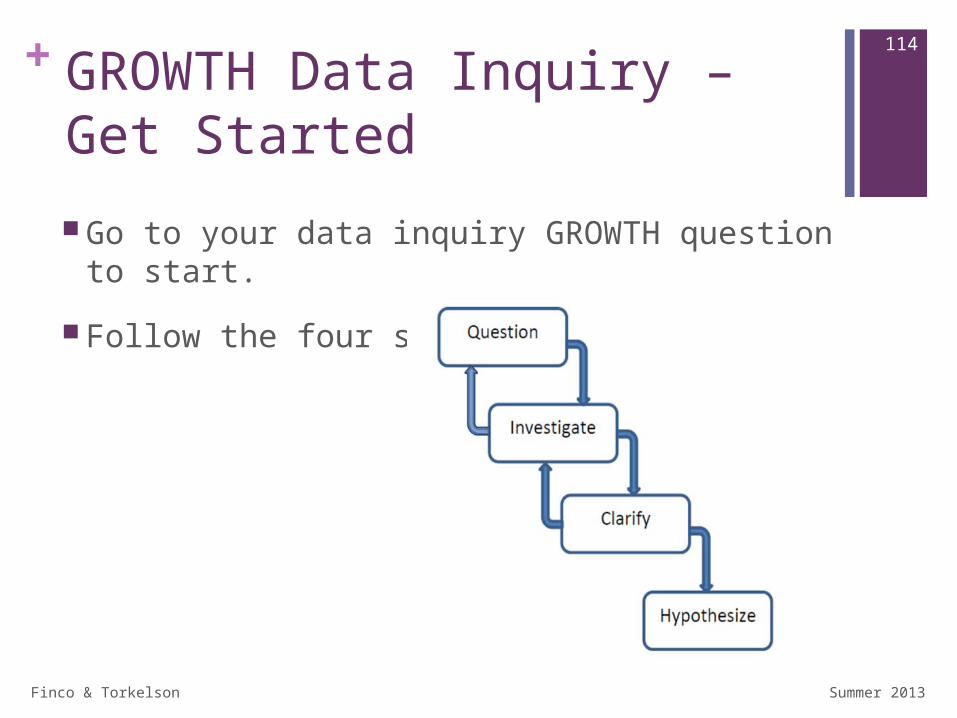
114+GROWTH Data Inquiry – Get Started
Go to your data inquiry GROWTH question to start.
Follow the four steps.
Summer 2013

115+
June 2013
Finco & Torkelson
116+
What did you learn through this Inquiry Process?
Reflecting…
June 2013

117
June 2013


