download this report - calnonprofits homepage this report calnonprofits.org/causes-count a village...
TRANSCRIPT


DOWNLOAD THIS REPORT
calnonprofits.org/causes-count
A village came together to produce this report. In particular, we would like to thank the following individuals:
At the University of San Diego: Dr. Laura Deitrick and her amazing team for the rigor of their research and the relentlessness and energy with which they tracked down the right information. The participation of Jon Durnford, affiliated scholar at the National Center for Charitable Statistics, brought newly available statewide and national data and a wealth of context to the study findings. We are also grateful to Dean Paula Cordeiro at the USD’s School of Leadership and Education Sciences (SOLES) and Pat Libby, Director of the USD Nonprofit Institute for Education and Research, for their support of the project.
Janet Camarena and Steven Lawrence of the Foundation Center were data partners on the research, and Janet’s presence makes all meetings more enjoyable.
Jim Canales and Kevin Rafter of the James Irvine Foundation were early inspirations and early funders of this effort, and Kevin’s sharp attention kept us on track and focused.
Additional grantmakers who brought not only funding but their personal support and advice include: Irene Wong of the David & Lucile Packard Foundation, Fred Ali and Vy Nguyen of the Weingart Foundation, Wendy Garen of the Ralph M. Parsons Foundation, and Sylia Obagi of the Annenberg Foundation.
The study’s advisors—recognized elsewhere in this report—played an active role in every aspect of the research, especially with the survey design, survey outreach, and message development.
The 1,439 nonprofit leaders and the 1,639 members of the public who completed surveys provided valuable insights and made it possible to connect data points across the study.
For the CalNonprofits staff, we would like to acknowledge the leadership of Ashley McCumber, Chair, and the Board of Directors of the California Association of Nonprofits, who both lead and hold our feet to the fire on projects like this. Staff support came in particular from Katie Kleinsasser, Kris Lev-Twombly, and Edan Enriquez. The brilliant and patient Patrick Santana and Paulette Traverso designed this report. A standing ovation is due to Kristen Wolslegel, Project Manager, for doing simply everything, on time, expertly, with insight and intellectual rigor, and with grace.
— Jan Masaoka, August 2014
Acknowledgements
Dear Friends,
Why does it matter whether nonprofits are a powerful economic force in California? Just as we need to understand the economic impact of tourism, of Silicon Valley, of the wine industry and construction, we need to understand the significant role that nonprofits play in our state’s economic landscape.
This knowledge reveals a myriad of opportunities:
• Policymakers will know how to identify their most effective partners in developing and passing legislation and ask: “What will the nonprofit community think?”
• Nonprofit leaders – both staff and volunteer – can plot their organizational trajectories in the context of their industry trends
• Cities – knowing the rates at which nonprofits create and retain jobs – will court nonprofits the way they court other important industry
• Elected officials and candidates for public office will seek out nonprofits knowing that nonprofit work is crucial to civic success, and because voters care about which candidates support nonprofits
• Business leaders will see nonprofits as viable partners in local and regional economic development
• Grantmakers can address disparities among regions and populations in California
Nonprofits are often thought of as helping “other people.” This report reminds us that nonprofits benefit all of us. How many of us picked up a daughter at Girl Scouts or a father at an Alzheimer’s care center this week? Did our family watch Downton Abbey, Sesame Street, Nature? Use Wikipedia without fear of data intrusion? How many of us were cared for in a nonprofit hospital or health clinic, or benefited from research conducted by nonprofit health organizations?
If we are women, people of color, LGBT or disabled, we are able to vote, go to college and get jobs in large part due to nonprofit activism. We breathe cleaner air thanks to nonprofit environmental advocates and our children’s toys and our foods are safer thanks to nonprofit consumer activists.
In short, causes do count. We nonprofits should rise to the stature we have earned, wield our influence, and make our voices heard. When nonprofits leverage our power, we use it for the collective good — to make our communities better places to live and thrive.
Jan MasaokaCEO, California Association of Nonprofits (CalNonprofits)[email protected]
CALIfORNIA ASSOCIATION Of NONPROfITS
CalNonprofits California’s nonprofits & the communities we serve
Jan Masaoka, CEO

About The Caster Family Center for Nonprofit and Philanthropic Research at the University of San DiegoHoused within the Institute for Nonprofit Education and Research at the School of Leadership and Education Sciences (SOLES), the mission of The Caster Center is to provide research, evaluation, and consulting services that build the leadership and strategic- and evaluative-thinking capacity of nonprofits. The Caster Center strives to be the leading source of information, data, and research on the nonprofit sector. It offers resources and products that are grounded in systematic research and have direct applicability to the field. It also serves as an important training facility that enables doctoral students to directly engage in innovative and timely nonprofit research projects. The Caster Center works in collaboration, and under contract, with nonprofit service and charitable organizations on a wide range of projects.
About CalNonprofitsThe California Association of Nonprofits (CalNonprofits) is a statewide policy alliance of nearly 10,000 organizations, representing and promoting California’s growing nonprofit sector. We work to bring the full power of nonprofits to strengthening communities by speaking with the voice of California nonprofits to the legislature, government agencies, philanthropy, and the public. CalNonprofits provides membership benefits, including health and other insurances to nonprofits, discounts to goods and services, access to special advocacy opportunities, and the energy that comes from participating in an active advocacy network. CalNonprofits has offices in San Francisco, Capitola, Los Angeles and Sacramento.
Principal Investigator and Research TeamLaura Deitrick, Ph.D., Principal Investigator
Director, The Caster Family Center for Nonprofit and Philanthropic Research, University of San Diego
Jon Durnford, Principal, DataLake, LLC Affiliated Scholar, Center on Nonprofits & Philanthropy, The Urban Institute, and Research Associate, The Caster Family Center for Nonprofit and Philanthropic Research, University of San Diego
Andrew Narwold, Ph.D., Professor of Economics, University of San Diego
Fred Galloway, Ed.D., Professor of Leadership Studies and Research Associate, The Caster Family Center for Nonprofit and Philanthropic Research, University of San Diego
Mary Jo Schumann, Ph.D., Associate Director, The Caster Family Center for Nonprofit and Philanthropic Research, University of San Diego
Research AssistantsJennifer JonesKim HuntSue Carter-KahlSvetlana KrasynskaCarolyn Noack
Additional Report ContributorsJan Masaoka, CEO, CalNonprofitsKristen Wolslegel, Project Manager, CalNonprofits
Advisors to Causes CountKaren Baker, CaliforniaVolunteers Gregory Bradbard, Inland Empire United WayJanet Camarena, Foundation CenterAndy Carey, US-Mexico Border Philanthropy PartnershipSarah Carnochan, Mack Center, University of California,
BerkeleyMuhammed Chaudhry, Silicon Valley Education Foundation Vivian Clecak, Human OptionsEleanor Clement-Glass, Silicon Valley Community FoundationSarah de Guia, California Pan-Ethnic Health NetworkCeleste DeWald, California Association of MuseumsShannon Ellis, CompassPoint Nonprofit ServicesSandra Flores, Fresno Regional FoundationPatricia Gardner, Silicon Valley Council of NonprofitsZuretti Goosby, Field Representative, State Senator
Noreen Evans Irma Herrera, New America MediaLarry Imwalle, ACTION Council; Nonprofit Alliance of
Monterey CountyMatt Jendian, California State University, FresnoPete Manzo, United Ways of California, and the lead from
the CalNonprofits Board of Directors on this projectJeff McDonald, San Diego Union TribuneDan McQuaid, OneOCVy Nguyen, Weingart FoundationSylia Obagi, Annenberg FoundationJeff Pickering, Kern Community FoundationKevin Rafter, James Irvine FoundationNancy Sasaki, Alliance Healthcare FoundationJui Shrestha, Public Policy Institute of CaliforniaConnie Stewart, California Center for Rural PolicyCorey Timpson, PICO CaliforniaPaul Vandeventer, Community Partners Bill Watanabe, Little Tokyo Service Center
CALIfORNIA ASSOCIATION Of NONPROfITS
CalNonprofits California’s nonprofits & the communities we serve

PART 1
Introduction and Key Findings
PART 2
Nonprofits Count in the California Economy
PART 3
Nonprofit Employment Counts
PART 4
Disparities Matter
PART 5
Nonprofit Finances Count
Part 6
Values Count
PART 7
Conclusion: Causes Count
PART 8
Appendix
6
12
20
30
38
48
56
58
Contents
The most complete picture ever produced of the power of California’s nonprofit sector
PART 1
Introduction and Key Findings

including the women’s suffrage campaign of the 1900s, the free speech and black liberation movements of the 1960s, and the emergence of the environmental movement in the 1980s. As a result of the dedication and vision of California’s nonprofits and their supporters, today’s nonprofit hospitals and universities are world class institutions, our nonprofit arts and cultural organizations are admired around the world for their artistic daring and excellence, and our all-volunteer organizations manage significant programs that positively impact the lives of all Californians. These nonprofits play an instrumental role in making California an economic driver, a leader in innovation, and a champion for hope and opportunity.
So just how powerful is California’s nonprofit sector today—and what impact does that have on the economic and social well-being of our state? CalNonprofits commissioned
this groundbreaking study to find out.
Causes Count describes, in economic terms, the stunning size, variety, activities and impact of California’s large and diverse nonprofit sector. The research was conducted by The Caster family Center for Nonprofit and Philanthropic Research at the University of San Diego and was guided by an advisory panel of more than 30 leaders throughout California.
This study synthesizes multiple sources of data to generate the most complete picture of the power of California’s
nonprofit sector to date.
The research identifies and documents trends in the financial health of nonprofits, employment, volunteerism, foundation grantmaking, and civic engagement, as well as provides insight into what may
be in store for California’s nonprofit sector in the future. Select demographic data are also presented to provide context and assess regional differences.
In addition to economic impact, this report also presents data about the more difficult to measure social impact of nonprofits, and documents the numerous ways California nonprofits express the deeply held values of our communities and engage people in our democracy.
This powerful information can serve leaders in nonprofits, government, philanthropy, and our communities to identify and advance partnerships in policymaking, funding,
and policy implementation.
The information provided in this report will inform anyone who shares an interest in the nature and impact of California’s nonprofit sector–in other words, all of us.
for over a hundred years, California nonprofits have been at the forefront of important social movements
Causes Count: the eConomiC Power of California’s nonProfit seCtor — CalnonProfits — 2014 — www.CalnonProfits.org 7

Key
Find
ings
Economic strength
Disparities
This study reveals for the first time the size, scope, and economic power of California’s nonprofit sector.
Nonprofits are a large and vital part of California’s economy, with nonprofit economic activity contributing
15%
— or 1/6 — of California’s Gross State Product (GSP).
Despite being exempt from corporate income tax, nonprofits generated
$37 billion in taxes in 2012 at federal, state and local levels.
Nonprofits generate
$208 billion in annual revenue and hold $328 billion in assets.
Among the
72,478 501(c)(3) public charities in California, the density of the sector and its resources, including revenues, assets, and grant dollars are not distributed evenly.
California foundations make nearly
$2 billion in grants to California nonprofits annually.
A sector of economic strength and social impact
The nonprofit sector is a growth industry: while the total number of nonprofits has leveled off since 2009, the California sector has grown in revenue, assets, jobs, and wages.
There are
25,000nonprofits
with paid staff and 50,500 identified as grassroots or mostly voluntary.
Each year California nonprofits bring in at least $40 billion in revenue from out-of-state sources.
Significant
resource disparities persist: • In rural compared to
metropolitan communities
• In communities of color
• In southern versus northern California
• In certain subsectors
• Between “have” and “have not” communities
8 CausesCount:theeConomiCPowerofCalifornia’snonProfitseCtor—CalnonProfits—2014—www.CalnonProfits.org

Major employer
Public confidence and advocacy
While sometimes portrayed as too small to matter or less efficient than for-profit businesses, this report shows California’s nonprofit sector to be too big to overlook, robust with human and financial capital, and uniquely representative of the visions and values of California’s diverse communities.
California volunteers contribute more than $24.7 million in unpaid labor each year, the equivalent of
450,000 full-time jobs.
Californians surveyed for this report believe that nonprofits exist to provide services to the needy and vulnerable (85%), improve quality of life (79%), as well as express community values and promote social change (70%).
Nearly
1 million people are employed by nonprofits in California, accounting for six percent of total state employment.
California nonprofits are
trusted institutions. Over 80 percent of the Californians surveyed for this study are confident that nonprofits act on the public’s behalf and deliver quality services.
Nonprofits rank as the
4th largest industry in California by employment, producing more jobs than the construction, finance, or real estate industries.
California nonprofits are
intricately involved with civic life: 79 percent of nonprofit leaders surveyed meet with public officials and their staff, 53 percent belong to an association or coalition that lobbies on their behalf, and 42 percent mobilize their clients and constituents in community affairs.
There is greater racial/ethnic
workforce diversity in the nonprofit sector when compared to the adult civilian workforce as a whole.
On average, small nonprofits
employ more people than for-profit small businesses.
Causes Count: the eConomiC Power of California’s nonProfit seCtor — CalnonProfits — 2014 — www.CalnonProfits.org 9

for the first time, California nonprofit sector data that have not previously been available is synthesized with economic data, IRS data, census figures and two statewide surveys. This unique combination of data sources is broad in its scope and groundbreaking in its application. Causes Count is based on research conducted between September 2013 and March 2014 and includes:
MORE ABOUT METHODOLOGy: A comprehensive description of the methods, data sources, and limitations of this study is available as a Technical Appendix. It can be downloaded from the CalNonprofits website at calnonprofits.org/causes-count/methodology
1 The digitized dataset is cited in this report as CalNonprofits (circa 2012).
Detailed analysis of IRS Forms 990This report was based on a uniquely comprehensive digitized dataset—developed specifically for this study—of the nearly 72,500 California 501(c)(3) public charities filing IRS Forms 990, 990-EZ, and 990-N in California and processed by the IRS as of December 2013, representing the latest fiscal year information available.1
The database compiled more than 250 Form 990 data elements, allowing for unique research into paid employees, volunteers, general operations, governance, and lobbying practices. Much of the data are not available through public archives.
The Urban Institute’s National Center for Charitable Statistics (NCCS)This study also relies on the following NCCS datasets: IRS Business Master Files, NCCS Core Public Charity Files, 2013 Revenue Transaction File, and IRS 990-N archives. Subsector classifications used in this report are based groupings of NCCS National Taxonomy of Exempt Entities (NTEE) codes.
Until the 2008 introduction of the new Form 990-N, there was virtually no information available about nonprofits with less than $25,000 in annual revenue. This study is one of the first to utilize this newly available data.
The Foundation CenterData about the number of foundations, as well as their assets and grantmaking, were generated through a partnership with the Foundation Center, San Francisco.
The U.S. Census BureauInformation about the California population was derived from the 2012 American Community Survey 5-Year Estimates.
Two customized survey instruments
1. The Individual Perspectives Survey polled 1,639 randomly selected California residents to learn about their perceptions and awareness of nonprofits.
2. The Nonprofit Leadership Perspectives Survey polled 1,430 nonprofit leaders on topics such as staffing, finances, and advocacy activities.
The California Employment Development DepartmentThe California EDD supplied the nonprofit labor and wage data, as well as information about the diversity of California industries.
Data for this report draws
on multiple sources
10 CausesCount:theeConomiCPowerofCalifornia’snonProfitseCtor—CalnonProfits—2014—www.CalnonProfits.org

The scope and breakdown of California nonprofits
According to the Internal Revenue Code, 501(c) organizations are exempt from paying corporate income tax. The IRS Exempt Organizations Business Master file (BMf), reports 26 classifications of 501(c) tax exempt organizations in California.2 Eighty percent of these are 501(c)(3) public charities and private foundations that are eligible to receive tax-deductible donations.3
How many nonprofits are there in California?
There are 170,783 organizations registered as 501(c) corporations, including non-charity nonprofits such as condominium associations, labor unions, Chambers of Commerce and professional associations. Only 501(c)(3) corporations are classified as public charities. There are 72,478 active public charities that filed returns with the IRS in 2012, plus an approximate 23,313 nonprofit churches that are not required to file.
Short answer: Not including all congregations, there are about 72,000 active nonprofits in California, of which about 25,000 have paid staff.
How many of these organizations have paid staff?
According to the California Employment Develop-ment Department, 25,239 nonprofits reported having paid employees in 2012. The remaining 47,239 organizations are grassroots and primarily voluntary in nature, with no paid employees.
2 for a detailed description of 501(c) classifications see www.irs.gov/Charities-&-Non-Profits/Exempt-Organizations-Business-Master-file-Extract-EO-BMf
3 See IRS Publication 557 available at www.irs.gov/pub/irs-pdf/p557.pdf
What about churches and religion-related public charities?
Churches and religious organiza-tions are generally exempt from IRS nonprofit application and annual reporting requirements. Religious organizations were not included with other public charities in this study to avoid undercounting their significant contributions, as only 7,268 of the 30,581 that did register filed an annual information return.
501(c)(3) Public Charities 123,321
501(c)(3) Private Foundations 11,891
All Other 501(c) Classifications 35,571
501(c)(3) public charities - 123,321
All other 501(c)(3) public charities - 92,471
Active Filers of IRS Form 990, 990-EZ,or 990-N (e-postcard) 72,478
Non-Active Filers 20,264
501(c)(3) Religion-Related Public Charities30,581
501(c)(3) Public Charities other than Religion-Related 92,471
The 501(c)(3) nonprofits (public charities) studied in this report include:
Subsector Form 990 990-EZ 990-N All Filers
Arts, culture, and humanities 2,583 2,828 4,695 10,106
Higher education 239 - - 239
Education, other 4,229 4,746 6,596 15,571
Environment 1,211 1,096 1,990 4,297
Hospitals 201 - - 201
Health, other 2,813 1,521 2,063 6,397
Human services 8,503 5,839 8,520 22,862
International 681 598 1,099 2,378
Mutual, public & societal benefit 2,785 2,308 5,334 10,427
TOTAL 23,245 18,936 30,297 72,478
What are non-active filers?
Non-Active filers are organizations that for various reasons have not filed an annual information return within 24 months of this study. These ‘non-filers’ are often in the process of exemption application or termination (initial or final return not yet available), or are defunct, or are delinquent filers.
Causes Count: the eConomiC Power of California’s nonProfit seCtor — CalnonProfits — 2014 — www.CalnonProfits.org 11

of California’s Gross State Product
Nonprofits account for 15%
PART 2
Nonprofits Count in the California Economy

fig
ur
e 1 Direct, indirect, induced,
and catalytic effects
The clothing store uses income from the sale of clothes to Jane to purchase office supplies and
employ its own employees.
Nonprofits… • Make California an
attractive place to live, visit, and do business
• Support California’s na-tional and international economic strength
• Are the trusted vehicles through which Californians express their values
Jane Smith gets paid for working at a community
health clinic.
She uses part of her pay to buy clothes
for her kids at a local clothing store.
Direct effect
Indirect effect
Inducedeffect
Catalytic effects:
As a result, the sector’s output of $260 billion — more than a quarter of a trillion dollars — is 1/6 of California’s Gross State Product (GSP).4 In other words, 15 percent of California’s $1.7 trillion GSP results from the activities of the nonprofit sector.
Like all businesses, nonprofits purchase and produce goods and services and pay taxable wages to employees. These transactions have an economic ripple effect as monies spent by nonprofits and their employees are circulated throughout the larger
California’s nonprofit sector generates approximately $132 billion in direct goods and services, and an additional $128 billion through indirect and induced effects.
economy. figure 1 illustrates these multiplier effects and how economists use them to calculate economic activity.
for this report, IMPLAN economic modeling software was used to create an input-output model using California nonprofit employment and wage data. The resulting model presented in figure 2, on the following page, describes the economic activity associated with California nonprofits and provides a baseline from which to estimate their potential economic impact.5
4 for calculation of California GSP see: www.bea.gov5 Detailed methods related to the IMPLAN modeling are presented in the Technical Appendix of this report available online
at www.calnonprofits.org/causes-count/methodology
Causes Count: the eConomiC Power of California’s nonProfit seCtor — CalnonProfits — 2014 — www.CalnonProfits.org 13

$
In addition to the 937,000 jobs directly produced by the nonprofit sector, the economic model indicates that the nonprofit sector supports an additional 800,000 jobs through both induced and indirect effects. The total effect is that 1.7 million jobs in California result from nonprofit activity. A further discussion of nonprofit employment in California is presented in Part 3 of this report.
Output (in billions)
IMPACT TyPE
Direct Effect
Indirect Effect
Induced Effect
Total Effect 1.7 million $119 billion $260 billion
$132b
$48b
$80b
$75b
$18b280,000
Full-Time Jobs Employment
Compensation (in billions)
937,000
513,000
full time jobs1.7 million
Nonprofit activity in California results in $260 billion worth of goods and services
Fig
ur
e 2
Economic effects of California nonprofits
Data Source: IMPLAN Model
Employment, Labor Income, and Output represent different measures of economic activity that are impacted by the economic activity associated with the nonprofit sector. Employment represents the number of fulltime jobs created. Labor Income represents the dollar value of employee compensation, including salary, wages, and benefits. Output represents the dollar value of the final goods and services produced as a result of nonprofit activity in California.
$
$28b
14 CausesCount:theeConomiCPowerofCalifornia’snonProfitseCtor—CalnonProfits—2014—www.CalnonProfits.org

California’s nonprofit
revenue growth outpaces that of the U.S. nonprofit sector
CArevenue
CAcount
14%
12%
10%
8%
6%
4%
2%
0%
-2%
-4%
In relative terms, California has slightly fewer nonprofit organizations per 1,000 residents (1.12) than the U.S. overall (1.16). Additionally, California has more revenues per capita (CA: $5,585 vs. U.S.: $5,349) and fewer assets per capita (CA: $8,797 vs. U.S.: $9,777).
However, this may be changing. As figure 3 illustrates, California is experiencing a higher percentage of annual revenue growth than the overall U.S. nonprofit sector. These data suggest that California’s nonprofits are growing in size more than they are in number, indicating a potential increase in their capacity and productivity. Although not shown in figure 3, growth in nonprofit assets follows a similar pattern, indicating that California is gaining financial market share in the U.S. nonprofit sector.
California nonprofits are growing in revenue but not in number
Annual change in total revenues and number of 501(c)(3) public charity organizations filing IRS Forms 990 and 990-EZ
Sources: CalNonprofits (circa 2012), and NCCS Core Files (circa 2008-2012).
2008 2009 2010 2011 2012
10%of U.S. nonprofit assets
California is a big player...
12% of U.S. population
12% of U.S. nonprofit revenues
Fig
ur
e 3
USrevenue
UScount
Causes Count: the eConomiC Power of California’s nonProfit seCtor — CalnonProfits — 2014 — www.CalnonProfits.org 15
Nonprofit financial strength
is distributed across many types of organizations
Organization Type Count% of total
Total revenue
(in billions)% of total
Total assets
(in billions)% of total
Median revenue per organization
Median assets per
organization
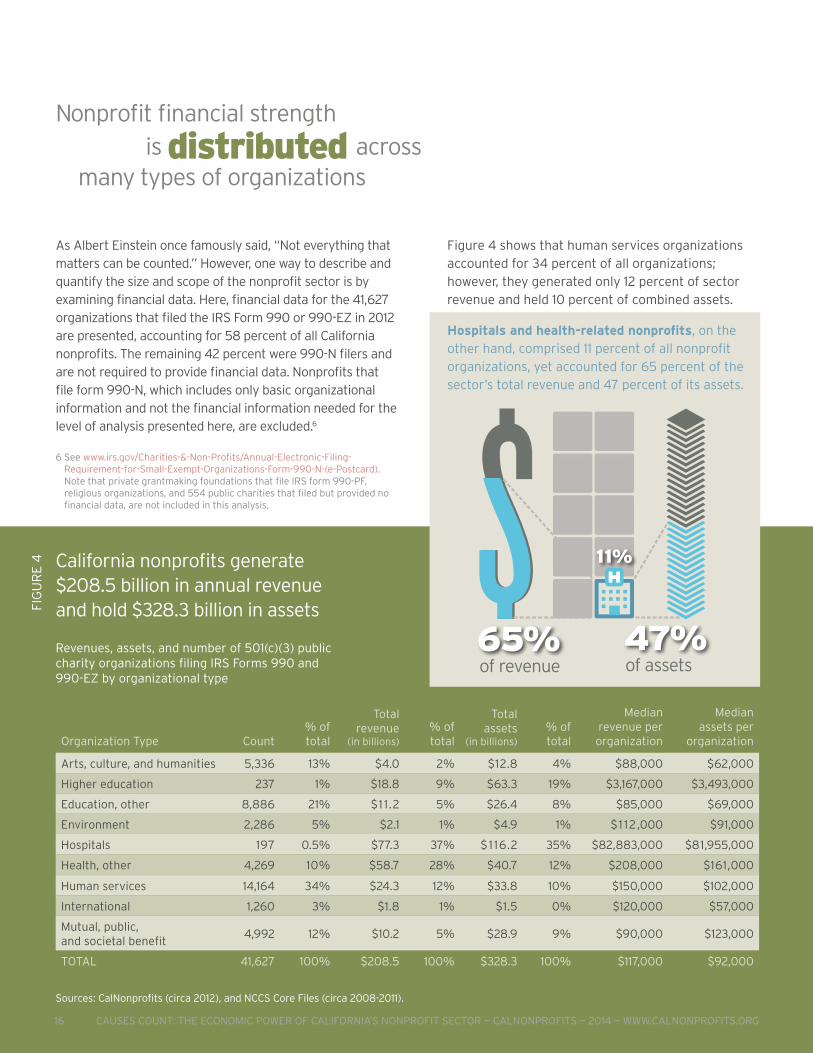
Arts, culture, and humanities 5,336 13% $4.0 2% $12.8 4% $88,000 $62,000
Higher education 237 1% $18.8 9% $63.3 19% $3,167,000 $3,493,000
Education, other 8,886 21% $1 1.2 5% $26.4 8% $85,000 $69,000
Environment 2,286 5% $2.1 1% $4.9 1% $1 12,000 $91,000
Hospitals 197 0.5% $77.3 37% $1 16.2 35% $82,883,000 $81,955,000
Health, other 4,269 10% $58.7 28% $40.7 12% $208,000 $161,000
Human services 14,164 34% $24.3 12% $33.8 10% $150,000 $102,000
International 1,260 3% $1.8 1% $1.5 0% $120,000 $57,000
Mutual, public, and societal benefit
4,992 12% $10.2 5% $28.9 9% $90,000 $123,000
TOTAL 41,627 100% $208.5 100% $328.3 100% $117,000 $92,000
Figure 4 shows that human services organizations accounted for 34 percent of all organizations; however, they generated only 12 percent of sector revenue and held 10 percent of combined assets.
Hospitals and health-related nonprofits, on the other hand, comprised 11 percent of all nonprofit organizations, yet accounted for 65 percent of the sector’s total revenue and 47 percent of its assets.
$65% 47%
11%
of revenue of assetsRevenues, assets, and number of 501(c)(3) public charity organizations filing IRS Forms 990 and 990-EZ by organizational type
Sources: CalNonprofits (circa 2012), and NCCS Core Files (circa 2008-2011).
As Albert Einstein once famously said, “Not everything that matters can be counted.” However, one way to describe and quantify the size and scope of the nonprofit sector is by examining financial data. Here, financial data for the 41,627 organizations that filed the IRS Form 990 or 990-EZ in 2012 are presented, accounting for 58 percent of all California nonprofits. The remaining 42 percent were 990-N filers and are not required to provide financial data. Nonprofits that file form 990-N, which includes only basic organizational information and not the financial information needed for the level of analysis presented here, are excluded.6
6 See www.irs.gov/Charities-&-Non-Profits/Annual-Electronic-filing-Requirement-for-Small-Exempt-Organizations-form-990-N-(e-Postcard). Note that private grantmaking foundations that file IRS form 990-Pf, religious organizations, and 554 public charities that filed but provided no financial data, are not included in this analysis.
California nonprofits generate $208.5 billion in annual revenue and hold $328.3 billion in assetsFi
gu
re
4
16 CausesCount:theeConomiCPowerofCalifornia’snonProfitseCtor—CalnonProfits—2014—www.CalnonProfits.org

Despite exemption from some forms of taxes, such as corporate income tax, the IMPLAN Model estimates the activities of California’s nonprofit sector generated $24.7 billion in federal taxes and $12.3 billion in state and local taxes in 2012, yielding a total of $37 billion in tax revenue. As both generators of taxes and recipients of tax monies that comes through government grants and contracts, these figures suggest that California nonprofits should be active participants in tax policy dialogue at all levels of government.
California nonprofits generate a robust
Nonprofits generate tax revenue at local, state, and federal levels
IMPLAN Model of Tax Revenues
Type of tax Includes $ in billions
federal taxes
Social Insurance Tax Social Security (Medicare, Medicaid, Old Age Pension) contributions by both employee and employer
$1 1.7
Tax on Production and Imports Excise taxes and custom duty $.9
Personal Income Tax $9.2
Corporate Profits Tax $2.9
Total federal Taxes $24.7
State & local taxes
Social Insurance Tax State contributions by both employee and employer $.3
Tax on Production and Imports Sales tax, property tax, vehicle license tax $7.4
Personal Income and Other Taxes State income tax, property tax, vehicle license fees $3.9
Corporate Profits Tax $.7
Total State and Local Taxes $12.4
Total all taxes $37.1
Source: IMPLAN System
Fig
ur
e 5
$37 billion in taxes
Causes Count: the eConomiC Power of California’s nonProfit seCtor — CalnonProfits — 2014 — www.CalnonProfits.org 17

Another way to measure the economic impact of California nonprofits is to estimate the percentage of total nonprofit revenue that comes from out-of-state sources because this money represents new dollars into the state economy. for example, a California nonprofit could attract new money into the overall economy through grants and contracts with corporations and foundations that operate outside of California.
As there is no single and reliable source of data that measures the flow of out-of-state dollars into California nonprofits, estimates were generated. To accomplish this, data were gathered from nonprofits, the U.S. Office of Management and Budget, and the foundation Center to approximate the proportion of revenues derived from out-of-state sources.
This analysis identified out-of-state funds that account for 21 percent—or $40 billion—of all nonprofit revenue.7 While this number should be considered at best a lower bound estimate (because there is no way to ensure that all out-of-state funding was accounted for), it provides a framework for thinking about the nonprofit sector’s economic contributions to California.
California nonprofits import over
$1 billion in foundation grants annually
In the last two decades, mega-foundations have emerged in California that for the first time rival the scale of the established East Coast foundations. Although foundations are not the focus of this report, their activity is considered here as it relates to nonprofit economic activity and impact.
The Foundation Center reports that there are 7,764 foundations in California. These include both community foundations, which are public charities, and private foundations, which comprise independent and family foundations, corporate foundations, and operating foundations. In 2011, the most recent year for which data are available, these California foundations held $102.8 billion in assets.
$40 billionNonprofits bring
more than into California from out-of-state
An analysis of grantmaking activity, presented in Figures 6 and 7, provides information about the ways in which grant dollars are distributed by California foundations, as well as information about the types of organizations that attract grant dollars from non-California based foundations. Notably, California nonprofits create economic impact by attracting over $1 billion into the economy though grants made by philanthropic organizations outside of the state.
7 Detailed methods related to the IMPLAN modeling are presented in the Technical Appendix of this report at calnonprofits.org/causes-count/methodology.
18 CausesCount:theeConomiCPowerofCalifornia’snonProfitseCtor—CalnonProfits—2014—www.CalnonProfits.org

Figures for each organizational type have been rounded to the nearest thousand dollars.
Foundation grantmaking distributions
Organization type
Grants awarded by California foundations to
California recipient organizations % of Total
Grants awarded by non-California foundations to
California recipient organizations % of Total
Arts and culture $210,032,000 1 1 % $103,002,000 10%
Education $562,367,000 29% $311,175,000 30%
Environment and animals $245,981,000 13% $67,138,000 7%
Health $344,539,000 18% $249,067,000 24%
Human services $265,105,000 14% $86,783,000 8%
International $17,396,000 1% $33,114,000 3%
Public affairs/society benefit $125,056,000 6% $144,405,000 14%
Science and technology $145,749,000 8% $12,788,000 1%
Social sciences $5,699,000 <1% $11,885,000 1%
Religion $20,507,000 1% $9,746,000 1%
Other $222,000 <1% $12,000 <1%
Total $1,942,653,000 100% $1,029,114,000 100%
Fig
ur
e 6
Although the Foundation Center has consistently reported that California is a net importer of foundation dollars, these latest figures show in 2011 California was a net exporter of grant dollars. While it is too early to know whether this is a one-time occurrence or a new trend, this change may reflect the growing reach and influence of California’s very large foundations.
Figures for each organizational type have been rounded to the nearest thousand dollars.
Source: The Foundation Center, Research Division, 2014. Due to rounding, figures may not add to 100%. Based on all grants of $10,000 or more awarded by a national sample of larger U.S. foundations. For community foundations, only discretionary grants are included. Grants to individuals are not included in the file.
Fig
ur
e 7 California foundations
to non-California recipient organizations
Non-California foundations to California recipient organizations
Import and export of grant dollars
24% Education
17% Health
59% All Others
100% Total
30% Education
24% Health
46% All Others
100% Total
$311 ,175,000
$249,067,000
$468,872,000
$1.0 billion
$321,031,000
$226,180,000
$784,477,000
$1.3 billion
Education-related nonprofits attract the most foundation grant dollars
Foundation grant dollars by organizational type, includes private, community, operating, and corporate foundations
Out
In $1.0 billion
$1.3 billion
Causes Count: the eConomiC Power of California’s nonProfit seCtor — CalnonProfits — 2014 — www.CalnonProfits.org 19

California nonprofits account for 1 in every 16 California jobs
HIRINGNOW
PART 3
Nonprofit EmploymentCounts

Leisure and hospitality 1,671,300
Retail trade 1,601,400
Manufacturing 1,250,900
Nonprofit sector 937,000
Construction 636,200
Finance and insurance 523,900
Transportation, warehousing, and utilities 503,700
Agriculture, forestry, fishing, and hunting 41 1,400
Real estate, rental, and leasing 196,500
Telecommunications 90,400
Source: California Employment Development Department 2012, Private Industry Employment Quarterly Census of Employment and Wages (QCEW). Figures have been rounded.
1 out of 16California jobs is at a nonprofit organization
In comparison:
• 1 out of 25 California jobs is in a restaurant
• 1 out of 50 California jobs is in agriculture
Nearly
1 million Californians work for a nonprofit
Since the onset of the Great Recession, job creation and wages have been in the forefront of the minds of economists, policymakers, the media, and the general public. The findings from this study document the importance of the nonprofit sector as a vital and vibrant center of employment.8 Overall, nonprofits make up six percent of all California employment, or seven percent of private sector employment. Despite a lower nonprofit share of employment than the national average of 10.1 percent,9 nonprofits nonetheless prove to be a pivotal component of California’s economy — recognized as the world’s 8th largest economy — accounting for over $51 billion in wages paid to Californians in 2012.
Nonprofits rank as the 4th largest industry in California by employment
Fig
ur
e 8
Comparison of nonprofit employment to select California industries
8 The nonprofit sector relies on a labor force comprised of both paid staff and unpaid volunteers. Findings about volunteers are presented on page 29.9 See “Holding the Fort: Nonprofit Employment during a Decade of Turmoil, Nonprofit Economic Data Bulletin #39” Johns Hopkins Center for Civil Society.
Causes Count: the eConomiC Power of California’s nonProfit seCtor — CalnonProfits — 2014 — www.CalnonProfits.org 21
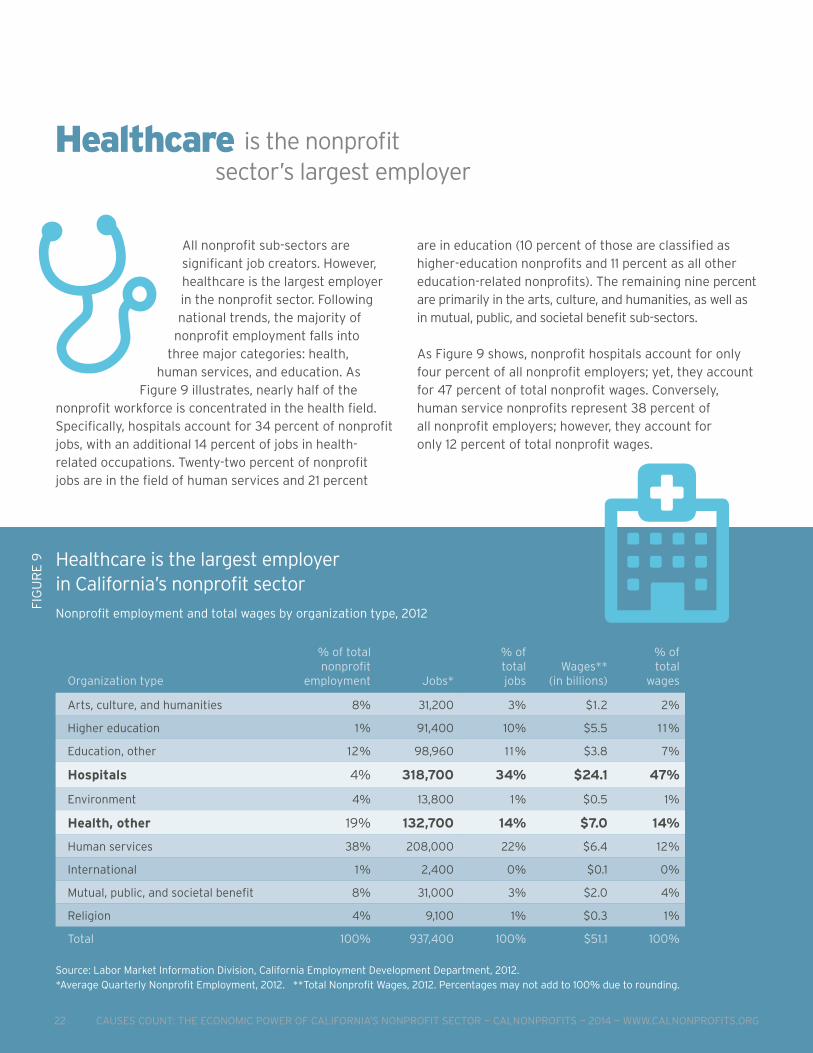
All nonprofit sub-sectors are significant job creators. However, healthcare is the largest employer in the nonprofit sector. following national trends, the majority of
nonprofit employment falls into three major categories: health,
human services, and education. As figure 9 illustrates, nearly half of the
nonprofit workforce is concentrated in the health field. Specifically, hospitals account for 34 percent of nonprofit jobs, with an additional 14 percent of jobs in health-related occupations. Twenty-two percent of nonprofit jobs are in the field of human services and 21 percent
Healthcare is the nonprofit sector’s largest employer
are in education (10 percent of those are classified as higher-education nonprofits and 11 percent as all other education-related nonprofits). The remaining nine percent are primarily in the arts, culture, and humanities, as well as in mutual, public, and societal benefit sub-sectors.
As figure 9 shows, nonprofit hospitals account for only four percent of all nonprofit employers; yet, they account for 47 percent of total nonprofit wages. Conversely, human service nonprofits represent 38 percent of all nonprofit employers; however, they account for only 12 percent of total nonprofit wages.
Organization type
% of total nonprofit
employment Jobs*
% of total jobs
Wages** (in billions)
% of total
wages
Arts, culture, and humanities 8% 31,200 3% $1.2 2%
Higher education 1% 91,400 10% $5.5 1 1%
Education, other 12% 98,960 11% $3.8 7%
Hospitals 4% 318,700 34% $24.1 47%
Environment 4% 13,800 1% $0.5 1%
Health, other 19% 132,700 14% $7.0 14%
Human services 38% 208,000 22% $6.4 12%
International 1% 2,400 0% $0.1 0%
Mutual, public, and societal benefit 8% 31,000 3% $2.0 4%
Religion 4% 9,100 1% $0.3 1%
Total 100% 937,400 100% $51.1 100%
Source: Labor Market Information Division, California Employment Development Department, 2012. *Average Quarterly Nonprofit Employment, 2012. **Total Nonprofit Wages, 2012. Percentages may not add to 100% due to rounding.
Healthcare is the largest employer in California’s nonprofit sector
Nonprofit employment and total wages by organization type, 2012
Fig
ur
e 9
22 CausesCount:theeConomiCPowerofCalifornia’snonProfitseCtor—CalnonProfits—2014—www.CalnonProfits.org

1% 0.2%
4%2%
20%
12%
20-99 employees
Small nonprofits are
not so small
Small business is legitimately seen as a key driver of the California economy, and the state of California supports small business in many ways. As discussed in Part 5 of this study, the majority of nonprofits may also be considered “small” when their organizational size is described in terms of revenue and assets relative to the for-profit sector. However, when using employment as a measure of organizational size, nonprofits tended to be larger than other California employers.
As figure 10 shows, 39 percent of nonprofits reported fewer than five employees compared to the majority (57%) of all other California employers. The majority of nonprofits (55%), on the other hand, were found to employ from 5-99 employees. In addition, five percent of nonprofits have 100 or more employees, while only slightly more than two percent of other California employers report the same.
While nonprofits are sometimes dismissed as “too small to matter,” these data demonstrate that not only is the nonprofit sector a significant job creator, but also that “small nonprofits” employ more staff per organization than do “small businesses.” These findings suggest that attention and investment in nonprofits from the State of California could be a highly leveraged job creation strategy.
Fig
ur
e 1
0 Nonprofit employers are larger by comparison than other California employers
5-19 employees
35%
29%
Org
aniz
atio
n si
ze >
0-4 employees
Non
profi
t em
ploy
ers
Oth
er
empl
oyer
s
39%
57%
Source: Labor Market Information Division, California Employment Development Department, 2012.
Causes Count: the eConomiC Power of California’s nonProfit seCtor — CalnonProfits — 2014 — www.CalnonProfits.org 23
100-499 employees
500+ employees

Number of other California organizations
Average of other California employment
Total of other California wages
Number of nonprofit organizations
Average quarterly nonprofit employment
Total nonprofit wages
Nonprofits outpace California overall in organization, job, and total wage growth
Change in average annual nonprofit and California organization size and employment and total wages, 2008-2012
+20%
+15%
+26%
-1%
-4%
+6%
Nonprofit employment is growing, and
total wages are growing even faster
10 See California Employment Development Department Quarterly Census of Employment and Wages (CCEW).
Source: Labor Market Information Division, California Employment Development Department, 2012
following national trends, California’s nonprofit sector has continued to demonstrate strong employment and wage growth. As figure 11 illustrates, overall economic recovery in terms of employment and wages has been slow as California recorded a four percent decline in total employment, when compared to 2008, and a modest six percent increase in total wages. In contrast, average quarterly nonprofit employment increased by 15 percent over the same period and total wages
paid increased by 26 percent. Although not reflected in figure 11, other California organizations also exhibited fluctuations in wage growth specific to their particular industry. for instance, both the leisure and hospitality industry and the manufacturing industry reported single digit increases in wages (8% and 4%, respectively) from 2008 to 2012. Conversely, the construction industry realized a 20 percent loss in wages over the same period of time.10
Fig
ur
e 1
1
24 CausesCount:theeConomiCPowerofCalifornia’snonProfitseCtor—CalnonProfits—2014—www.CalnonProfits.org
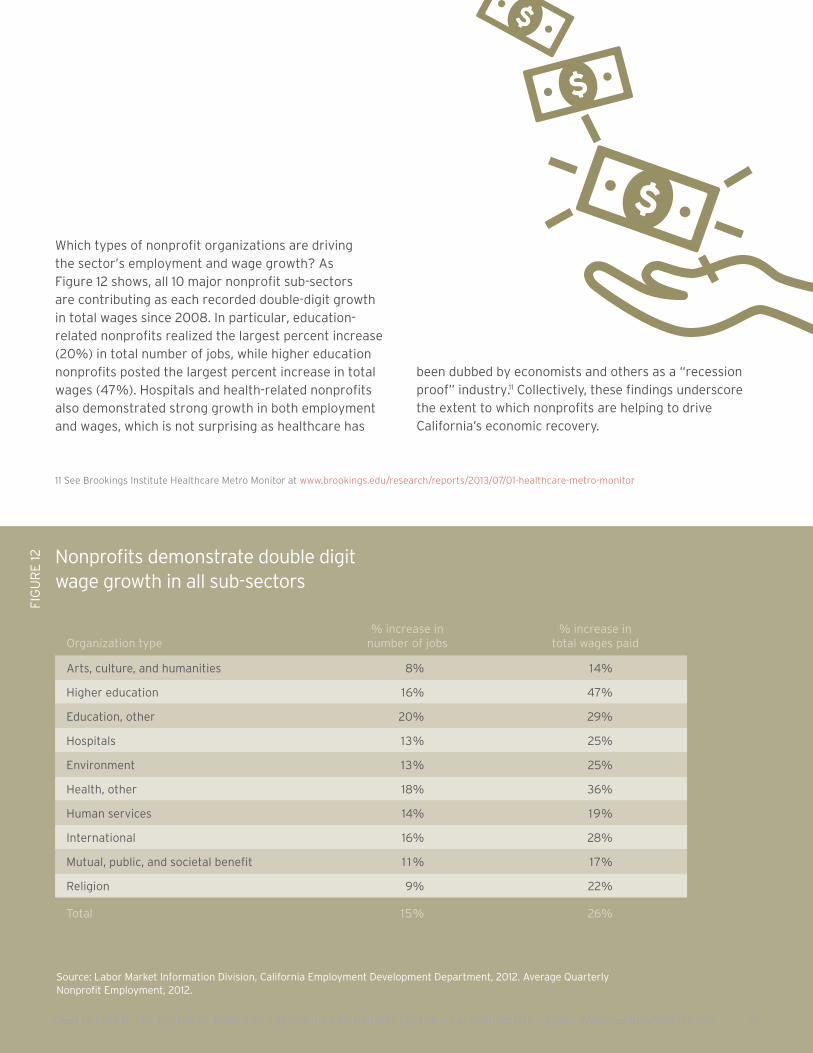
Organization type% increase in
number of jobs % increase in
total wages paid
Arts, culture, and humanities 8% 14%
Higher education 16% 47%
Education, other 20% 29%
Hospitals 13% 25%
Environment 13% 25%
Health, other 18% 36%
Human services 14% 19%
International 16% 28%
Mutual, public, and societal benefit 1 1 % 17%
Religion 9% 22%
Total 15% 26%
Source: Labor Market Information Division, California Employment Development Department, 2012. Average Quarterly Nonprofit Employment, 2012.
Fig
ur
e 1
2 Nonprofits demonstrate double digit wage growth in all sub-sectors
Which types of nonprofit organizations are driving the sector’s employment and wage growth? As figure 12 shows, all 10 major nonprofit sub-sectors are contributing as each recorded double-digit growth in total wages since 2008. In particular, education-related nonprofits realized the largest percent increase (20%) in total number of jobs, while higher education nonprofits posted the largest percent increase in total wages (47%). Hospitals and health-related nonprofits also demonstrated strong growth in both employment and wages, which is not surprising as healthcare has
11 See Brookings Institute Healthcare Metro Monitor at www.brookings.edu/research/reports/2013/07/01-healthcare-metro-monitor
been dubbed by economists and others as a “recession proof” industry.11 Collectively, these findings underscore the extent to which nonprofits are helping to drive California’s economic recovery.
Causes Count: the eConomiC Power of California’s nonProfit seCtor — CalnonProfits — 2014 — www.CalnonProfits.org 25

12 See Simply Hired, Inc., Average Nonprofit Salaries, available at www.simplyhired.com/salaries-k-nonprofit-jobs.html
Nonprofit leaders predict hiring for new positions in 2014
Fig
ur
e 1
3
Source: Nonprofit Leadership Perspectives Survey
Response when asked: “Approximately how many additional paid full-time-equivalent (FTE) employees do you think you will hire into newly created positions next year (2014)?”
percent of nonprofits
71%
22%
6%
The 1,430 nonprofit employers in the Nonprofit Leadership Perspectives Survey indicated that this positive job growth could continue. As reflected in figure 13, more than half of all respondents said they expected to hire for newly created positions in 2014. Respondents’ aggregate estimates totaled 1,634 full-time equivalent (fTE).
Although this analysis is based on responses from a sample of California nonprofits and information about the specifics of these jobs is not available, it is possible to estimate the potential impact of these new hires. for example, considering the estimates from the survey respondents, the 1,634 jobs these organizations anticipate creating within the next year, multiplied by California’s new minimum wage of $9 per hour, represents a minimum of $19.4 million in new wages for California. Of course, not all of these jobs will be remunerated at minimum wage. Thus, using an average annual nonprofit salary of $49,000, these new positions could represent as much as $80 million in new wages generated in the state.12
The sub-sectors most likely to hire for newly created positions in 2014 include environmental, human services, and public and societal benefit organizations. Religion-related nonprofits were the least likely to make new hires in 2014. Organizations in highly-populated areas, such as San Diego County, Los Angeles and Ventura, the Bay Area, and Orange County were the most likely to report that they would be hiring for new positions in 2014.
Although these projections are estimates derived from a sample, they are supported by the positive nonprofit employment and revenue trend data already discussed in this report.
Already-planned nonprofit hiring will result in
substantial job creation
employees expected to
be hired
2.6 – 9.0
2.5 or less
10 or greater
26 CausesCount:theeConomiCPowerofCalifornia’snonProfitseCtor—CalnonProfits—2014—www.CalnonProfits.org
13 See California Labor Market Review, 2014.
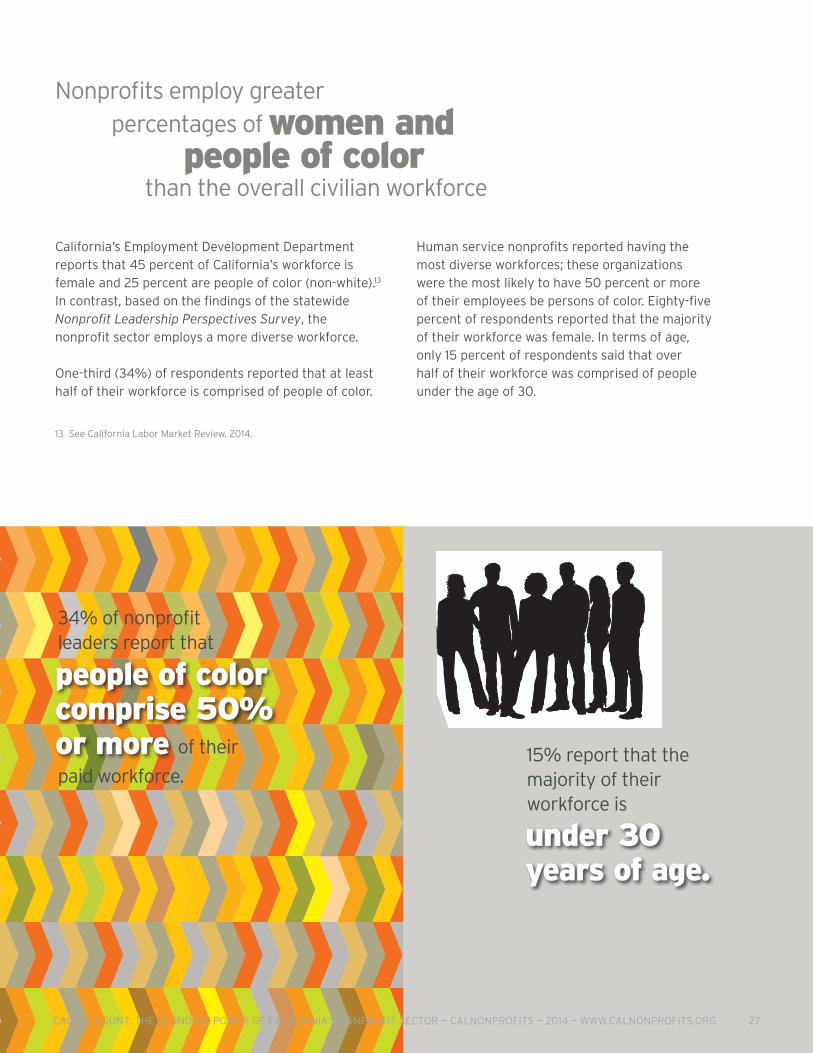
under 30 years of age.
people of color comprise 50% or morepaid workforce.
of their
34% of nonprofit leaders report that
15% report that the majority of their workforce is
Nonprofits employ greater
percentages of women and people of color than the overall civilian workforce
California’s Employment Development Department reports that 45 percent of California’s workforce is female and 25 percent are people of color (non-white).13 In contrast, based on the findings of the statewide Nonprofit Leadership Perspectives Survey, the nonprofit sector employs a more diverse workforce.
One-third (34%) of respondents reported that at least half of their workforce is comprised of people of color.
Human service nonprofits reported having the most diverse workforces; these organizations were the most likely to have 50 percent or more of their employees be persons of color. Eighty-five percent of respondents reported that the majority of their workforce was female. In terms of age, only 15 percent of respondents said that over half of their workforce was comprised of people under the age of 30.
Causes Count: the eConomiC Power of California’s nonProfit seCtor — CalnonProfits — 2014 — www.CalnonProfits.org 27

14 See www.volunteeringinamerica.gov. These data are derived from the US Bureau of Census Current Population Survey and include the Volunteer Supplement and the Civic Supplement. Full time equivalent (FTE) is based on 2,080 annual work hours and value of volunteer time was estimated using Independent Sector’s rate of $26.34 per hour as the average value of volunteer time in California.
15 See Technical Appendix at www.calnonprofits.org/causes-count/methodology for discussion of methods used to derive number of volunteer and board positions
Volunteers in California do the equivalent work of
450,000 full-time workersIf, as participants in this study have asserted, the goals of the nonprofit sector are to help make the community a better place, stand for values, express community spirit, and mobilize the community, then they must engage the community in that work to be successful. One measure of this engagement is the recruitment and deployment of a significant workforce as volunteers.
of volunteers believe their time was well spent
Many of these California volunteers were engaged specifically with the registered 501(c)(3) nonprofits analyzed in this study. According to IRS data, these nonprofits:15
• Filled at least 5.2 million volunteer positions
• Utilized volunteers in 393,000 nonprofit board positions
Data suggest approximately 25 percent of Californians volunteered in 2012.14
These volunteers:
• contributed more than 938 million hours of volunteer service
• represented the equivalent of $24.7 million in unpaid annual labor
86%
25% volunteer
28 CausesCount:theeConomiCPowerofCalifornia’snonProfitseCtor—CalnonProfits—2014—www.CalnonProfits.org

1,200
1,000
800
600
400
200
0
Fig
ur
e 1
4 Nonprofits utilize more volunteers than paid employees
Average number of volunteers and employees reported on IRS Form 990 by total revenue size
Volunteers serve in nearly
Volunteers outnumber paid staff in nonprofits of all sizes
Volunteers contribute to the nonprofit workforce at all levels. Volunteers serve as board members, executive staff, administrators and program providers. for example, they care for people in hospices, raise critical program funds, serve as Chief financial Officers, receptionists, museum docents, bus drivers, tax preparers and surgical nurses. In fact, as illustrated in figure 14, volunteers outnumber paid staff in California nonprofits of all revenue sizes. Although not depicted in figure 14, this trend also holds true for all nonprofit organization types except for hospitals and higher education nonprofits.
Contrary to the popular stereotype that volunteers are merely supplemental to the nonprofit workforce, this study documented that more than 50 percent of volunteers are involved in two integral and important aspects of nonprofit work: delivering core programs and raising funds. Although employment and volunteerism are typically treated separately (as they are in this report), these findings suggest that the nonprofit workforce should be described and interpreted as a combination of paid and volunteer efforts.
Source: CalNonprofits (circa 2012).
400,000nonprofit board positions.
Under $50,000
$50,000 to $250,000
$250,000 to $1M
$1M to $10M
Above $10M
Number of volunteers(average)
Number of employees(average)
Causes Count: the eConomiC Power of California’s nonProfit seCtor — CalnonProfits — 2014 — www.CalnonProfits.org 29
PART 4
Disparities Matter
The focus of this report has been California in its entirety, but the research also shows regional disparities
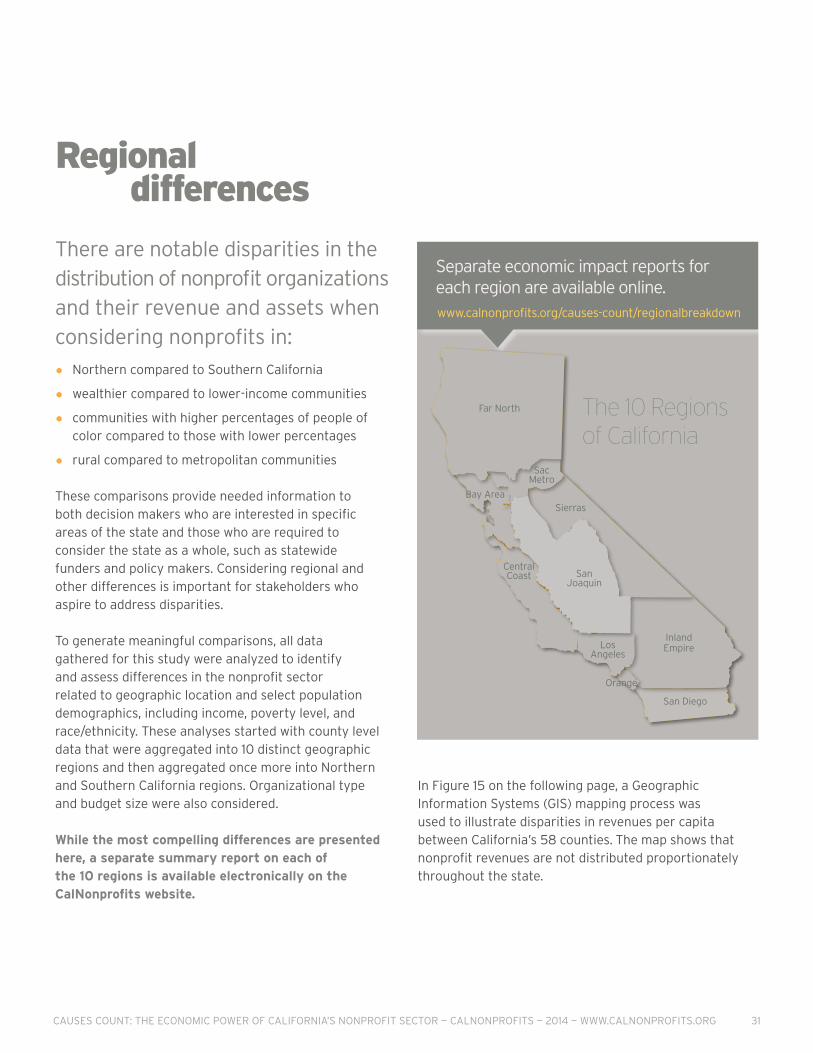
www.calnonprofits.org/causes-count/regionalbreakdown
Separate economic impact reports for each region are available online.
Far North
Sac Metro
Sierras
San Joaquin
Los Angeles
San Diego
Orange
CentralCoast
Inland Empire
Bay Area
There are notable disparities in the distribution of nonprofit organizations and their revenue and assets when considering nonprofits in:
• Northern compared to Southern California
• wealthier compared to lower-income communities
• communities with higher percentages of people of color compared to those with lower percentages
• rural compared to metropolitan communities
These comparisons provide needed information to both decision makers who are interested in specific areas of the state and those who are required to consider the state as a whole, such as statewide funders and policy makers. Considering regional and other differences is important for stakeholders who aspire to address disparities.
To generate meaningful comparisons, all data gathered for this study were analyzed to identify and assess differences in the nonprofit sector related to geographic location and select population demographics, including income, poverty level, and race/ethnicity. These analyses started with county level data that were aggregated into 10 distinct geographic regions and then aggregated once more into Northern and Southern California regions. Organizational type and budget size were also considered.
While the most compelling differences are presented here, a separate summary report on each of the 10 regions is available electronically on the CalNonprofits website.
In figure 15 on the following page, a Geographic Information Systems (GIS) mapping process was used to illustrate disparities in revenues per capita between California’s 58 counties. The map shows that nonprofit revenues are not distributed proportionately throughout the state.
Regional differences
The 10 Regionsof California
Causes Count: the eConomiC Power of California’s nonProfit seCtor — CalnonProfits — 2014 — www.CalnonProfits.org 31
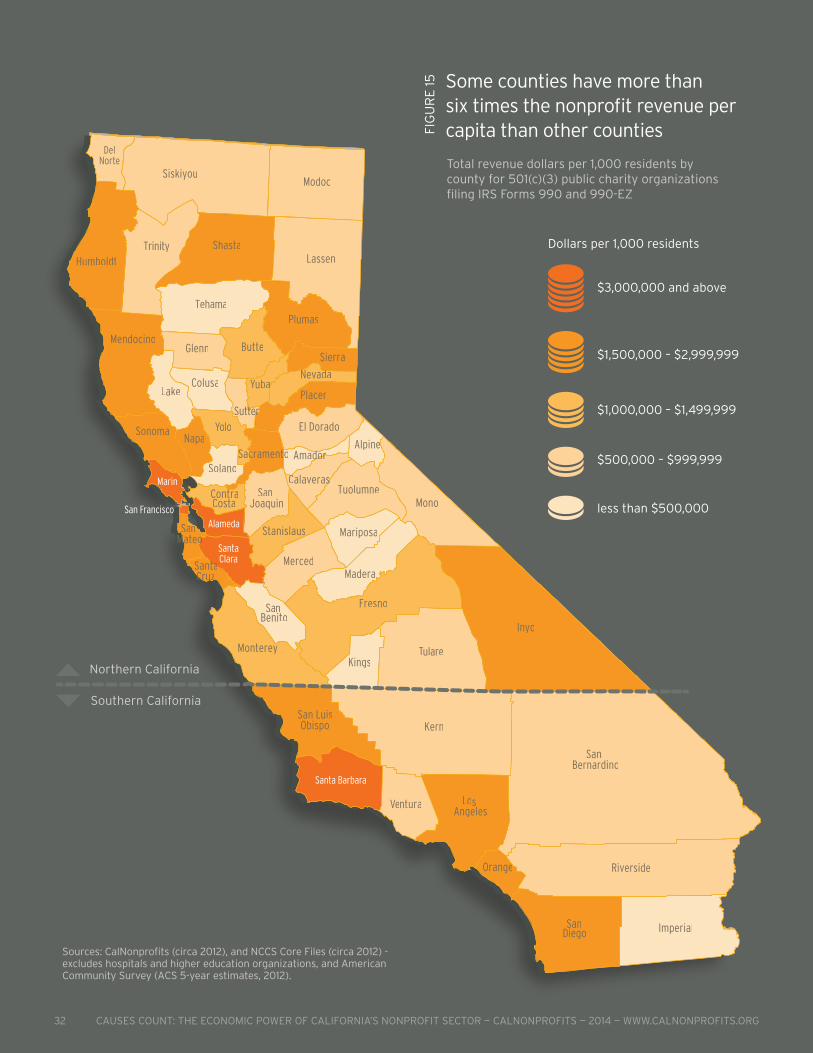
Fig
ur
e 1
5
Northern California
Southern California
Some counties have more than six times the nonprofit revenue per capita than other counties
Total revenue dollars per 1,000 residents by county for 501(c)(3) public charity organizations filing IRS forms 990 and 990-EZ
$3,000,000 and above
$1,500,000 – $2,999,999
$1,000,000 – $1,499,999
$500,000 – $999,999
less than $500,000
Dollars per 1,000 residents
Sources: CalNonprofits (circa 2012), and NCCS Core files (circa 2012) - excludes hospitals and higher education organizations, and American Community Survey (ACS 5-year estimates, 2012).
32 CausesCount:theeConomiCPowerofCalifornia’snonProfitseCtor—CalnonProfits—2014—www.CalnonProfits.org
Colusa
Glenn
Kings
Mariposa
Modoc
Sacramento
SanBernardino
Shasta
Tulare
Alpine
Mendocino
Merced
Mono
Monterey
Napa
Nevada
Orange
Placer
Plumas
Riverside
SanBenito
SanDiego
SanJoaquin
Amador
Butte
CalaverasContraCosta
El Dorado
Fresno
Humboldt
Imperial
Inyo
Kern
Lake
Lassen
Madera
San LuisObispo
SanMateo
SantaCruz
Sierra
Siskiyou
Solano
Sonoma
Stanislaus
Tehama
Trinity
Tuolumne
Yolo
Yuba
Sutter
LosAngeles
Ventura
Marin
SantaClara
Alameda
DelNorte
San Francisco
Santa Barbara

When analyzing statewide data, policy makers and researchers often categorize California counties into regions. for this study we utilized nine regions identified by the Public Policy Institute of California, and added Orange County as a distinct region for a total of 10 regions. figure 16 shows notable disparities in revenues and assets between these 10 California regions. for example, the Bay Area region represents 20 percent of the state’s total population, yet it comprises 53 percent of all California nonprofit revenue, and 49 percent of the sector’s assets. In contrast, the Inland Empire and San Joaquin regions are heavily populated, yet the number of nonprofits, revenue, and assets per capita in these regions are notably smaller than most other regions.
Far North
Sac Metro
Sierras
San Joaquin
Los Angeles
San Diego
Orange
CentralCoast
Inland Empire
Bay Area
California nonprofit revenues and assets by California region
Total revenues, assets, and number of 501(c)(3) public charity organizations filing IRS Forms 990 and 990-EZ per capita by region
Sources: CalNonprofits (circa 2012), NCCS Core Files (circa 2012) and American Community Survey (ACS 5-year estimates, 2012).
Fig
ur
e 1
6
The 10 Regionsof California
Location% CA
populationNumber of nonprofits
% of Total
Total revenue
(in billions)
% Total
revenue
Total assets (in
billions)
% Total
assets
Nonprofits per capita
(1,000)
Revenue per
capita
Assets per
capita
Bay Area 19% 11,648 28% $ 1 1 1 . 1 53% $161.5 49% 1.62 $15,493 $22,518
Central Coast 4% 2,249 5% $4.3 2% $8.7 3% 1.58 $3,033 $ 6,1 1 1
Far North 3% 1,749 4% $3.4 2% $4.0 1% 1.44 $2,827 $3,263
Inland Empire 11% 2,661 6% $6.3 3% $9.8 3% 0.63 $1,478 $2,317
Los Angeles 29% 10,819 26% $43.6 21% $81.3 25% 1.01 $4,093 $7,628
Orange 8% 3,360 8% $9.7 5% $19.8 6% 1 .1 1 $3,2 1 1 $6,543
Sacramento Metro 6% 2,526 6% $7.4 4% $12.6 4% 1.17 $3,459 $5,834
San Diego 9% 3,586 9% $13.8 7% $20.3 6% 1.10 $4,208 $6,207
San Joaquin 1 1% 2,706 7% $8.4 4% $10.1 3% 0.68 $2,125 $2,532
Sierras 1% 323 1% $0.3 0% $0.3 0% 1.70 $1,652 $1,539
TOTAL/AVERAGE 100% 41,627 100% $208.4 100% $328.4 100% 1.12 $5,585 $8,797
Causes Count: the eConomiC Power of California’s nonProfit seCtor — CalnonProfits — 2014 — www.CalnonProfits.org 33
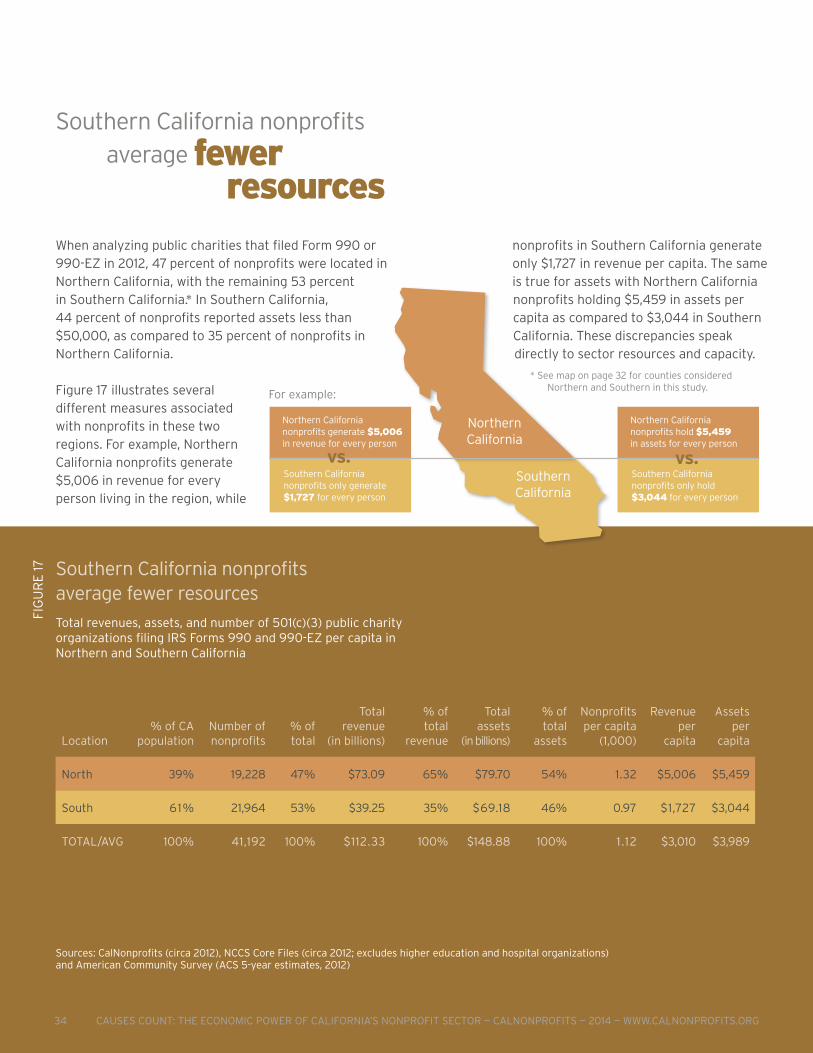
Southern California nonprofits
average fewer resources
Location% of CA
populationNumber of nonprofits
% of total
Total revenue
(in billions)
% of total
revenue
Total assets
(in billions)
% of total
assets
Nonprofits per capita
(1,000)
Revenue per
capita
Assets per
capita
North 39% 19,228 47% $73.09 65% $79.70 54% 1.32 $5,006 $5,459
South 61% 21,964 53% $39.25 35% $69.18 46% 0.97 $1,727 $3,044
TOTAL/AVG 100% 41,192 100% $112.33 100% $148.88 100% 1.12 $3,010 $3,989
When analyzing public charities that filed form 990 or 990-EZ in 2012, 47 percent of nonprofits were located in Northern California, with the remaining 53 percent in Southern California.* In Southern California, 44 percent of nonprofits reported assets less than $50,000, as compared to 35 percent of nonprofits in Northern California.
figure 17 illustrates several different measures associated with nonprofits in these two regions. for example, Northern California nonprofits generate $5,006 in revenue for every person living in the region, while
Northern California
Southern California
Northern California nonprofits generate $5,006 in revenue for every person
Southern California nonprofits only generate $1,727 for every person
Northern California nonprofits hold $5,459 in assets for every person
Southern California nonprofits only hold $3,044 for every person
vs. vs.
nonprofits in Southern California generate only $1,727 in revenue per capita. The same is true for assets with Northern California nonprofits holding $5,459 in assets per capita as compared to $3,044 in Southern California. These discrepancies speak directly to sector resources and capacity.
For example:
Sources: CalNonprofits (circa 2012), NCCS Core Files (circa 2012; excludes higher education and hospital organizations)and American Community Survey (ACS 5-year estimates, 2012)
* See map on page 32 for counties considered Northern and Southern in this study.
Fig
ur
e 1
7 Southern California nonprofits average fewer resources
Total revenues, assets, and number of 501(c)(3) public charity organizations filing IRS Forms 990 and 990-EZ per capita in Northern and Southern California
34 CausesCount:theeConomiCPowerofCalifornia’snonProfitseCtor—CalnonProfits—2014—www.CalnonProfits.org
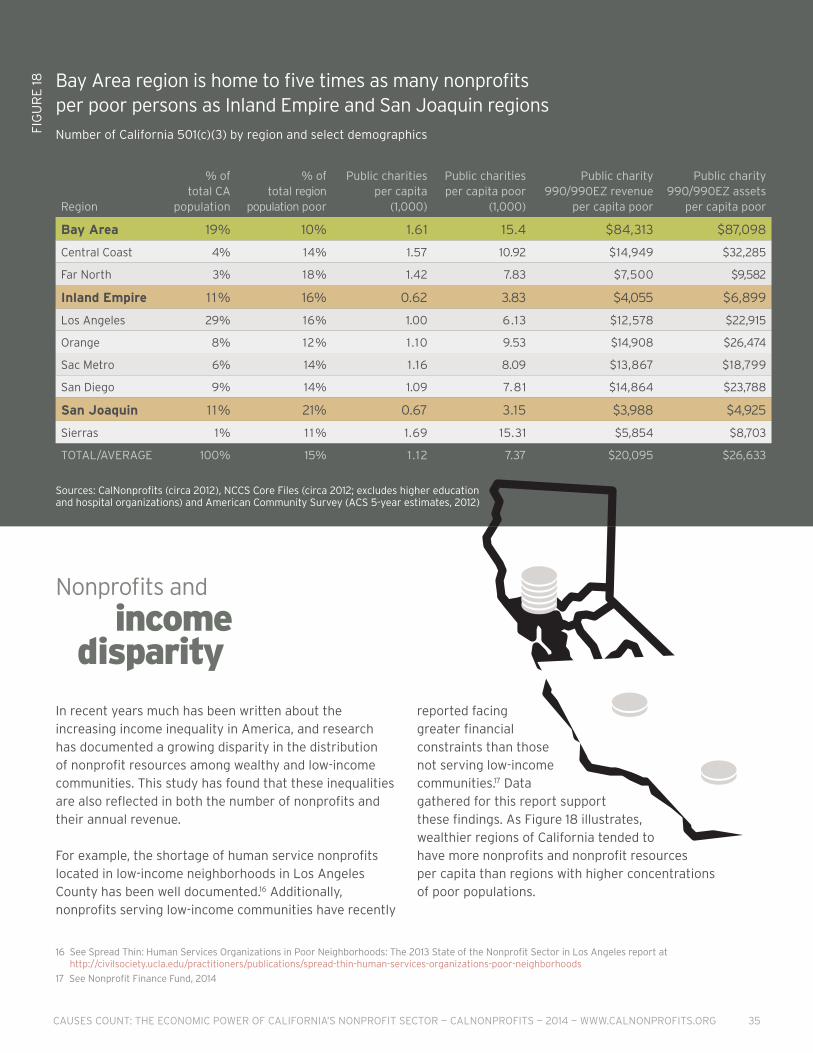
Fig
ur
e 1
8 Bay Area region is home to five times as many nonprofits per poor persons as Inland Empire and San Joaquin regions
Number of California 501(c)(3) by region and select demographics
Sources: CalNonprofits (circa 2012), NCCS Core Files (circa 2012; excludes higher education and hospital organizations) and American Community Survey (ACS 5-year estimates, 2012)
Nonprofits and
income disparityIn recent years much has been written about the increasing income inequality in America, and research has documented a growing disparity in the distribution of nonprofit resources among wealthy and low-income communities. This study has found that these inequalities are also reflected in both the number of nonprofits and their annual revenue.
for example, the shortage of human service nonprofits located in low-income neighborhoods in Los Angeles County has been well documented.16 Additionally, nonprofits serving low-income communities have recently
reported facing greater financial constraints than those not serving low-income communities.17 Data gathered for this report support these findings. As figure 18 illustrates, wealthier regions of California tended to have more nonprofits and nonprofit resources per capita than regions with higher concentrations of poor populations.
16 See Spread Thin: Human Services Organizations in Poor Neighborhoods: The 2013 State of the Nonprofit Sector in Los Angeles report at http://civilsociety.ucla.edu/practitioners/publications/spread-thin-human-services-organizations-poor-neighborhoods
17 See Nonprofit finance fund, 2014
Region
% of total CA
population
% of total region
population poor
Public charities per capita
(1,000)
Public charities per capita poor
(1,000)
Public charity 990/990EZ revenue
per capita poor
Public charity 990/990EZ assets
per capita poor
Bay Area 19% 10% 1.61 15.4 $84,313 $87,098
Central Coast 4% 14% 1.57 10.92 $14,949 $32,285
far North 3% 18% 1.42 7.83 $7,500 $9,582
Inland Empire 1 1% 16% 0.62 3.83 $4,055 $6,899
Los Angeles 29% 16% 1.00 6.13 $12,578 $22,915
Orange 8% 12% 1.10 9.53 $14,908 $26,474
Sac Metro 6% 14% 1.16 8.09 $13,867 $18,799
San Diego 9% 14% 1.09 7.81 $14,864 $23,788
San Joaquin 1 1% 21% 0.67 3.15 $3,988 $4,925
Sierras 1% 1 1 % 1.69 15.31 $5,854 $8,703
TOTAL/AVERAGE 100% 15% 1.12 7.37 $20,095 $26,633
Causes Count: the eConomiC Power of California’s nonProfit seCtor — CalnonProfits — 2014 — www.CalnonProfits.org 35

% of CA population
Number of nonprofits
% of total
Total revenue
(in billions)
% of total
revenue
Total assets (in
billions)
% of total
assets
Nonprofits per capita
(1,000)
Revenue per
capita
Assets per
capita
Metro 98% 39,747 96% $11 1 .3 99% $147.5 99% 1.09 $3,050 $4,042
Rural 2% 1,445 4% $1.0 1% $1.4 1% 1.72 $1,244 $1,690
TOTAL/AVG 100% 41,192 100% $112.3 100% $148.9 100% 1.12 $3,010 $3,989
Sources: CalNonprofits (circa 2012), NCCS Core Files (circa 2012; excludes higher education and hospital organizations)and American Community Survey (ACS 5-year estimates, 2012)
Rural nonprofits work with fewer resourcesSimilar to the findings noted above, there were also disparities in the nonprofit resources available to Californians who reside in rural areas.20 Although there were actually more nonprofits per capita in rural parts of the state, as figure 19 illustrates, nonprofits in
metropolitan areas had more than twice the revenues per capita and more than three times the assets per capita than their rural counterparts. Consequently, nonprofits in metropolitan areas are likely to be better positioned to serve their constituencies.
Rural nonprofits average fewer resources than nonprofits in metropolitan areas
Fig
ur
e 1
9
Total revenues, assets, and number of 501(c)(3) public charity organizations filing IRS Forms 990 and 990-EZ per capita in metropolitan and rural areas.
Specifically, the Bay Area region, home to seven of the top ten wealthiest counties in California,18 comprised almost 20 percent of the state’s total population and 10 percent of California’s poor. In contrast, the Inland Empire and the San Joaquin regions collectively represented a similar percent of the state’s total population (22%); however, the Bay Area had twice as many nonprofits per capita, five times as many nonprofits per capita poor persons, and 21 times more per capita nonprofit revenue dollars available to serve communities in these regions.
18 See http://quickfacts.census.gov19 Additional regional data are available at www.calnonprofits.org/causes-count/regionalbreakdown20 See State of California Department of Justice, Office of the Attorney General definition of rural counties.
Although not shown in figure 18, an analysis of contributed income found that the regions with higher concentrations of poor persons were also more likely to rely on government grants as a form of contributed income than areas with lower concentrations of poor persons. for instance, the Bay Area derived 37 percent of its contributions from government grants, while the Inland Empire and the San Joaquin regions derived over two-thirds of their contributed revenue from government grants and contracts in 2012.19
36 CausesCount:theeConomiCPowerofCalifornia’snonProfitseCtor—CalnonProfits—2014—www.CalnonProfits.org

Fig
ur
e 2
0 Fewer nonprofits and nonprofit resources in communities of color
California is one of only five states in the country in which the majority of the population is comprised of ethnic minority groups. It is projected that by the end of 2014, Hispanics will define the largest racial/ethnic group in the state.21 Despite the state’s “minority-majority” status, this research found that there are fewer nonprofits and less funding for nonprofits in communities that are predominately non-white and Hispanic.
Notwithstanding this continued growth of racial and ethnic diversity, very little is known about the nonprofit sector in communities of color across the state or how to properly define and identify communities of color across a largely diverse population. As an initial step toward understanding the scope and roles of nonprofits in communities of color, American Community Survey census data were used to identify zip codes where 20 percent or less of the population self-identified as white and not Hispanic. These areas, with 80 percent or higher populations other than white, are defined as communities of color for purposes of this study, but in truth represent a wide diversity of communities within and among themselves.
Using this measure, 305 communities of color were identified in California, representing 18 percent of all zip code areas and 27 percent of California’s total population. A comparison of California public charities (filing form 990 or 990-EZ) within these two community groups, presented in figure 20, indicates a notable disparity in the number of nonprofits per capita. Specifically, there are half as many nonprofits per capita located within communities of color as there are within less racially diverse communities. The disparity is even greater with regard to financial resources. We recognize these disparities are driven by complex contextual factors not fully captured in the scope of this study. However, these findings may suggest that recent efforts to strengthen “locally grown” institutions in communities of color still have a long way to go.
Nonprofits in communities of color:
fewer and less resourced
Communities of color(population in zip code >–80% non-white)
All others(population in zip code <80% non-white)
Nonprofit organizations
per capita (1,000)
Nonprofit revenues per
capita (1,000)
Assets per capita (1,000)
0.5
$1,355
$1,921
1.14
$3,497
$4,473
Sources: CalNonprofits (circa 2012), NCCS Core Files (circa 2012; excludes higher education and hospital organizations) and American Community Survey (ACS 5-year estimates, 2012)
21 See Pew Research factTank at www.pewresearch.org/fact-tank/2014/01/24/in-2014-latinos-will-surpass-whites-as-largest-racialethnic-group-in-california
Causes Count: the eConomiC Power of California’s nonProfit seCtor — CalnonProfits — 2014 — www.CalnonProfits.org 37
Most California nonprofits report diversified, hybrid income streams
PART 5
Nonprofit Finances Count

Programs generate 76% of nonprofit sector revenue
In this study, Californians were asked, “Where do California nonprofits get their money?” Eighty-four percent of respondents believed nonprofits acquired the majority of revenue from donations. However, in reality, as figure 21 illustrates, the bulk (76%) of nonprofit revenue is generated through program fees and contracts. According to the IRS, program service revenue includes revenue collected from fee-for-service activities directly related to the organization’s mission.22 Although most government funds come to nonprofits in the form of contracts for services, government funds are classified as contributed income.
Examples of program service revenue include:
• Museum admission and theater ticket charges
• Payments for medical services at a hospital or nursing home
• School tuition, and registration payments to youth sports clubs
• Payments from state and/or federal medical insurance programs
22 Charitable contributions, grants, and the charitable portion, if any, of membership dues are not included in the definition of program service revenue. Program revenue also may contain unrelated business income. See IRS 990, Current form 990 Series – forms and Instructions available at www.irs.gov/pub/irs-prior/i990--2012.pdf
75.6%
0.2% 1.2%
Special events
Other income
Investment income
Sale of assets
Program revenue
1.4%
1.4%
Contributions20.2%
Nonprofit income streams are not understood by the public
Revenue sources of 501(c)(3) public charity organizations
Sources: CalNonprofits (circa 2012), NCCS Core Files (circa 2012) and American Community Survey (ACS 5-year estimates, 2012).
Fig
ur
e 2
1
Causes Count: the eConomiC Power of California’s nonProfit seCtor — CalnonProfits — 2014 — www.CalnonProfits.org 39

Contributions come
from multiple sources
Contributions
48.5%
Government grants (federal, state, and local)
Individual, corporate, foundation and all other Related
organizations44.3%3.5%
2.1%
Fundraising events
Fig
ur
e 2
2 Government grants make up almost half of contributed income
Federated campaigns0.6%
Membership contributions1.1%
Contributions, gifts and grants by source for 501(c)(3) public charity organizations
Source: CalNonprofits (circa 2012).
Program revenue
A line item analysis of IRS form 990 conducted specifically for this study allowed for a more detailed accounting of the contributions revenue category than is usually available to researchers. The findings from this analysis further illustrate the diverse revenue mixes present in nonprofit organizations. As figure 22 shows, government plays a larger role in terms of contributed income than might be expected, generating almost half (49%) of contributions to nonprofits. However, nonprofits are not required to designate on tax forms whether the money is generated from federal, state or local
sources, and thus, disaggregating different types of government funding is not possible. Similarly, an additional 44 percent of the contributed income category is comprised of gifts from individuals, corporations and foundations but, again, further disaggregation is not available.
40 CausesCount:theeConomiCPowerofCalifornia’snonProfitseCtor—CalnonProfits—2014—www.CalnonProfits.org
Contributions
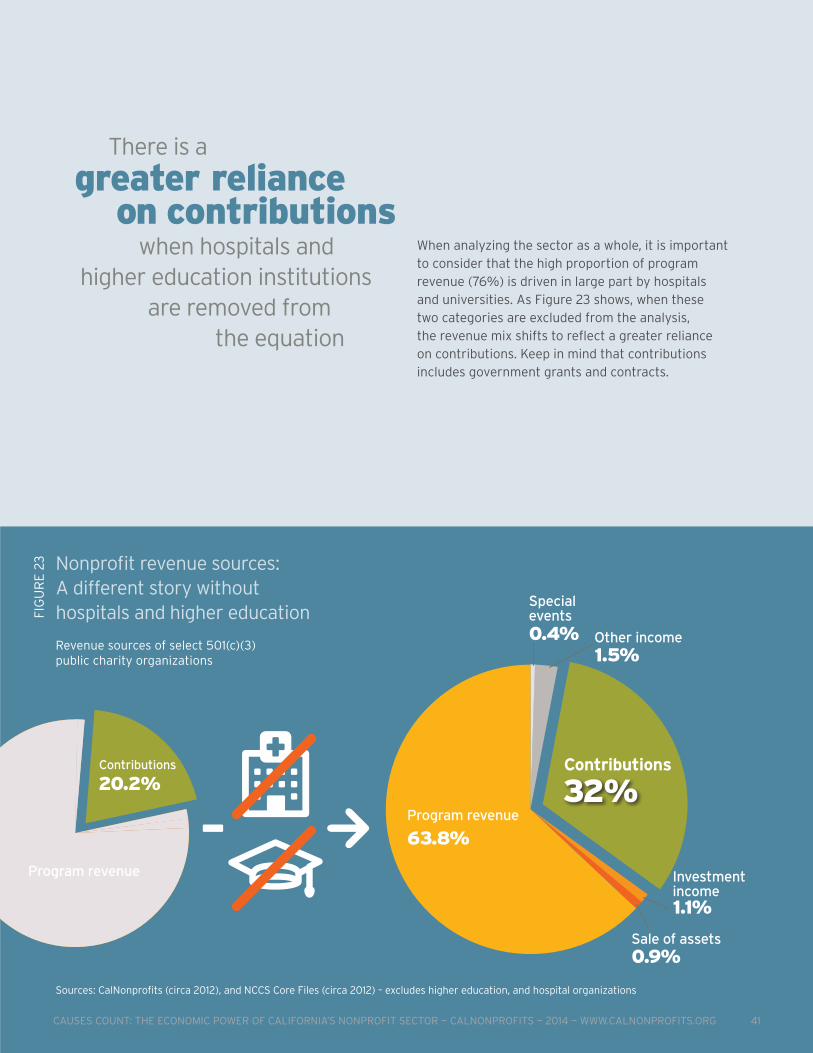
Revenue sources of select 501(c)(3) public charity organizations
Sources: CalNonprofits (circa 2012), and NCCS Core Files (circa 2012) – excludes higher education, and hospital organizations
Nonprofit revenue sources: A different story without hospitals and higher education
32%Contributions
There is a
greater reliance on contributions when hospitals and higher education institutions are removed from the equation
Fig
ur
e 2
3
20.2%
Special events
Other income
Investment income
Program revenue
Program revenue
Sale of assets
0.4%1.5%
1.1%
63.8%
0.9%
When analyzing the sector as a whole, it is important to consider that the high proportion of program revenue (76%) is driven in large part by hospitals and universities. As Figure 23 shows, when these two categories are excluded from the analysis, the revenue mix shifts to reflect a greater reliance on contributions. Keep in mind that contributions includes government grants and contracts.
Causes Count: the eConomiC Power of California’s nonProfit seCtor — CalnonProfits — 2014 — www.CalnonProfits.org 41

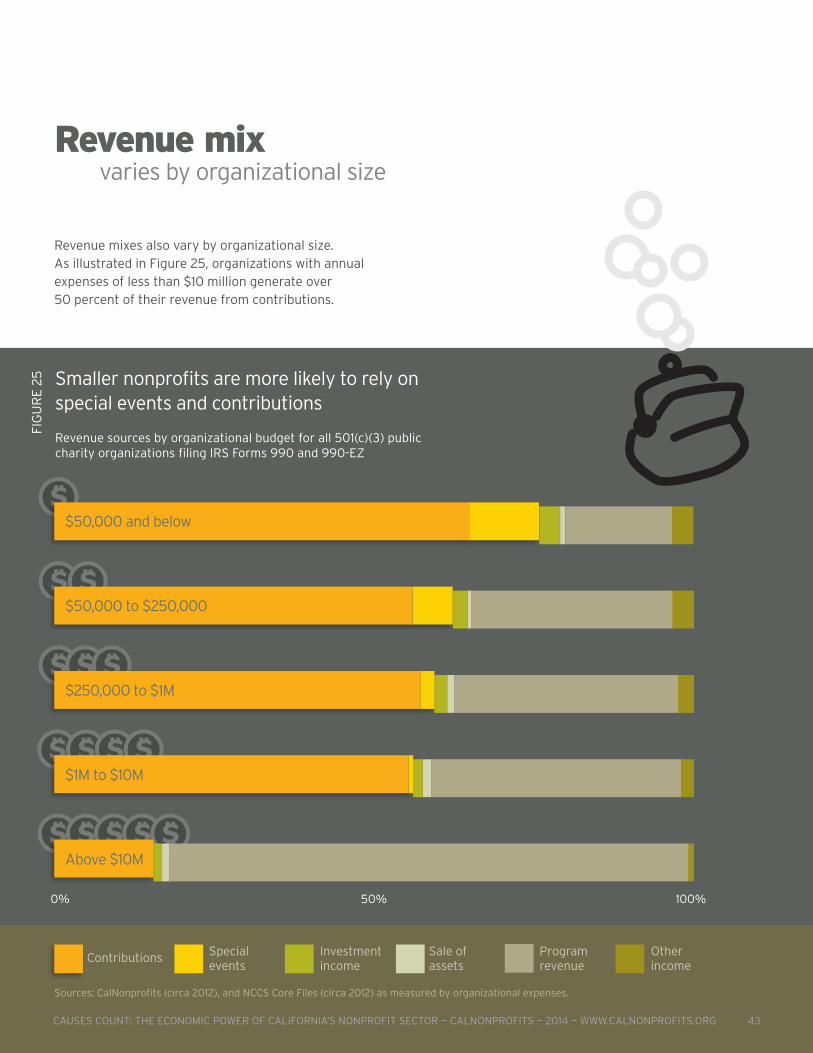
0% 50% 100%
Contributions Special events
Investment income
Sale of assets
Program revenue
Other income
As figure 24 illustrates, different types of nonprofits have different business models. for instance, as previously noted, hospitals and other health-related organizations rely heavily on program revenue, while international and environmental organizations are more reliant on contributions. Within each sub-sector, there is great diversity as well.
Revenue sources
differ by type and size of nonprofit
Arts and environmental nonprofits rely more on contributions than do health-related and higher education nonprofits
Revenue sources by organizational type for 501(c)(3) public charity organizations filing IRS Forms 990 and 990-EZ
Fig
ur
e 2
4
Sources: CalNonprofits (circa 2012), and NCCS Core files (circa 2012).
Arts, culture, and humanities
Higher education
Education, other
Environment
Human services
International
Hospitals
Health, other
Mutual, public, and social benefit
42 CausesCount:theeConomiCPowerofCalifornia’snonProfitseCtor—CalnonProfits—2014—www.CalnonProfits.org
Contributions Special events
Investment income
Sale of assets
Program revenue
Other income
Revenue mix varies by organizational size
Smaller nonprofits are more likely to rely on special events and contributions
Revenue sources by organizational budget for all 501(c)(3) public charity organizations filing IRS Forms 990 and 990-EZ
Fig
ur
e 2
5
Sources: CalNonprofits (circa 2012), and NCCS Core files (circa 2012) as measured by organizational expenses.
$50,000 to $250,000
$250,000 to $1M
$1M to $10M
Above $10M
$50,000 and below
0% 50% 100%
Revenue mixes also vary by organizational size. As illustrated in figure 25, organizations with annual expenses of less than $10 million generate over 50 percent of their revenue from contributions.
Causes Count: the eConomiC Power of California’s nonProfit seCtor — CalnonProfits — 2014 — www.CalnonProfits.org 43
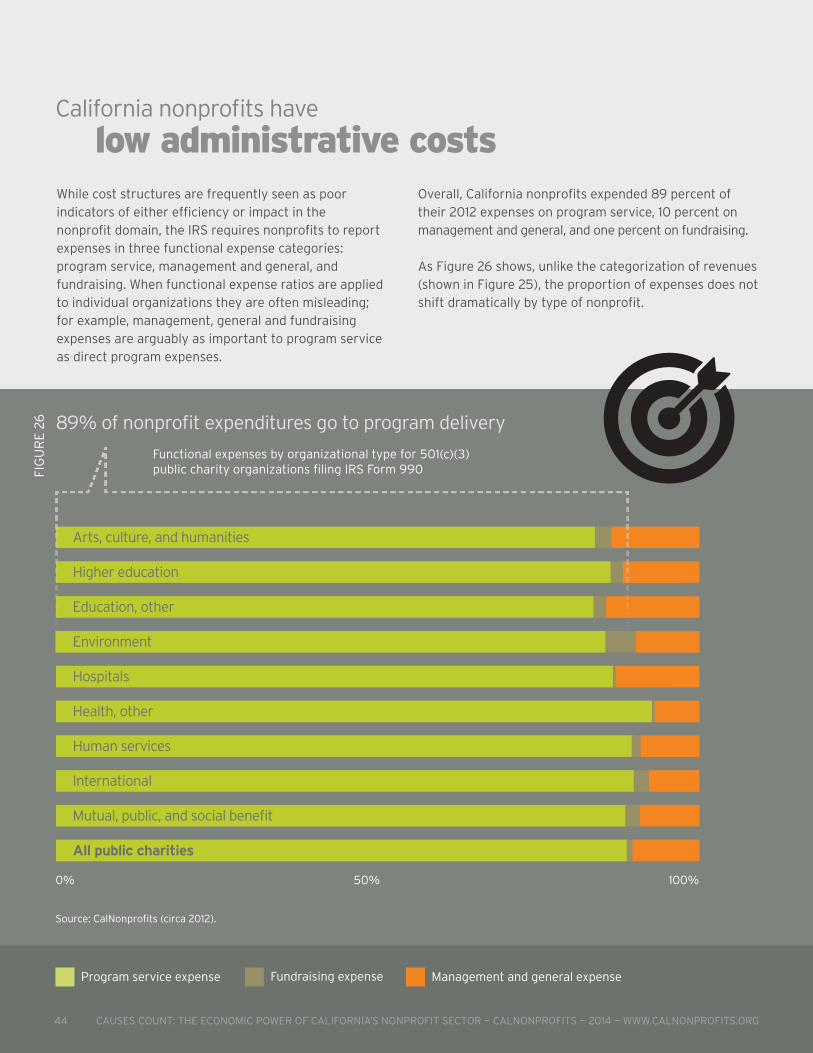
0% 50% 100%
89% of nonprofit expenditures go to program delivery
Fig
ur
e 2
6
Arts, culture, and humanities
Higher education
Education, other
Environment
Human services
International
Hospitals
Health, other
Mutual, public, and social benefit
All public charities
Functional expenses by organizational type for 501(c)(3) public charity organizations filing IRS Form 990
Source: CalNonprofits (circa 2012).
California nonprofits have
low administrative costs While cost structures are frequently seen as poor indicators of either efficiency or impact in the nonprofit domain, the IRS requires nonprofits to report expenses in three functional expense categories: program service, management and general, and fundraising. When functional expense ratios are applied to individual organizations they are often misleading; for example, management, general and fundraising expenses are arguably as important to program service as direct program expenses.
Overall, California nonprofits expended 89 percent of their 2012 expenses on program service, 10 percent on management and general, and one percent on fundraising.
As figure 26 shows, unlike the categorization of revenues (shown in figure 25), the proportion of expenses does not shift dramatically by type of nonprofit.
Fundraising expense Management and general expenseProgram service expense
44 CausesCount:theeConomiCPowerofCalifornia’snonProfitseCtor—CalnonProfits—2014—www.CalnonProfits.org

Indicators of nonprofit
financial health are improving
Fig
ur
e 2
7 Nonprofit surplus margins still below pre-recession levels
Surplus operating margins are increasing
During the boom years of the early 2000s, nonprofits were able to generate modest surpluses to create reserves and working capital, and some organizations had surplus margins of more than 30 percent of their operating budgets. Figure 27 illustrates a decline in levels of surpluses during the Great Recession, beginning in 2007 and reaching the lowest point in 2009. Overall, California’s nonprofit sector had a surplus margin of 5.47 in 2012. Although surpluses are again beginning to improve, nonprofits still operate with little margin for error.
Researchers are only now able to study and assess the impact of the Great Recession on the financial state of California’s nonprofit sector because nonprofit financial data are often delayed at least two years. In order to construct such an analysis, this section of the report presents longitudinal data from 2004 to 2012 regarding two indicators of financial health: surplus operating margins and deficit spending.23
Arts, culture, & humanities
Education, other
Hospitals
Human services
Mutual, public, & social benefit
Higher education
Environment
International
Health, other
Total
30%
25%
20%
15%
10%
5%
0%
-5%
-10%
2004 2006 2008 2010 2012
Average surplus margin ratio by organizational type for 501(c)(3) public charity organizations filing IRS Forms 990 and 990-EZ
23 Calculating a surplus margin (equivalent to profit margin) is accomplished by dividing the end of year surplus (or deficit) by total revenue. A margin of less than zero indicates that expenses exceed revenues, and a margin of greater than zero indicates that revenues exceed expenses. Sources: CalNonprofits (circa 2012), and NCCS Core Files (circa 2004-2012).
Causes Count: the eConomiC Power of California’s nonProfit seCtor — CalnonProfits — 2014 — www.CalnonProfits.org 45
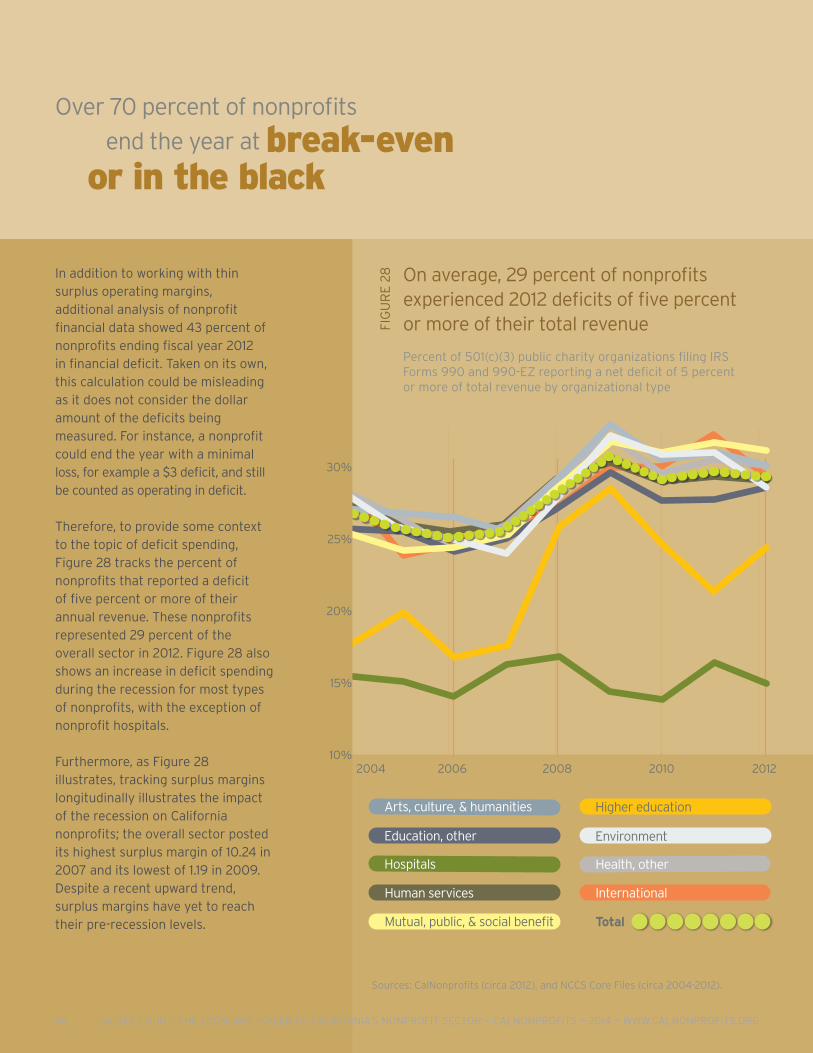
Fig
ur
e 2
8 On average, 29 percent of nonprofits experienced 2012 deficits of five percent or more of their total revenue
Arts, culture, & humanities
Education, other
Hospitals
Human services
Mutual, public, & social benefit
Higher education
Environment
International
Health, other
Total
2004 2006 2008 2010 2012
Sources: CalNonprofits (circa 2012), and NCCS Core Files (circa 2004-2012).
Percent of 501(c)(3) public charity organizations filing IRS Forms 990 and 990-EZ reporting a net deficit of 5 percent or more of total revenue by organizational type
Over 70 percent of nonprofits
end the year at break-even or in the black
30%
25%
20%
15%
10%
In addition to working with thin surplus operating margins, additional analysis of nonprofit financial data showed 43 percent of nonprofits ending fiscal year 2012 in financial deficit. Taken on its own, this calculation could be misleading as it does not consider the dollar amount of the deficits being measured. For instance, a nonprofit could end the year with a minimal loss, for example a $3 deficit, and still be counted as operating in deficit.
Therefore, to provide some context to the topic of deficit spending, Figure 28 tracks the percent of nonprofits that reported a deficit of five percent or more of their annual revenue. These nonprofits represented 29 percent of the overall sector in 2012. Figure 28 also shows an increase in deficit spending during the recession for most types of nonprofits, with the exception of nonprofit hospitals.
Furthermore, as Figure 28 illustrates, tracking surplus margins longitudinally illustrates the impact of the recession on California nonprofits; the overall sector posted its highest surplus margin of 10.24 in 2007 and its lowest of 1.19 in 2009. Despite a recent upward trend, surplus margins have yet to reach their pre-recession levels.
46 CausesCount:theeConomiCPowerofCalifornia’snonProfitseCtor—CalnonProfits—2014—www.CalnonProfits.org
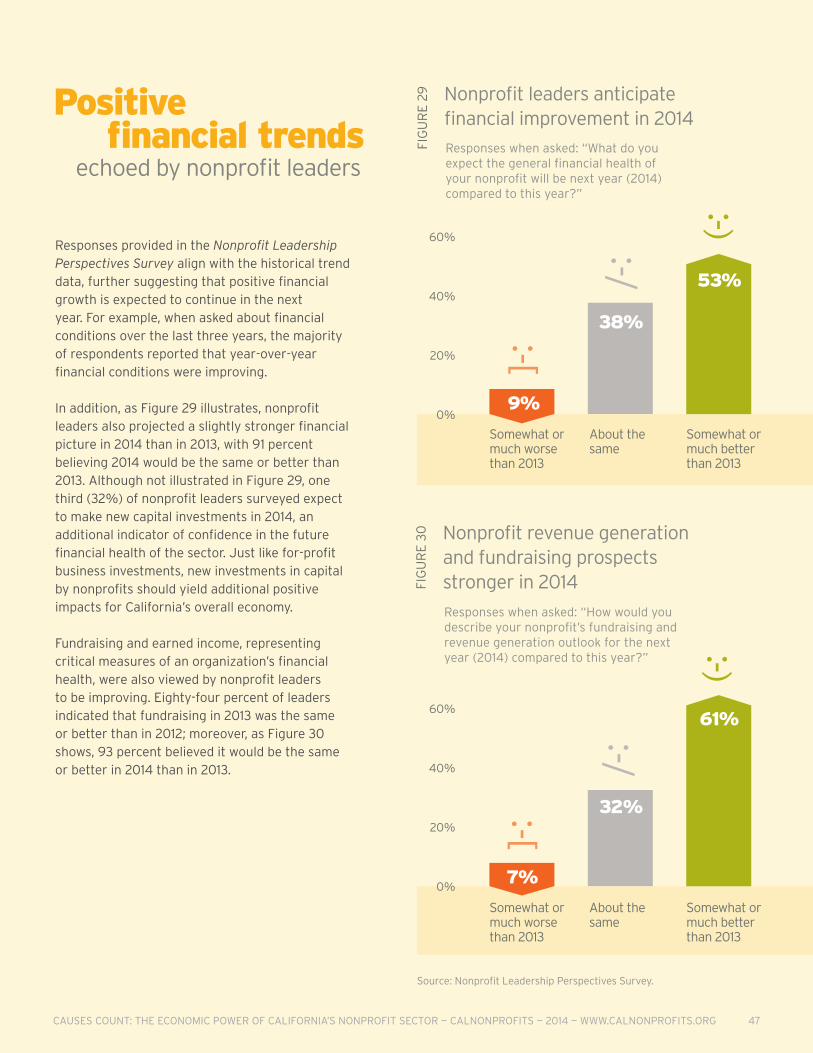
60%
40%
20%
0%7%
Somewhat or much worse than 2013
32%
About the same
61%
Somewhat or much better than 2013
60%
40%
20%
0%9%
Somewhat or much worse than 2013
38%
About the same
53%
Somewhat or much better than 2013
:- )
:-/
:- [
Positive financial trends echoed by nonprofit leaders
Responses provided in the Nonprofit Leadership Perspectives Survey align with the historical trend data, further suggesting that positive financial growth is expected to continue in the next year. For example, when asked about financial conditions over the last three years, the majority of respondents reported that year-over-year financial conditions were improving.
In addition, as Figure 29 illustrates, nonprofit leaders also projected a slightly stronger financial picture in 2014 than in 2013, with 91 percent believing 2014 would be the same or better than 2013. Although not illustrated in Figure 29, one third (32%) of nonprofit leaders surveyed expect to make new capital investments in 2014, an additional indicator of confidence in the future financial health of the sector. Just like for-profit business investments, new investments in capital by nonprofits should yield additional positive impacts for California’s overall economy.
Fundraising and earned income, representing critical measures of an organization’s financial health, were also viewed by nonprofit leaders to be improving. Eighty-four percent of leaders indicated that fundraising in 2013 was the same or better than in 2012; moreover, as Figure 30 shows, 93 percent believed it would be the same or better in 2014 than in 2013.
Nonprofit leaders anticipate financial improvement in 2014
Nonprofit revenue generation and fundraising prospects stronger in 2014
Source: Nonprofit Leadership Perspectives Survey.
Fig
ur
e 2
9Fi
gu
re
30
Responses when asked: “What do you expect the general financial health of your nonprofit will be next year (2014) compared to this year?”
Responses when asked: “How would you describe your nonprofit’s fundraising and revenue generation outlook for the next year (2014) compared to this year?”
:- )
:-/
:- [
Causes Count: the eConomiC Power of California’s nonProfit seCtor — CalnonProfits — 2014 — www.CalnonProfits.org 47

PART 6
Values Count
of Californians believe
nonprofits act on the public’s
behalf, while only 45% think
so of for-profit business
82%

80%
60%
40%
20%
0%
findings in this final section of the report document the myriad ways Californians are engaged and inspired by nonprofits, the roles nonprofits play in our democratic process, as well as the ways in which nonprofits express the deeply held values of our communities. Data from the 1,659 respondents in our Individual Perspectives Survey suggested that Californians hold nonprofits in high esteem compared to other sectors, and are confident that nonprofits are working on the public’s behalf.
Respondents expressed high levels of confidence in the sector’s ability to benefit communities and society at large. In particular, figure 31 shows Californians believe that nonprofits do a better job than either government or the for-profit sector in acting on the public’s behalf, providing quality services, operating effectively and spending money wisely.
Californians trust nonprofits In addition to their robust economic power, California nonprofits have a daily and wide-reaching impact on the lives of people throughout the state
Survey responses when asked “Please rate your overall level of confidence in California’s organizations to: a) Act on the public’s behalf, b) Provide quality services, c) Operate effectively, d) Spend money wisely
Fig
ur
e 3
1 Californians give nonprofits higher marks than the for-profit or government sectors
82%
45%48%
Act on the public’s behalf
85%
77%
54%
Provide quality services
77%72%
40%
Operate effectively
69%
55%
31%
Spend money wisely
Source: Individual Perspectives Survey.
Nonprofit
Government
For-Profit
Causes Count: the eConomiC Power of California’s nonProfit seCtor — CalnonProfits — 2014 — www.CalnonProfits.org 49

Contrary to conventional perceptions of the for-profit sector as the place
where jobs are created and where businesses run efficiently, figure
32 shows that Californians who responded to the Individual Perspectives Survey expressed
slightly more confidence in nonprofits to create jobs in the community and to work efficiently compared to the for-profit sector. furthermore, respondents expressed much greater confidence in nonprofits to act ethically and to promote positive social change, compared to the for-profit and government sectors.
80%
60%
40%
20%
0%
Survey responses when asked “Please rate your overall level of confidence in California’s nonprofit organizations to: a) Create jobs for people in our community, b) Work effectively, c) Act ethically, d) Promote positive social change”
Fig
ur
e 3
2 High approval ratings for nonprofits
Source: Individual Perspectives Survey.
Nonprofit
Government
For-Profit
68% 67%
44%
Create jobs for people in our community
77%73%
39%
Work efficiently
83%
55%
48%
Act ethically
82%
51%48%
Promote positive social change
Californians express
confidence in nonprofits
50 CausesCount:theeConomiCPowerofCalifornia’snonProfitseCtor—CalnonProfits—2014—www.CalnonProfits.org

Nonprofits mobilize multiple constituencies for
social changeWith strong public trust as its bedrock, nonprofits have become an important vehicle for public participation in civic affairs. Individuals engage with nonprofits in a variety of ways — as patrons, clients and beneficiaries; as volunteers and employees; as board leaders and advocates.
As demonstrated in figure 33, staff and board members are those primarily engaged in advocacy work on behalf of nonprofits. They are followed by clients and constituents, and, finally, by volunteers. Additionally, nonprofits are more likely to mobilize people around community issues than to encourage people to vote or contact their elected officials.
Staff and Board
Mobilized around community issues 49%
Encouraged to vote 32%
Encouraged to contact elected officials 35%
VoluntEErS
Mobilized around community issues 37%
Encouraged to vote 23%
Encouraged to contact elected officials 23%
CliEntS and ConStituEntS
Mobilized around community issues 42%
Encouraged to vote 26%
Encouraged to contact elected officials 27%
Nonprofits mobilize multiple constituencies
Fig
ur
e 3
3
Survey responses when asked: “In the past 12 months, to what extent did your nonprofit engage in the following activities?”
Source: Nonprofit Leadership Perspectives Survey.
Causes Count: the eConomiC Power of California’s nonProfit seCtor — CalnonProfits — 2014 — www.CalnonProfits.org 51
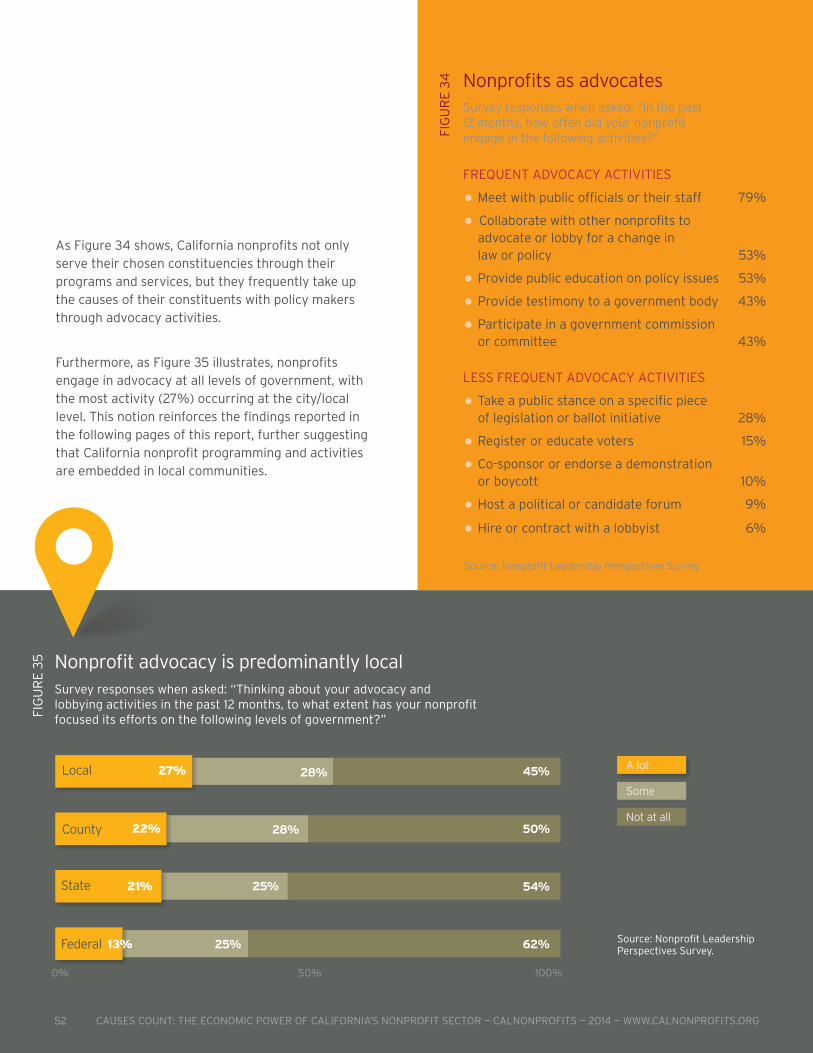
Nonprofit advocacy is predominantly local
A lot
Some
Not at all
Fig
ur
e 3
5
Survey responses when asked: “Thinking about your advocacy and lobbying activities in the past 12 months, to what extent has your nonprofit focused its efforts on the following levels of government?”
Source: Nonprofit Leadership Perspectives Survey.
0% 50% 100%
Local 27% 28%
County 22% 28%
State 21% 25%
Federal 13% 25%
As figure 34 shows, California nonprofits not only serve their chosen constituencies through their programs and services, but they frequently take up the causes of their constituents with policy makers through advocacy activities.
furthermore, as figure 35 illustrates, nonprofits engage in advocacy at all levels of government, with the most activity (27%) occurring at the city/local level. This notion reinforces the findings reported in the following pages of this report, further suggesting that California nonprofit programming and activities are embedded in local communities.
45%
50%
54%
62%
Survey responses when asked: “In the past 12 months, how often did your nonprofit engage in the following activities?”
Frequent AdvocAcy Activities
• Meet with public officials or their staff 79%
• collaborate with other nonprofits to advocate or lobby for a change in law or policy 53%
• Provide public education on policy issues 53%
• Provide testimony to a government body 43%
• Participate in a government commission or committee 43%
Less Frequent AdvocAcy Activities
• take a public stance on a specific piece of legislation or ballot initiative 28%
• register or educate voters 15%
• co-sponsor or endorse a demonstration or boycott 10%
• Host a political or candidate forum 9%
• Hire or contract with a lobbyist 6%
Nonprofits as advocates
Fig
ur
e 3
4
Source: Nonprofit Leadership Perspectives Survey.
52 CausesCount:theeConomiCPowerofCalifornia’snonProfitseCtor—CalnonProfits—2014—www.CalnonProfits.org

80%
60%
40%
20%
0%
Nonprofits lobby through
associations and coalitions
23 The 501(h) election is a one page IRS form nonprofits may submit to indicate the intent to engage in lobbying activities. Completion of this form gives nonprofits clearly outlined legal guidelines for allowable lobbying activities beyond the “insubstantial” amount and activities that is afforded all 501(c)(3) organizations.
4% of California nonprofits report to the IRS that they engage in lobbying activities or take the 501(h) election...
53%…�however,�of�nonprofit�leaders�report�belonging�to�an�association�or�coalition�that�lobbies�on�their�behalf.
One way to measure the extent to which nonprofits are engaged in lobbying is to assess activities that are self-reported on IRS form 990. These data reveal that only four percent of nonprofits in California have either filed the 501(h) election or otherwise engaged in lobbying. furthermore, 50 percent of the nonprofit leaders who participated in this study said they were not familiar with the IRS 501(h) election.23
Some nonprofits hire professional lobbyists. IRS data analyzed for this study showed that 370 California nonprofit organizations collectively paid $27.8 million for lobbying services in 2012. This represents .02% (two percent of one percent) of total expenditures for nonprofit organizations during that year.
Despite the low levels of lobbying reported by individual organizations, 53 percent of nonprofit leaders in this study did report that they belonged to an association or coalition that lobbied on their behalf. Notably, 60 percent of these leaders rated these coalitions as effective.
In addition, nonprofit staff represent an overlooked voting force. for example, of the 111 respondents to the Individual Perspectives Survey who indicated they worked for a nonprofit, 90 percent reported that they are “always voters” or “most of the time voters.”
Causes Count: the eConomiC Power of California’s nonProfit seCtor — CalnonProfits — 2014 — www.CalnonProfits.org 53

California nonprofits are inherently
community-basedReflecting the bottom-up origins of many nonprofits, most California nonprofits identified themselves as local or regional organizations, often using geography to define their constituencies. As figure 36 shows, 82 percent of nonprofit leaders who participated in this study described nonprofit programming as taking place within either the neighborhood, city, or county where the nonprofit was located. Arts and culture organizations (29%) and human service organizations (21%) were the most likely to carry out activities in the city in which the organization is located, while 14 percent of environment and 13 percent of health organizations provided services statewide.
Nonprofit programming is largely local
Fig
ur
e 3
6
Survey responses when asked: “Which of the following best describes where the majority of your programs are carried out?”
Source: Nonprofit Leadership Perspectives Survey.
11%
Neighborhood
10%
State
4%
U.S.A
3%
International
21%
City
50%
County
54 CausesCount:theeConomiCPowerofCalifornia’snonProfitseCtor—CalnonProfits—2014—www.CalnonProfits.org

Nonprofits
express who Californians are and strive to be
Each year, millions of Californians express their personal and community values through their participation in the nonprofit sector. Thus, in aggregate, nonprofits both reflect and stand for our society’s values. The various nonprofit causes and philosophies are as diverse as California itself, and in the creation and turmoil of the nonprofit ecosystem, ideas and causes compete for profile and resources, and ultimately lead to new ways of thinking.
“ Nonprofits exist in our society as an expression of the many cherished non-tangible values that various people hold dear to their hearts.”
This study documents:
believe that nonprofits exist to provide services to the needy and vulnerable.
believe that nonprofits exist to improve quality of life.
believe nonprofits play a major role in making our communities a better place to live.
believe nonprofits exist to express community values and promote social change.
believe nonprofits express the spirit of the community.
As one respondent summed it up: “Nonprofits exist as an expression of a community’s soul.” Each of California’s nonprofits is a place where this expression happens — where donors, volunteers, staff, and clients connect and contribute to make better communities and a better California.
69% of Californians surveyed agreed
nonprofits exist to express community values
74%
64%
85%
80%
70%
Causes Count: the eConomiC Power of California’s nonProfit seCtor — CalnonProfits — 2014 — www.CalnonProfits.org 55

PART 7
Conclusion: Causes Count
from hidden in
plain sight…
to a seat at
the table

ConCluding Commments from Calnonprofits
from hidden in plain sight…This study reveals California nonprofits to be a deep and integral part of what makes California the uniquely vibrant state it is. With 15 percent of the State GDP, a million employees and millions of volunteers, nonprofits not only help drive the California economy, but touch the lives of every Californian every day.
yet the nonprofit sector isn’t often known by that name. It’s known as the fight for clean air, the local hospital, Wikipedia, the legal help center, the university I went to, NPR, the campaign for LGBT rights, the counseling center, my church, the local theatre, my son’s soccer league, and the African American history museum.
Partly because of this embeddedness and bottom-up character, the nonprofit sector enjoys a high degree of public confidence— more so than the for-profit business or government sectors— to provide quality services, to benefit communities, and to mirror
the values held by Californians.
…to a seat at the tableBut while Californians know nonprofits as important and valued community institutions, this report shows the unexpectedly strong economic power of the nonprofit sector and its ability to use that power for the common good. And as this study shows, California nonprofits are not only service and arts providers, they are community organizers and vote mobilizers.
for California to make full use of this nonprofit economic and people power, California’s leaders should work with nonprofits to devise and implement community solutions and programs. Whenever the Chamber of Commerce, for instance, is asked to bring a business perspective to the discussion, the nonprofit sector must be asked as well.
And within the nonprofit sector, we encourage nonprofits to ask how our sector—with its diversity of efforts, unequally distributed resources, and tumultuously different viewpoints—can act more cohesively in its shared interests.
Let the discussions begin. The future of California is at stake.
Causes Count: the eConomiC Power of California’s nonProfit seCtor — CalnonProfits — 2014 — www.CalnonProfits.org 57

PART 8
Appendix
How nonprofits are described and categorized in this report
Arts, culture, and humanities. Includes an array of organizations, such as museums, symphonies, community orchestras, theatres, historical societies, public TV/radio, and other cultural organizations.
Higher education. Includes private nonprofit universities and colleges and related organizations.
Education, other. Encompasses a wide range of educational institutions and groups, including preschools, private secondary schools, libraries, student sororities, alumni associations, teacher and parent groups, and other education-related organizations (excluding higher education).
Environment. Includes botanical gardens, horticultural societies, land conservation, environmental beautification, pollution abatement, as well as animal services, zoos and aquariums, and wildlife sanctuaries.
Hospitals. Includes nonprofit hospitals.
Health, other. Includes community clinics, nursing facilities, rehabilitative care, research institutions and service organizations dedicated to specific diseases, substance abuse facilities, blood banks, and other nonprofit health organizations (excluding hospitals).
Human services. Encompasses social and human service organizations that provide housing, shelter, food, employment, disaster relief, legal services and other assistance to disadvantaged populations, as well as youth centers and clubs, playgrounds, parks, and sports training facilities.
International, foreign affairs. Includes international and foreign affairs organizations, such as overseas relief and development, cultural and professional exchange, international peace and human rights groups, and United Nations associations.
Mutual, public and societal benefit. In this report, three common nonprofit organizational classifications (mutual benefit, public societal benefit, and otherwise uncategorized nonprofits) have been merged to create this category. Organizations include those working with civil rights and community development, advocacy groups, neighborhood associations, business leagues, civic and service clubs, science and technology organizations, credit unions, and public grantmaking foundations.
The 501(c)(3) nonprofits discussed in this report are categorized into distinct organizational types or sub-sectors using the National Taxonomy of Exempt Entities Core Codes (NTEE-CC) developed by the National Center for Charitable Statistics (NCCS) and the Internal Revenue Service (IRS). What follows is a list of the major sub-sectors presented in this report and examples of organizations that are typically found within each sub-sector.
58 CausesCount:theeConomiCPowerofCalifornia’snonProfitseCtor—CalnonProfits—2014—www.CalnonProfits.org

DOWNLOAD THE fULL STUDy (PDf)
calnonprofits.org/causes-count/download
STUDy WEBSITE
calnonprofits.org/causes-count
DOWNLOAD THE TECHNICAL APPENDIX (PDf)
calnonprofits.org/causes-count/methodology
Causes Count is able to report on only a fraction of the data that was analyzed as part of this study. Additional materials available on the CalNonprofits website at www.calnonprofits.org include:
• Snapshots of the nonprofit sector for each of California’s 10 regions
• More detailed explanation of methodology and data sources
• This report downloadable as a PDF
Both the USD and CalNonprofits teams are committed to making presentations and holding discussions on these findings. In addition to USD and CalNonprofits events and webinars, please contact Kristen Wolslegel at [email protected] to have a speaker at your event.
The USD team can also develop custom reports from this uniquely complete data set for your geographic region or other subset. Please contact them at (619) 260-2903.
Finally, all of us at USD and CalNonprofits welcome your questions and comments.
How to learn more

DE
SIG
N: T
RA
VE
RS
OS
AN
TAN
A.C
OM
Annenberg Foundation
David & Lucile Packard Foundation
The James Irvine Foundation
Ralph M. Parsons Foundation
Weingart Foundation
Heartfelt thanks to the funders who made Causes Count possible:
David & Lucile Packard Foundation
Evelyn and Walter Haas, Jr. Fund
The James Irvine Foundation
The California Endowment
The California Wellness Foundation
Weingart Foundation
In addition, this report was made possible thanks to the nearly 10,000 members of the California Association of Nonprofits (CalNonprofits), and the foundations that provide unrestricted core support; together these foundations and our members provide the footing for everything we do:
© Copyright California Association of Nonprofits, 2014. All rights reserved.
Design by TraversoSantana.com
Dr. Laura DeitrickThe Caster Family Center for Nonprofit and Philanthropic ResearchUniversity of San Diego5998 Alcalá ParkSan Diego, CA 92110(619) 260-2903
Kristen Wolslegel, Project ManagerCalifornia Association of Nonprofits400 Montgomery Street, Suite 500San Francisco, CA 94104www.calnonprofits.org/[email protected](800) 776-4226
Contact information
To contact the Principal Investigator and research team:
For printed copies of this report, more information, or to invite a speaker to your area to present its findings, contact: