dowduponts21.q4cdn.com/.../doc_presentations/2017/10/3q17-slides-final.pdf · safe harbor statement...
TRANSCRIPT

DowDuPont3Q17 Earnings Conference Call
November 2, 2017

Safe Harbor StatementRegulation G
This presentation includes information that does not conform to U.S. GAAP and are considered non-GAAP measures. These measures include the Company's pro forma consolidated
results and pro forma earnings per share on an adjusted basis, which excludes the after-tax impact of pro forma significant items and the after-tax impact of pro forma amortization
expense associated with DuPont's intangible assets. Management uses these measures internally for planning, forecasting and evaluating the performance of the Company's
segments, including allocating resources. DowDuPont's management believes that these non-GAAP measures best reflect the ongoing performance of the Company during the periods
presented and provide more relevant and meaningful information to investors as they provide insight with respect to ongoing operating results of the Company and a more useful
comparison of year-over-year results. These non-GAAP measures supplement the Company's U.S. GAAP disclosures and should not be viewed as an alternative to U.S. GAAP
measures of performance. Furthermore, such non-GAAP measures may not be consistent with similar measures provided or used by other companies. Reconciliations of non-GAAP
measures to GAAP are provided in the financial schedules attached to the earnings news release and the Investor Relations section of the Company’s website. DowDuPont does not
provide forward-looking GAAP financial measures or a reconciliation of forward-looking non-GAAP financial measures to the most comparable GAAP financial measures on a forward-
looking basis because the Company is unable to predict with reasonable certainty the ultimate outcome of pending litigation, unusual gains and losses, foreign currency exchange gains
or losses, potential future asset impairments and purchase accounting fair value adjustments, as well as discrete taxable events, without unreasonable effort. These items are
uncertain, depend on various factors, and could have a material impact on GAAP results for the guidance period.
Cautionary Statement about Forward-Looking Statements
This communication contains “forward-looking statements” within the meaning of the federal securities laws, including Section 27A of the Securities Act of 1933, as amended, and
Section 21E of the Securities Exchange Act of 1934, as amended. In this context, forward-looking statements often address expected future business and financial performance and
financial condition, and often contain words such as “expect,” “anticipate,” “intend,” “plan,” “believe,” “seek,” “see,” “will,” “would,” “target,” similar expressions, and variations or negatives
of these words.
On December 11, 2015, The Dow Chemical Company (“Dow”) and E. I. du Pont de Nemours and Company (“DuPont”) announced entry into an Agreement and Plan of Merger, as
amended on March 31, 2017, (the “Merger Agreement”) under which the companies would combine in an all-stock merger of equals transaction (the “Merger Transaction”). Effective
August 31, 2017, the Merger Transaction was completed and each of Dow and DuPont became subsidiaries of DowDuPont Inc. (“DowDuPont”). For more information, please see each
of DowDuPont’s, Dow’s and DuPont’s latest annual, quarterly and current reports on Forms 10-K, 10-Q and 8-K, as the case may be, and the joint proxy statement/prospectus included
in the registration statement on Form S-4 filed by DowDuPont with the SEC on March 1, 2016 (File No. 333-209869), as last amended on June 7, 2016, and declared effective by the
SEC on June 9, 2016 (the “Registration Statement”) in connection with the Merger Transaction.
Forward-looking statements by their nature address matters that are, to different degrees, uncertain, including the intended separation of DowDuPont’s agriculture, materials science
and specialty products businesses in one or more tax efficient transactions on anticipated terms (the “Intended Business Separations”). Forward-looking statements are not guarantees
of future performance and are based on certain assumptions and expectations of future events which may not be realized. Forward-looking statements also involve risks and
uncertainties, many of which are beyond the company’s control. Some of the important factors that could cause DowDuPont’s, Dow’s or DuPont’s actual results to differ materially from
those projected in any such forward-looking statements include, but are not limited to: (i) successful integration of the respective agriculture, materials science and specialty products
businesses of Dow and DuPont, including anticipated tax treatment, unforeseen liabilities, future capital expenditures, revenues, expenses, earnings, productivity actions, economic
performance, indebtedness, financial condition, losses, future prospects, business and management strategies for the management, expansion and growth of the combined operations;
(ii) impact of the divestitures required as a condition to consummation of the Merger Transaction as well as other conditional commitments; (iii) achievement of the anticipated synergies
by DowDuPont’s agriculture, materials science and specialty products businesses; (iv) risks associated with the Intended Business Separations, including those that may result from the
comprehensive portfolio review undertaken by the DowDuPont board, changes and timing, including a number of conditions which could delay, prevent or otherwise adversely affect
the proposed transactions, including possible issues or delays in obtaining required regulatory approvals or clearances related to the Intended Business Separations, disruptions in the
financial markets or other potential barriers; (v) the risk that disruptions from the Intended Business Separations will harm DowDuPont’s business (either directly or as conducted by and
through Dow or DuPont), including current plans and operations; (vi) the ability to retain and hire key personnel; (vii) potential adverse reactions or changes to business relationships
resulting from the completion of the merger or the Intended Business Separations; (viii) uncertainty as to the long-term value of DowDuPont common stock; (ix) continued availability of
capital and financing and rating agency actions; (x) legislative, regulatory and economic developments; (xi) potential business uncertainty, including changes to existing business
relationships, during the pendency of the Intended Business Separations that could affect the company’s financial performance and (xii) unpredictability and severity of catastrophic
events, including, but not limited to, acts of terrorism or outbreak of war or hostilities, as well as management’s response to any of the aforementioned factors.
2©2017 DowDuPont. All rights reserved.

Safe Harbor Statement, continued
Forward-Looking Statements, continued
These risks, as well as other risks associated with the merger and the Intended Business Separations, are more fully discussed in (1) the Registration Statement and (2) the current,
quarterly and annual reports filed with the SEC by DowDuPont and to the extent incorporated by reference into the Registration Statement, by Dow and DuPont. While the list of factors
presented here is, and the list of factors presented in the Registration Statement are, considered representative, no such list should be considered to be a complete statement of all
potential risks and uncertainties. Unlisted factors may present significant additional obstacles to the realization of forward-looking statements. Consequences of material differences in
results as compared with those anticipated in the forward-looking statements could include, among other things, business disruption, operational problems, financial loss, legal liability to
third parties and similar risks, any of which could have a material adverse effect on DowDuPont’s, Dow’s or DuPont’s consolidated financial condition, results of operations, credit rating or
liquidity. None of DowDuPont, Dow or DuPont assumes any obligation to publicly provide revisions or updates to any forward-looking statements whether as a result of new information,
future developments or otherwise, should circumstances change, except as otherwise required by securities and other applicable laws.
The Dow Diamond, DuPont Oval logo, DuPont™ and all products, unless otherwise noted, denoted with ™, ℠or ® are trademarks or registered trademarks of The Dow Chemical
Company, E. I. du Pont de Nemours and Company or their affiliates.
Supplemental unaudited pro forma information for DowDuPont is presented to illustrate the estimated effects of the Merger, assuming that the Merger had been consummated on January
1, 2016. For the third quarter of 2017, activity prior to August 31, 2017 (the “Merger Date”) was prepared on a pro forma basis and activity after the Merger Date was prepared on a
combined U.S. GAAP basis. The unaudited pro forma information was prepared in accordance with Article 11 of Regulation S-X. Pro forma adjustments have been made for (1) the
preliminary purchase accounting impact, (2) accounting policy alignment, (3) eliminate the effect of events that are directly attributable to the Merger Agreement (e.g., one-time transaction
costs), (4) eliminate the impact of transactions between Dow and DuPont, and (5) eliminate the effect of consummated or probable and identifiable divestitures agreed to with certain
regulatory agencies as a condition of approval for the Merger. Events that are not expected to have a continuing impact on the combined results (e.g., inventory step-up costs) are
excluded. The unaudited pro forma information does not reflect restructuring or integration activities or other costs following the Merger that may be incurred to achieve cost or growth
synergies of DowDuPont. The unaudited pro forma financial information provides shareholders with summary financial information and historical data that is on a basis consistent with how
DowDuPont reports current financial information.
3©2017 DowDuPont. All rights reserved.

Highlights
4©2017 DowDuPont. All rights reserved.
• Delivered solid 3Q17 pro forma results– Sales increased 8%
– Volume growth of 4%
– Operating EBITDA up 7%
– Adjusted EPS increased 10%
• Closed the merger on August 31st
• Realigned the portfolio– Shifted >$8B in sales, ~$2.4B in EBITDA to Specialty Products
– Aligned businesses along end-markets to increase competitiveness,
accelerate growth
• Progressed two of the three remedy transactions
Divestiture of Dow’s ethylene acrylic acid copolymer assets (closed Sept. 1)
Sale of certain DuPont crop protection assets to FMC, acquisition of most
of FMC health and nutrition business (Nov. 1)
– Divestiture of select portion of Dow AgroSciences' corn seed business in
Brazil on track to close in 4Q17

Strategic Drivers
5©2017 DowDuPont. All rights reserved.
• Closed transaction on Aug. 31
• New reporting structure
complete
• Pro formas delivered on Oct. 26,
incorporating business
realignments
• Re-mapping stand-and-spin
timing, evaluating multiple
scenarios and risk mitigation
plans
Stand and Spin
• Advancing playbook to deliver
$1B in growth synergies
• Early examples:
• Ag pipeline to deliver 10 new
seed products and 11 new CP
products over next 5 years
• Combination of Dow Pharma &
Food, DuPont Health & Nutrition
and acquired FMC business
creates one of the broadest
offerings to serve industry
• High performance packaging
solutions from integration of
DuPont’s ethylene copolymers
portfolio
Growth Synergies
• Remain committed to total $3B
of cost synergies
• New division targets:
• Agriculture: $1.0B (no change)
• Materials Science: $1.2B
• Specialty Products: $0.8B
• 70% run rate by end of Year 1;
100% run rate by end of Year 2
• Expect $500MM run rate by end
of 4Q17
• Broader cost synergy program
and actions announced today
Cost Synergies

3Q 2017 Financial Highlights
Financial Performance Snapshot 3Q16 3Q17 B/(W)
Pro Forma Net Sales ($MM) 16,991 18,285 +1,294
Pro Forma Operating EBITDA ($MM) 3,022 3,221 +199
Pro Forma Adjusted EPS ($/share) $0.50 $0.55 +$0.05
6©2017 DowDuPont. All rights reserved.
3Q 2017 Pro Forma Adjusted EPS Variance Highlights
• Volume growth from consumer-led demand in key end-markets
• Pricing gains and currency tailwinds more than offset higher feedstock costs
• Higher equity earnings led by Kuwait JVs
• Lower pension/OPEB costs
• Lost production and repair costs from impact of hurricanes
• Challenging Ag market conditions, particularly in Brazil
• Continued start-up spending on USGC growth projects
$0.30
$1.08
3Q
16
Volu
me g
row
th
Marg
in g
row
thfr
om
price
gain
s&
curr
ency
Equity E
arn
ings
Pensi
on/O
PEB
Net
Inte
rest
expense
Sta
rt-u
pexpense
s
Weakness
in A
gm
ark
ets
Hurr
icane
impact
3Q
17
$0.50
$0.55
Agriculture: 3Q 2017 Pro Forma Highlights
Pro Forma 3Q16 3Q17
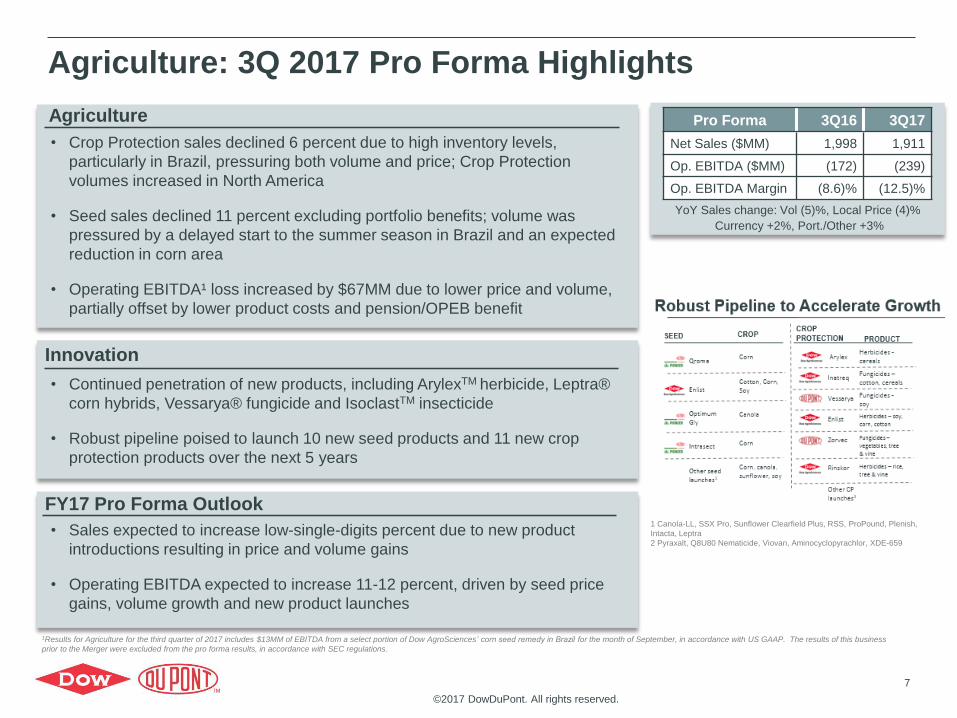
Net Sales ($MM) 1,998 1,911
Op. EBITDA ($MM) (172) (239)
Op. EBITDA Margin (8.6)% (12.5)%
YoY Sales change: Vol (5)%, Local Price (4)%
Currency +2%, Port./Other +3%
Agriculture
Innovation
FY17 Pro Forma Outlook
• Crop Protection sales declined 6 percent due to high inventory levels,
particularly in Brazil, pressuring both volume and price; Crop Protection
volumes increased in North America
• Seed sales declined 11 percent excluding portfolio benefits; volume was
pressured by a delayed start to the summer season in Brazil and an expected
reduction in corn area
• Operating EBITDA¹ loss increased by $67MM due to lower price and volume,
partially offset by lower product costs and pension/OPEB benefit
• Continued penetration of new products, including ArylexTM herbicide, Leptra®
corn hybrids, Vessarya® fungicide and IsoclastTM insecticide
• Robust pipeline poised to launch 10 new seed products and 11 new crop
protection products over the next 5 years
• Sales expected to increase low-single-digits percent due to new product
introductions resulting in price and volume gains
• Operating EBITDA expected to increase 11-12 percent, driven by seed price
gains, volume growth and new product launches
7
©2017 DowDuPont. All rights reserved.
1Results for Agriculture for the third quarter of 2017 includes $13MM of EBITDA from a select portion of Dow AgroSciences’ corn seed remedy in Brazil for the month of September, in accordance with US GAAP. The results of this business
prior to the Merger were excluded from the pro forma results, in accordance with SEC regulations.
1 Canola-LL, SSX Pro, Sunflower Clearfield Plus, RSS, ProPound, Plenish,
Intacta, Leptra
2 Pyraxalt, Q8U80 Nematicide, Viovan, Aminocyclopyrachlor, XDE-659

Materials Science: 3Q 2017 Pro Forma Highlights
Performance Materials & Coatings
Industrial Intermediates & Infrastructure
Packaging & Specialty Plastics
Pro Forma 3Q16 3Q17
Net Sales ($MM) 2,046 2,219
Op. EBITDA ($MM) 345 487
Op. EBITDA Margin 16.9% 21.9%
Pro Forma 3Q16 3Q17
Net Sales ($MM) 2,770 3,226
Op. EBITDA ($MM) 401 676
Op. EBITDA Margin 14.5% 21.0%
Pro Forma 3Q16 3Q17
Net Sales ($MM) 5,070 5,490
Op. EBITDA ($MM) 1,386 1,147
Op. EBITDA Margin 27.3% 20.9%
YoY Sales change: Vol +6%, Local Price +1%
Currency +1%, Port./Other –
YoY Sales change: Vol +1%, Local Price +6%
Currency +1%, Port./Other –
YoY Sales change: Vol +3%, Local Price +12%
Currency +1%, Port./Other –
• Consumer Solutions delivered sales growth in all businesses, led by volume gains in
most geographies and price/volume management in silicone intermediate products
• Coatings & Perf. Monomers achieved higher sales as price increases in all regions
more than offset a modest decline in volume due to actions to shed lower margin
business
• Polyurethanes reported strong demand and price increases in downstream, higher-
margin systems applications and increased MDI sales
• Industrial Solutions delivered sales gains in consumer-driven market segments of
electronics processing and food and pharmaceutical applications
• Consumer-led demand drove sales growth in Asia Pacific and EMEA, enabled by ramp
up in Sadara volumes; Americas volume impacted by hurricane-related disruptions
• Operating EBITDA declined as sales growth was more than offset by higher feedstock
costs, hurricane impact, commissioning & start-up costs on USGC projects; marketing
of additional Sadara volumes slightly impacted unit margins
8©2017 DowDuPont. All rights reserved.

Specialty Products: 3Q 2017 Pro Forma Highlights
Electronics & Imaging Pro Forma 3Q16 3Q17
Net Sales ($MM) 1,138 1,198
Op. EBITDA ($MM) 341 382
Op. EBITDA Margin 30.0% 31.9%
Nutrition & Biosciences
Transportation & Advanced Polymers
Safety & Construction
• Broad-based volume growth across key end-markets, led by double-digit gains
in semiconductor, consumer electronics, industrial, PV and display end-markets
• Operating EBITDA improved on volume growth, mix enrichment and lower
pension/OPEB costs
Pro Forma 3Q16 3Q17
Net Sales ($MM) 1,469 1,473
Op. EBITDA ($MM) 321 315
Op. EBITDA Margin 21.9% 21.4%
Pro Forma 3Q16 3Q17
Net Sales ($MM) 1,187 1,299
Op. EBITDA ($MM) 303 325
Op. EBITDA Margin 25.5% 25.0%
Pro Forma 3Q16 3Q17
Net Sales ($MM) 1,238 1,310
Op. EBITDA ($MM) 282 351
Op. EBITDA Margin 22.8% 26.8%
YoY Sales change: Vol +6%, Local Price –
Currency –, Port./Other –
YoY Sales change: Vol +13%, Local Price (2)%
Currency – , Port./Other (6)%
YoY Sales change: Vol –, Local Price –
Currency +1%, Port./Other (1)%
YoY Sales change: Vol +5%, Local Price +3%
Currency +1%, Port./Other –
• Sales rose 9% on volume and local price gains
• Operating EBITDA increased 7% on volume and pricing gains and lower
pension/OPEB costs, partly offset by higher raw material costs
• Sales increased 6% on volume gains with increases in every region
• Operating EBITDA grew 24% due to volume growth, one-time gains, lower
pension/OPEB costs and better plant performance, despite higher raw
materials
• Sales gains in microbial control solutions, probiotics and biomaterials more than
offset declines in protein solutions, systems and texturants, and a negative
impact from portfolio
• Operating EBITDA declined as sales gains in microbial and probiotics was more
than offset by declines in protein solutions, systems and texturants
9©2017 DowDuPont. All rights reserved.

10
©2017 DowDuPont. All rights reserved.
4Q17 Modeling Guidance4
Q1
7
Corporate Segment Operating EBITDA ($200) – ($230)MMOperational Tax Rate(excl. EGL, DuPont Amort. & Sig. Items)
24-26%
D&A (includes the DuPont Amortization expense
below)
$1,380 – $1,410MM(includes step-up D&A)
DuPont Non-operating pension
/OPEB2 (included in Op. EBITDA)
~$90 – $110MM credit in
4Q17
DuPont Amortization expense(this is added back while calculating Adj. EPS)
~$270MM pre-taxTaxed at ~32%
Net Interest Expense (net of Interest Income, which is reported in
Sundry Income/Expense line)
$300 – $325MM
Net Income attributable to non-controlling
Interests (reduced from net income)~$30MM Share Count ~2,350MM
Segment Outlook 4Q17 vs. 4Q16 Net Sales Op. EBITDA (incl. Equity Earnings)
Agriculture Up ~10% ~$225MM
Performance Materials & Coatings Up high-single-digits percent Up mid-teens percent
Industrial Intermediates & Infrastructure Up high-teens percent Up 10-11%
Packaging & Specialty Plastics Up ~10% Up low-single-digits percent
Electronics & Imaging Down mid-single-digits percent Up low-single-digits percent
Nutrition & Biosciences Up high-single-digits percent Up 10-11%
Transportation & Advanced Polymers Up mid-single-digits percent Up mid-teens percent
Safety & Construction Up mid-single-digits percent Up low-twenties percent
Net Sales: $19.0 - $19.5B >7% vs. 4Q161 Op. EBITDA: 11-13% vs. 4Q161
1 All 4Q16 numbers are on a pro forma basis2 The 4Q17 estimate for non-operating pension/OPEB costs does not include any potential settlements or curtailments that could occur during the remainder of the year
Note: Operating EBITDA estimates exclude approximately $1B related to a restructuring charge, which will be treated as a significant item
Refer to slide 14 in Appendix for additional commentary on segment outlook

Outlook
11©2017 DowDuPont. All rights reserved.
• Robust demand conditions remain in consumer-driven end-markets, such as
packaging, consumer electronics and transportation
• Ag fundamentals remain soft– Full-year DowDuPont Ag results expected to increase YoY on self-help actions and
innovation-led growth
• Packaging fundamentals remain healthy globally– Demand outlook enhanced by improving global GDP growth prospects
– Sustainable urbanization continues to drive demand in the developing world; tighter
environmental regulations could drive further upside
– Recent U.S. supply interruptions highlight tight supply/demand fundamentals
– Measured pace of capacity adds reduces duration and severity of supply/demand imbalance
Market Outlook
• Global economic expansion on continued strength in U.S. and with notable
improvements in Europe– Consumer-driven strength an increasingly common theme globally
• Select headwinds remain, including geopolitical uncertainties and elevated
emerging market debt levels
Macro Outlook

Disciplined Focus on Financial, Strategic and Operational Results
12©2017 DowDuPont. All rights reserved.
Deliver operating and financial plan• Continued focus on volume and earnings growth
• Ongoing productivity and manufacturing excellence
Achieve synergy targets• Finalize detailed plans to achieve cost synergies & mitigate dis-synergies
• Achieve 70% run rate in 12 months and 100% run rate in 24 months
• Advance growth synergies playbook
Stand and spin the intended companies• Complete carve-out activities based on realignments
• Separate each intended company as soon as possible
• Remain committed to our original timeline; assessing options to accelerate
1
2
3


14©2017 DowDuPont. All rights reserved.
4Q17 Segment Expectations
1 4Q16 on a pro forma basis2 Hemlock Semiconductor
Segments Key Sales and Operating EBITDA Outlook Drivers (4Q17 vs. 4Q161)
Packaging & Specialty
Plastics
Sales growth on pricing gains, higher Sadara PE volumes and start-up of U.S. Gulf Coast growth projects. Op. EBITDA up
modestly as higher prices and ramp-up of the new TX-9 and ELITE™ units through the quarter are mostly offset by higher
feedstock costs, start-up costs (~$50MM in 4Q17), spending and volume impact of higher turnaround activity as well as a
residual hurricane impact into 4Q17 (~$40MM).
Industrial Intermediates
& Infrastructure
Sales and Op. EBITDA growth on pricing momentum and volume gains supported by tight supply-demand fundamentals.
4Q17 results impacted by lower equity earnings (down ~$40-60MM) driven by major turnaround in Equate JV. Isocyanates
markets remain tight but supply improves as industry recovers from turnarounds and outages. Polyol margins under
pressure from higher feedstock costs.
Perf. Materials &
Coatings
Sales up on pricing gains. Op. EBITDA expected to grow on improved volume/mix and pricing, which more than offset
headwinds from higher raw material costs. 4Q17 HSC2 pre-tax equity earnings expected to be $100-$120MM.
Safety & ConstructionExpect continued demand from oil & gas and broader industrial markets. Raw materials costs projected to be higher year-
on-year. Benefit from expected lower pension/OPEB costs.
Transportation &
Advanced Polymers
Modest price increases announced to mitigate pressure from higher raw material costs. Volumes expected to remain
positive, with industry auto builds expected to be up slightly vs. last year. Tailwind from expected lower pension/OPEB costs.
Nutrition & Biosciences
Sales up on continued growth in microbial control solutions, probiotics, biomaterials and bioactives, partially offset by
continued declines in protein solutions. Op. EBITDA growth on mix enrichment and lower pension/OPEB costs, partially
offset by the absence of a prior year $27MM gain on asset sale. Portfolio benefit in Nov and Dec from acquisition of FMC’s
Health & Nutrition business.
Electronics & Imaging
Sales expected to be down vs. the year-ago period as continued growth in semiconductors, consumer electronics and
displays will be more than offset by the negative impact of portfolio (sale of stake in a non-core JV in 2Q17) and declines in
photovoltaics volumes due to Hurricane Maria-driven supply disruption in Puerto Rico. Op. EBITDA expected to be up on mix
enrichment, productivity gains and lower pension/OPEB costs.
AgricultureAg segment sales growth driven by increased fungicide volumes and the continued penetration of Leptra® corn hybrids.
Benefits from lower pension/OPEB costs and the inclusion of the Brazil corn seed remedy (until the expected close of
transaction in 4Q17) will be partially offset by continued price pressure within the crop protection business.
Refer in conjunction with Slide 10

3Q16 3Q17
-60.0%
-50.0%
-40.0%
-30.0%
-20.0%
-10.0%
0.0%
-250
-200
-150
-100
-50
0
Ma
rgin
$ in
Millio
ns
15
©2017 DowDuPont. All rights reserved.
3Q Pro Forma Operating EBITDA
3Q17 Pro Forma Sales• Ag markets continue to be challenging driven by lower expected corn
planted area, elevated crop protection inventory levels, and weak farm
economics. 3Q operating EBITDA¹ loss increased by $67MM as lower
sales were partially offset by lower product costs and benefits from
currency and portfolio
• FY17 Outlook: Sales expected to increase low-single-digits percent
due to new product introductions resulting in price and volume gains.
Op. EBITDA expected to increase 11-12 percent driven by top line price
gains and volume growth
Crop Protection• 3Q sales down as high industry inventory levels, driven by Brazil, and
competitive markets resulted in volume and price declines
• FY17 Outlook: Driving full year new product volume gains with
Vessarya® fungicide, ArylexTM herbicide, Isoclast® herbicide, and novel
Seed Treatment solutions
Seed• 3Q sales down as portfolio and currency benefits were more than offset
by lower volume and pricing
• Quarterly volume declines driven by a delayed start to the summer
season in Brazil and South Africa and expected lower planted corn area
also in Brazil. Quarterly price declines driven by higher replant in the
U.S. due to wet conditions during planting
• FY17 Outlook: Driving full year volume and seed price gains from
increased penetration of Leptra® corn hybrids, Enlist® cotton, and A-
series® soybeans
Seed Crop Protection
North America Asia Pacific
Europe Latin America
Pro Forma Sales down 4% vs. 3Q16
Vol -5%, Local Price -4%, Currency 2%, Port./Other 3%
-172
-239
Agriculture
1Results for Agriculture for the third quarter of 2017 includes $13MM of EBITDA from a select portion of Dow AgroSciences’ corn seed remedy in Brazil for the month of
September, in accordance with US GAAP. The results of this business prior to the Merger were excluded from the pro forma results, in accordance with SEC regulations.

Performance Materials & Coatings
16©2017 DowDuPont. All rights reserved.
3Q163Q17
0.0%
5.0%
10.0%
15.0%
20.0%
25.0%
0
50
100
150
200
250
300
350
400
450
500
Ma
rgin
$ in
Millio
ns
3Q Pro Forma Operating EBITDA
3Q17 Pro Forma Sales
3,928
Coatings & Performance Monomers
Consumer Solutions
Coatings & Performance Monomers
Consumer Solutions
North America Asia Pacific
EMEA Latin America
Pro Forma Sales 8% vs. 3Q16
Vol 1%, Local Price 6%, Currency 1%
• Higher prices in all geographic areas
• Modest decline in volume related to
hurricane-related lost sales and actions to
shed lower margin business
• Op. EBITDA growth as price gains more than
offset modest volume decline and higher raw
material costs
• Robust sales growth in all businesses led by
volume growth in silicones and price/volume
management in upstream silicone
intermediate products
• Op. EBITDA growth on continued silicones
cost synergy capture, increased pricing and
solid consumer demand
345
487

Ind. Intermediates & Infrastructure
17©2017 DowDuPont. All rights reserved.
3Q16 3Q17
0.0%
5.0%
10.0%
15.0%
20.0%
25.0%
0
100
200
300
400
500
600
700
800
Ma
rgin
$ in
Millio
ns
3Q Pro Forma Operating EBITDA
3Q17 Pro Forma Sales
3,928
Constr. Chem. Energy Sol.
Ind. Sol. PU & CAV
North America Asia Pacific
EMEA Latin America
Pro Forma Sales up 16% vs. 3Q16
Vol 3%, Local Price 12%, Currency 1%
Construction Chemicals
• Demand growth in acrylics-based and methyl cellulosics products
• Modest decline in pro forma op. EBITDA due to raw materials
cost increases that were partially offset by volume and price
increases
Polyurethanes & CAV
• Robust demand for PU systems; tight MDI and caustic
fundamentals continued
• Op. EBITDA rose on price gains and broad-based volume growth
Energy Solutions
• Sales declined due to decreased project activity in oil & gas
• Pro forma op. EBITDA improved due to scale down of solar
operations that was partially offset by decreased project activity
in oil & gas
Industrial Solutions
• Strong sales gains led by glycol ethers, ethylene glycol and
oxo alcohols in consumer-led market segments of electronics
processing, crop defense and food & pharma
• Pro forma op. EBITDA improved on pricing momentum,
higher equity earnings and volume growth
401
676

Sales• Higher sales driven by volume growth and price gains
• Volume grew 6 percent on consumer-led demand across
packaging, health & hygiene and footwear applications
• Double-digit volume gains in health & hygiene end-markets
in the Americas and strong demand in food and specialty
packaging applications, particularly in Asia Pacific
• Hurricane-related disruptions impacted polyethylene,
ethylene co-polymers and wire and cable production
• Pro forma op. EBITDA of $1.1B reflects pricing gains and
higher equity earnings, more than offset by increased
feedstock costs, hurricane-related repair costs and lost
production, and USGC commissioning and startup costs
Other Highlights
• New world-scale ethylene unit and ELITE™ enhanced PE
units both came online on U.S. Gulf Coast; will continue to
ramp to full rates in 4Q
• New LDPE capacity reached mechanical completion; on
track for startup in 1Q18
Packaging & Specialty Plastics
18©2017 DowDuPont. All rights reserved.
3Q163Q17
10.0%
20.0%
30.0%
40.0%
800850900950
1,0001,0501,1001,1501,2001,2501,3001,3501,400
Ma
rgin
$ in
Millio
ns
3Q Pro Forma Operating EBITDA
3Q17 Pro Forma Sales
3,928
Hydrocarbons & Energy
Packaging & Spec Plastics
EBITDA
North America Latin America
EMEA Asia Pacific
Pro Forma Sales up 8% vs. 3Q16
Vol +6%, Local Price +1%, Currency +1%, Port./Other –
1,386
1,147

Electronics & Imaging
19©2017 DowDuPont. All rights reserved.
3Q16 3Q17
10.0%
20.0%
30.0%
40.0%
300
310
320
330
340
350
360
370
380
390
Ma
rgin
$ in
Millio
ns
3Q Pro Forma Operating EBITDA
3Q17 Pro Forma Sales
Sales
• 13 percent volume growth across key end-markets and
almost all geographic areas, primarily Asia Pacific
• Double-digit gains in semiconductor, consumer electronics,
industrial, photovoltaics and display end-markets
• Growth in semiconductor as strong demand for memory and
logic segments drove component manufacturing across
mobile devices, automotive and consumer electronics
• Local price declined 2 percent on pressure in Solamet® paste
and advanced printing applications
• 6 percent negative impact from portfolio changes (Display
Films and Authentication)
Operating EBITDA
• Op. EBITDA increased 12 percent on broad-based volume
growth, mix enrichment and lower pension/OPEB costs
more than offset lower local price and a negative impact
from portfolio
• Op. EBITDA margins expanded by about 190 basis points
North America Asia Pacific
Europe Latin America
Pro Forma Sales 5% vs. 3Q16
Vol 13%, Local Price (2)%, Currency – , Port./Other (6)%
341
382

Nutrition & Biosciences
20©2017 DowDuPont. All rights reserved.
3Q16 3Q17
10.0%
20.0%
30.0%
40.0%
250
260
270
280
290
300
310
320
330
340
350
Ma
rgin
$ in
Millio
ns
3Q Pro Forma Operating EBITDA
3Q17 Pro Forma Sales
Pro Forma Sales – vs. 3Q16
Vol – , Local Price – , Currency 1%, Port./Other (1)%
Nutrition & Health
Industrial Biosciences
North America Asia Pacific
Europe Latin America
321 315
Industrial Biosciences• Pro forma net sales grew on improved demand for microbials,
bioactives and biomaterials
• Microbial demand improved across all geographies, primarily in
North America on growth in energy markets
• Biomaterials growth led by local price gains and demand for
Sorona® in apparel, primarily in Asia Pacific
Operating EBITDA• Op. EBITDA declined 2 percent as double-digit sales gains
in probiotics, microbial control and biomaterials was more
than offset by declines in protein solutions, systems and
texturants
Nutrition & Health• Pro forma net sales declined as continued strength in probiotics
was more than offset by declines in protein solutions and systems
& texturants and a negative impact from portfolio (sale of
Diagnostics)
• Double-digit volume growth in probiotics, led by China
• Soft market conditions in global packaged foods, customer
destocking in the U.S. and business-specific actions to exit low
margin markets continue to impact protein solutions and systems &
texturants

Transportation & Adv. Polymers
21©2017 DowDuPont. All rights reserved.
3Q16 3Q1710.0%
20.0%
30.0%
40.0%
200
250
300
350
400
Ma
rgin
$ in
Millio
ns
3Q Pro Forma Operating EBITDA
3Q17 Pro Forma Sales
3,9283,928
Sales
• Pro forma sales increased 9 percent to $1.3
billion due to volume and local price gains
• Strong demand from the automotive market,
particularly in Asia Pacific, Latin America and
EMEA; growth outpaced auto industry overall,
led by polymers and parts, including Kalrez®
and Vespel® as well as structural adhesives
and MolyKote® lubricants
• Price gains in nearly all regions
• Pro forma op. EBITDA increased 7 percent to
$325 million on volume and pricing gains and
lower pension/OPEB costs, partly offset by
higher raw material costs
Operating EBITDA
North America Asia Pacific
Europe Latin America
Pro Forma Sales 9% vs. 3Q16
Vol 5%, Local Price 3%, Currency 1%, Port./Other –
303 325

Safety & Construction
22©2017 DowDuPont. All rights reserved.
3Q Pro Forma Operating EBITDA
3Q17 Pro Forma Sales
3,9283,928
Sales
• Pro forma sales of $1.3 billion increased 6 percent
due to volume gains of 6 percent with increases in
every region
• Oil & gas markets drove a double-digit gain in
Nomex® thermal garments and mid-single-digit gain
in Kevlar ® high-strength materials
• Tyvek ® protective material up mid-single digits due
to demand in graphics and building envelopes
• Double-digit growth in filtration from gains in
industrial markets in reverse osmosis and
ultrafiltration membranes and recent capacity
increases
Operating EBITDA
• Pro forma operating EBITDA of $351 million grew
24 percent due to volume growth, one-time gains of
$30 million, lower pension/OPEB costs and
improved plant performance, partly offset by higher
raw material costs
North America Asia Pacific
Europe Latin America
Sales 6% vs. 3Q16
Vol 6%, Local Price – , Currency – , Port./Other –
3Q16 3Q17
10.0%
20.0%
30.0%
40.0%
200
250
300
350
400
Ma
rgin
$ in
Millio
ns
282
351