dow reports fourth quarter 2019 results
TRANSCRIPT

1. Op. EPS, Op. EBIT, Op. EBIT Margin and Op. EBITDA are non-GAAP measures. See page 13 for further discussion.2. Free cash flow is defined as cash flows from operating activities - continuing operations, excluding the impact of ASU 2016-15, less capital expenditures.3. Financial information for the three months ended December 31, 2018 was prepared on a pro forma basis and determined in accordance with
Article 11 of Regulation S-X.®TM Trademark of The Dow Chemical Company (“Dow”) or an affiliated company of Dow
Dow reports fourth quarter 2019 results FINANCIAL HIGHLIGHTS • GAAP loss per share from continuing operations was $3.14; Operating EPS¹ was $0.78. Operating EPS
excludes significant items in the quarter, totaling $3.92 per share, primarily related to: the impairment of theremaining Coatings & Performance Monomers acquisition-related goodwill and charges related to Sadara;integration and separation costs; and a tax gain associated with Swiss tax reform.
• Net sales were $10.2 billion, down 15% versus pro forma results in the year-ago period, primarily driven bylower local prices in all operating segments due to a decline in global energy prices.
• Volume declined 2% versus pro forma results in the year-ago period, primarily due to lower hydrocarbonco-product sales as a result of planned turnaround activity. Excluding the Hydrocarbons & Energy business,volume rose 2%, driven by demand growth in packaging and construction chemicals applications.
• Local price declined 12% versus pro forma results in the year-ago period. The largest declines were inPackaging & Specialty Plastics, driven by decreases in polyethylene and hydrocarbon co-products, and inIndustrial Intermediates & Infrastructure, primarily due to polyurethane intermediates. Currency decreasedsales by 1%.
• Equity losses were $21 million versus pro forma equity earnings of $26 million in the year-ago period. Thereduction was primarily due to lower results at the Kuwait joint ventures, driven by margin compression inmonoethylene glycol (MEG) and polyethylene.
• GAAP loss from continuing operations, net of tax, was $2.3 billion. Operating EBIT1 was $1.0 billion, downfrom pro forma results of $1.3 billion in the year-ago period, reflecting margin compression in Packaging &Specialty Plastics and Industrial Intermediates & Infrastructure. These factors were partly offset by marginexpansion in Performance Materials & Coatings, savings from stranded cost removal, and the contributionfrom new polyethylene capacity on the U.S. Gulf Coast.
• Stranded cost removal in the quarter was more than $35 million, raising the full-year, cumulative strandedcost savings to more than $160 million.
• Cash provided by operating activities – continuing operations was $1.9 billion, up $531 million versus theyear-ago period. Capital expenditures in the quarter were $577 million and free cash flow2 was $1.3 billion.
• Returns to shareholders totaled $611 million in the quarter, including $517 million in dividends and $94 millionin share repurchases. The Company achieved its full-year share repurchase target of $500 million.
SUMMARY FINANCIAL RESULTS Three Months Ended December 31 Three Months Ended September 30
In millions, except per share amounts
4Q19 As Reported
4Q183 Pro Forma
vs. SQLY [B / (W)]
3Q19 As Reported
vs. PQ [B / (W)]
Net Sales $10,204 $12,008 $(1,804) $10,764 $(560) GAAP Income (Loss) from Continuing Ops, Net of Tax $(2,310) $531 $(2,841) $347 $(2,657)
Operating EBIT¹ $1,033 $1,289 $(256) $1,117 $(84) Operating EBIT Margin¹ 10.1% 10.7% (60) bps 10.4% (30) bpsOperating EBITDA¹ $1,746 $2,015 $(269) $1,856 $(110) GAAP EPS $(3.14) $0.68 $(3.82) $0.45 $(3.59) Operating EPS¹ $0.78 $1.07 $(0.29) $0.91 $(0.13) Cash Provided by Operating Activities – Continuing Ops $1,920 $1,389 $531 $1,790 $130
1
January 29, 2020

Dow reports fourth quarter 2019 results
®TM Trademark of The Dow Chemical Company (“Dow”) or an affiliated company of Dow
CEO QUOTE
Jim Fitterling, chief executive officer, commented on the quarter: “We experienced similar economic headwinds in the quarter as we have seen all year – especially in the industrial sector – which included price and margin compression, in part driven by additional industry supply and uncertain macros. Yet once again, the Dow team navigated these factors by leveraging our core strengths – feedstock flexibility, a lean cost structure, and leading positions in consumer-driven end-markets. Together, these enabled us to capture demand growth, excluding our Hydrocarbons & Energy business, while also delivering another year-over-year improvement in cash from operations.
“We also deployed capital to strengthen our financial flexibility and to reward our owners, reducing debt by more than $1 billion and returning more than $600 million to shareholders. We enter 2020 in a stronger competitive and financial position, poised to continue to deliver value for our customers and shareholders.”
SEGMENT HIGHLIGHTS
Packaging & Specialty Plastics Three Months Ended December 31 Three Months Ended September 30
In millions, except margin percentages
4Q19 As Reported
4Q18 Pro Forma
vs. SQLY [B / (W)]
3Q19 As Reported
vs. PQ [B / (W)]
Net Sales $4,840 $5,898 $(1,058) $5,062 $(222) Operating EBIT $648 $839 $(191) $798 $(150) Operating EBIT Margin 13.4% 14.2% (80) bps 15.8% (240) bpsEquity Earnings $27 $37 $(10) $23 $4
Packaging & Specialty Plastics net sales were $4.8 billion, down 18% versus pro forma results in the year-ago period. Volume declined 3%, driven primarily by lower hydrocarbon co-product sales that resulted from planned turnaround activity in Europe. Local price declined 14%, and currency decreased net sales by 1%.
Packaging and Specialty Plastics reported a net sales decline, driven by reduced polyethylene product prices. Volume grew 4% with increases in all geographic regions except Latin America, which was flat. The business reported a double-digit demand gain in Asia Pacific. The strongest end-market growth was reported in flexible food and specialty packaging, industrial and consumer packaging, and health and hygiene applications.
Hydrocarbons & Energy reported a decline in net sales with decreases in volume, price and currency. The volume decline was primarily due to planned turnaround activity in Europe, which led to reduced hydrocarbon co-product production and sales.
Equity earnings for the segment were $27 million, down from pro forma equity earnings of $37 million in the year-ago period. The decline was driven by lower earnings from the Kuwait and Thai joint ventures.
Operating EBIT was $648 million, down from pro forma results of $839 million in the year-ago period. Lower polyethylene margins and reduced equity earnings more than offset stranded cost savings and volume gains in the Packaging and Specialty Plastics business.
2

Dow reports fourth quarter 2019 results
®TM Trademark of The Dow Chemical Company (“Dow”) or an affiliated company of Dow
Industrial Intermediates & Infrastructure Three Months Ended December 31 Three Months Ended September 30
In millions, except margin percentages
4Q19 As Reported
4Q18 Pro Forma
vs. SQLY [B / (W)]
3Q19 As Reported
vs. PQ [B / (W)]
Net Sales $3,253 $3,777 $(524) $3,365 $(112) Operating EBIT $221 $339 $(118) $193 $28 Operating EBIT Margin 6.8% 9.0% (220) bps 5.7% 110 bps Equity Losses $(45) $(15) $(30) $(70) $25
Industrial Intermediates & Infrastructure net sales were $3.3 billion, down 14% versus pro forma results in the year-ago period. Volume was flat, local price declined 13%, and currency decreased net sales by 1%.
Polyurethanes & Construction Chemicals reported a net sales decline as modest volume growth was more than offset by local price declines which included lower prices for polyurethane intermediates. The business reported volume growth in all geographic regions except the U.S. & Canada.
Industrial Solutions reported lower net sales, primarily driven by price declines in performance intermediates, including ethyleneamines and glycol ethers. The business reported a modest decline in volume, primarily in ethylene glycols, which more than offset growth in heat transfer fluids and pharmaceutical applications.
Equity losses for the segment were $45 million, down from pro forma equity losses of $15 million in the year-ago period, primarily due to margin compression in MEG at the Kuwait joint ventures.
Operating EBIT was $221 million, down from pro forma results of $339 million in the year-ago period, primarily due to margin compression in both businesses and lower equity earnings, partially offset by lower planned maintenance turnaround costs.
Performance Materials & Coatings Three Months Ended December 31 Three Months Ended September 30
In millions, except margin percentages
4Q19 As Reported
4Q18 Pro Forma
vs. SQLY [B / (W)]
3Q19 As Reported
vs. PQ [B / (W)]
Net Sales $2,035 $2,269 $(234) $2,250 $(215) Operating EBIT $233 $201 $32 $200 $33 Operating EBIT Margin 11.4% 8.9% 250 bps 8.9% 250 bps Equity Earnings $2 $ - $2 $2 $ -
Performance Materials & Coatings net sales were $2.0 billion, down 10% versus pro forma results in the year-ago period. Volume declined 1%, local price fell 8%, and currency decreased net sales by 1%.
Consumer Solutions reported a decrease in net sales on local price declines in all geographic regions, primarily driven by lower siloxanes prices. Demand contraction, particularly in automotive and consumer electronics end-markets, was partly offset by improved demand for siloxanes in Asia Pacific and the U.S. & Canada as well as volume growth globally in differentiated infrastructure applications.
Coatings & Performance Monomers reported lower net sales on declines in both local price and volume. Coatings volume declined, primarily driven by lower demand in the U.S. & Canada and Europe for architectural binders. Volume grew modestly in functional coatings, including liquid-applied sound damping and wood coatings. Performance Monomers reported volume declines in all geographic regions except Latin America, which was up modestly.
Operating EBIT was $233 million, up from pro forma results of $201 million in the year-ago period, partly due to lower costs in Coatings & Performance Monomers, which was impacted by an extended maintenance turnaround in the same quarter last year, as well as reduced propylene feedstock costs.
3

Dow reports fourth quarter 2019 results
®TM Trademark of The Dow Chemical Company (“Dow”) or an affiliated company of Dow
OUTLOOK “Building on the consistent execution of our operational playbook in 2019, we are well-positioned to navigate the market dynamics that have carried into 2020 by focusing on the actions in our control,” said Fitterling. “We will continue to advance our pipeline of higher-return, lower-risk investments, particularly in sectors closer to the consumer where demand conditions remain favorable. By taking advantage of our unique feedstock capabilities, we will maintain our competitive cost positions. We expect to further reduce our cost structure over the course of the year as we complete the stranded cost removal. And, we plan to direct our free cash flow toward a balance of debt reduction and returns to shareholders. Taken together, these actions will give us the ability to continue to advance our strategic and financial priorities, outperform the competition and drive value for all our stakeholders.”
Conference Call Dow will host a live webcast of its fourth quarter earnings conference call with investors to discuss its results, business outlook and other matters today at 8:00 a.m. ET. The webcast and slide presentation that accompany the conference call will be posted on the events and presentations page of investors.dow.com.
About Dow Dow (NYSE: DOW) combines global breadth, asset integration and scale, focused innovation and leading business positions to achieve profitable growth. The Company’s ambition is to become the most innovative, customer centric, inclusive and sustainable materials science company. Dow’s portfolio of plastics, industrial intermediates, coatings and silicones businesses delivers a broad range of differentiated science-based products and solutions for its customers in high-growth market segments, such as packaging, infrastructure and consumer care. Dow operates 109 manufacturing sites in 31 countries and employs approximately 36,500 people. Dow delivered sales of approximately $43 billion in 2019. References to Dow or the Company mean Dow Inc. and its subsidiaries. For more information, please visit www.dow.com or follow @DowNewsroom on Twitter.
###
For further information, please contact:
Investors: Neal Sheorey [email protected] +1 989-636-6347
Media: Kyle Bandlow [email protected] +1 989-638-2417
Cautionary Statement about Forward-Looking Statements
This press release contains “forward-looking statements” within the meaning of the federal securities laws, including Section 27A of the Securities Act of 1933, as amended, and Section 21E of the Securities Exchange Act of 1934, as amended. In this context, forward-looking statements often address expected future business and financial performance, financial condition, and other matters, and often contain words such as “anticipate,” “believe,” “estimate,” “expect,” “intend,” “may,” “opportunity,” “outlook,” “plan,” “project,” “seek,” “should,” “strategy,” “target,” “will,” “will be,” “will continue,” “will likely result,” “would” and similar expressions, and variations or negatives of these words. Forward-looking statements are based on current expectations and assumptions that are subject to risks and uncertainties which may cause actual results to differ materially from the forward-looking statements.
Forward-looking statements include, but are not limited to, expectations as to future sales of Dow’s products; the ability to protect Dow’s intellectual property in the United States and abroad; estimates regarding Dow’s capital requirements and need for and availability of financing; estimates of Dow’s expenses, future revenues and profitability; estimates of the size of the markets for Dow’s products and services and Dow’s ability to compete in such markets; expectations related to the rate and degree of market acceptance of Dow’s products; the outcome of certain Dow contingencies, such as litigation and environmental matters; estimates of the success of competing technologies that may become available and expectations regarding the benefits and costs associated with each of the foregoing.
4

Dow reports fourth quarter 2019 results
®TM Trademark of The Dow Chemical Company (“Dow”) or an affiliated company of Dow
Forward-looking statements by their nature address matters that are, to different degrees, uncertain. Forward-looking statements are based on certain assumptions and expectations of future events which may not be realized and speak only as of the date the statements were made. In addition, forward-looking statements also involve risks, uncertainties and other factors that are beyond Dow’s control that could cause Dow’s actual results to differ materially from those projected, anticipated or implied in the forward-looking statements. These factors include, but are not limited to: fluctuations in energy and raw material prices; failure to develop and market new products and optimally manage product life cycles; significant litigation and environmental matters; failure to appropriately manage process safety and product stewardship issues; changes in laws and regulations or political conditions; global economic and capital markets conditions, such as inflation, market uncertainty, interest and currency exchange rates, and equity and commodity prices; business or supply disruptions; security threats, such as acts of sabotage, terrorism or war; weather events and natural disasters; ability to protect, defend and enforce Dow’s intellectual property rights; increased competition; changes in relationships with Dow’s significant customers and suppliers; unanticipated expenses such as litigation or legal settlement expenses; unanticipated business disruptions; Dow’s ability to predict, identify and interpret changes in consumer preferences and demand; Dow’s ability to complete proposed divestitures or acquisitions; Dow’s ability to realize the expected benefits of acquisitions if they are completed; the availability of financing to Dow in the future and the terms and conditions of such financing; and disruptions in Dow’s information technology networks and systems. Additionally, there may be other risks and uncertainties that Dow is unable to identify at this time or that Dow does not currently expect to have a material impact on its business.
Risks related to achieving the anticipated benefits of our separation from DowDuPont Inc. include, but are not limited to, a number of conditions including risks outside the control of Dow including risks related to (i) Dow’s inability to achieve some or all of the benefits that it expects to receive from the separation from DowDuPont, (ii) certain tax risks associated with the separation, (iii) Dow’s inability to make necessary changes to operate as a stand-alone company, (iv) the failure of Dow’s pro forma financial information to be a reliable indicator of Dow’s future results, (v) Dow’s inability to enjoy the same benefits of diversity, leverage and market reputation that it enjoyed as a combined company, (vi) Dow’s inability to receive third-party consents required under the separation agreement, (vii) Dow’s customers, suppliers and others' perception of Dow’s financial stability on a stand-alone basis, (viii) non-compete restrictions under the separation agreement, (ix) receipt of less favorable terms in the commercial agreements we entered into with E. I. du Pont de Nemours and Company n/k/a/ DuPont de Nemours, Inc.(“DuPont”) and Corteva, Inc. (“Corteva”), including restrictions under intellectual property cross-license agreements, than Dow would have received from an unaffiliated third party; and (x) Dow’s obligation to indemnify DuPont and/or Corteva for certain liabilities.
Where, in any forward-looking statement, an expectation or belief as to future results or events is expressed, such expectation or belief is based on the current plans and expectations of management and expressed in good faith and believed to have a reasonable basis, but there can be no assurance that the expectation or belief will result or be achieved or accomplished. For a more detailed discussion of Dow’s risks and uncertainties, see the section titled “Risk Factors” contained in Dow Inc. and TDCC’s combined Quarterly Report on Form 10-Q for the quarterly period ended October 25, 2019, in the Current Report on Form 8-K of Dow Inc. and TDCC, filed with the SEC on July 25, 2019, recasting portions of the TDCC 10-K for the fiscal year ended December 31, 2018, and in Part I, Item 1A of the Annual Report on Form 10-K of TDCC for the fiscal year ended December 31, 2018. Dow Inc. and TDCC assume no obligation to update or revise publicly any forward-looking statements whether because of new information, future events or otherwise, except as required by securities and other applicable laws.
5

Separation from DowDuPontOn April 1, 2019, DowDuPont Inc. ("DowDuPont" and effective June 3, 2019, n/k/a DuPont de Nemours, Inc. or "DuPont") completed the separation of its materials science business and Dow Inc. became the direct parent company of The Dow Chemical Company and its consolidated subsidiaries ("TDCC" and together with Dow Inc., "Dow" or the "Company"), owning all of the outstanding common shares of TDCC. For filings related to the period commencing April 1, 2019 and thereafter, TDCC was deemed the predecessor to Dow Inc., and the historical results of TDCC are deemed the historical results of Dow Inc. for periods prior to and including March 31, 2019. The information in this report reflects the results of Dow and its consolidated subsidiaries, after giving effect to the distribution to DowDuPont of TDCC’s agricultural sciences business (“AgCo”) and specialty products business (“SpecCo”) and the receipt of E. I. du Pont de Nemours and Company and its consolidated subsidiaries' (“Historical DuPont”) ethylene and ethylene copolymers business (other than its ethylene acrylic elastomers business) ("ECP").
The separation was contemplated by the merger of equals transaction effective August 31, 2017, under the Agreement and Plan of Merger, dated as of December 11, 2015, as amended on March 31, 2017. TDCC and Historical DuPont each merged with subsidiaries of DowDuPont and, as a result, TDCC and Historical DuPont became subsidiaries of DowDuPont (the “Merger”). Subsequent to the Merger, TDCC and Historical DuPont engaged in a series of internal reorganization and realignment steps to realign their businesses into three subgroups: agriculture, materials science and specialty products. Dow Inc. was formed as a wholly owned subsidiary of DowDuPont to serve as the holding company for the materials science business.
Unaudited Pro Forma Financial InformationIn order to provide the most meaningful comparison of results of operations and results by segment, supplemental unaudited pro forma financial information has been included in the following financial schedules. The unaudited pro forma financial information is based on the consolidated financial statements of TDCC, adjusted to give effect to the separation from DowDuPont as if it had been consummated on January 1, 2017. For the twelve months ended December 31, 2019 and the three and twelve months ended December 31, 2018, pro forma adjustments have been made for (1) the margin impact of various manufacturing, supply and service related agreements entered into with DuPont and Corteva in connection with the separation which provide for different pricing than the historical intercompany and intracompany pricing practices of TDCC and Historical DuPont, (2) the removal of the amortization of ECP's inventory step-up recognized in connection with the Merger, and (3) the elimination of the impact of events directly attributable to the Merger, internal reorganization and business realignment, separation, distribution and other related transactions (e.g., one-time transaction costs). The results for the three months ended December 31, 2019, are presented under accounting principles generally accepted in the United States of America ("U.S. GAAP").
The unaudited pro forma financial information has been presented for informational purposes only and is not necessarily indicative of what Dow's results of operations actually would have been had the separation from DowDuPont been completed as of January 1, 2017, nor is it indicative of the future operating results of Dow. The unaudited pro forma information does not reflect restructuring or integration activities or other costs following the separation from DowDuPont that may be incurred to achieve cost or growth synergies of Dow. For further information on the unaudited pro forma financial information, please refer to the Company's Current Report on Form 8-K dated June 3, 2019.
Non-GAAP Financial MeasuresThis earnings release includes information that does not conform to U.S. GAAP and are considered non-GAAP measures. These measures include the Company's pro forma consolidated results and pro forma earnings per share on an adjusted basis. Management uses these measures internally for planning, forecasting and evaluating the performance of the Company's segments, including allocating resources. Dow's management believes that these non-GAAP measures best reflect the ongoing performance of the Company during the periods presented and provide more relevant and meaningful information to investors as they provide insight with respect to ongoing operating results of the Company and a more useful comparison of year-over-year results. These non-GAAP measures supplement the Company's U.S. GAAP disclosures and should not be viewed as alternatives to U.S. GAAP measures of performance. Furthermore, such non-GAAP measures may not be consistent with similar measures provided or used by other companies. Non-GAAP measures included in this release are defined below. Reconciliations for these non-GAAP measures to U.S. GAAP are provided in the Selected Financial Information and Non-GAAP Measures section starting on page 13. Dow does not provide forward-looking U.S. GAAP financial measures or a reconciliation of forward-looking non-GAAP financial measures to the most comparable U.S. GAAP financial measures on a forward-looking basis because the Company is unable to predict with reasonable certainty the ultimate outcome of pending litigation, unusual gains and losses, foreign currency exchange gains or losses and potential future asset impairments, as well as discrete taxable events, without unreasonable effort. These items are uncertain, depend on various factors, and could have a material impact on U.S. GAAP results for the guidance period.
Operating earnings per share is defined as "Earnings (loss) per common share from continuing operations - diluted" excluding the after-tax impact of significant items. Pro forma operating earnings per share is defined as "Pro Forma earnings (loss) per common share from continuing operations - diluted" excluding the after-tax impact of significant items.
6

Operating EBIT is defined as earnings (i.e., "Income (loss) from continuing operations before income taxes") before interest, excluding the impact of significant items. Pro forma operating EBIT is defined as pro forma earnings (i.e., "Pro Forma income (loss) from continuing operations before income taxes") before interest, excluding the impact of significant items.
Operating EBIT margin is defined as Operating EBIT as a percentage of net sales. Pro forma Operating EBIT margin is defined as pro forma Operating EBIT as a percentage of pro forma net sales.
Operating EBITDA is defined as earnings (i.e., "Income (loss) from continuing operations before income taxes") before interest, depreciation and amortization, excluding the impact of significant items. Pro forma operating EBITDA is defined as pro forma earnings (i.e., "Pro Forma income (loss) from continuing operations before income taxes") before interest, depreciation and amortization, excluding the impact of significant items.
Cash flows from operating activities - continuing operations, excluding the impact of Accounting Standards Update 2016-15, "Statement of Cash Flows (Topic 230): Classification of Certain Cash Receipts and Cash Payments" ("ASU 2016-15"), is defined as cash provided by (used in) operating activities - continuing operations, excluding the impact of ASU 2016-15 and related interpretive guidance. Management believes this non-GAAP financial measure is relevant and meaningful as it presents cash flows from operating activities inclusive of all trade accounts receivable collection activity, which Dow utilizes in support of its operating activities.
Free cash flow is defined as "Cash Flow from Operating Activities - Continuing Operations," excluding the impact of ASU 2016-15, less capital expenditures. Under this definition, free cash flow represents the cash generated by the Company from operations after investing in its asset base. Free cash flow, combined with cash balances and other sources of liquidity, represent the cash available to fund obligations and provide returns to shareholders. Free cash flow is an integral financial measure used in the Company's financial planning process.
7

Dow Inc. and SubsidiariesConsolidated Statements of Income
In millions, except per share amounts (Unaudited)
Three Months Ended Twelve Months EndedDec 31,
2019Dec 31,
2018Dec 31,
2019Dec 31,
2018Net sales $ 10,204 $ 11,944 $ 42,951 $ 49,604
Cost of sales 8,718 10,098 36,657 41,074Research and development expenses 173 178 765 800Selling, general and administrative expenses 332 406 1,590 1,782Amortization of intangibles 99 116 419 469Restructuring, goodwill impairment and asset related charges - net 2,851 46 3,219 221Integration and separation costs 99 380 1,063 1,179Equity in earnings (losses) of nonconsolidated affiliates (21) 26 (94) 555Sundry income (expense) - net 92 59 461 96Interest income 23 22 81 82Interest expense and amortization of debt discount 222 282 933 1,063
Income (loss) from continuing operations before income taxes (2,196) 545 (1,247) 3,749Provision for income taxes on continuing operations 114 54 470 809
Income (loss) from continuing operations, net of tax (2,310) 491 (1,717) 2,940Income from discontinued operations, net of tax — 432 445 1,835
Net income (loss) (2,310) 923 (1,272) 4,775Net income attributable to noncontrolling interests 13 32 87 134
Net income (loss) available for Dow Inc. common stockholders $ (2,323) $ 891 $ (1,359) $ 4,641— — — —
Per common share data:Earnings (loss) per common share from continuing operations - basic $ (3.14) $ 0.63 $ (2.42) $ 3.80Earnings per common share from discontinued operations - basic — 0.56 0.58 2.41Earnings (loss) per common share - basic $ (3.14) $ 1.19 $ (1.84) $ 6.21Earnings (loss) per common share from continuing operations - diluted $ (3.14) $ 0.63 $ (2.42) $ 3.80Earnings per common share from discontinued operations - diluted — 0.56 0.58 2.41Earnings (loss) per common share - diluted $ (3.14) $ 1.19 $ (1.84) $ 6.21
Weighted-average common shares outstanding - basic 740.2 747.2 742.5 747.2Weighted-average common shares outstanding - diluted 740.2 747.2 742.5 747.2
8
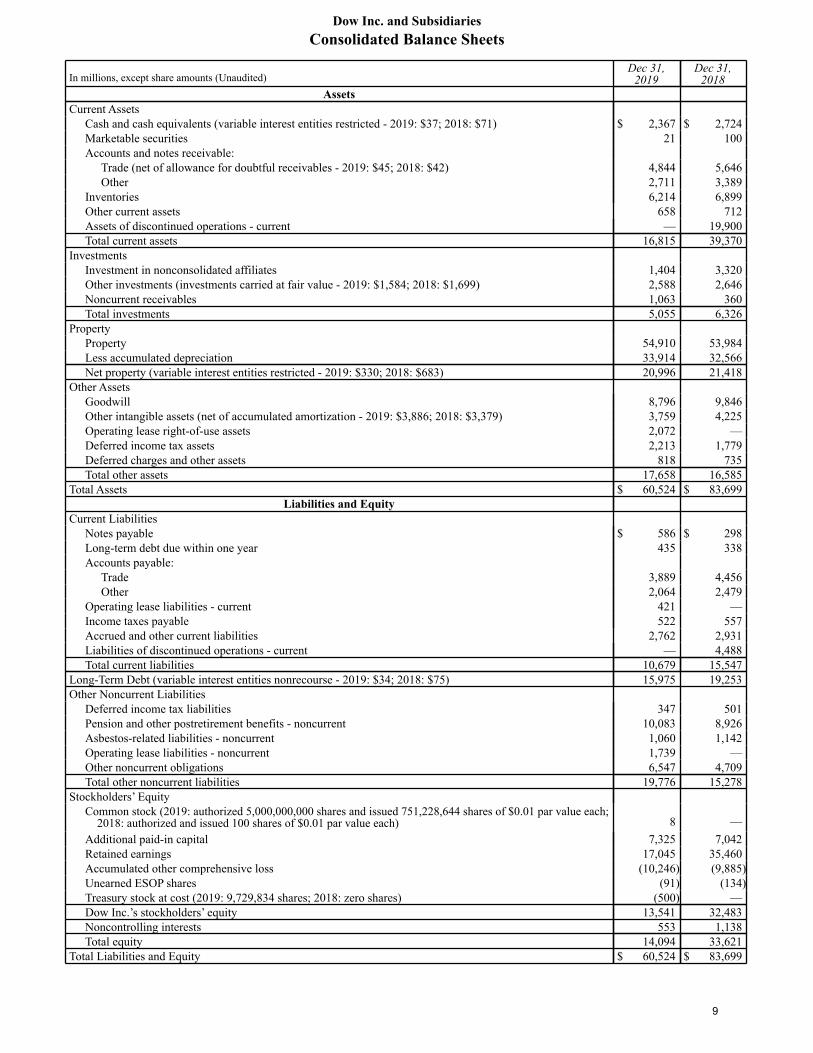
Dow Inc. and SubsidiariesConsolidated Balance Sheets
In millions, except share amounts (Unaudited)Dec 31,
2019Dec 31,
2018Assets
Current AssetsCash and cash equivalents (variable interest entities restricted - 2019: $37; 2018: $71) $ 2,367 $ 2,724Marketable securities 21 100Accounts and notes receivable:
Trade (net of allowance for doubtful receivables - 2019: $45; 2018: $42) 4,844 5,646Other 2,711 3,389
Inventories 6,214 6,899Other current assets 658 712Assets of discontinued operations - current — 19,900Total current assets 16,815 39,370
InvestmentsInvestment in nonconsolidated affiliates 1,404 3,320Other investments (investments carried at fair value - 2019: $1,584; 2018: $1,699) 2,588 2,646Noncurrent receivables 1,063 360Total investments 5,055 6,326
PropertyProperty 54,910 53,984Less accumulated depreciation 33,914 32,566Net property (variable interest entities restricted - 2019: $330; 2018: $683) 20,996 21,418
Other AssetsGoodwill 8,796 9,846Other intangible assets (net of accumulated amortization - 2019: $3,886; 2018: $3,379) 3,759 4,225Operating lease right-of-use assets 2,072 —Deferred income tax assets 2,213 1,779Deferred charges and other assets 818 735Total other assets 17,658 16,585
Total Assets $ 60,524 $ 83,699Liabilities and Equity
Current LiabilitiesNotes payable $ 586 $ 298Long-term debt due within one year 435 338Accounts payable:
Trade 3,889 4,456Other 2,064 2,479
Operating lease liabilities - current 421 —Income taxes payable 522 557Accrued and other current liabilities 2,762 2,931Liabilities of discontinued operations - current — 4,488Total current liabilities 10,679 15,547
Long-Term Debt (variable interest entities nonrecourse - 2019: $34; 2018: $75) 15,975 19,253Other Noncurrent Liabilities
Deferred income tax liabilities 347 501Pension and other postretirement benefits - noncurrent 10,083 8,926Asbestos-related liabilities - noncurrent 1,060 1,142Operating lease liabilities - noncurrent 1,739 —Other noncurrent obligations 6,547 4,709Total other noncurrent liabilities 19,776 15,278
Stockholders’ EquityCommon stock (2019: authorized 5,000,000,000 shares and issued 751,228,644 shares of $0.01 par value each;
2018: authorized and issued 100 shares of $0.01 par value each) 8 —Additional paid-in capital 7,325 7,042Retained earnings 17,045 35,460Accumulated other comprehensive loss (10,246) (9,885)Unearned ESOP shares (91) (134)Treasury stock at cost (2019: 9,729,834 shares; 2018: zero shares) (500) —Dow Inc.’s stockholders’ equity 13,541 32,483Noncontrolling interests 553 1,138Total equity 14,094 33,621
Total Liabilities and Equity $ 60,524 $ 83,699
9

Dow Inc. and SubsidiariesConsolidated Statements of Cash Flows
(In millions) (Unaudited) For the years ended Dec 31, 2019 2018Operating Activities
Net income (loss) $ (1,272) $ 4,775Less: Income from discontinued operations, net of tax 445 1,835Income (loss) from continuing operations, net of tax (1,717) 2,940Adjustments to reconcile net income (loss) to net cash provided by operating activities:
Depreciation and amortization 2,938 2,909Credit for deferred income tax (228) (429)Earnings of nonconsolidated affiliates less than dividends received 1,114 108Net periodic pension benefit cost 144 279Pension contributions (261) (1,651)Net gain on sales of assets, businesses and investments (81) (38)Restructuring, goodwill impairment and asset related charges - net 3,219 221Other net loss 198 415
Changes in assets and liabilities, net of effects of acquired and divested companies:Accounts and notes receivable 1,253 (855)Inventories 668 (859)Accounts payable (948) 787Other assets and liabilities, net (586) (731)
Cash provided by operating activities - continuing operations 5,713 3,096Cash provided by operating activities - discontinued operations 217 1,158Cash provided by operating activities 5,930 4,254
Investing ActivitiesCapital expenditures (1,961) (2,091)Investment in gas field developments (76) (114)Purchases of previously leased assets (9) (26)Proceeds from sales of property and businesses, net of cash divested 84 47Acquisitions of property and businesses, net of cash acquired — (20)Investments in and loans to nonconsolidated affiliates (638) (18)Distributions and loan repayments from nonconsolidated affiliates 89 55Purchases of investments (899) (1,530)Proceeds from sales and maturities of investments 1,252 1,214Proceeds from interests in trade accounts receivable conduits — 657Cash used for investing activities - continuing operations (2,158) (1,826)Cash used for investing activities - discontinued operations (34) (369)Cash used for investing activities (2,192) (2,195)
Financing ActivitiesChanges in short-term notes payable 307 (178)Proceeds from issuance of long-term debt 2,287 1,999Payments on long-term debt (5,561) (3,054)Purchases of treasury stock (500) —Proceeds from issuance of parent company stock 93 112Transaction financing, debt issuance and other costs (119) (70)Employee taxes paid for share-based payment arrangements (60) (77)Distributions to noncontrolling interests (77) (135)Purchases of noncontrolling interests (297) —Dividends paid to stockholders (1,550) —Dividends paid to DowDuPont Inc. (535) (3,711)Settlements and transfers related to separation from DowDuPont Inc. 1,935 (240)Other financing activities, net — 3Cash used for financing activities - continuing operations (4,077) (5,351)Cash used for financing activities - discontinued operations (18) (53)Cash used for financing activities (4,095) (5,404)
Effect of exchange rate changes on cash, cash equivalents and restricted cash (27) (99)Summary
Decrease in cash, cash equivalents and restricted cash (384) (3,444)Cash, cash equivalents and restricted cash at beginning of year 2,764 6,208
Cash, cash equivalents and restricted cash at end of year $ 2,380 $ 2,764Less: Restricted cash and cash equivalents, included in "Other current assets" 13 40
Cash and cash equivalents at end of year $ 2,367 $ 2,724
10

Dow Inc. and SubsidiariesPro Forma Consolidated Statements of Income
Three Months Ended Twelve Months Ended
In millions, except per share amounts (Unaudited)
Dec 31,2019
Dec 31,2018
Dec 31,2019
Dec 31,2018
As Reported Pro Forma Pro Forma Pro Forma
Net sales $ 10,204 $ 12,008 $ 42,998 $ 49,852Cost of sales 8,718 10,152 36,689 41,270Research and development expenses 173 177 765 798Selling, general and administrative expenses 332 404 1,590 1,781Amortization of intangibles 99 116 419 469Restructuring, goodwill impairment and asset related charges - net 2,851 46 3,219 198Integration and separation costs 99 344 1,013 1,074Equity in earnings (losses) of nonconsolidated affiliates (21) 26 (94) 555Sundry income (expense) - net 92 56 461 93Interest income 23 23 82 83Interest expense and amortization of debt discount 222 281 932 1,062
Income (loss) from continuing operations before income taxes (2,196) 593 (1,180) 3,931Provision for income taxes on continuing operations 114 62 485 847
Income (loss) from continuing operations, net of tax (2,310) 531 (1,665) 3,084Net income attributable to noncontrolling interests 13 24 74 102
Net income (loss) from continuing operations available for Dow Inc. common stockholders $ (2,323) $ 507 $ (1,739) $ 2,982
Per common share data:Earnings (loss) per common share from continuing operations - basic $ (3.14) $ 0.68 $ (2.35) $ 3.99Earnings (loss) per common share from continuing operations - diluted $ (3.14) $ 0.68 $ (2.35) $ 3.99
Weighted-average common shares outstanding - basic 1 740.2 747.2 742.5 747.2Weighted-average common shares outstanding - diluted 1 740.2 747.2 742.5 747.21. The weighted-average common shares outstanding - basic and diluted for the twelve months ended December 31, 2019, are the same under both U.S. GAAP
and on a pro forma basis.
11

Dow Inc. and SubsidiariesNet Sales by Segment and Geographic Region
Net Sales by Segment Three Months Ended Twelve Months Ended
In millions (Unaudited)
Dec 31,2019
Dec 31,2018
Dec 31,2019
Dec 31,2018
As Reported Pro Forma Pro Forma Pro Forma
Packaging & Specialty Plastics $ 4,840 $ 5,898 $ 20,245 $ 24,237Industrial Intermediates & Infrastructure 3,253 3,777 13,449 15,465Performance Materials & Coatings 2,035 2,269 8,961 9,865Corporate 76 64 343 285Total $ 10,204 $ 12,008 $ 42,998 $ 49,852U.S. & Canada $ 3,612 $ 4,255 $ 15,582 $ 17,999EMEAI 1 3,384 4,156 14,618 17,426Asia Pacific 2,212 2,382 8,683 9,438Latin America 996 1,215 4,115 4,989Total $ 10,204 $ 12,008 $ 42,998 $ 49,852
Pro Forma Net SalesVariance by Segment andGeographic Region
Three Months Ended Dec 31, 2019 2 Twelve Months Ended Dec 31, 2019Local
Price &Product
Mix Currency VolumePortfolio/ Other Total
LocalPrice &Product
Mix Currency VolumePortfolio/ Other TotalPercent change from prior year
Packaging & SpecialtyPlastics (14)% (1)% (3)% —% (18)% (12)% (1)% (3)% —% (16)%
Industrial Intermediates &Infrastructure (13) (1) — — (14) (12) (2) 1 — (13)
Performance Materials &Coatings (8) (1) (1) — (10) (6) (2) (1) — (9)
Total (12)% (1)% (2)% —% (15)% (11)% (1)% (2)% —% (14)%Total, excluding the
Hydrocarbons & Energybusiness (13)% (1)% 2 % —% (12)% (10)% (2)% 1 % —% (11)%
U.S. & Canada (13)% — % (2)% —% (15)% (11)% — % (2)% —% (13)%EMEAI 1 (11) (2) (6) — (19) (9) (3) (4) — (16)Asia Pacific (14) — 7 — (7) (12) (1) 5 — (8)Latin America (16) — (2) — (18) (15) — (3) — (18)Total (12)% (1)% (2)% —% (15)% (11)% (1)% (2)% —% (14)%1. Europe, Middle East, Africa and India.2. As reported net sales for the three months ended December 31, 2019 compared with pro forma net sales for the three months ended December 31, 2018.
12

Dow Inc. and SubsidiariesSelected Financial Information and Non-GAAP Measures
Operating EBIT by Segment Three Months Ended Twelve Months EndedDec 31,
2019Dec 31,
2018Dec 31,
2019Dec 31,
2018In millions (Unaudited) As Reported Pro Forma Pro Forma Pro Forma
Packaging & Specialty Plastics $ 648 $ 839 $ 2,904 $ 3,593Industrial Intermediates & Infrastructure 221 339 845 1,767Performance Materials & Coatings 233 201 918 1,246Corporate (69) (90) (315) (370)Total $ 1,033 $ 1,289 $ 4,352 $ 6,236
Depreciation and Amortization by Segment Three Months Ended Twelve Months EndedDec 31,
2019Dec 31,
2018Dec 31,
2019Dec 31,
2018In millions (Unaudited) As Reported Pro Forma Pro Forma Pro Forma
Packaging & Specialty Plastics $ 332 $ 337 $ 1,435 $ 1,385Industrial Intermediates & Infrastructure 153 159 594 607Performance Materials & Coatings 222 224 877 888Corporate 6 6 32 29Total $ 713 $ 726 $ 2,938 $ 2,909
Operating EBITDA by Segment Three Months Ended Twelve Months EndedDec 31,
2019Dec 31,
2018Dec 31,
2019Dec 31,
2018In millions (Unaudited) As Reported Pro Forma Pro Forma Pro Forma
Packaging & Specialty Plastics $ 980 $ 1,176 $ 4,339 $ 4,978Industrial Intermediates & Infrastructure 374 498 1,439 2,374Performance Materials & Coatings 455 425 1,795 2,134Corporate (63) (84) (283) (341)Total $ 1,746 $ 2,015 $ 7,290 $ 9,145
Equity in Earnings (Losses) of Nonconsolidated Affiliates by Segment Three Months Ended Twelve Months EndedDec 31,
2019Dec 31,
2018Dec 31,
2019Dec 31,
2018In millions (Unaudited) As Reported Pro Forma Pro Forma Pro Forma
Packaging & Specialty Plastics $ 27 $ 37 $ 162 $ 287Industrial Intermediates & Infrastructure (45) (15) (241) 284Performance Materials & Coatings 2 — 5 4Corporate (5) 4 (20) (20)Total $ (21) $ 26 $ (94) $ 555
Reconciliation of "Income (loss) from continuing operations, net of tax"to "Operating EBIT"
Three Months Ended Twelve Months EndedDec 31,
2019Dec 31,
2018Dec 31,
2019Dec 31,
2018In millions (Unaudited) As Reported Pro Forma Pro Forma Pro Forma
Income (loss) from continuing operations, net of tax $ (2,310) $ 531 $ (1,665) $ 3,084+ Provision for income taxes on continuing operations 114 62 485 847
Income (loss) from continuing operations before income taxes $ (2,196) $ 593 $ (1,180) $ 3,931- Interest income 23 23 82 83+ Interest expense and amortization of debt discount 222 281 932 1,062- Significant items (3,030) (438) (4,682) (1,326)
Operating EBIT $ 1,033 $ 1,289 $ 4,352 $ 6,236
13

Dow Inc. and SubsidiariesSelected Financial Information and Non-GAAP Measures
Significant Items Impacting Results for the Three Months Ended Dec 31, 2019
In millions, except per share amounts (Unaudited) Pretax 1Net
Income 2 EPS 3 Income Statement ClassificationReported results $ (2,196) $ (2,323) $ (3.14)Less: Significant items
Integration and separation costs (99) (89) (0.12) Integration and separation costsRestructuring, goodwill impairment and
asset related charges - net 4 (2,851) (2,842) (3.84)Restructuring, goodwill impairment and
asset related charges - netLoss on divestiture (5) (4) (0.01) Sundry income (expense) - netLoss on early extinguishment of debt (58) (49) (0.07) Sundry income (expense) - netIndemnification and other transaction
related costs 5 (17) (17) (0.02) Sundry income (expense) - net
Income tax related items 6 — 101 0.14Provision for income taxes on continuing
operationsTotal significant items $ (3,030) $ (2,900) $ (3.92)
Operating results (non-GAAP) $ 834 $ 577 $ 0.78
Significant Items Impacting Results for the Three Months Ended Dec 31, 2018
In millions, except per share amounts (Unaudited) Pretax 1Net
Income 2 EPS 3 Income Statement ClassificationPro forma results $ 593 $ 507 $ 0.68Less: Significant items
Integration and separation costs (344) (333) (0.45) Integration and separation costsRestructuring, goodwill impairment and
asset related charges - net (46) (37) (0.05)Restructuring, goodwill impairment and
asset related charges - netLoss on early extinguishment of debt (48) (37) (0.05) Sundry income (expense) - net
Income tax related items — 115 0.16Provision for income taxes on continuing
operationsTotal significant items $ (438) $ (292) $ (0.39)
Operating pro forma results (non-GAAP) $ 1,031 $ 799 $ 1.071. "Income (loss) from continuing operations before income taxes" or pro forma "Income (loss) from continuing operations before income taxes."2. "Net income (loss) available for Dow Inc. common stockholders" or pro forma "Net income (loss) available for Dow Inc. common stockholders." The income
tax effect on significant items was calculated based upon the enacted tax laws and statutory income tax rates applicable in the tax jurisdiction(s) of the underlying non-GAAP adjustment.
3. "Earnings (loss) per common share from continuing operations - diluted" or pro forma "Earnings (loss) per common share from continuing operations - diluted."4. Primarily related to a $1,755 million pretax charge associated with Sadara (including an other-than-temporary impairment of the Company's equity method
investment in Sadara and the reserve of loan and accounts receivable balances associated with Sadara) and a $1,039 million pretax impairment charge related to goodwill associated with the Coatings & Performance Monomers reporting unit.
5. Primarily related to charges associated with agreements entered into with DuPont and Corteva as part of the separation and distribution which, among other matters, provides for cross-indemnities and allocations of obligations and liabilities for periods prior to, at and after the completion of the separation.
6. Primarily related to effects of Swiss tax reform.
14

Dow Inc. and SubsidiariesSelected Financial Information and Non-GAAP Measures
Significant Items Impacting Results for the Twelve Months Ended Dec 31, 2019
In millions, except per share amounts (Unaudited) Pretax 1Net
Income 2 EPS 3 Income Statement ClassificationPro forma results $ (1,180) $ (1,739) $ (2.35)Less: Significant items
Integration and separation costs (1,013) (824) (1.11) Integration and separation costsRestructuring, goodwill impairment and
asset related charges - net 4 (3,219) (3,160) (4.26)Restructuring, goodwill impairment and
asset related charges - netLoss on divestitures (49) (47) (0.06) Sundry income (expense) - netLoss on early extinguishment of debt (102) (83) (0.11) Sundry income (expense) - netLitigation related charges, awards and
adjustments 5 205 178 0.24 Sundry income (expense) - net
Environmental charges 6 (399) (311) (0.42) Cost of sales
Indemnification and other transaction related costs 7 (144) (257) (0.34)
Cost of sales ($75 million); Sundry income(expense) - net ($69 million); Provision forincome taxes on continuing operations($113 million)
Warranty accrual adjustment of exitedbusiness 39 30 0.04 Cost of sales
Income tax related items 8 — 101 0.14Provision for income taxes on continuing
operationsTotal significant items $ (4,682) $ (4,373) $ (5.88)
Operating pro forma results (non-GAAP) $ 3,502 $ 2,634 $ 3.53
Significant Items Impacting Results for the Twelve Months Ended Dec 31, 2018
In millions, except per share amounts (Unaudited) Pretax 1Net
Income 2 EPS 3 Income Statement ClassificationPro forma results $ 3,931 $ 2,982 $ 3.99Less: Significant items
Impact of Dow Silicones ownership restructure 9 (20) (18) (0.02) Sundry income (expense) - net
Integration and separation costs (1,074) (946) (1.27) Integration and separation costsRestructuring, goodwill impairment and
asset related charges - net (198) (162) (0.22)Restructuring, goodwill impairment and
asset related charges - netGain on divestiture 10 20 15 0.02 Sundry income (expense) - netLoss on early extinguishment of debt (54) (42) (0.06) Sundry income (expense) - net
Income tax related items 11 — 125 0.17Provision for income taxes on continuing
operationsTotal significant items $ (1,326) $ (1,028) $ (1.38)
Operating pro forma results (non-GAAP) $ 5,257 $ 4,010 $ 5.371. Pro forma "Income (loss) from continuing operations before income taxes."2. Pro forma "Net income (loss) available for Dow Inc. common stockholders." The income tax effect on significant items was calculated based upon the enacted
tax laws and statutory income tax rates applicable in the tax jurisdiction(s) of the underlying non-GAAP adjustment.3. Pro forma "Earnings (loss) per common share from continuing operations - diluted."4. Primarily related to a $1,755 million pretax charge associated with Sadara (including an other-than-temporary impairment of the Company's equity method
investment in Sadara and the reserve of loan and accounts receivable balances associated with Sadara) and a $1,039 million pretax impairment charge related to goodwill associated with the Coatings & Performance Monomers reporting unit.
5. Includes a gain associated with a legal settlement with Nova, as well as a gain related to an adjustment of the Dow Silicones breast implant liability and a charge related to the settlement of the Dow Silicones commercial creditor matters.
6. Related to environmental remediation, primarily resulting from the culmination of long-standing negotiations with regulators and/or agencies and review of additional costs to manage ongoing remediation activities resulting from Dow’s separation from DowDuPont and related agreements with Corteva and DuPont.
7. Primarily related to charges associated with agreements entered into with DuPont and Corteva as part of the separation and distribution which, among other matters, provides for cross-indemnities and allocations of obligations and liabilities for periods prior to, at and after the completion of the separation.
8. Primarily related to effects of Swiss tax reform.9. Post-closing adjustments related to the Dow Silicones ownership restructure.10. Reflects a pretax gain related to the sale of equity interests in MEGlobal.11. Related to effects of U.S. Tax Reform.
15
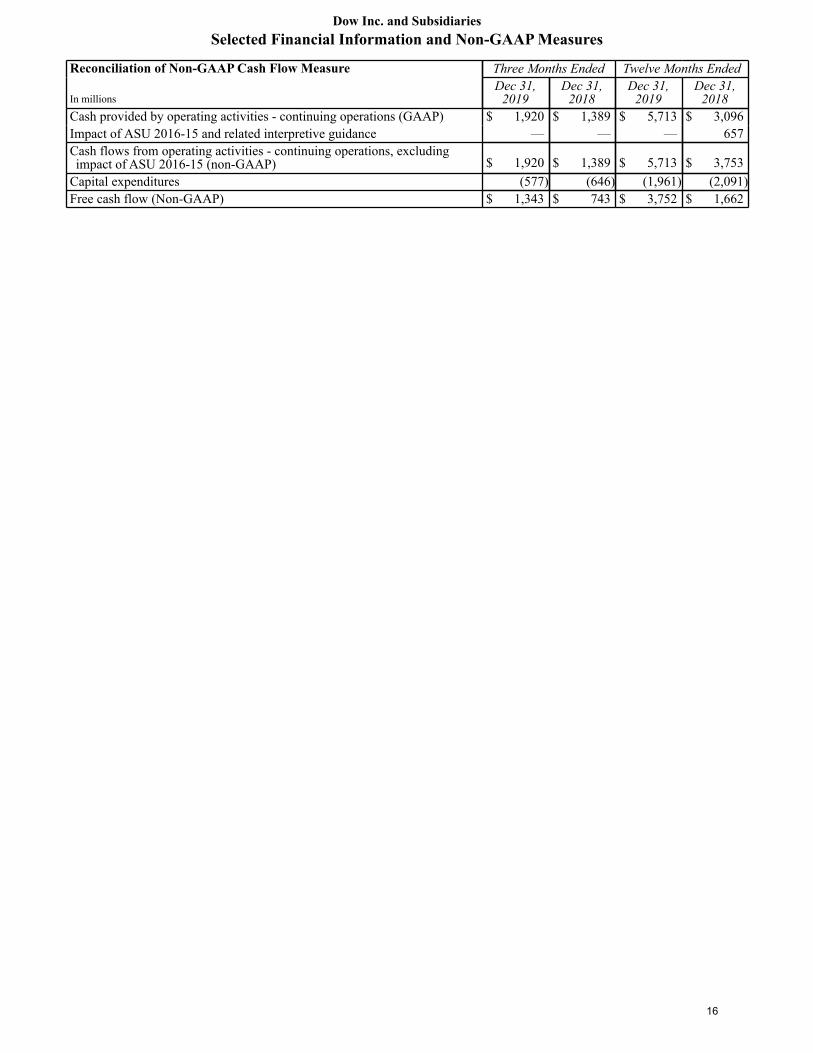
Dow Inc. and SubsidiariesSelected Financial Information and Non-GAAP Measures
Reconciliation of Non-GAAP Cash Flow Measure Three Months Ended Twelve Months Ended
In millionsDec 31,
2019Dec 31,
2018Dec 31,
2019Dec 31,
2018Cash provided by operating activities - continuing operations (GAAP) $ 1,920 $ 1,389 $ 5,713 $ 3,096Impact of ASU 2016-15 and related interpretive guidance — — — 657Cash flows from operating activities - continuing operations, excludingimpact of ASU 2016-15 (non-GAAP) $ 1,920 $ 1,389 $ 5,713 $ 3,753
Capital expenditures (577) (646) (1,961) (2,091)Free cash flow (Non-GAAP) $ 1,343 $ 743 $ 3,752 $ 1,662
16