double z sampling: how abstract does it work and what …
TRANSCRIPT

Double Z Sampling: How Does It Work and What
Does It Do?
MR Bruesewitz, AN Primak, J Zhang, CH McCollough
Mayo Clinic College of Medicine, Rochester, MN
B Schmidt, TG FlohrSiemens Medical Solutions, Forchheim, Germany
AbstractRecently, a 64-slice MDCT system which employs overlapping sampling along the z axis (z-flying focal spot, Sensation 64, Siemens Medical Solutions) was introduced. This exhibit reviews the underlying physics principles of this technology in terms of sampling theory. The effects of z over-sampling on longitudinal resolution (section sensitivity profiles), image noise, and dose are shown. Additionally, the increased sampling along the z axis reduces spiral artifacts, thereby improving the clinical utility of applications previously limited by spiral artifacts (e.g. neuro CT)
Principles of double z-samplingIn spiral CT, hyper- or hypo-dense “windmill” artifacts occur around z-
inhomogeneous high-contrast objects such as bones (Fig 1). These artifacts appear to rotate about a central point when scrolling through a stack of images. They are a consequence of insufficient data sampling in the z direction, and the discrete transitions between interpolation pairs [1,2]. To meet the criteria of the Nyquist sampling theorem, the sampling interval along the z axis must be Dz = S/2, at the iso-center, for a detector element aperture of S. With a sampling frequency of at least twice the highest frequency contained in the signal, the time-varying attenuation data along the z axis may be accurately reconstructed from a series of discrete projection samples, spatial resolution is improved without the use of smaller detector elements, and windmill artifacts effectively minimized.
One method of ensuring adequate sampling is to select spiral pitch values that interleave z samples at isocenter (Fig 2) [3,4]. However, the optimal sampling interval is only for some pitch values and is maintained over only a small radius around the isocenter.
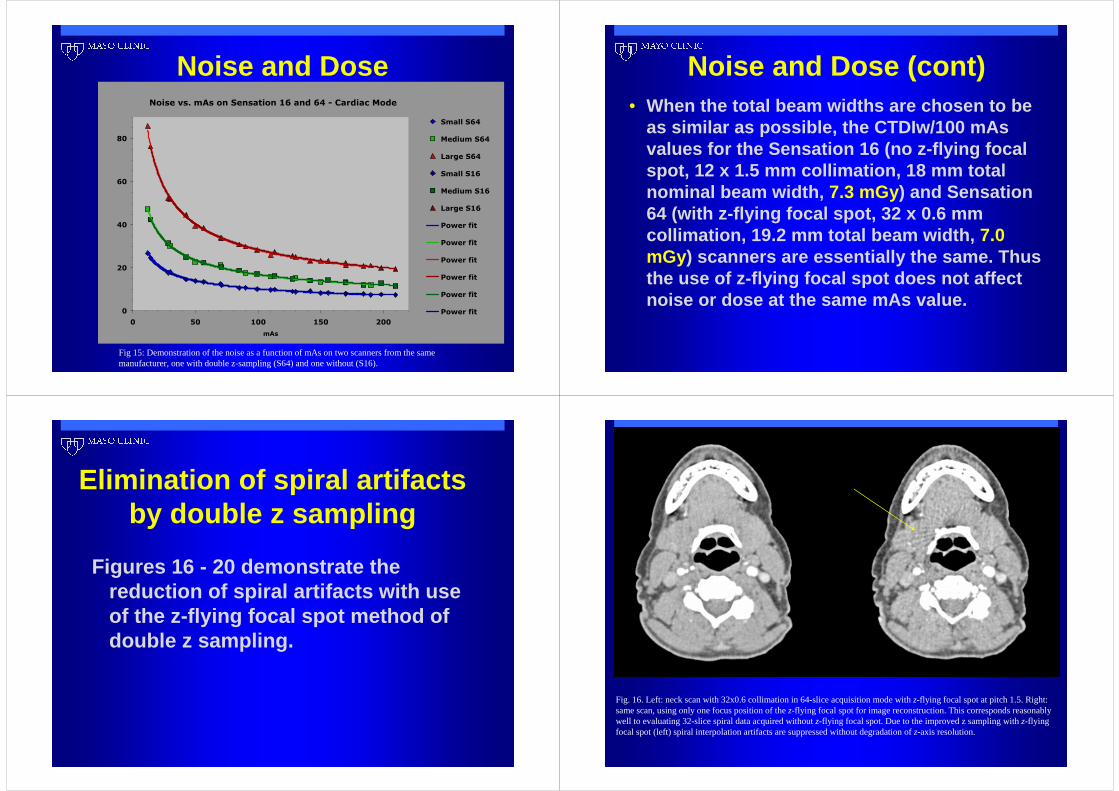
The z-flying focal spot technology implemented in the 32 x 0.6 detector row scanner discussed here (Sensation 64, Siemens Medical Solutions) makes use of a periodic motion of the focal spot along the z direction to achieve optimal sampling along the z axis [5]. Continuous electromagnetic deflection of the electron beam in the x-ray tube causes the focal spot to move periodically between two differentpositions on the anode plate (Fig 3). The amplitude of the motion is adjusted such that two subsequent readings are shifted by half a collimated slice width (S/2) along the z axis. Therefore, the measurement rays of two subsequent readings with collimated slice width S interleave in the z direction, and every two 32-slice readings are combined to one 64-slice projection with a sampling distance of S/2 at isocenter (Fig 4,5). This pitch-independent z-sampling scheme, with ∆Z = S/2, fulfills the Nyquist sampling theorem, and allows improved longitudinal resolution and the suppression of spiral artifacts across a much larger radius from isocenter (approximately a 28 cm field of view).
Principles of double z-sampling
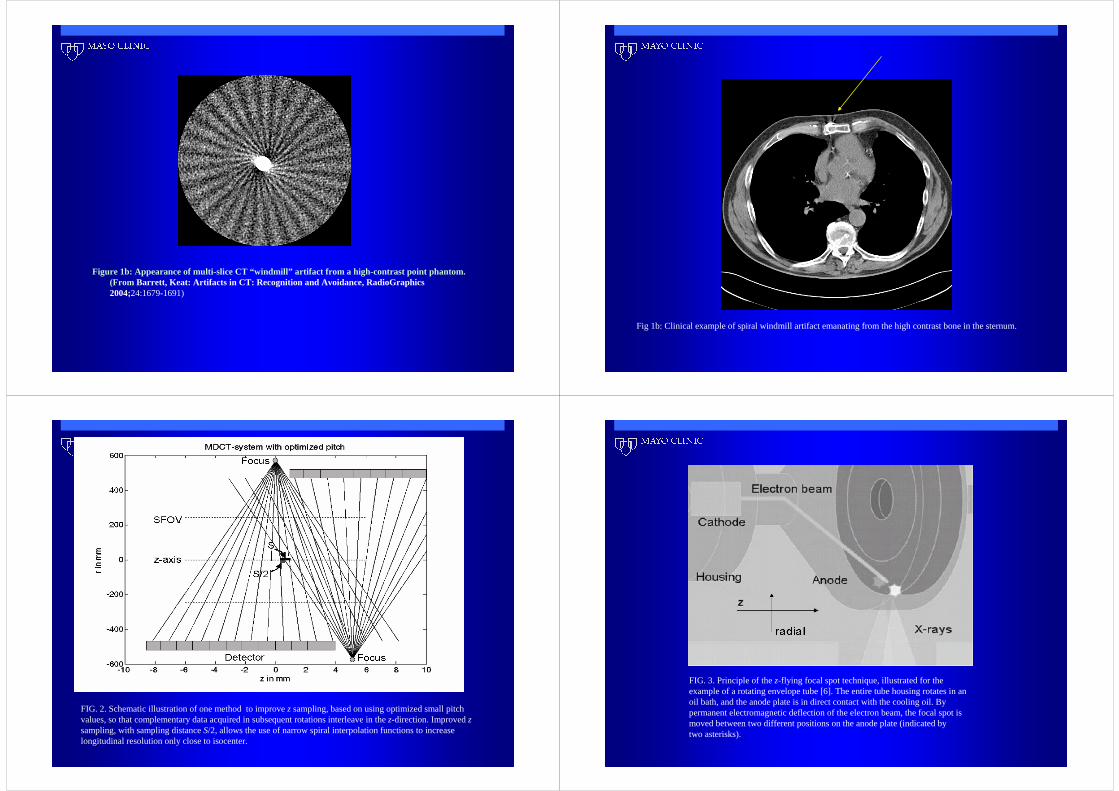
Figure 1b: Appearance of multi-slice CT “windmill” a rtifact from a high-contrast point phantom. (From Barrett, Keat: Artifacts in CT: Recognition and Avoidance, RadioGraphics 2004;24:1679-1691)
Fig 1b: Clinical example of spiral windmill artifact emanating from the high contrast bone in the sternum.
FIG. 2. Schematic illustration of one method to improve z sampling, based on using optimized small pitch values, so that complementary data acquired in subsequent rotations interleave in the z-direction. Improved z sampling, with sampling distance S/2, allows the use of narrow spiral interpolation functions to increase longitudinal resolution only close to isocenter.
FIG. 3. Principle of the z-flying focal spot technique, illustrated for theexample of a rotating envelope tube [6]. The entire tube housing rotates in an oil bath, and the anode plate is in direct contact with the cooling oil. By permanent electromagnetic deflection of the electron beam, the focal spot ismoved between two different positions on the anode plate (indicated bytwo asterisks).
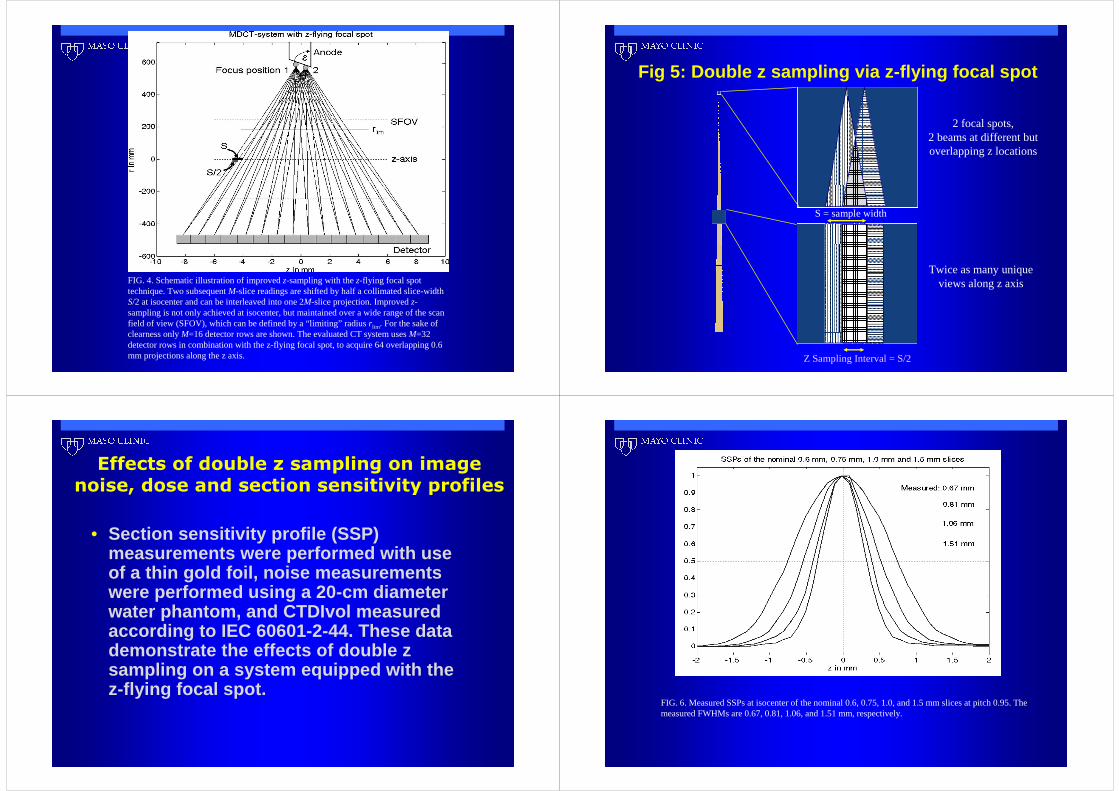
FIG. 4. Schematic illustration of improved z-sampling with the z-flying focal spot technique. Two subsequent M-slice readings are shifted by half a collimated slice-width S/2 at isocenter and can be interleaved into one 2M-slice projection. Improved z-sampling is not only achieved at isocenter, but maintained over a wide range of the scan field of view (SFOV), which can be defined by a “limiting” radius rlim. For the sake of clearness only M=16 detector rows are shown. The evaluated CT system uses M=32 detector rows in combination with the z-flying focal spot, to acquire 64 overlapping 0.6 mm projections along the z axis.
Fig 5: Double z sampling via z-flying focal spot
2 focal spots,2 beams at different but overlapping z locations
Twice as many unique views along z axis
Z Sampling Interval = S/2
S = sample width
Effects of double z sampling on image noise, dose and section sensitivity profiles
• Section sensitivity profile (SSP) measurements were performed with use of a thin gold foil, noise measurements were performed using a 20-cm diameter water phantom, and CTDIvol measured according to IEC 60601-2-44. These data demonstrate the effects of double z sampling on a system equipped with the z-flying focal spot.
FIG. 6. Measured SSPs at isocenter of the nominal 0.6, 0.75, 1.0, and 1.5 mm slices at pitch 0.95. The measured FWHMs are 0.67, 0.81, 1.06, and 1.51 mm, respectively.
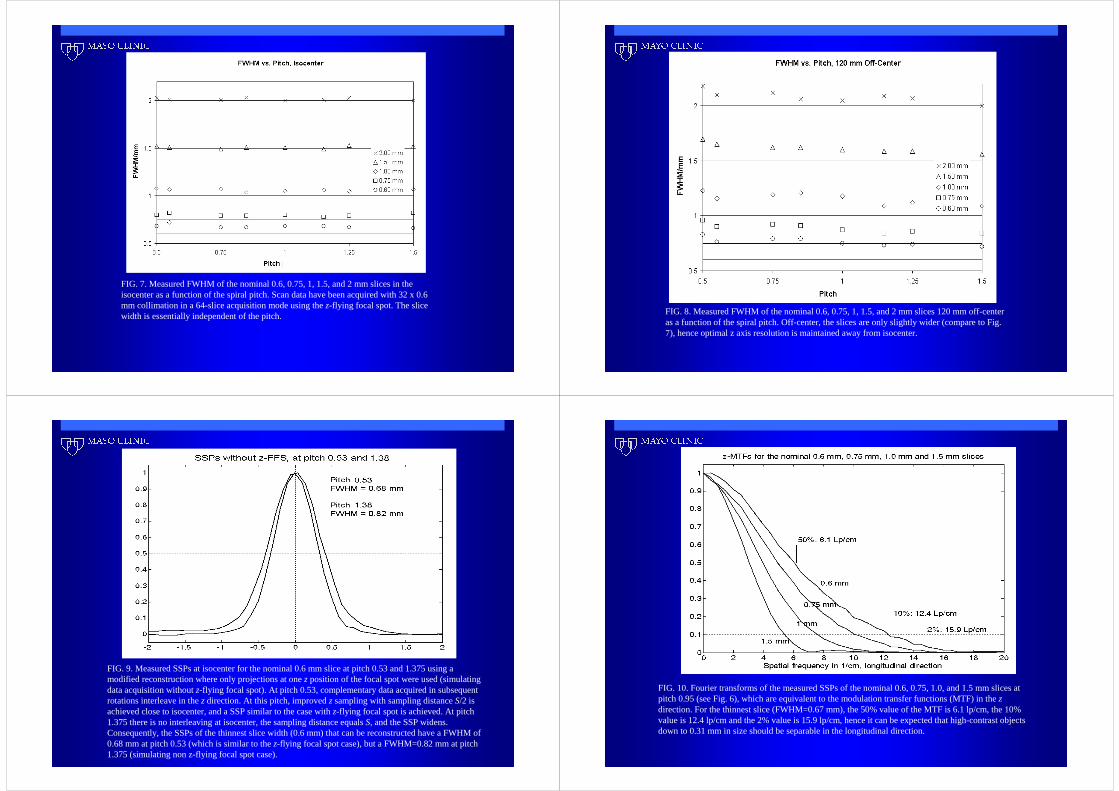
FIG. 7. Measured FWHM of the nominal 0.6, 0.75, 1, 1.5, and 2 mm slices in the isocenter as a function of the spiral pitch. Scan data have been acquired with 32 x 0.6 mm collimation in a 64-slice acquisition mode using the z-flying focal spot. The slice width is essentially independent of the pitch. FIG. 8. Measured FWHM of the nominal 0.6, 0.75, 1, 1.5, and 2 mm slices 120 mm off-center
as a function of the spiral pitch. Off-center, the slices are only slightly wider (compare to Fig. 7), hence optimal z axis resolution is maintained away from isocenter.
FIG. 9. Measured SSPs at isocenter for the nominal 0.6 mm slice at pitch 0.53 and 1.375 using a modified reconstruction where only projections at one z position of the focal spot were used (simulating data acquisition without z-flying focal spot). At pitch 0.53, complementary data acquired in subsequent rotations interleave in the z direction. At this pitch, improved z sampling with sampling distance S/2 is achieved close to isocenter, and a SSP similar to the case with z-flying focal spot is achieved. At pitch 1.375 there is no interleaving at isocenter, the sampling distance equals S, and the SSP widens. Consequently, the SSPs of the thinnest slice width (0.6 mm) that can be reconstructed have a FWHM of 0.68 mm at pitch 0.53 (which is similar to the z-flying focal spot case), but a FWHM=0.82 mm at pitch 1.375 (simulating non z-flying focal spot case).
FIG. 10. Fourier transforms of the measured SSPs of the nominal 0.6, 0.75, 1.0, and 1.5 mm slices at pitch 0.95 (see Fig. 6), which are equivalent to the modulation transfer functions (MTF) in the z direction. For the thinnest slice (FWHM=0.67 mm), the 50% value of the MTF is 6.1 lp/cm, the 10% value is 12.4 lp/cm and the 2% value is 15.9 lp/cm, hence it can be expected that high-contrast objects down to 0.31 mm in size should be separable in the longitudinal direction.

FIG. 11. MPRs of a z-resolution phantom (high-resolution insert of the CATPHAN, Phantom Laboratories, Salem, NY, with the module placed flat on the table top at the isocenter of the scanner) as a function of pitch. Data were acquired with 32x0.6 mm collimation in a 64-slice acquisition mode using the z-flying focal spot and reconstructed with the narrowest slice width (nominal 0.6 mm) and a sharp body kernel (B70). Independent of the pitch all bar-patterns up to 16 lp/cm can be visualized. The bar patterns with 15 lp/cm are exactly perpendicular to the z axis, corresponding to 0.33 mm longitudinal resolution.
FIG. 12. MPR of the z-resolution phantom at pitch 0.95, positioned in the isocenter, 50 and 100 mm off-center. At 100 mm off-center, longitudinal resolution is only slightly degraded to 14 lp/cm, correspondingto 0.36 mm.
x,y
z
0.4 mm
0.4 mmz
x
y
coronal
axial
Fig 13: Demonstration of isotropic resolution of 0.4 mm, obtained by imaging the resolution phantom shown in the volume rendered CT image at left.
FIG. 14. MPRs of the z-resolution phantom at isocenter, obtained with a modified reconstruction approach using only projections at one z position of the focal spot (simulating data acquisition without z-flying focal spot). At pitch 0.53, longitudinal resolution is comparable to the case with z-flying focal spot. At pitch 1.375, longitudinal resolution degrades compared to the case with z-flying focal spot (see Fig. 9).
Noise and Dose
Fig 15: Demonstration of the noise as a function of mAs on two scanners from the same manufacturer, one with double z-sampling (S64) and one without (S16).
Noise vs. mAs on Sensation 16 and 64 - Cardiac Mode
0
20
40
60
80
0 50 100 150 200
mAs
Small S64
Medium S64
Large S64
Small S16
Medium S16
Large S16
Power fit
Power fit
Power fit
Power fit
Power fit
Power fit
Noise and Dose (cont)• When the total beam widths are chosen to be
as similar as possible, the CTDIw/100 mAs values for the Sensation 16 (no z-flying focal spot, 12 x 1.5 mm collimation, 18 mm total nominal beam width, 7.3 mGy) and Sensation 64 (with z-flying focal spot, 32 x 0.6 mm collimation, 19.2 mm total beam width, 7.0 mGy) scanners are essentially the same. Thus the use of z-flying focal spot does not affect noise or dose at the same mAs value.
Elimination of spiral artifacts by double z sampling
Figures 16 - 20 demonstrate the reduction of spiral artifacts with use of the z-flying focal spot method of double z sampling.
Fig. 16. Left: neck scan with 32x0.6 collimation in 64-slice acquisition mode with z-flying focal spot at pitch 1.5. Right: same scan, using only one focus position of the z-flying focal spot for image reconstruction. This corresponds reasonably well to evaluating 32-slice spiral data acquired without z-flying focal spot. Due to the improved z sampling with z-flying focal spot (left) spiral interpolation artifacts are suppressed without degradation of z-axis resolution.
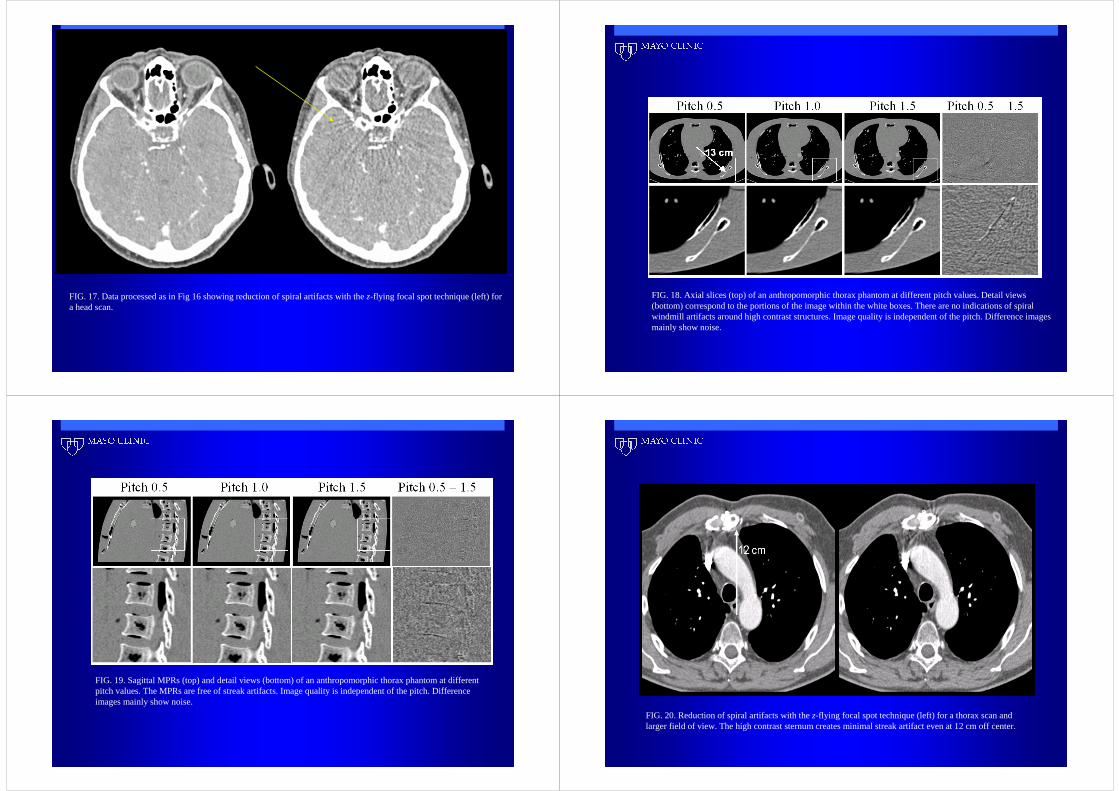
FIG. 17. Data processed as in Fig 16 showing reduction of spiral artifacts with the z-flying focal spot technique (left) for a head scan.
FIG. 18. Axial slices (top) of an anthropomorphic thorax phantom at different pitch values. Detail views (bottom) correspond to the portions of the image within the white boxes. There are no indications of spiral windmill artifacts around high contrast structures. Image quality is independent of the pitch. Difference images mainly show noise.
FIG. 19. Sagittal MPRs (top) and detail views (bottom) of an anthropomorphic thorax phantom at different pitch values. The MPRs are free of streak artifacts. Image quality is independent of the pitch. Difference images mainly show noise.
FIG. 20. Reduction of spiral artifacts with the z-flying focal spot technique (left) for a thorax scan and larger field of view. The high contrast sternum creates minimal streak artifact even at 12 cm off center.

Example of clinical applications improved with use of double z sampling
• Both the improved spatial resolution and reduced windmill artifacts achieved with use of the z-flying focal spot provide advantages to clinical applications. Figure 21 provide several examples.
Figure 21: Spiral CT images with reduced windmill artifacts provide the opportunity for coronal, sagittal, oblique and 3-D reconstructions.
Fig 22a) Sequential scans of the inner ear are often performed with the patient in the relatively uncomfortable prone position, and the neck hyperextended, in order to obtain direct coronal images, which better portray the anatomy of interest.
Fig 22b: Spiral scans allow the patient to lie in the more comfortable supine position. Additionally, the anatomy of interest can be readily portrayed in multiple planes, or with 3-D rendering techniques.
Oblique Sag
Axial
ReformatReformat
3-D rendering
Coronal
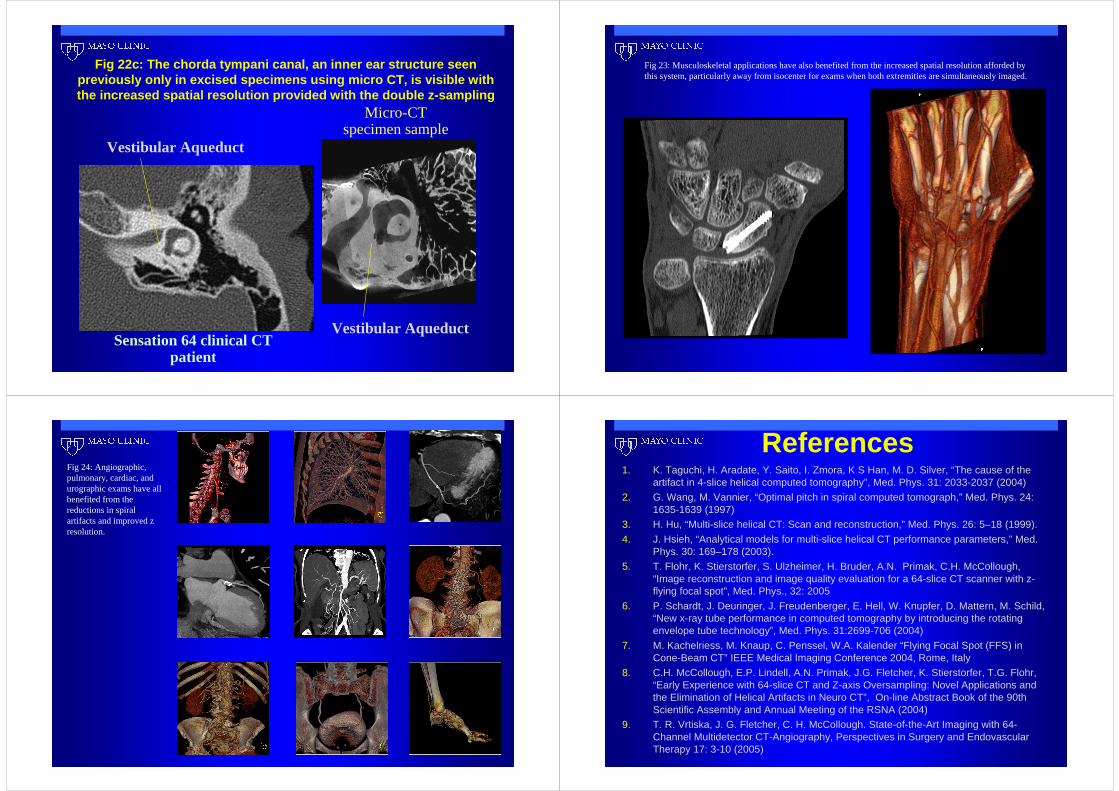
Fig 22c: The chorda tympani canal, an inner ear structure seen previously only in excised specimens using micro CT, is visible with the increased spatial resolution provided with the double z-sampling
Vestibular Aqueduct
Micro-CTspecimen sample
Vestibular Aqueduct
Sensation 64 clinical CT patient
Fig 23: Musculoskeletal applications have also benefited from the increased spatial resolution afforded by this system, particularly away from isocenter for exams when both extremities are simultaneously imaged.
Fig 24: Angiographic, pulmonary, cardiac, and urographic exams have all benefited from the reductions in spiral artifacts and improved z resolution.
References1. K. Taguchi, H. Aradate, Y. Saito, I. Zmora, K S Han, M. D. Silver, “The cause of the
artifact in 4-slice helical computed tomography”, Med. Phys. 31: 2033-2037 (2004)
2. G. Wang, M. Vannier, “Optimal pitch in spiral computed tomograph,” Med. Phys. 24: 1635-1639 (1997)
3. H. Hu, “Multi-slice helical CT: Scan and reconstruction,” Med. Phys. 26: 5–18 (1999).
4. J. Hsieh, “Analytical models for multi-slice helical CT performance parameters,” Med. Phys. 30: 169–178 (2003).
5. T. Flohr, K. Stierstorfer, S. Ulzheimer, H. Bruder, A.N. Primak, C.H. McCollough, “Image reconstruction and image quality evaluation for a 64-slice CT scanner with z-flying focal spot”, Med. Phys., 32: 2005
6. P. Schardt, J. Deuringer, J. Freudenberger, E. Hell, W. Knupfer, D. Mattern, M. Schild, “New x-ray tube performance in computed tomography by introducing the rotating envelope tube technology”, Med. Phys. 31:2699-706 (2004)
7. M. Kachelriess, M. Knaup, C. Penssel, W.A. Kalender “Flying Focal Spot (FFS) in Cone-Beam CT” IEEE Medical Imaging Conference 2004, Rome, Italy
8. C.H. McCollough, E.P. Lindell, A.N. Primak, J.G. Fletcher, K. Stierstorfer, T.G. Flohr, “Early Experience with 64-slice CT and Z-axis Oversampling: Novel Applications and the Elimination of Helical Artifacts in Neuro CT”, On-line Abstract Book of the 90th Scientific Assembly and Annual Meeting of the RSNA (2004)
9. T. R. Vrtiska, J. G. Fletcher, C. H. McCollough. State-of-the-Art Imaging with 64-Channel Multidetector CT-Angiography, Perspectives in Surgery and Endovascular Therapy 17: 3-10 (2005)