dot/faa/ct-93179 dot-vntsc-faa-93-11dot/faa/ct-93179 dot-vntsc-faa-93-11 faa technical center...
TRANSCRIPT

DOT/FAA/CT-93179 DOT-VNTSC-FAA-93-11
FAA Technical Center Atlantic City International Airport, N.J. 08405
DOT/FAA /CT-93/ 79 c.2
December 1993
Final Report
0 U.S. Department of Transportation Federal Aviation Administration

---------------------
DOT/FAA /CT-93/ ..,.
Rice, R. Effects of repair on structural integrity
the sponsorship of the interest of information
1t assumes no liability for
1ot endorse products or ' names appear herein tial to the objective of this

REPORT DOCUMENTATION PAGE Form Ap!?roved OMS No. 704-0188
Public reporting burden for this collection of information is estimated to average 1 hour per response, includi119 the time for reviewing instructions( searchi~ existi::y data sources, gathering and maintaining the dilta neected, and coq,letii)SI and reviewil)9 the co lection o informa ion. Send conments regardi119 this burden estimate or anv. other as~t of this collection qf information, including s~gestions for reduc1ng th1s burden, to ~ashi~ton He~rters ~~~~~~nlll i ~~t~~a~~-fg~f l ~!o:;rt ion Operat !~ R~ .. ~eP!)rts, 1215 R~~!ff~~p~~yi ~t H} H~~trtl1~~ teu!;~ ~~~; ;~~~~ .. x~
1. AGENCY USE ONLY (Leave blank) 2. REPORT DATE 3. REPORT TYPE AND DATES COVERED December 1993 Final Report
January 1990-September 1992
4. TITLE AND SUBTITLE 5. FUNDING NUMBERS
Effects of Repair on Structural Integrity FA3H2/A3128 DTRS-57-89-C-00006
6. AUTHOR($)
R. Rice, R. Francini, s. Rahman, M. Rosenfeld, s. Rust, s. Smith, D. Broek
7. PERFORMING ORGANIZATION NAME(S) AND ADDRESS(ES) 8. PERFORMING ORGANIZATION BATTELLE* REPORT NUMBER 505 King Avenue DOT-VNTSC-FAA-93-11 Columbus, OH 43201
9. SPONSORING/MONITORING AGENCY NAME(S) AND ADDRESS(ES) 10. SPONSORING/MONITORING u.s. Department of Transportation AGENCY REPORT NUMBER Federal Aviation Administration Technical Center
DOT/FAA/CT-93/79 Atlantic City International Airport, NJ 08405
11. SUPPLEMENTARY NOTES u.s. Department of Transportation *Under Contract to: Volpe National Transportation Systems Center
Kendall Square Cari>r i dge_. MA 02142
12a. DISTRIBUTION/AVAILABILITY STATEMENT 12b. DISTRIBUTION CODE
This document is available to the public through the National Technical Information Service, Springfield, VA 22161
13. ABSTRACT (Maximum 200 words)
FAA regulations require commercial aircraft operators to repair damaged aircraft structures. These repairs must be performed in a timely •mer to reduce aircraft downti111e and loss of revenue. A guiding principal for such repairs is to restore the structure to the original (or better) static strength and stiffness.
However, the repair ILISt also be designed for adequate fatigue resistance, damage tolerance, and inspectability. Fatigue and damage tolerance (DT) analyses should be based on realistic stress histories which, in turn, should be derived from realist load spectra. Thus, an algorithm for the developnent of a stress history should be included in a coq,rehens i ve analysis of repairs.
Since 11111ny damage repair stations and airlines do have at least basic c~ter facilities that can be used for fatigue and damage tolerance analysis, one goal has been the developnent of a relatively si~le, yet accurate analytical tool to design aircraft repairs more effectively.
Structural analysis and stress spectrun developnent procedures described in this report are approximate and , therefore, have certain limitations. These procedures might be used to qualitatively compare the quality of different repair options with the original structure.
14. SUBJECT TERMS
SKINFIX, load spectra, static strength, damage tolerance
17. SECURITY CLASSIFICATION 18. SECURITY CLASSIFICATION 19. OF REPORT OF THIS PAGE
Unclassified Unclassified
NSN 7540·01·280·5500
SECURITY CLASSIFICATION OF ABSTRACT
Unclassified
15. NUMBER OF PAGES 154
16. PRICE COOE
20. LIMITATION OF ABSTRACT
Standard Form 298 (Rev. 2·89) Prescribed by ANSI Std. 239·18 298-102

PREFACE
This report describes an effort undertaken by Battelle and funded by the FAA Technical Center
via the Volpe National Transportation Systems Center (VNTSC) to address the influence of fuselage
repairs on the structural integrity of todays aging commercial aircraft.
The authors wish to acknowledge the support of the following VNTSC staff members on this
program- Dr. John Brewer1, Dr. Sam Sampath2, and Ms. Melanie Violette3• In addition, we
acknowledge the efforts of the following Task 4 reviewers- Mr. Tom Swift, Los Angeles Aircraft
Certification Office FAA, Long Beach, California; Dr. Jack Lincoln, ASD/ENFS, Wright Patterson
AFB, Ohio; and Mr. Tom Disney, Marietta, Georgia.
The support of other capable Battelle staff members in the course of this program is also
appreciated. In particular, we would like to acknowledge the efforts of Ms. Leota Alwine on Task 1,
Mr. Ying-Liang Chou on Task 2, Mr. Nu Ghadiali on Task 3, and Messrs. Norm Frey, Michael
Oliver, and David Utz on Task 5.
1 Current VNTSC Technical Task Initiator. 2 Former VNTSC TTl, currently Director, National Aging Aircraft Research Program, FAA
Technical Center, Atlantic City, New Jersey. 3 Former VNTSC Til, currently working toward PhD at RPI.
iii

METRIC/ENGLISH CONVERSION FACTORS
ENGLISH TO METRIC
LENGTH (APPROXIMATE)
1 inch (in.) • 2.5 centimeters (em)
1 foot (ft) • 30 centimeters (em) 1 yard (yd) • 0.9 meter (m) 1 mile (mi) • 1.6 kilometers (km)
AREA (APPROXIMATE)
1 square inch (sq in, in2) • 6.5 square centimeters (cm2) 1 square foot (sq ft. ft2) • 0.09 square meter (m2)
1 SQuare yard (sq yd. yd2) • 0.8 square meter (m2) 1 square mile (sq rna, mi2) • 2.6 square kilometers (km2)
1 acre • 0.4 hectares (he) • 4,000 square meters (m2)
MASS- WEIGHT (APPROXIMATE)
1 ounce (oz) • 28 grams (gr) 1 pound (lb) • .4:i kilogram (kg)
1 short ton • 2,000 pounds (lb) • 0.9 tonne (t)
VOLUME (APPROXIMATE)
1 teaspoon (tsp) • 5 milliliters (ml) 1 tablespoon (tbsp) • 15 milliliters (ml) 1 flu ad ounce (fl oz) • 30 milliliters (ml)
1 cup (c) • 0.24 liter (I) 1 pint (pt) • 0.47 liter (I)
1 quart (Qt) • 0.961iter (I)
1 gallon (gal) • 3.81iters (I) 1 cubic foot (cu ft. ftl) • 0.03 cubic meter (ml)
1 cubic yard (cu yd. yd3) • 0.76 cubic meter (m3)
TEMPERATURE (EXACT)
[ (x- 32)(519)] •f • y-t
METRIC TO ENGLISH
LENGTH (APPROXIMATE)
1 millimeter (mm) • 0.04 inch (in)
1 centi'!'eter (em) • 0.4 inch (in) 1 meter (m) • 3.3 feet (ft) 1 meter (m) • 1.1 yards (yd)
1 kilometer (km) • 0.6 mile (mi)
AREA (APPROXIMATE)
1 square centimeter (cm2) • 0.16 square anch (sq in, in2)
1 SQuare meter (m2) • 1.2 square yards (sq yd. yd2) 1 square kilometer (kn2) • 0.4 square mile (sq ma. mol)
1 hectare (he) • 10,000 square meters (mZ) • 2.5 acres
MASS- WEIGHT (APPROXIMATE)
1 gram (gr) • 0.036 ounce (oz) 1 kilogram (kg) • 2.2 pounds (I b)
1 tonne (t) • 1,000 kalograms (kg) • 1 .1 short tons
VOLUME (APPROXIMATE)
1 milliliter (ml) • 0.03 fluid ounce (fl oz) 1 liter (I) • 2.1 pants (pt) 1 liter (I) • 1.06 quarts (qt) 1 liter (I) • 0.26 gallon (gal)
1 cubic meter (m3) • 36 cuboc feet (cu ft, ft3)
1 cubic meter (m3) • 1.3 cubac yards (cu yd. ydl)
TEMPERATURE (EXACT)
( (915) y + 32)°C • X °F
QUICK INCH-CENTIMETER LENGTH CONVERSION
10 INCHES ,o 1 : : i r r r r r
,~--~--~----~--~----L---~--~----~--~--~ aNTIM£TEAS 0 1 l ] • 5 6 7 I 9 10 11 U 1] 1• 15 16 17 11 19 20 21 22 23 2• 25
QUICK FAHRENHEIT-CELSIUS TEMPERATURE CONVERSION
so• u•
For more exact and or other conversion factors, see NBS Mascellaneous Publication 286, Unats of Weights and Measures. Price S2.50. SO Catalog No. C13 10286.
iv
2UO

TABLE OF CONTENTS
Section ~
EXECUTIVES~Y ............................................. ~
1.0 INTRODUCTION ............................•............... 1-1
2.0 PLANNING AND INDUSTRY COORDINATION ....................... 2-1 2.1 Initial Meetings and Presentations . . . . . . . . . . . . . . . . . . . . . . . . . . . . . . 2-1 2.2 Aging Aircraft Repairs Program Meeting .......................... 2-2 2.3 TOGAA Meeting ........................................ 2-3 2.4 Damage Tolerance Conference . . . . . . . . . . . . . . . . . . . . . . . . . . . . . . . . 2-4 2.5 Airworthiness Assurance Task Force Meeting . . . . . . . . . . . . . . . . . . . . . . . 2-4
3.0 REPAIR DATABASE ASSESSMENT ............................... 3-1 3.1 Acquisition and Setup of the SDR and ARS Databases • • • . . • . • • . . • . . . • . 3-1 3.2 Analysis of SDR and ARS Data ............................... 3-3
4.0 COMPATIBLE-DISPLACEMENT ANALYSIS .......................... 4-1 4.1 Methods of Compatible-Displacement Analysis ...................... 4-1 4.2 The Bidirectional CDA Element ............................... 4-3 4.3 CDA Program SKINFIX .................................... 4-6 4.4 Analysis of Test Specimen ................................... 4-8 4.5 Cracked Panel Strain Contours ........••..................... 4-20
5.0 STANDARDIZED LOAD SPECTRA ...............•................ 5-1 5.1 Fuselage Loading . . . . . . . . . . . . . . . . . . . . . . . . . . . . . . . . . . . . . . . .5-1
5.1.1 Loading Segments .................................. 5-1 5.1.2 Gust Loadings .................................... 5-1 5.1.3 Maneuvers ...................................... 5-4 5.1.4 Basic Fuselage Stress History ........................... 5-4
5.2 The Exceedance Diagram . . . . . . . . . . . . . . . . . . . . . . . . . . . . . . . . . . .5-6 5.2.1 Measured Spectra and the TWIST Standard •................. 5-6 5.2.2 Proposed Spectrum ..........•...................... 5-9
5.3 Stress History Generation ..•............................... 5-10 5.3.1 Stress Levels .................................... 5-10 5.3.2 Different Flight Types ..••.......................... 5-14 5.3.3 Issues of Importance ............................... 5-19
5.4 Fuselage Stresses •...•................•................. 5-19 5.4.1 Approximate Fuselage Stress Analysis .................... 5-20 5.4.2 Limit Load Analysis ............................... 5-24
5.5 Comparison of Proposed Stress History Generation Scheme With Manufacturer's ......•.................................. 5-25
6.0 REPAIRED PANEL TESTING ................................... 6-1 6.1 Specimen and FIXture Designs ................................ 6-1 6.2 Experimental Plan . . . . . . . . . . . . . . . . . . . . . . . . . . . . . . . . . . . . . . . .6-6 6.3 Repair Program Fatigue Experiments ............................ 6-9
v

TABLE OF CONTENTS (Continued)
Section
6.3.1 Baseline Fatigue Experiments ........................... 6-9 6.3.2 Repair Panel Fatigue Experiments ....................... 6-10
6.4 Doubler Strain and Displacement Measurements . . . . . . . . . . . . . . . . . . . . 6-15
7.0 RELIABll.JTY ASSESSMENT .................................... 7-1 7.1 Introduction ........................................... 7-1 7.2 State-of-the-Art Review .................................... 7-2 7.3 Development of the Probabilistic Model .......................... 7-6
7.3.1 Structural Loading Environment ......................... 7-6 7 .3.2 Fatigue Crack Initiation .............................. 7-8 7.3.3 Fatigue Crack Growth .....••...••...•.............. 7-10 7.3.4 Structural Reliability Analysis ......................... 7-13 7.3.5 Inspection Planning and Repair Strategy ................... 7-18
7.4 Numerical Example ...................................... 7-W 7.4.1 Problem Description ............................... 7-W 7.4.2 Reliability Analysis ................................ 7-22
8.0 CONCLUSIONS AND RECOMMENDATIONS ......................... 8-1 8.1 Repair Database Assessment . . . . . . . . . . . . . . . . . . . . . . . . . . . . . . . . . 8-1 8.2 Compatible Displacement Analysis .............................. 8-2 8.3 Standardized Load Spectra ................................... 8-3 8.4 Repaired Panel Testing ..................................... 8-4 8.5 Reliability Assessment ..................................... 8-5
REFERENCES ............................•....•................... R-1
vi

3-1 3-2 3-3 3-4 4-1 4-2 4-3 4-4
4-5 4-6 4-7 4-8 4-9 4-10 4-11 4-12 4-13
4-14
4-15 4-16 4-17 4-18 4-19 5-1 5-2 5-3 5-4 5-5 5-6 5-7 5-8
5-9 5-10 5-11 5-12
5-13
5-14 5-15
LW OF FIGURES
NUMBER OF AIRCRAFf STARTED INTO SERVICE SINCE 1960 ........... 3-12 NUMBER OF SDR'S VERSUS AIRPLANE AGE ....................... 3-14 NUMBER OF SDR'S VERSUS FLIGHT HOURS ....................... 3-15 NUMBER OF SDR'S VERSUS NUMBER OF LANDINGS ..........•...... 3-16 SWIFI' CDA MODEL ........•................................ 4-2 BIDIREC'I10NAL CDA ELEMENT ••.....•........................ 4-4 SKINFIX PROGRAM STRUCTURE ................................ 4-7 COMPATIBLE DISPLACEMENT ANALYSIS MODEL OF TEST SPECIMEN NO. 25 ..................•.............................. A-9 STRAIN GAGE LOCATIONS (SPECIMEN NO. 25) ..................... 4-10 SKIN STRESSES (SPECIMEN NO. 25) .•...••••••.••...•...••.•.... 4-13 DOUBLER STRESSES (SPECIMEN NO. 25) ......................... 4-15 FASTENER SHEAR STRESSES ................................. 4-16 SKIN STRESSES ...........•............................... 4-16 DOUBLER STRESSES ...•................................... 4-17 DOUBLER STRESSES AND RIVET DISPLACEMENTS .................. 4-18 SKIN STRESSES AND RIVET DISPLACEMENTS (SPECIMEN NO. 25) ....... 4-19 EFFECT OF RELATIVE FASTENER STIFFNESS ON FIRST ROW BEARING STRESSES ............................................... 4-21 EFFECT OF RELATIVE FASTENER STIFFNESS ON MAXIMUM BEARING STRESSES ............................................... 4-21 TEST PANEL GEOMEI'RY ......•.........•................... 4-22 FINITE ELEMENT MODEL OF TEST PANEL ........................ 4-22 STRAIN CONTOURS FOR LONGER CRACK ........................ 4-23 STRAIN CONTOURS FOR SHORTER CRACK ...•.................... 4-24 OVERALL CRACKED RIVET HOLE STRAIN CONTOURS •.............. 4-25 COORDINATE SYSTEM ....•...•....••...•.................... 5-2 GUST LOADING DELTA 4L ..••................................ 5-3 MANEUVER LOADING TAKE-OFF ROLL ...•••.•.................. . 5-5 MANEUVER LOADING BANKING IN CURVE ....•..•............... . 5-5 TYPICAL STRESS HISTORIES FOR AIRCRAFf FUSELAGE .•............. 5-7 LOAD SPECTRA PERTAINING TO 40,000 FUGHTS FOR DIFFERENT AIRCRAFf 5-8 STANDARDIZED SPECTRUM FOR 40,000 FLIGHTS TWIST ............... 5-9 PROPOSED SIMPLIFICATION TO STANDARDIZED TWIST SPECTRUM FOR 40,000 FUGHTS •.••.••..•••..••..•..........•............. 5-10 REPAIR SPECTRUM (SEE FIGURE 5.8) IN TERMS OF Nz •.............. 5-11 REPAIR SPECTRUM FOR 6700 HRS (COMPARE TO FIGURE 5.9) .......... 5-11 OBTAINING STRESS LEVELS AND EXCEEDANCES .............•..... 5-12 EFFECT OF LEVELS IN EXCEEDANCE DIAGRAM APPROXIMATION; COMPliTED NUMBER OF HOURS FOR CRACK GROWTH AS A FUNC'I10N OF NUMBER OF LEVELS. ONE LEVEL IS CONSTANT AMPLITUDE ....... 5-13 TURBULENCE, GUSTS, AND CONTINUITY OF AIR UP AND DOWN GUST OF ABOUT EQUAL MAGNITUDE OFTEN OCCUR IN CLOSE SUCCESSION ...... 5-14 REAR (SEMI-RANDOM) AND WRONG (RANDOM) HISTORIES ............ 5-15 STRESS HISTORY WITH DIFFERENT FUGHTS (SEMI RANDOM) .......... 5-17
vii

5-16 5-17 5-18 5-19 5-20
5-21 5-22 5-23 5-24 5-2S 6-1 6-2 6-3 6-4 6-5 6-6 6-7
6-8 6-9 6-10 6-11
6-12
6-13
7-1
7-2 7-3 7-4 7-5 7-6 7-7 7-8
7-9
7-10
7-11 7-12
LIST OF FIGURES (Continued)
FUSELAGE LOADING ....................................... 5-20 FUSELAGE BENDING ....................................... 5-21 FUSELAGE STRESSES ....................................... 5-22 AREAS OVER WIDCH STRESSES ARE ASSUMED THE SAME ............ 5-27 BOEING SPECTRUM: AU FLIGHTS ARE THE SAME, LAST 3 CYCLES ARE MAKE-UP CYCLES ......................................... 5-28 MISSION 3 ALTITUDE PROFILE ................................ 5-29 SHORTENED SPECTRUM, TOUCH AND GOES DELETED ............... 5-30 FLIGHT TYPES, EVERY OCCURRENCE WITH DIFFERENT SEQUENCE ..... 5-33 CRACK GROWfH COMPARISON OF BOEING AND PRESENT SPECTRUM .... 5-35 CRACK GROWfH, PRESENT SPECTRUM FOR AREAS J, K, AND L ........ 5-37 COMMON FUSELAGE DOUBLER DESIGNS ......................... 6-1 TYPE m, DOUBLER SPECIMEN DESIGN ........................... 6-2 SPREADER BAR OR WHIFFLETREE FIXTURE DESIGN ................. 6-3 FINITE ELEMENT ANALYSIS OF 1/4 REPAIR PANEL ................... 6-4 STRAIN UNIFORMITY VERIFICATION SAMPLE ...................... 6-5 UNNOTCHED DOGBONE SPECIMEN DESIGN ........................ 6-7 BASELINE REPAIR SAMPLE WITH UNFILLED AND FILLED COUN'I'ER.SUNK HOLES ...................................... 6-8 REPAIR SAMPLE WITHOUT CUTOUT ............................. 6-8 REPAIR SAMPLE WITH CUTOUT ................................ 6-9 RIVET LOCATION COORDINATE SYSTEM ......................... 6-12 REPAIR PANEL WITH LOCATION OF DISPLACEMENT MEASUREMENTS NOTED ...........................•..................... 6-15 DOUBLER STRESSES AND RIVET DISPLACEMENTS FOR SPECIMEN NO. 2S ......................................... 6-17 SKIN STRESSES AND RIVET DISPLACEMENTS (SPECIMEN NO. 2S) ..•••.••.•.•••.••.•.•.•..•.•...••.•....•......... 6-18 CUMULATIVE PROBABILITY OF DETECTION VERSUS INSPECTION INTERVAL ..•............................................ 7-3 FINITE ELEMENT MODEL OF A LAP JOINT •....•.•................. 7-6 CRACKED HOLE AT A LAP JOINT SUBJECTED TO VARIOUS LOADS ....... 7-7 SCATTERGRAM OF CRACK INITIATION LIFE •...................... 7-9 ADDITIVE DECOMPOSmON OF STRESS INTENSITY FACTOR ........... 7-11 SCATTER IN CRACK GROwm DATA FROM 68 REPUCATE TESTS ........ 7-12 DEFINITION OF BINARY LIMIT STATE IN ORIGINAL SPACE ............ 7-15 LINEAR AND QUADRATIC APPROXIMATIONS OF LIMIT STATE IN GAUSSIAN IMAGE •....•................................... 7-16 EFFECTS OF PERIODIC MAINTENANCE ACTION ON THE CRACK SIZE DENSITY F\JNCTION ....................................... 7-19 PROBABILITY OF FAILURE BY VARIOUS METHODS AS A F\JNCTION OF NUMBER OF CYCLES ....................................... 7-23 EFFECTS OF LOAD VARIABILITY ON FAILURE PROBABILITIES ......... 7-2S EFFECTS OF FRACTILES OF CRACK INITIATION LIFE OF FAILURE PROBABILITIES ............•.............................. 7-2S
viii

LIST OF TABLES
1-1 TASKS AND OBJECTIVES ..................................... 1-1 2-1 COORDINATION ACTIVITIES ................................... 2-1 3-1 SDR DATA TAPE INFORMATION ................................ 3-2 3-2 SDR DATA FOR 737 AIRCRAFT ................................. 3-2 3-3(a) BREAKDOWN OF SDR'S FOR BOEING 727 AIRCRAFT .................. 3-3 3-3(b) BREAKDOWN OF SDR'S FOR BOEING 737 AIRCRAFT .................. 3-4 3-3(c) BREAKDOWN OF SDR'S FOR BOEING 747 AIRCRAFT .................. 3-4 3-3(d) BREAKDOWN OF SDR'S FOR MCDONNELL-DOUGLAS DC-9 AIRCRAFT ..... 3-5 3-4 DC-9 AIRCRAFT WITH SKIN CORROSION OR CRACKING PROBLEMS,
MERGED SDR & ARS DATABASE INFORMATION ..................... 3-6 3-5 SUMMARY OF SIGNIFICANT SDR CITATIONS BY AIRCRAFT MAKE
AND MODEL ............................................. 3-8 3-6 NUMBER OF AIRCRAFT FOR MAJOR UNITED STATES AIRLINES ......... 3-11 4-1 RATIO OF CALCULATED TO MEASURED STRESSES .................. 4-12 5-1 VARIATION IN AIRCRAFT HOOP STRESSES ......................... 5-6 5-2 GENERATION OF STRESS IDSTORY WITH DIFFERENT PERIODS
BASED ON FIGURE 5.15 ..................................... 5-16 6-1 MATRIX OF EXPERIMENTS .................................... 6-6 6-2 SUMMARY OF BASE MATERIAL FATIGUE TEST DATA ................ 6-10 6-3 RESULTS OF TEST ON BASELINE AND TYPE ill REPAIRS .............. 6-11 6-4 FATIGUE UFE STATISTICS FOR REPAIR PANELS TESTED AT A MAXIMUM
STRESS OF 18 KSI, R = 0.10 .................................. 6-14 6-5 RESULTS OF RIVET DISPLACEMENT MEASUREMENTS ON TEST SAMPLE
NO. 18 ................................................. 6-16 7-1 COMPARISONS OF CPU TIME FOR CALCULATION OF FAll..URE
PROBABIIJTIES ........................................... 7-24
ix

AATF ACO AD ARS ASIP AWACS CDA COD CPOD CPU DER DOT DT FAA FEA FEM FORM GAG MCS MSD NACA NASA NDI NLP NLR OEM POD PRA SDR SORM STC TTl TOGAA TWA TWIST VGH VNTSC
LIST OF ABBREVIATIONS
Aging Aircraft Task Force (a.k.a Airworthiness Assurance Task Force) Aircraft Certification Office Airworthiness Directive Aviation Research & Support Aircraft Structural Integrity Program Airborne Warning and Control System Compatible Displacement Analysis Crack Opening Displacement Cumulative Probability of Detection Central Processing Units (Seconds) Designated Engineering Representative Department of Transportation Damage Tolerance Federal Aviation Administration Finite Element Analysis (a.k.a FEM) Finite Element Method (a.k.a. FEA) First Order Reliability Method Ground-Air-Ground Monte Carlo Simulation Multiple Site Damage National Advisory Committee for Aeronautics National Aeronautics and Space Administration Nondestructive Inspection Nonlinear Programming National Aerospace Laboratory (Netherlands) Original Equipment Manufacturer Probability of Detection Probabilistic Risk Assessment Service Difficulty Report Second Order Reliability Method Supplemental Type Certificate Technical Task Initiator (at VNTSC) Technical Oversight Group for Aging Aircraft Trans World Airlines Standardized Spectrum for Transport Aircraft Wing Structures Velocity, Acceleration of Gravity and Altitude Volpe National Transportation Systems Center
X

LISI' OF SYMBOLS
a,b Parameters used in CDA analysis, material dependent 3etr Effective crack length ~ Permissible crack size A Effective strip area in CDA analysis
A, A Ac:,s,d
A at
c c cg CL D and D, Dh d dCL/det E[N0]
E f,s,r E fA(a)
Fa g, G g(X)
G.t h I c:,s,d KA, Ks k
kr L m Mb Mt Dz N No p p
PF r R s Seq
sx,y
Parameters, dependent on aircraft type Effective element areas used in computation of CDA element stiffnesses Area of tear strap Coefficient Element chord length Center of gravity Three dimensional lift coefficient Fastener shank diameter Fastener head diameter Element diagonal length Slope of CL vs. et curve Mathematical expectation operator representing the expected mean value of the random initiation life N0 Elastic moduli of fastener, sheet and reinforcement material Material modulus Probability density after inspection and repair at N 1 cycles Cumulative distribution function Acceleration of gravity Performance function in reliability analysis Gust alleviation factor Element thickness Element moments of inertia Stress intensity factors corresponding to specific loading environments Number of stringers Fastener stiffness Lift load (force), also fastener spacing transverse to loading direction Mass Bending moment Torsional moment Vertical acceleration load factor Number of cycles Number of cycles to crack initiation Fuselage pressure level Fastener load Probability of failure Radius of curvature Fuselage radius Wing area Equivalent stress Average CDA element stresses in x and y directions
XI

LIST OF SYMBOLS (Continued)
s Element side length, also fastener spacing Txy CDA element shear stress t Fuselage skin thickness t..r Thickness of sheet and reinforcement T Tail load (force) v Gust velocity V Airspeed V P Coefficient of variation of fuselage pressure Vt Density of air w Angular velocity W Weight WefT Effective panel width z Z--direction distance a Angle of attack a 1 Constant dependent on stiffening ratio Aa Increment of a Aub1 Range of bending stress AK Stress Intensity Range AL Incremental lift p Density of air u 1 Cyclic stress ub1 Local bending stress ubl-lg lg bending stress uu Limit load stress um Mean stress, membrane stress umax Maximum stress uP Circumferential pressurization stress (hoop stress) uP1 Longitudinal pressurization stress u,ut Total stress u11 One g stationary stress ., Poisson's ratio Tt Shear stress 6 Angle of vector
xii

EXECUTIVE SUI\IMARY
Commercial aircraft operators are required by FAA regulations to repair damaged aircraft
structures. These repairs must be performed in a timely manner to reduce aircraft downtime and loss
of revenue. A guiding principle that has been used for many aircraft structural repairs is to simply
restore the structure to its original (or better) static strength and stiffness.
However, fuselage repairs must withstand significant fatigue loadings and be damage tolerant if
cracks do form in them. It must be understood where cracks are most likely to form so appropriate
inspection procedures can be instituted.
This report describes an effort undertaken by Battelle and funded by the FAA Technical Center
via the Volpe National Transportation Systems Center (VNTSC) to address these issues. Since many
repair stations and airlines do have at least basic computer facilities that can be used for fatigue and
damage tolerance analysis, one goal has been the development of a relatively simple, yet accurate
analytical tool to design aircraft repairs more effectively.
The following significant accomplishments resulted from this study:
• A two dimensional compatible displacement analysis program (SKINFIX) was developed. It calculates skin and doubler stresses as well as rivet displacements within 5 percent accuracy in regions of modest load transfer. This approach was found to be less precise (although generally within 15 percent accuracy) in regions of high load transfer or significant out-of-plane bending.
• Fatigue tests on strain-gaged Type III repair panels were performed, including precise measurements of rivet displacements under load. Deformation and stress redistribution behavior in simulated fuselage doublers were determined. Such data do not exist elsewhere in the public domain.
• SKINFIX can be used to analyze a wide range of typical fuselage skin repairs and produce realistic estimates of rivet loads. These rivet loads can be used to estimate fatigue quality and crack growth behavior.
• A methodology to obtain an approximate stress history for specific locations in an aircraft fuselage was developed. Two methods for estimating nominal fuselage skin stresses were also constructed. The first method was based on static equilibrium requirements and the second was based on a limit load analysis.
• The service difficulty reporting (SDR) database was merged with the Aircraft Utilisation Database. The result was previously unavailable information regarding the service history of particular Boeing 737 aircraft at points in their history when repairs were made.
• A methodology for probabilistic modeling of aged aircraft subject to variable loading conditions, periodic inspection and repair was formulated. One of the first practical problems addressed with this model was the potentially adverse effects of multiple site cracks in a fuselage lap joint.
xiii

1.0 INTRODUCTION
Commercial aircraft operators are required by FAA regulations to repair damaged aircraft
structure. These repairs must be performed in a timely manner to reduce aircraft downtime and loss
of revenue.
A guiding principle for many aircraft structural repairs has been to restore the structure to its
original (or better) static strength and stiffness. However, the repair must also be designed for
adequate fatigue resistance, damage tolerance and inspectability.
Fatigue and damage tolerance (DT) analyses should be based on realistic stress histories which,
in turn, should be derived from realistic load spectra. Therefore, an algorithm for the development of
a stress history should be included in a comprehensive analysis of repairs. Finally, the ramifications
of missed cracks during inspection and repair quality on an aircraft's reliability should be examined.
This research program was initiated with these requirements in mind.
This study of the Effects of Repair on Structural Integrity, as defined by VNTSC and the FAA
Technical Center, included six tasks. These tasks and their major objectives are listed in Table 1-1.
TABLE 1-1. TASKS AND OBJECTIVES
Task Major Objective(s)
Planning and Industry First, identify aircraft industry concerns regarding aircraft Coordination repairs; then communicate results to the industry.
Repair Database Assessment Identify whether existing databases could be used to identify specific repairs that required frequent re-repair; isolate overall trends in aircraft repairs as aircraft age.
Compatible Displacement Develop a simple, accurate analytical tool for estimating Analysis local stresses in fuselage skin repairs.
Standardized Load Spectra Develop a methodology for developing realistic stress histories at specific locations in typical commercial aircraft fuselages.
Repaired Panel Testing Develop laboratory data on, flat-panel simulated fuselage repairs to assess the accuracy of the compatible displacement analysis procedure.
Reliability Assessment Develop an analytical tool that may eventually assess the ramifications of variable inspection accuracy and repair quality on the reliability of a commercial aircraft.
1-1

The major activities in each of these tasks are discussed in this report. Overall conclusions and
recommendations are also provided.
The structural analysis and stress spectrum development procedures described in this report are
approximate and, therefore, have certain limitations. These methods might be used to qualitatively
compare the quality of different repair options with the original structure. If more precise
quantitative analyses are required, more detailed structural analysis and stress results for specific
locations in the aircraft should either be obtained from the origin equipment manufacturer (OEM) or
calculated through the use of sophisticated structural analysis codes such as three dimensional finite
el~ment methods.
1-2

2.0 PLANNING AND INDUSTRY COORDINATION
At the beginning of this program it was understood that the analysis of aircraft repairs was both
complex and controversial. Because of this, considerable effort was expended to make aircraft
industry representatives aware of this research effort and to solicit their inputs regarding the best
directions for the program.
The major coordination activities undertaken in the course of this program are listed in
Table 2-1 below.
TABLE 2-1. COORDINATION ACTIVITIES
Date Principal Individual or Purpose of Visit and/or Presentation Group
2/2/90 Mr. Tom Swift, FAA National Define principal elements of analytical and Resource Specialist for experimental effort Fracture Mechanics and Metallurgy
3/20-22/90 International Symposium on Review program plans with industry and government to Structural Integrity of Aging obtain feedback regarding planned analytical and Airplanes experimental efforts
518190 Aging Aircraft Repairs Discuss plans for the F AANNTSC repair program; Program Representatives learn more about the large aircraft manufacturers
initiative to review and update aircraft repairs
8/8/90 Technical Oversight Group for Present initial program results and near-term program Aging Aircraft (TOGAA) plans to ensure the practical utility of work undertaken
12/4/90 Various airlines and repair Review initial results from the SKINFIX analysis stations program and illustrate (through a computer
demonstration) the potential utility of this program for analysis of fuselage repairs
1122-23/91 Aging Aircraft Task Force Review the derivation of the SKINFIX analysis (AATF) procedure and discuss the current attributes and
limitations of the method; compare predicted repair stresses and displacements with laboratory data
2.1 Initial Meetings and Presentations
The initial coordination visit to Long Beach, California to meet with Mr. Tom Swift, the FAA
National Resource Specialist for Fracture Mechanics and Metallurgy was useful in defining specific
2-1

research objectives. It was agreed that the initial focus would be on fuselage skin repairs and that an
extension of the traditional compatible displacement analysis procedure held promise as a simple, yet
accurate repair analysis tool.
Battelle researchers prepared an overview presentation for the 1990 International Symposium
on Structural Integrity of Aging Airplanes in Atlanta, Georgia. The prese~tation addressed the scope
of this study and included a discussion of the role of repairs in aging aircraft. A program overview
including program schedule and critical milestones was provided, including a discussion of plans and
issues related to each task. Comments and inputs from industry representatives were requested.
2.2 Aging Aircraft Repairs Program Meeting
After the Atlanta presentation, a follow-up meeting was scheduled with several large aircraft
manufacturers. This meeting was held in May, 1990, in Long Beach, California. Representatives
from Douglas Aircraft Company, Boeing Commercial Aircraft, and Lockheed, the FAA Aircraft
Certification Office in Long Beach, the FAA Technical Center and VNTSC attended.
The airframe manufacturers presented an overview of their Aircraft Repairs Program and
defined a timetable for completion of their efforts. They indicated that their efforts had been
underway on an industry-coordinated basis since 1986. Their proposal can be summarized as follows:
• Develop operator usable system to evaluate repairs on aircraft.
• System would establish appropriate course of action for each repair evaluated, including
Inspection program requirements
Normal maintenance
NDI inspection thresholds/repetition rate
Removal limits (if required)
• Evaluation process would not be under an airworthiness directive (AD) - but would involve all aircraft repairs.
• Time frame for completion of evaluation would be under an AD.
• Regulator penalties for substandard repairs or repairs lacking documentation would .nm be assessed.
2-2

Following this presentation, Battelle presented an overview of its repairs program (VNTSC
OMNI Task VA-0013). In regard to the repair database assessment, it was disclosed that Battelle was
using the Service· Difficulty Reponing (SDR) System in conjunction with the Aircraft Utilisation
Database (maintained by Aviation Research & Support Limited in Warks, England) as a means to
determine the location of repeat repairs and potentially troublesome types of repairs. Many factors
influence whether a report is made to the SDR System and the level of detail of the data.
Nonetheless, it was explained that findings from such a database interrogation might well provide
useful indications of trends.
Battelle indicated that the primary focus was on smaller aircraft but that this program might be
applicable to the industry in general. Since manufacturers of large transpon aircraft already had a
common repairs evaluation program underway, it was suggested that Battelle consider investigating
commuter aircraft along the same lines to further the concept of an industry common approach.
To aid in the fuselage stress spectra development effon, Battelle also requested data on fuselage
skin stresses from the large transport manufacturers represented at the meeting. Similar inquiries had
already been made to the National Aeronautic Laboratory of the Netherlands (NLR) and to Deutsche
Airbus. This information was requested to help develop several generic fuselage spectra for testing
simulated aircraft repairs in the laboratory. The industry representatives were reluctant to provide
such information because of the substantial range of fuselage pressurization stresses, variations of
design life goals and other model specific differences, as well as the problems related to releasing
such proprietary data. As a result, Battelle took the initiative to develop an alternative procedure for
estimating fuselage stress spectra (see Section 5 of this repon.)
Several suggestions were made concerning panel testing for repairs. A minimum width of
15 inches was suggested for damage tolerance testing. This recommendation was accepted in
developing the final specimen design for laboratory testing in this program, as discussed in Section 6
of this repon.
2.3 TOGAA Meeting
Since its inception the Technical Oversight Group for Aging Aircraft (TOGAA) has met at
regular intervals to review pertinent research activities and offer recommendations for further work.
In August, 1990, TOGAA met at the FAA Technical Center in Atlantic City, New Jersey.
Participants in various aging aircraft research programs, including Battelle, were invited to present
progress reports.
2-3

At the time of this meeting, the specimen design for fatigue testing of repairs had just been
decided, so no laboratory fatigue data were available. However, virtually all of the work associated
with the repair database assessment was completed. The results of this effort were reviewed.
Considerable progress had also been made on the formulation of the compatible displacement analysis
methodology, so an overview of this work was also presented. An overview of plans for the
remainder of the program was offered.
2.4 Damage Tolerance Conference
In October 1990, Battelle was contacted by the New York City Certification Office of the
FAA. Several individuals within that office were interested in learning more about this program and
its potential long range utility to airlines and repair stations. Arrangements were made to hold a
workshop at Kennedy Airport on December 4, 1990. The workshop evolved into a one day Damage
Tolerance Symposium with 29 participants.
Presentations were made by Messrs. Tom Swift and Dick Johnson of the FAA, Dr. Pin Tong
of VNTSC, Messrs. Walter Winkler and Paul Sawhny of Pan Am, Mr. Michael Lai of Federal
Express, and Mr. Richard Rice of Battelle. The presentation by Battelle on the Effects of Repair on
Structural Integrity was the central presentation of the symposium.
2.5 Airworthiness Assurance Task Force Meeting
Shortly after the Aloha B737 incident in April, 1988, the Airworthiness Assurance Task Force
(also known as the Aging Aircraft Task Force) was set up by the Air Transport Association of
America and the Aerospace Industries Association. Various technical experts representing airlines,
aircraft manufacturers, international organizations and regulatory bodies comprise this group.
Members of the steering committee agreed to periodic meetings to review aircraft airworthiness issues
and research. One of those meetings was scheduled at VNTSC for January 22 - 23, 1991. Battelle
gave a presentation on the work accomplished on the Structural Integrity of Repairs Program.
With the exception of the reliability assessment work, which was initiated later in 1991, the
majority of the significant, approved technical activity on this program was accomplished by the time
of this meeting. The first generation of the new compatible displacement analysis model was
completed, all of the laboratory testing was finished, and all of the repair database assessment work
was done. A detailed presentation of the overall program was made.
2-4

3.0 REPAIR DATABASE ASSESSMENT
The primary objective of this task was to identify whether cenain types of repairs were more
likely to require subsequent re-repair than others. A secondary objective was to identify significant
trends within the commercial aging aircraft fleet regarding the incidence of fatigue and corrosion
damage.
Representative findings from key database searches are included in the following paragraphs.
Complete copies of the mini-databases that were generated were previously supplied to
VNTSC[1] 1• The entire SDR database (over 200 megabytes of information on three magnetic
tapes representing over 150,000 SDR reports) was also provided.
3.1 Acquisition and Setup of the SDR and ARS Databases
At the beginning of February 1990, Sam Smith and Richard Rice of Battelle visited the
Aviation Standards National Field Office in Oklahoma City, Oklahoma along with Dr. Sam Sampath.
The following individuals from the FRA discussed the attributes of the service difficulty reponing
(SDR) system:
Cheryl Walker, AVN-121B
Jack Price, AVN-124
Jean Fossett, AVN-121B
Oscar Ball, AVN-112
Donald Schein, AVN-124. Jim McLean, AVN-143
After this meeting, Dr. Sam Sampath of VNTSC sent a letter to Mr. Mark Rosenthal,
APR-300 at the Federal Aviation Administration Headquarters in Washington, D.C. requesting release
of the complete SDR database to Battelle. Several weeks later Battelle received the complete database
from Boeing Computer Services on three magnetic tapes.
These tapes were referred to as follows:
• On-line:
• History:
Data which is currently on-line in the SDR system
Data which is stored off-line but is in the same format as the "online" data
Numbers in brackets refer to References listed at the end of this repon.
3-1

• Old History: Data which is stored off-line and has a slightly different format from the .. on-line" data.
TABLE 3-1. SDR DATA TAPE INFORMATION
Total Reduced Number of Reports Megabytes of Data Megabytes of Data
Tape Name Time Period
On-line 1984-1990 83,918 116 42
History 1980-83 30,377 45 15
Old History 1973-79 41,093 39 13
TOTAL 1973-1990 155,388 200 70
The information contained on the tapes is described in Table 3-1. The .. total megabytes"
column gives the approximate storage requirements for the entire set of 92 SDR variables.
The SDR variable list was examined to determine which of the 92 variables were essential to
this study. It was determined that 33 of the SDR variables were necessary. The remaining
59 variables could be derived from these 33 accessed or through the use of look-up tables. The
"reduced megabytes" column of Table 3-1 gives the approximate storage requirements for the
essential set of 33 SDR variables.
The next step in the database assessment process was to break down the SDR data into
individual datasets for particular aircraft models. Initially, this process was completed for a single
aircraft model, the Boeing 737, in order to create a dataset for exploratory analyses. Table 3-2 is a
summary description of the B737 dataset.
TABLE 3-2. SDR DATA FOR 737 AIRCRAFI'
Total Reduced Number of Megabytes of Megabytes of
Tape Name Time Period Reports Data Data
On-line 1984-1990 9,533 13.2 4.5
History 1980-1983 3,663 5.4 1.8
Old History 1973-1979 2,241 2.1 0.7
TOTAL 1973-1990 15,437 20.7 7.0
3-2
On April 9, 1990, VNTSC sent to Battelle a copy of the Aircraft Utilisation Database
developed and maintained by Aviation Research & Support in Warks, England. The Department of
Transportation purchased a license to this database and loaned the manuals and database to Battelle for
use on this task. In April the SDR and ARS databases were loaded onto one of Battelle's VAX
computers and several different merges of these databases were accomplished.
Appendix A of Reference [1] provided a sampling of selected fields from the SDR database for
several B727 aircraft. These records included only skin-related SDR incidents where the pan
condition was identified as either corroded or cracked. It was obvious from this sampling that
individual aircraft were tracked principally by tail number and aircraft model. Inconsistencies in the
part location description hampered attempts to perform automated searches for problems at specific
part locations within a given aircraft make and model. Similar samplings were provided in
Appendices B through D of Reference [ 1] for B737, B747, and DC-9 aircraft.
Appendix E of Reference [ 1] provided a sampling from the ARS database. This database
provided more information than the SDR database concerning operator and service history.
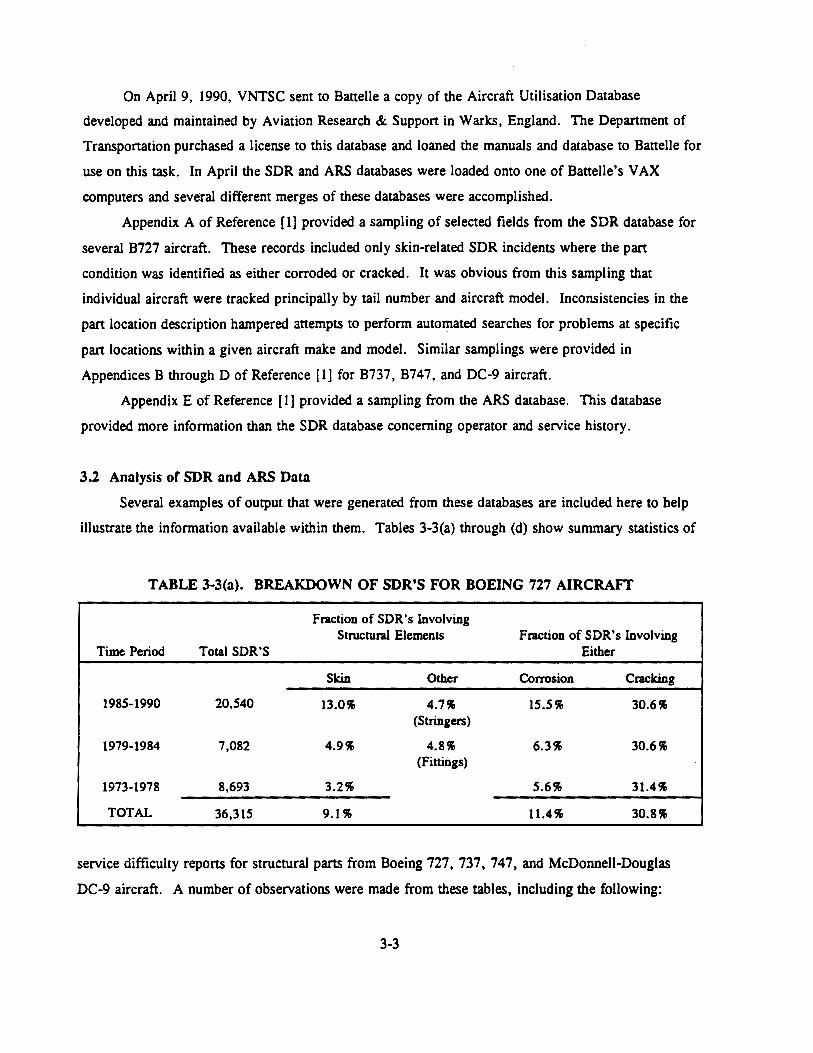
3.2 Analysis of SDR and ARS Data
Several examples of output that were generated from these databases are included here to help
illustrate the information available within them. Tables 3-3(a) through (d) show summary statistics of
TABLE 3-3(a). BREAKDOWN OF SDR'S FOR BOEING 727 AIRCRAFT
Fraction of SDR's Involving Structural Elements Fraction of SDR's Involving
Time Period Total SDR'S Either
Skin Other Corrosion Cracking
1985-1990 20,540 13.0% 4.7% 15.5% 30.6% (Stringers)
1979-1984 7,082 4.9% 4.8% 6.3% 30.6% (Fittings)
1973-1978 8,693 3.2% 5.6% 31.4%
TOTAL 36,315 9.1% 11.4% 30.8%
service difficulty reports for structural parts from Boeing 727, 737, 747, and McDonnell-Douglas
DC-9 aircraft. A number of observations were made from these tables, including the following:
3-3

TABLE 3-3(b). BREAKDOWN OF SDR'S FOR BOEING 737 AIRCRAFT
Fraction of SDR's Involving Structural Elements Fraction of SDR's Involving
Time Period Total SDR'S Either
Skin Other Corrosion Cracking
1985-1990 9,533 17.1~ 14.2~ 35.5~
1979-1984 3,663 9.8~ 4.3~ 20.2~ 39.0~
(Frames) 3~
(Fittings)
1973-1978 2,241 3.4~ 3% 7.4% 31.0% (Doors) 2.5%
(Frames)
TOTAL 15,437 13.4% 14.7% 35.7%
TABLE 3-3(c). BREAKDOWN OF SDR'S FOR BOEING 747 AIRCRAFT
Fraction of SDR's Involving Structural Elements Fraction of SDR's Involving
Time Period Total SDR'S Either
Skin Other Corrosion Cracking
1985-1990 20,540 13.0% 4.7~ 15.5% 30.6% (Stringers)
1985-1990 4,110 8.8% 7.1% 16.5~ 37.5~
(Fittings)
1979-1984 1,411 9.4% 6% 7.6% 45.4% (Fittings)
1973-1978 1,415 3.5~ 5.2% 5.0~ 21.6% (Fittings)
TOTAL 6,936 7.8·% 12.4% 35.9%
3-4

• The total number of SDR citations have increased in all cases in recent years. This is partially attributable to a larger number of aircraft in each category, but may also be a reflection of effects of their increasing age.
• The percentage of SDR incidents that are fuselage skin-related have increased in recent years.
• The number and percentage of structural parts suffering from corrosion-related damage have increased substantially in recent years.
• The percentage of structural parts causing an SDR report because of cracking incidents has been substantial for years. The percentages shown in Tables 3-3(a) through (d) under part condition are for all parts, not just structural parts.
• The percentage of frame and longeron related incidents relative to skin incidents tends to be higher for aircraft that have lower skin stresses due to pressurization.
Table 3-4 provides an example of an SDR/ARS merge in which SDR data (first 6 columns)
were combined with ARS derived information {last 4 columns). Output such as this could not be
produced by interrogating either database independently. With this merged database it was possible to
TABLE 3-3(d). BREAKDOWN OF SDR'S FOR MCDONNELL-DOUGLAS DC-9 AIRCRAFT
Fraction of SDR's Involving Structural Elements Fraction of SDR's Involving
Time Period Total SDR'S Either
Skin Other Corrosion Cracking
1985-1990 13,945 7.1% 6.4% 8.7% 31.9% (Longerons)
1979-1984 5,637 4.9% 3.7% 5.2% 48.4% (Frames)
5.7% (Fittings) (Fittings)
1973-1978 6,546 4.1% 3.0% 7.6% 48.1% (Frames)
6.8% (Fittings)
4.0% (Longerons)
TOTAL 26,128 5.9% 7.7% 39.5%
3-5

TABLE 3-4. DC-9 AIRCRAFT WITH SKIN CORROSION OR CRACKING PROBLEMS, MERGED SDR AND ARS DATABASE INFORMATION
Aircraft Serial Aircraft SDR Part Operator Estimated Estimated Estimated Number Model Date Part Name Part Location Condition Code Age Flight HPS Landings
DC914 80-01-14 Skin STA SSS Cracked EALA • • • DC91S 82-06-21 Skin FSTA 884 Cracked EMAA • • •
87-08-14 Skin STA 756-176 Corroded lWAA • • • DC931 84-11-13 Skin Right Wing Cracked OZAA • • •
17316 DC931 89-12-22 Skin Station 756 Cracked CALA • • • 19674 DC932 89-0S-19 Skin Above Pylon Cracked lWAA • • •
45316 DC931 80-06-30 Skin STA 756 Corrosion TXIA • • • ~
145695 DC914 74-11-04 Skin STA 738 and 718 Corroded TXt 9 22720 27698 ~
75-03-12 Skin Station 200 Corroded TXt 10 23532 28687
71-04-0S Skin Station 859 Cracked TXt 12 28319 34524
79-06-14 Skin S2SL STA 817 Corrosion TXt 14 33392 40708
80-02-22 Skin Station 817 Corrosion TXI IS 34997 42664
81-12-22 Skin Panel STA 170 DR Frame Cracked TXIA 16 39239 47835
82-06-29 Skin STA 755 766 Corroded TXIA 17 40437 49296
88-11-25 Skin FS 710 Cracked SWXA 23 55282 67393
45696 DC914 87-02-02 Skin STA 817 Corroded MWEA 20 45680 49189
87-02-02 Skin STA 439 Corroded MWEA 20 45680 49189
87-02-02 Skin STA 766-801 Corroded MWEA 20 45680 49189
89-0S-26 Skin Stations 171-184 Cracked MWEA 22 50819 54722
89-0S-26 Skin Station 106 Cracked MWEA 22 40819 54722
89-08-25 Skin WS XRS 215 Cracked MWEA 23 51373 55319
89-08-25 Skin Cracked MWEA 23 51373 55319

make meaningful comparisons between SDR trends and aircraft service history. This capability to
link service history and owner history directly with incidents of service difficulty is believed to have
been unique at the time.
Initial SDR analysis results were presented at a meeting in Long Beach on May 8, 1990. At
this meeting it was generally agreed that many factors have influenced whether an SDR report was
made and its level of detail. Nonetheless, findings from such a database interrogation can provide
useful indicators of trends.
Based on this meeting, a decision was made to perform a survey of the SDR database to get a
better idea of what aircraft were represented and to better identify which ones showed substantial
SDR activity, especially in terms of skin-related problems. This information is summarized in
Table 3-5.
As a rudimentary method of sorting the various makes and models of aircraft in terms of their
SDR .. criticality", two criteria were developed and all aircraft categories were compared against these
two criteria. The first criterion was based on the ratio of total SDR reports compared with the
number of aircraft within a category. Criterion 1 was set at a ratio of 10 or greater. A brief scan of
Table 3-5 reveals that relatively few aircraft show an average of more than 10 SDR reports per
aircraft.
The. second criterion was based on the percentage of SDR incidents that involved skin damage,
suggesting the need for doubler repairs like those addressed in this program. Criterion 2 was set at
5 percent or greater. Again, relatively few aircraft showed a high percentage of skin-related
problems. Many of these aircraft types were also the ones that satisfied Criterion 1.
Overall, the aircraft models that appeared to represent the highest level of SDR criticality were
those that represented the mainline, older commercial transport aircraft models. This finding was not
particularly surprising considering that the evaluation criteria did not take into account aircraft age or
size, both of which could reasonably be expected to influence the average number and type of SDR
incidents.
Table 3-6 shows the cross-section of active aircraft within the commercial fleet among the older
McDonnell Douglas and Boeing aircraft models. Of the six models included, approximately
70 percent of these aircraft are flown by the top ten operators. If DC-8's are excluded, the
percentage of the remaining five aircraft models flown by the top ten operators moves up to almost
75 percent.
3-7

Aircraft Make Code
AEROSP
AIRBUS
AMD
BAC
BAG
BEECH
BELL
BOEING
BRAERO
CASA
CESSNA
CNDAIR
CURTIS
TABLE 3-5. SUMMARY OF SIGNIFICANT SDR CITATIONS BY AIRCRAFT MAKE AND MODEL
All types of Damage Skin Related Damage
Aircraft Model Number of Number Number of Number Different of SDR's Different of SDR's Aircraft Aircraft
262NORD 60 402 1 1 ATR42 81 245 1 1
A300 195 974 12 13 A310 30 66 0 0 A320 11 26 0 0
FALCON 10 83 199 1 1 FALCON 20 202 1007 12 12 FALCON SO 45 72 1 1
111 166 2074 so 172 146 71 450 4 7
BAE146 53 261 7 11 JETSTM 160 1837 0 0
1900 131 1302 8 10 300 52 535 7 8
214 38 315 1 2
707 542 6813 163 453 720 70 454 13 18 727 2364 36315 774 3294 737 1097 15437 257 2069 747 381 6935 134 543 757 130 667 16 16 767 123 635 7 9
DH125 200 427 5 5
C212 55 326 2 2
650 94 245 1 1
CL44 10 97 0 0 CL600 85 417 1 2
C46 58 139 0 0
1 Ratio of SDR's to number of aircraft exceeds 10 for all types of damage. 2 More than 5 percent of all SDR's are related to skin damage.
3-8
Exceeds Criteria 11 22
• •
•
• •
• •
• • • • • •

Aircraft Make Code
CVAC
DHAV
DORNER
DOUG
EMB
FOKKER
FRCHLD
GRUMAN
GRUMAV
GULSTM
HAMFLU
HWKSLY
TABLE 3-S. SUMMARY OF SIGNIFICANT SDR CITATIONS BY AIRCRAFf MAKE AND MODEL (CONTINUED)
All types of Damage Skin Related Damage
Number of Number Number of Number Aircraft Model Different ofSDR's Different of SDR's
Aircraft Aircraft
22 11 15 1 1 240 30 64 0 0 30 21 158 3 4
340 56 166 6 7 440 46 236 6 9 580 174 5387 99 437 600 37 606 15 25 640 46 470 8 16
DHC7 1167 1167 11 26 DHC8 806 806 13 28
D0228 48 185 1 1
DC3 209 376 5 7 DC4 20 26 0 0 DC6 141 607 16 31 DC7 15 26 1 1 DC8 704 6785 180 402 DC9 1465 26174 493 1532 DC10 337 4423 83 152
120 174 1075 1 1
F27 76 881 9 33 F28 72 868 32 70
F27 114 886 10 13 FH227 74 1075 4 4
SA16 9 15 0 0
G159 21 22 0 0
01159 432 1669 13 13
HFB320 12 21 1 1
DH125 82 146 3 5
1 Ratio of SDR's to number of aircraft exceeds 10 for all types of damage. 2 More than 5 percent of all SDR's are related to skin damage.
3-9
Exceeds Criteria 1' 22
... ...
...
...
...
...
... ... ... ...
...
... ...
...

Aircraft
TABLE 3-5. SUMMARY OF SIGNIFICANT SDR CITATIONS BY AIRCRAFT MAKE AND MODEL (CONCLUDED)
All types of Damage Skin Related Damage
Number of Number Number of Number Aircraft Model Different of SDR's Different of SDR's
Exceeds Criteria
Make Code Aircraft Aircraft 11 22
ISRAEL 1121 108 1245 11 11 • 1123 25 15 0 0 1124 116 409 3 4
KAWSK.I KV107 11 51 0 0
LEAR 24 260 554 8 11 25 312 156 5 6 35 381 893 3 3 55 64 140 17 21
LKHEED lOll 344 4203 74 133 • 1329 121 289 4 4 188 222 2916 26 46 • 382 96 2190 10 27 •
MARTIN 404 28 104 1 1
MTSBSI MU300 44 66 0 0
NIH ON YSll 97 708 4 5
RKWELL NA265 384 2411 17 43
SAAB SF340 147 151 1 1
SKRSKY S58 24 39 1 1 S58T 30 10 1 2 S61 30 221 1 1
SNIAS SA330 17 144 0 0
STBROS SD3 281 3179 9 11 • VICKER 745 17 71 0 0
1 Ratio of SDR's to number of aircraft exceeds 10 for all types of damage. 2 More than 5 percent of all SDR's are related to skin damage.
Figures 3-l(a) and (b) show when these aircraft models were introduced into service. This
figure rather dramatically illustrates the large percentage of B727 and DC-9 aircraft between 20 and
25 years old and the great percentage of B747 and DC-10 aircraft between 15 and 20 years old.
•
Two additional issues were also explored in the SDR database. First, an attempt was made to
find evidence within the SDR database that repairs were being made in accordance with specific SRM
3-10

TABLE 3-6. NUMBER OF AIRCRAFT FOR MAJOR UNITED STATES AIRLINES
OP(OPERATOR) TYPE (MODEL)
Frequency B727 B737 B747 DC10 DC8 DC9 Total
UNITED 144 148 33 55 27 0 407
US AIR 44 208 0 0 0 74 326
NORTHWEST 71 0 45 20 0 140 276
CONTINENTAL 94 97 8 15 0 40 254
DELTA 130 74 0 0 0 36 240
AMERICAN 164 12 2 59 0 0 237
FEDERAL EXP 114 0 0 25 6 0 145
TWA 69 0 19 0 0 48 136
PAN AM 89 5 37 0 0 0 131
EASTERN 55 0 0 2 0 73 130
OTHERS 259 261 43 69 178 175 985
Total 1233 805 187 245 211 586 3267
SOURCE: AIRCRAFT UTILISATION DATABASE, AVIATION RESEARCH&. SUPPORT, ENGLAND
recommendations. Second, the SDR database was examined to determine whether there was any
evidence of the need for additional repairs in the vicinity of these repairs, or the need for re-repair of
these .. sanctioned" repairs.
It was found in general that SRM's were cited in an SDR repon in the comment fields, if at
all. Rather than attempting text-string searches for specific SRM designations, panial listings of the
comment fields were developed for DC-9 and B737 aircraft (as shown in Appendices F and G of
Reference [1], respectively). Based on a review of comment fields for about 50 DC-9 aircraft (out of
493 represented in the database) and 50 B737 aircraft (out of 257) the following observations were
made:
• A number of cases where the same SDR is cited twice for the same aircraft represents a single repair. In these cases the first entry is simply a notice of observed damage. The second entry (which usually occurs days later) is a recording of the actual repair.
• Within our limited sampling, some type of repair designation was given about 1/4 of the time for DC-9 aircraft and about 1/2 of the time for B737 aircraft. All other cases did not provide a reference number that might provide further details on the nature of the
3-11

--2 I:! <i 0 t
1 z
140r-------------------------~----------------~
o·-
~, I\ I \ I \ I \ ' ' . : ' ~ I I \
I I \ I l, I I I I I .
• J II /h.. i'
/: \i! .. _... I •· .
.•• •• J I \
1970
Year
-·······-··· 707 727
----- 7'37 --··-- 747
, ... , I \ ' \ ' \ I \
' \ ,.J \ I \
I I I I
I" I \1 .,
1980 1990
SOUitCE: AillCltAFr Ul1I.lSA TION OAT ABASE
(a) Boeing Aircraft 140r-------------------------------------------~
---··--- oc-e ---- DC-9 ----- DC-10
1970 1990
Year
SOUltCE: AillCitAFr triU.JaATION DATABASE
(b) McDonnell-Douglas Aircraft
FIGURE 3-1. NUMBER OF AIRCRAFI' STARTED INTO SERVICE SINCE 1960
3-12

repair. In general, the exact type of repair made is not stated explicitly within the comment field.
• In about 15 percent of the cases where an SRM number is cited, the repair is described specifically by including a page number or figure number along with the SRM number. In all other cases the SRM number that is specified only identifies a general class of repairs.
• Other numbering systems appear in the comment fields, which apparently represent repairs from other manuals or simply orders for repairs.
• In most cases, the location of the repair is defined only by the fuselage station. In less than half of these cases the location is further specified by longeron number.
Although the information provided in the SDR database alone may have limited usefulness in
identifying problematic repairs or trouble spots in aircraft, it can provide meaningful global trends
concerning the incidence of aircraft structural problems and associated repairs when combined with
the Aircraft Utilisation Database. For example, a simple interrogation of the SDR database in
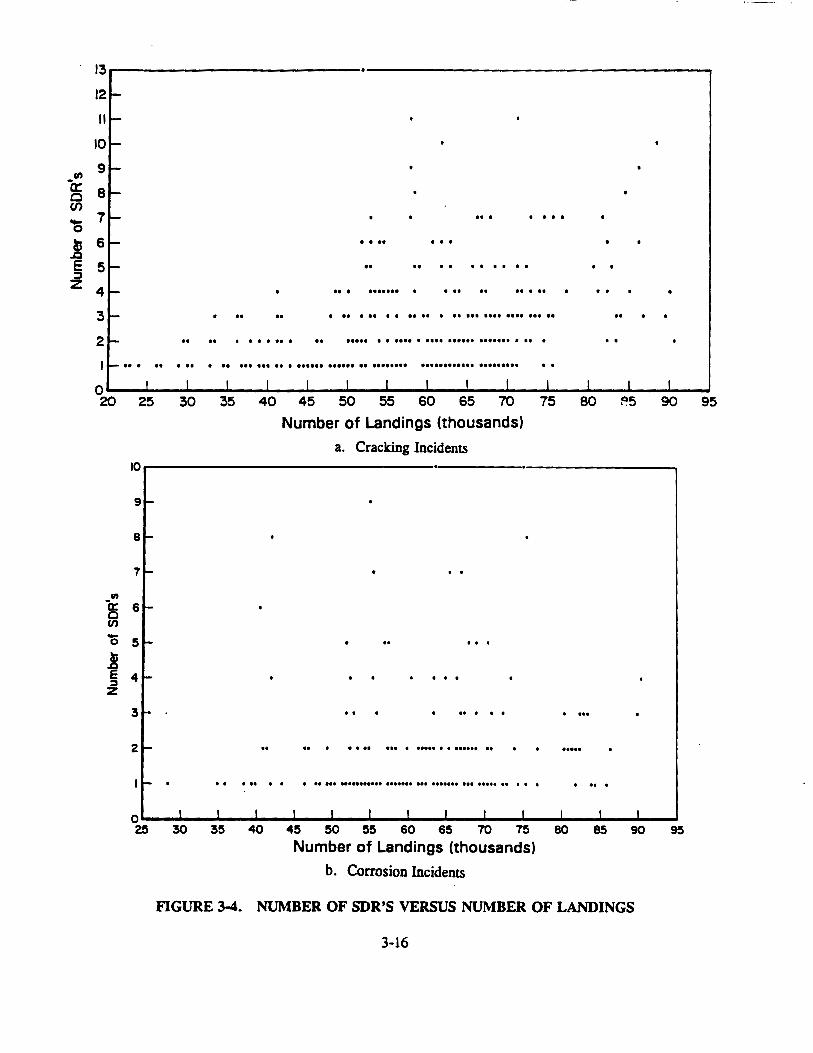
combination with the Aircraft Utilisation Database allowed the development of Figures 3-2 through
3.4 for three airlines flying DC-9 aircraft. In these figures, the relationship between aircraft age,
flight hours and aircraft landings with the number of cracking and/or corrosion-related SDR's is
evident: Each data point represents the total number to date of SDR 's of a certain type for a single
aircraft as of the last update of the database. In any case, little SDR activity would be expected until
an aircraft is at least 10 years old. After the aircraft reaches an age of about 20 years, the number of
cracking and corrosion incidents could be expected to go up rather dramatically. The number of
incidents of corrosion is less well correlated with flight hours, and even more poorly correlated with
aircraft landings. An examination of these trends against specific airlines did not reveal significantly
different trends.
These results show a dramatic increase in the number of repair incidents as an aircraft's age
exceeds 15 to 20 years. An obvious conclusion is that repairs to aging aircraft will likely increase in
the U.S. commercial fleet unless a large percentage of these older aircraft are retired in the next few
years.
The utility of the SDR system could be enhanced by introducing greater standardization in
reponing requirements and introducing more required fields, especially fields that would specify the
exact type and location of damage and the specific type of repair.
3-13

en -a: 0 (/) -0 ... cu
.£:)
E ::I z
., -a: 0 (/)
0
13
12 -IP- . .
10 -91-
8 1- ••
7 1- . . •••• 0 •
6 1- •••• • •
5 1- . ... .. . .. 4 1- • • • ••••••••••• • •
3 1- .. . . .. . ............ ... . 2- • • • • •• •• • • . . . ........................ . -· •• . . . .. .. . .... .................. .... . .
0 I I I I I I I I 8 10 12 14 16 18 20 22 24 26
Age, years
a. Cracking Incidents
lOr------------------------------------------------------------,
..
. .. . . . ..................... .
.. . .. . .......................... . 13 14 15 16 18 26
Age, years
b. Corrosion Incidents
FIGURE 3-2. NUMBER OF SDR'S VERSUS AIRPLANE AGE
3-14

13
121-
II-
10 1-
91-Cit -a:: 8'-0
VJ 71-
'0 .... . ...
.! 6 1-
E 5 1- .. . . ....... ::1 z 41- ...... . ...... . ... . ..
3- . .... . .............. .. . 21- . . .. . .............. . ..........................
H- .... . .. . ..... . . .... . ....... . ................. . ......... . I I I 0 ' I I I I I
15 20 25 30 35 40 45 50 55 60 65 Flight Hours (thousands)
a. Cracking Incidents
10 ·---· 9-
Sf-
7f-
Cit -a:: 6 f-0 VJ
'0 5f-... .! E 4 1-~
31-
2- . . ......... . .......... . It- .. . .. . ... . ............................
0 I I I ' ' ' ' I I
15 20 25 30 35 40 45 50 55 60 65
Flight Hours (thousands)
b. Corrosion Incidents
FIGURE 3-3. NUMBER OF SDR'S VERSUS FLIGHT HOURS
3-15
U)
-a: c (/') -0
t .c E :J z
13
12 f-
II~
10 f-
9 ~
8 -7 - •• • • •••
6 - • • •• • ••
5 ~ •• •• . . . . . . . . 4 r- •• • • •••••• • •• •• ..... . . 3 f- •• •• • •• • •• • • •• •• • •••••••••••••••••• • •
2 ...... •• •• . . ..... •• ..... . . .... . .... ...... ....... . .. . • •
I - •• • •• . .. • .. ••••••••••••••••••••••••••••••• . .................... . . 0 20
en 0:: c V) -0
~ E ;::, z
I I I I I I I I I I I I I I
25 30 35 40 45 50 55 60 65 70 75 eo ~5 90
Number of Landings (thousands)
a. Cracking Incidents 10
9r
8f-
7r-
6-
5 r-
4 r . . . 3-- .. .. . . . . . .. 2 - .. . . .. ... . ..... . . ...... . . . .... lr 0 . .. . . . .. ... ........... ....... ... ....... ... ..... .. . . . .. . O~~~~~l--~L--_.! ___ ._t __ J~--~~~~--~~--~1--_.t ___ ._t __ ._l~ ~ ~ ~ ~ ~ ~ ~ ~ e ro ~ ~ M oo
Number of Landings (thousands)
b. Corrosion Incidents
FIGURE 3-4. NUMBER OF SDR'S VERSUS NUMBER OF LANDINGS
3-16
95
95

4.0 COMPATIBLE DISPLACEMENT ANALYSIS
At present, aircraft repairs are often designed on the basis of static strength. In order to assure
a damage-tolerant repair, it is necessary to perform engineering calculations at a sufficient level of
detail to identify the most fatigue-critical locations in a proposed repair and evaluate its effect on
structural fatigue life. Accurate fatigue life estimates require calculating the fastener loads and skin
or reinforcement member stresses in a highly redundant structure. One means of accomplishing this
is to perform finite element analysis (FEA) of the repair. FEA requires sufficiently capable
commercial software, supponing hardware, and knowledgeable staff to correctly implement and
interpret the analyses. These facilities and skills may not be available at small aircraft repair
facilities. An alternative approach is to perform a .. displacement-compatibility" analysis, in which
equations are written for the displacements of the loaded sheet and doubler elements and made
.. compatible" by accounting for fastener displacements. This still results in a matrix of linear
equations, which must be solved numerically (on a computer), but this approach potentially requires
less sophisticated computational resources than a typical FEA analysis. One relatively sophisticated
approach to compatible-displacement analysis was explored in this program[2].
4.1 Methods of Compatible-Displacement Analysis
Compatible-displacement analysis (CDA) involves writing equations for the displacements of
the skin, all reinforcing members (in this context, one or more thin plates), which are mechanically
fastened to the skin, and the fasteners, in terms of the unknown fastener loads. This system of
equations is solved to obtain the unknown fastener loads and displacements and, subsequently, stresses
in the repaired skin and reinforcement. The process of writing and solving equations for
displacements in terms of forces is also inherent in finite element analysis. FEA differs from CDA,
however, in that the behavior of the continuous structure is modeled with an assembly of discrete
elements, the fundamental behavior of which are chosen such that the behavior of the actual structure
is approached as the elements are reduced in size and increased in number. Hence, solution accuracy
is dependent upon mesh refinement relative to stress gradients and the numerical integration order of
the element formulation. CDA relies on the explicit expression of the structure's behavior or, at the
very least, on a discrete element behavior that is representative of the macroresponse of the structure.
4-1

Vlieger and Sanderse[3] developed a computer code to evaluate the residual strength of a
uniformly loaded continuous sheet, reinforced with fastened stringers oriented in the direction of
loading and containing a central crack. Equations for sheet displacement at the fastener locations
were written from elasticity solutions for uniformly stressed and point-loaded membranes, and then
fastener loads were determined by equating the sheet displacements to the stiffener displacements.
The fasteners were considered rigid, although they could also have been treated as flexible. Vlieger
and Sanderse's method represented a sophisticated approach with the advantage of accounting for
local sheet displacements around fasteners and cracks. However, the approach did not appear to be
readily implementable to general repair configurations which might include arbitrary openings in the
skin, complex reinforcement geometries, and nonuniform loading.
At the opposite end of the spectrum of technical rigor, Swift[4] developed a highly
simplified approach in which the sheet and reinforcement was reduced to a uniaxial extensional strip
(After Swift)
FIGURE 4-1. SWIFT CDA MODEL
equal in width to the fastener spacing transverse to the direction of loading, as in Figure 4-1. The
sheet and reinforcement(s) were individually modeled as discrete axial spring members with stiffness
4-2

expressed as AEIL, where A was the product of width and thickness of the strip of sheet or
reinforcement, E was the material modulus, and L was the fastener spacing in the direction of
loading. The fasteners were modeled as shear springs connecting the sheet and reinforcements. The
fastener stiffness values were estimated empirically from double-lap shear tests[5]. This scheme
has the advantages of simplicity and of empirically accounting for local fastener-plate interactions.
However, it does not adequately address the in-plane shear load transfer and biaxial stresses that
result in and around a wide sheet having a finite-width reinforcement.
It was decided (within the constraints of the repairs program scope and with the concurrence of
the VNTSC ITI), that the best approach would be to apply the Swift model, expanded as a
bidirectional spring member, thereby simultaneously improving the CDA element's accuracy and
general applicability.
4.2 The Bidirectional CDA Element
Expanding Swift's approach to two dimensions resulted in spring-like discrete members
connecting fasteners in both principal axes, each with axial and shear stiffness terms. However, to
adequately model the membrane behavior of a plate, in-plane diagonal coupling between fasteners was
also required, as defined in Figure 4-2. In this application, the side and chord members possess both
axial and bending propenies and the diagonals are trusses (with axial propenies only). For an
isotropic rectangular plate element of thickness h, side length s, chord length c, diagonal length d,
and Poisson's ratio P[6],
A = h(s2 - vc 2
)
c 2s (1 - v2) (4-la)
(4-lb)
(4-lc)
4-3

v
Beam member
ITJ
· Truss member
3
FIGURE 4-2. BIDIRECTIONAL CDA ELEMENT
hsc 2 (1 - 3v) --
Ic 24 =
1 - v2
(4-2a)
hcs2 (1 - 3v) -
I = 24 I
1 - v2
(4-2b)
Id = 0 (4-2c)
The axial stiffness of each member is then AEIL, and the in-plane bending stiffness is 12EIIL3. The
member properties of an irregular quadrilateral can be approximated, within undefmed limits, with
averaged side and chord dimensions. Since modeling each segment of the sheet and reinforcement
between individual groups of fasteners, or between fasteners and member boundaries by six individual
members would be a serious nuisance, a stiffness matrix representing the combined stiffness of all six
members is automatically assembled by the program.

where
The fastener stiffness is an empirical expression derived from double-lap shear tests<S>,
1 = kr
kr = fastener stiffness,
D = fastener diameter,
Er•s•r = elastic moduli of fastener, sheet, and reinforcement material,
t.•r = thickness of sheet and reinforcement,
and a and b are parameters which depend on the fastener material. For steel, a = 1.667 and
(4-3)
b = 0.86; for aluminum, a = 3.125 and b = 0.82; and for titanium, a = 5.0 and b = 0.80. This
relationship implicitly accounts for local plate deformations and fastener rotations. There may be
limits to the range of other parameters such as fastener diameter, plate thickness, and fastener spacing
for which this relationship remains valid. These limits, which must be explored experimentally, have
not been addressed in the literature or by Battelle. Other fastener flexibility models that were
examined and compared with Swift's model for one specific case were found to be at variance (both
indicating lower stiffness) by factors of 2 and 10. Although there is no consensus on fastener
flexibility, Swift's estimates appeared to be widely accepted. Furthermore, estimating a higher
fastener stiffness would tend to result in higher estimates of bearing loads, which would generally be
conservative in the repair context.
The stiffness matrix of the entire structure was assembled from the plate and fastener member
stiffnesses. The solution for unknown displacements, reactions, and internal forces was then
accomplished through a straight-forward matrix structural analysis procedure[?].
Once displacements were known at the venices of each bi-directional element, an average
stress, equal to the .. bypass" stress, was calculated as:
(44a)
4-5

(4-4b)
(4-4c)
Direct bearing stresses and the distribution of stresses moving away from the hole were obtained after
the fastener loads were calculated. Average (bypass) stresses of distorted elements were likewise
calculated using averaged side and chord dimensions, which were reasonable approximations for small
element distortions. The limits of distortion for acceptable approximation were not explored.
4.3 CDA Program SKINFIX
The CDA analysis program, SKINFIX, is written in FORTRAN and was driven by menus in a
main menu routine, which calls the appropriate subroutines based on user input. This structure is
shown in Figure 4-3. The menu is self-explanatory. On first use, the menu requests instruction from
the user as to which set of input data is to be provided, or whether to go to the solution and assembly
phase or stress output phase. Based on user response, the appropriate subroutine is called. For
example, if the user responds with "N", for node input, subroutine GEOMETRY is called.
GEOMETRY will ask for the form of input data (single node entry, node generation, or external data
file), will call the appropriate subroutine, and then return to the main menu. At this time, only the
file input-mode (as opposed to the interactive mode) is operational. This is a programming matter
that is not of technical importance. A similar procedure applies to input for elements, materials,
forces, and boundary conditions. Element and node numbers in the model need not be consecutive.
It is not necessary to provide the problem input in any particular order (i.e., nodes before
elements), except that all such input must be made available before entering the assembly and solution
phase. This phase is called by entering "A" from the main menu, which then calls the subroutine
SOLVE. SOLVE is the largest single subroutine in the program. It automatically assembles plate
elements from the constituent beam-truss members, and then assembles a global stiffness matrix from
plate and fastener stiffness matrices. It also identifies degrees of freedom associated with prescribed
displacements and known forces. The global stiffness matrix is partitioned accordingly:
4-6

Main Program
SKINFIX
1----~ ELEMENTS
FORCES
t-----4 BOUNDAR!
SOLVER
'-----f STRESSOU
Subroutines
NOD INPUT
NODFILE
NODGEN NODREVU
ELEMINPU
ELEMFILE
ELEMGEN
ELEMREVU
MATREVU
FORCINPU FORCGEN
FORCFILE
FORCREVU
BOUNDINP
BOUNDGEN
BOUNDFIL BOUNDREV
AVGSHES
LOCALST
FIGURE 4-3. SKINFIX PROGRAM STRUCTURE
4-7
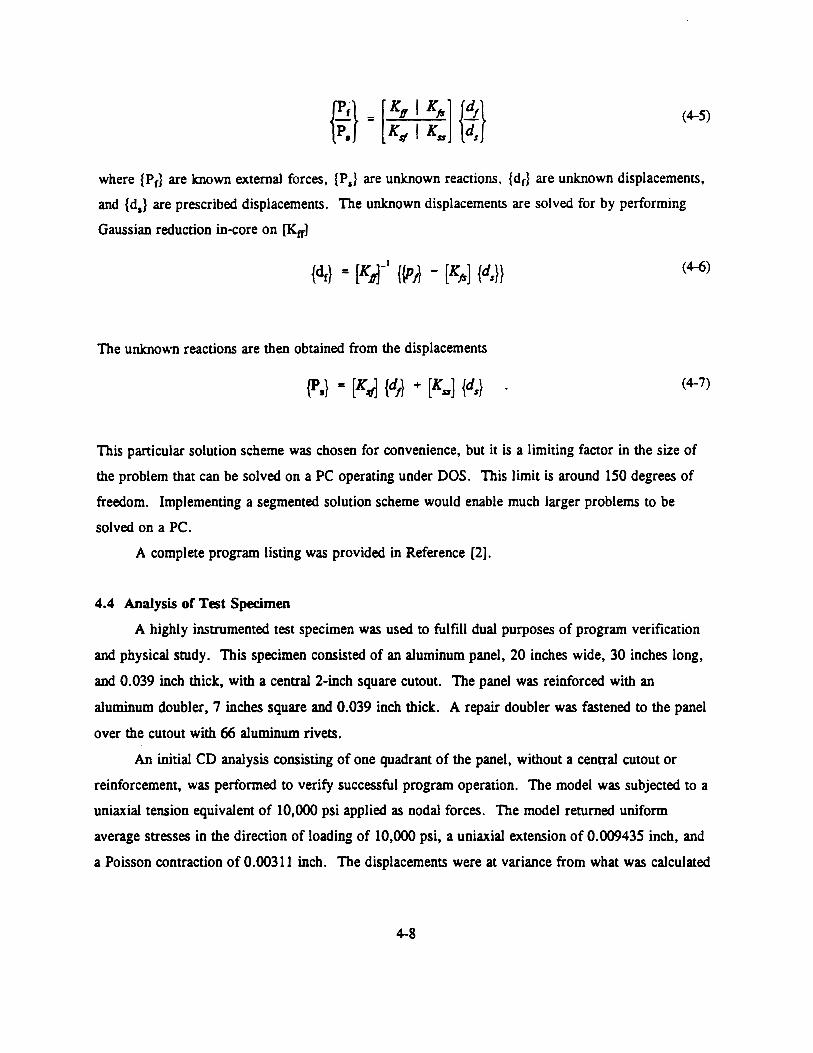
(4-5)
where {Pr} are known external forces, {P,} are unknown reactions, {dr} are unknown displacements,
and {d,} are prescribed displacements. The unknown displacements are solved for by performing
Gaussian reduction in-core on [K.ff]
(4-6)
The unknown reactions are then obtained from the displacements
(4-7)
This particular solution scheme was chosen for convenience, but it is a limiting factor in the size of
the problem that can be solved on a PC operating under DOS. This limit is around 150 degrees of
freedom. Implementing a segmented solution scheme would enable much larger problems to be
solved on a PC.
A complete program listing was provided in Reference [2].
4.4 Analysis of Test Specimen
A highly instrumented test specimen was used to fulfill dual purposes of program verification
and physical study. This specimen consisted of an aluminum panel, 20 inches wide, 30 inches long,
and 0.039 inch thick, with a central 2-inch square cutout. The panel was reinforced with an
aluminum doubler, 7 inches square and 0.039 inch thick. A repair doubler was fastened to the panel
over the cutout with 66 aluminum rivets.
An initial CD analysis consisting of one quadrant of the panel, without a central cutout or
reinforcement, was performed to verify successful program operation. The model was subjected to a
uniaxial tension equivalent of 10,000 psi applied as nodal forces. The model returned uniform
average stresses in the direction of loading of 10,000 psi, a uniaxial extension of 0.009435 inch, and
a Poisson contraction of 0.00311 inch. The displacements were at variance from what was calculated
4-8

theoretically by about 5 percent. However, this analysis confirmed that the program was executing
correctly and returning a solution of acceptable accuracy.
A quadrant of the test panel was then modeled with the cut-out, reinforcement, fasteners, and
appropriate boundary conditions on lines of symmetry. A schematic of the model is shown in
y
1 -- - -10.00-
I
7.50-
5.00-
3.50-3.00-
2.25-
1.50-1.00-0.75-
o-
I
I
I
-- -- -- -- -~ lfubler outline
I .J---Rivet
I I
/ l I
: 't - i -6 J ~.~~~5~ l ~ 0.75 1.00 \3.50
I 7.50
-I
10.00
X
FIGURE 4-4. COMPATIBLE DISPLACEMENT ANALYSIS MODEL OF TEST SPECIMEN NO. 25
Figure 4-4. The test specimen is shown in Figure 4-5. Listings of the input data required to run this
model were provided in Appendix B of Reference [2]. The model required 101 nodes, 74 plate
elements, and 18 fasteners. The output listing was provided in Appendix C of Reference [2]. The
panel was modeled to a dimension of y = 10 inches, which corresponds to a panel length of only
20 inches, to save modeling effort.
4-9

0 0 I
0[D~Rivet I I I I I I
FIGURE 4-5. SI'RAIN GAGE LOCATIONS (SPECIMEN NO. 25)
4-10
Skin

Two boundary conditions at the point of loading were evaluated for the test specimen. One
condition was a uniform applied load corresponding to a test panel load of 7,000 pounds
(3,500 pounds for a quadrant), the other was a uniform applied displacement. The applied
displacement was taken as the average displacement across the top of the panel for the uniform load
case, which was 0.085 inch. This resulted in an effective panel load of 7,322.3 pounds
(3661.2 pounds for a quadrant), so all results were adjusted linearly to compare to a panel load of
7,000 pounds. The better results (as determined by a match against strain-gage data near the top of
the specimen) were obtained from the uniform displacement case, adjusted for the equivalent load by
multiplying the results by 7000n322 = 0.956. The method of far-field loading had little influence on
stress estimates in the reinforced region. The output listings were presented in Appendix C of
Reference [2] for the uniform load and displacement cases, respectively. The necessary input files
were also provided with self-explanatory file names (i.e., NODES03 for nodal data).
The fasteners were represented in accordance with Swift. For the fasteners on the vertical line
of symmetry, it was necessary to specify a reduced fastener diameter equal to about 30 percent of the
nominal diameter, to produce approximately half the overall fastener stiffness. This effective
diameter was calculated from Swift's formula and the desired stiffness value. It was then also
necessary to make adjustments to calculated fastener and bearing stresses attributed to those fasteners
because they were calculated by the program using the reduced diameter. If this technique was not
employed, the program would have indicated excess load transfer at those fasteners. This technique
would not have been required if the entire width of the panel were modelled. Thus, some engineering
judgement was required to achieve correct results. With a more automated approach to modelling,
the need for user judgement could be reduced.
It should be noted that the doubler material outside the fastener pattern envelope was
specifically included in the model. This material performs an important load transfer function
through compression and shear. A more complex reinforcement, such as a fingered plate or a rolled
shape stiffener, could also be modeled.
Results of the above analysis are summarized in Table 4-1 and Figures 4-6 through 4.12. It
can be seen that bypass stresses are in good agreement with strain-gage data except in the areas of
high bearing-to-bypass stress ratios. These locations, at Strain Gages 1, 2, and 5, occur in first and
last rivet rows adjacent to free edges transverse to the direction of loading. Unfortunately, Location 1
is the most fatigue critical. Figures 4-6 and 4-7 also indicate some nonlinearity with load level in the
experimental data.
4-11

TABLE 4-1. RATIO OF CALCULATED TO MEASURED SfRESSES
Skin Doubler
Strain Gage 7000 # 14000 # 7000 # 14000 # Location
1 0.86 0.81 1.24 1.44
2 0.95 0.85 0.97 1.24
3 1.05 0.88 0.82 0.98
4 1.02 0.88 0.85 0.87
5 1.48 1.21 0.72 0.76
6 0.95 0.92 0.96 1.00
7 0.98 0.96 1.03 1.04
8 1.00 0.98 1.02 1.05
9 1.05 0.98 1.04 1.07
10 1.04 1.03
11 1.10 1.03
Two causes for the variance between the analyses and test results have been postulated. One is
that local (out-of-plane) bending occurs as a result of the asymmetry of the repair with respect to the
applied load. The current CDA model does not account for out-of-plane bending, although the
necessary degrees of freedom could be added. To investigate this further, a coarse finite element
analysis of the same configuration was performed using ANSYS. When the panel was constrained to
in-plane degrees of freedom, its results were in good agreement with the model. When the panel was
allowed to displace out of plane, the overall quality of the results with respect to the actual
measurements degraded significantly. These results did not suppon the argument for bending effects,
although they do not necessarily refute it, either, since the FEA was based on linear small
displacement theory.
Examining the test data at the locations of greatest disagreement with the CD analysis showed
that large stresses were measured at the same locations as small differential fastener displacements,
and vice-versa. Furthermore, the pattern of differential displacements indicated that the assembly
bulged at its center with the doubler on the concave side, and that the curvature was reversed in the
vicinity of the first two horizontal rows of rivets. Finally, the displacements were used to estimate
4-12

20
Location Analytical Experimental
18 I • 0 2 • 0 3 .. D. 4 ~ \1
16 5 • 0
Load, kips
FIGURE 4-6. SKIN STRESSES (SPECIMEN NO. 25)
4-13

20
Location Analytical Experimental
6 • 0 18 7 • 0
8 .. 6 9 ~ v 10 • <>
16 II + X
12
·c;; ..:.:. en en f 10 -(/)
c: ~ (/)
8
Load, kips
FIGURE 4-6. SKIN STRESSES (SPECIMEN NO. 25) (CONCLUDED)
4-14

14
LocatiOn Analytical Elcperlmentol --,- • 0 2 • D 3 • A
4 "' v 5 • ()
14
Locat1011 Anolytlcal Expenmenlal -6--- • 0
7 • D 8 • A
9 "' v
FIGURE 4-7. DOUBLER STRESSES (SPECIMEN NO. 25)
4-15

.. Q. ...... en• en11 wr:
~~ 0
~t J: en
-..... •• a., .;5 en• ..,:. e;o enE
12
11
10
9
e
7
6
5
4
3
2
0
SPECIMEN ~. 7.4 kipa 6,-----------------~~~~--~------------------~ a First row
Second row Third row
0~----------r---------~-----------r------------o.oo
0
0.75 1.50
X-COORDINATE. inchee
FIGURE 4-8. FASTENER SHEAR STRESSES
SPECIMEN ~. 7.4 kipa
a y=8.75"
+ y•4.00" 0 ,. 2.625" t::. y•l.875" X ,. 1.125" v ,. 0.375"
2 4 6 e X-COORDINATE. lnchee
FIGURE 4-9. SKIN STRESSES
4-16
3.00
10

_....,. •• a., IIi~ f/1. w" a:O ... ~ Ill..,
SPECIMEN 25, 7.4 kipa
7,-------------------------------------------~
6
3
2
0.2
a--------•~-------~~------~
0.6
0 yz2.625" + y=l.875" 0 y•l.l25" 1::. y• 0.375"
1.4 1.8 2.2 2.6
FIGURE 4-10. DOUBLER STRESSES
J 3.4
stresses and were found to agree with the strain gage data. These factors could only be rationalized
by concluding that local bending was affecting the stresses.
The other possible cause of the error is that the local fastener-plate interaction may not be
correctly accounted for by SKINFIX when bearing-to-bypass stress ratios are very high. Inherent in
the CDA approach used in SKINFIX is the assumption that the gross load-displacement response of
the assembly is dominated by plate-like membrane behavior, and that local effects are accounted for
in the fastener flexibility. Gross response is what determines load transfer. However, if bearing
loads are high in a region of low bypass stresses, the local loading effects dominate the gross load
displacement response. It has been assumed that Swift's fastener model is sufficient to account for
the local effects. However, its validity may be limited to some range in physical parameters beyond
the test configurations from which it was derived. Thus, if Swift's fastener model does not apply,
then the gross response and resultant load transfer will not be correct.
Two different solutions for deformations in elastic membranes due to point loadings were
examined[3,8]. They were not in agreement as to the relative displacement of the load points with
respect to the displacement of a uniformly loaded membrane. According to Reference [8], the
4-17

Legend
----/ ... I \ ( )Stresses ' / , __ .,.
Displacements between rivets
Rivet
? ..---15 /43\ 17 . I (8) \ (2.5) I (6)
~-.... /
? __ ...
10 10 (4) (4)
~ ~ ,--.....
/~O:i\ 9 ,' 10.0\ 8
14,000 lb } k . (7000 lb) Sl
14,000 lb} 0000 . ( 7000 lb) . I ln.
Doubler
~ ~ /4:5'\ /54'\ II 9 (4) \ (2.9) ,' (3} \ (3.3) /
1 ' ,
~ ' /
.... __ .... _ ...
.,-- ...... ... --8 / 10.1 \ 3 /JJ.3\ (3) ~ (5.2) ) (I) 1
, (5.8) /
~ ' /
! , __ ., __ ...
7
I I \ I
~ I \ I I
8 I (3) I
~ I \ I
I I I I \
(I) \
! I I ( I I
' I (3) \ (5.2) / (3) \ (5.1) ,' (4) /' ________ l __ f ~
'--~
~ .... /
! __ ...
I I
I ,- .... ... - .... I
/10.2', / ' I I 10.3 \ \ (5.3) } \~5.3) ,' I
I , __ .,, ...... __ , I I
--~-~--~---~----------~----~
0.039 Panel with 0.039 patch Specimen No. 25 (with cutout)
+
FIGURE 4-11. DOUBLER SI'RESSES AND RIVET DISPLACEMENTS
4-18

--
t 7
{5)
t 10 (5)
,-..... , ( 18.0 \ \ (8.4) I ' /
.... _ ...
..... - ... / ' I \
1 )Stresses \ / , __ .,
Displacements between rivets
Legend
14,000 lb} . {7000 lb) ksl
14,000 lb} 0000 . (7000 lb) · 1
ln.
Doubler Rivet
------~----------------- ---------., I I I I
r t t I I
I I -- .... ..... - ... ,--, I
/ 3 ' 10 /15.2\, 9 II /18.8\ 5 I ,' I .I , \ (5.7) ,' (6) \ (6.8) I (5) (6) \ (8.9) } (2) I
I ... /
t ' /
t I ' /
i --~ ..... __ ,. .... __ ,
t ... - ... /,--., I I
/5.6\ II I 11.5 \ 13 II II I I (6) \ (5.1) I (7) (5) (5) \ (2.3) I
' / i ' /
t f i __ , .... _ ...
,.-- ...... ,.--, I 13 I 13.1 \ 12 ,' 13.6 \ II (·7) 1
, (6.5) : (5) \ (6.6)) (6)
:t ' /
i __ ,
i ...... __ ,.
,--, .,-- .... , /12.3\ ,' 12.7 \ \ (5.7) ,' \~6.2l) ' .... __ ,. __ ,
8 8
Skin
/16.3\ I (8.1)) \. / '-~
FIGURE 4-12. SKIN STRESSES AND RIVEI' DISPLACEMENTS (SPECIMEN NO. 25)
4-19
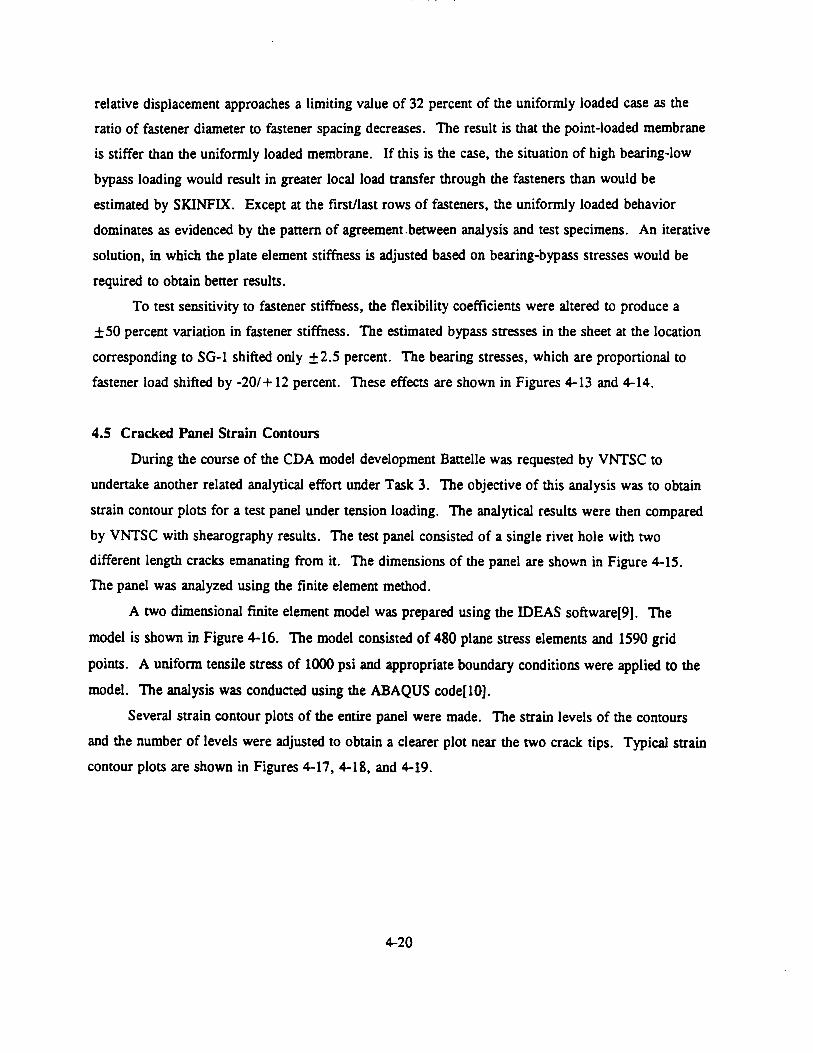
relative displacement approaches a limiting value of 32 percent of the uniformly loaded case as the
ratio of fastener diameter to fastener spacing decreases. The result is that the point-loaded membrane
is stiffer than the uniformly loaded membrane. If this is the case, the situation of high bearing-low
bypass loading would result in greater local load transfer through the fasteners than would be
estimated by SKINFIX. Except at the first/last rows of fasteners, the uniformly loaded behavior
dominates as evidenced by the pattern of agreement.between analysis and test specimens. An iterative
solution, in which the plate element stiffness is adjusted based on bearing-bypass stresses would be
required to obtain better results.
To test sensitivity to fastener stiffness, the flexibility coefficients were altered to produce a
±50 percent variation in fastener stiffness. The estimated bypass stresses in the sheet at the location
corresponding to SG-1 shifted only ±2.5 percent. The bearing stresses, which are proportional to
fastener load shifted by -20/+ 12 percent. These effects are shown in Figures 4-13 and 4-14.
4.5 Cracked Panel Strain Contours
During the course of the CDA model development Battelle was requested by VNTSC to
undertake another related analytical effort under Task 3. The objective of this analysis was to obtain
strain contour plots for a test panel under tension loading. The analytical results were then compared
by VNTSC with shearography results. The test panel consisted of a single rivet hole with two
different length cracks emanating from it. The dimensions of the panel are shown in Figure 4-15.
The panel was analyzed using the finite element method.
A two dimensional finite element model was prepared using the IDEAS software[9]. The
model is shown in Figure 4-16. The model consisted of 480 plane stress elements and 1590 grid
points. A uniform tensile stress of 1000 psi and appropriate boundary conditions were applied to the
model. The analysis was conducted using the ABAQUS code[10].
Several strain contour plots of the entire panel were made. The strain levels of the contours
and the number of levels were adjusted to obtain a clearer plot near the two crack tips. Typical strain
contour plots are shown in Figures 4-17, 4-18, and 4-19.
4-20

25~------------------------------~
X, inch
Relative Fastener Stiffness
1.5
1.0
0.5
FIGURE 4-13. EFFECT OF RELATIVE FASI'ENER STIFFNESS ON FIRST ROW BEARING SI'RESSES
1.5
VI VI Q) ~ -en 1.0 C\ c: ·.::: 0 Q)
al Q) 0.5 > I += 0 I a; I a::
0 0
, /~
/
0.5
---
1.0 1.5
Relative Fastener Stiffness
--
2.0
FIGURE 4-14. EFFECT OF RELATIVE FASI'ENER STIFFNESS ON M~MUMBE~NGSTRESSES
4-21
2.5

0 0 0
0.636~ l----o.590 ·I· 3.510 .. , 1---
_;lj~:. r--7.08
3.892~ 3.866
0.790~ ~ 3.505 ·I· 3.524 ·I r---0 0 0
FIGURE 4-15. TEST PANEL GEOMETRY
Crack Crack np np Left Right
FIGURE 4-16. FINITE ELEMENT MODEL OF TEST PANEL
4-22
0.318
t=0.064 d=0.25 ai=0.26 a2=0.68
Material: Aluminum
Dimensions in inches
0.170

t ~
3.00[-03
1
Crack Tip Right
1.22E-03 5.15[-03
2
Eyy ContDurs - 4 Levels Right Area Enlarged Un ijorm Loading
3
FIGURE 4-17. STRAIN CONTOURS FOR WNGER CRACK
y
Lx 6.67[-03
4

~
IAB!RBEIIOBI9~BBB~7t-o3 MAX1 2.76[-03 ABAOUS 1-8-1 1 "STATIC, DIRECT
-2.06[-03
1
-8.59[-01
2
Crack Tip
Right
3.16[-01
3
Exx Contours - 4 Levels Hole Area Enlarged Uniform Loading
2
FIGURE 4-18. STRAIN CONTOURS FOR SIIORTER CRACK
y
Lx I. SSE-03
4

~
aRB[RBEIIOBI9~BBBQ4[-04 MAXI 7.69[-03 ABAOUS 4-8-4 I NSTnT~fRtc
3.00E-03
1
I
'2
Crack Tip Left
i.22E-03
2
Eyy Contours - 4 Levels Left Area Enlarged Uniform Loading
X
S.iSE-03
3
FIGURE 4-19. OVERALL CRACKED RIVET HOLE STRAIN CONTOURS
y
Lx 6.67[-03
4

5.0 STANDARDIZED LOAD SPECTRA
5.1 Fuselage Loading
5.1.1 Loading Segments. An aircraft fuselage is subjected to flight segments with different
loading content during a typical flight. The loading consists of the 1.0 g stationary load and
dynamically induced loadings. The flight segments within which the dynamic loading occurs are
taxiing and take-off, ascent/climb with pressurization, cruise, descent with depressurization, landing
impact and taxiing. Over the years NASA and the FAA have conducted several flight loading
surveys on the response of commercial aircraft to gust and maneuver loadings. The experimental data
taken in the form of velocity, g-levels and altitude (VGH) are reduced to basic exceedance curves for
the various types of aircraft such as large or medium size and commuter aircraft. The cyclic content
and magnitude of stresses at a particular fuselage location are determined from exceedance diagrams
for gust and maneuver loadings[ll]. Detailed data on the most recent NASA/DOT/FAA program
on VGH flight loadings data for the B727, L-1011, DClO, and B747 aircraft are provided
elsewhere[ 12].
The stress history development for a given location in the fuselage must consider the
pressurization, gust and maneuver loadings. The primary loadings in the fuselage are the pressure
loads with superimposed maneuver and gust loadings. The stresses at the location selected for an
analysis are determined by structural load transfer functions which account for the response of the
aircraft fuselage to gusts and maneuvers. The determination of pressurization stresses is
straightforward.
5.1.2 Gust Loadings. The normal coordinate system for the aircraft structure is shown in
Figure 5-1. Besides pressurization, the next primary source of cyclic loading on a commercial
aircraft fuselage is gust. Gust loads on the wing will cause cyclic fuselage bending; lateral gusts on
the tail fin will cause fuselage torsion. As such, the gust spectrum is relevant to the definition of
fuselage cyclic loads. Figure 5-2 explains the elements of gust loading. During normal stationary
flight the lift is equal to the aircraft's weight (L = W), regardless of altitude, airspeed or angle of
incidence. Note that the tail load, T, is generally small (positive or negative) and ideally equal to
zero. The tail is needed only to equilibrate the total moment and to account for maneuvers.
A gust causes a&. up or down, as shown in Figure 5-2c. For a ramp-type or (1-cosine) gust,
a gust alleviation factor, Gal, must be included, which depends upon aerodynamic inertia. A large,
sluggish aircraft (B747 or DC10) has a lower Gal than a smaller one (B737 or DC9). Equation (5-1)
5-1

X z
FIGURE S-1. COORDINATE SYSTEM
shows that for a particular aircraft type the l:f.L is always proportional to the gust velocity, U, and the
airspeed, V, regardless of altitude.
where
= = =
1 l d~ AL = - p V S GaJ - A a
2 da
1 l d~ u =- pV S Ga~--
2 da V
1 d~ = - pS Ga~ - UV • C UV 2 da
Density of the air Wing area Gust alleviation factor depending on aircraft and altitude
5-2
(5-1)

VI w L
__ j __ .. ------
L= ~ ,VlscL =W
b. Stationary flight
6l
l
w
a. Fuselage bending and torsion
Gust 1 :!:r-~~·r· --a-
~v I
CL
L ±6l
-----......
u << v - v, =:s v u 611 ~v c. Gusl
FIGURE S-2. GUST LOADING DELTA 4L
..
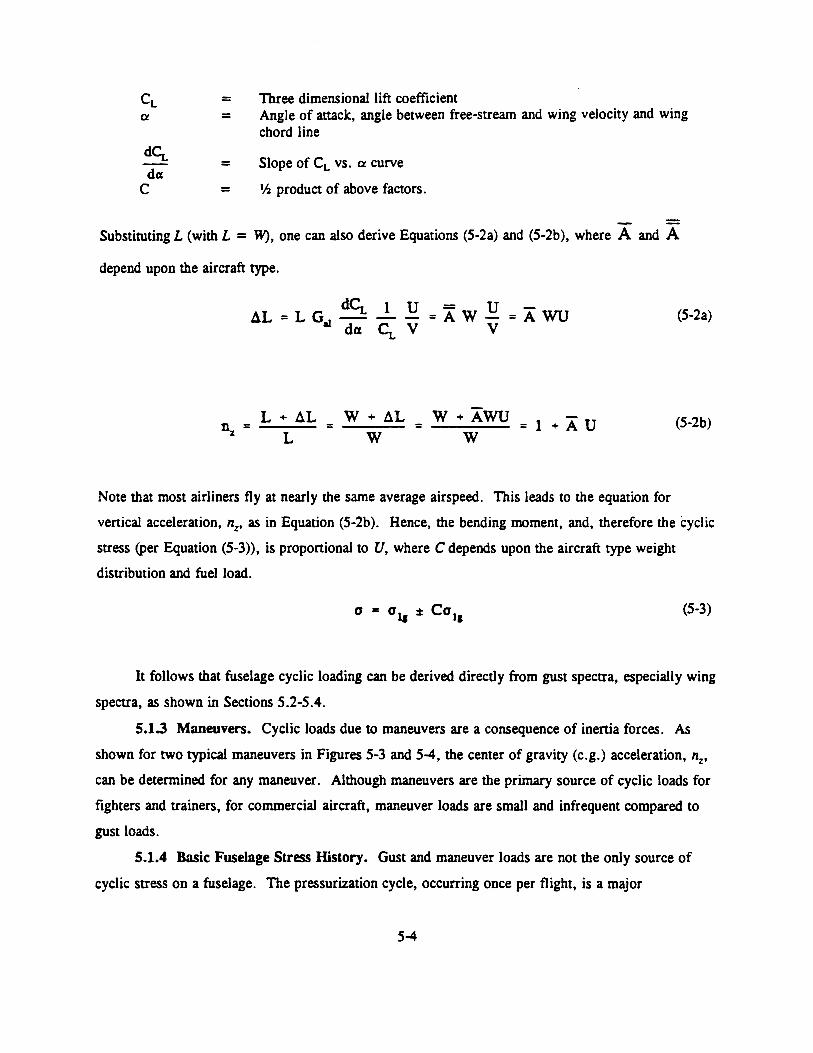
de;_ dcx
c
= =
=
=
Three dimensional lift coefficient Angle of attack, angle between free-stream and wing velocity and wing chord line
Slope of CL vs. a curve
'h product of above factors.
Substituting L (with L = W), one can also derive Equations (5-2a) and (5-2b), where A and A
depend upon the aircraft type.
d<;_ 1 u = u -AL=LG ---=AW-=AWU
a1 dcx Cx_ V V
L + AL L
= W + AL w = W •AWU
w = 1 +AU
(5-2a)
(5-2b)
Note that most airliners fly at nearly the same average airspeed. This leads to the equation for
vertical acceleration, nz, as in Equation (5-2b). Hence, the bending moment, and, therefore the cyclic
stress (per Equation (5-3)), is proportional to U, where C depends upon the aircraft type weight
distribution and fuel load.
(5-3)
It follows that fuselage cyclic loading can be derived directly from gust spectra, especially wing
spectra, as shown in Sections 5.2-5.4.
5.1.3 Maneuvers. Cyclic loads due to maneuvers are a consequence of inertia forces. As
shown for two typical maneuvers in Figures 5-3 and 5-4, the center of gravity (e.g.) acceleration, nz,
can be determined for any maneuver. Although maneuvers are the primary source of cyclic loads for
fighters and trainers, for commercial aircraft, maneuver loads are small and infrequent compared to
gust loads.
5.1.4 Basic Fuselage Stress History. Gust and maneuver loads are not the only source of
cyclic stress on a fuselage. The pressurization cycle, occurring once per flight, is a major
5-4
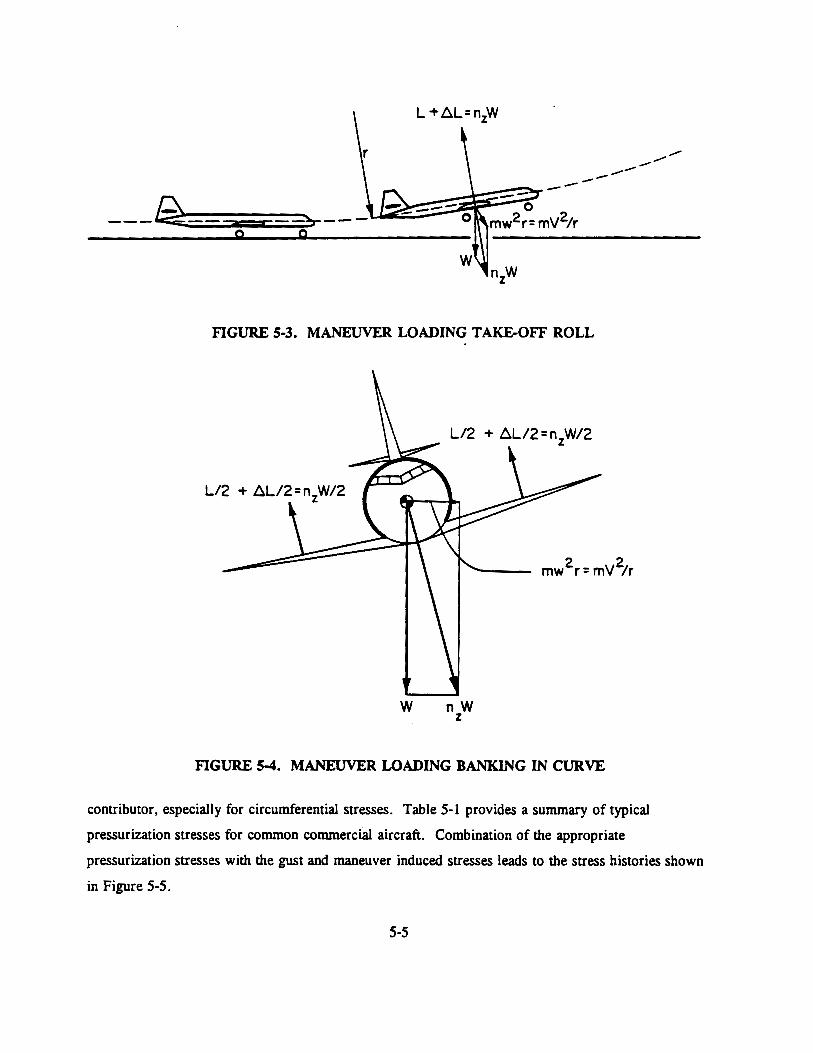
FIGURE 5-3. MANEUVER LOADING TAKE-OFF ROLL
W nW z
FIGURE 5-4. MANEUVER LOADING BANKING IN CURVE
contributor, especially for circumferential stresses. Table 5-1 provides a summary of typical
pressurization stresses for common commercial aircraft. Combination of the appropriate
pressurization stresses with the gust and maneuver induced stresses leads to the stress histories shown
in Figure 5-5.
5-5

TABLE 5-l. VARIATION IN AIRCRAFT HOOP STRESSES
Hoop Stress, Minimum Skin ksi Aircraft Alloy Thickness, inches
9.8 DC9 2014/24-T6 0.050
12.8 DC-8 2014-T6 0.050
14.8 L-1011 7075-T76 0.068
15.0 DC-10 2024-T3 0.068
15.7 B737 2024-T3/T4 0.036
15.9 B707/B727 2024-T3/T4 0.040
18.3 B747 2024-T3 0.063
For circumferential stresses, the hoop stress, aP' is the basic flight-by-flight cycle, essentially
the ground-air-ground (GAG) cycle. Longitudinal stresses for the stationary flight have two
contributors, one due to pressurization (roughly half the hoop stress) and one due to fuselage bending,
following from the "normal" weight distribution in the fuselage. Thus the GAG cycle consists of two
superimposed components, as shown in Figure 5-5b.
Cyclic stresses due to bending by inertia forces from vertical gusts and maneuvers are
superimposed on the GAG cycle. Torsional loadings are generally small and have a zero mean
because tail fm loads are normally zero. However, cyclic torsional stresses do occur due to lateral
gusts and maneuvers.
5.2 The Exceedance Diagram
5.2.1 Measured Spectra and the TWIST Standard. As demonstrated in Section 5.1, and
especially in Figure 5-5, the major fuselage cycle is the GAG cycle due to internal pressurization; the
superimposed cyclic stresses are due primarily to the fuselage response to the wing, which is
subjected to gust and maneuver loadings. The fuselage stresses are due to inertia loads, which in tum
are due to wing loads. Thus, the fuselage spectrum for the bending loads can be obtained from the
wing spectrum using the proper load-to-stress conversions (stress transfer functions) obtained from
structural analyses.
The best way to obtain the cyclic stress spectrum due to gusts and maneuvers is from
measurements. Extensive measurements on wings were made[l2,13]; they are shown in
Figure 5-6 (many more are presently available). Obviously, different aircraft types have somewhat
5-6

VI .!...
Steady Stress, - T--(I' ~ pR/t GAG
p _l
Steady Stress of Zero GAG=O
-- Zero Stress-- -
,,. Flight I •I
* l::.tl' due to i bending + torsion
a.
c. Torsional Stresses
...__ ___ Flight 3---~
FIGURE 5-S. TYPICAL STRESS HISTORIES FOR AIRCRAFT FUSELAGE

3.0
2.0
IJ)-
Caculoted Spectra
Transall F-28 SAC Ill DC-9 Boeing 737 F-27 DC-10
Measured Spectra
Transall (69 flights) F-28 (59,273 flights) Boeing 720 (571 flights) Caravelle (47,000 flights)
TwiSt standardised spectrum
e 1.0 ·-·-·-·-·-·-·-·-·-·-·-·-·-·-·-·-·-·-·-·-·-·-·-·-·-·-·-iii
-1.0
Exceedances per 40,000 flights
103 10.
FIGURE 5-6. LOAD SPECTRA PERTAINING TO 40,000 FLIGHTS FOR DIFFERENT AIRCRAFT
10'
different spectra, which is mainly due to the difference in the gust alleviation factor Gal> or a and C,
the parameters shown in Equations (5-l) and (5-2). Also note that these measured spectra inherently
include maneuver loads. The latter are small compared with the gust loads. The spectra are
essentially symmetric and nearly linear on a semi logarithmic scale.
These measured spectra were used[13] to establish a standard spectrum, called TWIST, which
is also shown in Figure 5-6 and in more detail in Figure 5-7. Note that the stresses are expressed as
a ratio to the lg stationary flight stress, so that adjustments can be made for the stress level: the stress
axis can be obtained when the lg stress level is known. It should be pointed out that TWIST was
developed for comparative testing. It is not a standard spectrum for design. Nevertheless, it can
serve as a basis for the present purpose provided the stress levels are adjusted for fuselages of
different aircraft systems.
5-8

3. 0
·-2. 0 I
' . +--
o--· . -· ~ --!...-- ....J_ 1-- ·-· ·- ·-~-~ ·- ·-~- ·- ·- .....
I •xto•
a: 101 2 ·-•·11102 to• 105 to'
0 E aceedonc:es -0 .3 f-f-· . - f- ·-i- ·- 1-· 1-1- ,___
- 1.
FIGURE 5-7. STANDARDIZED SPECTRUM FOR 40,000 FLIGHTS TWIST
Since TWIST is used for testing, detailed procedures have been developed to generate stress
histories from the exceedance diagram of Figure 5~. Although such histories are useful for testing,
they are cumbersome, to say the least, for analysis; easier, but similar ways to derive stress histories
can be devised, as will be shown in Section 5.3.
5.2.2 Proposed Spectrum. The TWIST exceedance diagram is repeated in Figure 5-8,
together with a proposed simplification. The simplification is not essential; the TWIST exceedance
diagram could be used as is. However, since it is an average, some streamlining is justified,
especially since the stress axis must be adjusted for different fuselages types (Section 5.4).
TWIST is a spectrum for 40,000 flights of an estimated average duration of 1.5 hours; hence it
is a spectrum for about 60,000 hours, the normal aircraft design life. In the case of fuselages for
aircraft with largely different flight durations, the GAG cycle occurs more or less frequently. As the
GAG cycle is of major importance (Figure 5-5), the spectrum must be considered to be for
60,000 hours instead of for 40,000 flights. This is perfectly legitimate, because the number of gusts
per hour is of more importance than the number of gusts per flight.
The TWIST spectrum ends at a minimum of 10 exceedances. This essentially means that it is
clipped at 10 exceedances per 60,000 hours. Clipping and truncation of the spectrum is of no
consequence if crack growth retardation due to overloads is not accounted for in the fatigue crack
growth analysis of the repair [11]. However, it is of great imponance if retardation is to be
5-9

3. 0 40,000 fiiQhts
=60,000 hours ..
-1--+- ··-
Bosrs for spectrum of -2 .n fuselage repairs
- .. . ' Twrsf
o-1-· . r--· r- 1---!..- r--- ·-· ·- ·-1-+ ·-r·-r-· t:!: ·-~ ~-•xto•
- .r ... II t.
~
to' 2 •-c·e102 to• to5 to' 0
E liCeedonces -0 .3 . . ·- ··r- - ·- - 1- ·- 1- ·r-- 1-r- 1-=.· ·r
- t ·-
FIGURE 5-8. PROPOSED SIMPLIFICATION TO STANDARDIZED TWIST SPECTRUM FOR 40,000 FLIGHTS
considered [11,14-15]. Performing linear crack growth analysis without consideration for
retardation effects is generally conservative.
As discussed in Section 5.3, a 60,000 hour spectrum is unwieldy and unnecessary for stress
history generation, especially when it is clipped anyway. Therefore, the proposed spectrum is
reduced to one for 600 hours. The logic for the reduction can be understood by comparing
Figures 5-9 and 5-10. The 600 hour spectrum of Figure 5-10 is the same as the one in Figures 5-8
and 5.9, but it is more suitable for the stress history generation explained in Section 5.3. Note that
this spectrum is "automatically" clipped at the once per 600 hours exceedance (100 times per
60,000 hours), which is more conservative if retardation is accounted for [11,14]. The spectrum
shown in Figure 5-10 can be convened to stress quite easily, since the fuselage pressurization stress
and the limit load stress are known for all cenified aircraft. This will be explained in Section 5.4.
5.3 Stress History Generation
5.3.1. Stress Levels. Depending upon the counting procedure, the exceedance diagram shows
the number of times a positive or negative stress excursion is exceeded; i.e., it shows the size of the
stress range and their frequency. In the schematic example in Figure 5-11, stress Level 4 is exceeded
5-10

-0.4
-once in 60,000 hrs ............
...................... ............
.....................
Clipping level
FIGURE 5-9. REPAIR SPECTRUM (SEE FIGURE 5.8) IN TERMS OF Nz
FIGURE 5-10. REPAIR SPECTRUM FOR 6700 HRS (COMPARE TO FIGURE 5.9)
5-11

61----~""
5 t----""'""'"-"' 4~----~~~~
Example of level approximation (only 6 levels shown for clarity)
Level
6-6
5-5 4-4
3-3 2-2
1-1
Exceedances
30
300
3000
30000
300000 3000000
FIGURE 5-11. OBTAINING SI'RESS LEVELS AND EXCEEDANCES
3,000 times and Level 3 is exceeded 20,000 times. As a result, there will be 20,000 - 3,000 =
17,000 events in which the stress reaches a level somewhere between Levels 3 and 4.
In reconstituting a stress history the exceedance diagram is always idealized by a number of
discrete levels. Considering too many stress levels is impractical and ignores the fact that the
spectrum is a statistical representation of past experience and that the analysis is a prediction of the
future. Accounting for too many stress levels would be presuming that stresses can be predicted to
occur in the future exactly as they have in ~e past, which they will not. The discrete levels do not
have to be evenly spaced, but they usually are. Experience shows that 10 to 12 levels (each positive
5-12
•
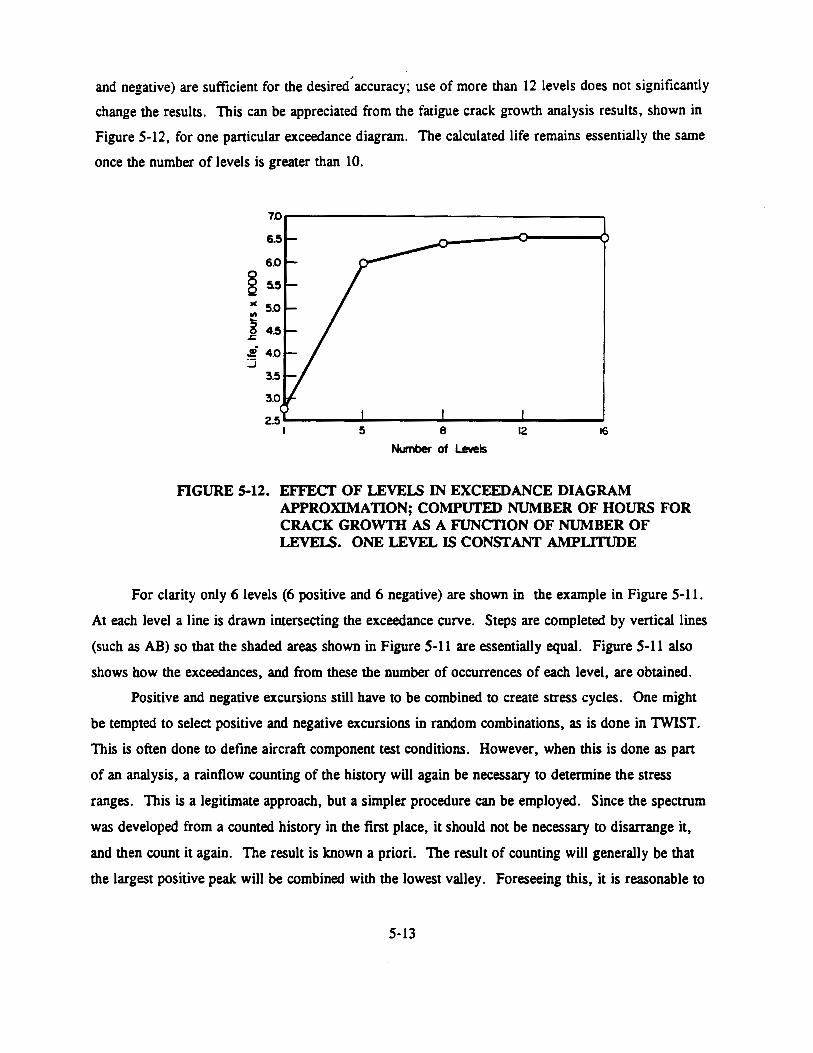
and negative) are sufficient for the desired' accuracy; use of more than 12 levels does not significantly
change the results. This can be appreciated from the fatigue crack growth analysis results, shown in
Figure 5-12, for one particular exceedance diagram. The calculated life remains essentially the same
once the number of levels is greater than 10.
70r-----------------------------------~
5 8
Number of Levels
12 16
FIGURE 5-12. EFFECT OF LEVELS IN EXCEEDANCE DIAGRAM APPROXIMATION; COMPUTED NUMBER OF HOURS FOR CRACK GROWTII AS A FUNCTION OF NUMBER OF LEVELS. ONE LEVEL IS CONSTANT AMPLITUDE
For clarity only 6levels (6 positive and 6 negative) are shown in the example in Figure 5-11.
At each level a line is drawn intersecting the exceedance curve. Steps are completed by vertical lines
(such as AB) so that the shaded areas shown in Figure 5-11 are essentially equal. Figure 5-11 also
shows how the exceedances, and from these the number of occurrences of each level, are obtained.
Positive and negative excursions still have to be combined to create stress cycles. One might
be tempted to select positive and negative excursions in random combinations, as is done in TWIST.
This is often done to define aircraft component test conditions. However, when this is done as part
of an analysis, a rainflow counting of the history will again be necessary to determine the stress
ranges. This is a legitimate approach, but a simpler procedure can be employed. Since the spectrum
was developed from a counted history in the first place, it should not be necessary to disarrange it,
and then count it again. The result is known a priori. The result of counting will generally be that
the largest positive peak will be combined with the lowest valley. Foreseeing this, it is reasonable to
5-13

combine positive and negative excursions of equal frequency. Stress ranges so established can be
applied (semi-) randomly, as they are already pre-counted and interpreted. This leads to the largest
possible load cycles (conservative), and the computer code does not need a counting routine. It is
also realistic, because air is a continuous medium, and a down-gust is often followed by an up-gust of
approximately equal magnitude (Figure 5-13).
----Ai~re!_Oft path
FIGURE 5-13. TURBULENCE, GUSTS, AND CONTINUITY OF AIR UP AND DOWN GUST OF ABOUT EQUAL MAGNITUDE OFTEN OCCUR IN CLOSE SUCCESSION
5.3.2 Different Flight Types. The content of the stress history is now known, but the
sequence must still be determined. If retardation is not an issue, sequencing of stresses is irrelevant.
If load interaction must be considered, stress sequencing is of eminent importance. In many analyses
the loads are applied in random order. However, with retardation, a random sequence does not
provide correct answers when actual service loading is semi-random. A commercial aircraft
experiences many smooth flights and occasionally a rough flight. This means that the loading is not
truly random, but clusters of high loads do occur (Figure 5-14). Were these high loads (e.g, A, B,
and C in Figure 5-14a) distributed randomly as in Figure 5-14b, as is sometimes done in analyses,
they would each cause retardation. Because of the clustering, the retardation will be much less (in
Figure 5-14a, only A will cause retardation, B & Care overshadowed by A). Realistically then,
5-14
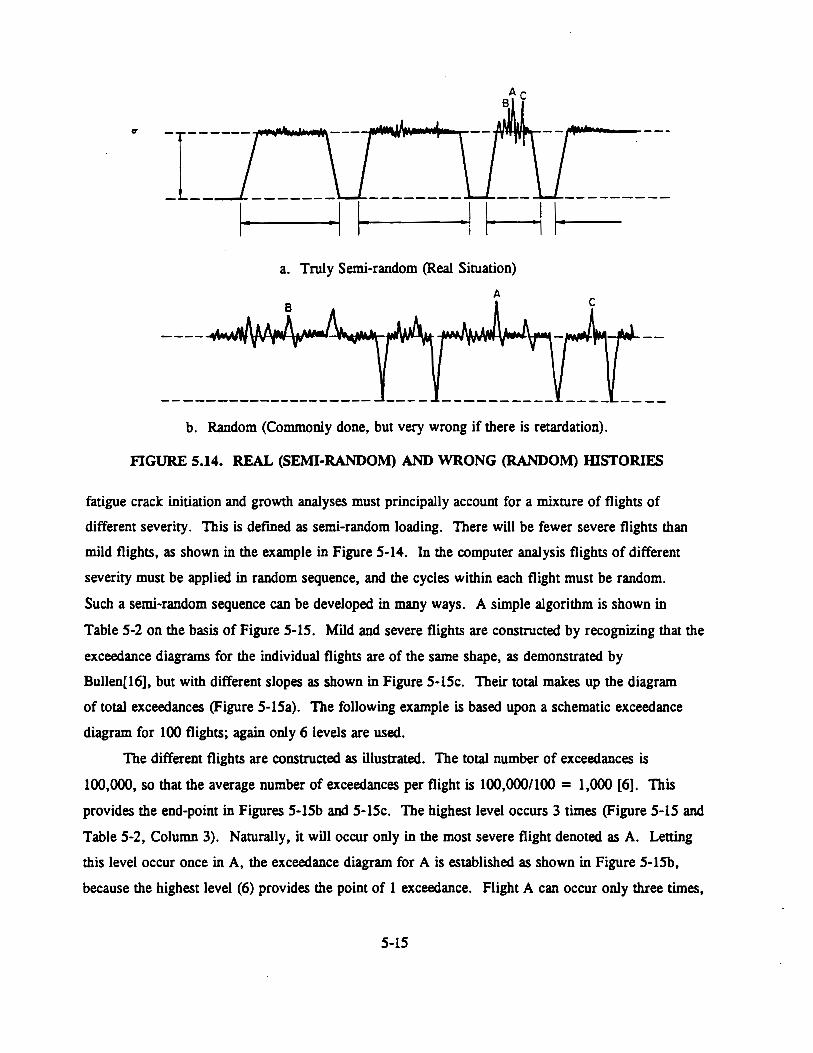
-1~~----------- ---------~---1----;·I 1~------___,.! H !~------· -
a. Truly Semi-random (Real Situation)
A
b. Random (Commonly done, but very wrong if there is retardation).
FIGURE 5.14. REAL (SEMI-RANDOM) AND WRONG (RANDOM) IDSTORIES
fatigue crack initiation and growth analyses must principally account for a mixture of flights of
different severity. This is defmed as semi-random loading. There will be fewer severe flights than
mild flights, as shown in the example in Figure 5-14. In the computer analysis flights of different
severity must be applied in random sequence, and the cycles within each flight must be random.
Such a semi-random sequence can be developed in many ways. A simple algorithm is shown in
Table 5-2 on the basis of Figure 5-15. Mild and severe flights are constructed by recognizing that the
exceedance diagrams for the individual flights are of the same shape, as demonstrated by
Bullen[16], but with different slopes as shown in Figure 5-15c. Their total makes up the diagram
of total exceedances (Figure 5-15a). The following example is based upon a schematic exceedance
diagram for 100 flights; again only 6 levels are used.
The different flights are constructed as illustrated. The total number of exceedances is
100,000, so that the average number of exceedances per flight is 100,000/100 = 1,000 [6]. This
provides the end-point in Figures 5-15b and 5-15c. The highest level occurs 3 times (Figure 5-15 and
Table 5-2, Column 3). Naturally, it will occur only in the most severe flight denoted as A. Letting
this level occur once in A, the exceedance diagram for A is established as shown in Figure 5-15b,
because the highest level (6) provides the point of 1 exceedance. Flight A can occur only three times,
5-15

1.1\ I -0\
TABLE S-2. GENERATION OF STRESS HISTORY WITII DIFFERENT PERIODS BASED ON FIGURE S.IS
1 2 3 4 5 6 7 8 9 10 11 3x5 3-6 12 lt 9 6- 10
Type A Type B Exceedances exceed. Occur Occur in 3 exceed. Occur Occur in 12
Level Fig. tSa Occurrences Fig. tSb in A types A Remainder Fig. tSc in B types B Remainder
6 3 3 1 1 3 - - - - I -I
5 21 18 3 2 6 12 1 1 12 -4 132 Ill 12 9 27 84 5 4 48 36
3 830 698 48 36 108 590 20 IS 180 4110
2 5750 4920 158 110 330 4590 tOO 80 960 3630
1 43650 37900 575 417 1251 36649 480 380 4560 32089
Total number of periods 12 + 3 = 15
12 13 14 IS 16 17 18 19 20 21 22 I 36 X 13 11 - 14 15/49 16 X 49 15- 17 18112 9 + 19 i
Type C Remainder Occur Distributed According exceed. Occur Occur in for 49 type in Occur in in 12 type B New type Exceed. to diagram Fig. 15c inC 36 types C D typeD 49 types D Remains B ofD Fig. ISc
- - - - - - - - - - -
- - - - - - - - I - -
1 1 36 - - - - - 4 - -
8 7 252 158 3 147 11 I 16 3 I
52 44 1584 2046 42 2058 -12 -I 79 45 20
400 348 12528 19561 399 19551 10 I 381 444 300
IS + 36 = 51 51 + 49 = 100
Same for negative levels if applicable. Periods: 3A + 128 + 36C + 490 = 100 total. - -- -··--

6
5 1---'-...;:a,~...,
41-----....L.....;;::!I~...,
3~----------~~~,
2~--------------~~~~
6 Type A
s ....... ~ 4 ....... ___,1~~
31-----._..or--t
21------~~~
(b)
(a)
6 Types B,C,D
4 ~~---3 .............. ~ ....... ~.---
(c)
FIGURE 5-15. STRESS WSfORY WITII DIFFERENT FLIGHTS (SEMI RANDOM)
because then the cycles of Level 6 are exhausted. The exceedances for A are read from the
exceedance diagram of A (Figure 5-lSb), and from these the occurrences (number of cycles) are
determined as in Columns 4 and 5 of Table 5-2. There being three Type A flights, the total cycles
5-17

for all A flights are sl;lown in Column 6. These cycles are subtracted from the total so that the
remainder for the other 97 flights is as shown in Column 7.
The next ~ost severe flight is Type B. Its highest level will be Level 5, which will occur
once. This information permits constrUction of the exceedance diagram for B as shown in
Figure 5-15c, Level 5 being at 1 exceedance. The exceedances and occurrences are determined as in
Columns 8 and 9 in Figure 5-15. Since there were only 12 cycles of Level 5 left after subtraction of
three Type A flights (Column 7), there can be 12 Type B flights. These 12 flights will use the
number of cycles shown in Column 10, which must be subtracted from those in Column 7 to leave
the remaining cycles in Column 11.
Flight C is constrUcted in the same manner. There can be 36 Type C flights and then the
cycles of Level 4 are exhausted. One could go on in this manner, but since there now are only
49 flights left, it is better to divide the remaining cycles in Column 15 by 49 in order to distribute
them evenly over 49 Type D flights. This is done in Columns 15-17. There are some cycles
unaccounted for, and a few too many cycles were used as shown in Column 18. These are of lower
magnitude, contributing little to crack initiation or growth - and since the diagram is only a
statistical average - this little discrepancy could be left as is. However, if one wants to be precise,
they could be accounted for by a little change in the content of Flight C, as shown in Columns 18-20.
If more than 6 levels are used, more (and different) types of flights can be generated.
However, this was an example only, and there is no need to go to extremes as long as a semi-random
history is obtained, recognizing that flights of different severity do occur and that the higher loads are
clustered in those flights. No matter how refmed the procedure, the actual load sequence in practice
will be different. In accordance with the nature of the loading, there are only three Type A flights of
a high severity in the total of 100. The majority consists of mild flights of Types D (49) and C (36).
Regardless of the number of levels chosen and the number of flights, the above procedure will reflect
this reality. Other procedures can be devised, but the above is a rational one and easy to
implement[14].
In crack initiation and growth analyses the various flights must be applied in random order and
the cycles within each flight applied randomly. Thus, the second occurrence of any flight type will
have a different sequence than its flrst occurrence, but the total cycle content will be the same. If the
.. basket" with 100 flights is empty, it is "refllled", and the process started anew; yet because of the
randomization the flights and the cycles within each flight will appear in different order.
5-18

5.3.3 Issues or Importance. The stress history generat~ in the manner discussed provides
the most realistic results when the total exceedances are on the order of 2,000 to 100,000 and the
number of flights on the order of 50 to 1000. Therefore, it may be advantageous to adjust
exceedance diagrams for smaller or larger numbers to the above ranges, as was done in Figure 5-10.
To summarize, the following issues are important in the generation of a stress history, namely:
a. Flights of different severity must be applied. Random application of stresses derived by complicated means will negate all the efforts.
b. Deterministic loads must be applied at the point where they occur: GAG cycles must occur between flights; random application may defy all other sophisticated procedures.
c. A reasonable number of stress levels (10-16 positive and negative) must be selected. More levels will complicate the procedure without improving the results and make the generation of different flight types much more cumbersome.
d. Positive and negative excursions of equal frequency must be combined. Random combinations will require subsequent counting, the result of which can be foreseen, while the stress history was based on an already counted history in the first place.
e. The total number of flights and cycles must be in accordance with the total exceedance diagram.
The above criteria account for what may be called the signature of the loading. Small changes in
these, including clipping[ll,l4,15], will usually have more effect on crack initiation and growth than
any complicated means of establishing stress levels.
It is important to emphasize that the 1WIST spectrum is based on measurements and used for
demonstration in this report; it should be compared with spectra furnished by the OEM. Another
important data source is the NASA/DOT/FAA aircraft loadings data[12]. In developing a stress
history for a given repair in an aircraft fuselage, the repair engineer may be well advised to compare
the stress history he or she develops with the proposed history and to use the most severe of the two.
5.4 Fuselage Stresses
The basic spectrum and stress history have now been established. What still needs to be done
is adjustment of the stress axis (actual stress) for the fuselage. There are two relatively simple ways
to accomplish this:
a. Approximate fuselage stress analysis
b. Limit load analysis.
These two possibilities are discussed in the following sub-sections.
5-19

5.4.1 Approximate Fuselage Stress Analysis. Figure 5-16 shows an aircraft's weight
distribution. Only the fuselage weight is of imoortance for fuselage bending; it is assumed to be
L
w
L
II I I I I I I I J J I J t I ' I f IJ ~ I I I J I I I I I I
wfuselage
FIGURE 5-16. FUSELAGE LOADING
evenly distributed. As shown in Figure 5-17, local bending moments due to vertical gusts are
determined from static equilibrium requirements. Given the Station No., x, of the repair, which is
always known, the moments (Mb and M,) are determined, and from these the approximate stresses can
be readily calculated as shown in Figure 5-18.
5-20

X .. ""'1·-------- R. -------~~
L ± 6L
Jlilliitttil t
wfuseloge wf L Ubs/in.l = T (horizontal flight) + wf
nz T (gust + maneuver)
1----- x~---•-''
~-------x2~·-----~
~--------------~--------~
FIGURE 5-17. FUSELAGE BENDING
Circumferential stresses can be calculated as follows:
0 = pR p
(5-4) t
This pressurization stress cycle occurs once per flight._ The circumferential stresses are generally
reduced by approximately 20 percent near frames and 10 percent near tear straps.
5-21

VI
~
CT
u5
= Steady stress (I cycle/flight)
ub =Variable bending stress due to gust and maneuvers
a. Longitudinal
---t---CT
&•61~ b. Torsion - variable amplituc.le stress due to lateral gust anc.l maneuvers
FIGURE 5-18. FUSELAGE STRESSES
R
+
CT
u = P~ (with allowance for P frames 8 straps)
c. Pressuriution anc.l longitudinal cracks: steac.ly stress part ( 1 cycle per flight)
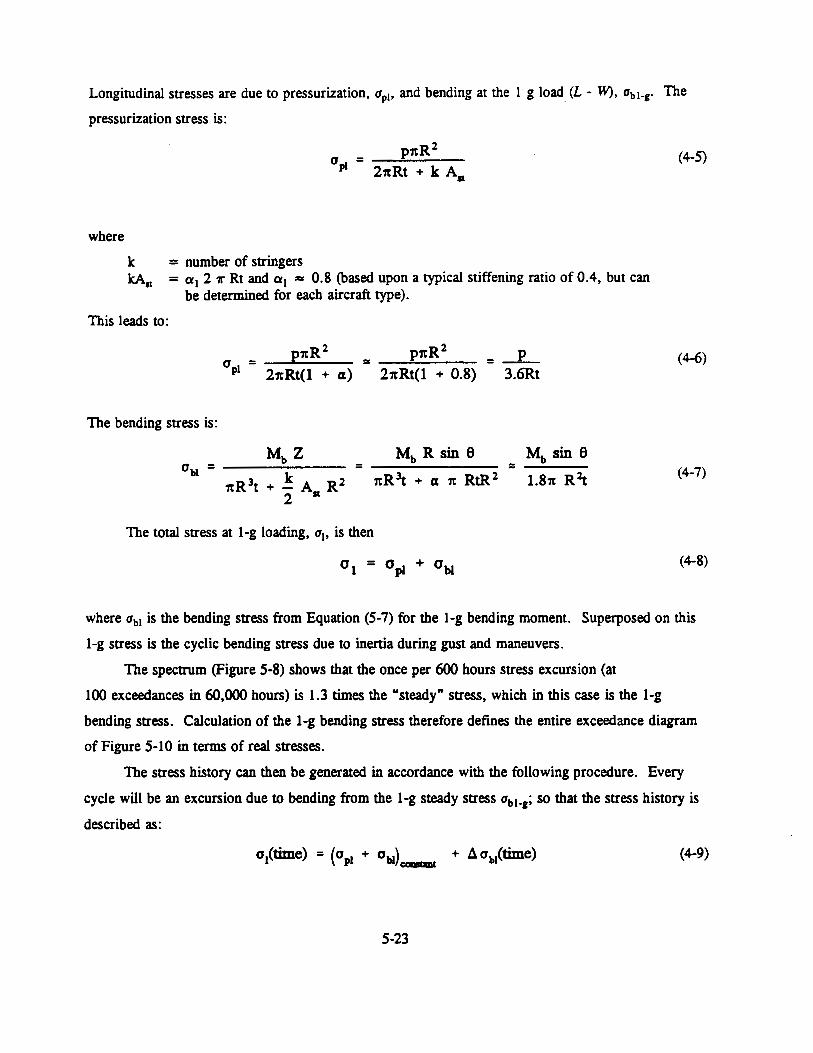
Longitudinal stresses are due to pressurization, O'pt• and bending at the l g load (L - W), O'bt-g· The
pressurization stress is:
where
k = number of stringers
pnR2
apl = --.::..---2nRt + k A•
leA• = a 1 2 11" Rt and a1 = 0.8 (based upon a typical stiffening ratio of 0.4, but can be determined for each aircraft type).
This leads to:
pnR2
apl = _2_n_,R,_t(_l_+_cz_) pnR2
= -~'-----2nRt(l + 0.8)
The bending stress is:
The total stress at 1-g loading, u1, is then
=-p-3.6Rt
Mb sin 8 =----
1.81t R 2t
(4-5)
(4-6)
(4-7)
(4-8)
where ub1 is the bending stress from Equation (5-7) for the 1-g bending moment. Superposed on this
1-g stress is the cyclic bending stress due to inertia during gust and maneuvers.
The spectrum (Figure 5-8) shows that the once per 600 hours stress excursion (at
100 exceedances in 60,000 hours) is 1.3 times the "steady" stress, which in this case is the 1-g
bending stress. Calculation of the 1-g bending stress therefore defines the entire exceedance diagram
of Figure 5-10 in terms of real stresses.
The stress history can then be generated in accordance with the following procedure. Every
cycle will be an excursion due to bending from the 1-g steady stress ub1•1; so that the stress history is
described as:
(4-9)
5-23

where
~ab1 reaches ± 1.3 (abl-g) once in 600 t1ights, as shown below:
If necessary the shear stresses due to torsion and bending can be included.
AM = t • Ao = A-r
2n R3t' t t
(4-10)
With the other stresses already obtained, this permits calculation of the largest principal stress - the
one to be used in the fatigue and crack growth analyses.
A complication that must be considered is that fuselage bending stresses due to wing gusts and
trrsional stresses (due to lateral gusts) vary independently. It is likely, however, that the torsion
•ntribution will be small for circumferential cracks, and the bending contribution will be small for
ost longitudinal cracks.
Of course the value of a 1 in aP1 in Equation (5-6) can be adjusted in a stress analysis program
r different aircraft types. The effect of longitudinal stringers on bending stresses and longitudinal
~surization stress is properly accounted for. Some adjusnnents to the circumferential stresses to
;ount for the effects of straps and frames must be made, and appropriate adjusnnents must be made
·door and window cut-outs and framing.
When the stresses in the basic structure are known in this manner, the stresses in the repair can
calculated by compatible displacements (or other local stress analysis techniques) for any repair.
5.4.2 Limit Load Analysis. An alternative, but simplified, way to obtain the stress
tversion is as follows:
Limit load is basically the load that is expected to occur once in the aircraft life (i.e,
once in 60,000 hours as shown in Figures 5-9 and 5-10). The structure is sized such
that the stress at ultimate load is equal to the material's design allowable strength. The
safety factor between ultimate and limit load is 1.5 (the airworthiness requirement).
5-24

Hence, the limit load stress follows immediately as the design allowable stress divided
by 1.5. One small limitation to this approach is that different manufacturers do use
different allowables, and these allowables are often lower than the .. true .. statistical
allowable of the material.
In any case, given the material and hence the design allowable stress, the limit load stress
follows as above. Since this is the stress which is assumed to occur once in about 60,000 hours, the
beginning points in Figures 5-9 and 5-10 are known, and hence the whole exceedance diagram can be
estimated. Another rule of thumb to consider in this analysis is that limit load stressts (in 2024-T3)
are usually set no higher than about 35 k:si.
As aircraft structures are seldom designed exactly to the design allowable limits (there is
always a margin of safety, which varies from location to location), the disadvantage of this method is
a loss in accuracy, but the accuracy may suffice for comparative analyses. Its advantage is that no
special allowances have to be made for location and structural details. (The assumption being that the
original structure was designed to conform to limit load margins).
5.5 Comparison of Proposed Stress History Generation Scheme With Manufacturer's
To provide an appreciation of how representative crack growth curves, as calculated with the
proposed stress history and spectrum, compare with those calculated by manufacturers, a comparison
was made of crack growth computations based upon the proposed procedure and those based on stress
histories for the KC-135 and EC-135[17]. The latter were kindly provided by the US Air Force.
Only longitudinal stress estimates are considered in these examples.
The following discussion is based on the word "spectrum" meaning the total load experience
(in terms of an exceedance diagram or otherwise), while the specific sequence of loads or stresses
used in an analysis or test is called a "stress history". These definitions were adhered to earlier in
Section 5, but in the general literature they are often confused, or used alternatively without
explanation. The two are essentially different - a stress history may be a loose interpretation of the
spectrum, as will be shown below. In practice the word "spectrum" is often used for both, which
may lead to confusion.
Before presentation of the results of the comparison, the stress histories for the military
versions of the B707/B720[ 17] require some discussion, because otherwise a fair comparison is not
5-25

possible. The details of the analysis leading to the stress histories are not elaborated upo~ in
Reference [17]. Therefore, only the results are reviewed briefly.
The fuselage of the aircraft is divided into Areas A through 0, as shown in Figure 5-19.
Stress histories for these areas were derived, and these were assumed to be valid throughout the area
without regard to stress gradients or detail design. (It should be noted that the bottom of Figure 5-19
roughly represents the neutral axis for fuselage bending.) The stress histories in each of these areas
were derived on the basis of the load spectrum, taking into account flight conditions (point-in-the-sky
approach accounting for different flight segments as discussed earlier). Although details are not
given, other evidence[ IS] shows that the manufacturer used a loose interpretation of TWIST (the
spectrum used here) for the stress history in a recent full-scale fatigue test; it is therefore reasonable
to assume that similar considerations were used in the derivation of the stress histories discussed here.
Apparently, stress histories for a variety of missions of the different military versions of the
aircraft were derived[l7]. By means of crack growth calculations, details of which are not specified,
one particular mission (identified as Mission 3) was determined to be the most severe. This led to a
typical mission profile (stress history) as shown in Figure 5-20. Similar stress histories were
developed for all areas specified, using only Mission 3 for all areas. The number of cycles in these
missions, and the maximum stress in each area, are shown in Figure 5-19.
The first thing to be noted is that the most severe mission (which was taken as representative
for all versions) penains to the AWACS version. The radar disk above the fuselage may explain the
fact that in Areas A through I the number of cycles is much larger than elsewhere and that the
stresses do not follow the anticipated pattern. For this reason, Areas A through I could not be used
for comparison with a commercial aircraft. This leaves Areas J through 0, from which Areas J, K,
and L were selected as the basis for comparison.
The cycle numbers per mission for these areas (Figure 5-19) do not seem to be consistent, as
(one must assume that) the cyclic stresses are due to bending cycles, the number of which is the same
for all areas in the fuselage. Be that as it may, Mission 3 includes 5 touch-and-go landings as
illustrated in Figure 5-21. Because normal airline practice does not include touch-and-goes, the
cycles concerned were eliminated. The stress histories for Areas J, K, and L are shown in
Figure 5-22. It seems reasonable to assume that the cycles for the five touch-and-goes are as
indicated. Eliminating these leads to the stress histories shown in Figure 5-22.
The total number of cycles per mission (flight) is still inconsistent and remains unexplained.
The stress histories in Figure 5-22 were considered representative for three areas over which the
5-26

VI ~ .......
Note: Maximum stress in history, r:r max• and number of cycles in Mission 3, N, are shown.
BS 480 I
BS 620 BS 720 BS 820 85960 I I I I
r:r max = 21.9 ksi Ct»
® N=I045
r:r max = 16.8 ksi r:rmax =15.6 ksi
® ® N=528 N=669
r:r max= 6.6 ksi r:r max= 6.6 ksi
® ® N=l80 N=l037
---- - --- -----
BS =Fuselage station S =Stringer
r:rmax =18.4 ksi ® r:r max= 15.8 ksi
® N=812
r:r max = 7.6 ksi
CD N=l345
---------
BS 1140 I
BS 1360 I
BS 1440 I
r:r =14.6 ksi -~-1
N=425 r:rmax=Q) max -S-2 N=
15.7 ks 1417 ® -S-3 -S-4
r:rmax =14.7 ksi N=l50
r:rmax =12.5 ksi -S-6
® ® N=292 N=l55
S-13 r:rmax = 8.1 ksi r:r max = 5.0 ksi I
© @ and
below
l N=245 N=203 ~-
FIGURE S-19. AREAS OVER WHICH STRESSES ARE ASSUMED TilE SAME
Fuselage - It

;:::; en ~
en en w a: ~ en
-en ~
en en ~
18
16
14
12
10
B
6
4
2
18
16
14
t; 10
B
6
2
5 TOUCH-AND-GOES
_l_
20 40 60 eo 100 120 140 160 1eo CYCLES I )
a. Area J
35 70 105 140 175 210 245 280 315 CYCLES ( )
b. Area K
FIGURE 5-20. BOEING SPECTRUM; ALL FLIGHTS ARE THE SAME, LAST 3 CYCLES ARE MAKE UP CYCLES
5-28

.... en ~
en en w a: ... en
13.00
11.00
9.00
7.00
5.00
3.00
1.00
-1.00
-3.00
5 TOUCH AND GOES
50 100 150 200 250 300 350 400 450 CYCLES ( l
c. Boeing Spectrum for Area L
FIGURE 5.20 BOEING SPECTRUM; ALL FLIGHTS ARE THE SAME, LASI' 3 CYCLES ARE MAKE UP CYCLES(CONCLUDED)
;= 45 w w u.. 0
40 0 0 - 35 w c ::;) 30 ... .... ... ~ 25 5 TOUCH-A~ <
20
15
10
5
1 2 3 4 5 6 7 B 9 TIME (HAS)
FIGURE 5-21. MISSION 3 ALTITUDE PROFILE
5-29

;:< en ~
en en w a: .... en
18
16
14
12
10
8
6
4
2
18
4
2
15 30 45 60 75 90 105 120 135 CYCLES ( )
a. Area J
20 40 60 80 100 120 140 160 180 CYCLES ( )
b. Area K
FIGURE 5-22. SHORTENED SPECTRUM, TOUCH AND GOES DELETED
5-30

;::::; en ~
en en w a: 1-en
13.00
11.00
9.00
7.00
5.00
3.00
1.00
-1.00
-3.00
25 50 75 100 125 150 175 200 225 CYCLES ( l
c. AreaL
FIGURE 5-22. SHORTENED SPECTRUM, TOUCH AND GOES DELETED (CONCLUDED)
stresses vary appreciably. Also, the particular mission in the stress history is the only one: all flights
are assumed to be equal. However, it should be noted that a small compensation is made for the fact
that higher loads do occur from time to time. For this reason the last three cycles in all histories in
Figures 5-20 and 5-22 are "make-up cycles". The first of the three occurs once in every 10 flights,
the second occurs once in every 100 flights, and the third occurs once in every 200 flights.
For a comparison with the stress histories proposed here the following conditions were
considered:
• Maximum differential pressure of 9 psi
• Fuselage weight of 65,000 pounds (for the military version for which the comparison was made)
• The critical points covered by Areas J, K, and L are at the forward and top of these areas which are the worst, as the stresses will be decreasing from there.
The stresses were calculated for these conditions using the procedure described in Section 5.4.
From these the spectrum was obtained, and subsequently stress histories were determined, all in
5-31

accordance with the procedures described earlier in this section. The stress histories for Area J are
shown in Figure 5-23. Note that there are five different types of flights. The stress histories for
Areas K and L are similar, except that the stress values are different.
The objective of the computations was to show the effect of different methods of computing
stress histories on predicted crack growth behavior. Therefore, the configuration and basic crack
growth rate data used are immaterial, as long as the same situation and data are considered for both
stress histories. Nevertheless, a configuration was chosen that is reasonably representative for aircraft
structures, namely a through crack at a fastener hole (no load transfer), while the crack growth rate
data were represented by a Walker equation with a coefficient of 3 x 1 o-9, and exponents of 2 and 1,
r~pectivel y.
The results of the computations for the three areas are shown in Figure 5-24. For Area J (the
most critical for longitudinal stresses) the present history is conservative by a factor of two with
regard to the manufacturer's history. For Area K they come out about the same, but for Area L the
manufacturer's spectrum is far more conservative. Anticipated crack growth in the three areas
according to the manufacturer's method of developing a stress history and according to the proposed
method are shown in Figure 5-25. The proposed stress history would produce a much longer crack
growth life in the area close to the neutral axis. This is reasonable, but rather insignificant, because
inspection intervals would be based on the most critical area (Area J), where the proposed history is
more conservative by a factor of two.
These relatively similar results must be considered with caution for the following reasons:
a. The manufacturer's stress history is the same in every flight; the proposed history recognizes that all flights are different.
b. The manufacturer's stress history recognizes that some load cycles occur at altitudes less that the cruising altitude, as shown in Figure 5-22, while the proposed histories implicitly assume that all cycles have the same mean stress. (It should be pointed out, however, that the cycles at lower mean stresses do not occur at a fixed mean either as assumed by the manufacturer.)
c. The manufacturer keeps the stresses the same over large areas, while the proposed history recognizes gradual stress gradients.
The stress history for Area J as shown in Figure 5-23 seems more representative of aircraft
loading than the one shown in Figure 5-22a, despite the fact that Figure 5-22a reflects altitude
differences. In reality the cycles at lower altitude (mean stress) are spread over different altitudes.
5-32

-... en ~
en en UJ a: 1-en
.... en ~
en en UJ a: 1-en
1a
16
14
12
10
a
6
4
2
1a
16
14
12
10
a
6
4
2
15 30 45 60 75 90 105 120 135 CYCLES ( )
a. Flight Type 1 - Occurs 106 times in 133 flights
20 40 60 80 100 120 140 160 1aO CYCLES ( )
b. Flight Type 2 -Occurs 21 times in 133 flights
FIGURE 5-23. FLIGHT TYPES, EVERY OCCURRENCE WITII DIFFERENT SEQUENCE
5-33

0:0 en ~
en en IU a: t-en
--en ~
en en IU a: t;
18
16
14
12
10
8
6
4
2
18
2
20 40 60 80 100 120 140 160 180 CYCLES ( l
c. Flight type 3 - Occurs 4 times per 133 flights
20 40 so eo 100 120 140 160 180 CYCLES ( )
d. Flight Type 4 - Occurs once per 133 flights
FIGURE 5-23. FLIGHT TYPES, EVERY OCCURRENCE WITII DIFFERENT SEQUENCE(CONTINUED)
5-34

18
! 16 f-
;:::; en 14 ~
~ en 12 f-M 1M ~ ~ ~ N w ~ en w v a: t- 10 en
8
6
4
2
5 10 15 20 25 30 35 40 45 CYCLES ( )
e. Flight Type 5 - Occurs once per 133 flights
FIGURE 5-23. FLIGHT TYPES, EVERY OCCURRENCE WITH DIFFERENT SEQUENCE (CONCLUDED)
0.9 c;; w :I: ~ 0.8 .... w 0.7 N .... en :.c 0.6 u < 5 0.5
0.4
0.3
0.1
PRESENT BOEING
2.5 5.0 7.5 10.0 12.5 15.0 17.5 20.0 22.5 LIFE (1000 FLIGHTS)
a. Run ID: 5742 - Area J FIGURE 5-24. CRACK GROWTII COMPARISON OF BOEING
AND PRESENT SPECTRUM
5-35

0.9 u; !i! ~ 0.8 ... I.IJ 0.7 N ... en ~ 0.6 (,J
~ (,J 0.5
0.4
0.3
0.2
0.1
0.9 u; !i! ~ 0.8 ... I.IJ 0.7 N ... en ~ 0.6 (,J c 5 0.5
0.4
0.1
PRESENT BOEING
2.5 5.0 7.5 10.0 12.5 15.0 17.5 20.0 22.5 LIFE (1000 FLIGHTS)
b. Run ID: 24657 - Area K
BOEING PRESENT
20 40 60 80 100 120 140 160 180 LIFE (1000 FLIGHTS)
c. Run ID: 7387 - Area L
FIGURE 5·.24. CRACK GROWTII COMPARISON OF BOEING AND PRESENT SPECTRUM (CONCLUDED)
5-36

0.9 u; ~ §f 0.8 !::! UJ 0. 7 N -en ~ 0.6 (,J < 5 0.5
0.4
0.3
0.2
0.1
/ /
/
K J L
/ /
/
/ /
I I
I
I I
I
5 10 15 20 25 30 35 40 45
0.9 u; ~ §f O.B --LL1 0.7 N -en ~ 0.6 (,J < 5 0.5 1-
a. Run ID: 14835
J K
0.4 II / 0.3" ~ ______ ,.,.
0.2 ~,. ...... ...................
0.1 ............ ~-
/ /
LIFE (1000 FLIGHTS)
/ /
,t /
I I
I
L
I
20 40 60 eo 100 120 140 160 180 LIFE (1000 FLIGHTS)
b. Run ID: 7387
FIGURE 5-25. CRACK GROWTII, PRESENT SPECTRUM FOR AREAS J, K, AND L
5-37

The manufacturer assumes that they will occur at a fixed (lower) altitude, while the present procedure
assumes them at a fixed higher altitude (conservative). In any case, the issue is of secondary
importance, because it affects only the R-ratio. The effect can be assessed by estimating the relative
number of cycles occurring at lower R; the result is that the effect is at most a factor of 1.3.
Considering the simplifications in taking all flights to be the same in the history and by assuming this
history is valid for large areas, the effect of R is probably inconsequential.
Both stress histories are based on numerous assumptions; the proposed history is based upon
measurements, is conservative with regard toR-ratio effects, and is more realistic in accounting for
different flight profiles. While the proposed method derives the stresses from generalization and
simplification of the structure, the manufacturer's method does also, and results in essentially the
same stress history.
5-38

6.0 REPAlRED PANEL TESTING
The goal of this effort was to select some common repairs, analytically predict their behavior,
and conduct fatigue experiments on them to substantiate the predictions. The plan was to test simple
flat panel doubler designs, 20 inches in width, evaluate the relative fatigue quality of a range of
commonly used simple fuselage panel repairs to verify anticipated trends and provide basic data for
designated engineering representatives (DER's) and airline repair engineers. The loading was to be
uniaxial constant amplitude cycling to simulate pressurization cycles only.
6.1 Specimen and Fixture Designs
The three commonly used fuselage doubler repairs are shown schematically in Figure 6-1. A
Type I (or Type A)[19] fuselage repair is a permanent repair that restores the aircraft's normal
inspection requirements. Such a repair often incorporates internal doublers, layered external doublers
and solid fasteners. By comparison, a Type ll (or Type B) fuselage repair has a design life less than
the original design goal for the aircraft, and it generally requires repetitive inspections. A Type ll
repair often incorporates layered external doublers and solid fasteners (but not internal doublers).
I + + + + • I + + +
+ + + + + + + + + + + + + + +
+ + + + + + + + + + + + + + +
+ + + + + + + + + + + + + + +
+ + + + + + + + + + + + + + +
+ + + + + + + + + + + + + + +
+ + + + + + + + + + + + + + +
+ + + + + + + + + + + + + + +
+ + + + + + + + + + + + + + +
+ + + + • I + + +
I Type m Type Ir Type I
FIGURE 6-1. COMMON FUSELAGE DOUBLER DESIGNS
6-1

Type III (or Type C) fuselage repairs are temporary repairs. The expected life of a Type III
repair will generally be less than the life of a Type II repair. The design of a Type III repair is often
similar to a Type II repair, except that blind, protruding head fasteners are often used, instead of solid
fasteners, because internal access during installation of the repair is not required. Drag increases with
Type m repairs may result in some performance penalties, but these repairs are normally replaced by
a Type I or ll repair at some prescribed number of flights.
In actual practice different types of repairs are often used depending on the specific situation.
The choice between a Type I repair and a less permanent repair depends on the tradeoff between the
time and cost of periodically removing major components when performing inspections, and the added
time and cost of performing a Type I repair.
The test specimen was 20 inches in width with a single row of countersunk rivets along the
specimen centerline (to simulate a pre-existing row of rivets at a stringer) as shown in Figure 6-2.
Hot-section s1ringer ins1olled on backside
..L II steel doubler 4 (both sides) or wide grips
+++++++++ -4-5" + + + + + + + + +
I . + + + + + + + + + ~ + + + + + + + + +
~-8-K)"~ 12" I
I
l=====o==o====o o======fi 0 0 0
0 0 0 0
... ,.,.._ ______ 20"-------.. ~!
7.!." 2
I
FIGURE 6-2. TYPE Ill, DOUBLER SPECIMEN DESIGN
The material chosen was 2024-TJ clad sheet, in 0.040 and 0.050 inch thicknesses. The specimen
shown here represented a Type III, or temporary repair. It consisted of a single doubler applied on
the outside of the "fuselage" over a cutout (to remove prior damage). To simulate the lack of
6-2

internal access, blind rivets were specified. Beyond Type III repairs, both Type I and Type II
doubler repairs were also to be examined, but the experimental effort was discontinued before that
work could be undertaken.
Before proceeding with testing it was necessary to demonstrate that the loading arrangement for
the samples was adequate to produce nearly uniform stresses across the test section of the test
samples. A fmite element analysis of the first candidate loading arrangement showed an uneven stress
distribution over the central section of the repair panel. One simple solution that was considered was
a substantial elongation of the test sample, but this was deemed impractical because of the available
panel widths and practical constraints imposed by the available test systems. As a relatively simple
alternative, in order to obtain a more uniform stress distribution across the center of the repair panel,
a spreader bar (or "whiffletree") assembly was designed. Figure 6-3 shows a plan view of the
assembly.
r---2.5- Note: All d1mens10ns in inches I
ri I
t• ("4
~ ~ k t G> G> G> G> 2
-~..:~- 0 G> 0 0 f-1- i-L5- _j_
3.5 I
+--~ ~ - /Z
1--~~--2- ~
3
0 i 0 0 0 0 I T 5
3 .rfz14l
-t-- 5 0 6t0j_ I
1 cJ 2
0 075
• 0 00.75 I
--l 1.75 1.75 p- 5
3.5
l l 5
10 • •
16
FIGURE 6-3. SPREADER BAR OR WIDFFLETREE FIXTURE DESIGN
Figure 6-4 shows the results of a finite element analysis on a symmetrical 1/4 section of the
specimen loaded with these grips. The computed stresses in the repair section were constant across
the center of the sample within 98 percent accuracy.
6-3

Cdti<Ol T"t Section-~-9-:....,.,..r:.·o:... .. ~.o=.:,.,.,. ,.....t;..e~.: ....... ~e ......... :~c:::...·.-:~Q~o... --'0
~.:-)'
~· ····· ···•·•• ........ ··· ..... ···•••• Vertical Centerline
/~. ::::·:.:.:.:::::;;;::::::·:: :.·:.::::: .. :::::·:
21012. 2lZI457. 1-=i~02. 1~347, 187'=12. 18257. 17692. 17127. 18572. 16~17. 15462. 14~~7. 14352.
FIGURE 6-4. FINITE ELEMENT ANALYSIS OF 1/4 REPAIR PANEL
When the grip assembly was completed, a blank specimen was prepared and strain gaged and
the uniformity of the stress field in the repair section was confirmed experimentally. This was done
by fabricating a test panel without fastener holes and then strain gaging it. Figure 6-5 shows the test
panel with the gage locations identified. The panel was loaded in increments to 16,000 pounds and
strain readings were taken at 0, 5000, 10,000, and 16,000 pounds (which corresponded to stress
levels of approximately the same magnitude in ksi, since the cross-sectional area of the sample was
about 1 in2). The range of variation in strains within the row of gages 7 inches off of the centerline
was within ± 6 percent, with the higher readings near the center of the sample as expected. The
variation in strains from nominal along the centerline of the sample was smaller (within
± 3.5 percent), again with the lower readings near the edges. These results were considered
sufficient evidence that the nominal stress variations within the region of the doubler repairs would be
small.
It is required by the FAA that known fatigue cracks be removed before a repair is completed.
As a result, the removal of fatigue damage prior to repair is common practice in the field, as
indicated by detail procedures recommended in SRM's for both B737 and DC-10 aircraft. Therefore,
it was decided that the damaged condition should be represented by the insenion of a cut-out in the
base sheet, just as is recommended in most SRM's for a fuselage skin repair over a stringer.

• t 1 1 1 2" 0 0
1 I
1(90"),2 3 4 5(9o-),6 15" c--,- [) [) 1:1
~3"-e 31" 7 2 9 n+ I D
15 on 31" 14on 2
~~ ~ f 11(9o-),12 ~ ~k - il -
l"l- I ...
-IS"
I ~ 0 4 0 t'
- 2t" 2t" 2t" 2t" - t - 2i" 2i" 2t" 2t" -rJ" ()"
FIGURE 6-S. STRAIN UNIFORMITY VERIFICATION SAMPLE
An OKUMA MC-SV A numerically controlled machine was used to automatically and
accurately position all of the fastener boles in the repair sections. Typical aircraft fastener installation
procedures were used by experienced technicians. Installation tooling was loaned to Battelle by the
fastener supplier (Allfast Fastening Systems). First, BAC Rl5CE4D 3C countersunk solid rivets were
installed in the repair panels. Then NAS 13980 SAZ blind rivets were used to install the doublers on
these panels.
6-S

6.2 Experimental Plan
This test plan investigated the effects of skin thickness for baseline samples and Type III
repairs. The test matrix is shown in Table 6-1. The focus of these experiments was to provide
baseline fatigue propenies for undamaged fuselage skin material and demonstrate the effect of doubler
TABLE 6-1. MATRIX OF EXPERIMENTS
Fastener Damage Test Series Inner Layers Skin Outer Layers System Cutout?
1a Small coupons
(5 ea) 0.04· No
(5 ea) o.os· No
lb Single row unfilled boles
(5 ea) 0.04· No
(5 ea) o.o5· No1
lc Single row filled boles
(5 ea) 0.04· No1
(5 ea) o.os· No1
2a Standard bole pattern
(3 ea) 0.04· 0.5 X Skin Blind, No1
ProtNding
(3 ea) 0.04· • • Yes1
(3 ea) o.o5· • No1
(3 ea) o.o5· • Yes1
2b
(3 ea) 0.04· 1 X Skin Blind, No1
ProtNding
(3 ea) o.o5· Yes1
(3 ea) o.os· • No1
(3 ea) o.o5· • Yes1
6-6

thickness on the fatigue resistance of Type lli repairs. They also provided important information on
the actual stress distributions within these simple repairs as compared to analytical predictions.
Five specimen designs were used in the first series of experiments. Simple, unnotched
dogbane specimens, as shown in Figure 6-6 were used for the Test Series la experiments. The
Rolling direction
l t---- 4.00 --~
200 0.250 J.._ ~'-
~------- ------- 1.00 ----------e+-
~625~·1 t-------------12.50-----------... •-1·
Notes· I. Reference: ASTM des1gnat10n E466.
2. All d•mensions 1n 1nches. 3 Scale. 05"= 1"
FIGURE 6-6. UNNOTCHED DOGBONE SPECIMEN DESIGN
Series lb and lc specimen design is shown in Figure 6-7. These tests provided baseline fatigue
propenies for the skin material with countersunk holes drilled but no fasteners installed. These tests
also provided information on the amount of time spent in propagating a fatigue crack from the inside
of the countersunk hole to the surface of the skin, where it would normally be visually inspectable.
The filled-hole experiments also provided baseline fatigue propenies for a simulated fuselage skin at a
longitudinal stringer.
Test Series 2a and 2b focu~sed on simple variations in Type m doubler repairs to isolate
effects of base skin thickness, doubler thickness and skin repair (cutout) on fatigue crack initiation and
growth propenies. Blind protruding head rivets were used for all of these doubler repairs as shown
in Figures 6-8 and 6-9.
6-7

~-----coo------~ 15.00
FIGURE 6--7. BASELINE REPAIR SAMPLE WITII UNFILLED AND FILLED COUNTERSUNK HOLES
·i
- -.__..,.- ,.... ""'J' + + • .,........- + ~ r---... .__ _ __, -----· ,:!:._+_.!,...:!;_ __ t_.;!_~_._ ------
------+~~.-*·~~~_.~,~~~~~~-£ ------- .-... -.- ~--.. -•. ~-------+ + + + + + + + + + + + + + + + + + + + + + + +
~-----ooo-----~~
•
. r!:Ji±t-l·!=H~:=:= FIGURE 6-8. REPAIR SAMPLE WITIIOUf CUfOUT
6-8
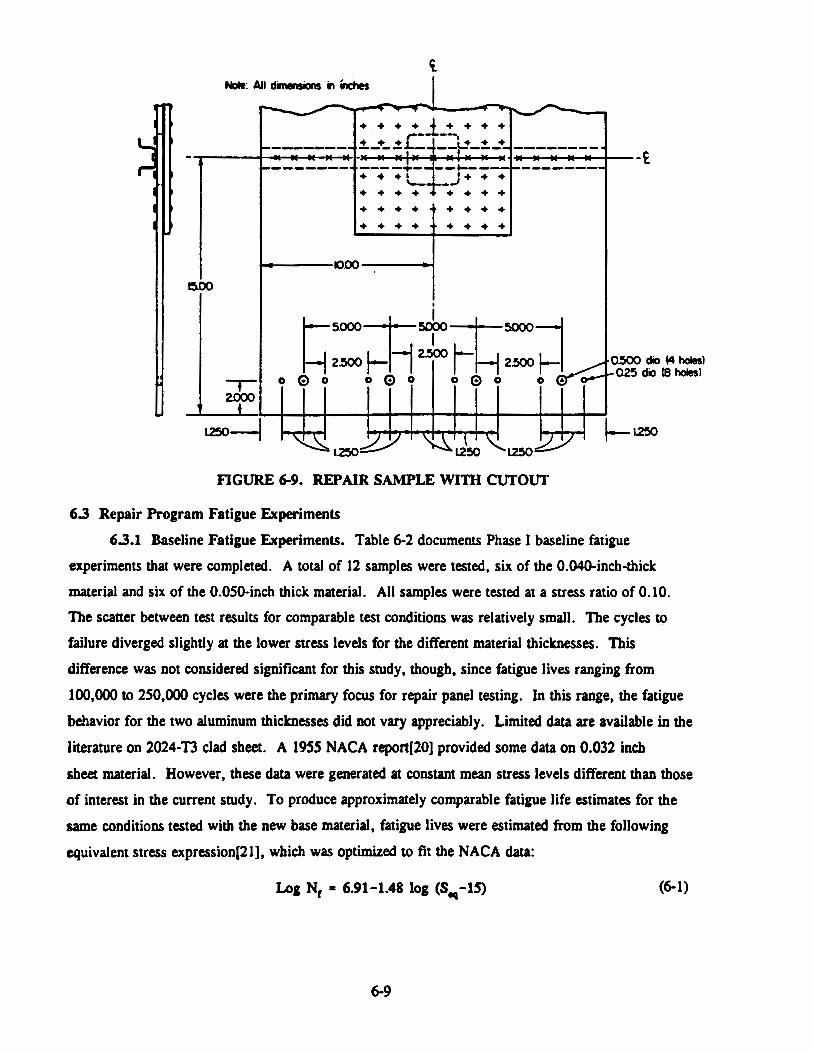
15.00
Note: All dimensions in Inches
+ + + + + + + +
+ + + +
~------000------~
1250---1 1.250
+ + + + + + + +
+ + + +
FIGURE 6-9. REPAIR SAMPLE WITII CUTOUT
6.3 Repair Program Fatigue Experiments
0.500 clio 44 holes} 025 dio (8 holes}
6.3.1 Baseline Fatigue Experiments. Table 6-2 documents Phase I baseline fatigue
experiments that were completed. A total of 12 samples were tested, six of the 0.040-inch-thick
material and six of the 0.050-inch thick material. All samples were tested at a stress ratio of 0.10.
The scatter between test results for comparable test conditions was relatively small. The cycles to
failure diverged slightly at the lower stress levels for the different material thicknesses. This
difference was not considered significant for this study, though, since fatigue lives ranging from
100,000 to 250,000 cycles were the primary focus for repair panel testing. In this range, the fatigue
behavior for the two aluminum thicknesses did not vary appreciably. Limited data are available in the
literature on 2024-T3 clad sheet. A 1955 NACA repon[20] provided some data on 0.032 inch
sheet material. However, these data were generated at constant mean stress levels different than those
of interest in the current study. To produce approximately comparable fatigue life estimates for the
same conditions tested with the new base material, fatigue lives were estimated from the following
equivalent stress expression[21], which was optimized to fit the NACA data:
Log N, -= 6.91-1.48 log (S-.-15) (6-1)
6-9

where, with the exponent, m, equal to approximately 0.55
(6-2)
TABLE 6-2. SUMMARY OF BASE MATERIAL FATIGUE TEST DATA
Sample Thiclcness, in. 0.039 0.048 0.032(1)
Maximum Stress<2>, ksi (Specimen Number) Cycles to failure
45 (2) 67,200 (9) 59,600 59,500
45 (3) 80,700 (8) 62,000
30 (1) 239,100 (7) 338,000 174,000
30 (4) 228,700 (10) 320,300
20 (5) 1,145,500 (11) 10,361,500{3) 1,090,000
20 (6) 1,162,000 (12) 10,358,000(3)
(1) 1955 NACA Report, Reference [18]. (2) Stress ratio of 0.10 for all samples. (3) Did not fail.
In the mid-life range of interest both thicknesses of the current material corresponded
reasonably well in terms of fatigue resistance with the previously reponed clad sheet data. As might
be expected the 0.040 clad sheet material more closely matched the fatigue trends of the previously
studied 0.032 clad sheet material.
6.3.2 Repair Panel Fatigue Experiments. Table 6-3 summarizes the results of repair panel
fatigue experiments that were completed. A coordinate system based on rivet location, as shown in
Figure 6-10, is used in the comments section of this table to describe the sites of crack initiation.
Specific observations made on selected samples are summarized in the following paragraphs.
Repair Sample 15. This sample contained a single row of countersunk, unfilled holes along
the center line. This sample was not instrumented for crack detection. The first cracks were
observed in the third, fourth and fifth holes to the right of the center of the sample at 163,000 cycles.
The cracks grew from this area, and subsequently, in adjacent holes. At 164,000 cycles cracks were
detected in the third and fourth holes to the left of center of the sample. The cracks on both sides of
6-10

9' ..... .....
Type of Specimen
Baseline (unfilled holes)
Baseline (solid rivets)
Type Ill (no cutout)
Type Ill (Cutout)
TABLE 6-3. RESULTS OF TEST ON BASELINE AND TYPE Ill REPAIRS
t(Skin) t(Patch) (JINX Cycles (to Cycles (to No. (in.) (in.) (ksi) initiation) failure) Comments
14 0.039 -- 15 42,530 Failed in Grips
15 0.039 -- 15 163,000 167,430 lnit@ (3,0), MSD
16 0.048 -- 15 106,780 148,050 lnit@ (-1,0), No MSD
21 0.039 -- 18 68,360 93,580 lnit@ (5,0)
26 0.039 -- 18 76,170 104,030 lnit@ (-9,0), (12,0), MSD
17 0.048 -- 15 657,800 Did not fail
17 0.048 -- 18 86,580 106,950 lnit@ (-1 1,0), No MSD I
22 0.039 -- 18 320,800 Did not fail I
27 0.049 -- 18 567,860 I
18 0.048 0.048 15 315,100 Did not fail
18 0.048 0.048 18 unknown 21,730
19 0.039 0.038 18 94,110 96,620 lnit @ (0,4) (Top rivet row)
23 0.038 0.039 18 135,680 136,580 lnit site unknown
24 0.048 0.024 18 192,760 196,510 lnit@ (4,-4),(0,-4), MSD
30 0.039 0.019 18 126,000 152,210 lnit between (-4,-4) and (-4,-3)
31 0.048 0.048 18 156,870 160,920 lnit (3,4) and (4,4)
25 0.039 0.039 18 148,480 149,220 lnit@ (2,-4), (-1,4)(-2,4) (-3,4)(-4,4) MSD
20 0.049 0.024 18 105,670 Failed@ edge of cutout
28 0.048 0.048 18 181,670 187,910 lnit@ (-4,4), MSD
29 0.038 0.019 18 159,920 166,410 lnit@ (-3,-4) --- ------------

y
L, --1 3n t::;;-4 (4,4) • • • • • • • • • • • • • • • • • • • • • • • • • • ._1_
3n 4
• • • • • • • ·--,-(-6,01 l&,ol
)( )( )( )( )( )( )( )( )( )( )( )( ~ )( )(
Solid rivets
• • • • • • in skin
• • • • • • • • • • • • • • • • • • • • • • • • • •
~Pop rivets
(-4,4)
FIGURE 6-10. RIVET WCATION COORDINATE SYSTEM
the sample continued to grow and join up until approximately the center third of the sample was
cracked. At this point the entire sample failed. The total cycles to failure was 167,430.
Repair Sample 16. This sample also contained a single row of countersunk, unfilled holes
along the center line. This sample was instrumented with crack detection gages on both sides of each
hole. The first crack was detected on the right side of the first hole to the right of center at
106,780 cycles. A crack was detected on the other side of the first hole at 115,880 cycles. Cracks
were detected at the third and fourth holes to the right of center at 136,060 cycles. The sample failed
at 148,050 cycles.
Repair Sample 17. Sample 17 contained a single row of countersunk, solid rivets along the
center line. The sample was instrumented with crack detection gages on each side of the rivet heads.
No detectable cracks formed after 657,800 cycles at a maximum stress of 15 ksi, so the maximum
stress was raised to 18 ksi and the test continued. The first crack was detected on the right side of
the fifth hole to the right of center at 86,580 cycles. A crack was detected on the left side of Hole 5
at 92,050 cycles. The crack in Hole 5 grew to Hole 4 and another crack was detected at the right of
Hole 3 at 93,020 cycles. A crack was detected to the right of Hole 4 at 103,780 cycles and another
was detected in the left of Hole 6 at 105,280. The sample failed at 106,950 cycles beyond the initial
657,800 cycles.
6-12
X

Repair Sample 18. This sample contained a repair patch that was of the same thickness as the
base material. There was no cutout in the base sheet. This sample was used for the rivet
displacement measurements described in Section 6.4. The sample ran for 315,100 cycles at a
maximum stress of 15 ksi without developing any visible cracks. The maximum stress was raised to
18 ksi and the counter reset. The sample failed along the bottom row of rivets in the repair panel at
an additional 21,730 cycles. Fatigue cracks were evident in three of the interior holes from this row
of rivets. A single fatigue crack was detected in the opposite outer row of rivets, again near the
center of the patch. For this configuration the early indications were that fatigue cracking would
generally not begin at the comers of the patch, but would start at one or more of the inner rivets in
the outside rows. This result was not anticipated because analytical predictions suggested that the
comer rivets would be most critical, although only slightly more so than the inner rivets in the
outside row. Slightly higher than nominal stresses at the center of the test panels probably
contributed to this trend.
After these initial experiments a decision was made to use a stress level of 18 ksi as a standard
for the remainder of the Phase I repair experiments. The requirement to use this relatively high stress
level (compared to in-service fuselage pressurization stresses) to produce .. reasonable" fatigue lives
was not too surprising considering the fact that the countersunk rivets in the skin were selected to
avoid feather edges, typical of most current aircraft designs. It was also decided that it would be
prudent to use crack detection (continuity) gages along both outer rows of rivets to provide additional,
detailed information concerning exactly when and where the fatigue cracks typically initiated.
Table 64 summarizes the fatigue crack initiation life statistics for the tested repair samples.
The data are subdivided by base skin thickness because it was evident for almost all conditions that
the 0.039 inch 2024-n clad sheet repair panels provided lower fatigue resistance than the 0.048 inch
repair panels. Table 64 also suggests an interesting relationship between the size of the cutout and
doubler thickness. For the repairs without a cutout, fatigue lives tended to go down as the thickness
of the doubler was increased. The fatigue lives dropped from over 500,000 cycles with no doubler,
to 131,000 cycles when a doubler was added of the same thickness as the skin.
The critical parameters related to the observed fatigue lives for these repair panels
can be described in the following expression:
where
N, (X 10-5) = 2.304 (DI) - 0.687 (D2) + 0.116 (D,)
D1 = Skin thickness (X 20), inch D2 = Doubler thickness (X 20), inch D3 = Cutout width, inch.
6-13
(6-3)
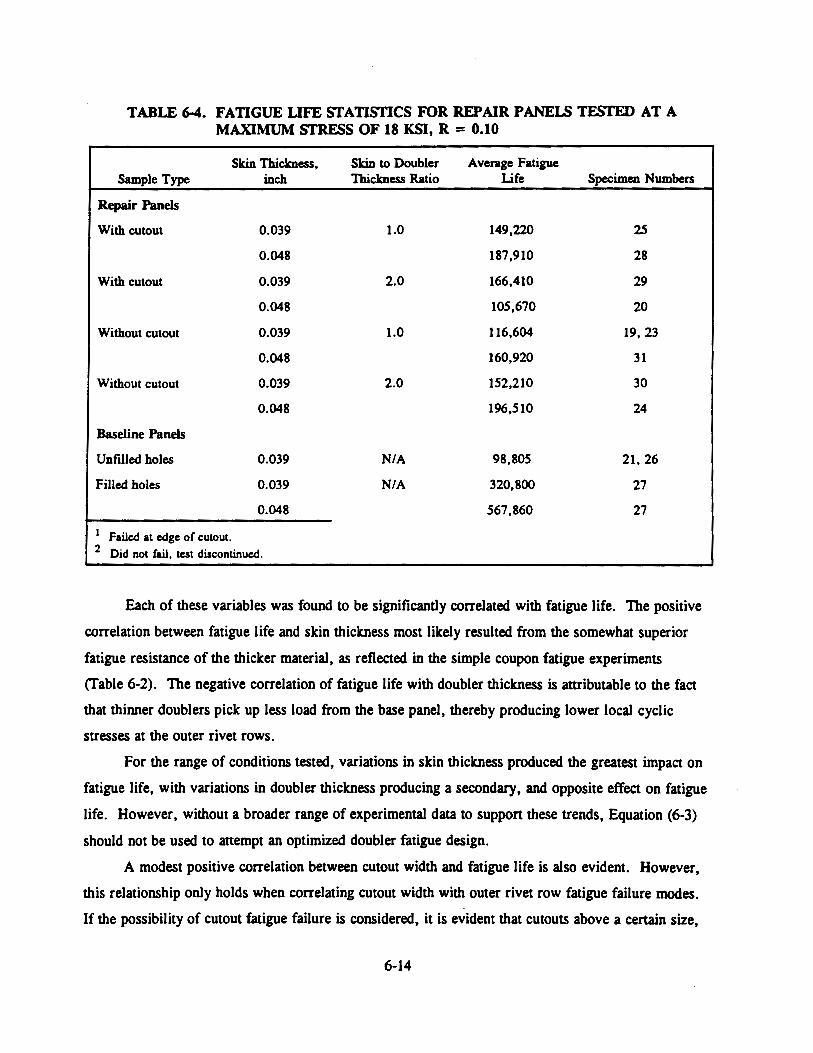
TABLE 6-4. FATIGUE UFE STATISTICS FOR REPAIR PANELS TESTED AT A MAXIMUM STRESS OF 18 KSI, R = 0.10
Skin Thickness, Skin to Doubler Average Fatigue Sample Type inch Thickness Ratio Life Specimen Numbers
Repair Panels
With cutout 0.039 1.0 149,220 25
0.048 187,910 28
With cutout 0.039 2.0 166,410 29
0.048 105,670 20
Without cutout 0.039 1.0 116,604 19, 23
0.048 160,920 31
Without cutout 0.039 2.0 152,210 30
0.048 196,510 24
Baseline Panels
Unfilled holes 0.039 N/A 98,805 21,26
Filled holes 0.039 N/A 320,800 27
0.048 567,860 27
I Failed at edge of cutout. 2 Did not fail, test discontinued.
Each of these variables was found to be significantly correlated with fatigue life. The positive
correlation between fatigue life and skin thickness most likely resulted from the somewhat superior
fatigue resistance of the thicker material, as reflected in the simple coupon fatigue experiments
(fable 6-2). The negative correlation of fatigue life with doubler thickness is attributable to the fact
that thinner doublers pick up less load from the base panel, thereby producing lower local cyclic
stresses at the outer rivet rows.
For the range of conditions tested, variations in skin thickness produced the greatest impact on
fatigue life, with variations in doubler thickness producing a secondary, and opposite effect on fatigue
life. However, without a broader range of experimental data to support these trends, Equation (6-3)
should not be used to attempt an optimized doubler fatigue design.
A modest positive correlation between cutout width and fatigue life is also evident. However,
this relationship only holds when correlating cutout width with outer rivet row fatigue failure modes.
If the possibility of cutout fatigue failure is considered, it is evident that cutouts above a certain size,
6-14

combined with relatively thin doublers, will almost certainly move the fatigue failure site to the cutout
(as occurred with Specimen No. 20), away from the outer row of rivets. Of course, this is a
condition that the repair is normally supposed to remedy, but it also shows the tradeoffs that must be
made in effective fatigue design of a doubler repair.
These results reinforce the concept that there should be an optimum size (as well as thickness)
for the doubler for a particular skin thickness and cutout size.
6.4 Doubler Strain and Displacement Measurements
Two COD-type clip gages were developed for rivet displacement measurements. These gages
were designed to span two adjacent rivets in order to precisely measure their relative displacements.
One of these gages was calibrated and used to measure the displacements of the first two rows of
rivets above the centerline of the sample and the displacements of the last two rows of rivets (see
Figure 6-11) in one of the repair panels. Table 6-5 shows the results of these measurements.
15.00
Note: All dimensions in inches
-r 2.000
..-----10.00 -----i
I '
t-5.ooo-t-s+o T5ooo-l 1-1 2.500 r--11
2"500
t-1--12.500 r-1 o e o o 0 o o 0 o o •
1.250--l
1.250 1.250
0.500 dio (4 holes) 0.25 dio (8 holes)
1---1.250
FIGURE 6-11. REPAIR PANEL WITII WCATION OF DISPLACEMENT MEASUREMENTS NOTED
6-15

The instrumentation used to read the clip gages was not grounded to the test sample during the
first two series of measurements which resulted in less precision in the measurements than in the fmal
two sets of measurements. Once this problem was resolved, the readings were stable and repeatable.
These results demonstrated the potential of these gages to measure displacements within an accuracy
of± 50 microinches, which equates to a resolution of rivet loads for 0.040-inch thick sheet/doubler
combinations to within about ± 10 pounds. Calibration checks of the gages also showed them to be
linear within 10 microinches over the design range of± 0.0020 inches.
TABLE 6-5. RESULTS OF RIVET DISPLACEMENT MEASUREMENTS ON TEST SAMPLE NO. 18
Location Stress (ksi) Displacement (in.)
End, 1st 2 Rows of Rivets 5.2 0.00 (1)
10.4 0.00 (1)
15.6 0.00028<1>
End, last 2 rows of rivets 5.2 0.00 (1)
10.4 0.00028(1)
. 15.6 0.00076(1)
. 5.2 0.00014
10.4 0.00035
15.6 0.00076
<1> Instrumentation not grounded to sample.
One of the test panels, Specimen No. 25, was extensively strain gaged to measure skin and
doubler stresses between the rivets. Rivet displacements were measured on both sides of the sample
for all adjacent rivet rows. The results of these measurements are shown in Figures 6-12 and 6-13.
The comparison of these results with the compatible displacement analysis predictions is included in
Section 4.4 of this report. Since additional, fully instrumented samples could not be completed, an
accurate estimate of the uncertainty in these measurements could not be established. Additional work
needs to be focused on this area, if valid comparisons are to be made between the repair panel
experiments and any model that will be used to explain the results.
6-16

Legend ,.,.-..._,
f \stresses \ I \ / , __ .,
Displacements between rivets
Rivet
~ ,-... 15 '43' 17 I . \
I ) I (8) \ (2.5 I (6)
? ' /
~ __ ....
10 10 (4) (4)
~ ~ , .... -, ,-, ,' 10.0\ " ' 9 8 f 10.1 \
14,000 lb} . (7000 lb) ksl
14,000 lb} 0000 . ( 7000 lb) 1 tn.
Doubler
~ ~ /45"\ ,-,
II 9 /5.4\ (4) \ (2.9)) (3) \ (3.3))
? ' "
~ ' "
.... __ .... __
,--, t'll.3\ 8 / 10.1 \ 3
(3) \ (5.2) ) (I) "(5.8) /
~ ' /
b , ___ ,
... _ ...
7
I \ \ I
~ ' \ I I
8 \ (3) I
? ' \ I
I I
I \ (I) \
b I I I
' I I ' (3) \ (5.2) / (3) \ (5.1) ,' (4) __ J
b ,_.,.,
~ , ___ ,/
b ,---------, I I I
,- ... ... - .... I /10.2', " ' I I 10.3 \ \ (5.3) } \(5.3)/ I
I ' / , __ ,
--"" I I
--~-~-~~---~--~--~----~----j
0.039 Panel with 0.039 patch Specimen No. 25 (with cutout)
+
FIGURE 6-12. DOUBLER STRESSES AND RIVET DISPLACEMENTS FOR SPECIMEN NO. 25
6-17

--I
t 7 (5)
t 10 (5)
... --/ ' 1 18.0 \ \ (8.4) I ,, _ _.,/
... - .... / ' I ' ,
, :stresses \ " , __ .,
Displacements between rivets
Legend
14,000 lb} . (7000 lb) ksl
14,ooo lb}oooo . (7000 lb) . I ln.
Doubler Rivet
------~----------------- ---------.,
... -... f ... -... t ,---..... t /13.1\ 10 I ' 9 II /18.8\ 5 I 15.2 \ \ (5.7) } (6) \ (6.8) I (5) (6) •, (8.9) ) (2) ' " t '
"
f f ' "
__ , , __ ., , __ ,.
t ... - ... ... -...
/5.6\ / ' II I 11.5 \ 13 II II ', (2.3)/ (6) \ (5.1) I (7) (5) (5)
,...__,.,
i ....__ .. /
t f f ,--- ..... ,,.--, 13 I 13.1 \ 12 I 13.6\ II (7) ', (6.5) : (5) \(6.6) / (6)
~ ' /
~ i __ ... , __ ,
, ....... , , ..... -.... , ( 12.3\ ( 12.7 \ \ (5.7) ,' \~6.2)) '--""
__ , 8 8
Skin
..... - ... /16.3\ \ (8.D)
... _,
FIGURE 6-13. SKIN SfRESSES AND RIVET DISPLACEMENTS (SPECIMEN NO. 25)
6-18

7.0 RELIABILITY ASSESSMENT
7.1 Introduction
In recent years, the occurrence and interaction of damage and repairs at multiple sites have
been identified as important phenomena in damage tolerance assessment of older aircraft. In
July 1990, a U.S. Air Force C-141 at Altus, Oklahoma was found to be close to failure when damage
linked up between wing repair patches. The Aloha Air accident in Hawaii in April of 1988 showed
that damage in multiple sites can lead to significant structural failures in an aircraft. Multiple site
damage (MSD) is a rather general term. In the present context, MSD is defined as the existence of
multiple cracks in a line of rivet holes prior to propagation of those cracks to failure (whatever the
failure criteria may be).
Causative factors which correlate with MSD in aging aircraft, however, involve a number of
sources of statistical uncenainty. These are due to variabilities in fatigue crack initiation, fatigue
crack growth, crack detection probability, and loading environment. In panicular, the predicted
variability in fatigue crack growth depends greatly on the realistic distribution of initial crack sizes.
Rational treatment of these uncertainties and assessment of their impact on system performance and
recommended repair procedures can be achieved only by applying the theories of probability and
structural reliability. Clearly, MSD is a stochastic mechanics problem.
The configuration of a repair and its associated stress field are strongly dependent on the type,
size, and location of damage being repaired. The possibility of nearby MSD or otherwise damaged
elements must be assessed for a complete damage tolerant analysis of the repair. The complexities
involved in conducting a comprehensive reliability analysis for a commercial aircraft susceptible to
MSD and requiring repairs mandate that this effort be divided into several phases. As MSD (upon
detection) will require repair, and since it can significantly influence the damage tolerance of nearby
repairs, it will be necessary to satisfactorily describe the initiation and growth of MSD cracks in a
reliability analysis before additional issues of repair effects can be included.
This effon has focussed on the formulation of a novel probabilistic model to accurately
determine the reliability of aging aircraft susceptible to MSD. Although MSD has been emphasized,
the models are sufficiently flexible to accommodate other structural degradation factors that logically
would be included in the future.
7-1

There are several possible enchancements to this model. For example, various existing
databases could be explored to accurately characterize input variables (deterministic and random).
Then, the model could be used for a significant number of specific (real world) cases. It could
include the reliability assessment associated with additional sources of damage and variability such as
repair location and size. Finally, the model could integrate all of these results into a framework that
would provide a tool for assessing the reliability of aircraft as a function of relevant parameters such
as age, probability of crack detection, inspection interval, flight load distribution, and others.
7.2 State-of-the-Art Review
Previous studies on probabilistic aspects of risk assessment for aging aircraft were critically
reviewed. In recent years, there have been several research activities on multiple site damage. They
have included both deterministic and probabilistic studies which were conducted by Orringer[22],
Mayville[23], and Broek[24-26]. Both Orringer and Mayville investigated mainly the
deterministic issues related to MSD. In Reference [24], a probabilistic model was developed in which
the factors effecting initiation and growth of MSD cracks were investigated. The loading environment
was assumed to be deterministic and the nominal stress distribution over a fuselage bay (as it is
affected by frames, tear straps, and stringers) was obtained from linear elastic fracture mechanics
analyses[27]. The statistical characterization of random parameters governing crack initiation and
growth was performed by analyzing test data on lap joint specimens. An array of 100 fastener holes
in a critical row of a fuselage lap joint was considered. Crack initiation and growth properties were
randomly assigned in accordance with their cumulative distribution functions. They were then
assessed on the basis of local stress level, in which the effects of membrane stress, fastener load, and
local bending stress were included. The growth of these cracks was incremented every 100 cycles,
and inspections were performed at regular intervals with the basic probability of detection (POD)
curves based on U.S. Air Force (USAF) inspection data. This led to the computation of cumulative
probabilities of detection (CPOD) during a series of periodic inspections from crack initiation at the
first fastener hole. Figure 7-1 shows the plots of CPOD versus length of inspection interval (eddy
current) for various MSD cracks obtained from Reference [23]. Results suggest that there is a
precipitous drop in CPOD, if the inspection interval is longer than 3500 flights (pressurization
cycles). On the basis of worst case values, it was also concluded[28] that an inspection interval of
about 1800 flights would be required to provide a CPOD value of 95 percent.
7-2
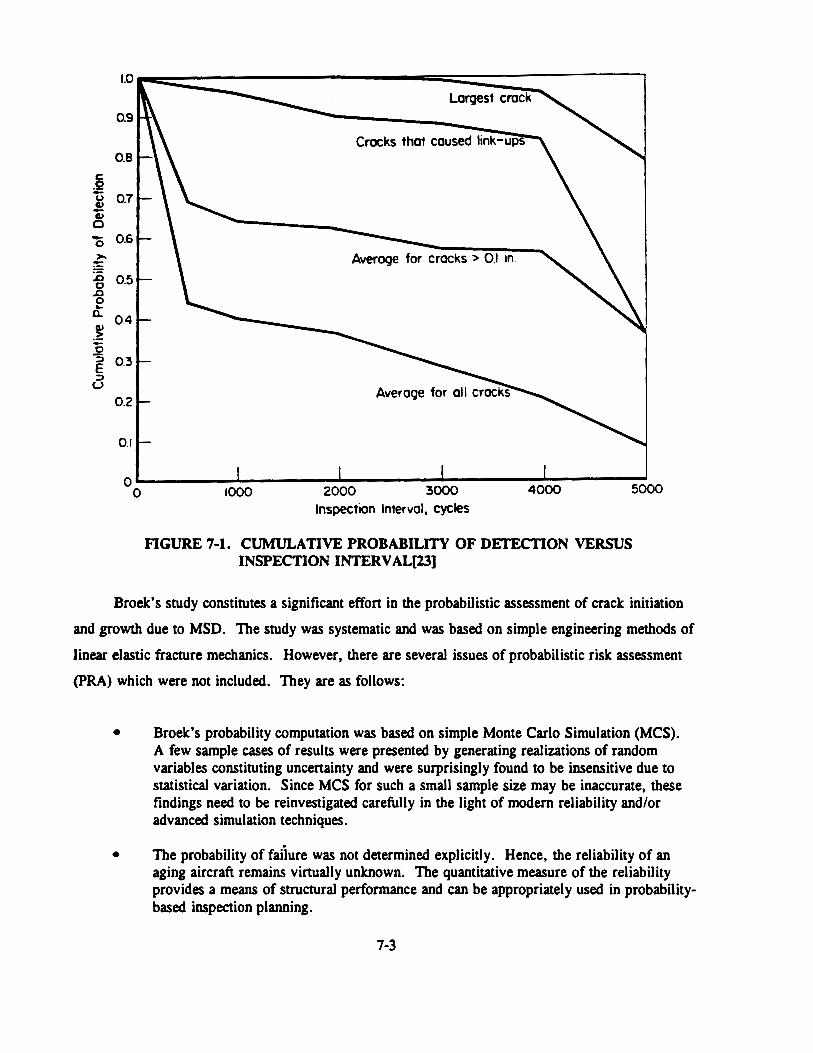
0.8
c .Q - 0.7 u G> -G> 0 - 0.6 0
>-~ :0 0.5 0 .c 0 ~
~ 0.4 G> -~ 0 ::1 0.3 E ::1 u
0.2
0.1
0 0
Largest crock
Crocks that caused link-ups
Average for crocks > 0.1 tn
1000 2000 3000 4000 5000
Inspection Interval, cycles
FIGURE 7-1. CUMULATIVE PROBABILITY OF DETECTION VERSUS INSPECTION INTERVAL[23]
Broek's study constitutes a significant effort in the probabilistic assessment of crack initiation
and growth due to MSD. The study was systematic and was based on simple engineering methods of
linear elastic fracture mechanics. However, there are several issues of probabilistic risk assessment
(PRA) which were not included. They are as follows:
• Broek's probability computation was based on simple Monte Carlo Simulation (MCS). A few sample cases of results were presented by generating realizations of random variables constituting uncertainty and were surprisingly found to be insensitive due to statistical variation. Since MCS for such a small sample size may be inaccurate, these findings need to be reinvestigated carefully in the light of modern reliability and/or advanced simulation techniques.
• The probability of faiiure was not determined explicitly. Hence, the reliability of an aging aircraft remains virtually unknown. The quantitative measure of the reliability provides a means of structural performance and can be appropriately used in probabilitybased inspection planning.
7-3

• The issue regarding desirable (target) CPOD was not addressed. Obviously, this probability cannot be arbitrary. Once again, a reliability analysis needs to be performed, so that the target CPOD can be based on .. acceptable .. risk.
• Maintenance considerations on MSD were focussed on the evaluation of optimal interval inspection intervals. Inclusion of parameters which affect repair quality and their statistical variability (if any) were not included.
Despite these limitations, the study described in Reference (24] demonstrated the need and the
feasibility of probabilistic analysis of aging aircraft subjected to multiple site damage.
The Aircraft Structural Integrity Program (ASIP) of the U.S. Air Force (USAF) traces its
origin to B-47 failures in 1958. ASIP was established based on the recognition that repeated loads
were a threat to the safety of an operational aircraft. This threat has been successfully controlled
through the adoption of the damage tolerance approach in 1975. This approach, also referred to as
.. retirement for cause .. , was used as a basis for the inspection/modification program to maintain safety
throughout the life of the aircraft. In a recent technical paper by Lincoln[29], occurrences of
MSD on USAF aircraft and their influence on service lives were discussed. This was done through
the experiences derived from the KC-135, C-5, and C-141 aircraft. In summary, it was shown that
detection and prevention of MSD should be a major factor in the life management program for wing
structures, in addition to other components of an aircraft. For an aircraft where the maintenance of
fail safety is vital to the operational safety of the aircraft, it is essential that there be an assessment of
the timing of the loss of fail-safety from MSD.
Initially, the USAF damage tolerance requirements were based on deterministic rather than
probabilistic approaches. The initial flaw size was postulated as a specific number, and the critical
crack length was based on a specific load. Also, the inspection capability was based on one point of
the POD curve, i.e., all cracks longer than the one corresponding to this point value are assumed to
be found when the aircraft is inspected. For example, this point was chosen to be associated with
90 percent probability of detection. The selection of the 10 percent upper fractile from the
cumulative distribution function of the smallest detectable crack size is somewhat arbitrary. Questions
regarding the safety, or level of reliability associated with this specific POD value were examined in
Reference [29] which also presented a risk assessment methodology originally developed in
Reference [30]. The study also evaluated the adequacy of a USAF damage tolerance inspection
criterion for protecting the safety of an aging military trainer aircraft. This was done though the
above-mentioned risk assessment methodology based on cracks found in teardown inspections of
retired wings. The crack propagation was combined with stress probabilities representing service
7-4
experience to determine single flight probabilities of failure and the single aircraft probability of
failure after a given time. For the case studied, the single flight probabilities of failure at a specific
location with an inspection interval obtained from the deterministic damage tolerance criterion was
found to be 0.4 before the next inspection was due. This failure probability is unacceptably high and
hence, the inspection program obtained from the deterministic method must be treated as
unconservative due to the inadequate level of reliability.
Another study on risk analysis for aging aircraft fleets was carried out by Berens[31] under
the sponsorship of the Flight Dynamics Directorate of the Wright Laboratories in Dayton, Ohio. It
comprises an evaluation of the probability of failure due to a flaw in a structural element as well as a
determination of optimal inspection intervals based on minimization of maintenance costs. There
were two basic calculations: one involved the development of a probability density function of crack
size from a beginning reference time to an arbitrary time within a period of uninterrupted usage, and
the other involved the quantification of the effects of inspection and repair-if-necessary actions due to
periodic maintenance. In both cases, elementary principles of probability theory were applied.
The probabilistic model described above has the merit of analytical treatment as opposed to a
.. brute force .. approach like MCS as done in Reference [24]. However, it differs from a
comprehensive reliability assessment in the following ways:
1
• The model is primarily developed for a single flaw which considers only the probabilistic aspects of crack growth. When there are multiple flaws, it is assumed that (all) cracks have already developed and their subsequent growth is independent. In practice, however, as an aircraft ages, there will be both crack initiation and growth at the same time, mainly due to differential stress fields and crack tip stress intensities. Simultaneous crack growth at all critical locations may not be realistic.
• The model disregards uncertainty in the crack growth parameters. For example, when a Paris equation1 is used, the model does not take into account the stochastic variability of the Paris coefficients. Crack growth data obtained from experiments on the 2024-T3 aluminum alloy have shown that the Paris coefficients are indeed random variables with possible correlation[32-33]. If the uncertainty of these coefficients and any other relevant parameters needs to be included, the evaluation of single flight probabilities of fracture proposed in Reference [31] becomes immensely difficult. This complexity arises because the dimension of the probability integral (Equation (4) in Reference [31]) increases greatly. Since analytic and/or numerical probability integration in large dimensions becomes prohibitive, alternative methods need to be developed to calculate
Assumed log-linear relationship between crack growth rate and stress intensity factor range, see Section 7 .3.3.
7-5

this failure probability. This can be a very serious limitation of the risk methodology proposed in Reference [31] unless such alternative means are found.
• The probabilities were calculated for a crack in a single element (stress raiser). Global risk assessment in an airframe which comprises many identical elements is performed by invoking independent assumptions. This may not be valid unless the loading environment in these identical elements is truly independent.
7.3 Development or the Probabilistic Model
7.3.1 Structural Loading Environment. Consider a fuselage lap joint which is subjected to
multiple site damage (MSD) in a large series of fastener holes. Assume that R is the fuselage radius,
tis the skin thickness, Ds is the shank diameter, Dh is the fastener head diameter, sis the fastener
spacing, and p is the random fuselage pressure with a known cumulative distribution function.
Figure 7-2 shows an idealized model used in a linear elastic stress analysis by finite element method
~ ..... ....... 406.4 mm ...... ......
,x~ .. ,,,. '..: , . , . . , .
,'. Jl , . ,'.. ,. , . /'• .
, ·. ,, .. , ,. ,/•,. .
/• ... ,, ,' · . ... , , .
._, • a .... •
Shear clip
Tear~
FlGURE 7-2. FlNITE ELEMENT MODEL OF A LAP JOINT (REFERENCES [24] AND [27])
(FEM)[27) and obtained from Ref~rence [24]. It consists of one half of a bay in a curved panel
subjected to the distributed fuselage pressure. The three-row lap joint is considered disbanded, so
that all of the load transfer occurs through the fasteners. Figure 7-3 exhibits an isolated hole which is
7-6

subjected to various stresses due to fuselage pressure p. They include membrane stress, fastener load,
and local bending stress. They are discussed below.
M
[I
fT - fT m p
FIGURE 7-3. CRACKED HOLE AT A LAP JOINT SUBJECTED TO VARIOUS LOADS
Membrane Stress. The membrane stress, u,, although varying through the bay due to the
frame and tear straps is proportional to pR/t and is given by[24]
(7-1)
in which .A1 is a proportionality factor.
Fastener Load. The fastener load depends upon the fastener flexibility. However, it is
assumed that for small changes in fastener size and skin thickness, the flexibility will not be changed
signifu:antly, and can be considered invariant for a given hole deformation. This fastener load, P, is
proportional to pRsh9 giving[24]
where A2 is a proportionality factor.
A7PRs P(p) =
t
7-7
(7-2)

Local Bending Stress. The local bending stress, ab• depends on the local bending moment due
to eccentricity of the fastener forces, which in tum depends on the skin thickness. Thus, ab is
proportional to pR/r giving[24]
(7-3)
in which .A3 is a factor of proportionality.
Using Equations (7-1), (7-22), and (7-3), the membrane stress, fastener load, and local bending
stress can be calculated for each fastener hole (Figure 7-3) following determination of the
proportionality factors A1, A2, and A3 via a deterministic finite element analysis. The stress analysis
is assumed to be linear elastic, so that results of FEM are proportional to load and geometrical
parameters. On this premise, the above stresses can be easily obtained for new parameter values.
Note that all these component stresses are random due to functional dependence on random fuselage
pressure p, and they are all perfectly correlated.
7 .3.2 Fatigue Crack Initiation. The fatigue strength for crack initiation is usually expressed
through the S-N curve (Wohler Curve), which gives the number of stress cycles N0 under constant
amplitude loading with a stress rangeS necessary to cause failure (initiation). Readily available
fatigue test data for joints can be obtained from References [23] and [34-39]. Of these sources, some
were for conditions and configurations not immediately relevant to the analysis of a fuselage lap joint.
However, the large data bases generated by Hartman[34] and Mayville[23] are relevant.
Figure 7-4 shows the scattergrams of initiation life N0 for several stress ranges obtained from
the experimental data produced by Hartman and Mayville. Hartman's data were very useful, because
they were generated from tests on adhesively bonded and riveted lap joints of a configuration almost
identical to the one used in fuselage structures for several types of aircraft. Hartman performed well
over 400 tests and investigated the effects of many parameters, such as different types of adhesives,
and surface treatments, as well as variations in temperature, loading frequency, and stress intensity.
The data obtained by Mayville also deserve attention. Instead of the basic lap joint as used by
Hartman, Mayville, however, employed specimens with short stiffeners which were attached to their
edges to simulate crack arrester straps found in some types of aircraft experiencing MSD. These test
~ which are also shown in Figure 7-4, fall within (but to the low side) of the scatterband exhibited
by the Hartman data.
7-8

50
45 -
40 ~
35 -·;;; .M.
u) 30 -.; g'
25 ~ 0 a:: ., ., Q) 20 -... -(/)
15 -
10 1-
5 -0
2
o Low frequency (Hortman) A Riveted only (Hortman) e Riveted only (Mayville)
0 00 0 00
0 CXlDODDO
I I I I 3 4 5 6
Number of Cycles, loo10N0
7
FIGURE 7-4. SCAITERGRAM OF CRACK INITIATION LIFE (REFERENCE [26])
Figure 7-4 clearly indicates that the initiation life, N0, for a given stress range is a random
variable. Broek's statistical analysis[24,25] of the consolidated Hartman data suggests that a Weibull
distribution of normalized initiation life N01E[N0] applies fairly well, where E[ •] is the mathematical
expectation operator with E[N0] representing the expected (mean) value of random initiation life N0.
It should be noted that the stresses are the nominal stresses away from the joint and they
represent hoop (membrane) stresses in a fuselage. Furthermore, all data were obtained for a stress
ratio of 0.05 or 0.10, while typical fuselage loading is essentially with stress ratio equal to zero.
Consequently, an assumption has to be made on the applicability of the above test results to the
slightly different fuselage loading.
7-9

7 .3.3 Fatigue Crack Growth. A wide variety of mathematical models for fatigue crack
growth are available in the current literature. The simplest and generally accepted model was
proposed by Paris and Erdogan[40] which has the kinetic equation
with the initial condition
a(O) = a0
(7-4)
(7-5)
where a = a(N) is the half crack length at N cycles, IlK is the change in stress intensity factor due to
the variation of fuselage pressure from zero top, C and m are material constants, and a0 is the initial
value of the half crack length.
Stress Intensity Factor. The stress intensity factor K can be calculated by the theory of linear
elastic fracture mechanics (LEFM). Following compounding and superposition[41-42] which are
allowable in linear elastic stress analysis, K can be decomposed as
(7-6)
where KA, K8 , K0 and KD are stress intensity factors which correspond to the various loading cases
shown in Figure 7-5. A derivation of Equation (7-6) can be obtained from Reference [24] and hence,
is not repeated here. From basic principles of LEFM, the component stress intensity factors KA• K8 ,
K0 and KD can be obtained as[41-42]:
(7-7)
(7-8)
(7-9)
7-10

M
-o-
-o-
-o-
p
p
tT - tT m P
tT - tT m P
FIGURE 7-5. ADDmVE DECOMPOSITION OF STRESS INTENSITY FACTOR
(7-10)
in which aP = Pits, ae.ff = a + D/2, D is the hole diameter, and We§ is the effective width introduced
to account for the effects of adjacent craclcs[24]. These equations were taken directly from
Reference [24]. From Equation (7-6), the total stress intensity factor K becomes
7-11

K = P o,J7taeff (7-11)
where
p = 0.39 [1 + 0.161 °e.ff ]
2
] 0
b + sec 11rae.ffll 1 _ .!. 0p] + .!. _s oP • (7-12
) we.ff a.. weff 2 o, 2 7(Qe.ff o,
Statistical Variability. Virkler, et al.[43-44] conducted a large replicate test program to
identify the contribution of material inhomogeneity to the statistical variability observed in laboratory
fatigue crack growth data (a vs. N). Crack growth data were generated from 68 identical 2.54 mm
thick center-cracked panels cut from the same sheet of 2024-T3 aluminum. This alloy is still used in
many aircraft fuselage structures. The replicate tests were performed under identical (within limits of
experimental accuracy) constant amplitude loading conditions and with the same initial crack lengths.
Under these carefully controlled conditions, the ensemble of crack growth curves exhibited in
Figure 7-6 indicates a considerable amount of scatter. In order to achieve sample curves as those
exhibited in Figure 7-6, the material constants C and m must be random variables for a given initial
E 0
O~r-------------------------------------------~~
0~------------_. ______________ ~------------~--------------~ 0 2 3
N, CyCles a 105
FIGURE 7-6. SCATI'ER IN CRACK GROWTH DATA FROM 68 REPLICATE TESTS (REFERENCE [33])
7-12

crack size and loading condition. Several options exis.: in modeling random crack growth behavior.
Both C and m can be assumed to be jointly distributed random variables[32-33,45]. Other possible
treatments include the use of Cas a random variable and mas deterministic[24,46], and the use of
Cas a random variable and mas a function of Q47]. Here, it will be assumed that In (C) and m
are correlated random variables with jointly distributed bivariate Gaussian distribution functions. This
was originally proposed in References [32] and [33]. More sophisticated models with random
processes simulating intra-specimen variability of crack growth were also considered by Ortiz and
Kiremidjian[32-33]. These approachs will not be addressed here. The statistical properties, such as
mean, standard deviation, and the correlation coefficients of the random variables In( C) and m can be
obtained from analysis of the Virkler data and are readily available in References [32] and [33].
In order to obtain a particular solution of the differential equation for crack growth life based
on the Paris model (Equation (7-4)), the initial condition specifying initial crack length ao must be
characterized. The initial crack length Do is assumed to be realized following fatigue crack initiation.
However, it has been found to be difficult to accurately quantify ao and currently, it is done rather
empirically. Broek[24] has used a deterministic value of ao = (Dh- D1 )12 with the argument that
smaller crack sizes would not be detectable. This is indeed true and relevant when inspection
intervals are based on cumulative probabilities of detection (CPOD), not the failure probability. In a
reliability analysis, however, the probability of failure may be significantly dependent on ao and
hence, a better deterministic and/or random description of ao is needed. In this study, a0 will be
treated as a uniform random variable with equal probability of occurrence between a judiciously
chosen lower and upper bounds.
7 .3.4 Structural Reliability Analysis
Structural reliability analysis requires a mathematical model derived from the principles of
mechanics and experimental data which relates various input random parameters for a specific
performance criterion of interest. For example, consider Equation (7-4) which when combined with
Equation (7 -11) becomes
(7-13)
in which it is noted that the stress ratio is zero due to the variation of fuselage pressure from zero to
p. Following separation of variables and subsequent integration,
7-13

a
N
= c [o.<p>r f d11 (7-14)
N•
where N0 is the number of cycles to crack initiation. Define a damage function which when
introduced in Equation (7-14) can be inverted to solve (implicitly) for the crack length as a function
of number of cycles N. When material and geometric properties are specified, the crack length at any
number of cycles N can then be obtained from Equation (7-16) for a given loading environment.
(7-15)
(7-16)
Consider a simple failure criterion
(7-17)
which is based on the exceedance of the crack length at N cycles beyond an allowable threshold, aP"
aP is defined as a permissible crack size and can be evaluated following the net-section collapse
criterion used in Reference [26]. Theoretically, aP is a random variable. However, since the crack
growth rate is very high near the permissible crack size, effects of aP on the variability of fatigue
failure threshold in rather small compared with other random variables involved in the system. This
fail-safe condition can be conveniently expressed in the traditional form where the performance
function
g(X) < 0 (failure)
g(X) = 0 (limit state)
g(X) > 0 (survival)
g(X) = aP - a(N)
= aP - y,-1(C [up(p))"' (N-No) ; Do)
7-14
(7-18)
(7-19)

in which X = {N0, tzo, C, m, p}T is a real vector of random parameters characterizing uncertainty in
all load and system parameters, and the superscript Tis a symbol for transpose of a vector. Note that
the performance function g(X) itself is random, because it depends on the input random vector X. In
the x space, the equation g(x) = 0 also known as limit state separates the domain D of X into the safe
set S = {x: g(x) > 0} and failure set 1 = {x: g(x) < 0}. This result is shown schematically in
Figure 7-7. The reliability Psis the complement of the probability of failure PF (Ps = 1 - PF). PF is
Domain D with Pr (:KED) -=1
FIGURE 7-7. DEFINITION OF BINARY LIMIT STATE IN ORIGINAL SPACE
defined as the probability that the failure event represented by Inequality 37 is true, i.e.,
dcf dcf
PF = Pr ~(X) < o] = I f;x(x) dx f(.r)<O
(7-20)
wherefx{x) is the joint probability density function of input random vector X = {N0, ao. C, m, p}T.
which is assumed to be known. In general, the multi-dimensional integral in Equation (7-20) cannot
be determined analytically. As an alternative, numerical integration can be performed, however, it
becomes impractical and the computational effort becomes prohibitive when the dimension becomes
greater than 2.
Several approximate methods exist for performing the multi-dimensional probability integration
in Equation (7-20). Among them: First- and Second-Order Reliability Methods
(FORM/SORM£48-53], Importance Sampling[48,54-58], Directional Simulation[59-61],
MCS£48,62], and many others can be applied to estimate PF in Equation (7-20). In this section, a
few of them will be presented with regard to their potential for use in an approximate reliability
analysis.
7-15

First- and Second-Order Reliability Methods (FORM/SORM). First- and Second-Order
Reliability Methods (FORM/SORM) are general state-of-the-art structural reliability methods. The
methods are based on linear (first-order) and quadratic (second-order) approximations of the limit
state surface g(x) = 0 tangent to the closest point of the surface to the origin of the space. The
determination of this point involves nonJinear programming (NLP) and is performed in the standard
Gaussian image of the original space.
The FORM/SORM algorithms involve several steps. They will be described here briefly
assuming a generic n-dimensional random vector X. First, the space of uncertain parameters x is
transformed into a new n-dimensional space u consisting of independent standard Gaussian variables.
The original limit state g(x) = 0 then becomes mapped into the new limit state gu(u) = 0 in the u
space. Second, the point on the limit state gu(u) = 0 having the shortest distance to the origin of the
u space is determined by using an appropriate nonJinear optimization algorithm. This point is
referred to as the design point or P-point, and has a distance PHL to the origin of the u space. Third,
the limit state gu(u) = 0 is approximated by a surface tangent to it at the design point. Let such limit
states be gL(u) = 0 and gQ(u) = 0, which correspond to approximating surfaces as hyperplane (linear
or first-order) and hyperparaboloid (quadratic or second-order), respectively (Figure 7-8). The
u space
gu(u) < 0
gu(u) > 0
FIGURE 7-8. LINEAR AND QUADRATIC APPROXIMATIONS OF LIMIT STATE IN GAUSSIAN IMAGE
probability of failure PF (Equation (7-20)) is thus approximated by Pr[gL(u) < 0] in FORM and
Pr[gQ(u) < 0] in SORM. These first-order and second-order estimates PF,J and PF,2 are given
by[48-53]
7-16
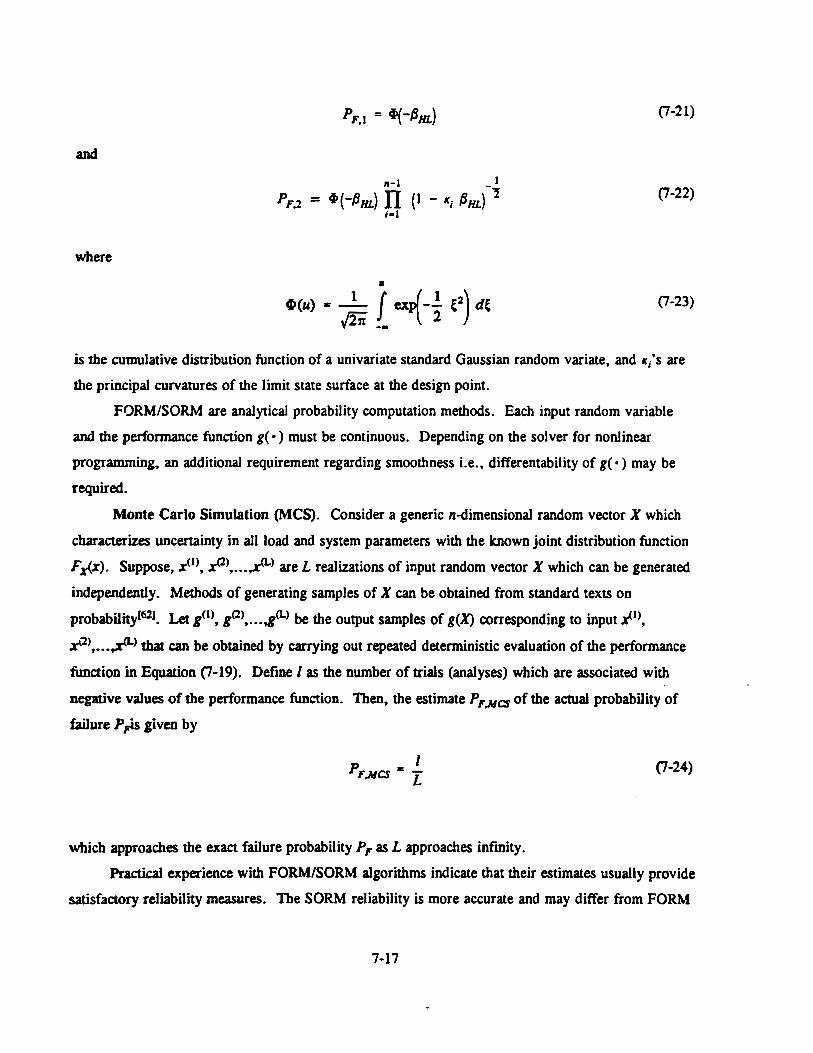
and
where
n-1 _ 1
PF.l = ~(-PHL} n (1 - l(i PHL} 2 1•1
• ~(u) = - 1
- J exrf -.! ~2) d~ ,fii -• r~ 2
(7-21)
(7-22)
(7-23)
is the cumulative distribution function of a univariate standard Gaussian random variate, and «;'s are
the principal curvatures of the limit state surface at the design point.
FORM/SORM are analytical probability computation methods. Each input random variable
and the performance function g( ·) must be continuous. Depending on the solver for nonlinear
programming, an additional requirement regarding smoothness i.e., differentability of g( ·)may be
required.
Monte Carlo Simulation (MCS). Consider a generic n-dimensional random vector X which
characterizes uncenainty in all load and system parameters with the known joint distribution function
Fx(x). Suppose, x(l>, x<l>, ••• ,x<L> are L realizations of input random vector X which can be generated
independently. Methods of generating samples of X can be obtained from standard texts on
probability162l. Let g(l>, g<l>, ••• ,g<L> be the output samples of g(X) corresponding to input rl), r'l> , ••• ,zCL> that can be obtained by carrying out repeated deterministic evaluation of the performance
function in Equation (7-19). Define I as the number of trials (analyses) which are associated with
negative values of the performance function. Then, the estimate P F .NCS of the actual probability of
failure P ,is given by
I PF,NCS = -L
which approaches the exact failure probability PF as L approaches infinity.
(7-24)
Practical experience with FORM/SORM algorithms indicate that their estimates usually provide
satisfactory reliability measures. The SORM reliability is more accurate and may differ from FORM
7-17

reliability when the design conditions are highly nonlinear. Besides, the SORM reliability has the
property of approaching the exact reliability Ps asPs approaches 1 asymptotically. When the
reliability is large (small probability of failure), FORM/SORM are extremely computationally efficient
simulation methods. The Central Processing Unit (CPU) time for FORM is approximately linear inn
(n = number of basic input variables) and the additional CPU time for SORM grows approximately
with r?. However, SORM based on the diagonal of the matrix of second-order derivatives at the f3
point (u space) has CPU time linear inn. Obviously, the absolute CPU time depends on the CPU
time required to evaluate the performance function g( • ). The CPU time may be invariant with the
actual reliability level if the calculation of g( ·) does not depend on different combinations of input
variables. This means that when Ps approaches 1, the computational effort by FORM/SORM may
remain relatively unchanged and hence become a superior method when compared with simulations.
Direct MCS is a general method based on repeated deterministic evaluation of the g( ·)function
due to random sampling of the input random vector X according to their joint distribution function.
This method can be applied to any type of problem without requiring any continuity in the random
variables or the limit state function. For a sample size L that approaches infinity, the estimated
reliability converges to the exact result. For a finite sample size, uncertainty estimates on the results
may need to be evaluated. As a rule of thumb, the CPU time grows linearly with nand 1/Min(PF,Ps)
for a given coefficient of variation on the estimator. The absolute value of the CPU time depends on
the time necessary to evaluate the g( ·)function. When Ps approaches 1 (PF approaches 0), the MCS
may be inefficient and expensive and hence, may become computationally prohibitive.
7 .3.5 Inspection Planning and Repair Strategy. Aircraft in service are inspected at
intervals to detect cracks before they become critical. When a maintenance action takes place after at
a specified number of flights, there may be a change in the flaw size distribution. This change is
obviously a function of inspection capability and the quality of repair. Inspection capability can be
modeled by the probability of detection (POD) curve as a function of crack size a. The POD curve
represents the cumulative distribution function Fia) of the smallest detectable flaw size (a random
variable). Repair quality can be expressed in terms of the equivalent repair crack size density
functionfR(a).
Consider a real line in Figure 7-9 which represents the number of load cycles in an aging
aircraft. Following crack initiation after N0 cycles, let N1, N2, N3, • • • ( • • ·, > N3 > N2 > N1) be
the successive number of cycles during which periodic inspections take place with a regular inspection
intervali1Nins = N2 - N1 = N3 - N2 = • • •. Letj8(a) denote the probability density function of the
7-18

0
I
I I
I I
I
I I
I I
I I
I
I I
I
I I
I I
I I
I I
I I
I I
I I
I
I
I I
I I
I
I I
I I
I
I I
I I
I I
I
I I
I I
I I
I
FIGURE 7-9. EFFECTS OF PERIODIC MAINTENANCE ACTION ON TilE CRACK SIZE DENSITY FUNCTION
crack size at N1 before inspection. j 8(a) can be easily obtained following differentiation of the
cumulative distribution function F8(a) (j8(a) = dF8(a)/da), which in tum can be calculated from
dcf
F8(a) = Pr [a(N1) < a] = 1 - Pr [a(N1) > a]. (7-25)
Methods of computing the probability Pr[a(N1) > a] (cj. Inequality 37 and Equation (7-25)) are
discussed in Section 7.3.4 (Equations (7-21), (7-22), and (7-24)). Let.f;.(a) represent the probability
density function after inspection and repair at N1 cycles. Due to this maintenance action, J;.(a) can be
obtained as[31]
/A(a) = /R(a) J F,(t) / 8{t) dt + (1 - F11(a)] / 8(a) . (7-26)
0
The post maintenance crack size density JA(a) is then projected forward for the next interval of
uninspected usage, i.e., for N1 s; N s; N2. Thus,f.t(a) can be treated as the initial crack size density
at N1 cycles replacing the density function of the original initial crack size. This process is continued
for as many inspection intervals as desired. The methodology described above, however, implicitly
7-19

assumes that all the probabilistic characteristics of the basic input variables, such as C, m, p, etc., are
unchanged due to maintenance actions. Appropriate performance function(s) similar to Equation (7-
19) can be formulated which will allow evaluation of updated failure probabilities as a function of
inspection and/or repair.
7.4 Numerical Example
7 .4.1 Problem Description. Consider a fuselage lap joint with 100 fastener holes in a critical
row. The model used for the FEM analysis shown in Figure 7-2 was obtained from the original
References[24,27]. The geometrical parameters are assumed to be deterministic. They are as
follows: fuselage radius R = 1.905 m, skin thickness r = 1.016 x Hr3 m, shank diameter D6 = 4.572 x 10·3 m, fastener head diameter Dh = 5.588 x 10·3 m, fastener hole diameter D = 4.572 x
10·3 m, fastener spacingS = 25.4 X 10"3 m, effective width W,.§ = 25.4 X 10·3 m, and permissible
crack size aP = 5.207 x 10"3 m.
The random variables considered in this example are fuselage pressure p, initiation life N0,
initial crack length a0, and Paris coefficients C and m. The fuselage pressure pis assumed to be
lognormally distributed (arbitrary) with mean value P.p = 0.0586 MPa, and a coefficient of variation
Vp- Several values of VP will be used to determine the sensitivity of results on VP. It's probability
density function is given by
1 h r·~-~ rJ X > 0 (7-27) /p(x) = J21r xu exp
0 otherwise
with U e Jln(l +V/)
Jnp.P-~ql (7-28)
jJ. e
1be initiation life N0 normalized by its mean value E[N0] is assumed to be distributed with Weibull
probability with the probability density function
with [25]
7-20
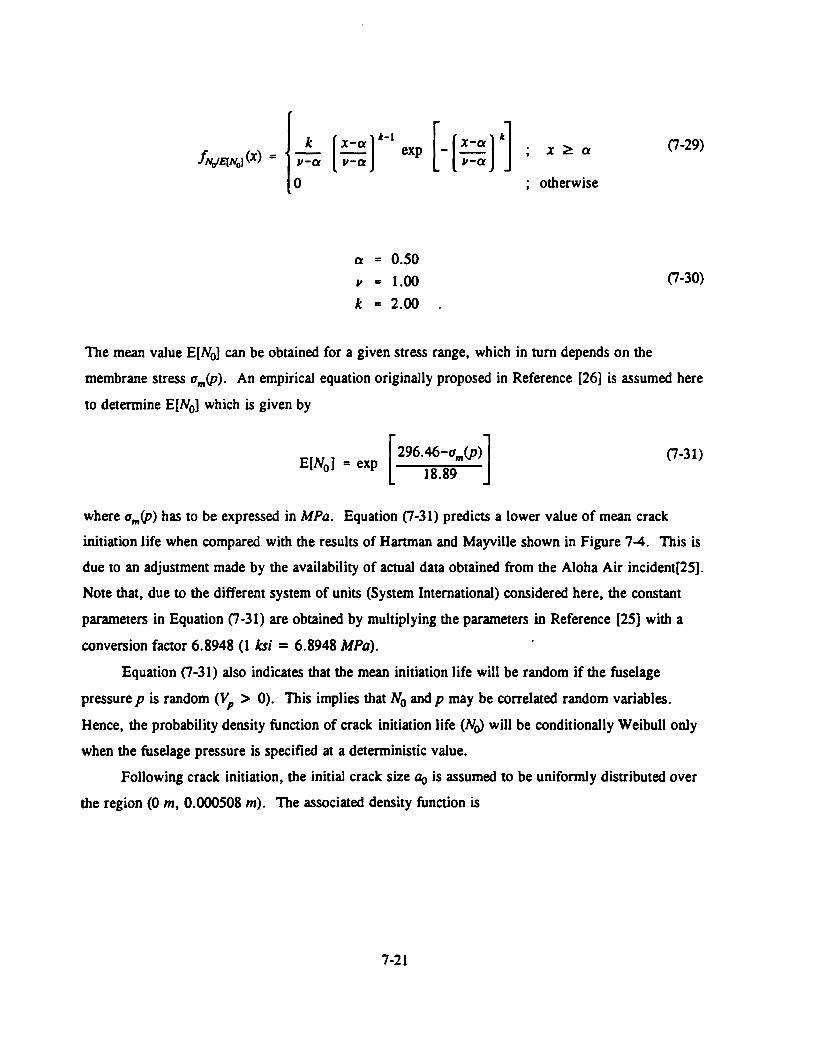
k x ~a p-a
0 otherwise
a = 0.50
p = 1.00
k = 2.00
(7-29)
(7-30)
The mean value E[NoJ can be obtained for a given stress range, which in tum depends on the
membrane stress um(p). An empirical equation originally proposed in Reference [26] is assumed here
to determine E[N0] which is given by
[ 296.46-um(p)]
E[No] = exp 18.89 (7-31)
where um(p) has to be expressed in MPa. Equation (7-31) predicts a lower value of mean crack
initiation life when compared with the results of Hartman and Mayville shown in Figure 7-4. This is
due to an adjustment made by the availability of actual data obtained from the Aloha Air incident[25].
Note that, due to the different system of units (System International) considered here, the constant
parameters in Equation (7-31) are obtained by multiplying the parameters in Reference [25] with a
conversion factor 6.8948 (I ksi = 6.8948 MPa).
Equation (7-31) also indicates that the mean initiation life will be random if the fuselage
pressure p is random (VP > 0). This implies that N0 and p may be correlated random variables.
Hence, the probability density function of crack initiation life (N~ will be conditionally WeibuJI only
when the fuselage pressure is specified at a deterministic value.
Foilowing crack initiation, the initial crack size ao is assumed to be uniformly distributed over
the region (0 m, 0.000508 m). The associated density function is
7-21

1 a 1 ~ x ~ a 2 (7-32)
fao(x) = a2-al
0 otherwise
with
al '"' 0.0 (7-33)
a2 = 0.000508
The vector {ln C, m}T representing Paris coefficients is assumed to be a bivariate Gaussian random
vector with the joint probability density function[32-33]
-[¥]'- 2p [¥] [¥]· [¥]' -34)
2(1-p2)
where
1'1 ... mean value of InC = -23.1
al == standard deviation of InC == 0.48
1'1. = mean value of m '"' 2.86 (7-35)
a2 .. standard deviation of m .. 0.20
p .. correlation coefficient = -o.992
with the units in m and MPa. A linear elastic stress analysis by FEM was carried out in
Reference [27] for the above geometrical parameters and a deterministic pressure of 0.0586 MPa.
Reference (24] has a listing of an nominal stresses such as, membrane stress a"', fastener load P, and
local bending stress ab computed for all the fastener holes. Using these values and Equations (7-21 to
7-23), the corresponding proportionality factors A1, A2, and A3 can be easily calculated for each of the
100 fastener holes considered in this example. These factors are then used to calculate the stress
distribution due to a new fuselage pressure, due to statistical variability from its expected value.
7.4.2 Reliability Analysis. Figure 7-10 shows several plots of probability of failure PF versus
number of cycles N obtained for one of the 100 fastener holes considered in the analysis. The
associated proportionality factors for this hole (Equations (7-11 to 7-13)) are A1 = 0.928, A2 = 3.427
7-22
··~

u.. 1l..
1 o-1
1 o-2
1 o-s 0 15000
FORM ------ SORM
• Simulation
30000 45000
N (cycles)
60000
FlGURE 7-10. PROBABILITY OF FAILURE BY VARIOUS METIIODS AS A FUNCTION OF NUMBER OF CYCLES
x 1~ m, and A3 = 4. 781 x 1 <r m. The coefficient of variation VP of the random fuselage pressure
p was arbitrarily assumed to be S percent. Various reliability methods such as FORM, SORM, and
.. !CS were applied to determine the failure probabilities. They all consistently indicated that P F
increases as N increases, and it approaches unity when N becomes large. Figure 7-10 also shows that
Jhe results obtained from the approximate methods, e.g., FORM and SORM provide satisfactory
probability estimates when compared with results from MCS. The sample size (L) for the simulation
was varied according to the level of probability being estimated. As a rule of thumb, the sample size
has to be at least lOIP, for obtaining a 30 percent coefficient of variation on the probability
estimatorl62]. All the plots in Figure 7-10 were obtained for uninterrupted usage of an aircraft.
Table 7-1 exhibits the relative effort and computational expenses required to determine the
above solutions by analyticaJ (FORM and SORM) and simulation methods. They were measured in
terms of CPU seconds by executing computer programs for each of these methods in a 386-33 MHz
7-23

TABLE 7-1. COMPARISONS OF CPU TIME FOR CALCULATION OF F AlLURE PROBABILITIES
N FORM (cycles) (sec)
14000 14.43
15000 14.33
17000 14.12
20000 13.95
25000 1.86
30000 1.75
Values in parcntheaca denole com:spondina number of umple size.
SORM MCS (sec) (sec)
15.01 10572.90 (500,000)
14.77 2112.87 (100,000)
14.70 528.38 ( 25,000)
14.47 106.28 ( 5,000)
2.41 12.45 ( 500)
2.25 2.69 100)
Personal Computer. Clearly, the FORM/SORM algorithms are more efficient than MCS and become
superior particularly when the failure probabilities are in the lower range C'tail") of the distribution.
For realistic structural systems, it is usually this lower range of probabilities which is of interest.
This is cenainly true for aging aircraft.
Figure 7-11 shows the sensitivity of the above failure probabilities as estimated by SORM as a
function of randomness on the fuselage pressure p. It is apparent that the coefficient of variation VP
has a significant influence on the structural reliability. A small variation in VP can make a large
difference in the failure probability. Hence, considerable effon should be expended in accurately
modeling the structural loads.
Figure 7-12 shows similar plots described by SORM and obtained for a deterministic fuselage
pressure (i.e., VP = 0) assigned to its mean value, and several deterministic realizations of crack
initiation life. These plots were developed with the intent of showing the imponance of simultaneous
interaction of crack initiation and growth in a reliability analysis. In Figure 7-12, the probability of
failure was obtained for three distinct deterministic values of crack initiation life which were
characterized by their mean, and 10 and 25 percent lower fra~iles. When the initiation life was
assigned such deterministic values, it was assumed that the crack had already developed, and hence
7-24

10°
10"1
1 o·2
&L
.....-:·-_,.....;,' / ,
/" ,' /. ,'
deterministic p
a.
/ ,' random p ~ ,'
\.! / 1 o·'
1 o·•
1 o·' 0
? ,' I I
I ~~ I I I
i II
I
15000 30000
N (cycles)
v, - 0.05 v, - 0.03 v, - 0.00
45000 60000
FIGURE 7-11. EFFECTS OF LOAD VARIABILITY ON FAILURE PROBABILITIES
&L
a..
10° ------ mean value
10"1 --- 25% fractile
------ 1 0% fractile random
1 o·2
1 o·'
10"5 ~------~--------~--~----~------~ 0 15000 30000 45000 60000
N (cycles)
FIGURE 7-12. EFFECTS OF FRACTILES OF CRACK INITIATION LIFE OF FAILURE PROBABILITIES
the performance function was based solely on crack growth, without the possibility of no crack
initiation. Comparison of results obtained from such considerations with those from fully random
crack initiation lives suggests that there can be large differences in the calculated probability of
failure.
7-25

Figures 7-10 to 7-12 can also be used to determine a threshold of first inspection. This can be
performed based on reliability or probability of failure when a target reliability is known. This target
value is usually decided by expen opinion and discussion in code committees. Using Figure 7-12, it
is also possible to decide on a specific fractile of crack initiation life which may provide similar
reliability estimates (in the region of interest) when compared with a fully random analysis. For
example, in Figure 7-12, based on a 10 percent lower fractile and fully random analyses, an
inspection threshold could be in the vicinity of 29000 cycles, with an associated failure probability of
approximately 1.0 x 1<r4.
7-26

8.0 CONCLUSIONS AND RECOMMENDATIONS
Because of the distinct requirements of each of the technical tasks on this program, conclusions
and recommendations are offered separately for each of them in the following paragraphs. In
general, it is apparent that the structural integrity of repairs in aging aircraft is an important issue; the
aircraft industry clearly is aware of this and is taking steps to improve the quality and reliability of
aircraft repairs. Certainly, engineers at airlines and repair stations could substantially benefit from
additional analytical tools that are simple to use, but effective for making intelligent repair design
choices.
The analytical program, SKINFIX, could ultimately serve as one of these tools, or be
embedded within an overall, user-friendly repair assessment software package. The techniques that
were compiled for the estimation of fuselage stress spectra could also be incorporated into this
package. If such an analytical tool is developed, it will be important to demonstrate the accuracy and
range of applicability of it through a series of carefully controlled laboratory experiments. Even after
this is done it would be prudent to expose the analysis software to a trial, "beta-test" period, in which
interested repair stations and airlines could try out the software on a number of real repair problems.
8.1 Repair Database Assessment
The SDR database is more useful in providing global indications of trends than it is in allowing
a detailed assessment of the problems associated with a particular type of repair. The SDR database,
in combination with the Aircraft Utilisation Database, can show the relationship between aircraft age,
flight hours and aircraft landings with the number of cracking or corrosion-related SDR's. Little
SDR activity would be expected until an aircraft is at least 10 years old. After the aircraft reaches an
age of about 20 years, the number of cracking and corrosion incidents could be expected to increase.
The number of incidents of corrosion is less well correlated with flight hours and even more poorly
correlated with aircraft landings. An examination of these trends versus specific airlines did not
reveal significantly different trends.
In general, these results show an increase in the number of repairs as an aircraft's age exceeds
15 to 20 years. An obvious conclusion is that repairs to aging aircraft will likely increase in the U.S.
commercial fleet unless a large percentage of these older aircraft are retired in the next few years.
Based on this brief study of the Service Difficulty Reporting System and the Aircraft Utilisation
Database, the authors offer the following recommendations:
8-1

• Steps should be taken to ensure that enhancements to the SDR system are implemented. Results of this study and the efforts of the Data Analysis Subcommittee of the ATA should be given due consideration in defining the modifications.
• The Boeing Structural Item Interim Advisory system should be examined as a possible model for future SDR reports. These reports, several of which are included in Appendix H for the B727 aircraft, include detailed drawings of a trouble spot, along with a description of its specific location and exact SRM reference.
• Consider institution of a formal procedure for routing structurally significant SDR's through the OEM's (or other clearing house) to ensure consistency in nomenclature and completeness.
• In support of the FAA's ongoing aging aircraft research efforts, maintain a current version of the Aircraft Utilisation Database as a resource of information on service history and ownership of specific aircraft.
• Consider a pilot program to demonstrate the benefits of a more comprehensive aircraft damage and repair database in terms of tracking fleet trends and identifying the need for new airworthiness directives (AD's). Collaborate with the ATA on the specifics of such a program. Consider the merits of a fleet-leader tracking program in conjunction with this effort.
8.2 Compatible Displacement Analysis
A linear elastic compatible displacement analysis methodology has been developed and used to
analyze a repair configuration. The methodology is a biaxial extension of the Swift analysis. The
hypothetical repair was of sufficient complexity to simulate an actual repair and to be analytically
challenging. The results of the analyses were compared with strain and displacement data obtained
from laboratory tests performed on a representative specimen at two different load levels. The
analysis was found to be in good agreement with the test data in terms of general load distribution
patterns and bypass stresses at many specific locations in the repair assembly. The analysis exhibited
errors in some areas; the probable sources of error are local bending and locally high bearing-to
bypass stress ratios. A nonlinear analysis would be required to achieve the correct results, regardless
of the calculation method employed. The necessary corrections for bending and local concentrated
loadings are technically feasible, as is the nonlinear analysis. These would add to the size and
complexity of the computer program, of course. Also, the computer program is presently in a low
stage of automation, requiring significant manual effort and engineering judgement up front to
perform an appropriate analysis. However, the analysis process can be automated to reduce the level
8-2

of user effon and technical proficiency required. This would require some type of CAD-like software
to facilitate model generation.
The authors make the following recommendations for improvement of the compatible
displacement analysis:
(1) Adapt an out-of-core matrix solution algorithm from existing software to facilitate PC-based use.
(2) Improve the model-generating package or adapt such a procedure from existing software to facilitate analysis of arbitrary repair configurations.
(3) Perform analyses on other benchmark configurations which have been analyzed by competing methods and/or physically tested for purposes of comparison.
(4) Incorporate the effects of local bending.
(5) Incorporate the effects of concentrated loading.
8.3 Standardized Load Spectra
A simplified procedure for the development of stress histories for use in the analysis of aircraft
repairs was presented in Section 5 of this repon. Although repairs of all components of the airframe
are of interest, this analysis concentrated on stress histories for fuselage skin repairs. A description
of typical fuselge loadings was provided, and basic fuselage stress histories were described. A
method for development of an exceedance diagram for analysis of fuselage skin repairs was detailed.
Subsequently, a methodology for generating detailed stress histories was reviewed. Some of the key
features are (1) the inclusion of a range of flights of different severities, (2) the inclusion of
deterministic loads where they occur, e.g. ground-air-ground cycles, (3) the use of a near-optimum
number of stress levels (10-16 positive and negative), (4) the combination of positive and negative
excursions of equal frequency, and (5) matching of the total number of flights and cycles with the
total exceedance diagram. Two methods of estimating fuselage skin stresses were presented, the first
based on static equilibrium requirements and the second based on a limit load analysis.
A comparison of the proposed history generation scheme with that of an airframe manufacturer
for the KC-135 was also presented. The predicted fatigue crack growth patterns for a hypothetical
through-crack at a fastener hole were compared for the two history generation schemes at three areas
within a fuselage. Predicted crack growth lives were within a factor of 1.5 for two of the three cases.
For the third case (which was predicted to be the least severe by both techniques) the proposed
8-3

scheme resulted in substantially longer crack growth life predictions. The probable reasons for these
differences were discussed.
Overall, we conclude that the procedures that were developed for estimation of fuselage stress
histories compare favorably with common industry practice. In general, when generating an aircraft
stress history it is important to:
• Apply flights of different severity in accordance with their historical or predicted frequency of occurence. Randomly apply stress excursions within flights, with the following exception.
• Apply deterministic loads at the point where they occur, e.g. GAG cycles must occur between flights.
• Select a reasonable number of stress levels (10-16 positive and negative are recommended). More levels will complicate the procedure without improving the results and make the generation of different flight types much more cumbersome.
• Combine positive and negative excursions of equal frequency. Random combination of positive and negative excursions will require subsequent recounting.
• Match the total number of flights and cycles with the overall exceedance diagram.
As followup to this study it is recommended that these procedures for estimating fuselage stress
histories be distributed to the aircraft industry for further comment and consideration.
8.4 Repaired Panel Testing
It is important to ascertain whether SKINFIX or other candidate repair analysis procedures will
provide sufficient accuracy, simplicity and adaptability to be used by designated engineering
representatives (DER's) and small aircraft repair stations to assess the suitability of various candidate
fuselage repairs.
With SKINFIX it was found that predictions of fastener displacements and skin stresses
were in error by as much as 20 percent when compared with detailed laboratory data on a simple
Type DI fuselage skin repair. In particular, the stresses in the Type DI repair involving the highest
load transfer between the sheet and doubler were predicted with the least accuracy. By inference, if
SKINFIX provides poor correlations with these detailed laboratory measurements of repair stresses
and displacements, then other finite element procedures which provide predictions similar to
SKINFIX will also provide poor correlations. This line of reasoning suggests that any stress analysis
model that is being considered for use in analyzing fuselage skin repairs should be validated in
8-4

comparison with a series of carefully documented laboratory experiments on common repair
configurations. The experimental work that was done in this program represents only a beginning.
To increase the credibility of these experiments, it is recommended that a major aircraft
manufacturer be invited to participate in the design and fabrication of these flat panel repairs. At
least the following basic issues should be resolved through further laboratory experimentation:
• Fatigue crack initiation and growth behavior of the three basic types of fuselage repairs can be accuratelly predicted by SKINFIX or other currently available analytical tools that can readily be used by DER 's and others required to design fuselage repairs. Detailed data suitable for such an assessment are available on only one Type III temporary doubler repair sample. Type I and II doubler designs must also be evaluated.
• Replicate test data for each of these doubler designs should be developed to fully assess the variability caused by specimen to specimen fabrication differences, as well as uncertainties caused by scatter in laboratory measurements of rivet displacements and skin and doubler strains. No replicate data of the type required for model validation exists at the present time.
• A wider range of cutout to doubler size ratios and doubler to skin thickness ratios should be explored to better demonstrate the suitability of available analytical procedures in predicting the impact of these variables on the location and duration of crack initiation, as well as the rate of crack growth. Only one cutout size, one doubler size, and two doubler/skin thickness ratios have been explored to date.
8.5 Reliability Assessment
This work included completion of a state of the art review, development of a probabilistic
model, and initial model validations.
State-or-the-Art Review. A state-of-the-art review was conducted to determine the adequacy
of current methods for performance evaluation of aging aircraft subjected to in-service environmental
loads. Both deterministic and probabilistic approaches were reviewed. Based on this literature
survey, it was concluded that novel probabilistic model(s) are required to determine structural
reliability under the potential adverse effects of multiple site damage (MSD) and periodic repairs.
Development or Probabilistic Model. An analytical model was developed to evaluate
stochastic performance (reliability) of aircraft components subject to MSD and periodic repairs. The
model is based on (i) phenomenological models of fatigue crack initiation and fatigue crack growth,
(ii) linear elastic fracture mechanics (LEFM), and (iii) First- and Second-Order Reliability Methods
(FORM/SORM) of modern structural reliability theory. It incorporates various uncertainties in
8-5
structural loads, properties governing fatigue crack initiation, properties governing fatigue crack
propagation, and initial conditions characterizing flaw sizes at "crack initiation ... The proposed
model is versatile and can be easily adapted when additional uncertainty parameters are required to
describe the relevant performance criteria. Based on this model, optimal inspection and repair
strategies for an aging aircraft could be determined.
Model Evaluation. The proposed analytic model was evaluated by comparing its failure
probability estimates with those obtained from reference solutions. The method of MCS was used for
comparison purposes. A numerical example based on a fuselage lap-joint subjected to MSD was
considered. Preliminary results suggest that the approximate methods, such as FORM and SORM can
provide accurate estimates of failure probability with much less computational effort than those
obtained from MCS.
Based on these positive initial results, the authors recommend the following work be
undertaken: various existing databases be explored to accurately characterize input variables
(deterministic and random). Then, the model would be used for a significant number of specific (real
world) cases. The proposed theoretical formulation should be coded as a complete computer
program. The effect of additional sources of damage and variability, including repair location and
size, should be assessed. Finally, the resulting software should be integrated in a framework that
would provide a tool for assessing the reliability of aircraft as a function of relevant parameters, such
as age, probability of damage detection, inspection interval, flight load distribution, and others.
8-6

REFERENCES
[1] Rice, R. C., "Repair Database Assessment", Summary Report on Subtask 2 to the Volpe National Transportation Systems Center, Contract No. DTRS-57-89-C-00006, Project No. VA-0013, (March 6, 1991).
[2] Rice, R. C., and Rosenfeld, M., "Compatible Displacement Analysis", Progress Report to the Volpe National Transportation Systems Center, Contract No. DTRS-57-89-C-00006, Project No. VA-0013, (March 7, 1991).
[3] Vlieger, H. and Sanderse, A., User's Manual of ARREST. A Computer Routine for Prediction of Residual Strength of Cracked Stiffened Panels, National Aerospace Laboratory (1976).
[4] Swift, T., "Repairs to Damage Tolerant Aircraft", International Symposium on Structural Integrity of Aging Airplanes (1990).
[5] Swift, T., "Development of the Fail-Safe Design Features of the DC-10", Damage Tolerance in Aircraft Structures, ASTM STP 486 (1971).
[6] Hussein, R. M., Computer Aided Engineering: Advanced Structural Analysis (1988).
[7] Gallagher, R. H., Finite-Element Analysis Fundamentals (1975).
[8] Poe, C. C., Jr., "The Effect of Riveted and Uniformly Spaced Stringers on the Stress Intensity Factor of a Cracked Sheet", MS Thesis, Virginia Polytechnic Institute (1969).
[9] "I-DEAS Finite Element Modeling User's Guide .. , Structural Dynamics Research Corporation, Milford, Ohio (1990).
[10] "ABAQUS Finite Element Analysis User's Guide", Version 4.7, Hibbin, Karlsson & Sorenson Inc., Providence, R.I. (1988).
[11] Broek, D., 1he Practical Use of Fracture Mechanics, Kluwer Academic Publishers, (1988).
[12] Crabill, N. L., "The NASA Gigital VGH Program-Exploration of Methods and Final Results, Volume !-Development of Methods, Volume Il-L 1011 Data 1978-1979: 1619 Hours, Volume III-B727 Data 1978-1980: 1765 Hours, Volume IV-B747 Data 1978-1980: 1689 Hours, Volume V- DC10 Data 1981-1982: 129 Hours, .. NASA Contractor Report 181909, NASW 4430, Eagle Engineering Inc., (December 1989).
[13] DeJonge, J. B., et al., "A Standardized Load Sequence for Flight Simulation Tests on Transport Aircraft Wing Structures (TWIST) .. , LBF-FB-106, NLR TR 73029U, (1973).
[ 14] Schijve, J., "The Analysis of Random Load-Time Histories With Relation to Fatigue Test and Life Calculations, Fatigue of Aircraft Structure .. , p. 115, Pergamon, (1963).
[15] Broek, D., and Smith, S. H., "Fatigue Crack Growth Prediction Under Aircraft Spectrum Loading .. , Engineering Fracture Mech., 11, pp. 122-142, (1979).
R-1

[16] Bullen, N. I., "The Chance of a Rough Flight", RAE TR 65039 (1965).
[17] Anon., "Fuselage Load Spectrum for Modification Design per Damage Tolerance Criteria", Enclosure to BMAC letter, No. 3-KC-135~183-1130, (1986).
[18] Fowler, K. R., and Watanabe, R. T., "Development of Jet Transport Airframe Test Spectra", Boeing paper without date or number.
[19] Hoggard, A., "Aircraft Repairs Program Review", Manufacturer's/FAA Meeting, Douglas Aircraft Company, (May 8, 1990).
[20] Smith, I., Howard, D. M., and Smith, F. C., "Cumulative Fatigue Damage of Axially Loaded Alclad 75S-T6 and Alclad 24S-T3 Aluminum Alloy Sheet", National Advisory Committee for Aeronautics, NACA Technical Note 3293, (September, 1955).
[21] Rice, R. C., Davies, K. B., Jaske, C. E., and Feddersen, C. E., "Consolidation of Fatigue and Fatigue-Crack Propagation Data for Design Use", NASA Contractor Repon, National Aeronautics and Space Administration, NASA CR-2586, (October, 1975).
[22] Orringer, 0., "Significance of Multiple Site Damage (MSD) on Damage Tolerance of Aircraft", Presented at the Airworthiness Assurance Task Force, (January 1991).
[23] Mayville, R., "Influence of Joint Design Variables on MSD Formation and Crack Growth", Presented at the Airworthiness Assurance Task Force, (January 1991).
[24] Broek, D., "The Inspection Interval for Multi-Site Damage in Fuselage Lap-Joints", Final Repon, TR-9002, USDOTNNTSC, (April 1990).
[25] Broek, D., "Analysis Concerning the Inspection Threshold for Multi-Site Damage", Final Repon, TR-9104, USDOTNNTSC, (June 1991).
(26] Broek, D., "Outline of Risk Analysis to Establish Requirements for Inspection Interval", Preliminary Discussion Document, Galaxy Scientific Corporation, (July 1991).
[27] Patil, S., "Finite Element Analysis of Lap-Joint", Foster Miller Inc., (1991).
(28] Broek, D., "The Feasibility of Proof Testing", Repon TR 8916, FractuREsearch Inc., Galena, Ohio, (1989).
[29] Lincoln, J., "Life Management Approach for USAF Aircraft", Paper presented at AGARD meeting, Bath, United Kingdom, (April 1991).
[30] Lincoln, J., "Risk Assessment of an Aging Military Aircraft", Journal of Aircraft, 22 (8), pp. 687~91, (August 1985).
[31] Berens, A., "Risk Analysis for Aging Aircraft Fleets- Demonstration Repon", University of Dayton Research Institute, (February 1991).
R-2

[32] Ortiz, K., and Kiremidjian, A., "Stochastic Modeling of Fatigue Crack Growth", Engineering Fracture Mechanics, 29 {3), pp. 317-334, (1988).
[33] Ortiz, K., and Kiremidjian, A., "Time Series Analysis of Fatigue Crack Growth Rate Data", Engineering Fracture Mechanics, 24 (5), pp. 657-675, (1986).
[34] Hartman, A., "Fatigue Tests on Three-Row Lap-Joints in Clad 2024-T3 Manufactured by Riveting and Adhesive Bonding", Report TN M-2170, National Aerospace Laboratory, NLR, Amsterdam, (1967).
[35] Schijve, J., "The Endurance Under Program Fatigue Testing", Full Scale Testing of Aircraft Structures, pp. 41-59, Permagon Press, (1961).
[36] Jarfall, L., "Review of Some Swedish Work on Fatigue of Aircraft Structures During 1975-1977", Report TN HE-1918, Institute for Aviation Research, FFA, Stockholm.
[37] Haas, T., "Spectrum Fatigue Tests on Typical Wing Joints", Materialprujung, 2, pp. 1-17, (1961).
[38] "Causative Factors Relating to Multi-Site Damage in Aircraft Structures", ADL Report-63053, (1990).
[39] Grover, H. J., "Fatigue of Aircraft Structures", NAVAIR 01-1A-13, (1966).
[ 40] Paris, P., and Erdogan, F., "A Critical Analysis of Crack Propagation Laws", Journal of Basic Engineering, ASME, 85, pp. 528-534, (1963).
[41] Broek, D., "The Practical Use of Fracture Mechanics", Kluwer Academic Publishers, (1988).
[42] Broek, D., "Elementary Engineering Fracture Mechanics", Kluwer Academic Publishers, (1986).
[43] Virkler, D. A., Hillberry, B. M., and Gael, P. K., "The Statistical Nature of Fatigue Crack Propagation", AFFDL-TR-43-78, Air Force Flight Dynamics Laboratory, (April 1978).
[44] Virkler, D. A., Hillberry, B. M., and Gael, P. K., "The Statistical Nature of Fatigue Crack Propagation", J. Engng. Mater. Techno/., 101, pp. 148-153, (1979).
[45] Varanasi, S. R., and Whittaker, I. C., "Structural Reliability Prediction Method Considering Crack Growth and Residual Strength", Symposium on Fatigue Crack Growth Under Spectrum Loads, 78th Annual Meeting of ASTM, ASTM STP 595, pp. 292-305, Montreal, Quebec, Canada, (June 1975).
[46] Lidiard, A. B., "Probabilistic Fracture Mechanics", Fracture Mechanics, Current Status, Future Prospects, Permagon Press, Oxford, (1979).
[47] Engesvik, K. M., "Analysis of Uncertainties in the Fatigue Capacity of Welded Joints," Division of Marine Structures", The University of Trondheim, The Norwegian Institute of Technology, Trondheim, Norway, (December 1981).
R-3

[48] Rahman, S., .. A Markov Model for Local and Global Damage Indices in Seismic Analysis", Doctoral Dissenation presented at the Graduate School, Cornell University, Ithaca, NY, (May 1991).
[49] Fiessler, B., Neumann, H. J., and Rackwitz, R. "Quadratic Limit States in Structural Reliability", Journal of Engineering Mechanics, ASCE, 10S(EM4), pp. 661-676.
[50] Rackwitz, R. and Fiessler, B., "Structural Reliability under Combined Random Load Sequences", Computer and Structures, 9, pp. 484-494, (1978).
[51] Madsen, H. 0., Krenk, S., and Lind, N. C., Methods of Structural Safety, Prentice-Hall, Inc., Englewood Cliffs, New Jersey, (1986).
[52] Hohenbichler, M., "New Light on First- and Second-Order Reliability Methods", Structural Safety, 4, pp. 267-284, (1987).
[53] Breitung, K., .. Asymptotic Approximation for Multinormal Integrals", Journal of Engineering Mechanics. ASCE, 110 (3), pp. 357-366, (March 1984).
[54] Fu, G., and Moses, F., .. A Sampling Distribution for System Reliability Applications", Proceedings of the First IFIP WG 7.5 Working Conference on Reliability and Optimization of Structural Systems, Aalborg, Denmark, pp. 141-155, (May 1987).
[55] Harbitz, A., .. An Efficient Sampling Method for Probability of Failure Calculation", Structural Safety, 3 (1), pp. 109-115, (October 1986).
[56] Harbitz, A., "Efficient and Accurate Probability of Failure Calculation by Use of the Imponance Sampling Technique", Proceedings of the 4th International Conference on Applications of Statistics and Probability in Soil and Structural Engineering, Florence, Italy, (1983).
[57] Ibrahim, Y. and Rahman, S., "Reliability Analysis of Uncenain Dynamic Systems Using Imponance Sampling", Proceedings of the Sixth International Conference on Applications of Statistics and Probability in Civil Engineering, Mexico City, Mexico, (1991).
[58] Melchers, R. E., "Efficient Monte Carlo Probability Integration", Repon No. 7, Dept. of Civil Engineering, Monash University, Australia, (1984).
[59] Bjerager, P., .. Probability Integration by Directional Simulation", Journal of Engineering Mechanics, ASCE, 114 (8), pp. 1285-1302, (August 1988).
[60] Deak I., .. Three Digit Accurate Multiple Normal Probabilities", Numerische Mathematik, 35, pp. 369-380, (1980).
[61] Ditlevson, 0., Olesen, R., and Mohr, G., "'Solution of a Class of Load Combination Problems by Directional Simulation", Structural Safety, 4, pp. 95-109, (1986).
[62] Rubinstein, R. Y., Simulation and the Monte Carlo Method, John Wiley & Sons, New York, New York, (1981).
R-4.