dot/faa/ar-07/57 flammability properties of … properties of aircraft carbon-fiber structural...
TRANSCRIPT

DOT/FAA/AR-07/57 Air Traffic Organization Operations Planning Office of Aviation Research and Development Washington, DC 20591
Flammability Properties of Aircraft Carbon-Fiber Structural Composite October 2007 Final Report This document is available to the U.S. public through the National Technical Information Service (NTIS), Springfield, Virginia 22161.
U.S. Department of Transportation Federal Aviation Administration

NOTICE
This document is disseminated under the sponsorship of the U.S. Department of Transportation in the interest of information exchange. The United States Government assumes no liability for the contents or use thereof. The United States Government does not endorse products or manufacturers. Trade or manufacturer's names appear herein solely because they are considered essential to the objective of this report. This document does not constitute FAA certification policy. Consult your local FAA aircraft certification office as to its use.
This report is available at the Federal Aviation Administration William J. Hughes Technical Center's Full-Text Technical Reports page: actlibrary.tc.faa.gov in Adobe Acrobat portable document format (PDF).
Technical Report Documentation Page 1. Report No. DOT/FAA/AR-07/57
2. Government Accession No. 3. Recipient's Catalog No.
5. Report Date
October 2007 4. Title and Subtitle
FLAMMABILITY PROPERTIES OF AIRCRAFT CARBON-FIBER STRUCTURAL COMPOSITE 6. Performing Organization Code
7. Author(s)
James G. Quintiere*, Richard N. Walters, and Sean Crowley 8. Performing Organization Report No.
10. Work Unit No. (TRAIS)
9. Performing Organization Name and Address
Federal Aviation Administration William J. Hughes Technical Center *Dept of Fire Protection Engineering Airport & Aircraft University of Maryland Safety Research & Development Division OISI Glenn L. Martin Hall (Bldg. 088) Fire Safety Section College Park, MD 20742 Atlantic City International Airport, NJ 08405
11. Contract or Grant No.
12. Sponsoring Agency Name and Address
U.S. Department of Transportation Federal Aviation Administration Air Traffic Organization Operations Planning Office of Aviation Research and Development Washington, DC 20591
13. Type of Report and Period Covered
Final Report
14. S
ANM-115 ponsoring Agency Code
15. Supplementary Notes
16. Abstract
This study investigated the flammability of a carbon-fiber composite material for use in aircraft structures. In particular, it considered a composite material manufactured by Toray Composites (America) to Boeing Material Specification 8-276. The objective was to establish a complete set of properties pertaining to the heating and burning characteristics of these materials in fires. Several apparatuses were used, including the cone calorimeter, microscale combustion calorimeter, thermogravimetric analyzer, differential scanning calorimeter, and a flame spread rig to promote spread with preheating by radiation. An attempt was made to measure the thermal conductivity of the composite over a range of temperatures through its decomposition, but the heat losses from the apparatus likely caused an overestimate in the measurement. Data from standard tests were also reported for the Ohio State University calorimeter and the smoke density chamber. The material burns in a manner similar to a charring material, in that the carbon fibers comprise most of its mass. The composite burns primarily from the vaporization of its resin. It can ignite with a pilot flame after preheating at a low heat flux. When it burns, the resin vapor is forced out of the fiber pores, and pressure causes the material to swell to over twice its volume. In most all cases studied, the composite maintained its rigidity, but its structural strength was not examined after degradation. The material appears to maintain homogeneity in swelling. The fibers create an insulating, char-like structure that causes a reduction in the internal heating, and consequently, the burning rate drops in time. As the burning rate drops, extinction can naturally occur due to insufficient heating. As is common of charring materials, external heat flux is required to sustain burning and flame spread. It should be noted that the carbon fiber can also oxidize under high-temperature conditions, and this was observed even at low heat fluxes. Furthermore, the properties in this report pertain primarily to the characteristics of the resin material, as the carbon fibers are essentially inert. The data in this report can be used for modeling and explaining the fire behavior of the composite in fire scenarios associated with aircraft operations. 17. Key Words
Carbon fiber, Composite, Flame spread, Heat release
18. Distribution Statement
This document is available to the U.S. public through the National Technical Information Service (NTIS) Springfield, Virginia 22161.
19. Security Classif. (of this report)
Unclassified
20. Security Classif. (of this page)
Unclassified
21. No. of Pages
43 22. Price
Form DOT F1700.7 (8-72) Reproduction of completed page authorized

ACKNOWLEDGEMENTS J.G. Quintiere is indebted to Gus Sarkos and Dick Hill for their support and motivation for this study of carbon-fiber composite material for aircraft construction. Discussions with Richard Lyon on the approach and interpretation of the data have been rewarding and critical to the full understanding of the composite characteristics. Also, the author is grateful to Dr. Lyon for extending the hospitality of the facilities and resources of his group for this study. His staff, Sean Crowley and Richard Walters, are co-authors of this report, and their contributions are greatly appreciated.
iii/iv

TABLE OF CONTENTS Page EXECUTIVE SUMMARY ix 1. INTRODUCTION 1 2. EXPERIMENTAL MEASUREMENTS 2
2.1 Thermal Conductivity 3 2.2 Thermodynamic Properties 4 2.3 Kinetics of Degradation 6 2.4 Ignition 8 2.5 Burning 11 2.6 Yields and Morphology of Burning 19 2.7 Yields of Incomplete Combustion Products 25 2.8 Flame Spread 28
3. SUMMARY OF RESULTS 31 4. CONCLUSIONS 33 5. REFERENCES 33
v

LIST OF FIGURES Figure Page 1 Toray Carbon-Fiber Composite: Smooth Face, Edge, and Rough Face, Left to Right 1 2 Conduction Apparatus: Heater Plate in Specimen Sandwich With Edge Insulation 3 3 Composite Thermal Conductivity Versus Temperature 4 4 The DSC Results, Specific Heat, and Heat of Decomposition 5 5 Microscale Combustion Calorimeter Results 5 6 Arrhenius Plot to Determine Kinetic Parameters of Thermal Decomposition 7 7 The TGA Results and Comparison to First-Order Model 7 8 Time to Ignite: Piloted and Auto 8 9 Thermal Response Parameter Values From Ignition Delay Experiments 10 10 Thermally Thick Theory Compared to Data for Piloted Ignition 11 11 Heat Release in OSU Calorimeter 12 12 Heat Release Rate per Unit Area at Fluxes From 25 to 100 kW/m2 13 13 Average Peak HRR Over Burning Range 15 14 Heat of Combustion Over Range of Burning 15 15 The HRR During the Critical Burning Series With Igniter 16 16 Total Energy Released in Burning 17 17 Burning Rate of Carbon Fibers in Smoldering 17 18 Surface Temperatures of Carbon Fiber Smoldering 18 19 Vertical Burning in the OSU Apparatus 19 20a After Burning Front and Back, 8.2 kW/m2 20 20b After Burning Front and Back, 12.3 kW/m2 20 20c After Burning Front and Back, 14.7 kW/m2 20 20d After Heating Front and Back, 17.5 kW/m2 21 20e After Burning Front and Back, 18.7 kW/m2 21 20f After Burning Front and Back, 40.0 kW/m2 21 20g After Burning Front and Back, 60.0 kW/m2 22 20h After Burning Front and Back, 85 kW/m2 22 21 Thickness Increase on Burning 23 22 Morphology of Composite After Burning 24 23 Cross Section of the 40 kW/m2 Heated Composite 25 24 Yield of CO for Flaming Conditions 25 25 Yield of Smoke for Flaming Conditions 26 26 The Ds for the Smoke Density Chamber 27 27 Residue Fraction After Flaming 27 28 Flame Spread Apparatus 28 29 Vertical Flame Spread 29 30 Pyrolysis and Flame Tip in Vertical Spread 29 31 Flame Speed Dependence on Heat Flux 30 32 Upward Flame Spread Behavior 31
vi

LIST OF TABLES Table Page 1 The Results for FAA 14 CFR 25.853 OSU Calorimeter Test 12 2 Summary of Toray Carbon-Fiber Composite 32
vii
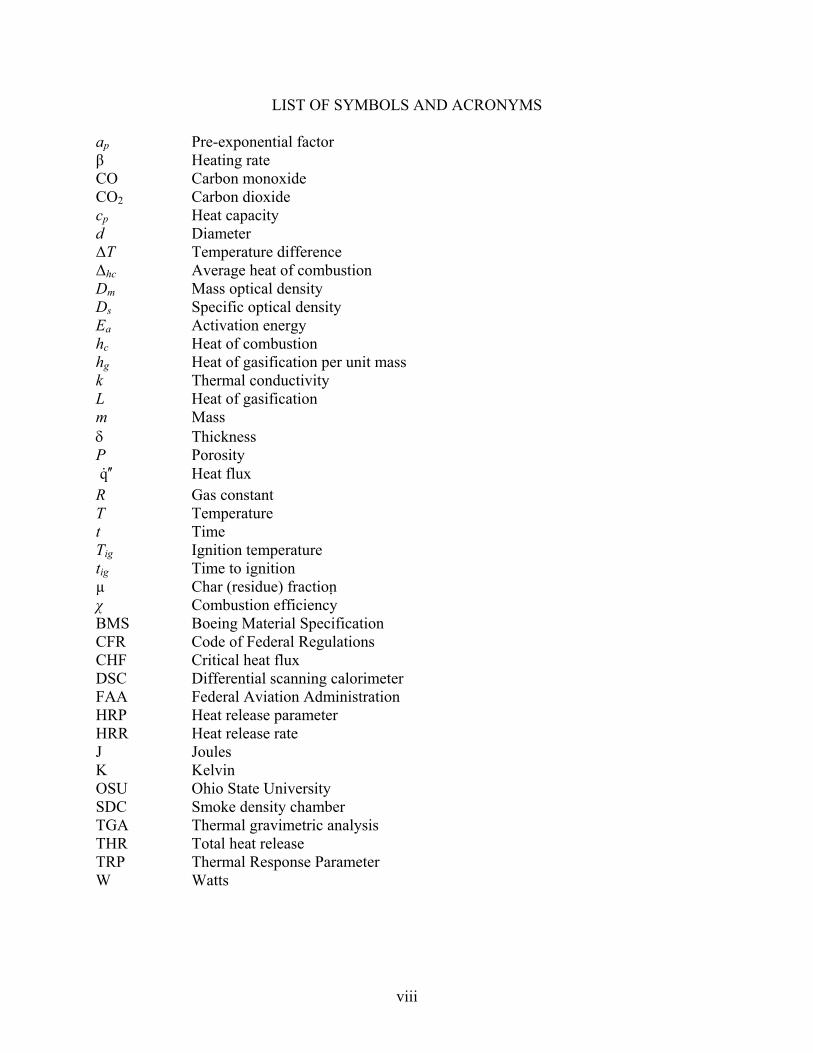
LIST OF SYMBOLS AND ACRONYMS ap Pre-exponential factor β Heating rate CO Carbon monoxide CO2 Carbon dioxide cp Heat capacity d Diameter ΔT Temperature difference Δhc Average heat of combustion Dm Mass optical density Ds Specific optical density Ea Activation energy hc Heat of combustion hg Heat of gasification per unit mass k Thermal conductivity L Heat of gasification m Mass δ Thickness P Porosity q ′′ Heat flux
R Gas constant T Temperature t Time Tig Ignition temperature tig Time to ignition µ Char (residue) fraction χ Combustion efficiency BMS Boeing Material Specification CFR Code of Federal Regulations CHF Critical heat flux DSC Differential scanning calorimeter FAA Federal Aviation Administration HRP Heat release parameter HRR Heat release rate J Joules K Kelvin OSU Ohio State University SDC Smoke density chamber TGA Thermal gravimetric analysis THR Total heat release TRP Thermal Response Parameter W Watts
viii
EXECUTIVE SUMMARY
This study investigated the flammability of a carbon-fiber composite material for use in aircraft structures. In particular, it considered a composite material manufactured by Toray Composites (America) to Boeing Material Specification 8-276. The objective was to establish a complete set of properties pertaining to the heating and burning characteristics of these materials in fires. Several apparatuses were used, including the cone calorimeter, microscale combustion calorimeter, thermogravimetric analyzer, differential scanning calorimeter, and a flame spread rig to promote spread with preheating by radiation. An attempt was made to measure the thermal conductivity of the composite over a range of temperatures through its decomposition, but the heat losses from the apparatus likely caused an overestimate in the measurement. Data from standard tests were also reported for the Ohio State University calorimeter and the smoke density chamber. The material burns in a manner similar to a charring material, in that the carbon fibers comprise most of its mass. The composite burns primarily from the vaporization of its resin. It can ignite with a pilot flame after preheating at a low heat flux. When it burns, the resin vapor is forced out of the fiber pores, and pressure causes the material to swell to over twice its volume. In most all cases studied, the composite maintained its rigidity, but its structural strength was not examined after degradation. The material appears to maintain homogeneity in swelling. The fibers create an insulating, char-like structure that causes a reduction in the internal heating and consequently the burning rate drops in time. As the burning rate drops, extinction can naturally occur due to insufficient heating. As is common of charring materials, external heat flux is required to sustain burning and flame spread. It should be noted that the carbon fiber can also oxidize under high-temperature conditions, and this was observed even at low heat fluxes. Furthermore, the properties in this report pertain primarily to the characteristics of the resin material, as the carbon fibers are essentially inert. The data in this report can be used for modeling and explaining the fire behavior of the composite in fire scenarios associated with aircraft operations.
ix/x

1. INTRODUCTION.
This study was motivated by the need to investigate the fire hazard of carbon-fiber composite material for use in aircraft structures. In particular, it considers the material fabricated to Boeing material specification (BMS) 8-276 by Toray Composites (America) in a quasi-isotropic lay-up [-45,0,45,90]2s of 16 plies. The material consists of resin and continuous carbon fibers, typically 7 μm in diameter. The thickness of the material is 3.2 mm, and the two faces (smooth and rough) along with the edge view are shown in figure 1.
Figure 1. Toray Carbon-Fiber Composite: Smooth Face, Edge, and Rough Face, Left to Right
The density of the composite is 1530 ±30 kg/m3. Other physical properties of the composite are listed below: • Carbon fiber density = 1750 kg/m3 • Volume fraction of carbon in the composite = 0.60 • Resin density = 1220 kg/m3 • Char fraction (typical) of resin alone in flaming combustion = 0.25 During heating or combustion, the resin material will vaporize and leave a char residue. The escaping resin vapor must escape through closely spaced carbon fibers. This produces internal pressures in the composite, and the sample will swell. Therefore, the physical properties of the composite will change on heating as the resin vaporizes, because the composite expands in response to the internal pressure. First, the bulk density of the material decreases, then pores form, and finally, the thermal conductivity of the matrix decreases. The strength of the degraded
1

material is not addressed in this report, but should be a consideration for the effects of fire on its performance. While the vaporization of the resin will allow a flame to form in combustion, the remaining char and carbon can burn as a surface oxidation (smoldering) and even produce a carbon monoxide flame near the oxidizing surface. Typically, surface combustion needs a high temperature to be sustained, which is usually in excess of 500°C. The use of a carbon composite for aircraft construction can have advantages over aluminum. For example, aluminum will melt at 660°C in large fires. Typically, for a composite material, the degradation temperature to cause burning is 300°-500°C, but it will maintain structural integrity during burning. Fire produces complex effects in a new material application that are not always anticipated. Since fire is commonly assessed in standard tests, the performance of a new material is not always fully determined. This lack of determination is due to limitations in the tests to indicate pass/fail only, tests designed for traditional materials, and typical scenarios. This report is not intended to address these limitations or scenario considerations, but the data in this report should provide a sufficient basis to make these further analyses. This report will only address the properties of the composite in combustion. The controlling variable in fire is the heat flux that the material is subjected to. Consequently, the full performance of a material can only be judged by displaying its behavior over an appropriate range of heat flux. This report describes the fire performance over a range of heat flux that encompasses the peak in typical fire situations (~100 kW/m2) to the lowest or critical flux that initiates its fire behavior. This report examines the degradation of the material and its behavior in ignition, burning, and flame spread. Special and standard apparatuses have been used to make these measurements. In addition, the thermal, thermodynamic, and chemical degradation kinetics of the material were measured. It should be noted that heat flux in fire would arise due to the flame itself and the thermal feedback of heated surroundings. So, a fire in a confined space will accelerate due to thermal feedback, and oxygen depletion will decelerate the fire. Therefore, the effect of oxygen is an important factor in combustion, and the use of oxygen supply sources on an aircraft can produce enhanced oxygen. No experiments were conducted to address enhanced oxygen effects, but the theoretical response of this variable is well known, and estimates can be made for its effects. 2. EXPERIMENTAL MEASUREMENTS.
Various apparatuses were used to obtain the data for thermal and combustion effects on the composite. The measurements comprise properties pertaining to thermal, chemical kinetic degradation, and combustion phenomena. Physical properties pertaining to sample decomposition were also measured after combustion. The principal variable varied in the measurements was heat flux, or temperature. The measurements and a description of the apparatus are discussed in the following section.
2

2.1 THERMAL CONDUCTIVITY.
A flat power source was sandwiched between two identical materials to be measured (see figure 2). The temperature difference (∆T) across both samples of material was measured. At steady state, half the power (recorded by current and voltage flow) constitutes steady heat conduction through the sample. Consequently, the thermal conductivity (k) can be measured from
T
qkΔ
δ′′= (1)
where δ is the thickness, and is the heat flow rate per unit area (heat flux). q′′
Figure 2. Conduction Apparatus: Heater Plate in Specimen Sandwich With Edge Insulation
Measurements were made for the composite by taking the power up in steps, and thereby raising the temperature across the specimen. The results, without accounting for any possible heat losses, are shown in figure 3. A check on the accuracy of the method was made by using 14-mm-thick ThermalCeramics Kaowool® M-board for the sample. Then, the results were compared to ThermalCeramics’ published results. The thicker, more insulating M-board caused end heat loss errors of up to 50%. This effect, in the denser, thinner composite suggested heat loss errors could cause a reduction in the results of figure 3 of about 20%. A more accurate, standard test measurement method is recommended to determine the conductivity of the composite. This should be done over the temperature range relevant to burning, as indicated in figure 3.
3

0.5
0.45
0.4
0.35
Figure 3. Composite Thermal Conductivity Versus Temperature
2.2 THERMODYNAMIC PROPERTIES.
Specific heat and heat of decomposition were measured by differential scanning calorimetry (DSC) [1]. Appropriate calibrations were done to account for the baseline empty cup, and the heat losses from the heated cup to the surroundings. The sample was taken through decomposition, and then the residue (primarily carbon) was run separately to determine its specific heat. Three repeated runs were averaged for a final value. The results as a function of temperature are shown in figure 4, where J = Joules and K = temperature in Kelvin. The microscale combustion calorimeter was also used to establish the complete heat of combustion of the volatiles [2]. It measures the energy of complete combustion per unit mass of sample degraded as a function of the sample temperature. These results are shown in figure 5. The heat of complete combustion of the volatiles is determined as
dTm
hi
completec ∫∞
⎟⎟⎟
⎠
⎞
⎜⎜⎜
⎝
⎛′′
−=Δ
•
0,q
)μ1(β1
.
. (2)
0.1
0.15
0.2
0.25
0.3
0 100 200 300 400
k = 0.023 x T(ºC) 0.46 k
(W/m
-K)
Temperature (°C)
CompositeOriginal
Composition
Mostly Carbon Fiber
Composition
DecompostionRange
of Resin
600 700 500
4

0
5
10
15
20
25
30
0 100 200 300 400 500 600
Effe
ctiv
e Sp
ecifi
c H
eat (
J/g-
K o
rigin
al)
Temperature (°C)
Heat of DecompositionArea Under Curves Shaded
2.07, 2.22, 3.12 kJ/gAverage = 2.5 ± 0.5 kJ/g
Specific Heats per Original Massoriginal C
P = 0.75 +0.0041 T (ºC) J/g-K original
residue CP,O
= 0.84 +0.0035 T (ºC) J/g-K original
Figure 4. The DSC Results, Specific Heat, and Heat of Decomposition (per Unit Mass of Original Sample)
The heating rate, β, is 1 K/s, and the residue (char) fraction, µ, is 0.74. Performing the integration yields = 26.5 kJ/g volatiles. Δhc,complete
0
20
40
60
80
100
0 100 200 300 400 500 600 700 800
Run 1Run 2Run 3
Ener
gy R
elea
se R
ate
per M
ass
of O
rigin
al M
ater
ial (
W/g
)
Temperature (ºC)
ηc = 96 J/g-K original
β = 1 K/s
Figure 5. Microscale Combustion Calorimeter Results
5

2.3 KINETICS OF DEGRADATION.
Standard thermal gravimetric analysis (TGA) was used to establish the degradation and mass loss behavior of the composite in nitrogen. Several runs were made at different heating rates to obtain sufficient data to determine kinetic degradation parameters. A one-step, first-order decomposition model was assumed having activation energy (Ea) and the pre-exponential factor (ap) for the composite. The char fraction (µ) was also measured. The governing equation for the model is [3]
( )( ) ( )Tk
dtd
μ−α−
=11α (3)
where 1μ
1α
−
−=
−−
= i
if
i mm
mmmm
and m is the mass (i-initial, f –final), and k = ape−Ea
RT is the Arrhenius rate. Based on equation 3, the activation energy and pre-exponential constant were determined for four TGA runs of 1°, 3°, 10°, and 30°C/minute at α mass loss rate corresponding to the peak decomposition rate. The result is shown in figure 6, and the kinetic parameters follow as Ea = 182 kJ/mol ap = 9.67 x 10¹⁰ s-1 with the residue fraction as µ = 0.74. This fraction in the TGA consists of the carbon fibers and char from the resin. An exact solution for a small homogeneous sample heated in a TGA at the heating rate β (K/s) is given as [3]
( ) ( 1μexpβμ1
expμ −⎥⎥⎦
⎤
⎢⎢⎣
⎡⎟⎠⎞⎜
⎝⎛−
−−−= ∫
∞
dtRTEa
mm a
T
T
p
i
) . (4)
The results of the model satisfactorily reproduce the TGA data, as shown in figure 7, except for the end of the process. The model should be suitable for predicting the composite degradation in general, and can be used for fire-modeling analyses. It should be noted that the results of this report could be used in various analytical strategies. The composite can be fully modeled, or aspects of the results can be used to assess specific phenomena. For example, the onset of degradation in the TGA is approximately 300°C, but temperatures in subsequent degradation could reach 400°-500°C at the higher heating rate in a fire (see figure 5).
6

-8.5
-8
-7.5
-7
-6.5
-6
-5.5
-5
-4.5
0.00142 0.00146 0.0015 0.00154 0.00158
Based on Peak Mass Loss Rate
y = 26.133 - 21846x R= 0.99928 ln
(dα
/dt )
1/T (K-1)
Figure 6. Arrhenius Plot to Determine Kinetic Parameters of Thermal Decomposition
0.7
0.75
0.8
0.85
0.9
0.95
1
1.05
100 200 300 400 500 600 700
TGA Data and Theory DataModel
Mas
s Fr
actio
n (m
/m i )
Temperature (°C)
1°C/min
30°C/min3°C/min
10°C/min
Residue Fraction = 0.74
Figure 7. The TGA Results and Comparison to First-Order Model
7

2.4 IGNITION.
The cone calorimeter was used to conduct ignition and burning experiments over a wide range of heat fluxes. Both piloted and auto-ignition was considered for a horizontal sample. Based on convective heat loss considerations, there is minimal difference between horizontal and vertical ignition under natural convection conditions. In general, ignition time will increase with the velocity of a convective flow. Also, the effect of oxygen in the atmosphere will have minimal effect on ignition, because the degradation temperature of the material where vapor is evolved is most important. The lower flammability limit then controls the onset of piloted ignition, and a sufficient temperature near stoichiometric concentration is needed for auto-ignition. An increase in oxygen concentration has the tendency to reduce the time to ignition (tig), but the principle time controlling factor is heating the solid to the degradation temperature by conduction. From TGA/DSC, the onset of vaporization of the composite is about 300°C. After this is attained, both piloted and auto-ignition can occur. They occur at correspondingly higher temperatures, but the piloted ignition temperature (Tig) is typically only slightly higher than the decomposition temperature, because the mass loss rate is very low for piloted ignition. The heat release rate at piloted ignition in air is about 20 kW/m2 and about 50 kW/m2 to sustain burning [4 and 5]. The time to ignite is summarized in figure 8. It shows that the critical heat fluxes below which ignition cannot occur (in natural convection with radiant heating in air) is 17.5 kW/m2 for piloted ignition and about 31.5 kW/m2 for auto-ignition. No significant differences were noticed in ignition and burning for heating from either the smooth or rough side of the composite. So, in subsequent tests, only the rough side was examined.
0
50
100
150
200
250
300
350
0 20 40 60 80 100 120
IgnitionPilot SmoothPilot RoughAuto Rough
tig = 2 x 10⁴ * q" -1.5 ) R= 0.99
tig = 3 x 10⁴ * q" -1.6 ) R= 0.98
tig = 23 x 105 * q" -2 ) R= 0.97Ti
me
(s)
Incident Heat Flux (kW/m 2 )
No
Pilo
ted
Igni
tion@
17.
5 kW
/m2
No
Aut
o-ig
nitio
n@ 3
1.6
kW/m
2
Figure 8. Time to Ignite: Piloted and Auto
8

Ignition theory based on pure conduction indicates that the time for ignition should behave as heat flux to the -2 power for a thermally thick solid and -1 power for thermally thin. As thermally thick depends on the heat flux, if the physical thickness is greater than the thermal penetration depth as
i
igig q
TTk′′−
=δ≥δ ∞ )(2, (5)
then the material acts as thermally thick in ignition [3]. For a pilot ignition temperature of 300°C and a thermal conductivity of 0.25 W/m-K, thermally thick results apply for a heat flux greater than 43 kW/m2. Hence, one sees that the behavior for auto-ignition appears thermally thick, but not so for piloted ignition at lower heat fluxes. An important parameter for ignition is the Thermal Response Parameter (TRP). It is defined as
TRP =π4
kρc⎛ ⎝ ⎜
⎞ ⎠ ⎟
1/ 2
Tig − T0( ). (6)
Several ignition theories for a thermally thick material use TRP to predict the time to ignite. The simplest theory derives from linear conduction theory in the limit of high-incident radiant heat flux, as
2
⎟⎟⎠
⎞⎜⎜⎝
⎛′′
=i
ig qTRPt . (7)
The result may be adjusted to account for the critical flux limit at relatively low heat flux, as
2
⎟⎟⎠
⎞⎜⎜⎝
⎛′′−′′
=criti
ig qqTRPt . (8)
Spearpoint and Quintiere [6] obtained an approximate solution for the corresponding nonlinear effects of re-radiation, as
( )( )2
β1β2π3
16
⎟⎟⎠
⎞⎜⎜⎝
⎛′′
⎥⎥⎥⎥
⎦
⎤
⎢⎢⎢⎢
⎣
⎡
−−
⎟⎠⎞
⎜⎝⎛
=iigig
ig qTRPt , (9)
where i
crit
i
igcigig q
TThTT′′
′′=
′′−+−
≡)()(σ
β 04
04
. The TRP for the composite is found from the slope
of , as plotted in figure 9. iig qt ′′∝− 2/1
9

0
0.05
0.1
0.15
0.2
0.25
0 20 40 60 80 100 120
SmoothRough
tig
-1/2 = 0.033 + 0.00187q" R= 0.997
tig
-1/2 = 0.025 + 0.00198q" R= 0.997
t ig
-1/2
(s-1
/2 )
Incident Heat Flux (kW/m 2)
No
Igni
tion
TRP = 534 (sm), 505 (rg) s 1/2-kW/m2
Figure 9. Thermal Response Parameter Values From Ignition Delay Experiments
It is interesting to use the theories of ignition listed above to see how well they reproduce the data. Figure 10 was plotted using average values of TRP = 525 (kW/m2)-s1/2 and
. The theory describes the data only at high heat fluxes, where the sample is thermally thick. While the properties TRP and
2kW/m18=′′critq
critq ′′ found for ignition of the composite are valid, a theory for the prediction of ignition must account for the thin character of the sample at low heat flux.
10

0
200
400
600
800
1000
0 20 40 60 80 100 120
Time to Piloted Ignition with Theory
SmoothRoughSpearpoint TheoryLimit Flux TheoryNet Flux Theory
Tim
e (s
)
Incident Heat Flux (kW/m 2)
No
Igni
tion
@ 1
7.5
kW/m
2
Figure 10. Thermally Thick Theory Compared to Data for Piloted Ignition
2.5 BURNING.
The Ohio State University (OSU) fire calorimeter tests were performed according to Title 14 Code of Federal Regulations (CFR) 25.853 a-1 [7], the Federal Aviation Administration (FAA) flammability test method for large surface area materials for aircraft cabin interiors. Tests were performed on 15- by 15-cm (6- by 6-inch) samples with and without the foil backing, and with rough and smooth sides facing outward. Flammability was similar for all samples tested in the different configurations. An average of all the tests is shown in figure 11. Samples ignited 40 to 50 seconds into the test. Large flame jets protruded from the sample surface at 70 to 80 seconds into the test. Initially, it was thought that this occurred because the sample was backed with aluminum foil and the trapped gases had nowhere to go except out the front. Later, tests were performed without the foil backing, and the same sample jetting was observed with additional flames coming from the rear of the sample holder. The values derived from the test were consistent regardless of the sample orientation and the backing foil. Average results for 14 CFR 25.853 are shown in table 1. Samples had a peak heat release rate (HRR) of 104 kW/m2 at 162 seconds and a 2-minute total heat release (THR) of 73 kW/m2-min. The pass/fail criteria of 14 CFR 25.853 a-1 was established for large surface area interior components of passenger aircraft. Samples tested were 16-ply composites to be used for exterior and structural components of the aircraft.
11

-20
0
20
40
60
80
100
120
-20
0
20
40
60
80
100
120
0 50 100 150 200 250 300
0 20 40 60 80 100 120H
eat R
elea
se R
ate
(kW
/m 2 )
Total Heat R
elease (kW/m
2 min)
Time (seconds)
Time (seconds)
14 CFRPart 25
Maximum
Figure 11. Heat Release in OSU Calorimeter (Average of six tests)
Table 1. The Results for FAA 14 CFR 25.853 OSU Calorimeter Test
OSU Calorimeter Smoke Chamber Peak HRR (kW/m2)
2-min THR (kW/m2-min)
4Dm (--)
Average n=6 104 73 63 FAA Regulation 65 65 200
Cone calorimeter tests were run at incident radiant heat fluxes of 25, 50, 75, and 100 kW/m2 according to a standard method [8]. These were done in replicates of at least two for both the smooth and rough side of the composite facing the heat flux in a horizontal orientation. Additional cone tests were performed to determine the minimum heat flux to sustain burning. Following radiant exposure for about 100 s at heat fluxes below the minimum flux for piloted ignition, the sample was forced to ignition by a premixed Bunsen burner flame. As the air for the Bunsen burner was part of the flow stream into the cone system, its oxygen consumption could be used to estimate the contribution from the burner. The subsequent difference from the total energy release rate would be the contribution of the material. In this way, the energy
12

release rate of the material was determined below the minimum heat flux for ignition. The minimum heat flux for burning could be then established. Figure 12 shows the results of the standard cone data for fire energy flux (HRR, or heat release rate per unit area). As the heat flux increased over 25 kW/m2, the sample responds more as a thermally thick sample [3] producing two peaks in the HRR. The first peak occurs due to the composite seeking to achieve the steady state for the resin binder. As the resin depletes from the surface and into the depth of the material, the carbon fibers form a matrix of insulation. This insulation blocks heat and reduces the HRR. The second peak occurs as the thermal heating wave reaches the back of the composite, and the insulation of the lower density backing board of the cone holder now blocks more heat from being lost. Hence, more heat goes into the sample, and HRR increases until the resin is depleted. This completes the main flaming phase of the composite. However, the carbon and resin char are now capable of oxidizing, and smoldering can ensue with the possibility of a carbon monoxide (CO) flame near the surface.
0
50
100
150
200
250
300
350
400
0 100 200 300 400 500
25 kW/m2
Rough 1Smooth 1Rough 2Smooth 2
HR
R (k
W/m
2 )
Time (s)
Avg. Peak130 ± 30
0
50
100
150
200
250
300
350
400
0 100 200 300 400 500
50 kW/m2
Rough 1Smooth 1Rough 2Smooth 2
HR
R (k
W/m
2 )
Time (s)
Avg. Peak250 ± 50
0
50
100
150
200
250
300
350
400
0 100 200 300 400 500
75 kW/m2
Rough 1Smooth 1Rough 2Smooth 2Rough 3
HR
R (k
W/m
2 )
Time (s)
Avg. Peak290 ± 40
0
50
100
150
200
250
300
350
400
0 100 200 300 400 500
100 kW/m2
Rough 1Smooth 1Rough 2Smooth 2
HR
R (k
W/m
2 )
Time (s)
Avg. Peak315 ± 40
Figure 12. Heat Release Rate per Unit Area at Fluxes From 25 to 100 kW/m2
13
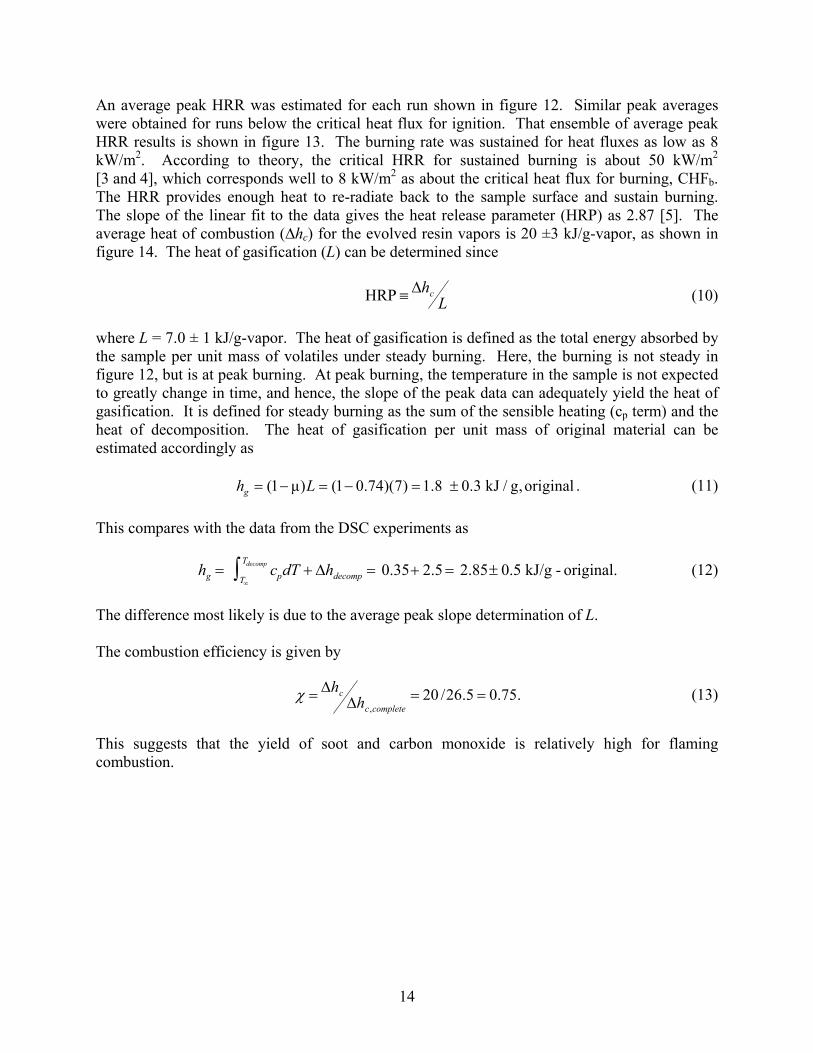
An average peak HRR was estimated for each run shown in figure 12. Similar peak averages were obtained for runs below the critical heat flux for ignition. That ensemble of average peak HRR results is shown in figure 13. The burning rate was sustained for heat fluxes as low as 8 kW/m2. According to theory, the critical HRR for sustained burning is about 50 kW/m2 [3 and 4], which corresponds well to 8 kW/m2 as about the critical heat flux for burning, CHFb. The HRR provides enough heat to re-radiate back to the sample surface and sustain burning. The slope of the linear fit to the data gives the heat release parameter (HRP) as 2.87 [5]. The average heat of combustion (∆hc) for the evolved resin vapors is 20 ±3 kJ/g-vapor, as shown in figure 14. The heat of gasification (L) can be determined since HRP ≡ Δhc
L (10) where L = 7.0 ± 1 kJ/g-vapor. The heat of gasification is defined as the total energy absorbed by the sample per unit mass of volatiles under steady burning. Here, the burning is not steady in figure 12, but is at peak burning. At peak burning, the temperature in the sample is not expected to greatly change in time, and hence, the slope of the peak data can adequately yield the heat of gasification. It is defined for steady burning as the sum of the sensible heating (cp term) and the heat of decomposition. The heat of gasification per unit mass of original material can be estimated accordingly as . (11) (1 μ) (1 0.74)(7) 1.8 0.3 kJ / g,originalgh L= − = − = ± This compares with the data from the DSC experiments as (12) hg = cpT∞
Tdecomp∫ dT + Δhdecomp = 0.35+ 2.5 = 2.85± 0.5 kJ/g - original.
The difference most likely is due to the average peak slope determination of L. The combustion efficiency is given by χ = Δhc
Δhc,complete= 20 /26.5 = 0.75. (13)
This suggests that the yield of soot and carbon monoxide is relatively high for flaming combustion.
14

0
50
100
150
200
250
300
350
0 20 40 60 80 100 120
Peak Average for All Data
HRR= 76.8 + 2.87q" R= 0.93
Ave
rage
Pea
k H
RR
(kW
/m 2 )
Incident Heat Flux (kW/m 2)
OSUVertical
HRP = 2.87
Heat of Combustion ~ 20 ± 3 kJ/g-vapor
L = 7.0 kJ/g-vapor
µ = 0.74 g residue/g-original
hg = (7.0)(1- 0.74) = 1.8 kJ/g-originalHRR crit,b
Figure 13. Average Peak HRR Over Burning Range
0
5
10
15
20
25
30
0 20 40 60 80 100 120
Heat of Combustion(based on overall average for flaming)
²hc (k
J/g
vapo
r)
Incident Heat Flux (kW/m 2)
Figure 14. Heat of Combustion Over Range of Burning
15

It should be noted that the burning (caused by the ignitor) below the critical heat flux for ignition was not complete, and a significant portion of the resin did not burn at these lower heat fluxes, particularly when the igniter was removed. By subjecting the igniter alone to the cone calorimeter, its average HRR was recorded as about 120 kW/m2. This is shown in figure 15, where the igniter was exposed alone during the 12.3 and 14.7 kW/m2 runs. The net average peak HRR were estimated accordingly and are shown in the boxed labels of figure 12.
0
50
100
150
200
250
300
0 100 200 300 400 500
18.7 kW/m2
12.3 kW/m2
14.7 kW/m2
8.2 kW/m2
HR
R (k
W/m
2 )
Time (s)
Ignitor Only
14.7 kW/m2
Igniter Only
12.3 kW/m2
Ignitoroff
IgnitorOff
120 ± 20Igniter
At 18.7 flame3 is sustainedIn all other fluxes, flame HRR dropsafter PM ignitor is withdrawn
100 ± 20net @12.3
120 ± 20net @ 14.7
130 ± 20
60 ± 20
Figure 15. The HRR During the Critical Burning Series With Igniter
Figure 16 shows the THR per unit area during flaming. It clearly shows that at these lower heat fluxes, not all of the resin is burned. The THR is 30 MJ/m2 for heat fluxes above 25 kW/m2, but drops off linearly at lower values, falling to about 2 MJ/m2 at 8 kW/m2. While the initial flame and radiant heat fluxes can allow the burning to commence at the lower heat fluxes, as the resin is depleted, the carbon fibers insulate to reduce the internal heat flux. This causes extinction before all of the resin is consumed. The carbon fibers will continue to oxidize following extinction of the flame due to the resin’s combustion. This process was not fully explored to delineate its properties, but some features were established. The mass loss, after the flame extinguished, was examined for a limited period in the standard cone tests. In addition, at 85 kW/m2, a thin blue flame about 2-3 mm off the surface persisted until the radiant heat flux was turned off. The burning rate for these cases is shown in figure 17.
16

0
5
10
15
20
25
30
35
40
0 20 40 60 80 100 120
Total Heat Release based on Flaming
SmoothRoughTH
R (M
J/m
2 )
Incident Heat Flux (kW/m 2)
CH
F
Figure 16. Total Energy Released in Burning
0
0.2
0.4
0.6
0.8
1
0 20 40 60 80 100 120
Estimated Burn Rate of Carbonat End of Cone Tests
Bur
n R
ate
(g/m
2 -s)
Incident Heat Flux (kW/m 2)
Blue CO Flame Observed
Figure 17. Burning Rate of Carbon Fibers in Smoldering
17

At sufficiently high temperatures, the smoldering oxidation of carbon will be sustained. The energy supply to the surface comes from the incident radiant heating and the energy produced in oxidation. At low temperatures (less than 500°C), the oxidation process is primarily controlled by kinetics, but at higher temperatures, the process of smoldering is controlled by the rate of oxygen transport to the surface. This transport depends on the convective field and, therefore, increases as the velocity of the stream increases. The carbon combustion rate at high temperatures is directly proportional to the heat transfer convective coefficient [9]. In the cone test, the heat transfer coefficient is roughly 10 W/m2-K [3]; under flight conditions this can be as high as 300 W/m2-K. Under natural convection conditions, the 3.2 mm composite sample tested would oxidize all of the carbon in about 1 hour at 85 kW/m2. Under flight conditions, this could occur in about 2 minutes provided the heat flux can be sustained. Surface temperatures of the composite were measured in several tests following flaming combustion. These temperatures constitute the condition of surface smoldering. The values are plotted in figure 18 along with the blackbody temperature corresponding to the incident heat flux. It shows that the convective and conduction losses from the surface exceed the energy released in smoldering. The smoldering energy is of the order of 5-35 kW/m2.
0
200
400
600
800
1000
0 20 40 60 80 100 120
Carbon Temperature Following Flaming
Surface TemperatureFlux Blackbody Temperature
Surf
ace
Tem
pera
ture
(ºC
)
Incident Heat Flux (kW/m 2)
Convection + Conduction Lossesminus Energy of Smoldering
Figure 18. Surface Temperatures of Carbon Fiber Smoldering
18

2.6 YIELDS AND MORPHOLOGY OF BURNING.
The composite material decomposes and burns under heating by vaporizing the resin binding the carbon fiber plies. As the resin vaporizes, it seeks to escape through the fibers, and this process develops pressure in the composite. Those stresses result in a volume increase for the remaining matrix of material. Under flaming, that pressure can cause jets to emerge that distort the normal natural convection flame on the surface. This is particularly evident in the burning of a vertical sample, as done in the OSU apparatus. A photograph of the enlarged boundary layer flame due to jetting is shown in figure 19. After flaming, the composite generally is depleted of the resin if combustion is complete, and this was shown to be the case for heat fluxes above about 25 kW/m2 according to figure 16. However, char from the resin can remain, and this is roughly 0.25 as a char mass fraction based on the resin alone [10]. As the resin and its char are depleted, the carbon plies can lose their structural integrity. It was observed that for the case of 85 kW/m2, in which the sample was allowed to smolder for some time after flaming ceased, the fiber structure lost its rigid composition upon handling. The composition became more loosely hair-like with increasing handling. Photographs of the final state of the composite after burning are shown in figure 20a through 20h. The aluminum foil in the photographs was either due to wrapping the back for the cone test, or due to sealing in volume determination tests (blue in some photographs).
Figure 19. Vertical Burning in the OSU Apparatus
19

Figure 20a. After Burning Front and Back, 8.2 kW/m2
Figure 20b. After Burning Front and Back, 12.3 kW/m2
Figure 20c. After Burning Front and Back, 14.7 kW/m2
20

No ignition
Figure 20d. After Heating Front and Back, 17.5 kW/m2
Figure 20e. After Burning Front and Back, 18.7 kW/m2
Figure 20f. After Burning Front and Back, 40.0 kW/m2
21

Figure 20g. After Burning Front and Back, 60.0 kW/m2
Figure 20h. After Burning Front and Back, 85 kW/m2
Figure 21 displays the typical swelling of the composite on heating. As the edges are constrained in the cone holder, the swelling is mostly at the center. The thickness increase at the center was measured, and an attempt was made to measure the volume increase. The volume was measured by immersing the sample in a beaker of water and measuring the volume displaced.
22

(a) At 40 kW/m2
(b) Original
Figure 21. Thickness Increase on Burning
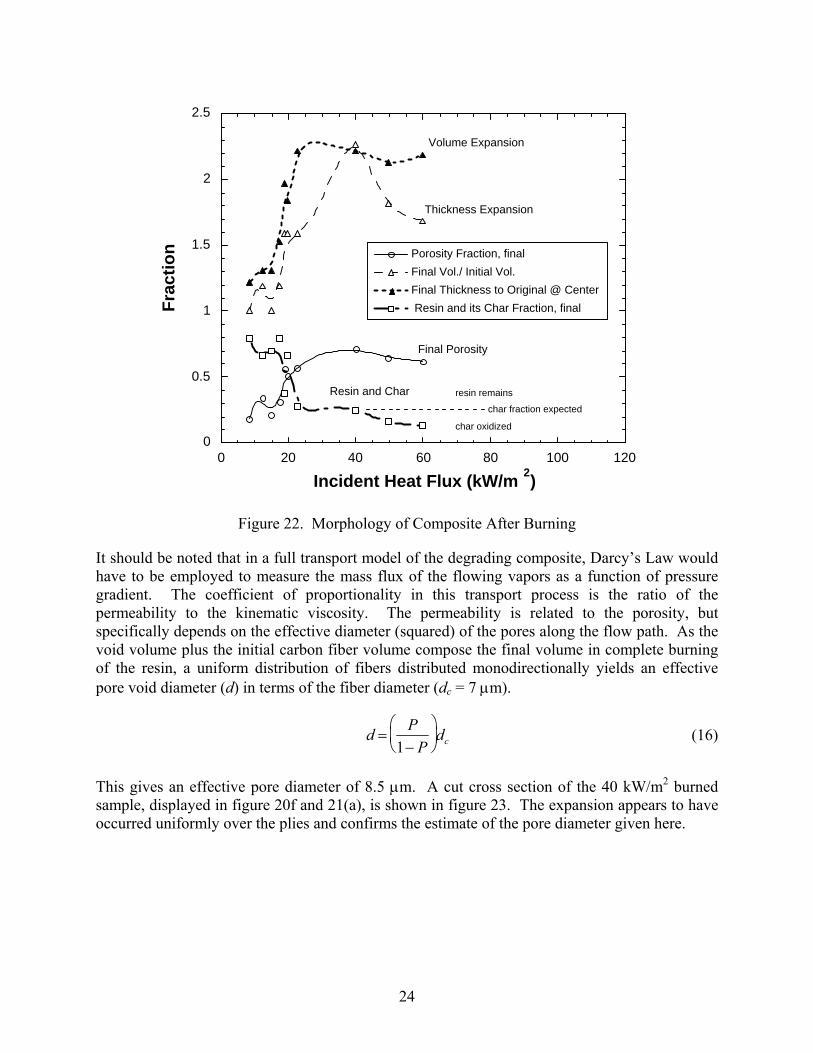
For the more degraded samples, an increase in mass of the sample indicated the absorption of water. By weight measurements before and after immersion, the true displaced volume of the outer envelope of the sample could be estimated. The initial volume was 32 cm3, and thickness was 3.2 mm. Figure 22 shows the increases in volume and thickness. In addition, the porosity (P) of the expanded sample (void volume to final volume) and the mass fraction (μchar) of the resin remaining as char or undepleted resin were estimated. These follow from
( ) ⎥⎦
⎤⎢⎣
⎡−+−= charic
char
RicP μφ1
ρρφ1 ,, (14)
and ( )
( )icR
icifichar
mm
,
,
φ1ρμ/ρ
μ−
−= (15)
where the initial bulk density, ρi = 1.54 g/cm3 the initial carbon fiber mass fraction, μc,i = 0.68 the initial carbon fiber volume fraction, φc,i = 0.60 the resin density, ρR = 1.22 g/cm3 the char density, ρchar = 1.75 g/cm3 (as an estimate) For heat fluxes above about 25 kW/m2, complete burning of the resin takes place and the properties associated with expansion appear to approach an asymptote. The maximum volume expansion factor is about 2.2, the porosity is about 0.65, and the char fraction of the resin appears to approach its nominal value of about 0.25.
23
0
0.5
1
1.5
2
2.5
0 20 40 60 80 100 120
Porosity Fraction, finalFinal Vol./ Initial Vol.Final Thickness to Original @ Center Resin and its Char Fraction, finalFr
actio
n
Incident Heat Flux (kW/m 2)
char fraction expected
char oxidized
resin remains
Volume Expansion
Thickness Expansion
Final Porosity
Resin and Char
Figure 22. Morphology of Composite After Burning
It should be noted that in a full transport model of the degrading composite, Darcy’s Law would have to be employed to measure the mass flux of the flowing vapors as a function of pressure gradient. The coefficient of proportionality in this transport process is the ratio of the permeability to the kinematic viscosity. The permeability is related to the porosity, but specifically depends on the effective diameter (squared) of the pores along the flow path. As the void volume plus the initial carbon fiber volume compose the final volume in complete burning of the resin, a uniform distribution of fibers distributed monodirectionally yields an effective pore void diameter (d) in terms of the fiber diameter (dc = 7 μm).
d =P
1− P⎛ ⎝ ⎜
⎞ ⎠ ⎟ dc (16)
This gives an effective pore diameter of 8.5 μm. A cut cross section of the 40 kW/m2 burned sample, displayed in figure 20f and 21(a), is shown in figure 23. The expansion appears to have occurred uniformly over the plies and confirms the estimate of the pore diameter given here.
24

Figure 23. Cross Section of the 40 kW/m2 Heated Composite
2.7 YIELDS OF INCOMPLETE COMBUSTION PRODUCTS.
The primary incomplete products of combustion for the flaming resin are CO and soot. The cone calorimeter data includes concentration measurements of CO and light obscuration of the smoke. Tewarson [11] best explains how these measurements are converted into yields based on per unit mass of vapor burned. The heat of combustion given in figure 13 is the yield of chemical energy released per unit mass of vapor. Similarly, the yield of CO and smoke are computed and averaged over the flaming period. They all serve to give the average stoichometry of the combustion reaction of the vapor with air. Figure 24 gives the yield of CO for flaming conditions. As with the heat of combustion of figure 14, the yield reaches an asymptote (~ 0.048) for complete burning of the resin after about 25 kW/m2. Note, under smoldering conditions, nearly all of the carbon will yield CO, but it could be burning completely to CO2 if a flame forms near the surface, as discussed for the sample burned at 85 kW/m2.
0
0.01
0.02
0.03
0.04
0.05
0.06
0 20 40 60 80 100 120
y CO g
CO
/g F
uel L
ost
Heat Flux (kW/m 2)
Figure 24. Yield of CO for Flaming Conditions
25

The parameter measured for smoke is the mass optical density (Dm), and it expresses the visibility per unit mass of fuel lost. It is directly related to the yield of soot or particulates in the smoke. It also relates to the specific optical density (Ds) quantity measured in the National Bureau of Standards smoke density chamber (SDC) as Ds = Dm Δmlost / A( ) (17) where ∆mlost/A is the mass lost per unit surface area of heated specimen. As Ds is a dimensionless quantity inversely related to the transmission of light (i.e. I/Io ~ exp(-Ds)), the attenuation by the smoke increases as ∆mlost/A increases. The mass optical density approaches a constant of roughly 850 m2/kg of mass lost as shown in figure 25.
400
500
600
700
800
900
1000
0 20 40 60 80 100 120
Smoke Mass Optical Density
Dm
m2 / k
g Fu
el L
ost
Heat Flux (kW/m 2)
Figure 25. Yield of Smoke for Flaming Conditions
The smoke density of the composite measured in the smoke density chamber gave results as shown in figure 26. Here a vertical sample is irradiated at 25 kW/m2 and small premixed flames near the bottom promote piloted ignition. The results of the standard test for the composite is shown in figure 26 along with a prediction using equation 17 based on the mass loss rate in the cone at 25 kW/m2. The difference between the standard result and the prediction is due to the transient burning behavior between the standard vertical configuration and the horizontal sample orientation in the cone. This result also shows the limitation of addressing smoke hazard by the standard test, as the smoke visibility for the composite is clearly a function of ignition time and the early rate of burning. The hazard of smoke visibility needs to address the nature of the fire scenario. The SDC is a closed system at the start of burning and pertains to the volume of that chamber and the area of burning.
26

0
100
200
300
400
500
600
0 50 100 150 200 250 300 350
Smoke Density Chamber
Prediction from Cone
Data @ 25 kW/m2
Spec
ific
Opt
ical
Den
sity
Time (s)
Sta
ndar
d Te
st S
topp
ed
Figure 26. The Ds for the Smoke Density Chamber
The fractional residue of carbon fibers and resin char that remains after flaming was suggested by TGA data to be 0.74. The results in the array of cone tests are shown in figure 27 to vary with heat flux, which is consistent with the TGA result.
0.65
0.7
0.75
0.8
0.85
0.9
0.95
1
0 20 40 60 80 100 120
Final Residue FractionCarbon Fibers + Resin Char
Cone Tests
Frac
tion
of M
ass
Rem
aini
ng
Incident Heat Flux (kW/m 2)
TGA Result
Figure 27. Residue Fraction After Flaming
27

2.8 FLAME SPREAD.
A special radiant panel apparatus was used to investigate the conditions of flame spread for the composite. The apparatus was developed in the work of Panagiotou and Quintiere [12], and is depicted in figure 28. The composite was tested in an exposed dimension of approximately 6 by 25 cm long. The sample had to be specially prepared by applying an adhesive ceramic coating to the edges to prevent out-gassing along the edges. Only surface flames must appear in a proper test to reflect no exposure size factors. The tests were run with preheating at the designated heat flux to establish a steady temperature on the surface. The preheating time was set at 4 minutes, corresponding to the time to reach the critical heat flux as derived from the curve shown in figure 8 (i.e., 0.065-2/60 = 3.9 min.). The flame spread is only a unique function of heat flux at this long-time condition, as the flame speed depends on surface temperature. A video camera behind the radiant panels recorded the flame spread as shown in figure 29. A reduction of these data allowed an estimate of the flame tip and the pyrolysis position. If the speed of the pyrolysis front is steady, the speed of the flame tip will be identical. A typical reduction of the video data is shown in figure 30. By comparing the time to ignite with the ignition data (figure 8), the 6-cm-tall igniter flame is estimated to have had a net flame heat flux of about 60 kW/m2. The flame tip velocity was slightly higher than the pyrolysis front speed, but the flame speed did appear constant for about 100 s. After that time, the flame speed decreased, and its advancement stopped. The igniter was sustained over the entire time.
Figure 28. Flame Spread Apparatus
Radiant H
Sample (back)
Line Igniter
eaters
28
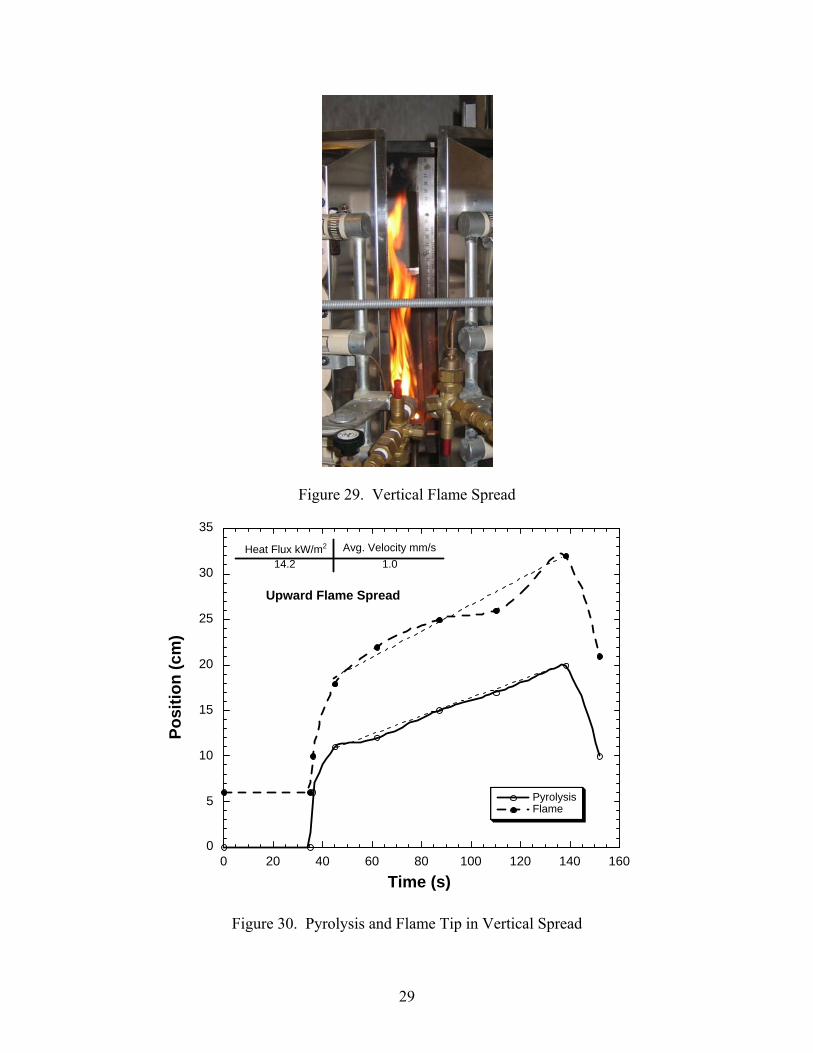
Figure 29. Vertical Flame Spread
0
5
10
15
20
25
30
35
0 20 40 60 80 100 120 140 160
Upward Flame Spread
PyrolysisFlame
Posi
tion
(cm
)
Time (s)
Avg. Velocity mm/sHeat Flux kW/m2
1.014.2
Figure 30. Pyrolysis and Flame Tip in Vertical Spread
29

All vertical flame spread data exhibited this decay in speed after some time. It would appear that the igniter flame had some influence, but more likely the decrease in the burning rate of the composite caused the decrease. The flame spread was investigated in a horizontal orientation and vertically downward. The heat flux available was not able to spread the flame initially. All flame spread results determined in this study are shown in figure 31. At the critical flux for piloted ignition, the flame spread would approach the premixed speed (~ 50 cm/s) as the surface temperature would approach the ignition temperature. The critical heat flux for upward flame spread is < 10 kW/m2, for downward is between 14 and 18 kW/m2, and for horizontal is between 6 and 18 kW/m2. The limitations of the apparatus on achieving sufficient heat fluxes for spread on downward and horizontal orientations prohibited more precise results. The nature of the upward spread observed is shown in figure 32.
0
0.2
0.4
0.6
0.8
1
1.2
0 5 10 15 20
Flame Spread Rate
UpwardDownHorizontal
Velo
city
(mm
/s)
Heat Flux (kW/m 2)
No Horizontal Spread No Downward Spread
Upward
Igni
tion
CH
F
Figure 31. Flame Speed Dependence on Heat Flux
30

Figure 32. Upward Flame Spread Behavior
3. SUMMARY OF RESULTS.
The data presented herein constitute a set of information useful for characterizing the burning behavior of the Toray Composites BMS 8-276 carbon-fiber material. A summary of the results is presented in table 2. The parameters constitute the properties related to thermal heating, degradation, burning, and the physical morphology of the material undergoing thermal degradation. All results were conducted in air, except for the microcalorimeter and TGA/DSC where degradation was performed in nitrogen. The effect of increased oxygen will have minimal effect on the piloted ignition temperature, reduce the auto-ignition temperature, linearly increase the burning rate, and cause the flame spread rate to increase at most with the square of oxygen concentration [3]. The effect of increased thickness would be to increase burning time and somewhat delay ignition times for heat fluxes below about 43 kW/m2. Complete vaporization of the resin occurred for heat fluxes above 25 kW/m2 in the cone calorimeter with an insulated backface. Under these conditions, the heat of combustion was approximately 20 kJ/g-vapor, the yield of CO in flaming was roughly 0.48 g CO/g-vapor, and the mass fraction of remaining residue was roughly 0.74. The sample can swell to over twice its volume, and its porosity after burning is about 65%. The minimum heat flux required for auto-ignition is 32 kW/m2, for piloted is 18 kW/m2, and for burning is about 10 kW/m2. Flame spread will occur for heat fluxes below 18 kW/m2 after preheating for 4 minutes with upward flame spread occurring for as low as 10 kW/m2 with rates of the order of 1 mm/s.
31

Table 2. Summary of Toray Carbon-Fiber Composite
Property Value Comments Thickness 3.2 mm Density 1530 kg/m3 Thermal conductivity at 25°C at 300°C
0.13 W/m-K 0.32 W/m-K
Heat loss error could result in about 20% lower values
Specific heat at 25°C at 300°C
0.85 J/g-K 1.98 J/g-K
Decomposition temperature • Onset • Range
300°C 650°C, max
Significant range is 400° - 500°C
Heat of decomposition 2.5 kJ/g original Activation energy to pyrolysis 182 kJ/mol Pre-exponential coefficient 9.67 x 10¹⁰ s-1 First-order reaction fit
Heat of combustion • Complete • Actual
26. 5 kJ/g vapor 20 ±3 kJ/g vapor
From microcalorimeter From cone
Effective heat of gasification 7 ±1 kJ/g vapor 1.8 ±0.3 kJ/g-original 2.85 ±0.5 kJ/g-original
Based on average peak From cone data From DSC
Critical heat flux • Auto ignition • Piloted ignition • Burning • Upward flame spread • Downward flame
spread • Horizontal flame
spread
32.0 kW/m2 18.0 kW/m2 ~ 8.0 kW/m2 ~ 10 kW/m2 14 to 18 kW/m2 6 to 18 kW/m2
Combustion not complete Flame dies out
Total heat release per thickness
9.4 MJ/m2-mm > 25 kW/m2
CO yield in flaming 0.48 ±0.05 g/g vapor > 25 kW/m2 Smoke mass optical density 0.85 ±0.05 g/g vapor > 25 kW/m2 Residue fraction after flaming 0.74 Carbon fibers + resin char Porosity after flaming 0.65 ±0.05 > 25 kW/m2 Volume expansion 2.2 ±0.1 > 25 kW/m2 Char yield from resin 0.20 ±0.05 > 25 kW/m2
32

4. CONCLUSIONS.
This report has presented the properties of a carbon composite typical of aircraft construction. The resin binding the carbon fibers comprises about 30% of its mass and will burn with a char residue of about 20%. The properties of the composite under fire heating conditions and burning have been measured and can be used in modeling and explaining attributes of fire performance of this material. It should be realized that the properties pertain primarily to the characteristics of the resin material, as the carbon fibers do not generally burn. Also, the burning tests are peculiar to horizontal burning in the cone calorimeter and, therefore, depend on the flame heat flux generated in that test and the insulated nature of its back face. Otherwise, the results are expected to be general, and not test dependent. 5. REFERENCES.
1. Stoliarov, S.I., Walters, R.N., and Lyon, R.E., “Determination of Heats of Gasification of Polymers Using Differential Scanning Calorimetry,” Proc. 52nd Intl. SAMPE Symposium & Exhibition, Baltimore, MD, June 4-6, 2007.
2. Lyon, R.E. and Walters, R.N., “Microscale Combustion Calorimeter,” US5981290,
November 09, 1999. 3. Kim, M. and Quintiere, J.G., “Predicting Polymer Burning Using TGA/DSC,” 5th Int.
Seminar on Fire and Explosion Hazards, Edinburgh, 23-27 April 2007. 4. Lyon, R.E., “Piloted Ignition of Combustible Solids,” Fire and Materials, 9th
International Conference, San Francisco, CA, January 31, 2005. 5. Quintiere, J.G., “A Theoretical Basis for Flammability Properties,” Fire and Materials,
March 29, 2006. 6. Spearpoint, M.J. and Quintiere, J.G. “Predicting the Piloted Ignition of Wood in the
Cone Calorimeter Using an Integral Model - Effect of Species, Grain Orientation and Heat Flux,” Fire Safety Journal, 36, 2001.
7. FAR 25.853 a-1, “Heat Release Test for Cabin Materials,” compiled by April Hornor,
Aircraft Materials Fire Test Handbook, FAA report DOT/FAA/AR-00/12, April 2000. 8. ASTM E 1354, “Standard Test Method for Heat and Visible Smoke Release Rates for
Materials Using an Oxygen Consumption Calorimeter,” American Society of Testing and Materials, Philadelphia, PA, 1992.
9. Glassman, I., Combustion, Academic Press, NY, 1977. 10. Lyon, R.E., FAA William J. Hughes Technical Center, Private Communications, May
2007.
33

11. Tewarson, A., “Generation of Heat and Chemical Compounds in Fires,” Sec. 3, Chap. 4, The SFPE Handbook of Fire Protection Engineering, 3rd ed., pp. 3-82 to 3-161, The National Fire Protection Association Press, Quincy, MA, 2002.
12. Panagioutou, J. and Quintiere, J. G., “Generalizing Flammability of Materials,” Interflam
2004, Edinburgh, July 2004.
34