dot/faa/ar-07/34 extended material testing research and ...extended material testing research and...
TRANSCRIPT

DOT/FAA/AR-07/34 Air Traffic Organization Operations Planning Office of Aviation Research and Development Washington, DC 20591
Extended Material Testing Research and Technical Enhancements of IPAM3 Equipment for Determining Aging of Wire Insulation in Aircraft July 2007 Final Report This document is available to the public through the National Technical Information Service (NTIS), Springfield, Virginia 22161.
U.S. Department of Transportation Federal Aviation Administration

NOTICE
This document is disseminated under the sponsorship of the U.S. Department of Transportation in the interest of information exchange. The United States Government assumes no liability for the contents or use thereof. The United States Government does not endorse products or manufacturers. Trade or manufacturer's names appear herein solely because they are considered essential to the objective of this report. This document does not constitute FAA certification policy. Consult your local FAA aircraft certification office as to its use. This report is available at the Federal Aviation Administration William J. Hughes Technical Center’s Full-Text Technical Reports page: actlibrary.tc.faa.gov in Adobe Acrobat portable document format (PDF).

Technical Report Documentation Page 1. Report No.
DOT/FAA/AR-07/34
2. Government Accession No. 3. Recipient's Catalog No.
4. Title and Subtitle
EXTENDED MATERIAL TESTING RESEARCH AND TECHNICAL ENHANCEMENTS OF IPAM3 EQUIPMENT FOR DETERMINING AGING OF WIRE INSULATION IN AIRCRAFT
5. Report Date July 2007
6. Performing Organization Code
7. Author(s)
William M. Denny and David Puterbaugh
8. Performing Organization Report No.
9. Performing Organization Name and Address
Analog Interfaces, Inc. 706 South Union Avenue Alliance, OH 44601
10. Work Unit No. (TRAIS)
11. Contract or Grant No.
12. Sponsoring Agency Name and Address
U.S. Department of Transportation Federal Aviation Administration Air Traffic Organization Operations Planning Office of Aviation Research and Development Washington, DC 20591
13. Type of Report and Period Covered
Final Report
14. Sponsoring Agency Code ANM-111
15. Supplementary Notes The Federal Aviation Administration Airport and Aircraft Safety R&D Division COTR was Cesar Gomez. 16. Abstract
The Indenter is a nondestructive test method that monitors the aging of wires by measuring changes in compressive modulus, a mechanical property of insulation and jacket materials. When wires age, significant changes occur in a mechanical property before any changes occur in an electrical property. That is, the mechanical properties must change to the point of embrittlement and cracking before significant electrical changes are observed. Changes in mechanical properties typically have been evaluated by Elongation-at-Break (EAB) testing. However, EAB testing is destructive and requires relatively large specimens, making it undesirable for analyzing installed cables. As an alternative to EAB tests, Indenter tests that measure compressive modulus provide a systematic indication of material aging. Thus, Indenter data obtained during a research project that also obtained EAB (or other) data at the same level of aging can be correlated to predict remaining cable life. The goal of this research project was to develop the Indenter further so that it would be a nonintrusive, easy-to-use, nondestructive portable test device to help assess the aging condition of wires in aircraft. Significant enhancements to the design of the Indenter (both in hardware and software) during this project have advanced the state of the art of this technology and resulted in a more accurate, reliable, and easier-to-use instrument. Both electrical and mechanical tests have demonstrated conclusively that the Indenter is a nondestructive test technique. Insulation Resistance and High-Potential Withstand test measurements made on wires before and after Indenter tests showed no change in electrical performance. An Indenter-tested wire examined under a microscope revealed no damage, and a mandrel bend test during extended accelerated aging exposures produced no visible difference in aging between wires that had been indented prior to aging and those that had not been indented prior to aging. There is no apparent relationship between insulation thickness and Indenter modulus for polyimide. That is, when the ratio of insulation thickness to conductor diameter varies for this type of insulation, the Indenter modulus is not proportional to the change in ratio. This finding is valid for both unaged and aged polyimide. 17. Key Words Indenter, Aged wire, Wire degradation
18. Distribution Statement This document is available to the U.S. public through the National Technical Information Service (NTIS), Springfield, Virginia 22161.
19. Security Classif. (of this report) Unclassified
20. Security Classif. (of this page) Unclassified
21. No. of Pages 149
22. Price
Form DOT F 1700.7 (8-72) Reproduction of completed page authorized

ACKNOWLEDGEMENTS The research project described in the following report was made possible by the combined efforts of numerous people in the Federal Aviation Administration, private industry, and academia. Analog Interfaces, Inc. greatly appreciates their support in providing material information and testing services, as well as offering excellent suggestions based on their expertise and many years of professional experience. Specific mention is made of the following participants: Cesar A. Gomez Federal Aviation Administration L. Catherine Brinson, PhD Northwestern University Hui Zang, PhD Northwestern University T. Ramanathan Northwestern University Roger D. Bradshaw, PhD University of Louisville Kaushik B. Nagendran University of Louisville Kevin Howard Sandia National Laboratories Robert Palomino Sandia National Laboratories Edward White Wright Patterson AFB James Hierholzer Wright Patterson AFB William M. Denny AMEC Earth & Environmental, Inc. A special note of appreciation to Drs. Brinson and Bradshaw whose contribution over the period of this report far exceeded the immediate areas that they originally were to provide inputs.
iii/iv

TABLE OF CONTENTS
Page EXECUTIVE SUMMARY xi 1. INTRODUCTION 1
2. RELAXATION METHOD—INVESTIGATION OF CALCULATION FORMULA 2
3. COMPARISON OF IPAM AND WIDAS DATA AT BENDS IN WIRE 5
4. ADDITIONAL OVEN AGING OF SELECTED INSULATION MATERIALS 7
5. MEASURING DEFORMATION ON HARD WIRES 15
5.1 Incorporate an LVDT Into the Indenter 15
5.1.1 Deformation Reading Methods—Encoder, LVDT, and DMA 17 5.1.2 Decision on Using the LVDT for Deformation Readings 18 5.1.3 Conclusions Regarding the LVDT and Indenter 19
5.2 Developing an Alternative Method of Calculating the Modulus 19
5.3 Software Modifications to Incorporate LVDT and Modulus Calculation Changes 23
6. SIMPLFIED FIELD CALIBRATION CHECK METHOD 23
7. MANUFACTURE A COMPLETE INDENTER SYSTEM (PHASE 2) 26
7.1 Hardware Enhancements 26
7.2 Software Enhancements 28
8. INDENTER MEASUREMENTS OF INTRUSIVE INSPECTION WIRE SAMPLES 29
8.1 Wire Tests 29
8.2 Sources of Intrusive Inspection Report Data Relative to Wires Tested at Sandia 35
8.3 Summary of Correlations 36
9. NONDESTRUCTIVE TESTS 37
9.1 Electrical Tests—Insulation Resistance and High-Potential Withstand 38
9.2 Mechanical Test—Mandrel Bend 39
v

10. CORRELATE MECHANICAL DEGRADATION TEST DATA WITH ELECTRICAL PERFORMANCE 39
11. EVALUATE AN ADDITIONAL WIRE TYPE USED IN AIRCRAFT 41
12. RESULTS 43
13. REFERENCES 45
APPENDICES
A Test Plan and Three Revisions
B Elongation-at-Break Testing AMEC Test Specification PTLI Test Results
C Aging Schedule for all Wires Used in Project
D A Discussion of LVDT and Modulus
E Northwestern University Memo on Indentation and Impedance Spectroscopy Testing
F Modulus Discussion
G Change in Probe Tip Design
H Test Data From Intrusive Inspection Report Referenced to Wires Tested at Sandia
I Nondestructive Test Plan
J Insulation Resistance and High-Potential Testing
vi

LIST OF FIGURES
Figure Page
1 Relaxation of PVC 3
2 New Probe PVC Relaxation 4
3 Example of Cubic Curve Fit Produced by the Template 5
4 Coils From WIDAS Tests 6
5 Large-Diameter Coil 6
6 Straight Versus Bend Sections of WIDAS Power Wires 7
7 Straight Versus Bend Sections of Widas Polyimide Instrument Wires 7
8 Various Specimens in Small Oven 10
9 Various Specimens in Large Oven 10
10 Indenter Modulus: PVC 11
11 Indenter Modulus: PVC G-N 11
12 Indenter Modulus: XL-ETFE 12
13 Indenter Modulus: Polyimide INST 12
14 Indenter Modulus: Polyimide Power 13
15 Indenter Modulus: Composite TKT 13
16 Elongation-at-Break: XL-ETFE 14
17 Elongation-at-Break: TKT 14
18 Linear Variable Differential Transducer 15
19 Mounting LVDT to Probe Tip 16
20 Analog PVC Modulus Values Using Encoder, LVDT, and DMA 18
21 Comparison of Two Methods to Determine Modulus for PVC 20
22 Comparison of Two Methods to Determine Modulus for XL-ETFE 21
23 Comparison of Two Methods to Determine Modulus for Polyimide 21
vii

24 Comparison of Three Methods to Determine Modulus for PVC 23
25 Calibration Test Rods 25
26 Testing Calibration Rods 26
27 Wire Clamping Area of Indenter Phase 2 27
28 Internal View of Indenter Phase 2 27
29 External View of Indenter Phase 2 28
30 Testing Setup of Complete System 28
31 Close-up of Indenter Test on Large Cable 33
32 Typical Wire for Testing 34
33 Conceptual Diagram for Indenter 34
34 High-Potential Withstand Test 34
35 Insulation Resistance Test 38
36 Examination of Indented Location (Centered Between Black Marks) Magnified 9.5 Times 38
37 Mandrel Bend Test 39
38 Indenter Modulus of CA PVC 40
39 Modulus Versus Impedance (Z’) 41
40 Comparison of Thickness Effect for M81381 43
viii

LIST OF TABLES
Table Page 1 Relaxation Solution for Hold Portion 4 2 Summary of Thermal Aging Program 9 3 Test Rod Candidates 24 4 Testing of HDPE and LDPE Calibration Rods 24 5 Crafty Glue Rod Calibration Test 25 6 Location Codes 30 7 Wires Tested by Aircraft, Location, and Wire Type 30 8 Indenter Results by Wire Type and Modulus Value 31 9 Aircraft and Wires in Intrusive Inspection 35 10 Thermal and Chemical Aging PVC Modulus Readings 40 11 Dimensions of M81381 Wires 42
ix

LIST OF ACRONYMS ATSRAC Aging Transport Systems Rulemaking Advisory Committee CA Chemically aged DMA Dynamic Mechanical Analyzer EAB Elongation-at-break FAA Federal Aviation Administration HDPE High-density polyethylene IIR Intrusive Inspection Report INST Instrument IPAM Indenter Polymer Aging Monitor IR Insulation resistance IS Impedance Spectroscopy LDPE Low-density polyethylene LVDT Linear variable differential transducer MIL Military specification number PC Personal computer PVC Polyvinyl chloride PVC G-N Polyvinyl chloride glass-nylon TA Thermally aged TKT Teflon®-Kapton®-Teflon® WIDAS Wire Insulation Deterioration Analysis System XL-ETFE Cross-linked ethylene tetraflouroethylene Z Impedance
x

EXECUTIVE SUMMARY The Indenter was originally developed by the Electric Power Research Institute for use in nuclear power plants. The Indenter is a nondestructive test method that monitors the aging of wires by measuring changes in compressive modulus, a mechanical property of insulation and jacket materials. When wires age, significant changes occur in a mechanical property before any changes occur in an electrical property. That is, the mechanical properties must change to the point of embrittlement and cracking before significant electrical changes are observed. Changes in mechanical properties typically have been evaluated by Elongation-at-Break (EAB) testing. However, EAB tests are destructive and require relatively large specimens, making them undesirable for analyzing installed cables. As an alternative to EAB tests, Indenter tests that measure compressive modulus provide a systematic indication of material aging. Thus, Indenter data obtained during a research project that also obtained EAB (or other) data at the same level of aging can be combined in a graph to predict remaining cable life. During the first phase of this project, six commonly used wire types were thermally aged and tested with the Indenter to see how Indenter modulus readings changed with aging. The results showed that the wires had not been aged to a level at or approaching an end-of-life condition. Thus, the same wires were additionally aged and tested to validate that the specimens had approached an end-of-life condition. In addition to these six wires, an additional wire, military specification 81381—Polyimide Power, was added to the aging program. The goal of this research project was to develop the Indenter further so that it would be a nonintrusive, easy-to-use, nondestructive, portable test device to help assess the aging condition of wires in aircraft. Significant enhancements to the design of the Indenter (both in hardware and software) during this project have advanced this state of the art of this technology and resulted in a more accurate, reliable, and easy-to-use instrument. For wire specimens that were subjected to additional thermal aging for significant periods of time, the most notable findings were (1) the polyvinyl chloride (PVC) had become discolored and very stiff and (2) the polyvinyl chloride glass-nylon (PVC G-N) was severely aged and cracked. The insulation showing the least effects from thermal aging was the Composite Teflon®-Kapton®-Teflon® (TKT); it appeared and felt similar to unaged specimens. Only the PVC demonstrated a clear pattern in modulus data that could be correlated with aging as the amount of aging time increased. The modulus values for other materials did change significantly after extended aging, but there was no consistent pattern in the change in modulus that could be correlated with age. EAB testing produced good results for both cross-linked ethylene tetraflouroethylene (XL-ETFE) and Composite TKT. However, although both materials exhibit a clear pattern for EAB with increased aging time, these results cannot be correlated with Indenter modulus for the same amount of aging time. The calculation of a relaxation value, even for significantly longer time periods and with an enhanced formula, did not demonstrate the usefulness of performing relaxation measurements and calculations as an indicator of wire aging.
xi

Calculating the modulus values using more sophisticated formulas than the one that was developed originally in the 1980s did not improve the correlation of modulus values with aging levels. Two new methods produced essentially the same results as the original method. Since the original method for calculating modulus has been demonstrated to be valid, and since it is much easier to perform than the newer methods examined during this project, the original method will be retained. The modulus measurements showed no difference between the straight and coiled region of the Wire Insulation Deterioration Analysis System specimens. There is no apparent relationship between the aging that occurred on the straight sections and the aging that occurred in the coiled sections of polyimide-insulated wires. An easy to use and effective method of doing a field calibration check was successfully developed. Plastic rods made from high-density polyethylene and low-density polyethylene and a “Glue Stick” produce a reliable and repeatable range of modulus values that can be used to determine if the Indenter needs calibration. Both electrical and mechanical tests have demonstrated conclusively that the Indenter is a nondestructive test technique. Insulation Resistance and High-Potential Withstand tests measurements made on wires before and after Indenter tests showed no change in electrical performance. An indented wire examined under a microscope revealed no damage, and a mandrel bend test during extended accelerated aging exposures produced no visible difference in aging between wires that had been indented prior to aging and those that had not been indented prior to aging. There is no apparent relationship between insulation thickness and Indenter modulus for polyimide. That is, when the ratio of insulation thickness to conductor diameter varies for this type of insulation, the Indenter modulus is not proportional to the change in ratio. This finding is valid for both unaged and aged polyimide. A significant percentage of all aged aircraft that are still in operation has PVC-insulated wires. The data obtained during this project (and a previous one) support the excellent correlation of Indenter readings for PVC insulation as it ages. PVC exhibits the properties for which the Indenter was designed; that is, materials that harden uniformly with age. For other more modern materials such as polyimide, or more complex constructions such as Composite TKT, the data indicate that the Indenter would have only limited applications.
xii

1. INTRODUCTION.
The objective of this project was to perform additional research concerning the measurement of the change in hardness of aircraft wire insulation materials as they age. Measurements were made using an Indenter Polymer Aging Monitor (IPAM) (herein referred to as Indenter), which is a portable device originally developed in the 1980s for use in nuclear power plants and modified during a research project performed in 2003 for in situ testing of wires in aircraft [1]. During the project described in this report, seven different aircraft wire insulation materials were thermally aged and then tested with the Indenter to measure the change in hardness. Also, various enhancements were made to the hardware and software of the Indenter to advance the state-of-the-art of this technology. The insulation materials tested during this project were identified as follows: • PVC (Polyvinyl chloride) • PVC G-N (Glass-nylon) • XL-ETFE (Cross-linked ethylene tetrafluoroethylene) • Polyimide INST (Instrument) • Polyimide Power1 • Composite TKT (Teflon®-Kapton®-Teflon®) • M81381/12-10, /12-12, /12-20 The accelerated thermal aging was performed in forced-convection air ovens located at the Federal Aviation Administration (FAA) William J. Hughes Technical Center, Atlantic City, New Jersey. A total of 202 wires were aged in three ovens. All of the wires were size #20 AWG except for those wires designated Polyimide Power (#10 AWG), M81381/12-10 (#10 AWG), and M81381/12-12 (#12 AWG). Seventy-five wires (PVC, XL-ETFE, and Composite TKT) were then subjected to Elongation-at-Break (EAB) tests to obtain data that could be compared to Indenter measurements after various periods of thermal aging. Two nondestructive types of Indenter measurements were made, namely, modulus and relaxation. The modulus is a calculated ratio of the change in force to the change in displacement that occurs when the probe of the Indenter is pressed against the insulation. Relaxation consists of pressing the probe against the insulation until a peak force is reached and then holding the probe at this position for a short period of time before retracting it. Force and displacement values are measured continuously as the material relaxes. The purpose of this test is to evaluate the elastic properties and recovery of a material. Enhancements to the Indenter hardware consisted of a change in the probe shape from a truncated cone to a cylinder and the inclusion of a linear variable differential transformer
1 The name Polyimide Power cable can be misleading because although the primary insulation is Kapton the
inclusion of other materials actually results in the total insulation system being identical to that described as Composite TKT. As explained in the report for a previous project [1], a type of power cable other than what was intended had been substituted by a contractor. To avoid confusion later, the original nomenclature of Polyimide Power was retained for both projects.
1

(LVDT) position sensor. The new probe shape eliminates the possibility of damage to the insulation when the probe is pressed against it, and the LVDT enables the Indenter to measure more accurately the deformation of thin-walled aircraft insulation. The new probe shape was determined with the assistance of Northwestern University under contract to the FAA. Enhancements to the Indenter software involved the development of new curve-fitting algorithms to evaluate the modulus at more than two distinct points and to determine the relaxation over a much longer period of time than used previously. An additional modification to the modulus formula examined the influence of wire geometry on the calculated value. The new algorithms and formula were developed by personnel at Northwestern University and the University of Louisville. Additional work included in this project involved the following six activities. • Examination of the difference in aging that might be caused by bends in wires
• Development of a test method to demonstrate that use of the Indenter was nondestructive
• Selection of a simplified field calibration check method
• Correlation of mechanical degradation test data with electrical performance
• Indenter measurements of various wires that had been examined previously during the FAA Intrusive Inspection Project [2]
• Manufacture and delivery to the FAA of the first model Indenter, which incorporates the enhancements developed during this project
2. RELAXATION METHOD—INVESTIGATION OF CALCULATION FORMULA.
The Indenter performs a test called relaxation, which consists of moving the probe into the surface of the polymer (wire insulation under test) until a peak force is reached and then holding the probe at this position for a short period of time before retracting it. Force and displacement values are measured continuously as the material relaxes. The purpose of this test is to evaluate the elastic properties and recovery of a material. Prior to the project described in this report, a relaxation constant had been calculated based on the difference of the measured force value at two set time points, namely, 2 seconds and 4 seconds, after reaching a peak force of 2 pounds. The relaxation constant was determined using the following formula:
( ) ( )2121 // fflnttk −= where: k = Force relaxation constant t1 = Time 1 (set at 2 seconds) t2 = Time 2 (set at 4 seconds)
2

f1 = Force (pounds) at Time 1 f2 = Force (pounds) at Time 2 Relaxation constants have been obtained in the past for a variety of materials as they were aged for various time periods, but none of the data ever exhibited a meaningful trend or pattern. Therefore, an extensive evaluation of the time periods and method of calculation of a relaxation constant was performed in this project to determine if relaxation could be measured or analyzed in a new manner that could be used to predict aging of wire insulation. The relaxation value was considered to be a possible method to predict wire degradation from aging for those materials that did not produce meaningful results when the modulus was measured. The Indenter software was modified so that force and displacement data could be obtained for a period of up to 240 seconds. Then, many relaxation measurements were made on PVC-insulated wires that had been aged for various time periods. PVC was chosen because its favorable behavior during EAB and Indenter modulus tests after various periods of aging were well documented. The primary finding from the analysis of the 240-second data is that approximately two-thirds of the relaxation that occurred, regardless of aging level, would occur during the first 10 seconds after the probe reached the peak force of 2 pounds. Also, ~80% of the relaxation that occurred, regardless of aging level, would occur during the first 40 seconds, and almost all relaxation occurred within 60 seconds, as shown in figure 1. The same results were obtained using a new cylindrical probe2, as shown in figure 2. Thus, a shorter period of 45 seconds was established for all further relaxation evaluations.
Figure 1. Relaxation of PVC 2 See section 7 for a discussion concerning the probe shape and the change made to it during this project.
3

PVC RELAXATION - NEW PROBE
0
5
10
15
20
25
30
35
40
45
50
55
60
-65%-60%-55%-50%-45%-40%-35%-30%-25%-20%-15%-10%
Change in Peak Force of Two Pounds
Tim
e (s
econ
ds)
A0 A2 A4 A6 A8
Figure 2. New Probe PVC Relaxation A Microsoft® Excel®-based template was developed3 so that the substantial amount of data that is obtained during a 45-second relaxation measurement could be analyzed and plotted quickly. The template produces not only a cubic curve fit for the measured data, as illustrated in figure 3, but also the values of the constants (coefficients) associated with each variable, as shown in table 1.
Table 1. Relaxation Solution for Hold Portion
Cubic Fit Value Linear Term (lb/log(s)) 0.147984 Parabolic Term (lb/log(s)2) -0.214916 Cubic Term (lb/log(s)3) 0.0266451
3 Created by Roger D. Bradshaw, Ph.D., University of Louisville, under contract to Northwestern University.
4

Figure 3. Example of Cubic Curve Fit Produced by the Template The constants for each variable at each aging time were then examined to determine if they as a group produced a clear trend or pattern that could be used to indicate the state of aging of wire insulation. No such pattern was determined. The only finding was that a change in relaxation could be observed between unaged and aged materials in some cases; however, the amount of change in relaxation that occurred between each period of aging was not significant enough to establish a clear relationship between duration of aging and change in relaxation. 3. COMPARISON OF IPAM AND WIDAS DATA AT BENDS IN WIRE.
In a previous FAA research project involving the Indenter [1], power and instrument polyimide-insulated wires that had been thermally aged for up to 12 weeks at 220ºC were subjected to Wire Insulation Deterioration Analysis System (WIDAS) testing.4 After the WIDAS tests, Indenter measurements were taken, but only on the straight sections of the wires. The center section of each wire had been coiled, as shown in figure 4, and no Indenter readings were obtained from the coiled (bend) areas. As part of this current project, those same wires were Indenter-tested again, both in the straight sections and in the bend sections, as shown in figure 5. The purpose of the tests was to determine if the stress caused by bending had produced accelerated aging that would result in Indenter data that was different from the Indenter data obtained on the straight sections.
4 WIDAS tests, performed by Lectromechanical Design Company, Dulles, VA, involve coiling the wire sample and
aging the coiled portion of the wire using hydrolysis.
5

Figure 4. Coils From WIDAS Tests
Figure 5. Large-Diameter Coil The Indenter data was analyzed using the template developed for this project and discussed in section 2, and the stiffness (lb/in.) [modulus] values produced by the template were graphed. The graphs of stiffness versus aging time for instrument and power wires, shown in figures 6 and 7, do not show any apparent relationship between the aging that occurred on the straight sections and the aging that occurred in the coiled sections. This finding for polyimide cannot necessarily be applied to other materials, since only polyimide was tested.
6

Figure 6. Straight Versus Bend Sections of WIDAS Power Wires
Figure 7. Straight Versus Bend Sections of Widas Polyimide Instrument Wires 4. ADDITIONAL OVEN AGING OF SELECTED INSULATION MATERIALS.
The purpose of this task was to obtain and analyze Indenter data from wires that had been aged significantly longer than the wires that had been aged in the previous Indenter project for the FAA. The aging previously performed on Composite TKT and polyimide wires did not produce significant changes in hardness. Consequently, in this project, all wires were aged at 20°C above
7

the rated temperature of the wire, and the duration of aging was two to three times longer than the previous aging periods. Also, an additional wire type commonly used in aircraft was added to those wire types studied in the previous project. The accelerated thermal aging was performed in ovens located at the FAA William J. Hughes Technical Center, Atlantic City, New Jersey. A total of 202 wires were aged in three ovens; a summary of the types of wires, aging temperatures, and aging periods is presented in table 2. All of the wires were size #20 AWG except for those wires designated Polyimide Power (#10 AWG), M81381/12-10 (#10 AWG), and M81381/12-12 (#12 AWG). A complete test plan was developed to coordinate and control both the thermal aging exposures and postthermal aging testing. The original test plan and three revisions to it are included in appendix A of this report. Photographs showing test specimens in the ovens are presented in figures 8 and 9. The specimens were examined after aging and the most notable findings were (1) the PVC had become discolored and very stiff and (2) the PVC G-N was severely aged and cracked. The insulation showing the least effects from thermal aging was the Composite TKT; it appeared and felt similar to unaged specimens. After the various thermal aging exposures were completed, all wires were subjected to Indenter tests, except for the 12 wires used in the mandrel bend test, which is discussed throughout this report. The results, using the traditional Indenter method to calculate the modulus, are shown in figures 10 through 15. Only the PVC demonstrated a clear pattern as the aging time increased. The modulus values for other materials did change significantly after extended aging, but there was no consistent pattern in the change in modulus that could be correlated with age. Seventy-five wires (PVC, XL-ETFE and Composite TKT)5 were then subjected to EAB tests to obtain data that could be compared to Indenter measurements after various periods of thermal aging.6 Useable results could not be obtained from the PVC because the insulation could not be separated from the conductor after the long aging exposures. However, the EAB tests produced good results for both XL-ETFE and Composite TKT. The data for each material were plotted, and a curve fit for each plot was developed using Microsoft Excel. The results are shown in figures 16 and 17. Although both materials exhibit a clear pattern for EAB, these results cannot be correlated with Indenter modulus and aging.
5 Only PVC and XL-ETFE (Tefzel) were EAB-tested in the previous FAA Indenter project. 6 EAB tests were to be done at the FAA research center. However, equipment problems there required the tests to
be performed by a commercial laboratory. The report from the laboratory is in appendix B.
8

Table 2. Summary of Thermal Aging Program7
Conductor Insulation Material
Aging Temperature
(°C)
Aging Time
(weeks) Total
Specimens PVC 125 6 5 PVC 125 8 20 PVC G-N 125 8 25 XL-ETFE 220 12 20 Polyimide INST 220 15 5 Polyimide INST 220 18 5 Polyimide INST 220 21 5 Polyimide INST 220 24 5 Polyimide Power 220 15 5 Polyimide Power 220 18 5 Polyimide Power 220 21 5 Polyimide Power 220 24 5 Composite TKT 280 15 5 Composite TKT 280 18 5 Composite TKT 280 21 5 Composite TKT 280 24 5 M81381/12-20 220 15 5 M81381/12-20 220 18 5 M81381/12-20 220 21 5 M81381/12-20 220 24 5 M81381/12-12 220 15 5 M81381/12-12 220 18 5 M81381/12-12 220 21 5 M81381/12-12 220 24 5 M81381/12-10 220 15 5 M81381/12-10 220 18 5 M81381/12-10 220 21 5 M81381/12-10 220 24 5 PVC (mandrel bend) 125 8 2 PVC G-N (mandrel bend) 125 8 2 XL-ETFE (mandrel bend) 220 12 2 Polyimide INST (mandrel bend) 220 24 2 Polyimide Power (mandrel bend) 220 24 2 Composite TKT (mandrel bend) 280 24 2
7 See appendix C for a list of the exposure and additional tests for each one of the 202 wires.
9

Figure 8. Various Specimens in Small Oven
Figure 9. Various Specimens in Large Oven
10

Figure 10. Indenter Modulus: PVC
Figure 11. Indenter Modulus: PVC G-N
11

Figure 12. Indenter Modulus: XL-ETFE
Figure 13. Indenter Modulus: Polyimide INST
12

Figure 14. Indenter Modulus: Polyimide Power
Figure 15. Indenter Modulus: Composite TKT
13

Figure 16. Elongation-at-Break: XL-ETFE
Figure 17. Elongation-at-Break: TKT
14

5. MEASURING DEFORMATION ON HARD WIRES.
5.1 INCORPORATE AN LVDT INTO THE INDENTER.
Prior to this project, an encoder mounted to the motor that drove the probe tip was used to calculate the amount of deformed insulation as the probe tip was pressed against it. The encoder recorded motor turns and used a conversion number to translate the number of turns into the number of inches moved. This method provided good results for wires with soft or relatively thick insulations. However, there was a concern that when wires with harder insulation materials were tested, the encoder method might overstate the amount of deformation because of tolerances in the drive train parts between the encoder and the probe tip. For example, some of the movement that was reported by the encoder might not be probe tip movement. Rather, it could just be movement that took up the slack in the train of parts between the probe tip and the encoder. A more detailed discussion is presented in appendix D. A variety of methods were investigated to provide better deformation measurements within the confines of a portable instrument. The method selected was to incorporate an LVDT, shown in figure 18, in which a cylindrical magnetic rod (core) moves inside a cylinder with wire windings that gives an electrical signal that is proportional to the position of the core within the cylinder. If the addition of an LVDT improved the deformation measurement, then the improved deformation measurement accuracy would lead to a better modulus calculation and help establish a better correlation with aging.8
Figure 18. Linear Variable Differential Transducer
Figure 19 shows how an LVDT was added to the redesigned Indenter so that the deformation
Attaching the LVDT to the probe tip removed the effect of drive train compression
measurement can be made more accurately. Mounting the LVDT sensor closer to the measurement point (the probe tip) improved the performance of the deformation measurement in the following ways. •
through the mechanical parts from the motor, lead screw, thrust washer, and force sensor by placing the LVDT at the probe tip. The load cell compression is the single largest error source in the deformation measurement and would increase with increasing load on
8 See appendix D for a more detailed explanation of the relationship between deformation and modulus.
15

the sensor. The rest of the drive train components also contribute, but to a smaller degree.
• A reduction in hysteresis and an improvement in repeatability in the measurement are possible by making the deformation measurement closer to the probe tip.
• Making the measurement with a precision LVDT would maintain reading integrity during the entire travel of the probe tip during the loading and unloading portion of the test.
LVDT
CYLINDRICAL PROBE TIP
LVDT MOUNTED TO PROBE TIP
Figure 19. Mounting LVDT to Probe Tip
In addition, the back clamp (the part with the groove that holds the wire being tested) was redesigned with more mass and a more robust structure to reduce or eliminate the deflection of the back clamp as the force increases. This improvement in the back clamp and structure benefited the modulus measurement by effectively removing the error associated with the back clamp that flexed during force loading. The result of the above efforts allowed the gap between the encoder and LVDT reading to be reduced appreciably from the Indenter Phase 1 to the Indenter Phase 2. Reducing the distortion in the deformation measurement by beefing up structural elements was an important improvement in and of itself. As a confirmation that the LVDT was working properly, the deformation readings from the LVDT were compared to the encoder. One quick check of the LVDT measurement is to confirm that the encoder should always read more deformation than the LVDT. This is because the motor armature (and the encoder) is rotating more to makeup the distance lost while the drive train is being compressed. Another check is to see that the encoder and LVDT deformations
16

start at approximately the same distance at the start of the test when the probe tip and force sensor have little or no load on them. As the load increases, so should the difference between the two deformation readings. Finally, since the LVDT and encoder are two independent measurement sources, both should track closely with one another noting that they will diverge in a consistent way. The amount of divergence between the deformations is based on system loading (force) and can ultimately be described by an equation (see discussion below). With few exceptions, the data files have abided by the confirmation checks above. The addition of the LVDT to the system allowed the engineers to see how the deformation was affected during the tests. As noted above, the LVDT was an essential tool to make any conclusions regarding how the system was behaving during a test. For the modulus calculation to be meaningful, the deformation measurements must reflect the actual deformations seen at the probe tip. Aviation wiring has very thin insulation systems that is approximately 8 mil. The Indenter will only indent the wire insulation at or about 1 to 2 mil, depending on the hardness of the wire. The Indenter should not press against the wire under test much more than that distance to ensure the wire insulation is not compromised. Making accurate deformation measurements with sub-mil resolution is certainly challenging with a portable instrument. 5.1.1 Deformation Reading Methods—Encoder, LVDT, and DMA.
The Indenter software was modified to report both encoder and LVDT readings so the two could be compared. In addition to encoder and LVDT readings, the University of Louisville also made readings with a Dynamic Mechanical Analyzer (DMA) Model RSA3. The DMA tested PVC wire samples and test rods that will be used as field calibration references. The intention of doing DMA tests was to establish a gold standard or independent reference point for deformation readings. Although this DMA has a potential dynamic (sinusoidal loading) resolution of 0.1 micron (0.000004″), the resolution seen for the static type tests for this project is approximately 10 microns (0.0004″). The software used in the tests reported both encoder and LVDT readings so the differences could be studied as a function of material hardness. The results of encoder, LVDT, and DMA modulus measurements on PVC are shown in figure 20.
17

Figure 20. Analog PVC Modulus Values Using Encoder, LVDT, and DMA The three methods shown in figure 14 track fairly well for modulus values up to and including total aging of 8 weeks. However, starting with total aging of 10 weeks, the DMA tester is approaching the limits of the machine and the values are not considered valid. At this point in the DMA work, it has not been possible to determine that these values represent the true measurement of deformation. For this reason, because the DMA readings appear to not be useful above modulus readings of approximately 2000 and because the DMA readings track very well with encoder and LVDT at the lower modulus readings, it was decided to not use DMA as the reference point. Additional work with the DMA is ongoing. It may be possible to obtain better results with these samples sometime in the future. 5.1.2 Decision on Using the LVDT for Deformation Readings.
At the conclusion of this effort to add the LVDT, a decision needed to be made as to whether to keep the LVDT as part of the Indenter or remove it and develop a correction factor to the encoder readings to compensate for the difference in readings. After reviewing many data files over the many months of testing wires associated with this project, the relationship between the encoder and LVDT behaved in a predictable way. The decision was made that a correction factor (equation) could be used in place of the LVDT. The equation would be used to correct the deformation value reported by the encoder prior to using the deformation for display purposes and before the modulus calculation. The constants that makeup this equation would be made available to the engineer to be altered later, if needed, or to add new constants when a system is first built.
18

Removing the LVDT would benefit the system by: • Simplify the system assembly • Eliminate the cost of an expensive measurement device (approximately $600) • Eliminate the time and maintenance of the sensor and its calibration requirements It is expected that future Indenters will behave in a similar way as this Indenter because they will be built the same way with the same components. The provision for the LVDT will not be designed out with any future development efforts so that the LVDT may be used in new systems that are built to reconfirm that the relationship between the LVDT and encoder has not changed in any meaningful way. No appreciable difference is expected, but if some variation is seen, that change can be accommodated by a change in the constants used in the equation. The hardness of materials tested during this project have a modulus result from 160 to approximately 3000, depending on material. Materials with modulus values at about 1000 or below would not need much, if any, correction (or the LVDT) per se since the modulus results between the LVDT and the encoder are similar. Harder materials will present more force more rapidly along with less overall deformation. The system drive train will load up more rapidly. The geometry of the new and improved probe tip presents more surface area to the wire diameter and can increase the modulus values especially on harder materials due to the lower deformations. It is these lower deformations that need to be measured more accurately. As noted in other parts of this report, small changes in deformation can have a large effect on the modulus result. The Indenter was able to test and report modulus results that again ranged from 160 to 3000. This is a very large modulus range over a whole range of material types, and the Indenter was able to report these results with few exceptions consistently. 5.1.3 Conclusions Regarding the LVDT and Indenter.
Adding the LVDT to the system allowed an independent measurement to be made for deformations. This measurement was made at the probe tip and not through a drive train. This design allowed the engineers to characterize the Indenter performance and then prepare a solution to correct differences in deformation (and in modulus). This was not necessarily the desired outcome when the proposal to add the LVDT was originally developed. The more likely outcome was that the LVDT would be an integral part of the Indenter system. If in the end, the system could operate effectively without the LVDT, then it is not needed after the Indenter developmental phase and can be replaced with a correction instead. Another significant change to the Indenter in this project has been to incorporate structural design changes to give the drive train more rigidity. The increased rigidity will improve the accuracy of encoder readings. 5.2 DEVELOPING AN ALTERNATIVE METHOD OF CALCULATING THE MODULUS.
One aspect of this task was to improve the precision of the Indenter for measuring deformation in thin-walled, hard insulations by enhancing the software. Analog Interfaces worked with Northwestern University to develop an alternative method of calculating modulus. The desired new formula would incorporate factors relating to the effect of different wire gauges. The
19

desired format of the new formula would eliminate not only the need to consider the effect of changing methods of calculating the slope, but also the need to investigate the effect of changing the calculation points from the present 25% and 75%. A progressive methodology was established whereby PVC would be tested first to determine if the new formula gave the same good correlation as the method now used. If a good correlation was established, then the new formula would be tested on other wire types. The original method for calculating the Indenter modulus was to select two data points, namely, one at 25% of the peak force and one at 75% of the peak force. The difference of those two force values (F75–F25) was divided by the difference in deformation (D75–D25) of the insulation corresponding to the two force values. The result was defined as the modulus of the material. The first change to the original method consisted of calculating a parabolic curve-fit equation that would apply to all of the force and deformation values, rather than just those at the 25% and 75% points. An illustration of the method, shown in figure 21, demonstrates that the original method and the new method would produce essentially the same modulus on an unaged piece of PVC-insulated wire. The same close agreement with the 25%-75% model was also seen for samples aged 8 weeks. Therefore, the new method does show good correlation.
Figure 21. Comparison of Two Methods to Determine Modulus for PVC The new method was then tested on other unaged materials, shown in figures 22 and 23, for XL-ETFE and polyimide, respectively. The same result was seen.
20

Figure 22. Comparison of Two Methods to Determine Modulus for XL-ETFE
Figure 23. Comparison of Two Methods to Determine Modulus for Polyimide The next step in the process was to develop a formula that incorporated the physical characteristics of both the wire and the Indenter probe, and then refine the formula to minimize the complexity of it without losing any significant accuracy. Northwestern University developed a spherical contact model for a wire indented by a cylindrical tip and eliminated the need for
21

contact length and Poisson’s ratio in the refined formula. A detailed discussion is presented in appendix F. The final formula was as follows:
2δπ RhPE =
where: E = modulus P = force applied to the insulation by the Indenter probe h = wall thickness of the insulation π = 3.14159 R = radius of the cylindrical tip of the Indenter probe = deformation of the insulation δ
The formula can be written as 2δπ ⎟⎠⎞
⎜⎝⎛=
hREP
or where = 2δα=P α ⎟⎠⎞
⎜⎝⎛
hREπ
The template developed for this project9 was modified again to calculate the best fit of the data, and it is provided as a constant α = π x E x R ÷ h where R is the radius of the cylindrical indenter probe and h is the wall thickness of the insulation. Values for R and h were not incorporated into the template as parameters because it would require the user to enter the wall thickness at the time of the Indenter measurement. However, the user can easily calculate the modulus value E from α as long as the value of h is known for the wire being tested (R is a fixed value for the indenter). All three methods were then plotted on a common graph to ascertain if one of them provided a better technique to determine the modulus of a material using the Indenter. The results, presented in figure 24, demonstrate that all three methods produce essentially the same curve between the values of 25% and 75% of peak force. That was the range originally selected in the 1980s for calculating the Indenter modulus, and the more detailed formulae developed during this project confirm the accuracy of the original work performed to establish a calculation methodology. Since the original method for calculating modulus has been demonstrated to be valid, and since it is much easier to perform than the newer methods examined during this project, Analog Interfaces concludes that retention of the original method is best.
9 See discussion in section 2.
22

Figure 24. Comparison of Three Methods to Determine Modulus for PVC
5.3 SOFTWARE MODIFICATIONS TO INCORPORATE LVDT AND MODULUS CALCULATION CHANGES.
Before testing started, the software was modified so that modulus values were calculated and saved using LVDT and encoder deformations. In addition, a raw data file existed for each test showing all the force and deformation readings (encoder and LVDT) sampled at 100 samples per second. The raw file was used for analytical work. The software was modified from 12- to 16-bit readings. This change was made prior to all the testing. The effect of changing from 12 to 16 bit was to increase the bit resolution (for the LVDT reading) from 1 part in 4096 counts to 1 part in 65,536 counts. 6. SIMPLFIED FIELD CALIBRATION CHECK METHOD.
The purpose of this task was to provide a means for an Indenter user to determine if the Indenter should be recalibrated or have the calibration checked. Calibrating the Indenter, although not very time consuming, requires use of a test fixture to hold the Indenter, several weights for calibrating force, and a dial indicator for calibrating distance. These items are not typically taken in the field. Thus, a method was needed to give the user a quick check to see if the Indenter not only was calibrated, but also was functioning properly. The approach that has been adopted to accomplish this was to use two test rods that the user would run Indenter tests on and compare the results to a specified range. The test rods are approximately 0.25″ in diameter and 4″ long; thus, they are easily carried with the unit. It takes about 5 minutes to run each Indenter test on the rods.
23

A variety of materials were examined for the test rods. The three main criteria were that they: • were made of a homogeneous material with reasonable uniform hardness,
• have hardness values that represented the lower and higher ranges of Indenter measurements, and
• were able to fit in the Indenter clamp assembly.
Table 3 shows the materials were examined to determine their suitability.
Table 3. Test Rod Candidates
McMaster-Carr
Part Number Material Hardness 8754K12 LDPE Shore D:44 8538K14 Nylon Rockwell
M:80 8646K31 PVC Shore D:76 8546K11 Teflon
PTFE Shore D: 55
8624K11 HDPE Shore D: 60
The final rods chosen were high-density polyethylene (HDPE) and low-density polyethylene (LDPE). These rods were tested multiple times on different days at Analog Interfaces. They were also sent to the University of Louisville for testing on their DMA machine. The DMA modulus readings, calculated the same way the Indenter modulus readings were, are shown in table 4.
Table 4. Testing of HDPE and LDPE Calibration Rods
MaterialAverageLVDT
AverageDMA
HDPE 2009 1611 LDPE 883 770
To provide a reference point that includes the full, normal operating range of the Indenter, a softer material was needed to provide lower-range modulus readings. Although none of the materials examined from McMaster-Carr met the criteria, glue rods that go into an adhesive gun were tested in the past. When a plastic was not found to meet the criteria, the glue stick was found to have a very good consistency in the 100 modulus value range. The values found for a glue stick manufactured by Crafty are shown in table 5.
24

Table 5. Crafty Glue Rod Calibration Test
Summary Average Encoder
Minimum and Maximum
Average Relaxation LVDT Difference
Sample 1 161 158-164 53 147 14 Sample 2 162 159-167 55 140 22 Sample 3 161 151-172 53 146 14 Sample 4 149 136-168 55 138 11 Sample 5 158 154-160 54 147 11 Average 158 54 144 14
Even though a glue rod might not appear to be appropriate for use as a reference, this did not prove to be the case for the samples tested. Of course, there is no guarantee that future orders of the glue rod will be the same consistency. However, since 50 glue rods in stock from the same batch were available, it is felt that this stock will provide a consistent material for long period of time. In addition, it is reasonable to assume that the glue stick sample will be a soft material during its lifetime and very likely to remain in the soft category with low Indenter modulus readings serving the purpose of the very low modulus reading. Analog Interfaces has decided to furnish all three of the test material rods described in table 5 and shown in figure 25 for use in evaluating the state of calibration of the Indenter. Recognizing that values may vary somewhat from rod to rod, the modulus readings taken at Analog Interfaces on each rod were recorded on the label for that rod. To assess the need for a recalibration, the customer was asked to make 10 tests on each rod, as shown in figure 26. If the values were outside ±100 from the recorded value on the LDPE and HDPE rods and ±10 on the glue stick, then a user performed a full calibration of the system.
Figure 25. Calibration Test Rods
25

Figure 26. Testing Calibration Rods
7. MANUFACTURE A COMPLETE INDENTER SYSTEM (PHASE 2).
The Indenter Phase 2 incorporated significant enhancements to the previous model, Indenter Phase 1. Modifications to both the hardware and software improved the capability and performance of the equipment and advanced the state-of-the-art technology. 7.1 HARDWARE ENHANCEMENTS.
The following hardware enhancements were made to the Indenter Phase 1. • Provision was made for incorporating the LVDT.
• Change in shape of probe tip from conical to cylindrical shape. The basis for this major change is discussed in appendix G.
• More rigid frame and back clamp provided better deformation measurements. In making the decision on how to make the deformation measurement, improvements in the encoder readings played a key role. Providing more rigidity in the frame and back clamp significantly reduced the error in encoder readings.
• Change in trigger material from plastic to metal addressed the issue of some trigger breakage in the previous design.
• A force limit circuit was incorporated into the cable clamp assembly to provide an independent safeguard to prevent the probe from moving too far into the insulation.
• The internal wiring was improved with the addition of a new internal circuit board.
26

• All of the Indenter Phase 1 part designs were reviewed with Murray Engineering who designed the parts for the Indenter Phase 1. Many changes were made based on experience with assembly and functionality of the Indenter Phase 1. Illustrations of various changes are shown in figure 27 through 29, and a complete system is shown in figure 30.
Figure 27. Wire Clamping Area of Indenter Phase 2
LVDT
Figure 28. Internal View of Indenter Phase 2
New Trigger LVDT conditioning
board and new wiring PC board
27

Figure 29. External View of Indenter Phase 2
Indenter
Pocket PC
Data Acquisition Box
Wire Under Test Cable Clamp
Figure 30. Testing Setup of Complete System 7.2 SOFTWARE ENHANCEMENTS.
The following software enhancements were made to the Indenter System. • Change from 12- to 16-bit readings for use with the LVDT.
28

• A data export facility was included for automatic raw data file generation on the Pocket personal computer (PC) for use on a desktop computer. This addition helped with data evaluation with the template spreadsheet.
• Some new test parameter options were included in the software to provide for a variety of testing options. To give the Indenter the most flexibility for additional investigative work, these options were left in the software. In the relaxation area, options were included for taking no relaxation data, taking 7 seconds of data, or taking 45 seconds of data.
• With the addition of the LVDT, software had to be incorporated to read the LVDT signal, scale it with a polynomial equation, save it, and display it.
• The file naming system was changed to provide for user-selectable names (as opposed to an automatic-indexing name) to make the file name descriptive of the test being done.
8. INDENTER MEASUREMENTS OF INTRUSIVE INSPECTION WIRE SAMPLES.
The purpose of this task was to take Indenter readings on some of the wires tested in an intrusive inspection program conducted under the auspices of the Aging Transport Systems Rulemaking Advisory Committee (ATSRAC).10 The Intrusive Inspection Report, issued by ASTRAC, will be referred to as IIR in the following discussion [2]. Analog Interfaces, Inc. went to Sandia test laboratories in Albuquerque, New Mexico, the week of November 29, 2004. The test protocol involved locating wires available for testing and then examining them according to the following criteria: • Were the wires referenced in the IIR (particularly in appendix 4.2.1, “Raytheon Test
Data”)?
• Did the wires visually appear to be significantly aged or compromised so that they should represent some extremes in testing values?
8.1 WIRE TESTS.
Indenter tests consisted of testing six to eight points in close proximity to each other on a given wire. Although the majority of the tests were done by a representative from Analog Interfaces, personnel from Sandia duplicated the tests on a random basis to see if the readings were comparable. The duplicated tests were performed to confirm previous research that demonstrated that another tester, who had no previous Indenter experience, would obtain a similar modulus average. The individual tests were averaged to obtain a modulus value to represent the condition of the wire insulation at that location, as shown in table 6, where all the location codes are referenced. A summary of all data is presented in tables 7 and 8.
10 Information on ATSRAC can be obtained at www.mitrecaasd.org/atsrac/
29

Table 6. Location Codes
Location Codes Definition LCL Lower cabin area with large wire bundle LCS Lower cabin area with small wire bundle UCL Upper cabin are with large wire bundle ICH Area inside pressure vessel with complex harnesses IPF Area inside pressure vessel with power feeder cable PSU Area with passenger service unit cabling CPT Cockpit CTM Area inside pressure vessel with contaminated wire bundles CDT Area inside pressure vessel with wire bundles in sheathing or conduit ENL Area exterior to pressure vessel with large bundle ENS Area exterior to pressure vessel with small bundle EPF Exterior power feeder ECH Exterior complex harness ECD Exterior conduit
Table 7. Wires Tested by Aircraft, Location, and Wire Type
Aircraft Location Zone/Wire Label Wire Type A300 CPT CPT I Polyimide A300 CPT CPT H Polyimide A300 ECD ECD-2 C Polyimide A300 ECH ECH-x D Polyimide A300 ENS ENS2-B Polyimide A300 F01 F01-B Polyimide A300 PSU PSU7-A Polyimide A300 UCL UCL F Polyimide A300 UCL UCL-C Polyimide DC-10 CTM Z130 CTM-1 E XL-ETFE DC-10 CTM Z130 CTM-1 E XL-ETFE DC-10 CTM Z130 CTM-1 A XL-ETFE DC-10 CTM CTM-2 C XL-ETFE DC-10 CTM CTM-2 A XL-ETFE DC-10 ECD Z640 ECD-1 A XL-ETFE DC-10 ECH Z610 ECH-1 A XL-ETFE DC-10 ECH/ECD ECH ECD A XL-ETFE DC-10 ENS Z140 ENS-2 A XL-ETFE DC-10 FWEE FWEE 1 E XL-ETFE DC-10 FWEE FWEE 1 G XL-ETFE DC-10 FWEE FWEE 1 C XL-ETFE DC-10 Tailcone Tailcone A XL-ETFE DC-9 (1) CDT CDT-2 C Unknown DC-9 (1) CDT CDT-1 A XL-ETFE DC-9 (1) ECD ECD-2 D PVC G-N DC-9 (1) ENL ENL-1 J PVC G-N DC-9 (1) IPF IPF B Unknown
30

Table 7. Wires Tested by Aircraft, Location, and Wire Type (Continued)
Aircraft Location Zone/Wire Label Wire Type DC-9 (1) IPF IPF A Unknown DC-9 (1) LCS LCS-1 A PVC G-N DC-9 (1) LH Wheel Well LH Wheel Well E PVC G-N DC-9 (1) None RB-I-71B PVC G-N DC-9 (1) None RB-I-82C PVC G-N DC-9 (1) None RB-I-72C PVC G-N DC-9 (1) None RB-I-72B PVC G-N DC-9 (1) None RB-I-65D PVC G-N DC-9 (1) None RB-I-72A PVC G-N DC-9 (1) None RB-I-65A PVC G-N DC-9 (1) None RB-I-72 D PVC G-N DC-9 (1) UCL UCL-1 H Unknown DC-9 (1) UCL UCL-1 E Unknown DC-9 (2) CTM CTM R PVC G-N DC-9 (2) CTM CTM F Polyimide DC-9 (2) ECD ECD C Polyimide DC-9 (2) ECH ECH-1 F Polyimide DC-9 (2) ECH ECH 1 H Polyimide DC-9 (2) ECH ECH 1 D PVC G-N DC-9 (2) ENS ENS-B PVC G-N DC-9 (2) LCS LCS F PVC G-N DC-9 (2) RH Tailcone RH Tailcone F61-17 B PVC G-N DC-9 (2) RHWT Z-14 RHWT I PVC G-N DC-9 (2) RHWT RH WING TIP A PVC G-N DC-9 (2) Tailcone Tailcone C XL-ETFE DC-9 (2) UCL UCL I PVC G-N LT1011 CDT CDT C Polyimide LT1011 CTM CTM-2 N Polyimide LT1011 CTM CTM-2 C Polyimide LT1011 ENL ENL M Polyimide LT1011 ENL ENL C Polyimide LT1011 ICH ICK K Polyimide LT1011 LCS LCS M Polyimide LT1011 PSU PSU-1 N Polyimide LT1011 UCL UCL K Polyimide Unknown None RB-I-94F LM1301 PVC G-N
Table 8. Indenter Results by Wire Type and Modulus Value
Wire Type Project Location Location Code Average Modulus
Polyimide A300 ECD ECD-2 C 423 Polyimide LT1011 ICH ICK K 432 Polyimide DC-9 (2) CTM CTM F 451 Polyimide A300 CPT CPT H 662
31
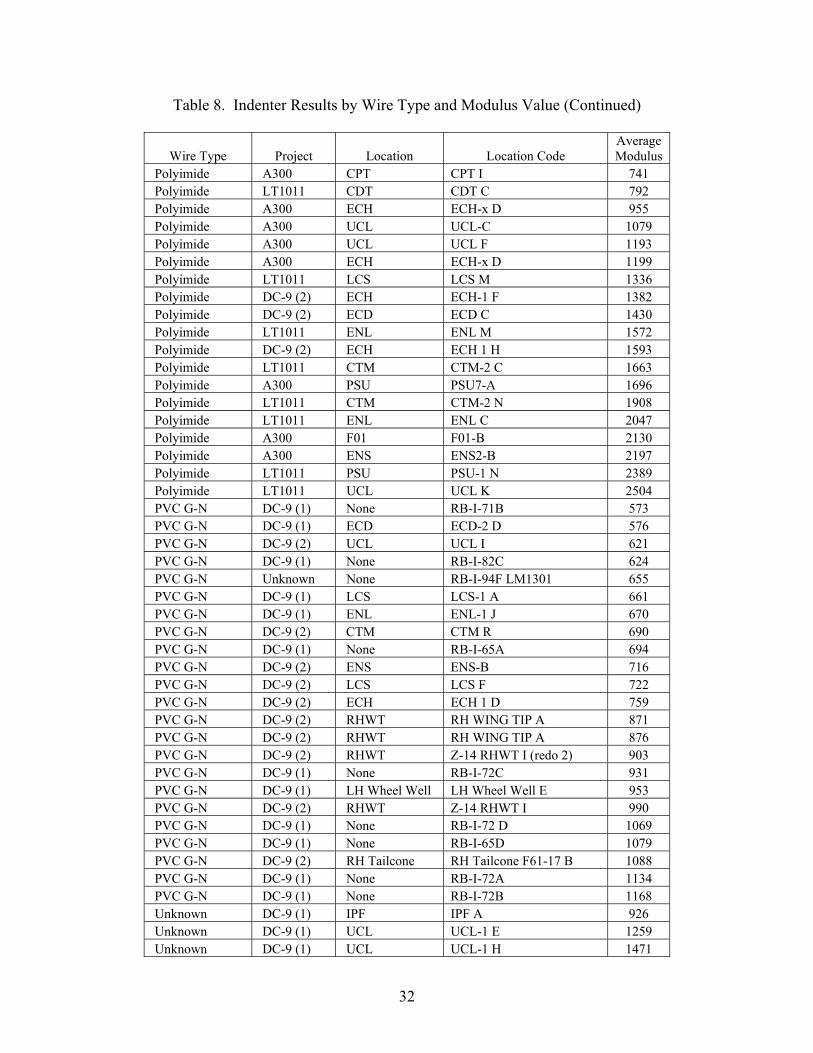
Table 8. Indenter Results by Wire Type and Modulus Value (Continued)
Wire Type Project Location Location Code Average Modulus
Polyimide A300 CPT CPT I 741 Polyimide LT1011 CDT CDT C 792 Polyimide A300 ECH ECH-x D 955 Polyimide A300 UCL UCL-C 1079 Polyimide A300 UCL UCL F 1193 Polyimide A300 ECH ECH-x D 1199 Polyimide LT1011 LCS LCS M 1336 Polyimide DC-9 (2) ECH ECH-1 F 1382 Polyimide DC-9 (2) ECD ECD C 1430 Polyimide LT1011 ENL ENL M 1572 Polyimide DC-9 (2) ECH ECH 1 H 1593 Polyimide LT1011 CTM CTM-2 C 1663 Polyimide A300 PSU PSU7-A 1696 Polyimide LT1011 CTM CTM-2 N 1908 Polyimide LT1011 ENL ENL C 2047 Polyimide A300 F01 F01-B 2130 Polyimide A300 ENS ENS2-B 2197 Polyimide LT1011 PSU PSU-1 N 2389 Polyimide LT1011 UCL UCL K 2504 PVC G-N DC-9 (1) None RB-I-71B 573 PVC G-N DC-9 (1) ECD ECD-2 D 576 PVC G-N DC-9 (2) UCL UCL I 621 PVC G-N DC-9 (1) None RB-I-82C 624 PVC G-N Unknown None RB-I-94F LM1301 655 PVC G-N DC-9 (1) LCS LCS-1 A 661 PVC G-N DC-9 (1) ENL ENL-1 J 670 PVC G-N DC-9 (2) CTM CTM R 690 PVC G-N DC-9 (1) None RB-I-65A 694 PVC G-N DC-9 (2) ENS ENS-B 716 PVC G-N DC-9 (2) LCS LCS F 722 PVC G-N DC-9 (2) ECH ECH 1 D 759 PVC G-N DC-9 (2) RHWT RH WING TIP A 871 PVC G-N DC-9 (2) RHWT RH WING TIP A 876 PVC G-N DC-9 (2) RHWT Z-14 RHWT I (redo 2) 903 PVC G-N DC-9 (1) None RB-I-72C 931 PVC G-N DC-9 (1) LH Wheel Well LH Wheel Well E 953 PVC G-N DC-9 (2) RHWT Z-14 RHWT I 990 PVC G-N DC-9 (1) None RB-I-72 D 1069 PVC G-N DC-9 (1) None RB-I-65D 1079 PVC G-N DC-9 (2) RH Tailcone RH Tailcone F61-17 B 1088 PVC G-N DC-9 (1) None RB-I-72A 1134 PVC G-N DC-9 (1) None RB-I-72B 1168 Unknown DC-9 (1) IPF IPF A 926 Unknown DC-9 (1) UCL UCL-1 E 1259 Unknown DC-9 (1) UCL UCL-1 H 1471
32

Table 8. Indenter Results by Wire Type and Modulus Value (Continued)
Wire Type Project Location Location Code Average Modulus
Unknown DC-9 (1) IPF IPF B 1476 Unknown DC-9 (1) UCL UCL-1 H 1528 Unknown DC-9 (1) CDT CDT-2 C 1516 XL-ETFE DC-10 CTM CTM-2 A 760 XL-ETFE DC-10 CTM CTM-2 A 884 XL-ETFE DC-10 FWEE FWEE 1 E 1017 XL-ETFE DC-9 (2) Tailcone Tailcone C 1039 XL-ETFE DC-10 FWEE FWEE 1 G 1127 XL-ETFE DC-10 Tailcone Tailcone A 1231 XL-ETFE DC-10 CTM CTM-2 C 1254 XL-ETFE DC-10 ECH/ECD ECH ECD A 1344 XL-ETFE DC-10 ECD Z640 ECD-1 A 1350 XL-ETFE DC-10 ECH Z610 ECH-1 A 1353 XL-ETFE DC-10 FWEE FWEE 1 C 1400 XL-ETFE DC-9 (1) CDT CDT-1 A 1409 XL-ETFE DC-10 ENS Z140 ENS-2 A 1415 XL-ETFE DC-10 CTM Z130 CTM-1 E 1504 XL-ETFE DC-10 CTM Z130 CTM-1 A 1508
For reference purposes, a location-coded picture was taken of each wire tested. Only some pictures are shown in this report; however, they all are available upon request from Analog Interfaces, Inc. Figures 31 through 34 show various aspects of the wire tests that were performed.
Figure 31. Close-up of Indenter Test on Large Cable
33
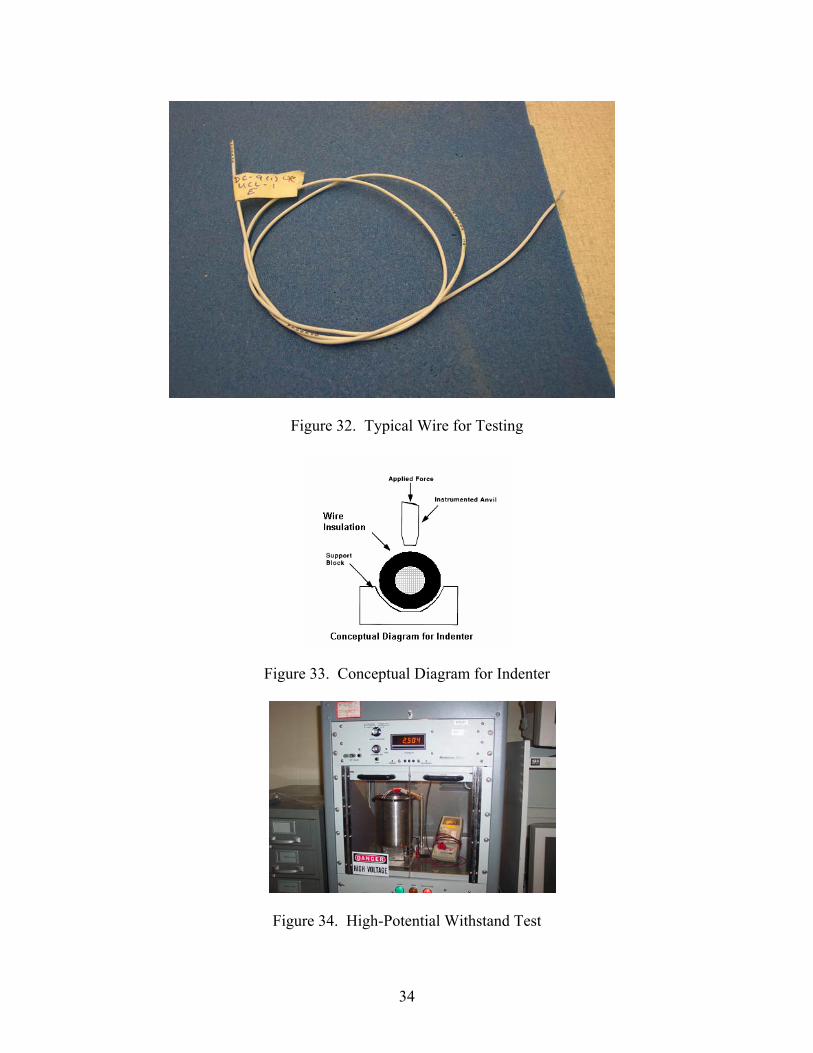
Figure 32. Typical Wire for Testing
Figure 33. Conceptual Diagram for Indenter
Figure 34. High-Potential Withstand Test
34

Table 9 summarizes both the types of aircraft and wire types investigated for the IIR. The wire
Table 9. Aircraft and Wires in Intrusive Inspection
Aircraft A300 DC-9 B-747 DC-9 L1011 DC-10
type shown is the primary wire type on that aircraft. Polyalkene was not represented as a general purpose wire in the six selected aircraft. Poly-X was not included in the testing program of Analog Interfaces; therefore, no wires were tested from the Boeing 747.
I nspection 9/99 12/99 2/00 5/00 6/00 6/00 Year
Manufactured 1978 1867 1973 1971 1972 1979
Hours 39713 74558 100241 66801 63618 61334 Cycles 27078 100017 20348 75446 26256 18818 Retired 7/99 9/99 5/99 12/99 6/99 5/00
W Po e PVC G-N Poly-X PVC G-N Po e XL-ETFE ire type lyimid lyimid
f the available wire types, the following five were selected for testing:
Polyimide (e.g., Military Standards number MIL-W-81381)
(e.g., MIL-W-81044/6 to /13)
to 45 and 41 to 46)
ach wire was labeled with a location code (shown in table 6), zone, and other more specific
.2 SOURCES OF INTRUSIVE INSPECTION REPORT DATA RELATIVE TO WIRES
O •• PVC G-N (e.g., MIL-W-5086) • Extruded XL-Polyalkene/PVDF • Poly-X (e.g., MIL-W-81044/16) • XL-ETFE (e.g., MIL-W-22759/32 Elocation identification. The labeling methodology varied somewhat, but a typical label would be DC-9 (1) UCL-1 E (see figure 13).11 8TESTED AT SANDIA.
The areas of the IIR that had data pertinent to the wires tested by Analog Interfaces were
“Laboratory Testing,” chapter 4: This chapter describes each of the tests that were done
• “Supplemental Laboratory Analysis of DC-9 (1) and (2) and DC-10,” appendix 4.1.2:
The text of this appendix represents laboratory notes on the results of select visual inspection of three aircraft: the two DC-9s and the DC-10 aircraft. These analyses
typically found in •
at both Sandia and Raytheon. Raytheon data is in appendix 4.2.1.
DC-9 (1), page 2; DC-9 (2), page 19; and DC-10, page 40. The observations in 4.1.2 are qualified with a note from the IIR as follows:
11 Diagrams for each of the aircraft (except the L1011) showing the area of these codes on the aircraft are available
in appendix 3.1 of the IIR (A300 - page 3; DC-9 - pages 52 and 72; DC-10 - page 92).
35

were performed in response to a request from ATSRAC to continue laboratory analysis and to ensure that no aircraft or wire type received inadequate or excessive attention.
These notes are very raw and not appropriate for quote. Instead they are intended–in their entirety–to give additio al support to the conclusions presented
The fol anies the DC-9 (2) section of IIR appendix 4.1.2
many were events similar to ones already seen on the DC-9 (1). The term ‘burn mark’
Note fr ter readings:
ircraft. The important question is how does the degree of discoloration in the PVC affects its’
Append Raytheon in Indianapolis, IN. This ppendix has three sections, each covering all tested wire samples.
rformed insulation resistance (IR), wet dielectric voltage, withstand, and conductor resistance)
sslink proof, notch propagation, wrap test, lamination sealing, flammability, dynamic cut through, and inherent viscosity)
nin the body of this report.
lowing explanation accomp
Note: Fewer events were tagged, and photographed due to the fact that
or ‘burnt’ is used throughout this report. These terms are what they appear to be, in some cases it could very well be compromised nylon stained with dirt, in many cases it is very difficult to distinguish. The reader should realize that all statements of this kind are a reflection on what the author’s best guess on the matter and should be interpreted with extreme caution.
om IIR 4.1.2, page 18 relative to discoloration and Inden
Various stages of colored nylon, and PVC were observed in this a
ability to act as an insulator. Preliminary studies on the modulus clearly display a difference between the white and discolored PVC.
ix 4.2.1 of the IIR summarizes the work done ata • Wire description
• Electrical tests pe
• Other tests (life cycle, cro
8.3 SUMMARY OF CORRELATIONS.
To study correlations between the findings of the IIR and the Indenter readings obtained during this project, a table was prepared to compare the various data versus type of aircraft using the
L, ECH, etc.) that were tested at Sandia were compared to the list of locations studied by Raytheon as reported in appendix 4.2.1. (Raytheon was the facility
following methodology. • All locations (UC
where most of the electrical tests were done.) If there was a match between a location tested with the Indenter and results reported in 4.2.1, the location was added to the table in column A.
36

• The description of the wire from 4.2.1 was added to the table in column C along with the wire sample code – i.e., A, C, etc.
ge references in column F. Phil Casey’s notes were indicated in column G.
the beginning of each aircraft type, the range of modulus values obtained in the test was shown by material type. Thus, the modulus value for a given test
arily because many of the findings were not wire-location specific. For example, there was no section in the IIR that presented all visual and electrical test results for a
elation table and comparing them to the Indenter readings. The complete table is resented in appendix H.
• The Raytheon test data was then analyzed to see if any failures were reported. If so, they were noted in the table in column D.
• Next, any references to the Sandia tested location codes from chapter 4 and appendix 4.2.1 were listed in column B with pa
• Column E listed the actual wire codes that were tested by Analog Interfaces along with the modulus reading. At
can be compared to where it fell in the range for that material and compared with the test notes.
Making correlations between Indenter readings and findings reported in the IIR proved to be impossible, prim
specific wire. In many cases, the results of visual inspection were grouped in a summary table, which reported such things as breaks per 100 inspections. In quite a few cases, the tested wires had a location designation (such as CDC C), but the IIR report refers to CDC B and D, thereby raising the question as to whether the test results referred to the same wire position and condition. Only general observations can be made by looking at the electrical results and test comments in the test corrp 9. NONDESTRUCTIVE TESTS.
After the conclusion of a previous FAA project involving the Indenter, a question was raised ny, of the Indenter probe pressing against the thin insulation
in aircraft wires because a slight indentation can be seen under a microscope after an indentation
l shape. Thus, when an Indenter measurement is made, a ylindrical shape (the probe) is pressed against another cylindrical shape (the wire) thereby
concerning the damaging effect, if a
test on wires with soft insulation. This question may have been the result of a misunderstanding concerning the shape of the probe; that is, thinking that the end of the probe was a point. The probe (anvil) has always been a truncated cone whose tip is actually a flat surface with rounded edges, as illustrated in figure 33. At the beginning of this project, a decision was made to change the profile of the probe tip from a conical shape to a cylindricacsignificantly reducing any impact on the wire by the Indenter. Also, a change to the software now prevents the probe from compressing the insulation more than 25% of its original thickness.
37
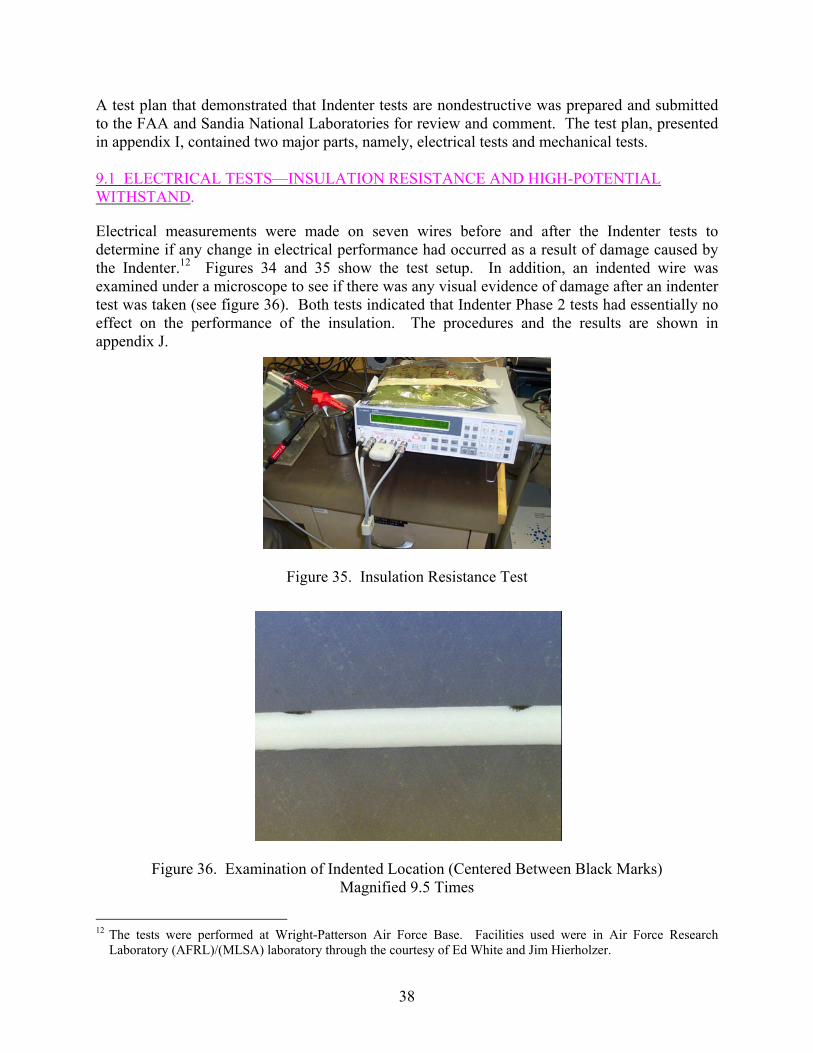
A test plan that demonstrated that Indenter tests are nondestructive was prepared and submitted
1 ELECTRICAL TESTS—INSULATION RESISTANCE AND HIGH-POTENTIAL
to the FAA and Sandia National Laboratories for review and comment. The test plan, presented in appendix I, contained two major parts, namely, electrical tests and mechanical tests. 9.WITHSTAND.
Electrical measurements were made on seven wires before and after the Indenter tests to
Figure 35. Insulation Resistance Test
Figure 36. Examination of Indented Location (Centered Between Black Marks)
Magnified 9.5 Times
determine if any change in electrical performance had occurred as a result of damage caused by the Indenter.12 Figures 34 and 35 show the test setup. In addition, an indented wire was examined under a microscope to see if there was any visual evidence of damage after an indenter test was taken (see figure 36). Both tests indicated that Indenter Phase 2 tests had essentially no effect on the performance of the insulation. The procedures and the results are shown in appendix J.
12 The tests were performed at Wright-Patterson Air Force Base. Facilities used were in Air Force Research
Laboratory (AFRL)/(MLSA) laboratory through the courtesy of Ed White and Jim Hierholzer.
38

9.2 MECHANICAL TEST—MANDREL BEND.
To demonstrate that the Indenter probe did not damage the wire insulation, this project included a mandrel bend test in which two identical wires of each wire type were bent around a steel rod
After aging, both wires were vi ing glass in the area where the
denter test had been performed. In all cases, there was no visible difference between the wires
test were applicable only as an historical reference point because e shape of the Indenter probe was changed during this project. The truncated cone probe used
and held in tension while exposed to long-term, accelerated thermal aging, as shown in figure 37. One wire of each pair was Indenter-tested before aging.
Figure 37. Mandrel Bend Test
sually inspected with a magnifyInin each pair. Thus, the Indenter has no visible effect on the wire and does not make it more susceptible to damage or aging. The results of the mandrel bend thin this test has been replaced by a cylindrical probe that was pressed sideways against the wire. 10. CORRELATE MECHANICAL DEGRADATION TEST DATA WITH ELECTRICAL PERFORMANCE.
wire aging research at Northwestern University that focused on electrical measurements and performance degradation. The Indenter tests focused on mechanical
University was impedance ectroscopy (IS) measured as Z’ ((real) impedance (ohms)). This electrical parameter was
The FAA sponsored
(physical) measurements and performance degradation, from which the future electrical performance or failure of the wire can be estimated or inferred. The purpose of this task was to investigate whether data from these two efforts could be correlated. The electrical measurement that was being made at Northwesternspchosen for comparison or correlation with Indenter modulus readings in this project.
39

Northwestern took IS readings on two types of wires.13 • Thermally aged (TA) PVC wires that were aged at Boeing and at the FAA were furnished
to Northwestern by Analog Interfaces
• Chemically aged (CA) PVC wires that were aged at Northwestern
Both types of aging were included to demonstrate the general applicability of IS and Indenter measurements on more than one type of aging that occurred in aircraft. Indenter test results already existed for the TA wires. Northwestern furnished CA wires to Analog Interfaces for testing with the Indenter, the results of which are shown in figure 38. Table 10 shows how the Indenter modulus values for CA PVC compares to Indenter modulus values for TA PVC. Figure 39 shows Indenter modulus readings versus IS values (Z).
Figure 38. Indenter Modulus of CA PVC
Table 10. Thermal and Chemical Aging PVC Modulus Readings
TA (weeks)
Modulus Readings (encoder)
CA (hours)
595 TA0 712 0
TA2 762 — 825 — 920 6 1060 12
TA4
1273 24 1337 TA6 1351 48
13 Appendix E contains an explanation of Northwestern’s work relative to Indenter tests and IS.
40

Table 10. Thermal and Chemical Aging PVC Modulus Readings (Continued)
TA (weeks)
Modulus Readings (encoder)
CA (hours)
1219 TA8 1637 72
TA10 2374 TA12 2569 TA14 2608 TA16 2555
—
Figure 39. Modulus Versus Impedance (Z’) 11. EVALUATE AN ADDITIONAL WIRE TYPE USED IN AIRCRAFT.
The group of wires that were investigated in this project was expanded to include an additional type of insulation that has been widely used in aircraft so that the influence of conductor size on the Indenter modulus could be evaluated. It has always been assumed that the size of the conductor has no effect on the Indenter modulus readings; however, there never has been a study that determined if the ratio of insulation thickness to conductor size influenced the Indenter data.
41

A Polyimide Power14 cable (Military Specification M81381/12C) was added to the aging program described in section 4. Various sizes, shown in table 11, were considered, and the three conductor sizes chosen were #20 AWG, #12 AWG, and #10 AWG.
Table 11. Dimensions of M81381 Wires
Size
Insulation Thickness
(inch)
Conductor Diameter
(inch)
Ratio: Insulation Thickness-to-
Conductor-Diameter Ratio
Ratio in Relation to #20 AWG
#20 AWG 0.008 0.037 0.216 1.00 #18 AWG 0.008 0.046 0.174 1.24 #16 AWG 0.008 0.052 0.154 1.40 #14 AWG 0.008 0.065 0.123 1.76 #12 AWG 0.008 0.084 0.095 2.27 #10 AWG 0.008 0.106 0.075 2.88
The different wire sizes were TA at 220°C for various periods of time (15, 18, 21, or 24 weeks).15 Indenter modulus measurements were then made to determine the effect, if any, when the insulation-thickness-to-conductor-diameter ratio varied for the same type of insulation. Preliminary data obtained from unaged wires indicated that there was no apparent relation between Indenter data and insulation thickness for this material. The Indenter data obtained after aging for up to 24 weeks was analyzed with the template developed for this project to calculate the stiffness (lb/in.) [modulus] and compare the results. The resulting graphs of stiffness [modulus] versus aging time, shown in figure 40 for all three wire sizes, indicate that there was no apparent relationship between insulation thickness and Indenter stiffness data for this material. Although the pattern of the #10 AWG and #20 AWG wires was somewhat similar, the intermediate size of #12 AWG shows no similar pattern to either of the other two.
14 Another wire type in this project is referred to as Polyimide Power. However, as explained in the report on the
previous Indenter project for the FAA, that description is a misnomer. The actual type of insulation used on those #10 AWG wires was Composite TKT. Nonetheless, the name was retained in this project to permit comparison between the two projects without adding a significant level of confusion. Thus, the M81381 wires tested for this project are, in fact, the only true Polyimide Power wires.
15 A complete description of the aging program is given in section 4.
42

Figure 40. Comparison of Thickness Effect for M81381 12. RESULTS.
The impetus for this research project was to develop the Indenter further so that it would be a nonintrusive, easy-to-use, nondestructive, portable, test device to help assess the aging condition of wires in aircraft. Significant enhancements to the design of the Indenter (both in hardware and software) during this project have advanced the state of the art of this technology and resulted in a more accurate, reliable, and easier-to-use instrument. The following paragraphs list specific results regarding each task of this project. The calculation of a relaxation value, even for significantly longer time periods and with an enhanced formula, did not demonstrate the usefulness of performing relaxation measurements and calculations as an indicator of wire aging. A change in relaxation was observed between unaged and aged materials in some cases. However, the amount of change in relaxation that occurred between each period of aging was not significant enough to establish a clear relationship between duration of aging and change in relaxation. Further Indenter wire tests that were previously subjected to Wire Insulation Deterioration Analysis System tests that determined if modulus measurements differed in the straight leg versus the coiled regions showed no difference. There was no apparent relationship between the aging that occurred on the straight sections and the aging that occurred in the coiled sections of polyimide-insulated wires. For wire specimens that were subjected to additional thermal aging for significant periods of time, the most notable findings were (1) the PVC had become discolored and very stiff and (2)
43

the PVC G-N was severely aged and cracked. The insulation that showed the least effects from thermal aging was the Composite TKT; it appeared and felt similar to unaged specimens. Only the PVC demonstrated a clear pattern in modulus data that could be correlated with aging as the amount of aging time increased. The modulus values for other materials did change significantly after extended aging, but there was no consistent pattern in the change in modulus that could be correlated with age. Elongation-at-break (EAB) tests produced good results for both cross-linked ethylene tetrafluoroethylene and Composite TKT. However, both materials exhibited a clear pattern for EAB with increased aging time. These results cannot be correlated with Indenter modulus for the same amount of aging time. The addition of a linear variable differential transducer provided better deformation measurements on wires that have thin-walled, hard insulation. However, it also significantly increased the complexity and cost of the Indenter. For aged materials that have a maximum modulus value of about 1000 lb/in., the previously used motor encoder produced sufficient accuracy when deformation was measured. Calculating the modulus values with more sophisticated formulas than the one that was developed originally in the 1980s did not improve the correlation of modulus values with aging levels. Two new methods produced essentially the same results as the original method. Since the original method for calculating modulus has been demonstrated to be valid, and since it is much easier to perform than the newer methods examined during this project, the original method will be retained. An easy-to-use and effective method of performing a field calibration check was successfully developed. Plastic rods made from high-density polyethylene, low-density polyethylene, and a glue stick produced a reliable and repeatable range of modulus values that can be used to determine if the Indenter needed calibration. Indenter testing of wires used in the Federal Aviation Administration Intrusive Inspection program indicated only general areas of agreement between reported visual findings and other inspection criteria. However, it was not possible to make specific correlations between Indenter measurements and the findings of the Intrusive Inspection because many of the findings were not wire-location specific. For example, the results of visual inspections were grouped in a summary table, which reported such things as breaks per 100 inspections, which cannot be compared to an Indenter measurement on a specific wire removed from a specific location in a specific type of aircraft. Both electrical and mechanical tests have demonstrated conclusively that the Indenter is a nondestructive test technique. Insulation resistance and high-potential withstand tests measurements made on wires before and after Indenter tests showed no change in electrical performance. An indented wire examined under a microscope revealed no damage. A mandrel bend test during extended accelerated aging exposures produced no visible difference in aging between wires that had been indented prior to aging and those that had not been indented prior to aging.
44

There appeared to be some type of correlation between the Impedance Spectroscopy electrical measurements made at Northwestern University and Indenter readings obtained from PVC; however, the application of such correlation could not be determined. There was no apparent relationship between insulation thickness and Indenter modulus for polyimide. That is, when the ratio of insulation thickness to conductor diameter varied for this type of insulation, the Indenter modulus was not proportional to the change in ratio. This finding was valid for both unaged and aged polyimide. A significant percentage of all aged aircraft that are still in operation has PVC-insulated wires. The data obtained during Indenter Phases 1 and 2 support the excellent correlation of Indenter readings for PVC insulation as it ages. PVC exhibits the properties for which the Indenter was designed; that is, materials that harden uniformly with age. For other more modern materials such as polyimide, or more complex constructions such as Composite TKT, the data indicate that the Indenter would have only limited applications. 13. REFERENCES.
1. Denny, B., “Material Testing Research and Indenter Equipment Modifications for Determining Aging of Wires (Cables) in Aircraft,” FAA report DOT/FAA/AR-04/17, October 2004.
2. “Transport Aircraft Intrusive Inspection Project (An Analysis of the Wire Installations of
Six Decommissioned Aircraft),” Final Report, December 29, 2000, Prepared by The Intrusive Inspection Working Group, Christopher Smith, Chairman, FAA, Airworthiness Assurance R&D.
45/46

APPENDIX A—TEST PLAN AND THREE REVISIONS
A-1

TEST PLAN
THERMAL AGING
AND
ELONGATION-AT-BREAK TESTING
OF
WIRES USED IN AIRCRAFT
FAA Contract Number DTFA03-03-C-00027 AMEC Earth & Environmental, Inc. Project No. 3-7652-0000
Revision No. 0 dated November 25, 2003 Prepared By:
William M. Denny (AMEC) Reviewed By:
David W. Puterbaugh (Analog Interfaces) Reviewed By:
Cesar Gomez (FAA AAR 480) Reviewed By:
Michael F. Walz (FAA AAR 480)
AMEC Earth & Environmental, Inc. One Plymouth Meeting, Suite 850
Plymouth Meeting, PA 19462-1308 Phone: 610-828-8100 Fax: 610-828-6700
A-2
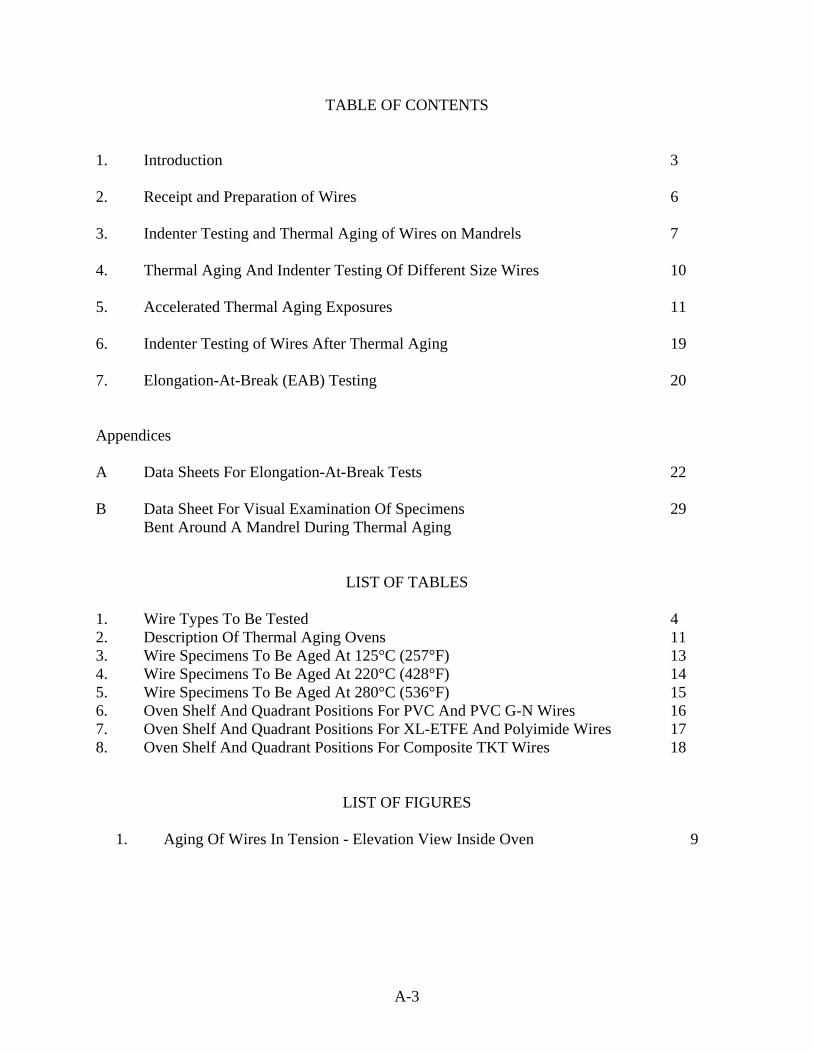
TABLE OF CONTENTS 1. Introduction 3 2. Receipt and Preparation of Wires 6 3. Indenter Testing and Thermal Aging of Wires on Mandrels 7 4. Thermal Aging And Indenter Testing Of Different Size Wires 10 5. Accelerated Thermal Aging Exposures 11 6. Indenter Testing of Wires After Thermal Aging 19 7. Elongation-At-Break (EAB) Testing 20 Appendices A Data Sheets For Elongation-At-Break Tests 22 B Data Sheet For Visual Examination Of Specimens 29
Bent Around A Mandrel During Thermal Aging
LIST OF TABLES 1. Wire Types To Be Tested 4 2. Description Of Thermal Aging Ovens 11 3. Wire Specimens To Be Aged At 125°C (257°F) 13 4. Wire Specimens To Be Aged At 220°C (428°F) 14 5. Wire Specimens To Be Aged At 280°C (536°F) 15 6. Oven Shelf And Quadrant Positions For PVC And PVC G-N Wires 16 7. Oven Shelf And Quadrant Positions For XL-ETFE And Polyimide Wires 17 8. Oven Shelf And Quadrant Positions For Composite TKT Wires 18
LIST OF FIGURES
1. Aging Of Wires In Tension - Elevation View Inside Oven 9
A-3

1. INTRODUCTION Six types of insulated wire that are used in aircraft were subjected to accelerated thermal aging followed by various mechanical tests in 2002 in accordance with the Statement of Work for FAA Contract number DTFA03-01-R-00037. The objective of that research project was to demonstrate that data obtained by testing aircraft wire with the Indenter Polymer Aging Monitor (IPAM) system could be correlated with the aging of the wire. The success of that project has resulted in a new project to extend the material testing and make technical enhancements to the IPAM.
This Test Plan identifies the wire specimens that will be subjected to additional accelerated thermal aging, and specifies the methodology and procedures that will be used for the thermal aging exposures and the post-aging mechanical tests. The accelerated thermal aging exposures in forced-convection air ovens will last from 6 weeks to 24 weeks (depending on the type of insulation); the thermal aging temperatures will be the same as those used in the previous project. Following the thermal aging, the insulated wires will be subjected to IPAM testing and, in some cases, Elongation-at-Break (EAB) testing. Table 1 describes the following six types of wire insulation that will be included in this test:
• PVC • PVC G-N • XL-Tefzel • Composite TKT • Polyimide (Instrument) • Polyimide (Power)1
General guidance for the accelerated thermal aging exposures and EAB tests is based on Federal Test Method Standard No. 228 and the following industry standards: ASTM D 2633-82 ("Standard Methods of Testing Thermoplastic Insulation and Jackets for Wire and Cable"); ASTM Standard D 638-95 ("Standard Test Method for Tensile Properties of Plastics"); ASTM Standard D 573 ("Test Method For Rubber-Deterioration in an Air Oven"); and, ASTM Standard D 412-92 ("Standard Test Methods for Vulcanized Rubber and Thermoplastic Rubbers and Thermoplastic Elastomers-Tension").
1 The designation “Polyimide Power” can be misleading because although the primary insulation is Kapton® the inclusion of other materials actually results in the total insulation system being the same as Composite TKT. The previous test program (FAA Contract number DTFA03-01-R-00037) was to include a #10 AWG power wire whose insulation was identical to the Kapton®-insulated #20 AWG instrument wire. However, such a wire was not readily available, so another type was substituted. The original nomenclature of “Polyimide Power” was retained, however, to remain consistent with other project documents.
A-4

TABLE 1. WIRE TYPES TO BE TESTED Name (Original Length)
5.2 DESCRIPTION AND MILITARY SPECIFICATION NUMBER
PVC (16 in.)
Polyvinyl Chloride (PVC) - MIL-DTL-16878/1C Conductor is covered with extruded PVC insulation 8 mils to 11.5 mils thick
PVC G-N (24 inch)
PVC/glass/nylon – MIL-W-5086/2C Conductor is covered with extruded PVC insulation that is covered by glass fiber braid that is covered by extruded clear nylon. Nylon is 6 mils thick. Combined thickness of PVC and braid is 18 mils. PVC insulation thickness assumed to be 8 miles to 11.5 mils.
XL-Tefzel (16 inch)
XL-ETFE (Cross-linked Tefzel) – MIL-W-22759/42B Conductor is covered with two extrusions. First extrusion is 3 mils (min.) of crosslinked modified ETFE. Second extrusion is 4 mils (min.) of crosslinked modified ETFE. Total combined insulation system must be 8 mils (min.) thick. ETFE = ethylene-tetrafluoroethylene copolymer
Composite TKT (24 inch)
Composite TKT (Teflon®-Kapton®-Teflon®) - MIL-DTL-22759/90A Conductor is covered with two wrapped tapes; the overlap for each wrapping is 50% (min). First wrap over conductor consists of 0.5 mils of FP over 1 mil of polyimide covered by 0.5 mils of FP. Second wrap consists of 2 mils of FP. Nominal thickness of entire insulation system is 7.4 mils. FP = Fluorocarbon Polymer, modified Polytetrafluorethylene (PTFE
Polyimide INST (6 inch)
Polyimide (Kapton®) #20 AWG Instrument wire - MIL-W-81381/12C Conductor is covered with two wrapped tapes; the overlap for each wrapping is 50% (min). First wrap over conductor consists of 2 mils of polyimide film covered by 0.5 mil FEP fluorocarbon resin. Second wrap consists of 0.1 mil FEP fluorocarbon resin over 1 mil of polyimide film that is covered by 0.1 mil of FEP fluorocarbon resin. The second wrap is then coated with 0.5 mil of aromatic polyimide resin. Approximate thickness of entire insulation system is 8 mils. FEP = Fluorinated Ethylene Propylene
Polyimide Power (6 inch)
Polyimide (Kapton®) #10 AWG Power wire – MIL-DTL-22759/80A Conductor is covered with two wrapped tapes; the overlap for each wrapping is 50% (min). First wrap over conductor consists of 0.5 mil fluorocarbon polymer over 1 mil of polyimide over 0.5 mil fluorocarbon polymer. Second wrap consists of 3 mils of PTFE (unsintered). Nominal wall thickness of entire insulation system is 9.5 mils. PTFE = Polytetrafluorethylene
A-5
The entire test program will consist of the following sequence of activities:
• Inspection of test specimens • Indenter measurements of specimens to be wrapped around a mandrel • Thermal aging exposures • Indenter measurements after thermal aging • Elongation-at-Break (EAB) tests
The accelerated thermal aging program will contain three separate groups of specimens, namely,
• 130 wires that were included in the previous project and which will be subjected to additional thermal aging in this project.
• 12 unaged wires that were included in the previous project and which will be aged while
in tension (bent around a mandrel).
• 60 new wires (20 of each of three sizes) that will be used to evaluate the effect of insulation thickness on Indenter modulus.
Indenter Measurements will be performed by personnel at Analog Interfaces using the Indenter Polymer Aging Monitor (IPAM). All IPAM measurements will be performed after thermal aging except for those that will be made before thermal aging on the 12 specimens that will be bent around a mandrel throughout the thermal aging exposures. Thermal aging and EAB tests will be performed at the FAA Technical Center (Atlantic City).
A-6

2. RECEIPT AND PREPARATION OF WIRES 2.1 Examine all markings on each wire that identifies the manufacturer, size, type,
specification, trade name, or any other information. Verify that the markings are consistent with the wire identification information shown in Table 1. Perform a visual inspection of wires to identify any obvious defects that would render them unsuitable for testing. If defects are found, prepare a written record of the defect and notify the AMEC project manager.
2.2 Prepare specimen-identification number printed labels that will stick to self-sealing
(“Ziplock”) plastic bags. The numbers for these labels are shown in the six data tables contained in Appendix A to this Test Plan. The identification number code represents the following information (reading from left to right): Wire Type, duration (weeks) of accelerated aging performed in the previous project, and specimen number. For example, the identification code PVC A2 #3 would mean a Polyvinyl Chloride insulated-wire that had been previously aged for two weeks (specimen number 3 of 10).
A-7

3. INDENTER TESTING AND THERMAL AGING OF WIRES ON MANDRELS
One specimen of each wire type will be tested with the Indenter then wrapped around a metal mandrel, held in tension and subjected to thermal aging. An identical specimen that has not been tested by the Indenter also will be wrapped around the mandrel, held in tension and subjected to thermal aging. The point where the Indenter measurement was made will be maintained under tension throughout the entire thermal aging exposure by hanging a weight from the wire. At the completion of thermal aging, the specimen will be examined at the point where the Indenter measurement was made to determine if there are any cracks or other indications of aging stress at that location which are not seen on the wire that did not have an Indenter measurement before aging.
The diameter of the mandrel will be approximately five times (“5X”) the diameter of the insulated wire. Five of the six types of test specimens are #20 AWG, and the typical overall diameter of these insulated wires is approximately 0.05 inches; therefore, the diameter of a 5X mandrel for the #20 AWG test specimens is to be approximately 0.25 inches (1/4 inch). The overall diameter of a #10 AWG insulated wire (“Polyimide Power”) is approximately 0.126 inches; therefore, the diameter of a 5X mandrel for the #10 AWG insulated wire is to be approximately 0.63 inches (~5/8 inches). All of the specimens to be bent around a mandrel are those that were unaged in the previous research project. The specimen identification number for the 12 wires are as follows:
• PVC A0 #6 and PVC A0 #7 • PVC G-N A0 #6 and PVC G-N A0 #7 • XL-ETFE A0 #6 and XL-ETFE A0 #7 • Composite TKT A0 #6 and Composite TKT A0 #7 • Polyimide INST A0 #6 and Polyimide INST A0 #7 • Polyimide POWER A0 #6 and Polyimide POWER A0 #7 • The #6 specimen of each type is to be indented before it is bent around a mandrel.
3.1 Obtain one metal mandrel that is approximately 5/8 inch in diameter, and five metal mandrels that are each approximately ¼ inch in diameter. The length of
A-8

each mandrel should be approximately six inches (up to nine inches). The mandrels can be made from any type of metal that is not affected by a temperature of 300°C (572°F), and they can be cut from standard bar stock or any other readily available source. Thoroughly clean and dry each mandrel to ensure that no oil, grease, dirt or residual contamination of any kind is on the surface.
3.2 Obtain a set of metal weights that will be hung from the test wires to maintain tension
(see sketch above). The weight for the #20 AWG wires should be approximately 0.75 pounds (~341 grams). The weight for the #10 AWG wire should be approximately 2.5 pounds (~1,136 grams). The weights can be either standard laboratory items, or made from materials readily available at a hardware store (for example, the contents of a box of steel bolts or nuts placed in a metal wire mesh (door screen) that is attached to the terminal lugs.
3.3 Cut a 6-inch length of wire from a longer, unaged specimen. Crimp appropriately sized
terminal lugs onto both ends. 3.4 Make an Indenter measurement in the exact center (longitudinal axis) of the wire
specimen, then rotate the wire exactly 180 degrees around its longitudinal axis and make a mark on the wire using indelible ink (black). The black mark in the exact center (longitudinal axis) of the wire specimen will identify the side and part of the wire specimen that will rest on the top of the mandrel so that the point of the Indenter measurement on the other side of the wire will be in tension throughout the thermal aging exposure.
3.5 Place the wire specimen over the mandrel (black mark centered at top and touching the
highest point of a mandrel held horizontally), then attach the two ends to the weight suspended underneath. Suspend the ends of the mandrel from the underneath of a tray in the oven using “S”-shaped metal hooks or other appropriate means (see illustration in Figure 1).
3.6 The number, type and use of the entire set of mandrels is as follows:
Mandrel Diameter Wires Oven Weights 1 0.25 inch 2 PVC No. 1
(125°C) 2 @ 0.75 lbs;
2 0.25 inch 2 PVC G-N No. 1 (125°C)
2@ 0.75 lbs
3 0.25 inch 2 XL-ETFE No. 2 (220°C)
2 @ 0.75 lbs;
4 0.25 inch 2 Polyimide INST No. 2 (220°C)
2 @ 0.75 lbs
5 0.625 inch 2 Polyimide Power
No. 2 (220°C)
2 @ 2.5 lbs
6 0.25 inch 2 Composite TKT No. 3 (280°C)
2 @ 0.75 lbs
A-9

3.7 Age the specimens on the mandrels at the same time as those described in Section
5 (“Accelerated Thermal Aging Exposures”). The total aging time for all mandrel specimens is as follows:
• PVC and PVC G-N 8 weeks • XL-ETFE 12 weeks • Polyimide and Composite TKT 24 weeks
3.8 Remove the specimens from the oven and perform a visual inspection of them. Visually
examine the two specimens of each type at the location where one of each was tested by the Indenter. Examine the specimens first using the unaided eye and then using a magnifying glass. Prepare a written record of the examination of all specimens, using the form shown in Appendix B.
shelf
Mandrel (1/4” dia.)
9”
0.75 LB Weights
6-inch Wire Specimens Bent Over Mandrel in Tension
Suspension Device – Wire, Hook, Eye Bolt, etc.
2 7/8”
Weights Hung from terminal lugs on test specimens using steel wire
FIGURE 1. AGING OF #20 AWG WIRES IN TENSION ELEVATION VIEW INSIDE OVEN
A-10

4. THERMAL AGING AND INDENTER TESTING OF DIFFERENT SIZE WIRES Different wire sizes will be thermally aged and Indenter tested to determine the effect, if any, on the Indenter modulus when the ratio of insulation-thickness-to-conductor-diameter varies for the same type of insulation. Three sizes of wire (#20 AWG, #12 AWG and #10 AWG), all of which are insulated with the identical insulation system (polyimide, as described in Table 1), will be thermally aged at 220°C for various periods of time (15 to 24 weeks).2 4.1 Cut 25 specimens, each of which is 12-inches long, from a continuous length of each type
of wire to be tested. 4.2 Place five specimens of each of the three types in sealable plastic bags, and label the
three bags with the following designations: M81381/12-20 A0; M81381/12-12 A0; and, M81381/12-10 A0. Set the bags aside for Indenter testing at a later time.
4.3 Place five specimens of M81381/12-10 in the right-hand side of each of the four
quadrants of the top shelf in Oven Number 2 (see Table 7 for quadrant diagram). 4.4 Place five specimens of M81381/12-20 in the right-hand side of each of the four
quadrants of the center shelf in Oven Number 2 (see Table 7 for diagram). 4.5 Place five specimens of M81381/12-12 in the right-hand side of each of the four
quadrants of the bottom shelf in Oven Number 2 (see Table 7 for diagram). 4.6 Age the specimens in accordance with the following schedule:
Quadrant Aging Time1 15 weeks 2 18 weeks 3 21 weeks 4 24 weeks
4.7 Remove the appropriate specimens from the oven after each period of aging. After the
removed specimens have cooled to room temperature, place them in a sealable plastic bag that is labeled with one of the following designations:
• M81381/12-20 A15; M81381/12-20 A18; M81381/12-20 A21; or M81381/12-20 A24 • M81381/12-12 A15; M81381/12-12 A18; M81381/12-12 A21; or M81381/12-12 A24 • M81381/12-10 A15; M81381/12-10 A18; M81381/12-10 A21; or M81381/12-10 A24
2 The Mil Spec identification numbers for the three types of wires are as follows: M81381/12-20;
M81381/12-12; and, M81381/12-10.
A-11

5. ACCELERATED THERMAL AGING EXPOSURES Thermal aging of the wire specimens will be performed in three laboratory ovens located at the FAA Technical Center (Atlantic City International Airport). There will be one large oven (Gruenberg) and two smaller ovens (Lindberg/Blue M). A descriptions of the ovens that will be used is presented in Table 2.
TABLE 2. DESCRIPTION OF THERMAL AGING OVENS
Model
Width (in)
Depth(in)
Height(in)
Volume (cu. Ft.)
Shelves
Air Changes Per Hour
Max Temp (°C)
MO1450A (Lindberg/Blue M)
22 16 24 4.9 2 46 300 (572°F)
C100H360 (Gruenberg)
36 36 48 36 3 4500 538 (1000°F)
All PVC and PVC G-N specimens will be aged at 125°C; all XL-ETFE and Polyimide specimens will be aged at 220°C; and, all Composite TKT specimens will be aged at 280°C. The duration (weeks) of accelerated thermal aging for each test specimen is shown in Tables 3, 4 and 5. 5.1 Prepare three, forced-convection, air ovens with the ability to maintain a temperature
within +/- 2°C of the following three temperatures:
• Temperature #1: 125°C (257°F) • Temperature #2: 220°C (428°F) • Temperature #3: 280°C (536°F)
5.2 Sort all specimens that are to be thermally aged into common groups based on the aging
exposures specified in Tables 3, 4 and 5. 5.3 Install the specimen groups in the appropriate ovens in such a manner that each group can
be removed at the appropriate time without disturbing the specimen groups that will remain in the oven for additional aging. That is, the installed position in the oven should be on the order of "first in - last out." See Tables 6, 7 and 8 for instructions concerning the placement of test specimens on the shelves in the ovens.
5.4 Energize the ovens.3 After the oven temperature has stabilized at the specified
temperature (approximately one hour after being energized), record the date and time (hour and minute) as the starting time for the thermal aging exposure.
3 The starting time should be during the normal working hours of a weekday, but should not be in the
afternoon on a Friday. The preferred starting time is on a Tuesday at 10 A.M.
A-12

5.5 After six weeks (1,008 hours) has elapsed from the starting time, open oven number 1 containing the PVC wires (Tables 3 and 6) and remove the group containing specimens PVC A0 #1 through PVC A0 #5. The specimens should be removed from the oven as quickly as possible to minimize temperature fluctuations in the oven. Close the oven immediately and continue the aging for another two weeks. At the completion of eight weeks (1,344 hours) of aging, turn off the oven and remove all of the remaining PVC and PVC G-N specimens, including those on the mandrels. Record the ending time (date and time) of the thermal aging exposure for the PVC and PVC G-N specimens..
5.6 After 12 weeks (2,016 hours) has elapsed from the starting time, open oven number 2 and
remove all XL-EFTE test specimens on the bottom shelf (Tables 4 and 7), including those on the XL-ETFE mandrel. The specimens should be removed from the oven as quickly as possible to minimize temperature fluctuations in the oven. Close the oven immediately and continue the aging for the other test specimens in oven number 2. Record the ending time (date and time) of the thermal aging exposure for the XL-ETFE specimens.
5.7 After 15 weeks (2,520 hours) has elapsed from the starting time, open oven number 2 and
oven number 3 and remove the two groups (one in each oven) containing specimens that were designated to have 15 weeks of aging (see Tables 4 and 7, and Tables 5 and 8). The specimens should be removed from the ovens as quickly as possible to minimize temperature fluctuations in the ovens. Close the ovens immediately and continue the aging for another three weeks. Repeat the process of removing the appropriate specimens, closing the ovens and continuing the aging exposures every three weeks until a total of 24 weeks (4,032 hours) of aging has been completed. At the completion of 24 weeks of aging, turn off both ovens and remove all of the remaining specimens, including those on the mandrels. Record the ending time (date and time).
5.8 Send all wire specimens to Analog Interfaces for Indenter Testing.
A-13

TABLE 3. WIRE SPECIMENS TO BE AGED AT 125°C (257°F) (Oven Number 1: Blue M Model MO1450A located in Building No. at FAA)
Aging Time (Weeks)
PVC (16 inches)
Specimen Number
PVC G-N (24 inches)
Specimen Number 6
PVC A0 #1 PVC A0 #2 PVC A0 #3 PVC A0 #4 PVC A0 #5
8
PVC A2 #1 PVC A2 #2 PVC A2 #3 PVC A2 #4 PVC A2 #5
PVC A4 #1 PVC A4 #2 PVC A4 #3 PVC A4 #4 PVC A4 #5
PVC A6 #1 PVC A6 #2 PVC A6 #3 PVC A6 #4 PVC A6 #5
PVC A8 #1 PVC A8 #2 PVC A8 #3 PVC A8 #4 PVC A8 #5
PVC G-N A0 #1 PVC G-N A0 #2 PVC G-N A0 #3 PVC G-N A0 #4 PVC G-N A0 #5
PVC G-N A2 #1 PVC G-N A2 #2 PVC G-N A2 #3 PVC G-N A2 #4 PVC G-N A2 #5
PVC G-N A4 #1 PVC G-N A4 #2 PVC G-N A4 #3 PVC G-N A4 #4 PVC G-N A4 #5
PVC G-N A6 #1 PVC G-N A6 #2 PVC G-N A6 #3 PVC G-N A6 #4 PVC G-N A6 #5
PVC G-N A8 #1 PVC G-N A8 #2 PVC G-N A8 #3 PVC G-N A8 #4 PVC G-N A8 #5
A-14

TABLE 4 WIRE SPECIMENS TO BE AGED AT 220°C (428°F) (Oven Number 2: Gruenberg Model C100H360 – located in Building No. at FAA)
Aging Time
(Weeks) XL-ETFE (16 inches)
Specimen No.
Polyimide INST (6 inches)
Specimen No.
Polyimide Power (6 inches)
Specimen No.
12
XL-ETFE A3 #1 XL-ETFE A3 #2 XL-ETFE A3 #3 XL-ETFE A3 #4 XL-ETFE A3 #5
XL-ETFE A6 #1 XL-ETFE A6 #2 XL-ETFE A6 #3 XL-ETFE A6 #4 XL-ETFE A6 #5
XL-ETFE A9 #1 XL-ETFE A9 #2 XL-ETFE A9 #3 XL-ETFE A9 #4 XL-ETFE A9 #5
XL-ETFE A12 #1 XL-ETFE A12 #2 XL-ETFE A12 #3 XL-ETFE A12 #4 XL-ETFE A12 #5
15
Polyimide INST A3 #1 Polyimide INST A3 #2 Polyimide INST A3 #3 Polyimide INST A3 #4 Polyimide INST A3 #5
Polyimide POWER A3 #1 Polyimide POWER A3 #2 Polyimide POWER A3 #3 Polyimide POWER A3 #4 Polyimide POWER A3 #5
18
Polyimide INST A6 #1 Polyimide INST A6 #2 Polyimide INST A6 #3 Polyimide INST A6 #4 Polyimide INST A6 #5
Polyimide POWER A6 #1 Polyimide POWER A6 #2 Polyimide POWER A6 #3 Polyimide POWER A6 #4 Polyimide POWER A6 #5
21
Polyimide INST A9 #1 Polyimide INST A9 #2 Polyimide INST A9 #3 Polyimide INST A9 #4 Polyimide INST A9 #5
Polyimide POWER A9 #1 Polyimide POWER A9 #2 Polyimide POWER A9 #3 Polyimide POWER A9 #4 Polyimide POWER A9 #5
24
Polyimide INST A12 #1 Polyimide INST A12 #2 Polyimide INST A12 #3 Polyimide INST A12 #4 Polyimide INST A12 #5
Polyimide POWER A12 #1 Polyimide POWER A12 #2 Polyimide POWER A12 #3 Polyimide POWER A12 #4 Polyimide POWER A12 #5
A-15

A-16
TABLE 5 WIRE SPECIMENS TO BE AGED AT 280°C (536°F) (Oven Number 3: Blue M Model MO1450A located in Building No. at FAA)
Aging Time(Weeks)
Composite TKT (24 inches)
Specimen No.
15
Composite TKT A3 #1 Composite TKT A3 #2 Composite TKT A3 #3 Composite TKT A3 #4 Composite TKT A3 #5
18
Composite TKT A6 #1 Composite TKT A6 #2 Composite TKT A6 #3 Composite TKT A6 #4 Composite TKT A6 #5
21
Composite TKT A9 #1 Composite TKT A9 #2 Composite TKT A9 #3 Composite TKT A9 #4 Composite TKT A9 #5
24
Composite TKT A12 #1 Composite TKT A12 #2Composite TKT A12 #3Composite TKT A12 #4Composite TKT A12 #5

TABLE 6. OVEN SHELF AND QUADRANT POSITIONS FOR PVC AND PVC G-N WIRES (Oven Number 1: Blue M Model MO1450A located in Building No. at FAA)
Shelf Position Quadrant 1 Quadrant No. 2 Quadrant No. 3 Quadrant No. 4Top
PVC A0 #1 PVC A0 #2 PVC A0 #3 PVC A0 #4 PVC A0 #5 PVC A2 #1 PVC A2 #2 PVC A2 #3 PVC A2 #4 PVC A2 #5
PVC A4 #1 PVC A4 #2 PVC A4 #3 PVC A4 #4 PVC A4 #5
PVC A6 #1 PVC A6 #2 PVC A6 #3 PVC A6 #4 PVC A6 #5
PVC A8 #1 PVC A8 #2 PVC A8 #3 PVC A8 #4 PVC A8 #5
Bottom PVC G-N A0 #1PVC G-N A0 #2PVC G-N A0 #3PVC G-N A0 #4PVC G-N A0 #5PVC G-N A2 #1PVC G-N A2 #2PVC G-N A2 #3PVC G-N A2 #4PVC G-N A2 #5
PVC G-N A4 #1 PVC G-N A4 #2 PVC G-N A4 #3 PVC G-N A4 #4 PVC G-N A4 #5
PVC G-N A6 #1 PVC G-N A6 #2 PVC G-N A6 #3 PVC G-N A6 #4 PVC G-N A6 #5
PVC G-N A8 #1 PVC G-N A8 #2 PVC G-N A8 #3 PVC G-N A8 #4
A-17
PVC G-N A8 #5
TYPICAL OVEN SHELF SHOWING QUADRANTS
Quadrant 2
Quadrant 4
Quadrant 1
Quadrant 3

TABLE 7. OVEN SHELF AND QUADRANT POSITIONS FOR XL-ETFE AND POLYIMIDE WIRES (Oven Number 2: Gruenberg Model C100H360 – located in Building No. at FAA)
Shelf Position Quadrant 1 Quadrant No. 2 Quadrant No. 3 Quadrant No. 4 Top Polyimide POWER A3 #1
Polyimide POWER A3 #2Polyimide POWER A3 #3Polyimide POWER A3 #4Polyimide POWER A3 #5
Polyimide POWER A6 #1Polyimide POWER A6 #2Polyimide POWER A6 #3Polyimide POWER A6 #4Polyimide POWER A6 #5
Polyimide POWER A9 #1Polyimide POWER A9 #2Polyimide POWER A9 #3Polyimide POWER A9 #4Polyimide POWER A9 #5
Polyimide POWER A12 #1 Polyimide POWER A12 #2Polyimide POWER A12 #3Polyimide POWER A12 #4Polyimide POWER A12 #5
Middle Polyimide INST A3 #1 Polyimide INST A3 #2 Polyimide INST A3 #3 Polyimide INST A3 #4 Polyimide INST A3 #5
Polyimide INST A6 #1 Polyimide INST A6 #2 Polyimide INST A6 #3 Polyimide INST A6 #4 Polyimide INST A6 #5
Polyimide INST A9 #1 Polyimide INST A9 #2 Polyimide INST A9 #3 Polyimide INST A9 #4 Polyimide INST A9 #5
Polyimide INST A12 #1 Polyimide INST A12 #2 Polyimide INST A12 #3 Polyimide INST A12 #4 Polyimide INST A12 #5
Bottom XL-ETFE A3 #1 XL-ETFE A3 #2 XL-ETFE A3 #3 XL-ETFE A3 #4 XL-ETFE A3 #5
XL-ETFE A6 #1 XL-ETFE A6 #2 XL-ETFE A6 #3 XL-ETFE A6 #4 XL-ETFE A6 #5
XL-ETFE A9 #1 XL-ETFE A9 #2 XL-ETFE A9 #3 XL-ETFE A9 #4 XL-ETFE A9 #5
XL-ETFE A12 #1 XL-ETFE A12 #2 XL-ETFE A12 #3 XL-ETFE A12 #4
A-18
XL-ETFE A12 #5
TYPICAL OVEN SHELF SHOWING QUADRANTS
Quadrant 2
Quadrant 4
Quadrant 1
Quadrant 3

TABLE 8. OVEN SHELF AND QUADRANT POSITIONS FOR COMPOSITE TKT WIRES
(Oven Number 3: Blue M Model MO1450A located in Building No. at FAA)
Shelf Position Quadrant 1 Quadrant No. 2 Quadrant No. 3 Quadrant No. 4 Top Composite TKT A3 #1
Composite TKT A3 #2Composite TKT A3 #3Composite TKT A3 #4Composite TKT A3 #5
Composite TKT A6 #1Composite TKT A6 #2Composite TKT A6 #3Composite TKT A6 #4Composite TKT A6 #5
Composite TKT A9 #1Composite TKT A9 #2Composite TKT A9 #3Composite TKT A9 #4Composite TKT A9 #5
Composite TKT A12 #1 Composite TKT A12 #2Composite TKT A12 #3Composite TKT A12 #4Composite TKT A12 #5
TYPICAL OVEN SHELF SHOWING QUADRANTS
Quadrant 2
Quadrant 4
Quadrant 1
Quadrant 3
A-19

6. INDENTER TESTING OF WIRES AFTER THERMAL AGING 6.1 Analog Interfaces personnel will perform all Indenter testing. 6.2 Analog Personnel will perform a complete calibration of the Indenter in accordance with
the calibration procedure stated in the Indenter manual. Document of the full calibration will become part of the test records.
6.3 Analog personnel will perform Indenter testing using the procedures stated in the
Indenter most current revision of the Instruction Manual. 6.4 At the conclusion of Indenter testing, all specimens listed in Appendix A are to be sent to
the FAA Technical Center (Atlantic City) for Elongation-at-Break (EAB) testing.
A-20

7. ELONGATION-AT-BREAK (EAB) TESTING Tensile tests are to be performed on the aged specimens to determine the Elongation-at-Break (EAB) that occurs after each increase in aging time. The tests will be performed at the FAA Technical Center (Atlantic City) using an INSTRON 1125 Tensile Testing machine (or similar).
The tensile tests will be performed in general accordance with the guidance provided in Method 3031 of Federal Test Method Standard No. 28 and ASTM Standard D 638-95 (Plastics). The primary standard for guidance will be D 638-95, except when overruled by specific requirements of ASTM D 2633-82. The "Conditioning" described in Section 7 of ASTM D 638-95 is not required. Elongation-at-Break (EAB) testing of aged specimens normally is performed no earlier than 16 hours and no later than 96 hours after each group of aged specimens has been removed from the aging ovens. However, since IPAM measurements must be made prior to EAB testing, the usual time period of 16 to 96 hours will not be followed. Specific requirements for the EAB tests consist of the following:
• Specimens shall be tested at room temperature (68°F to 82°F) • Five specimens from each aging group shall be tested • Specimens shall be marked with gage marks that are two (2) inches apart • Specimens shall be placed in the jaws of the testing machine with a maximum distance
between the jaws of four (4) inches and a minimum distance of three (3) inches • The speed of testing shall be 20 inches (500 mm) per minute
An Extension Indicator (extensometer) that meets the requirements of Section 5.2 of ASTM D 638-95 should be used to measure the elongation that occurs. If one is not available, then use a measuring scale or other device graduated in 0.1 inch for indicating elongation. Perform five trial runs using other wire specimens to ensure satisfactory operation of the tensile testing machine before any tests are performed on specimens included in this test program. Measurements made in trial runs are not part of this project and are not to be recorded in the official records of this test. 7.1 Preparation of the Test Specimens Prepare the test specimens as follows:
• Cut a 6-inch piece of aged wire from one end of the whole aged test specimen • Remove ½-inch of insulation at each end using a standard wire stripper tool • Place the ½-inch bare metal conductor ends in the Instron jaws and stretch the conductor
until it ruptures • Remove the metal conductor from inside the insulation “tube” (gentle rolling of the
specimen back and forth between your palms will loosen the metal conductor from the insulation).
A-21

• Make very thin parallel gage marks on the tube using an indelible marker (black) that will not degrade the material. The gage marks are to be centered on the middle of the tube and be exactly two inches apart.
• Place the five “tubes” from each aging group in a small, sealed (“Ziplock”) plastic bag that contains a printed label listing each specimen identification number.
7.2 Steps to Perform EAB Tests The procedure for performing the EAB tests follows that stated in Section 10 of ASTM D 638-92, and is repeated in the following steps.
• Remove the specimen from the labeled plastic bag.
• Place the specimen in the grips of the testing machine, taking care to align the long axis of the specimen and the grips with an imaginary line joining the points of attachment of the grips to the machine. The distance between the ends of the gripping surfaces shall be four (4) inches. Tighten the grips evenly and firmly to the degree necessary to prevent slippage of the specimen during the test, but not to the point where the specimen would be crushed.
• Attach the extension indicator (gage length is two inches). The extension indicator must
continuously record the distance the specimen is stretched (elongated) WITHIN THE ORIGINALLY MARKED GAGE LENGTH. The distance between the two gage marks on the specimen shall be noted continuously to the nearest 01. inch by means of the scale or other device which shall be used in such a manner as not to touch the specimen.
• Set the speed of testing to 20 inches (500 mm) per minute.
• Start the machine, and measure the extension AT THE MOMENT THE SPECIMEN
BREAKS. Record the data on the appropriate data sheet contained in Appendix A of the Test Plan.
• Put all tested specimen pieces back into the labeled plastic bag and seal it.
• Repeat the above six steps until all specimens in the group have been tested.
• Record on the data sheet in the “Comments” section any anomalies, situations, or
behavioral characteristics of the materials/test specimens that are significant in your judgment, or could be of help in understanding the test data.
• At the conclusion of EAB testing, return all specimens to AMEC.
A-22

DATA SHEETS FOR ELONGATION-AT-BREAK TESTS
DATA SHEET NO. 1: ELONGATION-AT-BREAK TESTS ON PVC
ID Number
Original Aging (weeks)
Additional Aging (weeks)
Length Between Gage Marks at Break
(inches) Initials /Date PVC A0 #1 0 6 PVC A0 #2 0 6 PVC A0 #3 0 6 PVC A0 #4 0 6 PVC A0 #5 0 6 PVC A2 #1 2 8 PVC A2 #2 2 8 PVC A2 #3 2 8 PVC A2 #4 2 8 PVC A2 #5 2 8 PVC A4 #1 4 8 PVC A4 #2 4 8 PVC A4 #3 4 8 PVC A4 #4 4 8 PVC A4 #5 4 8 PVC A6 #1 6 8 PVC A6 #2 6 8 PVC A6 #3 6 8 PVC A6 #4 6 8 PVC A6 #5 6 8 PVC A8 #1 8 8 PVC A8 #2 8 8 PVC A8 #3 8 8 PVC A8 #4 8 8 PVC A8 #5 8 8 EAB tests performed using INSTRON 1125 Tensile Testing machine Serial No. Comments: NAME Date
A-23
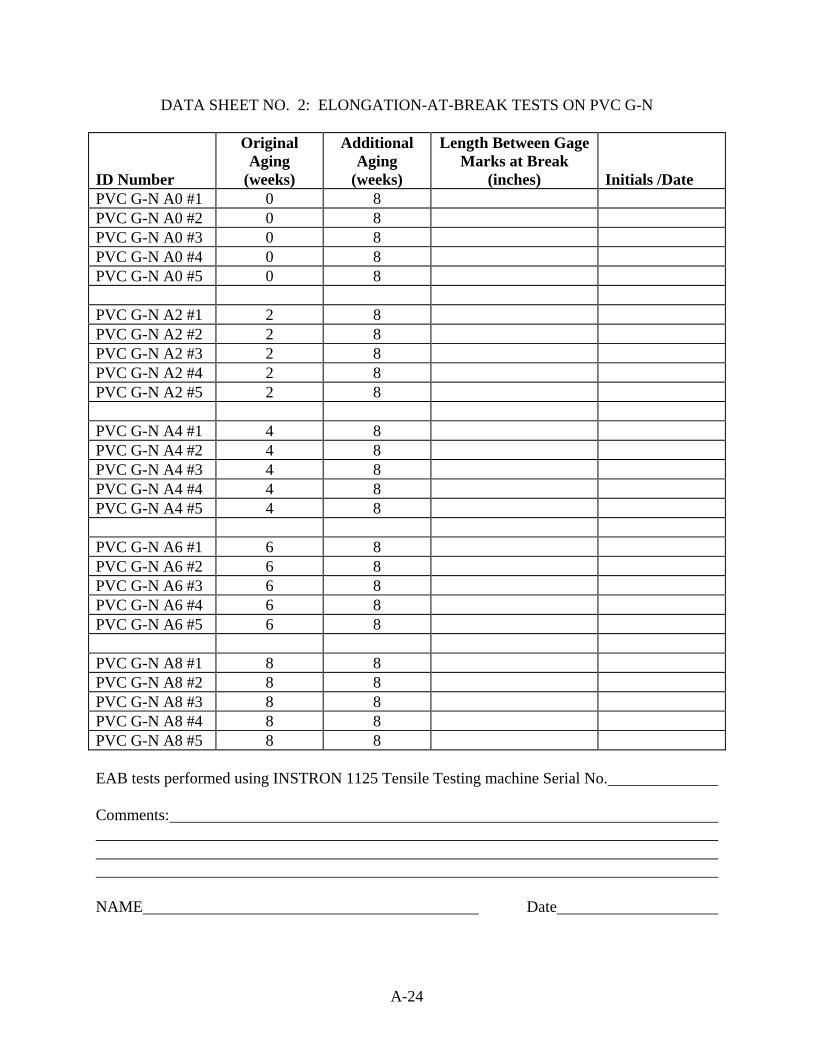
DATA SHEET NO. 2: ELONGATION-AT-BREAK TESTS ON PVC G-N
ID Number
Original Aging
(weeks)
Additional Aging
(weeks)
Length Between Gage Marks at Break
(inches)
Initials /Date
PVC G-N A0 #1 0 8 PVC G-N A0 #2 0 8 PVC G-N A0 #3 0 8 PVC G-N A0 #4 0 8 PVC G-N A0 #5 0 8 PVC G-N A2 #1 2 8 PVC G-N A2 #2 2 8 PVC G-N A2 #3 2 8 PVC G-N A2 #4 2 8 PVC G-N A2 #5 2 8 PVC G-N A4 #1 4 8 PVC G-N A4 #2 4 8 PVC G-N A4 #3 4 8 PVC G-N A4 #4 4 8 PVC G-N A4 #5 4 8 PVC G-N A6 #1 6 8 PVC G-N A6 #2 6 8 PVC G-N A6 #3 6 8 PVC G-N A6 #4 6 8 PVC G-N A6 #5 6 8 PVC G-N A8 #1 8 8 PVC G-N A8 #2 8 8 PVC G-N A8 #3 8 8 PVC G-N A8 #4 8 8 PVC G-N A8 #5 8 8 EAB tests performed using INSTRON 1125 Tensile Testing machine Serial No. Comments: NAME Date
A-24

DATA SHEET NO. 3: ELONGATION-AT-BREAK TESTS ON XL-ETFE
ID Number
Original Aging
(weeks)
Additional Aging
(weeks)
Length Between Gage Marks at Break
(inches) Initials /Date XL-ETFE A3 #1 3 12 XL-ETFE A3 #2 3 12 XL-ETFE A3 #3 3 12 XL-ETFE A3 #4 3 12 XL-ETFE A3 #5 3 12 XL-ETFE A6 #1 6 12 XL-ETFE A6 #2 6 12 XL-ETFE A6 #3 6 12 XL-ETFE A6 #4 6 12 XL-ETFE A6 #5 6 12 XL-ETFE A9 #1 9 12 XL-ETFE A9 #2 9 12 XL-ETFE A9 #3 9 12 XL-ETFE A9 #4 9 12 XL-ETFE A9 #5 9 12 XL-ETFE A12 #1 12 12 XL-ETFE A12 #2 12 12 XL-ETFE A12 #3 12 12 XL-ETFE A12 #4 12 12 XL-ETFE A12 #5 12 12 EAB tests performed using INSTRON 1125 Tensile Testing machine Serial No. Comments: NAME Date
A-25

DATA SHEET NO. 4: ELONGATION-AT-BREAK TESTS ON POLYIMIDE INST
ID Number
Original Aging (weeks)
Additional Aging
(weeks)
Length Between Gage Marks at Break
(inches) Initials /Date Polyimide INST A3 #1 3 15 Polyimide INST A3 #2 3 15 Polyimide INST A3 #3 3 15 Polyimide INST A3 #4 3 15 Polyimide INST A3 #5 3 15 Polyimide INST A6 #1 6 18 Polyimide INST A6 #2 6 18 Polyimide INST A6 #3 6 18 Polyimide INST A6 #4 6 18 Polyimide INST A6 #5 6 18 Polyimide INST A9 #1 9 21 Polyimide INST A9 #2 9 21 Polyimide INST A9 #3 9 21 Polyimide INST A9 #4 9 21 Polyimide INST A9 #5 9 21 Polyimide INST A12 #1 12 24 Polyimide INST A12 #2 12 24 Polyimide INST A12 #3 12 24 Polyimide INST A12 #4 12 24 Polyimide INST A12 #5 12 24 EAB tests performed using INSTRON 1125 Tensile Testing machine Serial No. Comments: NAME Date
A-26

DATA SHEET NO. 5: ELONGATION-AT-BREAK TESTS ON POLYIMIDE POWER
ID Number
Original Aging
(weeks)
Additional Aging
(weeks)
Length Between Gage Marks at Break
(inches) Initials /Date Polyimide Power A3 #1 3 15 Polyimide Power A3 #2 3 15 Polyimide Power A3 #3 3 15 Polyimide Power A3 #4 3 15 Polyimide Power A3 #5 3 15 Polyimide Power A6 #1 6 18 Polyimide Power A6 #2 6 18 Polyimide Power A6 #3 6 18 Polyimide Power A6 #4 6 18 Polyimide Power A6 #5 6 18 Polyimide Power A9 #1 9 21 Polyimide Power A9 #2 9 21 Polyimide Power A9 #3 9 21 Polyimide Power A9 #4 9 21 Polyimide Power A9 #5 9 21 Polyimide Power A12 #1 12 24 Polyimide Power A12 #2 12 24 Polyimide Power A12 #3 12 24 Polyimide Power A12 #4 12 24 Polyimide Power A12 #5 12 24 EAB tests performed using INSTRON 1125 Tensile Testing machine Serial No. Comments: NAME Date
A-27

DATA SHEET NO. 6: ELONGATION-AT-BREAK TESTS ON COMPOSITE TKT ID Number
Original Aging
(weeks)
Additional Aging
(weeks)
Length Between Gage Marks at Break
(inches)
Initials /Date
Composite TKT A3 #1 3 15 Composite TKT A3 #2 3 15 Composite TKT A3 #3 3 15 Composite TKT A3 #4 3 15 Composite TKT A3 #5 3 15 Composite TKT A6 #1 6 18 Composite TKT A6 #2 6 18 Composite TKT A6 #3 6 18 Composite TKT A6 #4 6 18 Composite TKT A6 #5 6 18 Composite TKT A9 #1 9 21 Composite TKT A9 #2 9 21 Composite TKT A9 #3 9 21 Composite TKT A9 #4 9 21 Composite TKT A9 #5 9 21 Composite TKT A12 #1 12 24 Composite TKT A12 #2 12 24 Composite TKT A12 #3 12 24 Composite TKT A12 #4 12 24 Composite TKT A12 #5 12 24 EAB tests performed using INSTRON 1125 Tensile Testing machine Serial No. Comments: NAME Date
A-28

DATA SHEET FOR VISUAL EXAMINATION OF SPECIMENS BENT AROUND A MANDREL DURING THERMAL AGING
Visually examine each specimen using the unaided eye, then repeat the inspection using a magnifying glass. Describe the appearance of the wire at the location where it was Indented, and the appearance of the control wire at the same location. Identification Number (Indented Specimen): Comments: Identification Number (Control Specimen): Comments: Name: Date: Printed Signature
A-29

Earth & Environmental, Inc.
One Plymouth Meeting
Suite 850 Phone: 610-828-8100 Plymouth Meeting, PA 19462-1308 Fax: 610-828-6700 United States of America [email protected] MEMORANDUM To: Files – AMEC Project Number 3-7652-0000 Fm: William M. Denny Date: February 2, 2004 SUBJECT: Revision Number 1 to Test Plan for Aging of Aircraft Wires REF. 1: “Start of Thermal Aging Test at FAA Technical Center” Memo from William M. Denny dated January 22, 2004 Reference 1 stated that 12 wires were not included in the start of the aging test in Oven Number 2 because they could not be located. The missing specimens were as follows: Polyimide INST A3 #3 Polyimide INST A6 #3 Polyimide INST A9 #3 Polyimide INST A12 #3 Polyimide INST A3 #4 Polyimide INST A6 #4 Polyimide INST A9 #4 Polyimide INST A12 #4 Polyimide INST A3 #5 Polyimide INST A6 #5 Polyimide INST A9 #5 Polyimide INST A12 #5 Page 26 of the Test Plan (Rev. 0, Nov. 25, 2003) showed that the total cumulative aging at 220°C that these four groups of specimens would have experienced as a result of both the previous aging test (early 2003) and the current aging test would be 18, 24, 30 and 36 weeks, respectively. Therefore, other specimens will now be chosen to add to Oven Number 2 as substitutes for the specimens that are missing. The intent is to put the substitute wires into Oven Number 2 after three weeks of aging has been completed in the current test now underway. Since the test for these specimens started on Wednesday, January 21, 2004 at 1:21 P.M., the substitute specimens will be put into Oven Number 2 on Wednesday, February 11, 2004 at 1:21 P.M. The specimens that are to be added and the length of time that they are to be aged have been chosen so that the total cumulative aging of each group will be 18, 24, and 30 weeks, respectively, to remain consistent will the other specimens. Since it will not be possible to obtain a total of 36 weeks, only three substitute groups will be added. The identification numbers of the substitute specimens, the durations of aging and placement locations in Oven Number 2 are shown in the following table.
A-30

Substitute Wire Specimens To Be Added To Oven Number 2
Identification Number Original
Aging (weeks)
Additional Aging
(weeks)
Quadrant Location on MIDDLE Shelf
Polyimide INST A3 #8 3 15 Quad 2 – Left side Polyimide INST A3 #9 3 15 Quad 2 – Left side Polyimide INST A3 #10 3 15 Quad 2 – Left side Polyimide INST A6 #8 6 18 Quad 3 – Left side Polyimide INST A6 #9 6 18 Quad 3 – Left side Polyimide INST A6 #10 6 18 Quad 3 – Left side Polyimide INST A9 #8 9 21 Quad 4 – Left side Polyimide INST A9 #9 9 21 Quad 4 – Left side Polyimide INST A9 #10 9 21 Quad 4 – Left side
Typical Oven Shelf Showing Quadrants
Quadrant 2
Quadrant 4
Quadrant 1
Quadrant 3
Front of Oven To ensure that these specimens are maintained separately from the others for proper identification, each group of three wires will be contained within a loosely coiled short segment of un-aged #20 AWG wire provided by Boeing (BMS 13-48 T10C01G020).
A-31

Earth & Environmental, Inc.
One Plymouth Meeting
Suite 850 Phone: 610-828-8100 Plymouth Meeting, PA 19462-1308 Fax: 610-828-6700 United States of America [email protected] MEMORANDUM To: Files – AMEC Project Number 3-7652-0000 Fm: William M. Denny Date: April 6, 2004 SUBJECT: Revision Number 2 to Test Plan for Aging of Aircraft Wires REF. 1: Email from Cesar Gomez (FAA ) to William M. Denny dated April 5, 2005.
Subject: “Power Outage” Reference 1 stated that the power would be removed from the research area at the FAA Technical Center from 5:00 P.M. on Friday, April 9 until 9:00 A.M. on Sunday, April 11, 2004. Thus, the test schedule would be interrupted for a period of 40 hours. If those 40 hours were just added to the aging test, then the schedule for periodic removal of specimens would require activity in the middle of the night for the next several months. Consequently, AMEC, Analog Interfaces and the FAA have agreed to a self-imposed, one-week interruption of the test schedule so that all future specimen removal activities can be performed at a reasonable time. FAA personnel will perform the following tasks: 1. Remove the power to Oven No. 3 at 11:51 A.M. on Wednesday, April 7th. 2. Remove the power to Oven No. 2 at 1:21 P.M. on Wednesday, April 7th. Take no action for one week, then 3. Restore the power to Oven No. 3 at 11:30 A.M. on Wednesday, April 14th and monitor
it until the temperature has stabilized at 280°C. Record the time when the temperature has stabilized.
4. Restore the power to Oven No. 2 at 1:00 P.M. on Wednesday, April 14th and monitor it until the temperature has stabilized at 220°C. Record the time when the temperature has stabilized.
The revised schedule for removal of the various specimens is shown on the next page.
A-32

REVISED4
Schedule for Removal of Wires from Ovens at FAA Technical Center
Removal Date (Wednesday)
Aging Period
Oven No. 1 (125°C)
11:35 A.M.
Oven No. 2 (220°C)
1:21 P.M.
Oven No. 3 (280°C)
11:51 A.M. March 3, 2004 6 Weeks PVC A0 #1-5 March 17, 2004 8 Weeks All PVC
All PVC G-N All Mandrels
April 21, 2004 12 Weeks All XL-ETFE (bottom shelf only) Bottom mandrel
May 12, 2004 15 Weeks Polyimide INST A3 #1-5; Polyimide POWER A3 #1-5 M81381/12-10 A15 [top] M81381/12-20 A15 [mid] M81381/12-12 A15 [bot]
Composite TKT A3 #1-5
June 2, 2004 18 Weeks Polyimide INST A6 #1-5; Polyimide POWER A6 #1-5 M81381/12-10 A18 [top] M81381/12-20 A18 [mid] M81381/12-12 A18 [bot]
Composite TKT A6 #1-5
June 23, 2004 21 Weeks Polyimide INST A9 #1-5; Polyimide POWER A9 #1-5 M81381/12-10 A21 [top] M81381/12-20 A21 [mid] M81381/12-12 A21 [bot]
Composite TKT A9 #1-5
July 14, 2004 24 Weeks All remaining wires All mandrels
All remaining All mandrels
4 This revised schedule includes a self-imposed, one-week interruption of the test schedule, lasting from
Wednesday, April 7 to Wednesday, April 14, 2004.
A-33

Earth & Environmental, Inc.
One Plymouth Meeting
Suite 850 Phone: 610-828-8100 Plymouth Meeting, PA 19462-1308 Fax: 610-828-6700 United States of America [email protected] MEMORANDUM To: Files – AMEC Project Number 3-7652-0000 Fm: William M. Denny Date: June 7, 2004 SUBJECT: Revision Number 3 to Test Plan for Aging of Aircraft Wires REF. 1: Email from Cesar Gomez (FAA ) to William M. Denny dated June 3, 2004.
Subject: “Oven No2” Reference 1 stated that Oven No. 2 experienced a technical problem about 1:30 P.M. on Wednesday, June 2, 2004. A fuse blew and the temperature decreased from the operating condition of 220°C to an ambient condition of 36 - 39°C. Attempts to correct the problem were not immediately successful; therefore, the FAA Project Manger decided to remove the remaining wire specimens from Oven No. 2 and place them in Oven No. 1 for the rest of the thermal aging exposure. The transfer was completed and the temperature of Oven No. 1 was stable at 220°C at 10:10 A.M. on Thursday, June 3, The schedule for specimen removal from Oven No. 1 and No. 3 is no longer synchronized because of the transfer of specimens. Therefore, to correct that problem and re-establish a synchronized schedule for specimen removal, the following actions will be taken:
1. Turn Oven No. 3 OFF at 11:51 A.M. on Wednesday, June 23, 2004. Leave the door closed; do not remove any specimens.
2. Turn Oven No. 1 OFF at 10:10 A.M. on Thursday, June 24, 2004. Open door and photograph locations of all specimens. Record information as necessary to ensure correct identification of all specimens for remainder of test. Remove the specimens shown on the attached revised schedule. Close Oven No. 1, turn power ON, wait until temperature has stabilized at 220°C and record time.
3. After action is completed with Oven No. 1, open Oven No. 3 on Thursday, June 24, 2004 and remove the specimens shown on the attached revised schedule. Close Oven, turn power ON, wait until temperature has stabilized at 280°C and record time.
A-34

REVISED SCHEDULE5
Schedule for Removal of Wires from Ovens at FAA Technical Center
Removal Date
(Thursday)
Aging Period
Oven No. 1 (220°C)
10:10 A.M.
Oven No. 2
Oven No. 3 (280°C)
10:10 A.M. June 24, 2004 21 Weeks Polyimide INST A9 #1-2;
Polyimide INST A6 #8-10(loop); Polyimide POWER A9 #1-5 M81381/12-10 A21 M81381/12-20 A21 M81381/12-12 A21
N/a Composite TKT A9 #1-5
July 15, 2004 24 Weeks Polyimide INST A12 #1-2; Polyimide INST A9 #8-10(loop); Polyimide POWER A12 #1-5 M81381/12-10 A24 M81381/12-20 A24 M81381/12-12 A24 Polyimide INST A0 #6 & 7 (Mandrel) Polyimide POWER A0 #6 & 7 (Mandrel)
Composite TKT A12 #1-5 Composite TKT A0 #6 & 7 (mandrel)
5 This revised schedule includes a one-day shift from Wednesday to Thursday for specimen removal, and
relocation to Oven No. 1 of all specimens that had remained in Oven No. 2 after specimen removal was completed on Wednesday, June 2, 2004.
A-35

Comparison of Specimen Locations After Transfer From Oven No. 2 to Oven No. 16 ID Number Original Location New Location - Must Verify Polyimide INST A9 #1 Oven 2 – Middle Shelf Quadrant 3-L Oven 1 – Top Shelf Quadrant 2-L Polyimide INST A9 #2 Oven 2 – Middle Shelf Quadrant 3-L Oven 1 – Top Shelf Quadrant 2-L Polyimide INST A6 #8(loop) Oven 2 – Middle Shelf Quadrant 3-L Oven 1 – Top Shelf Quadrant 2-F Polyimide INST A6 #9(loop) Oven 2 – Middle Shelf Quadrant 3-L Oven 1 – Top Shelf Quadrant 2-F Polyimide INST A6 #10(loop) Oven 2 – Middle Shelf Quadrant 3-L Oven 1 – Top Shelf Quadrant 2-F Polyimide INST A0 #6(Mandrel) Oven 2 – Middle Shelf (underneath) Oven 2 – Bottom Shelf (underneath) Polyimide INST A0 #7(Mandrel) Oven 2 – Middle Shelf (underneath) Oven 2 – Bottom Shelf (underneath) Polyimide POWER A9 #1 Oven 2 – Top Shelf Quadrant 3-L Oven 1 – Top Shelf Quadrant 3 Polyimide POWER A9 #2 Oven 2 – Top Shelf Quadrant 3-L Oven 1 – Top Shelf Quadrant 3 Polyimide POWER A9 #3 Oven 2 – Top Shelf Quadrant 3-L Oven 1 – Top Shelf Quadrant 3 Polyimide POWER A9 #4 Oven 2 – Top Shelf Quadrant 3-L Oven 1 – Top Shelf Quadrant 3 Polyimide POWER A9 #5 Oven 2 – Top Shelf Quadrant 3-L Oven 1 – Top Shelf Quadrant 3 Polyimide POWER A0 #6(Mandrel) Oven 2 – Top Shelf (underneath) Oven 1 – Top Shelf (underneath) Polyimide POWER A0 #7(Mandrel) Oven 2 – Top Shelf (underneath) Oven 1 – Top Shelf (underneath) M81381/12-10 A21 Oven 2 – Top Shelf Quadrant 3-R Oven 1 – Top Shelf Quadrant 1-R M81381/12-10 A21 Oven 2 – Top Shelf Quadrant 3-R Oven 1 – Top Shelf Quadrant 1-R M81381/12-10 A21 Oven 2 – Top Shelf Quadrant 3-R Oven 1 – Top Shelf Quadrant 1-R M81381/12-10 A21 Oven 2 – Top Shelf Quadrant 3-R Oven 1 – Top Shelf Quadrant 1-R M81381/12-10 A21 Oven 2 – Top Shelf Quadrant 3-R Oven 1 – Top Shelf Quadrant 1-R M81381/12-20 A21 Oven 2 – Middle Shelf Quadrant 3-R Oven 1 – Top Shelf Quadrant 2-R M81381/12-20 A21 Oven 2 – Middle Shelf Quadrant 3-R Oven 1 – Top Shelf Quadrant 2-R M81381/12-20 A21 Oven 2 – Middle Shelf Quadrant 3-R Oven 1 – Top Shelf Quadrant 2-R M81381/12-20 A21 Oven 2 – Middle Shelf Quadrant 3-R Oven 1 – Top Shelf Quadrant 2-R M81381/12-20 A21 Oven 2 – Middle Shelf Quadrant 3-R Oven 1 – Top Shelf Quadrant 2-R M81381/12-12 A21 Oven 2 – Bottom Shelf Quadrant 3-R Oven 1 – Top Shelf Quadrant 1-L M81381/12-12 A21 Oven 2 – Bottom Shelf Quadrant 3-R Oven 1 – Top Shelf Quadrant 1-L M81381/12-12 A21 Oven 2 – Bottom Shelf Quadrant 3-R Oven 1 – Top Shelf Quadrant 1-L M81381/12-12 A21 Oven 2 – Bottom Shelf Quadrant 3-R Oven 1 – Top Shelf Quadrant 1-L M81381/12-12 A21 Oven 2 – Bottom Shelf Quadrant 3-R Oven 1 – Top Shelf Quadrant 1-L Polyimide INST A12 #1 Oven 2 – Middle Shelf Quadrant 4-L Oven 1 – Bottom Shelf Quadrant 2-L Polyimide INST A12 #2 Oven 2 – Middle Shelf Quadrant 4-L Oven 1 – Bottom Shelf Quadrant 2-L Polyimide INST A9 #8(loop) Oven 2 – Middle Shelf Quadrant 4-L Oven 1 – Bottom Shelf Quadrant 2-F Polyimide INST A9 #9(loop) Oven 2 – Middle Shelf Quadrant 4-L Oven 1 – Bottom Shelf Quadrant 2-F Polyimide INST A9 #10(loop) Oven 2 – Middle Shelf Quadrant 4-L Oven 1 – Bottom Shelf Quadrant 2-F Polyimide POWER A12 #1 Oven 2 – Top Shelf Quadrant 4-L Oven 1 – Bottom Shelf Quadrant 3 Polyimide POWER A12 #2 Oven 2 – Top Shelf Quadrant 4-L Oven 1 – Bottom Shelf Quadrant 3 Polyimide POWER A12 #3 Oven 2 – Top Shelf Quadrant 4-L Oven 1 – Bottom Shelf Quadrant 3 Polyimide POWER A12 #4 Oven 2 – Top Shelf Quadrant 4-L Oven 1 – Bottom Shelf Quadrant 3 Polyimide POWER A12 #5 Oven 2 – Top Shelf Quadrant 4-L Oven 1 – Bottom Shelf Quadrant 3
6 The new locations must be verified visually and photographed before removal of any additional specimens.
A-36

ID Number Original Location New Location - Must Verify M81381/12-10 A24 Oven 2 – Top Shelf Quadrant 4-R Oven 1 – Bottom Shelf Quadrant 1-R M81381/12-10 A24 Oven 2 – Top Shelf Quadrant 4-R Oven 1 – Bottom Shelf Quadrant 1-R M81381/12-10 A24 Oven 2 – Top Shelf Quadrant 4-R Oven 1 – Bottom Shelf Quadrant 1-R M81381/12-10 A24 Oven 2 – Top Shelf Quadrant 4-R Oven 1 – Bottom Shelf Quadrant 1-R M81381/12-10 A24 Oven 2 – Top Shelf Quadrant 4-R Oven 1 – Bottom Shelf Quadrant 1-R M81381/12-20 A24 Oven 2 – Middle Shelf Quadrant 4-R Oven 1 – Bottom Shelf Quadrant 2-R M81381/12-20 A24 Oven 2 – Middle Shelf Quadrant 4-R Oven 1 – Bottom Shelf Quadrant 2-R M81381/12-20 A24 Oven 2 – Middle Shelf Quadrant 4-R Oven 1 – Bottom Shelf Quadrant 2-R M81381/12-20 A24 Oven 2 – Middle Shelf Quadrant 4-R Oven 1 – Bottom Shelf Quadrant 2-R M81381/12-20 A24 Oven 2 – Middle Shelf Quadrant 4-R Oven 1 – Bottom Shelf Quadrant 2-R M81381/12-12 A24 Oven 2 – Bottom Shelf Quadrant 4-R Oven 1 – Bottom Shelf Quadrant 1-L M81381/12-12 A24 Oven 2 – Bottom Shelf Quadrant 4-R Oven 1 – Bottom Shelf Quadrant 1-L M81381/12-12 A24 Oven 2 – Bottom Shelf Quadrant 4-R Oven 1 – Bottom Shelf Quadrant 1-L M81381/12-12 A24 Oven 2 – Bottom Shelf Quadrant 4-R Oven 1 – Bottom Shelf Quadrant 1-L M81381/12-12 A24 Oven 2 – Bottom Shelf Quadrant 4-R Oven 1 – Bottom Shelf Quadrant 1-L
A-37/A-38

APPENDIX B—ELONGATION-AT-BREAK TESTING AMEC TEST SPECIFICATION PTLI TEST RESULTS
AMEC Earth & Environmental, Inc. Test Specification Number 3-7652-0000
PTLI Quote # Q20050011 – Wire Testing
ELONGATION-AT-BREAK (EAB) TESTING The tensile Elongation-at-Break tests shall be performed in general accordance with the guidance provided in ASTM Standard D 638 (Plastics). The "Conditioning" described in Section 7 of ASTM D 638 is not required. Specific requirements for the EAB tests consist of the following:
• Specimens shall be tested at room temperature (68°F to 82°F). • Elongation shall be measured between gage marks that are two (2) inches apart initially. • Specimens shall be placed in the jaws of the testing machine with a maximum distance
between the jaws of four (4) inches and a minimum distance of three (3) inches. • The speed of testing shall be 20 inches (500 mm) per minute. • An Extension Indicator (extensometer) that meets the requirements of Section 5.2 of
ASTM D 638 should be used to measure the elongation that occurs. • The tests are to be performed in the sequence shown on page 2 of this Specification.
Prepare the test specimens as follows:
• Remove a specimen from the labeled plastic bag. • Cut a 6-inch piece of wire from one end of the specimen. • Remove a one-inch length of insulation at each end using a standard wire stripper tool. • Place the one-inch bare metal conductor ends in the Instron jaws and stretch the metal
conductor until it breaks. • Remove the test specimen from the jaws. • Remove the stretched metal conductor from inside the insulation “tube” (gentle rolling of
the specimen back and forth between your palms will loosen the metal conductor from the insulation).
Perform the EAB Tests in general accordance with Section 10 of ASTM D 638:
• Place the insulation “tube” in the jaws. The distance between the jaws shall be a
maximum of four (4) inches. • Attach the extensometer (initial gage length of two inches), centered between the jaws. • Set the speed of testing to 20 inches (500 mm) per minute. • Perform the EAB test and record appropriate data. • Put all tested specimen pieces back into the labeled plastic bag and seal it. • At the conclusion of EAB testing, return all specimens to AMEC.
B-1

SEQUENCE OF ELONGATION-AT-BREAK (EAB) TESTS 1. MIL-W-16878E/1 A0#1 2. MIL-W-16878E/1 A0#2 3. MIL-W-16878E/1 A0#3 4. MIL-W-16878E/1 A0#4 5. MIL-W-16878E/1 A0#5 6. PVC A0 #1 7. PVC A0 #2 8. PVC A0 #3 9. PVC A0 #4 10. PVC A0 #5 11. PVC A2 #1 12. PVC A2 #2 13. PVC A2 #3 14. PVC A2 #4 15. PVC A2 #5 16. PVC A4 #1 17. PVC A4 #2 18. PVC A4 #3 19. PVC A4 #4 29. PVC A4 #5 21. PVC A6 #1 22. PVC A6 #2 23. PVC A6 #3 24. PVC A6 #4 25. PVC A6 #5 26. PVC A8 #1 27. PVC A8 #2 28. PVC A8 #3 29. PVC A8 #4 30. PVC A8 #5 31. BMS13-48T10C01G020 A0#1 32. BMS13-48T10C01G020 A0#2 33. BMS13-48T10C01G020 A0#3 34. BMS13-48T10C01G020 A0#4 35. BMS13-48T10C01G020 A0#5 36. XL-ETFE A3 #1 37. XL-ETFE A3 #2 38. XL-ETFE A3 #3 39. XL-ETFE A3 #4 40. XL-ETFE A3 #5 41. XL-ETFE A6 #1 42. XL-ETFE A6 #2
43. XL-ETFE A6 #3 44. XL-ETFE A6 #4 45. XL-ETFE A6 #5 46. XL-ETFE A9 #1 47. XL-ETFE A9 #2 48. XL-ETFE A9 #3 49. XL-ETFE A9 #4 50. XL-ETFE A9 #5 51. XL-ETFE A12 #1 52. XL-ETFE A12 #2 53. XL-ETFE A12 #3 54. XL-ETFE A12 #4 55. XL-ETFE A12 #5 56. COMPOSITE TKT A3 #1 57. COMPOSITE TKT A3 #2 58. COMPOSITE TKT A3 #3 59. COMPOSITE TKT A3 #4 60. COMPOSITE TKT A3 #5 61. COMPOSITE TKT A6 #1 62. COMPOSITE TKT A6 #2 63. COMPOSITE TKT A6 #3 64. COMPOSITE TKT A6 #4 65. COMPOSITE TKT A6 #5 66. COMPOSITE TKT A9 #1 67. COMPOSITE TKT A9 #2 68. COMPOSITE TKT A9 #3 69. COMPOSITE TKT A9 #4 70. COMPOSITE TKT A9 #5 71. COMPOSITE TKT A12 #1 72. COMPOSITE TKT A12 #2 73. COMPOSITE TKT A12 #3 74. COMPOSITE TKT A12 #4 75. COMPOSITE TKT A12 #5
B-2

B-3

B-4

B-5

B-6

APPENDIX C—AGING SCHEDULE FOR ALL WIRES USED IN PROJECT
WIRES USED IN FAA PROJECT DTFA03-03-C-00027
Identification Number
Aging Time
(Weeks)
AgingTemp(°C)
PreviousAging
(Weeks)
Total Aging
(Weeks)
Notes Composite TKT A0 #6 24 280 0 24 Mandrel & Indented Composite TKT A0 #7 24 280 0 24 Mandrel; not IndentedComposite TKT A3 #1 15 280 3 18 EAB Composite TKT A3 #2 15 280 3 18 EAB Composite TKT A3 #3 15 280 3 18 EAB Composite TKT A3 #4 15 280 3 18 EAB Composite TKT A3 #5 15 280 3 18 EAB Composite TKT A6 #1 18 280 6 24 EAB Composite TKT A6 #2 18 280 6 24 EAB Composite TKT A6 #3 18 280 6 24 EAB Composite TKT A6 #4 18 280 6 24 EAB Composite TKT A6 #5 18 280 6 24 EAB Composite TKT A9 #1 21 280 9 30 EAB Composite TKT A9 #2 21 280 9 30 EAB Composite TKT A9 #3 21 280 9 30 EAB Composite TKT A9 #4 21 280 9 30 EAB Composite TKT A9 #5 21 280 9 30 EAB Composite TKT A12 #1 24 280 12 36 EAB Composite TKT A12 #2 24 280 12 36 EAB Composite TKT A12 #3 24 280 12 36 EAB Composite TKT A12 #4 24 280 12 36 EAB Composite TKT A12 #5 24 280 12 36 EAB M81381/12-10 A15 15 220 0 15 Ratio Test M81381/12-10 A15 15 220 0 15 Ratio Test M81381/12-10 A15 15 220 0 15 Ratio Test M81381/12-10 A15 15 220 0 15 Ratio Test M81381/12-10 A15 15 220 0 15 Ratio Test M81381/12-10 A18 18 220 0 18 Ratio Test M81381/12-10 A18 18 220 0 18 Ratio Test M81381/12-10 A18 18 220 0 18 Ratio Test M81381/12-10 A18 18 220 0 18 Ratio Test M81381/12-10 A18 18 220 0 18 Ratio Test M81381/12-10 A21 21 220 0 21 Ratio Test M81381/12-10 A21 21 220 0 21 Ratio Test M81381/12-10 A21 21 220 0 21 Ratio Test M81381/12-10 A21 21 220 0 21 Ratio Test
C-1

Identification
Number
Aging Time
(Weeks)
AgingTemp(°C)
PreviousAging
(Weeks)
Total Aging
(Weeks)
Notes M81381/12-10 A21 21 220 0 21 Ratio Test M81381/12-10 A24 24 220 0 24 Ratio Test M81381/12-10 A24 24 220 0 24 Ratio Test M81381/12-10 A24 24 220 0 24 Ratio Test M81381/12-10 A24 24 220 0 24 Ratio Test M81381/12-10 A24 24 220 0 24 Ratio Test M81381/12-12 A15 15 220 0 15 Ratio Test M81381/12-12 A15 15 220 0 15 Ratio Test M81381/12-12 A15 15 220 0 15 Ratio Test M81381/12-12 A15 15 220 0 15 Ratio Test M81381/12-12 A15 15 220 0 15 Ratio Test M81381/12-12 A18 18 220 0 18 Ratio Test M81381/12-12 A18 18 220 0 18 Ratio Test M81381/12-12 A18 18 220 0 18 Ratio Test M81381/12-12 A18 18 220 0 18 Ratio Test M81381/12-12 A18 18 220 0 18 Ratio Test M81381/12-12 A21 21 220 0 21 Ratio Test M81381/12-12 A21 21 220 0 21 Ratio Test M81381/12-12 A21 21 220 0 21 Ratio Test M81381/12-12 A21 21 220 0 21 Ratio Test M81381/12-12 A21 21 220 0 21 Ratio Test M81381/12-12 A24 24 220 0 21 Ratio Test M81381/12-12 A24 24 220 0 24 Ratio Test M81381/12-12 A24 24 220 0 24 Ratio Test M81381/12-12 A24 24 220 0 24 Ratio Test M81381/12-12 A24 24 220 0 24 Ratio Test M81381/12-20 A15 15 220 0 15 Ratio Test M81381/12-20 A15 15 220 0 15 Ratio Test M81381/12-20 A15 15 220 0 15 Ratio Test M81381/12-20 A15 15 220 0 15 Ratio Test M81381/12-20 A15 15 220 0 15 Ratio Test M81381/12-20 A18 18 220 0 18 Ratio Test M81381/12-20 A18 18 220 0 18 Ratio Test M81381/12-20 A18 18 220 0 18 Ratio Test M81381/12-20 A18 18 220 0 18 Ratio Test M81381/12-20 A18 18 220 0 18 Ratio Test M81381/12-20 A21 21 220 0 21 Ratio Test M81381/12-20 A21 21 220 0 21 Ratio Test M81381/12-20 A21 21 220 0 21 Ratio Test
C-2

Identification
Number
Aging Time
(Weeks)
AgingTemp(°C)
PreviousAging
(Weeks)
Total Aging
(Weeks)
Notes M81381/12-20 A21 21 220 0 21 Ratio Test M81381/12-20 A21 21 220 0 21 Ratio Test M81381/12-20 A24 24 220 0 24 Ratio Test M81381/12-20 A24 24 220 0 24 Ratio Test M81381/12-20 A24 24 220 0 24 Ratio Test M81381/12-20 A24 24 220 0 24 Ratio Test M81381/12-20 A24 24 220 0 24 Ratio Test Polyimide INST A0 #6 24 220 0 24 Mandrel & Indented Polyimide INST A0 #7 24 220 0 24 Mandrel; not IndentedPolyimide INST A3 #1 15 220 3 18 Polyimide INST A3 #2 15 220 3 18 Polyimide INST A3 #3 0 220 3 3 Deleted from Aging Polyimide INST A3 #4 0 220 3 3 Deleted from Aging Polyimide INST A3 #5 0 220 3 3 Deleted from Aging Polyimide INST A3 #8 15 220 3 18 Aging Substitute Polyimide INST A3 #9 15 220 3 18 Aging Substitute Polyimide INST A3 #10 15 220 3 18 Aging Substitute Polyimide INST A6 #1 18 220 6 24 Polyimide INST A6 #2 18 220 6 24 Polyimide INST A6 #3 0 220 6 6 Deleted from Aging Polyimide INST A6 #4 0 220 6 6 Deleted from Aging Polyimide INST A6 #5 0 220 6 6 Deleted from Aging Polyimide INST A6 #8 18 220 6 24 Aging Substitute Polyimide INST A6 #9 18 220 6 24 Aging Substitute Polyimide INST A6 #10 18 220 6 24 Aging Substitute Polyimide INST A9 #1 21 220 9 30 Polyimide INST A9 #2 21 220 9 30 Polyimide INST A9 #3 0 220 9 9 Deleted from Aging Polyimide INST A9 #4 0 220 9 9 Deleted from Aging Polyimide INST A9 #5 0 220 9 9 Deleted from Aging Polyimide INST A9 #8 21 220 9 30 Aging Substitute Polyimide INST A9 #9 21 220 9 30 Aging Substitute Polyimide INST A9 #10 21 220 9 30 Aging Substitute Polyimide INST A12 #1 24 220 12 36 Polyimide INST A12 #2 24 220 12 36 Polyimide INST A12 #3 0 220 12 12 Deleted from Aging Polyimide INST A12 #4 0 220 12 12 Deleted from Aging Polyimide INST A12 #5 0 220 12 12 Deleted from Aging Polyimide Power A0 #6 24 220 0 24 Mandrel & Indented
C-3

Identification
Number
Aging Time
(Weeks)
AgingTemp(°C)
PreviousAging
(Weeks)
Total Aging
(Weeks)
Notes Polyimide Power A0 #7 24 220 0 24 Mandrel; not IndentedPolyimide Power A3 #1 15 220 3 18 Polyimide Power A3 #2 15 220 3 18 Polyimide Power A3 #3 15 220 3 18 Polyimide Power A3 #4 15 220 3 18 Polyimide Power A3 #5 15 220 3 18 Polyimide Power A6 #1 18 220 6 24 Polyimide Power A6 #2 18 220 6 24 Polyimide Power A6 #3 18 220 6 24 Polyimide Power A6 #4 18 220 6 24 Polyimide Power A6 #5 18 220 6 24 Polyimide Power A9 #1 21 220 9 30 Polyimide Power A9 #2 21 220 9 30 Polyimide Power A9 #3 21 220 9 30 Polyimide Power A9 #4 21 220 9 30 Polyimide Power A9 #5 21 220 9 30 Polyimide Power A12 #1 24 220 12 36 Polyimide Power A12 #2 24 220 12 36 Polyimide Power A12 #3 24 220 12 36 Polyimide Power A12 #4 24 220 12 36 Polyimide Power A12 #5 24 220 12 36 PVC A0 #1 6 125 0 6 EAB PVC A0 #2 6 125 0 6 EAB PVC A0 #3 6 125 0 6 EAB PVC A0 #4 6 125 0 6 EAB PVC A0 #5 6 125 0 6 EAB PVC A0 #6 8 125 0 8 Mandrel & Indented PVC A0 #7 8 125 0 8 Mandrel; not IndentedPVC A2 #1 8 125 2 10 EAB PVC A2 #2 8 125 2 10 EAB PVC A2 #3 8 125 2 10 EAB PVC A2 #4 8 125 2 10 EAB PVC A2 #5 8 125 2 10 EAB PVC A4 #1 8 125 4 12 EAB PVC A4 #2 8 125 4 12 EAB PVC A4 #3 8 125 4 12 EAB PVC A4 #4 8 125 4 12 EAB PVC A4 #5 8 125 4 12 EAB PVC A6 #1 8 125 6 14 EAB PVC A6 #2 8 125 6 14 EAB
C-4

Identification
Number
Aging Time
(Weeks)
AgingTemp(°C)
PreviousAging
(Weeks)
Total Aging
(Weeks)
Notes PVC A6 #3 8 125 6 14 EAB PVC A6 #4 8 125 6 14 EAB PVC A6 #5 8 125 6 14 EAB PVC A8 #1 8 125 8 16 EAB PVC A8 #2 8 125 8 16 EAB PVC A8 #3 8 125 8 16 EAB PVC A8 #4 8 125 8 16 EAB PVC A8 #5 8 125 8 16 EAB PVC G-N A0 #1 8 125 0 8 PVC G-N A0 #2 8 125 0 8 PVC G-N A0 #3 8 125 0 8 PVC G-N A0 #4 8 125 0 8 PVC G-N A0 #5 8 125 0 8 PVC G-N A0 #6 8 125 0 8 Mandrel & Indented PVC G-N A0 #7 8 125 0 8 Mandrel; not IndentedPVC G-N A2 #1 8 125 2 10 PVC G-N A2 #2 8 125 2 10 PVC G-N A2 #3 8 125 2 10 PVC G-N A2 #4 8 125 2 10 PVC G-N A2 #5 8 125 2 10 PVC G-N A4 #1 8 125 4 12 PVC G-N A4 #2 8 125 4 12 PVC G-N A4 #3 8 125 4 12 PVC G-N A4 #4 8 125 4 12 PVC G-N A4 #5 8 125 4 12 PVC G-N A6 #1 8 125 6 14 PVC G-N A6 #2 8 125 6 14 PVC G-N A6 #3 8 125 6 14 PVC G-N A6 #4 8 125 6 14 PVC G-N A6 #5 8 125 6 14 PVC G-N A8 #1 8 125 8 16 PVC G-N A8 #2 8 125 8 16 PVC G-N A8 #3 8 125 8 16 PVC G-N A8 #4 8 125 8 16 PVC G-N A8 #5 8 125 8 16 XL-ETFE A0 #6 12 220 0 12 Mandrel & Indented XL-ETFE A0 #7 12 220 0 12 Mandrel; not IndentedXL-ETFE A3 #1 12 220 3 15 EAB XL-ETFE A3 #2 12 220 3 15 EAB
C-5

Identification
Number
Aging Time
(Weeks)
AgingTemp(°C)
PreviousAging
(Weeks)
Total Aging
(Weeks)
Notes XL-ETFE A3 #3 12 220 3 15 EAB XL-ETFE A3 #4 12 220 3 15 EAB XL-ETFE A3 #5 12 220 3 15 EAB XL-ETFE A6 #1 12 220 6 18 EAB XL-ETFE A6 #2 12 220 6 18 EAB XL-ETFE A6 #3 12 220 6 18 EAB XL-ETFE A6 #4 12 220 6 18 EAB XL-ETFE A6 #5 12 220 6 18 EAB XL-ETFE A9 #1 12 220 9 21 EAB XL-ETFE A9 #2 12 220 9 21 EAB XL-ETFE A9 #3 12 220 9 21 EAB XL-ETFE A9 #4 12 220 9 21 EAB XL-ETFE A9 #5 12 220 9 21 EAB XL-ETFE A12 #1 12 220 12 24 EAB XL-ETFE A12 #2 12 220 12 24 EAB XL-ETFE A12 #3 12 220 12 24 EAB XL-ETFE A12 #4 12 220 12 24 EAB XL-ETFE A12 #5 12 220 12 24 EAB
C-6

APPENDIX D—A DISCUSSION OF LVDT AND MODULUS
LVDT AND MODULUS DISCUSSION Before discussing the work with the LVDT, it is important to establish some reference points regarding the relationship of modulus values and the resolution of the LVDT required to report them accurately. The modulus has traditionally been calculated as the slope of the cross plot of force vs. deformation. The method presently being used uses two points on this cross plot curve to calculate the slope (modulus) as follows: M(odulus) = ∆F / ∆X F = force in lbs X = deformation in inches These two points are at 75% and 25% of maximum force. The test parameters have been set for maximum force of 2 lbs. (that is, the point at which the probe stops moving into the insulation and holds at that force value while additional (relaxation) data is taken). Thus, the 75% and 25% points (based on 2 lbs) are at 1.5 lbs. and 0.5 lbs. Therefore, ∆F = 1.5 lbs. – 0.5 lbs. or 1.0 lbs. Measuring ∆X is where the difficulty arises due to the very small deformations that need to be measured. Previous Indenter work was in the following areas:
• Focused on the nuclear industry • Used to test wires of much larger diameters than aircraft wires (0.5” and up compared to
0.020” for typical aircraft wires.) • Involved in the types of materials and constructions that produced deformations
measured in the 0.01” to 0.1” range with corresponding modulus values in the 100 – 500 range as opposed to aircraft wire deformations in the 0.0005” range and modulus readings exceeding 2000.
The method of calculating the amount of deformation of the probe tip as it was moved into the insulation was by use of an encoder on the motor driving the probe tip. The encoder recorded turns of the motor and used a conversion number to translate that into the number of inches moved. This worked fine in the case of the types of wires being tested in the nuclear version where the insulations were much softer and thicker. It was found that when testing harder wires, the encoder method overstated the amount of deformation because of tolerances in the drive train parts between the encoder and the probe tip. That is, some of the movement being reported by
D-1

the encoder was not direct probe tip movement but was movement taking up the “slack” in the train of parts between the probe tip and the encoder. What was needed was a way to find out what distance the probe tip actually moves during a given test. A variety of methods were investigated to provide better deformation measurements within the confines of a portable instrument. The method selected was to incorporate an LVDT. An LVDT is a device where a cylindrical magnetic rod (core) moves inside a cylinder with wire windings that gives an electrical signal that is proportional to the position of the core within the cylinder. TABLE A illustrates the relationship between modulus values and the corresponding deformations. As explained above, the ∆F remains fixed at one in the Indenter configuration. Thus the only variable in calculating the modulus is ∆X. ∆X values are shown for modulus examples from 100 to 3500 – which covers the range of values seen in testing. For example, a ∆X of 0.01” gives a modulus of 100 and a ∆X of 0.00029” gives a modulus of 3500. Thus, when you’re trying to measure materials where the modulus value is in the 3000 range, you have to be able to measure accurately in the range of 0.0001” (or 0.1 of a mil). The accuracy of the LVDT is in the range of 0.0003” to 0.0005”. Column (4) below shows the effect of changing the ∆X by 0.0001”. The former modulus of 100 now becomes 99 (Column 5) for a 1% change (Column 6). However, the same amount of change to the ∆X for the 3500 modulus changes it to 2564 or a 26.7% change. Thus, if the LVDT is only accurate to 0.0003” to 0.0004”, it can be seen that the modulus values can change significantly with very small changes in the deformation. Table B shows the effect on modulus values and % error if it was possible to measure to a resolution of 1 micron (0.00004”). With this example, modulus values up to 2500 would be accurate to within 10%.
D-2

APPENDIX D - TABLE A
(1) (2) (3) (4) (5) (6) (7)
Original Change of New New Modulus Delta F Delta X Modulus .0001 in Modulus Minus %error Lbs. Inches Delta X Original
1 0.01000 100 0.01010 99 1 1.0% 1 0.00200 500 0.00210 476 24 4.8% 1 0.00100 1000 0.00110 909 91 9.1% 1 0.00067 1500 0.00077 1299 201 13.4% 1 0.00050 2000 0.00060 1667 333 16.7% 1 0.00040 2500 0.00050 2000 500 20.0% 1 0.00033 3000 0.00043 2326 674 22.5% 1 0.00029 3500 0.00039 2564 936 26.7%
APPENDIX D - TABLE B
(8) (9) (10) (11) Change of New Modulus New Modulus
0.00004” Minus Original % error In Delta X
0.01004 100 0 0.4% 0.00204 490 10 2.0% 0.00104 962 38 3.8% 0.00071 1415 85 5.7% 0.00054 1852 148 7.4% 0.00044 2273 227 9.1% 0.00037 2679 321 10.7% 0.00033 3070 430 12.3%
D-3/D-4

APPENDIX E—NORTHWESTERN UNIVERSITY MEMO ON INDENTATION AND IMPEDANCE SPECTROSCOPY TESTING
Summary
As the polymeric insulation material on wiring ages (physical, thermal, chemical aging), the electrical insulation properties and the mechanical properties of the insulation change. Our recent work has focused on 1) understanding changes in mechanical properties of the insulation which can be probed by the Indenter Phase 1 indentation device and developing contact mechanics models to characterize the degree of aging based on modulus and relaxation data and 2) correlating change in mechanical properties from Indenter Phase 1 or other mechanical property tests with change in electrical characteristics via Impedance Spectroscopy (IS).
Indentation Studies
Analog Interfaces Inc. (AI) created Indenter Phase 1 wiring insulation indenter to monitor changes in mechanical properties of insulation. By probing the changes in the mechanical properties with a simple Indenter Phase 1 device, the aged state of the wire can be ascertained. Tests on PVC wire insulation have been performed at Northwestern University. The conducting core was removed from the wire and the insulation then subjected to tensile testing in the RSAIII DMA and the Minimat 2000 tensile test machine. The modulus based on several tests has been found to be in the range of 144±0.11 MPa. Collaborative work at NU has developed contact mechanics expressions to extract the modulus of the insulation from the Indenter Phase 1 data using simplified contact models. In the model, the geometry is approximated as a flat insulation layer with properties and thickness identical to those of the insulation jacket. This flat layer is supported on the bottom by a rigid substrate (representing the metal wire core) and pressed by a spherical tip. Then the contact area is similar to physical situation where the Indenter Phase 1 indenter has a cylindrical tip with the axis of the cylindrical portion of the tip perpendicular to the wire axis (“crossed cylinders”). This model predicts a wire response that is consistent with the actual experimental result described above. Collaborative ongoing work at NU/UL is: 1) developing finite element (FE) models to verify the simple analytical approaches and the data from the Indenter Phase 1 and 2) performing calibration indentation tests with precision laboratory settings to compare to Indenter Phase 1 data and to models.
FE ModelIPAM3 device Spherical Contact Model
E-1

spectroscopy/aging
Impedance spectroscopy (IS) consists of applying an alternating voltage and sweeping a frequency range. The current response of the sample is measured and then the resulting real and imaginary impedance can be used in a number of ways to describe the electrical characteristics of the polymer. In this manner, we can determine the sensitivity of IS to detecting changes in the polymeric material’s insulating capabilities due to a variety of environmental conditions. Both a liquid cell set up and dry cell set up were used for the IS experiments.
PVC Electrodes
Dry set up Liquid cell set up Results from more traditional dry set up reflect the inherent dielectric response of the
polymer. However, the dry set-up also suffers from difficulties with imperfect contacts. In most cases, the liquid cell set up was used, where perfect electrical contact was always obtained, however the resulting data reflects the ionic conductivity of the polymer as opposed to the polymer dielectric response directly. As ionic conductivity also changes as a function of material type, temperature and aging, the liquid cell still provides information on the polymer state. Chemical aging (CA) was performed on controlled PVC films as well as PVC wire insulation provided by AI. In addition to CA on the wires, the wires were thermally aged (TA) at 125º C for several weeks. For controlled PVC films, the results showed that conductivity increased and modulus and strength decreased with chemical aging due to polymer degradation. For PVC wire samples, resistance (Z’) increases with chemical aging time due to loss of plasticizer from the polymer. For thermal aging, resistance also increases initially, however, after 10 weeks of TA, resistance dropped dramatically due to microcracking in the insulation layer.
Cracks found after 10 week’s thermal aging
IS
mm E-2

APPENDIX F—MODULUS DISCUSSION
Contact Mechanics Model
According to a classical contact mechanics model, the material modulus E of an elastic layer being indented by a cylindrical indenter may be expressed as
( )Lr
tFE
i23
21
25
2
2
13
δ
ν−= , (1)
where F is the force applied to the cylindrical tip, ν is the Poisson’s ratio, t is the thickness of the insulation, ri is the radius of the cylindrical tip, δ is deformation of the insulation, and L is the length of the cylindrical tip.
Two test data, which is from PVC testing with cylindrical tip at age level A0, are put into
equation (1) to calculate the modulus value. For each pair of force and deformation, we have a modulus value and the average results E(Avg.) are listed in Table 1. In Table 1, EAI is the modulus given by AI method (the modulus value is calculated as the slope of the line between two points). Actually, to calculate E, the force per length is used in equation (1). For comparison, the EAI divided by the length of the cylindrical tip L is listed in the column 3 of Table 1. In that way, AI method is modified by using force per length. Columns 3 and 4 of Table 1 show that the modulus value from two methods is within the same magnitude range. However, Frequency Sweep Tests with our DMA for a commercial PVC show that E=4.23x10⁷ Pa at 25°C with ω=1Hz. Therefore, the modulus value from equation (1) is closer to the test results. For further comparison, we would do some testing with our DMA for both indention as well as straight tensile tests of the insulation material itself.
Table 1: Comparison of EAI and E from the force-deformation data of PVC testing with cylindrical tip at age level A0
TEST EAI
Lbs./Inch EAI /L
Lbs./Inch2 E(Avg.)
Lbs./Inch2 E(Avg.)
Pa 1 473 4730 7440 5.13 x10⁷ 2 449 4490 6950 4.79 x10⁷
Average 461 4610 7195 4.96x10⁷
Recall that the motivation to develop a more accurate expression as equation (1) is to have a proper measure of material modulus that is independent of geometry (wire radius, the insulation thickness, indenter radius, etc). Using equation (1), we can demonstrate the importance of a proper modulus measure. As an illustration, we consider how thickness changes affect the accuracy of the modulus using AI method. First, we may rewrite equation (1) as
F-1
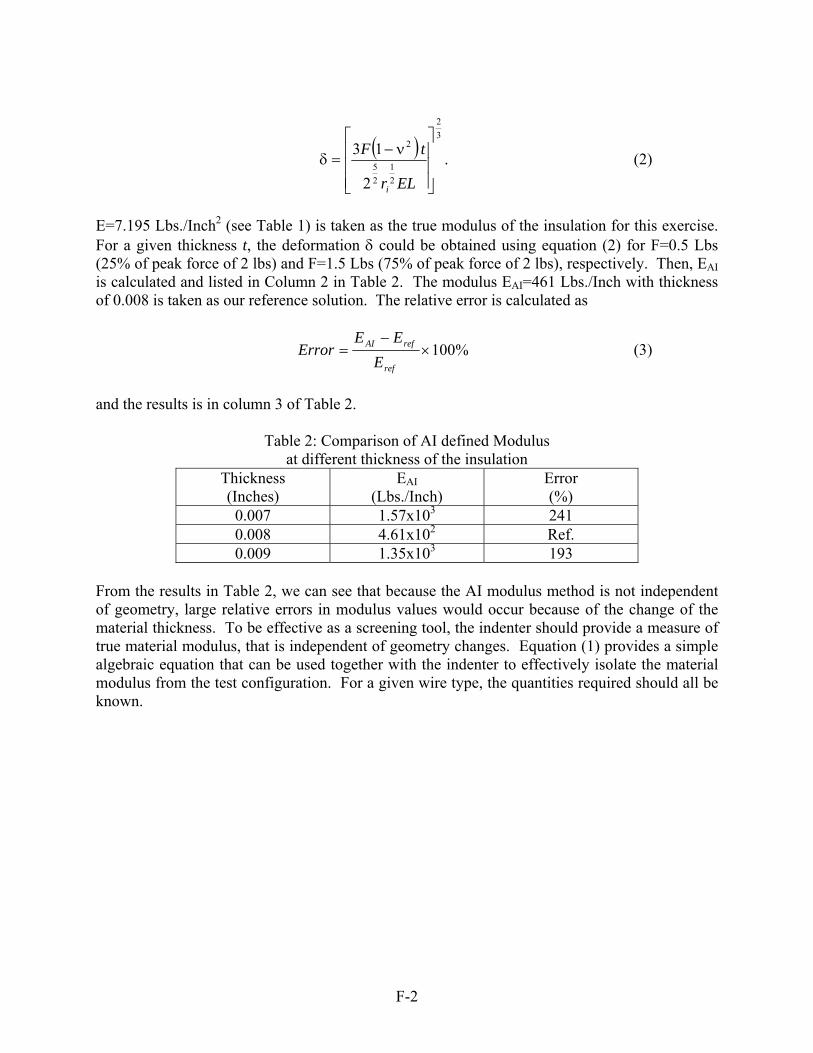
( )32
21
25
2
2
13
⎥⎥⎥
⎦
⎤
⎢⎢⎢
⎣
⎡ν−
=δELr
tF
i
. (2)
E=7.195 Lbs./Inch2 (see Table 1) is taken as the true modulus of the insulation for this exercise. For a given thickness t, the deformation δ could be obtained using equation (2) for F=0.5 Lbs (25% of peak force of 2 lbs) and F=1.5 Lbs (75% of peak force of 2 lbs), respectively. Then, EAI is calculated and listed in Column 2 in Table 2. The modulus EAI=461 Lbs./Inch with thickness of 0.008 is taken as our reference solution. The relative error is calculated as
%100×−
=ref
refAI
EEE
Error (3)
and the results is in column 3 of Table 2.
Table 2: Comparison of AI defined Modulus at different thickness of the insulation
Thickness (Inches)
EAI (Lbs./Inch)
Error (%)
0.007 1.57x10³ 241 0.008 4.61x10² Ref. 0.009 1.35x10³ 193
From the results in Table 2, we can see that because the AI modulus method is not independent of geometry, large relative errors in modulus values would occur because of the change of the material thickness. To be effective as a screening tool, the indenter should provide a measure of true material modulus, that is independent of geometry changes. Equation (1) provides a simple algebraic equation that can be used together with the indenter to effectively isolate the material modulus from the test configuration. For a given wire type, the quantities required should all be known.
F-2

Contact Mechanics Model (Part II) We did tension tests on our DMA (see Figure 1) with the hollow insulation (PVC) by pulling out the stranded conductor of the wire. The results show that E=1.00x10⁸ Pa. Also, the hollow insulation sample was tested on our MiniMat shown in Figure 2 with result of E=1.32x10⁸ Pa. Furthermore, flat film samples were made from the hollow insulation and were tested on our MiniMat shown in Figure 3. The results show that the modulus is 1.48x10⁸ Pa with the force among the range of 0~133 g and strain of 0~0.4%. To compare with our test results, part of the experimental data from AI was taken with Force among 0~0.50 Lbs (0~227 g) and calculated the modulus using our formula. The results were listed in Table 1. We can see from Table 1 that the modulus E coming from our formula is very close to the test results. For further comparison, we would do some indentation testing with Nanoindenter for both the insulation material and the wire.
050000
100000150000200000250000300000350000400000450000500000
0 0.1 0.2 0.3 0.4 0.5
Strain (%)
Stre
ss (P
a)
Figure 1 Tension Test of Hollow Insulation on DMA at Room Temperature
F-3

0.00E+00
2.00E+02
4.00E+02
6.00E+02
8.00E+02
1.00E+03
1.20E+03
0.00E+00 5.00E-02 1.00E-01 1.50E-01 2.00E-01 2.50E-01
Strain (%)
Stre
ss (K
Pa)
Figure 2 Tension Test of Hollow Insulation on MiniMat at Room Temperature
0.00E+00
5.00E+02
1.00E+03
1.50E+03
2.00E+03
2.50E+03
0.00E+00 1.00E-01 2.00E-01 3.00E-01 4.00E-01 5.00E-01
Strain (%)
Stre
ss (K
Pa)
Figure 2 Tension Test of Flat Film on MiniMat at Room Temperature
Table 1: Comparison of EAI and E from force-deformation data at age level A0
with Force 0~0.49 Lbs (0~222g) & Strain 0~1.49%
EAI /L
E TEST
EAI
Lbs./Inch Lbs./Inch2 Pa Lbs./Inch2 Pa
1 473 4730 3.26 x10⁷ 2.36 x10⁴ 1.63 x10⁸ 2 449 4490 3.09 x10⁷ 2.15 x10⁴ 1.48 x10⁸
Average 461 4610 3.18 x10⁷ 2.26 x10⁴ 1.56 x10⁸
F-4

F-5
Northwestern UniversityNorthwestern University
McC
orm
ick
Sch
ool o
f E
ngin
eeri
ngM
cCor
mic
k S
choo
l of
Eng
inee
ring
Hui ZhangHui Zhang33
Cylindrical Contact Model-Old Model
Apparent Modulus, Test 2
1,000
10,000
100,000
1,000,000
0.000 0.001 0.002 0.003 0.004Deformation (in)
Mod
ulus
(psi
)
DataAvg 0.19-0.51 lbs (Hui)Avg, 1-2 lbs (Roger)
E=1.38E+07 PaCV: 7.0%
E=1.53E+07 PaCV: 8.4%
Apparent Modulus, Test 1
1,000
10,000
100,000
1,000,000
0.000 0.001 0.002 0.003 0.004Deformation (in)
Mod
ulus
(psi
)
DataAvg 0.18-0.51 lbs (Hui)Avg, 1-2 lbs (Roger)
1. Modulus Average
2. Contact Length
Northwestern UniversityNorthwestern University
McC
orm
ick
Sch
ool o
f E
ngin
eeri
ngM
cCor
mic
k S
choo
l of
Eng
inee
ring
Hui ZhangHui Zhang44
Spherical Contact Model-New
Rigid Indenter
Elastic Foundation
Rigid Base
2δπ RhPE =
Axisymmetric case:
Advantages: no contact length, Lno Poisson’s ratio, νcontact area more similar to physical situationthan old cylinder contact model
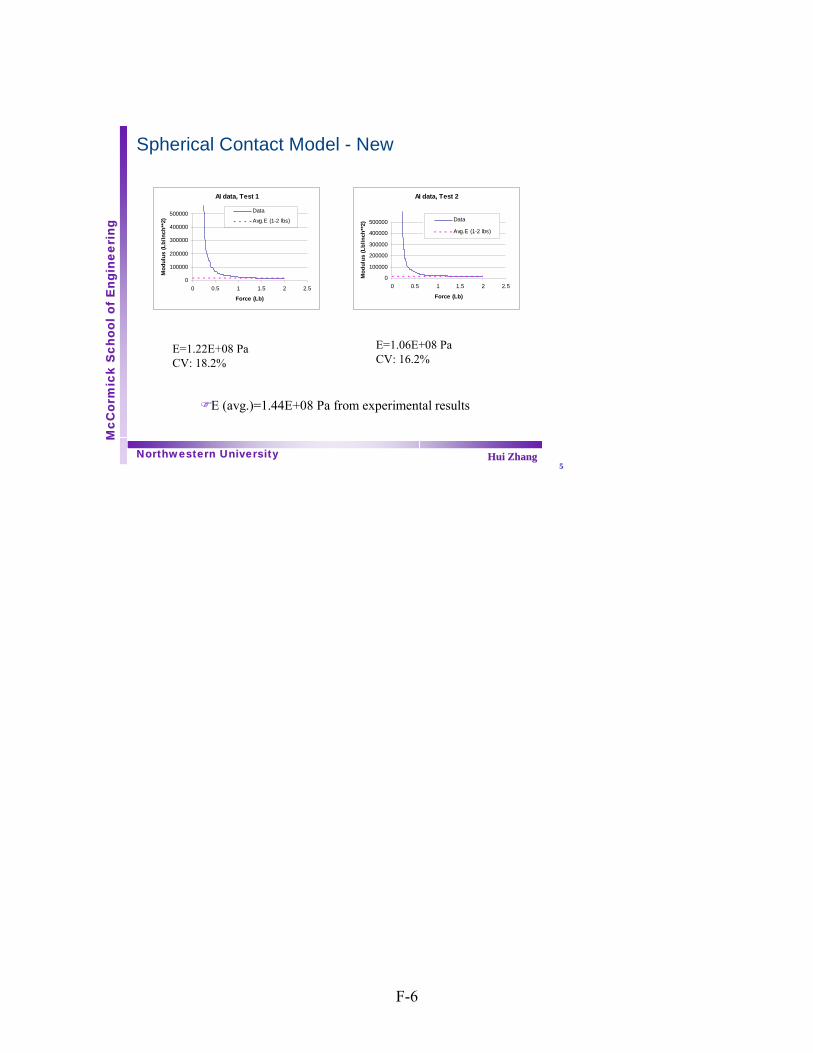
Northwestern UniversityNorthwestern University
McC
orm
ick
Sch
ool o
f E
ngin
eeri
ngM
cCor
mic
k S
choo
l of
Eng
inee
ring
Hui ZhangHui Zhang55
Spherical Contact Model - New
AI data, Test 1
0
100000
200000
300000
400000
500000
0 0.5 1 1.5 2 2.5
Force (Lb)
Mod
ulus
(Lb/
Inch
**2)
Data
Avg.E (1-2 lbs)
E (avg.)=1.44E+08 Pa from experimental results
E=1.06E+08 PaCV: 16.2%
E=1.22E+08 PaCV: 18.2%
AI data, Test 2
0
100000
200000
300000
400000
500000
0 0.5 1 1.5 2 2.5
Force (Lb)
Mod
ulus
(Lb/
Inch
**2)
Data
Avg.E (1-2 lbs)
F-6

APPENDIX G—CHANGE IN PROBE TIP DESIGN The following documents the decision making process to change the probe tip design. Advantages of changing to a cylindrical design were stated by Ken Shull (Northwesterrn University) as:
There are two primary advantages. The first is that the geometry of two cylinders (of equal radii) crossed at right angles to one another is geometrically equivalent to a sphere in contact with a flat surface. This is by far the most-analyzed contact geometry, and will allow you to make use of a lot of well established analytic results. The second advantage is that the crossed cylinder geometry avoids almost all alignment issues – you no longer need to worry about centering a small indenter tip over the wire.
In regards to the actual design of the cylindrical probe, Ken stated:
It’s best to have the radius of curvature of the indenter to be identical to the radius of the wire (including the insulation). That’s because you only get a circular contact in this situation. That means that you would need a different indenter for each wire gauge, which is probably a pain. If the radii of the indenter and wire are different you will get elliptical contact, which is still better than some of the geometries you’ve been working with historically. My suggestion would be to use a radius of curvature for the cylindrical indenter which is in the middle of the range of wire diameters you want to test.
Thus, the decision was made to proceed with using a cylindrical probe tip design. The radius for the cylindrical tip was set at 0.025 inches. Because a different area was being used for indentation, the modulus readings would be different using the new probe tip design. Thus, readings from previous research work would not be directly comparable to readings obtained during this project. Therefore, all readings taken on wire samples from a previous research project would be repeated during this project.
FIGURE G-1. NEW CYLINDRICAL PROBE TIP AND OLD STYLE CONICAL TIP Old style conical probe tip
Cylindrical probe
G-1/G-2

APPENDIX H—TEST DATA FROM INTRUSIVE INSPECTION REPORT REFERENCED TO WIRES TESTED AT SANDIA
H-1
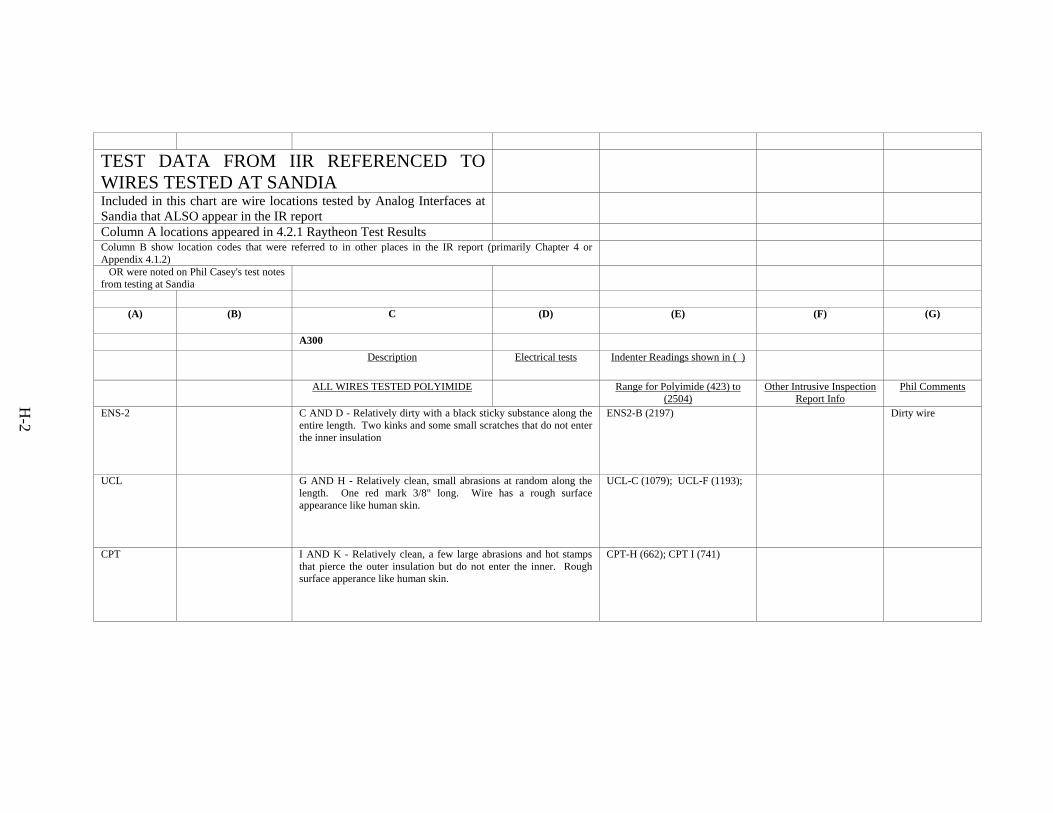
TEST DATA FROM IIR REFERENCED TO WIRES TESTED AT SANDIA
Included in this chart are wire locations tested by Analog Interfaces at Sandia that ALSO appear in the IR report
Column A locations appeared in 4.2.1 Raytheon Test Results Column B show location codes that were referred to in other places in the IR report (primarily Chapter 4 or Appendix 4.1.2)
OR were noted on Phil Casey's test notes from testing at Sandia
(A) (B) C (D) (E) (F) (G)
A300 Description Electrical tests Indenter Readings shown in ( )
ALL WIRES TESTED POLYIMIDE Range for Polyimide (423) to (2504)
Other Intrusive Inspection Report Info
Phil Comments
ENS-2 C AND D - Relatively dirty with a black sticky substance along the entire length. Two kinks and some small scratches that do not enter the inner insulation
ENS2-B (2197) Dirty wire
UCL G AND H - Relatively clean, small abrasions at random along the length. One red mark 3/8" long. Wire has a rough surface appearance like human skin.
UCL-C (1079); UCL-F (1193);
CPT I AND K - Relatively clean, a few large abrasions and hot stamps that pierce the outer insulation but do not enter the inner. Rough surface apperance like human skin.
CPT-H (662); CPT I (741)
H-2

PSU-7 E AND F - Relatively clean, a couple small abrasions not entering the inner insulation. One red mark3/8" long. Every other airbus stamp goes through the outer insulation but does not appear to enter the inner insulation.
Sample E failed on Wet Dielectric Voltage Withstand
PSU7-A (1696) Chapter 4, page 11 (Raytheon results)
ECH-XD ECH-XD (1199) Dirty, discolored, rough spots
DC-10 ALL WIRES TESTED XL-ETFE Range for XL-ETFE (760) -
(1508)
CTM-1 B - Dirty, black tacky crust CTM-1 E (1504); CTM-1 A
(1508) CTM-2A Gummy
and dirty D - Relatively clean, black tacky crust G - Relatively clean, greenish crust
CTM-2 B - Relatively dirty, blackish yellow crusty
sticky substance. Kinked significantly Failed wet dielectric CTM-2 A (760); CTM-2 A (884)
D - Relatively dirty, blackish yellow crusty sticky substance
4.1.2 page 43
ECH-1 B and D - Relatively clean
ECD-1 B - Dirty, black grime ECH ECD A (1344); Z640 ECD-1 A (1350);
4.1.2 page 44
DC-9 (1) ALL WIRES PVC G/N or UNKNOWN Range for PVC G/N (573) -
(1168)
ECD-2 RH Wheel Well
RBI 72C - Dirty with dark spots Failed wet dielectric
RB-I-71B RB-I-71B (573) 4.1.2 p12
H-3

LCS-1 A LCS-1 A (661) 4.1.2 p17 RB-I-65A LB-I-65A (694) 4.1.2 p2 IPFA IPFA (926) 4.1.2 p9 "looks good" LH WHEEL WELL E LH WHEEL WELL E (953) 4.1.2 p2 RB-I-72 D RB-I-72 D(1069) 4.1.2 p17 RB-I-65D RB-I-65D (1079) 4.1.2 p4 "nylon
compromised"
RB-I-72C RB-I-72C (1092) 4.1.2 p16,17 RB-I-72A RB-I-72A (1134) 4.1.2 p15 "appears OK"
RB-I-72B RB-I-72B (1168) 4.1.2 p16 "nylon,
fiberglass breach"
UCL-1 E UCL-1 E (1259) 4.1.2 p8 "good condition"
CDT-1A CDT-1A (1409) 4.1.2 p12 "generally
good"
CDT-2 C CDT-2 C (1516) 4.1.2 p18 "looks really
good"
DC-9 (2) Wires tested were Polyimide and PVC G/N
Range for PVC G/N (573) - (1168)
H-4

Range for Polyimide (423) to (2504)
LCS D - Spots of yellowish rubbery substance.
Red mark 3/8" long LCS F PVC G/N (722) 4.1.2 p33; Chapter 4 p19
RHWT RB-1-95F ID02 - Relatively clean, a little yellowish outer insulation
feels a little brittle. Cracks in outer nylon jacket. RH WING TIP A PVC G/N (871); Z14 RHWT I (redo 2) (903)
Chapter 4 p19 "Anomolies - such condition that couldn't be analyzed by lab studied" p20 "Badly damaged, yellowed, and cracked into nylon coating
Dirty, discolored, rough spots
F - Relatively clean, one scratch and one pinch. Outer insulation goes from clear to opaque. Some small bubbles in outer insulation
G - Relatively clean, outer insulation goes from clear to opaque
CTM P - Relatively clean, slight nick in outer
insulation CTM F Polyimide (451);
CTM R Polyimide (690) 4.1.2 p29
Q - Slightly dirty, yellowish flaky substance. Two spots that are bluish-green in color, nick in outer insulation reveals that glass braid has taken on the color.
RH Tailcone C - F61-17 RB-1-99E - Slightly dirty, one
abrasion that a dark substance has entered and discolored the braid (about one inch), exposed conductor.
Failed wet dielectric RH Tailcone F61-17B PVC G/N (1088)
Chapter 4 p.20 "Badly damaged, yellowed, and cracked into nylon coating
A F61-17 RB-I-97B - Slightly dirty, with one dark spot where the insulation has been completely worn to the conductor (~ .25 inch long)
Failed wet dielectric
ECH 1 H, F ECH 1H Polyimide (1593); ECJ
1F: (1382) 4.1.2 p34, 39 "Great shape"
Visual - expected higher modulus
ECH 1 D ECH 1D PVC G/N (759) 4.1.2 p31
H-5

ECD C ECD C Polyimide (1430) 4.1.2 p31; Chapter 4 p. 20
Z14 RHWT I (redo 2) Z-14 RHWT I (redo 2) PVC G/N
(903) Chapter 4 p19, 20 "Badly damaged, yellowed, and cracked into nylon coating
UCL I UCL I PVC G/N (621) Chapter 4 p20 Tailcone C Tailcone C PVC G/N (845) 4.1.2 p30 LT-1011 ALL WIRES TESTED POLYIMIDE Range for Polyimide (423) to
(2504)
CDT B - Clean and white extruded insulation.
(Possibly a replacment wire.) Failed dielectric after bend test - life cycle
CDT C (792)
D - Relatively clean, yellowish in color
CTM B- 2TW/SHLD Very dirty, black tacky substance
Red wire fail to shield, wet dielectric
CTM-2C (1663); CTM-2N (1908)
Yellow top coat missing over most length
D - Very dirty, yellowish in color, black
tacky substance
F - 2TW Very dirty, black tacky grimey substance
ENL B - Relatively dirty, yellowish in color,one
inch white mark ENL M (1572); ENL C (2047)
D - Slightly dirty, yellowish in color, sticky
H-6

ICH B - 3TW Relatively clean, small amount of grime and metal particles. Some chaffed insulation.
ICH K (432)
D - 3TW/SHLD Relatively clean Red fail to shield wet
dielectric
F - 3TW/SHLD Relatively clean Yellow, blue fail to shield wet dielectric H - 2TW Relatively clean, small amount
of grime between the wires Blue - failed dielectric
J - 2TW Relatively clean L - Relatively clean, yellowish in color, a couple of outer insulation
scrapes
N - Slightly dirty, light black tacky spots, One 4" white spot
LCS Dirty, brown tacky gooey thick substance LCS M (1336)
PSU B- Relatively clean, yellowish in color, a
few slightly dirty spots
D - Relatively clean, yellowish in color, has one non-enviromental splice
PSU-1 N (2389)
H-7
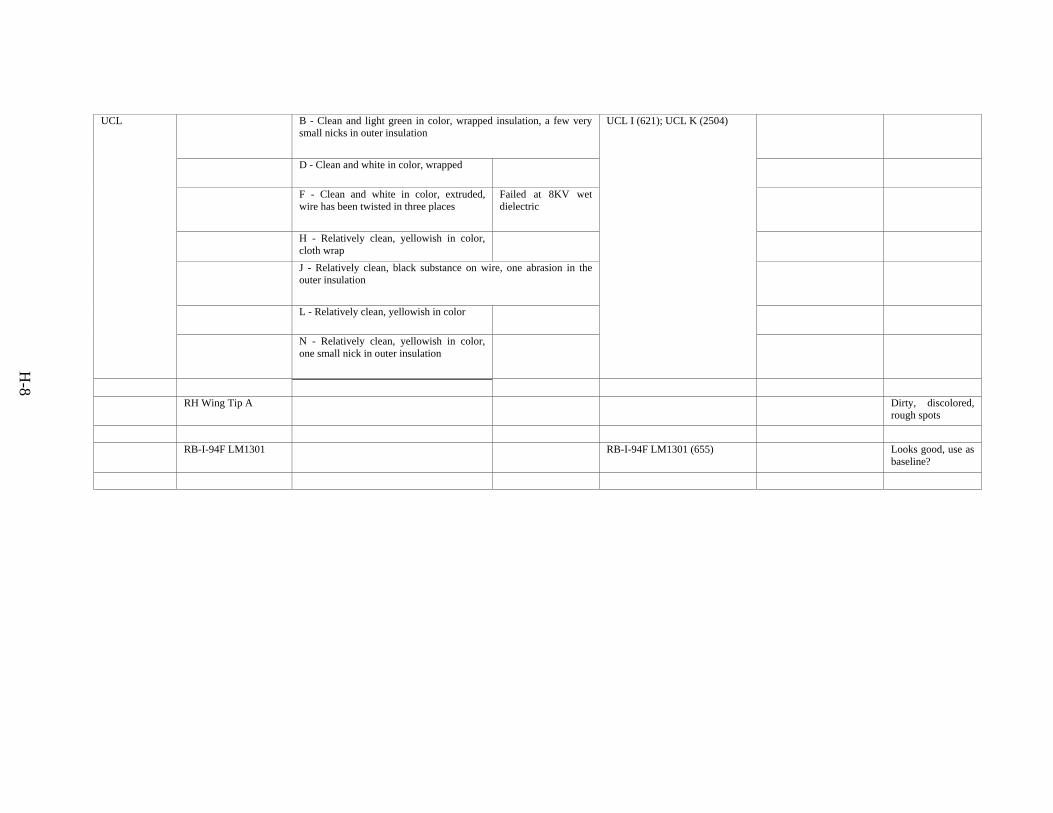
UCL B - Clean and light green in color, wrapped insulation, a few very
small nicks in outer insulation UCL I (621); UCL K (2504)
D - Clean and white in color, wrapped
F - Clean and white in color, extruded, wire has been twisted in three places
Failed at 8KV wet dielectric
H - Relatively clean, yellowish in color, cloth wrap
J - Relatively clean, black substance on wire, one abrasion in the outer insulation
L - Relatively clean, yellowish in color
N - Relatively clean, yellowish in color, one small nick in outer insulation
RH Wing Tip A Dirty, discolored,
rough spots RB-I-94F LM1301 RB-I-94F LM1301 (655) Looks good, use as
baseline?
H-8

APPENDIX I—NONDESTRUCTIVE TEST PLAN
I-1
NONDESTRUCTIVE TEST PLAN
TASK 9 OF
FAA CONTRACT NUMBER DTFA03-03-C-00027
Revision No. 0 dated October 20, 2004 Prepared By: Analog Interfaces, Inc.
P.O. Box 3448 706 South Union Avenue
Alliance, OH 44601 Reviewed By:
Cesar Gomez (FAA AAR 480) Reviewed By:
Michael F. Walz (FAA AAR 480)
I-2

TABLE OF CONTENTS
1. Goal 3 2. Background 3 3. Nondestructive Tests 3 3.1 Chemical 3.2 Electrical 3.3 Mechanical 3.4 Thermal 4. Summary of Tests To Be Performed 6 Appendices A. Section 3 of “Thermal Aging and Elongation-At-Break Testing of Wires 7
Used in Aircraft,” Revision 0, November 25, 2003, prepared by AMEC Earth & Environmental, Inc. for FAA Contract Number DTFA03-03-C-00027
B Historical Information Concerning the Development of the Original Shape 11
of the Probe (Anvil) Tip C MIL-STD-202G 17
Method 301 Dielectric Withstanding Voltage Method 302 Insulation Resistance
I-3

NONDESTRUCTIVE TEST PLAN 1. GOAL Develop, document, and execute a specific plan to demonstrate by objective methods that Indenter testing of thin-walled insulations used in wires typically installed in aircraft is nondestructive when performed by an Indenter Phase 2. The plan will include input provided by Sandia under separate contract to the FAA. 2. BACKGROUND During previous FAA-sponsored Indenter tests of aircraft wire using the Indenter Phase 1, no observable permanent deformation of the material was observable by the unaided eye. However, a slight indentation was seen under a magnifying glass. 3. NONDESTRUCTIVE TESTS Nondestructive testing (NDT) consists of test methods used to examine an object, material or system without impairing its future performance or accelerating the rate of failure. Wire tests typically consist of one or more of the following four methods:
• Chemical • Electrical • Mechanical • Thermal
3.1 CHEMICAL The typical reaction of a wire insulation material when it contacts a chemical agent is softening, material discoloration, swelling or a combination of all three. Thus, a chemical test would almost certainly mask or obliterate the effects (if any) of the Indenter pressing against the outer surface of the jacket or insulation. Consequently, a chemical test is not considered to be a realistic method to evaluate the nondestructive aspect of an Indenter test.
I-4

3.2 ELECTRICAL The following nine electrical tests are commonly used to assess the status of wire insulation:
• Insulation resistance (IR) • High potential (Hi-Pot) • Power factor (PF) • Polarization index (PI) • Capacitance
• Partial Discharge • Time Domain Reflectometry • Tan Delta • Density (Computed Tomography)
Two of those electrical tests have been selected for this project, namely, IR and Hi-Pot.1 A comparison will be made between the IR and Hi-Pot performance of a submerged wire before and after it has been indented. Samples of the wires used in the project will be tested as follows:
1. Perform IR tests in air on non-Indented wires 2. Submerge non-Indented wires in room-temperature tap water 3. Perform IR and Hi-pot tests of non-Indented wires while they are submerged 4. Remove the wires from the water bath, dry them and perform Indenter measurements 5. Submerge the wires in the water bath and perform IR and Hi-Pot tests again.
The test wires will be bent such that each end of a wire will be above the level of the water. All IR data and Hi-Pot leakage current data will be analyzed to determine if any difference can be detected that is reasonably attributable to localized deformation resulting from the Indenter test. Insulation Resistance (IR) Test2 The test apparatus shall consist of a source of constant potential of 500 volts DC3. Single-conductor cables shall be tested between the conductor and ground or water (50°F to 85°F). The conductor under test shall be connected to the negative terminal of the test equipment and the readings shall be taken after an electrification of one minute. HIGH-POTENTIAL WITHSTAND (HI-POT) TEST4
Subject the 1/C wires to High Voltage withstand test of 2500 Vac for a period of five minutes (same as Intrusive Inspection Report – see www.mitrecaasd.org/atsrac/intrusive). Apply the potential between the conductor and ground (water). Record the leakage current at the end of the five-minute period.
1 General guidance is given by MIL-STD 202 (see Appendix C). 2 “Thermoplastic-insulated Wire and Cable of the Transmission and Distribution of Electrical Energy,”
IPCEA S-61-402 NEMA WC 5 Section 6.12 (“Insulation Resistance”). 3 Such as discussed in “Test Method for DC Resistance or Conductance of Insulating Materials,” ASTM
Standard D 257 4 Also known as Dielectric Voltage Withstand Test.
I-5
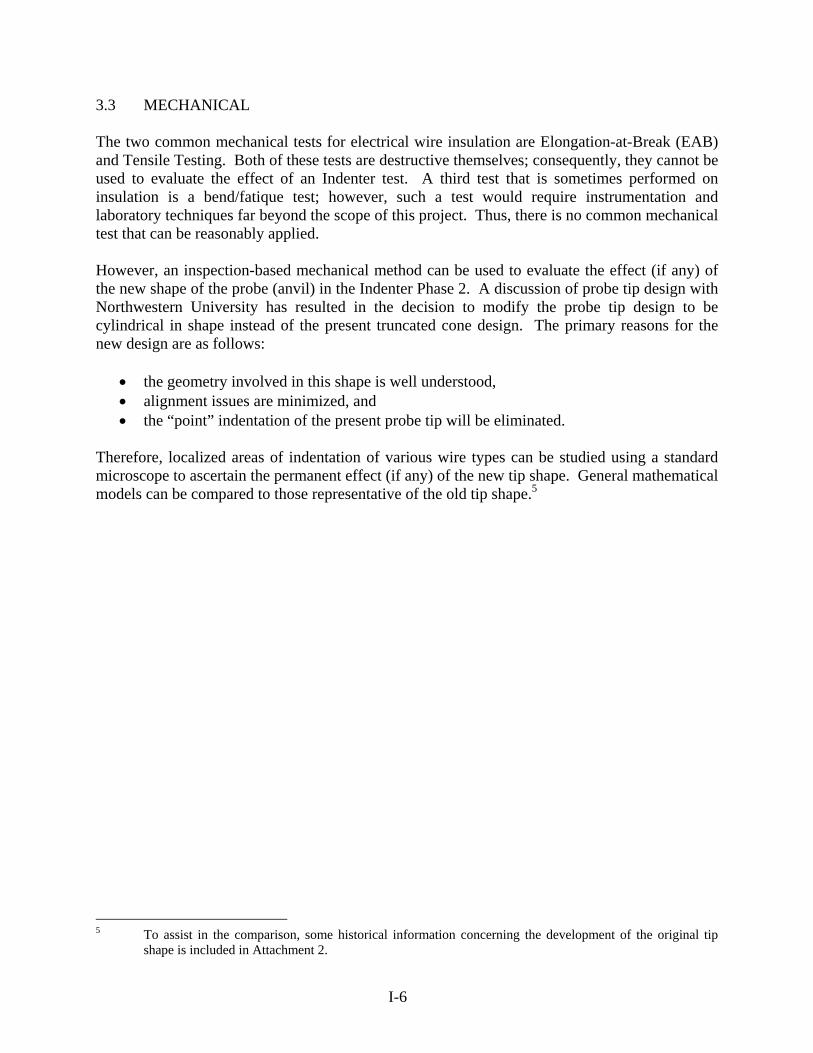
3.3 MECHANICAL The two common mechanical tests for electrical wire insulation are Elongation-at-Break (EAB) and Tensile Testing. Both of these tests are destructive themselves; consequently, they cannot be used to evaluate the effect of an Indenter test. A third test that is sometimes performed on insulation is a bend/fatique test; however, such a test would require instrumentation and laboratory techniques far beyond the scope of this project. Thus, there is no common mechanical test that can be reasonably applied. However, an inspection-based mechanical method can be used to evaluate the effect (if any) of the new shape of the probe (anvil) in the Indenter Phase 2. A discussion of probe tip design with Northwestern University has resulted in the decision to modify the probe tip design to be cylindrical in shape instead of the present truncated cone design. The primary reasons for the new design are as follows:
• the geometry involved in this shape is well understood, • alignment issues are minimized, and • the “point” indentation of the present probe tip will be eliminated.
Therefore, localized areas of indentation of various wire types can be studied using a standard microscope to ascertain the permanent effect (if any) of the new tip shape. General mathematical models can be compared to those representative of the old tip shape.5
5 To assist in the comparison, some historical information concerning the development of the original tip
shape is included in Attachment 2.
I-6

3.4 THERMAL A thermal test is used to age the insulation, thereby changing certain mechanical properties of the material. This test method can be used in combination with a visual inspection to ascertain if a known thermal aging effect, namely, cracking, occurs sooner in a localized area stressed by an Indenter test. Wire samples of each type of wire tested in Phase I (either new or previously aged) will be tested with the Indenter Phase 2, then wrapped around a mandrel and subjected to thermal aging performed in conjunction with Task 4. The Indenter Phase 2-tested area will be in tension. An identical control wire that has not been tested with the Indenter Phase 2 will be aged on an adjacent mandrel. The specimens will be examined at the end of aging to identify any differences between them as they age. Visual examinations will be performed initially using the unaided eye, then repeated using a magnifying glass. A complete description of the methodology is presented in Section 3 of the Test Plan6 and is repeated in Appendix A of this document for completeness.
6 “Thermal Aging and Elongation-At-Break Testing of Wires Used in Aircraft,” Revision 0, November 25,
2003, prepared by AMEC Earth & Environmental, Inc. for FAA Contract Number DTFA03-03-C-00027
I-7

4. SUMMARY OF TESTS TO BE PERFORMED Samples of the various wire types included in this project will be subjected to the following tests to evaluate the nondestructive nature of the Indenter probe tip:
• Electrical Insulation Resistance (IR) and High Potential Withstand tests of immersed wires before and after Indenter tests
• Mechanical Indenter tests followed by visual examination using a microscope • Thermal accelerated aging after Indenter tests followed by visual examination by the
unaided eye and by using a magnifying glass
I-8

APPENDIX A
Section 3 of
“Thermal Aging and Elongation-At-Break Testing of Wires Used in Aircraft,” Revision 0, November 25, 2003, prepared by AMEC Earth & Environmental, Inc.
for FAA Contract Number DTFA03-03-C-00027
I-9

3. INDENTER TESTING AND THERMAL AGING OF WIRES ON MANDRELS
One specimen of each wire type will be tested with the Indenter then wrapped around a metal mandrel, held in tension and subjected to thermal aging. An identical specimen that has not been tested by the Indenter also will be wrapped around the mandrel, held in tension and subjected to thermal aging. The point where the Indenter measurement was made will be maintained under tension throughout the entire thermal aging exposure by hanging a weight from the wire. At the completion of thermal aging, the specimen will be examined at the point where the Indenter measurement was made to determine if there are any cracks or other indications of aging stress at that location which are not seen on the wire that did not have an Indenter measurement before aging. The diameter of the mandrel will be approximately five times (“5X”) the diameter of the insulated wire. Five of the six types of test specimens are #20 AWG, and the typical overall diameter of these insulated wires is approximately 0.05 inches; therefore, the diameter of a 5X mandrel for the #20 AWG test specimens is to be approximately 0.25 inches (1/4 inch). The overall diameter of a #10 AWG insulated wire (“Polyimide Power”) is approximately 0.126 inches; therefore, the diameter of a 5X mandrel for the #10 AWG insulated wire is to be approximately 0.63 inches (~5/8 inches). All of the specimens to be bent around a mandrel are those that were unaged in the previous research project. The specimen identification number for the 12 wires are as follows:
• PVC A0 #6 and PVC A0 #7 • PVC G-N A0 #6 and PVC G-N A0 #7 • XL-ETFE A0 #6 and XL-ETFE A0 #7 • Composite TKT A0 #6 and Composite TKT A0 #7 • Polyimide INST A0 #6 and Polyimide INST A0 #7 • Polyimide POWER A0 #6 and Polyimide POWER A0 #7
The #6 specimen of each type is to be Indented before it is bent around a mandrel.
I-10

3.1 Obtain one metal mandrel that is approximately 5/8 inch in diameter, and five metal mandrels that are each approximately ¼ inch in diameter. The length of each mandrel should be approximately six inches (up to nine inches). The mandrels can be made from any type of metal that is not affected by a temperature of 300°C (572°F), and they can be cut from standard bar stock or any other readily available source. Thoroughly clean and dry each mandrel to ensure that no oil, grease, dirt or residual contamination of any kind is on the surface.
3.2 Obtain a set of metal weights that will be hung from the test wires to maintain tension
(see sketch above). The weight for the #20 AWG wires should be approximately 0.75 pounds (~341 grams). The weight for the #10 AWG wire should be approximately 2.5 pounds (~1,136 grams). The weights can be either standard laboratory items, or made from materials readily available at a hardware store (for example, the contents of a box of steel bolts or nuts placed in a metal wire mesh (door screen) that is attached to the terminal lugs.
3.3 Cut a 6-inch length of wire from a longer, unaged specimen. Crimp appropriately sized
terminal lugs onto both ends. 3.4 Make an Indenter measurement in the exact center (longitudinal axis) of the wire
specimen, then rotate the wire exactly 180 degrees around its longitudinal axis and make a mark on the wire using indelible ink (black). The black mark in the exact center (longitudinal axis) of the wire specimen will identify the side and part of the wire specimen that will rest on the top of the mandrel so that the point of the Indenter measurement on the other side of the wire will be in tension throughout the thermal aging exposure.
3.5 Place the wire specimen over the mandrel (black mark centered at top and touching the
highest point of a mandrel held horizontally), then attach the two ends to the weight suspended underneath. Suspend the ends of the mandrel from the underneath of a tray in the oven using “S”-shaped metal hooks or other appropriate means (see Figure 1).
3.6 The number, type and use of the entire set of mandrels is as follows:
Mandrel Diameter Wires Oven Weights 1 0.25 inch 2 PVC No. 1
(125°C)2 @ 0.75 lbs;
2 0.25 inch 2 PVC G-N No. 1 (125°C)
2@ 0.75 lbs
3 0.25 inch 2 XL-ETFE No. 2 (220°C)
2 @ 0.75 lbs;
4 0.25 inch 2 Polyimide INST No. 2 (220°C)
2 @ 0.75 lbs
5 0.625 inch 2 Polyimide Power No. 2 (220°C)
2 @ 2.5 lbs
6 0.25 inch 2 Composite TKT No. 3 (280°C)
2 @ 0.75 lbs
I-11

3.7 Age the specimens on the mandrels at the same time as those described in Section 5 (“Accelerated Thermal Aging Exposures”). The total aging time for all mandrel specimens is as follows:
• PVC and PVC G-N 8 weeks • XL-ETFE 12 weeks • Polyimide and Composite TKT 24 weeks
3.8 Remove the specimens from the oven and perform a visual inspection of them. Visually
examine the two specimens of each type at the location where one of each was tested by the Indenter. Examine the specimens first using the unaided eye and then using a magnifying glass. Prepare a written record of the examination of all specimens, using the form shown in Appendix B.
FIGURE 1
AGING OF #20 AWG WIRES IN TENSION
ELEVATION VIEW INSIDE OVEN
shelf
Mandrel (1/4” dia.)
9”
0.75 LB Weights
6-iWSpecimens Bent Over Mandrel insion
Suspension Device – Wire, Hook, Eye Bolt, etc.
2 7/8”
Weights Hung from terminal lugs on test specimens using steel wire
Note: Not to scale and dimensions are approximate.
I-12

APPENDIX B
Historical Information Concerning the Development of the Original Shape of the Probe (Anvil) Tip
I-13

One of several published reports on the development of the Indenter provides useful information concerning the original shape of the probe (anvil) tip. Section 2 of EPRI NP-73481 states the following:
“Laboratory experiments were conducted with an Instron testing machine, as described in Section 4 of Ref. 1.2 In most experiments, a short section of cable was supported in a V block, and the physical testing machine was used to press a probe against the surface of the cable. However, for experiments with a large-diameter cable, special apparatus was designed to hold the cable firmly in place. “The probe was an anvil of the form illustrated in Figure 2-1, which shows the four different designs tested. A probe with a 0.10” end radius (ASTM-D) was previously found unsuitable because it was designed for hard surfaces.”
Figure 2-1 is reproduced on the following page. Additional detail is provided by an earlier technical paper3 which states, in part, the following:
“The nondestructive test trails were performed on an Instron Model 1125 tension-compression test machine; a sketch of the configuration is shown in Figure 6. The cable sample is clamped in a support block that is centered under the anvil. The initial anvil size has the same dimensions as that of a Type A durometer as described in ASTM Std D2240. The anvil is connected to the crosshead of the Instron by a load cell that indicates the force exerted on the anvil by the cable insulation system. The anvil is driven against the cable jacket at a given rate by the Instron crosshead until the desired force or depth is reached.”
Figure 6 and a sketch of the current probe tip (Type A) are shown as the last two pages of Appendix B.
1 T.A. Shook, J.B. Gardner, S.P. Carfagno, Cable Indenter Aging Monitor, EPRI Final Report NP-7348,
prepared by Franklin Research Center, June 1981 2 T.A. Shook and J.B. Gardner, Cable Indenter Aging Monitor, EPRI Interim Report NP-5920, prepared by
Franklin Research Center, July 1988 3 G.J. Toman, J.B. Gardner, Development of a Nondestructive Cable Insulation Test, Proceedings
International AND/ENS Topical Meeting, Operability of Nuclear Power Systems in Normal and Adverse Environments, Albuquerque, New Mexico, Sept. 29 – Oct. 3, 1986
I-14

I-15
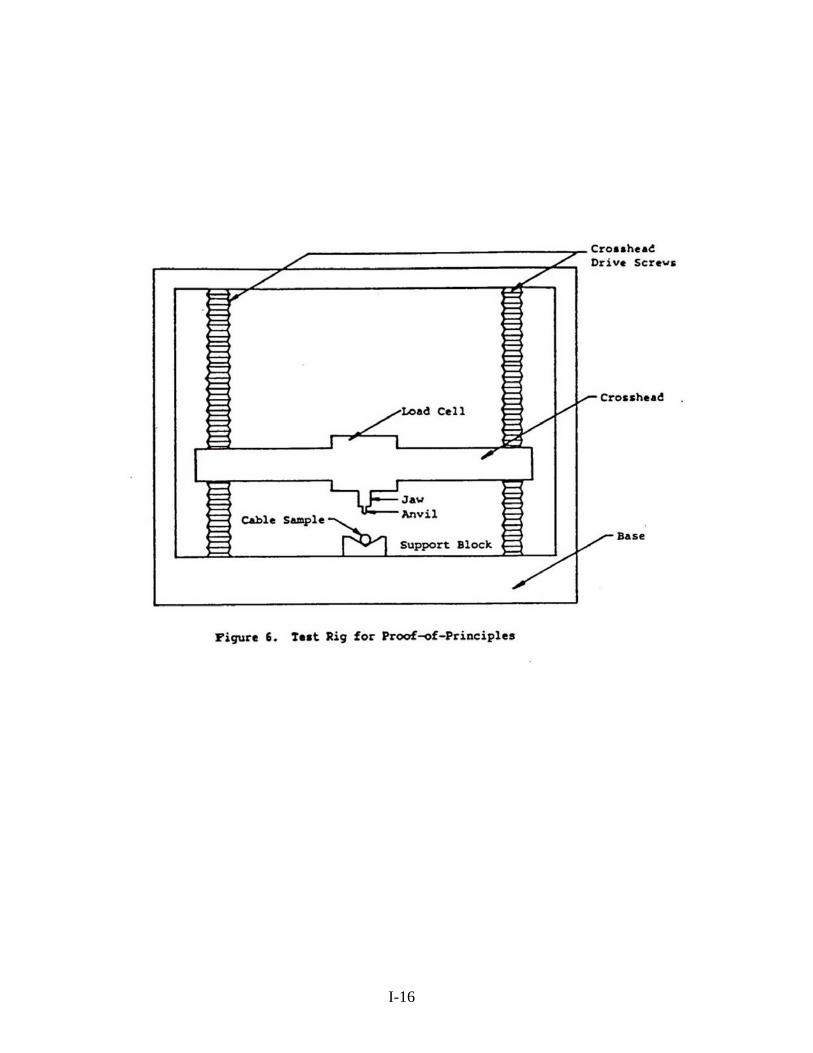
I-16

I-17

APPENDIX C
MIL-STD-202G
METHOD 301 DIELECTRIC WITHSTANDING VOLTAGE
METHOD 302 INSULATION RESISTANCE
I-18

MIL-STD-202G METHOD 301 DIELECTRIC WITHSTANDING VOLTAGE
1. PURPOSE. The dielectric withstanding voltage test (also called high-potential, over potential, voltage breakdown, or dielectric-strength test) consists of the application of a voltage higher than rated voltage for a specific time between mutually insulated portions of a component part or between insulated portions and ground. This is used to prove that the component part can operate safely at its rated voltage and withstand momentary overpotentials due to switching, surges, and other similar phenomena. Although this test is often called a voltage breakdown or dielectric-strength test, it is not intended that this test cause insulation breakdown or that it be used for detecting corona, rather, it serves to determine whether insulating materials and spacing in the component part are adequate. When a component part is faulty in these respects, application of the test voltage will result in either disruptive discharge or deterioration. Disruptive discharge is evidenced by flashover (surface discharge), sparkover (air discharge), or breakdown (puncture discharge). Deterioration due to excessive leakage currents may change electrical parameters or physical characteristics. 1.1 Precautions. The dielectric withstanding voltage test should be used with caution particularly in inplant quality conformance testing, as even an overpotential less than the breakdown voltage may injure the insulation and thereby reduce its safety factor. Therefore, repeated application of the test voltage on the same specimen is not recommended. In cases when subsequent application of the test potential is specified in the test routine, it is recommended that the succeeding tests be made at reduced potential. When either alternating-current (ac) or direct current (dc) test voltages are used, care should be taken to be certain that the test voltage is free of recurring transients or high peaks. Direct potentials are considered less damaging than alternating potentials which are equivalent in ability to detect flaws in design and construction. However, the latter are usually specified because high alternating potentials are more readily obtainable. Suitable precautions must be taken to protect test personnel and apparatus because of the high potentials used. 1.2 Factors affecting use. Dielectric behavior of gases, oils, and solids is affected in various degrees by many factors, such as atmospheric temperature, moisture, and pressure; condition and form of electrodes; frequency, waveform, rate of application, and duration of test voltage; geometry of the specimen; position of the specimen (particularly oil-filled components); mechanical stresses; and previous test history. Unless these factors are properly selected as required by the type of dielectric, or suitable correction factors can be applied, comparison of the results of individual dielectric withstanding voltage tests may be extremely difficult. 2. APPARATUS 2.1 High voltage source. The nature of the potential (ac or dc) shall be as specified. When an alternating potential is specified, the test voltage provided by the high voltage source shall be nominally 60 hertz in frequency and shall approximate, as closely as possible, a true sine wave in form. Other commercial power frequencies may be used for inplant quality conformance testing, when specified. All alternating potentials shall be expressed as root-mean square values, unless otherwise specified. The kilovolt-ampere rating and impedance of the source shall be such as to permit operation at all testing loads without serious distortion of the waveform and without serious change in voltage for any setting. When the test specimen demands substantial test source power capacity, the regulation of the source shall be specified. When a minimum kilovoltampere rating is required, it shall be specified. When a direct potential is specified, the ripple content shall not exceed 5 percent rms of the test potential. When required, a suitable current-limiting device shall be used to limit current surges to the value specified. 2.2 Voltage measuring device. A voltmeter shall be used to measure the applied voltage to an accuracy of at least 5 percent, unless otherwise specified. When a transformer is used as a high voltage source of alternating potential, a voltmeter connected across the primary side or across a tertiary winding may be used provided it is previously determined that the actual voltage across the test specimen will be within the allowable tolerance under any normal load condition. 2.3 Leakage current measuring device. When any leakage current requirement is specified, a suitable method shall be used to measure the leakage current to an accuracy of at least 5 percent of the specified requirement. 2.4 Fault indicator. Suitable means shall be provided to indicate the occurrence of disruptive discharge and leakage current in case it is not visually evident in the specimen. The voltage measuring device of 2.2, the leakage current
I-19

measuring device of 2.3, or an appropriate indicator light or an overload protective device may be used for this purpose. 3. PROCEDURE 3.1 Preparation. When special preparations or conditions such as special test fixtures, reconnections, grounding, isolation, or immersion in water are required, they shall be specified. 3.2 Test voltage. Specimens shall be subjected to a test voltage of the magnitude and nature (ac or dc) specified. 3.3 Points of application. The test voltage shall be applied between mutually insulated portions of the specimen or between insulated portions and ground as specified. The method of connection of the test voltage to the specimen should be specified only when it is a significant factor. 3.4 Rate of application. The test voltage shall be raised from zero to the specified value as uniformly as possible, at a rate of approximately 500 volts (rms or dc) per second, unless otherwise specified. At the option of the manufacturer, the test voltage may be applied instantaneously during inplant quality conformance testing. 3.5 Duration of application. Unless otherwise specified, the test voltage shall be maintained at the specified value for a period of 60 seconds for qualification testing. For inplant quality conformance testing, when specified, reduced time with a possible correlated higher test voltage may be used. Specimens with movable parts shall be tested as specified, in a manner to assure that repeated stresses are not applied to the same dielectric. Upon completion of the test, the test voltage shall be gradually reduced to avoid surges. At the option of the manufacturer, the test voltage may be removed instantaneously during inplant quality conformance testing. 3.6 Examination and measurement of specimen. During the dielectric withstanding voltage test, the fault indicator shall be monitored for evidence of disruptive discharge and leakage current. Following this, the specimen shall be examined and measurements shall be performed to determine the effect of the dielectric withstanding voltage test on specific operating characteristics, when specified. 4. SUMMARY. The following details are to be specified in the individual specification: a. Special preparations or conditions, if required (see 3.1). b. Magnitude of test voltage (see 3.2). (1) Test voltage, and duration for inplant quality conformance testing, if different than for qualification testing (see 3.5). c. Nature of potential (ac or dc) (see 2.1). d. Duration of application of test voltage for qualification testing if other than 60 seconds (see 3.5). e. Points of application of test voltage (see 3.3). (1) Method of testing specimens with movable parts (see 3.5). f. Method of connection of test voltage to specimen, if significant (see 3.3). g. Regulation, when applicable (see 2.1). h. Minimum kilovolt-ampere rating of high voltage source, if required. (see 2.1). i. Limiting value of surge current, if applicable (see 2.1). j. Maximum leakage current requirement, if applicable (see 2.3). k. Measurements after dielectric withstanding voltage test, if required (see 3.6).
I-20
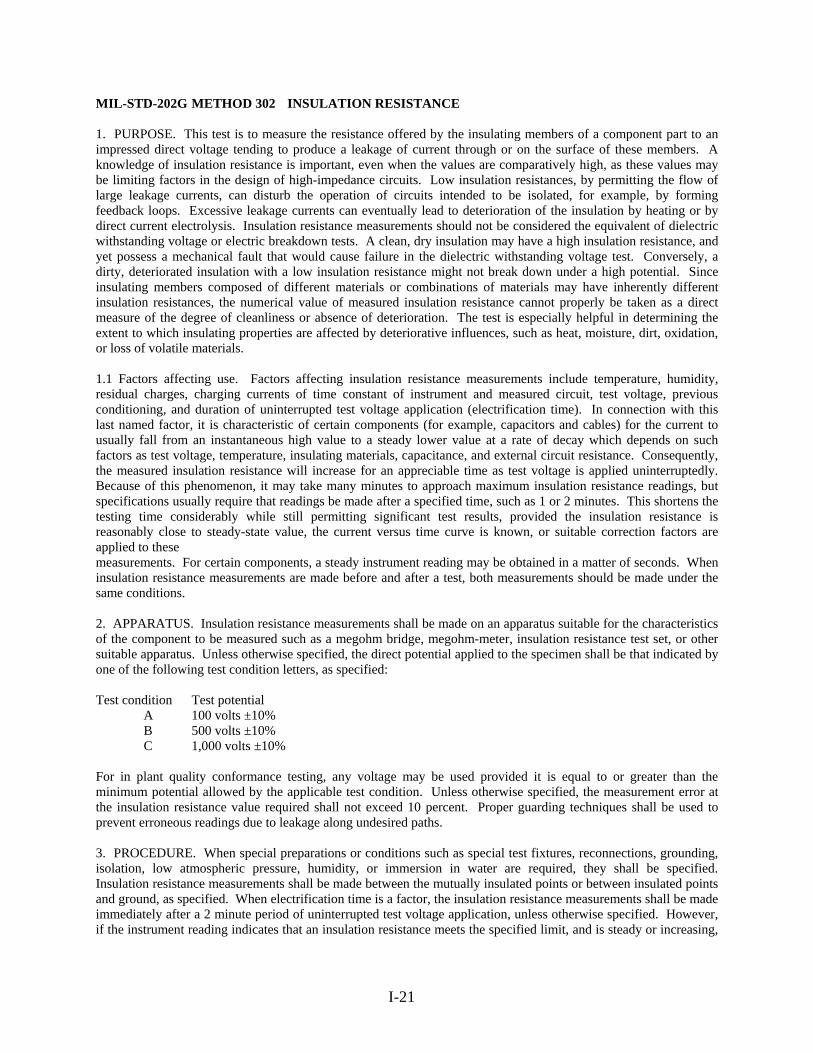
MIL-STD-202G METHOD 302 INSULATION RESISTANCE 1. PURPOSE. This test is to measure the resistance offered by the insulating members of a component part to an impressed direct voltage tending to produce a leakage of current through or on the surface of these members. A knowledge of insulation resistance is important, even when the values are comparatively high, as these values may be limiting factors in the design of high-impedance circuits. Low insulation resistances, by permitting the flow of large leakage currents, can disturb the operation of circuits intended to be isolated, for example, by forming feedback loops. Excessive leakage currents can eventually lead to deterioration of the insulation by heating or by direct current electrolysis. Insulation resistance measurements should not be considered the equivalent of dielectric withstanding voltage or electric breakdown tests. A clean, dry insulation may have a high insulation resistance, and yet possess a mechanical fault that would cause failure in the dielectric withstanding voltage test. Conversely, a dirty, deteriorated insulation with a low insulation resistance might not break down under a high potential. Since insulating members composed of different materials or combinations of materials may have inherently different insulation resistances, the numerical value of measured insulation resistance cannot properly be taken as a direct measure of the degree of cleanliness or absence of deterioration. The test is especially helpful in determining the extent to which insulating properties are affected by deteriorative influences, such as heat, moisture, dirt, oxidation, or loss of volatile materials. 1.1 Factors affecting use. Factors affecting insulation resistance measurements include temperature, humidity, residual charges, charging currents of time constant of instrument and measured circuit, test voltage, previous conditioning, and duration of uninterrupted test voltage application (electrification time). In connection with this last named factor, it is characteristic of certain components (for example, capacitors and cables) for the current to usually fall from an instantaneous high value to a steady lower value at a rate of decay which depends on such factors as test voltage, temperature, insulating materials, capacitance, and external circuit resistance. Consequently, the measured insulation resistance will increase for an appreciable time as test voltage is applied uninterruptedly. Because of this phenomenon, it may take many minutes to approach maximum insulation resistance readings, but specifications usually require that readings be made after a specified time, such as 1 or 2 minutes. This shortens the testing time considerably while still permitting significant test results, provided the insulation resistance is reasonably close to steady-state value, the current versus time curve is known, or suitable correction factors are applied to these measurements. For certain components, a steady instrument reading may be obtained in a matter of seconds. When insulation resistance measurements are made before and after a test, both measurements should be made under the same conditions. 2. APPARATUS. Insulation resistance measurements shall be made on an apparatus suitable for the characteristics of the component to be measured such as a megohm bridge, megohm-meter, insulation resistance test set, or other suitable apparatus. Unless otherwise specified, the direct potential applied to the specimen shall be that indicated by one of the following test condition letters, as specified: Test condition Test potential
A 100 volts ±10% B 500 volts ±10% C 1,000 volts ±10%
For in plant quality conformance testing, any voltage may be used provided it is equal to or greater than the minimum potential allowed by the applicable test condition. Unless otherwise specified, the measurement error at the insulation resistance value required shall not exceed 10 percent. Proper guarding techniques shall be used to prevent erroneous readings due to leakage along undesired paths. 3. PROCEDURE. When special preparations or conditions such as special test fixtures, reconnections, grounding, isolation, low atmospheric pressure, humidity, or immersion in water are required, they shall be specified. Insulation resistance measurements shall be made between the mutually insulated points or between insulated points and ground, as specified. When electrification time is a factor, the insulation resistance measurements shall be made immediately after a 2 minute period of uninterrupted test voltage application, unless otherwise specified. However, if the instrument reading indicates that an insulation resistance meets the specified limit, and is steady or increasing,
I-21

the test may be terminated before the end of the specified period. When more than one measurement is specified, subsequent measurements of insulation resistance shall be made using the same polarity as the initial measurements. 4. SUMMARY. The following details are to be specified in the individual specification: a. Test condition letter, or other test potential, if required (see 2). b. Special preparations or conditions, if required (see 3). c. Points of measurement (see 3). d. Electrification time, if other than 2 minutes (see 3). e. Measurement error at the insulation resistance value required, if other than 10 percent (see 2).
I-22

APPENDIX J—INSULATION RESISTANCE AND HIGH-POTENTIAL TESTING
IR AND HI-POT TESTING AT WRIGHT-PATTERSON AIR FORCE BASE TUESDAY, FEBRUARY 1, 2005
PRE-INDENTING INDENTING POST
INDENTING
IR HI-POT NOTES IR HI-POT
UNITS OHMS mA OHMS mA
MATERIAL Wire Identification
PVC New wire 2 X 10 12 0.260 No problems 5 X 10 12 0.247
PVC G/N New wire 1.6 X 10 11 0.124 Multiple over force 3.3 X 10 11 0.135
XL-ETFE A0 #8 1.6 X 10 12 0.185 No problems 1.2 X 10 12 0.180
COMPOSITE TKT A0 #8 0.6 X 10 12 0.178 No problems 1.1 X 10 12 0.172
POLYIMIDE INST * A0 #8 0.4 X 10 12 0.071 Over force problems 1.2 X 10 12 0.071
POLYIMIDE POWER A0 #8 1 X 10 12 0.090 No problems 2.4 X 10 11 0.083
M81381 12 AWG No label - unaged wire 1.6 X 10 12 0.133 No problems 2.3 X 10 11 0.147
Testing was done with the cylindrical probe tip (Indenter Phase 2) instead of the earlier conical tip design. * Indented five times Test solution: The test solution used for both procedures was, by volume, 95% deionized water, 5% salt, and 2 ml of Tritton X-100 wetting agent per 2 liters of solution. IR Test procedure: The wire specimen was immersed as much as possible in a stainless steel beaker with solution as described above. A voltage of 500 Volts DC was applied for one minute before readings were taken. Hi-Pot test procedure: The wire specimen was immersed as much as possible in a stainless steel beaker with solution as described above. A voltage of 2500 volts AC was applied for five minutes before readings were taken. Test instruments: IR Pre-Indenting HP 4329A Hi Resistance Meter IR Post-Indenting Agilent 4339B Hi Resistance Meter Beckman Instruments PA5-502/102 AC Dielectric Hi-Pot testing Breakdown tester Note: The Hi Resistance instrument was switched in the post-indenting testing to a digital Instrument due to some instability observed in the analog readings with the HP instrument. The digital meter gave more stable readings.
J-1/J-2