dosimetry needs and methods for srt: yttrium-90 · dosimetry needs and methods for srt: yttrium-90...
TRANSCRIPT

Department of RadiologyUniversity of Michigan
Dosimetry Needs and Methods for SRT:
Yttrium-90
Yuni Dewaraja, Emilie Roncali, Mark Madsen
University of California, Davis; University of Iowa
NCI Workshop on Dosimetry of Systemic Radiopharmaceutical Therapy (SRT) Rockville, MD, April 19-20, 2018

Disclosures
• Yuni Dewaraja is a consultant for MIM Software, Inc.

90Y Imaging/Dosimetry
• Almost pure beta emitter
– Eave= 0.94 MeV; mean tissue penetration=2.5 mm; T1/2=64 h
– Betas can eradicate tumor cells that are not directly targeted
– 90Y microsphere RE, 90Y ibritumomab, 90Y DOTATOC PRRT
• Imaging: complex
– SPECT via bremsstrahlung
– PET via very low probability positron
• Absorbed dose calculation: relatively easy
– Under certain conditions can assume local energy deposition
• lack of g and range of b relative to SPECT/PET resolution
90Y
90Zr
b-/b+
0.0032%
b-
99.99%
b-
0.011%

Bremsstrahlung imaging
• Challenges
– Inefficient: < 4% of b tissue interactions give photons > 50keV
• Not suitable for pre-therapy tracer imaging
– Continuous bremsstrahlung spectrum extending to 2.1 MeV
• Penetration (downscatter) of high energy photons
– Tissue dependent bremsstrahlung generation probabilities
• Yield not same in tissue vs. bone
• Internal bremsstrahlung
• Photons emitted during the b decay process itself

Bremsstrahlung SPECT Imaging: Guidelines
• HE collimator
• Acquisition window
– Within 100 – 500 keV
• 100 – 200 keV (avoids x-ray, optimal primary-to-scatter)
• Single (narrow) window vs. multi
window reconstruction model
• Model/Monte Carlo based SC
– Energy window based not suitable
with continuous spectrum

Bremsstrahlung SPECT/CT Reconstruction with Scatter Correction
• Model based
Minarik et al, Phy Med Biol 2008; Rong et al, Med Phys 2012
– Pre-calculated scatter kernels
• Fully Monte Carlo
Elschot et al, JNM 2013
– MC reconstruction with ‘on the fly’ calculation of SC and AC
• Monte Carlo generated scatter estimate
Dewaraja et al, Med Phys 2017
– Less computationally demanding than fully MC
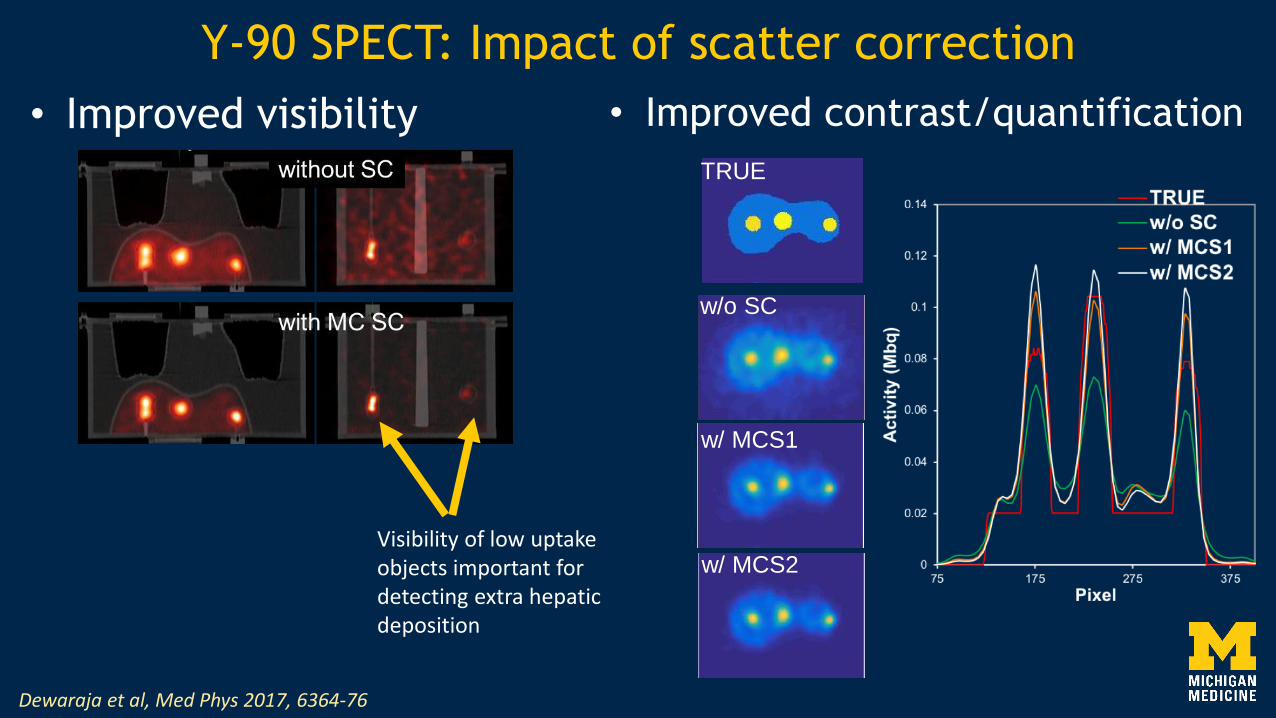
Y-90 SPECT: Impact of scatter correction
Improved visibility• • Improved contrast/quantification
Visibility of low uptakeobjects important fordetecting extra hepaticdeposition
w/o SC
TRUE
w/ MCS1
w/ MCS2
Dewaraja et al, Med Phys 2017, 6364-76

Impact of scatter correction:RE patient example
Dewaraja et al, Med Phys 2017, 6364-76
In 11 lesions (5 patients) without and with MC SCMean lesion uptake was 4.9 vs. 7.1 MBq/mLMean normal liver uptake was 1.6 vs. 1.5 MBq/mLLesion-to-liver uptake ratio was 2.7 vs. 4.3 (P=0.040)
SPECT without SC
SPECT with MC SC

Tissue dependent bremsstrahlung generation probabilities
• Bremsstrahlung yield ∝ Z2
– Same activity in different tissue will produce different number of photons
– Impact quantification of heterogeneous tissue
• Can account for this by incorporating probabilities in the reconstruction system matrix and using CT to determine voxel composition
• Yield in bone is 1.5 – 2 times that of tissue
Lim, Fessler, Brooks, Wilderman, Dewaraja . Submitted to PMB and presented at SNMMI Annual Meeting 2017

Demonstrating tissue dependent bremsstrahlung yield
SPECT with new system matrix(consistent w/ TRUE)
Bone Water Bone Water
SPECT with Standard OSEM
PET (consistent w/ TRUE)Bone 1.5 times more intense although sameY-90 concentration
Lim, Fessler, Brooks, Wilderman, Dewaraja . Phys Med Biol 2018 and presented at SNMMI Annual Meeting 2017
On SPECT/CT camera
Same Y-90 conc in 2 syringes with bone equiv. liquid (potassium salt) & water
CT

Y-90 PET
• Very low probability positron (low true coincidences) in the presence of bremsstrahlung (high random coincidences)
Poor image quality•
Improved with time– -of-flight

Y-90 SPECT vs PET
• SPECT: higher visibility lower resol. • PET: higher resolution, high noise

• Need only a single imaging point to get time-integrated activity
• Voxel level dosimetry can be based on local energy deposition
• Pre-therapy 99mTc-MAA SPECT/CT study for better planning ?
– Currently mostly used to assess extra-hepatic deposition
• Differences between MAA and microsphere distribution
• Post therapy Y-90 PET and SPECT can be used for
– Safety, dose verification (immediate prediction of response)
– Establishing lesion dose – response, normal liver dose-toxicity
Patient specific dosimetry in Y-90 radioembolization

Y-90 RE: Initial results from ongoing study at U Michigan
• Methods to improve Y-90 post therapy imaging– Dewaraja et al. Improved quantitative 90Y bremsstrahlung SPECT/CT reconstruction with
Monte Carlo scatter modeling. Med Phys. 2017;44:6364-6376.
– Lim H, Dewaraja Y, Fessler J. A PET reconstruction formulation that enforces non-negativity in projection space for bias reduction in Y-90 imaging. Phys Med Biol 2018
• Dosimetry based on Tc-MAA SPECT/CT, Y-90 SPECT/CT & PET/CT
– Patients with HCC or liver mets treated with glass microspheres
– Radiologist defined lesions, 3D dosimetry using DPM MC code
• Follow up for dose – outcome
– RECIST, mRECIST, liver function tests

Value of Tc-MAA SPECT/CT for Lung Shunt Estimation
• Planar calculation, used in clinic, overestimates LS
• SPECT/CT based
– Higher accuracy
– Auto liver/lung contouring
– Less variability
Lt Posterior Rt Rt Anterior Lt
Lung Shunt = 6%
Lung Liver
99mTc-MAA SPECT 90-Y PET
Lung Shunt = 1.49% Lung Shunt = 0.58%
0%
2%
4%
6%
8%
10%
12%
14%
16%
1 2 5 8 9 10 14 15 22 23 26 31 33 34 35 36 37 38 39 40
Lu
ng
Sh
un
t F
rac
tio
n
Patient
Planar
SPECT/CT (AC & SC)
Y-90 PET/CT
Allred et al, Submitted to EJNMMI Research 2018


Tc-MAA predicted vs. Y-90 delivered mean absorbed dose
Mikell et al, EANM Annual Meeting 2017

Past studies looking at Tc MAA – Y90 concordance
• Mixed conclusionsSpatial
granularity
registration device Analysis 90Y Cath
tip info?
Wondergem et al JNM 2013
segment ? resin BlandAlt SPECT Y
Gnesin et al JNM 2016
tumor ? mix ccc of dose ratio
mean, D70
PET N
Kneusarek et al TCRT 2010
Voxel-level CT-CT resin Correlation
coefficient, L2 norm
SPECT N Poor to highlycorrelated
Poor correlation
moderate
Gnesin et al, JNM 2016 Haste et al, J Vasc Interv Radiol 2017


Lesion Dose-Response
Dewaraja et al, to be presented at SNMMI 2018
Absorbed dose significantly (p < 0.05) associated with shrinkage. Median absorbed dose among responding andnon-responding tumors was 209 and 130 Gy (p=0.024) with RECIST and 271 and 97 Gy (p=0.004)with mRECIST criteria.

90Y RE with glass microspheres: past dose-response studies
• Threshold lesion dose predictive of response around 100-500 Gy
• Mostly based on predicted doses from Tc-MAA SPECT/CT– Garin, JNM 2012 (predictive of survival in HCC); Chiesa, EJNM 2015
(predictive of response in HCC); Kokabi,J Vasc Interv Radiol, 2014 (predictive of survival in HCC)
• Post therapy imaging based
– Y-90 Bremsstrahlung SPECT/CT based
• Strigari et al, JNM 2010 (predictive of response in HCC)
– Y-90 PET/CT based
• Fowler et al, Cardiovasc Interv Radiol, 2016(dose-response for CRC only); Srinivas et al, Front in Oncol, 2014 (HCC no dose- response)

Y-RE: Past dose – response studies
Garin et al
Kokabi et al
Strigari et al
Chiesa et al

Thank YouTo patients who volunteered for the presented clinical studies.
To collaborators Jeff Fessler PhD, Pete Roberson PhD, Scott
Wilderman PhD, Kyle Cuneo MD, Bill Majdalany MD, Dawn
Owen, MD, Ravi Kaza MD, Ravi Srinivasa MD, Justin Mikell PhD
Funding from NIH(NIBIB) grant R01EB022075 is Acknowledged