dose response severity functions for acoustic disturbance...
TRANSCRIPT

Dose response severity functions for acoustic disturbancein cetaceans using recurrent event survival analysis
C. M. HARRIS,1,� D. SADYKOVA,1 S. L. DERUITER,1 P. L. TYACK,2 P. J. O. MILLER,2 P. H. KVADSHEIM,3
F. P. A. LAM,4 AND L. THOMAS1
1Centre for Research into Ecological and Environmental Modelling, Buchanan Gardens,University of St Andrews, St Andrews, Fife KY16 9LZ Scotland, United Kingdom
2Sea Mammal Research Unit, Scottish Oceans Institute, University of St Andrews, St Andrews,Fife KY16 8LB Scotland, United Kingdom
3Norwegian Defence Research Establishment (FFI), Maritime Systems, N-3191 Horten, Norway4Acoustics & Sonar Research Group, Netherlands Organization for Applied Scientific Research (TNO),
Oude Waalsdorperweg 63, 2597 AK The Hague, The Netherlands
Citation: Harris, C. M., D. Sadykova, S. L. DeRuiter, P. L. Tyack, P. J. O. Miller, P. H. Kvadsheim, F. P. A. Lam, and L.
Thomas. 2015. Dose response severity functions for acoustic disturbance in cetaceans using recurrent event survival
analysis. Ecosphere 6(11):236. http://dx.doi.org/10.1890/ES15-00242.1
Abstract. Behavioral response studies (BRSs) aim to enhance our understanding of the behavior changes
made by animals in response to specific exposure levels of different stimuli, often presented in an
increasing dosage. Here, we focus on BRSs that aim to understand behavioral responses of free-ranging
whales and dolphins to manmade acoustic signals (although the methods are applicable more generally).
One desired outcome of these studies is dose-response functions relevant to different species, signals and
contexts. We adapted and applied recurrent event survival analysis (Cox proportional hazard models) to
data from the 3S BRS project, where multiple behavioral responses of different severities had been
observed per experimental exposure and per individual based upon expert scoring. We included species,
signal type, exposure number and behavioral state prior to exposure as potential covariates. The best
model included all main effect terms, with the exception of exposure number, as well as two interaction
terms. The interactions between signal and behavioral state, and between species and behavioral state
highlighted that the sensitivity of animals to different signal types (a 6–7 kHz upsweep sonar signal
[MFAS] or a 1–2 kHz upsweep sonar signal [LFAS]) depended on their behavioral state (feeding or non-
feeding), and this differed across species. Of the three species included in this analysis (sperm whale
[Physeter macrocephalus], killer whale [Orcinus orca] and long-finned pilot whale [Globicephala melas]), killer
whales were consistently the most likely to exhibit behavioral responses to naval sonar exposure. We
conclude that recurrent event survival analysis provides an effective framework for fitting dose-response
severity functions to data from behavioral response studies. It can provide outputs that can help
government and industry to evaluate the potential impacts of anthropogenic sound production in the
ocean.
Key words: behavioral response; cetaceans; controlled exposure experiment; Cox proportional hazards model;
Globicephala melas; Orcinus orca; Physeter macrocephalus; response intensity; sonar.
Received 23 April 2015; revised 4 June 2015; accepted 8 June 2015; published 20 November 2015. Corresponding Editor:
D. P. C. Peters.
Copyright: � 2015 Harris et al. This is an open-access article distributed under the terms of the Creative Commons
Attribution License, which permits unrestricted use, distribution, and reproduction in any medium, provided the
original author and source are credited. http://creativecommons.org/licenses/by/3.0/
� E-mail: [email protected]
v www.esajournals.org 1 November 2015 v Volume 6(11) v Article 236

INTRODUCTION
Many marine mammals rely on sound forforaging, maintaining group cohesion, naviga-tion, finding mates and avoiding predators.Hence, they may be profoundly affected by theintroduction of anthropogenic noise into themarine environment. Examples of potentiallyharmful noise sources include vessel noise andactive acoustic devices such as naval sonar orairguns used for seismic prospecting (Richardsonet al. 1995, DeRuiter 2010). Potential adverseeffects of those sounds include reduction orcessation of feeding (Miller et al. 2009, Goldb-ogen et al. 2013), strong avoidance responses(Tyack et al. 2011, DeRuiter et al. 2013, Miller etal. 2014), and stranding (D’Amico et al. 2009).Strong avoidance responses may exclude animalsfrom important habitats or result in separation ofdependent offspring and mother (Miller et al.2012).
Controlled exposure experiments (CEEs) arebehavioral response studies (BRSs) that follow anexperimental design and are an importantapproach for studying the short-term responsesof animals to specific doses of potential stressors.A growing number of these studies have beencarried out in recent years on a number ofdifferent cetacean species, specifically looking atdifferent acoustic stimuli (Kvadsheim et al. 2011,2012, 2014, Miller et al. 2011, Tyack et al. 2011,Southall et al. 2012, Dunlop et al. 2013). Together,these studies are increasing our understanding ofspecies differences in sensitivity to sound, andthe importance of context in influencing howindividuals respond. These types of studies arenot unique to the marine environment and havefollowed the example of many terrestrial studiesthat have investigated the behavioral responsesof a range of species experimentally exposed tohuman-induced disturbance (for example, RockyMountain elk [Preisler et al. 2006], grasslandraptors [Holmes et al. 1993], waterbirds [Klein1993] and ungulates [see Stankowich 2008 forreview]). The common objective across many ofthese studies has been to determine the relation-ship between the dose of a stressor (which can berepresented by many different metrics) andresponse.
CEEs on cetaceans are costly to undertake.Many species of interest occur at low density, or
are hard to monitor (for example if they aredifficult to locate or track, either at the surface orunderwater), and experiments can only takeplace in good weather conditions and whenother interfering noise sources are not present.Because of these factors, the sample sizesassociated with CEEs are usually very low:typically fewer than 10 exposures per speciesper field season, and sometimes substantiallyfewer (e.g., Kvadsheim et al. 2014).
In a CEE, the focal species is selected basedupon research need and the focal animal is theindividual that becomes the focus of the study.The behavior of the focal animal is monitoredusing visual observations, passive acoustics,animal-borne tags or a combination of these.After pre-exposure observations, the focal whaleis exposed to a stimulus, such as a potentiallydisturbing sound or control sound, and itsresponse is monitored. In many of the experi-ments the dose of sound increases over theduration of the exposure and therefore they canbe thought of as dose-escalation studies. Theincreasing dose is achieved either by increasingthe level of the source, or by approach of thevessel, which can increase the level of soundreceived at the animal by transmitting the soundstimulus while approaching the focal animal. Tounderstand the influence of this experimentaldesign on responsiveness, no-sonar control ex-posures are also conducted where the vesselapproaches in the same manner but no soundsare transmitted (e.g., Miller et al. 2011). Variousmeasurements are recorded before, during andafter exposure periods, including location of thefocal animal through time, vocal behavior,underwater orientation, and behavior observedat the surface. Care is taken to ensure that theexperimental animals are not injured or stressed,for example by having mitigation protocols inplace that result in shut-down if animals ap-proach too close or display an extreme response.
Following data collection, typically the firststage of analysis is to assemble and visualize theobservational data for each individual to deter-mine whether or not it responded, gauge themagnitude of any response and relate the onsetof response to sound exposure level (‘‘dose’’).There is ongoing development of quantitativemethods for identifying responses or ‘‘change-points’’ in behavior (for example, see DeRuiter et
v www.esajournals.org 2 November 2015 v Volume 6(11) v Article 236
HARRIS ET AL.

al. 2013, Goldbogen et al. 2013, Antunes et al.2014; http://www.creem.st-and.ac.uk/mocha/);however qualitative methods have also beenused effectively. The process of examining visualobservation and animal-borne tag records andsubsequent identification of putative responsesto exposure stimuli by panels of experts isdescribed in detail for the 3S BRS project inMiller et al. (2012). Miller et al. (2012) note thatthe results from such scoring exercises (hereinreferred to as expert scoring) are one interpreta-tion of the experiment outcome, and whilst theybelieve that they identified most responses thatoccurred during the experiments, there is thepossibility that some behavioral changes thatwere scored as responses may not have been inresponse to the sonar. Therefore, although thereis potential for bias, it is likely that the outputsfrom expert scoring are precautionary, which isthe preferred stance from a policy perspective(Miller et al. 2012). The output from expertscoring is a detailed record of all behavioralchanges that are likely to be responses to thestimuli for each exposure session with details ofthe time the response started, the correspondingexposure level (measured as sound pressure level[SPL] and cumulative sound exposure level[SELcum]) at the point of response, and anassessment of the severity of the response (seeMiller et al. 2012: Appendix A). Since the dosemetrics relate to the sonar sound, the responsesidentified during the no-sonar control experi-ments have zero dose associated with them. Eachresponse is attributed a score between 0 and 9which describes the severity of the response ofthe animal. This scoring is derived from theseverity scale described in Southall et al. (2007),and modified by Miller et al. (2012), and rangesfrom no effect (0), effects not likely to influencevital rates (severity of 1–3), effects that couldaffect vital rates (severity of 4–6), to effects thatare thought likely to influence vital rates (severityof 7–9).
The next stage is to combine the results fromindividual exposures to estimate the likelihood ofresponse as a function of exposure intensity(dose), and perhaps behavioral or environmentalcontext. There are two things to consider in ourapproach to this analysis. First, there may bemultiple responses per exposure and multipleexposures per individual animal. Second, there
may be individuals that showed no responseacross the range of doses they experienced overan exposure session. To account for the latter, aframework is needed that allows inclusion ofright-censored data where it is assumed aresponse will occur at some point above themaximum dose received during the exposuresession, but it is unknown by how much. Right-censored data are informative and should beincluded in any analysis (Klein and Moeschberg-er 2003). Miller et al. (2014) and Antunes et al.(2014) describe a Bayesian hierarchical approachthat allows the inclusion of censored data,accounts for multiple exposures per individual,and estimates response variability between andwithin whales. This approach, however, onlyallows for analysis of one response per individ-ual per exposure session. In their papers, Milleret al. (2014) and Antunes et al. (2014) focused onthe threshold for the first avoidance responseobserved in each exposure session.
Our aim was to find a framework for produc-ing dose-response severity functions that wouldallow us to consider all of the observed responsesper exposure session together, to account forcensored data, and to acknowledge the non-independence of responses made by the sameindividual.
CEEs are similar in many ways to clinicaltrials, which seek to identify the toxicity of adrug by administering different doses of thedrug and assessing responses, and also tomedical studies where the objective is to studyhow long it takes until certain events occur. Forthis reason we turned to the medical literature toseek appropriate analysis methods for thisecological question. We found that recurrentevent survival analysis (Kleinbaum and Klein2005) is often used to address questions anddata similar to ours. This approach is used inmedical studies to assess time to events such astumor occurrence (where the recurrent eventsare the same), or different disease symptoms(where recurrent events are different; Klein-baum and Klein 2005). It is also designed toaccept censored data, since an individual mayleave a study prior to the end, or not display asymptom by the end of a follow-up period. Theuse of survival analysis as a framework tomodel time-to-event data has been primarilyutilized for modeling time-to-death, or time-to-
v www.esajournals.org 3 November 2015 v Volume 6(11) v Article 236
HARRIS ET AL.

symptom expression in the medical and epide-miological domains; however there are docu-mented examples of its application withinecology. Muenchow (1986) advocated the useof such models in ecology and proposed anumber of ecological questions that could bephrased in terms of ‘‘time until an event occurs.’’Examples include flower visitation events byinsects (Muenchow 1986), time of fish passagein rivers (Zabel et al. 2014), tree mortality(Woodall et al. 2005) and duration of tarantulafighting (Moya-Lorano and Wise 2000). Most ofthese authors note the novelty of the applicationof survival analysis within their specific fields.One particular area of expansion of its applica-tion has been in plant pathology (see Schermand Ojiambo 2004 for summary) and it is herethat we found the only example of the use ofrecurrent event survival analysis within ecology(Thomson and Copes 2009). We were particu-larly interested in the variant of these recurrentevent survival models called the marginalstratified Cox proportional hazards model. Inthe marginal approach each event is consideredas a separate process (i.e., there is no conditionon events being progressive, such as in a diseasewhere symptoms have to occur in a certainorder), and different response events can repre-sent different response types that may occur inthe same subject (Kleinbaum and Klein 2005).
Here we demonstrate and evaluate the appli-cation of recurrent event survival analysis todevelop dose-response severity functions in thecontext of cetacean CEEs, using data on killerwhales, long-finned pilot whales and spermwhales from the 3S BRS project (Miller et al.2011).
METHODS
DataThe expert scored response data were provid-
ed by the 3S BRS project, which includes data onkiller whales, long-finned pilot whales andsperm whales exposed to three different sonarsignals, as well as killer whale playbacks andno-sonar control sessions (all data used arepublicly available; see Miller et al. [2011] for fulldescription of project and controlled exposureexperiments, Miller et al. [2012] for descriptionof expert scoring, and Appendix A of Miller et
al. [2012] for descriptions of scored responses).Here we focus only on the exposures to twosonar signals that were conducted as dose-escalation experiments where the vessel ap-proached the focal animal during exposure toincrease the received sound level at the animal:a 6–7 kHz upsweep signal (MFAS) and a 1–2kHz upsweep signal (LFAS). These signals werethe primary focus of the study and, as such, thedata come from a balanced study design wherethe order in which signal types were presentedwas alternated from one experiment to the next.The data comprise 27 exposure sessions across14 different individuals (four sperm whales,four killer whales and six long-finned pilotwhales). No-sonar control exposures were notincluded in this analysis because the sonar doseis zero for all identified responses, and othermetrics of sound level such as ship noise relatedto vessel approach have not been measured.
Behavioral responses during each exposureevent were identified by expert scoring (Milleret al. 2012) and each identified response eventwas assigned a severity score by the expertsaccording to the severity scale outlined in Milleret al. (2012). The responses were also alignedwith the corresponding levels of the receivedsonar signals recorded on the animal-borne tag(DTAG; Johnson and Tyack 2003). Although theseverity scale ranges from 0 (no response) to 9(severe response), we did not have enough dataacross the scale to fit separate exposure-re-sponse functions for each of the nine scores.Therefore, we binned the data into three levels; 1¼ mild (severity scores 1–3), 2 ¼ moderate(severity scores 4–6), 3¼ severe (severity scores7–9). Instead of including 0 (no response) as aseparate level, we included data from thesesessions as right-censored (described below).We identified the first occurrence of eachresponse level within each exposure session forinclusion in the model.
Recurrent event survival analysis is generallyused to assess time-to-event; however we wereinterested in acoustic dose-to-event, and so wereplaced time with received acoustic energy inthe form of cumulative sound exposure level(SELcum). SELcum is a measure of soundenergy integrated over the duration of theexposure, which increases monotonicallythroughout each sonar exposure session. In the
v www.esajournals.org 4 November 2015 v Volume 6(11) v Article 236
HARRIS ET AL.

3S dose-escalation experimental design, thevalues of SELcum were highly correlated withthe maximum received sound pressure level(Miller et al. 2014).
In the marginal variant of the stratified Coxproportional hazards model, each individual isconsidered to be at risk of all response levels.Therefore for each response level the ‘‘starttime,’’ or in our case initial dose (SELcum),was the same, i.e., the first dose of thatparticular exposure session. If all three responselevels were observed, in ascending order ofseverity, then the dose relating to each responseevent was allocated accordingly. If, however, amoderate or severe response was observedwithout a preceding mild or moderate response,then the dose allocated to the lower level wasthe same as that observed for the higher level.Similarly, if a mild response was observed at ahigher SELcum than a moderate response, thenwe replaced the observed SELcum for the mildresponse with the value for the moderateresponse. This data structure does not implythat responses have to occur in a progressivemanner, with mild responses occurring beforemoderate, etc. Rather, this approach assumesthat observing one more severe response meansthat the equivalent of all less-severe responseshas also occurred, simultaneously if not previ-ously. This is a reasonable assumption in abroad context of response severity and we havetherefore structured the data set to reflect this.See Thomson and Copes (2009) for an exampleof similar data structuring.
In the case of no response across all levelswithin an exposure session, then each level wasallocated the cumulative received level (SELcum)at the end of the exposure session, and the datawere labelled as censored. Similarly if only mildand/or moderate response events were observedthen a censored value was allocated to the higherseverity response level.
Model specificationThe data comprise K¼ 14 individuals and N¼
27 exposure sessions in total, with up to threeexposures per whale. Severity level was denotedas S ¼ 1, 2, 3 and XSkn denoted the value of avector of covariates X for individual k (k¼ 1,. . . ,K ) at exposure session n (n ¼ 1,. . . , N ) withrespect to the Sth stratum (severity level). Then a
marginal stratified Cox proportional hazardregression model can be defined as Eq. 1.
hSðSELcumjXÞ ¼ h0SðSELcumÞexpðXTbÞ;S ¼ 1; :::; 3 ð1Þ
where hS(SELcumjX) is the stratum-dependenthazard function, h0S(SELcum) is the stratum-dependent baseline hazard and b is the stratum-dependent vector of regression coefficients,which are estimated by the method of maximumpartial likelihood estimation (Cox 1975, Therneauand Grambsch 2000). The hazard function in thiscase gives the probability of a response occurringat a given unit of SELcum, given that theindividual has not responded up to that point(Kleinbaum and Klein 2005). We assumed thatthe observations were clustered (and thereforecorrelated) within individuals and that there wasindependence between individuals (clusters).The standard errors of the model estimates werecorrected for the correlations within the clustersusing a grouped jackknife procedure (Therneauand Grambsch 2000: Section 8.2.1).
The covariates considered were species (killerwhale, sperm whale, long-finned pilot whale),signal (MFAS, LFAS), exposure number (1–3) andbehavioral state in the pre-exposure period(feeding, non-feeding). All were specified asfactor covariates with the exception of exposurenumber. It was unclear whether exposure num-ber should be included as a continuous covariate,and therefore we fitted models where it wasincluded as a continuous covariate, an orderedcategorical covariate or factor covariate. Behav-ioral state, feeding or non-feeding, was deter-mined by the diving and vocalizing behavior ofthe animals prior to exposure (based on thebehavioral description in Miller et al. [2011]) andfeeding was assigned if any feeding behavior wasobserved during any part of the pre-exposureperiod. We considered all combinations ofcovariates up to, and including, all first-orderinteraction terms and carried out backwardsselection from the full model, dropping thecovariate with the highest p-value (from a Waldv2 test) at each iteration until all remainingcovariates had p-values less than 0.05. For thebest fitting model, we tested that the proportion-al hazards assumption and the no-interactionassumption were both met (Kleinbaum and Klein2005). The proportional hazards assumption
v www.esajournals.org 5 November 2015 v Volume 6(11) v Article 236
HARRIS ET AL.

requires that the hazard for one individual isproportional to the hazard for any other individ-ual, where the proportionality constant is inde-pendent of time (or SELcum in this case), and theno-interaction assumption requires that b coeffi-cients do not vary across severity categories(Kleinbaum and Klein 2005). To test the propor-tional hazards assumption, we carried out a v2
test to determine if the slope of the scaledSchoenfeld residuals differed significantly fromzero (Grambsch and Therneau 1994). Schoenfieldresiduals relate to the difference between anindividual’s covariate value when there is aresponse event and the weighted average of thecovariate values for the other individuals still atrisk at the relevant SELcum. The weights are eachindividual’s hazard (Kleinbaum and Klein 2005).We tested the no-interaction assumption bycomparing a model with no interactions and amodel where each covariate interacts with thestratum indicator (severity level) using a likeli-hood ratio test. The fit of the best model wasevaluated using the Cox-Snell residuals, whichare the estimated cumulative hazards for indi-viduals at their response (or censoring) times (orcorresponding SELcum in this case). If a modelfits the data well, then the cumulative hazardfunction conditional on the covariate vectorshould have an exponential distribution with ahazard rate of one (i.e., the estimated cumulativehazard of the Cox-Snell residuals should looklike a 45-degree line).
All statistical analyses were carried out in Rversion 3.0.2 (R Core Team 2015) using theSurvival library (Therneau 2015), and in SASsoftware version 9.3 (SAS Institute, Cary, NorthCarolina, USA). We used SAS to carry out themodel selection procedure because our modelincluded factor covariates. SAS model outputprovides p-values for factor level comparisons,but also p-values that relate to the contribution ofthe factor to model fit. The latter is not readilyavailable in R, but is required for backwardsselection.
RESULTS
Model selection and testing assumptionsThe selected model included signal, species
and behavioral state as well as an interactionterm between species and behavioral state, and
between signal and behavioral state (Table 1).Note that we have no data on sperm whales in anon-feeding behavioral state and therefore wecould not make any inference or predictionsabout non-feeding sperm whales. There was nosignificant effect of exposure number (no ordereffect) when included as a continuous, orderedcategorical or factor covariate. Fig. 1 shows thatthe model fitted reasonably well to the data: athigh values of cumulative hazard rate the datapoints lie above the 45 degree line, however, it isin the tail of such functions where variability dueto estimation uncertainty is the greatest and sothese deviations are not of major concern (Box-Steffensmeier and Jones 2004).
The best-fitting model met both the propor-tional hazards assumption (global p-value fromv2 test ¼ 0.067) and the no-interaction assump-tion (the model with interactions between covar-iates and stratum was not significantly betterthan the model without these interaction terms; p¼ 0.184). As both assumptions were met, noremedial action was required.
Biological interpretationIn this section we provide an overview of the
model output from a biological perspective, butwe advise caution applying the results from thiscase study. Though the data are unique, thesample sizes for each species were small and,with the inclusion of explanatory covariates, weare describing outputs which, in some cases,result from a sample size of one individual (e.g.,feeding killer whales exposed to LFAS). Inaddition, we have not included no-sonar controlexposures in this analysis and so there is nodirect evaluation of the relative contributions ofvessel approach and sonar exposure in theprobability of response.
From the model we can produce dose-responsefunctions for the three different severity levelsaveraged across all covariates and accounting forcensored data (Fig. 2). All dose-response func-tions were generated using the survfit functionwithin the Survival library in R, which can beused to produce survival curves based on a fittedmodel. We can see from Fig. 2A that theprobability of a mild level 1 response increasedsteadily from a SELcum of 87 dB re 1 lPa2sthrough to 168 dB re 1 lPa2s at which point theprobability of response (P-response) was equal to
v www.esajournals.org 6 November 2015 v Volume 6(11) v Article 236
HARRIS ET AL.
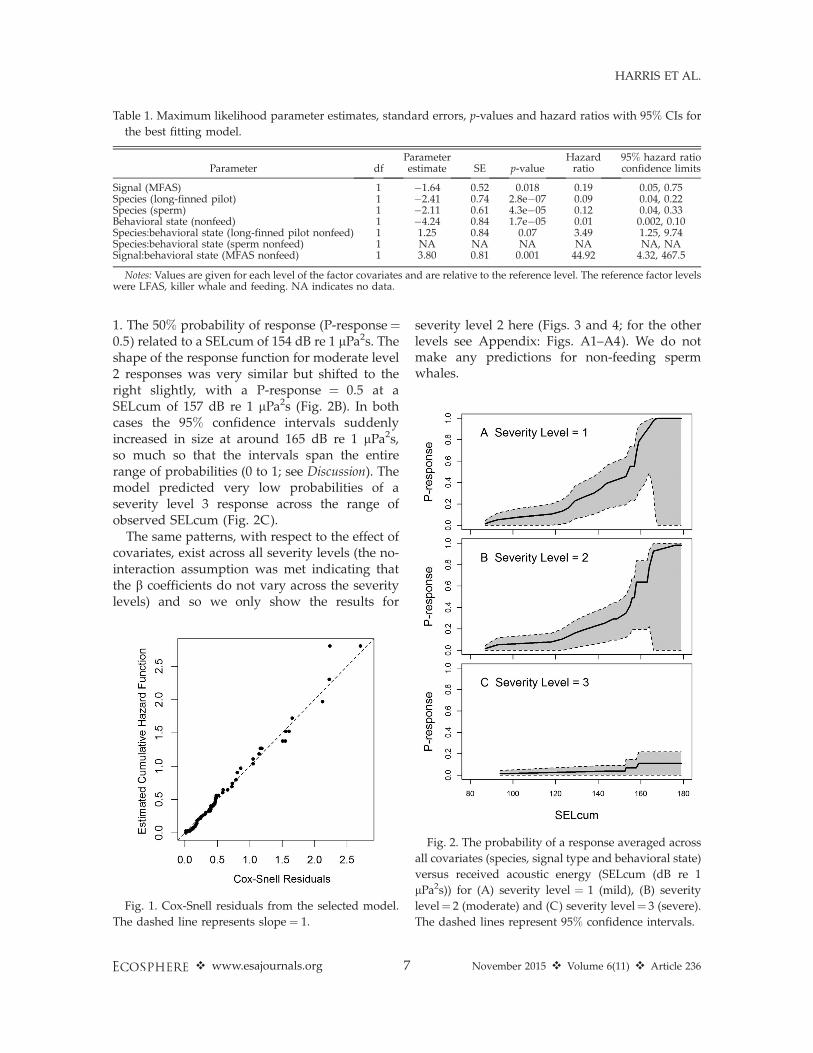
1. The 50% probability of response (P-response¼0.5) related to a SELcum of 154 dB re 1 lPa2s. Theshape of the response function for moderate level2 responses was very similar but shifted to theright slightly, with a P-response ¼ 0.5 at aSELcum of 157 dB re 1 lPa2s (Fig. 2B). In bothcases the 95% confidence intervals suddenlyincreased in size at around 165 dB re 1 lPa2s,so much so that the intervals span the entirerange of probabilities (0 to 1; see Discussion). Themodel predicted very low probabilities of aseverity level 3 response across the range ofobserved SELcum (Fig. 2C).
The same patterns, with respect to the effect ofcovariates, exist across all severity levels (the no-interaction assumption was met indicating thatthe b coefficients do not vary across the severitylevels) and so we only show the results for
severity level 2 here (Figs. 3 and 4; for the otherlevels see Appendix: Figs. A1–A4). We do notmake any predictions for non-feeding spermwhales.
Table 1. Maximum likelihood parameter estimates, standard errors, p-values and hazard ratios with 95% CIs for
the best fitting model.
Parameter dfParameterestimate SE p-value
Hazardratio
95% hazard ratioconfidence limits
Signal (MFAS) 1 �1.64 0.52 0.018 0.19 0.05, 0.75Species (long-finned pilot) 1 �2.41 0.74 2.8e�07 0.09 0.04, 0.22Species (sperm) 1 �2.11 0.61 4.3e�05 0.12 0.04, 0.33Behavioral state (nonfeed) 1 �4.24 0.84 1.7e�05 0.01 0.002, 0.10Species:behavioral state (long-finned pilot nonfeed) 1 1.25 0.84 0.07 3.49 1.25, 9.74Species:behavioral state (sperm nonfeed) 1 NA NA NA NA NA, NASignal:behavioral state (MFAS nonfeed) 1 3.80 0.81 0.001 44.92 4.32, 467.5
Notes: Values are given for each level of the factor covariates and are relative to the reference level. The reference factor levelswere LFAS, killer whale and feeding. NA indicates no data.
Fig. 1. Cox-Snell residuals from the selected model.
The dashed line represents slope ¼ 1.
Fig. 2. The probability of a response averaged across
all covariates (species, signal type and behavioral state)
versus received acoustic energy (SELcum (dB re 1
lPa2s)) for (A) severity level ¼ 1 (mild), (B) severity
level¼ 2 (moderate) and (C) severity level¼ 3 (severe).
The dashed lines represent 95% confidence intervals.
v www.esajournals.org 7 November 2015 v Volume 6(11) v Article 236
HARRIS ET AL.

Comparing the sensitivity of all three species,we see that killer whales have a higherprobability of responding at lower SELcum thanlong-finned pilot whales and sperm whalesacross all signal types and behavioral states(Fig. 3). There was little difference in theprobability of response of long-finned pilotwhales and sperm whales.
There were differences in the way speciesresponded depending on their behavior state,hence the significant interaction term betweenthese covariates. For example, long-finned pilotwhales were predicted to respond to MFAS atslightly lower SELcum when non-feeding com-pared to feeding, but the opposite was true forLFAS where they were predicted to respond atmuch higher SELcum when non-feeding com-pared to feeding. By contrast, killer whales hada lower probability of responding to bothsignal types when in a non-feeding statecompared to feeding, although the difference
was much more marked for the LFAS signal
(Fig. 3).
Regarding sensitivity within species, sperm
whales were predicted to respond to LFAS at
lower SELcum compared to MFAS (Fig. 3, data
only for feeding sperm whales). Killer whales
and long-finned pilot whales were also predicted
to respond to LFAS signals at lower SELcum
when feeding compared to MFAS (Fig. 4) whilst
the opposite is predicted when in a non-feeding
state (Fig. 4). This explains the significant
interaction term between signal and behavioral
state, which was due to a large difference in
sensitivity to LFAS across behavioral states
rather than a difference in sensitivity to MFAS.
However, as noted earlier there is only one
datum each for feeding killer whales exposed to
LFAS and feeding long-finned pilot whales
exposed to LFAS, and therefore we need to limit
our inference from these results.
Fig. 3. The probability of a response occurring in killer whales (dashed line), long-finned pilot whales (dotted
line) and sperm whales (solid line) versus received acoustic energy (SELcum (dB re 1 lPa2s)) for severity level¼ 2
when signal¼MFAS (A and C) and LFAS (B and D) and behavioral state¼ feeding (A and B) and non-feeding (C
and D). Mean probabilities are all shown in black, while 95% confidence intervals are shown in grey. Similar plots
for severity levels 1 and 3 are shown in Appendix: Figs. A1 and A2.
v www.esajournals.org 8 November 2015 v Volume 6(11) v Article 236
HARRIS ET AL.

DISCUSSION
Recurrent event survival analysis as applied to datafrom acoustic exposure experiments: pros and cons
The use of recurrent event survival analysiswithin the context of cetacean CEEs has allowedus to generate dose-response severity functionsfrom an integrated multi-signal, multi-speciesmodel whilst dealing appropriately with cen-sored data. The model was effective in estimatingmodel parameters despite low sample size.
Recurrent event survival analysis has enabledus to expand upon previous exposure-responseanalysis of CEE data (Antunes et al. 2014, Milleret al. 2014), allowing us to generate functions forresponses of different types whilst acknowledg-ing that multiple responses may have beenobserved within one exposure session and byone individual across multiple exposure sessions.Here we chose to model responses of differentseverity levels, but an alternative would be to
divide the data into behavioral categories insteadand model the onset of different response types(e.g., vocal response, dive response, avoidanceresponse). The latter would allow us to deter-mine whether different contexts result in differ-ent types of responses as well as differentseverity levels.
One of the main motivations for searching themedical literature for an analysis method was tofind a framework that would accommodatecensored data. In experiments such as BRS CEEsit is important to include the data from exposureswhen animals did not respond, to avoid negativebias whereby we might predict animals, onaverage, to respond at lower doses than weobserved. In this study, the main visible conse-quence of including the censored data was thevery large confidence intervals seen in Fig. 2. Thisis due to the nature of these data, which werecollected as part of a dose-escalation studywhereby nearly all of the data points at SELcum
Fig. 4. The probability of a response occurring during LFAS (dashed line) and MFAS (solid line) exposures
versus received acoustic energy (SELcum (dB re 1 lPa2s)) for severity level ¼ 2 for long-finned pilot whales (A
and C) and killer whales (B and D) and when behavioral state¼ feeding (A and B) and non-feeding (C and D).
Mean probabilities are all shown in black, while 95% confidence intervals are shown in grey. Similar plots for
severity levels 1 and 3 are shown in Appendix: Figs. A3 and A4.
v www.esajournals.org 9 November 2015 v Volume 6(11) v Article 236
HARRIS ET AL.

above 165dB were censored data points repre-senting animals that did not respond to themaximum sound level received. The preponder-ance of censored data for high SELcum valuesleads to very large uncertainty over this part ofthe function.
The output of the model can be viewed eitheras dose-response functions for each severity levelaveraged across all covariates (Fig. 2), or as dose-response functions for particular combinations ofcovariates (Figs. 3 and 4). The output from ourcase study data set shows little difference in thefunctions for the mild and moderate severitylevels, which implies a similar probability ofobserving a mild or moderate response for agiven dose. However, it should be noted that thesimilarity in these functions is partly an artifact ofour assumption that if a moderate or severeresponse was observed, but not a mild response,then all responses at least as severe as thatresponse have also occurred at the same receivedlevel. In this data set, this assumption resulted in19 instances (out of a possible 31) where a mildresponse was allocated the received level ob-served for a moderate response. The effect of thisassumption would be reduced in data sets wheremore mild responses were observed. Alternative-ly, we could remove the need for such anassumption if we chose to model different typesof response (e.g., vocal, movement) rather thandifferent intensities of response. However, thisassumption predominantly affects the functionfor the mild level 1 severity responses, whichmay be of least interest from a regulatory point ofview.
Miller et al. (2014) and Antunes et al. (2014)modelled the onset of the first avoidance/hori-zontal movement response observed for eachexposure session using a Bayesian hierarchicalmodel which fitted the observed thresholds to anassumed, underlying dose-response model. Theadvantage of the Bayesian framework over thesurvival analysis approach is that previousknowledge could be used to derive initialestimates (priors) of dose-response, which canbe useful when faced with such small samplesizes. Miller et al. (2014) used simulation studiesto demonstrate that the Bayesian approach wasable to recover an underlying dose-responsefunction with limited bias based upon the sizeof the data set they were able to obtain in the
field, providing reassurance that the posteriorestimates of the dose-response model were notoverly influenced by the uninformative priorsused in that case, but rather reflected trends inthe data. In addition, the priors and theunderlying form of the model constrain theresulting exposure-response function to conformto the expected shape for such functions. The Coxproportional hazards model has no such con-straints and therefore there is the possibility ofextremely wide confidence intervals for regionsof acoustic dose where data are sparse, orexposure-response functions with unexpectedshapes. We did not experience the latter problemwith this case study data set but it is somethingthat may need to be addressed in futureiterations. The advantage of the survival analysisapproach over the Bayesian hierarchical model isthe ability to model multiple response eventswithin one framework rather than carrying outmultiple, independent analyses on each responsetype.
The proportional hazards assumption thatthere is a constant hazard ratio across time(SELcum) underpins the use of Cox proportionalhazards models, and if this assumption isviolated then the use of these models is inappro-priate. In our case study the assumption was met,but only marginally. It is worth noting that thereare options to consider if the assumption isviolated (e.g., see Kleinbaum and Klein [2005] fordetails), and we discuss these briefly here. Thefirst option would be to stratify by the covariatethat is causing the violation. In our case we hadalready chosen to stratify by severity level toaddress our particular question of interest and soit would not have been viable to stratify byanother covariate. The second option would be toadd an interaction term between the covariatecausing violation and SELcum, or a function ofSELcum, which is referred to as an extended Coxmodel (Kleinbaum and Klein 2005).
Case study resultsFrom a biological perspective, the novelty of
the model fitted here is the inclusion of acontextual variable (pre-exposure behavioralstate), and the combining of species in onemodel. Both Miller et al. (2014) and Antunes etal. (2014) discussed the importance of context inexplaining the remaining within- and between-
v www.esajournals.org 10 November 2015 v Volume 6(11) v Article 236
HARRIS ET AL.

whale variability in their models, but neitherstudy modelled the effect of contextual variablesbeyond sonar frequency and exposure order. Thisis understandable given the data, as in both casesthey were fitting to data from a single speciesand therefore sample size precluded the inclu-sion of more than a few covariates. Even whenwe combined the data from three species, oursample size was fairly limited, and by including acontextual variable and first-order interactionterms we have pushed the data to its limits.When we divide the data by species, signal typeand behavioral state this results in some catego-ries with a sample size of one. We are thereforecautious in our biological interpretation of themodel output from this case study. However,there are similarities in the results between ourstudy and previous analyses of these same datausing different methodologies (Miller et al. 2012,2014, Antunes et al. 2014), which gives usconfidence in the application of the model.
It is also worth noting that while we showresults from backwards model selection based onp-values, there are alternative model selectionoptions. We also explored the use of AIC-basedmodel selection with the same data set and theselected model was the same using both ap-proaches, however the AIC method resulted inquite a few models with AIC values close to theselected model and so, given this awareness ofcompeting models, we further emphasize cautionwhen interpreting the biological results.
Our results suggest that pre-exposure behav-ioral state (feeding or non-feeding) can make adifference to the way in which an individualresponds to exposure and that this differsdepending upon species and signal type. Thisagrees with research on bowhead whales whichwere observed to react differently to seismicairgun sounds depending on whether they werefeeding or migrating (Richardson et al. 1986,1999, Miller et al. 2005), and on blue whaleswhich were found to have different levels ofresponsiveness depending on their diving andforaging behavior (Goldbogen et al. 2013). Theimportance of context has long been recognized(Southall et al. 2007, Ellison et al. 2012, Miller etal. 2012) and here we have only managed toinvestigate one aspect of this. However, assample size increases, we anticipate that it willbe possible to include other relevant contextual
variables, for example relating to social settings.Combining the data from multiple species into
one model has allowed us to borrow strengthacross the individual data sets and increase thesample size, providing an opportunity to incor-porate more explanatory variables as describedabove. It has also allowed us to compare directlythe responses of each species within one modeland determine whether the descriptive differenc-es resulting from Miller et al. (2014) and Antuneset al. (2014) whereby killer whales were deemedmore sensitive than pilot whales is a quantita-tively significant difference (Table 1). Directcomparison between species is complicated bythe interaction of their responses with context,but the killer whale is significantly more sensitivethan pilot whales and sperm whales in allsituations, except when exposed to LFAS whilstin a non-feeding state. We believe there issignificant scope to expand the multi-speciesapproach using this framework.
Future workWe have demonstrated the utility of this
framework using the 3S BRS data on killerwhales, long-finned pilot whales and spermwhales as a case study. When further expert-scored data become available, we anticipateusing the framework as a tool for meta-analysisacross multiple BRS projects. Despite the antici-pated increase in sample size, there will un-doubtedly be new analytical challenges relatingto an increase in the number of covariates, andlevels within covariates.
A significant challenge will be the inclusion ofno-sonar control exposures, where the sourcevessel approaches the animal without sonartransmissions. Although it is desirable to includethe data from these experimental sessions in ouranalysis to better understand the contribution ofthe vessel approach to responsiveness, they havebeen excluded to date because of difficulties indefining an appropriate dose metric for inclusionin analysis. The sonar dose is zero and notescalating, and other, potentially relevant soundmetrics such as ship propulsion noise, have notbeen measured. Expert scored response datahave been published for the no-sonar controlexposures (Miller et al. 2012, Sivle et al. 2015) andresults showed that these exposures had both thefewest responses scored per session and the
v www.esajournals.org 11 November 2015 v Volume 6(11) v Article 236
HARRIS ET AL.

lowest proportion of sessions with maximumseverity scores of 4 or greater. This implies thatthere was a lower probability of individualsresponding to the approaching vessel than tosonar exposure, and that when they did respondit was to a lesser extent. However, withoutincluding data from both sonar exposures andno-sonar control exposures in one dose-responseanalysis framework we cannot quantitativelyevaluate the features of the sonar exposure thatare driving a response, in particular the role ofthe approaching vessel. Miller et al. (2014) alsoexcluded the data from no-sonar control expo-sures in their Bayesian dose-response analysis;they believed that it was unlikely that theresponses identified by expert scoring were aresult of ship propulsion noise alone, but that insome cases the approaching vessel may have hadan effect on overall responsiveness. One possi-bility for the future may be to investigatedifferent dose metrics, such as whale-vesselrange, which, unlike received sound level, is ameasure that is available for both sonar and no-sonar control exposures.
ConclusionsThe analogous nature of the scientific ques-
tions, experimental approaches, and data fromBRS CEEs and medical studies has led to a novelapplication and extension of recurrent eventsurvival analysis within ecology. Replacementof time with received acoustic energy allowed usto produce event curves relative to a relevantmetric (sound dose) and there are likely manyother metrics in ecology to which this extensionmay be applicable. We believe the framework isan effective analytical tool for fitting dose-response severity functions, a key output of BRSsthat are much needed by regulatory communi-ties.
ACKNOWLEDGMENTS
This work was financially supported by the U. S.Office of Naval Research grant N00014-12-1-0204,under the project ‘‘Multi-study Ocean acoustics Hu-man effects Analysis’’ (MOCHA). We thank theMOCHA working group for input and feedback atvarious stages of analysis development. Although theMOCHA project itself is funded by the US Office ofNaval Research, we rely on the participation of theworking group members whose time and efforts are
supported by a wide range of institutes and funders. P.L. Tyack received funding from the MASTS poolinginitiative (The Marine Alliance for Science andTechnology for Scotland) and their support is grate-fully acknowledged. MASTS is funded by the ScottishFunding Council (grant reference HR09011) andcontributing institutions. The case study data wereprovided by the 3S project, which was funded by theU.S. Office of Naval Research, the Norwegian Ministryof Defense, the Netherlands Ministry of Defense, andWWF Norway. We thank an anonymous reviewer forproviding constructive feedback on a previous draft ofthis manuscript.
LITERATURE CITED
Antunes, A., P. H. Kvadsheim, F. P. A. Lam, P. L. Tyack,L. Thomas, P. J. Wensveen, and P. J. O. Miller. 2014.High thresholds for avoidance of sonar by free-ranging long-finned pilot whales (Globicephalamelas). Marine Pollution Bulletin 83(1):165–180.
Box-Steffensmeier, J. M., and B. S. Jones. 2004. Eventhistory modeling: a guide for social scientists(analytical methods for social research). CambridgeUniversity Press, Cambridge, UK.
Cox, D. R. 1975. Partial likelihood. Biometrika 62:269–76.
D’Amico, A., R. C. Gisiner, D. R. Ketten, J. A.Hammock, C. Johnson, P. L. Tyack, and J. Mead.2009. Beaked whale strandings and naval exercises.Aquatic Mammals 35:452–472.
DeRuiter, S. L. 2010. Marine animal acoustics. Pages425–474 in X. Lurton, editor. An introduction tounderwater acoustics. Praxis, Chichester, UK.
DeRuiter, S. L. et al. 2013. First direct measurements ofbehavioural responses by Cuvier’s beaked whalesto mid-frequency active (MFA) sonar. BiologyLetters 9:20130223.
Dunlop, R. A., M. J. Noad, D. H. Cato, E. Kniest, P. J. O.Miller, J. N. Smith, and M. D. Stokes. 2013.Multivariate analysis of behavioural responseexperiments in humpback whales (Megaptera no-vaeangliae). Journal of Experimental Biology216:759–770.
Ellison, W. T., B. L. Southall, C. W. Clark, and A. S.Frankel. 2012. A new context-based approach toassess marine mammal behavioral responses toanthropogenic sound. Conservation Biology 26:21–28.
Goldbogen, J. A. et al. 2013. Blue whales respond tosimulated mid-frequency military sonar. Proceed-ings of the Royal Society B 280(1765):20130657.
Grambsch, P., and T. Therneau. 1994. Proportionalhazards tests and diagnostics based on weightedresiduals. Biometrika 81:515–526.
Holmes, T. L., R. L. Knight, L. Stegall, and G. R. Craig.1993. Responses of wintering grassland raptors to
v www.esajournals.org 12 November 2015 v Volume 6(11) v Article 236
HARRIS ET AL.

human disturbance. Wildlife Society Bulletin21:461–468.
Johnson, M. P., and P. L. Tyack. 2003. A digital acousticrecording tag for measuring the response of wildmarine mammals to sound. IEEE Journal ofOceanic Engineering 28:3–12.
Klein, M. L. 1993. Waterbird behavioral responses tohuman disturbance. Wildlife Society Bulletin 21:31–39.
Klein, J. P., and M. L. Moeschberger. 2003. Survivalanalysis: techniques for censored and truncateddata. Second edition. Springer, Berlin, Germany.
Kleinbaum, D. G., and M. Klein. 2005. Survivalanalysis: a self-learning text. Third edition. Spring-er, Berlin, Germany.
Kvadsheim, P. et al. 2011. Behavioural response studiesof cetaceans to naval sonar signals in Norwegianwaters �3S-2011 cruise report. http://rapporter.ffi.no/rapporter/2011/01289.pdf
Kvadsheim, P. et al. 2014. Behavioural responses ofcetaceans to naval sonar signals—the 3S-2013cruise report. http://rapporter.ffi.no/rapporter/2014/00752.pdf
Kvadsheim, P., F. P. Lam, P. J. Miller, P. Wensveen, F.Visser, L. Doksæter, L. Kleivane, C. Cure, P. Ensor,S. van Ijsselmuide, and R. Dekeling. 2012. Behav-ioural response studies of cetaceans to naval sonarsignals in Norwegian waters �3S-2012 cruisereport. http://rapporter.ffi.no/rapporter/2012/02058.pdf
Miller, G. W., V. D. Moulton, R. A. Davis, M. Holst, P.Millman, A. MacGillivray, and D. Hannay. 2005.Monitoring seismic effects on marine mammals—southeastern Beaufort Sea, 2001-2002. Pages 511–542 in S. L. Armsworthy, P. J. Cranford, and K. Lee,editors. Offshore oil and gas environmental effectsmonitoring: approaches and technologies. BattellePress, Columbus, Ohio, USA.
Miller, P. J., R. Antunes, A. C. Alves., P. H. Kvadsheim,L. Kleivane, N. Nordlund, F. P. A. Lam, S. vanIjsselmuide, F. Visser, and P. L. Tyack. 2011. The 3Sexperiments: studying the behavioural effects ofnaval sonar on killer whales (Orcinus orca), spermwhales (Physeter macrocephalus), and long-finnedlong-finned pilot whales (Globicephala melas) inNorwegian waters. Scottish Oceans Institute Tech-nical Report SOI-2011- 001. http://soi.st-andrews.ac.uk/documents/424.pdf
Miller, P. J. O., R. N. Antunes, P. J. Wensveen, F. I. P.Samarra, A. C. Alves, P. H. Kvadsheim, L.Kleivane, F. P. A. Lam, M. A. Ainslie, P. L. Tyack,and L. Thomas. 2014. Dose-response relationshipsfor the onset of avoidance of sonar by free-rangingkiller whales. Journal of the Acoustical Society ofAmerica 135:975.
Miller, P. J. O., M. P. Johnson, P. T. Madsen, N. Biassoni,M. Quero, and P. L. Tyack. 2009. Using at-sea
experiments to study the effects of airguns on theforaging behaviour of sperm whales in the Gulf ofMexico. Deep-Sea Research I 56:1168–1181.
Miller, P. J. O., P. H. Kvadsheim, F. P. A. Lam, P. J.Wensveen, R. Antunes, A. C. Alves, F. Visser, L.Kleivane, P. L. Tyack, and L. Doksæter. 2012. Theseverity of behavioral changes observed duringexperimental exposures of killer (Orcinus orca),long-finned pilot (Globicephala melas), and sperm(Physeter macrocephalus) whales to naval sonar.Aquatic Mammals 38(4):362–401.
Moya-Lorano, J., and D. H. Wise. 2000. Survivalregression analysis: a powerful tool for evaluatingfighting and assessment. Animal Behaviour60:307–313.
Muenchow, G. 1986. Ecological use of failure timeanalysis. Ecology 67(1):246–250.
R Core Team. 2015. R: A language and environmentfor statistical computing. R Foundation for Statis-tical Computing, Vienna, Austria. www.r-project.org
Preisler, H. K., A. A. Ager, and M. J. Wisdom. 2006.Statistical methods for analyzing responses ofwildlife to human disturbance. Journal of AppliedEcology 43:164–172.
Richardson, W. J., C. R. Greene, Jr., C. I. Malme, and D.Thompson. 1995. Marine mammals and noise.Academic Press, San Diego, California, USA.
Richardson, W. J., G. W. Miller, and C. R. Greene, Jr.1999. Displacement of migrating bowhead whalesby sounds from seismic surveys in shallow watersof the Beaufort Sea. Journal of the AcousticalSociety of America 106:2281.
Richardson, W. J., B. Wursig, and C. R. Greene, Jr. 1986.Reactions of bowhead whales, Balaena mysticetus, toseismic exploration in the Canadian Beaufort Sea.Journal of the Acoustical Society of America79:1117–1128.
Scherm, H., and P. S. Ojiambo. 2004. Applications ofsurvival analysis in botanical epidemiology. Phy-tophathology 94:1022–1026.
Sivle, L. D., P. H. Kvadsheim, C. Cure, S. Isojunno, P. J.Wensveen, F. P. A. Lam, F. Visser, L. Kleivane, P. L.Tyack, C. M. Harris, and P. J. O. Miller. 2015.Severity of expert-identified behavioural responsesof humpback whale, minke whale and northernbottlenose whale to naval sonar. Aquatic Mammals41(4).
Southall, B. L. et al. 2007. Marine mammal noiseexposure criteria: initial scientific recommenda-tions. Aquatic Mammals 33:411–521.
Southall, B. L., D. Moretti, B. Abraham, J. Calamboki-dis, S. L. DeRuiter, and P. L. Tyack. 2012. Marinemammal behavioral response studies in southernCalifornia: advances in technology and experimen-tal methods. Marine Technology Society Journal46:48–59.
v www.esajournals.org 13 November 2015 v Volume 6(11) v Article 236
HARRIS ET AL.

Stankowich, T. 2008. Ungulate flight responses tohuman disturbance: a review and meta-analysis.Biological Conservation 141:2159–2173.
Therneau, T. M., and P. M. Grambsch. 2000. Modelingsurvival data: extending the Cox model. Springer,New York, New York, USA.
Therneau, T. 2015. A package for survival analysis in S.R package version 2.38. http://CRAN.R-project.org/package=survival
Thomson, J. L., and W. E. Copes. 2009. Modelingdisease progression of Camellia twig blight using arecurrent event model. Phytopathology 99(4):378–384.
Tyack, P. L. et al. 2011. Beaked whales respond to
simulated and actual navy sonar. PLoS ONE
6(3):e17009.
Woodall, C. W., P. L. Grambsch, and W. Thomas. 2005.
Applying survival analysis to a large-scale forest
inventory for assessment of tree mortality in
Minnesota. Ecological Modeling 189:199–208.
Zabel, R. W., B. J. Burke, M. L. Moser, and C. C.
Caudill. 2014. Modeling temporal phenomena in
variable environments with parametric models: an
application to migrating salmon. Ecological Mod-
eling 273:23–30.
SUPPLEMENTAL MATERIAL
ECOLOGICAL ARCHIVES
The Appendix is available online: http://dx.doi.org/10.1890/ES15-00242.1.sm
v www.esajournals.org 14 November 2015 v Volume 6(11) v Article 236
HARRIS ET AL.