donors contribute $14,750 to support the northern grapes ... · a donation, please contact either...
TRANSCRIPT

Viticulture enology and marketing for cold-hardy grapes
Nor
ther
n Gr
apes
New
sD
ecem
ber 2
1 20
16Vo
l 5 I
ssue
4
Donors Contribute $14750 to Support the Northern Grapes Project
Tim Martinson and Alex Koeberle Cornell University
We thank industry donors for their generous support of continued outreach through the Northern Grapes Project Although federal funding through the USDA ended in August project team members are com-mitted to continuing Northern Grapes Webinars Northern Grapes News and completion of the final project results in an indexed searchable Northern Grapes Project website and Owners Manual
To date nine producer associations have donated $12500 with individual donations of $500-$2000 Four Industry lsquoGold Sponsorsrsquo ($500) and one Silver Sponsor ($250) have donated an additional $2250 Thank you so much for your support
$20000 goal for lsquogaprsquo funding These donations have gone a long way towards sup-porting the cost of providing the outreach described above during 2017 The $20000 goal reflects the cost of 25 time commitment (salary and fringe benefits) for a program associate to produce and complete the webinars newsletters and permanent website The project team led by Paolo Sabbatini of Michigan State is preparing a new funding proposal to the USDA to continue the Northern Grapes Project
Thanks to Mike White We acknowledge the extraordinary effort that Mike White Iowa State University has made to contact producer groups and suppliers to solicit donations to this effort Thank you Mike
We are still accepting additional donations to reach the $20000 goal If you wish to make a donation please contact either Mike White (mlwhiteiastateedu) or Alex Koeberle (alk239cornelledu)
Tim MartinsonProgram Director
In This Issuebull Donors Contribute $14750 to
Support the Northern Grapes Project 1
bull Lessons Learned Northern Grapes Baseline and Economic Impact Study 2-3
bull NGP Team Profile Brigid Tuck 3-4
bull Vineyard Practices Insights from the 2012 and 2016 Northern Grapes Surveys 4-7
2
One of the goals of the Northern Grapes Project is to un-derstand how the economics of the cold-hardy grape industry are changing To accomplish this goal Uni-versity of Minnesota conducted two surveys The first survey conducted in 2012 and covering the 2011 sea-son established an industry baseline The second sur-vey conducted in 2016 and covering the 2015 season provided an opportunity to measure change against the baseline The two surveys allow the opportunity to compare the industry at two distinct points in time
The comparison of the 2011 to the 2015 season provides insights into the cold-hardy grape and wine industry Here are a few of the key observations
bull Cold-hardy grapes are a significant driver of growth in the vineyard and winery industry Results indicate economic output generated by cold-har-dy grapes was 34 percent higher in 2015 than 2011 Output from the vineyard and winery industry as a whole including traditional and cold-hardy grapes was only 6 percent higher
bull There are continued signs of an industry moving towards maturity Of particular interest is the notable increase in the number of vineyard employees The survey results show a shift from volunteer to paid labor in vineyards This could be a reflection of the growing size of vineyards but also a sign that vine-yards are becoming more profitable Wineries are also showing this trend towards maturity Wineries are increasingly planting vineyards to grow their own grapes or using contracts with vineyards showing a strong degree of pre-planning
bull Total cold-hardy wine production dipped slight-ly in 2015 as compared to 2011 This is the result of lower production per winery reported in the 2015 sur-vey That in turn may be the result of the increased number of new wineries which had limited or no production in 2015 Also the 2014 growing season which feeds into wine produced in 2015 was a poor growing year in many of the participating states due to a severe winter throughout most of the northern states Therefore grape availability may have been a factor Despite the decline sales at wineries using cold-hardy grapes were higher in 2015 versus 2011 This may be the result of an increase in the price per bottle sold and an increase in the number of tasting
Lessons Learned Northern Grapes Baseline andEconomic Impact StudyBrigid Tuck University of Minnesota
How Northern Grapes Vineyards and Wineries have Changed from 2011 ndash 2015
This table shows changes in acreage expenditures sales and employment from surveys conducted in 2012 and 2016 across 12 states in the Midwest and Northeast
Vineyardbull Acreage increased from 5900 to 7580 (28)bull Production increased by 17 (despite arctic vortex)bull Yield 35 to 32 Tacre (9 decrease)bull Vineyard expenditures $69M to 92M (34)bull Labor costs $19M to 30M (56)bull Labor costs per vineyard $5K to 9K
bull Shift from ldquofreerdquo owner-operator labor to paid labor
Winerybull Tasting room visitswinery 8000 to 10500 (31)bull Cold-hardy grape purchases $21M to 23M (7 total grapes purchased rose 26)bull Total winery sales $493M to 450M (2 decrease)bull Sales of cold-hardy wines $150M to 167M (11)bull Winery employment 5800 to 8500 (47)bull Labor costs winery $56M to 71M (27)
bull Shift to part-time annual employment (vs seasonal)
Economic impact bull Vineyard economic contribution $46M to 80M (75)bull Vineyard employment 5900 to 7800 jobs (32)bull Winery economic contribution $215M to 255M (19)bull Winery employment 5000 to 8400 (68)bull Winery visitors $140M to 204M (45)bull Winery visitor-associated jobs 1500 to 2526 (49)bull Total economic contribution $401M to 539M (34)bull Total employment 12600 jobs to 18736 jobs (49)
(Note Only those attributed to cold-hardy varieties and wines made from them are reported Many wineries also source fruit from standard varieties grown elsewhere)
SourcesTuck B and W Gartner 2014 Economic Contribution of Vine-yards and Wineries of the North Univ of Minnesota Extension Publication
Tuck B and W Gartner 2013 Vineyards and Grapes of the North Univ of Minnesota Extension Publication
Tuck B and W Gartner 2013 Wineries of the North Univ of Minnesota Extension Publication
New 2016 publications now available online
The following sources on overall NGP economic impacts are available through Univ of Minnesota Extension (Tuck B and W Gartner)
bull Economic Contribution of Vineyards and Wineries of the North 2015bull Wineries of the Northbull Vineyards and Grapes of the North
3
room customers Wineries also reported an increased sale of inventoried wine in 2015
bull Tourism remains a critical component of winery success Tasting rooms remain the primary source of a wineryrsquos sales The 2015 results show wineries selling a higher percentage of all wine from the tast-ing room (84 percent) compared to 2011 (73 percent) Wineries selling wines from cold-hardy grapes also tend to be located in rural areas creating a need to draw customers to the site The number of tasting room customers per winery was higher in 2015 Con-
tinued financial success likely depends on further tourism development
bull Tasting room operations are more sophisticated The results show an uptick in the percent of wineries charging for tastings and selling food with their wine service In the early days of the industry wineries ap-peared to be more concerned with bringing in cus-tomers to taste wines than with making a large profit off the tasting room Our latest survey indicates this may be changing
NGP Team Profile Brigid TuckBrigid Tuck is a Senior Economic Impact Analyst for the Center of Community Vitality She joined the University of Minnesota Extension in 2008 and has since conducted numerous economic studies of tourism education manufacturing retail infrastructure and local food industries across Minnesota For the Northern Grapes Project Brigid has led the baseline and close-of-project surveys which will evaluate the economic impact of this project
1 Tell us how your interest in community economics and agriculture developed
I grew up and continue to live on my family farm Irsquom fourth generation so you could say agriculture is in my blood Every morning when I left for school my dad would shout out the door ldquoremember you can make a differencerdquo When I realized I could make a difference and work with rural communities I knew I had the career for me
2 How is the economic impact information you generate used by industry government and community groups What does this information enable stakeholders to accomplish
My work in economic impact has two goals ndash both focused around education My work with industries and businesses tends to focus on educating stakeholders and decision-makers on economic value The hope is the information can be valuable as decisions are made For example we did a study looking at the economic impact of a plant closure The community used the data to apply for and receive a grant to help in planning for the closure My work with communities tends to focus on helping them think about their economic future
3 Most NGP survey respondents are very small start-up vineyards and wineries From your perspective what has surprised you the most comparing baseline and close-of-project surveys and what are the major economic challenges this young industry will face
Increasing business sophistication on the behalf of both vineyards and wineries comes through clearly in the data I have also observed it in Minnesota I first started working on economics and grapes in 2007 In touring the state to learn more I visited many small operations
with most of the labor provided by the owner with little expectation of income for their labor Between the baseline survey (2011) and the close-of-project (2015) the data shows a significant uptick in the amount of hired labor and a decline in the amount of volunteer (owner and family) labor This trend is also important as it hints that vineyards and wineries have enough gross profit to pay for labor
Challenges remain around the marketing and continued sale of wines My colleagues and I were worried early on about a glut of grapes on the market The rise in the number of wineries helped to absorb the excess grapes As long as wineries can sell their product the industry should be successful However wineries are still relying primarily on tasting rooms for their sales The data still shows relatively limited use of liquor stores or distributors for wine sales One has to wonder if there is a cap in terms of total demand through tasting rooms Working together on tourism initiatives may be one way to expand the cap
4 Other wine industry studies in various states show much higher numbers than the NGP surveys For example a 2012 survey estimated a $401M impact for Iowa alone while the NGP estimated $401M across 12 states Why are the numbers so different
4
My philosophy in conducting economic impact studies has always been to take a conservative approach This aligns with my goals to help communities make decisions
In this project it is difficult to make apple-to-apple comparisons as the scope of these reports are often different We focus primarily on cold-hardy wine grapes and locally-produced wines In some of the project states cold-hardy grapes are only a small portion of total grape production Some states also have large commercial wineries that import grape juice from other states to produce wine These wineries were not the focus of our work
There are two fundamental ways our study methodologies differ First some of the other studies appear to engage in double-counting In economic impact studies labor is a component of output (thus already included in the output figures) Irsquove seen studies that add labor to output thus counting it twice Some studies also count the grapersquos value of production at both the vineyard and the winery This is counting that same grape twice
Second we follow best practices when measuring tourism impacts Not all visitors to a winery are ldquotouristsrdquo Some winery visitors are local residents These visitors are not creating ldquonewrdquo income in the region as they likely would have spent their dollar in the region had the winery not been there They may have seen a movie instead or gone to a brewery In our study we counted only non-locals as tourists which in some cases significantly reduced the tourism impact Further we used conservative per day per person expenditures while visiting the winery
5 In your opinion what is the most exciting research-based information that has come out of the Northern Grapes Project
Irsquom sure I should say my own research here However I found Miguel Gomezrsquos work around tasting room customer preferences quite interesting As I mentioned in my response tasting room sales are critical to winery success Miguel had some intriguing insights into best practices to sell more wine through the tasting room I think it also points to how important research into multiple aspects of the industry can be helpful
Vineyard Practices Insights from the 2012 and 2016 Northern Grapes SurveysTim Martinson Cornell University
The producer surveys we conducted in 2012 and 2016 had two distinct goals The first was to measure indus-try size and economic impact at the start and the end of the Northern Grapes Project
The second goal was to take a detailed look at project impacts In addition to acreage production and wine production we asked questions about viticultural practices in the following areas
bull Acreage amp Planting Intentionsbull Training Systemsbull Canopy Managementbull Cropping Levelsbull Fertility Practicesbull Insect and Disease Management
Here are some key observations about the state of vine-yards in 2011 and 2015
bull Vineyard size Although small startup vineyards lt3 acres comprised over half of the survey responses the 2016 survey had more respondents with larger
vineyards The overall average in reported acreage increased from 43 acres in 2012 to 129 acres in 2016 Although the total number of survey respondents was similar (331 response in 2012 372 in 2016) we re-ceived more responses from larger established grow-ers (with up to 200 acres in production) The numbers could indicate that vineyards have grown overall or that interest from larger established growers in-creased over the course of the project Or it could be some combination of the two
5
bull Vineyard Age In both surveys about one quarter of respondents had nonbearing vineyards (1-3 years old) and about one-third were 6-10 years old How-ever in the 2016 survey there were about three times more respondents with vineyards 11+ years old
bull Growers reported plans to either stay lsquoabout the samersquo or increase the size of their vineyard Re-sponses in both the 2012 and 2016 surveys were simi-lar About half reported lsquostay the samersquo about one-third plan a lsquoslight increasersquo and about one fifth are planning to lsquosubstantially increasersquo the size of their vineyard (see chart below)
bull Training systems Growers are shifting from low and midwire cordon training systems with vertical shoot positioning (VSP) to high cordon and divided canopy training systems Larger-scale growers with more acreage are more aggressively adopting the high training systems
In 2012 growers reported 34 of their grapes on high cordon 43 on VSP and the remainder on cane-pruned (14) and divided (8) canopy systems These results were the same in 2012 when we adjust-ed for reported acreage (right)
By 2016 growers reported 50 on high cordon and 38 on VSP (left) However when we adjusted these percentages by vineyard size (right) the acreage in VSP shrunk to 24 and the amount in cane-pruned and divided canopy systems doubled
My interpretation of these trends is this Labor re-quirements for VSP are dramatically higher than those for high cordon-trained systems As vineyards expand beyond a few acres it becomes harder to maintain the amount of labor to successfully imple-ment VSP In addition our studies in New York have shown a significant yield advantage for high training systems with the fruiting zone at the top
bull Yield targets Growers need to aim for higher yields In both 2012 and 2016 one-quarter of the growers re-ported yield targets of lt3 Tonsacre and an addition-al 40-45 reported yield targets of 3-4 Tacre The re-maining 25 were targeting yields from 4 to 7 Tacre Given production costs12 and small vineyard size my sense is that production of these varieties under 4 Tacre will not be profitable ndash even with $1500ton grape prices And I also feel that with proper management and good sites therersquos no reason why growers cannot produce 5-6 Tacre consistently
1Goacutemez et al 2015 Cost of Est and Prod of Cold Hardy Grapes in the Thousand Islands Region of New York - 2015 Cornell University 2Goacutemez et al 2016 Cost of Est and Prod of Cold Hardy Grapes in the Chautauqua Region of New York - 2015 Cornell University
6
bull Canopy Management Several questions addressed how many lsquopassesrsquo through the vineyard were made during the growing season Practices included shoot suckering shoot thinning shoot positioning (vertical or downward) skirting or hedging and cluster zone leaf removal While responses werenrsquot tied to specific training systems we were able to attribute different practices with different training systems
In 2012 the average number of passes was the same (45 vs 46) for VSP and high cordon training The number of passes in 2016 was much lower for the high cordon-trained vineyards (26) and decreased mod-estly for the VSP vineyards (38)
Nonetheless growers with VSP-trained vineyards reported more passes for canopy management than those with vineyards trained to high cordon
bull Cropping levels Managing cropping levels is thought by some to be the key to grape and wine quality The surveys asked growers to cite which practices they used to manage cropping levels for quality Results were similar in the 2012 and 2016 surveys (Table 2)
Dormant pruning to a specific bud number per foot of canopy was cited most frequently (two-thirds of re-spondents) followed by shoot thinning (45) Post-bloom cluster thinning (35) and cluster thinning at veraison (33) were the next most common practices
Table 1 Number of passes reported for implementing can-opy management practices in vineyards trained to High Cordon and mid-wire or low-wire Vertical Shoot Posi-tioned (VSP)
Note We used a subset of the responses with gt4 acres of vineyards for this table
2012 2016
High Cordon VSP High Cordon VSPN 99 99 105 105Average 45 46 27 38Maximum Number 15 13 16 18
Min 0 0 0 0
There are limitations to these numbers Particularly in 2012 many vineyards were recently planted and still in the process of being trained This may have increased the number of passes compared to a ma-ture fully established vineyard The 2016 survey had more respondents with large established vineyards In both surveys those respondents with small vine-yards (lt4 acres) generally reported many more passes through the vineyard than those with commercial-sized vineyards
Table 2 Percentage of survey respondents citing different methods of adjusting cropping levels for quality
I have mixed feelings about the results Certainly the first lsquocutrsquo at managing crop is to get the right num-ber of buds retained So dormant pruning followed by post-budburst shoot thinning should be the stan-dard to arrive at the appropriate shoot density (4-6 shoots per foot of canopy) Shoot thinning if done early enough (lt10 in shoot growth) can be conducted rapidly ndash and is perhaps the most cost-effective way to improve quality
Cluster thinning on the other hand is more expen-sive ndash and often has only a modest impact on fruit composition at harvest So for me it is a practice of lsquolast resortrsquo Cluster thinning at veraison is time con-suming directly reduces yield and may only measur-ably result in higher soluble solids (brix) It will not result in lower acids or lsquofaster ripeningrsquo
Crop Control Methods 2012 2016
Dormant pruning (shootsft) 63 73
Shoot thinning 46 45
Pre-bloom cluster thinning 12 12
Post-bloom cluster thinning 35 37
Cluster thinning at veraison 26 33
Shoot-length based cluster thinning 19 20
N responses 297 246
7
bull Fertility Our results in both years showed that many survey respondents can better utilize soil and tissue testing both pre-plant and in mature vine-yards to provide guidance for applying fertilizers and lime to their vineyards Notably 50 (2016) to 70 of respondents didnrsquot know their sitersquos soil pH and 15 had never tested their soil About half of respondents (45-55) had never had tissue tests (eg petiole tests) in their vineyard as well
bull Disease and Insect Management Survey respon-dents reported a wide range of responses about the number of fungicide and insecticide sprays applied in their vineyards Overall the median number of fun-gicide sprays (4 to 6) and insecticide sprays (2-3) was on target but the range of responses was enormous Fully half of respondents were in the 8-16 fungicide spray category (some reporting up to 32 sprays) and in the 4-11 insecticide spray categories Growers ap-plying this many sprays are not only wasting money and time but they are also greatly increasing the risk of pesticide resistance
I feel that most of the over-application reported is due in part to lack of knowledge about the diseases and insects ndash when they appear when critical control lsquowin-dowsrsquo are and when to ignore them In particular several responded that sprays needed to be applied at
lsquo7-10 day intervalsrsquo While thatrsquos a simple (but costly) program effective disease and insect management can be accomplished with far fewer sprays
Summary Although about 25 of responses in both years represented new (nonbearing) vineyards less than three years old we had more responses from old-er established vineyards (gt15 years) in the 2016 survey This probably affected responses to questions about training systems spray frequency and fertility prac-tices Overall the surveys told us the following
bull Vineyard size has grown Average size grew from 34 acres to 129 acres
bull Respondents see further growth ahead Half re-ported maintaining current acreage and slightly less than half (47) expect to either slightly increase (33) or significantly increase (14) their acreage
bull Training systems shift from VSP to high cordon and divided canopies More growers are report-ing high cordon training and the trend is most pro-nounced with larger-acreage growers Labor require-ments probably play a role in this
bull Disease and insect management are still challeng-ing There are ample opportunities for growers to adopt more efficient and effective disease and insect management practices
bull Better use of soil and tissue sampling is possible More growers would benefit from soil and tissue sampling to improve fertility management
bull Labor is the largest expense and a limiting factor in vineyard size Labor availability (both skilled and unskilled) is second only to disease and insect man-agement as a concern As vineyard size increases hired labor becomes more important ndash and vineyard mechanization to reduce labor costs will be needed in the future for profitable production
bull Growers should aim for higher yields Four tons per acre is my benchmark for lsquominimumrsquo produc-tion to approach profitability Five to six tonsacre on good sites should be attainable in many areas
Acknowledgements Thanks from the Northern Grapes Project team to everyone who completed this survey (331 in 2012 and 372 in 2016) We recognize that the questions werenrsquot always simple to answer and some were quite detailed We truly appreciate the effort and time expended in your responses
How many fungicide sprays do you apply
How many insecticide sprays do you apply
8
Visit us online at wwwnortherngrapesprojectorg
copy 2016
The Northern Grapes Project was funded by the USDArsquos Specialty Crops Research Initiative Program of the National Institute for Food and Agriculture Project 2011-51181-30850
Thank You to Our DonorsWe would like to thank the following organizations and businesses for their support of the Northern Grapes Webinar Series Grower Associations SponsorsIowa Wine Growers AssociationIllinois Grape Growers and Vintners AssociationNorth Dakota Grape and Wine AssociationEastern Winery ExhibitionColorado Wine Industry Development BoardMichigan Wine Industry CouncilConnecticut Vineyard and Winery AssociationWisconsin Grape Growers Association South Dakota State University Grape ProgramSouthern Minnesota Wine Grower Alliance
Industry Gold SponsorsDouble A VineyardsAgro KBevens Creek Vineyard amp Nursery
Industry Silver SponsorsScott Labs
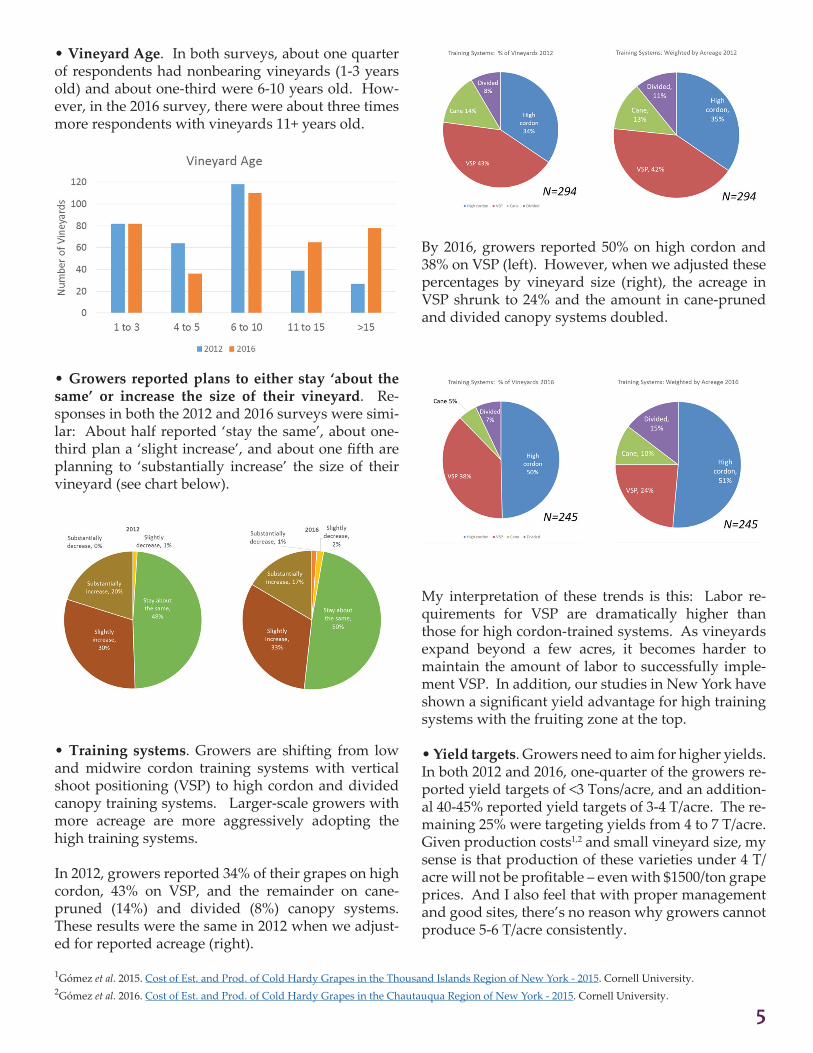
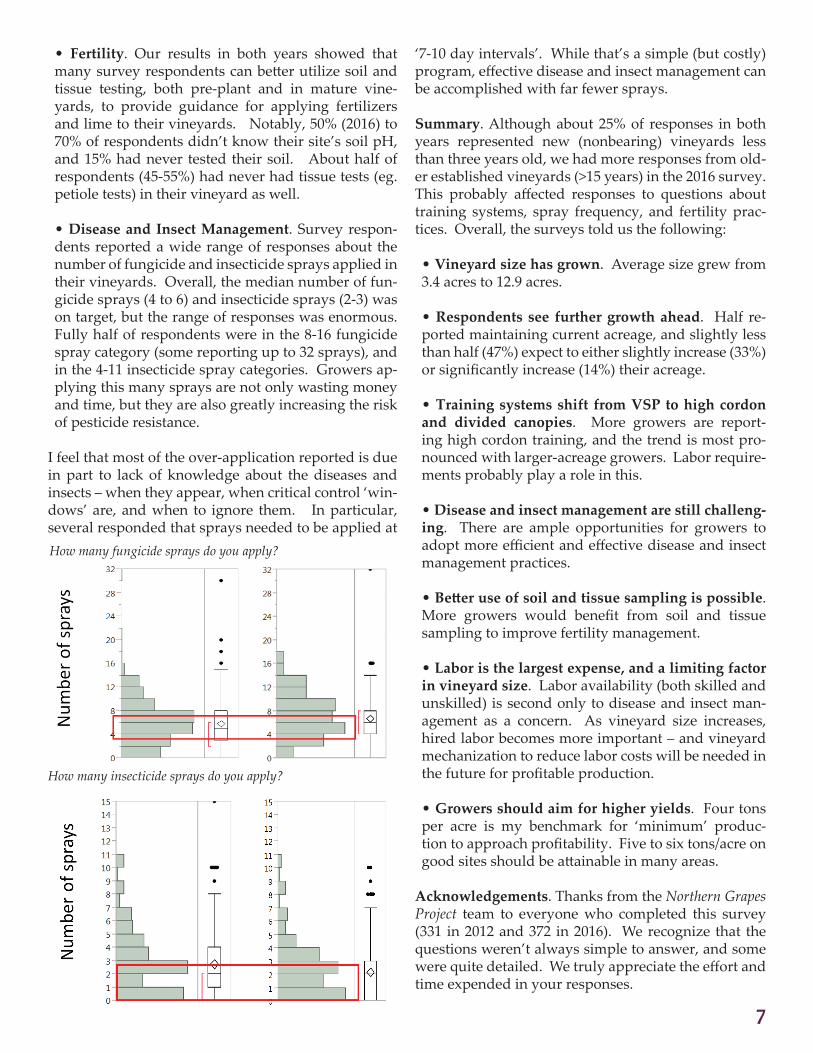