donorcentrics index of direct marketing fundraising · pdf fileabout the donorcentrics index...
TRANSCRIPT

Q4 2013 donorCentrics™ Index of Direct Marketing Fundraising
© April 2014 | 2 Canal Park, Cambridge, MA 02141 | www.blackbaud.com/analytics | T 800.443.9441 | E [email protected]
donorCentrics™ Index of Direct Marketing Fundraising 2013 Fourth Calendar Quarter Results
By Helen Flannery, Paige Grainger, Rob Harris, and Carol Rhine
Contents
About the donorCentrics Index of Direct Marketing Fundraising ................................................................. 1
Q4 2013 Index Participants ............................................................................................................................................. 2
Q4 2013 Summary .............................................................................................................................................................. 3
Overall Index Performance .............................................................................................................................................. 4
Industry Sector Performance ........................................................................................................................................ 12
Animal Welfare ........................................................................................................................................................... 15
Arts & Culture ............................................................................................................................................................ 16
Environment ................................................................................................................................................................ 17
Health ............................................................................................................................................................................. 18
Human Services ......................................................................................................................................................... 19
International Relief ................................................................................................................................................... 20
Religion .......................................................................................................................................................................... 21
Societal Benefit .......................................................................................................................................................... 22
References ........................................................................................................................................................................... 23
Industry Sectors Used in the Index ........................................................................................................................... 24
Looking Ahead ................................................................................................................................................................... 25
Index Methodology .......................................................................................................................................................... 25
About Medians ................................................................................................................................................................... 25
Participation ......................................................................................................................................................................... 25
Online Resources .............................................................................................................................................................. 25
About Target Analytics ................................................................................................................................................... 25

Q4 2013 donorCentrics™ Index of Direct Marketing Fundraising
© April 2014 | 2 Canal Park, Cambridge, MA 02141 | www.blackbaud.com/targetanalytics 1
About the donorCentrics Index of Direct Marketing Fundraising
The Target Analytics donorCentrics Index of Direct Marketing Fundraising analyzes direct marketing giving for many of the largest non-profit organizations in the country. For the twelve months ending Q4 2013, Target Analytics evaluated transactions from 76 organizations, including over 36 million donors and more than 77 million gifts totaling over $2.4 billion in revenue.
The Target Index reports on direct marketing giving only. Direct mail is the dominant revenue source for most organizations but web, telemarketing, canvassing, and other gifts considered to be direct marketing are also included. Individual payments greater than $10,000, soft credits, and matching gift payments are excluded.
Quarterly results are reported on a calendar year basis. This report includes results through December 2013.
Index findings are based on analysis of actual donor transactions, not survey responses from fundraisers. All calculated measures have been reviewed by participants for accuracy.

Q4 2013 donorCentrics™ Index of Direct Marketing Fundraising
© April 2014 | 2 Canal Park, Cambridge, MA 02141 | www.blackbaud.com/targetanalytics 2
Q4 2013 Index Participants
Animal Welfare ASPCA Best Friends Animal Society International Fund for Animal Welfare People for the Ethical Treatment of Animals Arts & Culture Colonial Williamsburg Foundation National Law Enforcement Officers Memorial National Trust for Historic Preservation National World War II Museum The Smithsonian Institution Environment Defenders of Wildlife Earthjustice Environmental Defense Fund Greenpeace USA National Parks Conservation Association National Wildlife Federation Natural Resources Defense Council The Nature Conservancy The Ocean Conservancy Sierra Club The Wilderness Society Trout Unlimited World Wide Fund for Nature Health ALSAC / St. Jude Children’s Research Hospital Alzheimer’s Association American Diabetes Association American Heart Association American Institute for Cancer Research American Lung Association Arthritis Foundation BrightFocus Foundation Cystic Fibrosis Foundation Easter Seals The Foundation for AIDS Research Juvenile Diabetes Research Leukemia and Lymphoma Society March of Dimes Mayo Clinic Muscular Dystrophy Association National Foundation for Cancer Research National Multiple Sclerosis Society Special Olympics
Human Services American Indian Relief Council Cal Farley’s Boys Ranch Covenant House Disabled American Veterans Feeding America Make-A-Wish Foundation Paralyzed Veterans of America United States Olympic Committee International Relief AmeriCares CARE Catholic Relief Services ChildFund International Doctors without Borders Habitat for Humanity International Heifer Project International International Rescue Committee Mercy Corps Operation Smile USA Oxfam America Project HOPE Save the Children Religion Missionary Association of Mary Immaculate Sisters of St. Francis of Assisi Sisters of St. Francis - PET Society of the Divine Savior Societal Benefit American Association of University Women American Civil Liberties Union Amnesty International Human Rights Campaign NAACP National Committee to Preserve Social Security & Medicare Planned Parenthood Public Citizen Southern Poverty Law Center

Q4 2013 donorCentrics™ Index of Direct Marketing Fundraising
© April 2014 | 2 Canal Park, Cambridge, MA 02141 | www.blackbaud.com/targetanalytics 3
Index Saw Small Revenue Growth in 2013 Revenue per Donor Increases Continue to Compensate for Donor Declines
Q4 2013 Summary
Revenue for the index increased a median 2.2% from 2012 to 2013. 61% of the organizations in the index had revenue increases and 39% had revenue declines over the period.
Index donors declined a median 2.0% from 2012 to 2013, continuing a trend that predates the recession. Donor populations have been shrinking for more than seven years; the index has not experienced positive year-to-year overall donor growth since the U.S. Gulf Coast hurricanes in the third quarter of 2005.
Declines in overall donor numbers have been driven primarily by declines in new donor acquisition. In 2013, new donor acquisition continues to decline. New donor acquisition declined a median 3.2% from 2012 to 2013. Only 37% of the organizations in the index had new donor population increases over the period.
In spite of continued donor declines, revenue has held steady because of increases in revenue per donor. In 2013, revenue per donor amounts increased a median 3.6% from 2012 to 2013. These increases were widespread; 82% of the organizations in the index had positive revenue per donor growth over the period.
Revenue per donor shifts can be largely influenced by the mix of donors across different loyalty segments, since long-term donors typically contribute larger amounts than new donors. The increases in revenue per donor that we are seeing in the index may be driven by changes in organizational strategy, as organizations work to maximize net revenue by focusing efforts on higher value donors, bringing in fewer donors each year but acquiring them at higher gift amounts than previous years.
The pattern of slightly increasing revenue, with increases in revenue per donor generally compensating for donor declines, was reflected across most of the industry sectors in the index. Six of eight sectors had revenue increases, five of eight sectors had donor declines, and all sectors had increases in revenue per donor in 2013.
The international relief sector had the largest increases in donors and revenue compared to all sectors. This sector experienced significant declines in key measures throughout 2011 and 2012 following large scale emergency giving in January 2010 due to a severe earthquake in Haiti. In the fourth quarter of 2013, organizations in this sector may have received a large influx of revenue and donors from Typhoon Haiyan in the Philippines.
The human services and religion sectors experienced increases in both donors and revenue from 2012 to 2013. Both of these
sectors experienced increases in new donor acquisition as well as new donor revenue per donor.
The arts and culture, environmental, and societal benefit sectors followed overall index trends most closely; all had revenue increases from 2012 to 2013; all were able to compensate for donor declines with increases in revenue per donor.
The animal welfare and health sectors were the only two sectors to experience declines in both donors and revenue in 2013. Health organizations in the index saw declines in most key measures including donors, revenue, new donor acquisition and retention rates, as they have for most of the past ten years. However, continuing increases in revenue per donor in the health sector have helped to minimize their revenue declines. Animal welfare organizations also saw declines in most key measures, especially new donor acquisition.

Q4 2013 donorCentrics™ Index of Direct Marketing Fundraising
© April 2014 | 2 Canal Park, Cambridge, MA 02141 | www.blackbaud.com/targetanalytics 4
Overall Index Performance
All index results are medians unless otherwise specified.
Year-to-Year Change
Target index revenue grew slightly in 2013, increasing a median 2.2% from the same period a year before (see Fig. 1). 61% of the organizations in the index had revenue increases and 39% had revenue declines over the period.
Continuing a trend that predates the recession, index donors declined a median 2.0% from 2012 to 2013. Donor populations have been shrinking for more than seven years; the index has not experienced positive year-to-year donor growth since the U.S. Gulf Coast hurricanes in the third quarter of 2005. 42% of the organizations in the index had positive donor growth in 2013.
New donor acquisition has also been in decline since 2005, and has been the primary reason for overall donor declines over that period. New donor acquisition declined 3.2% from 2012 to 2013 and only 37% of the organizations in the index had new donor increases in 2013. New donor acquisition declined in all but three sectors and will be reviewed in greater detail later in this analysis.
Under normal circumstances, revenue per donor amounts tend to increase, due to a combination of organizational practice and inflationary adjustments by donors. During the 2007-2009 recession, revenue per donor amounts went into an atypical decline, and then returned to growth again from 2010 to 2012 after the recession was over. Revenue per donor continued to grow in 2013, increasing a median 3.6% from 2012 to 2013 for the index as a whole following a 2.3% increase in the previous year. These increases
-1.0%
-2.4%
2.3%
-3.7%
0.3%
1.6%
0.4%
0.0%
2.2%
-2.0%
3.6%
-3.2%
0.4%
-0.2%
-0.6%
1.4%
Revenue
Donors
Rev / Donor
New Donors
Retention
First-Year Retention
Multi-Year Retention
Reactivation
Fig. 1: Overall Index Medians
2011 to 2012
2012 to 2013
Year-over-Year Changein Key Measures
46%
36%
64%
37%
53%
59%
57%
50%
61%
42%
82%
37%
51%
49%
45%
53%
% of Organizations with Positive Change

Q4 2013 donorCentrics™ Index of Direct Marketing Fundraising
© April 2014 | 2 Canal Park, Cambridge, MA 02141 | www.blackbaud.com/targetanalytics 5
were widespread, with 82% of the organizations in the index having growth in revenue per donor in 2013.
Overall donor retention rates were flat from 2012 to 2013, increasing a median 0.4% over the year. First-year and multi-year retention rates both also remained essentially flat during the same time period.
Single Quarter Trends
In the index, we usually report on year-to-date or rolling twelve-month periods, rather than year-to-year changes in individual quarters. This is because shifts in the timing of direct marketing campaigns can, in turn, shift significant revenue from one quarter to another. In addition, smaller donor counts and revenue totals in single quarters can exaggerate the magnitude of increases and decreases in donors and revenue.
We have done some analysis on year-to-year trends for 2013, however, to evaluate the impact of recent current events and economic changes in more detail.
This analysis indicates that giving generally improved as the year progressed. All giving, particularly new donor acquisition, was down markedly in the first quarter of 2013 (see Fig. 2). Declines slowed and began to turn around in the second and third quarters, and by the fourth quarter, revenue, donors and new donors were all showing gains versus the same period in the previous year. This may be the result of donors shifting their giving from earlier to later quarters, or it may be an indication of the start of a recovery in fundraising.
Actual Median Values for Performance Metrics
In our index analyses, we typically focus on the change in metrics over time, such as year-to-year comparisons and long-term trends. In a fourth-quarter analysis, however, we can examine actual median values of key metrics based on a full year of data.
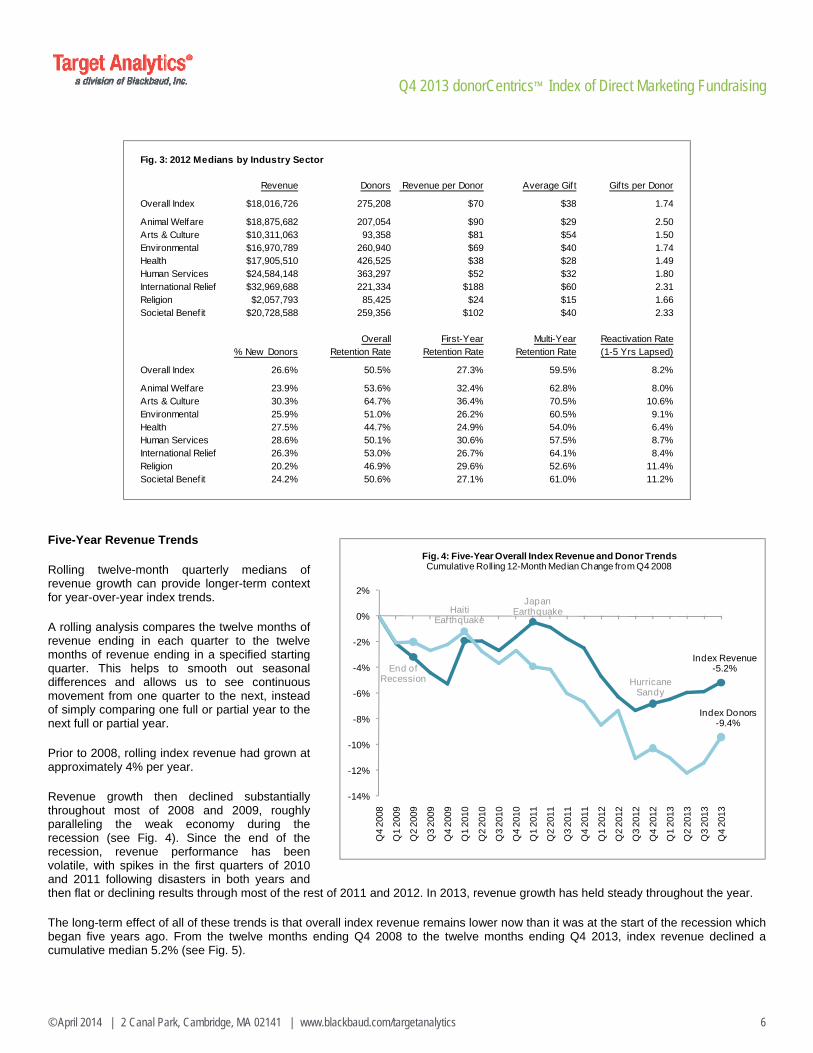
Median revenue per donor was $70 for the index in 2013 (see Fig. 3). The international relief sector had the highest revenue per donor, with each donor giving $188. The religion sector had the lowest revenue per donor, with each donor giving $24.
Index donors gave a median 1.74 gifts each in 2013. The animal welfare organizations had the highest gift frequency of any sector, receiving a median 2.50 gifts per donor in 2013. Although large sustainer or monthly giving programs are not widespread, organizations with sustainer programs will drive up gifts-per-donor metrics.
The index as a whole had a median 50.5% donor retention rate in 2013. The arts and culture sector had the highest retention rate at a median 64.7%; the health sector had the lowest retention rate at a median 44.7%.
First-year retention rates by sector were similar to overall retention rates. The index as a whole had a median 27.3% first-year retention rate in 2013. Similar to overall retention rates, the arts and culture sector had the highest first-year retention rate at 36.4%; the health sector had the lowest first-year retention rate at 24.9%.
Fig. 2: Median Single-Quarter Year-to-Year Change
Q1 2012 to Q1 2013
Q2 2012 to Q2 2013
Q3 2012 to Q3 2013
Q4 2012 to Q4 2013
Revenue -1.0% 2.0% 2.2% 3.0%Donors -3.5% -1.7% 0.0% 1.2%New Donors -9.5% -5.2% -2.9% 3.1%
% of Orgs With Positive Revenue Change 42% 57% 58% 59%% of Orgs With Positive Donor Change 34% 46% 50% 55%% of Orgs With Positive New Donor Change 34% 47% 42% 53%
Q4 2013 donorCentrics™ Index of Direct Marketing Fundraising
© April 2014 | 2 Canal Park, Cambridge, MA 02141 | www.blackbaud.com/targetanalytics 6
Five-Year Revenue Trends
Rolling twelve-month quarterly medians of revenue growth can provide longer-term context for year-over-year index trends.
A rolling analysis compares the twelve months of revenue ending in each quarter to the twelve months of revenue ending in a specified starting quarter. This helps to smooth out seasonal differences and allows us to see continuous movement from one quarter to the next, instead of simply comparing one full or partial year to the next full or partial year.
Prior to 2008, rolling index revenue had grown at approximately 4% per year.
Revenue growth then declined substantially throughout most of 2008 and 2009, roughly paralleling the weak economy during the recession (see Fig. 4). Since the end of the recession, revenue performance has been volatile, with spikes in the first quarters of 2010 and 2011 following disasters in both years and then flat or declining results through most of the rest of 2011 and 2012. In 2013, revenue growth has held steady throughout the year.
The long-term effect of all of these trends is that overall index revenue remains lower now than it was at the start of the recession which began five years ago. From the twelve months ending Q4 2008 to the twelve months ending Q4 2013, index revenue declined a cumulative median 5.2% (see Fig. 5).
Fig. 3: 2012 Medians by Industry Sector
Revenue Donors Revenue per Donor Average Gift Gifts per Donor
Overall Index $18,016,726 275,208 $70 $38 1.74
Animal Welfare $18,875,682 207,054 $90 $29 2.50Arts & Culture $10,311,063 93,358 $81 $54 1.50Environmental $16,970,789 260,940 $69 $40 1.74Health $17,905,510 426,525 $38 $28 1.49Human Services $24,584,148 363,297 $52 $32 1.80International Relief $32,969,688 221,334 $188 $60 2.31Religion $2,057,793 85,425 $24 $15 1.66Societal Benefit $20,728,588 259,356 $102 $40 2.33
% New DonorsOverall
Retention RateFirst-Year
Retention RateMulti-Year
Retention RateReactivation Rate(1-5 Yrs Lapsed)
Overall Index 26.6% 50.5% 27.3% 59.5% 8.2%
Animal Welfare 23.9% 53.6% 32.4% 62.8% 8.0%Arts & Culture 30.3% 64.7% 36.4% 70.5% 10.6%Environmental 25.9% 51.0% 26.2% 60.5% 9.1%Health 27.5% 44.7% 24.9% 54.0% 6.4%Human Services 28.6% 50.1% 30.6% 57.5% 8.7%International Relief 26.3% 53.0% 26.7% 64.1% 8.4%Religion 20.2% 46.9% 29.6% 52.6% 11.4%Societal Benefit 24.2% 50.6% 27.1% 61.0% 11.2%
Index Revenue-5.2%
Index Donors-9.4%
-14%
-12%
-10%
-8%
-6%
-4%
-2%
0%
2%
Q4
2008
Q1
2009
Q2
2009
Q3
2009
Q4
2009
Q1
2010
Q2
2010
Q3
2010
Q4
2010
Q1
2011
Q2
2011
Q3
2011
Q4
2011
Q1
2012
Q2
2012
Q3
2012
Q4
2012
Q1
2013
Q2
2013
Q3
2013
Q4
2013
Fig. 4: Five-Year Overall Index Revenue and Donor TrendsCumulative Rolling 12-Month Median Change from Q4 2008
HaitiEarthquake
End ofRecession
JapanEarthquake
Hurricane Sandy

Q4 2013 donorCentrics™ Index of Direct Marketing Fundraising
© April 2014 | 2 Canal Park, Cambridge, MA 02141 | www.blackbaud.com/targetanalytics 7
Real index revenue declined by 14.5% over the past five years when revenue dollar amounts are adjusted for inflation1.
Five-Year Donor Trends
A rolling twelve-month analysis provides additional context for donor trends as well. It shows that recent donor declines are part of a long-term pattern that was at its worst during the recent recession.
Donor numbers have generally been on a slow decline ever since the U.S. Gulf Coast hurricanes of Q3 2005. Declines intensified during the 2007-2009 recession and then continued at a more moderate pace after the recession was over (see Fig. 4). A positive spike in the first half of 2010 is likely at least partly due to disaster-related giving following a January earthquake in Haiti.
The result of these combined trends is that donor numbers have declined significantly over the past five years. Donors declined a cumulative median 9.4% from the twelve months ending Q4 2008 to the twelve months ending Q4 2013, for an effective annual rate of decline of 1.8% per year (see Fig. 5).
As we have said in previous editions of the index, falling donor populations in the index may be due to a mix of factors. The recession certainly had an impact, but so also may have a changing generational profile in the United States, changing attitudes of donors about giving, changing investment in new donor acquisition strategies by organizations, and a change in focus by fundraisers toward higher-dollar donors.
New Donors
Long term overall donor declines have been caused mainly by declines in new donor acquisition.
Over the past five years, from the twelve months ending Q4 2008 to the twelve months ending Q4 2013, new donor numbers have fallen a cumulative median 16.4% (see Fig. 6).
This is an effective annual rate of decline of 3.1%
Fig. 5: Long-Term Index Revenue and Donor Trends
Five-Year Change Four-Year Change Three-Year Change Tw o-Year Change One-Year Change
Q4 2008 to Q4 2013 Q4 2009 to Q4 2013 Q4 2010 to Q4 2013 Q4 2011 to Q4 2013 Q4 2012 to Q4 2013
Revenue
Median Change -5.2% 3.6% -0.9% 1.3% 2.2%
Effective Annual Change -1.0% 0.9% -0.3% 0.6% 2.2%
% Orgs w ith Positive Change 45% 54% 49% 57% 61%
Donors
Median Change -9.4% -5.6% -7.7% -4.7% -2.0%
Effective Annual Change -1.8% -1.4% -2.5% -2.3% -2.0%
% Orgs w ith Positive Change 34% 37% 34% 36% 42%
Show s the cumulative median change from the tw elve-month period ending the f irst date to the tw elve-month period ending the second date
in each column. Effective Annual Change is the average yearly change over the stated time period, adjusted for compounding over that period.
New Donors-16.4%
All Donors-9.4%
-25%
-20%
-15%
-10%
-5%
0%
Q4
2008
Q1
2009
Q2
2009
Q3
2009
Q4
2009
Q1
2010
Q2
2010
Q3
2010
Q4
2010
Q1
2011
Q2
2011
Q3
2011
Q4
2011
Q1
2012
Q2
2012
Q3
2012
Q4
2012
Q1
2013
Q2
2013
Q3
2013
Q4
2013
Fig. 6: Five-Year Overall Index Donor and New Donor TrendsCumulative Rolling 12-Month Median Change from Q4 2008
HaitiEarthquake
End ofRecession
JapanEarthquake
Hurricane Sandy
Q4 2013 donorCentrics™ Index of Direct Marketing Fundraising
© April 2014 | 2 Canal Park, Cambridge, MA 02141 | www.blackbaud.com/targetanalytics 8
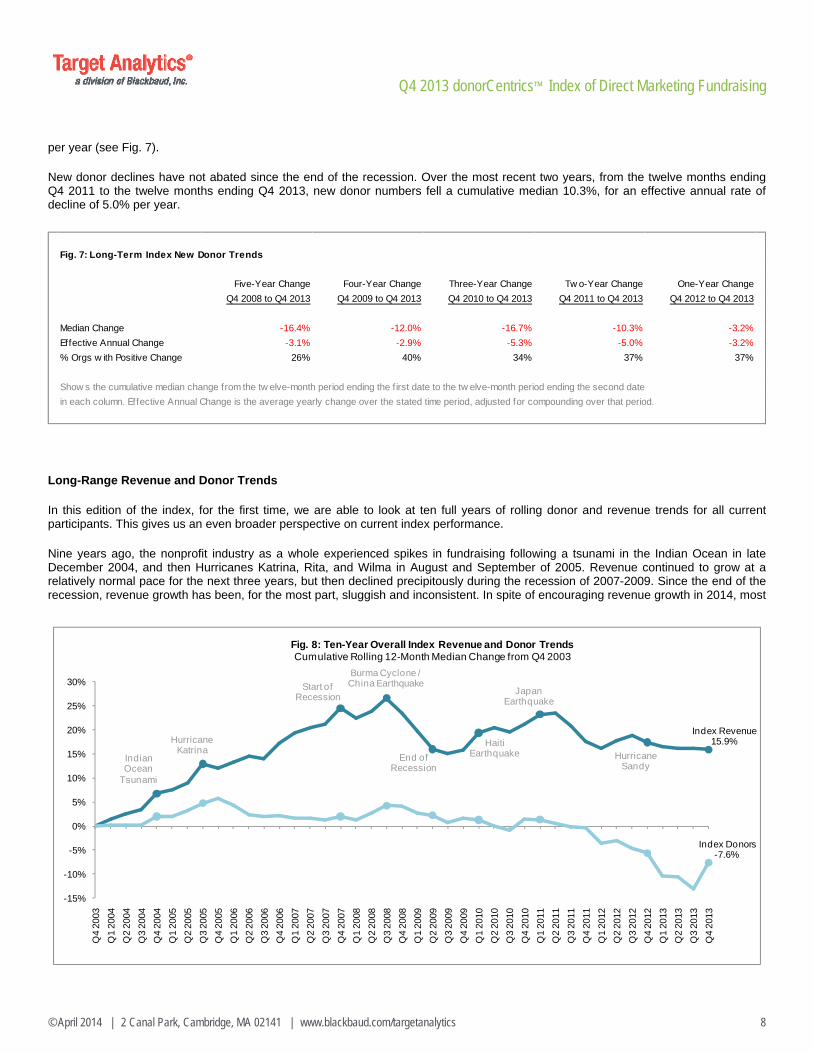
per year (see Fig. 7).
New donor declines have not abated since the end of the recession. Over the most recent two years, from the twelve months ending Q4 2011 to the twelve months ending Q4 2013, new donor numbers fell a cumulative median 10.3%, for an effective annual rate of decline of 5.0% per year.
Long-Range Revenue and Donor Trends
In this edition of the index, for the first time, we are able to look at ten full years of rolling donor and revenue trends for all current participants. This gives us an even broader perspective on current index performance.
Nine years ago, the nonprofit industry as a whole experienced spikes in fundraising following a tsunami in the Indian Ocean in late December 2004, and then Hurricanes Katrina, Rita, and Wilma in August and September of 2005. Revenue continued to grow at a relatively normal pace for the next three years, but then declined precipitously during the recession of 2007-2009. Since the end of the recession, revenue growth has been, for the most part, sluggish and inconsistent. In spite of encouraging revenue growth in 2014, most
Fig. 7: Long-Term Index New Donor Trends
Five-Year Change Four-Year Change Three-Year Change Tw o-Year Change One-Year Change
Q4 2008 to Q4 2013 Q4 2009 to Q4 2013 Q4 2010 to Q4 2013 Q4 2011 to Q4 2013 Q4 2012 to Q4 2013
Median Change -16.4% -12.0% -16.7% -10.3% -3.2%
Effective Annual Change -3.1% -2.9% -5.3% -5.0% -3.2%
% Orgs w ith Positive Change 26% 40% 34% 37% 37%
Show s the cumulative median change from the tw elve-month period ending the f irst date to the tw elve-month period ending the second date
in each column. Effective Annual Change is the average yearly change over the stated time period, adjusted for compounding over that period.
Index Revenue15.9%
Index Donors-7.6%
-15%
-10%
-5%
0%
5%
10%
15%
20%
25%
30%
Q4
2003
Q1
2004
Q2
2004
Q3
2004
Q4
2004
Q1
2005
Q2
2005
Q3
2005
Q4
2005
Q1
2006
Q2
2006
Q3
2006
Q4
2006
Q1
2007
Q2
2007
Q3
2007
Q4
2007
Q1
2008
Q2
2008
Q3
2008
Q4
2008
Q1
2009
Q2
2009
Q3
2009
Q4
2009
Q1
2010
Q2
2010
Q3
2010
Q4
2010
Q1
2011
Q2
2011
Q3
2011
Q4
2011
Q1
2012
Q2
2012
Q3
2012
Q4
2012
Q1
2013
Q2
2013
Q3
2013
Q4
2013
Fig. 8: Ten-Year Overall Index Revenue and Donor TrendsCumulative Rolling 12-Month Median Change from Q4 2003
HaitiEarthquakeEnd of
Recession
JapanEarthquake
Hurricane Sandy
Start ofRecession
Hurricane Katrina
IndianOcean
Tsunami
Burma Cyclone / China Earthquake

Q4 2013 donorCentrics™ Index of Direct Marketing Fundraising
© April 2014 | 2 Canal Park, Cambridge, MA 02141 | www.blackbaud.com/targetanalytics 9
organizations participating in the index have not yet regained a significant portion of the ground they have lost over the past six years.
Overall index revenue has grown a median 15.9% from 2003 to 2013 (see Fig. 8). However, it has actually declined by 8.5% when adjusted for inflation over that time.
A ten-year rolling view shows that donor counts in the index have been generally declining for eight years, following their 2005 peak. As we have said earlier in this summary, declining donor numbers are primarily due to declines in new donor acquisition, which has declined precipitously over the past eight years. Overall index donors have declined a median 7.6% from 2003 to 2013, and new donors have declined 23.2% over the same period (see Fig. 9).
Retention Rates
Overall retention remained essentially flat in 2013. Retention rates increased a median 0.4% from 2012 to 2013, on top of flat growth of 0.3% the previous year (see Fig. 10). Almost exactly half (51%) of the organizations in the index had positive retention rate growth in 2013.
Fig. 10: Retention Rate Change
2011-2012 2012-2013 2011-2012 2012-2013 2011-2012 2012-2013
Overall Index 0.3% 0.4% 1.6% -0.2% 0.4% -0.6%
Animal Welfare 1.5% -3.1% 11.8% -7.5% -0.4% -3.7%
Arts & Culture -1.0% 0.6% 0.9% -0.9% -1.7% -0.6%
Environmental -0.7% -0.2% 1.8% -5.1% -0.4% -0.4%
Health 0.9% -1.7% 3.0% -0.1% 0.5% -1.4%
Human Services -2.1% 2.4% -1.7% 4.2% -2.2% -0.2%
International Relief 7.9% 8.8% 0.8% 14.9% 1.1% 4.0%
Religion -0.9% -0.2% -3.8% 6.2% 0.2% -1.4%
Societal Benefit -1.7% -6.0% -6.3% -4.6% 0.7% -3.5%
Overall retention rates may not alw ays fall betw een first-year and multi-year donor retention rates for a given sector, since each
rate is a median of the rates of all organizations in that sector.
Overall Retention First-Year Donor Retention Multi-Year Donor Retention
New Donors-23.2%
All Donors-7.6%
-30%
-25%
-20%
-15%
-10%
-5%
0%
5%
10%
Q4
2003
Q1
2004
Q2
2004
Q3
2004
Q4
2004
Q1
2005
Q2
2005
Q3
2005
Q4
2005
Q1
2006
Q2
2006
Q3
2006
Q4
2006
Q1
2007
Q2
2007
Q3
2007
Q4
2007
Q1
2008
Q2
2008
Q3
2008
Q4
2008
Q1
2009
Q2
2009
Q3
2009
Q4
2009
Q1
2010
Q2
2010
Q3
2010
Q4
2010
Q1
2011
Q2
2011
Q3
2011
Q4
2011
Q1
2012
Q2
2012
Q3
2012
Q4
2012
Q1
2013
Q2
2013
Q3
2013
Q4
2013
Fig. 9: Ten-Year Overall Index Donor and New Donor TrendsCumulative Rolling 12-Month Median Change from Q4 2003
HaitiEarthquake
End ofRecession
JapanEarthquake
Hurricane Sandy
Start ofRecession
Hurricane Katrina
IndianOcean
Tsunami
Burma Cyclone / China Earthquake
Q4 2013 donorCentrics™ Index of Direct Marketing Fundraising
© April 2014 | 2 Canal Park, Cambridge, MA 02141 | www.blackbaud.com/targetanalytics 10
Lack of new donor growth is the primary cause of overall donor declines in the index, but flat first-year donor retention rates in recent years are also partly responsible, for most sectors in the index.
From 2012 to 2013, first-year retention rates remained essentially flat, declining a median 0.2%; 49% of the organizations in the index had positive first-year retention growth in 2012, and 51% had declines. Only three sectors had increases in first-year retention in 2012: human services and religion, both of which were recovering from declines in 2011, and international relief, which experienced boosts in all areas due to emergency giving at the end of the year.
Overall, multi-year retention also remained essentially flat, declining a median 0.6% from 2012 to 2013. 45% of the organizations in the index had positive multi-year retention rate growth in 2013. Multi-year retention tends to be less volatile than first-year retention, and this was generally true across most index sectors.
The Growth of Internet Giving
By the time of publication of this edition of the index, we were able to identify and verify gift channels for 57 of the 76 participating organizations, and so are able to include a giving channel analysis in this report.
The organizations that participate in the index are large direct marketing organizations that rely primarily on direct mail. Revenue from other channels, such as telemarketing and the internet, makes up a relatively small portion of the overall total, and revenue from large-scale events is generally not included in the index analysis.
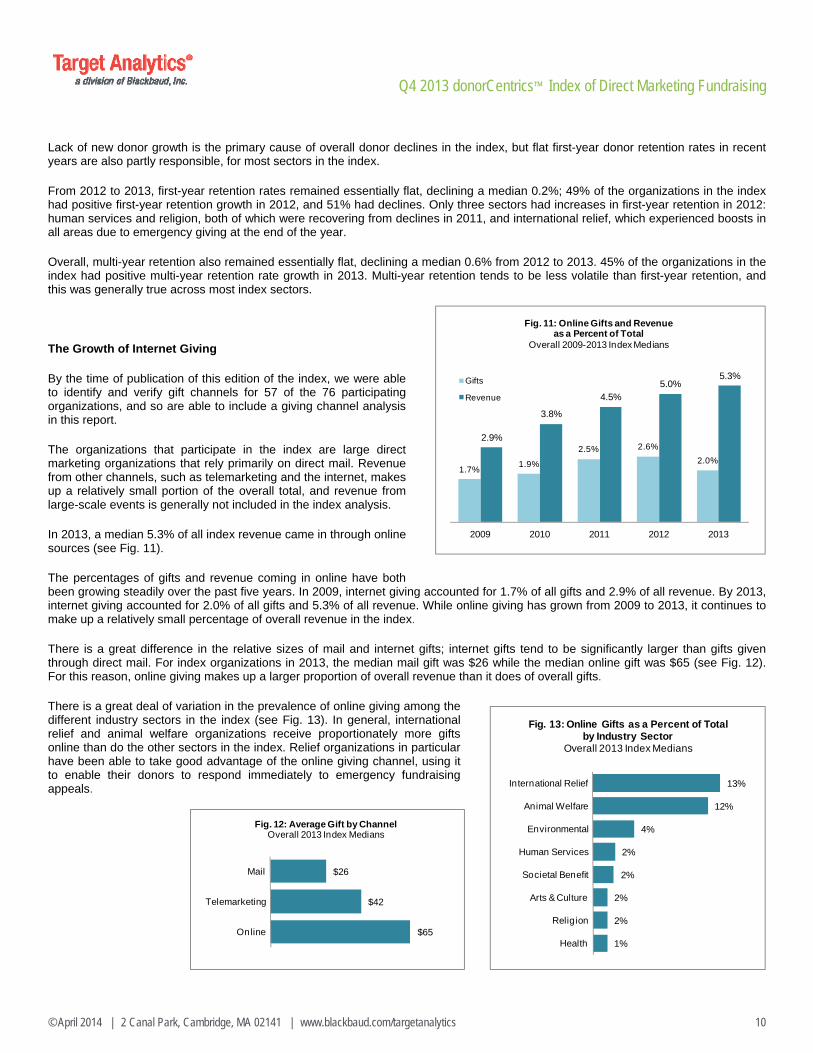
In 2013, a median 5.3% of all index revenue came in through online sources (see Fig. 11).
The percentages of gifts and revenue coming in online have both been growing steadily over the past five years. In 2009, internet giving accounted for 1.7% of all gifts and 2.9% of all revenue. By 2013, internet giving accounted for 2.0% of all gifts and 5.3% of all revenue. While online giving has grown from 2009 to 2013, it continues to make up a relatively small percentage of overall revenue in the index.
There is a great difference in the relative sizes of mail and internet gifts; internet gifts tend to be significantly larger than gifts given through direct mail. For index organizations in 2013, the median mail gift was $26 while the median online gift was $65 (see Fig. 12). For this reason, online giving makes up a larger proportion of overall revenue than it does of overall gifts.
There is a great deal of variation in the prevalence of online giving among the different industry sectors in the index (see Fig. 13). In general, international relief and animal welfare organizations receive proportionately more gifts online than do the other sectors in the index. Relief organizations in particular have been able to take good advantage of the online giving channel, using it to enable their donors to respond immediately to emergency fundraising appeals.
1.7%1.9%
2.5% 2.6%
2.0%
2.9%
3.8%
4.5%5.0%
5.3%
2009 2010 2011 2012 2013
Fig. 11: Online Gifts and Revenueas a Percent of Total
Overall 2009-2013 Index Medians
Gifts
Revenue
$26
$42
$65
Telemarketing
Online
Fig. 12: Average Gift by ChannelOverall 2013 Index Medians
13%
12%
4%
2%
2%
2%
2%
1%
International Relief
Animal Welfare
Environmental
Human Services
Societal Benefit
Arts & Culture
Religion
Health
Fig. 13: Online Gifts as a Percent of Totalby Industry Sector
Overall 2013 Index Medians
Q4 2013 donorCentrics™ Index of Direct Marketing Fundraising
© April 2014 | 2 Canal Park, Cambridge, MA 02141 | www.blackbaud.com/targetanalytics 11
Effects of the Economy on Giving
Research by the Giving USA Foundation™ tells us that charitable giving revenue growth rises during periods of strong economic growth and slows during periods of relative economic weakness. Non-profit giving trends are not limited to simple parallels with national economic growth, however. The Foundation has reported in their publication Giving USA that during harder economic times, charitable giving falls as a percentage of the Gross Domestic Product2.
This means that in a slow economy, not only does giving slow down, but it also declines as a proportion of the average American’s spending dollar. In recessionary periods, people shift their spending priorities away from charities, compounding the effects of an economic decline on fundraising.
The donorCentrics index has consistently supported both of these findings. Median index revenue growth has generally followed national economic performance and tends to grow more slowly or even to decline during periods of relative economic hardship.
According to the National Bureau of Economic Research, the United States economy entered a recession in December 2007 and emerged from it in June 20093. Non-profit direct marketing revenue in the donorCentrics index declined throughout 2008 and in early 2009 during the worst parts of the recession, and donor declines intensified during that time. We reported overall revenue declines in seven consecutive editions of the index (Q2 2008 through Q4 2009), with some of the steepest downturns coming in the first half of 2009.
Many indicators of US economic health, including GDP growth, have remained sluggish since then. Similarly, nonprofit revenue growth in the index has been weak since the declared end of the recession.
Most organizations participating in the index have not yet regained a significant portion of the ground they have lost over the past six years. Giving USA Foundation research indicates that, in the past, once a recession is over, it has taken an average of three to four years for inflation-adjusted charitable giving to rise back up to pre-recession levels4. However, the recession of 2007-2009 was one of the worst in recent memory and the post-recession recovery one of the slowest, meaning that the nonprofit industry may have to contend with this situation for a while yet. At current rates of growth, the Foundation says, real national charitable giving will not reach pre-recession revenue levels until at least 20185.
Q4 2013 donorCentrics™ Index of Direct Marketing Fundraising
© April 2014 | 2 Canal Park, Cambridge, MA 02141 | www.blackbaud.com/targetanalytics 12
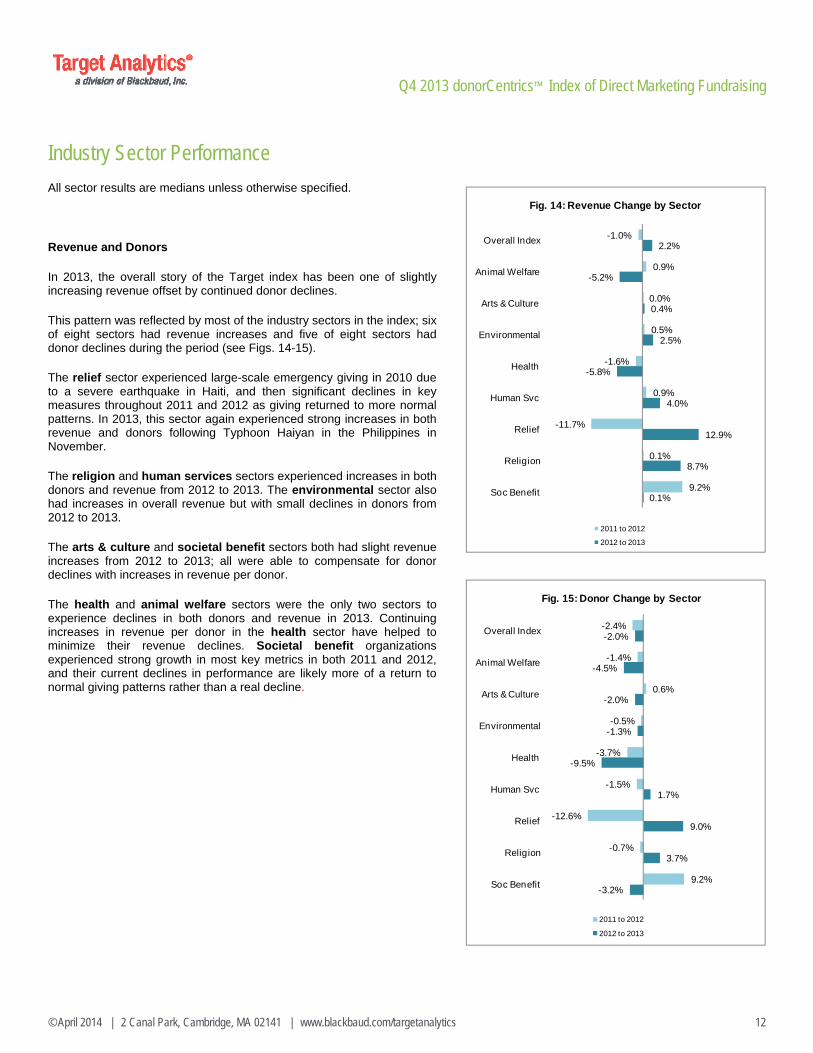
Industry Sector Performance
All sector results are medians unless otherwise specified.
Revenue and Donors
In 2013, the overall story of the Target index has been one of slightly increasing revenue offset by continued donor declines.
This pattern was reflected by most of the industry sectors in the index; six of eight sectors had revenue increases and five of eight sectors had donor declines during the period (see Figs. 14-15).
The relief sector experienced large-scale emergency giving in 2010 due to a severe earthquake in Haiti, and then significant declines in key measures throughout 2011 and 2012 as giving returned to more normal patterns. In 2013, this sector again experienced strong increases in both revenue and donors following Typhoon Haiyan in the Philippines in November.
The religion and human services sectors experienced increases in both donors and revenue from 2012 to 2013. The environmental sector also had increases in overall revenue but with small declines in donors from 2012 to 2013.
The arts & culture and societal benefit sectors both had slight revenue increases from 2012 to 2013; all were able to compensate for donor declines with increases in revenue per donor.
The health and animal welfare sectors were the only two sectors to experience declines in both donors and revenue in 2013. Continuing increases in revenue per donor in the health sector have helped to minimize their revenue declines. Societal benefit organizations experienced strong growth in most key metrics in both 2011 and 2012, and their current declines in performance are likely more of a return to normal giving patterns rather than a real decline.
-1.0%
0.9%
0.0%
0.5%
-1.6%
0.9%
-11.7%
0.1%
9.2%
2.2%
-5.2%
0.4%
2.5%
-5.8%
4.0%
12.9%
8.7%
0.1%
Overall Index
Animal Welfare
Arts & Culture
Environmental
Health
Human Svc
Relief
Religion
Soc Benefit
Fig. 14: Revenue Change by Sector
2011 to 2012
2012 to 2013
-2.4%
-1.4%
0.6%
-0.5%
-3.7%
-1.5%
-12.6%
-0.7%
9.2%
-2.0%
-4.5%
-2.0%
-1.3%
-9.5%
1.7%
9.0%
3.7%
-3.2%
Overall Index
Animal Welfare
Arts & Culture
Environmental
Health
Human Svc
Relief
Religion
Soc Benefit
Fig. 15: Donor Change by Sector
2011 to 2012
2012 to 2013

Q4 2013 donorCentrics™ Index of Direct Marketing Fundraising
© April 2014 | 2 Canal Park, Cambridge, MA 02141 | www.blackbaud.com/targetanalytics 13
New Donor Acquisition
For most of the past five years, declines in overall donor numbers have been driven primarily by declines in new donor acquisition. Except for a temporary increase in the first half of 2012, new donor numbers have been on the decline for the index as a whole since 2005.
In 2013, new donor acquisition declined for five sectors, while one experienced significant increases and the remaining two experienced more modest increases (see Fig. 16).
The international relief sector had the largest median increase in new donor acquisition, increasing 20.5% from 2012 to 2013. Much of the current year increase in new donors may be driven by emergency-related giving in the fourth quarter of 2013. This is a welcome change after significant post-disaster acquisition declines in the previous two years.
Societal benefit organizations’ new donor populations declined a median 12.7% from 2012 to 2013, but this follows extraordinary growth of 18.5% in the previous period and may be more a return to more normal acquisition patterns, rather than a real decline.
The health and environmental sectors experienced large declines in new donors, declining 8.6% and 8.0% respectively over the period. Animal welfare sector new donor counts declined 5.8% from 2012 to 2013, following larger declines during the same period in the previous year while the arts and culture sector declined 2.4% following similar declines in the previous year.
The human services and religion sectors both had increasing new donors from 2012 to 2013 following declines in the same period in the previous year.
Every sector experienced an increase in revenue per new donor from 2012 to 2013, reflecting an index-wide increase in new donor value (see Fig. 17). For most sectors this year’s growth comes on top of increases in the previous year.
The trend of fewer new donors giving at higher average amounts is a significant one and may be due in part to intentional organizational strategy.
-3.7%
-10.9%
-2.0%
0.3%
-2.9%
-6.8%
-21.2%
-1.0%
18.5%
-3.2%
-5.8%
-2.4%
-8.0%
-8.6%
6.5%
20.5%
3.0%
-12.7%
Overall Index
Animal Welfare
Arts & Culture
Environmental
Health
Human Svc
Relief
Religion
Soc Benefit
Fig. 16: New Donor Change by Sector
2011 to 2012
2012 to 2013
2.3%
-3.1%
9.2%
3.4%
2.7%
6.0%
-6.4%
2.5%
-0.2%
6.5%
4.8%
1.3%
5.7%
6.1%
4.3%
15.5%
6.7%
3.9%
Overall Index
Animal Welfare
Arts & Culture
Environmental
Health
Human Svc
Relief
Religion
Soc Benefit
Fig. 17: Revenue per New Donor Chg by Sector
2011 to 2012
2012 to 2013

Q4 2013 donorCentrics™ Index of Direct Marketing Fundraising
© April 2014 | 2 Canal Park, Cambridge, MA 02141 | www.blackbaud.com/targetanalytics 14
Retention Rates
Donor retention has been an area of concern in the index in recent years. While declining new donor acquisition was primarily responsible for overall index donor declines, falling retention rates–particularly first-year retention rates–also certainly played a part.
This year, however, in what appears to be stabilization, five of the eight sectors in the index had either flat or increasing first year retention from 2012 to 2013 (see Fig 18). The international relief and religion sectors had the largest increases in first year retention, while the animal welfare and societal benefit sectors had the largest declines in first year retention from 2012 to 2013. The decline for societal benefit is to be expected following the large increase in new donors in 2012.
Multi-year retention was, as always, more stable than first-year retention. Most sectors’ multi-year retention rates were essentially flat, with the exception of animal welfare and societal benefit sectors which experienced relatively large declines (see Fig 19).
Individual sector results are explained in more detail on the following pages.
1.6%
11.8%
0.9%
1.8%
3.0%
-1.7%
0.8%
-3.8%
-6.3%
-0.2%
-7.5%
-0.9%
-5.1%
-0.1%
4.2%
14.9%
6.2%
-4.6%
Overall Index
Animal Welfare
Arts & Culture
Environmental
Health
Human Svc
Relief
Religion
Soc Benefit
Fig. 18: First-Year Retention Rate Changeby Sector
2011 to 2012
2012 to 2013
0.4%
-0.4%
-1.7%
-0.4%
0.5%
-2.2%
1.1%
0.2%
0.7%
-0.6%
-3.7%
-0.6%
-0.4%
-1.4%
-0.2%
4.0%
-1.4%
-3.5%
Overall Index
Animal Welfare
Arts & Culture
Environmental
Health
Human Svc
Relief
Religion
Soc Benefit
Fig. 19: Multi-Year Retention Rate Changeby Sector
2011 to 2012
2012 to 2013

Q4 2013 donorCentrics™ Index of Direct Marketing Fundraising
© April 2014 | 2 Canal Park, Cambridge, MA 02141 | www.blackbaud.com/targetanalytics 15
Animal Welfare 4 organizations
This sector has been one of the strongest in the index for more than five years, maintaining steady donor counts during a time when most other sectors had donor declines. After several years of outpacing the overall index performance, this trend shifted in 2013, with declines in donor and revenue across the sector.
Animal welfare revenue declined a median 5.2% from 2012 to 2013, compared to an overall index median revenue increase of 2.2% (see Fig. 20). One of the four organizations in this sector had revenue growth in 2013.
Donors to animal welfare organizations declined a median 4.5% from 2012 to 2013, compared to an overall index median donor decline of 2.0%. New donor acquisition declined a median 5.8% from 2012 to 2013, compared to an overall index median new donor decline of 3.2%.
Rolling twelve-month trends give us more long-term context for recent animal welfare sector performance. The sector received a spike in both donors and revenue in 2010 following the earthquake in Haiti, and has continued to outdo the rest of the index in revenue growth even with declines in recent performance.
This has enabled the animal welfare sector to outperform cumulative overall index revenue over the past five years. From the twelve months ending Q4 2008 to the twelve months ending Q4 2013, revenue growth for the animal welfare sector grew by a cumulative median 8.4%, while the index as a whole had revenue declines of 5.2% (see Fig. 21). Over the same period, sector donors declined by a median 7.1% while the overall index saw a median donor decline of 9.4% (see Fig. 22).
When evaluating results for this sector, it is important to be aware that it includes only four organizations.
0.9%
-1.4%
2.7%
-10.9%
1.5%
11.8%
-0.4%
-2.8%
-5.2%
-4.5%
1.5%
-5.8%
-3.1%
-7.5%
-3.7%
-8.2%
Revenue
Donors
Rev / Donor
New Donors
Retention
First-Year Retention
Multi-Year Retention
Reactivation
Fig. 20: Animal Welfare Sector MediansYear-to-Date Change in Key Measures
2011 to 2012 2012 to 2013
AnimalWelfareSector8.4%
EntireIndex-5.2%
-15%
-10%
-5%
0%
5%
10%
15%
20%
25%
Q4
'08
Q1
'09
Q2
'09
Q3
'09
Q4
'09
Q1
'10
Q2
'10
Q3
'10
Q4
'10
Q1
'11
Q2
'11
Q3
'11
Q4
'11
Q1
'12
Q2
'12
Q3
'12
Q4
'12
Q1
'13
Q2
'13
Q3
'13
Q4
'13
Fig. 21: Five-Year Animal Welfare Revenue Trends 12-Month Quarter-End Median Change from Q4 2008
Each data point is the median change in revenue for the 12 months ending in that quarter from the 12 months ending in Q4 2008.
HaitiEarthquake
Gulf OilSpill
Hurricane Sandy
AnimalWelfareSector-7.1%
EntireIndex-9.4%
-15%
-10%
-5%
0%
5%
10%
15%
20%
25%
Q4
'08
Q1
'09
Q2
'09
Q3
'09
Q4
'09
Q1
'10
Q2
'10
Q3
'10
Q4
'10
Q1
'11
Q2
'11
Q3
'11
Q4
'11
Q1
'12
Q2
'12
Q3
'12
Q4
'12
Q1
'13
Q2
'13
Q3
'13
Q4
'13
Fig. 22: Five-Year Animal Welfare Donor Trends12-Month Quarter-End Median Change from Q4 2008
Each data point is the median change in donors for the 12 months ending in that quarter from the 12 months ending in Q4 2008.
HaitiEarthquake
Gulf OilSpill Hurricane
Sandy
Q4 2013 donorCentrics™ Index of Direct Marketing Fundraising
© April 2014 | 2 Canal Park, Cambridge, MA 02141 | www.blackbaud.com/targetanalytics 16
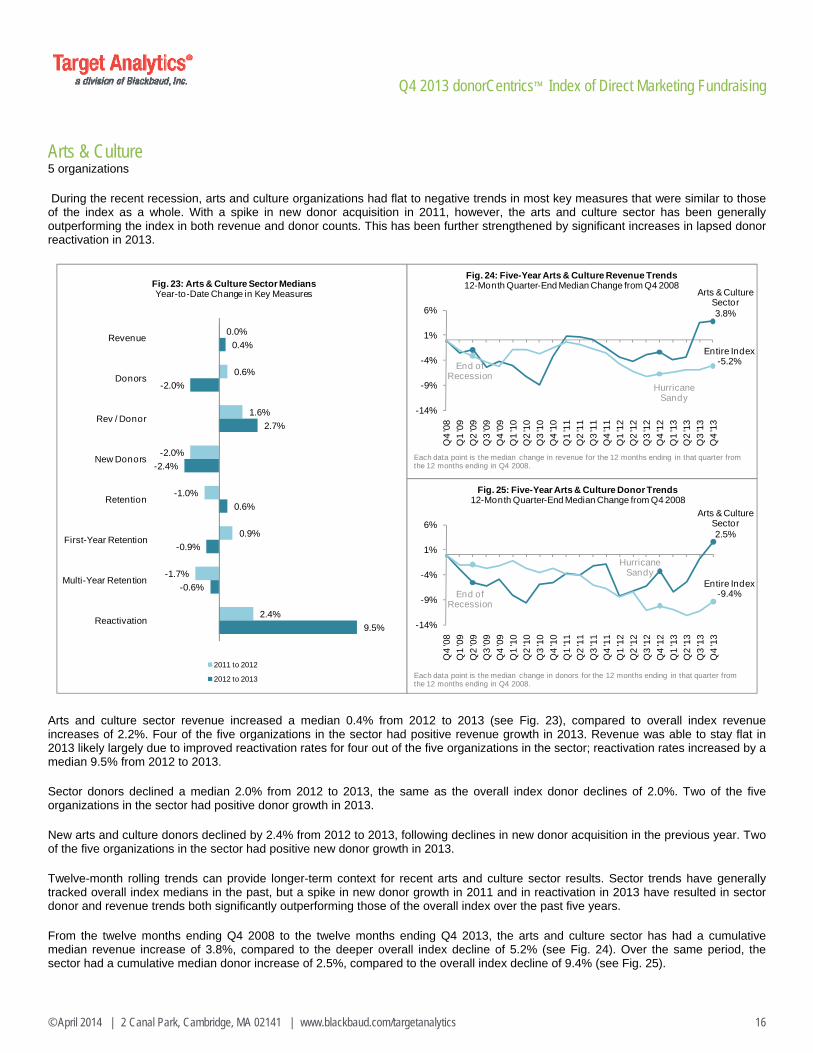
Arts & Culture 5 organizations
During the recent recession, arts and culture organizations had flat to negative trends in most key measures that were similar to those of the index as a whole. With a spike in new donor acquisition in 2011, however, the arts and culture sector has been generally outperforming the index in both revenue and donor counts. This has been further strengthened by significant increases in lapsed donor reactivation in 2013.
Arts and culture sector revenue increased a median 0.4% from 2012 to 2013 (see Fig. 23), compared to overall index revenue increases of 2.2%. Four of the five organizations in the sector had positive revenue growth in 2013. Revenue was able to stay flat in 2013 likely largely due to improved reactivation rates for four out of the five organizations in the sector; reactivation rates increased by a median 9.5% from 2012 to 2013.
Sector donors declined a median 2.0% from 2012 to 2013, the same as the overall index donor declines of 2.0%. Two of the five organizations in the sector had positive donor growth in 2013.
New arts and culture donors declined by 2.4% from 2012 to 2013, following declines in new donor acquisition in the previous year. Two of the five organizations in the sector had positive new donor growth in 2013.
Twelve-month rolling trends can provide longer-term context for recent arts and culture sector results. Sector trends have generally tracked overall index medians in the past, but a spike in new donor growth in 2011 and in reactivation in 2013 have resulted in sector donor and revenue trends both significantly outperforming those of the overall index over the past five years.
From the twelve months ending Q4 2008 to the twelve months ending Q4 2013, the arts and culture sector has had a cumulative median revenue increase of 3.8%, compared to the deeper overall index decline of 5.2% (see Fig. 24). Over the same period, the sector had a cumulative median donor increase of 2.5%, compared to the overall index decline of 9.4% (see Fig. 25).
0.0%
0.6%
1.6%
-2.0%
-1.0%
0.9%
-1.7%
2.4%
0.4%
-2.0%
2.7%
-2.4%
0.6%
-0.9%
-0.6%
9.5%
Revenue
Donors
Rev / Donor
New Donors
Retention
First-Year Retention
Multi-Year Retention
Reactivation
Fig. 23: Arts & Culture Sector MediansYear-to-Date Change in Key Measures
2011 to 2012
2012 to 2013
Arts & Culture Sector3.8%
Entire Index-5.2%
-14%
-9%
-4%
1%
6%
Q4
'08
Q1
'09
Q2
'09
Q3
'09
Q4
'09
Q1
'10
Q2
'10
Q3
'10
Q4
'10
Q1
'11
Q2
'11
Q3
'11
Q4
'11
Q1
'12
Q2
'12
Q3
'12
Q4
'12
Q1
'13
Q2
'13
Q3
'13
Q4
'13
Fig. 24: Five-Year Arts & Culture Revenue Trends 12-Month Quarter-End Median Change from Q4 2008
Each data point is the median change in revenue for the 12 months ending in that quarter from the 12 months ending in Q4 2008.
Hurricane Sandy
End ofRecession
Arts & Culture Sector2.5%
Entire Index-9.4%
-14%
-9%
-4%
1%
6%
Q4
'08
Q1
'09
Q2
'09
Q3
'09
Q4
'09
Q1
'10
Q2
'10
Q3
'10
Q4
'10
Q1
'11
Q2
'11
Q3
'11
Q4
'11
Q1
'12
Q2
'12
Q3
'12
Q4
'12
Q1
'13
Q2
'13
Q3
'13
Q4
'13
Fig. 25: Five-Year Arts & Culture Donor Trends12-Month Quarter-End Median Change from Q4 2008
Each data point is the median change in donors for the 12 months ending in that quarter from the 12 months ending in Q4 2008.
Hurricane Sandy
End of Recession

Q4 2013 donorCentrics™ Index of Direct Marketing Fundraising
© April 2014 | 2 Canal Park, Cambridge, MA 02141 | www.blackbaud.com/targetanalytics 17
Environment 13 organizations
Unlike many index sectors, the environmental sector does not typically see a great deal of fluctuation in giving from quarter to quarter or from year to year, and usually closely parallels the overall index in revenue and donor growth. As overall donor counts have declined, environmental organizations have generally been able to maintain overall revenue by increasing overall revenue per donor. These trends have continued in 2013.
Revenue for the environmental sector increased a median 2.5%, similar to the overall index median increase of 2.2% (see Fig. 26). These increases were widespread with 85% of the environmental organizations in the index having positive revenue growth in 2013.
Environmental donors decreased a median 1.3% from 2012 to 2013, while the index as a whole declined a similar 2.0%. Only 38% of the environmental organizations in the index had positive donor growth in 2013.
Over the past two years, the area of greatest concern for environmental organizations has been new donor acquisition. This year the sector continued to experience new donor declines, with new donors declining 8.0% from 2012 to 2013 after flat growth in the previous year. Only 31% of the environmental organizations in the index had positive new donor growth in 2013.
Twelve-month rolling trends can provide longer-term context for recent sector trends. This analysis shows that ever since 2008, environmental revenue and donor growth have both followed index medians relatively closely. From the twelve months ending Q4 2008 to the twelve months ending Q4 2013, the environmental sector had a median cumulative revenue decline of 7.6%, similar to the overall index decline of 5.2% (see Fig. 27). From the twelve months ending Q4 2008 to the twelve months ending Q4 2013, the sector had cumulative median donor declines of 8.1% compared to the overall index decline of 9.4% (see Fig. 28).
0.5%
-0.5%
2.6%
0.3%
-0.7%
1.8%
-0.4%
-4.5%
2.5%
-1.3%
3.6%
-8.0%
-0.2%
-5.1%
-0.4%
2.0%
Revenue
Donors
Rev / Donor
New Donors
Retention
First-Year Retention
Multi-Year Retention
Reactivation
Fig. 26: Environmental Sector MediansYear-to-Date Change in Key Measures
2011 to 2012
2012 to 2013
Environmental Sector-7.6%
Entire Index-5.2%
-14%
-12%
-10%
-8%
-6%
-4%
-2%
0%
Q4
'08
Q1
'09
Q2
'09
Q3
'09
Q4
'09
Q1
'10
Q2
'10
Q3
'10
Q4
'10
Q1
'11
Q2
'11
Q3
'11
Q4
'11
Q1
'12
Q2
'12
Q3
'12
Q4
'12
Q1
'13
Q2
'13
Q3
'13
Q4
'13
Fig. 27: Five-Year Environmental Revenue Trends 12-Month Quarter-End Median Change from Q4 2008
Each data point is the median change in revenue for the 12 months ending in that quarter from the 12 months ending in Q4 2008.
Hurricane Sandy
Gulf OilSpill
End of Recession
Environmental Sector-8.1%
EntireIndex-9.4%
-14%
-12%
-10%
-8%
-6%
-4%
-2%
0%
Q4
'08
Q1
'09
Q2
'09
Q3
'09
Q4
'09
Q1
'10
Q2
'10
Q3
'10
Q4
'10
Q1
'11
Q2
'11
Q3
'11
Q4
'11
Q1
'12
Q2
'12
Q3
'12
Q4
'12
Q1
'13
Q2
'13
Q3
'13
Q4
'13
Fig. 28: Five-Year Environmental Donor Trends12-Month Quarter-End Median Change from Q4 2008
Each data point is the median change in donors for the 12 months ending in that quarter from the 12 months ending in Q4 2008.
Hurricane Sandy
Gulf OilSpill
End of Recession

Q4 2013 donorCentrics™ Index of Direct Marketing Fundraising
© April 2014 | 2 Canal Park, Cambridge, MA 02141 | www.blackbaud.com/targetanalytics 18
Health 19 organizations
Health organizations have had some of the greatest fundraising challenges in the index for much of the past five years. Negative health sector trends predated the recent recession but were significantly intensified by it. In 2013 the sector continued to see declines in revenue and donors in spite of increases in overall revenue per donor.
Health sector revenue declined a median 5.8% from 2012 to 2013 compared to overall index revenue increases of 2.2% (see Fig. 29). Only 26% of the organizations in the health sector had positive revenue growth in 2013.
Health sector donors declined a median 9.5% from 2012 to 2013 compared to overall index donor declines of 2.0%. Only 21% of the organizations in this sector had positive donor growth in 2013.
Past declines in health donors have been due mainly to declines in donor acquisition. This trend continued in 2013 with new health sector donors declining 8.6% from 2012 to 2013 compared to overall index new donor declines of 3.2%. Only 21% of the health organizations in the index did have positive new donor growth in 2013.
While donor counts have continued to see declines, donor value has increased for the last two years. Health sector revenue per donor increased 3.8% from 2012 to 2013, following a 2.8% increase in the prior year.
Health sector revenue and donor growth have both lagged overall index median trends significantly over the long term. From the twelve months ending Q4 2008 to the twelve months ending Q4 2013, health organizations had cumulative revenue declines of 21.3%, compared to a decline of only 5.2% for the index as a whole (see Fig. 30). Over the same five-year period, health organizations had a cumulative donor decline of 31.8%, compared to a decline of only 9.4% for the index as a whole (see Fig. 31).
This study considers direct marketing revenue, not event revenue. Several health charities have large-scale fundraising events that are not included in this analysis.
-1.6%
-3.7%
2.8%
-2.9%
0.9%
3.0%
0.5%
-1.1%
-5.8%
-9.5%
3.8%
-8.6%
-1.7%
-0.1%
-1.4%
-5.0%
Revenue
Donors
Rev / Donor
New Donors
Retention
First-Year Retention
Multi-Year Retention
Reactivation
Fig. 29: Health Sector MediansYear-to-Date Change in Key Measures
2011 to 2012
2012 to 2013
Health Sector-21.3%
Entire Index-5.2%
-35%
-30%
-25%
-20%
-15%
-10%
-5%
0%
Q4
'08
Q1
'09
Q2
'09
Q3
'09
Q4
'09
Q1
'10
Q2
'10
Q3
'10
Q4
'10
Q1
'11
Q2
'11
Q3
'11
Q4
'11
Q1
'12
Q2
'12
Q3
'12
Q4
'12
Q1
'13
Q2
'13
Q3
'13
Q4
'13
Fig. 30: Five-Year Health Revenue Trends 12-Month Quarter-End Median Change from Q4 2008
Each data point is the median change in revenue for the 12 months ending in that quarter from the 12 months ending in Q4 2008.
Hurricane Sandy
End of Recession
Health-31.8%
Entire Index-9.4%
-35%
-30%
-25%
-20%
-15%
-10%
-5%
0%
Q4
'08
Q1
'09
Q2
'09
Q3
'09
Q4
'09
Q1
'10
Q2
'10
Q3
'10
Q4
'10
Q1
'11
Q2
'11
Q3
'11
Q4
'11
Q1
'12
Q2
'12
Q3
'12
Q4
'12
Q1
'13
Q2
'13
Q3
'13
Q4
'13
Fig. 31: Five-Year Health Donor Trends12-Month Quarter-End Median Change from Q4 2008
Each data point is the median change in donors for the 12 months ending in that quarter from the 12 months ending in Q4 2008.
Hurricane Sandy
End ofRecession

Q4 2013 donorCentrics™ Index of Direct Marketing Fundraising
© April 2014 | 2 Canal Park, Cambridge, MA 02141 | www.blackbaud.com/targetanalytics 19
Human Services 8 organizations
The human services sector was one of the strongest in the index during the recent recession, well outperforming the index in revenue growth during from 2007-2009. During that time of great need, donors may have deliberately concentrated their giving on organizations in this sector, which provide direct aid to the disadvantaged. Human services organizations have generally performed close to overall index trends since the end of the recession.
Revenue for the human services sector increased by 4.0% from 2012 to 2013 (see Fig. 32). Five of the eight organizations in the sector had positive revenue growth over the period.
Human services donors increased slightly in 2013, increasing a median 1.7% from 2012 to 2013, while the index as a whole had donor declines of 2.0%. Five of the eight organizations in this sector had positive donor growth in 2013.
New human services donors increased by 6.5% from 2012 to 2013, compared to overall new donor declines of 3.2%. Five of the eight organizations in the sector had new donor growth over the period. Coming after declines of 6.8% in the previous year, this may be a sign more of a recovery of new donor numbers.
Rolling twelve-month trends show that the human services sector has generally had similar performance to the overall index over the past five years. From the twelve months ending Q4 2008 to the twelve months ending Q4 2013, human services revenue declined a cumulative median 6.3% while overall index revenue declined by 5.2% (see Fig. 33). Over the same five-year period, sector donor numbers have declined a cumulative median 9.4%, exactly the same as the overall index decline of 9.4% (see Fig. 34).
0.9%
-1.5%
4.0%
-6.8%
-2.1%
-1.7%
-2.2%
5.6%
4.0%
1.7%
1.1%
6.5%
2.4%
4.2%
-0.2%
4.1%
Revenue
Donors
Rev / Donor
New Donors
Retention
First-Year Retention
Multi-Year Retention
Reactivation
Fig. 32: Human Services Sector MediansYear-to-Date Change in Key Measures
2011 to 2012
2012 to 2013
Human Services Sector
-6.3%
Entire Index-5.2%
-18%
-13%
-8%
-3%
2%
Q4
'08
Q1
'09
Q2
'09
Q3
'09
Q4
'09
Q1
'10
Q2
'10
Q3
'10
Q4
'10
Q1
'11
Q2
'11
Q3
'11
Q4
'11
Q1
'12
Q2
'12
Q3
'12
Q4
'12
Q1
'13
Q2
'13
Q3
'13
Q4
'13
Fig. 33: Five-Year Human Services Revenue Trends 12-Month Quarter-End Median Change from Q4 2008
Each data point is the median change in revenue for the 12 months ending in that quarter from the 12 months ending in Q4 2008.
Hurricane Sandy
End of Recession
Human ServicesSector-9.4%
Entire Index-9.4%
-18%
-13%
-8%
-3%
2%
Q4
'08
Q1
'09
Q2
'09
Q3
'09
Q4
'09
Q1
'10
Q2
'10
Q3
'10
Q4
'10
Q1
'11
Q2
'11
Q3
'11
Q4
'11
Q1
'12
Q2
'12
Q3
'12
Q4
'12
Q1
'13
Q2
'13
Q3
'13
Q4
'13
Fig. 34: Five-Year Human Services Donor Trends12-Month Quarter-End Median Change from Q4 2008
Each data point is the median change in donors for the 12 months ending in that quarter from the 12 months ending in Q4 2008.
Hurricane Sandy
End ofRecession
Q4 2013 donorCentrics™ Index of Direct Marketing Fundraising
© April 2014 | 2 Canal Park, Cambridge, MA 02141 | www.blackbaud.com/targetanalytics 20
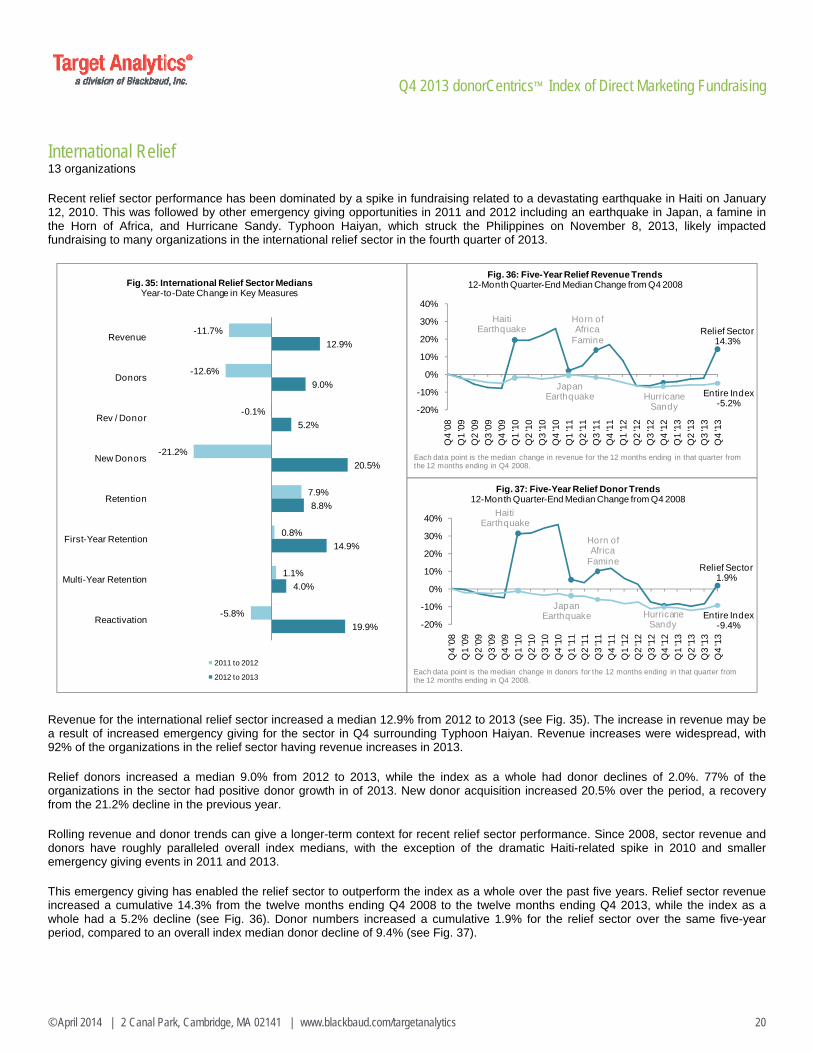
International Relief 13 organizations
Recent relief sector performance has been dominated by a spike in fundraising related to a devastating earthquake in Haiti on January 12, 2010. This was followed by other emergency giving opportunities in 2011 and 2012 including an earthquake in Japan, a famine in the Horn of Africa, and Hurricane Sandy. Typhoon Haiyan, which struck the Philippines on November 8, 2013, likely impacted fundraising to many organizations in the international relief sector in the fourth quarter of 2013.
Revenue for the international relief sector increased a median 12.9% from 2012 to 2013 (see Fig. 35). The increase in revenue may be a result of increased emergency giving for the sector in Q4 surrounding Typhoon Haiyan. Revenue increases were widespread, with 92% of the organizations in the relief sector having revenue increases in 2013.
Relief donors increased a median 9.0% from 2012 to 2013, while the index as a whole had donor declines of 2.0%. 77% of the organizations in the sector had positive donor growth in of 2013. New donor acquisition increased 20.5% over the period, a recovery from the 21.2% decline in the previous year.
Rolling revenue and donor trends can give a longer-term context for recent relief sector performance. Since 2008, sector revenue and donors have roughly paralleled overall index medians, with the exception of the dramatic Haiti-related spike in 2010 and smaller emergency giving events in 2011 and 2013.
This emergency giving has enabled the relief sector to outperform the index as a whole over the past five years. Relief sector revenue increased a cumulative 14.3% from the twelve months ending Q4 2008 to the twelve months ending Q4 2013, while the index as a whole had a 5.2% decline (see Fig. 36). Donor numbers increased a cumulative 1.9% for the relief sector over the same five-year period, compared to an overall index median donor decline of 9.4% (see Fig. 37).
-11.7%
-12.6%
-0.1%
-21.2%
7.9%
0.8%
1.1%
-5.8%
12.9%
9.0%
5.2%
20.5%
8.8%
14.9%
4.0%
19.9%
Revenue
Donors
Rev / Donor
New Donors
Retention
First-Year Retention
Multi-Year Retention
Reactivation
Fig. 35: International Relief Sector MediansYear-to-Date Change in Key Measures
2011 to 2012
2012 to 2013
Relief Sector14.3%
Entire Index-5.2%
-20%
-10%
0%
10%
20%
30%
40%
Q4
'08
Q1
'09
Q2
'09
Q3
'09
Q4
'09
Q1
'10
Q2
'10
Q3
'10
Q4
'10
Q1
'11
Q2
'11
Q3
'11
Q4
'11
Q1
'12
Q2
'12
Q3
'12
Q4
'12
Q1
'13
Q2
'13
Q3
'13
Q4
'13
Fig. 36: Five-Year Relief Revenue Trends 12-Month Quarter-End Median Change from Q4 2008
Each data point is the median change in revenue for the 12 months ending in that quarter from the 12 months ending in Q4 2008.
Haiti Earthquake
Horn of Africa
Famine
Hurricane Sandy
Japan Earthquake
Relief Sector1.9%
Entire Index-9.4%-20%
-10%
0%
10%
20%
30%
40%
Q4
'08
Q1
'09
Q2
'09
Q3
'09
Q4
'09
Q1
'10
Q2
'10
Q3
'10
Q4
'10
Q1
'11
Q2
'11
Q3
'11
Q4
'11
Q1
'12
Q2
'12
Q3
'12
Q4
'12
Q1
'13
Q2
'13
Q3
'13
Q4
'13
Fig. 37: Five-Year Relief Donor Trends12-Month Quarter-End Median Change from Q4 2008
Each data point is the median change in donors for the 12 months ending in that quarter from the 12 months ending in Q4 2008.
Haiti Earthquake
Horn of Africa
Famine
Hurricane Sandy
Japan Earthquake

Q4 2013 donorCentrics™ Index of Direct Marketing Fundraising
© April 2014 | 2 Canal Park, Cambridge, MA 02141 | www.blackbaud.com/targetanalytics 21
Religion 4 organizations
Religious organizations in the index have experienced a fair amount of volatility over the past several years, but generally have paralleled the overall index in revenue and donor growth. However the sector outperformed the index in many key metrics in 2013, including in revenue, donors, first-year retention, and reactivation.
Religion sector revenue increased a median 8.7% from 2012 to 2013 (see Fig. 38) compared to the index as a whole which had revenue increases of 2.2%. Three of the four organizations in this sector had positive revenue growth in 2013.
Sector donors increased a median 3.7% from 2012 to 2013, compared to the index as a whole which had donor declines of 2.0%. Three of the four organizations in this sector had positive donor growth in 2013.
New donors to religious organizations increased a median 3.0% from 2012 to 2013, compared to overall index declines of 3.2%. Reactivation rates also increased significantly, increasing 10.2% from 2012 to 2013 compared to the overall index increase of 1.4%.
Over the last five years, the sector has generally tracked very close to overall index trends, except for a significant spike in sector revenue in the past year. From the twelve months ending Q4 2008 to the twelve months ending Q4 2013, sector revenue increased a cumulative median 3.3%, compared to overall index declines of 5.2% (see Fig. 39). Over the same period, sector donor numbers declined 9.4%, the same as the overall index decline of 9.4% (see Fig. 40).
All four of the organizations in this sector are Catholic faith-based organizations.
0.1%
-0.7%
3.5%
-1.0%
-0.9%
-3.8%
0.2%
1.8%
8.7%
3.7%
3.2%
3.0%
-0.2%
6.2%
-1.4%
10.2%
Revenue
Donors
Rev / Donor
New Donors
Retention
First-Year Retention
Multi-Year Retention
Reactivation
Fig. 38: ReligionSector MediansYear-to-Date Change in Key Measures
2011 to 2012
2012 to 2013
Religion Sector3.3%
Entire Index-5.2%
-12%-10%-8%-6%-4%-2%0%2%4%
Q4
'08
Q1
'09
Q2
'09
Q3
'09
Q4
'09
Q1
'10
Q2
'10
Q3
'10
Q4
'10
Q1
'11
Q2
'11
Q3
'11
Q4
'11
Q1
'12
Q2
'12
Q3
'12
Q4
'12
Q1
'13
Q2
'13
Q3
'13
Q4
'13
Fig. 39: Five-Year Religion Revenue Trends 12-Month Quarter-End Median Change from Q4 2008
Each data point is the median change in revenue for the 12 months ending in that quarter from the 12 months ending in Q4 2008.
Hurricane Sandy
End of Recession
ReligionSector-9.4%
EntireIndex-9.4%
-12%-10%-8%-6%-4%-2%0%2%4%
Q4
'08
Q1
'09
Q2
'09
Q3
'09
Q4
'09
Q1
'10
Q2
'10
Q3
'10
Q4
'10
Q1
'11
Q2
'11
Q3
'11
Q4
'11
Q1
'12
Q2
'12
Q3
'12
Q4
'12
Q1
'13
Q2
'13
Q3
'13
Q4
'13
Fig. 40: Five-Year Religion Donor Trends12-Month Quarter-End Median Change from Q4 2008
Each data point is the median change in revenue for the 12 months ending in that quarter from the 12 months ending in Q4 2008.
Hurricane Sandy
End of Recession

Q4 2013 donorCentrics™ Index of Direct Marketing Fundraising
© April 2014 | 2 Canal Park, Cambridge, MA 02141 | www.blackbaud.com/targetanalytics 22
Societal Benefit 9 organizations
Societal benefit organizations experienced some of the greatest challenges of any sector in the index during the recent recession. This turned around completely after the recession was over, with most organizations in the sector experiencing robust revenue, donor, and new donor growth from 2011 through most of 2013. This was due in part to current events that highlighted the missions of several of the organizations across the sector. The Giving USA Foundation has indicated that campaign fundraising historically has had no discernible impact on individual giving6, but this sector was the most likely to be impacted—either positively or negatively—by increased messaging around their missions during the 2012 presidential election. The sector has seen some declines in donors, new donors and retention in 2013, but has been able to maintain flat revenue.
Societal benefit sector revenue was flat, increasing a median 0.1% from 2012 to 2013 (see Fig. 41), compared to overall index median increases of 2.2%. Societal benefit donor populations declined 3.2% over the same period, while the index as a whole experienced donor declines of 2.0%. These donor declines were widespread across the sector; only 33% of the societal benefit organizations in the index had positive donor growth in 2013.
New donors for the sector declined by a median 12.7% from 2012 to 2013. This decline is the largest sector decline in the index but comes after an extraordinary increase in new donors over the same period in the previous year.
A rolling twelve-month revenue and donor analysis can provide a longer-term perspective on these recent trends. It shows that the sector largely followed the index in revenue and donor growth from 2008 to mid-2010, but that the sector began rapidly gaining ground in the second half of 2010. The result is that cumulative revenue and donor growth for the societal benefit sector over the past five years are both far above overall index medians. From the twelve months ending Q4 2008 to the twelve months ending Q4 2013, societal benefit revenue rose a cumulative median 29.1%, compared to an overall index revenue decline of 5.2% (see Fig. 42). Over the same period, societal benefit donors increased a cumulative median 29.2%, compared to an overall index decline of 9.4% (see Fig. 43).
9.2%
9.2%
1.4%
18.5%
-1.7%
-6.3%
0.7%
0.5%
0.1%
-3.2%
4.3%
-12.7%
-6.0%
-4.6%
-3.5%
-8.9%
Revenue
Donors
Rev / Donor
New Donors
Retention
First-Year Retention
Multi-Year Retention
Reactivation
Fig. 41: Societal Benefit Sector MediansYear-to-Date Change in Key Measures
2011 to 2012
2012 to 2013
SocietalBenefitSector29.1%
EntireIndex-5.2%
-15%-10%-5%0%5%
10%15%20%25%30%
Q4
'08
Q1
'09
Q2
'09
Q3
'09
Q4
'09
Q1
'10
Q2
'10
Q3
'10
Q4
'10
Q1
'11
Q2
'11
Q3
'11
Q4
'11
Q1
'12
Q2
'12
Q3
'12
Q4
'12
Q1
'13
Q2
'13
Q3
'13
Q4
'13
Fig. 42: Five-Year Societal Benefit Revenue Trends 12-Month Quarter-End Median Change from Q4 2008
Each data point is the median change in revenue for the 12 months ending in that quarter from the 12 months ending in Q4 2008.
Hurricane Sandy
End of Recession
SocietalBenefitSector29.2%
EntireIndex-9.4%
-15%-10%-5%0%5%
10%15%20%25%30%
Q4
'08
Q1
'09
Q2
'09
Q3
'09
Q4
'09
Q1
'10
Q2
'10
Q3
'10
Q4
'10
Q1
'11
Q2
'11
Q3
'11
Q4
'11
Q1
'12
Q2
'12
Q3
'12
Q4
'12
Q1
'13
Q2
'13
Q3
'13
Q4
'13
Fig. 43: Five-Year Societal Benefit Donor Trends12-Month Quarter-End Median Change from Q4 2008
Each data point is the median change in revenue for the 12 months ending in that quarter from the 12 months ending in Q4 2008.
Hurricane Sandy
End ofRecession

Q4 2013 donorCentrics™ Index of Direct Marketing Fundraising
© April 2014 | 2 Canal Park, Cambridge, MA 02141 | www.blackbaud.com/targetanalytics 23
References
1. U.S. Department of Labor Bureau of Labor Statistics Analysis, Seasonally adjusted month-end Consumer Price Index (U.S. city average, all items), http://www.bls.gov/. Retrieved September 18, 2013.
2. Giving USA Foundation, Giving USA 2006, pp. 22 and 29.
3. National Bureau of Economic Research, NBER Business Cycle Dating Committee Announces Trough Date, September 20, 2010, http://www.nber.org/cycles/sept2010.html. Retrieved March 22, 2012.
4. Giving USA Foundation, “Giving Recovery after Economic Depression or Recession,” Giving USA Spotlight, Issue 2, 2009, p. 8. Article written by Melanie Miller, Sarah Schaefer, and Corinne Wagner of the Center on Philanthropy at Indiana University.
5. Giving USA Foundation, Giving USA Highlights 2013, p. 2.
6. Giving USA Foundation, Giving USA 2008, p. 50.
Q4 2013 donorCentrics™ Index of Direct Marketing Fundraising
© April 2014 | 2 Canal Park, Cambridge, MA 02141 | www.blackbaud.com/targetanalytics 24
Industry Sectors Used in the Index
Animal Welfare Organizations Organizations that focus on the care, protection, or understanding of pets or specialty animals, other than livestock. Includes humane societies, veterinary services, aquariums, and zoos. Arts & Culture Organizations Organizations that promote enjoyment or understanding of the visual, performing, folk, or media arts or the humanities; communications organizations; and organizations that promote the appreciation or understanding of historical events, including historical societies and genealogical or heredity-based organizations. Environmental Organizations Programs that focus on the preservation and protection of the environment, including pollution control and abatement programs; conservation and development of natural resources (land, plant, water, energy); control or elimination of hazardous and toxic substances (including pesticides); solid waste management programs; botanical gardens and societies; urban beautification and open spaces programs; and environmental education. Also includes programs that focus primarily on the protection and preservation of wildlife or fisheries. Health Organizations Programs which help people achieve and maintain physical well-being through prevention, screening, evaluation and treatment; programs that promote mental health and treatment of mental illness; voluntary health organizations that are organized on a national, state or local basis and supported primarily by voluntary contributions from the public at large, which are engaged in a program of service, education and some research that is related to a particular disease, condition or disability, or group of diseases, conditions or disabilities; research institutes and other organizations whose primary purpose is to promote the advancement of knowledge about specific diseases, disorders, or medical disciplines. Human Services Organizations Organizations that promote or provide a broad range of social or human services to individuals or families; organizations that focus on protecting the public from antisocial elements; organizations that help individuals to find and sustain gainful employment; organizations that focus on the development and improvement of food resources; organizations that focus on promoting adequate housing for individuals, families and communities; organizations which aim to prevent, predict or control the effects of domestic disasters (e.g., floods, earthquakes, fires, tornadoes); organizations that work to build character and develop leadership and social skills among children and youth. International Relief Organizations Organizations that provide development and relief services to foreign countries and/or organizations that raise and distribute funds for the benefit of overseas institutions. Religious Organizations Programs operated for the purpose of worship, religious training or study, governance or administration of organized religions, or the promotion of religious activities. Societal Benefit Organizations Programs that focus on protecting and promoting the broad civil rights and civil liberties of individuals, improving relations between racial, ethnic, and cultural groups, and promoting voter education and registration; advocacy and citizen action groups that work to change public policy and opinion in a variety of areas; organizations that work to strengthen, unify, and build community spirit and increase the capacity of various community organizations to improve the quality of life for all. Sector definitions are based on a modification of the Foundation Center’s National Taxonomy of Exempt Entities. http://fdncenter.org/ntee/index.html
Q4 2013 donorCentrics™ Index of Direct Marketing Fundraising
© April 2014 | 2 Canal Park, Cambridge, MA 02141 | www.blackbaud.com/targetanalytics 25
Looking Ahead
The next installment of the index, to be released in July 2014, will examine activity for the first quarter of 2014. Findings can be found at http://www.blackbaud.com/targetanalytics.
Index Methodology
Target Analytics applied the following rules to standardize data from each of the organizations participating in the Index of Direct Marketing Fundraising:
Individual payments greater than $10,000, soft credits, and matching gift payments are excluded. Direct mail is the dominant or only revenue source for most organizations; however, web, telemarketing, event, and other sources are included. Indicators are calculated on a cash payment basis, as opposed to a pledge basis. Gifts or donors are defined as new, retained, or reactivated according to relative gift dates rather than organization-specific business rules or source codes. Retention rates for quarterly analysis are calculated by dividing the number of donors giving in the current year-to-date quarter(s) who also gave during the previous calendar year by the total number of donors who gave in the previous calendar year. Revenue per donor refers to the cumulative giving per donor per current period.
About Medians
Unless otherwise noted, index trends are measured by using the median percent change among a group of organizations. The median is the middle value in a ranked order of numbers. Using this statistic to describe historical trending minimizes distortion caused by the wide range of organizations’ file sizes or extreme changes at a few organizations.
Participation
Participation in the index is limited to organizations that meet size and geographic requirements as well as other terms and conditions. For information about index eligibility contact Amanda Williams at [email protected]. Please direct questions or requests to reproduce these findings to [email protected].
Online Resources
Participating organizations are granted access to an online, interactive graphical system where they can chart their own performance results against overall and sector-specific medians. Please contact your account representative for your password and for more information.
About Target Analytics
Target Analytics, a division of Blackbaud, delivers data-driven, collaborative solutions designed to help non-profit organizations maximize their fundraising potential. Target Analytics was the first company to bring forward-thinking non-profit organizations together to establish industry-standard benchmarking and openly discuss successful strategies and practices.