donders’s assumption of pure insertion: an evaluation on...
TRANSCRIPT

Donders's assumption of pure insertion: an evaluation onthe basis of response dynamics
Rolf Ulrich a,*, Stefan Mattes a, Je� Miller b
a University of T�ubingen, Phychological Institute, Friedrichstr. 21, 72072 T�ubingen, Germanyb University of Otago, Dunedin, New Zealand
Received 13 August 1998; received in revised form 26 November 1998; accepted 5 February 1999
Abstract
In order to assess DondersÕs assumption of pure insertion for the response execution stage,
we measured the magnitude and time course of response force in the three classical reaction
time (RT) tasks: simple RT, go/nogo and choice RT. Response force was virtually identical for
the simple and choice RT tasks (Experiments 1 and 2). However, the go/nogo task yielded
more forceful responses than both the simple RT (Experiment 3) and choice RT (Experiments
4 and 5) tasks. These results support DondersÕs original assumption that the response exe-
cution process operates identically in the simple and choice RT tasks. More response acti-
vation seems to be generated in the go/nogo task, however, consistent with a motor readiness
model. Ó 1999 Elsevier Science B.V. All rights reserved.
Keywords: Reaction time; Response force; Subtraction method; Stage models; Pure insertion
1. Introduction
In¯uenced by Helmholtz's (1850) technique for assessing nerve conduction velocity,Donders (1868) introduced the so-called subtraction method to infer the speed ofhigher mental processes from reaction time (RT). Donders devised three basic tasks tomeasure the durations of cognitive processes: the A-task (or simple RT), the B-task (orchoice RT) and the C-task (or go/nogo task). He argued that the go/nogo task isidentical to the simple RT task except that it requires the additional process of stimulus
Acta Psychologica 102 (1999) 43±75
* Corresponding author. Fax: +49-7071-292410; e-mail: [email protected]
0001-6918/99/$ ± see front matter Ó 1999 Elsevier Science B.V. All rights reserved.
PII: S 0 0 0 1 - 6 9 1 8 ( 9 9 ) 0 0 0 1 9 - 0
discrimination. Similarly, the go/nogo and the choice RT tasks are identical, exceptthat the latter includes the additional process of response selection. Thus, subtractingmean RT of the simple RT task from the go/nogo task yields an estimate of the du-ration of stimulus discrimination, whereas subtracting RT for the go/nogo task fromthat of the choice task yields an estimate of the duration of response selection.
DondersÕs method is based on three assumptions. First, it is assumed that in thesetasks the mental processes of stimulus detection, stimulus identi®cation, responseselection and response execution are arranged sequentially in the sense that theoutput of one serves as the input to the next. Second, it is assumed that only oneprocess can be active at each moment in time between stimulus input and responseoutput. Thus, each process or processing stage is assumed to be functionally distinct(Sternberg, 1998a) and to consume a certain duration, denoted as the stage duration.According to this serial processing model, RT is equal to the sum of all the stagedurations (the serial processing assumption). 1 Third, it is assumed that a mentalprocess can be added or omitted without a�ecting the duration of the other processes,the so-called assumption of pure insertion (cf. Sternberg, 1969). Especially the ®rst(cf. Eriksen & Schultz, 1979; McClelland, 1979) and the second assumption have beensupported and tentatively accepted by many researchers (cf. Meyer, Osman, Irwin &Yantis, 1988; Miller, 1988; Roberts & Sternberg, 1992), whereas the third assumptionhas been severely criticized (Boring, 1929; Massaro, 1989; Pachella, 1974).
Using these three assumptions, Donders estimated the durations of various pro-cesses by subtracting the RT for one task from the RT for another more complex task;that is, the more complex task was assumed to require an extra mental process com-pared to the less complex task. He reasoned that the di�erence in RT between the tasksprovides an estimate of the duration of this extra process. A drawback of this methodis that the estimation procedure involves three unknowns (the durations of stimulusidenti®cation, response selection and the residual processes like stimulus detection andmotor processing) and three independent functions relating mean RT to mean stagedurations for each task. Thus, from a mathematical point of view this system ofequations is completely determined and therefore untestable. Consequently, Donders'estimation procedure provides no internal checks on the validity of its assumptions. 2
1 One should note that the serial processing assumption does not necessarily imply the assumption of
pure bottom-up processing. Within this serial stage model there is always the possibility that earlier stages
can be preset or prepared by later ones (cf. Sanders, 1997, ch. 4). Thus, stage models may accommodate
top-down processes as well as bottom-up processes.2 This system would be testable if enough conditions could be used. To see this, suppose that there are
three stages with mean processing times a, b and c. If it would be possible to ®nd four suitable tasks, one
with all three stages, and three each omitting a di�erent stage, the model would predict the following four
mean RTsRT1 � a � b � c;RT2 � a � b;RT3 � a � c;RT4 � b � c:Thus, there are four independent equations with three unknowns and so the model would be testable. In
practice, however, the required tasks are di�cult to ®nd. We are aware of only one study (Taylor, 1966)
which utilized this approach, and this work is reviewed below.
44 R. Ulrich et al. / Acta Psychologica 102 (1999) 43±75

K�ulpe (1893) noted that various laboratories reported inconsistent duration es-timates, which often di�ered substantially from each other. K�ulpe suggested that thisinconsistency was most likely caused by violations of the assumption of pure in-sertion. 3 Relying on introspective reports, K�ulpe argued that changing from asimpler to a more complex task may not only insert an extra processing stage butalso a�ect other stages, both qualitatively and quantitatively (see also Ach, 1905;Watt, 1905). Additional discussion of these historical concerns can be found in, forinstance, Luce (1986, pp. 212±215), Welford (1980) and Woodworth (1938).
Although early RT researchers criticized the subtraction method, we doubt thatthese criticisms are empirically strong enough to rule out any possibility of applyingthis method. The subtraction method would clearly be a very powerful tool in RTresearch if its assumptions could be veri®ed. Hence, it is easy to see why some morecontemporary RT researchers have developed rigorous distributional tests to checkthe validity of the assumption of pure insertion (e.g., Ashby, 1982; Ashby &Townsend, 1980; Roberts & Sternberg, 1992; see Schwarz, 1988 for further sug-gestions). For example, Ashby (1982) and Ashby and Townsend (1980) applied suchtests with success to memory scanning tasks, where the tasks compared are alikeexcept with respect to the number of items to be memorized. It seems quite plausiblethat pure insertion may hold in this task, because there is no obvious qualitativechange in a memory scanning task when the number of memory set items is increased(Sternberg, 1998a,b). However, such a qualitative di�erence is clearly much morelikely with the three tasks devised by Donders.
1.1. Tests of the assumption of pure insertion
Curiously, only a few di�erent tests of the validity of pure insertion involving theoriginal RT tasks have been reported in the literature to our knowledge. The ®rst testwas performed by Taylor (1966). He basically extended the original three tasks bydeveloping a modi®ed choice RT task in which participants did not need to identifythe stimulus but nevertheless were required to select a response to its nonappearanceat a more or less expected time. This additional task, termed the ``selection'' task(Gottsdanker & Tietz, 1992), was held to require response selection but not stimulusidenti®cation. Because there were four tasks but only three unknown stage durationsto estimate, one degree of freedom was left. This enabled a comparison between theobserved and predicted stage durations (i.e., of the sum of stimulus identi®cation andresponse selection). Taylor reported a nonsigni®cant di�erence between the observedand the predicted durations and concluded that the assumption of pure insertion wassupported.
Gottsdanker and Tietz (1992) extended Taylor's work and in doing so providedclear evidence against the validity of his proposed test of the subtraction method.
3 Given that few statistical tools were used in those times, one can easily imagine that sampling errors
inherent in sample means were falsely classi®ed as ``inconsistent'', especially when the subtraction method
yielded negative estimates of stage duration.
R. Ulrich et al. / Acta Psychologica 102 (1999) 43±75 45

First, they enlarged the number of trials per participant to increase the statisticalpower of the test. Second, they included choice RT tasks with both compatible andincompatible mappings, based on arguments that compatibility should in¯uence theoutcome of Taylor's test. Finally, they employed a countdown procedure to providemaximal temporal information about stimulus occurrence and thus to help theparticipant execute a true nonstimulus response in the selection task. The results ofthis extended study provided clear evidence that Taylor's test is not appropriate forevaluating the assumption of pure insertion. First, as the authors expected and aswas suggested by a previous study (Broadbent & Gregory, 1962), the results diddepend heavily on S±R compatibility. Given that the duration of response selectiondepends on the S±R mapping, it is di�cult to argue that the selection and choicetasks ± which use completely di�erent S±R mappings ± di�er only in the time re-quired for stimulus identi®cation. Second, RTs in the choice task with the com-patible mapping were generally faster than those in the selection task, contrary toTaylor's assumption that the selection task requires one fewer stage (i.e., no stimulusidenti®cation).
A second and highly sophisticated test was suggested by Gottsdanker andShragg (1985). They split the informative and the imperative functions of a choicestimulus. A visual precue speci®ed the correct response alternative and thus servedthe informative function. The precue was followed by an auditory stimulus atvarious precue-to-stimulus intervals. The auditory stimulus signalled that thespeci®ed response should be executed, and thus provided the imperative function.When this interval was less than the mean di�erence between choice and simpleRT, it did not in¯uence the precue-to-response latency in the choice task. Thisoutcome is predicted when stimulus identi®cation and response selection are ad-ditional operations that would be purely inserted in the choice task. Unfortunately,however, it seems quite possible that this prediction may also be made by alter-native continuous models (e.g., McClelland, 1979), which deny the assumption ofstrict serial processing. These models may mimic the behavior of serial stagemodels on mean RT when stages are ``inserted'' (e.g. McClelland, 1979). Thus theresults of Gottsdanker and Shragg may be quite consistent with continuous models,although in this case the second assumption of the subtraction method, namelyserial processing, would be violated and therefore its application to the analysis ofRT would be meaningless.
A third test of the assumption of pure insertion employed a pupillometric analysisto assess whether response selection is involved in the go/nogo task. Since the time ofDondersÕs (1868) original study, RT researchers have been rather uneasy about hisassumption that the go/nogo task does not involve response selection. On intro-spective grounds, Wundt (1880) reasoned that participants in this task need tochoose between performing and inhibiting a response. In more recent years, Richer,Silverman and Beatty (1983) utilized pupillary responses to provide some objectiveevidence relevant to this conjecture. There is evidence that the size of the pupillaryresponse during cognitive processing provides an index of the load imposed on thecentral nervous system by these processes (cf. Beatty, 1982). Richer et al. measuredthe timecourse of the evoked pupillary response in both go and nogo trials of the go/
46 R. Ulrich et al. / Acta Psychologica 102 (1999) 43±75

nogo task. Even in nogo trials, a phasic change of the pupillary response was ob-tained, and its size depended on the response demands in the go trials. Generally,pupillary responses in nogo trials were smaller when responses in go trials had to bedelayed than when they were elicited immediately after the imperative stimulus hadoccurred. From this and further results, the authors estimated that approximately50% of the pupillary response is related to response selection and the remaining 50%to motor preparation and execution in go/nogo tasks. This analysis led Richer et al.to conclude that response selection is involved in the go/nogo task, contrary toDondersÕs assumption.
Two recent studies (Ja�skowski & Wlodarczyk, 1997; Miller, Franz & Ulrich,1999) measuring response force may be considered as a fourth test of the as-sumption of pure insertion, although they were not designed for this purpose. Forexample, Miller et al. measured the e�ects of stimulus intensity on response force toinfer potential post-perceptual e�ects of stimulus intensity. Although they weremainly concerned with intensity e�ects, they also compared response force acrosssimple RT, go/nogo, and two-choice tasks in their ®rst experiment. In this exper-iment, the type of task did not a�ect the forcefulness of a response, consistent withDondersÕs claim that response execution operates identically in all tasks. However,this null e�ect could be due to a lack of su�cient statistical power, since the ex-periment was not speci®cally designed to compare the level of response force be-tween RT tasks. In the second and third experiments an auditory accessorystimulus accompanied the imperative stimulus in a go/nogo and choice task. Onlythe third experiment yielded a di�erence between tasks, with more forceful re-sponses in the go/nogo task than in the choice task, contrary to the assumption thatresponse execution operates identically in these tasks. However, it is questionablewhether this e�ect generalizes to conventional RT tasks without an accessory, es-pecially those studied by Donders. Thus, the outcomes of this study were somewhatmixed; taken at face value, they suggest that response execution may operateidentically in all tasks with a single relevant stimulus but not when an irrelevantaccessory stimulus accompanies the imperative stimulus. Similarly, Ja�skowski andWlodarczyk (1997) assessed the e�ects of sleep deprivation, stimulus quality,knowledge of results, stimulus quality, and task on response force and RT. Theirmain ®nding was that participants produced signi®cantly larger force amplitudeswhen knowledge of results about RT was provided. Most important for the pur-poses of this paper, however, task (simple RT vs. choice RT) did not signi®cantlya�ect response force. However, as in the previous study, this null result may simplyre¯ect a lack of statistical power. Moreover, because the go/nogo task was notincluded, these results are incomplete with respect to the examination of DondersÕsassumptions.
The studies just discussed tested DondersÕs insertion hypothesis for the classicalsimple RT, go/nogo and choice RT tasks. Ilan and Miller (1994) went a step furtherand tested the validity of pure insertion in a more complex task. Basically, they testedthe assumption that the operation of mental rotation is purely inserted into a normalversus mirror-image discrimination task commonly used in studies of mental rota-tion (e.g., Cooper & Shepard, 1973). Their results suggest that in this task response
R. Ulrich et al. / Acta Psychologica 102 (1999) 43±75 47
selection is altered when mental rotation is added, violating the assumption of pureinsertion.
1.2. The objective of the present experiments
This paper reports new experiments designed speci®cally to test DondersÕs hy-pothesis that insertion of a mental process does not a�ect other processes in thesimple RT, go/nogo and choice RT tasks. Like Richer et al. (1983), we feel thatpsychophysiological measures provide the most powerful means of assessing thisassumption, especially given that the underlying model has too many free param-eters to test using RT alone. In particular, response force seems an especially ap-propriate measure for assessing changes in operation of the motor system.Response force directly indexes motor activity and thus may supplement the pre-vious inferences based on pupillary responses. It seems plausible that response forceprovides a more speci®c index to probe the state of the motor system than pupillaryresponses, which seem to probe the global processing demands on the CNS (Beatty,1982). This is because response force directly assesses the force output of the re-sponding limb, whereas pupillary responses are not directly linked with the motorprocessing of the stimulus-associated response. 4 Thus, response force may specif-ically probe the motor system and thus assess potential di�erences (if any) betweenthe various RT tasks devised by Donders. In sum, if the type of task a�ects re-sponse execution, then response force should vary as a function of task, providingevidence at odds with DondersÕs assumption of an invariant response executionstage.
The present experiments extend the research of Miller et al. (1999) using designsfocusing on the e�ects of task ± as needed to test DondersÕs hypothesis ± rather thanon the e�ects of intensity. Speci®cally, participants performed simple RT, go/nogoand two-choice RT tasks. In each trial, we measured the complete force±time pro®leof the response. If this pro®le varies across tasks, then it will be safe to conclude thatresponse execution is not identical in all tasks.
The logic of our comparison assumes that di�erences in force demonstrate dif-ferences in motoric processing. This assumption seems indisputable because force isclearly one manifestation of motor activity. If force di�ers across tasks, there mustnecessarily have been some change in the operation of the motor system, whether it isa change in the number of recruited motor units, their synchronization, the durationof their outputs, or some other aspect of motor activity (Ulrich & Wing, 1991).Admittedly, the cause of this change in motor activity cannot be immediatelyidenti®ed by examining force. Force di�erences might arise either because the motor
4 There is, however, evidence that the amplitude of the pupillary responses is sensitive to response force.
Richer and Beatty (1985) asked participants to press a lightly or heavily loaded key and found a larger
pupillary response when participants had to depress hard load conditions. This clearly indicates that
motoric processing demands contribute to the size of the pupillary response. However, it should be noted
that the response forces required in this study were very di�erent (100 vs. 1250 cN). Clearly, much smaller
di�erences (if any) in response force are expected between the RT tasks devised by Donders.
48 R. Ulrich et al. / Acta Psychologica 102 (1999) 43±75

system itself functions somewhat di�erently in di�erent tasks or because the motorsystem receives di�erent inputs (e.g., from the decision level) in di�erent tasks.Whatever the mechanism, though, an observed change in force output would indi-cate some change in the motor system, and would thus weaken DondersÕs assump-tion of a task-invariant motor stage. Conversely, if response force is equal for alltasks, DondersÕs assumption would clearly be strengthened.
It must be acknowledged that a di�erence in force±time pro®les will not prove thatthe processing time of the response execution stage varies across tasks, which wouldfalsify DondersÕs assumption directly. The presumption that force changes alsoimply duration changes appears to be quite plausible, however, not only theoretically(Ulrich & Wing, 1991) but also empirically. First, when response force is manipu-lated by instructions, decreases in response force are associated with increases in RT(Carlton, Carlton & Newell, 1987). Second, many factors that a�ect RT have alsobeen found to a�ect response force. For example, previous studies of response forcehave indicated that force increases with stimulus intensity (Angel, 1973; Ja�skowski,Rybarczyk, Jaroszyk & Lemanski, 1995; Miller et al., 1999), with stimulus duration(Ulrich, Rinkenauer & Miller, 1998), with response uncertainty (Mattes, Ulrich &Miller, 1997), with temporal uncertainty of the stimulus (Ja�skowski & Verleger,1993; Mattes & Ulrich, 1997), with the level of arousal (Ja�skowski, Wroblewski &Jaroszyk, 1993; Ulrich & Mattes, 1996), with the number of stimuli (Giray & Ulrich,1993; Mordko�, Miller & Roch, 1996), under time pressure (Ja�skowski, Verleger &Wascher, 1994), with word frequency in a lexical decision task (Abrams & Balota,1991; Balota & Abrams, 1995), and with decreasing set size in memory scanning(Abrams & Balota, 1991). Thus, response force is sensitive to a large number ofexperimental manipulations that in¯uence RT.
This study provides four experiments to check for di�erences across tasks in re-sponse force. Each experiment compares the dynamics of the responses for two RTtasks. Experiments 1 and 2 compare simple with choice tasks: Experiment 3, choicewith go/nogo; and Experiment 4, simple RT with go/nogo. Experiment 5 comparedthe choice with the go/nogo task with a symbolic S±R mapping to test a speci®chypothesis that emerged from the results of Experiments 3 and 4. We included onlytwo tasks within each experiment to maximize the statistical power for its compar-ison and to minimize potential transfer e�ects between the tasks.
2. Experiment 1
The ®rst experiment employed visual imperative stimuli for both simple andchoice reaction times. A stimulus (the onset of an LED) appeared either on the left orthe right side of a central ®xation point. In the choice task, participants made acorresponding left-hand response to the stimulus on the left and a right-hand re-sponse to the stimulus on the right. In the simple RT task, participants made a re-sponse to either stimulus with the same hand. If the two RT tasks do not di�er in theexecution of distal motor processes, response force±time pro®les should not di�erbetween tasks.
R. Ulrich et al. / Acta Psychologica 102 (1999) 43±75 49
2.1. Method
Participants. Thirty-six participants (16 females and 20 males; mean age: 26.3 yr)were volunteers recruited from the campus of the University of Wuppertal. Theywere tested in a single session and received 10 DM. All participants were naive aboutthe experimental hypothesis and all but 2 claimed to be right-handed.
Apparatus. Participants were seated in a dimly illuminated room. A microcom-puter controlled stimulus presentation and recorded response force. A tone (440 Hz,69 dB-SPL) served as the warning signal and was presented binaurally via head-phones for 300 ms. A panel was attached at the top of the computer screen. A white®xation cross was drawn in the middle of this panel. This ®xation cross was ap-proximately at the participant's eye level. Two LEDs were mounted 8 cm (7.6°) tothe left and right of the ®xation cross. Both LEDs were green and had a diameter of5 mm (0.48°). In each trial one LED was switched on for 150 ms, producing anintensity of 77.3 cd/m2, which served as the imperative stimulus. A chinrest provideda constant viewing distance of 60 cm.
Response force was measured by means of a force key of the same sort usedpreviously (e.g., Giray & Ulrich, 1993). One end of a leaf spring (110 ´ 19 mm) washeld ®xed by an adjustable clamp, and the other end remained free. The participant'sforearm rested comfortably on a table while his or her index ®nger bent down the freeend of the leaf spring in response to the stimulus. A force of 10 N bent the free end byabout 1 mm. The resolution of this device was about 2 cN (approximately 2 g). Straingauges were attached to the leaf spring, so force applied to its free end caused changesin an electrical signal that was digitized with a sampling rate of 500 Hz.
Procedure. Two tasks (simple RT and choice RT) were employed in a single sessionlasting approximately 55 min. In the simple RT task, participants responded to anyimperative stimulus with the same index ®nger, and in the choice task they respondedwith the index ®nger that corresponded to the side of the imperative stimulus.
Each task was run in a separate block of trials. There were four blocks per taskand task alternated from block to block. Each block contained 35 trials with im-perative stimuli on the left side and 35 trials with stimuli on the right side. Both typesof trials were randomly intermixed within each block. The ®rst ten trials of eachblock were considered practice, to familiarize participants with the new task andtherefore discarded from data analysis. Feedback on performance (mean RT andpercent correct) were provided after each block. Half of the participants respondedwith their right hand in the ®rst block of the simple RT task and with the left hand inthe second block, whereas the reverse order was used for the other half of partici-pants. The order of the four blocks was counterbalanced across participants.
A single trial started with the presentation of the warning signal. The temporalinterval between the onset of the warning signal and the onset of the imperativestimulus (i.e., the foreperiod) was never less than 1.0 s. A random duration drawnfrom the exponential distribution with a mean of 0.5 s was added to this 1.0 s intervalto prevent anticipatory responses (cf. Luce, 1986, p. 213). The next trial started 2 safter the o�set of the imperative stimulus. The recording of response force started50 ms before stimulus onset.
50 R. Ulrich et al. / Acta Psychologica 102 (1999) 43±75
Task instructions for each block were presented on the computer screen at thebeginning of each block, and participants initiated the block by pressing the spacebar when they felt ready to proceed. Participants were instructed to respond asquickly as possible without making too many errors, and they were instructed not topress the response key during the intertrial interval.
Method of Analysis. RT was de®ned as the ®rst moment at which force exceeded acriterion of 50 cN (about 50 g) after imperative stimulus onset. This value was se-lected because it is approximately the force needed to trigger a response with manycommon setups for measuring RT.
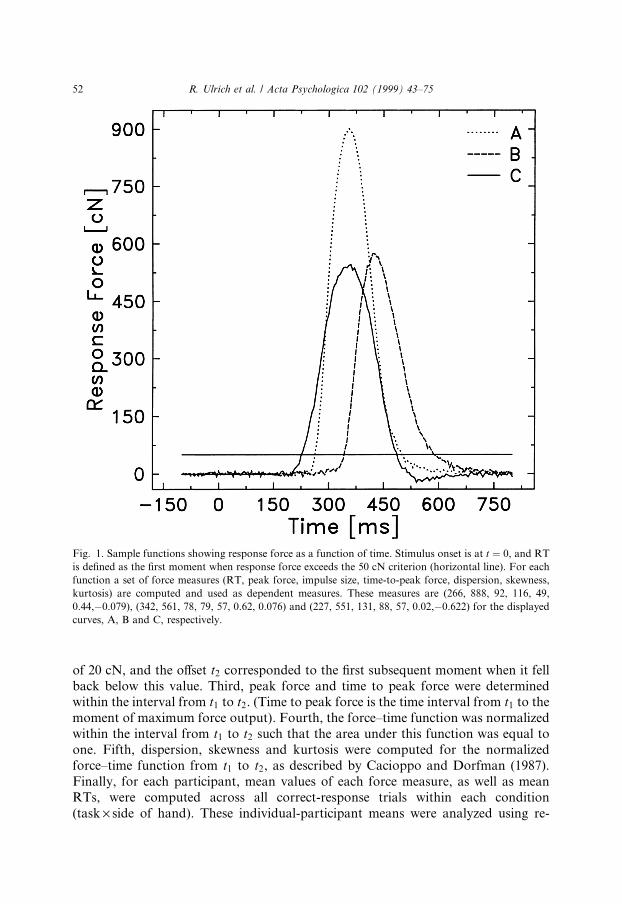
Two sets of dependent measures were derived from each recorded force±timefunction to assess potential e�ects on response force. Fig. 1 provides example valuesof these measures for three sample force±time functions. The ®rst set assessed thedynamics of a response and included three force measures: (a) The maximal forcevalue attained in a single trial, i.e. peak force. (b) The total force integrated over timein a single trial, i.e. the impulse size. (c) Time to peak force measured the speed of theforce output, that is, the temporal interval from force onset until the maximum of theforce output was achieved.
The second set of measures assessed the shapes of the force±time functions todetermine whether the task a�ects the shape of the force±time pro®les. Changes inthese pro®les may be expected when there is a qualitative change in the mode of forcecontrol (see Ulrich & Wing, 1991; Ulrich, Wing & Rinkenauer, 1995). Shapes weremeasured using central moments of the force±time pro®les (see Cacioppo & Dorf-man, 1987). In brief, if the force±time function is normalized to have an area of one,it can be thought of as analogous to a probability distribution, and its shape can bedescribed by standard measures of dispersion, skewness, and kurtosis (see Ulrichet al., 1995). Dispersion assesses the duration of force output, skewness characterizesthe degree of asymmetry of the force pulse, while kurtosis measures its peakedness.Each of these three descriptors was scored on the force±time function for each trial 5.These measures were also used by Ulrich et al. (1995) to assess the shape of briefforce pulses and by Ulrich et al. (1998) to assess the e�ect of stimulus intensity andstimulus duration on the timecourse of response force in a simple RT task.
For each trial, the force±time function was scored using the following steps. First,the baseline of the force±time function was identi®ed as the average force value in theinterval from ÿ200 to ÿ190 ms before response onset, i.e. before response forceattained the criterion force of 50 cN. This baseline value was subtracted from everyforce value in the whole force±time function to correct this function for baselineshifts, which were in fact negligible in almost all cases. Second, the onset and theo�set of the force pulse were determined for this baseline-corrected force±timefunction. The onset t1 corresponded to the moment when force ®rst attained a value
5 A positive (negative) value of skewness indicates that the force pulse is skewed to the right (left). A
positive (negative) value of kurtosis usually indicates a peaked (¯at) force pulse relative to a normal
distribution, which has a kurtosis of zero. Both skewness and kurtosis are independent of the scale of
measurement and therefore have no measurement unit.
R. Ulrich et al. / Acta Psychologica 102 (1999) 43±75 51
of 20 cN, and the o�set t2 corresponded to the ®rst subsequent moment when it fellback below this value. Third, peak force and time to peak force were determinedwithin the interval from t1 to t2. (Time to peak force is the time interval from t1 to themoment of maximum force output). Fourth, the force±time function was normalizedwithin the interval from t1 to t2 such that the area under this function was equal toone. Fifth, dispersion, skewness and kurtosis were computed for the normalizedforce±time function from t1 to t2, as described by Cacioppo and Dorfman (1987).Finally, for each participant, mean values of each force measure, as well as meanRTs, were computed across all correct-response trials within each condition(task ´ side of hand). These individual-participant means were analyzed using re-
Fig. 1. Sample functions showing response force as a function of time. Stimulus onset is at t � 0, and RT
is de®ned as the ®rst moment when response force exceeds the 50 cN criterion (horizontal line). For each
function a set of force measures (RT, peak force, impulse size, time-to-peak force, dispersion, skewness,
kurtosis) are computed and used as dependent measures. These measures are (266, 888, 92, 116, 49,
0.44,ÿ0.079), (342, 561, 78, 79, 57, 0.62, 0.076) and (227, 551, 131, 88, 57, 0.02,ÿ0.622) for the displayed
curves, A, B and C, respectively.
52 R. Ulrich et al. / Acta Psychologica 102 (1999) 43±75
peated-measures ANOVAs with factors of task and hand, separately for each de-pendent measure.
2.2. Results and discussion
There were a total of 0.9% premature responses (RTs < 100 ms) and 0.3% misses(RTs > 1000 ms); in the choice task, there were 0.7% wrong hand responses. Thesetrials were discarded from further data analysis.
Table 1 shows the mean value for each dependent measure in each task, followedby a 95%-con®dence interval for the di�erence between the simple and the choicetasks for that dependent measure. This interval was computed using the error termfrom a paired t-test, which was applied to the di�erence scores of the participants.For each measure, the table also shows the F-value of the corresponding ANOVAand the statistics for a Wilcoxon matched-pairs signed-ranks test. The latter non-parametric test uses only the ranks of the di�erences between the simple and thechoice task for each participant. It is thus less sensitive than the ANOVA to a smallnumber of participants producing large di�erences, and it therefore provides a checkwhether signi®cant F-values are due to such outliers. Nevertheless the statisticalpower of this nonparametric test is comparable to corresponding parametric tests(Wonnacott & Wonnacott, 1977).
As expected, mean RT was shorter in the simple than in the choice task. Con-sistent with previous research (Kerr, Mingay & Elithorn, 1963; Woodworth &Schlosberg, 1954, p. 40; Ulrich & Stapf, 1984) the RT di�erence of 3 ms between theleft and right hand was small and did not di�er signi®cantly, F �1; 35� � 1:5; p > 0:1.There was no signi®cant interaction of task and hand on RT, F < 1. Within thesimple RT task, responses were 4 ms faster when the stimulus appeared on the sameside as the responding hand than when it appeared on the opposite side,F �1; 35� � 13:3; p < 0:01. This 4 ms disadvantage for contralateral responses agreesfully with previous studies (e.g., Po�enberger, 1912) and has been attributed to theadditional time required to transfer neuronal information from the stimulated ce-rebral hemisphere to the opposite one, which generates the response (cf. Bashore,1981). 6
Most important and in agreement with DondersÕs assumption of pure insertion,the dynamics of the response and shape of the response pro®le were virtuallyidentical for both the simple and the choice task, because neither peak force, inte-grated force nor time to peak force was in¯uenced by RT task. The values of peakforce and integrated force were in close agreement with those reported in previousstudies (Giray & Ulrich, 1993; Ulrich et al., 1998). The grand mean of time to peakforce was 98 ms and thus only slightly longer than the minimal attainable value ofabout 90 ms (Freund & B�udingen, 1978; Ulrich et al., 1995); a similar grand meanwas obtained in other RT studies (Ulrich & Mattes, 1996; Ulrich et al., 1998). Thus,the force output of the response developed very rapidly. As found in previous studies
6 Ironically, this conclusion also requires the assumption of pure insertion.
R. Ulrich et al. / Acta Psychologica 102 (1999) 43±75 53

Tab
le1
Mea
nv
alu
eo
fea
chd
epen
den
tm
easu
rea
sa
fun
ctio
no
fta
sk,
inE
xp
erim
ent
1,
an
dre
sult
so
fth
eA
NO
VA
an
dth
eW
ilco
xo
nte
stfo
re�
ect
of
task
a
Dep
end
ent
va
riab
leT
ask
AN
OV
AW
ilco
xo
nte
st
Sim
ple
Ch
oic
eD�
HW
F-v
alu
ep
Z-v
alu
ep
RT
(ms)
26
12
98
38
�7
105.7
p<
0:0
01
5.2
p<
0:0
01
Pea
kfo
rce
(cN
)6
83
65
3ÿ3
0�
54
1.3
n.s
.0.7
n.s
.
Inte
gra
ted
forc
e(c
Ns)
11
11
10
ÿ1�
10
0.0
1n
.s.
0.5
n.s
.
Tim
eto
pea
kfo
rce
(ms)
97
99
2�
31.4
n.s
.1.1
n.s
.
Sk
ewn
ess
0.2
40
.23
ÿ0.0
1�
0.0
25.6
p<
0:0
51.0
n.s
.
Ku
rto
sis
ÿ0.4
0ÿ0
.44
ÿ0.0
4�
0.0
42.7
n.s
.1.8
n.s
.
Dis
per
sio
n(m
s)5
65
71
�1
2.6
n.s
.1.6
n.s
.
aN
ote
s:T
he
deg
rees
of
free
do
mfo
rea
chF
-va
lue
are
1a
nd
35.
Atw
o-t
ail
edp-v
alu
ew
as
use
dfo
rth
eW
ilco
xo
nm
atc
hed
-pair
ssi
gn
ed-r
an
ks
test
.T
he
fou
rth
colu
mn
giv
esth
em
ean
di�
eren
ceD
an
dth
eh
alf
-wid
th,
HW
,o
fth
eco
rres
po
nd
ing
con
®d
ence
inte
rval.
54 R. Ulrich et al. / Acta Psychologica 102 (1999) 43±75
(Ulrich et al., 1995, 1998), the shape analysis of the force±time functions revealedpositive values of skewness and negative values of kurtosis. There was a small yetreliable e�ect of RT task on skewness; force pulses were slightly more skewed to theright in the simple than in the choice task. However, the Wilcoxon matched-pairssigned-ranks test did not produce a signi®cant di�erence. Hence, the signi®cant F-value may re¯ect a Type II error, which may arise from the multiple comparisonswithin such an extended set of dependent measures tested with both parametric andnonparametric tests.
Furthermore, kurtosis did not systematically vary with task, suggesting that thepeakedness of the force pulse was unin¯uenced by task. Finally, the duration of theforce output was virtually identical in both tasks as indicated by the measure ofdispersion. Thus, the analysis of the shape descriptors indicates no substantial e�ectof task on either the shape or duration of the force pulse. In addition, within thesimple RT task, force was una�ected by whether the stimulus appeared on the sameor opposite side from the responding hand.
Interestingly enough, the hand factor also produced no signi®cant main e�ects onthese variables, suggesting that left- and right-hand responses did not di�er in forceoutput. However, there was a signi®cant hand by task interaction on time to peakforce, F �1; 35� � 29:7; p < 0:01; for the left hand, mean time to peak force wasvirtually identical for both the choice and the simple RT task (100 vs. 99 ms). Forright-hand responses, however, mean time to peak force was slightly faster in thesimple than in the choice task (95 vs. 100 ms). This small di�erential hand e�ectmight re¯ect a better synchronization of force units (Ulrich & Wing, 1991) for theright than for the left hand due to more practice. However, this hand di�erenceseems to vanish when the activation of force units has to be delayed because of theintervening response selection stage.
In conclusion, then, the present results are quite compatible with the hypothesis ofpure insertion, because the force output of the response seems to be rather unin-¯uenced by whether participants perform a simple or a choice task. The next ex-periment was performed with auditory stimuli to test the generality of thisconclusion.
3. Experiment 2
Experiment 2 was identical to the ®rst experiment, except that loud auditoryimperative stimuli were employed. It has been well documented that loud auditorystimuli increase choice RT yet reduce simple RT (van der Molen & Keuss, 1979; vander Molen & Orlebeke, 1980). One explanation of this asymmetrical e�ect is thatloud auditory stimuli increase immediate arousal, which interferes with responseselection in choice RT tasks (van der Molen & Keuss, 1981). It seems quite possiblethat this interference might extend to the motor system and a�ect the execution of aresponse and thus its force output. Hence, the present experiment was a critical testto see whether the results found in Experiment 1 would generalize to intense auditoryimperative stimuli.
R. Ulrich et al. / Acta Psychologica 102 (1999) 43±75 55

3.1. Method
Participants. A fresh sample of 36 participants (16 females and 20 males; meanage: 27.7 yr) was recruited from the same population as in Experiment 1. All par-ticipants were naive about the experimental hypothesis and all but two claimed to beright-handed.
Apparatus. The apparatus was identical to the one of Experiment 1, except thatthe left (right) visual imperative stimulus was replaced by a tone (1000 Hz, 80 dB-A,150 ms) presented monaurally to the left (right) ear via a headphone.
Procedure. The procedure and the method of data analysis was identical to Ex-periment 1.
3.2. Results and discussion
There were a total of 0.8% premature responses (RTs < 100 ms) and 0.2% misses(RTs > 1000 ms); in the choice task, there were 0.7% wrong hand responses. These®gures are almost identical to those obtained in Experiment 1. As in the previousexperiment, these trials were discarded from further data analysis.
The main e�ect of task on the dependent measures is shown in Table 2. Notethat these results clearly replicate the results obtained in Experiment 1 and thusreinforce the conclusion that RT task does not a�ect the force output of the re-sponse. As in Experiment 1, there was no signi®cant e�ect of response hand on anydependent measure. In addition, this time the hand by task interaction was notsigni®cant.
We also performed a Modality (Experiment 1 vs. 2) by Task (Simple vs. Choice) byResponse Hand (left vs. right) ANOVA to further increase the statistical power fordetecting a task e�ect and also to assess the e�ect of stimulus modality. 7 This analysisof course yielded a highly signi®cant main e�ect of task on RT, F �1; 70� � 224:3;p < 0:001, but it yielded virtually no e�ect of task on force measures. Overall, for thesimple and choice RT tasks, mean peak forces were 696 and 669 cN, integrated force118 and 117 cN s, time to peak force 101.7 and 101.6 ms, skewness 0.26 and 0.24,kurtosis ÿ0.39 and ÿ0.41, and dispersion 59.4 and 59.6 ms, respectively. The maine�ect of task was signi®cant only in the ANOVA test of skewness, F �1; 70� � 4:2;p � 0:04, though it was insigni®cant with the Wilcoxon test, z � 1:14; p � 0:254. Asdiscussed in the previous experiment, this e�ect appears too small to justify an in-terpretation, and a Type II error for the F-test seems likely because many tests wereconducted and because this e�ect was not con®rmed by the Wilcoxon test.
This combined analysis also yielded some e�ects of modality. There was a highlysigni®cant e�ect of modality on RT, F �1; 70� � 24:2; p < 0:001; as one might expect,
7 In this comparison, the e�ect of modality is not purely sensory, but may also be confounded to some
extent with di�erences in stimulus intensity, the required discrimination, the arousing properties of the
stimuli, and so on. Since the most important e�ects are the same across both modalities, however, it seems
unnecessary to attempt to disentangle these confounded factors.
56 R. Ulrich et al. / Acta Psychologica 102 (1999) 43±75

Tab
le2
Mea
nv
alu
eo
fea
chd
epen
den
tm
easu
rea
sa
fun
ctio
no
fta
sk,
inE
xp
erim
ent
2,
an
dre
sult
so
fth
eA
NO
VA
an
dth
eW
ilco
xo
nte
stfo
re�
ect
of
task
a
Dep
end
ent
va
riab
leT
ask
AN
OV
AW
ilco
xo
nte
st
Sim
ple
Ch
oic
eD�
HW
F-v
alu
ep
Z-v
alu
ep
RT
(ms)
20
62
58
52
�6
277.1
p<
0:0
01
5.2
p<
0:0
01
Pea
kfo
rce
(cN
)7
08
68
6ÿ2
2�
48
0.9
n.s
.0.4
n.s
.
Inte
gra
ted
forc
e(c
Ns)
12
51
24
ÿ1�
10
0.0
3n
.s.
0.4
n.s
.
Tim
eto
pea
kfo
rce
(ms)
10
61
04
ÿ2�
32.1
n.s
.1.8
n.s
.
Sk
ewn
ess
0.2
60
.26
ÿ0.0
1�
0.0
20.3
n.s
.0.9
n.s
.
Ku
rto
sis
ÿ0.3
8ÿ0
.40
ÿ0.0
2�
0.0
40.5
n.s
.0.7
n.s
.
Dis
per
sio
n(m
s)6
36
2ÿ1
�1
2.6
n.s
.0.9
n.s
.
aN
ote
s:T
he
deg
rees
of
free
do
mfo
rea
chF
-va
lue
are
1a
nd
35.
Atw
o-t
ail
edp-v
alu
ew
as
use
dfo
rth
eW
ilco
xo
nm
atc
hed
-pair
ssi
gn
ed-r
an
ks
test
.T
he
fou
rth
colu
mn
giv
esth
em
ean
di�
eren
ceD
an
dth
eh
alf
-wid
th,
HW
,o
fth
eco
rres
po
nd
ing
con
®d
ence
inte
rval.
R. Ulrich et al. / Acta Psychologica 102 (1999) 43±75 57
participants responded faster to auditory than to visual stimuli. In addition, the RTdi�erence between the choice and the simple RT task was signi®cantly larger forauditory than for visual stimuli, F �1; 70� � 8:9; p < 0:01. Modality did not have asigni®cant e�ect on peak force or on integrated force (p's > 0.14) nor were thereinteractions of modality with task (p's > 0.38).
There were also some statistically signi®cant though small interactive e�ects whichwe cannot interpret. First, for the left hand time to peak force was 2 ms shorter forthe simple compared to the choice task. However, the reverse 2 ms e�ect was ob-tained for the right hand, F �1; 70� � 6:9; p � 0:01. Second, for the visual modalitythe right hand reached peak force faster (by 2 ms) than the left hand. However, forthe auditory modality this e�ect reversed, F �1; 70� � 4:3; p � 0:043. Finally, thethree-way interaction of hand, modality and task on peak force just attained sta-tistical signi®cance F �1; 70� � 4:0; p � 0:050. This interaction seems to be due to asomewhat increased force output of the right hand in the simple RT task whenauditory stimuli were employed.
Intermediate conclusions. The outcomes of Experiment 1 and 2 strongly suggestthat the execution of a keypress response is almost completely invariant across RTtasks and thus support DondersÕs assumption of pure insertion. This inference isbased on the present ®ndings that force output of a speeded response does not (or atleast not strongly) depend on whether a participant performs a simple or a choice RTtask, although the task manipulation strongly in¯uenced RT. This conclusion wasalso supported by an ANOVA combining Experiments 1 and 2 to increase statisticalpower. Furthermore, the conclusion seems to hold whether auditory or visual stimuliare employed as imperative stimuli.
The next two experiments compare the go/nogo task with the simple and choice RTtasks to examine whether the present conclusion also generalizes to the go/nogo task.
4. Experiment 3
This experiment was identical to Experiment 1, except that the simple RT taskwas replaced by the go/nogo task. Therefore, this experiment investigates whetherresponse dynamics di�er between the choice and go/nogo tasks.
4.1. Method
Participants. A fresh sample of 36 participants (24 females and 12 males; meanage: 25.4 yr) was recruited from the same population as in the previous experiments.All participants were naive about the experimental hypothesis and all but ®veclaimed to be right-handed.
Apparatus. The apparatus was identical to the one of Experiment 1.Procedure. The procedure and the method of data analysis was identical to Ex-
periment 1 with the only exception that the simple RT task was now replaced by ago/nogo task. In each block of the go/nogo task, one hand was designated as theresponse hand. Participants were instructed to respond whenever the LED ipsilateral
58 R. Ulrich et al. / Acta Psychologica 102 (1999) 43±75

to the respond hand went on (go trial) but to withhold the response to the onset ofthe contralateral LED (nogo trial). Before each block they were also explicitly told to®x their gaze on a small white spot between both LEDs.
4.2. Results and discussion
There were a total of 0.4% premature responses (RTs < 100 ms) and 0.3% misses(RTs > 1000 ms). In the choice task, there were 0.1% wrong hand responses. These®gures are quite similar to the ones obtained in the previous experiments. In the go/nogo task there were only 1.2% false alarms in nogo trials. As before, these trialswere discarded from further data analysis.
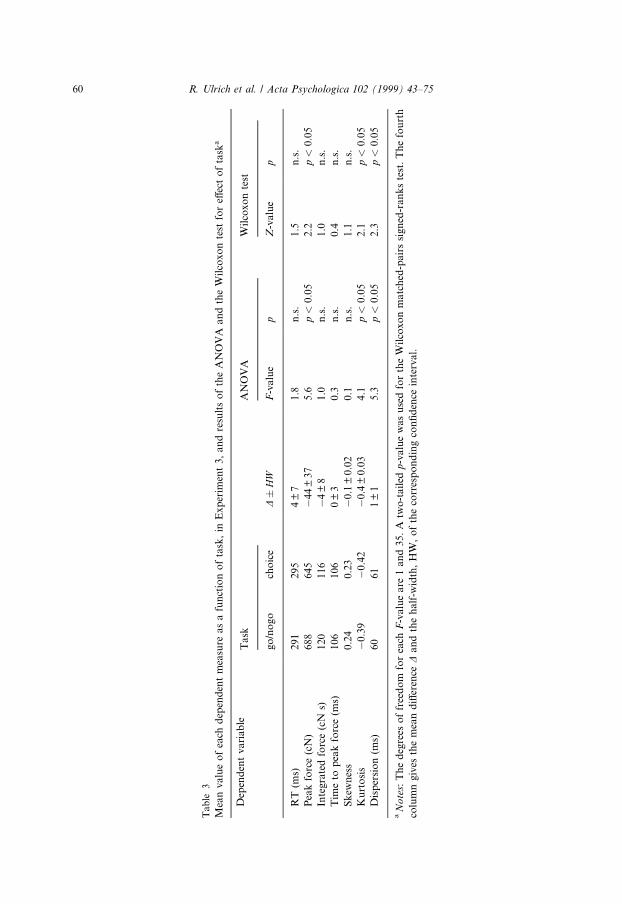
The main e�ect of task on the dependent measures is shown in Table 3. Althoughmean RTs were slightly faster in the go/nogo than in the choice task, this di�erencewas not signi®cant. The lack of a signi®cant RT di�erence may be expected with sucha highly compatible spatial S±R mapping as the one employed in this experiment,since such a mapping should strongly facilitate response selection and thereforewould greatly reduce the RT di�erence between the choice and go/nogo tasks (cf.Kornblum, Hasbroucq & Osman, 1990).
Although RT did not di�er signi®cantly between the two tasks, participantsproduced signi®cantly more forceful responses in the go/nogo task than in the choicetask. Task also produced tiny yet signi®cant e�ects on kurtosis and dispersion. Theforce±time functions in the choice task were slightly more stretched along the timeaxis and also slightly ¯atter than those in the go/nogo task. There was no main e�ectof the hand factor (p's > 0.18) nor did factor hand modulate the above signi®cantmain e�ects of task (p's > 0.24).
It is remarkable that the results of the choice task were almost identical to theones in Experiment 1 when the choice task was paired with the simple RT task. Thisparticular result indicates that the present results are not amenable to context e�ects,i.e. the results of the choice task appear to be unin¯uenced by its pairing with a go/nogo or a simple RT task.
To summarize, the present experiment indicates that the go/nogo task involvesmore powerful responses as compared to responses in a choice task. The next ex-periment therefore tests whether the same conclusion can be reached when the go/nogo task is compared with the simple RT task.
5. Experiment 4
This experiment was identical to Experiment 3, except that the choice RT task wasreplaced by the simple RT task.
5.1. Method
Participants. A fresh sample of 36 participants (19 females and 17 males; meanage: 26.6 yr) was recruited from the same population as in the previous experiments.
R. Ulrich et al. / Acta Psychologica 102 (1999) 43±75 59
Tab
le3
Mea
nv
alu
eo
fea
chd
epen
den
tm
easu
rea
sa
fun
ctio
no
fta
sk,
inE
xp
erim
ent
3,
an
dre
sult
so
fth
eA
NO
VA
an
dth
eW
ilco
xo
nte
stfo
re�
ect
of
task
a
Dep
end
ent
va
riab
leT
ask
AN
OV
AW
ilco
xo
nte
st
go
/no
go
cho
ice
D�
HW
F-v
alu
ep
Z-v
alu
ep
RT
(ms)
29
12
95
4�
71.8
n.s
.1.5
n.s
.
Pea
kfo
rce
(cN
)6
88
64
5ÿ4
4�
37
5.6
p<
0:0
52.2
p<
0:0
5
Inte
gra
ted
forc
e(c
Ns)
12
01
16
ÿ4�
81.0
n.s
.1.0
n.s
.
Tim
eto
pea
kfo
rce
(ms)
10
61
06
0�
30.3
n.s
.0.4
n.s
.
Sk
ewn
ess
0.2
40
.23
ÿ0.1
�0.0
20.1
n.s
.1.1
n.s
.
Ku
rto
sis
ÿ0.3
9ÿ0
.42
ÿ0.4
�0.0
34.1
p<
0:0
52.1
p<
0:0
5
Dis
per
sio
n(m
s)6
06
11
�1
5.3
p<
0:0
52.3
p<
0:0
5
aN
ote
s:T
he
deg
rees
of
free
do
mfo
rea
chF
-va
lue
are
1a
nd
35.
Atw
o-t
ail
edp-v
alu
ew
as
use
dfo
rth
eW
ilco
xo
nm
atc
hed
-pair
ssi
gn
ed-r
an
ks
test
.T
he
fou
rth
colu
mn
giv
esth
em
ean
di�
eren
ceD
an
dth
eh
alf
-wid
th,
HW
,o
fth
eco
rres
po
nd
ing
con
®d
ence
inte
rval.
60 R. Ulrich et al. / Acta Psychologica 102 (1999) 43±75
All participants were naive about the experimental hypothesis and all except twoclaimed to be right-handed.
Apparatus. The apparatus was identical to the one of Experiment 1.Procedure. The procedure and the method of data analysis was identical to Ex-
periments 1 and 3. The simple RT task and the go/nogo task were identical to theones employed in Experiments 1 and 3, respectively.
5.2. Results and discussion
There were a total of 0.4% premature responses (RTs < 100 ms) and 0.6% misses(RTs > 1000 ms). In the go/nogo task 1.7% false alarms resulted in nogo trials. These®gures are similar to the ones obtained in the preceding experiments.
The e�ect of task on the dependent variables is summarized in Table 4. As ex-pected, simple RTs were signi®cantly faster than RTs in the go/nogo task. Theo-retically more revealing, however, is that task signi®cantly a�ected the force outputof the responses. In accordance with the preceding experiment, participants pro-duced signi®cantly more forceful responses in the go/nogo task. Both the amplitudeand the area under the force±time function were larger in the go/nogo task ascompared with the simple RT task, though the shape of the force±time function wasvirtually una�ected by task. The estimates of the shape parameters and time to peakforce were remarkably consistent with the ones obtained in the preceding experi-ments.
Participants produced signi®cantly more response force with their right handsthan with their left hands (peak force: 725 vs. 647 cN, F �1; 35� � 6:8; p < 0:05; in-tegrated force: 123 vs. 139 cN s, F �1; 35� � 7:2; p < 0:05�. However, these maine�ects did not interact with factor task (p's > 0.47). The hand factor produced neitherany further signi®cant main e�ect (p's > 0.17) nor any signi®cant interaction(p's > 0.15) with task on the remaining dependent measures.
6. Experiment 5
The preceding two experiments demonstrated that responses are more forceful inthe go/nogo task than in the simple and choice RT tasks. These results certainlysuggest that the response execution process operates di�erently in the go/nogo taskthan in the other two tasks, contrary to DondersÕs assumption of pure insertion.Before concluding that pure insertion was de®nitely violated in this situation,however, it is necessary to consider whether the increased response force in the go/nogo task can be attributed to changes in apparent brightness.
In the previous two experiments, the imperative stimuli were two LEDs to the leftand right of ®xation. With such stimuli, it seems optimal to divide spatial attentionbetween these two LEDs in both the simple and choice RT tasks, because both ofthese tasks require speeded responses to both LEDs. In the go/nogo task, however, itseems advantageous to focus spatial attention at the ``go'' side LED, because this isthe only LED requiring a speeded response. It is possible that this extra focusing of
R. Ulrich et al. / Acta Psychologica 102 (1999) 43±75 61

Tab
le4
Mea
nv
alu
eo
fea
chd
epen
den
tm
easu
rea
sa
fun
ctio
no
fta
sk,
inE
xp
erim
ent
4,
an
dre
sult
so
fth
eA
NO
VA
an
dth
eW
ilco
xo
nte
stfo
re�
ect
of
task
a
Dep
end
ent
va
riab
leT
ask
AN
OV
AW
ilco
xo
nte
st
sim
ple
go
/no
go
D�
HW
F-v
alu
ep
Z-v
alu
ep
RT
(ms)
26
22
92
30
�7
69.6
p<
0:0
01
5.2
p<
0:0
01
Pea
kfo
rce
(cN
)6
60
71
152
�43
5.9
p<
0:0
52.1
p<
0:0
5
Inte
gra
ted
forc
e(c
Ns)
12
61
37
11
�8
8.3
p<
0:0
12.4
p<
0:0
5
Tim
eto
pea
kfo
rce
(ms)
99
10
01
�3
0.7
n.s
.0.9
n.s
.
Sk
ewn
ess
0.2
20
.22
ÿ.01
�.0
30.1
n.s
.0.6
n.s
.
Ku
rto
sis
ÿ0.4
9ÿ0
.46
0.0
1�
0.0
31.9
n.s
.0.8
n.s
.
Dis
per
sio
n(m
s)5
96
00
�1
0.3
n.s
.1.2
n.s
.
aN
ote
s:T
he
deg
rees
of
free
do
mfo
rea
chF
-va
lue
are
1a
nd
35.
Atw
o-t
ail
edp-v
alu
ew
as
use
dfo
rth
eW
ilco
xo
nm
atc
hed
-pair
ssi
gn
ed-r
an
ks
test
.T
he
fou
rth
colu
mn
giv
esth
em
ean
di�
eren
ceD
an
dth
eh
alf
-wid
th,
HW
,o
fth
eco
rres
po
nd
ing
con
®d
ence
inte
rval.
62 R. Ulrich et al. / Acta Psychologica 102 (1999) 43±75
attention in the go/nogo task would increase the apparent brightness of the stimulus(Downing, 1988) in this task as compared to the other two tasks. Because brighterstimuli produce more forceful responses (Angel, 1973; Ulrich & Mattes, 1996; Ex-periment 3), this attentional hypothesis might explain why participants producedespecially forceful responses in the go/nogo tasks of the preceding experiments, evenif response execution processes operated identically in all tasks.
Experiment 5 was designed to test this attentional hypothesis. The stimuli wereletters, always presented at the same location, and letter identity determined thecorrect response (go/nogo or left/right hand in the choice task). Since all stimuliappeared at the same location, stimuli in both the go/nogo and the choice RT taskshould have had the same degree of focused attention and therefore the same ap-parent brightness. Thus, according to the above attentional hypothesis, responseforce should not di�er between the go/nogo and the choice RT tasks.
6.1. Method
Participants. Another sample of 36 participants (20 females and 16 males; meanage: 26.2 yr) was recruited. Two participants claimed to be left-handed.
Apparatus. The apparatus was identical to Experiment 1 except for the stimuli,which were the letters X and S presented in the center of the computer monitor. Eachletter subtended a visual angle of 2.1° ´ 1.6° and had an intensity of 3.1 cd/m2. Theintensity of the background was 0.25 cd/m2.
Procedure. The procedure and data analysis were identical to Experiment 3 exceptfor the stimulus set and S±R mapping. In the choice RT task, half of the participantsresponded with the left hand to the letter X and with the right hand to the letter S;this mapping was reversed for the other half. In the go/nogo task, the assignment ofletters to go and nogo trials was de®ned analogously to Experiment 3. Thus, thestimulus that de®ned the right (left) hand response in the choice task also de®ned a``go'' trial when participants responded with the right (left) hand in the go/nogo task.
6.2. Results and discussion
A total of 0.2% premature responses (RTs < 100 ms) and 0.5% misses (RTs > 1000ms) were obtained. In the choice task, there were 0.7% wrong hand responses, and inthe go/nogo task there were 1.8% false alarms in nogo trials. These ®gures are quitesimilar to the error pattern observed in Experiment 3.
Table 5 shows the main e�ect of task on the dependent measures. Compared toExperiment 3, there was a clearer RT di�erence between the choice and go/nogotasks. Such a strong e�ect of task was expected, because the symbolic S±R mappingin the present experiment is much less compatible than the spatial mapping S±Remployed in Experiment 3 (Kornblum et al., 1990).
Although the S±R mapping clearly di�ers between Experiment 3 and the presentone, the e�ects of task on response dynamics were almost identical. Most important,participants again produced larger force amplitudes in the go/nogo task than in thechoice task. This ®nding strongly argues against the attentional hypothesis consid-
R. Ulrich et al. / Acta Psychologica 102 (1999) 43±75 63

Tab
le5
Mea
nv
alu
eo
fea
chd
epen
den
tm
easu
rea
sa
fun
ctio
no
fta
sk,
inE
xp
erim
ent
5,
an
dre
sult
so
fth
eA
NO
VA
an
dth
eW
ilco
xo
nte
stfo
re�
ect
of
task
a
Dep
end
ent
va
riab
leT
ask
AN
OV
AW
ilco
xo
nte
st
go
/no
go
cho
ice
D�
HW
F-v
alu
ep
Z-v
alu
ep
RT
(ms)
33
94
12
73
�9
262.7
p<
0:0
01
5.2
p<
0:0
01
Pea
kfo
rce
(cN
)6
14
57
5ÿ3
8�
33
5.6
p<
0:0
52.5
p<
0:0
5
Inte
gra
ted
forc
e(c
Ns)
10
01
00
0�
71.0
n.s
.0.9
n.s
.
Tim
eto
pea
kfo
rce
(ms)
10
01
02
2�
40.4
n.s
.0.8
n.s
.
Sk
ewn
ess
0.2
70
.26
ÿ0.0
1�
0.0
30.6
n.s
.0.8
n.s
.
Ku
rto
sis
ÿ0.3
5ÿ0
.38
ÿ0.0
2�
0.0
51.5
n.s
.1.3
n.s
.
Dis
per
sio
n(m
s)6
06
1ÿ2
�1
6.7
p<
0:0
52.8
p<
0:0
1
aN
ote
s:T
he
deg
rees
of
free
do
mfo
rea
chF
-va
lue
are
1a
nd
35.
Atw
o-t
ail
edp-v
alu
ew
as
use
dfo
rth
eW
ilco
xo
nm
atc
hed
-pair
ssi
gn
ed-r
an
ks
test
.T
he
fou
rth
colu
mn
giv
esth
em
ean
di�
eren
ceD
an
dth
eh
alf
-wid
th,
HW
,o
fth
eco
rres
po
nd
ing
con
®d
ence
inte
rval.
64 R. Ulrich et al. / Acta Psychologica 102 (1999) 43±75
ered earlier. Moreover, this dissociation suggests that the task e�ect on responseforce is not generated at the level of response selection. If it were, one would expect achange in S±R compatibility to a�ect response force as well as RT. Thus, it seemsmost likely that the generally heightened force output in the go/nogo task is due to aprocessing stage that is located at the distal end of the processing chain. (Thisconjecture is further elaborated in Section 7.)
Only two further e�ects were signi®cant. First, there was a one millisecond e�ectof task on dispersion. As in the analogous Experiment 3, force pulses were slightlyless stretched along the time axis in the go/nogo compared to the choice task. Sec-ond, there was a main e�ect of hand on dispersion, F �1; 35� � 5:8; p < 0:05; left-hand responses produced a somewhat less dispersed (by 3 ms) force pulse thanright-hand responses. There was neither any further main e�ect (p's > 0.07) nor anysigni®cant interaction (p's > 0.40) on the remaining dependent measures.
6.3. Conclusions from go/nogo task
The outcomes of Experiment 3, 4 and 5 clearly suggest that participants producemore forceful responses in the go/nogo task than in the two other RT tasks, whichthemselves do not produce di�erences in force output.
7. General discussion
In this study, we sought to examine whether the type of RT task a�ects responseforce. Speci®cally, participants performed simple RT, go/nogo and two-choice RTtasks, and in each trial we measured the complete force±time pro®le of the re-sponse. We reasoned that if this pro®le varies across tasks, response execution mustnot operate identically in all tasks, weakening DondersÕs hypothesis that the motorsystem consumes the same amount of time regardless of task. In contrast, if force±time pro®les are the same in all tasks, this would clearly strengthen the assumptionthat this system operates identically ± and thus consumes the same time ± in alltasks.
The two main ®ndings of this study can be summarized as follows: First, theforce±time pro®les of the responses of simple and choice RT tasks are virtually in-distinguishable. This conclusion applies to both visual and auditory stimuli (Ex-periments 1 and 2, respectively). Second, participants produce more forcefulresponses in the go/nogo than in the choice or simple RT tasks (Experiments 3, 4 and5). Most surprisingly, the tasks most di�erent in terms of RT, i.e. simple and choiceRT, produced virtually identical response outputs, suggesting that the response ex-ecution process does indeed operate identically in these two tasks, as Donders as-sumed.
Because the present force results from simple and choice RT tasks are in accor-dance with DondersÕs assumption, they argue against the idea that response acti-vation di�ers between these two tasks, as suggested by continuous models (cf. Balota& Abrams, 1995). For example, under the plausible assumption that di�erences in
R. Ulrich et al. / Acta Psychologica 102 (1999) 43±75 65

the rate of response activation produce di�erences in observable response force,McClelland's (1979) cascade model predicts the highest rate of response activation inthe simple RT task, a lower rate in the go/nogo task, and the lowest rate in the choiceRT task (see the appendix for a detailed analysis of this prediction). The presentresults, however, are clearly inconsistent with this prediction.
The ®nding that the go/nogo task produces especially vigorous responses extendsthe pattern reported by Miller et al. (1999). As mentioned in the Introduction, theseauthors measured response force to assess whether stimulus intensity a�ects post-perceptual processes in the simple, go/nogo, and choice tasks. Although the authorswere mainly concerned with intensity e�ects, they also compared response forceacross RT tasks. In their ®rst experiment employing all three tasks, response forcedid not vary across task.
This null e�ect may be attributed to insu�cient statistical power, because all threetasks were run within a single session. In the second and third experiments an au-ditory accessory stimulus accompanied the imperative stimulus in a go/nogo andchoice task. As in the present study, in both of theses experiments more vigorousresponses were found for the go/nogo task, although this e�ect was only highlystatistically reliable in their third experiment. It should be stressed that the study ofMiller et al. (1999) not only employed an accessory stimulus but also a less directstimulus-response mapping than in the present set of experiments. Thus, the con-clusion that the go/nogo task produces relatively forceful responses is obviouslyfairly robust.
There seem to be at least three plausible accounts of why participants producedrelatively more forceful responses in the go/nogo task. First, one might argue that ina go/nogo task a response is not required in each trial and hence the motor systemhas, on average, more time to recover from the previous response. Assuming thatforce increases with the length of the recovery period, this would clearly explainespecially forceful responses in a go/nogo task, since in both simple and choice RT aresponse is required in each trial and so the recovery period is never more than oneintertrial interval. Alternatively, one might argue that participants become moreresponsive as more nonresponse trials precede a trial with an imperative stimulus(e.g., perhaps because arousal increases). Although it is di�cult to discriminate thisfrom the recovery explanation, both make the same testable prediction. Immediateresponse repetitions in a go/nogo task should produce less forceful responses thanresponses following nogo trials. In order to test this prediction, we analyzed responseforce for repetitions vs. nonrepetitions in the go/nogo tasks employed in Experiments3, 4 and 5. These additional analyses revealed no repetition e�ect on the strength of aresponse, thus leading us to reject these accounts. 8
As a second possible explanation, one might be tempted to argue that participantsmay for some reason raise the level of muscle tension during the foreperiod more in
8 Peak force was 668 cN for repetitions and 677 cN for nonrepetitions and this di�erence was
nonsigni®cant, F �1; 107� � 2:3, p � 0:130; in addition, integrated forces were 120 and 119 cNs,
respectively, and the di�erence between these was also nonsigni®cant, F �1; 107� � 1:1, p � 0:294.
66 R. Ulrich et al. / Acta Psychologica 102 (1999) 43±75
the go/nogo than in the other tasks. Thus the force output before stimulus onset maybe slightly more increased toward the criterion force of 50 cN in the go/nogo taskcompared with the other tasks. Hence, the force±time functions may be started froma slightly higher base-line level in the go/nogo task. An increase in the maximalproduced force level would be quite a reasonable consequence of a heightened base-line level due to preload force (Ulrich & Wing, 1991). To test this explanation, weinvestigated whether the base-line level of response force before stimulus onset dif-fered across tasks. Mean force output was computed over the interval from 100 to110 ms before the RT on each trial, and the average force in this interval was vir-tually identical in all three tasks. 9 Hence, it seems implausible that participantsproduced more force in the go/nogo task because they started from a higher forcelevel.
The third and at this point most attractive explanation involves the motorreadiness model (N�a�at�anen, 1971; Niemi & N�a�at�anen, 1981) and, speci®cally, to afurther development of this model to account for response probability e�ects onresponse force (Mattes et al., 1997). Mattes et al. reported that participants pro-duced more forceful responses when the probability of a go trial was low thanwhen it was high. They interpreted this ®nding in terms of an extended motorreadiness model. According to this extension, the distance between motor activa-tion and a threshold for action is relatively large when response probability is low,and a large increment is needed to exceed this threshold, resulting in slow butforceful responses. A similar explanation might apply to the present ®nding thatparticipants produce more forceful responses in the go/nogo task. In this task,participants might be forced to keep motor activation low in order to avoid falsealarms on nogo trials. If motor activation were high (i.e., close to the threshold formotor action), nonspeci®c activation elicited by the nogo stimulus might propagatethrough the S±R system and occasionally trigger a false alarm. Note that non-speci®c activation is especially likely to trigger false alarms in the go/nogo task. Insimple RT, there is no irrelevant stimulus to produce nonspeci®c activation. Inchoice RT, each stimulus selectively activates one response channel and reciprocalinhibition would quickly dampen or even eliminate activation in the other channel(Zorzi & Umilta, 1995), so even a high initial level of motor activation would rarelytrigger erroneous responses.
The motor readiness account also explains the paradoxical ®nding that the RT ina go/nogo task can sometimes even be longer than the RT in a corresponding choicesituation (cf. Luce, 1986, p. 213). According to this explanation, the response systemmust generate more activation to produce a response in the go/nogo task than in thechoice task. It is plausible that extra time would be needed to generate this additionalactivation.
9 An ANOVA including Experiment 3, 4 and 5 revealed that the average preload force within this
window was only 0.7 cN larger in the go/nogo task than in the other tasks, F < 1. Virtually identical
results were obtained in an analysis of mean force output over a wider interval preceding RT.
R. Ulrich et al. / Acta Psychologica 102 (1999) 43±75 67

Since the introduction of DondersÕs subtraction method, the go/nogo task hasbeen a major cause of debate about the validity of DondersÕs scheme (cf. Luce, 1986;Welford, 1980). The present results provide direct empirical support for the existingnotion that the go/nogo task does not ®t well into this scheme. As discussed in theIntroduction, the traditional concerns about the go/nogo task revolve aroundDondersÕs assumption that this task does not necessitate the process of responseselection. Speci®cally, beginning with Wundt (1880), several authors have argued onintrospective and logical grounds that the go/nogo task does require response se-lection ± contrary to DondersÕs analysis ± because the observer must choose whetherto respond or not. As far as we know, however, the only empirical support for thisview comes from the pupillometric studies mentioned in the introduction, and thisevidence is rather indirect, as already discussed. The present results neither supportnor contradict the idea that the go/nogo task requires a response selection process,but they do suggest an alternative account of why the go/nogo task might not ®twithin DondersÕs scheme.
In conclusion, the present experiments partially support but partially contradictDondersÕs assumption that the response execution system operates identically in allthree RT tasks of his scheme. In particular, the go/nogo task is an exception, becausemore force is generated in this task.
Acknowledgements
This work was supported by the Deutsche Forschungsgemeinschaft (UL 116/3-2)and by a research cooperation fund of the Deutsche Forschungsanstalt f�ur Luft-undRaumfahrt e.V. (NZ 08). We thank Frauke Becker and Hiltraut M�uller-Gethmannfor running the experiments. We appreciate the helpful comments of Richard Rid-derinkhof, A.F. Sanders, Robin Thomas, and three anonymous reviewers on pre-vious versions of this paper. Requests for reprints should be addressed to RolfUlrich, Phychological Institute, University of T�ubingen, Friedrichstr. 21, 72072T�ubingen, Germany, or to Je� Miller, Department of Psychology, University ofOtago, Dunedin, New Zealand.
Appendix A. Predictions of cascade model
In the main text we have emphasized the null e�ects of task on response forcepredicted from serial stage models and DondersÕs assumption of pure insertion. Inthis appendix we consider the predictions of an alternative continuous model knownas the ``cascade model'' (McClelland, 1979). This alternative model rejects theassumptions of serial stages and of pure insertion and, as we will show, suggests thatthe response execution stage should vary with task complexity. Speci®cally, it sug-gests that the response force should decrease as task complexity increases. Thisprediction is developed in the remainder of this Appendix A.
It seemed important to consider the predictions of continuous models as well asdiscrete ones. Some theorists consider continuous models to be more plausible than
68 R. Ulrich et al. / Acta Psychologica 102 (1999) 43±75

discrete stage models, because the former seem more compatible with current ideasabout brain structure and neural mechanisms (e.g., Smith, 1995; but see Roberts &Sternberg, 1992). McClelland's (1979) cascade model was chosen for study because itis the classic and seemingly most prominent continuous model in RT research, andbecause it is one of the few continuous models that are speci®ed precisely enough toderive such predictions (cf. Roberts & Sternberg, 1992).
In some respects, the cascade model resembles discrete stage models. Like discretemodels, it assumes that activation passes unidirectionally through a set of func-tionally ordered stages such as stimulus detection, stimulus identi®cation, responseselection, and response execution. It di�ers fundamentally from stage models,however, regarding the transmission of activation from one stage to the next. Thecascade model holds that a single stage transmits its output continuously to thesubsequent stage, which starts processing as soon as partial activation is availablefrom its predecessor stage. Thus, when a stimulus is presented, activation graduallyincreases throughout the whole system until a threshold is crossed in a ®nal motorstage, triggering the motor response.
As has been noted previously (e.g., Balota & Abrams, 1995; Ulrich et al., 1998), anatural elaboration of the cascade model is required to account for the recent®ndings that experimental manipulations a�ect not only RT but also the dynamics ofthe response itself. For example, it has repeatedly been documented that participantsrespond not only faster but also more forcefully to intense stimuli than to weakstimuli (Angel, 1973; Ja�skowski et al., 1995; Mattes & Ulrich, 1997; Miller et al.,1999; Ulrich et al., 1998).
Within the standard cascade model, increasing stimulus intensity would increasethe activation ¯ow throughout the system, because the strength of a stage's inputdetermines the strength of its output. Even if force is monotonically related to re-sponse-level activation, however, this would not explain the e�ect of intensity onresponse force. As mentioned before, in the standard cascade model a response isemitted when the accumulated activation at the ®nal response stage reaches a certainthreshold value that is independent of intensity. Thus, all responses would be initi-ated at the same criterion activation value regardless of stimulus intensity, and re-sponse force would not increase with intensity.
It is, however, plausible to elaborate the cascade model by assuming that forceproduction somehow re¯ects continuing response activation after the criterion iscrossed. Moreover, there is evidence in support of this assumption (Ulrich et al.,1998). Such an elaboration could explain why intense stimuli cause more forcefulresponses. For example, it seems quite plausible that an increased rate of responseactivation after criterion crossing would recruit more motor units, which in turnwould increase the amplitude of the force output (cf. Ulrich & Wing, 1991). Thus, ifresponse force is assumed to depend on the rate of continued response activationafter the response criterion is crossed, the cascade model would not only accountfor RT results but also provide a framework to make predictions about the dy-namics of the response itself. The predictions of this elaborated cascade modelregarding the e�ect of task complexity on both response force and RT will beanalyzed next.
R. Ulrich et al. / Acta Psychologica 102 (1999) 43±75 69

The ¯ow of activation predicted by McClelland's cascade model is depicted inFig. 2 for various levels of task complexity. In each panel, the solid curve representsthe activation level of the response execution stage. First, examine panels A, B and Con the left side of the ®gure. These show how response activation is in¯uenced by theinsertion of nonmotoric stages, in accordance with DondersÕs analysis of the simpleRT, go/nogo, and choice RT tasks. Panel A shows the activation functions for a two-stage version of the cascade model, which might be suitable for a simple RT task(e.g., stimulus detection and response execution). Panel B shows the activationfunctions for a three-stage version of the model that might be suitable for a go/nogotask, with an intermediate stage (e.g., stimulus identi®cation) added between the twostages of the version shown in Panel A. Note that the growth of response activationin the response execution stage is slowed, relative to that shown in Panel A, when thisintermediate stage is inserted. Finally, Panel C shows the activation functions for afour-stage version of the model that might be suitable for a choice RT task, with anadditional intermediate stage (e.g., response selection) beyond that present in PanelB. Note that insertion of this additional stage further slows the growth of responseactivation. Thus, continuous models suggest that response activation would increasemore slowly as the number of nonmotoric stages increased, contrary to DondersÕsassumption of pure insertion.
Panels D, E and F show that the response activation function is also ¯attened if ±contrary to DondersÕs analysis ± task complexity reduces the rate of accumulation¯ow within a central stage instead of in¯uencing the number of stages. Panel Dshows a model for simple RT; information is processed at a high rate within thecentral stage because the task puts little demand on that stage. Panel E shows amodel for the go/nogo task, where there is more demand on the central stage andthus a lower rate of information growth in this stage. Once again, making the taskmore complex slows the growth of response activation, just as it did when increasingcomplexity added new stages rather than slowing an existing one. Panel F shows amodel for the choice task, with even more demand on the central stage and evenslower activation growth in it, resulting in even slower activation growth in the ®nalstage.
The ¯attening of the response activation function illustrated in panels A-C andagain in panels D±F can be demonstrated more formally. Let i denote the ith�i � 1; . . . ; n� stage within a chain of n successive processing stages. Speci®cally, let nbe the ®nal processing stage, which corresponds to the response activation process.As shown by McClelland (1979, p. 294), the response activation function an�t� isgiven by the general gamma function (McGill, 1963)
an�t� � 1ÿXn
i�1
Ki exp�ÿki � t�; �A:1�
where ki is the rate associated with the ith stage and the constant Ki is computed as
Ki �Yn
j�1j 6�i
kj
kj ÿ ki: �A:2�
70 R. Ulrich et al. / Acta Psychologica 102 (1999) 43±75
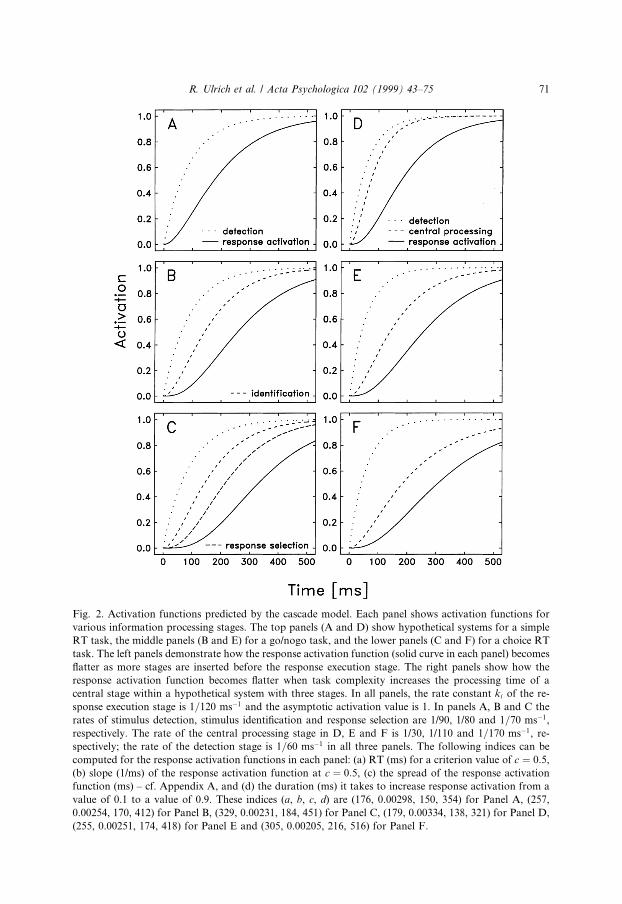
Fig. 2. Activation functions predicted by the cascade model. Each panel shows activation functions for
various information processing stages. The top panels (A and D) show hypothetical systems for a simple
RT task, the middle panels (B and E) for a go/nogo task, and the lower panels (C and F) for a choice RT
task. The left panels demonstrate how the response activation function (solid curve in each panel) becomes
¯atter as more stages are inserted before the response execution stage. The right panels show how the
response activation function becomes ¯atter when task complexity increases the processing time of a
central stage within a hypothetical system with three stages. In all panels, the rate constant ki of the re-
sponse execution stage is 1=120 msÿ1 and the asymptotic activation value is 1. In panels A, B and C the
rates of stimulus detection, stimulus identi®cation and response selection are 1/90, 1/80 and 1=70 msÿ1,
respectively. The rate of the central processing stage in D, E and F is 1/30, 1/110 and 1=170 msÿ1, re-
spectively; the rate of the detection stage is 1=60 msÿ1 in all three panels. The following indices can be
computed for the response activation functions in each panel: (a) RT (ms) for a criterion value of c � 0:5,
(b) slope (1/ms) of the response activation function at c � 0:5, (c) the spread of the response activation
function (ms) ± cf. Appendix A, and (d) the duration (ms) it takes to increase response activation from a
value of 0.1 to a value of 0.9. These indices (a, b, c, d) are (176, 0.00298, 150, 354) for Panel A, (257,
0.00254, 170, 412) for Panel B, (329, 0.00231, 184, 451) for Panel C, (179, 0.00334, 138, 321) for Panel D,
(255, 0.00251, 174, 418) for Panel E and (305, 0.00205, 216, 516) for Panel F.
R. Ulrich et al. / Acta Psychologica 102 (1999) 43±75 71

(Note that information is processed more slowly in stage i when ki is small than whenit is large.)
The general gamma function can be conceived as the cumulative distributionfunction of a sum of n exponentially distributed random variables with ratesk1; . . . ; kn (McGill, 1963). Therefore, the slope of an�t� corresponds to the probabilitydensity function of the general gamma function
d
dtan�t� �
Xn
i�1
Ki � ki exp�ÿki � t� �A:3�
and thus the spread (i.e., the standard deviation) of the activation function an�t� is
SD ����������������Xn
i�1
1
k2i:
s�A:4�
Hence, all other things being equal, the spread of an�t� increases and the responseactivation function an�t� becomes ¯atter in two cases: (1) as more stages precede the®nal stage, that is, as n increases (i.e., as illustrated in panels A±C); and (2) as there isa decrease in the rate ki of any stage i 2 f1 . . . nÿ 1g that precedes the ®nal stage n(i.e., as illustrated in panels D±F).
In summary, the cascade model suggests that response activation accumulatesmore slowly within the motor system in more complex tasks, whether increasing taskcomplexity adds new stages, as Donders suggested, or slows existing ones. Assumingthat response force is larger when motor activation accumulates at a higher rate, ineither case the model thus suggests that responses are most forceful in the simple RTtask, less forceful in the go/nogo task, and least forceful in the choice RT task. Thisparticular prediction is clearly at variance with the results of our experiments.
References
Abrams, R. A., & Balota, D. A. (1991). Mental chronometry: beyond reaction time. Psychological Science,
2, 153±157.
Ach, N. (1905). �Uber die Willenst�atigkeit und das Denken [On volition and thinking]. G�ottingen:
Vardenhoeck.
Angel, A. (1973). Input±output relations in simple reaction time experiments. Quarterly Journal of
Experimental Psychology, 25, 193±200.
Ashby, F. G. (1982). Testing the assumptions of exponential, additive reaction time models. Memory and
Cognition, 10, 125±134.
Ashby, F. G., & Townsend, J. T. (1980). Decomposing the reaction time distribution: Pure insertion and
selective in¯uence revisited. Journal of Mathematical Psychology, 21, 93±123.
Balota, D. A., & Abrams, R. A. (1995). Mental chronometry: beyond onset latencies in the lexical decision
task. Journal of Experimental Psychology: Learning, Memory and Cognition, 21, 1289±1302.
Bashore, T. R. (1981). Vocal and manual reaction time estimates of interhemispheric transmission time.
Psychological Bulletin, 89, 352±368.
Beatty, J. (1982). Task-evoked pupillary responses, processing load, and the structure of processing
resources. Psychological Bulletin, 91, 276±292.
Boring, E. G. (1929). A history of experimental psychology. New York: Appleton-Century.
72 R. Ulrich et al. / Acta Psychologica 102 (1999) 43±75
Broadbent, D. E., & Gregory, M. H. P. (1962). Donders' B-and C-reactions and S-R compatibility.
Journal of Experimental Psychology, 633, 575±578.
Cacioppo, J. T., & Dorfman, D. D. (1987). Waveform moment analysis in psychophysiological research.
Psychological Bulletin, 102, 421±438.
Carlton, L. G., Carlton, M. J., & Newell, K. M. (1987). Reaction time and response dynamics. Quarterly
Journal of Experimental Psychology, Section A: Human Experimental Psychology, 39, 337±360.
Cooper, L. A., & Shepard, R. N. (1973). Chronometric studies of the rotation of mental images. In W. G.
Chase, Visual information processing (pp. 75±176). New York: Academic Press.
Donders, F. C. (1868/1969). Over de snelheid van psychische processen. (On the speed of mental
processes.) (W. Koster, Trans.). In W. G. Koster, Attention and Performance II (pp. 412±431).
Amsterdam: North Holland.
Downing, C. J. (1988). Expectancy and visual-spatial attention: e�ects on perceptual quality. Journal of
Experimental Psychology: Human Perception and Performance, 14, 188±202.
Eriksen, C. W., & Schultz, D. W. (1979). Information processing in visual search: a continuous ¯ow
conception and experimental results. Perception and Psychophysics, 25, 249±263.
Freund, H. J., & B�udingen, H. J. (1978). The relationship between speed and amplitude of the fastest
voluntary contractions of human arm muscles. Experimental Brain Research, 31, 1±12.
Giray, M., & Ulrich, R. (1993). Motor coactivation revealed by response force in divided and
focused attention. Journal of Experimental Psychology: Human Perception and Performance, 19,
1278±1291.
Gottsdanker, R., & Shragg, G. P. (1985). Veri®cation of Donders' subtraction method. Journal of
Experimental Psychology: Human Perception and Performance, 11, 765±776.
Gottsdanker, R., & Tietz, J. D. (1992). An ``exhaustive'' search for tasks that fall between the choice and
simple reactions. Journal of Motor Behavior, 24, 147±156.
Helmholtz, H. L. F. (1850). �Uber die Methoden, kleinste Zeittheile zu messen, und ihre Anwendung f�ur
psychologische Zwecke [On the methods of measuring very small portions of time, and their
application to physiological processes]. Original work translated in Philosophical Magazine, 1853, 6
(Section 4) 313±325.
Ilan, A. B., & Miller, J. O. (1994). A violation of pure insertion: Mental rotation and choice RT. Journal of
Experimental Psychology: Human Perception and Performance, 20, 520±536.
Ja�skowski, P., Rybarczyk, K., Jaroszyk, F., & Lemanski, D. (1995). The e�ect of stimulus intensity on
force output in simple reaction time task in humans. Acta Neurobiologiae Experimentalis, 55,
57±64.
Ja�skowski, P., & Verleger, R. (1993). A clock paradigm to study the relationship between expectancy and
response force. Perceptual and Motor Skills, 77, 163±174.
Ja�skowski, P., Verleger, R., & Wascher, E. (1994). Response force and reaction time in a simple reaction
task under time pressure. Zeitschrift f�ur Psychologie, 202, 405±413.
Ja�skowski, P., & Wlodarczyk, D. (1997). E�ect of sleep de®cit, knowledge of results, and stimulus quality
on reaction time and response force. Perceptual and Motor Skills, 84, 563±572.
Ja�skowski, P., Wroblewski, M., & Jaroszyk, F. (1993). Attendant electrical shock can a�ect response force
in simple reaction time task. Unpublished manuscript.
Kerr, M., Mingay, R., & Elithorn, A. (1963). Cerebral dominance in reaction time responses. British
Journal of Psychology, 54, 325±336.
Kornblum, S., Hasbroucq, T., & Osman, A. M. (1990). Dimensional overlap: cognitive basis for stimulus-
response compatibility ± a model and taxonomy. Psychological Review, 97, 253±270.
Kulpe, O. (1893). Grundriss der Psychologie: Auf experimenteller Basis dargestellt [An outline of psychology
from an experimental perspective]. Leipzig: Engelmann.
Luce, R. D. (1986). Response times: Their role in inferring elementary mental organization. Oxford: Oxford
University Press.
Massaro, D. W. (1989). Experimental psychology: An information processing approach. San Diego, CA:
Harcourt Brace Jovanovich.
Mattes, S., & Ulrich, R. (1997). Response force is sensitive to the temporal uncertainty of response stimuli.
Perception and Psychophysics, 59, 1089±1097.
R. Ulrich et al. / Acta Psychologica 102 (1999) 43±75 73
Mattes, S., Ulrich, R., & Miller, J. O. (1997). E�ects of response probability on response force in simple
RT. Quarterly Journal of Experimental Psychology, Section A: Human Experimental Psychology, 50,
405±420.
McClelland, J. L. (1979). On the time relations of mental processes: A framework for analyzing processes
in cascade. Psychological Review, 86, 287±330.
McGill, W. (1963). Stochastic latency mechanisms. In R. D. Luce, R. Bush & E. Galanter, Handbook of
mathematical psychology, Vol. 1 (pp. 309±360). New York: Wiley.
Meyer, D. E., Osman, A. M., Irwin, D. E., & Yantis, S. (1988). Modern mental chronometry. Biological
Psychology, 26, 3±67.
Miller, J. O., Franz, V., & Ulrich, R. (1999). E�ects of stimulus intensity on response force in simple, go-
no-go, and choice RT. Perception and Psychophysics, 61, 107±119.
Miller, J. O. (1988). Discrete and continuous models of human information processing: Theoretical
distinctions and empirical results. Acta Psychologica, 67, 191±257.
Mordko�, J. T., Miller, J. O., & Roch, A. C. (1996). Absence of coactivation in the motor component:
Evidence from psychophysiological measures of target detection. Journal of Experimental Psychology:
Human Perception and Performance, 22, 25±41.
N�a�at�anen, R. (1971). Non-aging fore-periods and simple reaction time. Acta Psychologica, 35, 316±327.
Niemi, P., & N�a�at�anen, R. (1981). Foreperiod and simple reaction time. Psychological Bulletin, 89, 133±
162.
Pachella, R. G. (1974). The interpretation of reaction time in information-processing research. In B. H.
Kantowitz, Human information processing: Tutorials in performance and cognition (pp. 41±82).
Hillsdale, NJ: Erlbaum.
Po�enberger, A. T. (1912). Reaction time to retinal stimulation with special reference to the time lost in
conduction through nerve centers. Archives of Psychology, 23, 1±73.
Richer, F., & Beatty, J. (1985). Pupillary dilations in movement preparation and execution. Psychophys-
iology, 22, 204±207.
Richer, F., Silverman, C., & Beatty, J. (1983). Response selection and initiation in speeded reactions: a
pupillometric analysis. Journal of Experimental Psychology: Human Perception and Performance, 9,
360±370.
Roberts, S., & Sternberg, S. (1992). The meaning of additive reaction-time e�ects: Tests of three
alternatives. In D. E. Meyer & S. Kornblum, Attention and Performance XIV. Synergies in
experimental psychology, arti®cial intelligence, and cognitive neuroscience (pp. 611±653). Cambridge,
MA: MIT Press.
Sanders, A. F. (1997). Elements of human performance: Reaction processes and attention in human skill.
Hillsdale, NJ: Erlbaum.
Schwarz, W. (1988). Die Methode der reinen Einf�ugung: Ein �Uberblick und einige neue Resultate.
[The method of pure insertion: A review and some new results.] Zeitschrift f�ur Psychologie, 196,
274±263.
Smith, P. L. (1995). Psychophysically principled models of visual simple reaction time. Psychological
Review, 102, 567±593.
Sternberg, S. (1969). The discovery of processing stages: Extensions of Donders' method. Acta
Psychologica, 30, 276±315.
Sternberg, S. (1998a). Discovering mental processes: The method of additive factors. In D. Scarborough &
S. Sternberg, Methods, models, and conceptual issues. An invitation to cognitive science, Vol. 4 (pp.
703±863). Cambridge, MA: MIT Press.
Sternberg, S. (1998b). Inferring mental operations from reaction-time data: How we compare objects. In
D. Scarborough & S. Sternberg, Methods, models, and conceptual issues. An invitation to cognitive
science, Vol. 4 (pp. 365±454). Cambridge, MA: MIT Press.
Taylor, D. H. (1966). Latency components in two-choice responding. Journal of Experimental Psychology,
72, 481±487.
Ulrich, R., & Mattes, S. (1996). Does immediate arousal enhance response force in simple reaction time?
Quarterly Journal of Experimental Psychology, Section A: Human Experimental Psychology, 49, 972±
990.
74 R. Ulrich et al. / Acta Psychologica 102 (1999) 43±75

Ulrich, R., Rinkenauer, G., & Miller, J. O. (1998). E�ects of stimulus duration and intensity on simple
reaction time and response force. Journal of Experimental Psychology: Human Perception and
Performance, 24, 915±928.
Ulrich, R., & Stapf, K. H. (1984). A double response paradigm to study stimulus intensity e�ects upon the
motor system. Perception and Psychophysics, 36, 545±558.
Ulrich, R., & Wing, A. M. (1991). A recruitment theory of force-time relations in the production of brief
force pulses: The parallel force unit model. Psychological Review, 98, 268±294.
Ulrich, R., Wing, A. M., & Rinkenauer, G. (1995). Amplitude and duration scaling of brief isometric force
pulses. Journal of Experimental Psychology: Human Perception and Performance, 21, 1457±1472.
Van der Molen, M. W., & Keuss, P. J. G. (1979). The relationship between reaction time and intensity in
discrete auditory tasks. Quarterly Journal of Experimental Psychology, 31, 95±102.
Van der Molen, M. W., & Keuss, P. J. G. (1981). Response selection and the processing of auditory
intensity. Quarterly Journal of Experimental Psychology, Section A: Human Experimental Psychology,
33, 177±184.
Van der Molen, M. W., & Orlebeke, J. F. (1980). Phasic heart rate change and the U-shaped relationship
between choice reaction time and auditory signal intensity. Psychophysiology, 17, 471±481.
Watt, H. J. (1905). Experimentelle Beitr�age zur einer Theorie des Denkens [Experimental contribution to a
theory of thinking]. Archiv f�ur die Gesamte Psychologie, 4, 289±436.
Welford, A. T. (1980). Choice reaction time: Basic concepts. In A. T. Welford, Reaction times (pp. 73±
128). New York: Academic Press.
Wonnacott, T. H., & Wonnacott, R. H. (1977). Introductory statistics (3rd ed.). New York: Wiley.
Woodworth, R. S. (1938). Experimental psychology. New York: Holt.
Woodworth, R. S., & Schlosberg, H. (1954). Experimental psychology, New York: Henry Holt.
Wundt, W. (1880). Grundz�uge der physiologischen Psychologie Foundations of physiological psychology
(2nd ed.). Leipzig: Engelmann.
Zorzi, M., & Umilta, C. (1995). A computational model of the Simon e�ect. Psychological Research, 58,
193±205.
R. Ulrich et al. / Acta Psychologica 102 (1999) 43±75 75