domestic hot water - california energy · pdf fileconsumption for the domestic hot water...
TRANSCRIPT
Publ ic Interest Energy Research (P IER) Program FINAL PROJECT REPORT
MULTIFAMILY CENTRAL DOMESTIC HOT WATER DISTRIBUTION SYSTEMS
JUNE 2013CEC ‐500 ‐2013 ‐011
Prepared for: California Energy Commission Prepared by: Heschong Mahone Group, Inc.

Prepared by: Primary Author(s): Yanda Zhang, PhD Heschong Mahone Group, Inc. 11211 Gold Country Blvd, Suite 103 Gold River, CA 95670 916-962-7001 www.h-m-g.com Contract Number: 500-06-029 Prepared for: California Energy Commission Bradley C. Meister, Ph.D., P.E. Contract Manager Virginia Lew Office Manager Energy Efficiency Research Office Laurie ten Hope Deputy Director RESEARCH AND DEVELOPMENT DIVISION Robert P. Oglesby Executive Director
DISCLAIMER This report was prepared as the result of work sponsored by the California Energy Commission. It does not necessarily represent the views of the Energy Commission, its employees or the State of California. The Energy Commission, the State of California, its employees, contractors and subcontractors make no warranty, express or implied, and assume no legal liability for the information in this report; nor does any party represent that the uses of this information will not infringe upon privately owned rights. This report has not been approved or disapproved by the California Energy Commission nor has the California Energy Commission passed upon the accuracy or adequacy of the information in this report.

i
ACKNOWLEDGEMENTS
The author would like to acknowledge the following team members at Heschong Mahone
Group, Inc., that contributed to the development of this study:
Charlotte Bonneville
Derrick Leung
Jeff Staller
Julianna Wei
Matthew Haro
Mike Maroney
Owen Howlett (now with the California Energy Commission)
Sophia Hartkopf
Stephen Wilson
EDC Technology, Inc., subcontractor on the project, provided temperature modulation control
equipment and access to its database of continuous monitoring data from many multifamily
buildings. Saves You Energy, LLC and Enovative Group, Inc. provided demand control
equipment to support the field performance evaluation of demand control technologies.
The research team would like thank the California Investor Owned Utilities (IOUs), Codes and
Standards programs for providing additional funding to support the improvement of the
recirculation system model developed by this study. The improved model was used to support
the development of the 2013 Title 24 requirements for central domestic hot water systems in
multifamily buildings and hotels/motels.
The project team is enormously appreciative of all the building owners and operators who
participated in this study and allowed team members to survey their buildings, monitor their
domestic hot water systems, and review their building plans. The study would not have been
possible without their participation.

ii
PREFACE
The California Energy Commission Public Interest Energy Research (PIER) Program supports
public interest energy research and development that will help improve the quality of life in
California by bringing environmentally safe, affordable, and reliable energy services and
products to the marketplace.
The PIER Program conducts public interest research, development, and demonstration (RD&D)
projects to benefit California.
The PIER Program strives to conduct the most promising public interest energy research by
partnering with RD&D entities, including individuals, businesses, utilities, and public or
private research institutions.
PIER funding efforts are focused on the following RD&D program areas:
Buildings End‐Use Energy Efficiency
Energy Innovations Small Grants
Energy‐Related Environmental Research
Energy Systems Integration
Environmentally Preferred Advanced Generation
Industrial/Agricultural/Water End‐Use Energy Efficiency
Renewable Energy Technologies
Transportation
Multifamily Central Domestic Hot Water Distribution Systems is the final report for the Domestic
Hot Water project (contract number 500‐06‐029), conducted by Heschong Mahone Group. The
information from this project contributes to PIER’s Buildings End‐Use Energy Efficiency
Program.
When the source of a table, figure or photo is not otherwise credited, it is the work of the author
of the report.
For more information about the Energy Research and Development Division, please visit the
Energy Commission’s website at www.energy.ca.gov/research/ or contact the Energy
Commission at 916‐327‐1551.
iii
ABSTRACT
This report examines recirculation systems in multifamily central domestic hot water systems.
The purpose is to provide a good understanding of recirculation system performance and to
assess the potential energy savings resulting from implementing recirculation system controls.
This project studied domestic hot water system operations in 28 multifamily buildings. These
multifamily buildings had between 11 and 250 dwelling units each and ranged from two to five
stories tall. Study buildings were located in both Northern and Southern California and covered
five climate zones. About half of these buildings were built after 1990, and the other half was
built before 1990.
This project developed a performance analysis method to measure energy consumption of
major components in central domestic hot water systems. This method separated natural gas
consumption for the domestic hot water system into four energy flow components: water
heating equipment efficiency and standby heat loss, recirculation system heat loss, branch pipe
heat loss, and delivered hot water energy. Percentages of natural gas consumption for these
four energy flow components were calculated using field monitoring results.
While recirculation system controls can help to reduce heat loss from pipes, improving
recirculation system designs is more important because it will ensure that domestic hot water
systems will have small heat loss from initial startup. This study investigated recirculation
system designs in central domestic hot water systems and developed a model to predict
recirculation system performance based on recirculation system designs.
Additional research is needed to address branch pipe performance so that overall system
optimization can be performed. Assessing the performance of these branches to the water
fixture will further identify future opportunities for energy saving improvements.
Residential hot water systems use approximately 44 percent of residential natural gas use in
California. Identifying ways to make all aspects of hot water systems more efficient can save
California residents a significant amount of energy and water.
Keywords: Multifamily hot water distribution, hot water, central distribution, demand control,
temperature modulation, efficient distribution, Cross over flow
Please use the following citation for this report:
Zhang, Yanda. (Heschong Mahone Group). 2013. Multifamily Central Domestic Hot Water
Distribution Systems. California Energy Commission. Publication Number: CEC‐500‐
2013‐011.
iv
TABLE OF CONTENTS
Acknowledgements ................................................................................................................................... i
PREFACE ................................................................................................................................................... ii
ABSTRACT .............................................................................................................................................. iii
TABLE OF CONTENTS ......................................................................................................................... iv
LIST OF FIGURES ................................................................................................................................. vii
LIST OF TABLES .................................................................................................................................. viii
EXECUTIVE SUMMARY ........................................................................................................................ 1
Field Monitoring Study ......................................................................................................................... 1
Performance Analysis ............................................................................................................................ 1
Recirculation System Design ................................................................................................................ 3
System Operation Issues ....................................................................................................................... 3
Recirculation System Model ................................................................................................................. 4
Performance of Recirculation System Controls ................................................................................. 4
Conclusions ............................................................................................................................................. 6
Next Steps ............................................................................................................................................... 6
Benefits to California ............................................................................................................................. 6
CHAPTER 1: Introduction ...................................................................................................................... 9
1.1 Multifamily Central DHW Systems ...................................................................................... 10
1.2 Recirculation System Controls ............................................................................................... 11
1.2.1 Timer Control ................................................................................................................... 12
1.2.2 Temperature Modulation ................................................................................................ 12
1.2.3 Demand Control ............................................................................................................... 13
1.2.4 Continuous Monitoring ................................................................................................... 13
1.3 Previous Studies ....................................................................................................................... 13
1.4 Research Goals and Objectives ............................................................................................... 14
CHAPTER 2: Research Plan .................................................................................................................. 16
2.1 Field Monitoring Study ........................................................................................................... 16

v
2.1.1 Field Monitoring Plan ...................................................................................................... 16
2.1.2 Evolution of Field Monitoring Plan ............................................................................... 17
2.2 Performance Analysis .............................................................................................................. 20
2.2.1 Energy Flow Analysis ...................................................................................................... 20
2.2.2 Historical Monitoring Data Analysis ............................................................................ 24
2.3 Recirculation System Model Development .......................................................................... 24
CHAPTER 3: Field Monitoring Study ................................................................................................. 27
3.1 Field Monitoring Buildings .................................................................................................... 27
3.2 Observations of Recirculation System Operation ................................................................ 32
3.2.1 Hot Water Draw Flow ..................................................................................................... 32
3.2.2 Recirculation Flow ........................................................................................................... 32
3.2.3 HWS Temperatures.......................................................................................................... 32
3.2.4 HWR Temperatures ......................................................................................................... 33
3.2.5 CWS Temperatures .......................................................................................................... 33
3.3 Field Measurement Issues ....................................................................................................... 35
3.3.1 Temperature Measurement ............................................................................................ 35
3.3.2 Water Flow Measurement ............................................................................................... 37
3.3.3 Natural Gas Measurement .............................................................................................. 38
3.4 Crossover Flow Investigation ................................................................................................. 38
3.4.1 Reverse Flow Measurement ........................................................................................... 38
3.4.2 System Pressure Analysis ............................................................................................... 39
3.5 Recirculation System Piping Layout ..................................................................................... 41
CHAPTER 4: Performance Analysis Results ..................................................................................... 44
4.1 Overall System Performance .................................................................................................. 44
4.2 Performance of Controls ......................................................................................................... 49
4.3 Hot Water Draw Analysis ....................................................................................................... 51
4.4 Historical Monitoring Data Analysis .................................................................................... 56
CHAPTER 5: Recirculation System Model Development .............................................................. 57

vi
5.1 Overview ................................................................................................................................... 57
5.2 Recirculation System Configuration ..................................................................................... 57
5.3 Pipe Heat Transfer Modes ...................................................................................................... 59
5.3.1 Pipe Heat Transfer with Hot Water Flows ................................................................... 60
5.3.2 Pipe Heat Transfer without Hot Water Flows ............................................................. 61
5.4 Recirculation System Heat Transfer Modes ......................................................................... 61
5.4.1 Recirculation Operation with Varying Hot Water Flows ........................................... 61
5.4.2 Recirculation Operation with Varying HWS Temperatures ...................................... 63
5.4.3 Mechanisms of Control Technologies ........................................................................... 64
5.5 Model of Controls .................................................................................................................... 64
5.5.1 Modeling of Continuous Pumping ................................................................................ 64
5.5.2 Continuous Pumping without Any Controls............................................................... 64
5.5.3 Modeling of Temperature Modulation ......................................................................... 65
5.5.4 Modeling of Timer Control and Demand Control ...................................................... 65
5.6 Model Validation Procedures ................................................................................................. 66
5.7 Model Validation Results ........................................................................................................ 69
5.7.1 Validation of HWR Temperature Prediction ............................................................... 69
5.7.2 Validation of System Energy Flows .............................................................................. 71
5.8 Energy Savings of Controls .................................................................................................... 74
CHAPTER 6: Conclusion ....................................................................................................................... 76
6.1 Performance Analysis .............................................................................................................. 76
6.2 Recirculation System Piping Design ..................................................................................... 77
6.3 Recirculation System Model ................................................................................................... 78
6.4 Performance of Recirculation Controls ................................................................................. 79
6.5 Continuous Monitoring ........................................................................................................... 80
6.6 Next Steps .................................................................................................................................. 81
CHAPTER 7: Technology Transfer ...................................................................................................... 83
7.1 Central DHW System Design Guide ..................................................................................... 83
vii
7.2 ACEEE Hot Water Forum Presentations .............................................................................. 83
7.3 2013 Title 24 Development ...................................................................................................... 83
GLOSSARY .............................................................................................................................................. 85
REFERENCES .......................................................................................................................................... 86
APPENDIX A: Field Monitoring Study Buildings ......................................................................... A‐1
APPENDIX B: Historical Monitoring Data Analysis ..................................................................... B‐1
APPENDIX C: Recirculation System Model .................................................................................... C‐1
Pipe Heat Transfer Solutions ............................................................................................................ C‐1
Pipe Heat Transfer Coefficient (UA) ........................................................................................... C‐1
Lumped Capacity Method for Pipe Cool Down ........................................................................ C‐2
Excel Model Screenshots ................................................................................................................... C‐3
Overall Setting and Output Summary ........................................................................................ C‐3
Settings of Controls ........................................................................................................................ C‐4
Model Pipe Section Configuration .............................................................................................. C‐5
Model Calculation Steps ............................................................................................................... C‐6
LIST OF FIGURES
Figure 1: Average Energy Flows in Monitored Central DHW Systems ............................................ 2
Figure 2: Illustration of a Central DHW System in a Multi‐Family Building ................................. 10
Figure 3: Schematics of Central DHW System Configuration .......................................................... 11
Figure 4: Schematics of Field Measurement Locations ...................................................................... 17
Figure 5: Illustration of Major Energy Flow Components in Central DHW Systems ................... 21
Figure 6: Measured Recirculation System Operation – No Controls ............................................... 33
Figure 7: Measured Recirculation System Operation – Timer Control ........................................... 34
Figure 8: Measured Recirculation System Operation – Temperature Modulation ....................... 34
Figure 9: Measured Recirculation System Operation – Demand Control....................................... 35
Figure 10: Comparison of Water and Pipe Temperature Measurements ....................................... 36
Figure 11: Recirculation System Pressure Measurement Results ..................................................... 40
Figure 12: Recirculation System Piping Layouts in Four Full On‐Site Study Buildings ............... 43
Figure 13: Percentages of DHW System Natural Gas Consumption by Energy Flow
Components .............................................................................................................................................. 45
Figure 14: Average Energy Flows in Multi‐Family Central DHW Systems ................................... 46
Figure 15: Statistics of Recirculation System Heat Loss .................................................................... 49
Figure 16: Example of Measured Peak Hot Water Demand – Full Day .......................................... 53
Figure 17: Example of Measured Peak Hot Water Demand – Three Hours ................................... 53

viii
Figure 18: Peak Hot Water Demand Fractions ................................................................................... 54
Figure 19: Example of Pipe Section Configurations for a Simple Recirculation System .............. 58
Figure 20: Recirculation System Model for a Full On‐Site Study Building .................................... 59
Figure 21: Hot Water Temperature Distribution in a Recirculation System .................................. 63
Figure 22: Model Validation – Temperature Modulation ................................................................. 70
Figure 23: Model Validation – Timer Control ..................................................................................... 70
Figure 24: Model Validation – Demand Control ................................................................................ 70
Figure 25: HWS Temperatures under Temperature Modulation Controls and Continuous
Monitoring .............................................................................................................................................. B‐2
Figure 26: Illustration of Pipe Heat Transfer ..................................................................................... C‐1
LIST OF TABLES
Table 1: Summary of Measured Energy Savings from Control Technologies.................................. 5
Table 2: Energy Savings from Control Technologies in Four Buildings Based on Modeling
Study ............................................................................................................................................................ 5
Table 3 Summary of Field Monitoring Plan ........................................................................................ 17
Table 4: Summary of Field Monitoring Study Buildings .................................................................. 28
Table 5: Detailed Characteristics of Field Monitoring Study Buildings – Full On‐Site Study ..... 29
Table 6: Detailed Characteristics of Field Monitoring Study Buildings – Partial On‐Site Study . 30
Table 7 Variations of Key Recirculation System Parameters of All Monitored Buildings ........... 44
Table 8 Summary of Field Monitoring and Performance Analysis Results – Full On‐Site Study47
Table 9: Summary of Field Monitoring and Performance Analysis Results – Partial On‐Site
Study .......................................................................................................................................................... 48
Table 10: Control Schedules for Full On‐Site Studies ........................................................................ 51
Table 11: Measured Gas Energy Savings by Controls ....................................................................... 51
Table 12: Recirculation System Pipe Heat Loss Rates under Different Flow Conditions ............. 62
Table 13: Recirculation System Pipe Heat Loss Rates with Different HWS Temperature ........... 63
Table 14: Validation of Model Predictions of Recirculation System Pipe Heat Loss .................... 71
Table 15: Validation of Energy Savings from Controls ..................................................................... 72
Table 16: Comparison of Heat Loss of Flows in Recirculation Systems .......................................... 74
Table 17: Energy Savings from Control Technologies in Four Buildings Based on Modeling
Study .......................................................................................................................................................... 75
Table 18: Pictures of Field Monitoring Study Buildings – Full On‐Site Study ............................. A‐2
Table 19: Pictures of Field Monitoring Study Buildings – Partial On‐Site Study ........................ A‐8
Table 20: Average HWS Temperature under Temperature Modulation and Continuous
Monitoring .............................................................................................................................................. B‐6
1
EXECUTIVE SUMMARY
Field Monitoring Study
The study monitored central domestic hot water system operation in 28 multifamily buildings,
selected from more than 50 buildings recruited by the research team. These monitored
multifamily buildings had between 11 and 250 dwelling units each and were between two and
five stories tall. They were located in both northern and southern California and covered five
climate zones. About half of these buildings were built after 1990 and the other half was built
before 1990.
The research team conducted two types of field studies: full on‐site studies (performed in 8
buildings) and partial on‐site studies (performed in 20 buildings). Full on‐site study buildings
were chosen to provide in‐depth understanding of recirculation performance, while partial on‐
site study buildings were chosen to obtain performance information from a broad range of
buildings. Both types of field studies monitored key recirculation system parameters, including
hot water supply temperature, hot water return temperature, cold water supply temperature,
recirculation flow, and hot water draw flow. These measurements allowed the research team to
quantify recirculation system performance using an energy flow analysis method, described in
the next section. Full on‐site studies also monitored domestic hot water system natural gas
consumption, investigated recirculation system piping designs, and assessed energy savings
from recirculation system controls. Control technologies investigated by this study included
timer control, temperature modulation, and demand control. The additional information
provided by full on‐site studies was essential to developing a recirculation system model.
Performance Analysis
Previous studies relied on total system natural gas consumption to determine performance of
overall central domestic hot water systems; this approach was unable to reveal the performance
of recirculation systems as a component of the overall central domestic hot water system. This
study developed a performance analysis method − energy flow analysis method − to quantify
energy consumption of major components in central domestic hot water systems. This method
separated the total domestic hot water system natural gas consumption into four energy flow
components: water heating equipment efficiency and standby heat loss, recirculation system
heat loss, branch pipe heat loss, and delivered hot water energy. Percentages of total domestic
hot water system natural gas consumption for these four energy flow components were
calculated using field monitoring results. Two performance metrics are established based on
this performance analysis method:
Overall domestic hot water system efficiency is represented by the percentage of
total system natural gas consumption accounted for by delivered hot water energy.
Performance of recirculation system is represented by the percentage of total system
natural gas consumption taken up by recirculation system heat loss.

2
Energy flow analysis was performed for domestic hot water systems in all 28 monitored
buildings. The analysis results revealed a very wide range of performance. Overall domestic hot
water system efficiency ranged from 9 percent to 67 percent, and recirculation system heat loss
ranged from 3 percent to 61 percent. As shown in Error! Reference source not found., the
overall average efficiency of central domestic hot water systems was 35 percent, and
recirculation system heat loss represented 33 percent of the total domestic hot water system
natural gas consumption.
The results showed that heat loss by branch pipes represented about 1 percent of the total
natural gas consumption. However, this study did not monitor hot water usages at each branch
and hot water fixture; therefore, it was un able to quantify hot water waste associated with
draws to discharge cold water in the pipe and hot water cooled down in branches without
being used. For this reason, branch pipe heat loss provided by this study represents only a low
bound. If hot water wastes by branch pipes were included, overall domestic hot water system
efficiency would be lower than 35 percent. Future studies are needed to provide better
information on branch pipe performance in multifamily central domestic hot water systems.
This future research will result in a thorough investigation and assessment of the entire piping
system performance and heat loss, natural gas consumption implications and strategies for
optimization based on pipe size and run.
Figure 1: Average Energy Flows in Monitored Central DHW Systems

3
Recirculation System Design
The study investigated recirculation piping designs through field surveys, building plan
reviews, and interviews with domestic hot water system designers. The research team inspected
recirculation system designs, in terms of pipe sizes and locations, in more than 50 multifamily
buildings as part of the initial screening process to identify field study candidates. For
monitored buildings, the research team further reviewed building plans, if available, to obtain
the recirculation design information that could not be observed through field inspection. Many
types of designs were found. Some buildings used simple recirculation loops that stayed in one
floor with long branch lines to reach to each hot water fixture, while other buildings used
complicated designs to minimize branch lengths between recirculation pipes and dwelling
units.
Interviews with several recirculation system designers found that there was no consensus on
design guidelines for central domestic hot water recirculation systems. This explained why no
consistent design trends were observed in the field. Some design approaches, for instance, using
balancing valves to balance flows in parallel recirculation loops, were adopted from design
guides for hydronic heating systems which transfers heat by circulating a hot fluid through a
closed system of pipes. These approaches were not widely used and were not always suitable
for central domestic hot water systems.
Detailed recirculation system designs in four full on‐site study buildings were created based on
field inspection and building plan review, and were used to support the development and
validation of a recirculation system model developed by the study.
System Operation Issues
This study investigated the system operations issue of crossover flows and recirculation pump
failures, which were reported by previous studies to exist widely in central domestic hot water
systems.
Bidirectional flow meters were installed on cold water supply and hot water return pipes to
detect possible crossover flow1 in these pipes. Field measurements did not indicate strong
reverse flow signals (strong signals can be an indication of crossover flows in cold water supply
pipes). In all surveyed central domestic hot water systems, check valves were in place on cold
water supply pipes to prevent back flows into building cold water mains. Therefore, it was not
surprising that no crossover flows in cold water supply pipes were found in these buildings.
Previous studies relied on pipe temperature measurements to detect crossover flows. This study
found that pipe temperature measurements, in some cases, were not reliable for copper pipes.
Because of their high thermal conductivity, the temperature of copper pipes can rise very
quickly when there is no water flow and the pipe is connected to a hot water pipe or a storage
tank with a short pipe length. In this case, using temperature measurement alone may lead to a
false conclusion of crossover flow of hot water into cold pipes.
1 Crossover flow is cold water flowing into hot water piping or hot water flowing into cold water piping

4
The study encountered only one event of recirculation pump failure during the field study
period. The failure was related to a coupler between the pump and motor. The system operator
identified the issue based on complaints of no hot water services from building occupants and
fixed the problem very quickly.
The study also tried to identify crossover flows and recirculation pump failures from long‐term
monitoring data provided by EDC Technology Inc. (EDC), who implemented continuous
monitoring of recirculation system in many multifamily buildings. Although many irregular
monitoring results were found, the research team did not possess sufficient information to
discern between system malfunctions and measurements issues. EDC informed the research
team that extensive information on system configurations was needed for system diagnosis.
Since system configuration information was not available to the research team, the study could
not reach definitive conclusions from analyzing historical monitoring data obtained from EDC.
Recirculation System Model
The study developed a recirculation system heat transfer model capable of predicting
recirculation pipe heat loss with different recirculation designs and under different operation
conditions. The model treated the recirculation system as a network of interconnected pipe
sections, reflective of actual recirculation system designs. The study identified that pipe heat
loss can be represented by two fundamental heat transfer modes: pipe with hot water flows
and pipe without hot water flows. Depending on hot water draw schedules and recirculation
pump control schedules, each pipe section can be in one of the two heat transfer modes and,
therefore, have different heat loss characteristics. This unique modeling method avoided the use
of complicated numerical methods, which could not provide clear explanation of the physical
processes. More important, this modeling method can be adapted to simple algorithms to be
implemented in Title 24 compliance software.
For model validation, four recirculation system models were configured based on detailed
recirculation system designs of four on‐site study buildings. Model‐predicted hot water return
temperatures, recirculation system heat loss, and total domestic hot water system natural gas
consumption were compared to measured values from field studies. The validation results
showed a close match between model prediction and field measurement, indicating the model
could actually predict recirculation system performance.
Performance of Recirculation System Controls
The study evaluated performance of three recirculation control technologies: timer control,
temperature modulation, and demand control. Energy savings potentials from these control
technologies were assessed through field measurement, heat transfer analysis, and model
simulations.
Field measurements in eight full on‐site study buildings provided a large range of energy
savings including negative and zero energy savings, as shown in Table 1. These savings were
calculated based on comparison to the domestic hot water system without any recirculation
5
system controls. Further investigation revealed that variations in system operation conditions,
especially hot water usages, caused the large uncertainties in energy savings assessment.
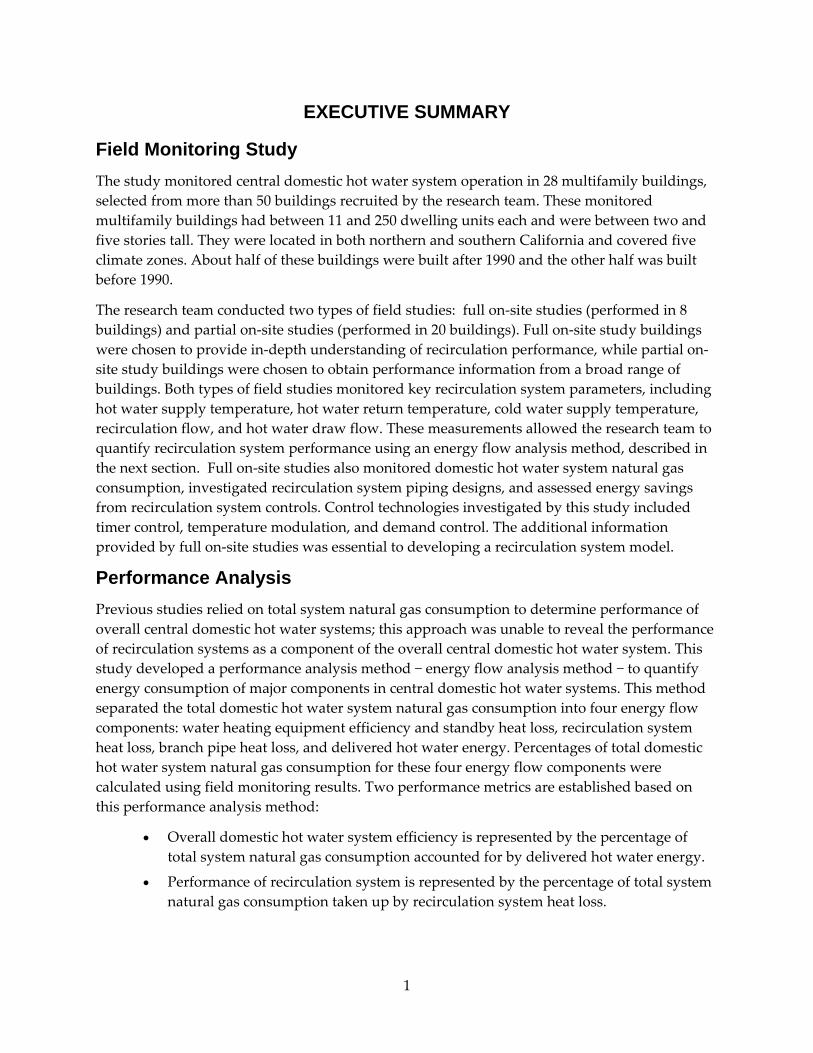
Table 1: Summary of Measured Energy Savings from Control Technologies
Controls Min Max Median
Temperature Modulation -11% 14% 7%
Timer Control -4% 18% 1%
Demand Response 0% 32% 11%
Pipe heat transfer studies revealed how the control technologies saved energy. Fundamentally,
pipe heat loss reduction depends on pipe temperature reduction. Temperature modulation
controls reduce the temperature of the whole recirculation system. The amount of pipe
temperature reduction is moderate and is for several hours a day, depending on detailed
control settings. Timer controls allow recirculation pipes, especially hot water return pipes, to
cool down substantially. Hot water draw flows, if existent, would prevent hot water supply
pipes from cooling down so that heat loss reduction in hot water supply pipes can be much less
and depends on hot water draw schedules. Timer controls are also usually active for several
hours a day, depending on control schedule settings. Demand controls have the same effects on
pipe temperature reduction as timer controls, since both technologies control recirculation
pump operation. However, demand controls turn off recirculation pumps much more often
than timer controls and, therefore, lead to higher heat loss reduction.
The study further used the validated recirculation models for four full on‐site study buildings
to assess energy savings from controls. Modeling studies have the advantages to keep system
operation conditions, such as hot water draw schedules, cold water supply temperatures, and
ambient temperatures, the same with and without recirculation controls, so that changes in
domestic hot water system natural gas consumption reflect only energy savings from controls.
Results of the modeling study showed that energy savings from controls strongly correlate to
recirculation system performance as omdocated om Table 2. Buildings with higher recirculation
system heat losses benefited more from controls than those with lower recirculation system heat
losses. Since field studies revealed a wide range of recirculation system performance, energy
savings from control in these building were expected to vary accordingly.
Table 2: Energy Savings from Control Technologies in Four Buildings Based on Modeling Study
A-SAM B-SFD C-SFH D-SFF
Temp Modulation 2.0% 1.4% 0.9% 0.5%
Timer Control 5.4% 3.4% 1.8% 0.5%
Demand Control 14.3% 6.9% 4.5% 1.0%
Recirculation System Heat Loss 42% 34% 18% 7%
6
Conclusions
Key observations and findings from the research project include:
Water heater/boiler efficiency is still the most important component to system efficiency‐
Proper system sizing will help reduce standby and short‐cycling losses
Distribution system design is important especially placing the recirculation loop through
the middle of the building (this is the same concept as placing water heater near fixture)
Control and monitoring is important and even a simple temperature indicator on the hot
water return can be very useful
The key to energy savings is to reduce recirculation loop temperatures as much as
possible since the return portion of the recirculation loop does not need to be warm
Pipe insulation can keep recirculation loop warm for an extended period
Hot water draws will help sustain recirculation loop temperatures
Recirculation controls were not widely used and those that were in use were not
configured properly.
Next Steps
While recirculation system controls can help to reduce pipe heat loss, enhancing recirculation
system designs is more important because it ensures the domestic hot water system will have
small heat loss from the onset of equipment operation. This study, for the first time, began to
investigate recirculation system designs in central domestic hot water systems and developed a
model to predict recirculation system performance based on recirculation system designs. From
the point of view of overall distribution system performance, there is a tradeoff between
recirculation system design and branch pipe design since heat loss from the two cannot be
minimized at the same time. Additional research is needed to address branch pipe performance
so that overall system improvement can be performed.
This study provided a better understanding of energy savings mechanisms of control
technologies. Further studies should be conducted to help improve existing control technologies
and demonstrate new control technologies, based on the findings from this study.
Benefits to California
Residential hot water systems use approximately 44 percent of residential natural gas use in
California. In California, approximately one third of households reside in multifamily
buildings and there are 2.4 million multifamily units according to the Multifamily
Subcommittee of the California Home Energy Retrofit Coordinating Committee
(www.builditgreen.org/_files/Admin/HERCC/MF_HERCC_report_10152010.pdf). Thus, identifying
ways to make hot water systems more efficient can save California residents a significant
amount of energy and water.
For existing multifamily buildings, the benefits of improved hot water systems include
monetary savings, reduced energy usage, reduced water use, and reduced greenhouse gas

7
emissions due to energy savings and the embedded energy in water. As indicated in this report,
recirculation system heat loss can range between 7% and 42%, with an average 33%. This means
that on average 33% of the energy used to heat water is lost through the piping systems.
Identifying effective control technologies and strategies can reduce this energy loss. For
instance, installing a temperature indicator on hot water return piping and reducing the
recirculation loop temperatures can lead to savings. Understanding that the return portion of
the recirculation loop does not need to be kept warm and that pipe insulation can keep
recirculation loop warm for extended periods will further result in reduced costs and energy
use.
In addition to the savings mentioned previously, for planned multifamily buildings, additional
savings can be realized through proper system design, sizing and the location of the
distribution system. By placing the recirculation loop in the middle of the building (this is the
same concept as placing a water heater near a fixture) both natural gas and water usage can be
minimized.

9
CHAPTER 1: Introduction
This report presents findings from the study on central domestic hot water (DHW) systems in
multifamily buildings. The study was conducted by the Heschong Mahone Group (HMG) and
was funded by the California Energy Commission (Energy Commission) through the Public
Interest Energy Research (PIER) program.
Multifamily buildings, especially large buildings with many dwelling units, usually use a
central DHW system to provide hot water to each dwelling unit. Such systems have centrally
located water heating equipment and use recirculation systems to distribute hot water to
individual dwelling units. Recirculation systems usually consist of long recirculation pipes with
hot water circulating inside, even when there is no hot water draw in the building. As a result,
recirculation systems in multi‐family buildings incur a large amount of pipe heat loss and
reduce overall DHW system efficiency. Several control technologies have been promoted by
industry practitioners to improve the efficiency of DHW systems with recirculation systems.
A previous PIER study on multi‐family central DHW system [HMG 2008] (hereafter referred to
as the 2008 PIER study) tried to assess energy savings from these control technologies. The 2008
PIER study monitored recirculation systems in three multi‐family buildings and provided
preliminary assessment of energy savings from control technologies. The study identified
factors that affected control technology performance and recommended that further
investigation of central DHW systems be performed to provide better assessment of control
technology savings.
This study was a continuation of the 2008 PIER study on central DHW systems in multi‐family
buildings. It aimed to provide thorough understanding of recirculation system operation and
control technology performance. The study included three major components:
1. Conducting field monitoring in a broad range of multi‐family buildings to collect
performance data of central DHW systems
2. Performing in‐depth analysis to characterize performance of central DHW systems
3. Developing a recirculation system model to facilitate performance assessment of
systems with different designs and control technologies
This chapter provides basic information on central DHW system designs and controls and the
overall research goals and objectives.

10
1.1 Multifamily Central DHW Systems
Figure 2 illustrates a central DHW system in a multifamily building, and Figure 3 presents the
schematics of central DHW system configuration. In general, a central DHW system consists of:
Central water heating equipment and a recirculation system. Common types of water
heating equipment used in multi‐family central DHW systems include the following:
One or multiple commercial gas storage water heaters
One or two hot water heating boilers coupled with a large storage tank
The following three types of water heating equipment were also observed, but they were less
common:
A storage tank heated by steam from a central plant (at a university campus)
Solar water heater with gas water heater/boiler as backup (three buildings)
Tankless water heater connected to recirculation system (one building)
Figure 2: Illustration of a Central DHW System in a Multi-Family Building
11
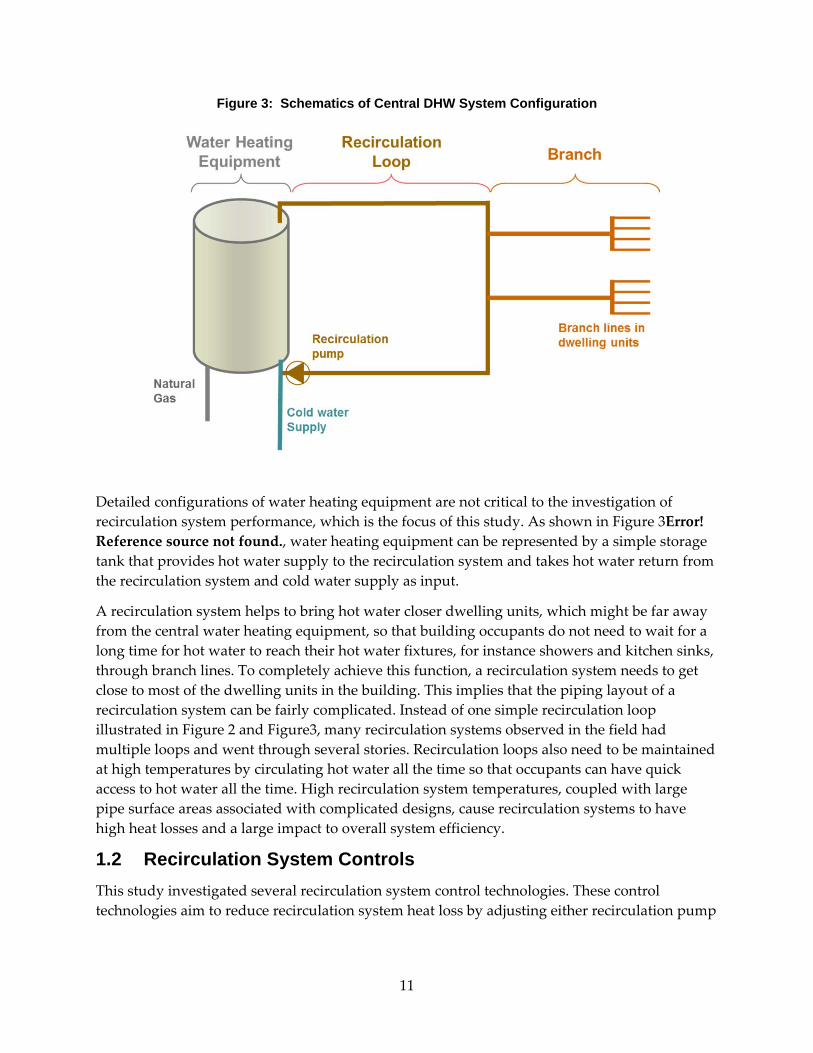
Figure 3: Schematics of Central DHW System Configuration
Detailed configurations of water heating equipment are not critical to the investigation of
recirculation system performance, which is the focus of this study. As shown in Figure 3Error!
Reference source not found., water heating equipment can be represented by a simple storage
tank that provides hot water supply to the recirculation system and takes hot water return from
the recirculation system and cold water supply as input.
A recirculation system helps to bring hot water closer dwelling units, which might be far away
from the central water heating equipment, so that building occupants do not need to wait for a
long time for hot water to reach their hot water fixtures, for instance showers and kitchen sinks,
through branch lines. To completely achieve this function, a recirculation system needs to get
close to most of the dwelling units in the building. This implies that the piping layout of a
recirculation system can be fairly complicated. Instead of one simple recirculation loop
illustrated in Figure 2 and Figure3, many recirculation systems observed in the field had
multiple loops and went through several stories. Recirculation loops also need to be maintained
at high temperatures by circulating hot water all the time so that occupants can have quick
access to hot water all the time. High recirculation system temperatures, coupled with large
pipe surface areas associated with complicated designs, cause recirculation systems to have
high heat losses and a large impact to overall system efficiency.
1.2 Recirculation System Controls
This study investigated several recirculation system control technologies. These control
technologies aim to reduce recirculation system heat loss by adjusting either recirculation pump
12
operations or hot water supply temperatures based on building hot water usage schedules. The
following section describes the basic operation principles of these control technologies.
1.2.1 Timer Control
A timer control (or time clock control) automatically turns off the recirculation pump according
to a fixed schedule set by the system operator. The common practice is to turn off the
recirculation pump when a building is expected to have no hot water draws. The intention is to
avoid having cold water in the recirculation loop when there are hot water draws. Since the
same control schedule is used every day, this control is believed to be applicable to buildings
with consistent window periods every day when there is no hot water draw.
The schedule of a timer control depends on building hot water usage schedules, which, in turn,
depends on building occupant behaviors. It is generally expected that multifamily buildings
have little to no hot water demand for some period during the night, so that the recirculation
pump can be scheduled to be turned off by a timer control. For this reason, the timer control
was specified in 2005 Title 24 Part 6 as the minimum control requirement for multifamily DHW
systems. A building could have other times, when there is no hot water draw and the
recirculation pump can be turned off, for instance during the time after morning peak hours
and before lunch cooking time and/or the time after the lunch and before the evening cooking
time. Ideally, timer control schedules should be carefully set by DHW system operators with
observations of hot water demand patterns.
1.2.2 Temperature Modulation
A temperature modulation control reduces hot water supply (HWS) temperatures when the hot
water demand is expected to be zero or very low. Recirculation pump operation is not affected
and is kept on all the time.
There are two types of temperature modulation controls available in the market; one uses fixed
control schedules and the other uses dynamic control schedules. For the one with fixed control
schedules, the control schedule is determined in similar way as that of a timer control. Since the
recirculation pump is not turned off, there is no concern for introducing cold water in the
recirculation system. The control would work when there are low levels of hot water draws. A
temperature modulation control with dynamic control schedules is designed to automatically
set control schedule by detecting and learning hot water usage patterns. Control schedules may
be automatically adjusted based on changes in hot water usage patterns. Potentially,
temperature modulation control with a dynamic control schedule can more accurately reflect
building hot water draw schedules and capture more times to reduce HWS temperatures.
Temperature modulation controls also need to determine the amount of HWS temperature
reduction during zero or low hot water demands. Large reductions in HWS temperature help to
reduce more pipe heat loss. However, by keeping HWS temperature too low, the system
thermal storage might be too low to meet any unexpected demand and the lukewarm water
temperature may not be able to satisfy hot water service needs of building occupants.
13
1.2.3 Demand Control
Demand controls change recirculation pump operation based on hot water demand. The
recirculation pump is turned off when there is no hot water draws. It is turned on when hot
water draws are detected by a flow sensor installed on the cold water supply (CWS) pipe. Some
industry practitioners suggested that demand control systems need to use a powerful
recirculation pump to bring hot water to occupants quickly, when hot water draws were
detected and the recirculation pump was turned on.
Advanced demand control technologies also incorporate measurement of hot water return
(HWR) temperature to determine recirculation pump operation in conjunction with hot water
demands. The recirculation pump is kept off as long as the HWR temperature is above an upper
threshold value, even when hot water draws are detected. The recirculation pump is turned on
if the HWR temperature is below a lower threshold value to prevent the water temperatures in
the recirculation system from becoming too low.
1.2.4 Continuous Monitoring
A continuous monitoring system installed in a recirculation system measures key system
operation parameters. It may automatically identify system operation issues and alert system
operators. If system operators take actions accordingly to correct reported problems, the system
can be maintained to operate under expected conditions. Energy savings could be generated if
the reported issues and corresponding correction actions prevent system performance
degradation. Continuous monitoring itself is not a control technology. However, it has been
integrated with other control technologies, for instance temperature modulation.
The research team collaborated with EDC Technology Inc. (EDC), a company that provides
continuous monitoring equipment and services, to evaluate the benefits of continuous
monitoring.
1.3 Previous Studies
Several studies have been conducted to assess energy savings from recirculation system
controls. Bohac et.al. [Bohac 1992] assessed energy savings and cost effectiveness of several
control technologies based on field studies at three multi‐family buildings (all had about 40
dwelling units each) in Minnesota. Their study found that temperature modulation controls
(referred to as the AQUASTAT in the study) was “worthwhile” and demand controls achieved
more energy savings than timer controls. Heschong Mahone Group (HMG) conducted the 2008
PIER study [HMG 2008], which assessed performance of control technologies at three multi‐
family buildings in California. The study observed large variations of energy savings from
controls, and some buildings even showed negative energy savings from certain controls. In
addition, the study pointed out that crossover flows might exist in recirculation systems, which
could lead to additional system energy losses. The Itron evaluation study [Itron 2006] of
California utility multi‐family boiler control programs concluded that energy savings from
temperature modulation controls were lower than what were claimed by utility incentive
programs and that energy savings varied substantially from building to building. A follow‐up
study by KEMA [KEMA 2008] suggested that demand control was more suitable for buildings

14
with 3‐40 dwelling units and temperature modulation was more suitable for larger buildings. In
summary, previous studies were not able to reach definitive conclusions on energy savings of
recirculation control technologies.
1.4 Research Goals and Objectives
The goal of this project is to gain a better understanding of performance of recirculation systems
in multi‐family central DHW systems. Such knowledge may be used by industry practitioners
to improve design practices and control technologies and by the Energy Commission to
improve building energy codes for central DHW systems.
The objectives of this study are to:
Characterize DWH recirculation system designs and operational parameters in multi‐
family buildings.
Assess pipe heat loss of recirculation systems and the impact of recirculation system
performance on overall DHW system efficiency.
Evaluate energy savings potentials of control technologies and investigate the factors
affecting performance of control technologies.
Investigate the existence of crossover flows and their impact on DHW system efficiency.
Evaluate the benefits of continuous monitoring of recirculation systems and identify
common failure modes of central DHW systems.
Develop a recirculation system model to predict performance of DHW recirculation
systems and potential energy savings from control technologies.
Inform the development of California building energy code (Title 24 Part 6) and utility
energy efficiency programs.
The following research activities were carried out to achieve the above project objectives:
Conducted two types of field monitoring studies:
o Full on‐site studies were performed at eight (8) multi‐family buildings to collect
detailed performance data of recirculation systems under different controls. In‐depth
performance analysis was conducted to provide comprehensive understandings of
recirculation system performance.
o Partial on‐site studies were conducted at twenty (20) multi‐family buildings. These
studies involved less detailed monitoring and analysis. They provided more
building samples and performance data to help characterize recirculation system
designs and performance.
Developed an energy flow analysis method to quantify heat loss components in central
DHW systems and characterized recirculation system performance by comparing
recirculation system heat loss to total system energy consumption.

15
Analyzed hot water draw patterns collected from field studies to assess the applicability
of control technologies.
Investigated common design practices for recirculation system designs
Compared central DHW system energy consumption under different recirculation
system controls
Analyzed historical monitoring data provided by EDC to understand long‐term DHW
system performance from a broad range of multi‐family buildings and to assess the
benefits of continuous system monitoring.
Performed in‐depth pipe heat transfer analysis to identify key modes of recirculation
operation and revealed energy savings mechanisms of control technologies.
Developed a recirculation system heat transfer model and validated the model using
recirculation designs and performance data collected from four full on‐site study
buildings.
16
CHAPTER 2: Research Plan This chapter discusses the research plans for the three major tasks of the study: field
monitoring, performance analysis, and recirculation system model development. Research
plans for each of the three tasks were developed to ensure research results from each task could
be used to support the other two tasks. For example, the field monitoring plan needed to ensure
that enough process data and system design information were obtained to support performance
analysis and model development. The method for performance analysis needed to be based on
field measurement data and to provide in‐depth information to support model development.
Development of the recirculation system model needed to ensure that the model could be
validated by field study results. As the methodologies for performance analysis and the
recirculation model were refined, the field monitoring plan was adjusted accordingly.
2.1 Field Monitoring Study
2.1.1 Field Monitoring Plan
The study conducted the following two types of field monitoring studies:
Full on-site studies aimed to provide detailed recirculation system operation data and
design information to support in‐depth understandings of recirculation system
performance. These field studies monitored central DHW system operation under
different recirculation controls to assess their associated energy savings. Detailed
information on recirculation system piping designs was collected to facilitate the
development of a recirculation system model. The study planned to conduct full on‐site
studies in nine (9) multi‐family buildings.
Partial on‐site studies aimed to obtain recirculation system performance from a broad
range of buildings with different size, vintage, geographic location, and occupancy type.
These monitoring studies only investigated recirculation system performance under the
existing conditions without changing recirculation controls. The study planned to
conduct partial on‐site studies in 24 multi‐family buildings.
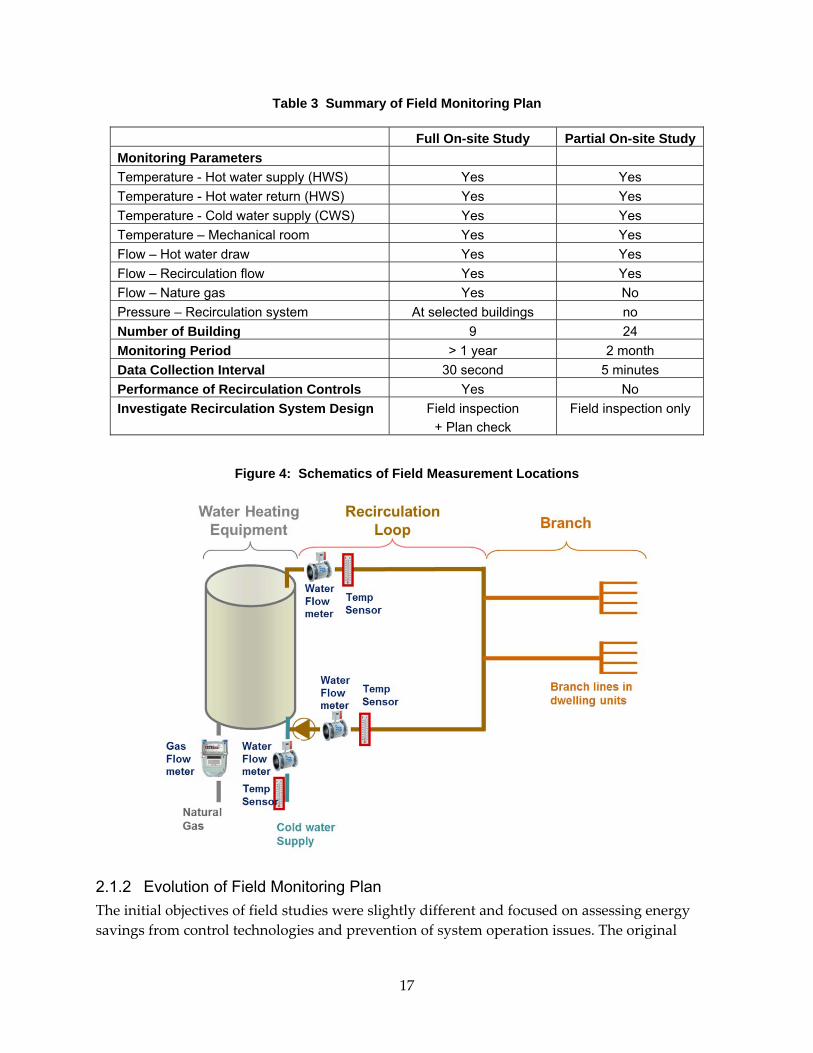
Table 3 summarizes the monitoring plan for both full and partial on‐site field studies. Figure 4
presents a schematic of the process parameters measured by the full and partial on‐site studies.
17
Table 3 Summary of Field Monitoring Plan
Full On-site Study Partial On-site Study
Monitoring Parameters
Temperature - Hot water supply (HWS) Yes Yes
Temperature - Hot water return (HWS) Yes Yes
Temperature - Cold water supply (CWS) Yes Yes
Temperature – Mechanical room Yes Yes
Flow – Hot water draw Yes Yes
Flow – Recirculation flow Yes Yes
Flow – Nature gas Yes No
Pressure – Recirculation system At selected buildings no
Number of Building 9 24
Monitoring Period > 1 year 2 month
Data Collection Interval 30 second 5 minutes
Performance of Recirculation Controls Yes No
Investigate Recirculation System Design Field inspection
+ Plan check
Field inspection only
Figure 4: Schematics of Field Measurement Locations
2.1.2 Evolution of Field Monitoring Plan
The initial objectives of field studies were slightly different and focused on assessing energy
savings from control technologies and prevention of system operation issues. The original
18
approach was to measure energy savings from buildings with different characteristics, such as
size, geographic location, and occupancy type, and to perform regression analysis to seek for
patterns of energy savings. In the initial field monitoring plan, full on‐site studies were
designed to measure energy savings from the three control technologies, installation of check
valves on CWS pipes to prevent crossover flows, and installation of air release values to prevent
pump failure. Partial on‐site studies were originally designed to assess long‐term energy
savings from recirculation controls that had already been installed. Partial on‐site studies were
also planned to test the capability of using limited process monitoring to identify system
operation issues.
Findings from several preliminary research efforts indicated that some of the initial research
approaches were not feasible and required modification. The preliminary research efforts
included the implementation of a full on‐site study, surveys of recirculation system designs,
preliminary heat transfer analysis for model development, and analysis of historical continuous
monitoring data provided by EDC. The following sections provide detailed discussions of
identified issues related to the initial field monitoring plan. These issues and the proposed
revisions to the research plan were discussed during the Project Advisory Committee (PAC)
meeting on November 21, 2008. The field monitoring plan presented in the previous section
reflected the revised research plan.
2.1.2.1 Assess Energy Savings from Controls
Preliminary research identified the following issues related to the approach of using regression
analysis to assess energy savings from controls.
Recirculation system heat loss strongly depends on recirculation system designs.
Therefore, energy savings from recirculation controls depend on recirculation system
designs. Similar buildings in terms of size, geographic location, and occupancy type can
have completely different recirculation system designs. Therefore, there was not enough
known about recirculation system designs to characterize recirculation system designs
for regression analysis.
Energy savings from controls depend on hot water draw schedules, especially the
windows with zero hot water draw. Hot water draw schedules could not be adequately
generalized by building characteristics and occupant types.
Control settings for timer control and temperature modulation can vary, depending on
system operators.
In summary, preliminary research found that energy savings from controls would be affected
by factors not included in the initial research plan. These factors are very difficult, if not
impossible, to characterize to support a regression type analysis of energy savings from
controls. Even if these factors could be characterized, a much larger building sample size than
initially planned would be needed to capture most possibilities for regression analysis. More
importantly, results from a regression analysis would not be able to inform the market on how
to improve recirculation designs and to improve control technologies.

19
Results from preliminary field studies also indicated the DHW system natural gas
consumptions were affected by large day‐to‐day hot water draw variations to cause large
uncertainties in energy savings assessment. Energy savings from controls may not be accurately
obtained simply based on field measurement of DHW system energy consumption.
With the above considerations, the revised field monitoring plan focused on providing
information to support performance analysis and model development, which would provide in‐
depth understandings of recirculation system operations and energy savings mechanisms of
control technologies.
2.1.2.2 Assess Energy Savings from Crossover Flows Prevention
The 2008 PIER study [HMG 2008] indicated that there could be three types of crossover flows
existing in a recirculation system. They included:
1. Crossover flows from a HWR pipe to the connected CWS pipe
2. Crossover flows from storage tanks or CWS pipe into the connected HWR pipe
3. Crossover flows, in a hot water fixture, from the hot water pipe into the cold water pipe
through the leaking mixing valve
It was proposed that the first two types of crossover flows could be prevented by installing a
check valve on affected CWS and HWR pipes. The initial monitored plan for full on‐site studies
planned to measure the energy savings from the installation of check valves. The initial field
monitoring plan did not intend to investigate the third crossover flow.
Preliminary field studies provided the following findings:
No obvious signs of crossover flows were found in monitored buildings. Therefore,
there was no need to install check valves and measure energy savings.
All central DHW systems in surveyed multi‐family buildings were equipped with a
check valve on the CWS pipe following plumbing code requirements. Therefore,
installing check value on CWS pipes was already a common practice and crossover
flows in CWS pipe should not exist or at least be very small.
Crossover flows in HWR pipes should only happen when recirculation pumps are
turned off. None of the building survey had any recirculation pump control prior to the
study. Therefore, the chances for crossover flow in HWR pipes were very small.
Crossover flows into HWR pipe have very small or zero impact on system energy
consumptions. If hot water flows from storage tanks into a HWR pipe, it would
eventually be delivered to hot water fixtures or be sent back to the storage tanks. If cold
water flows into a HWR pipe, it would displace the hot water, which will be delivered
as hot water draws. If cold water does reach fixtures through HWR pipes, it will cause
occupants’ unsatisfactory, but not cause any direct loss of hot water. In addition, a HWR
pipe filled with cold water has no pipe heat loss.
Based on the above findings, the field monitoring plan was revised to investigate the existence
of crossover flow, instead of measuring energy savings from the prevention measure of
installing check valves.
20
2.1.2.3 Assess Energy Savings from Pump Failure Prevention
According to some industry practitioners [HMG 2008], many system operators would increase
HWS temperature as a way to deal with hot water service issues. Recirculation pump failure
was identified as a major operation issue for central DHW systems. Furthermore, the 2008 Title
24, Codes and Standards Enhancement (CASE) study on multi‐family DHW system [HMG
2007] indicated that pump failures were often caused by propeller vane cavitation caused by
trapped air bubbles in recirculation flows. Based on this information, the initial field monitoring
plan intended to assess energy savings from installation of air release valves in recirculation
systems.
Air release valves need to be installed at the highest point of the recirculation system to release
trapped air bubbles. This is often not feasible because the highest recirculation pipes are not
accessible in many existing buildings. In most buildings, hot water fixtures located at a higher
altitude than the recirculation loop can effectively serve the same function as air release valves.
Installing an air release valve may not be necessary at all.
Preliminary field studies did not observe any recirculation pump failures. It is highly uncertain
if any pump failure event would be captured by the field studies. In addition, pump failures
only impact system efficiency if they are not identified by system operators and lead to HWS
temperature increase. The combined probability of all these events seemed to be very small.
For all above reasons, we did not anticipate to observe any energy savings from installation of
air release valves. The revised field monitoring plan intended to merely assess the frequencies
of pump failures from monitored buildings.
2.1.2.4 Identify System Operation Issues
Field studies planned to identify possible system operation issues during the course of system
performance monitoring. The associated findings can be useful to the evaluation of benefits of
continuous monitoring.
2.2 Performance Analysis
2.2.1 Energy Flow Analysis
Total DHW system natural gas consumptions are affected by several factors, including
efficiency of water heating equipment, recirculation system heat loss, and branch pipe heat loss.
In order to characterize recirculation system performance, field study data analysis needs to
further quantify recirculation system heat loss and calculate it as a percentage of the total DHW
system natural gas consumption. The research team developed the energy flow analysis method
to achieve this goal by quantifying all major energy flow components in a central DHW system.
Error! Reference source not found. illustrates the different energy flow components in a central
DHW system. In particular, thermal energy carried by hot water flows in the recirculation
system is broken into two components. One is thermal energy associated the recirculation flow
and the other is thermal energy associated with hot water draw flows. At the starting point of
the recirculation system, the two energy flow components are labeled as ĖRecirc_Supply and
ĖDraw_Supply, respectively. The sum of these two is the hot water energy provided by the water
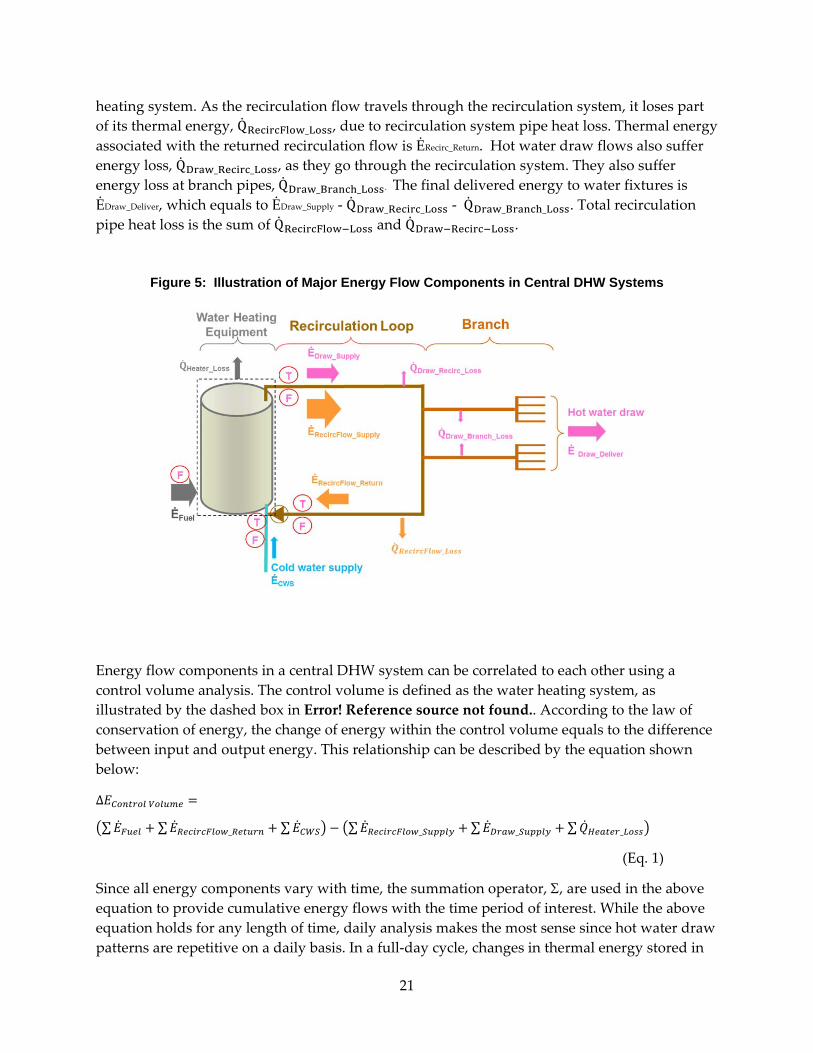
21
heating system. As the recirculation flow travels through the recirculation system, it loses part
of its thermal energy, Q _ , due to recirculation system pipe heat loss. Thermal energy
associated with the returned recirculation flow is ĖRecirc_Return. Hot water draw flows also suffer
energy loss, Q _ _ , as they go through the recirculation system. They also suffer
energy loss at branch pipes,Q _ _ . The final delivered energy to water fixtures is
ĖDraw_Deliver, which equals to ĖDraw_Supply ‐ Q _ _ ‐ Q _ _ . Total recirculation
pipe heat loss is the sum of Q and Q .
Figure 5: Illustration of Major Energy Flow Components in Central DHW Systems
Energy flow components in a central DHW system can be correlated to each other using a
control volume analysis. The control volume is defined as the water heating system, as
illustrated by the dashed box in Error! Reference source not found.. According to the law of
conservation of energy, the change of energy within the control volume equals to the difference
between input and output energy. This relationship can be described by the equation shown
below:
∆
∑ ∑ _ ∑ ∑ _ ∑ _ ∑ _
(Eq. 1)
Since all energy components vary with time, the summation operator, , are used in the above equation to provide cumulative energy flows with the time period of interest. While the above
equation holds for any length of time, daily analysis makes the most sense since hot water draw
patterns are repetitive on a daily basis. In a full‐day cycle, changes in thermal energy stored in
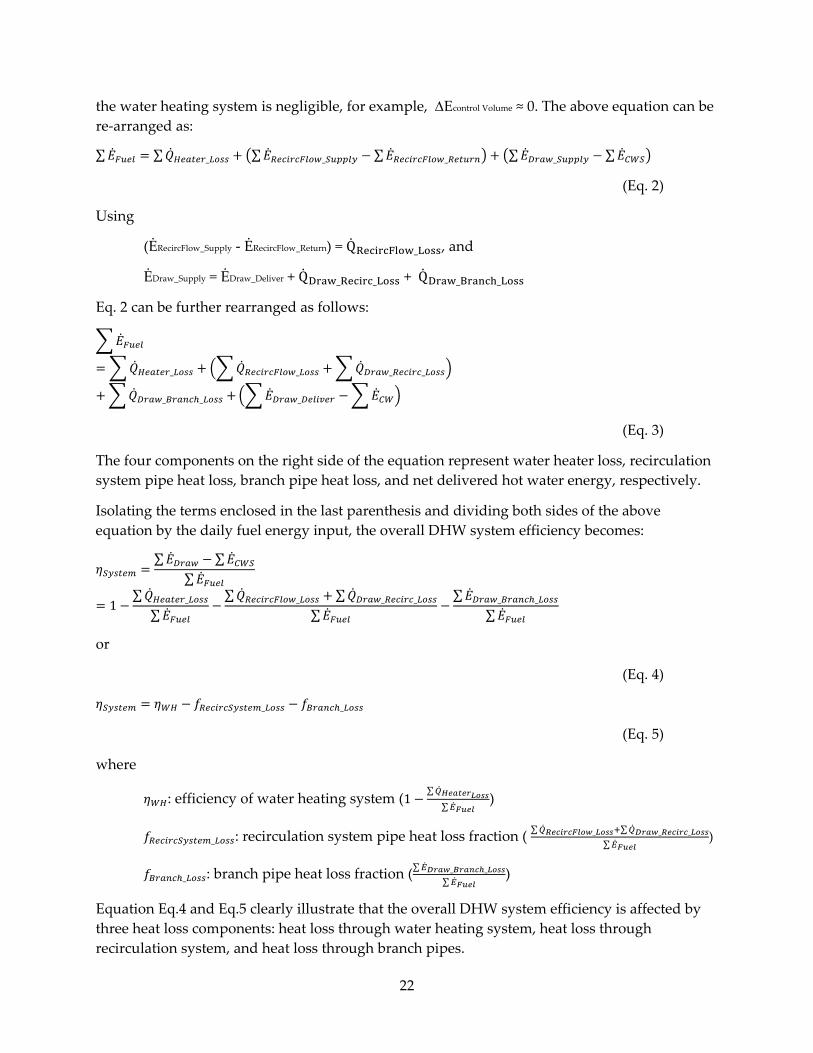
22
the water heating system is negligible, for example, Econtrol Volume ≈ 0. The above equation can be
re‐arranged as:
∑ ∑ _ ∑ _ ∑ _ ∑ _ ∑
(Eq. 2)
Using
(ĖRecircFlow_Supply ‐ ĖRecircFlow_Return) = Q _ , and
ĖDraw_Supply = ĖDraw_Deliver + Q _ _ + Q _ _
Eq. 2 can be further rearranged as follows:
_ _ _ _
_ _ _
(Eq. 3)
The four components on the right side of the equation represent water heater loss, recirculation
system pipe heat loss, branch pipe heat loss, and net delivered hot water energy, respectively.
Isolating the terms enclosed in the last parenthesis and dividing both sides of the above
equation by the daily fuel energy input, the overall DHW system efficiency becomes:
∑ ∑
∑
1∑ _
∑
∑ _ ∑ _ _
∑
∑ _ _
∑
or
(Eq. 4)
_ _
(Eq. 5)
where
: efficiency of water heating system (1∑
∑)
_ : recirculation system pipe heat loss fraction ( ∑ _ ∑ _ _
∑)
_ : branch pipe heat loss fraction (∑ _ _
∑)
Equation Eq.4 and Eq.5 clearly illustrate that the overall DHW system efficiency is affected by
three heat loss components: heat loss through water heating system, heat loss through
recirculation system, and heat loss through branch pipes.

23
It should be noted that all hot water draws were considered to be used by building occupants in
the above analysis. In practice, some hot water draws are wasted during to the following two
reasons:
1. Building occupants may have to clear out the cold water in a branch pipe. More water is
usually damped than the amount of cold water contained in the branch pipe, which
leads to hot water waste.
2. Hot water left in a branch pipe from previous hot water draws cools down to cold water
because there are no immediate hot water draws.
Since the field monitoring study did not intend to address the above two issues, the energy flow
analysis did not include the consideration of heat loss associated with hot water waste.
Therefore, the overall DHW system efficiency calculated according to equation Eq. 5 still
represents an optimistic estimate of DWH system performance. This, however, does not affect
the assessment of recirculation system performance.
In the above energy flow analysis method, recirculation system pipe heat loss is assessed from
heat loss associated with two flow components in the recirculation system, hot water draws and
recirculation flows. It is important to break the total recirculation system heat loss into these
two components, because they provide great insight into energy savings mechanisms of control
technologies.
The energy flow analysis method was developed to analyze field monitoring data. With the
exception of water heater losses, all other energy flow components in equation Eq.3 can be
calculated using field measurement data, as follows:
∙
_ ∙ ∙ ∙ ∆ ∙
_ _ ∙ ∙ ∙ ∆ ∙ _
_ _ ∙ ∙ ∙ ∆ ∙ _ _
_ ∙ ∙ ∙ ∆ ∙ _
where
HVFuel: fuel heat value
VFuel: natural gas volumetric flow rate
fRecirc: recirculation flow rate
: water density
Cp: water heat capacity
t: monitoring time interval
24
fRecirc: recirculation flow rate
fDrawc: hot water draw flow rate
TCWS: cold water supply temperature
THWS: hot water supply temperature
THWR: hot water return temperature
THW_Branch: hot water temperature at the entrance of a branch
THW_Fixture: hot water temperature at a hot water fixture
Field studies did not measure THW_Branch and THW_Fixture and these temperatures were obtained
based on measured temperature drop of recirculation flows and simple pipe heat transfer
analysis. Since hot water travel through part of the recirculation system, THW_Branch should be
between HWS and HWR temperatures, as described by the following equation:
_ ∙
The fraction, f, depends on detailed recirculation system configurations, hot water draw
locations, and flow rates. As a first‐order assumption, it was assumed that, on average, hot
water was drawn from the middle branch. It was also assumed heat loss per unit pipe surface
area was a constant because hot water flow temperatures had small variations. Based on
detailed recirculation system configuration obtained from full on‐site field study buildings, the
average value of fraction f was estimated to be 0.6.
Branch pipes are usually shorter and smaller than recirculation pipes, so branch pipe heat loss is
proportionally smaller than those of recirculation pipes. Based on pipe surface area comparison,
branch pipe heat loss was assumed to be 10 percent of the heat loss in recirculation pipes.
Therefore, THW_Fixture is estimated according to the following equation:
_ _ 10% ∙ _
2.2.2 Historical Monitoring Data Analysis
The study collaborated with EDC on evaluating benefits of continuous monitoring systems.
EDC provided commercial continuous monitoring products and services to multi‐family and
hotel/motel buildings and had cumulated large amount of monitoring data from buildings
using its monitoring services. The study planned to analyze EDC’s monitoring data to
understand what system failure modes could be identified by continuous monitoring
technologies. The study also planned to explore possible computer algorithms to automatically
identify these system failures through monitoring results.
2.3 Recirculation System Model Development
The recirculation system model needed to accurately predict performance of system with
different configurations and under different operational conditions. In addition, the model also
needed to serve the following two purposes:

25
Enhance the understanding of recirculation system operation and energy savings
mechanisms of control technologies
Facilitate the development of performance calculation algorithms to be incorporated into
compliance software for California Building Energy Code (Title 24, Part 6).
The study considered two modeling approaches, regression model and physical model. A
regression model was to be based on correlations between recirculation system performance
and various factors affecting system performance. As explained above, preliminary research
found that these correlations could not be easily established, because some of the factors,
especially recirculation system pipe configurations, could not be easily quantified for
developing correlations. Also, a regression model would provide very limited understandings
of recirculation system operation.
A physical model would be based on heat transfer and mass transfer principles, as well as
inputs of detailed system designs and operational parameters. In dealing with complicated
systems with very dynamic changes of operational conditions, the building science community
often uses finite element based modeling method. Such a method would break the complicated
recirculation system into many small pipe pieces, for instance one‐inch long pipe pieces. Within
each pipe piece, water flow and temperature can be considered to be uniform so that the pipe
piece can be simulated using equations reflecting fundamental physical processes. The model
would simulate physical processes in each piece and the interaction between pieces in small
time intervals, for instance one seconds, and integrate the solutions from all pipe pieces to
obtain the overall system performance. A finite element model essentially provides a
microscopic view of the system. However, it does not provide explicit understandings of system
operation on macroscopic levels.
Further investigation revealed that finite element models required understandings of flow
patterns in recirculation pipes. For example, at low flow rates, shear flows could take place to
cause hot water to travel faster than cold water and to mix with cold water. Convection flows
could form at junctions between recirculation pipe and branch pipes to enhance recirculation
pipe heat loss. These flow patterns are complicated and not well understood. Inappropriate
assumptions of these flow patterns could lead of large simulation errors.
Title 24 performance calculation requires relatively simple algorithms to estimate hourly energy
consumption of a recirculation system. Finite element models are too complicated for
conversion back into simple calculation algorithms to be implemented in Title 24. For the same
reason, this modeling approach requires much more resources than available to the study. For
all above reasons, an alternative method was needed.
After extensive investigation, the study decided to develop a physical model based on
simulation of heat transfer of major pipe sections in recirculation systems. Major pipe sections
were recirculation pipe sections between branch pipes and pipe section having the same
diameter, insulation condition, and locations. Heat transfer of pipe sections can be calculated
using established engineering solutions. By dividing a recirculation system into only several
major sections, the overall model is much simpler than a finite element model. In addition,

26
dynamic changes in system operations are simplified as a sequence of system heat transfer
mode. Recirculation system performance can be easily understood through heat transfer
characteristics of each pipe sections. Such a simple model can be easily converted into Title 24
performance calculation algorithms. Detailed description of the process of Title 24 performance
calculation rule set development is provided in Chapter 50.
The original scope of the research did not include the performance of branch pipes connecting
to a recirculation loop, and field monitoring studies did not monitor performance of branch
pipes. As a result, the recirculation model developed by this PIER study did not cover branch
pipes.
27
CHAPTER 3: Field Monitoring Study
This chapter describes characteristics of multi‐family buildings monitored by the study,
observations of recirculation system operations, and field measurement issues. Results of
quantitative performance analysis are provided in Chapter 4.
3.1 Field Monitoring Buildings
The following criteria were used by the study to select field monitoring buildings:
The building must have a central DHW system using a recirculation system to distribute
hot water. The recirculation system could include one or more recirculation loops. The
study focused on recirculation systems and did not impose any limits on water heating
systems.
The DHW systems were dedicated to DHW services and not for other uses such as
hydronic space heating, adjacent commercial applications, or pool heating. Systems that
served the building’s laundry facility were eligible. Performance of recirculation systems
heavily depended on hot water usage patterns, therefore, inclusion of other hot water
usages would distort the overall research findings.
The recirculation system must be insulated. The study was intended to provide
information to inform further improvements to systems that met the 2005 Title 24 codes
at the least; 2005 Title 24 required recirculation pipes to be insulated. However, field
surveys could only verify that pipes accessible by the research team were insulated.
Straight pipe sections must be available near water heating equipment for any two of the
following three pipes: CWS, HWS, and HWR pipes. Length of straight sections needed
to be as least 25 times of the pipe diameter because adequate straight pipe sections were
essential to accurate measurement of water flows.
The research team recruited field study participants through several different channels, to avoid
any bias that might arise from using only one or two sources. These channels included:
Developers known to HMG through implementation of utility multi‐family building
incentive programs
Building owners known to HMG staff
HMG’s contacts at utilities including SMUD, PG&E, SDG&E, and the Southern
California Gas Company
Members of the Project Advisory Committee for this project
Recirculation system control manufacturers
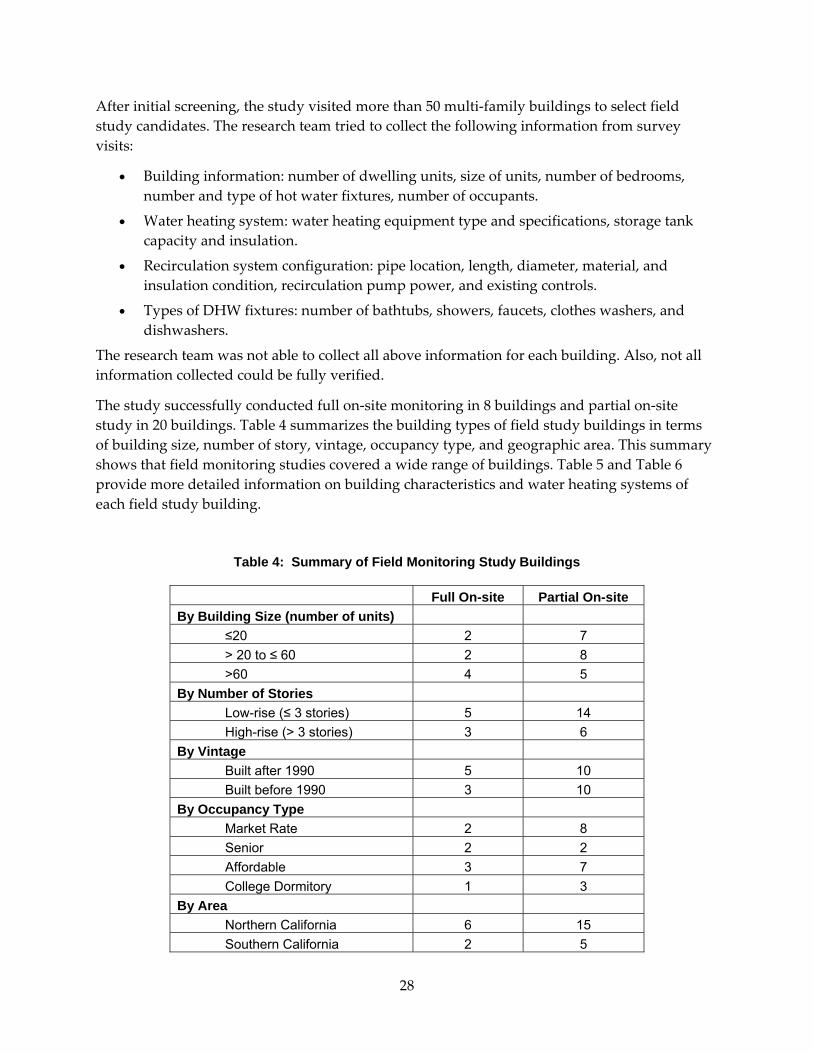
28
After initial screening, the study visited more than 50 multi‐family buildings to select field
study candidates. The research team tried to collect the following information from survey
visits:
Building information: number of dwelling units, size of units, number of bedrooms,
number and type of hot water fixtures, number of occupants.
Water heating system: water heating equipment type and specifications, storage tank
capacity and insulation.
Recirculation system configuration: pipe location, length, diameter, material, and
insulation condition, recirculation pump power, and existing controls.
Types of DHW fixtures: number of bathtubs, showers, faucets, clothes washers, and
dishwashers.
The research team was not able to collect all above information for each building. Also, not all
information collected could be fully verified.
The study successfully conducted full on‐site monitoring in 8 buildings and partial on‐site
study in 20 buildings. Table 4 summarizes the building types of field study buildings in terms
of building size, number of story, vintage, occupancy type, and geographic area. This summary
shows that field monitoring studies covered a wide range of buildings. Table 5 and Table 6
provide more detailed information on building characteristics and water heating systems of
each field study building.
Table 4: Summary of Field Monitoring Study Buildings
Full On-site Partial On-site
By Building Size (number of units)
≤20 2 7
> 20 to ≤ 60 2 8
>60 4 5
By Number of Stories
Low-rise (≤ 3 stories) 5 14
High-rise (> 3 stories) 3 6
By Vintage
Built after 1990 5 10
Built before 1990 3 10
By Occupancy Type
Market Rate 2 8
Senior 2 2
Affordable 3 7
College Dormitory 1 3
By Area
Northern California 6 15
Southern California 2 5
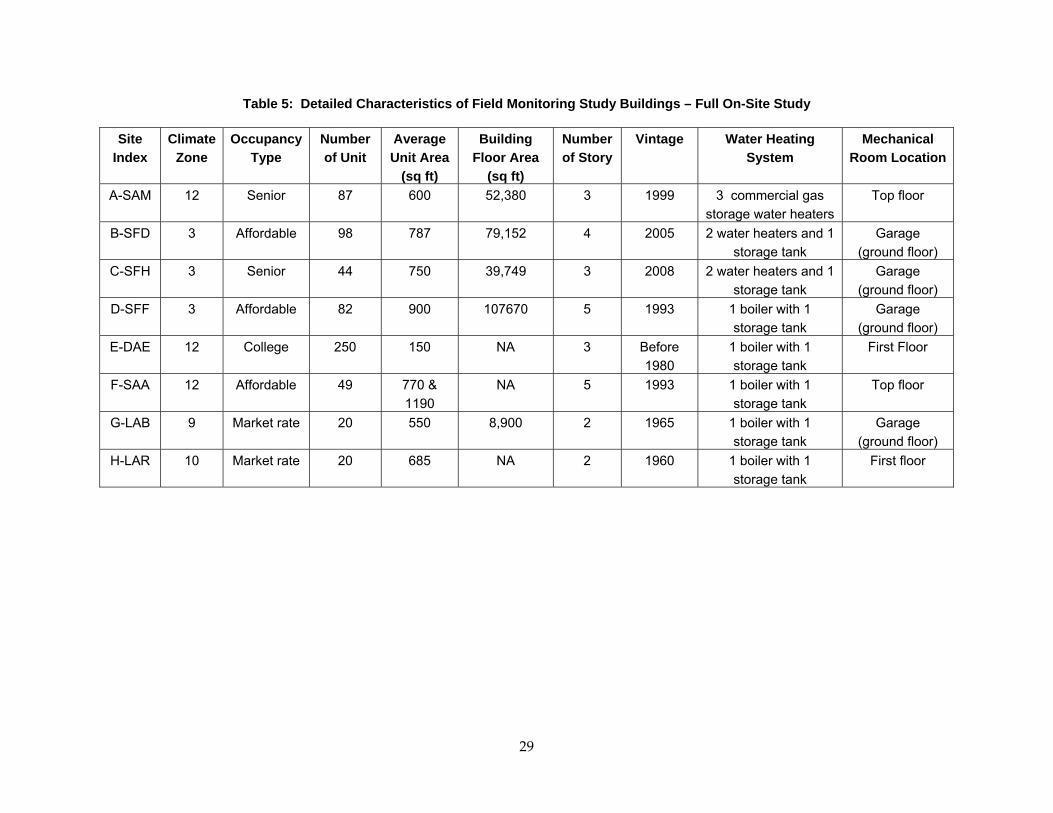
29
Table 5: Detailed Characteristics of Field Monitoring Study Buildings – Full On-Site Study
Site Index
Climate Zone
Occupancy Type
Number of Unit
Average Unit Area
(sq ft)
Building Floor Area
(sq ft)
Number of Story
Vintage Water Heating System
Mechanical Room Location
A-SAM 12 Senior 87 600 52,380 3 1999 3 commercial gas
storage water heaters
Top floor
B-SFD 3 Affordable 98 787 79,152 4 2005 2 water heaters and 1
storage tank
Garage
(ground floor)
C-SFH 3 Senior 44 750 39,749 3 2008 2 water heaters and 1
storage tank
Garage
(ground floor)
D-SFF 3 Affordable 82 900 107670 5 1993 1 boiler with 1
storage tank
Garage
(ground floor)
E-DAE 12 College 250 150 NA 3 Before
1980
1 boiler with 1
storage tank
First Floor
F-SAA 12 Affordable 49 770 &
1190
NA 5 1993 1 boiler with 1
storage tank
Top floor
G-LAB 9 Market rate 20 550 8,900 2 1965 1 boiler with 1
storage tank
Garage
(ground floor)
H-LAR 10 Market rate 20 685 NA 2 1960 1 boiler with 1
storage tank
First floor

30
Table 6: Detailed Characteristics of Field Monitoring Study Buildings – Partial On-Site Study
Site Index
Climate Zone
Occupancy Type
Number of Unit
Average Unit Area
(sq ft)
Building Floor Area ()
Number of Story
Vintage Water Heating System
Mechanical Room
Location
1-SFB 3 Senior 40 712 28480 4 2006 2 commercial gas
storage water heaters
Ground floor
2-BKS 3 Senior 27 475 25,000 4 1999 1 commercial gas
storage water heater
Ground floor
3-BKU 3 Affordable 35 995 34825 3 2005 2 boilers with 1
storage tank
First floor
4-SAP 12 Market rate 11 700 7700 2 1950 2 commercial gas
storage water heaters
Garage
(ground floor)
5-SAC 12 Market rate 16 650 10400 2 1950 1 commercial gas
storage water heater
Garage
(ground floor)
6-DAK 12 College 88 200 ~ 18000 4 2005 Central campus
steam supply to 2 storage tanks
Ground floor
7-DAL 12 College 88 200 ~ 18000 4 2005 Central campus steam supply to 2
storage tanks
Ground floor in the neighboring
building
8-OAL 3 Affordable 22 643 ~ 15000 2 2008 2 boilers with 1 storage tank
In stand-alone structure next to
the building
9-OAL 3 Affordable 28 643 ~ 18000 3 2008 2 boilers with 1
storage tank
Garage
(ground floor)
10-SFF 3 Affordable >60 N/A N/A 5 After 1990 2 boilers with 1
storage tank
Garage
(ground floor)
11-HOB 9 Market rate 20 550 8,900 2 1965 1 boiler with 1
storage tank
Garage
(ground floor)
12-HOB 9 Market rate 12 700 10,000 2 1965 1 boiler with 1
storage tank
First floor (in a
room attached to the building)
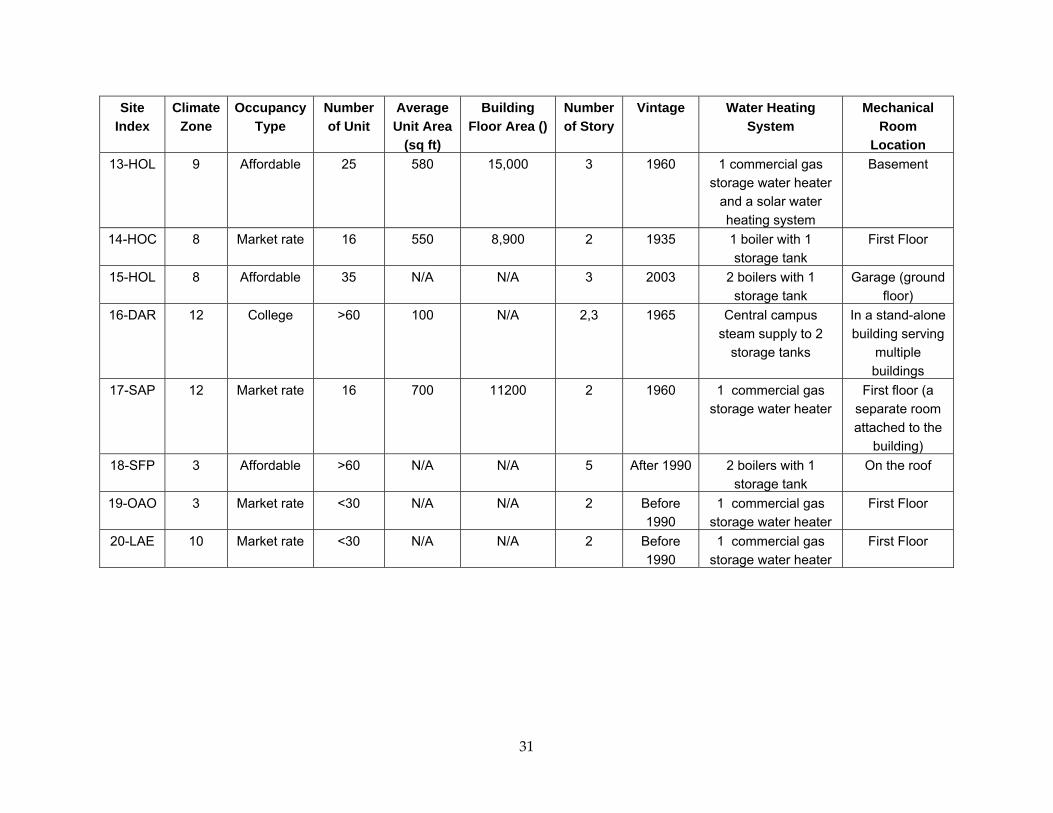
31
Site
Index
Climate
Zone
Occupancy
Type
Number
of Unit
Average
Unit Area (sq ft)
Building
Floor Area ()
Number
of Story
Vintage Water Heating
System
Mechanical
Room Location
13-HOL 9 Affordable 25 580 15,000 3 1960 1 commercial gas storage water heater
and a solar water
heating system
Basement
14-HOC 8 Market rate 16 550 8,900 2 1935 1 boiler with 1
storage tank
First Floor
15-HOL 8 Affordable 35 N/A N/A 3 2003 2 boilers with 1
storage tank
Garage (ground
floor)
16-DAR 12 College >60 100 N/A 2,3 1965 Central campus
steam supply to 2 storage tanks
In a stand-alone
building serving multiple buildings
17-SAP 12 Market rate 16 700 11200 2 1960 1 commercial gas storage water heater
First floor (a separate room
attached to the building)
18-SFP 3 Affordable >60 N/A N/A 5 After 1990 2 boilers with 1 storage tank
On the roof
19-OAO 3 Market rate <30 N/A N/A 2 Before 1990
1 commercial gas storage water heater
First Floor
20-LAE 10 Market rate <30 N/A N/A 2 Before 1990
1 commercial gas storage water heater
First Floor

32
3.2 Observations of Recirculation System Operation
Error! Reference source not found. through Error! Reference source not found. present a
sample of temperature and flow measurements to illustrate daily activities of recirculation
systems without control and under the three types of controls. These four figures are based on
monitoring results from the same full on‐site study building. Recirculation system operations in
other buildings had similar trends, except that hot water draw pattern had large variations
among different buildings. Field monitoring studies provided the following general
observations of operation parameters of recirculation systems in multi‐family buildings.
3.2.1 Hot Water Draw Flow
As expected, hot water draw flows had large fluctuations throughout the day since occupant
hot water demands were not constant. Hot water draws were very low during night time.
However, there was hardly an extended window period when hot water draws stayed at zero.
Even in buildings with small number of dwelling units, there were usually some scattered hot
water draw events during night.
3.2.2 Recirculation Flow
Recirculation flow rates were constant (whenever the pump was on)and were not affected by
variations of hot water draw flows. In this building, system operations during the demand
control and the timer control used a recirculation pump provided by the demand control
manufacturer, while system operations under continuously pumping and temperature
modulation used the existing recirculation pump in the building. Therefore, two different
recirculation flows were obtained. In buildings where the same recirculation pump was used
for all controls, recirculation flows were the same under all controls.
3.2.3 HWS Temperatures
HWS temperatures fluctuated in a narrow range around the set point of the water heating
system. Magnitude of fluctuations was determined by the controls of the water heating system.
Frequency of the fluctuations depended on hot water draws and standby heat loss of the water
heating system. When there were high hot water draws, storage tank temperature dropped
more often so that the burners were turned on more often. As a result, the frequency of HWS
temperature fluctuations was relatively high. In contrast, the frequency of HWS temperature
fluctuations was much lower when there were low or zero hot water draws. The reason was
that storage tank temperatures could be maintained for a long time, since standby loss of water
heating systems were usually small. For the same reason, HWS temperature changed slowly
from the high setting point to the low setting point during temperature modulation controls, as
shown in Error! Reference source not found..
In Error! Reference source not found., HWS temperature dropped below its normal fluctuation
range for some brief time around 11:00AM. The figure also showed high hot water draws
during the same period. The measurement indicated that the heating capacity of the water
heating system was not able to completely keep up with the high demand. However, the drop
of HWS was very moderate.
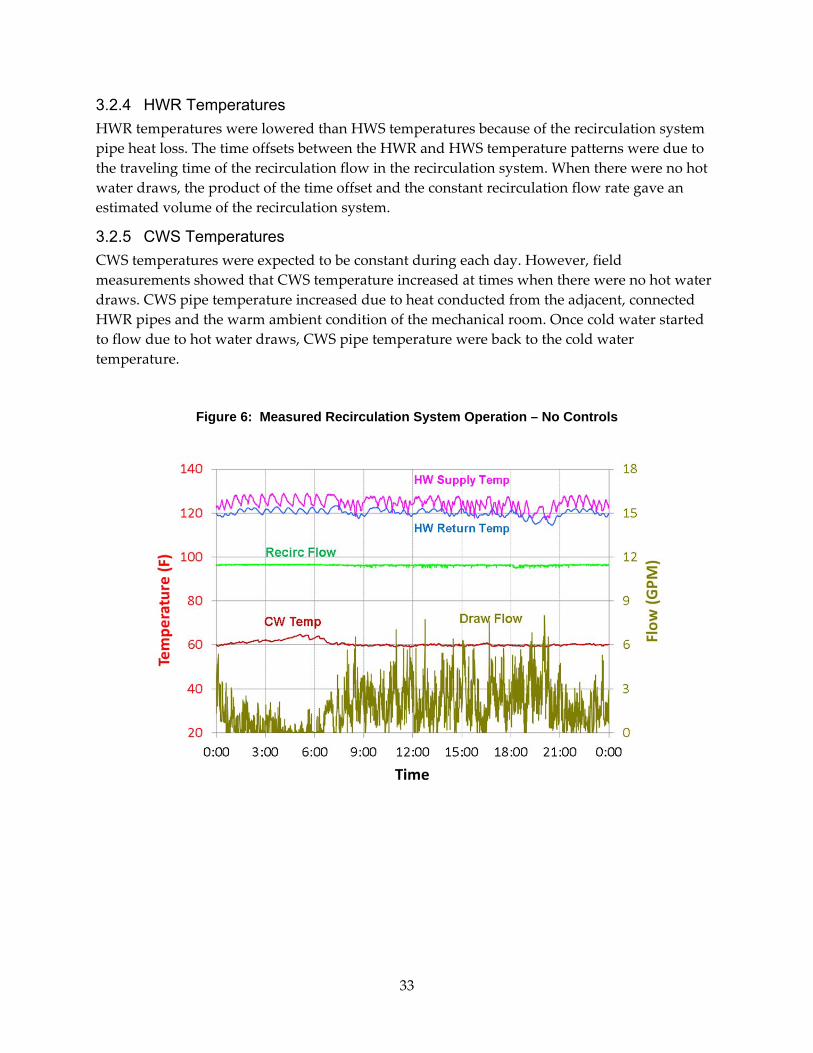
33
3.2.4 HWR Temperatures
HWR temperatures were lowered than HWS temperatures because of the recirculation system
pipe heat loss. The time offsets between the HWR and HWS temperature patterns were due to
the traveling time of the recirculation flow in the recirculation system. When there were no hot
water draws, the product of the time offset and the constant recirculation flow rate gave an
estimated volume of the recirculation system.
3.2.5 CWS Temperatures
CWS temperatures were expected to be constant during each day. However, field
measurements showed that CWS temperature increased at times when there were no hot water
draws. CWS pipe temperature increased due to heat conducted from the adjacent, connected
HWR pipes and the warm ambient condition of the mechanical room. Once cold water started
to flow due to hot water draws, CWS pipe temperature were back to the cold water
temperature.
Figure 6: Measured Recirculation System Operation – No Controls
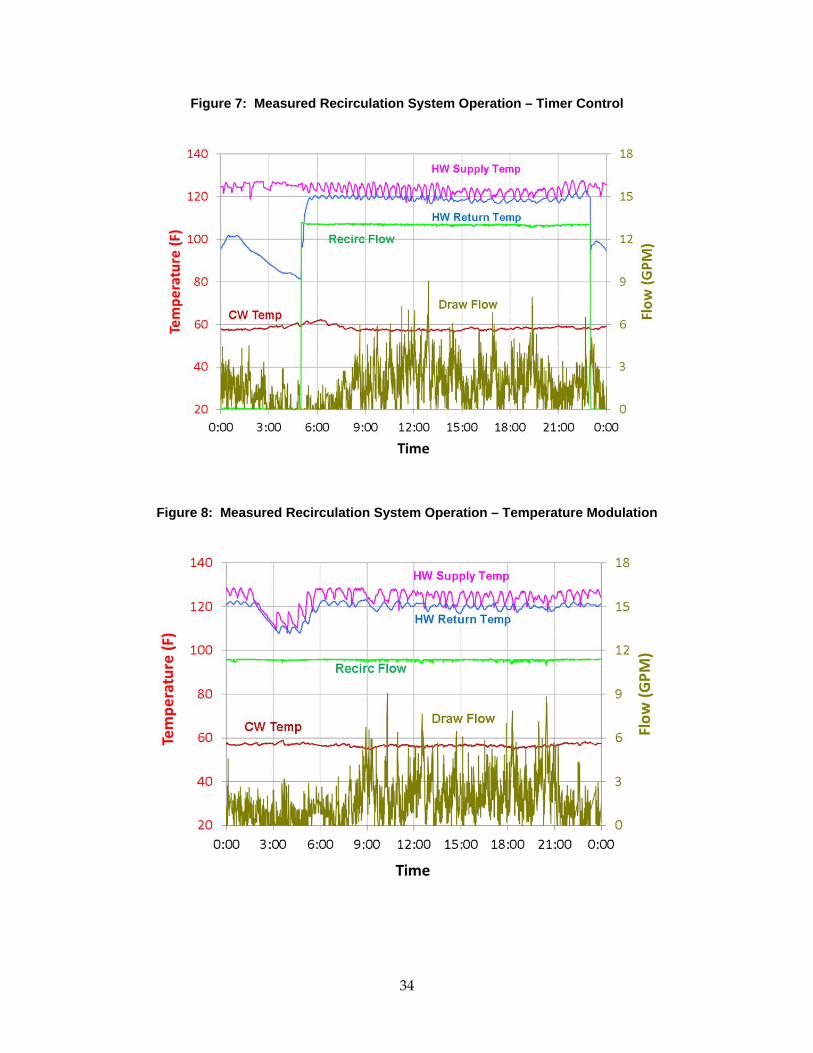
34
Figure 7: Measured Recirculation System Operation – Timer Control
Figure 8: Measured Recirculation System Operation – Temperature Modulation
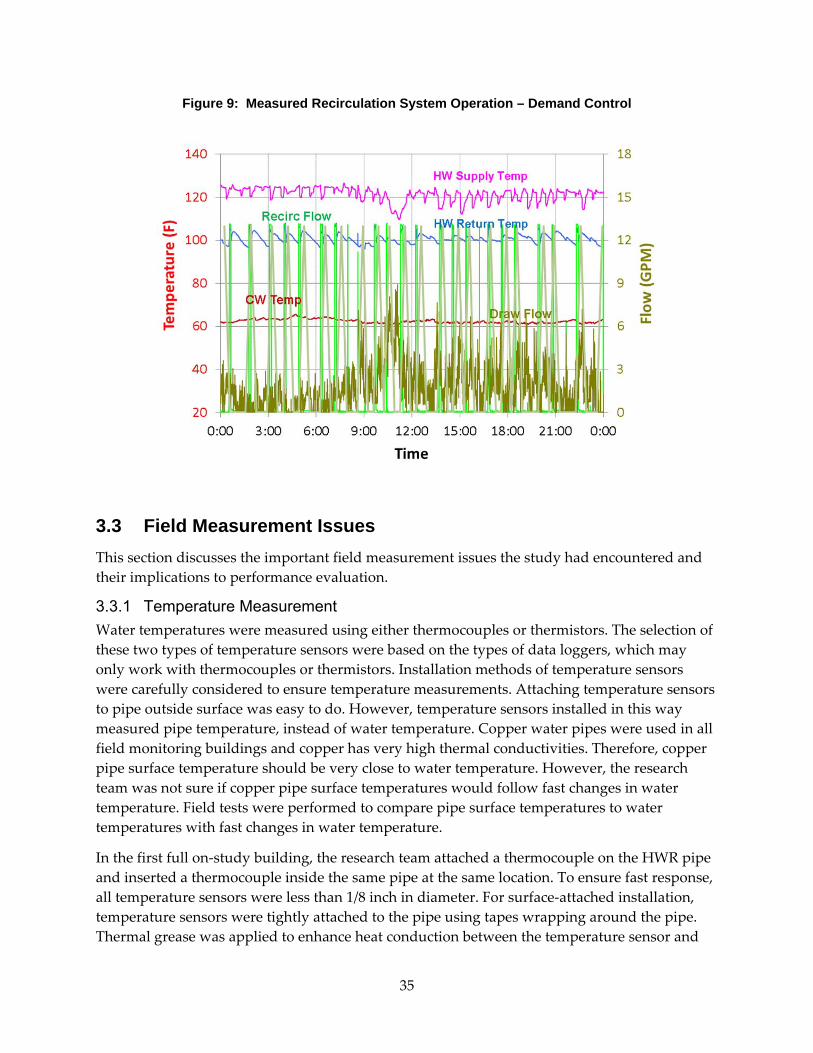
35
Figure 9: Measured Recirculation System Operation – Demand Control
3.3 Field Measurement Issues
This section discusses the important field measurement issues the study had encountered and
their implications to performance evaluation.
3.3.1 Temperature Measurement
Water temperatures were measured using either thermocouples or thermistors. The selection of
these two types of temperature sensors were based on the types of data loggers, which may
only work with thermocouples or thermistors. Installation methods of temperature sensors
were carefully considered to ensure temperature measurements. Attaching temperature sensors
to pipe outside surface was easy to do. However, temperature sensors installed in this way
measured pipe temperature, instead of water temperature. Copper water pipes were used in all
field monitoring buildings and copper has very high thermal conductivities. Therefore, copper
pipe surface temperature should be very close to water temperature. However, the research
team was not sure if copper pipe surface temperatures would follow fast changes in water
temperature. Field tests were performed to compare pipe surface temperatures to water
temperatures with fast changes in water temperature.
In the first full on‐study building, the research team attached a thermocouple on the HWR pipe
and inserted a thermocouple inside the same pipe at the same location. To ensure fast response,
all temperature sensors were less than 1/8 inch in diameter. For surface‐attached installation,
temperature sensors were tightly attached to the pipe using tapes wrapping around the pipe.
Thermal grease was applied to enhance heat conduction between the temperature sensor and
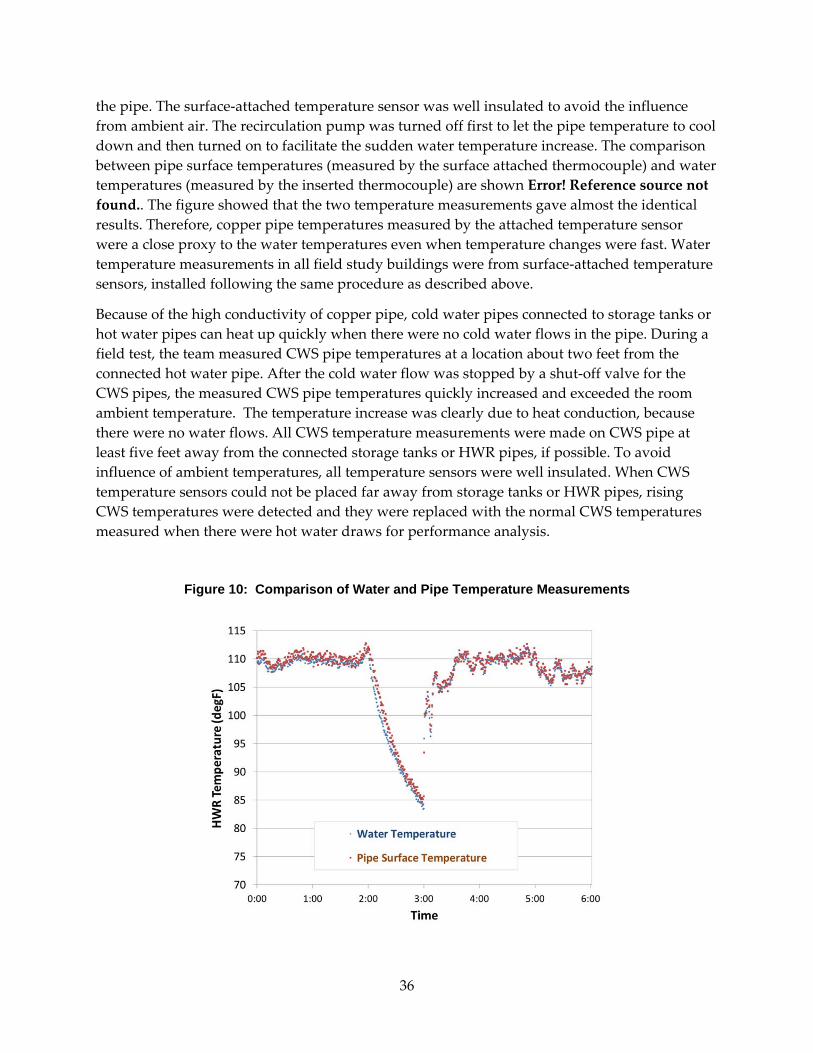
36
the pipe. The surface‐attached temperature sensor was well insulated to avoid the influence
from ambient air. The recirculation pump was turned off first to let the pipe temperature to cool
down and then turned on to facilitate the sudden water temperature increase. The comparison
between pipe surface temperatures (measured by the surface attached thermocouple) and water
temperatures (measured by the inserted thermocouple) are shown Error! Reference source not
found.. The figure showed that the two temperature measurements gave almost the identical
results. Therefore, copper pipe temperatures measured by the attached temperature sensor
were a close proxy to the water temperatures even when temperature changes were fast. Water
temperature measurements in all field study buildings were from surface‐attached temperature
sensors, installed following the same procedure as described above.
Because of the high conductivity of copper pipe, cold water pipes connected to storage tanks or
hot water pipes can heat up quickly when there were no cold water flows in the pipe. During a
field test, the team measured CWS pipe temperatures at a location about two feet from the
connected hot water pipe. After the cold water flow was stopped by a shut‐off valve for the
CWS pipes, the measured CWS pipe temperatures quickly increased and exceeded the room
ambient temperature. The temperature increase was clearly due to heat conduction, because
there were no water flows. All CWS temperature measurements were made on CWS pipe at
least five feet away from the connected storage tanks or HWR pipes, if possible. To avoid
influence of ambient temperatures, all temperature sensors were well insulated. When CWS
temperature sensors could not be placed far away from storage tanks or HWR pipes, rising
CWS temperatures were detected and they were replaced with the normal CWS temperatures
measured when there were hot water draws for performance analysis.
Figure 10: Comparison of Water and Pipe Temperature Measurements
37
3.3.2 Water Flow Measurement
Hot water flow measurements were essential to energy flow analysis. However, hot water draw
flows occur constantly and often very sporadically, making accurate measurements of flow
challenging. For this reason, the research team carefully considered different flowmeter options
to obtain the most accurate flow measurements within the allowance of project budget and field
installation feasibility.
Displacement type flowmeters can accurately measure unstable flows. That is why they are
used to meter water usages and at gas stations for billing purposes. However, they are made
only for small pipes (< 2 inches). Also, due to internal flow measurement mechanisms, they
cause large pressure drops when flows are high, which could cause hot water service
interruption. Therefore, they could not be used in most multi‐family buildings where cold water
or HWS supply pipes are at least 2 inches and hot water draw flows could be high.
The research team decided to use magnetic flowmeters in full on‐site field studies for several
reasons. This type of flowmeter has relatively high accuracy (±0.5 percent) and can handle high
fluid temperatures up to 212 oF. Magnetic sensors were placed inside the wall of a flowmeter so
that the overall flowmeter looks just like a short pipe with a thick wall. Because there is no
moving part in these flowmeters, they do not introduce any pressure drop if the flowmeter size
matches with the water pipe diameter. For this reason, and very low pressure drop, magnetic
flowmeters were easily accepted by the participants of full on‐site studies. Another reason of
using magnetic flowmeters is because they can measure bi‐directional flows, which was needed
to test the existence of crossover flows.
The team used ultrasonic flow meters for partial on‐site studies. Ultrasonic flow meters have the
least interruption to hot water services. Unlikely all other types of flowmeters, which require
existing water pipes to be cut to install flow sensors, ultrasonic flow sensor can be simply
strapped onto existing water pipes without any plumbing work. This nonintrusive technology
greatly reduces cost and, more important, makes the field monitoring study more acceptable to
participants. However, there were concerns regarding the accuracy of this type of flowmeters,
especially for measuring low flows, that it may not be able to be detected by certain ultrasonic
flow meters. Ultrasonic flow meters were used during the 2008 PIER study. It was found
through that study that ultrasonic flow meters were accurate as along as strong ultrasonic
signals could be detected by the embedded ultrasonic receivers. The research team further
identified an ultrasonic flowmeter, made by Fuji Electronics, having relative good accuracy in
the lower flow range. Based on both lab test and field use, this flowmeter was found to have
good ultrasonic signal reception, good sensitivity in detecting low flows, and good
measurement accuracy. Therefore, it was used in partial on‐site studies.
Almost all flowmeters, except displacement flowmeters, are based on measurement of flow
velocity. In order to obtain accurate measurements, certain length of straight pipes must be
available upstream and downstream of the flowmeter to ensure fully developed flows exist in
the flowmeter. For both partial and full on‐site studies, the research team only selected DHW
systems, where long straight cold water and recirculation loop pipe sections existed and were
easily accessible for flowmeter installation. However, it should be noted that sudden changes in
38
hot water draws, which are normal in DHW systems, tend to cause flow patterns deviate from a
fully developed flow. Therefore, inaccuracies of flow measurements were still inevitable even if
very long straight pipes were used. The only way to deal with this flow‐pattern induced
inaccuracy is to use a displacement type flowmeter, which, however, is not available in large
pipe sizes needed for multi‐family DHW system.
Magnetic flowmeters used in this study were calibrated for measuring water flow rates by the
corresponding vendors. Their calibration was further verified in selected full on‐site study
buildings.
3.3.3 Natural Gas Measurement
Full on‐site studies monitored DHW system natural gas consumptions, either using gas meters
or by monitoring the status of gas valve relays in water heaters or boilers. While the use of gas
meters was preferred, under the following situations, the research team had to monitor gas
valve relay instead:
Heat input rate of the boiler was larger than 300kBtu/hr, exceeding the capacity of the
largest gas meters used by the research team.
Location of the water heating equipment and gas supply pipe did not provide enough
space for installing a gas meter
Installation of a gas meter created enough pressure drop that prevented water heating
equipment from working properly. This problem occurred in two buildings.
Gas valve relays status, measured by detecting the electric current going through the relay, was
used to determine the amount of time when the burner was turned on. Since all monitored
water heating equipment had a constant firing rate, the product of water heater heat input rate
and burner‐on time could be used as an estimate of gas consumption during the time of interest.
3.4 Crossover Flow Investigation
The previous multi‐family central DHW system PIER study [HMG 2008] indicated that three
types of crossover flows may exist in a recirculation system. These are:
1. Hot water flow from tank into the cold water supply pipe
2. Hot water from tank into the recirculation return pipe
3. Hot water flow from the hot water supply into the cold water supply at a hot water
fixture, for instance shower or faucet mixing valve
This study conducted several types of research activities to investigate the above crossover flow
issues.
3.4.1 Reverse Flow Measurement
The first two types of crossover flows listed above involve hot water flowing in the opposite
direction of normal flows. Both types of flowmeters used in this study, magnetic and ultrasonic
flowmeters, could measure bi‐directional flows and, therefore, could detect flows in reverse
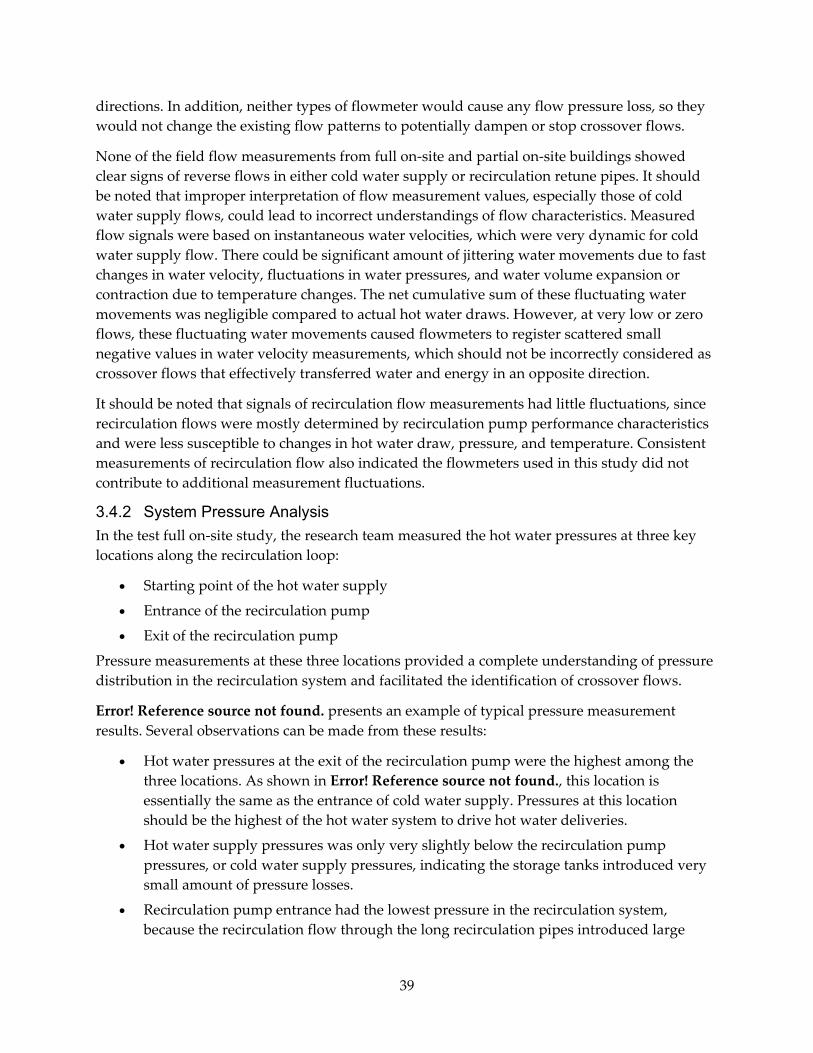
39
directions. In addition, neither types of flowmeter would cause any flow pressure loss, so they
would not change the existing flow patterns to potentially dampen or stop crossover flows.
None of the field flow measurements from full on‐site and partial on‐site buildings showed
clear signs of reverse flows in either cold water supply or recirculation retune pipes. It should
be noted that improper interpretation of flow measurement values, especially those of cold
water supply flows, could lead to incorrect understandings of flow characteristics. Measured
flow signals were based on instantaneous water velocities, which were very dynamic for cold
water supply flow. There could be significant amount of jittering water movements due to fast
changes in water velocity, fluctuations in water pressures, and water volume expansion or
contraction due to temperature changes. The net cumulative sum of these fluctuating water
movements was negligible compared to actual hot water draws. However, at very low or zero
flows, these fluctuating water movements caused flowmeters to register scattered small
negative values in water velocity measurements, which should not be incorrectly considered as
crossover flows that effectively transferred water and energy in an opposite direction.
It should be noted that signals of recirculation flow measurements had little fluctuations, since
recirculation flows were mostly determined by recirculation pump performance characteristics
and were less susceptible to changes in hot water draw, pressure, and temperature. Consistent
measurements of recirculation flow also indicated the flowmeters used in this study did not
contribute to additional measurement fluctuations.
3.4.2 System Pressure Analysis
In the test full on‐site study, the research team measured the hot water pressures at three key
locations along the recirculation loop:
Starting point of the hot water supply
Entrance of the recirculation pump
Exit of the recirculation pump
Pressure measurements at these three locations provided a complete understanding of pressure
distribution in the recirculation system and facilitated the identification of crossover flows.
Error! Reference source not found. presents an example of typical pressure measurement
results. Several observations can be made from these results:
Hot water pressures at the exit of the recirculation pump were the highest among the
three locations. As shown in Error! Reference source not found., this location is
essentially the same as the entrance of cold water supply. Pressures at this location
should be the highest of the hot water system to drive hot water deliveries.
Hot water supply pressures was only very slightly below the recirculation pump
pressures, or cold water supply pressures, indicating the storage tanks introduced very
small amount of pressure losses.
Recirculation pump entrance had the lowest pressure in the recirculation system,
because the recirculation flow through the long recirculation pipes introduced large
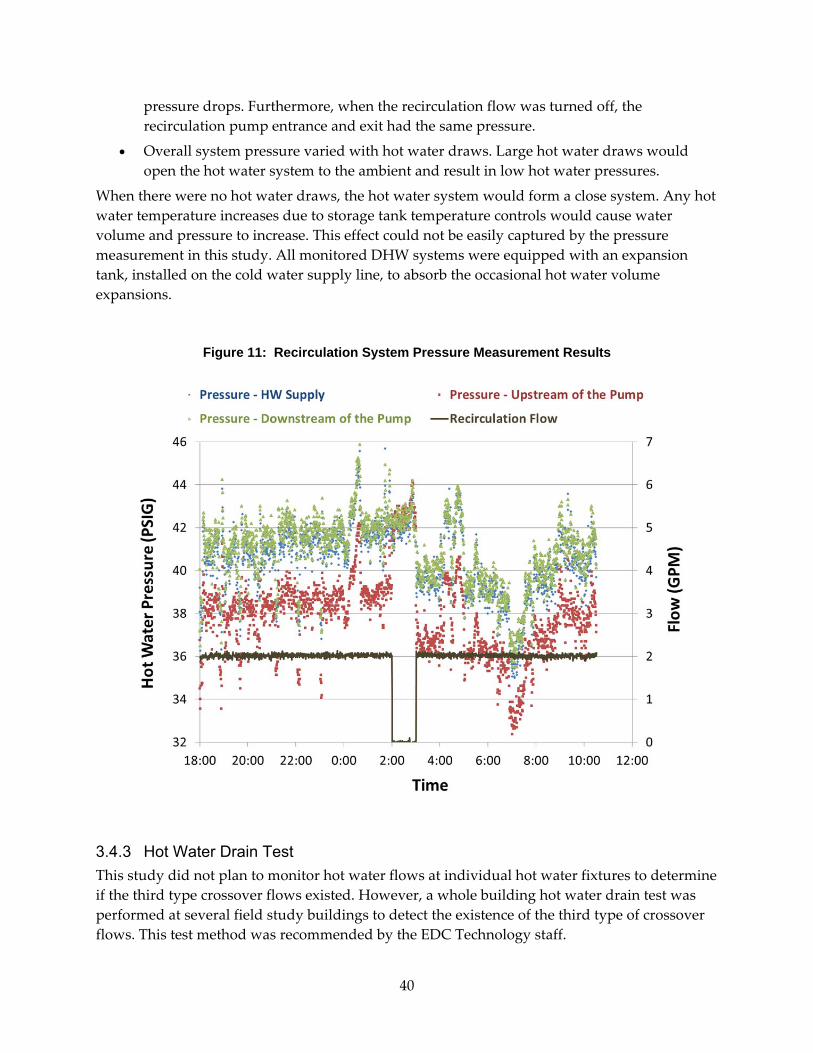
40
pressure drops. Furthermore, when the recirculation flow was turned off, the
recirculation pump entrance and exit had the same pressure.
Overall system pressure varied with hot water draws. Large hot water draws would
open the hot water system to the ambient and result in low hot water pressures.
When there were no hot water draws, the hot water system would form a close system. Any hot
water temperature increases due to storage tank temperature controls would cause water
volume and pressure to increase. This effect could not be easily captured by the pressure
measurement in this study. All monitored DHW systems were equipped with an expansion
tank, installed on the cold water supply line, to absorb the occasional hot water volume
expansions.
Figure 11: Recirculation System Pressure Measurement Results
3.4.3 Hot Water Drain Test
This study did not plan to monitor hot water flows at individual hot water fixtures to determine
if the third type crossover flows existed. However, a whole building hot water drain test was
performed at several field study buildings to detect the existence of the third type of crossover
flows. This test method was recommended by the EDC Technology staff.

41
This test was conducted in conjunction with the initial monitoring equipment installation.
Building tenants were informed that hot water service would be stopped for several hours.
HMG field study staff would turn off the cold water supply flow to the water heating system
and shut off the recirculation pump. Water supply to the cold water system was not turned off.
Then, one of the hot water faucet located on the lowest floor (in a laundry room or public
bathroom) would be turned on to only drain hot water. If there was no leaking mixing valves in
the building, hot water flow would eventually stop, because there was not make‐up flow into
the hot water system. Otherwise, it was expected that cold water would flow from the cold
water system through a leaking mixing valve in a shower or a single‐level faucet into the hot
water system, so that the drain at the rest faucet would never stop.
This drain test was only allowed by the building owners or operators at four (4) field study
buildings. At all these buildings, hot water drains eventually stopped after different amounts of
time. Since only four (4) buildings were tested and all of them were built after 1990, this study
can only conclude that the third type of crossover flows did not take place in any building, at
least not in any newer buildings. This study did not yield any evidence of the existence of the
third type of crossover flows.
3.5 Recirculation System Piping Layout
The original scope of this PIER project did not include the task to investigate recirculation
system designs. Through preliminary research, the research team recognized that recirculation
system design was the most important key factor in determining recirculation system
performance. The team brought up this issue at the mid‐term critical project review (CPR)
meeting and suggested to investigate recirculation system designs to obtain full understanding
of recirculation system performance. Following the approval by the Energy Commission project
manager, the research team carried out the following research activities to collect information
on recirculation system piping designs:
Interviewed mechanical system designers to understand common design practices.
Conducted visual inspection of recirculation system designs for all on‐site study
buildings.
Reconstruct detailed recirculation system designs based on field visual inspection and
building plumbing system plans (if available) for each full on‐site study building.
Collected and reviewed building plumbing plans from utility multi‐family energy
efficiency programs to gather more information on recirculation system design practices.
These research activities provided the following findings on general practices of recirculation
system designs:
There were no widely accepted guidelines on recirculation system designs for multi‐
family central DHW system. Different designers tended to have their own design
preferences. The research team found no design guidelines intended to improve system
efficiency, probably because there was little systematic knowledge of distribution
system performance.

42
Some design guidelines were created based on design guidelines for recirculation
systems in hydronic heating systems. However, these design guidelines were not
reflected in buildings monitored by this study. Hydronic heating recirculation systems
have different operational requirements. These systems need to deliver hot water to
every dwelling unit and, therefore, are more complicated. They are closed systems in
that no water leaves the system. Recirculation flows for hydronic heating need to be
carefully balanced to make sure they evenly reach each dwelling unit. In contrast, DHW
recirculation systems are open systems and also rely on branch lines to deliver hot water
to dwelling units. Recirculation pipes do not need to directly reach every dwelling unit.
As a result, DHW recirculation loops can be much simpler and system balance is not as
critical as for hydronic systems.
Field studies observed many different types of recirculation system configurations. In
general, DHW recirculation systems were not designed to reach every dwelling unit,
unless the building only had only one or two stories. Some designs tried to reach most
part of the building, while others only placed recirculation pipes in one of the building
stories and used long branch lines to reach dwelling units on other building stories.
Locations of recirculation pipes varied from building to building. Most monitored
buildings did not have underground piping, unless water heating systems were located
in a detached building. If a building had parking garage, on the first floor or basement
floor, the mechanical room tended to locate on the garage floor and at least part of the
recirculation pipes were located in the garage floor ceiling. When recirculation pipes
were installed to be within a building, they were usually located in the ceiling spaces on
one or multiple floors.
Recirculation systems could consist of one or multiple loops. The splits of multiple
recirculation loops started from the beginning of the hot water supply pipe in some
buildings, while the splits occurred at different locations along the supply line in other
buildings.
For full on‐site study buildings, the research team intended to obtain detailed recirculation
system design specifications, such as pipe length, diameter, and insulation thickness for each
piping section. In selecting full on‐site study buildings, the research team tried to only choose
buildings, for which detailed recirculation system designs can be obtained from field inspection
and/or building plan review. However, there were only a limited number of full on‐site study
participants and not all of them could meet the above selection criteria. For buildings with
recirculation pipes buried in walls, detailed design specifications could not be verified even if a
detailed plumbing plan was available. In the end, the research team identified four (4) full on‐
site buildings with visible recirculation pipes and a detailed plumbing plan. The recirculation
system design were re‐created, shown in Error! Reference source not found., based on both
plan check and field inspection. Section 50 discusses how the detailed recirculation system
designs, along with the corresponding measured system operation parameters, were used to
validate the recirculation system model.
43
Figure 12: Recirculation System Piping Layouts in Four Full On-Site Study Buildings
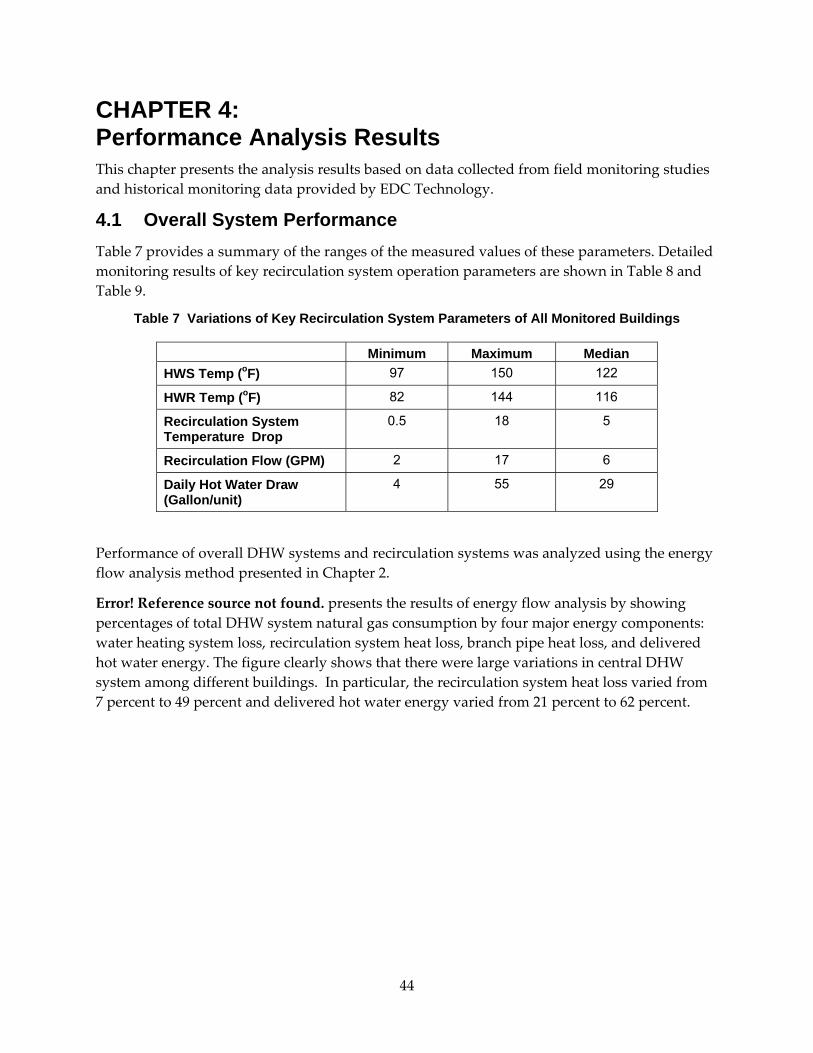
44
CHAPTER 4: Performance Analysis Results This chapter presents the analysis results based on data collected from field monitoring studies
and historical monitoring data provided by EDC Technology.
4.1 Overall System Performance
Table 7 provides a summary of the ranges of the measured values of these parameters. Detailed
monitoring results of key recirculation system operation parameters are shown in Table 8 and
Table 9.
Table 7 Variations of Key Recirculation System Parameters of All Monitored Buildings
Minimum Maximum Median
HWS Temp (oF) 97 150 122
HWR Temp (oF) 82 144 116
Recirculation System Temperature Drop
0.5 18 5
Recirculation Flow (GPM) 2 17 6
Daily Hot Water Draw (Gallon/unit)
4 55 29
Performance of overall DHW systems and recirculation systems was analyzed using the energy
flow analysis method presented in Chapter 2.
Error! Reference source not found. presents the results of energy flow analysis by showing
percentages of total DHW system natural gas consumption by four major energy components:
water heating system loss, recirculation system heat loss, branch pipe heat loss, and delivered
hot water energy. The figure clearly shows that there were large variations in central DHW
system among different buildings. In particular, the recirculation system heat loss varied from
7 percent to 49 percent and delivered hot water energy varied from 21 percent to 62 percent.

45
Figure 13: Percentages of DHW System Natural Gas Consumption by Energy Flow Components
Error! Reference source not found. illustrates the average energy flows among all buildings
monitored by the study. It shows that, on average, 33 percent of the DHW system natural gas
energy was lost by recirculation systems. The average overall DHW system efficiency,
represented by the delivered hot water energy, was 35 percent.
The analysis results showed that branch pipe heat loss represented less than one percent of the
total DHW system natural gas consumption. It should be noted that this loss only counted for
pipe heat loss when there were hot water draws in branch pipes. It did not include energy loss
associated with hot water wasted for discharging cold water in branch pipes and hot water
cooled down in the pipe without further hot water flows. The study did not perform any
measurements at individual hot water fixtures and, therefore, was un able to quantify this loss.
46
Figure 14: Average Energy Flows in Multi-Family Central DHW Systems
Table 8 Summary of Field Monitoring and Performance Analysis Results – Full On-Site Study
S
mp
)
HWR Temp
(oF)
Average Recirc.
Loop Temp Drop
(oF)
Recirc. Flow
(GPM)
Average Daily
HW Draw
per Unit
(Gallon)
Water Heating
EquipmentLoss
Recirculation System Heat Loss Branch Pipe
Heat Loss
HW Delivered
Energy Total Recirc.
Flow
HW
Draw
8 115 12.2 2.2 7 23% 42% 37% 5.2% 1.7% 33%
5 117 8.3 12.1 16 44% 34% 32% 1.8% 0.6% 22%
8 114 4.2 5.1 55 17% 18% 15% 3.6% 1.2% 64%
2 120 2.1 7.7 38 30% 7% 6% 1.2% 0.4% 62%
1 137 4.0 16.2 4 47% 29% 29% 0.8% 0.3% 23%
4 113 11.5 4.7 21 33% 42% 38% 3.8% 1.3% 24%
3 110 2.9 6.1 24 34% 33% 32% 1.1% 0.4% 33%
7 123 4.5 3.3 26 32% 27% 25% 1.8% 0.6% 40%
48
Table 9: Summary of Field Monitoring and Performance Analysis Results – Partial On-Site Study
Site Index
CWS Temp
(oF)
HWS Temp
(oF)
HWR Temp
(oF)
Average Recirc.
Loop Temp
Drop (oF)
Recirc. Flow
(GPM)
Average Daily HW
Draw per Unit
(Gallon)
Water Heating
Equipment Loss2
Recirculation System Heat Loss
Branch Pipe
Heat Loss
HW Delivered
Energy Total Recirc. Flow
HW Draw
1-SFB 63 120.9 117.2 3.7 9.1 19 30% 37% 36% 1.3% 0.4% 32%
2-BKS 59 126.4 123.6 2.8 5.4 15 30% 31% 31% 1.0% 0.3% 38%
3-BKU 70 114 113.8 0.2 11.4 33 30% 3% 3% 0.2% 0.1% 67%
4-SAP 74 137.3 131.1 6.2 3.8 35 30% 42% 40% 1.8% 0.6% 28%
5-SAC 73 121 118.1 2.9 5.5 25 30% 39% 38% 1.2% 0.4% 31%
6-DAK 67 105.8 94.4 11.4 3.6 53 30% 20% 9% 10.7% 3.6% 46%
7-DAL 67 116.4 105.8 10.6 4.1 54 30% 16% 9% 7.9% 2.6% 51%
8-OAL 63 122.4 116.7 5.7 14.6 19 30% 59% 58% 0.7% 0.2% 11%
9-OAL 63 115.8 113.2 2.6 9.8 31 30% 32% 30% 1.2% 0.4% 38%
10-SFF 61 125.5 117.0 8.5 14.7 32 30% 41% 39% 2.5% 0.8% 28%
11-HOB 57 113.6 112.1 1.5 5.7 39 30% 16% 15% 0.9% 0.3% 54%
12-HOB 66 116.6 112.9 3.7 4.4 25 30% 43% 42% 1.2% 0.4% 27%
13-HOL 92 112.8 110.5 2.3 10.3 12 30% 61% 61% 0.6% 0.2% 9%
14-HOC 60 123.3 121.3 2.0 4.6 12 30% 36% 36% 0.7% 0.2% 33%
15-HOL 64 143.9 126.1 17.8 3.6 32 30% 26% 19% 6.8% 2.3% 42%
16-DAR 70 120.9 115.8 5.1 23.1 9 30% 52% 51% 1.2% 0.4% 18%
17-SAP 67 131 123.9 7.1 7.1 34 30% 48% 47% 1.6% 0.5% 21%
18-SFP 69 127.8 119.8 8.0 15.4 50 30% 32% 29% 3.4% 1.1% 37%
19-OAO 69 115.4 105.4 10.0 3.9 31 30% 46% 42% 3.6% 1.2% 23%
20-LAE 75 107.5 106.2 1.3 10.2 50 30% 20% 19% 1.2% 0.4% 50%
2 Field studies did not measure DHW system natural gas consumption in partial on‐site study buildings. Efficiencies of water heating equipment
in partial on‐site study buildings were assumed to be 30 percent for energy flow analysis. (The average efficiency of water heating equipment in
full on‐site buildings was 67 percent.)
49
The variation of recirculation system performance is further illustrated by Error! Reference
source not found., which shows the distribution of number of buildings in different ranges of
recirculation system heat loss. Obviously, recirculation system heat loss depends on
recirculation system piping designs. However, field studies were unable to collect enough
design information to further correlate recirculation system designs to their performance.
Figure 15: Statistics of Recirculation System Heat Loss
The energy flow analysis revealed how recirculation system performance was related to hot
water usages. Table 8 and Table 9 show the two components of recirculation system heat loss:
heat loss associated with recirculation flows and hot water draw flows. The analyses, on
average, represented 31 percent and 2 percent of the total DHW system natural gas
consumptions. This result showed that majority of the recirculation system heat loss was
associated recirculation flows. As hot water usages increase, recirculation system heat loss
would increase slightly and its weight in the total DHW system natural gas consumption would
decrease, leading to lower percent values.
4.2 Performance of Controls
The study assessed performance of recirculation controls in the eight full on‐site study
buildings. The three types of controls were tried at all these buildings when they were allowed
by the building owners/operators.

50
Table 10 provides the control schedules for the three control technologies at the eight buildings.
For timer controls and temperature modulation controls, the research team developed control
schedules based on measured hot water usage patterns.

51
Table 10: Control Schedules for Full On-Site Studies
Site Index Timer Control (Hours of pump off
/ day)
Temperature Modulation (Temperature reduction /
Hours of reduction)
Demand Control (Minutes of pump-on
time/day)
A-SAM 6 hours 20oF / 6 hours N/A
B-SFD 6 hours 10oF / 5 hours 90 min
C-SFH 6 hours Not feasible 265 min
D-SFF 6 hours 20oF / 6 hours 346 min
E-DAE 6 hours 10oF / 6 hours 477 min
F-SAA 6 hours 10oF / 6 hours 170 min
G-LAB N/A N/A 62 min
H-LAR N/A N/A 62 min
Energy savings were calculated by comparing the total DHW system energy consumption with
and without controls being activated. The results, presented in Table 11, showed very large
variations and some negative savings in some buildings. Table 11 also shows the recirculation
system heat loss in each building for comparison. These energy savings results hardly show any
trend and do not correlate well with recirculation system heat loss.
Table 11: Measured Gas Energy Savings by Controls
Site Index
Timer Control
Temperature Modulation
Demand Control
Recirculation System Heat Loss (No Control)
A-SAM 2.1% 0.0% N/A 42%
B-SFD 7.6% -4.4% 24% 34%
C-SFH 14% N/A 32% 18%
D-SFF -11% 18% 11% 7%
E-DAE 7.1% 1.2% 3.4% 29%
F-SAA 6.9% 3.6% 0.0% 42%
G-LAB N/A N/A 16% 33%
H-LAR N/A N/A 11% 27%
4.3 Hot Water Draw Analysis
This study analyzed the hot water draw measurements to characterize peak hot water demand.
This information is important to the development of design guidelines for determining water
heating capacities, tank sizes and water heater/boiler heat input, in multi‐family buildings.
The research team followed a method provided in ASHRAE Application Handbook (Section
49.9) to characterize peak hot water demand by assessing the highest hot water draws for
different time ranges. As an example, Error! Reference source not found. shows the maximum
hot water demands for time ranges from one (1) minute to one (1) day. In addition, Error!
Reference source not found. also shows maximum rates of hot water demand, which was

52
obtained by dividing the maximum hot water demand by the corresponding time range. It is
clear that the maximum hot water demand increases with time range, because more hot water
draws can be expected in a longer observation period. It is also clearly indicated by Error!
Reference source not found. that the maximum rate of hot water demand decreases with time
range, because high demands usually only last for short periods of time. It is those high rates of
demand that determine the design capacity of a water heating system. Therefore, peak hot
water demands during short time periods are more relevant and deserve careful investigation.
Error! Reference source not found. presents the same trend of maximum hot water demand as
shown in Error! Reference source not found., but only for up to three (3) hours of time range. It
provides a detailed view of the correlation between maximum hot water demands and time
ranges. However, information provided in this figure only represents peak demand
characteristics of one building. In order to compare and summarize peak demand patterns of all
the buildings monitored in this study, maximum hot water demands were normalized by the
daily hot water demand to produce peak hot water demand fractions. These fractions represent
the maximum fractions of daily hot water usages that occur during the corresponding time
range. The slopes of a peak hot water demand fraction curve (Error! Reference source not
found.) represent rates of hot water demand. Both values and slopes of a peak hot water
demand fraction curve, along with building daily hot water demand, are needed to properly
size the water heating system.
For each monitored building, peak hot water demand fractions were assessed on a daily basis.
The day with the highest values of peak hot water demand fractions was used to represent the
peak demand of the building. The corresponding peak hot water demand fractions for all
buildings are presented in Error! Reference source not found..

53
Figure 16: Example of Measured Peak Hot Water Demand – Full Day
Figure 17: Example of Measured Peak Hot Water Demand – Three Hours
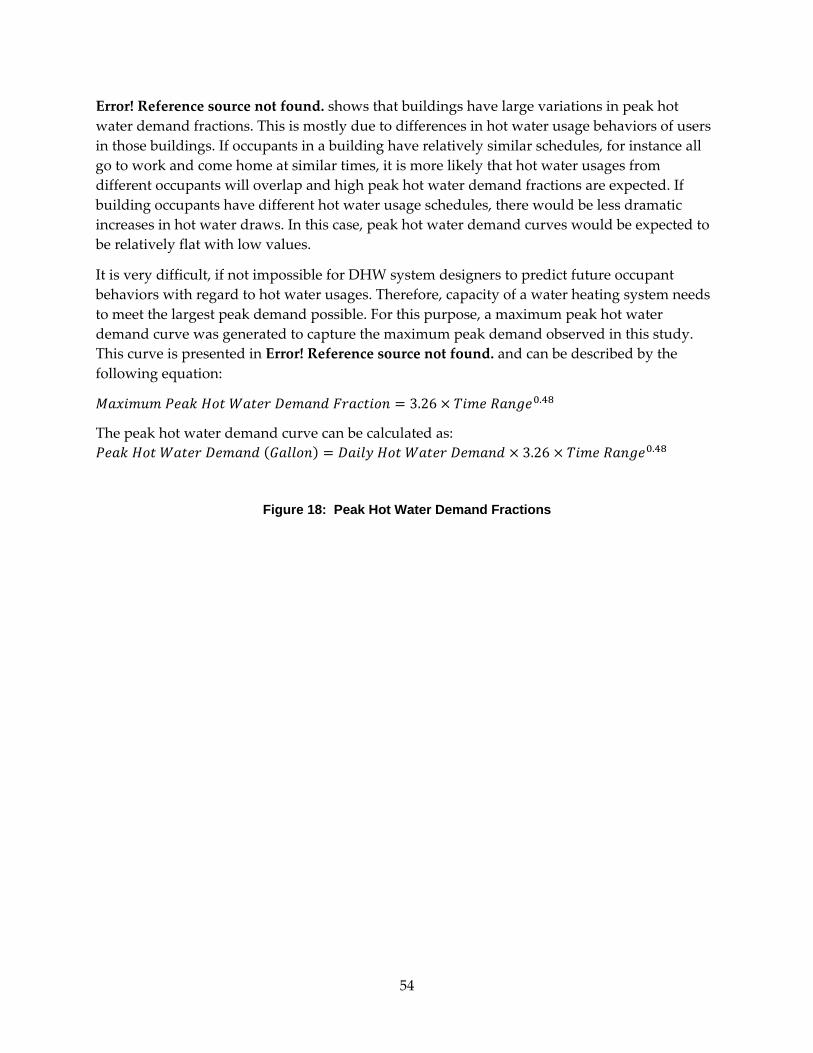
54
Error! Reference source not found. shows that buildings have large variations in peak hot
water demand fractions. This is mostly due to differences in hot water usage behaviors of users
in those buildings. If occupants in a building have relatively similar schedules, for instance all
go to work and come home at similar times, it is more likely that hot water usages from
different occupants will overlap and high peak hot water demand fractions are expected. If
building occupants have different hot water usage schedules, there would be less dramatic
increases in hot water draws. In this case, peak hot water demand curves would be expected to
be relatively flat with low values.
It is very difficult, if not impossible for DHW system designers to predict future occupant
behaviors with regard to hot water usages. Therefore, capacity of a water heating system needs
to meet the largest peak demand possible. For this purpose, a maximum peak hot water
demand curve was generated to capture the maximum peak demand observed in this study.
This curve is presented in Error! Reference source not found. and can be described by the
following equation:
3.26 .
The peak hot water demand curve can be calculated as: 3.26 .
Figure 18: Peak Hot Water Demand Fractions
55

56
4.4 Historical Monitoring Data Analysis
EDC’s monitoring systems measured hot water supply temperature, hot water return
temperature, and cold water temperature. In some buildings, status of relays for natural gas
valves in water heater or boilers were also measured and they provided indirect indication of
natural gas consumption. Measurements were made at every second and data were recorded
every 15 minutes.
EDC monitoring systems did not measure water flows and, therefore, we could not conduct
energy flow analysis, as described in the previous section, to reveal system energy performance
or recirculation system heat loss. For some DHW system, EDC monitoring systems measured
and recorded the status of gas value relay status, which can be used to determine the daily
burner firing time of the corresponding water heating equipment. Most hot water heating
equipment were expected to have a constant firing rate, knowing daily burner firing time, along
with heating equipment heat input ratings (Btu/hr), we could estimate daily natural gas
consumption by the monitored systems. Unfortunately, EDC monitoring data did not contain
information of heating equipment heat input ratings. As a result, we could not estimate system
gas consumptions. Another way to use the daily burner firing time information is calculate its
relative changes as a way to assess savings achieved by the corresponding system
improvement, such as installation of a temperature modulation control, reduction in supply
temperature settings, fix of a pipe leak, and so forth. All EDC monitoring was started along
with the installation of an EDC temperature modulation control and there was no monitoring
data indicating system performance before installation of the control. Other possible system
improvements were not explicitly indicated by the EDC monitoring data. As a result, we could
not use the monitoring data to assess savings from system improvements.
Without being able to performing energy performance related calculation, this study analyzed
the variations of hot water supply temperatures, hot water return temperatures, and
recirculation loop temperature drops. The results provided a picture of common hot
temperature settings and hot water temperatures delivered by recirculation systems. We also
developed Excel programs to search for abnormal trends in temperature measurements, which
were used to identify possible system operation issues, for instance recirculation pump failures.
57
CHAPTER 5: Recirculation System Model Development
5.1 Overview
This chapter describes the recirculation system model developed by this study. This model was
developed based on heat transfer principles and could predict recirculation system performance
based on system designs, operational conditions, and control schedules. The development
process of this model also provided in‐depth understandings of recirculation system operation
and revealed energy savings mechanisms of recirculation system designs and controls.
The general approach of this recirculation model, as discussed in Section 2.3, was to simulate
heat transfer of each pipe section in recirculation systems. The overall model development
consisted of the following steps of consideration:
1. Construct recirculation system using pipe sections
2. Understand and solve for heat loss of simple linear pipes
3. Understand heat loss characteristics of recirculation systems, considered as consisting of
interconnected pipe section, with steady flows
4. Understand heat loss characteristics of recirculation systems without recirculation flows
5. Develop assumptions to simulate overall recirculation operation as a sequence of
different heat loss modes
At the end, complicated recirculation systems were modeled as a set of interconnected pipe
sections with a sequence of heat loss modes. This simple modeling approach was implemented
using Excel.
The study validated the model to ensure accuracy by comparing model results to field
monitoring results from four full on‐site study buildings under different controls. Using the
validated model, the study was able to provide more accurate assessment of energy savings
from control technologies than those obtained from field studies, because operational
conditions could be kept the same under different controls.
5.2 Recirculation System Configuration
Recirculation systems were modeled as a network of interconnected pipe sections. Error!
Reference source not found. shows an example of pipe section configurations for a simple
recirculation loop with six branch lines. In this example, the system is divided into seven pipe
sections, denoted by the numbers enclosed in squares. Separation and interconnection between
pipe sections are specified through pipe nodes, denoted by the numbers enclosed in circles. For
example, pipe section number 1 has the node number 2 as the output node, which also serves as
the input node for pipe section number 2. The model would pass flow and temperature
information from pipe section number 1 to pipe section number 2 through pipe node number 2.

58
Figure 19: Example of Pipe Section Configurations for a Simple Recirculation System
Continuous linear pipe with the same physical configurations (pipe diameter and insulation),
ambient conditions, and flows can be treated as a unique pipe section in the model, because
such a pipe section would have a uniform heat transfer characteristics. Water flow in HWS
pipes reduces as hot water is drawn branch pipes. For this reason, HWS pipes between different
branches should be modeled as separate pipe sections. However, as explained in the following
section, since pipe heat loss is not very sensitive to variations of hot water flows, HWS pipes
between several branches can be modeled as one pipe section, with hot water draws from the
branches in between may be relocated to the branches at the beginning and end of the combined
pipe section. In this way, the overall model can be simplified down to having fewer pipe
sections. HWR pipes can be modeled as one pipe section because they often have the same
physical configurations and the same ambient conditions.
Using the above‐described simplification method, Error! Reference source not found. illustrates
how pipe section configurations were simplified from the complicated recirculation system
design (for the full on‐site building B‐SFD) to a relatively simple model configuration. This
example shows how a recirculation loop is split into two, at both pipe nodes #2 and #4, to form
two sets of parallel recirculation loops.

59
Figure 20: Recirculation System Model for a Full On-Site Study Building
5.3 Pipe Heat Transfer Modes
Recirculation pipes have two distinctive heat transfer modes: pipe heat transfer with hot water
flows and pipe heat transfer without hot water flows (with stagnant water). These two heat
transfer models have very different heat loss characteristics, which can be used to explain the
differences in system performance under controls. Pipe temperatures and heat loss for both heat
transfer modes can be predicted from material and flow properties, using well‐developed
engineering solutions available from most heat transfer text books.
60
5.3.1 Pipe Heat Transfer with Hot Water Flows
A pipe with a steady hot water flow will achieve a stable temperature distribution, with pipe
temperature decreasing gradually from the inlet to the outlet. Flow temperature at a distance L
from the inlet can be calculated using the following equation [Incropera 2002]:
. ∙ ∙ ∙
where
Tin is pipe inlet temperature;
Tamb is ambient temperature;
UAL is pipe heat transfer coefficient per unit length of pipe. It depends on pipe physical
configurations, such as pipe diameter and insulation conditions, and ambient conditions.
Calculation of UA is discussed in Appendix C.
is hot water density;
Cp is hot water specific heat; and
Flow is hot water volumetric flow rate (GPM).
The average temperature of pipe with length L can be calculated as:
.∙ ∙ ∙
∙∙ ∙
Pipe heat loss rate (Btu/hr), , can be calculated based on the formula for either pipe heat
transfer or hot water energy loss, as shown below:
∙ ∙ ∙ ∙ ,
The total pipe heat loss (Btu), , , during a period of t, when hot water has a constant
flow rate, is:
, ∙ ∆
The above equations indicate that pipe heat loss depends on pipe physical configurations, such
as heat transfer coefficient and pipe length, and on operational parameters, such as inlet
temperature, ambient temperatures, and flow. It will be shown in the next section that both pipe
heat loss and the exit temperature increase with water flow rate. One way to explain this trend
is that hot water has less time to lose heat as it travels through the pipe at a high flow rate, so
that the exit water temperature and the average pipe temperature are higher. On the other
hand, the overall pipe heat loss is higher due to the increased average pipe temperature.

61
5.3.2 Pipe Heat Transfer without Hot Water Flows
Without hot water flows, pipe heat loss will cause water and pipe temperatures to decrease. As
pipe temperature is reduced, pipe heat loss slows down accordingly. Eventually, water and
pipe temperatures will be the same as ambient temperature and pipe heat loss will be zero. As a
result, stopping hot water flows can dramatically reduce pipe heat loss.
Pipe cool‐down process can be analyzed using the lumped capacity method, which is one of the
standard methods for analyzing transient heat transfer in simple systems. Using this method,
average temperature of a pipe section after time t from the beginning of the cool‐down process
can be calculated as:
..
where
Tavg (0) is the average temperature of the pipe section at the beginning of the cool‐down
process;
CapL is thermal capacity (mass × specific heat) per unit length of pipe, including thermal
capacity of both water and pipe.
Total pipe heat loss (Btu) during the cool‐down period equals the total thermal energy
reduction of hot water and the pipe, as shown in the following equation.
, ∙ ∙
5.4 Recirculation System Heat Transfer Modes
Using the two pipe heat transfer modes presented above, several system operation modes were
constructed to illustrate the overall recirculation system performance. These system operation
modes help to explain energy savings mechanisms of control technologies.
5.4.1 Recirculation Operation with Varying Hot Water Flows
Water flow rate is the determining operational parameter in deciding pipe heat loss mode.
Therefore, system operation modes are determined by flow conditions. Changes in hot water
flows in a recirculation system are determined by hot water draw schedules and by
recirculation pump control schedules.
Using the system design shown in Error! Reference source not found. as an example, the study
calculated the recirculation system temperature distribution and pipe heat loss under several
representative flow conditions, as listed in Table 12. For each pipe section of the system, pipe
heat loss mode was determined based on water flow rate. Pipe temperatures and heat loss rate
were calculated accordingly using the equations provided in the previous section. Temperature
and flow data were passed from an upstream pipe section to a downstream one following the
pipe section configurations presented in Error! Reference source not found.. When there was a
hot water draw in a branch pipe, hot water flows in downstream pipe sections were reduced
accordingly. The recirculation system was assumed to be located in conditioned spaces with
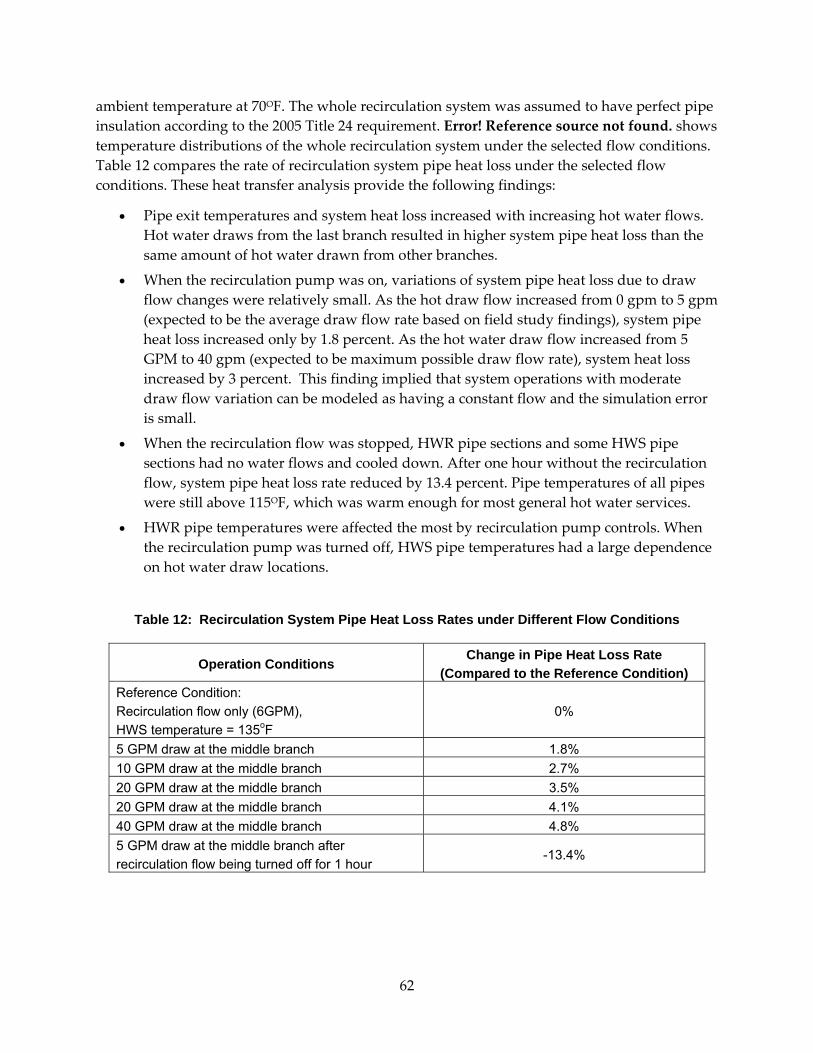
62
ambient temperature at 70OF. The whole recirculation system was assumed to have perfect pipe
insulation according to the 2005 Title 24 requirement. Error! Reference source not found. shows
temperature distributions of the whole recirculation system under the selected flow conditions.
Table 12 compares the rate of recirculation system pipe heat loss under the selected flow
conditions. These heat transfer analysis provide the following findings:
Pipe exit temperatures and system heat loss increased with increasing hot water flows.
Hot water draws from the last branch resulted in higher system pipe heat loss than the
same amount of hot water drawn from other branches.
When the recirculation pump was on, variations of system pipe heat loss due to draw
flow changes were relatively small. As the hot draw flow increased from 0 gpm to 5 gpm
(expected to be the average draw flow rate based on field study findings), system pipe
heat loss increased only by 1.8 percent. As the hot water draw flow increased from 5
GPM to 40 gpm (expected to be maximum possible draw flow rate), system heat loss
increased by 3 percent. This finding implied that system operations with moderate
draw flow variation can be modeled as having a constant flow and the simulation error
is small.
When the recirculation flow was stopped, HWR pipe sections and some HWS pipe
sections had no water flows and cooled down. After one hour without the recirculation
flow, system pipe heat loss rate reduced by 13.4 percent. Pipe temperatures of all pipes
were still above 115OF, which was warm enough for most general hot water services.
HWR pipe temperatures were affected the most by recirculation pump controls. When
the recirculation pump was turned off, HWS pipe temperatures had a large dependence
on hot water draw locations.
Table 12: Recirculation System Pipe Heat Loss Rates under Different Flow Conditions
Operation Conditions Change in Pipe Heat Loss Rate
(Compared to the Reference Condition)
Reference Condition:
Recirculation flow only (6GPM), HWS temperature = 135oF
0%
5 GPM draw at the middle branch 1.8%
10 GPM draw at the middle branch 2.7%
20 GPM draw at the middle branch 3.5%
20 GPM draw at the middle branch 4.1%
40 GPM draw at the middle branch 4.8%
5 GPM draw at the middle branch after recirculation flow being turned off for 1 hour
-13.4%

63
Figure 21: Hot Water Temperature Distribution in a Recirculation System
5.4.2 Recirculation Operation with Varying HWS Temperatures
The analysis above assumed a constant HWS temperature of 135OF. As the HWS temperature
changes, recirculation system pipe temperatures would float up and down with the HWS
temperature. However, the trends presented in Error! Reference source not found. and Table
12 stay the same. Temperature distributions along the pipe length remain the same as those
shown in Error! Reference source not found..
Table 13 compares recirculation system pipe heat loss rates under one draw condition, but with
different HWS temperatures. The results quantitatively show the energy savings benefit of
lowering HWS temperatures.
Table 13: Recirculation System Pipe Heat Loss Rates with Different HWS Temperature
Operation Conditions Change in Pipe Heat Loss Rate
(Compared to the Reference Condition)
Reference Condition: HWS temperature = 135oF Recirculation flow only (6GPM)
0%
HWS temperature = 130oF Recirculation flow only (6GPM)
-7.7%
HWS temperature = 125oF Recirculation flow only (6GPM)
-15%
HWS temperature = 120oF -23%
64
Recirculation flow only (6GPM)
5.4.3 Mechanisms of Control Technologies
The discussions in Section 5.3 on recirculation system operation modes help to understand
energy savings mechanisms of control technologies.
Both timer controls and demand controls enable pipe cooling down to reduce pipe heat loss.
The amount of pipe heat loss reduction depends on how often and how long pipes have no flow
and are allowed to cool down. Hot water flows in HWR pipes solely depend on recirculation
pump operation. Hot water flows in HWS pipes also depend on hot water draw schedules.
Therefore, recirculation pump controls have a large impact to HWR pipes than to HWS pipes.
The percentage reduction of recirculation system pipe heat loss depends on the ratio of HWR
pipes to HWS pipes, which is determined by recirculation system designs. Cool‐down process
for HWS pipes depend on hot water draw schedules and locations, so energy savings from
recirculation pump control also depends on occupant behaviors.
Temperature modulation controls reduce pipe temperatures of the whole recirculation system.
Therefore, the percentage reduction of recirculation system pipe heat loss only depends on the
amount of the HWS temperature reduction and duration of temperature reduction, and not on
recirculation system designs. For a fixed temperature modulation control schedule, energy
savings are not sensitive to hot water draw variations, because recirculation system pipe heat
loss is not sensitive to hot water draw flows when the recirculation pump is turned on.
Quantitative assessment of energy savings from controls are provided later in this chapter
based on recirculation system designs, draw schedules, and control schedules obtained from
four full on‐site study buildings.
5.5 Model of Controls
5.5.1 Modeling of Continuous Pumping
The daily operations of recirculation systems are simulated to have a sequence of different
operation modes as discussed in the prior section. Different controls have different
combinations of operation modes.
5.5.2 Continuous Pumping without Any Controls
Recirculation system operation without any control is the simplest scenario to model. Table 12
revealed that variation of hot water draws had a relatively small impact on recirculation system
pipe heat loss when the recirculation pump was on. Based on this finding, the model simulates
daily recirculation system operation as a sequence of steady‐state operations with constant hot
water draws along with a constant recirculation flow. The detailed modeling process is as
follows:
A day is divided into 48 time steps. Time steps were selected to capture periods with
relatively small variations in draw flow. For this reason, durations of each time step
were not always the same. For example, a time step at midnight could be two hours long
65
if hot water draws are very low or zero during the whole period. A time step for a peak‐
demand period could be only twenty minutes to include high hot water draws in that
period. No time step is less than ten minutes, because it takes at least ten minutes for
most recirculation systems to transition from one steady‐state operation to another.
For each time step, average hot water draws in each branch pipes are calculated
according to detailed hot water draw schedules. The recirculation system is modeled to
have a steady‐state operation with constant hot way draws in each branch pipe.
If the schedule of total hot water draw was known but branch locations of hot water
draws were unknown, each time step included three scenarios of hot water draw
locations to reflect possible variation of hot water draw locations: at the first branch, at
the middle branch, and at the last branch. System pipe heat loss of the three scenarios is
averaged to represent the recirculation system performance of the time period.
Daily recirculation system heat loss was obtained by summing up system pipe heat loss
from all 48 time steps.
5.5.3 Modeling of Temperature Modulation
The modeling process for system under temperature modulation control was very similar.
Because temperature modulation controls do not turn off the recirculation pump, modeling
method for dealing with variations in hot water draws stayed the same. Selection of time steps
was based on both hot water draw schedule, as well as the temperature modulation schedule.
Adjustment of HWS temperature was a slow process because it took considerable time to cool
down and heat up water in large storage tanks in multi‐family DHW systems. This effect was
evident in field monitoring results, as shown in Error! Reference source not found.. The model
designated two 30‐minute time steps to cover the slow transitions for tank temperature cool
down and ramp up. HWS temperatures for the two transition time steps are assumed to be the
average between the normal HWS set temperature and the set temperature of the modulation
control.
5.5.4 Modeling of Timer Control and Demand Control
Timer controls and demand controls involved two important, alternating processes: pipe
cooling down and recovery from pipe cooling down. These two processes inflicted large
changes in temperature and heat loss rate (as shown in Error! Reference source not found. and
Table 12) that cannot be properly modeled using steady‐state assumptions. They were modeled
using the solutions to pipe cooling mode provide in Section 5.2.
First, time steps were selected such that the recirculation was either turned on or off during the
whole time step. The recirculation system was assumed to start from a steady‐state status so
that the system initial condition can be used for further transient process modeling. Hot water
flows and HWS temperature were the same as those of the last time step since the model
simulated daily performance with the inherent assumption that the same operational conditions
cycle from one day to another. The initial status provided average pipe temperature and heat
loss rate of each pipe section.

66
Second, the model calculated pipe temperature and heat loss rate based on the following three
possible scenarios:
1. If the recirculation pump was turned on for the current and preceding time steps, the
recirculation system is treated as in transition from one steady‐state status to another.
The modeling method was essentially the same as that used for continuous pumping.
Average temperature of each pipe section was calculated and saved for possible use in
the next time step.
2. If the recirculation pump was turned off in the current time step, pipe sections without
draw flows will cool down. For those pipe sections, the model performed cool‐down
mode calculation following the equations provided in Section 5.2, using the average pipe
temperature of the last time step as the initial condition and the time step duration as the
cool‐down time. For pipe sections with hot water draw flows, the model used steady‐
state mode calculation. For all pipe sections, average temperature at the end of the time
step was calculated and saved for possible use in the next time step.
3. If the recirculation pump is turned on in the current time step, but was turned off in the
preceding step, pipe sections without flows previously would recover from a cool‐down
process. The model first calculated the steady‐state performance for the whole
recirculation system. For pipe sections without flows in the last time step, the model
assumed a transition period between the end of the last time step and new steady‐state
operation. Pipe temperature and heat transfer rate were assumed to vary linearly with
time. The length of the transition period was calculated as the total volume of pipe
sections without flows in the last time step divided by the flow rate of the recirculation
flow. Therefore, it was an estimate of the time needed to fill the pipes, which were
previously cooled down with hot water. If the transition time was longer than the time
step, the recirculation system did not reach the steady‐state.
As discussed in modeling for continuous pumping, the model considered three
scenarios of hot water draw locations at each time step, such as at the first branch, at the
middle branch, and at the last branch. They were used to reflect variations in hot water
draw locations. Simulation results of the three scenarios were averaged to represent the
performance of the time step.
5.6 Model Validation Procedures
To ensure that the developed model was able to accurately predict recirculation system
performance, this study validated the model by comparing model output to field measurement
results. The validation was performed for the four (4) full on‐site study buildings with detailed
recirculation system plumbing designs from the field monitoring studies. First, for each
building, a recirculation system model was developed based on the system plumbing
configurations. Pipe insulation conditions were calibrated based on system performance
without controls. Second, the model was used to predict system performance under different
controls, using same control schedules and hot water draws obtained from the corresponding

67
field studies. The predicted HWR temperature, recirculation system heat loss, and overall
system natural gas energy consumption were compared to field measurement values.

68
The detailed validation procedures are discussed here:
Step 1. Develop a Recirculation System Model
For each validation building, a recirculation system configuration model was developed
following the method described in Section 5.2. Error! Reference source not found. presented an
example.
Step 2. Develop of Validation Data Set
For each validation building, one day of monitoring data under each control was selected for
model validation comparison. Each data set was broken in 48 time steps following methods
discussed in previous sections. Average values of all monitored parameters in each time step
were calculated. Average values of the following parameters were used as input to the
recirculation model as they represented the system operational conditions and control
schedules:
CWS temperature
HWS temperature
Hot water draw flow rate
Recirculation pump on/off time
Ambient temperatures for pipes in conditioned spaces were assumed to be 70OF. For pipes in
unconditioned spaces, ambient temperatures were obtained from a weather database.
The average HWR temperatures were used to validate model accuracy.
Step 3. Calibrate of Pipe Heat Transfer Coefficient
Field studies found that all four buildings had one‐inch fiberglass based pipe insulations, at
least for exposed pipes. However, the study found that using this insulation condition alone
would substantially underestimate recirculation system pipe heat loss. Two other factors
needed to be considered to properly model overall pipe heat transfer coefficients. One is pipe
insulation quality and the other is heat loss through branch pipes.
Most straight pipes in these buildings had good insulation with the help of pre‐fabricated pipe
insulation products. Low‐quality insulations were observes at elbows or other types of joints,
where field‐installed loose insulation materials were used. It was also uncertain whether pipes
inside walls were insulated well.
Heat loss through branch pipes increased recirculation pipe heat loss. When there were hot
water draws, branch pipe heat loss was associated with hot water flows in branch pipes and,
therefore, would be considered independent from recirculation pipes. When there was no hot
water flow, thermal energy lost by branch pipes was from hot water in recirculation pipes,
through heat conduction and convection and should therefore be included in recirculation
system modeling. Heat loss caused by conduction is relatively easy to quantify. Convection heat
loss is very difficult to predict, because convection flows caused by temperature differences in
branch pipes are extremely uncertain.
69
The two factors discussed above effectively increase heat transfer coefficients of recirculation
pipes. In the model, their effects were represented by a multiply factor, applied to the heat
transfer coefficients that were calculated based on perfect pipe insulation of straight pipes
without branch pipes. For each validation building, the multiple factor was obtained through a
calibration process using the validation data set for continuous pumping (no control). The
multiplier was varied until the modeled HWR temperature marched with the measured HWR
temperature. The calibrated multiply factors were in the range of 2.0 to 2.5 for the four
validation buildings.
Step 4 Validate Model Prediction for Controls
For each validation building, the recirculation system model was to simulate system operation
under the three types of controls, using the corresponding validation data set developed in Step
2. To determine model accuracy, the study compared modeled and measured results of HWR
temperature, recirculation system heat loss, and total DHW system energy consumption.
5.7 Model Validation Results
5.7.1 Validation of HWR Temperature Prediction
Error! Reference source not found. through Error! Reference source not found. present
comparisons between modeled and measured HWR temperatures under three recirculation
system controls. In addition to HWR temperatures, these figures also show model inputs and
the corresponding measured values for hot water draws, HWS temperatures, and recirculation
flows. These figures were based results from the full on‐site study building of B‐SFD, and
results from other buildings were similar.
It can be seen from these figures that the model accurately predicted HWR temperatures when
the recirculation pump was turned on. When the recirculation pump was turned off, during
either timer control or demand control, the model correctly predicted the trends of HWR
temperature changes, but seemed to have predicted lower HWR temperatures than measured.
The measured HWR temperature was observed in the mechanical room, with considerably high
ambient temperatures than the rest of the HWR pipes, due to the water heating equipment
inside. High ambient temperatures slowed down the temperature drop for the short HWR pipe
in the mechanical room. On the other hand, the model only simulated large pipe sections. The
short HWR pipe section in the mechanical room was not treated as a separate pipe section, since
its impact to overall recirculation system heat loss was small. The modeled HWR temperatures
represented the performance of overall HWR pipes and, therefore, they were lower than the
measured values obtained from values in the mechanical room. Prediction of overall
recirculation system heat loss should still be relatively accurate, as shown below. It should also
be pointed out that the high ambient temperature in mechanical room had small impact on
HWR temperatures with recirculation flow, for the same reason that the short HWR pipes in the
mechanical room only represented a small fraction of the recirculation system.

70
Figure 22: Model Validation – Temperature Modulation
Figure 23: Model Validation – Timer Control
Figure 24: Model Validation – Demand Control
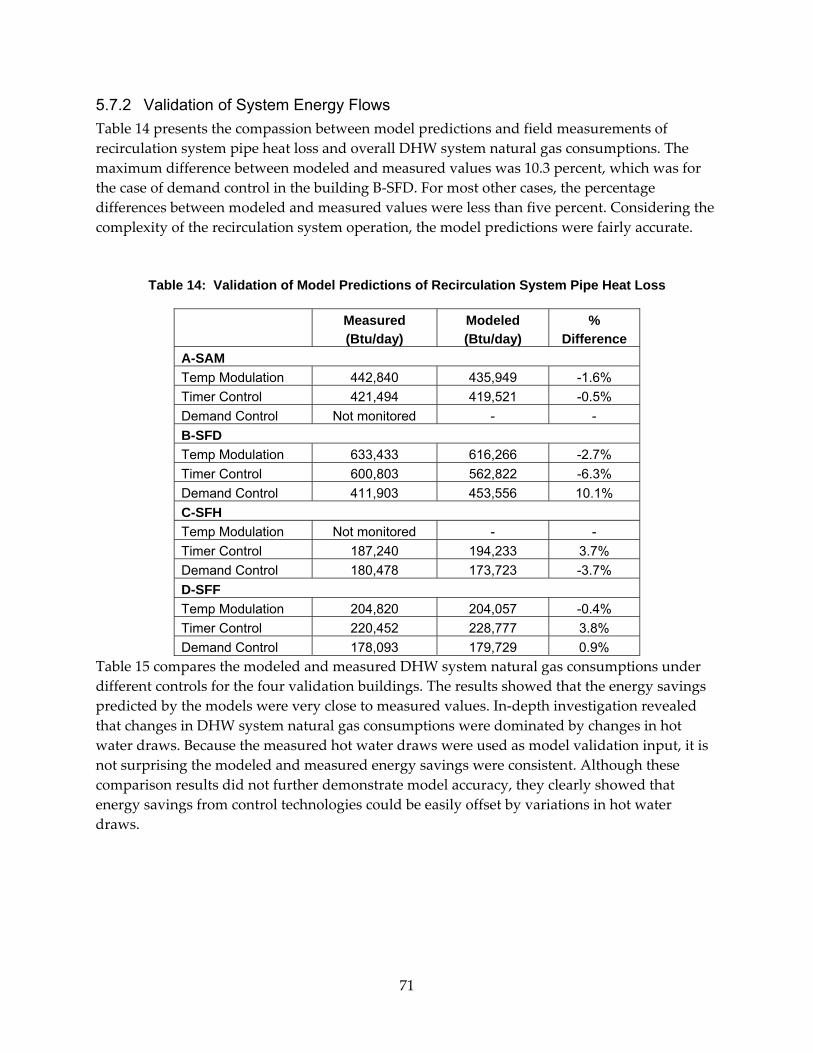
71
5.7.2 Validation of System Energy Flows
Table 14 presents the compassion between model predictions and field measurements of
recirculation system pipe heat loss and overall DHW system natural gas consumptions. The
maximum difference between modeled and measured values was 10.3 percent, which was for
the case of demand control in the building B‐SFD. For most other cases, the percentage
differences between modeled and measured values were less than five percent. Considering the
complexity of the recirculation system operation, the model predictions were fairly accurate.
Table 14: Validation of Model Predictions of Recirculation System Pipe Heat Loss
Measured (Btu/day)
Modeled (Btu/day)
% Difference
A-SAM
Temp Modulation 442,840 435,949 -1.6%
Timer Control 421,494 419,521 -0.5%
Demand Control Not monitored - -
B-SFD
Temp Modulation 633,433 616,266 -2.7%
Timer Control 600,803 562,822 -6.3%
Demand Control 411,903 453,556 10.1%
C-SFH
Temp Modulation Not monitored - -
Timer Control 187,240 194,233 3.7%
Demand Control 180,478 173,723 -3.7%
D-SFF
Temp Modulation 204,820 204,057 -0.4%
Timer Control 220,452 228,777 3.8%
Demand Control 178,093 179,729 0.9%
Table 15 compares the modeled and measured DHW system natural gas consumptions under
different controls for the four validation buildings. The results showed that the energy savings
predicted by the models were very close to measured values. In‐depth investigation revealed
that changes in DHW system natural gas consumptions were dominated by changes in hot
water draws. Because the measured hot water draws were used as model validation input, it is
not surprising the modeled and measured energy savings were consistent. Although these
comparison results did not further demonstrate model accuracy, they clearly showed that
energy savings from control technologies could be easily offset by variations in hot water
draws.

72
Table 15: Validation of Energy Savings from Controls
Measured DHW System Gas
Consumption (Btu/day)
% Energy
Savings
Modeled DHW System Gas
Consumption (Btu/day)
% Energy
Savings
Difference in Energy
Savings
A-SAM
Temp Modulation 1,030,039 0.0% 1,023,148 -1.9% -1.9%
Timer Control 1,008,693 -2.1% 1,006,720 -3.5% -1.4%
Demand Control Not monitored - - - -
B-SFD
Temp Modulation 1,958,764 4.4% 1,941,597 3.3% -1.1%
Timer Control 1,732,428 -7.6% 1,694,446 -10% -2.4%
Demand Control 1,423,628 -24% 1,465,281 -22% 2.0%
C-SFH
Temp Modulation Not monitored - - - -
Timer Control 942,592 -14% 949,586 -14% 0%
Demand Control 742,710 -32% 735,955 -33% -1%
D-SFF
Temp Modulation 2,564,910 -18% 2,564,146 -18% 0%
Timer Control 3,443,807 11% 3,452,131 11% 0%
Demand Control 2,784,551 -11% 2,786,187 -11% 0%
Using the validated models, the study further analyzed the two components of recirculation
pipe heat loss: recirculation flow heat loss and hot water draw heat loss in recirculation pipes.
As discussed in Section0 2.2.1 on energy flow analysis, these two components correspond to the
energy flow components of Q and Q , respectively, shown in Error!
Reference source not found.. The analysis results are shown in

73
Table 16. Relative changes of these two components under different controls provided another
perspective to understand energy savings of control technologies.
The results showed that recirculation flow heat loss was much larger than heat loss of hot water
draws, when there was no recirculation control. Temperature modulation control caused
similar reduction of heat loss of both recirculation flows and hot water draw flows. The
percentages of reduction were moderate. Timer controls and demand controls substantially
reduced heat loss of recirculation flows, but dramatically increased the heat loss of hot water
draw flows. One way to understand this effect is to consider that, when recirculation flows were
stopped, heat loss by HWS pipes was all used to cool hot water draws instead of shared
between hot water draws and the recirculation flow.
These results indicated the energy savings from temperature modulation controls has less
dependence on hot water draws than those for timer controls and demand controls.

74
Table 16: Comparison of Heat Loss of Flows in Recirculation Systems
Recirculation Flow Heat Loss Draw Flow Heat Loss
Modeled Results (Btu/day)
% Change from no Control
Modeled Results (Btu/day)
% Change from no Control
A-SAM
No Control 368,536 - 87,654 -
Temp Modulation 355,698 -3.5% 80,251 -8.4%
Timer Control 279,559 -24% 139,962 60%
Demand Control Not monitored - - -
B-SFD
No Control 608,711 - 34,776 -
Temp Modulation 582,695 -4.3% 33,572 -3.5%
Timer Control 461,656 -24% 101,166 191%
Demand Control 191,328 -69% 262,228 654%
C-SFH
No Control 177,796 - 29,404 -
Temp Modulation Not monitored - - -
Timer Control 145,345 -18% 48,889 66%
Demand Control 82,244 -54% 91,479 211%
D-SFF
No Control 176,588 - 51,679 -
Temp Modulation 159,541 -10% 44,516 -14%
Timer Control 147,709 -16% 81,068 56.9%
Demand Control 78,002 -56% 101,727 97%
5.8 Energy Savings of Controls
The previous section revealed that to determine the impact of control technologies to overall
DHW system gas energy consumptions, the hot water usages had to be kept the same under all
test conditions. This requirement is very difficult, if not impossible, to meet in actually field
studies. However, the requirement can be easily achieved in simulation efforts. Using the
models created for validation, the research team simulated recirculation system operation with
consistent hot water draw schedules, same as those used during continuous pumping (no
control). Pump operations or HWS temperatures were varied according to the corresponding
control schedules.
Table 17 shows the reduction in overall DHW system gas energy consumption achieved by
different controls in four full on‐site study buildings, while holding the hot water draw
schedules constant. Compared to the results in Table 11, all control technologies showed
positive energy savings, because the variations caused by hot water draws were eliminated.
In general, demand controls achieved the highest levels of energy savings, and there was a large
variation in the levels of energy savings from different controls. Table 17 also demonstrates that
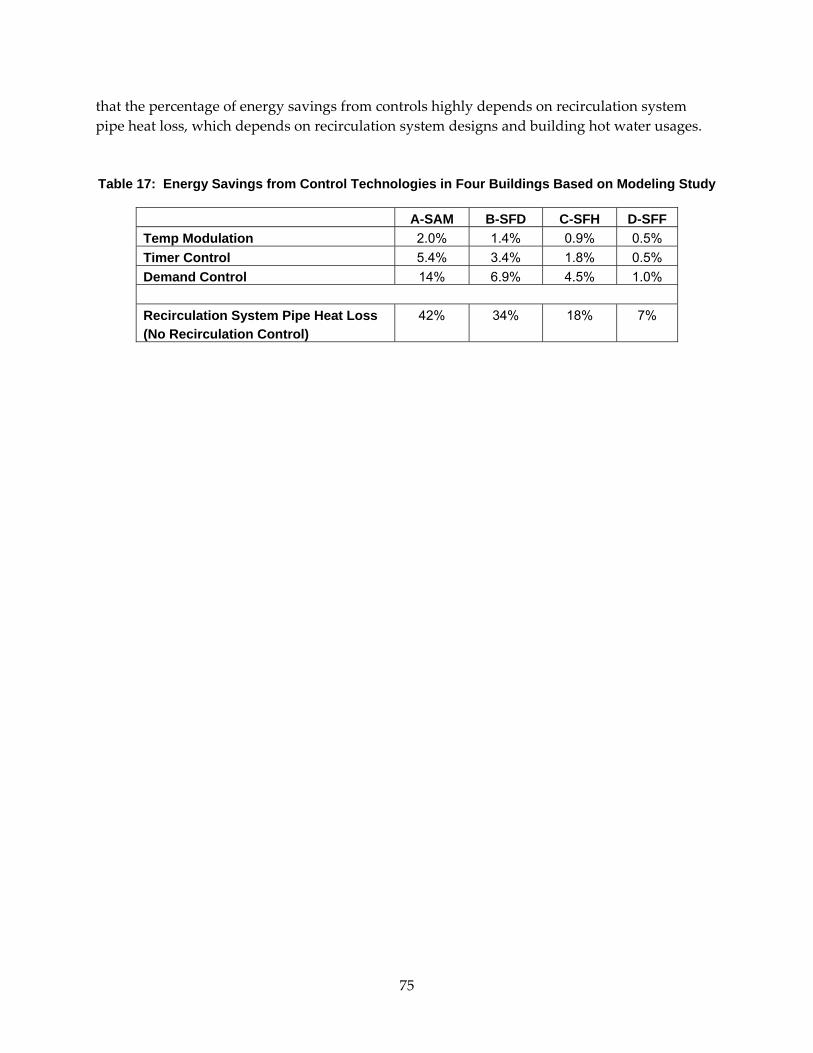
75
that the percentage of energy savings from controls highly depends on recirculation system
pipe heat loss, which depends on recirculation system designs and building hot water usages.
Table 17: Energy Savings from Control Technologies in Four Buildings Based on Modeling Study
A-SAM B-SFD C-SFH D-SFF
Temp Modulation 2.0% 1.4% 0.9% 0.5%
Timer Control 5.4% 3.4% 1.8% 0.5%
Demand Control 14% 6.9% 4.5% 1.0%
Recirculation System Pipe Heat Loss (No Recirculation Control)
42% 34% 18% 7%
76
CHAPTER 6: Conclusion
The research team conducted successful field studies in 28 multi‐family buildings. Full on‐site
studies were performed in eight (8) of these buildings to provide detailed DHW system process
measurements, investigate recirculation system designs, and assess energy savings from
controls. Partial on‐site studies were conducted in the rest of the multi‐family buildings to
assess recirculation system performance and identify system failure modes in a broader range
of multi‐family buildings. Key observations from the field studies include:
Recirculation flow rates are constant when the recirculation pump is turned on. They are
not sensitive to variations of hot water draw flows. The observed recirculation flow rates
were in the range of 2 to 17 GPM, with a median of 6 GPM.
Hot water draws were spread out throughout the day. In general, there were no
extended window periods when hot water draw flows were zero.
Daily hot water draw per dwelling unit had large variations among monitored buildings
and between different days for the same building. The average daily hot water draws
per dwelling unit were between 4 and 55 Gallons/day for the 28 monitored buildings,
with a median of 29 Gallons/day.
HWR temperatures were lower than the corresponding HWS temperatures due to
recirculation system pipe heat loss. The amount of temperature reduction depends on
several factors, including recirculation system piping designs, pipe insulation
conditions, recirculation flow rate, and hot water draw flow rates. The field measured
temperature reductions were in the range of 0.2 to 18 oF, with a median of 4.8 oF.
Recirculation controls were not widely used. Of more than 50 buildings surveyed by the
research team, four (4) buildings had timer controls and one (1) building had
temperature modulation control. None of the four timer controls was configured
properly to actually achieve recirculation pump controls.
6.1 Performance Analysis
The study developed an energy flow analysis method to analyze field monitoring data. This
method provided a clear illustration of central DHW system performance by breaking down
total DHW system natural gas consumption into four components: water heating system heat
loss, recirculation system heat loss, branch pipe heat loss, and delivered hot water energy.
DHW system efficiency is indicated by the percentage of total DHW system natural gas
consumptions accounted by the delivered hot water energy. Recirculation performance is
indicated by the percentage of total DHW system natural gas consumption accounted for by the
recirculation system heat loss. This quantity is also termed the recirculation system heat loss
fraction.

77
DHW system efficiencies and recirculation system heat loss fractions for the monitored
buildings showed very large variations. These large variations were due to differences in
recirculation system designs, as well as the amount of hot water draws. Buildings with shorter
recirculation pipes are expected to have less pipe heat loss and, therefore, a smaller recirculation
heat loss fraction than those with longer recirculation pipes. Once recirculation system designs
are fixed, recirculation system heat loss represents a fixed operation cost of the total DHW
system operation. As DHW system natural gas consumptions increase with hot water usages,
the weight of the recirculation system heat loss becomes smaller. Therefore, buildings with
higher hot water usages had lower recirculation system heat loss fractions than those with low
hot water usages.
The average DHW system efficiency of all the monitored buildings was 35 percent. The average
recirculation system heat loss fraction of all monitored buildings was 33 percent. The remaining
32 percent of total DHW system natural gas consumption was mostly accounted by heat loss by
water heating systems.
This study did not perform detailed monitoring of hot water draws at each branch and each hot
water fixture. Therefore, the study was not able to quantify energy loss associated with hot
water wastes at hot water fixtures (excessive water use by building occupants to displace cold
hot water in the branch pipe) or in branch pipes (hot water cooling down without being used).
If these two types of wastes were included, overall DHW system efficiency would be lower.
However, assessment of recirculation system heat loss fraction was independent of these issues.
6.2 Recirculation System Piping Design
This study investigated recirculation system plumbing designs through field survey, buildings
plan check, and interviews with recirculation system designers. The study found:
There were no widely accepted design guidelines for recirculation systems in central
DHW recirculation systems. Some of the design guidelines used by the industry were
those for hydronic space heating systems and were not suitable for central DHW system.
The study did not find any design guidelines intended for improving system
efficiencies.
Field studies observed many different types of recirculation system piping designs. In
general, DHW recirculation systems were not designed to reach every dwelling unit,
unless the building only had only one or two stories. Some designs tried to reach most
part of the building, while others only placed recirculation pipes in one of the building
stories and used long branch lines to reach dwelling units on other building stories.
Recirculation systems could consist of one or more recirculation loops. All recirculation
loops shared the same HWR pipe section connected to the hot water system, so that only
one recirculation pump was used even if there were multiple recirculation loops.
78
6.3 Recirculation System Model
The research team developed a heat transfer model to predict recirculation system performance.
The model was successfully validated by field monitoring data obtained from four full on‐site
study buildings.
The model broke each recirculation system down to a combination of interconnected pipe
sections. Pipe heat loss was calculated using two basic heat transfer modes, depending on
whether there was hot water flowing in the pipe. These two heat transfer modes have the
following characteristics:
With hot water flows, pipe temperature and heat loss increase slightly with hot water
flow rates.
Without hot water flows, pipe temperatures gradually declines due to pipe heat loss and
pipe heat loss rate decreases accordingly. Significant pipe temperature reduction would
lead to large pipe heat loss reduction, if the pipe has zero hot water flow for a long
period.
In the model, heat transfer modes of pipe sections were determined by hot water draw
schedules and recirculation pump operation schedules. The interconnections between pipe
sections ensured temperature and flow information being passed from upstream to
downstream pipe sections. The model used 48 time intervals to simulate the sequence of the
daily operation of a recirculation system. Overall recirculation system performance was
calculated by summing up the heat losses from all pipe sections during the 48 time intervals.
The study validated the recirculation model for four full on‐site study buildings with different
size and recirculation system designs. Recirculation models for these four buildings were
created according to detailed piping configurations obtained from field surveys. Hot water
draw schedules and control schedules obtained from the field monitoring study were used as
the model inputs. The differences between measured and predicted recirculation system heat
loss and DHW system natural gas consumption were all less than 7 percent. There were some
discrepancies between predicted and measured values of HWR temperatures, primarily
because the measured HWR temperatures represented those in mechanical rooms, but the
majority of the HWR pipes were located outside of the mechanical rooms.
The validated recirculation system models provided a better assessment of energy savings from
controls, because (biased) variations in system natural gas consumption introduced by other
operational parameters, especially hot water draws, can be eliminated by keeping all other
operational conditions constant, with and without controls. The validated model indicated that
all three control technologies saved energy. Percentage reduction of DHW system natural gas
consumptions was proportional to recirculation system heat loss fraction. Consistent with
monitored data, the model also predicted that Demand controls have the highest energy
savings.

79
6.4 Performance of Recirculation Controls
This study investigated the performance of three recirculation control technologies: timer
control, temperature modulation, and demand control. Energy savings from these control
technologies were measured in the eight (8) full on‐site study buildings. The efforts in energy
flow analysis and recirculation model development further provided in‐depth understanding of
energy savings mechanisms of controls.
Field measurement of energy savings from controls found:
Percentage energy savings were calculated as percentage energy reduction in DHW
system natural gas consumption from the baseline of no recirculation system controls.
The average measured percentage energy savings for timer control, temperature
modulation, and demand control were 4.5 percent, 3.7 percent, and 14 percent,
respectively. However, measured energy savings for the controls in different buildings
showed significant variations. In some buildings, negative or zero energy savings were
observed. Uncertainties in field energy savings measurements were due to large
variations in daily hot water usages.
Energy savings from timer controls and temperature modulation controls depended on
control schedule settings. The field studies only monitored control technology
performance under one set of control schedule settings. Control schedule of demand
controls were determined by building hot water usage patterns, sensitivity of the flow
sensor, and location of the HWR temperature sensor.
Field studies did not observe increases in hot water usages due to the deployment of
recirculation controls. The research team did not receive any complaints when controls
were activated.
Pipe heat transfer analysis revealed that pipe heat loss reduction was determined by the
amount and duration of pipe temperatures reduction. The three control technologies have
different mechanisms in reducing recirculation pipe temperatures:
Temperature modulation controls reduce temperatures of the whole recirculation
system. The amount of temperature reduction is almost uniform across the whole
recirculation system and equals to the HWS temperature reduction set by the control.
Both timer controls and demand controls stop recirculation flows. If there is neither hot
water circulation nor hot water draw flow in a recirculation pipe, pipe temperature cools
down and pipe heat loss rate is reduced. The amount of pipe temperature reduction and
heat loss reduction depend on how long the pipe is allowed to cool down, which further
depends on recirculation pump control schedules as well as hot water draw schedules.
Temperature reduction is usually not uniform across the recirculation system, due to the
existence of hot water draw flows. HWR pipes are not affected by hot water draws and,
therefore, are affected mostly by recirculation pump controls.
Timer controls have fixed control schedules to reduce pipe temperatures and demand
controls have dynamic control schedules to reduce pipe temperatures.
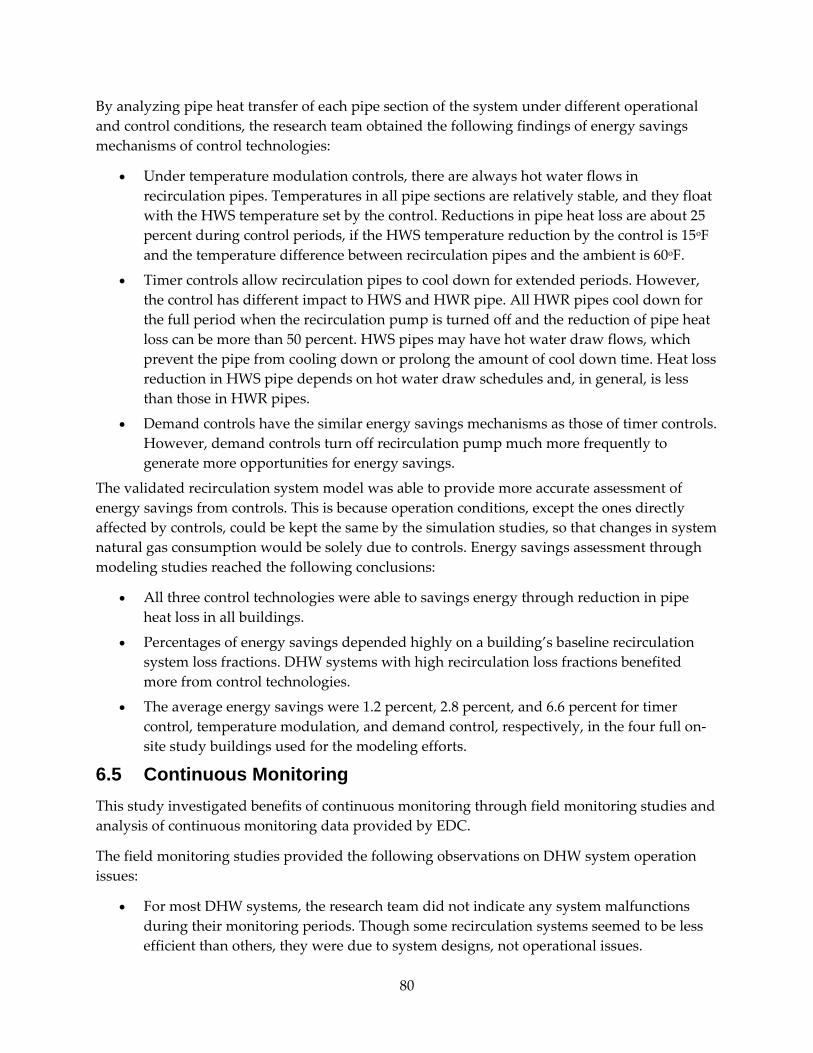
80
By analyzing pipe heat transfer of each pipe section of the system under different operational
and control conditions, the research team obtained the following findings of energy savings
mechanisms of control technologies:
Under temperature modulation controls, there are always hot water flows in
recirculation pipes. Temperatures in all pipe sections are relatively stable, and they float
with the HWS temperature set by the control. Reductions in pipe heat loss are about 25
percent during control periods, if the HWS temperature reduction by the control is 15oF
and the temperature difference between recirculation pipes and the ambient is 60oF.
Timer controls allow recirculation pipes to cool down for extended periods. However,
the control has different impact to HWS and HWR pipe. All HWR pipes cool down for
the full period when the recirculation pump is turned off and the reduction of pipe heat
loss can be more than 50 percent. HWS pipes may have hot water draw flows, which
prevent the pipe from cooling down or prolong the amount of cool down time. Heat loss
reduction in HWS pipe depends on hot water draw schedules and, in general, is less
than those in HWR pipes.
Demand controls have the similar energy savings mechanisms as those of timer controls.
However, demand controls turn off recirculation pump much more frequently to
generate more opportunities for energy savings.
The validated recirculation system model was able to provide more accurate assessment of
energy savings from controls. This is because operation conditions, except the ones directly
affected by controls, could be kept the same by the simulation studies, so that changes in system
natural gas consumption would be solely due to controls. Energy savings assessment through
modeling studies reached the following conclusions:
All three control technologies were able to savings energy through reduction in pipe
heat loss in all buildings.
Percentages of energy savings depended highly on a building’s baseline recirculation
system loss fractions. DHW systems with high recirculation loss fractions benefited
more from control technologies.
The average energy savings were 1.2 percent, 2.8 percent, and 6.6 percent for timer
control, temperature modulation, and demand control, respectively, in the four full on‐
site study buildings used for the modeling efforts.
6.5 Continuous Monitoring
This study investigated benefits of continuous monitoring through field monitoring studies and
analysis of continuous monitoring data provided by EDC.
The field monitoring studies provided the following observations on DHW system operation
issues:
For most DHW systems, the research team did not indicate any system malfunctions
during their monitoring periods. Though some recirculation systems seemed to be less
efficient than others, they were due to system designs, not operational issues.
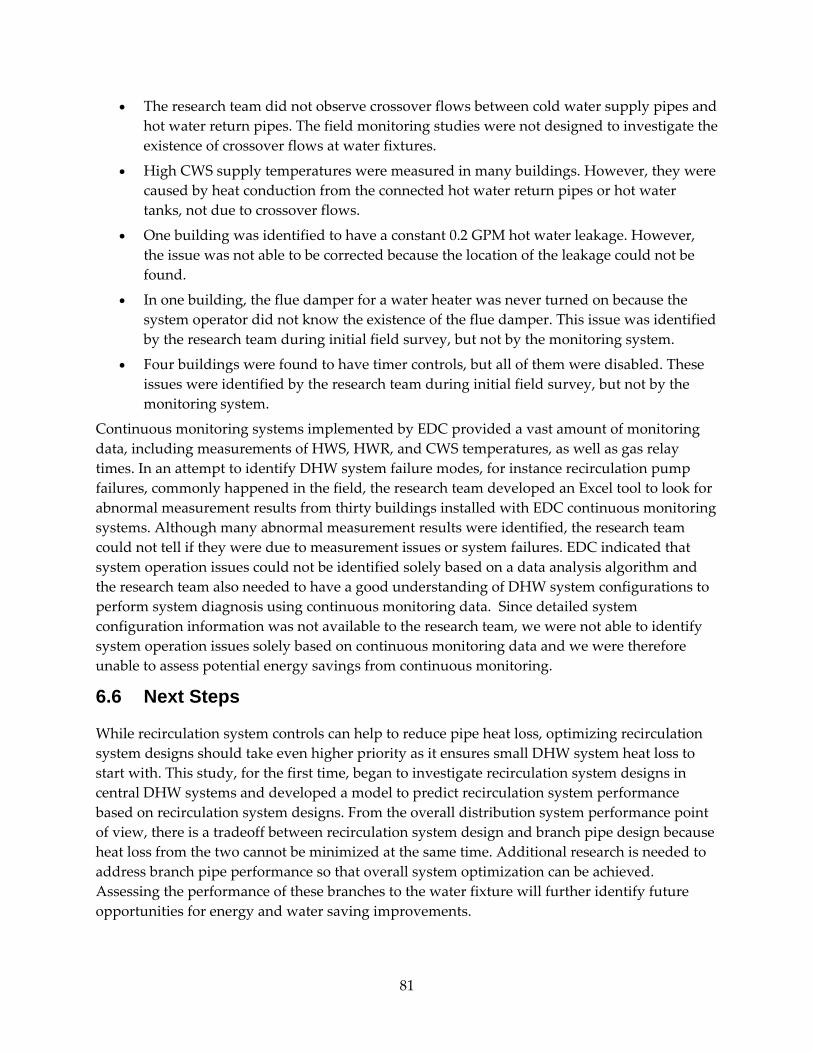
81
The research team did not observe crossover flows between cold water supply pipes and
hot water return pipes. The field monitoring studies were not designed to investigate the
existence of crossover flows at water fixtures.
High CWS supply temperatures were measured in many buildings. However, they were
caused by heat conduction from the connected hot water return pipes or hot water
tanks, not due to crossover flows.
One building was identified to have a constant 0.2 GPM hot water leakage. However,
the issue was not able to be corrected because the location of the leakage could not be
found.
In one building, the flue damper for a water heater was never turned on because the
system operator did not know the existence of the flue damper. This issue was identified
by the research team during initial field survey, but not by the monitoring system.
Four buildings were found to have timer controls, but all of them were disabled. These
issues were identified by the research team during initial field survey, but not by the
monitoring system.
Continuous monitoring systems implemented by EDC provided a vast amount of monitoring
data, including measurements of HWS, HWR, and CWS temperatures, as well as gas relay
times. In an attempt to identify DHW system failure modes, for instance recirculation pump
failures, commonly happened in the field, the research team developed an Excel tool to look for
abnormal measurement results from thirty buildings installed with EDC continuous monitoring
systems. Although many abnormal measurement results were identified, the research team
could not tell if they were due to measurement issues or system failures. EDC indicated that
system operation issues could not be identified solely based on a data analysis algorithm and
the research team also needed to have a good understanding of DHW system configurations to
perform system diagnosis using continuous monitoring data. Since detailed system
configuration information was not available to the research team, we were not able to identify
system operation issues solely based on continuous monitoring data and we were therefore
unable to assess potential energy savings from continuous monitoring.
6.6 Next Steps
While recirculation system controls can help to reduce pipe heat loss, optimizing recirculation
system designs should take even higher priority as it ensures small DHW system heat loss to
start with. This study, for the first time, began to investigate recirculation system designs in
central DHW systems and developed a model to predict recirculation system performance
based on recirculation system designs. From the overall distribution system performance point
of view, there is a tradeoff between recirculation system design and branch pipe design because
heat loss from the two cannot be minimized at the same time. Additional research is needed to
address branch pipe performance so that overall system optimization can be achieved.
Assessing the performance of these branches to the water fixture will further identify future
opportunities for energy and water saving improvements.

82
This study provided a better understanding of energy savings mechanisms of control
technologies. Further studies should be conducted to help improve existing control technologies
and to demonstrate new control technologies, based on the findings from this study.

83
CHAPTER 7: Technology Transfer 7.1 Central DHW System Design Guide
The study developed guidelines for central DHW system designs and improvement. They were
organized and printed as a 10‐page brochure and a one‐page flyer with professional graphic
designs. The brochure provided details information to guide mechanical system designer to
design and retrofit DHW systems. The flyer was a condensed version of the brochure to convey
main energy efficiency measures to developers, building owners, and operators.
7.2 ACEEE Hot Water Forum Presentations
The following presentations have been made on this research area:
2008 ACEEE Hot Water Forum
“Multifamily Central DHW Field Study for Title 24 Implementation” by Owen Howlett
Available at http://www.aceee.org/files/pdf/conferences/hwf/2008/4b_howlett.pdf
2009 ACEEE Hot Water Forum
“PIER Multifamily Central Domestic Hot Water Systems ‐ Central vs. Distributed
Architectures” by Yanda Zhang
Available at http://www.aceee.org/files/pdf/conferences/hwf/2009/1B‐Multifamily1‐Zhang.pdf
“PIER Multifamily Central Domestic Hot Water Systems – Recirculating System Controls”,
by Yanda Zhang
Available at http://www.aceee.org/files/pdf/conferences/hwf/2009/2B‐Multifamily2‐Zhang.pdf
2010 ACEEE Hot Water Forum
“Central Domestic Hot Water Systems in Multi‐Family Buildings” by Charlotte Bonneville
Available at http://www.aceee.org/files/pdf/conferences/hwf/2010/3C_Charlotte_Bonneville.pdf
2011 ACEEE Hot Water Forum
“DHW Recirculation System Performance in Multi‐Family Buildings” by Yanda Zhang
Available at http://www.aceee.org/files/pdf/conferences/hwf/2011/1C%20‐
%20Yanda%20Zhang.pdf.
7.3 2013 Title 24 Development
With additional funding provided by IOU Codes and Standards (C&S) programs, the research
team conducted two Codes and Standards Enhancement (CASE) studies. The Space and Water
Heating CASE study developed and proposed, along with other measures, the performance

84
calculation algorithms for recirculation systems in multi‐family and hotel/motel buildings. The
multifamily DHW CASE study developed and proposed prescriptive requirements for
recirculation systems, along with solar water requirements for DHW systems, in multi‐family
and hotel/motel buildings. In both CASE studies, recirculation system related development was
based on research findings from this study. The draft reports for these two studies are available
at the Energy Commission 2013 Title 24 rulemaking home page.
http://www.energy.ca.gov/title24/2013standards/prerulemaking/documents/current/Reports/Re
sidential/Water_Heating/2013_CASE_NR_Space_and_Water_Heating_Oct_2011.pdf
http://www.energy.ca.gov/title24/2013standards/prerulemaking/documents/current/Reports/Re
sidential/Water_Heating/2013_CASE_R_MF_DHW_and_Solar_Water_Heating_Oct_2011.pdf

85
GLOSSARY
2008 PIER Pier Study on Multi-Family Central DHW System (HMG 2008)
Btu British thermal unit
C&S Codes and Standards
CASE Codes and Standards Enhancement
CPR Critical Project Review
CWS Cold Water Supply
DHW Domestic Hot Water
EDC EDC Technology, Inc.
Energy Commission California Energy Commission
GPM Gallons Per Minute
HMG Heschong Mahone Group
HWR Hot Water Return
HWS Hot Water Supply
IOU California Investor Owned Utilities
PAC Project Advisory Committee
PIER Public Interest Energy Research

86
REFERENCES
Gutierrez, Jorge and Woo, Kevin 2008. EDC, Inc. Hot Water Recirculating System Study. June 1‐
3, 2008 – ACEEE Water Heating Conference.
Heschong Mahone Group (HMG) 2007. Codes and Standards Enhancement Initiative (CASE),
Revised Report: Central Hot Water Distribution Systems in Multifamily Buildings.
Heschong Mahone Group (HMG) 2008. Water Heaters and Hot Water Distribution Systems,
PIER Final Project Appendices, Appendix A, Energy Commission‐500‐2005‐007‐APA
Incropera, Frank P. and DeWitt, David P. 2002. Fundamentals of Heat and Mass Transfer, 5th
Edition, ISBN 0‐471‐38650‐2
Itron 2006. Impact Evaluation of the 2004‐2005 Statewide Multifamily Boiler Control Measure.
KEMA 2008. Multifamily Boiler Controls – Process Evaluation SoCal Gas’ and SDG&E’s 2006‐
2008 Multifamily Energy Efficiency Rebate Program, CALMAC Study ID: SDG0227.01,
Lobenstein, M.S, Bohac, D.L., Staller T.J., Dunsworth T.S., and Hancock M.W. 1992. Measured
Savings from Domestic Hot Water Temperature Control Strategies in Multi‐family
Buildings with Recirculation Loops. Report to Energy Resource Center, Legislative
Committee on Minnesota Resources, Contract # 02140‐03535.
Stone, Nehemiah 2008. Central Domestic Hot Water System Study. June 1‐3, 2008 – ACEEE
Water Heating Conference.

A‐1
APPENDIX A: Field Monitoring Study Buildings
Table 18 presents pictures of field monitoring study buildings and their DHW systems. Some of
these pictures had been edited to remove the information that may lead to the disclosure of the
identities of the buildings.
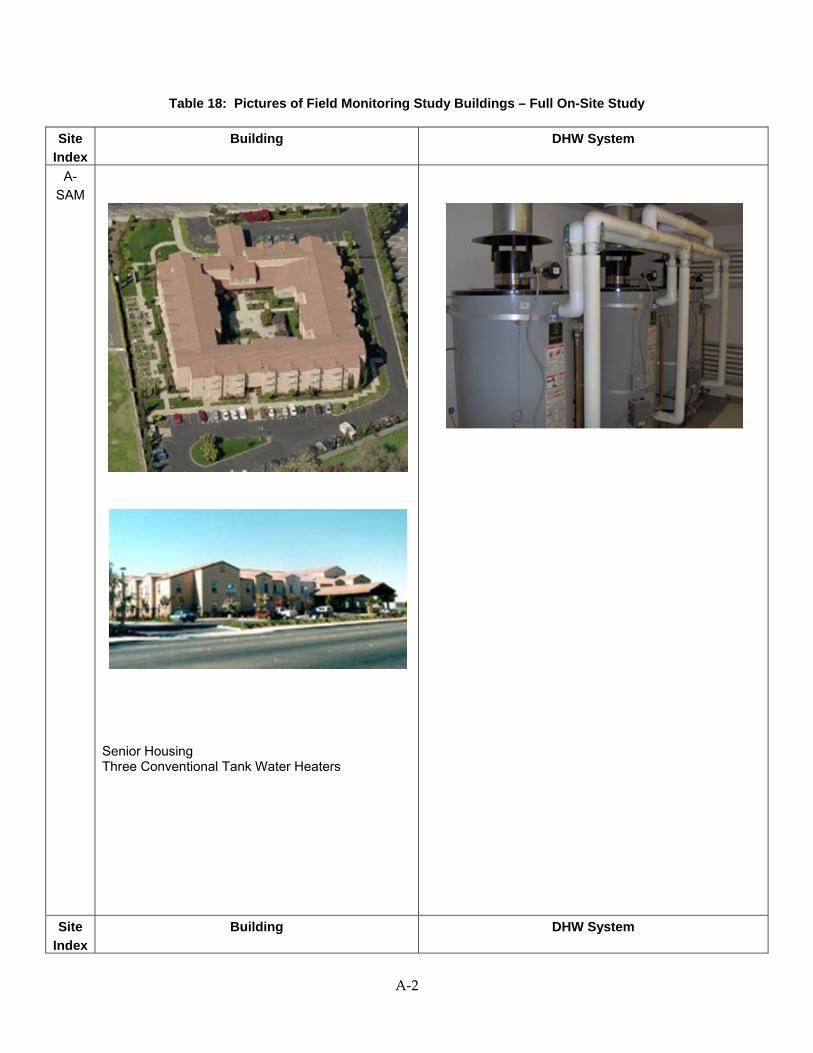
A‐2
Table 18: Pictures of Field Monitoring Study Buildings – Full On-Site Study
Site Index
Building DHW System
A-SAM
Senior Housing Three Conventional Tank Water Heaters
Site
Index
Building DHW System

A‐3
B-
SFD
Non-Senior Housing Multiple Boilers and Storage Tank
Site Index
Building DHW System
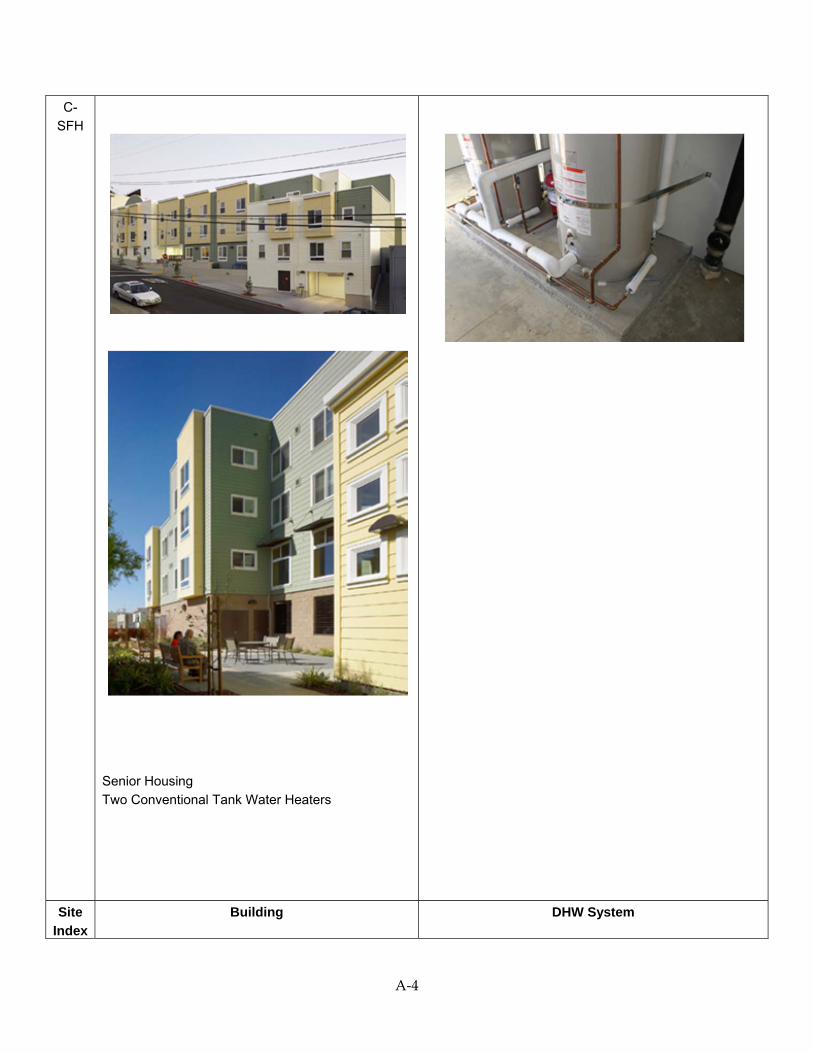
A‐4
C-
SFH
Senior Housing Two Conventional Tank Water Heaters
Site
Index
Building DHW System
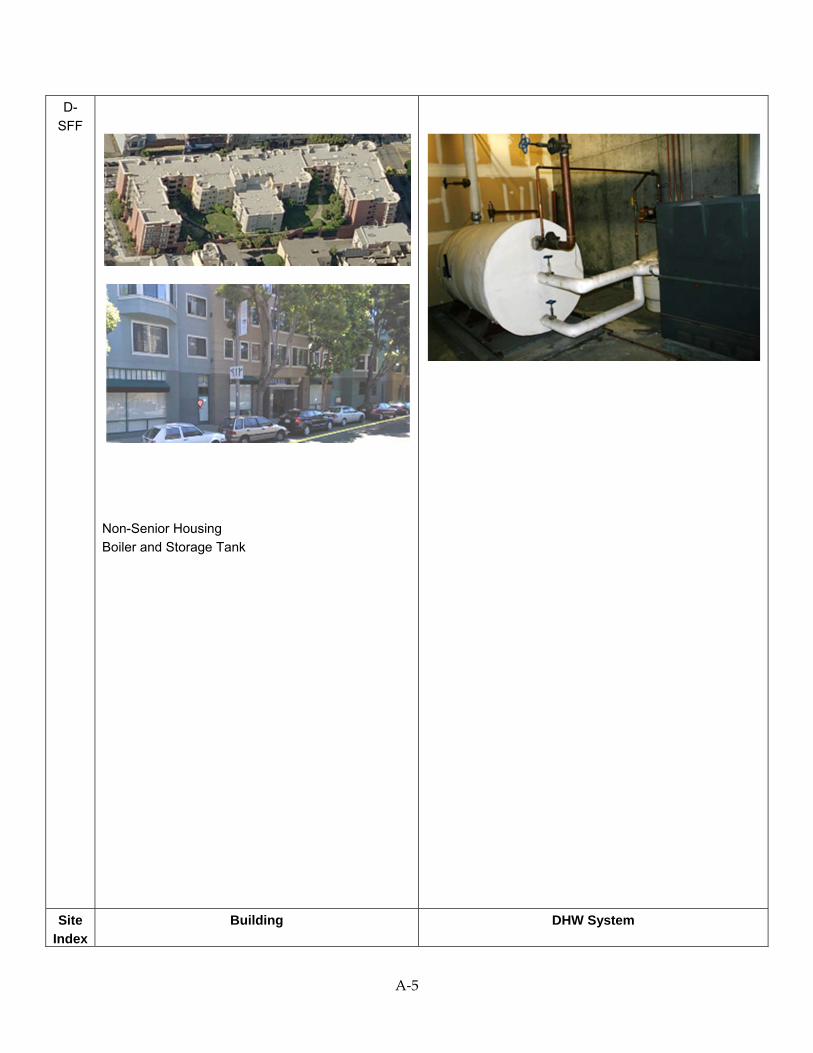
A‐5
D-
SFF
Non-Senior Housing Boiler and Storage Tank
Site Index
Building DHW System
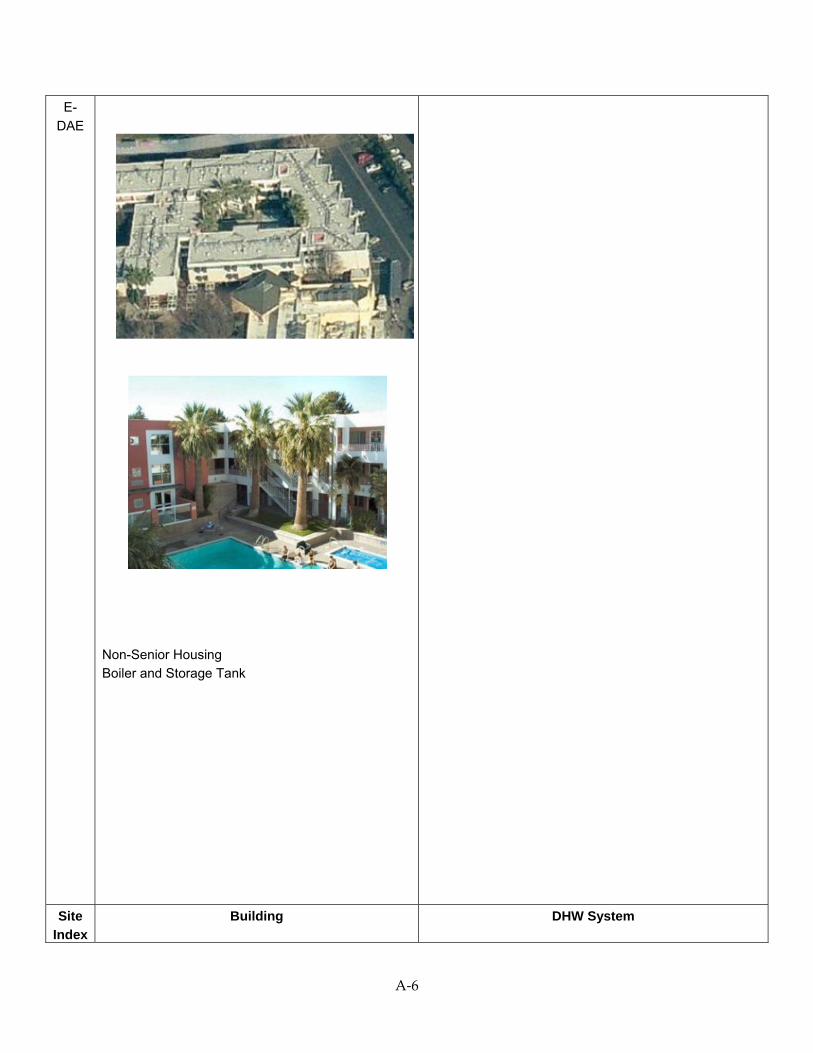
A‐6
E-
DAE
Non-Senior Housing Boiler and Storage Tank
Site Index
Building DHW System
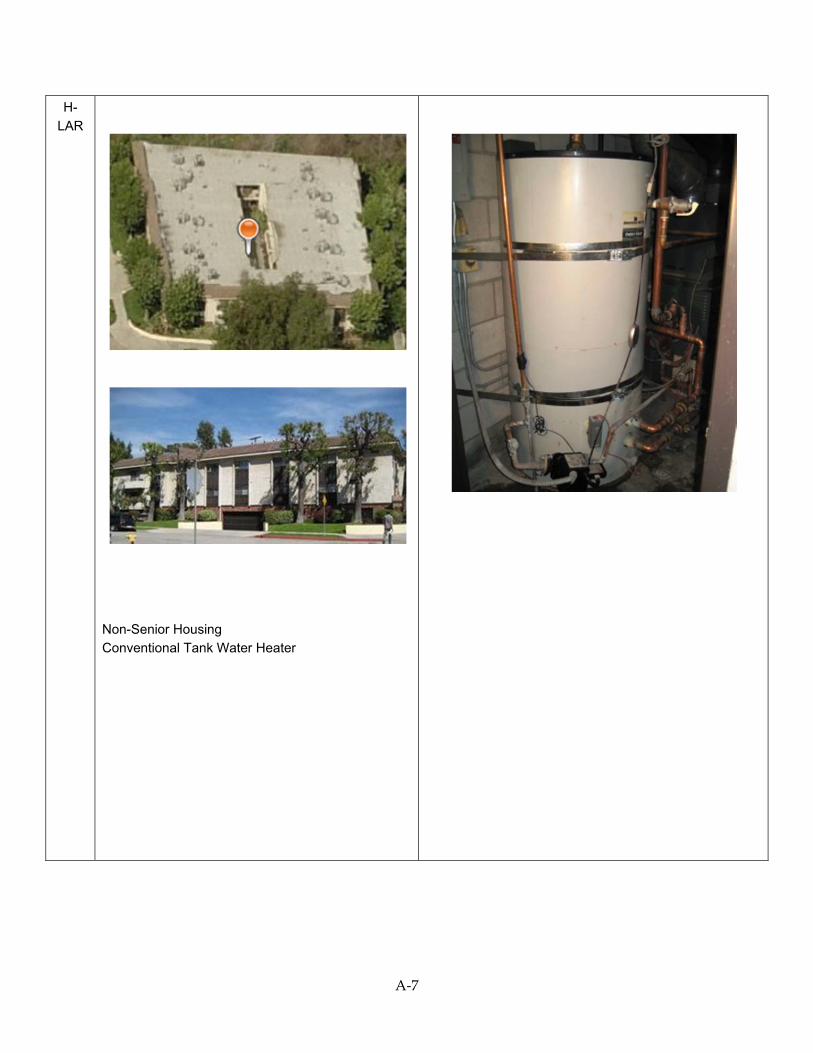
A‐7
H-
LAR
Non-Senior Housing Conventional Tank Water Heater

A‐8
Table 19: Pictures of Field Monitoring Study Buildings – Partial On-Site Study
Site Index
Building DHW System
1-SFB
Non-Senior Housing
Two Conventional Tank Water Heaters
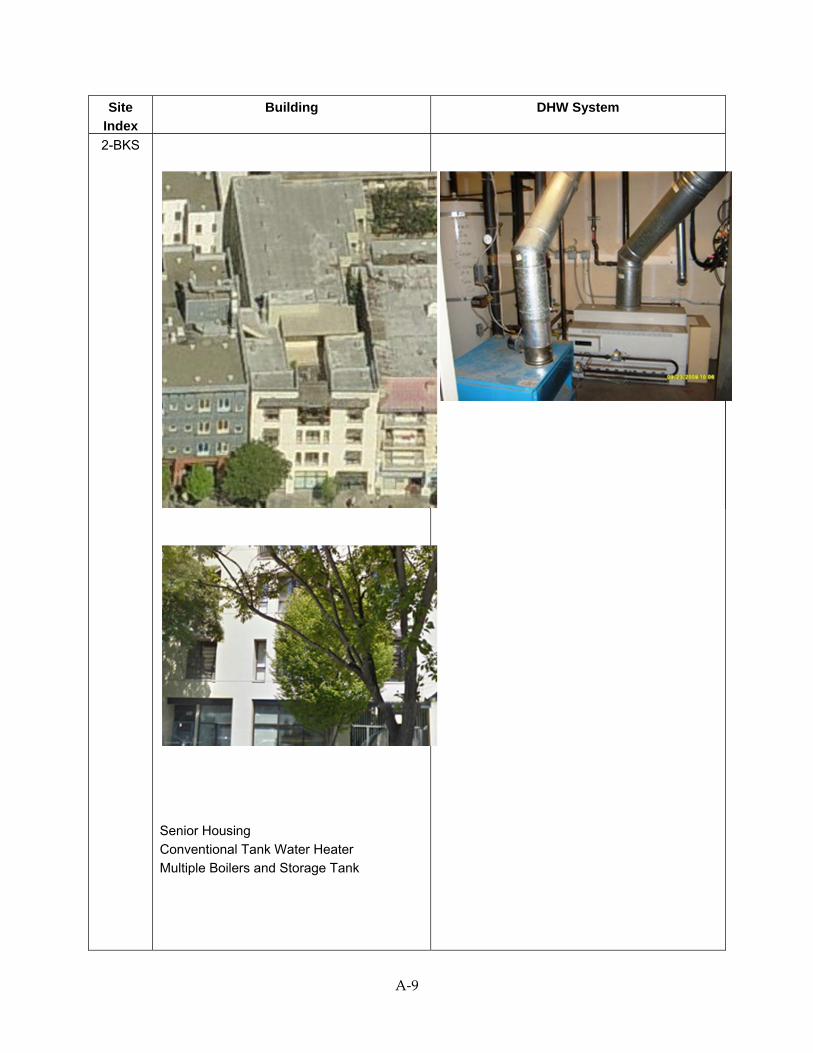
A‐9
Site
Index
Building DHW System
2-BKS
Senior Housing
Conventional Tank Water Heater Multiple Boilers and Storage Tank
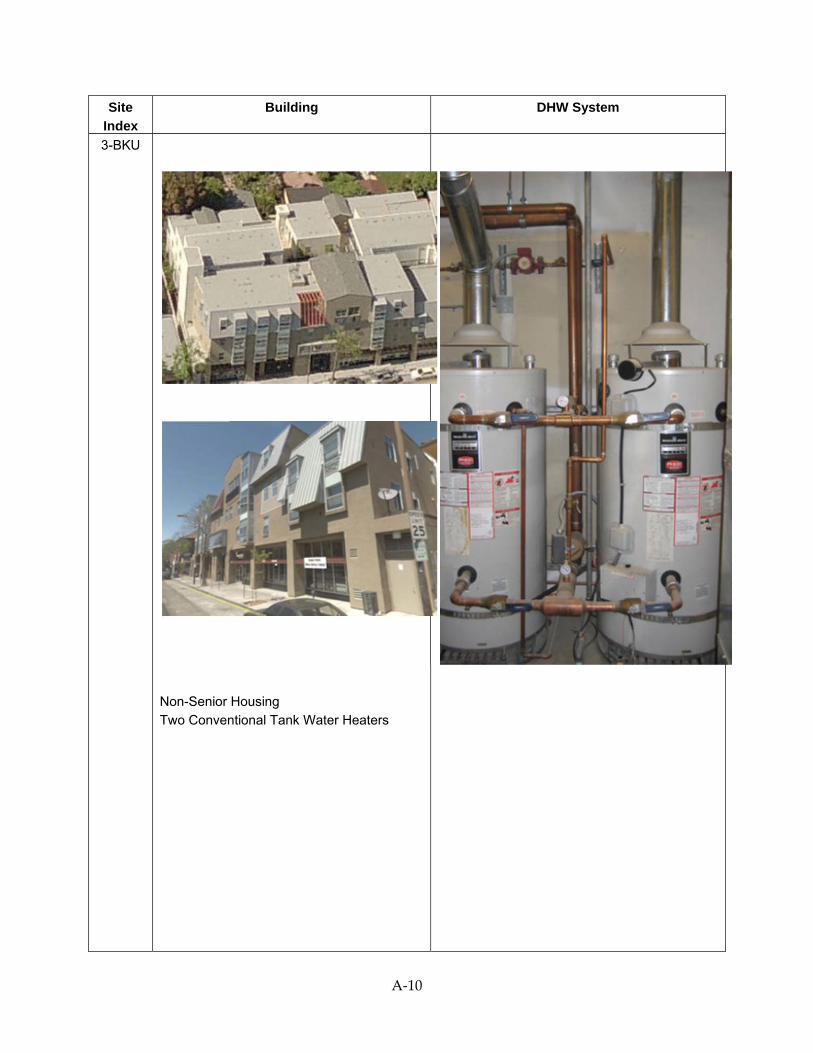
A‐10
Site
Index
Building DHW System
3-BKU
Non-Senior Housing Two Conventional Tank Water Heaters
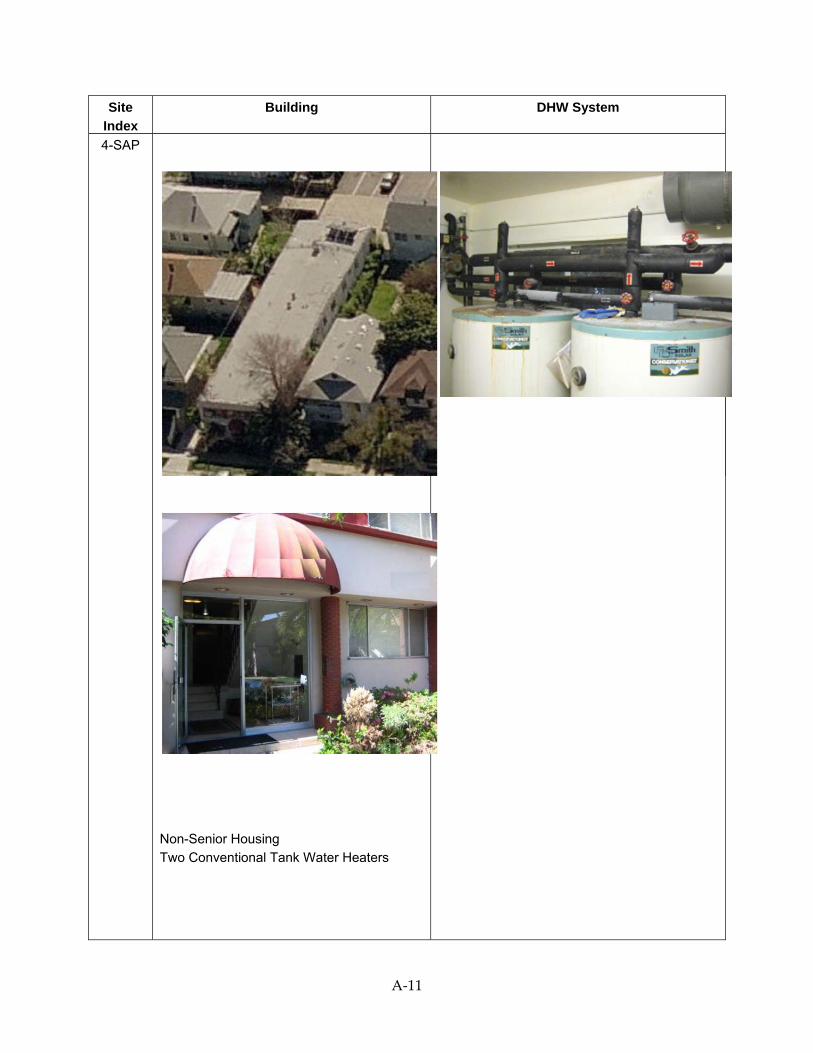
A‐11
Site
Index
Building DHW System
4-SAP
Non-Senior Housing Two Conventional Tank Water Heaters
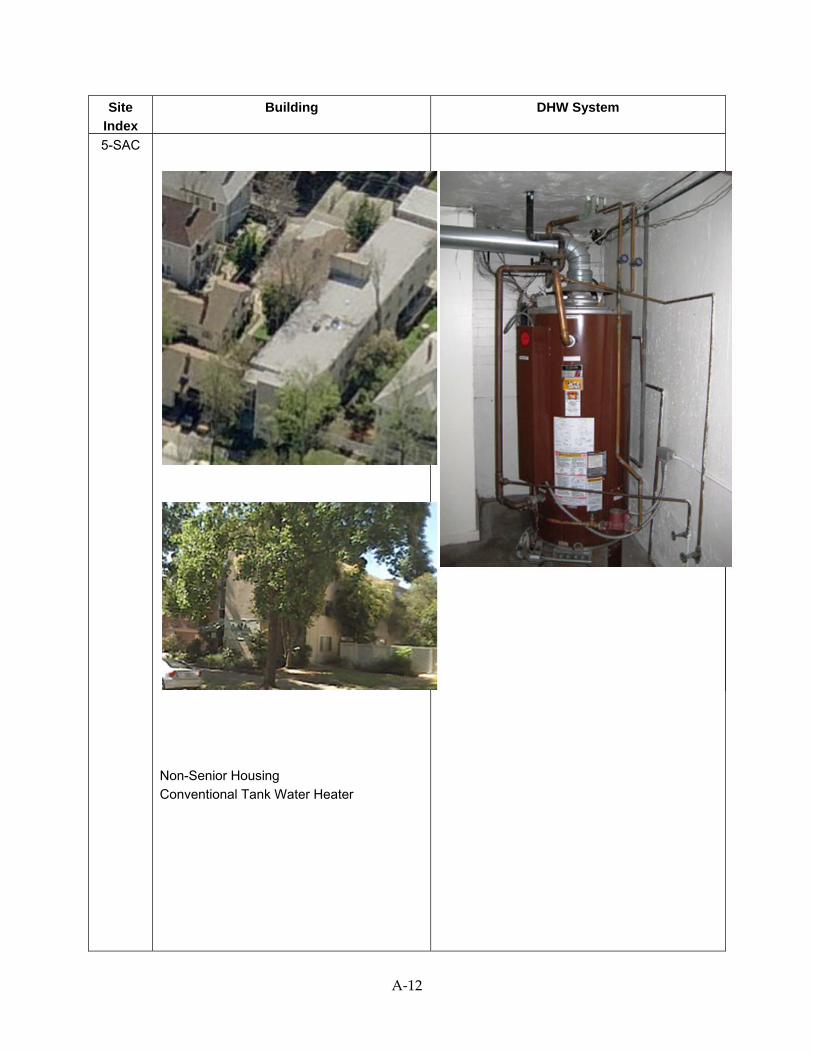
A‐12
Site
Index
Building DHW System
5-SAC
Non-Senior Housing
Conventional Tank Water Heater

A‐13
Site
Index
Building DHW System
6-DAK
Large Non-Senior Housing Multiple Boilers and Storage Tanks
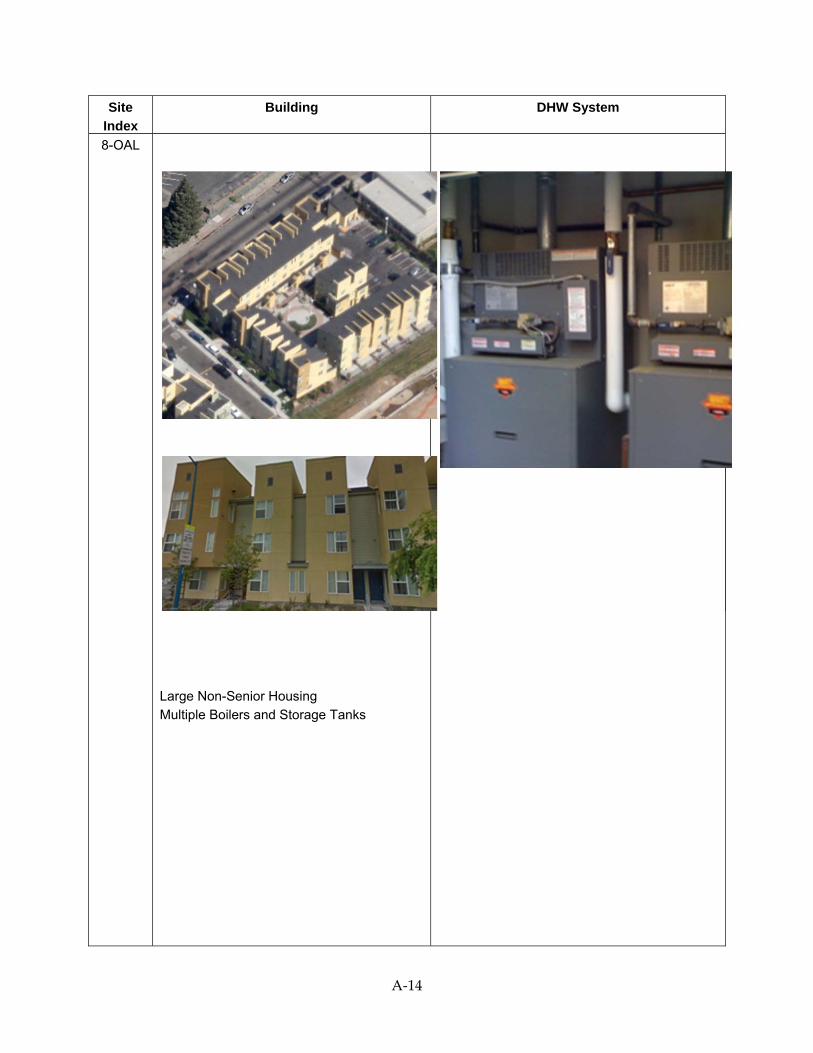
A‐14
Site
Index
Building DHW System
8-OAL
Large Non-Senior Housing Multiple Boilers and Storage Tanks

A‐15
Site
Index
Building DHW System
9-OAL
Non-Senior Housing Condensing Water Heater
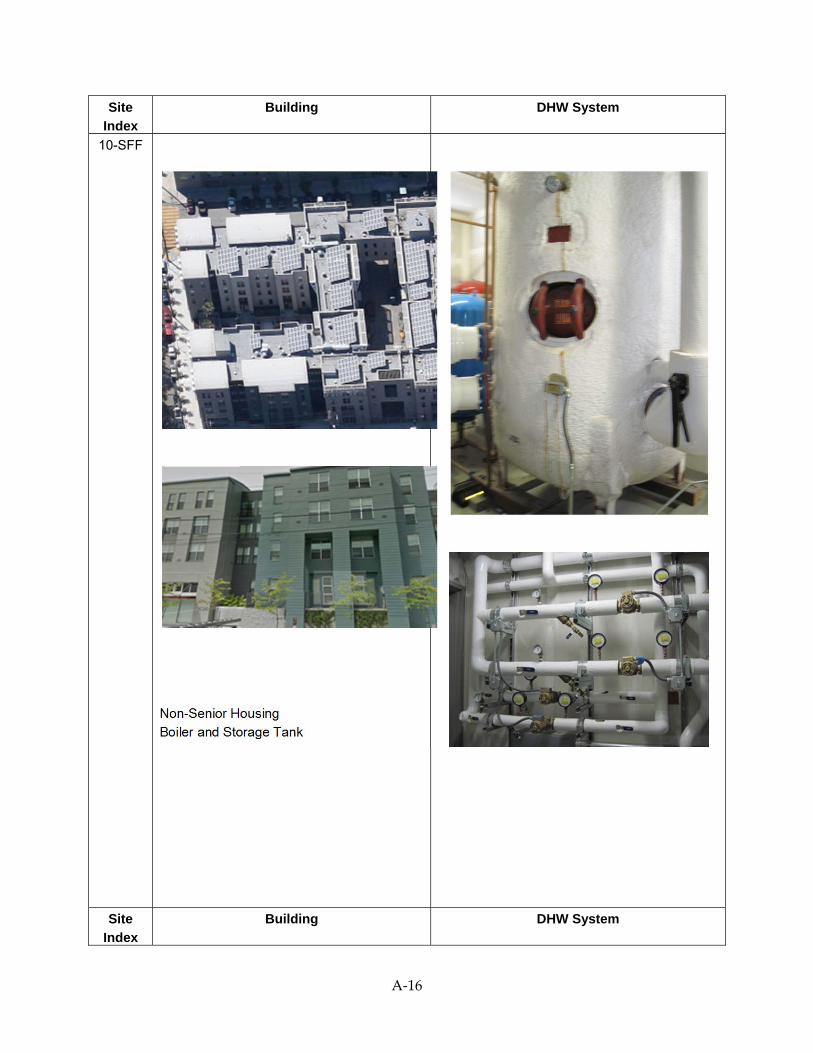
A‐16
Site
Index
Building DHW System
10-SFF
Non-Senior Housing
Boiler and Storage Tank
Site
Index
Building DHW System

A‐17
11-HOB
Non-Senior Housing Conventional Tank Water Heater
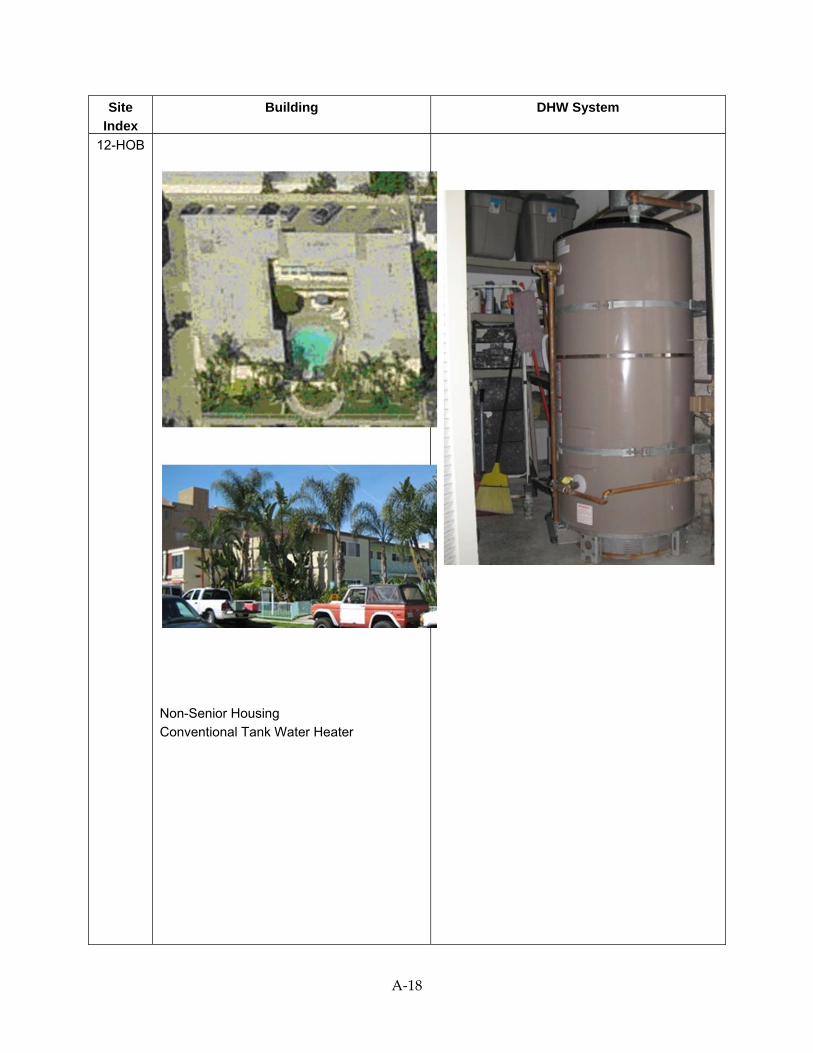
A‐18
Site
Index
Building DHW System
12-HOB
Non-Senior Housing
Conventional Tank Water Heater
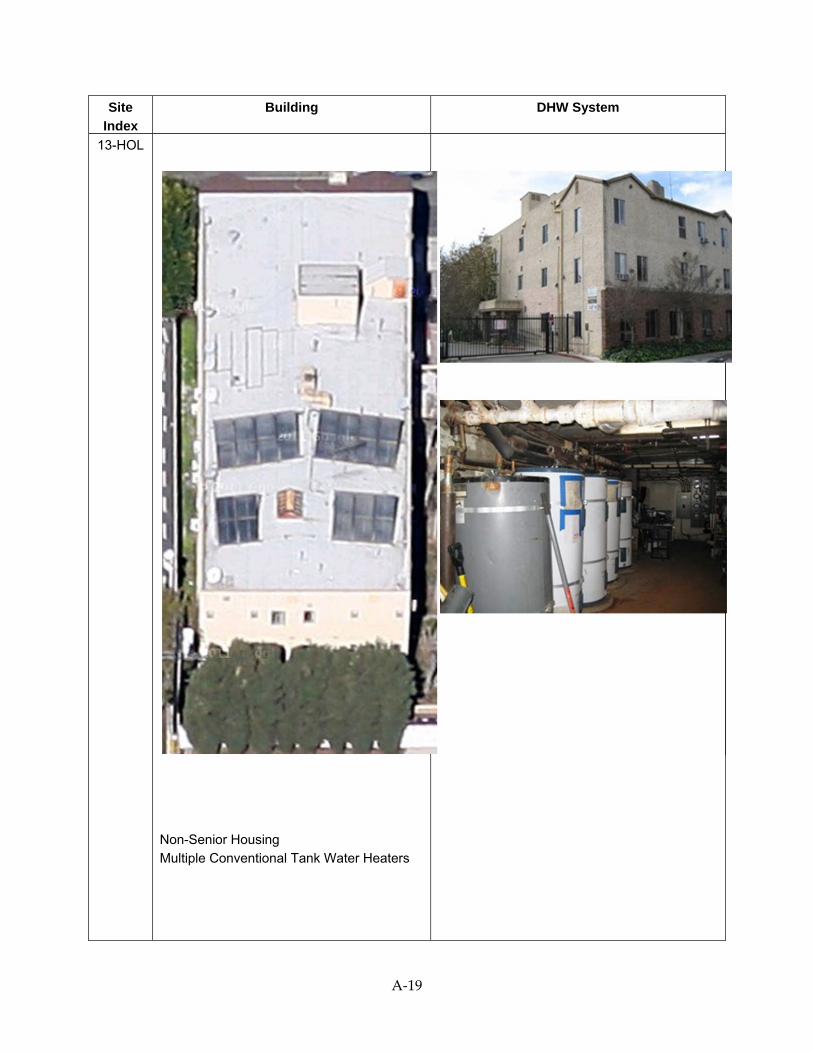
A‐19
Site
Index
Building DHW System
13-HOL
Non-Senior Housing Multiple Conventional Tank Water Heaters
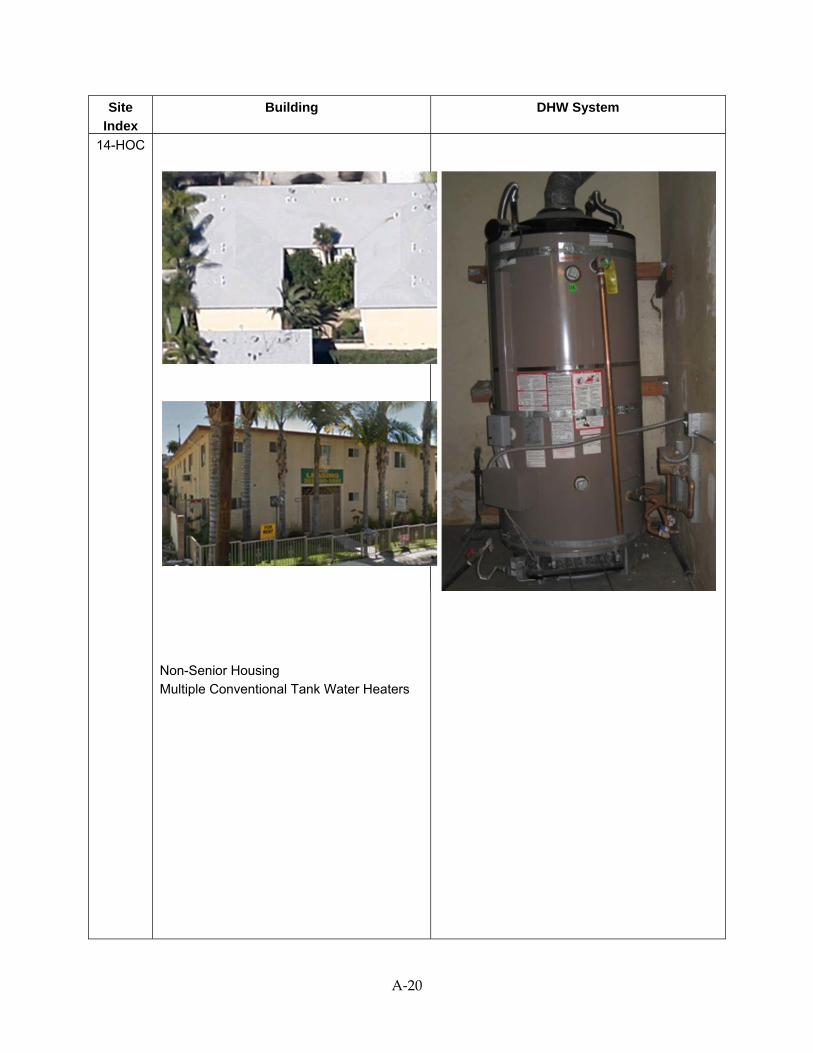
A‐20
Site
Index
Building DHW System
14-HOC
Non-Senior Housing Multiple Conventional Tank Water Heaters

A‐21
Site
Index
Building DHW System
15-HOL
Non-Senior Housing Multiple Boiler and Storage Tank

A‐22
Site
Index
Building DHW System
16-DAR
Non-Senior Housing Boiler and Storage Tank
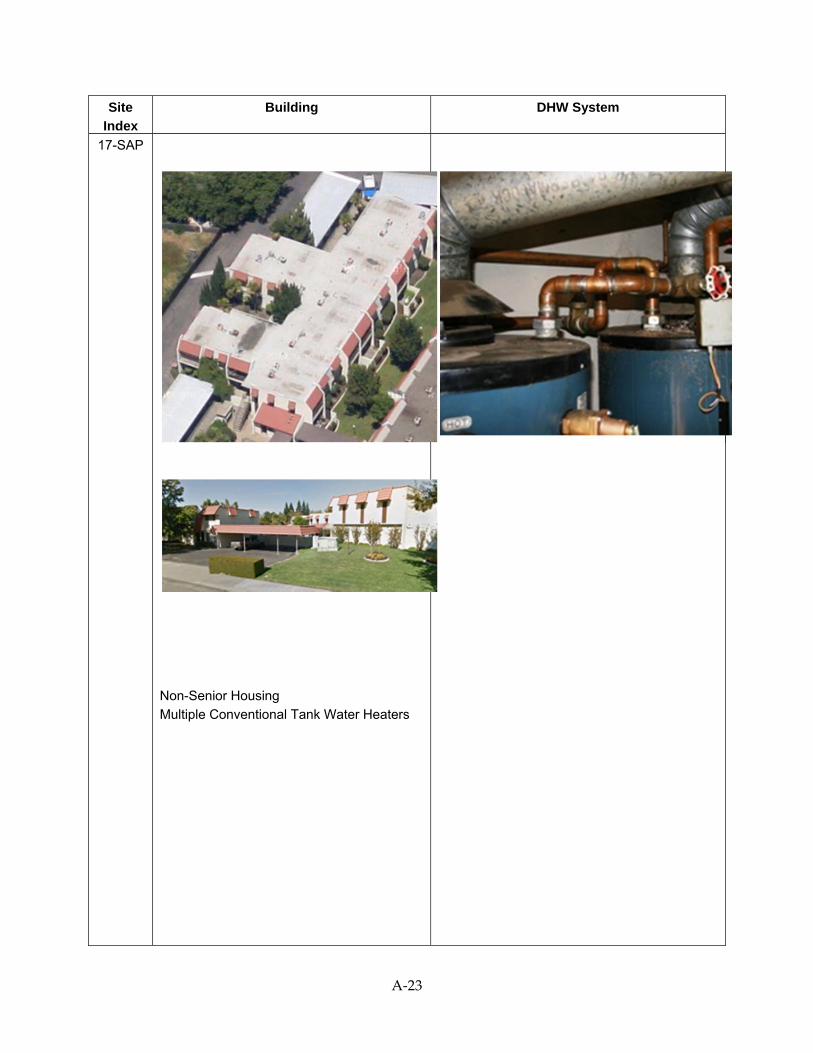
A‐23
Site
Index
Building DHW System
17-SAP
Non-Senior Housing
Multiple Conventional Tank Water Heaters
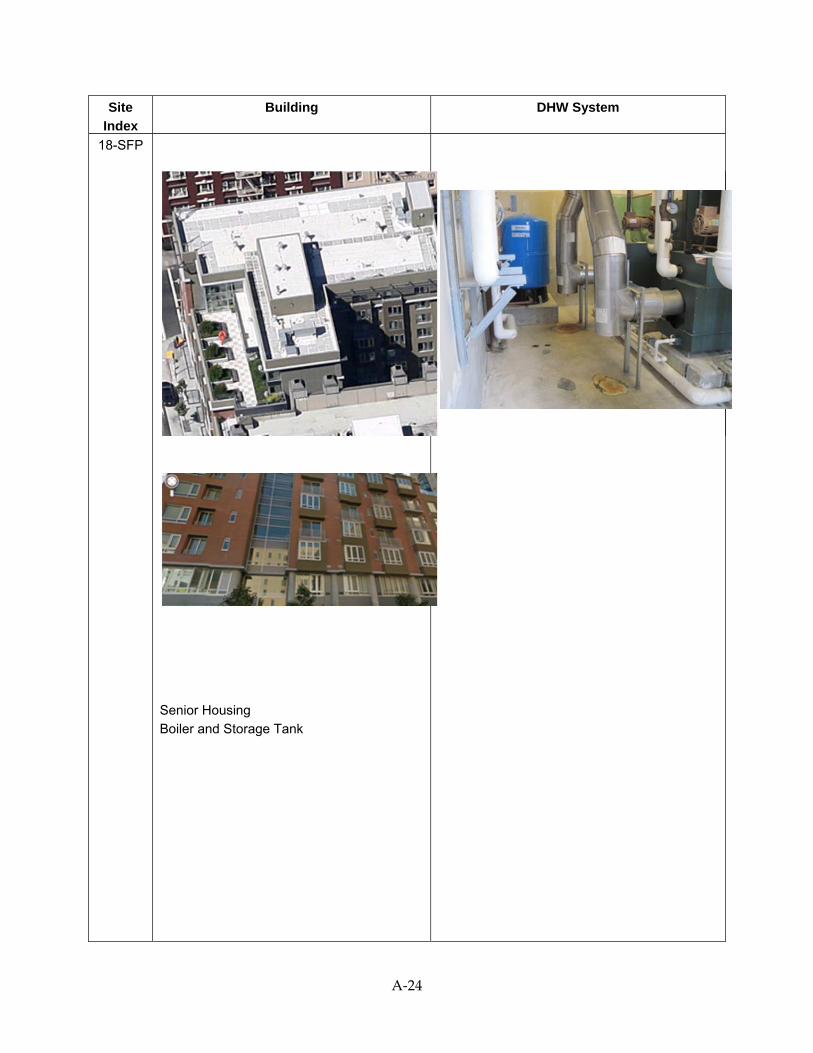
A‐24
Site
Index
Building DHW System
18-SFP
Senior Housing
Boiler and Storage Tank
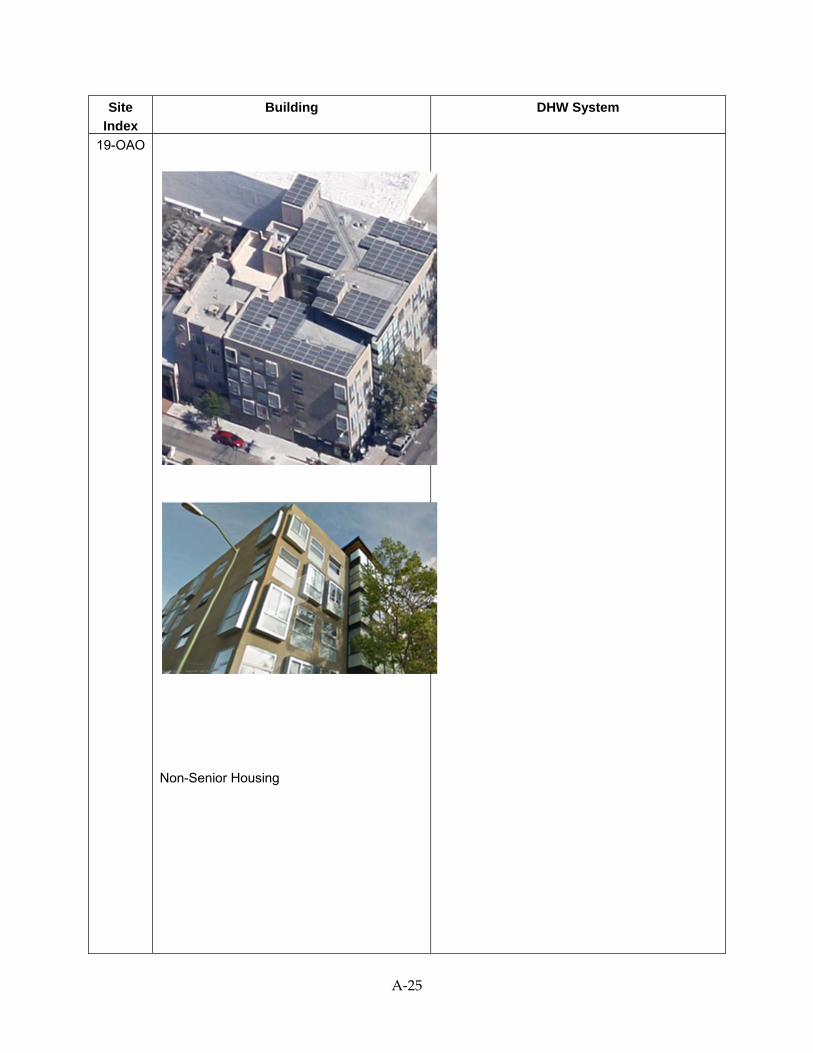
A‐25
Site
Index
Building DHW System
19-OAO
Non-Senior Housing

A‐26
Site
Index
Building DHW System
20-LAE
Non-Senior Housing Multiple Boiler and Storage Tanks

B‐1
APPENDIX B: Historical Monitoring Data Analysis
This appendix summarizes HWS temperature settings in buildings using the temperature
modulation and continuous monitoring technology from EDC Technology Inc. (EDC). In
general, HWS temperatures were reduced at night to save energy and were increased above
daytime average temperatures early in the morning to meet the morning peak demand. EDC’s
continuous monitoring services aimed to help system operators to promptly identify and fix
system operational issues and to avoid the use of high HWS temperatures.
On average, HWS temperatures were reduced for 5 hours during the night, with a 1‐hour
transition period on both ends of the 5‐hour period. Using this averaged control scheme to
curve fit the measured HWS temperatures, the amounts of temperature reduction at night were
obtained. Error! Reference source not found. presents the curve fitting results for 30 buildings
using the control and monitoring technology from EDC.
Table 20 summarizes the average HWS temperatures and HWS temperature reductions at
night, presented in graphical form in Figure 25. The average daytime HWS temperature
represents the HWS temperature achieved by the continuous monitoring function. The average
temperature reduction at night represents the typical amount of temperature modulation.
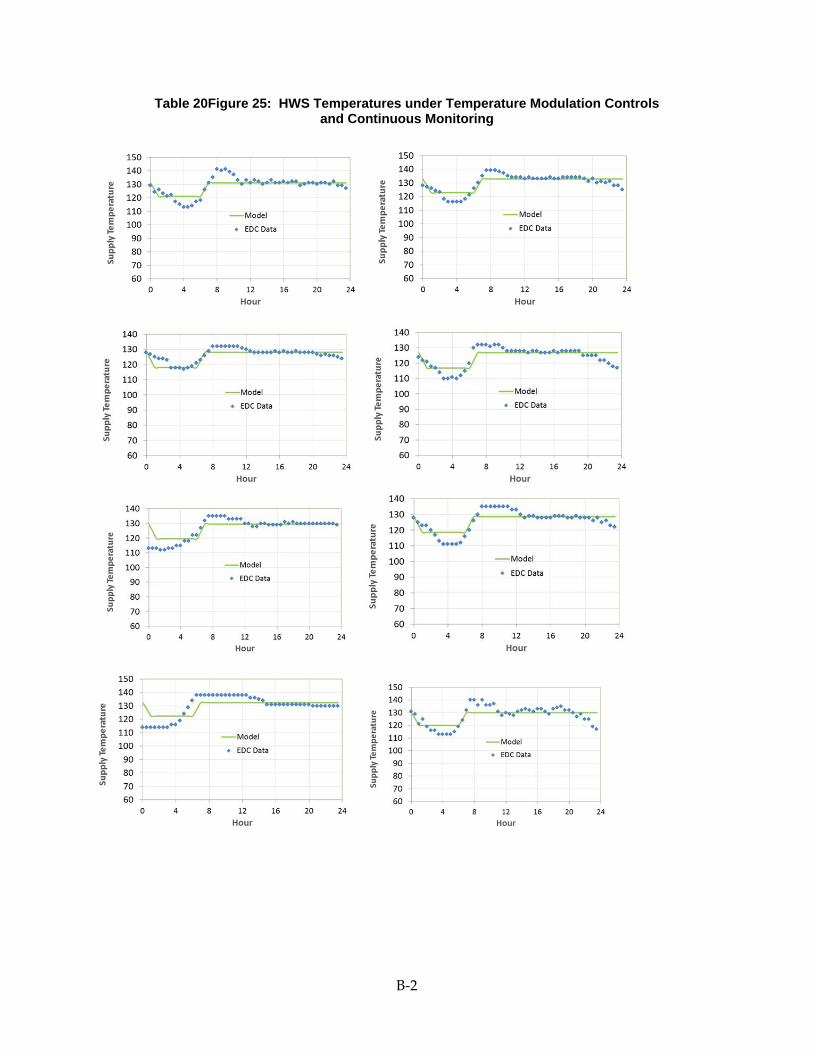
B‐2
Table 20Figure 25: HWS Temperatures under Temperature Modulation Controls and Continuous Monitoring

B‐3
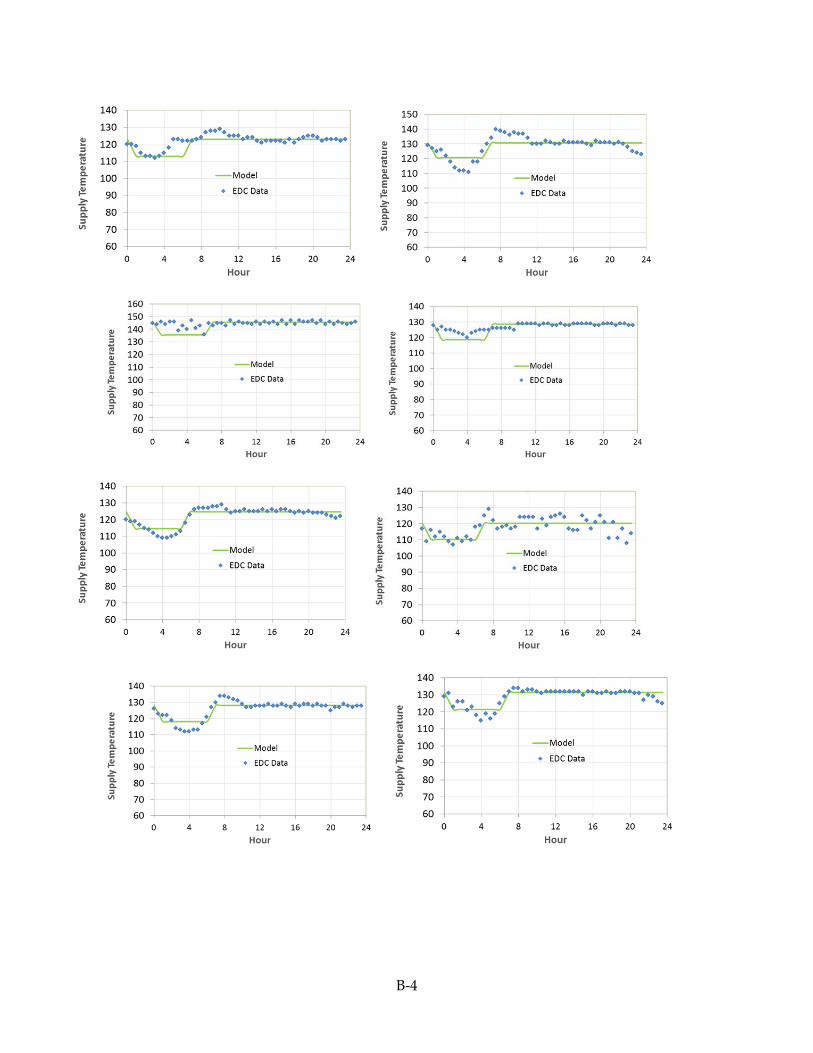
B‐4
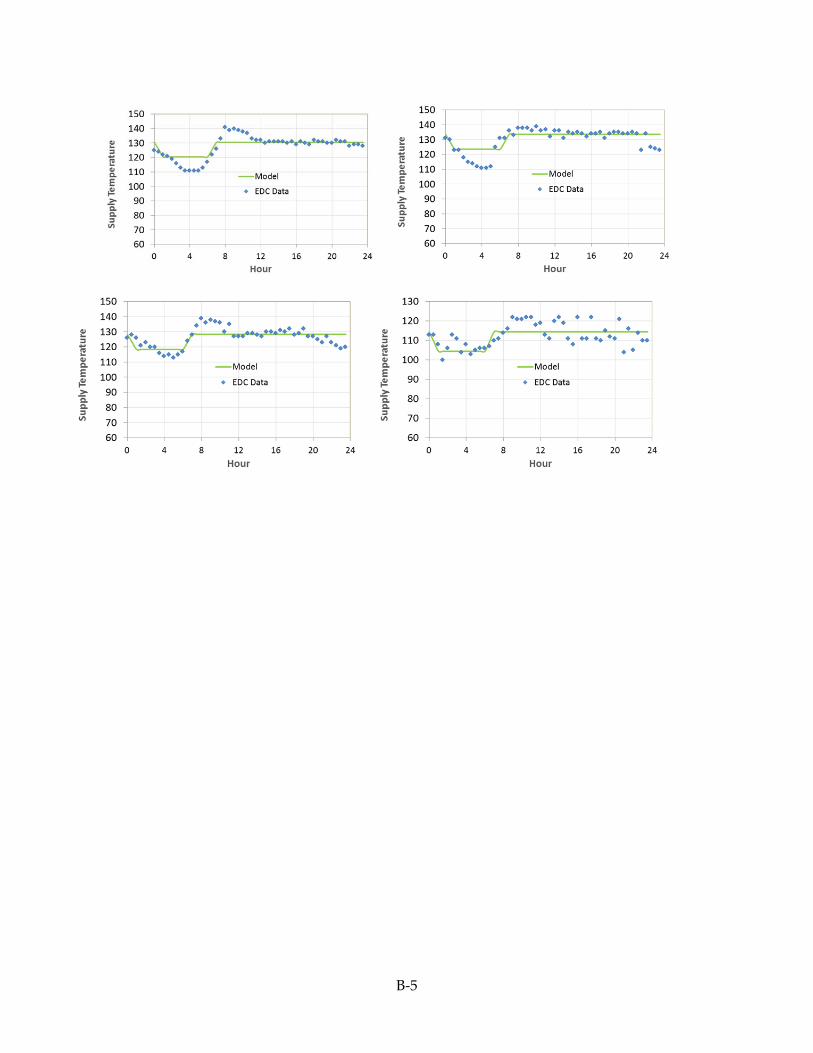
B‐5
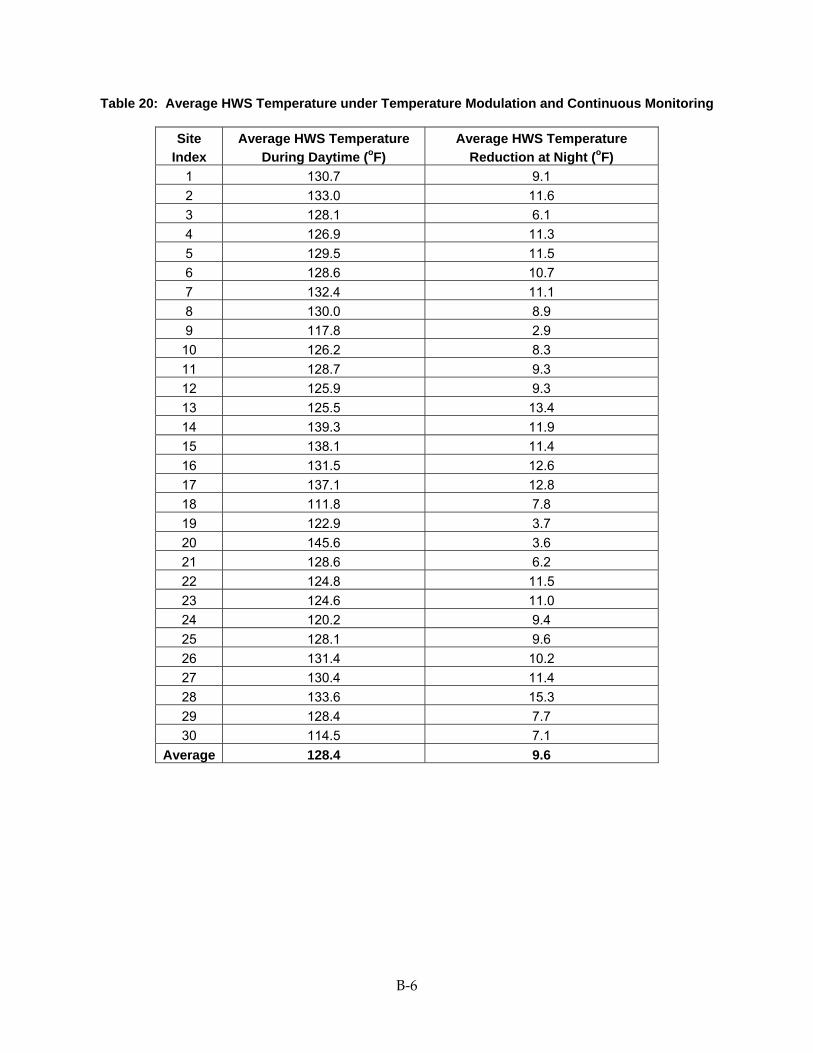
B‐6
Table 20: Average HWS Temperature under Temperature Modulation and Continuous Monitoring
Site Index
Average HWS Temperature During Daytime (oF)
Average HWS Temperature Reduction at Night (oF)
1 130.7 9.1
2 133.0 11.6
3 128.1 6.1
4 126.9 11.3
5 129.5 11.5
6 128.6 10.7
7 132.4 11.1
8 130.0 8.9
9 117.8 2.9
10 126.2 8.3
11 128.7 9.3
12 125.9 9.3
13 125.5 13.4
14 139.3 11.9
15 138.1 11.4
16 131.5 12.6
17 137.1 12.8
18 111.8 7.8
19 122.9 3.7
20 145.6 3.6
21 128.6 6.2
22 124.8 11.5
23 124.6 11.0
24 120.2 9.4
25 128.1 9.6
26 131.4 10.2
27 130.4 11.4
28 133.6 15.3
29 128.4 7.7
30 114.5 7.1
Average 128.4 9.6
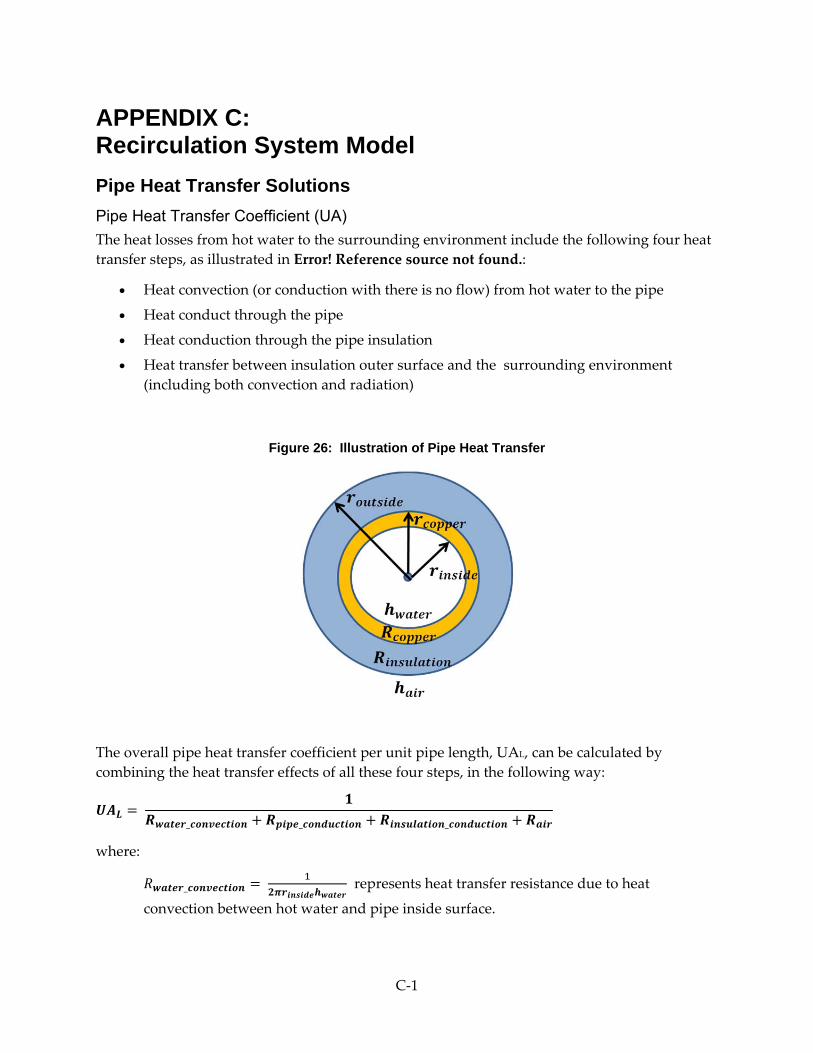
C‐1
APPENDIX C: Recirculation System Model
Pipe Heat Transfer Solutions
Pipe Heat Transfer Coefficient (UA)
The heat losses from hot water to the surrounding environment include the following four heat
transfer steps, as illustrated in Error! Reference source not found.:
Heat convection (or conduction with there is no flow) from hot water to the pipe
Heat conduct through the pipe
Heat conduction through the pipe insulation
Heat transfer between insulation outer surface and the surrounding environment
(including both convection and radiation)
Figure 26: Illustration of Pipe Heat Transfer
The overall pipe heat transfer coefficient per unit pipe length, UAL, can be calculated by
combining the heat transfer effects of all these four steps, in the following way:
_ _ _
where:
_ represents heat transfer resistance due to heat
convection between hot water and pipe inside surface.
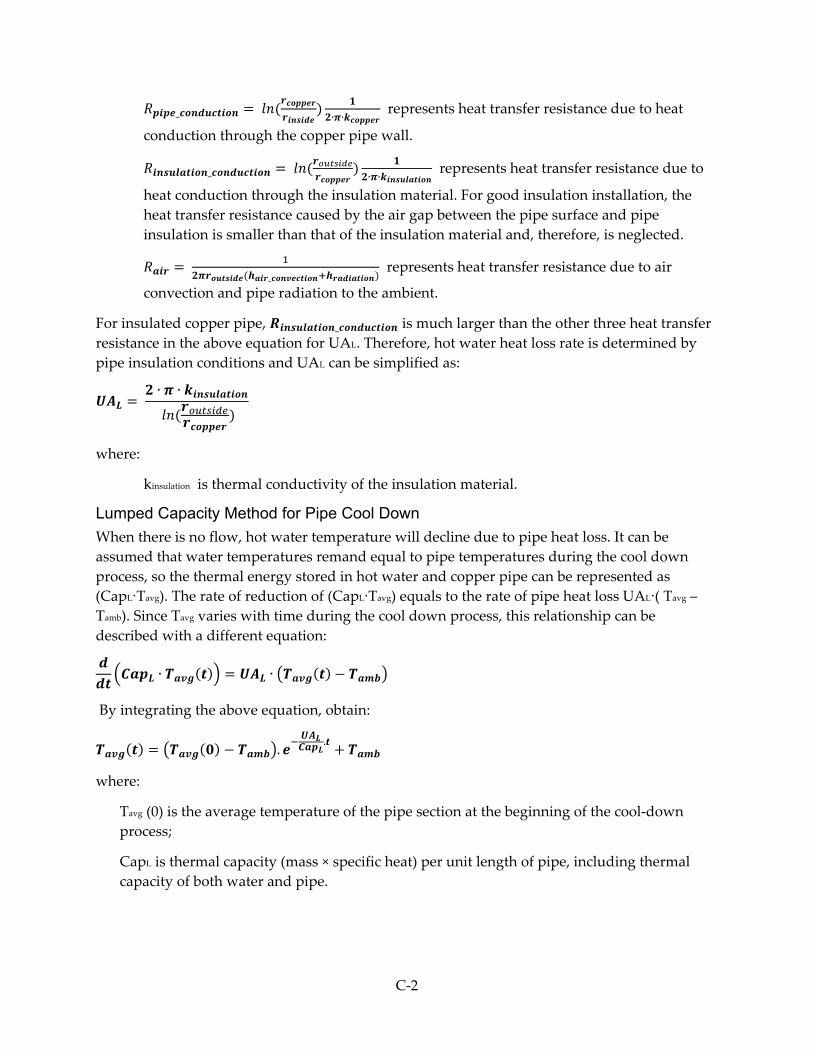
C‐2
_ ∙ ∙
represents heat transfer resistance due to heat
conduction through the copper pipe wall.
_ ∙ ∙
represents heat transfer resistance due to
heat conduction through the insulation material. For good insulation installation, the
heat transfer resistance caused by the air gap between the pipe surface and pipe
insulation is smaller than that of the insulation material and, therefore, is neglected.
_
represents heat transfer resistance due to air
convection and pipe radiation to the ambient.
For insulated copper pipe, _ is much larger than the other three heat transfer
resistance in the above equation for UAL. Therefore, hot water heat loss rate is determined by
pipe insulation conditions and UAL can be simplified as:
∙ ∙
where:
kinsulation is thermal conductivity of the insulation material.
Lumped Capacity Method for Pipe Cool Down
When there is no flow, hot water temperature will decline due to pipe heat loss. It can be
assumed that water temperatures remand equal to pipe temperatures during the cool down
process, so the thermal energy stored in hot water and copper pipe can be represented as
(CapL·Tavg). The rate of reduction of (CapL·Tavg) equals to the rate of pipe heat loss UAL·( Tavg –
Tamb). Since Tavg varies with time during the cool down process, this relationship can be
described with a different equation:
∙ ∙
By integrating the above equation, obtain:
..
where:
Tavg (0) is the average temperature of the pipe section at the beginning of the cool‐down
process;
CapL is thermal capacity (mass × specific heat) per unit length of pipe, including thermal
capacity of both water and pipe.
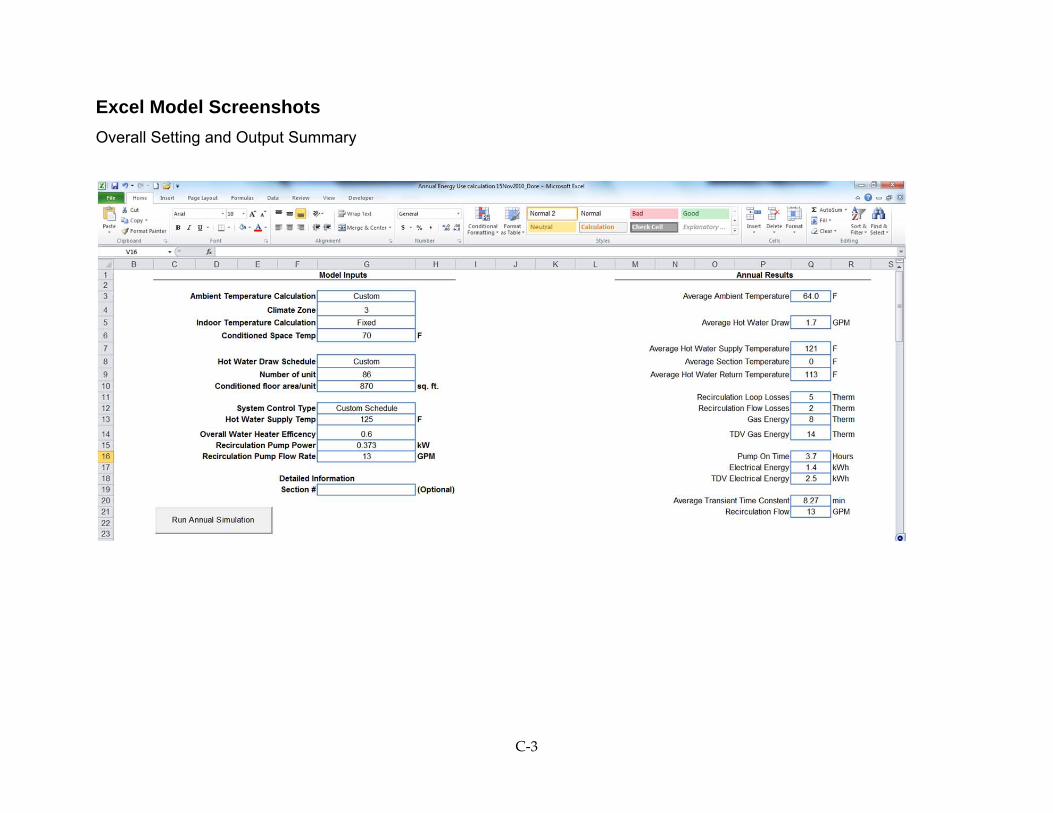
C‐3
Excel Model Screenshots
Overall Setting and Output Summary
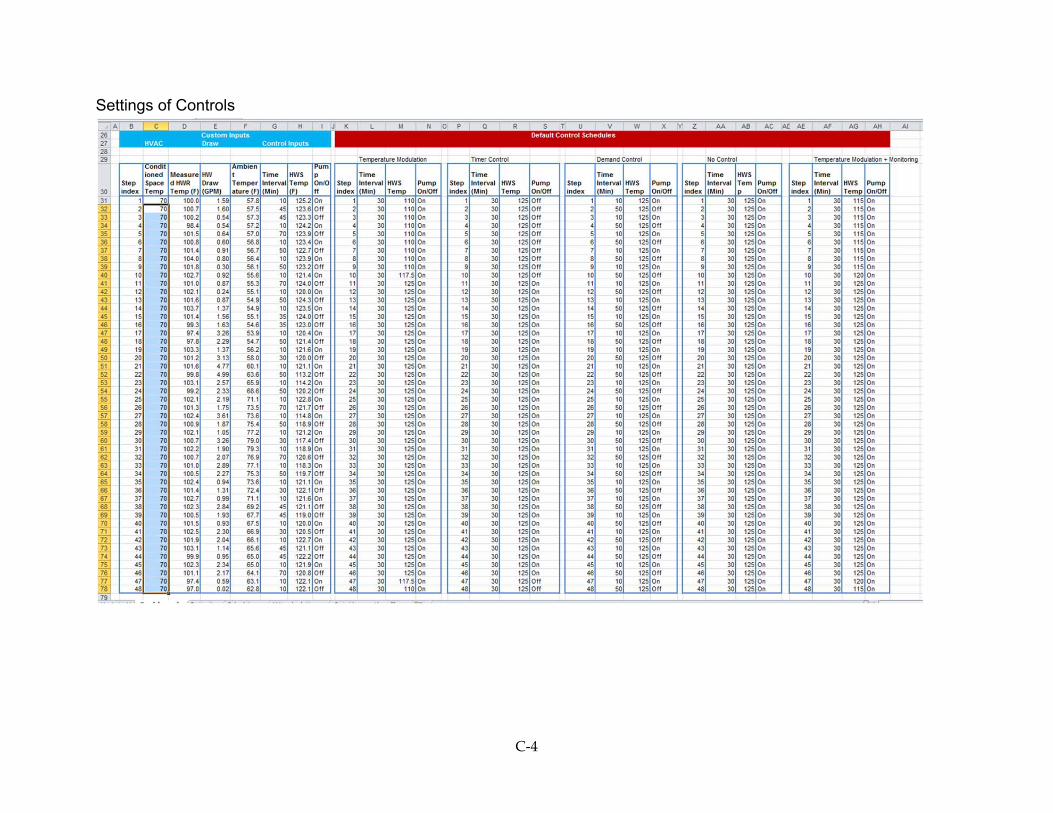
C‐4
Settings of Controls
C‐5
Model Pipe Section Configuration

C‐6
Model Calculation Steps