domain-referenced testing for foodservice a thesis
TRANSCRIPT

DOMAIN-REFERENCED TESTING FOR FOODSERVICE
SYSTEMS MANAGEMENT
by
JESSICA ANNE JONES HANCOCK, B.S. in H.E.
A THESIS
IN
FOOD AND NUTRITION
Submitted to the Graduate Faculty of Texas Tech University in Partial Fulfillment of the Requirements for
the Degree of
MASTER OF SCIENCE
IN
HOME ECONOMICS
Approved
Accepted
May, 1975

ACKNOWLEDGEMENTS
I am grateful to Dr. Mina W. Lamb for her encourage
ment and direction in the preparation of this thesis, to
Dr. Mitsuko Inano for her helpful criticism, and to Dr.
Kenneth H. Freeman for his insight. I wish to express my
appreciation to Vivian Cook for her patience in typing the
rough draft and to Kaye Larson for her conscientiousness in
preparing the final manuscript. I am indebted to my husban
Dave, for his support of my goals and his faith in me.
11

TABLE OF CONTENTS
Page • •
11 ACKNOWLEDGEMENTS
LIST OF TABLES vi
CHAPTER
I. INTRODUCTION 1
Purpose of the Research 5
Limitations of the Research 6
Hypotheses 7
Definitions 8
II. REVIEW OF LITERATURE 10
Procedure for Writing a Domain-referenced Test 10
Identification of the Domain, Units, and Objectives 11
Development of Test Specifications 12
Selection of the Learning Outcomes to be Tested 12
Selection of the Number of Objectives and Items 13
Identification of the Type of
Objective Test Item to Use 15
Development of the Item Format . . . 17
Development of the Test Format . . . 18
Construction of the Test Items . . . . 19
Selection of Item Writers 19
111
Rules for Constructing Quality Multiple Choice Items 20
Specification of Items 22
Analysis 24
Validity of Content 24
Reliability 25
Item Difficulty 25
Index of Homogenity 27
Level of Proficiency 31
Application of Domain-referenced Tests 33
Diagnosis of Individual Strengths and Weaknesses 33
Diagnosis of Group Strengths and Weaknesses 36
Application of Domain-referenced Testing in Current Programs 39
Application of Domain-referenced Testing to Foodservice Systems Management . . 41
III. PROCEDURE 43
Selection of the Type of Evaluation
Instrument 43
Writing the Domain-referenced Test . . . 44
Evaluation of the Domain-referenced Test 49
Analysis of Data 52
IV. RESEARCH FINDINGS AND DISCUSSION 57
Analysis of Validity and Reliability . . . 57
IV
Page
Establishment of Correlations Between the Independent Variables and the Dependent Variables 61
V. SUMMARY AND CONCLUSIONS 86
REFERENCES 91
APPENDIX 9 8
A. TEXTBOOKS FOR BASIS OF TEST CONTENT 9 9
B. STUDENT INFORMATION FORM 100
C. BEHAVIORAL OBJECTIVES FOR TEST UNITS 101
D. BEHAVIORAL OBJECTIVE CODE AND LEARNING OUTCOMES FOR EACH TEST ITEM 105
E. DOMAIN-REFERENCED TEST FOR FOODSERVICE SYSTEMS MANAGEMENT 110
LIST OF TABLES
Table
1.
2.
3.
4.
5.
6.
7.
8.
9.
10.
11.
Specifications for a Third-Grade Social Studies Test
Specifications for a Domain-referenced Test for Foodservice Systems Management
Descriptive Statistics and the KR-20 Coefficient of Reliability
Descriptive Statistics and Significance Level for the T-test
Correlation Coefficients Between the Significant Predictor Variables and Total Test Score
Correlation Coefficients Between the Significant Predictor Variables and the Menu Plannina and Service Unit . .
Correlation Coefficients Between the Significant Predictor Variables and the Purchasing Unit Score
Correlation Coefficients Between the Significant Predictor Variables and the Storage Unit Score
Correlation Coefficients Between the Significant Predictor Variables and the Food Preparation Unit Score . . . .
Correlation Coefficients Between the Significant Predictor Variables and the Equipment Unit Score
Correlation Coefficients Between the Significant Predictor Variables and the Cost Control Unit Score
Page
23
46
58
60
62
65
68
71
73
76
79
VI

Table Page
12. Correlation Coefficients Between the Significant Predictor Variables and the Sanitation Unit Score 81
13. Correlation Coefficients Between the Significant Predictor Variables and the Personnel Management Unit Score 83
Vll
CHAPTER I
INTRODUCTION
The diagnostic and prescriptive capabilities of
domain-referenced testing are essential for the field of
foodservice systems management. Judging from the litera
ture, the use of the domain-referenced test in this field
is unknown. The norm-referenced test is familiar to com
munity college and university foodservice systems manage
ment instructors for its descriptive and predictive
information. Domain-referenced testing and norm-referenced
testing both have a distinct use in the field of foodservice
systems management.
As a recently developed testing procedure, domain-
referenced testing is plagued by a lack of standard termi
nology. Domain-referenced tests are referred to as
criterion-referenced tests, edumetric tests, mastery tests,
maximum performance tests, competency tests, and content-
referenced tests. Previously, the criterion-referenced
test was the commonly used term, but due to automatic asso
ciations of the criterion-referenced test with mastery
learning programs, the preferred term is domain-referenced
test (1). Glaser and Nitko (2) propose a very flexible
definition of a domain-referenced test as a test
that is deliberately constructed so as to yield measurements that are directly interpretable in terms of specified performance standards. . . . The performance standards are usually specified by defining some domain of tasks that the student should perform. Representative samples of tasks from this domain are organized into a test. Measurements are taken and are used to make a statement about the performance of each individual relative to that domain.
Presently, domain-referenced test theory is abundant,
but the collection and analysis of test data has been
limited (3). By applying the theories to the collection
and analysis of data, item generative procedures, statisti
cal models, and analytical routines for domain-referenced
testing can be improved (4, 5).
The primary function of domain-referenced test is the
diagnosis of strengths and weaknesses on specified perfor
mance standards for 1) individuals and 2) groups (3, 5, 6,
7, 8, 9, 10, 11, 12, 13, 14, 15, 16, 17). Domain-referenced
tests function for individuals in three ways. First, the
individual moves through an individualized program by test
ing at crucial points to determine if he should be advanced
to new material or recycled through the learning process
(3). Secondly, when an individual's competence or profi
ciency must be assessed to assure high performance
standards, such as in licensed professions, the domain-
referenced test is useful. Thirdly, individuals studying
a subject area where future academic success is dependent
upon cumulative information and skills can be aided by
domain-referenced testing (18). The analysis of groups by
domain-referenced testing functions to evaluate instructors
and programs. The use of this testing for instructor
accountability is not accepted by most teachers (15, 19).
However, the use of the test to evaluate programs and to
improve curriculum design is well received by most teachers
and administrators (19, 20, 21).
The functions of the domain-referenced test can
easily be applied to foodservice systems management.
First, the domain-referenced test provides a tool for indi
vidualizing foodservice systems management courses in com-
munity colleges and universities. Individual pacing is
needed because of transfer students, open admissions poli
cies, overlapping courses, work experiences, student ages,
and other variables. Secondly, within the job categories
of supervisor, assistant, technician, and dietitian, test
ing to assure high performance standards for each job cate
gory is becoming increasingly important. Third, the
subject of foodservice systems management has a knowledge
base to which more information is added as a student moves
vertically in proficiency and job categories.
Finally, the domain-referenced test is needed to
evaluate the existing programs of study in the area of
foodservice systems management. Currently, there are
four-year degree programs, two-year associate degree pro
grams, one-year assistant programs, and ninety-hour food
service supervisor programs. In addition to this, coor
dinated undergraduate programs resulting in a baccalaureate
degree and postgraduate internship programs are available.
Most of the faculty for these various programs are aware
of the need to establish behavioral objectives, expected
competencies, and a defined knowledge base. However, the
testing of specified performance standards has not been
reported for evaluation of any of these programs. There
fore, the domain-referenced test in foodservice systems
management is potentially useful to determine if instruc
tional goals are consistent with desired performance in
these programs of study and to compare the efficiency of
these programs in the preparation of students for careers
in foodservice systems management.
The application of the domain-referenced test for
foodservice systems management courses in community col
leges and universities must commence with the introduc
tory course. The introductory course is the beginning
point, because 1) students entering these courses have a
wide variety of backgrounds, and 2) students completing
these courses should have a "common knowledge base" (22).
First, age and experience are the two most obvious variants
in the backgrounds of students entering introductory
foodservice systems management courses. But, do age and
experience have an effect on student performance in intro
ductory foodservice systems management courses? If these
factors do have an effect on student performance, then the
domain-referenced test is needed to diagnose individual
student needs and place the students in appropriate learn
ing situations. Secondly, a "common knowledge base" is
assumed to exist for facilitating communication between
professionals and supportive personnel in foodservice sys
tems management. But, is a "common knowledge base" for
introductory foodservice systems management existent? If
a "common knowledge base" exists, then the domain-referenced
test can be used to evaluate the attainment of expected
performance standards. If a "common knowledge base" is non
existent, then the domain-referenced test can be used to
evaluate if the varying objectives for introductory food-
service systems management courses are being achieved
effectively in different programs of study and in courses
taught by different instructors.
Purpose of the Research
The purpose of the research was to 1) develop a valid
and reliable domain-referenced test to diagnose student
strengths and weaknesses based on performance standards
specified for introductory courses in foodservice systems

management, 2) to evaluate the effect of age and experience
on domain-referenced test scores, and 3) to determine if
a "common knowledge base" exists at the termination of units
in foodservice systems management.
Limitations of the Research
The research was limited by a lack of definite cur
riculum guidelines for introductory foodservice systems
management courses, the need for a written response to an
objective domain-referenced test, and the small number of
schools participating in the study. Since a definite cur
riculum for foodservice systems management course was not
available to test several institutions with varying pro
grams of study, the implied curriculum in textbooks was
the basis for identifying objectives for the domain. There
fore, the test may not accurately measure objectives of a
specific course, but will serve only as an indicator of
student strengths and weaknesses based on performance
objectives written specifically for the test.
The need for a written response to an objective
domain-referenced test was a limitation. First, a test
written at the verbal level does not measure performance in
an actual situation. Secondly, terminology used by persons
educated in the area of foodservice systems management may
not be understood by persons unfamiliar with the terminology;

but aware of the principles and applications. Thirdly, the
objective test is not the best measure of problem-solving
abilities. Finally, the subject matter causes difficulty
in the location of plausible incorrect distractors.
The small number of schools participating in the
sample limited the conclusions that could be drawn from the
data. Since only two community colleges and one university
participated, generalizations concerning the courses and the
programs of study in the area of foodservice systems manage
ment, must be carefully analyzed.
Hypotheses
1. The domain-referenced test is not a valid test if stu
dents, who have not been instructed in a unit in an
introductory foodservice systems management course,
score significantly higher on the unit than students
who have been instructed in the unit.
2. The domain-referenced test is not a valid test if stu
dents who have had no formal instruction in a food-
service systems management course score significantly
higher than students who have completed a foodservice
systems management course.
3. The domain-referenced test is not a reliable test for
introductory foodservice systems management if the
coefficient of reliability shows a lack of internal
consistency within each unit and on the total test.
8
4. Actual age, years of work experience, type of program
of study, completion of units in a foodservice systems
management course, completion of a food preparation
course, and completion of an introductory foodservice
systems management course have no correlation with the
domain-referenced test scores.
Definitions
1. Foodservice systems management-SYSTEMS: " . . . The
components that make up the production and service of
food . . . " MANAGEMENT: " . . . The process of achiev
ing desired results by the effective use of human
efforts and facilitating resources . . . " (23).
2. Domain: a set of clearly specified test items which
have fundamental properties in common (19).
3. Item: any measurable bit of human performance.
4. Learning objective: a rule for generating a group of
performance tasks, or alternately a list of all per
formance tasks which comprise the objective (12).
5. Domain-referenced test: a test that is deliberately
constructed to yield measurements that are directly
interpretable in terms of the specified performance
standards (2).
6. Unit: learning objectives with fundamental properties
in common for instruction.

7. Levels of learning: Blomm's Taxonomy of Education
Objectives—knowledge, comprehension, and application
(24).

CHAPTER II
REVIEW OF LITERATURE
Procedure for Writing a Domain-referenced Test
The domain-referenced test provides a basis for jus
tifying many curriculum decisions (6). Before writing the
test the curriculum decisions for which the results will
be used should be determined because "it is the use to
which test results are put that determines their nature
and methodology" (25).
The principal procedures used to write a domain-
referenced test were drawn from the research findings to:
1. Identify the domain, units and objectives
2. Develop test specifications
a. Select the learning outcomes
b. Select the number of objectives and items
c. Identify the type of objective test items
to use
d. Develop the item format
e. Develop the test format
3. Construct test items
a. Select item writers
b. Follow rules for multiple choice item con
struction
c. Write table of specifications
10

11
Identification of the Domain, Units, and Objectives
In writing a domain-referenced test, the domain is
first drawn from a defined or implied curriculum (14).
Next, subsets or units representing various regions of the
domain are identified (16). Finally, the instructional
objectives are written in behavioral terms. However, some
test writers (26, 27) prefer to write behavioral objectives
for the domain and then organize the objectives into units.
Proger and Mann (28) suggest that the " . . . most
predominant commercial curriculum . . . " should be chosen
". . .to serve as an initial guide in formulating the
specific tasks. . . . " They state:
By and large, most of the specific objectives written from one curriculum will be reflected in other commercially available curricula. The basic differences .reside in the sequence in which the objectives occur.
Guidelines for identifying the domains in the cur
riculum are sparse. Definitions of the domain are very
general. Baker (7) considers a domain a subset of knowledge,
skills, understandings, or attitudes that represent a
"reasonable compromise between vagueness and over-precision."
Sension and Rabehl (16) define a domain as a set of clearly
specified test items which have fundamental properties in
common.

12
In accordance with traditional achievement test con
struction, Gronulund (29) suggests outlining the subject-
matter content. This same idea is expressed by Miller (30),
a domain-referenced test developer, as "content taxonomy
specification." "Content taxonomy specification" involves
the structural decomposition of the content unit into some
thing that can be learned. The content unit can then be
transformed into behavioral objectives (29). The cluster
of behaviors taught as a unit provide a coordinated set of
diagnostic subsets for any given domain (31).
The most important characteristic of the domain-
referenced measure is the set of behavioral objectives (32).
When domains are described in operational terms, "another
test developer should be able to generate an equivalent
domain of test items (7)." Also, the behavioral objectives
are important, because they serve to "emphasize the gen-
eralizable attributes of the subject matter and to increase
the probability of transfer (6)."
Development of Test Specifications
Selection of the Learning Outcomes to be Tested
There are numerous learning outcomes for any curricu
lum, but they can be classified under a relatively small
number of headings. The classification of objectives into
learning outcomes is arbitrary, but serves a useful purpose.

13
The learning outcomes provide a framework for correlating
the level at which the information in the curriculum is
presented with outcomes which are tested (33).
Bloom (24) has edited a book describing the tax
onomy of educational objectives belonging to cognitive
categories. There are six general categories for the iden
tification of the learning outcome for each objective:
1. Knowledge
2. Comprehension
3. Application
4. Analysis
5. Synthesis
6. Evaluation
Items which present problems and are new to the student
are measures of complex achievement. The categories of
comprehension, application, analysis, synthesis, and evalu
ation are recognized by Gronulund (29) as measuring com
plex learning outcomes.
Selection of the Number of Objectives and Items
Many opinions are expressed in both theory and prac
tice as to the number of objectives to a test and the num
ber of test items per objective. The number of objectives
for a test depends on the purpose of the test and the
characteristics of the curriculum (14, 25).

14
No fixed number of items are specified to test an
objective due to the diverse nature of the objectives (34).
However, Wall (17) recommends that the test should contain
at least one item and not more than five items for each
objective. In contrast, testing every objective is waste
ful of time and energy according to many writers (6, 12,
35). Baker (6) advocates selecting only goals for testing
that are worthy of the design effort.
The number of objectives and items selected by test
designers appears to be arbitrary. The mathmatics curricu
lum for the Individually Prescribed Instruction Project
(IPI) consists of 430 specified instructional programs
grouped into 88 units (3). Level E (5th grade equivalency)
of the Individually Prescribed Instruction Project provides
an example of the test lengths devised by the Learning
Research and Development Center at the University of Pitts
burg. The units that comprise Level E average five objec
tives per unit. The placement test uses an average of
twelve items per objective. The unit pretests and posttests
for Level E have approximately 37 items, and the average
number of items measuring each objective is six (3) .
The Grand Forks (North Dakota) School District speci
fied performance objectives for grades kindergarten through
grade twelve to develop domain-referenced pretests and
posttests. An average of 50 objectives per grade level
15
were developed on a hierarchical skills basis. One to three
items were written for each objective. The average test
length per grade is 120 items (19).
Sension and Rabehl (16) report that the test design
for the Osseo, Minnesota project, "An Accountability Model
for Local Education Agencies," is constructed, typically,
from 10 items randomly sampled from a single domain (objec
tive) . In contrast the Hopkins, Minnesota (Comprehensive
Achievement Monitoring" (CAM) project normally samples only
one item from a domain (objective) (16).
Identification of the Type of Objective Test Item to Use
"The multiple-choice item is generally recognized as
the most widely applicable and useful type of objective
test item," according to Gronulund (32). The domain-
referenced testing projects reported by Hambelton (3), and
Sension and Rabehl (16) recommend the multiple choice item.
When the learning outcomes and subject matter are
adaptable to several item types, the multiple choice items
will generally provide a higher quality measure than other
item types (29, 33). The advantages of the multiple choice
test are listed as follows:
1. Measures learning outcomes from the simple to
complex (29, 33, 36, 37).
2. Adapts to a wide range of subject content (29, 33)

16
3. Decreases ambiguity due to increased structure
(29).
4. Increases the reliability over other test items
when four or more alternatives are constructed
(37, 38).
5. Eliminates the tendency to respond to a particu
lar alternative when the answer is unknown (29).
6. Makes the misunderstandings and factual errors
amenable to diagnosis (29).
7. Decreases the time required for scoring.
The limitations of the multiple-choice items must be
recognized. Gronulund (29, 33) identifies the following
disadvantages:
1. Testing at the verbal level does not measure per
formance in an actual situation.
2. A multiple choice test is not an adequate measur
ing instrument for problem-solving skills in
mathematics or science and is inappropriate for
the cognitive learning category of synthesis.
3. There is difficulty in locating a sufficient num
ber of incorrect but plausible distractors.
4. The time required for designing a multiple choice
test item is greater than other types of test
items.

17
Development of the Item Format
A multiple choice item consists of a stem which states
the problem and alternatives which include one correct solu
tion and several distracters. The problem may be stated in
the form of a direct question or an imcomplete statement.
The incomplete statement is typically the most concise,
while the question form is easiest to write and forces the
testmaker to pose a clear problem. Starting with the ques
tion form and shifting to the incomplete statement form is
suggested if greater conciseness can be achieved (29, 33,
39).
Five alternatives will increase the reliability unless
the quality of the additional distractors is decreased.
Therefore, the use of four good alternatives for the item
format would be easier to write and, also, provide a satis
factory estimate of reliability (29, 33, 39).
Gronulund (33) recommends that an efficient item
format be chosen in which 1) alternatives are listed on
separate lines; 2) letters are used instead of numbers to
avoid confusion when numerical answers are used in an item;
3) if the stem of the item is a question, each alternative
should begin with a capital letter and end with a period;
4) when the stem is an incomplete statement each alterna
tive should begin with the punctuation which would be
required to complete the sentence.

18
The recommended spacing for the item format is shown
in the example below: (33)
The capital of California is located in A. Los Angeles B. Sacramento C. San Diego D. San Francisco
Development of the Test Format
In general, objective tests have formats in which
1) similar types of test items are grouped together, not
only to facilitate direction writing, but that students can
have continuity in taking the test; 2) test items within
an item type are arranged in order of ascending difficulty
to help in determining the types of learning outcomes caus
ing pupils the greatest difficulty and to allow students to
complete the simpler items and then spend the remainder of
time on items measuring complex outcomes; 3) items may be
organized by subject-matter content for mastery and diag
nostic tests (29, 33, 39).
Olsen and Barickowski (40) tested the idea that stu
dent's perceived a test as more difficult if arranged in
the order of hard items to easy items. Three sections of
the course, Teaching Reading and Language Arts in the Ele
mentary School, Education 310, at Ohio University, were
given a 60 item midterm exam. Forty-three students
received tests with multiple choice and true-false items

19
arranged in a hard to easy order, while forty-two students
received the same test with the items in an easy to hard
order. The answers indicated that no difference occurred
in the two groups' perception of the difficulty of either
test.
For a timed test, the percentage of students who
should complete the items, or the percentage of items which
should be finished in the allowed time, should be estab
lished prior to administration of the test (29). When the
main concern is the level of student achievement, speed is
not an important factor (29). But even when a test has no
time limit, there should be an expected length of time in
which the majority of the students will complete the test.
The experiences of the Grand Forks (North Dakota) School
District in administering domain-referenced tests for
grades kindergarten through grade twelve indicate an hour
as the maximum testing time for obtaining reliable results
(19).
Construction of the Test Items
Selection of Item Writers
A thorough knowledge of the suject matter of interest
is necessary to the domain developer (16). In the Osseo
and the Hopkins projects (16) and the Grand Forks (North
Dakota) School District (19) the domains were developed by

20
committees of teachers with the technical assistance of
evaluators and statistical analysts. In the Osseo and the
Hopkins projects (16) subject matter specialists aided the
teachers. Test specialists or test consultants might also
need to be involved in the design effort (31). By using
many experienced people in the design of the tests, their
personal opinions and judgements provide valuable and nec
essary input as to what ought to be included in the tests
(17, 31). Shannon (31) recommends the use of a test con
sultant to aid in the conversion of standardized tests in
current use to domain-referenced tests, thus saving time,
money and energy.
Rules for Constructing Quality Multiple Choice Items
Gronulund (29) provides an extensive list of rules
for item selection.
1. Design each item to measure an important learning outcome
2. Present a single, clearly formulated problem in the stem of the item
3. State the stem of the item in simple, clear language
4. Put as much of the wording as possible in the stem of the item
5. State the stem of the item in positive form, whenever possible
6. Emphasize negative wording whenever it is used in the stem of an item

21
7. Make certain that the intended answer is correct or clearly best
8. Make all alternatives grammatically consistent with the stem of the item and parallel in form
9. Avoid verbal clues which might enable students to select the correct answer or to eliminate an incorrect alternative, such as:
a. wording both the stem and the correct answer similarily
b. stating the correct answer in textbook language of stereotyped phraseology
c. stating the correct answer in greater detail
d. including absolute terms in the distractors
e. including two responses that are all-inclusive
f. including two responses that have the same meaning
10. Make the distractors plausible and attractive to the uniformed
11. Vary the relative length of the correct answer to eliminate length as a clue
12. Avoid use of the alternative "all of the above" and use "none of the above" with extreme caution
13. Vary the position of the correct answer in a random manner
14. Place numbers preferably in ascending order of size when alternate responses are numbers
15. Control the difficulty of the item either by varying the problem in the stem or by changing the alternatives
16. Make certain each item is independent of the other items in the test
17. Use an efficient item format
22
Pyrczak (41) studied the item quality of two parallel
forms of an arithmetic-reasoning test, consisting of 27
items each. The item quality, using a discrimination
index and a group of judges' opinions of item quality, was
determined for the responses of 364 examinees. Results
showed that both methods were valid. However, some items
were judged to be of poorer quality, but the discrimina
tion index did not indicate the need for their exclusion.
The following characteristics were used as a basis for
judgement of item quality:
1. adequacy of keyed choice 2. absence of distractors that can be defended as
adequately correct 3. plausibility of distractors, including presence
of naturally attractive distractors 4. absence of ambiguity in expressing the meaning of
the stem and choices 5. absence of ambiguity caused by use of negatives
or double negatives 6. absence of long or precisely worded keyed choice 7. absence of logically overlapping distracters 8. homogeneity of distractors with each other and
with keyed choice 9. grammatical agreement of stem with choices
Specification of Items
The table of specifications provides a blueprint for
item selection. The learning outcomes in terms of the level
of learning and the content for each unit is one method of
devising a table of specifications. Then the total number
of items for each area are specified. The following is an
example adapted from a table in Gronulund (29):
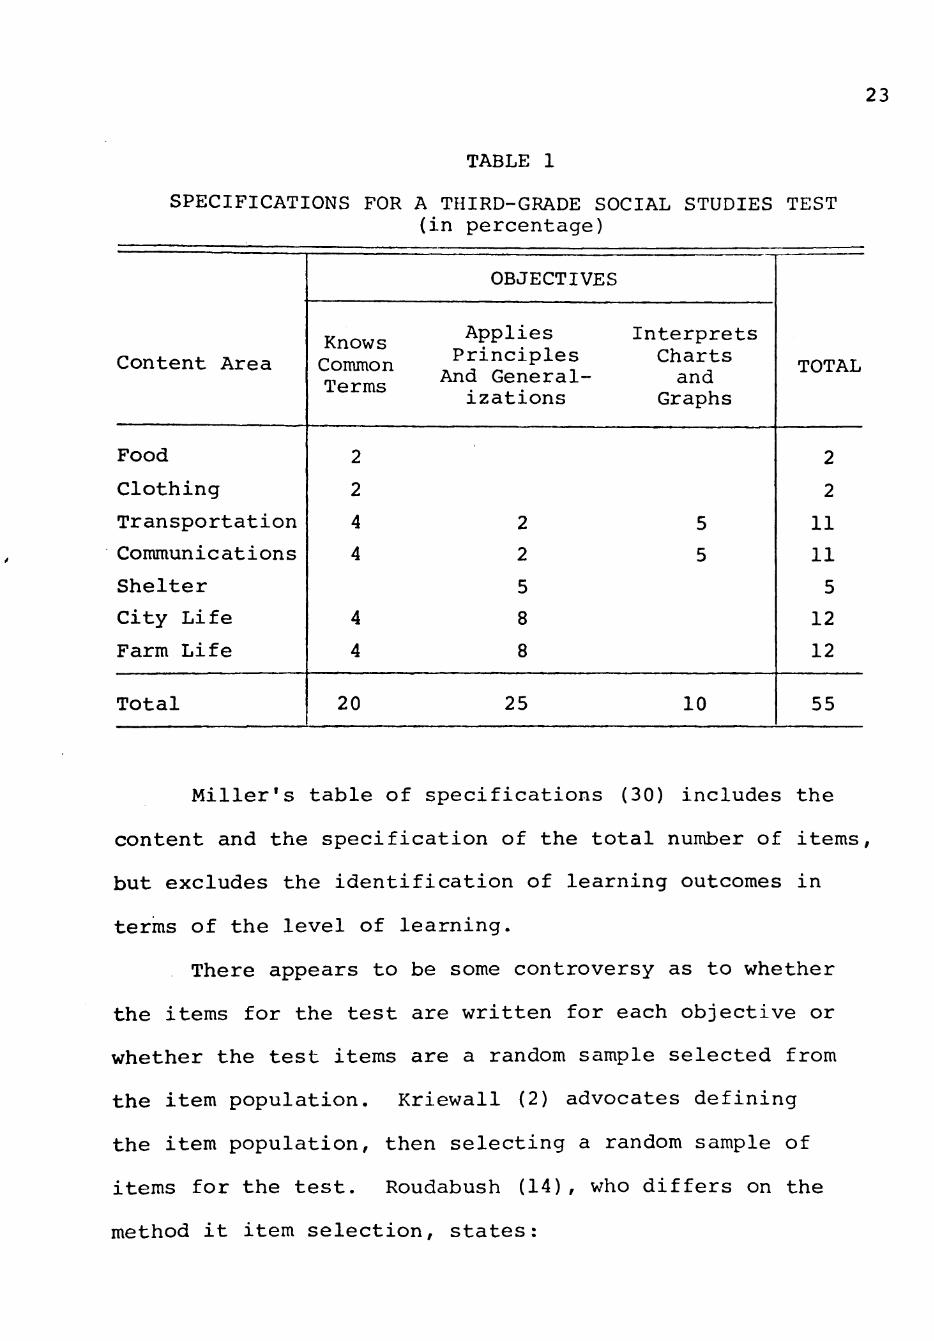
23
TABLE 1
SPECIFICATIONS FOR A THIRD-GRADE SOCIAL STUDIES TEST (in percentage)
Content Area
Food
Clothing
Transportation
Commun ications
Shelter
City Life
Farm Life
Total
OBJECTIVES
Knows /PP^^^^ Interprets Common /J^'^'^^P^^? ^^^""^^ „ And General- and
izations Graphs
2
2
4 2 5
4 2 5
5
4 8
4 8
20 25 10
TOTAL
2
2
11
11
5
12
12
55
Miller's table of specifications (30) includes the
content and the specification of the total number of items,
but excludes the identification of learning outcomes in
terms of the level of learning.
There appears to be some controversy as to whether
the items for the test are written for each objective or
whether the test items are a random sample selected from
the item population. Kriewall (2) advocates defining
the item population, then selecting a random sample of
items for the test. Roudabush (14), who differs on the
method it item selection, states:

24
Items are then written for each objective that should sample as purely as possible the specified domain of behaviors. This sample of behaviors will, of course, not be random, but hopefully, it will be representative of the domain. . . . Using sensitivity to instruction as the major criterion for item selection leads to choosing a different set of items than would ordinarily be chosen.
Analysis
Validity of Content
Analysis of validity of content of the test should
assess if the test actually measures what it purports to
measure. Validity is specific to the purpose and to the
situation for which the test is used. Therefore, test
validity is not constant, but a matter of degree. The
scores on the test are estimates of the probability that
an individual or group will respond similarly to other
items from the same content (42).
To demonstrate validity the test should be sensitive
to appropriate instruction (10). To determine the domain-
referenced test's validity of content the test may be
administered to:
1. a selected sample of persons as a pretest and posttest (9, 17)
2. an untrained-unskilled group and a trained-skilled group (9, 43)
3. groups high on the criterion and to groups low on the criterion (42, 43)
4. students who sample the range of individual performance not only the extremes of high proficiency and no proficiency (12, 44)
25
Reliability
Item Difficulty
Item difficulty is not appropriate or useful for
domain-referenced testing in the sense of classical test
theory (1, 3, 9, 12). In classical test theory maximum
variance is achieved when item difficulties are 0.50. Thus,
for maximum test reliability, it is commonly recommended
that items with either very low or very high p-values be
avoided (12).
The problem of applying the norm-referenced item dif
ficulties to domain-referenced tests is that the difficulty
of items for a non-randomly selected group of persons is
not known until the test is administered. Therefore,
"it would be possible in such cases to build tests having
some pre-determined class mean" (12) .
The above aspects of item difficulty in domain-
referenced testing elicits the following perspective from
Hively (1):
Items may never be added to, or removed from, a domain on the basis of their difficulties or their correlations with other items. The formal characteristics of an item, independent of students' responses to it are what determine its inclusion or exclusion. Items are classed together to form domains on the basis of similarities in their stimuli and responses.
To date, a satisfactory methodology of item valida
tion does not exist (3). However, Ivens (32), Kreiwall
(13), and Pyrczak (41), recommend that item difficulty and

26
the index of discrimination be used as an aid to the test
editor in selecting and revising test items. The follow
ing method of reviewing items is described by Ivens (32):
Any one of a group of homogeneous items that displays a difficult index markedly different from the others should be carefully scrutinized for possible ambiguity or other fault.
Also, determining the degree to which a distractor is
functional or non-functional is necessary for item analysis
The index of discrimination, point biserial R, indicates
if individuals who answer the item correctly have a test
score lower or higher than the mean. A distractor rarely
chosen or chosen by a greater percentage of the high
achievers may provide clues as to needed item revisions
(29). Thus, the quality of domain-referenced "ultimately
depends upon the quality of the insights and subjective
judgements of test editors" (41) .
The difficulty of the items selected is an important
estimate of individual performance regardless of group
performance (12). To show the range of individual perfor
mance, domain-referenced test writers suggest the inclusion
of test items that are easy, medium, and difficult (8, 11,
45). Shoemaker (45) emphasizes the utility of the test
results for the instructor. In order to obtain meaningful
results, three types of items are suggested for each objec
tive. These types include the following:

27
1. items that can be answered correctly by all students who have a minimum satisfactory performance
2. items that can be answered correctly only by students who have surpassed the minimum achievement
3. items that can be answered correctly only by students with a high level of achievement
Freytes (8) , Director of Program Evaluation in Math
matics, Department of Education, Puerto Rico, developed a
diagnostic criterion-referenced test for seventh grade mathe
matics. The test was administered after completion of the
sixth grade. Program specialists and experienced teachers
included items that were both easy and difficult to answer.
This was considered important since learning in math is
sequential.
Using items that are easy, medium, and difficult is
for the purpose of:
(1) providing information about the unanticipated outcomes of educational programs, (2) indicating how close a student or program came to meeting or surpassing the objectives, and (3) showing the level at which subsequent educational treatments should be pitched (11).
Index of Homogeneity
Reliability provides a measure of the amount of vari
ation in test performance from one time to another, from one
sample of items to another, and from one part of the test to
another. The test-retest method, alternate form method, the
split-half method, and the index of homogeneity may all be
used to determine reliability of domain-referenced tests
(29, 33, 42).
28
The characteristics of the test samples determine
which index of homogeneity would be most meaningful. When
the test sample is a highly selected group, there may be
little variance in test scores (7, 45, 46, 47, 49). For
this reason some of the following means of determining an
index of homogeneity have been developed: 1) the Harris
Index (48, 49, 50); 2) the Livingston Reliability Coeffi
cient (51); and 3) the Rasch Model (52). When the test
sample consists of students with a wide range of competence,
the Kuder-Richardson Formula 20 coefficient of reliability
may be used (9, 45). The reliability of the Kuder-Richardson
Formula 20 increases with the number of tests, with the
length of the test, with a wide dispersion or spread of
scores, and with items of moderate difficulty (9, 29, 33,
47).
Rim and Bresler (53) studied three statistical
measures of reliability. They analyzed the results of a
pretest, curriculum embedded test, and a posttest. Tests
for Levels A through E of the Individually Prescribed
Instruction (I.P.I), a elementary mathematics program,
were administered to 678 students, and the results were
analyzed for reliability using the KR-20 coefficient of
reliability, Livingston's Reliability Coefficient, and
Harris' Index of Efficiency. The tests were given and
analyzed as pre-tests, curriculum embedded tests, and
29
posttests. The KIl-20 coefficient of reliability was highly
positively correlated with the standard deviation and the
number of tests. The number of items on the test was mod
erately correlated with the KR-20 coefficient of reliability
Livingston's coefficient was positively correlated with the
standard deviation. The Harris index showed no significant
relation to any variable studied. The authors concluded
that the Harris index was relatively stable to all testing
situations, and that a higher reliability was obtained using
the Harris' Index and Livingston Reliability Coefficient.
When analyzing the pre-test data, curriculum-embedded test
data, and the posttest data separately, the samples are
restricted. If the data from all three tests had been
analyzed together, the samples would have represented the
range of the characteristics or competencies being measured,
and this might have altered the results, for the Kuder-
Richardson coefficient of reliability.
In addition to the problem of variance in domain-
referenced testing, is the question of internal consistency
when multiscaled domain-referenced tests are used (9, 14,
.32, 54). Shavelson, Block, and Ravitch (55) report that
the lack of internal consistency in multiscaled tests makes
the use of an index of homogenity inappropriate. However,
Roudabush (14), Ivens (32), and Haladyna (9) concur that
the total test score is not as significant as the subscale
30
scores. Reliability should be measured within the subscale
representing the test domain (9, 14). Haladyna's (9) test
reliabilities for subscales of a domain-referenced test
refute the theory that an index of homogenity would not
be meaningful. The domain-referenced achievement tests
were administered as a part of normal instruction to one-
hundred eighty students enrolled in an undergraduate level
measurement and evaluation course. The forty to fifty item
test was over three units consisting of subscales from two
to seventeen items. When only the posttest scores were
used the KR-20 estimate of reliability was low, from .31
to .72. When unrestricted samples including both pretests
and posttests were used the KR-20 range was .69 to .89 with
a median of .84.
The degree of reliability expected from test measure
ment is necessary for interpretation of the significance of
the scores for decision making. Teacher-made tests gener
ally have reliabilities between .60 and .85 (33, 56). Stan
dardized achievement tests should have a reliability, using
KR-20, of .90 (33, 38). The College Entrance Examination
Board (C.E.E.B.) provides extensive information on KR-20
reliabilities for standardized achievement tests. The
College level Examination Program reports reliabilities
above .90 for the General Examinations, above .85 for most
Subject Examinations, and between .77 and .85 for the Brief

31
Tests (57). The Advanced Placement Program of the College
Entrance Examination Board achievement tests are reported
as mostly in the .80's; one coefficient is above .90, sev
eral are in the .70's, and the English examination has a
coefficient of only .50 (58).
Level of Proficiency
The level of proficiency is a cut-off score used to
distinguish students who have achieved the objective or
objectives and students who have failed to achieve them.
Generally, the acceptable score is arbitrarily selected
(3, 7, 12, 28, 59). For the Beginning Reading Program,
reported by Besel (7), 80% or 4 of 5 questions answered
correctly was passing. The Individually Prescribed
Instruction Project initiated by the Learning Research and
Development Center at the University of Pittsburgh uses the
80-85% proficiency level for most tests. Implementers of
the Mastery Learning Model have set the passing standard
anywhere from 75% to 100% (3). Petre (59), a consultant
in reading for the Maryland State Department of Education,
reports the state goal for all twelve year olds and fifteen
year olds to perform successfully on 80% of the items on
domain-referenced survival reading tests.
Although the "variable absolute method" of determin
ing the proficiency level involves subjective value judge
ments of the examiner, the procedure involves analysis of
32
several definite factors, before the decision is reached.
The level of mastery will vary according to:
1. the difficulty of the task
2. the relative importance of the task with regard to future success with later content
3. the general potential of the particular student (28)
The effect of having a required proficiency level
established prior to instruction should be considered. In
one study (60) a three-unit sequence in elementary matrix
algebra was taught to all eighth-grade pupils during one
school week. The students were randomly arranged in five
treatment groups. A control group learned with no require
ment of meeting a specified performance level: but pupils
in each of the four experimental groups were required to
demonstrate learning of a preselected percent (65, 75, 85,
or 95) of the content taught. The conclusion was as follows;
. . . learning to the 9 5-percent performance level was optimal for the criteria of achievement level, retention, transfer, and rate of learning whereas learning to the 85-percent performance level was optimal for the criteria of short-term and long-term interest.
In a second study (61) students in a large educational
psychology class were assigned to high proficiency and no
set proficiency conditions in regard to passing weekly
exams. The percentage of students not attaining high pro
ficiency on the initial exam, but taking the remedial exam
for that week was higher for the high proficiency group in

33
most cases. The percentage of students attaining profi
ciency on either the initial or remedial test was also
higher for the high proficiency groups.
There are two types of errors for those students
whose scores fall close to or at the criterion level:
a) true non mastery students may be classified as mastery students
b) true mastery students may be.classified as non-mastery (9)
To combat this problem, Haladyna (9) recommends that a con
fidence interval be established. More input would be
needed to make decisions regarding students whose scores
fall in the confidence interval.
Application of Domain-referenced Tests
Diagnosis of Individual Strengths and Weaknesses
The domain-referenced test provides a tool for the
diagnosis of individual strengths and weaknesses on speci
fied performance standards. This information may be useful
to the individual student, to the instructor, and to pro
fessional organizations. Feedback concerning strengths and
weaknesses are helpful to any self-directed student who
searches for a way to document his individual accomplish
ments apart from instructional goal (16). The abundant
information from domain-referenced tests provides the stu
dent with "a tract of his individual growth which he can
then project into the future" (26). With knowledge of his

34
accomplishments and the challenge of striving for a high
proficiency level, higher student performance is encouraged
through systematic self-improvement (1, 62). Hentschke and
Levine (63) add that the domain-referenced test aids the
student by emphasizing accomplishment of objectives rather
than emphasizing cometition between students.
The instructor needs the domain-referenced test to
make decisions, about the individual student's relation to
the curriculum. The domain-referenced test provides place
ment information, formative evaluation, and attainment
information (8, 13, 26). Nitko and Hsu (13) propose that
placement information should answer the question "Where
should this pupil be located in the curriculum sequence to
begin his instruction?" A diagnostic profile gathered by
sampling within subdomains of large domains should accu
rately reflect the examinee's strengths and weaknesses with
regard to the curriculum (1, 14). Placement decisions help
to ". . . categorize learners into temporary learning groups
on the basis of a common requirement for instructional
treatment" (14). Knipe (19) advocates the use of the com
puter to analyze student tests and provide group printouts
for instruction purposes.
Formulative evaluation is the feedback which occurs
during instruction and provides information for improve
ment of the instructional package. Formative evaluation
35
is commonly the posttest at the end of a unit (26, 39, 47,
63). In some programs, the posttests are used only to
diagnose learning difficulties, not for grading purposes
(5, 19). For formative evaluation, the domain-referenced
test should accurately reflect changes when the examinee's
capability to perform has changed and should lead to
appropriate decisions for further instruction (11). Knipe
(29) recommends computerized group printout sheets for
remedial work in groups with common skill deficiencies.
Attainment information determines the probability
of student success with respect to specified performance
tasks (44) . This evaluates the student at the end of the
unit sequence. Kriewall (12) describes the purpose of the
attainment function as:
. . . to determine, in the case of established instructional segments having predetermined per-
_. formance standards, which individuals have
acquired minimal standards of proficiency. . . .
Professional organizations may use the domain-
referenced test for a "Quality Control Function" (12).
Establishing performance standards or competency levels
for licensing and certification may be aided by domain-
referenced testing (7, 18). Rahmlow (64) notes that when
testing future professionals, objectives for the domain-
referenced test should be based on job performance.

36
Diagnosis of Group Strengths and Weaknesses
When the strengths and weakness of groups of students
are evaluated, instructional and teacher accountability is
facilitated. Accountability as it involves instructional
procedures is necessary, because first, "the public has
a right to know," and secondly, the "advantage this affords
curriculum developers" (8). The following people outside
the educational community need to be informed concerning
instructional procedures and outcomes:
1. local taxpayers who want assurances of the uses
of their money (16)
2. elected officials at the national, state, and
local levels who must allocate resources for
educational programs (7)
3. parents who desire to know what their children
are being taught (16)
4. employers who must know what performance level
they can expect of employees (64, 65, 66)
By using a domain-referenced test, educational objectives
as well as measurements of these objectives are organized
for clear presentation to the public.
The advantages of domain-referenced testing for cur
riculum developers are in the areas of curriculum design
and instructional assessment (12). The domain-referenced
test helps in the "design of more efficient instructional
37
programs" (6). By integrating test design with the instruc
tional goals, educational purposes are clarified and unim
portant or illusory instructional goals are identified
(6, 31). Evaluation of the Osseo, Minnesota curriculum
emphasizes the hierarchial relations within a content
sequence. Their approach has been to pinpoint competencies
of the students in each grade, and then ask the following
question:
1. Are all entering competencies as low as expected, i.e., is it necessary to include the skill in the curriculum of a certain grade level?
2. Are all terminal competencies (sixth grade) as high as desired?
3. Are the skills being learned in the proper order? 4. What particular skills should receive priority
given limited resources for program revision and curriculum change? (16)
For instructional assessment, the domain-referenced
test may determine the relative effectiveness of alterna
tive instructional treatments (12, 16) .
Not all methods, materials, and modes of instruction
have been adapted to domain-referenced testing (12). To
be effective individualized instruction requires domain-
referenced test development (3). Hentsche and Levine (63)
promote the use of the domain-referenced test to alleviate
some of the following testing problems in performance con
tracting:
. . . it would appear that using domain-referenced theory in performance contracting could help to alleviate some of the current testing problems in

38
performance contracting. These problem areas would include, but not be limited to (a) matching test items to program objectives; (b) developing theoretically defensible matrices of expected performances, thereby reducing the relatively arbitrary construction of payoff schedules; (c) placing more emphasis on accomplishment of program objectives and less on discrimination among students; and, possibly, (d) providing a workable alternative to gain scores as a means of measuring program effect.
Wall recommends that the domain-referenced test be used any
time that the instructor is the facilitator and manager
of learning. Another curriculum mode in vogue is the
"systems approach." The use of a system " . . . implies
comprehensiveness of steps, as well as interdependence of
stages, components, and concepts" (17). If all necessary
assessments are made for the "systems approach," domain-
referenced testing would be essential (17).
Domain-referenced test results for groups of students
have implications for teacher accountability. Teacher
accountability appears to be an inevitable requirement of
local and state governments, school districts, administra
tors, and parents. The law in California now requires all
teachers in the state to be evaluated in terms of their
"ability to produce demonstrable results with children'.'
(20). Popham (67) believes that the ability of an instruc
tor to accomplish prespecified instructional objectives
should be measured. Conversely, Sension and Rabehl (16)
oppose the emphasis on teacher accountability, because

39
they fear it may cause less objectivity in curriculum
design or curriculum change, and a tendency for instructors
to defend approaches that are not appropriate.
The anxieties associated with widespread teacher
evaluation can perhaps be allayed by using domain-referenced
tests and increasing the teacher's expertise in aiding
learners to master explicit instructional objectives (20).
Standardized norm-referenced tests are 'jnfair to the
teacher since the objectives being assessed are unknown.
When the teacher determines the material being tested and
adapts the instruction accordingly, he is accused of
"teaching to the test" and the norm-referenced test scale
may be invalidated. When there is prior agreement as to
course content and test content, the instructor's work can
be fairly evaluated.
Application of Domain-Referenced Testing in Current Programs
The Hopkins, Minnesota project, "Comprehensive
Achievement Monitoring" (CAM) is a domain-referenced test
system oriented to individualized instruction. The student
is given a list of objectives from which he chooses where
to start and what objective he will attempt next. Tests
of about 10 items are taken to determine proficiency on
each objective.
40
The Individually Prescribed Instruction Program (IPI)
in math, reading, science, spelling, and handwriting has
domain-referenced placement, diagnostic and curriculum-
embedded tests. The placement test covers all the units
in a content area and pinpoints the units in which each
student will need instruction. The diagnostic tests are
the pretest and posttest for each unit. The learning mate
rial appropriate for the individual student is also part
of the diagnostic judgement. The curriculum-embedded test
measures one objective (3).
The Program for Learning in Accordance with Needs
(PLAN) requires domain-referenced assessment for social
studies, language arts, mathematics, and science in grades
one through twelve (3). An Aptitude Performance Test pro
vides the input needed to select the module (unit) appro
priate for individual student placement. The modules are
coded as to whether they are 1) part of the state require
ment, 2) essential for future performance, 3) highly
desirable for future performance, 4) necessary for citizen
ship, and 5) desirable for the well-informed citizen.
After module selection, a pretest is given and a teacher-
learning unit selected. A posttest is given after study
of the module to determine if the student should be
advanced or alternate learning materials selected (3).
41
For third to ninth grade mathematics the Grand Forks
(North Dakota) School District uses a domain-referenced
pretest in the fall to determine students' strengths and
weaknesses for placement purposes. The domain-referenced
posttest in the spring is for evaluation of the year's
progress and for predetermining probable fall placement
(19).
The lAMS (Individual Achievement Monitoring System)
is used for children with learning disabilities. Domain-
reference testing is geared to the two week module or unit.
Three parallel test forms, a pretest, posttest, and a test
for recycling, are developed for each unit. Monitor test
ing is suggested to measure retention about every four
modules or eight weeks. Actual teacher grading is encour
aged to provide immediate feedback on student performance
(19).
The Mastery Learning models provide individualized
instruction with a group-based instructional environment.
Domain-referenced tests are usually used for formative
evaluation (unit posttests) or for summative evaluation
(final assessment) (3).
Application of Domain-Referenced Testing to Foodservice Systems Management
Domain-referenced testing is not reported to be used
in foodservice systems management courses in community
42
colleges and universities. However, Miller and Spears (68)
recommend that an individualized program of mastery learn
ing and group study be used for a highly technical course,
"Operations Analysis in Food Systems." They cite the varied
backgrounds of students at the college level as the reason
to individualize programs. There is no evidence that a
domain-referenced test was constructed for the pretest,
unit tests, or posttest. However, by applying domain-
referenced test procedures to the mastery learning model
of Miller and Spears (68) , a more definite correlation
between specified performance standards and learning out
comes could be established.

CHAPTER III
PROCEDURE
The primary objectives of the research were to
1) develop a valid and reliable domain-referenced test
to diagnose student strengths and weaknesses based on
performance standards specified for introductory courses
in foodservice systems management, 2) evaluate the effect
of age and experience on domain-referenced test scores,
and 3) determine if a "common knowledge base" exists at
the termination of units in foodservice systems management.
Selection of the Type of Evaluation Instrument
Originally, the directors of the foodservice systems
management curriculum of community colleges in Texas and
California that offered two-year associate diplomas and
one-year assistant programs in the area of foodservice
systems management were sent a questionnaire. The question
naire asked for the director's opinions of equivalency
testing in foodservice systems management, and their will
ingness to participate in the development of an equivalency
test for this purpose. Out of the directors of sixteen
community colleges who were sent the questionnaire, six
expressed a desire to cooperate in the development of an
43

44
equivalency test. After a review of the different courses
in foodservice systems management offered by the community
colleges and Texas Tech University, equivalency testing
was determined to be an impractical goal. However, the
responses to the questionnaire indicated that students
entered foodservice systems management programs with a
great variety of backgrounds. This finding emphasized the
need for evaluation instruments.
A domain-referenced diagnostic test was selected as
the instrument to indicate students' strengths and weak
nesses based on specified performance standards in food-
service systems management. The results of a diagnostic
test would meet current evaluation needs, and, in order to
clarify the test content, the test would have to be domain-
referenced.
Writing the Domain-Referenced Test
The domain was drawn from the implied curriculum in
introductory foodservice systems management textbooks.
Roudabush's (14) implied curriculum was selected since the
domain will not be representative of one school or one
program of study. An outline of the subject-matter con
tent, as suggested by Gronulund (33), was compiled of the
material in textbooks used in foodservice systems manage
ment courses (List given in Appendix A).

45
The following eight content units were identified
after outlining the material and administering a pilot test
to advanced dietetic university students and foodservice
employees beginning a supervisor's course:
1. Menu Planning and Service
2. Purchasing
3. Storage
4. Food Preparation
5. Equipment and Layout
6. Cost Control
7. Sanitation
8. Personnel Management
A unit on work simplification and merchandising and service
had been included prior to the pilot test, but pertinent
content was integrated into other units after evaluation
of the pilot test. Work simplification was incorporated
into food preparation and cost control, and questions on
merchandising and service were included in menu planning
and service and also the food preparation unit. These changes
eliminated units with less than five items and maintained
an average testing time of one hour.
The number of items measuring the learning outcomes
of knowledge, comprehension, and application were deter
mined for each unit. Bloom's Taxonomy of Educational
Objectives (24) provided the classification of test items
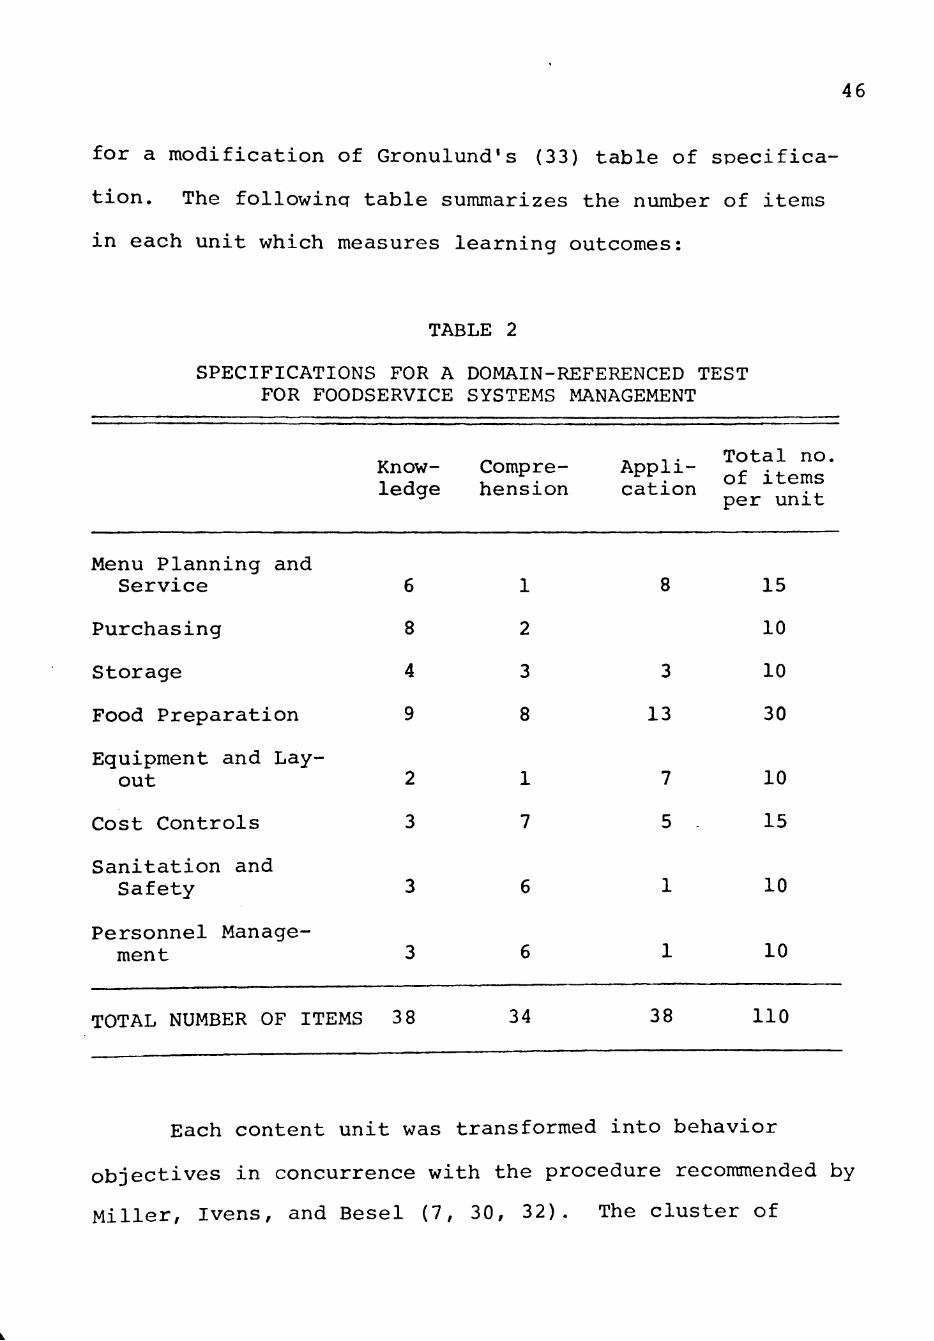
46
for a modification of Gronulund's (33) table of specifica
tion. The followincr table summarizes the number of items
in each unit which measures learning outcomes:
TABLE 2
SPECIFICATIONS FOR A DOMAIN-REFERENCED TEST FOR FOODSERVICE SYSTEMS MANAGEMENT
Know- Compre-ledge hension
,. Total no Appli- ^ . . ^f. of Items cation . . per unit
Menu Planning and Service
Purchasing
Storage
Food Preparation
Equipment and Layout
Cost Controls
Sanitation and Safety
Personnel Management
TOTAL NUMBER OF ITEMS
6
8
4
9
2
3
3
3
38
1
2
3
8
1
7
6
6
34
8
3
13
7
5 .
1
1
38
15
10
10
30
10
15
10
10
110
Each content unit was transformed into behavior
objectives in concurrence with the procedure recommended by
Miller, Ivens, and Besel (7, 30, 32). The cluster of
47
behaviors taught as a unit provide a coordinated set of
diagnostic subsets of any given domain (31).
The number of objectives for a test depends on the
purpose of the test and the characteristics of the cur
riculum (14, 25). Since this test is intended for diag
nostic purposes, it does not pursue any objective in
depth. To avoid waste of time and energy (6, 12, 35),
only the most significant objectives were tested. The
selection of the most significant objectives depended
on the volume of material related to that objective in
the textbooks reviewed, and on the judgement of a panel of
four faculty members who teach introductory and advanced
courses in the field of foodservice systems management.
Test items were not written for all objectives. The num
ber of test items written for an objective varied from one
to ten. The items written for each unit followed the table
of specifications for learning outcomes. Items were not
written to be a random sample of the domain, but to be
". . . representative of the domain . . . " (14).
The multiple-choice type of objective test item was
selected because it provides ". . .a higher quality
measure . . ." (29, 33). The item format consisted of an
incomplete statement with one best answer and three dis
tractors. The incomplete statement is typically the most
concise form and four good alternatives can be written
48
effectively to provide a satisfactory estimate of reli
ability (29, 33, 39). Gronulund's recommendations (32) for
an item format, for spacing, and for Rules for Constructing
Quality Multiple Choice Items were followed (see example,
p. 11 and rules, p. 13).
The test format organized the items by subject-
matter content, which is the recognized arrangement for
diagnostic tests (32, 33, 39). The items in a unit were
arranged in order of ascending difficulty whenever appli
cable. However, items in some units required that they be
arranged in order of item content to provide continuity
for the reader, in spite of the varying levels of dif
ficulty represented. The research of Olsen and Barickowski
(40) indicate that there would be no difference in student
perception of item difficulty when items are arranged in
hard-to-easy or easy-to-hard order.
Since the main concern of the test was level of stu
dent achievement, speed was not an important factor (33).
The expected length of time for the majority of students
to complete the test was one hour. The experiences of the
Grand Forks (North Dakota) School District in administer
ing domain-referenced tests for Kindergarten through grade
twelve support one hour as the maximum testing time for
obtaining reliable results (19) .

49
Evaluation of the Domain-Referenced Test
The personal opinions and judgements of four experi
enced faculty members in foodservice systems management
provided valuable and necessary input as to information
included in the test (17, 31). Pyrak (4) confirms that the
opinion of several judges as to item quality contributes to
item selection. Following the experts' suggestions, altera
tions were made in the behavioral objectives, weighting of
the units, the table of specifications, and the written
items. The difficulty of the items in the foodservice
preparation unit was increased. Also, a problem on a food-
service layout was incorporated to provide more information
for questions at the application level.
The next step was a pilot test, a procedure recom
mended by Cooper (2 7) for domain-referenced test develop
ment. The pilot test was administered to two groups. The
first group consisted of 27 foodservice employees with
experience, but little or no formal education in community
colleges or universities. The second group consisted of
17 junior and senior university students majoring in food
and nutrition.
A computer was used to compile the results of the
two test groups. The results were analyzed to determine
discrepancies in the answers based on the content in
textbooks in contrast to answers based on work experience.

50
The strengths and weaknesses of the foodservice employees
and the university students on specified performance stan
dards were determined to indicate the validity of the test
as a diagnostic device. To show the range of individual
performance, domain-referenced test writers suggested the
inclusion of test items that are easy, medium, and dif
ficult (8, 11, 45). Ivens (32), Kriewall (12), and Pyrcak
(41) recommend that item difficulty and the index of
discrimination be used as an aid to the test editor in
selection and revising test items, but not as the sole
determinant of which items are acceptable. Therefore,
distractors chosen more often by either group were recon
sidered to determine if the answer was confusing or inac
curate. Distractors which were rarely chosen were evalu
ated and changed if necessary. When a large portion of
the examinees selected the correct answer, the ability of
the item to discriminate was reviewed to determine if the
question and answer were too obvious or common knowledge.
Based on the analysis of each unit, at least ten items
per unit and one item for the most important objectives
were required to contribute significant information to
determine the participants' strengths and weaknesses based
on the specified performance standards. Following the
analysis of the pilot test, the table of specifications,
the weighting of units, and the test items were improved.
TEXAS TESK IsSnaSY

51
The test was administered to students who sampled the
range of individual performance in the area of foodservice
systems management, not only the extremes of high profi
ciency (12, 44). The range of individual performance was
represented by students with no experience and no community
college or university instruction in introductory food-
service systems management to students with several years
of experience, completion of an introductory course and
varying number of courses in advanced foodservice systems
management. The domain-referenced test was administered to
105 students in the fall of 1974 and the spring of 1975:
a. 41 students enrolled in introductory foodservice systems management courses at two community colleges
b. 22 dietary employees at nursing homes and hospitals who were beginning a 90-hour foodservice supervisors course
c. 21 sophomore and junior dietetics majors enrolled in an introductory foodservice systems management course
d. 21 junior and senior dietetics majors enrolled in an advanced foodservice systems management course
All tests were administered at the students' usual
class time, except the group of 21 junior and senior dietetic
majors who were allowed to take the test at preset times to
get bonus points in an advanced course. Tests were adminis
tered by the test developer with the exception of the two
groups at out-of-state community colleges where the direc
tors were mailed the test with instructions for its

52
administration. Each examinee received General Instructions
for taking the test, a test copy, a computer score form,
a piece of scratch paper, and a number two lead pencil.
The student was told that he had as long as he needed to
complete the test.
Students' scores were reported by social security
number. The percentage correct for each unit and the total
test was reported. Students who scored at the 80 percent
level or above on the total test or on a unit were marked
as being strong in that area (7, 59). Students who answered
only 50 percent or less of the questions correctly on the
total test or on a unit were marked as weak in the area
with the lower score. The range of scores between 80 and
50 percent was a confidence interval which would require
more input to determine strength or weakness (59).
Analysis of Data
If the test is valid, it should be sensitive to
appropriate instruction (10). The validity of the test was
determined by a t-test applied to two different sets of
data as shown in Table 3 (see p. 58). The first set of
data consisted of 24 students who had not been instructed
in a unit in a foodservice systems management course.
Group 1, and 17 students who had been instructed in all
eight units in a foodservice systems management course.
53
Group 2. If the domain-referenced test for introductory
foodservice systems management is a valid test of knowledge
on this subject, the students who have completed all eight
units should have a mean total score significantly larger
than the mean total score of students who have not been
instructed in any of the units in a community college or
university. The second set of data consisted of the unit
scores of students who had not been instructed in the unit.
Group 1, and the unit scores of students who had been instruc
ted in the unit. Group 2. The mean difference for both sets
of data must be significant at the .05 level for the test
to be accepted as valid.
The Kuder-Richardson Formula 20 (KR-20) was the
coefficient of reliability selected to determine the degree
of internal consistency among the test items. Although
several other statistical methods have been proposed
(48, 49, 50, 51), their interpretation is not as well defined
as the KR-20. Since the examinees sample the range of pro
ficiency in foodservice systems management, the total test
score was analyzed by the KR-20. For a multiscaled diagnos
tic test, the reliability of subscales may be more signi
ficant than the reliability of total test score. The eight
units were analyzed for reliability and the problems of
variance within the units and unit test length were evalu
ated for their effect on unit reliability (9, 14, 32).

54
The Statistical Package for the Social Sciences
(SPSS) Multiple Regression Program was selected for analysis
of the factors which affect student scores on the domain-
referenced test. The multiple regression program will pro
duce a linear combination of independent variables which
will correlate as highly as possible with the dependent
variables. The dependent variables effected by the indepen
dent variables were 1) total test score and 2) each unit
score. The independent variables were selected from the
Student Information Form and assigned numerical values.
The range of the following independent Variables will be
represented by:
1. increasing age
2. increasing years of experience
3. increasing length of the chosen program of study
4. no instruction to completion of the following at a community college or university prior to testing:
a. each of eight units based on knowledge of introductory foodservice systems management
b. a food preparation course
c. an introductory foodservice systems management course
The SPSS Multiple Regression Program output provides
the following statistical information for analysis:
1. simple regression coefficient (r)
2. normalized regression coefficient (b)

55
3. multiple regression coefficient (R)
4. R Square (R Sq.)
5. F value (F)
Coefficients reflect the strength of the relationship between
the independent and dependent variables. The simple regres-
sion coefficient represents the linear relationship between
the dependent variable and one independent variable. The
normalized regression coefficient is also called the path
coefficient of the independent variables correlated with the
dependent variable. The normalized regression coefficient
indicates whether the relationship is positive or negative.
A positive coefficient means that the larger the value of
the independent variable, the larger the value of the depen
dent variable. The negative value means that the larger the
value of the independent variable, the smaller the value of
the dependent variable. The R square is the proportion of
variance accounted for by the independent variables. The F
value measures the significance of the regression equation
representing more than mere change (69).
When the variables in the multiple regression are
significant at the point that they are added to the step
wise regression, the results were reported on the correla
tions which included only those independent variables. This
allows the results to display the multiple correlation for
those variables without the addition of many extraneous

56
factors. When the most significant variables in the mul
tiple regression are not significant at the point that they
are added to the stepwise regression, the results were
reported on the correlations between all independent
variables available for addition to the multiple regression
program.
For the interpretation of the results of the multiple
regression program causal modeling was used. "This method
of analysis attempts to explain empirical findings in a
manner that reflects the total process which the researcher
believes underlies the situation under study rather than
just the bivariate relationships" (69). The normalized
regression coefficient (b) is the path coefficient used for
the explanation of the relationships between the independent
variables and the dependent variables.

CHAPTER IV
RESEARCH FINDINGS AND DISCUSSION
Analysis of Validity and Reliability
Table 3 lists the descriptive statistics and the KR-20
coefficient of reliability for the total test and for each
\init. The mean is similar for the total test and for all
units. A wide range of scores is evident. The standard
deviation indicates that only the scores on the total test
represent a normal distribution.
The reliability coefficient for the total test of
r = .89 is close to the r = .90 recommended for standardized
achievement tests (33, 38). The reliability coefficients
were lower for the units due to 1) the small number of
test items, 2) the large number of objectives measured by
a unit, 3) the smaller variance in student competencies on
some units, and 4) the lack of sufficient homogenity of
unit content. In accordance with the acceptance of a coef
ficient of .50 by the Advanced Placement Program of the
College Board (59), hypothesis 3 for the five units,
Purchasing, Food Preparation, Cost Control, Sanitation, and
Personnel Management, with a reliability coefficient of .50
was rejected. The Menu Planning and Service Unit had a
r = .37. Menu Planning and Service may not be taught at
57

58
TABLE 3
DESCRIPTIVE STATISTIC AND THE KR-20 COEFFICIENT OF RELIABILITY
Range of Standard .._, ^^ Mean ^ ^ r • i. • KR-20 Scores Deviation
Total Test 55.00 28-83 12.83 .89
I. Menu Planning
and Service 53.52 20-87
II. Purchasing 55.90 0-100
III. Storage 62.66 30-100
IV. Food Preparation 55.55 27-90 15.71 .71
V. Equipment and Layout 54.19 0-100
•Sample N = 105
1 4 . 4 2
2 6 . 4 4
1 4 . 5 6
. 3 7
. 5 5
. 0 5
1 8 . 6 4
1 6 . 9 0
2 0 . 4 2
. 4 2
. 5 2
. 5 0
VI. Cost Control 50.23 0-87
VII. Sanitation 51.04 10-90
VIII. Personnel Management 45.71 10-90 21.92 .55

59
the same time by some instructors. Therefore, the lack of
sufficient homogenity of unit content may have caused the
low reliability coefficient. The extremely low reliability
on the Storage Unit of r = .05 was probably the result of
a lack of variance in the scores. No ready explanation is
available for the reliability coefficient of r = .42 for
the Equipment and Layout Unit scores. Therefore hypothe
sis 3 was accepted for the Equipment and Layout Unit, the
Storage Unit, and the Menu Planning and Service Unit.
The validity of the test was determined by a t-test
applied to two different sets of data. The first set of
data consists of the total test scores of the students who
had not been instructed in a unit in a foodservice systems
management course. Group 1, and the total test scores of
the students who had completed all eight units in a food-
service systems management course. Group 2. The second set
of data consists of the unit score of students who had not
been instructed in the unit. Group 1, and the unit score of
students who had been instructed in the unit. Group 2. The
second set of data was compiled for each of the eight units.
Table 4 summarizes the results of a t-test on the two sets
of data discussed. The difference in the mean of Group 1
and Group 2 on the Equipment Unit was significant at the .01
level. The other five units, Menu Planning and Service,
Purchasing, Food Preparation, Cost Control, and Personnel

60
TABLE 4
DESCRIPTIVE STATISTICS AND SIGNIFICANCE LEVEL FOR THE T-TEST*
Data Sets Number Mean
Total of Eight Units
Group 1** Group 2***
Menu Planning Group 1 Group 2
Purchasing Group 1 Group 2
Storage Group 1 Group 2
Food Prep Group 1 Group 2
Equipment Group 1 Group 2
Cost Control Group 1 Group 2
Sanitation Group 1 Group 2
Personnel Mgt. Group 1 Group 2
24 17
56 49
79 26
64 41
30 75
73 32
72 33
34 71
64 41
47.70 68.00
48.54 56.16
49.24 76.15
60.63 65.85
47.30 58.67
47.53 59.06
55.14 68.15
41.76 55.49
43.9 48.54
Separate Variance Estimate
T-Value Significance
6.24
4.03
6.43
1.88
3.80
2.68
4.35
3.40
1.01
.001
.001
.001
.06
.001
.01
.001
.001
.32
•Sample N = 105
••Examinees who have not been instructed in the unit or units in a community college or university
•••Examinees who have been instructed in the unit or units in a community college or university.

61
Management, and the total scores of the eight units were
significant for Group 1 and Group 2 at the .001 level of
significance. Therefore, hypothesis 1 was rejected at
least at the .01 significance level. The difference in
Group 1 and Group 2 was not significant for the scores on
the Storage Unit and the scores on the Personnel Manage
ment Unit. For these two units, hypothesis 1 was accepted.
Both groups scored relatively high on the Storage Unit and
relatively low on the Personnel Management Unit. Either
these units, particularly the Personnel Management Unit,
did not measure adequately the material being taught, the
instruction was ineffective, or considerable error occurred
in the research.
Establishment of Correlations Between the Independent Variables and the
Dependent Variables
The correlations for the independent variables which
had the most significant multiple R with the total test
score are recorded in Table 5. The simple r shows that
each independent variable correlated positively with the
total test score. The completion of the Personnel Manage
ment Unit accounted for a large portion of the variance in
the total test score, but as a predictor with the other
independent variables, the completion of the unit had a
negative notmalized regression coefficient (b). The
62
i n
w
<
C/5 W
H
o EH U H Q
EH
< u H CM
H o o w H W EH
W H W ffi EH EH
W
:5 EH W
tn Ui EH 2: w H
u H CM CM O U
O H
EH O EH
Q
O U
o
Q) O
o rH -H Q) ^-^
> -H
•H
CM
p^
o o
CN
rH
i n
CN cn
i n
rH
o o
cn
o
o o
00
VO
CN
i n
CN
I
o
00
cn
cn (U
H XI d
•H >H (d >
> 1 TJ :3 +J
, C/i
UH 0
g rd JH tP 0 V 0.
1 tn +J > i d cn Q)
e (U 0 u Cn
•H fd > C U (0 <D B cn
TJ cn 0 e 0 Q)
CM - P
0) cn u r^ 0 o
1 (1) t7> (d c fd S ^ -P <U -H
c c d D 0 cn 4J SH C: <U 0 CM e
c 0
•H +J fd JH fd Oi cu ^ a cu
cn n3 v-( 0 :3 0 0 CM U
63
proposed relationship for the independent variables and
the total test score is as follows:
Completion of the Personnel Management Unit .27
Completion of a foodservice systems management course
Completion of a food preparation course
Increasing length of programs of study
41
Total test score
.17
The F Value of 19.72 for the increasing length of the pro
gram of study emphasized the importance of this variable
as the major predictor of total test score. The comple
tion of a foodservice systems management course and a
food preparation course would be a component of a program
of study requiring greater time, as reflected by the
greater number of students in the four-year degree program
who had been instructed in these courses prior to taking
the domain-referenced test. The fact that a Personnel
Management Unit taught in a foodservice systems management
course could contribute negatively to the prediction
equation indicates that the test questions did not measure
64
the material being taught, the unit instruction requires
revision, or that considerable error occurred in this study.
Since the mean unit score was equally low for both the stu
dents who had completed the unit and those who had not been
instructed in the unit, the normalized regression coefficient
(b) for the Personnel Management Unit is probably not a
result of error, but an indicator that instruction in this
unit and the specific test items need further analysis.
Possibly the Personnel Management Unit is taught at higher
levels of learning, application, synthesis, and evaluation,
without sufficient emphasis on knowledge and comprehension
of material. However, when using the problem-solving
approach in teaching the Personnel Management Unit, the stu
dent should be able to understand all components of the
problem. Some students in all different programs of study
had completed a Personnel Management Unit, but the amount
of time spent on the unit and the emphasis of the instructor
are factors that were not taken into account by the statis
tical analysis. The model for the total test scores accounts
for almost one-half of the variance in test scores.
The correlation coefficients between the significant
predictor variables and the score on each of the eight units
were determined. On Table 6, the independent variables that
were significant predictor variables for the Menu Planning
and Service Unit were the same significant predictor

65
VD
CO
cq
<
H
o EH O H Q O C15 U K CO CM
E H EH H
<C O U H [iq CM U
H H
O C< H Cq CO CO
K O tn ^ EH <
Ciq O 2
Cq H 15 S
CQ
2
CM
D 2
CO EH
Ci5 H CJ H W CM ffi CM EH Ciq O Q
<
523 O H ^ •
<
rt o
0 o
MH C o fd
u CD m > -H
•^ D^ •H CO
CM
CO
rt
.Q
o o
CN
i n
o
CN
OS
cn cn
o o
VD
00 CN
VD CN
i n
CN
O o
ro i n
i n
o
OS CN
i n
CM
o o
ro cn
9
VD
r^ **
ro CO
CO i n
VD CN
cn (U
i H SX (d
•H }H fd >
> 1 TJ :3 4J CO
m 0
E fd U Cn 0 H
Q^
1 cn +J > i C cn 0
E 0 0) U tJi
•H fd > C u fd <u e cn
73 cn 0 B 0 0) CM 4 J
(U cn JH :3 0 0
1 0) cn fd C fd S rH +J 0) -H
a c C D 0 cn 4J JH G 0 (U CM e
c 0
•H 4J fd
u fd CM (U M a <U
cn TJ >H 0 13 0 0 CM 0
66
variables found significant for the correlation with the
total test score. All independent variables correlated
positively with the Menu Planning and Service Unit score
when entered in a simple regression equation. The Personnel
Management Unit had a small simple r correlation, and a nega-
give normalized regression coefficient. The program of
study accounted for the greatest portion of the multiple
regression coefficient (R) and the greatest portion of the
variance in the scores. All four variables were significant
at the .001 level.
The model of the relationship between the Menu Plan
ning Unit score and the significant independent variables
in the multiple regression is similar to the model for the
total test score:
Completion of the Personnel Management Unit -27
Completion of a foodservice systems management course
Completion of a food preparation course
24 .26
Increasing length of programs of study
.33
Menu Planning and Service Unit score
67
As discussed in the previous model, the Personnel Management
Unit taught at the different schools may require revision,
the test items may be faulty, or the study may contain
errors effecting this value. These four independent vari
ables account for one third of the variance in the Menu Plan
ning and Service Unit score.
Five independent variables had significant positive
prediction coefficients with the Purchasing Unit score, as
shown in Table 7. The completion of the Menu Planning Unit
and the completion of the foodservice systems management
course were not significant when added to the stepwise
regression. However, when all independent variables were
entered into the multiple regression equation, these vari
ables were significant at the .05 level. The simple r
indicated that the independent variables each have a strong
positive correlation with the Purchasing Unit score. With
increasing length of the program of study and completion of
the Storage Unit, Menu Planning Unit, food preparation
course, and foodservice systems management course, the Pur
chasing Unit score increased. The multiple regression
coefficients were large and the R Square of the five vari
ables accounted for 50 percent of the variance of scores.
The variables which have a significant influence on
the Purchasing Unit Score are related in the following
model:
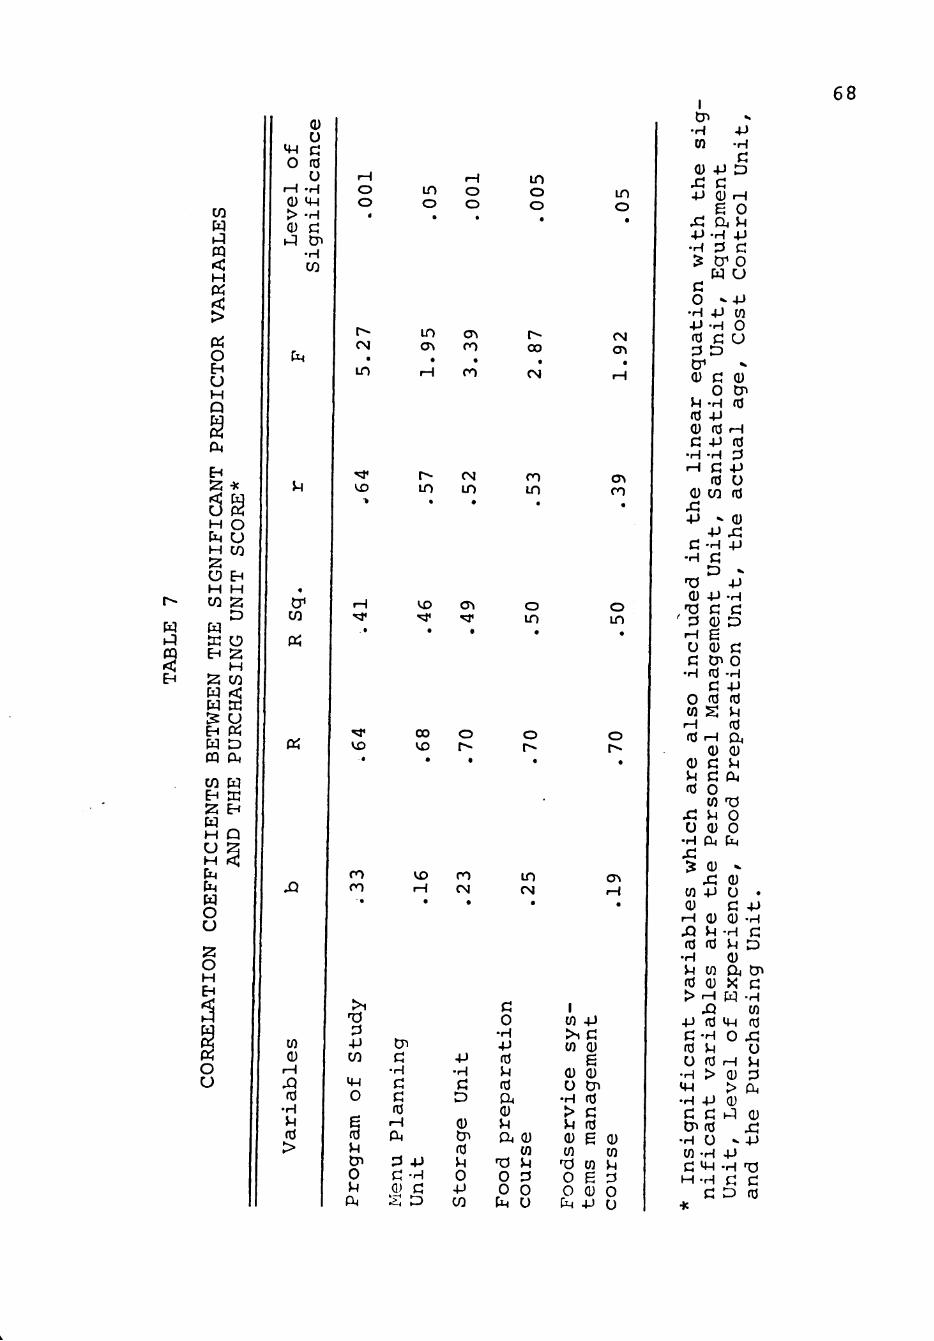
cq
< E H
CO
Ciq
<
H
rt rt o E H U H Q
§ CM
E H
s§ H O CM U H CO O H CO
E H H
Cq m o EH S
H ss CO cq <:
:5 u E H Cq CQ Cl
CO Ciq EH E
CU O
o fd u
rH .r^ Q) <+H > -H
i^ cn • H CO
CM
cr< CO
rt
rt
o o
in o
o o
in o o
in o
CM
in
' ^
VD
CO ro
in OS
OS
cn
ro
VD <5\
00 VD
O
VD ro CM
00
CN
••d' VD
• »
r i n
•
CN i n
•
CO i n
•
o in
o
in CN
CN cr»
OS cn
o in
o
cn (U
rH XX fd
•rH U fd >
1
>1 ^ 3 -P CO
14H 0
E fd
u tP 0 M ex,
CJ1
c; •H
c c fd
f-\
CM
:3 4J
c Q) :>
H
c D
+J •H
c; D
(U Cn fd >H 0 -P CO
c 0
•H +J fd u fd a . cu u CM <U
TJ 0 0 CM
cn u :3 0 u
1 cn 4J > i c cn (U
E 0) Q) U Cn
•H fd > c: M fd <u E (u cn cn
TJ cn ^ 0 E ::> 0 (U 0 CM JJ U
1
T"
V 1 1
K
•P •H
CU +J D JC 4J
s: 4-1 •H ^
C o •H •P fd
C (U rH
E 0
a ^ •H :3
4-» C
Cf 0 Ciq U
« 4J •H C
;3 o C7 <u >H fd <u
1 C 0
•H 4-)
. 4 J cn 0 u
^ (U tr> fd
fd rH C 4J
•H iH
•H fd :3
C -P fd
<U CO ^ -P
c •H
»« CU
, ' 0 13
rH
u C! •H
0
K
o fd
(U -P Xi •H C D
-P C
-P
%> •P •H C
(U D E CU c: cn 0 fd C fd
cn S rH (d rH
<u JH fd
x : o
•H 4:: ^
cn (U
r-{
x> fd •H v^ fd
<u C
•H 4J fd >H fd CM <u u
C CM 0 cn 7 3 >H (U CM
CU
s: -p
CU u fd
cn (U
0 0 CM
^ (U u . C +J (U -H
•H G >H D (U CM cn X C
> rH W -H
-p c-fd
u •H MH •H C
X5 cn fd UH fd H JH fd >
4-> C
Cn fd •H cn •
0 H
C UH . H • H
0 x: 0
H >H Q) ^ > CM 0) 1- (U
^ V 4->
•P H T5 C C
68
c: D fd

69
Completion of Menu Planning and Service Unit
Completion of a foodservice system management course
.19
Completion of a Storage Unit
23
Completion of a food preparation course
Increasing length of the program of study
.33
Purchasing Unit score
The increasing length of the program of study had the great
est influence on the Purchasing Unit score with a F Value
of 5.27. The completion of the Storage Unit was a very
significant contributor to the multiple regression equation.
This unit may be taught in both the foodservice systems
management and the food preparation course with varying
degrees of depth and emphasis. It is interesting to note
that the completion of a food preparation course controls
a great part of the multiple regression equation than the
completion of a foodservice systems management course.
The independent variables in the regression equation
with the Storage Unit score had very small simple regression
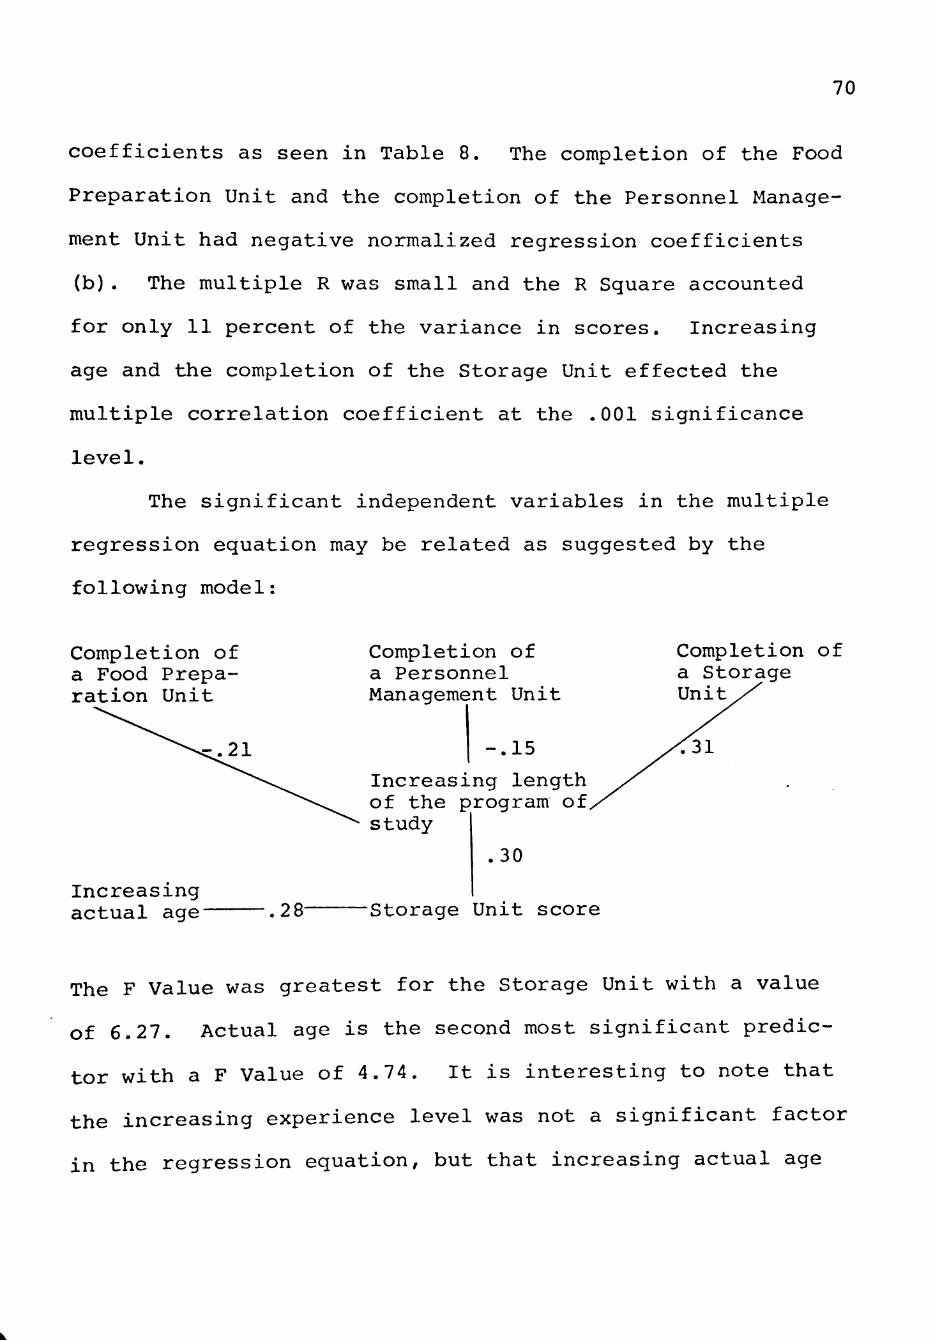
70
coefficients as seen in Table 8. The completion of the Food
Preparation Unit and the completion of the Personnel Manage
ment Unit had negative normalized regression coefficients
(b). The multiple R was small and the R Square accounted
for only 11 percent of the variance in scores. Increasing
age and the completion of the Storage Unit effected the
multiple correlation coefficient at the .001 significance
level.
The significant independent variables in the multiple
regression equation may be related as suggested by the
following model:
Completion of a Food Preparation Unit
^.21
Increasing actual age
Completion of a Personnel Management Unit
-.15
Increasing length of the program of, study
.30
.28- Storage Unit score
Completion of a Storage Unit
<31
The F Value was greatest for the Storage Unit with a value
of 6.27. Actual age is the second most significant predic
tor with a F Value of 4.74. It is interesting to note that
the increasing experience level was not a significant factor
in the regression equation, but that increasing actual age

00
C4
CQ <
CO cq
CQ < H
rt
rt o E H U H Q
CM
E H
^ Ciq < rt u o H U CM CO H
O H H ^ CO 5
Ci3 c q
w o
2 O CLI EH W CO
EH W
CQ EH
CO Q ^ !^
M H U H CM CM
O U
O H E H
<
rt o u
u UH C o fd
o r-{ -H CU '+H > -H
<u c • H CO
CM
CO
rt
rt
cn CU
H
fd •H
fd >
o o
in o
O o
ro 00
^ r ^
VD
ro CN
in o
ro o
iH O o
VD O
O CM CN
O ro
00 CN CN
CN
VD
00 r-i
cn
cn
71
in o
o o
CN
o
ro
in
> 1 TJ 13 4J CO
4H 0
E fd u cn 0 U C^
Q) cr> fd
rH fd :3 •P 0 <
c 0
•H 4J fd JH fd CM CU u CM
TJ 0 0
•P •H c;
CM D
4J •H C D
CU cn fd u 0 4-> CO
1 (U cn fd CJ fd S .H +J (U -H C C C D o cn 4J u c (U (U CM E
72
was a significant factor. This might mean that students
with increasing age but with only a few years of experience
make a significant contribution to the Storage Unit score.
The negative coefficients of b for the Food Preparation Unit
and the Personnel Management Unit should be analyzed. Seven
students in the 90 hour foodservice supervisor program and
the one year assistant programs checked that they had com
pleted a Food Preparation Unit without completion of a food
preparation course. Lower scores on the Storage Unit may
have been made by the same people that had completed the
Food Preparation Unit. The smaller amount of time for indepth
study in the 90 hour foodservice supervisor program and the
one year assistant program may be an additional factor which
helps to explain the negative effect of the completion of a
Food Preparation Unit on the Storage Unit score. The nega
tive correlation of the completion of the Personnel Manage
ment Unit with the multiple regression equation should be
analyzed as previously discussed for the influence it has
on the total test score (see page 63).
The F value of 31.38 and the simple regression coef
ficient (r) of .55 indicated a strong correlation between
the length of the program of study and the Food Preparation
Unit score as shown in Table 9. This one variable also
accounted for 30 percent of the variance in Food Preparation
Unit score. The negative simple regression coefficient for
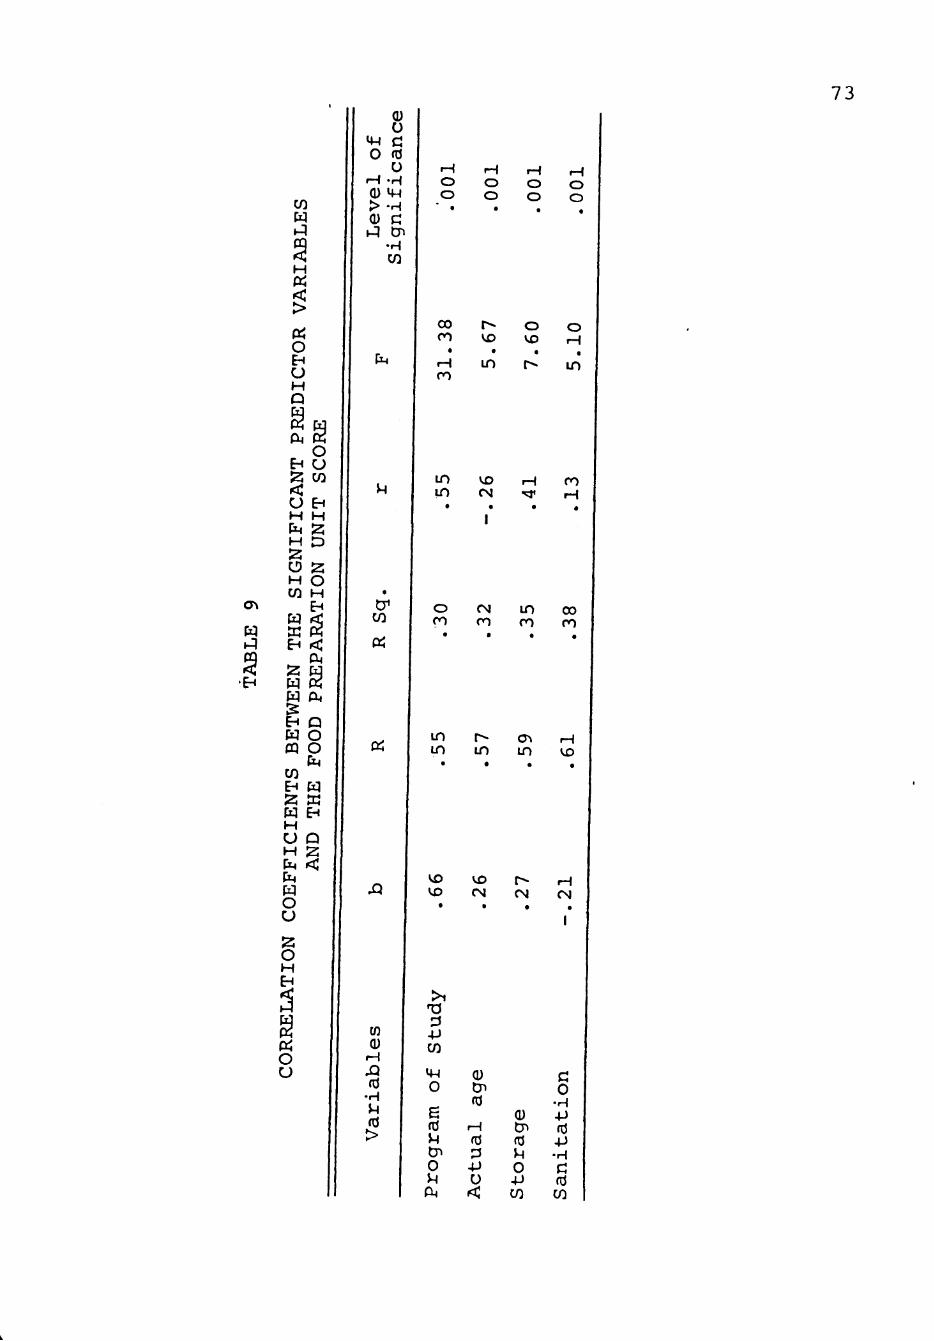
73
o\
cq
tH
CO Ciq
H rt
rt o EH U H Q
rt a rt K
o ^ CO
U EH H H CM ^ H D
O S H O CO H
E H cq <d K rt EH <
CM Z Cq Cq « Cq f i . 12 tH Q Cq O m O
CM CO EH cq
cq EH H O Q H ^ CM < CM cq O U
o H
rt o u
MH O
CU
o fd o
rH -H 0 m > - H <u c i-q cn
•H CO
CM
CO
Q^
XX
IS) CU
H
fd •H U fd >
o o
00 ro
ro
in in
o ro
in in
o o
o o
o o
VD
in
o VD
VD CN • « *
CN ro
in ro
i n OS in
o H
in
ro rH
00 ro
VD
VD VD
•
VD fVJ
•
r--CN
•
r-^ CN
• 1
> 1 TJ :3 -P CO
<w 0
E fd
u t7« 0 u (U
CU cn fd
t-\
fd P +) u <
<u tP fd M 0 4J CO
c 0
•H -P fd + j •H c fd CO
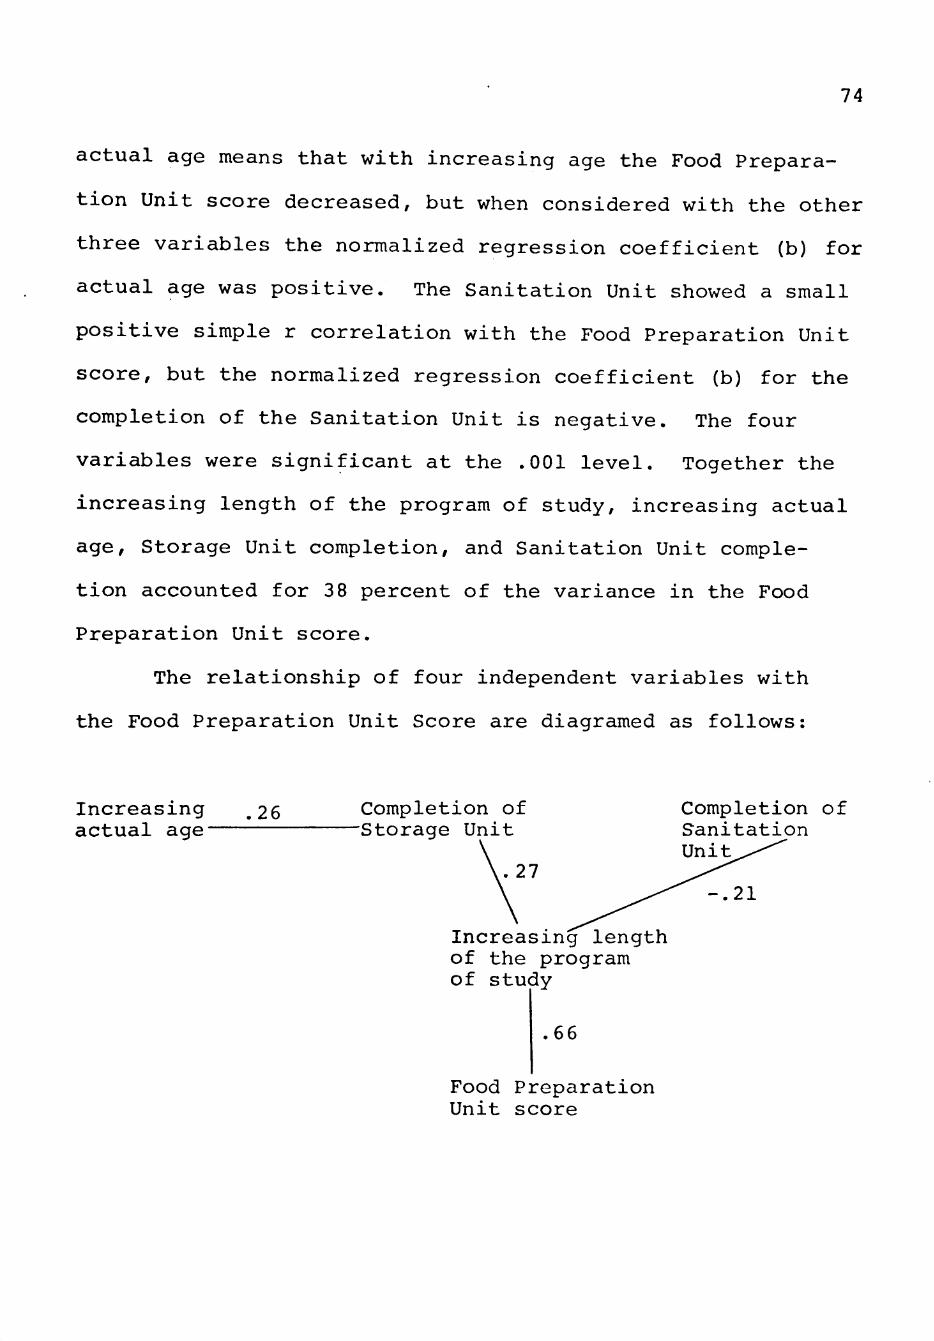
74
actual age means that with increasing age the Food Prepara
tion Unit score decreased, but when considered with the other
three variables the normalized regression coefficient (b) for
actual age was positive. The Sanitation Unit showed a small
positive simple r correlation with the Food Preparation Unit
score, but the normalized regression coefficient (b) for the
completion of the Sanitation Unit is negative. The four
variables were significant at the .001 level. Together the
increasing length of the program of study, increasing actual
age. Storage Unit completion, and Sanitation Unit comple
tion accounted for 38 percent of the variance in the Food
Preparation Unit score.
The relationship of four independent variables with
the Food Preparation Unit Score are diagramed as follows:
Increasing ,26 Completion of Completion of actual age Storage Unit Sanitation
Unit
-.21
Increasing length of the program of study
66
Food Preparation Unit score

75
The Sanitation Unit was completed by a large number of stu
dents in the 90 hour foodservice supervisor program and the
one-year assistant program. The score on the Sanitation
Unit was correlated positively with increasing time for the
program of study. Therefore, students having completed the
Sanitation Unit could have a significantly negative effect
on the multiple regression equation for the Food Preparation
Unit score.
In Table 10, a combination of six independent variables
were significant predictor variables for the Equipment Unit
score. The simple regression coefficient (r) were high for
completion of the foodservice systems management course,
completion of the Sanitation Unit, and completion of the
Food Preparation Unit. The foodservice systems management
course had a large normalized regression coefficent (b) of
.63. The negative b coefficients for the completion of the
Cost Control Unit, the Menu Planning and Service Unit, and
the Equipment Unit indicate that these variables, in com
bination with the other significant independent variables,
decreased the Equipment Unit score. The R Square coefficient
ascribed 34 percent of the variance of the Equipment Unit
score to the six variables. All variables were highly
significant.
The Equipment Unit score was effected by six signifi
cant independent variables whose relationships are reflected
by the following model:

76
cq CQ < £H
CO cq
CQ < H rt
rt o EH
u H Q
CM
EH
IS cq
< rt U O H U P4 CO H
EH
H
2 O H CO
cq EH W S3 EH cq 2: rt cq H cq D ^ O H cq cq CQ cq
CO EH tH
cq 2:
t4H 0
rH
CU o c fd u
•H <D MH > CU •q
•H C Cn
•H CO
CM
CO
rt
c<
o o
VD
O
o o o
o
O
o
in in
t-i in o o o o
VD 00
• ' ' d ' CN
o o
• ^
•<:3< eg
• VD
ro VD
• r-
VD 00
• "^
H ro
• ro
o ^
00 ro
VD r-i
VD ro
ro rH
rH cs
CSJ CM
VD CVJ
OS CM
CM ro
"r ro
in o\ in
Xi
cn CU
r-i XX fd
•H U fd >
1 cn -P > i a cn cu
E cu (U u cr>
•H fd > C ^ fd (U E cn
T3 cn 0 E 0 0 CM -P
ro VD
•
cu cn u •m 0 u
CM CM
•
4-> •H C o c 0
•H +J fd 4-> -H C! fd CO
OS CM
• 1
-P •H c: p
rH 0 u 4J c 0 o +j w 0 u
c 0
•H -p fd VH fd CM cu in
in ro
•
CM CU
TJ 0 o CM
cn M 13 0 U
ro CM
• 1
' d
c fd
tjs C -P
•H -H c: c s =
rH CU rt u
•H :3 > a u Q) CU
S CO
rH CM
• 1
4J •H c; D +j c cu E Cli
•H :3 cr cq
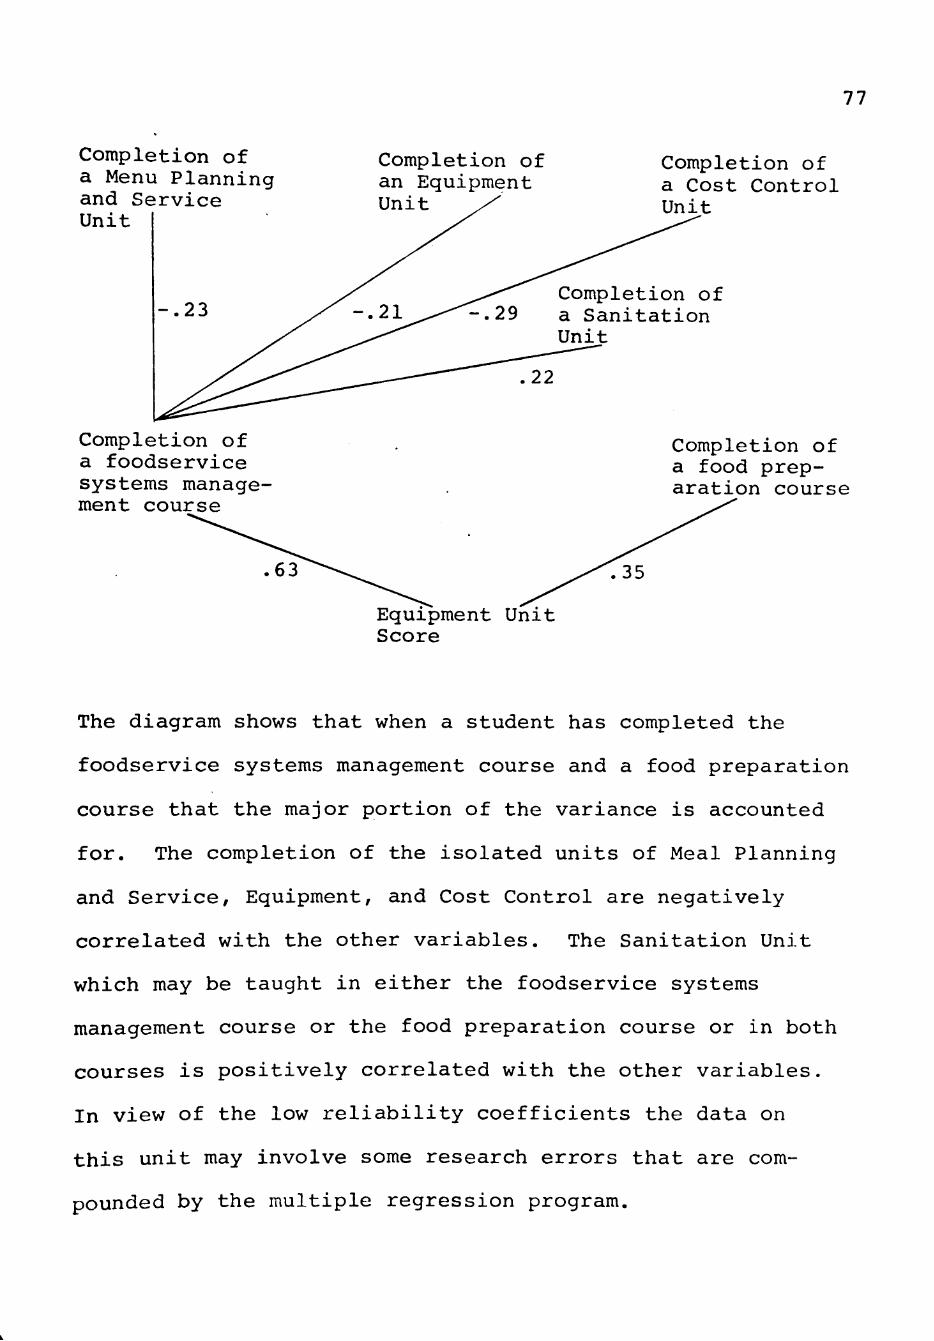
77
Completion of a Menu Planning and Service Unit
Completion of a foodservice systems management course
Completion of an Equipment Unit
Completion of a Cost Control Unit
Completion of 29 a Sanitation
Unit
Completion of a food preparation course
.63 .35
Equipment Unit Score
The diagram shows that when a student has completed the
foodservice systems management course and a food preparation
course that the major portion of the variance is accounted
for. The completion of the isolated units of Meal Planning
and Service, Equipment, and Cost Control are negatively
correlated with the other variables. The Sanitation Unit
which may be taught in either the foodservice systems
management course or the food preparation course or in both
courses is positively correlated with the other variables.
In view of the low reliability coefficients the data on
this unit may involve some research errors that are com
pounded by the multiple regression program.
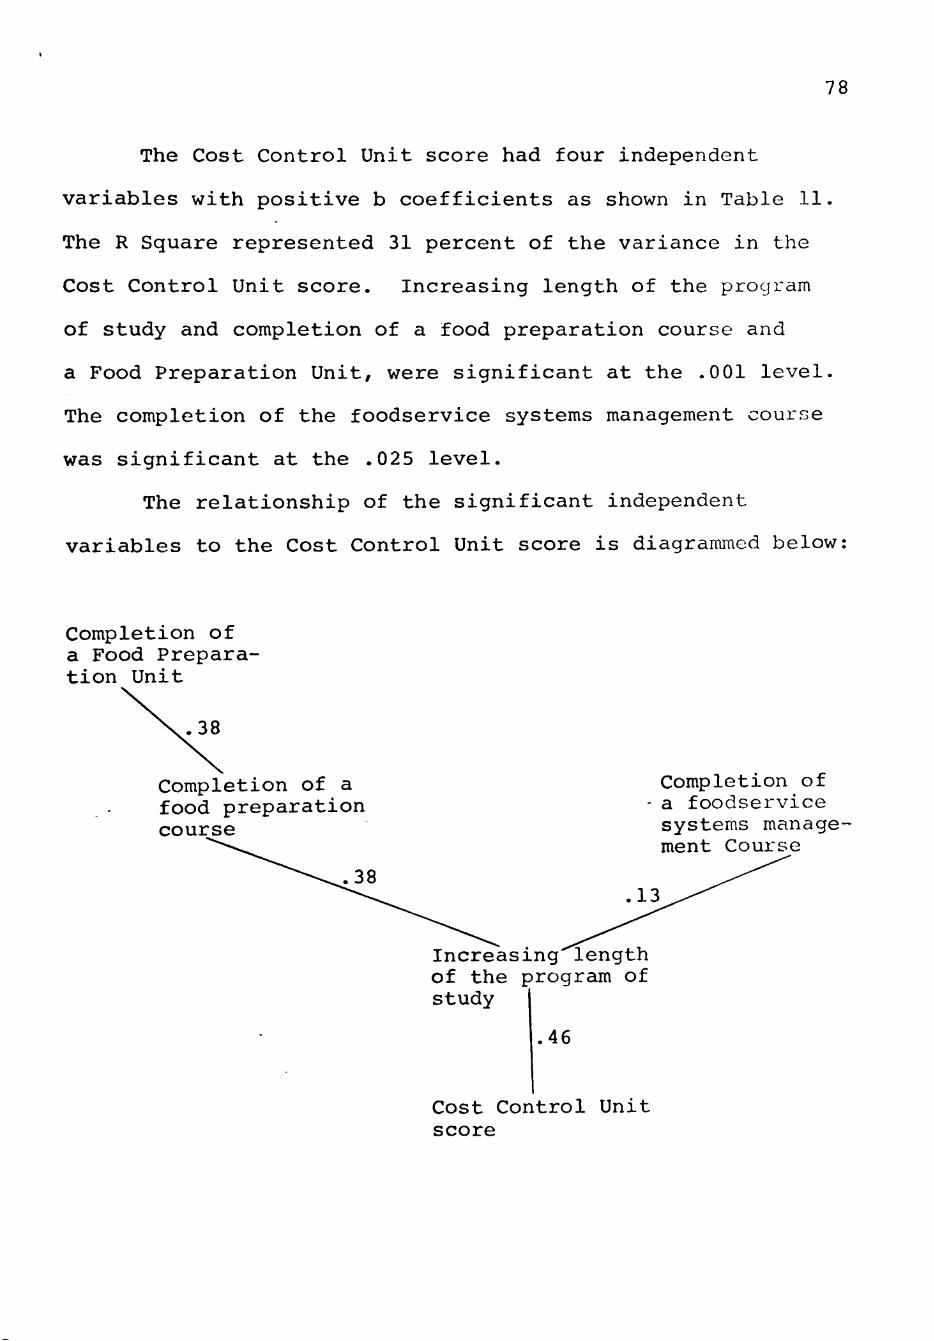
78
The Cost Control Unit score had four independent
variables with positive b coefficients as shown in Table 11.
The R Square represented 31 percent of the variance in the
Cost Control Unit score. Increasing length of the program
of study and completion of a food preparation course and
a Food Preparation Unit, were significant at the .001 level.
The completion of the foodservice systems management course
was significant at the .025 level.
The relationship of the significant independent
variables to the Cost Control Unit score is diagrammed below
Completion of a Food Preparation Unit
.38
Completion of a food preparation course
38
Completion of - a foodservice systems management Course
13
Increasing length of the program of study
.46
Cost Control Unit score
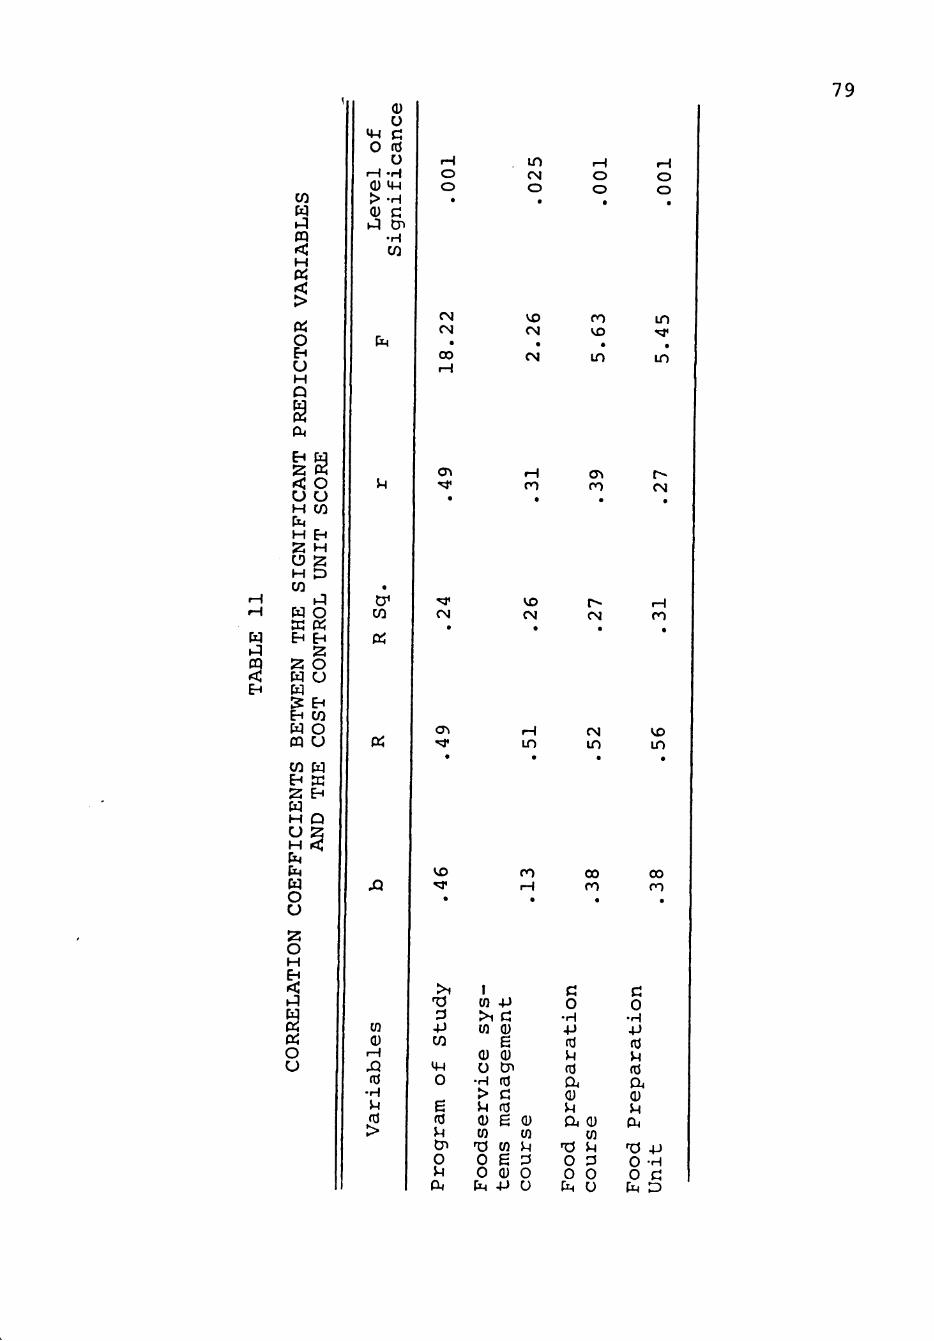
79
cq
CO cq
PX < H
O E H U H Q
rt
E H
< o u u H CO CM
EH H
H
o H CO
cq O
EH EH
2: o cq U cq
cq CO O
CQ O
CO cq EH ffi 2 EH cq H Q U 12 H < CM CM cq O U
O H E H <
rt o o
<u o MH C
0 fd u
r-i -H 0 4H > -H CU c ^q Cr>
•H CO
rH o o
•
CM
CO
Pi
Qi
XX
cn (U
H XJ fd
• H JH fd >
CM CM
• 00
CM
OS
VD
in CM
o
.H o o
VD CM
• CM
ro VD
in
VD CM CM
i n CM
in
ro 00 ro
o o
in
in
OS "^
•
H ro
•
CT ro
•
r-CM
•
ro
VD
in
00 ro
>1
Ti 3 •P CO
MH o E fd >H Cn 0 U rt
I cn 4J > i c; cn (u
E cu cu u cn
•H fd > C u fd cu E cn
T3 cn 0 E 0 <D
CM 4->
0) cn u ^ 0 u
c: 0
•H 4J fd >H fd CM CU u CM CU
Ti 0 0
CM
cn H
13 0 u
c 0
•r-i +J fd u fd CM <u JH
rt ^ 4J 0 H 0 C
CM D

80
The increasing length of the program of study was the most
significant contributor to the multiple regression equa
tion with an F Value of 18.22. The completion of a Food
Preparation Unit prior to the completion of a course in
food preparation and a course in foodservice systems manage
ment adds to the significance of the increasing length of
the program of study. It is interesting to note that the
completion of a food preparation course, with the other
variables considered, contributes more than the completion
of a foodservice systems management course.
Table 12 shows that the completion of a Foodservice
Systems Management Course and the completion of a Sanita
tion Unit were the only variables with a simple regression
coefficient (r) of import. Four of the independent variables
had positive normalized correlation coefficients (b) while
two variables, completion of the Personnel Management Unit
and completion of the Menu Planning and Service Unit have
negative correlation with the Sanitation Unit score. The
six variables together accounted for .30 percent of the
variance. The multiple R is composed primarily of the com
pletion of a Foodservice Systems Management Course. All
variables are significant at the .001 level.
The Sanitation Unit score was effected by six signi
ficant independent variables whose relationships are reflec
ted by the following model:
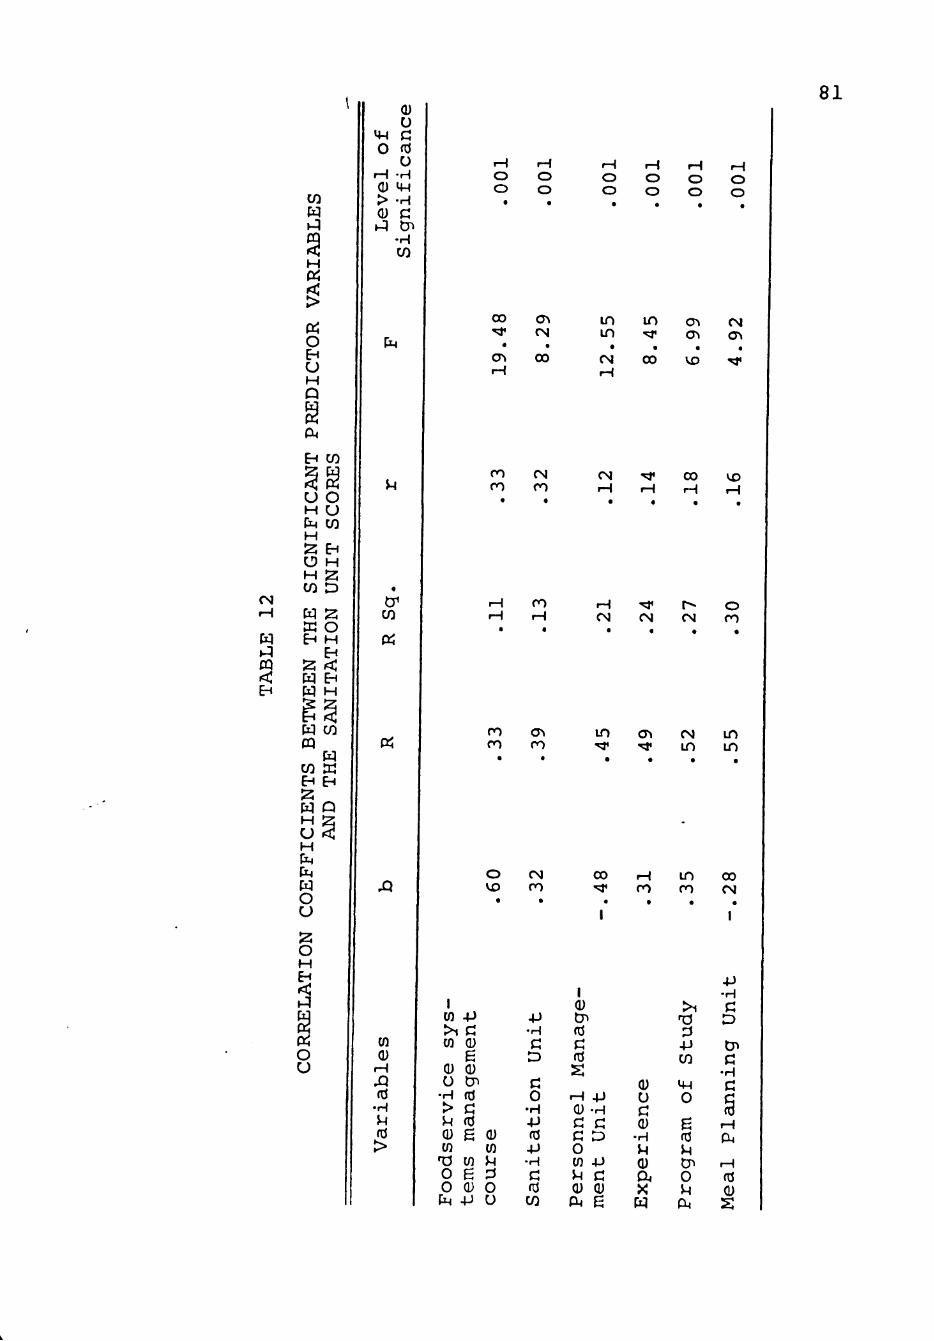
CM r-i
cq t^ CQ < E H
CO cq
H
rt
rt o E H U H Q
rt E^ CO
u o H U CM CO H S E H O H H CO
cq
E H
2 : cq cq
o H E H
H
cq CO CQ
cq CO W E H E H
2: cq Q M 2 O < H CM CM cq O CJ
o H E H
rt o u
MH
o
(U
u fd o
rH -H cu MH > -H CU C »q Cn
•H CO
CM
CO
rt
rt
Xi
cn cu
rH fd
•H JH fd >
r-i O O
ro ro
ro ro
O VD
o o
CM ro
ro rH
OS cn
CM ro
o o
H o o
o o
CM rH
CM CM
in OS
00 ro
00
CM
in
in ro
o o
00 •«*
• cn rH
o\ CM
• 00
i n i n
• CM rH
i n ' r
• 00
Oi OS
• VD
CM OS
• '^
VD
O ro
in in
00 CM
1 cn -P >i c cn (u
E (U <u O D
•H fd > C u fd (U E cn
'O tn 0 E 0 cu
CM - P
0 cn H 13 0 U
-P •H C D
C 0
•H 4J fd -P •H
c fd CO
1 Q) Cn fd C fd S
rH 4-> 0) -H C G c :D o cn 4J u c Q) Q) rt E
cu o c Q)
•H }H 0 CM X cq
> i ^0 :3 -P CO
MH 0
E fd 4
CJ 0 u rt
+J •H C D
Cn c
•H d
§ rH rt
rH fd 0 s
81

82
Completion of a Menu Planning and Service Unit
^ ^.28
Experience .31
Completion of a Personnel Management Unit
.48
Completion of a foodservice systems management course
.60
Increasing length of the_ program of study
.35
Sanitation Unit score
Completion of a Sanitation Unit
32
This diagram illustrates the role of experience and educa
tion as factors effecting the Sanitation Unit score. The
low scores on the Personnel Management Unit for the stu
dents with experience supports the negative b correlation
of the unit with the Sanitation Unit score. The comple
tion of a foodservice systems management course has the
strongest correlation.
In Table 13, two of the significant predictor vari
ables for the Personnel Management score, increasing
experience and completion of an Equipment Unit, had negative
simple regression coefficients (r) and negative b coeffi
cients. The completion of a Food Preparation Unit was the
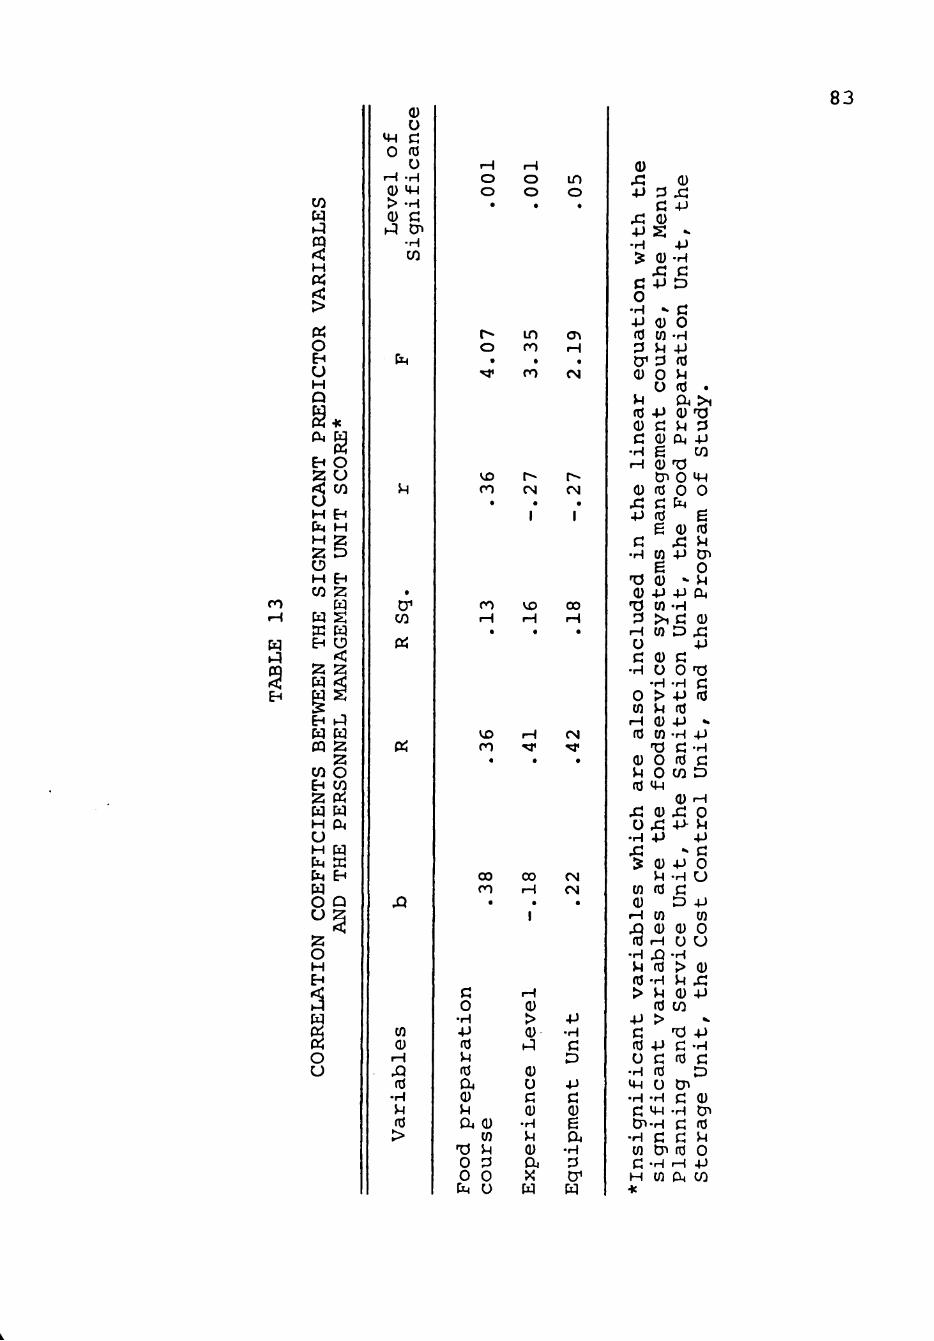
ro
cq
83
CO cq q
CQ < H Pi ^ >
Pi o ^
u H Q
S* ^§ EH O Z U < CO
u H ^ CM H H 2 Z 5 O H EH CO z
cq cq S K cq EH O
< 2 2 cq <
EH I-P
cq cq CQ Z
2 CO O EH CO
2: rt cq cq H CM CJ H cq CM X CM EH
cq O Q U g 12 O H EH
3 cq
§ O u
0 o MH C
0 fd
u rH -H 0 MH > -H 0 C t-:! Cn
• H CO
CM
U
•
tr CO
Pi
pa
XX
cn 0
i H
JQ fd
•H U fd >
f H O O
•
r o
t
•«*
VD ro
•
ro r-i
•
VD ro
«
00 ro
•
G 0
•H 4J (d }H (d Du 0 JH CM 0
cn TJ u 0 13 0 0 CM U
rH o o
•
i n ro
• ro
r-CM
• 1
VD H
•
rH TJ<
•
00 rH
• 1
rH 0 > 0
t-^
0 0 G 0
•H }H 0 CM X cq
i n o
•
OS r-i
• CM
r CM
• 1
00 H
•
CM •^
•
CM CM
•
4J •H G D
4-> G 0 E & i
•H ^ CT" cq
0 xi 0 +j 13 x ;
c; -p Xi 0 -P S -•H +J ^ 0 -H
JG C C -P D 0
•H ^ C •P 0 0 fd cn -H [3 JH 4J Cr" :3 fd 0 0 JH
o fd . JH CM > I fd -P 0 no 0 d JH :3 C 0 CM -P
- H E CO rH 0 73
t7> 0 MH 0 fd 0 0
^ C CM •P fd E
E 0 fd G j : : ^
•H cn -P cn E 0
T3 0 - JH 0 -P 4J rt
^d CO -H :3 > i c 0
f-i Ui O j::i O +J C 0 CJ
•H O 0 73 •H -H n
0 > -P fd cn JH fd
rH 0 4J -fd cn -H 4J
TJ C -H 0 O fd c JH 0 CO D fd MH
0 r-i X! 0 x: 0 0 ^ 4> JH
•H +J +J Xi ^ G ^ 0 -P 0
JH -H U cn fd c! 0 D -P
• H O ) en o 0) (u 0 (d rH U CJ
•H ^ -H JH fd > 0 fd -H H x : > VH 0 +J
fd CO -P > G 'd -P fd 4-) d -H u c; fd c
•H fd D MH O tJ^ •H -H c; 0 C MH -H Cn t P - H G fd
•H C G JH 01 Cn fd 0 C -H rH 4J M 0) CM CO •*:
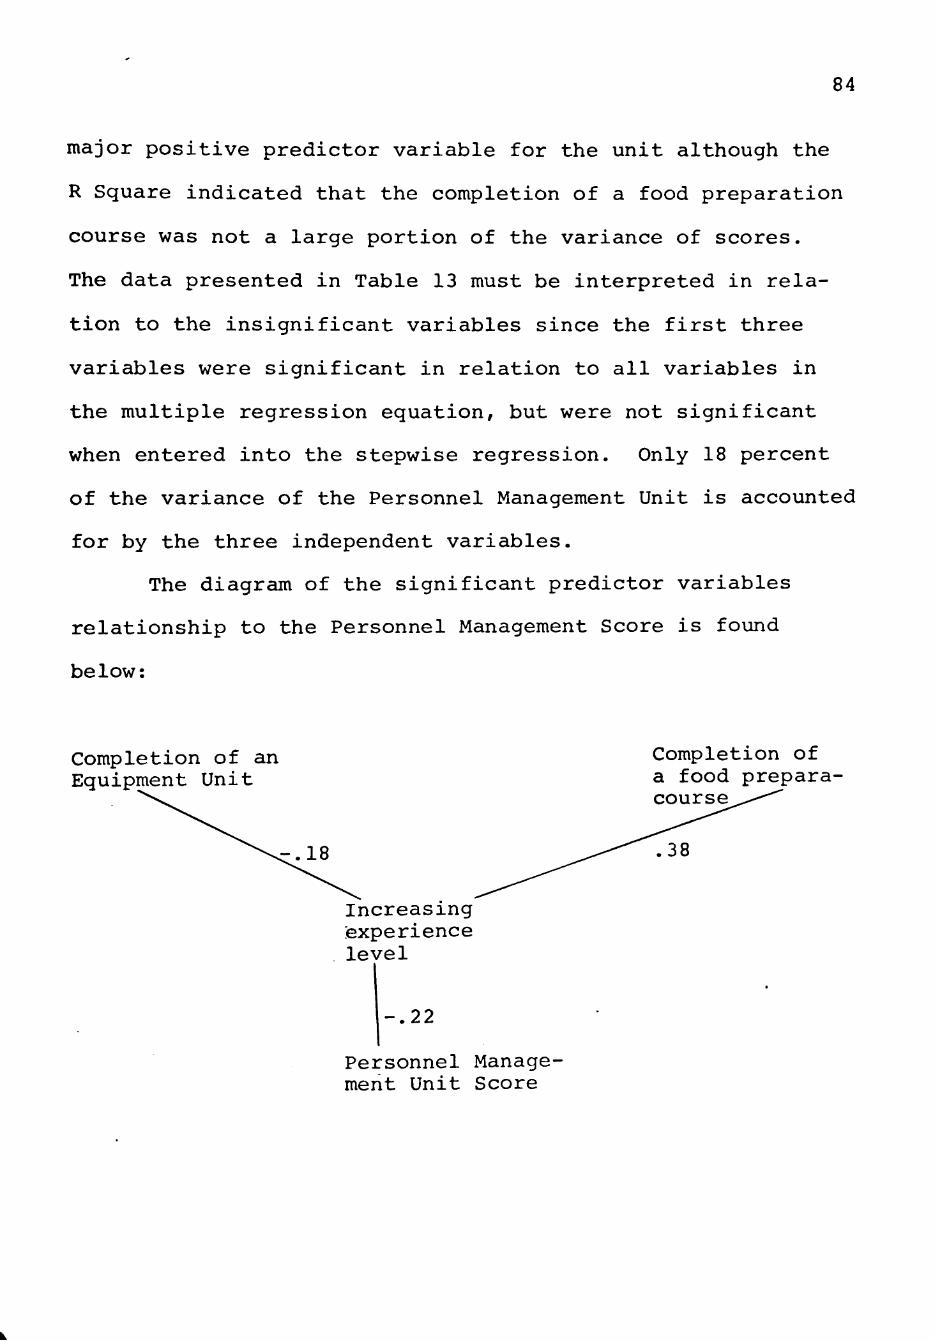
84
major positive predictor variable for the unit although the
R Square indicated that the completion of a food preparation
course was not a large portion of the variance of scores.
The data presented in Table 13 must be interpreted in rela
tion to the insignificant variables since the first three
variables were significant in relation to all variables in
the multiple regression equation, but were not significant
when entered into the stepwise regression. Only 18 percent
of the variance of the Personnel Management Unit is accounted
for by the three independent variables.
The diagram of the significant predictor variables
relationship to the Personnel Management Score is found
below:
Completion of an Equipment Unit
0-.18
Completion of a food prepara-coursi
.38
Increasing experience level
-.22
Personnel Management Unit Score
85
The reliability of this normalized regression or regression
or path coefficients is doubted since no significant dif
ference was found in the scores of students who had com
pleted the units and those who had never been instructed in
the unit. The negative b coefficient indicates that the
longer the work experience, the more difficult the exami
nees may have in understanding the principles of manage
ment. The strong positive correlation of the food prepara
tion course with the Personnel Management Unit is unexpected
since the content in a Personnel Management Unit would
generally be taught for a foodservice systems management
course.
The independent variables entered in the multiple
regression program were significantly correlated with the
total test scores and the unit scores. The increasing
length of the program of study was significant seven times,
the completion of a foodservice systems management course
was significant five times, and the completion of a food
preparation course was significant five times. Therefore,
hypothesis 4 is rejected at a significance level of at
least .01.
CHAPTER V
SUMMARY AND CONCLUSIONS
The objectives of the research were accomplished by
the administration of a domain-referenced test to 105 stu
dents enrolled in foodservice systems management courses.
First, a valid and reliable domain-referenced test was
developed as a diagnostic tool to assess the strengths and
weaknesses of students entering a field of foodservice
systems management. The total test had a reliability
coefficient of r = .89. The coefficients of reliability
were above r = .50 for all the units except the Menu Plan
ning and Service Unit, the Storage Unit, and the Equipment
and Layout Unit. The low reliability coefficient for the
Menu Planning and Service Unit indicates that the two areas
may have dissimilar content and need to be separated into
two units. Specific job experiences of examinees may have
contributed to the lack of variance on the Storage Unit
score. This idea is supported by the finding that increas
ing years of experience did not contribute significantly
to the score, but increasing age was positively correlated
with the score. Therefore, the Storage Unit probably does
not need revision. The Equipment and Layout Unit should be
reevaluated since the cause of the low reliability coefficient
86
87
is not evident. The total test was valid at the .001 sig
nificance level. Six units were a valid test of the know
ledge gained in a foodservice systems management course.
The lack of validity for the completion of a Menu Planning
and Service Unit and the Personnel Management Unit could
result from ineffective instruction or test items of poor
quality.
Secondly, the effect of increasing years of experi
ence and increasing age on the test scores was analyzed.
Experience was positively correlated with the Sanitation
Unit score when entered in a simple correlation equation
and when entered in a multiple regression equation. Experi
ence was negatively correlated with the Personnel Manage
ment Score when entered in a simple correlation equation
and when entered in a multiple regression equation. Age
had a positive correlation with the Storage Unit score and
the Food Preparation Unit score when entered in a multiple
regression equation. However, increasing age was negatively
correlated with the Food Preparation Unit score when no
other variables were entered into the equation. Students
with experience entering foodservice systems management
courses may perform well on the Sanitation Unit and poorly
on the Personnel Management Unit both before and after
instruction. Students with increasing age may score high
on the Storage Unit before and after instruction. However,
88
students with increasing age may score low on the Food
Preparation Unit before instruction and have significantly
higher scores after instruction. Personal characteristics
that were not evaluated by this research may account for
large differences in scores. Characteristics that need to
be evaluated further are motivation, intellectual ability,
specific job experiences and other factors.
The third objective was to determine if a "common
knowledge base" exists at the termination of the units in
introductory foodservice systems management. The research
indicates that there is no "common knowledge base" currently
being taught. However, this could be discerned more
accurately by evaluating all students at the completion of
a foodservice systems management course instead of at vary
ing stages of instruction. On all units, except Menu Plan
ning and Service and Personnel Management, the students who
had completed instruction scored significantly higher than
students who had not been instructed on the unit. Evalu
ation of the results of the multiple regression program
provides the following insights into the knowledge required
at the completion of the units in foodservice systems manage
ment.
1. The completion of a course or unit does not insure that the student is competent in that area.
89
2. The completion of a foodservice systems management course or several courses results in more proficiency than the completion of a unit.
3. Complex relationships exist between the content of the courses and the units in the area of food-service systems management.
In conclusion, following further revision of the
domain-referenced test to improve the validity and the reli
ability of all the units, the recommendations below are
suggested:
1. Since age and experience had a significant effect
on performance on the domain-referenced test and
other factors which were not considered in this
research could also influence test scores, pro
grams of study for introductory foodservice sys
tems management should be individualized. In an
individualized program, a revision of this domain-
referenced test would be useful as a diagnostic
tool for students entering the program. A student
with a strong performance on one of the units
might be given further tests or other measures of
knowledge in that area and be allowed to cover new
material on the same subject or advanced to
another subject. If the score on a unit indicated
a weakness in an area in which a high level of
competency was required before advancement or
instruction, the student could be redirected.
90
2. Since no "common knowledge base" was found for
various foodservice systems management programs
of study, a revision of this domain-referenced
test would not be directly applicable to a speci
fic course. However, the test could be used as
a rough guideline of knowledge gained in courses
at community colleges and universities.
3. If each program, institution, and instructor has
different objectives, the development of domain-
referenced tests measuring those objectives is
recommended to assure that the goals are being
achieved.
4. Domain-referenced testing is recommended to aid
organizations for professional and supportive
personnel in foodservice systems management
careers in establishing acceptable performance
standards for each step of the career ladder.

REFERENCES
(1) Hively, W.: Introduction to,domain-referenced testing. Educ. Tech. IV: 5, 1974.
(2) Glaser, R, , and Nitko, A. J.: Measurement in learning and instruction. In Thorndike, R. L., ed.: Educational Measurement. Washington,D.C.: American Council on Education, 1971.
(3) Hambleton, R. K.: A Review of Testing and Decision-Making Procedures for Selecting Individualized Instructional Programs. Washington, D.C: Office of Education, Department of Health, Education, and Welfare, 1972.
(4) Johnson, T. J.: Program and product evaluation from a domain-referenced viewpoint. Educ. Tech. IV: 43, 1974.
(5) Lord, F. M., and Novick, M. R.: Statistical Theories of Mental Test Scores. Reading, Mass.: Addison-Wesley Publishing Company, 1968.
(6) Baker, E. L.: Beyond objectives: domain-referenced tests for evaluation and instructional improvement. Educ. Tech. IV: 10, 1974.
(7) Besel, R. : Using group performance to interpret individual responses to criterion-referenced tests. Los Alamitos, Calif.: Southwest Regional Laboratory for Educational Research and Development, Annual Meeting of the American Educational Research Association, 1973. (ERIC ED 076 658).
(8) Freytes, F.: The development of a criterion-referenced test of mathmatics. Iii Cooper, M. P., ed. : Special Report on Criterion Referenced Test Development Mid-Atlantic Region Interstate Project 1972-73. Charleston, W. Va.: West Virginia State Department of Education, 1973. (ERIC ED 078 046).
(9) Haladyna, T. M.: An investigation of full and sub-scale reliabilities of criterion-referenced tests. Chicago, 111.: Annual Meeting of the American Educational Research Association, 1974. (ERIC ED 091 435).
91

92
(10) Pikulski, J. C : Criterion-referenced measures for clinical evaluations. Silver Springs, Md. Annual Meeting of the College Reading Association, 1973. (ERIC ED 085 660)
(11) Klein, S.: Evaluation tests in terms of the information they provide. UCLA Evaluation Comment 2:2, 1970.
(12) Kriewall, T. E.: Aspects and applications of criterion-referenced tests. Downers Grove, 111: Institute for Educational Research, (ERIC ED 063 333)
(13) Nitko, A. J., and Hsu, T.: Using domain-referenced tests for student placement, diagnosis and attainment in a system of adaptive, individualized instruction. Educ. Tech. IV: 48, 1974.
(14) Roudabush, G. E.: Item selection for criterion-referenced tests. New Orleans, La.: Annual Meeting of the American Educational Research Association, 1973. (ERIC ED 074 147).
(15) Sapone, C. V.: An administrative view. Chicago, 111.: Annual Meeting of the American Educational Research Assocation, 1972.
(16) Sension, D. B., and Rabehi, G.: Test item domains and instructional accountability. Educ. Tech. IV: 22, 1974.
(17) Wall, J. E. : Validation of curriculum in vocational-technical education. Ft. Collins, Colo.: Institute for Curriculum Personnel Development, 1972. (ERIC ED 070 866).
(18) Smith, C. W.: Criterion-referenced assessment. the Hague, the Netherlands: International Symposium on Educational Testing, 1973.
(19) Knipe, W. H., and Krahmer, E. F.: An application of criterion referenced testing. New Orleans, La. Annual Meeting of the American Educational Research Association, 1973.
(20) Popham, W. J.: Teacher evaluation and domain-referenced measurement. Educ. Tech. IV: 35, 1974.
93
(21) Dumke, G. S.: A new approach to higher education . . . for the California State Colleges. Los Angeles, Calif.: 1971. (ERIC ED 956-643).
(22) Clemen, S. J.: A model for educating supportive personnel: The dietetic technician. J. Am. Dietet. A. 64:401, 1974.
(23) Yakel, R. M. , Arkwright, M. S., Collins, M. E. and Sharp, J. J.: Titles, definitions, and responsibilities for the profession of dietetics—1974. Report of the committee to develop a glossary on terminology for the association and profession, J. Am. Dietet. A. 64:661, 1974.
(24) Bloom, B. S., ed.: Taxonomy of Educational Objectives, The Classification of Educational Goals. Longmans, Green, and Co., 1956.
(25) Nitko, A. J.: A model for criterion-referenced tests based on use. N.Y.: Pitsburgh University Learning Research and Development Center, Annual Meeting of the American Educational Research Association, 1971.
(26) Cooper, M. P.: Criterion-referenced test development—a contractual agreement between the public schools of the District of Columbia and a commerical test publisher. In Cooper, M. P., et.: Special Report on Criterion Referenced Test Development Mid-Atlantic Region Interstate Project 1972-73. Charleston, W. Va.: West Virginia State Department of Education, 1973. (ERIC ED 078 046).
(27) Millman, J.: Passing scores and test lengths for domain-referenced measures. R. Educ. Res. 43:205, 1973.
(28) Proger, B. B., and Mann, L.: Criterion-referenced measurement: the world of gray versus black and white. J. Learn. Dis. 6:19, 1973.
(29) Gronlund, M. E.: Constructing Achievement Tests. Englewood Cliffs, N. J.: Prentice-Hall, Inc., 1968.
(30) Miller, D. M. : Interpreting Test Scores. N.Y.: John Wiley and Sons, 1972.

94
(31) Shannon, D.: Criterion-referenced testing and the adaption of norm-referenced test items as a criterion reference measure. In Cooper, M. P., ed.: Special Report on Criterion Referenced Test Development Mid-Atlantic Region Interstate Project 1972-73. Charleston, W. Va.: West Virginia State Department of Education, 1973. (ERIC ED 078 046).
(32) Ivens, S. H.: A pragmatic approach to criterion-referenced measures. Joint Session of the Annual Meetings of the American Educational Research Association and the National Council on Measurement in Education, 1972. (ERIC ED 064 406).
(33) Gronulund, N. E., Measurement and Evaluation in Teaching. N.Y.: The Macmillan Company, 1971.
(34) Lindvall, C. M., and Cox, R.: The role of evaluation in programs for individualized instruction. In National Society for the Study of Education, Educational Evaluation: New Roles, New Means, Sixth-Eighth Yearbook, Part II, 1969.
(35) Hsu, T. C , and Carlson, M. : Oakleaf School-Project: computer-assisted achievement testing. (A Research Proposal.) Pittsburgh: University of Pittsburgh, Learning Research and Development Center, 1972.
(36) Chausow, H. M.: Evaluation of critical thinking in the social studies. National Council Social Studies Yearbook 35:77, 1965.
(37) Remmers, H. H. and Gage, N. L.: Educational Measurement anci Evaluation. Rev. Ed. N.Y. : Harper and Brothers, 1955.
(38) Ebel, R. L.: Expected reliability as a function of choices per item. Ed. Psy. Mea. 29:565, 1969.
(39) Wesman, A.G: Writing the test item. Chapter 4 In R. L. Thorndike (ed), Educational Measurement. Washington, D.C.: American Council on Education, 1971.
(40) Olsen, H. D., and Barickowski, R. S.: Test item arrangement and adaption level. Chicago, 111.: Annual Meeting American Educational Research, 1974. (ERIC ED 090 462).
95
(41) Pyrczak, F.: Validity of the discrimination index as a measure of item quality. J. Educ. 10:227, 1973.
(42) Miller, D. M.: Content, item, decisions: Orienting curriculum-assessment surveys to curriculum management IV: 29, 1974.
(43) Young, J. I.: Model for competency based evaluation. 1972. (ERIC ED 968 501).
(44) Woodson, M.I.C.E: Classical test theory and criterion-referenced scales. 1974. (ERIC ED 083 298).
(45) Shoemaker, D. M. : Criterion-referenced measurement revisited. Educ. Tech. I; 3, 1971.
(46) Woodson, M.I.C.E.: The issue of item and test variance for criterion-referenced tests. J. Educ. 11:63, 1974.
(47) Stodola, 0., and Stordahl, K.: Basic Educational tests and measurement. Chicago, 111.: Science Research Associates, Inc., 1967.
(48) Harris, M. L., and Harris, C. W.: Item analyses and reliabilities for reference tests for cognitive abilities: Fifth grade boys and girls. Madison, Wis.: Wisconsin University, Madison Research and Development Center for Cognitive Learning. (ERIC ED 070 020).
(49) Harris, M. L., and Harris, C. W.: Three systems of classifying cognitive abilities on bases for reference tests. Madison, Wis.: Wisconsin University, Madison Research and Development Center for Cognitive Learning.
(50) Harris, C. W.: An index of efficiency of fixed length mastery tests. Chicago, 111.: Annual Meeting of the American Educational Research Association, 1972. (ERIC ED 064 349).
(51) Livingston, S. A.: The reliability of criterion-referenced measures. Baltimore: Center for the Study of Social Organization of Schools, the John Hopkins University, 1970.
(52) Passmore, D. L.: Objective measurement in occupational education. 1972. (ERIC ED 069 691).

96
(53) Rim, E., and Bresler, S.: Livingston's reliability coefficient and Harris' index of efficiency: An empirical study of the two reliability coefficients for criterion-referenced tests. Chicago, 111.: Joint Session of the American Educational Research Association and the National Council on Measurement in Education, 1974.
(54) Ccprnett, J. E., and Bechner, W. : Introductory Statistics for the Behavioral Sciences. Columbus, Ohio: Charles E. Merrill Publishing Co., 1975.
(55) Shavelson, R. , Block, Jr., and Ravitch, M.: Criterion-referenced testing: comments on reliability. Educ. 9:133, 1972.
(56) Diederich, P. : Short-Cut Statistics for Teacher-Made Tests, Evaluation and Advisory Service Series, No. 5. Princeton, N.J.: Educational Testing Service, 1964.
(57) Alexander, W. A. : College-Level Examination Program In Wesman, A. G. (ed.). Seventh Mental Measurements Yearbook. Highland Park, N.J.: The Gryphon Press, 1972.
(58) Bloom, B. S.: College-level examination program. In Wesman, A. G., ed.: Seventh Mental Measurements Yearbook. Highland Park, N.J.: The Gryphon Press, 1972.
(59) Petre, R. M.: The development of criterion-referenced tests in reading. In_ Cooper, M. P., ed. : Special Report on Criterion-Referenced Test Development Mid-Atlantic Region Interstate Project, 1972-1973. Charleston, W.Va.: West Virginia State Department of Education, 1973. (ERIC ED 078 046).
(60) Block, J. H.: Student evaluation: toward the setting of mastery performance standards. Chicago, 111.: Annual Meeting of the American Education Research Association, 1972.
(61) Blumenfield, G. J., Bostow, D. and Waugh, R. Effect of criterion-referenced testing upon the use of remedial exam opportunities. N.Y.: Annual Meeting of the American Education Research Association, 1971.
97
(62) Rahmlow, J. F.: Implementing a mixed program of criterion and non-criterion referenced measurement. Chicago, 111.: Annual Meeting of the American Educational Research Association, 1972.
(63) Hentshke, G. C., and Levine, D. M.: Planning for evaluation in performance contracting experiments: The connection to domain-referenced testing theory. Educ. Tech. IV: 38, 1974.
(64) Dillavou, G. J.: Credentialing life experiences through credit by examination—the great challenge to higher education. In Altman, R. A., ed.: Credit by Examination. Proceedings from the Workshops in the West. Boulder, Colo.: 1971.(ERIC ED 061 897).
(65) Dowling, K. J.: Industry and credit by examination. In Altman, R. A., ed.: Credit by Examination. Proceedings from the Workshops in the West. Boulder, Colo.: 1971. (ERIC ED 061 897).
(66) Young Men's Christian Association.: Credit for life and work experience. Career Options Research and Development Report. Chicago, 111., 1971. (ERIC ED 057 744).
(67) Popham, W. J.: Alternate teacher assessment strategies 1973. (ERIC ED 087 757).
(68) Miller, J. B. , and Spears, M. C : Mastery learning and group study in a dietetics curriculum. J. Am. Dietet. A. 65:151, 1974.
(69) Nie, N. H., and Hull, C. H.: SPSS Statistical Package for the Social Sciences: Update Manual. University of Chicago. Chicago, 111.: National Opinion Research Center, 1973.
APPENDIX
A. Textbooks for Basis of Test Content
B. Student Information Form
C. Behavioral Objectives for Test Units
D. Behavioral Objective Code and Learning Outcomes for each Test Item
E. Domain-referenced Test for Foodservice Systems Management
98

APPENDIX A: TEXTBOOKS FOR BASIS OF TEST CONTENT
1. Gregg, J. B.: Cooking for Food Managers, Laboratory Text. Dubuque, Iowa: Wm. C. Brown Company Publishers, 1967.
2. Kotschevar, L. H.: Standards, Principles, and Techniques in Quantity Food Production. Boston, Massachusetts: Cahners Books, Division of Cahners Publishing Company, 1974.
3. Kotschevar, L. H., and McWilliams, M.: Understanding Food. New York, New York: John Wiley and Sons, Inc., 1969.
4. Lundberg, D. E., and Armatas, J. B.: The Management of People in Hotels, Restaurants, and Clubs. Dubuque, Iowa: Wm. C. Brown Company Publishers, 19 74.
5. Morgan, W. J.: Supervision and Management of Quantity Food Preparation and Teacher's Guide for Supervision and Management of Quantity Food Preparation.
6. Peckham, G. C.: Foundations of Food Preparation. New York, New York: Macmillan Publishing Company, Inc., 1974.
7. Practical Cookery: A compilation of Principles of Cookery and Recipes. Department of Food and Nutrition, College of Home Economics, Kansas State University. New York, New York: John Wiley and Sons, Inc., 1966.
8. Smith, E. E., and Crusius, V. C.: A Handbook on Quantity Food Management. Minneapolis, Minnesota: Burgess Publishing Company, 197 0.
9. Stokes, J. W.: Food Service in Industry and Institutions. Dubuque, Iowa: Wm. C. Brown Company Publishers, 1973.
10. West, B. B., Wood, L., and Harger, V. F.: Food Service in Institutions. New York, New York: John Wiley and Sons, Inc., 1966.
99

APPENDIX B: STUDENT INFORMATION FORM
Please fill in the following information:
SOCIAL SECURITY NUMBER
AGE
MONTHS OR YEARS OF FOOD SERVICE WORK EXPERIENCE
PROGRAM OF STUDY: (Check one)
food service or school lunch supervisor
dietetic assistant
^hospitality or hotel & restaurant manager or dietetic technician
four year degree
other
COURSES ACCORDING TO DESCRIPTIVE TITLE COMPLETED IN A COMMUNITY COLLEGE OR UNIVERSITY. Example: Quantity Food Preparation
UNITS OR MODULES TAUGHT IN PREVIOUS COMMUNITY COLLEGE
OR UNIVERSITY CLASSES
(Check those which you have completed)
_Meal Planning & Service Equipment & Layout
_Purchasing Cost Control
Storage Sanitation
Food Preparation ^Personnel Management
100

APPENDIX C: BEHAVIORAL OBJECTIVES FOR TEST UNITS
1. Menu Planning and Service Unit
A. Identifies the procedures for menu writing
B. Identifies the types of menus and the situations where each type of menu would be used
C. Writes menus considering the following factors:
a. clientele b. seasons c. special occasions d. food availability e. food combinations f. staffing considerations g. equipment h. cost and profit i. nutrition j. type of foodservice operation
D. Explains the effect of the format, wording, and specials used on printed menus
E. Describes different types of service and correct service procedures used for each type
F. Suggests ways of merchandising the menu
2. Purchasing Unit
A. Identifies the actions contributing to good relations between purchaser and vendor
B. Writes the purpose of food specifications
C. Defines the methods of buying and identifies their uses
D. Identifies the purpose of cutting tests
E. Uses yield tables to determine the amount of fresh fruits and vegetables to purchase for a specific number of servings
F. Identifies federal standards and grades
G. Describes the effect of the purchased food on the final product quality
H. Selects the purchase form according to purpose
101

102
3. Storage, Receiving, and Inspection Unit
A. Identifies proper storage facilities, temperatures, and procedures
B. Delegates responsibility for receiving to the appropriate person
C. Identifies the procedures for the following:
a. weighing deliveries b. recording deliveries c. inspecting deliveries d. marking merchandise e. returning merchandise
4. Food Preparation Unit
A. Defines terminology used in food preparation
B. Defines the different cooking methods
C. Identifies pre-preparation and preparation techniques which best preserve nutritive value, flavor, color and texture in the following:
a. fruit b. vegetables c. salads d. salad dressing e. egg f. cheese g. milk products h. meats i. stocks, soups, sauces, gravies j. bakery products k. desserts 1. frozen desserts m. prepared mixes n, sugar cookery o. fats and oils
D. Identifies characteristics of a standard product
E. Writes principles of recipe standardization
F. Evaluates recipes for correct wording, form, and information
G. Selects the best cooking method for foods
H. Explains the importance of preparation techniques in preventing waste, spoilage, and error
I. Write the motions which simplify food preparation
J. Identifies the preparation techniques necessary to merchandise food

103
5. Equipment and Layout Unit
A. Identifies equipment and tools used in quantity food production
B. Explains the operation of equipment and tools
C. Discusses the role of equipment in work simplification
D. States the safety precautions for equipment and tools
E. Illustrates the importance of general maintenance
F. Identifies the arrangements of equipment on a kitchen layout and the purpose of their location
6. Cost Unit
A. Defines terms used in cost control
B. Computes the following:
a. food cost b. food cost percentage c. net profit d. labor cost e. operating expenses f. menu prices g. price per serving h. break-even point i. food used during a given time period j. cost per unit
C. Identifies factors influencing the following:
a. food cost b. operating expenses c. labor cost d. profits
7. Sanitation and Safety Unit
A. Recognizes reasons for sanitation and safety in a foodservice
B. Identifies the types of bacteria which may cause food poisoning
C. Identifies the environment which encourages growth of bacteria
D. Identifies the food products v;hich are commonly infected by different types of bacteria
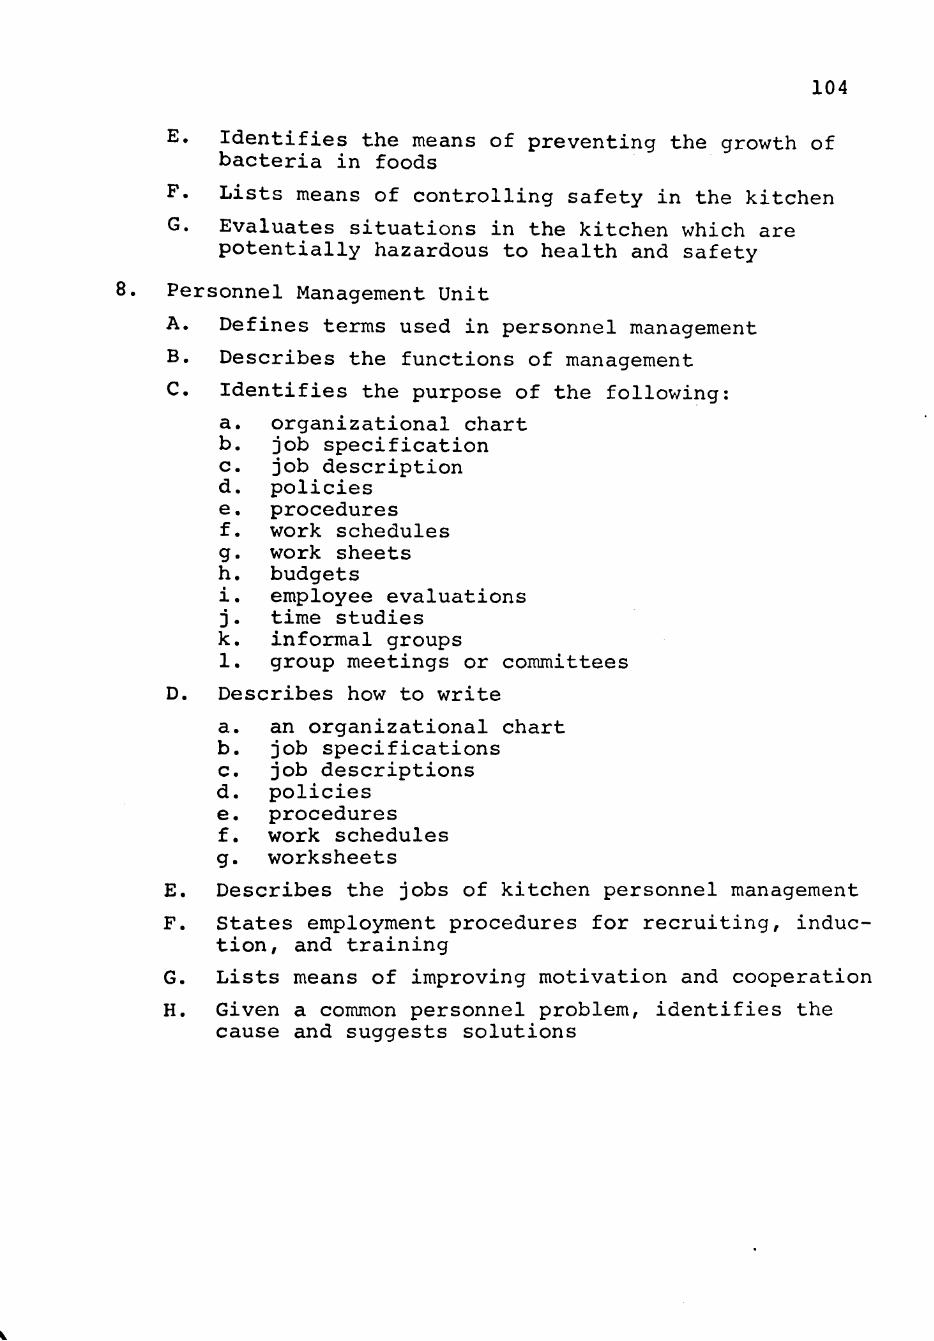
104
E. Identifies the means of preventing the growth of bacteria in foods
F. Lists means of controlling safety in the kitchen
G. Evaluates situations in the kitchen which are potentially hazardous to health and safety
8. Personnel Management Unit
A. Defines terms used in personnel management
B. Describes the functions of management
C. Identifies the purpose of the following:
a. organizational chart b. job specification c. job description d. policies e. procedures f. work schedules g. work sheets h. budgets i. employee evaluations j. time studies k, informal groups 1. group meetings or committees
D. Describes how to write
a. an organizational chart b. job specifications c. job descriptions d. policies e. procedures f. work schedules g. worksheets
E. Describes the jobs of kitchen personnel management
F. States employment procedures for recruiting, induction, and training
G. Lists means of improving motivation and cooperation
H. Given a common personnel problem, identifies the cause and suggests solutions
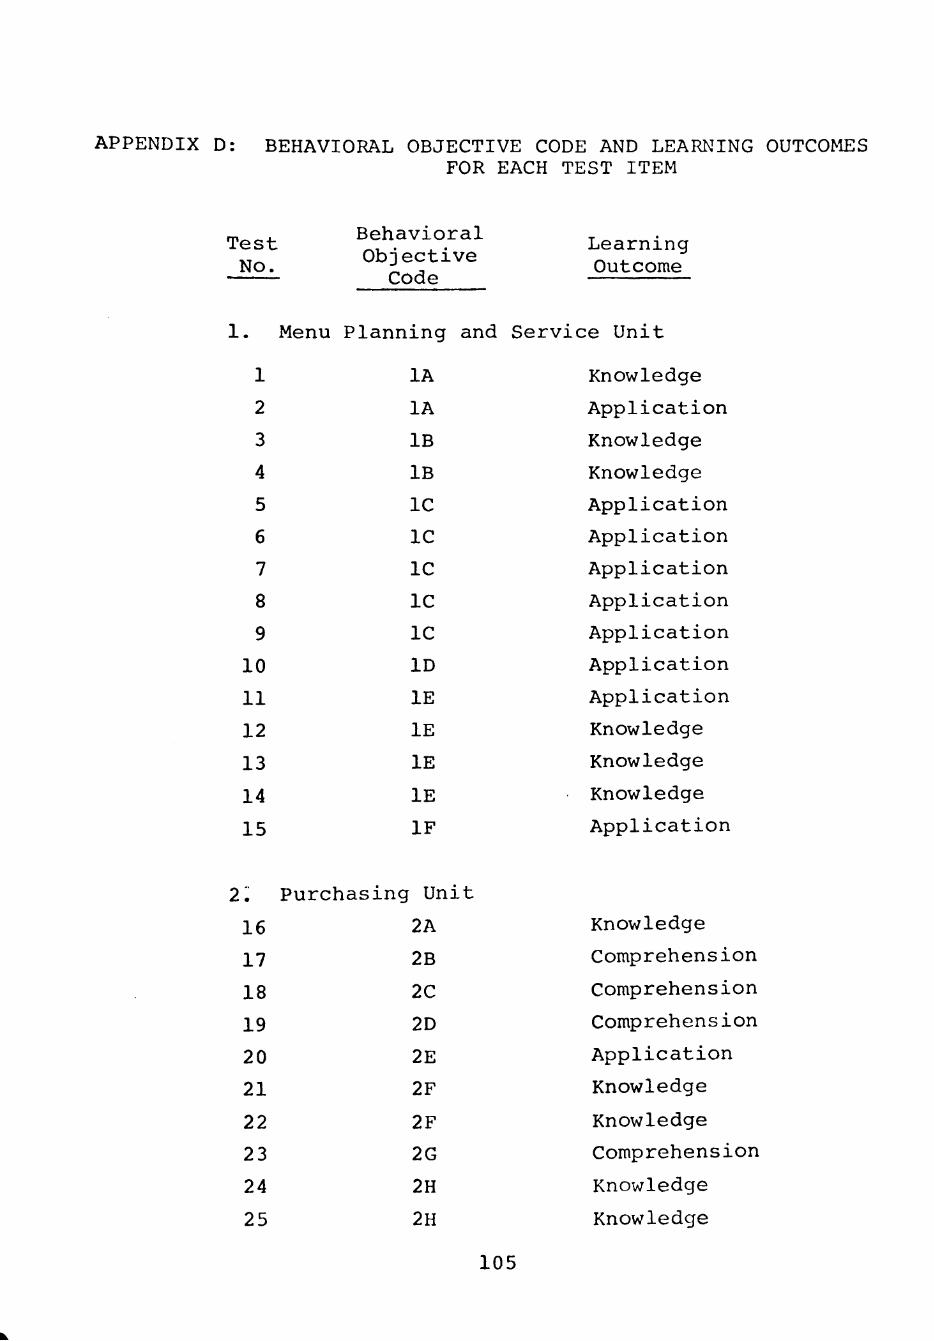
APPENDIX D: BEHAVIORAL OBJECTIVE CODE AND LEARNING OUTCOMES FOR EACH TEST ITEM
m . Behavioral , Test , . , . Learning Obnective ^ No. i J Outcome code
1. Menu Planning and Service Unit
1
2
3
4
5
6
7
8
9
10
11
12
13
14
15
2:
16
17
18
19
20
21
22
23
24
25
lA
lA
IB
IB
IC
IC
IC
IC
IC
ID
IE
IE
IE
IE
IF
Purchasing Unit
2A
2B
2C
2D
2E
2F
2F
2G
2H
2H
Knowledge
Application
Knowledge
Knowledge
Application
Application
Application
Application
Application
Application
Application
Knowledge
Knowledge
Knowledge
Application
Knowledge
Comprehension
Comprehension
Comprehens ion
Application
Knowledge
Knowledge
Comprehension
Knowledge
Knowledge
105
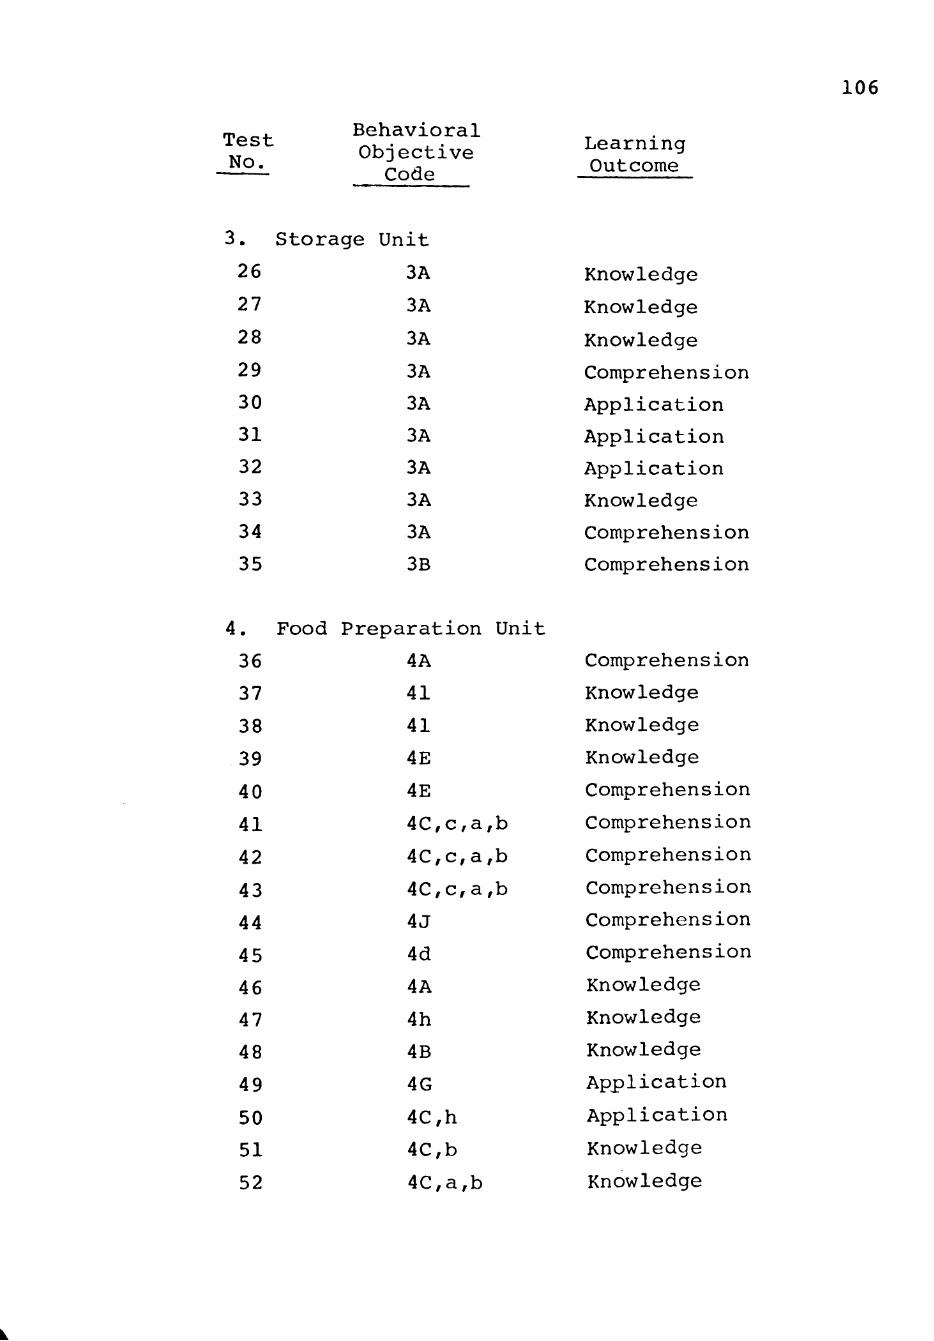
106
Test No.
3.
26
27
28
29
30
31
32
33
34
35
4.
36
37
38
39
40
41
42
43
44
45
46
47
48
49
50
51
52
Behavioral Objective
Code
Storage Unit
3A
3A
3A
3A
3A
3A
3A
3A
3A
3B
Food Preparat
4A
41
41
4E
4E
4C,
4C,
4C,
4J
4d
4A
4h
4B
4G
4C,
4C,
4C,
ion
c,a,
c,a,
c,a,
h
b
a,b
Unit
rb
rb
rb
Learning Outcome
Knowledge
Knowledge
Knowledge
Comprehension
Application
Application
Application
Knowledge
Comprehension
Comprehens ion
Comprehension
Knowledge
Knowledge
Knowledge
Comprehension
Comprehension
Comprehension
Comprehension
Comprehens ion
Comprehension
Knowledge
Knowledge
Knowledge
Application
Application
Knowledge
Knowledge

107
Behavioral Objective
Code
4C,b
4C,b
4C,b
4C,e,j,k
4C,e,j,k
4C,e,j,k,n
4C,j,k
4C,j
4C,j
4C,j
4FC,j
4C,j
4C,j
Learning Outcome
Application
Application
Application
Application
Application
Application
Application
Knowledge
Comprehension
Application
Application
Application
Application
Test No.
53
54
55
56
57
58
59
60
61
62
63
64
65
5. Equipment and Layout Unit
66 5A Knowledge
67 5A Comprehension
68 5B Knowledge
69 5F Application
70 5F Application
71 5F Application
72 5F Application
73 5F Application
74 5F Application
• 75 5F Application
6. Cost Unit
76 ^ 6A,a Application
77 6A,b Comprehension
78 6A,b Application
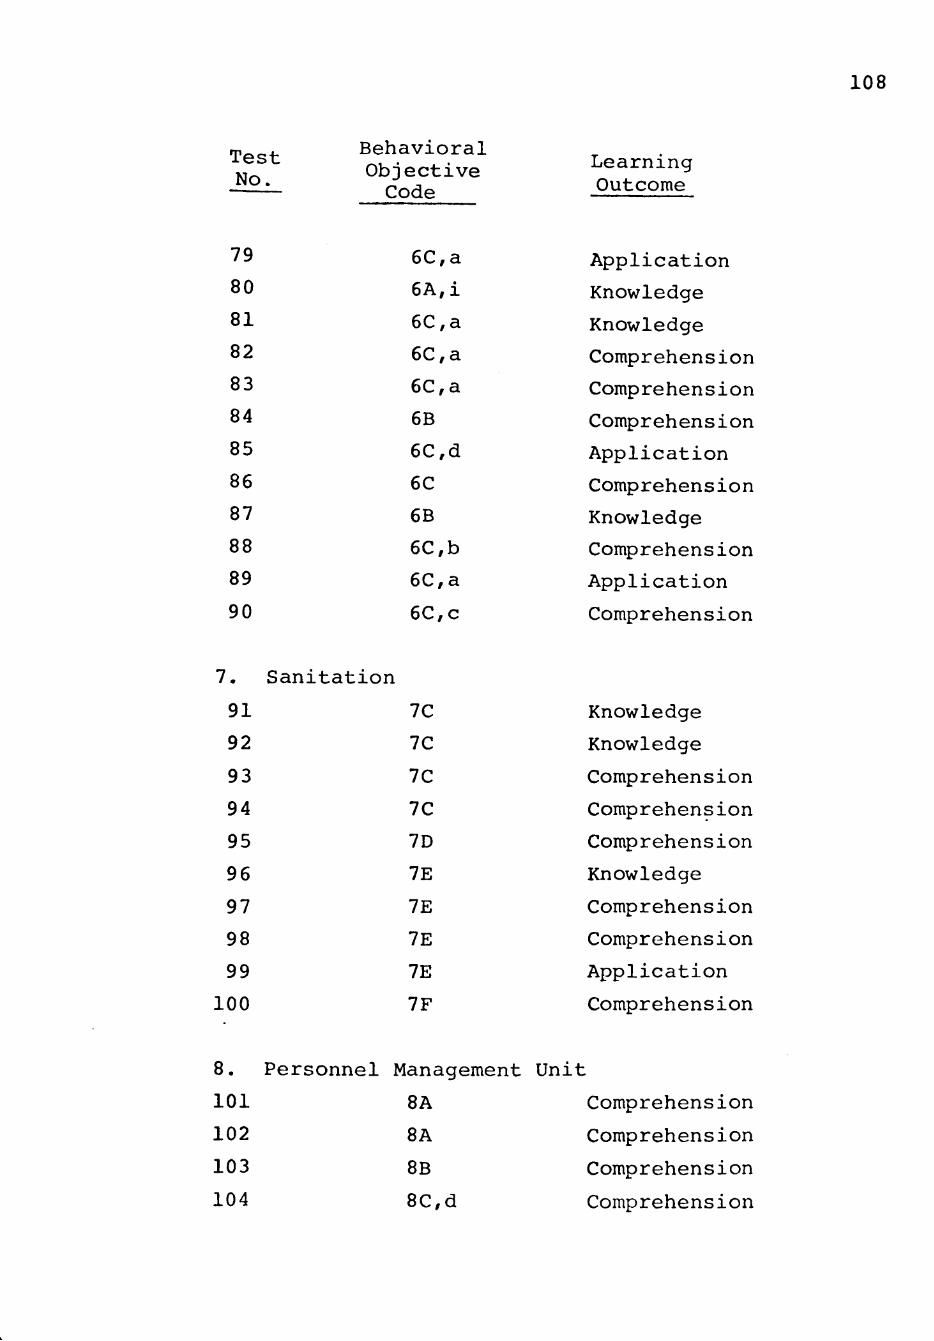
108
Test No.
79
80
81
82
83
84
85
86
87
88
89
90
7. Sanitat
91
92
93
94
95
96
97
98
99
100
Behavioral Objective Code
6C,a
6A,i
6C,a
6C,a
6C,a
6B
6C,d
6C
6B
6C,b
6C,a
6C,c
ion
7C
7C
7C
7C
7D
7E
7E
7E
7E
7F
Learning Outcome
Application
Knowledge
Knowledge
Comprehension
Comprehension
Comprehension
Application
Comprehension
Knowledge
Comprehension
Application
Comprehension
Knowledge
Knowledge
Comprehension
Comprehension
Comprehension
Knowledge
Comprehension
Comprehension
Application
Comprehension
8. Personnel Management Unit
101
102
103
104
8A
8A
8B
8C,d
Comprehens ion
Comprehension
Comprehension
Comprehension

Test No.
105
106
107
108
109
110
Behavioral Objective Code
8C,a
8C,j
8C,1
8D,f
8F
8H
109
Learning Outcome
Comprehension
Comprehension
Comprehension
Comprehension
Comprehension
Comprehension
APPENDIX E: A DOMAIN-REFERENCE TEST FOR FOODSERVICE SYSTEMS MANAGEMENT
GENERAL INSTRUCTIONS
This is a test of your knowledge of quantity food production. The questions reflect the concepts in many introductory food preparation and food production texts. Your score will help show the competencies which you have attained through your present experience and education.
Turn the red and white computer sheet with the blanks for social security number facing you. Fill in your social security numbers and mark a line through the corresponding numbers under each one. Leave all other spaces blank.
Each question in this test lists four possible answers. You are to select the ONE best answer for each question. You are to mark your answers on the separate answer sheet, NOT in the test booklet. Use a No. 2 lead pencil to mark your answers.
Your score on this test will be the total number of questions to which you give the best answer. It is important to do each of the following things:
1. Read each question carefully.
2. Select that ONE of the choices which BEST answers the question.
3. Indicate that answer by making a solid black mark in the proper space on the answer sheet. If you blacken more than one space for a question, you will receive no credit for that question.
4. The answer (E) should not be marked on any question, but should be left blank.
5. Use a No. 2 lead pencil.
6. Erase thoroughly all stray pencil marks on your answer sheet.
7. Work in a systematic manner, and do not spend too much time on any one question.
110

Ill
SITUATION FOR THE TEST
On the following page is the layout of a factory
kitchen. This kitchen serves an executive dining room and
an employee cafeteria. Answer all questions which refer to
the cafeteria, dining room, or kitchen layout as if you
were the manager. This is a factory cafeteria which serves
about 500 employees for lunch and about 500 employees for
dinner five days a week. The cafeteria limits the number
of selections, but has a short order area. While the
cafeteria provides low cost meals, the dining room is a
luxury restaurant for executives, their clients, and their
friends.
113
1. The first procedure in planning the menu is to determine the
A. entree. B. appetizers and soups. C. vegetables. D. desserts.
2. When writing menus for the dining room and cafeterias, the action which would not be correct would be to
A. write menus three to four days in advance. B. check previous sales. C. review interval between service of the items. D. use menu charts.
3. The cycle menu could be defined as a A. selective menu. B. list of menu items used to plan menus. C. rotation of high, moderate, and low cost menu
items. D. menu plan written for a definite period and
repeated.
4. A table d'hote menu is described as one in which A. the items are priced individually. B. there is a complete meal at a set price. C. the price of the entree determines the price of
the meal. D. vegetables and desserts are selected.
5. In the cafeteria the cycle menus are made seasonally because of the
A. requests of patrons. B. fluctuations in labor. C. cost of available foods. D. convenience of the manager.
6. The choice of menu items is limited in the cafeteria in order to
A. save food and labor costs. B. reduce food inventories. C. simplify menu writing. D. speed customer service.
7. One of the special dinners in the cafeteria Monday will feature Braised Beef tips over Egg Noodles. A good choice for a second entree would be
A. Chicken Spaghetti. B. Enchiladas. C. Fried Pork Chops. C. Creamed Ham.

114
8. Given the following special menu in the dining room
Beef Consomme Baked Chicken Breasts in Herb Sauce Fluffy Brown Rice Buttered Green Peas
Hot Yeast Rolls Peppermint Gelatin Dessert
Choose the best salad to go with the above menu: A. Asparagus Salad. B. Bing Cherry Gelatin. C. Warm Wilted Lettuce. D. Apricot Pecan Salad.
9. The executives are having buffet meals during their factory inventory week. The meats will be Smoked Beef Brisket and Sliced Turkey. Three vegetables which would be attractive flavor and texture combinations would be
A. Creamed Corn, Cornbread Dressing, Harvard Beets B. Wild Rice, Whole Carrots with Chives, Blue
Cheese Zucchini Bake. C. German Potato Pancakes, Scalloped Cauliflower,
Lemon Buttered Broccoli. D. Green Beans with Mushrooms, Broiled Stuffed
Tomatoes, Bacon Bits and Yellow Squash.
10. A Fruit Cup was listed on the weekly menu in the dining room: This item would be a correct menu choice if
A. described accurately. B. allowed for cook's choice. C. defined by the waiter. D. composed of leftovers.
11. The style of service for employees in the kitchen layout is the
A. double line cafeteria. B. mobile foods system. C. scramble service. D. self-service buffet system.
12. Beverages should be served to the seated executive on their
A. right side with the right hand. B. left side with the left hand. C. right side with the left hand D. left side with the right hand.
115
13. The correct service for a seated dinner in the dining room would be to
A. remove used plates from the right side. B. use an underliner for dessert bowls. C. place the dessert fork outside the dinner
fork, D. Use one spoon for both iced tea and hot coffee.
14. When clearing tables following the conclusion of the meal, the first items to be removed should be the
A. serving dishes. B. plates. C. glasses D. silverware.
15. The least effective method of merchandising meat in the dining room for executives would be
A. served flaming. B. carved at the table. C. garnished with parsley. D. planked and garnished.
16. To establish good relations with a salesman, the purchasing agent should
A, buy food from friends. B. use many salesmen to keep them "on their toes." C. set up a buying schedule. D, be prepared for a salesman at any time.
17. The primary purpose of food specifications is to A, increase bid competition. B. standardize menus. C, set product standards. D. decrease food cost.
18. A primary reason for using sealed bid or formal bid buying is to
A. gain possible favoritism from a company. B. pay a lower price for purchased food. C. avoid future fluctuations in product price. D. insure the best quality food.
19. The primary purpose of a cutting test on a specific food is to
A. determine specifications. B. compare brands and grades. C. check for fraud. D. try new products.

116
20. To determine the amount of a fresh vegetable to purchase for a given number of servings, the purchasing agent would
A, check recipes. B, study plate waste. C, use yield tables. D, double raw food weight.
21. The USDA inspection stamp on meat guarantees A. tenderness of the meat. B. sanitation of the slaughter house. C. prime grade of meat. D. no food additives.
22. Quality grades for fruits and vegetables such as U.S. No. 1 Extra Fancy defined by the United States Department of Agriculture are used
A. under federal law enforced by the USDA B. voluntarily by growers, canners, and processors. C. under State Health Department requirements. D. by companies guilty of previous labeling fraud.
23. A fruit of lesser quality should A. never be purchased. B. purchased when sold at a lov/ price C. purchased for fruit salads. D. purchased for baking cobblers or pies.
24. The flour with the highest gluten content and strongest structural ability is
A, bread flour. B, cake flour. C, all purpose flour. D, self-rising flour.
25. The primary factor to consider when selecting a fat for frying potatoes is
A. melting point. B. flavor. C. smoking point. D. texture.
26. The freezer temperature range desirable for quantity food service is
A. 32° to 25° F. B. 25° to 0° F. C. 10° to 0° F. D. 0° to -10° F.

117
27, Refrigeration temperature range is A. 34° - 45° F. B. 34° - 38° F. C. 23° - 30° F, D. 45° - 55° F.
28, The best atmosphere for dry storage is A. dark and damp. B. dry with direct sunlight. C. dry and cool. D. dark and warm.
29, Ideally shelving in the storeroom should be A, against the wall, and 2-4" above the floor. B. against the wall and at least 10" above the
floor. C. a few inches from the wall and 2-4" above the
floor. D, a few inches from the wall and 10" above the
floor,
30, Removal of moisture and odors in a dry storage area can be achieved by good
A. ventilation. B. cooling systems. C. flourescent lighting. D. stock organization.
31, A storage room should have individual products, such as canned apricots or dried apricots, arranged
A. in alphabetical order. B. by food groups. C. by delivery date. D. by product form.
32, The primary reason for freezer burn on poultry is A. storing with vegetable packages in the freezer. B. packaging poorly for freezer storage. C. defrosting in warm water. D. cooking frozen meat without thawing.
33, A commercial bakery bread delivered for two days should be stored by
A. refrigerating upon delivery. B. freezing immediately. C. placing on racks at room temperature. D. putting in the bunwarmer.
118
34. When refrigerated, the cheese which retains quality the longest is
A, Cheddar cheese. B, blue cheese. C, creamed cheese. D, camembert,
35. The responsibility for inspecting and checking deliveries should be
A. delegated to one position. B. learned by all employees. C. left to the delivery man. D. unneeded if there is a purchase form.
36. The first step in food preparation for a cook should be
A. assembling food. \ B. reading the recipe.
C. arranging the equipment. D. checking the worksheet.
37. Choose the standard motion for work simplification: A. move arms together in the same direction. B, use quick straight motions to increase pro
ductivity for a long task. C. use both hands, starting and completing motions
at the same time. D, bend from the waist to lift heavy food and
equipment.
38. An example of an alimentary paste is A, rice. B. corn. C. cornstarch. D, macaroni.
39. The primary purpose of standardized recipes is to A. stimulate creativity. B. simplify ordering. C. aid in menu planning. D. control the quality of results.
40. The procedure for increasing a home cake recipe for quantity cookery is to
A. increase the flour for baking in larger pans. B. increase ingredients using the quantity conver
sion factor. C. try the recipe for the quantity needed first. D. prepare in increasingly larger amounts.

119
41. The most important factor in making an attractive and flavorful salad is
A. quality of salad ingredients. B. a large variety of fruits or vegetables. C. arrangement or design of ingredients. D. bite size pieces of fruits and vegetables.
42. The best procedure to prevent darkening of cut fresh fruits and vegetables is to
A. immerse in orange juice. B. cover with a sugar solution. C. immerse in water. D. sprinkle with an antioxidant.
43. When salad greens are to be washed and stored a short period before assembling salads, moisture on the leaves is
A. removed to prevent rotting of the leaves. B. desired to adhere with salad dressing. C. blotted to allow some moisture for crisping. D. allowed to evaporate by spredding the leaves on
towels.
44. When merchandising individual salads it is important that the salad should
A. be garnished attractively. B. cover the entire plate. C. be served in lettuce cups. D. have a definite design.
45. When making salad dressings in the kitchen, the salad dressing which is an unstable emulsion is
A. French dressing. B. mayonnaise. C. boiled or cooked dressing. D. sour cream dressing.
46. The development of flavor during aging of meat is known as
A. rigor mortis. B. marbling. C. ripening. D. finishing.
120
47. When cooking a beef roast, the oven temperature which will produce the best product with the least drip loss is
A. 225° F. B. 325° F. C. 365° F. D. 425° F.
48. Braising is a method of meat cookery described as A. covering with water and simmering. B. frying under steam pressure. C. browning then simmering in a small amount of
liquid. D. baking with dry heat after browning.
49. The method of meat cookery most suitable for cooking a beef brisket tender for slicing is
A. braising. B. boiling. C. roasting. D. stewing.
50. Tough, stringy poultry is commonly caused by A. buying a low grade of poultry. B. slicing while hot. C. overcooking at high temperature. D. choosing the wrong cooking method.
51. The fastest method of cooking vegetables is A. rapid boiling. B. slow boiling. C. pressure steaming. D. conventional baking.
52. The pigment which gives fruits and vegetables an orange or yellow color is
A. chlorophyll. B. carotenoids. C. flavinoids. D. anthocyanin.
53. The correct way to prevent drab olive-colored broccoli is to cook the broccoli a short time and
A. add a pinch of soda. B. add lemon juice after cooking tender. C. cover with a tightly fitting lid. D. uncover the first few minutes.

121
54. To prepare hot buttered green beans, the unheated, canned vegetable is drained and the liquid should be
A. measured before heating the beans. B. thrown out. C. reduced by boiling bef(Dre adding the vegetable. D. poured in the pot before the beans are added.
55. In the preparation of new potatoes, the correct procedure to retain vitamins and minerals is to
A. hold overnight in cold, salt water. B. cut into small pieces. C. refrigerate covered with a damp cloth. D. wash after peeling.
56. Sugar added to an egg white foam early in the beating process
A. makes a stable foam. B. decreases whipping time. C. increases volume. D. causes small dry clumps.
57. When preparing a chiffon pie with unflavored gelatin, the first step is to
A. mix the gelatin and sugar. B. soften the gelatin in cold water. C. dissolve the gelatin in hot water. D. add the gelatin to the cream sauce.
58. The cause of the "weeping" of liquid in an egg custard is
A. overcooking the egg proteins. B. adding excess sugar. C. underbeating the egg whites. D. using homogenized milk.
59. The common problem when baking a single crust pie is shrinkage of the pie shell caused by
A. adding too much flour. B. stretching the pie dough. C. over heating the oven. D. using water to shape the edge.
60. The dry ingredients and liquid ingredients are mixed together when making a standard biscuit. The dough is shaped into balls and then
A. kneaded till shiny. B. kneaded lightly. C. rolled and folded. D. baked quickly.
122
61. A quick bread differs from a basic dough. In proportion to flour, a quick bread has
A. more liquid. B. more baking powder. C. more sugar. D. more fat.
62. Muffins that are flat and smooth with peaked tops are usually caused by
A. an oven temperature too cool. B. overmixing the batter. C. overcooking the muffins. D. not enough baking powder.
63. Cake batters are beaten for a longer time than muffin batters primarily to
A. prevent tunnels and distribute fat. B. improve flavor and increase storage life. C. increase volume and produce finer texture. D. make a moist and tender crumb.
64. A heavy yeast bread is commonly caused by A. excess kneading and gluten formation. B. too little sugar in proportion to liquid. C. an insufficient rising period. D. incomplete baking at low temperatures.
65. V7hen the crumb of a white cake is tough, a probable cause is a recipe with too little
A. liquid. B. fat. C. flour. D. baking powder.
66. The best knife for cutting and chopping fruits and vegetables is the
A. paring knife. B. French knife. C. chef's knife. D. serrated long knife.
67. The primary use for microwaves in quantity cookery is A. cooking meat. B. preparing pastries. C. reheating Individual servings. D. baking potatoes.
123
68 The speed of the mixer is controlled by the A, gear control. B. on and off switch. C. beater selected. D, wall socket.
69. The meat and vegetable cooking units on the kitchen layout are arranged in a
A. parallel back to back arrangement. B. parallel face to face arrangement. C. straight line arrangement. D. ell-shaped arrangement.
70, If the preparation of turnip greens for the service was to be staggered in fifteen minute intervals, the most useful equipment on the kitchen layout would be the
A. 40 gal. steam kettles. B. deck steamer. C. deck ovens. D. range top.
71. The dotted square next to the work counter across from the deck ovens in the kitchen layout would most probably represent a mobile
A. plate dispenser. B. electric slicer.• C. vegetable peeler. D. 20 qt. mixer.
72, The equipment on the kitchen layout most useful for a short order service are the
A. griddle and fryer. B, broiler and deck ovens. C. steamers. D, hot food tables.
73. The first sink next to the disposal in the pot washing area of the layout would be used for
A. scraping pans. B. presoaking pots. C. washing cutlery. D. rinsing dishes.
74, The pass-through refrigerators between the cold food service table and the dessert and salad preparation would be used primarily for
A. storage for preparation of ingredients. B. display of selections to the customer. C. storage of finished desserts and salads. D. storage of leftover menu items.

124
75. On the kitchen layout, lettuce and fresh cucumbers should flow from receiving to
A. the storage area. B. the roll-in refrigerators. C. the salad preparation refrigerators. D. the vegetable preparation sinks.
76. If the executive dining room serves a small eight ounce ribeye steak at a raw food cost of $2.50 per pound, the food cost of one steak would be
A. $2.00. B. $1.25. C. $0.94. D. $2.50.
77. The food cost percentage of a menu item should be based on
A. unit cost of a standard portion. B. raw food cost. C. expected waste. D. mark-up factor.
78. If the food cost percentage is forty percent, the a la ze of the eight ounce ribeye steak would carte
be A. B. C. D.
menu pr
$1.75, $6.20. $3.12. $4.47,
79. The condition which would not cause the food cost percentage to increase is
A. poorly utilized leftovers. B. increased menu prices. C. occasional pilferage. D. undetected invoice shortages.
80. The inventory at the beginning of the month plus the amount of food purchased during the month, minus the inventory at the end of the month determines the month's
A. purchases. B. potential sales. C. food cost. D. quantity of food used.
125
81. The food group which represents the major percentage of total food cost in the cafeteria and dining room is
A. meat. B. fruits and vegetables. C. milk. D. breads and cereals.
82. Fresh fruits and vegetables are bought at their lowest price when they are
A. grown in hot houses. B. most plentiful in supply. C. at the beginning of their growing season. D. transported short distances.
83. The primary factor which determines the price of meat is A. enzymes added for tenderness. B. season of the year. C. part of the animal from which the cut was taken. D. nutritive value.
84. The break even point refers to the point at which there is
A, no profit or loss. B. no extra food left on hand. C, sales and fixed costs are equal. D. profit is greater than loss.
85. The employee cafeteria has had a low check average the last few months. In order to try to break even the
A. turnover rate should be increased. B. food quality should be decreased. C. labor cost should be decreased. D. decor should be improved,
86. The widest cost fluctuations in a food service are usually
A. labor costs. B. operating costs. C. food costs. D. paper costs.
87. When depreciation is included as a fixed expense, it usually refers to
A. china and silverware. B. food waste. C. large equipment. D. utilities.

126
88. When using the same kitchen and cooking personnel, the cafeteria service operation should have less budgeted cost than the dining room for
A. raw food cost. B, operating expenses. C, serving equipment D. labor cost percentage.
89. A large amount of cooked fresh green beans are left over from dinner in the cafeteria. The amount purchased is correct. The next analysis should be
A. item popularity. B. the portion size. C. plate waste. D. product flavor.
90. Labor costs can be reduced by A. maintaining authoritarian management and strict
rules. B, scheduling the same number of people at all
times. C, modernizing and rearranging equipment. D. allowing employees freedom to perform tasks their
own way.
91. The following is not necessary for most bacterial growth:
A. moisture. B. protein. C. carbohydrate. D. oxygen (aerobic conditions).
92. Improperly cooked or processed pork and pork products may transmit
A, viruses. B. Brucellosis. C. Trichinosis. D, Staphylococcus.
93. The equipment most likely to be a source of sanitation problems is the
A. bun warmer. B. electric slicer. C. mixing machine. D. steam kettle.

127
94. When not in use, the ice scoop is commonly stored in A. plastic wrap. B. the ice machine. C. weak chlorine water. D. sterilized water.
95. Workers who carelessly handle potato salad when they have a cold could possibly transmit
A. Botulism. B. Staphylococcus. C. Salmonella. D. Rope.
96. A dishwasher during the rinse cycle should maintain a temperature of at least
A. 120° F. B. 130° F. C. 180° F. D. 170° F.
97. The method of treating food for storage which is least effective in preventing microbial growth is
A. dehydration. B. brine solution. C. refrigeration. D. freezing.
98. The best procedure to prevent bacterial growth during storage of cooked food is to
A. store in deep pans in a good refrigerator. B. leave at room temperature. C. divide in shallow pans to aid cooling at 40° F. D. leave uncovered to let air circulate.
99. Frozen ground meat which is allowed to thaw but does not need to be used for a day or so should be
A. kept refrigerated. B. cooked and stored. C. refrozen. D. thrown out.
100. The action to avoid burns which would not be safe would be to
A. stir using longhandle spoons. B. open pot lids towards the back first. C. reach carefully for products at the back of ovens. D. use salt on small stove top grease fires.
128
101. An organizational structure in which each employee is directly responsible to the manager is a
A. functional type. B. line type. C. staff type. D. line-and-staff type.
102. Two employees were disagreeing about whose responsibility it was to clean the service trays each day. The answer could be found in the
A, job specifications, B, personnel policies, C, job description. D, daily food preparation sheets.
103. The following are examples of the directing and supervising function of management except
A. training employees. B. motivating employees. C. preparing a flow chart. D. writing work sheets.
104. Written personnel policies give employees A. job descriptions. B. guidelines for treatment. C. personnel procedures, D. memos to follow.
105. In a large kitchen the ideal work sheet provides for A. a worker to help in several kitchen units. B. jobs for each person to complete when he can. C. a worker to complete assigned tasks, in his unit D. teams of two or three for each unit's work.
106. A time study does not A. determine labor cost. B. improve procedure. C. indicate whether to make or buy a product. D. evaluate food quality.
107. One of the main reasons for employee committees within a large food service is to
A. reduce frustrations and pressures. B. make management decisions. C. analyze the budget. D. write personnel policies.

129
108. Important source materials for planning work schedules are
A. waste studies and food consumption sheets. B. time studies and recipes. C. flow chart and portion chart. D. cost and inventory sheets.
109. The question, "Tell me more about your experiences in your last job," is an example of a
A. patterned interview. B. non-directive interview. C. group interview. D. board interview.
110. The most common reason for employee resistance to job analysis is
A. fear of criticism. B. impractical results. C. time required for analysis. D. opinions which conflict with the analyzer's.

