doi:10.1016/j.foreco.2007.02.028 1 effects of diversity of ... · huston, 1997; chapin et al.,...
TRANSCRIPT
doi:10.1016/j.foreco.2007.02.028
1 2 3
4
5 6 7 8 9
10 11 12 13 14 15 16 17 18 19 20 21 22 23 24 25 26 27 28 29 30 31 32 33 34 35 36 37 38 39 40 41
42
Effects of Diversity of Tree Species and Size on Forest Basal Area Growth, Recruitment, and Mortality
Jingjing Liang School of Natural Resources and Agricultural Sciences University of Alaska Fairbanks P.O.Box 757200 Fairbanks 99775, USA Joseph Buongiorno* Department of Forest Ecology and Management University of Wisconsin-Madison, 1630 Linden Drive, Madison WI 53706, USA. Tel: +1-608-262-0091 Fax: +1-608-262-9922 E-mail: [email protected] Robert A. Monserud PNW Research Station USDA, Forest Service 620 SW Main St., Suite 400 Portland, OR 97205, USA Eric L. Kruger Department of Forest Ecology and Management University of Wisconsin-Madison, 1630 Linden Drive, Madison WI 53706, USA. Mo Zhou Department of Forest Ecology and Management University of Wisconsin-Madison, 1630 Linden Drive, Madison WI 53706, USA. *Corresponding author.
Forest Ecology and Management 243: 116-127 1

doi:10.1016/j.foreco.2007.02.028
1
2
3
4
5
6
7
8
9
10
11
12
13
14
15
16
17
18
19
20
21
22
23
24
ABSTRACT
The objective of this study was to determine the relationship, or lack thereof, between growth and
diversity of tree species and size in conifer stands of western North America. Growth was measured by
net basal area growth and its components: survivor growth, recruitment, and mortality. The analysis
used inventory data from permanent plots in the Douglas-fir/western hemlock forest type in Oregon
and Washington, and in the mixed-conifer forest type in California. The methods consisted of
generalized least square regression with spatial autocorrelation, controlling for the effect of other stand
characteristics. Other things being equal, in the two forest types under study there was a strong positive
relationship between net basal area growth and tree-species diversity. This effect was associated with
higher recruitment in stands of higher tree-species diversity. Neither mortality nor growth of survivors
was related to tree-species diversity. The relationship between growth and tree-size diversity was less
clear. For Douglas-fir/western hemlock, net basal area growth was negatively correlated with tree-size
diversity, essentially because recruitment was lower on plots of high tree-size diversity. For mixed
conifers, net basal area growth tended also to be lower in plots of high tree-size diversity, but this was
mostly because mortality was higher in plots of higher tree-size diversity.
Keywords: species diversity, size diversity, forest growth, recruitment, mortality, spatial
autocorrelation.
INTRODUCTION
Does plant diversity increase ecosystem productivity? This question has attracted wide attention, both
for theoretical and managerial reasons. Lately, positive correlations have been observed between
Forest Ecology and Management 243: 116-127 2

doi:10.1016/j.foreco.2007.02.028
1
2
3
4
5
6
7
8
9
10
11
12
13
14
15
16
17
18
19
20
21
22
23
24
vegetation productivity and species diversity in various terrestrial ecosystems, but the relationship may
be transient and it varies across species assemblages and spatial scales (Schulze and Mooney, 1993;
Huston, 1997; Chapin et al., 2000; Loreau et al., 2003).
Some grassland experiments suggest that diversity effects are neither transient nor explained
solely by a few productive species. Tilman, among others, has noted that even the best-chosen
monocultures cannot achieve greater productivity than higher-diversity sites (Tilman et al., 1996;
Hector, 1999; Tilman et al., 2001). However, it remains unclear whether these results hold true at the
landscape level, and across ecosystem types (Loreau et al., 2001; Cardinale et al., 2004).
In the case of forest ecosystems, there are still few studies of the relationship between forest
productivity and tree diversity, due in part to the complexity and long life cycle of forest ecosystems
(Caspersen and Pacala, 2001; Monserud, 2002; Vilà et al., 2003). The traditional view in forestry was
that the clearcutting system with artificial regeneration (an even-aged monoculture) maximized volume
productivity (e.g., Assmann, 1970; Gulden and Baker, 1988). However, Hasse and Ek (1981) and
Haight and Monserud (1990) found that this maxim does not generalize. Using simulation with a
widely-used forest management model (viz., Wykoff et al. 1982), Haight and Monserud (1990)
compared long-term optimal forest stand productivity between a monoculture of western white pine
(Pinus monticola) and a multi-age mixed-species management strategy that relied on periodic
thinnings and natural regeneration (an uneven-aged shelterwood). The mixed-species stands had much
higher species and size diversity, yet the optimal long-term productivity (m3 ha-1 yr-1) of the two
contrasting stands was essentially identical (Haight and Monserud, 1990).
The diversity of a forest stand may not be sufficiently described by tree species diversity alone.
Structural diversity, resulting from recruitment of trees of different sizes into multi-layered canopies,
should also be taken into account. This characteristic, which can be approximated by the diversity of
tree size, affects the amount of light and precipitation received by subordinate trees and understory
Forest Ecology and Management 243: 116-127 3

doi:10.1016/j.foreco.2007.02.028
1
2
3
4
5
6
7
8
9
10
11
12
13
14
15
16
17
18
19
20
21
22
23
24
plants (Anderson et al., 1969), and may thus influence the productivity of forest ecosystems. In
addition, silvicultural treatments are often defined by target stand states defined by the distribution of
tree by size class (Smith et al., 1997). Thus manipulating tree-size diversity is a practical tool for
forest managers who strive for greater biodiversity and/or greater productivity (Varga et al., 2005).
Studies dealing with tree-size diversity include Oren et al. (1987), and Lusk and Ortega (2003).
Liang et al. (2005) consider the effects of both tree-species diversity and tree-size diversity on
individual tree growth, mortality, and recruitment. However, most previous studies have dealt with
tree-species diversity only. Insignificant or negative productivity-diversity relationships (Sterba and
Monserud, 1995; Chen and Klinka, 2003; Vilà et al., 2003) are as common as positive ones (Kelty,
1989; Caspersen and Pacala, 2001; Liang et al., 2005). Much still needs to be learned on the effects of
species and size diversity on forest growth.
The literature on diversity in ecology is vast (Dennis et al., 1979). Three measures of diversity
are prominent. Species richness, a simple count of the number of species, is straightforward but it
ignores species frequency. Shannon’s (or Shannon-Wiener’s) index of diversity was originally a
measure of entropy (Boltzmann, 1872), later applied to information theory (Shannon, 1948; Shannon
and Weaver, 1949). The Simpson (1949) (or Gini-Simpson) index of ecological diversity had in fact
been used earlier to measure economic inequality (Gini, 1912). All three indices are closely related and
they can be derived from the same one-parameter family of diversity indices (Patil and Tailie, 1979,
Keylock, 2005). Both Shannon’s and Simpson’s indices have stood the test of time “and are still
generally regarded as the premier measures of ecological diversity” (Gorelick, 2006). We chose
Shannon’s index because it reflects both evenness and richness of species (Magurran, 1988, p. 34),
without favoring either dominant or rare species. Simpson’s index gives more weight to dominant
species. We also found that with our data the explanatory power of Shannon’s index was superior to
the species count.
Forest Ecology and Management 243: 116-127 4

doi:10.1016/j.foreco.2007.02.028
1
2
3
4
5
6
7
8
9
10
11
12
13
14
15
16
17
18
19
20
21
22
23
24
In the present study we examined the effects of diversity of tree species and size on the net
basal area growth of forest stands. We also examined diversity effects on the components of net basal
area growth, namely, survivor growth, recruitment, and mortality. The data were from forests in the
U.S. west coast region, which stretch over a vast area from northern Washington to southern California,
and cover several ecoregions (Omernik and Gallant, 1986).
To check the consistency of the diversity effects in different ecosystems, we examined two
forest types: the Douglas-fir/western hemlock type, and the mixed conifer type in California. The
Douglas-fir/western hemlock (Pseudotsuga menziesii/Tsuga heterophylla) forests are among the most
productive in North America. They thrive in the moist temperate rainforest west of the crest of the
Cascade Mountains in Oregon and Washington. These forests are mostly in seral stages but there are
still areas of old-growth with massive Douglas-fir (Psuedotsuga menziesii) and western hemlock
(Tsuga heterophylla). Although Douglas-fir and western hemlock are most abundant, they coexist with
many other tree species in natural stands, in particular Alnus rubra, Thuja plicata, and Acer
macrophyllum (Franklin and Dyrness, 1988).
Farther south along the Pacific coast, mixed-conifer forests cover thirteen percent of
California’s land area. The dominant tree species are Pinus ponderosa, Pinus Jeffreyi, Pinus
lambertiana, Pseudotsuga menziesii, Abies concolor and Libocedrus decurrens (Barbour and Major,
1977).
DATA AND METHODS
Data were obtained from 2.5-ha circular forest plots in the PNW-FIA Integrated Database (IDB 2.0,
Hiserote and Waddell, 2005). This is the most complete database to date for the Douglas-fir/western
hemlock and the mixed-conifer forest types. The plots covered a large area from northern Washington,
Forest Ecology and Management 243: 116-127 5

doi:10.1016/j.foreco.2007.02.028
1
2
3
4
5
6
7
8
9
10
11
12
13
14
15
16
17
along the Cascades, the Klamath Mountains and the Sierra Nevada, down to southern California (Fig.
1). The database assembles past inventories from the USFS National Forest System (R5, R6), Bureau
of Land Management, and Forest Inventory and Analysis, covering the period 1988-2000. To minimize
the effects of human interference, we only used the data from the reserved plots, where forest growth
was protected from artificial alteration. There were 1160 such plots, 373 Douglas-fir/western hemlock
in Oregon and Washington, and 787 for mixed conifers in California. More than 99 percent of the plots
were in National Forests.
All plots had been measured twice at a ten-year interval between 1988 and 2000. From these
successive measurements on each plot we calculated the mean net annual growth, g, the mean annual
survivor growth, u, the mean annual recruitment, r, and the mean annual mortality, m, all expressed in
basal area (the sum of the cross section of the trees of at least 7.6 cm in diameter at breast height).
Survivor growth was the change in basal area of the trees that were alive at the first and second
inventory. The recruitment was based on trees that passed the 7.6 cm threshold between successive
inventories. The mean net annual growth is related to survivor growth, recruitment and mortality by
the relation: g = u + r – m (Table 1).
Shannon’s index (Shannon 1948) based on basal area was used to measure tree-species
diversity, Hs, and tree-size diversity, Hd, on each plot:
)ln(1 B
B
B
BH i
n
i
is
s
, and 18
)ln(1 B
B
B
BH j
n
j
jd
d
19
20
21
22
where B, Bi, and Bj were respectively the total stand basal area, the basal area of trees of species i, and
the basal area of trees of diameter class j; and ns and nd were the number of tree species and the number
of diameter classes, respectively. As 37 species (Table 2) and 19 two-inch diameter classes were used
Forest Ecology and Management 243: 116-127 6

doi:10.1016/j.foreco.2007.02.028
1
2
3
4
5
6
7
8
9
10
11
12
13
14
15
16
17
18
19
20
21
22
23
24
to classify the trees on the plots, the theoretical range of Hs was between 0 and ln(37)=3.61, while Hd
was between 0 and ln(19)=2.94. There was little correlation between Hs and Hd (0.18 within the
Douglas-fir/western hemlock forest type, and 0.17 within the mixed conifer type), thus tree-species
diversity and tree-size diversity were distinct dimensions of the explanatory space.
Shannon’s index increases with the number of species or diameter classes (richness of species
or tree sizes), and with the evenness of the distribution of basal area by species or diameter class. This
index has been used effectively to measure forest stand diversity in previous work (Buongiorno et al.,
1994; Holland et al., 1994; Wills et al., 1997; Varga et al., 2005; Liang et al., 2005, 2006). We also
explored an even simpler measure of species diversity, the total number of tree species (Tillman et al.,
1996, 1997; Vilà et al., 2003). But, with our data, Shannon’s Hs had more explanatory power than the
total number of species. This is presumably because Shannon’s index takes into account both evenness
and species richness (Magurran, 1988, p. 34). The index is also sensitive to changes in rare species
(Pielou, 1966), which may make significant contributions to ecosystem functioning (Lyons et al.,
2005). As shown by the standard deviations in Table 1, there was substantial variation across plots in
their growth rates, their diversity of tree species and size, and other plot characteristics. The variables
used to control for the effects of other stand characteristics, besides tree diversity, on stand growth are
also summarized in Table 1. The effect of total stand basal area, B, on tree growth, mortality, and
recruitment is well documented for these forest types (see for example Liang et al., 2005). Stand age
was not available for the plots used in this study, most of which had an uneven-aged structure.
Regardless, tree size more directly influences tree growth and stand productivity than age (Gower et al.,
1996).
Site characteristics also influence stand growth. Lacking data on soil characteristics, we used
maximum mean annual increment (m3ha-1y-1) as a measure of site productivity based on site index.
Additional control variables for the site consisted of elevation, E, aspect, A, and slope, S, which
Forest Ecology and Management 243: 116-127 7

doi:10.1016/j.foreco.2007.02.028
1
2
3
4
5
6
7
8
9
10
11
12
13
14
15
16
17
18
19
20
determine the solar radiation and temperature (Stathers et al., 1990). Plot Universal Transverse
Mercator (UTM) coordinates (Snyder, 1987), x for easting distance and y for northing distance from
the UTM origin, were used to test for spatial autocorrelation effects across plots, as well as for large-
scale spatial effects, using semivariograms (Gooevaerts, 1997; Webster and Oliver, 2001).
The effects of species and size diversity on net annual growth, survivor growth, recruitment,
and mortality were tested in the same way, with nested models. For example, in the case of net annual
growth, the most general model used cubic polynomials in Hs and Hd to allow for nonlinearity, in
addition to the control variables:
,,...,1,),(3,3
3,3
,2,2
2,,2
2,2
2,2,,,,0
NiyxeEASDCBHH
HHHHHHHHHHg
iieiaisliDiCiBiddiss
idisdsidissdiddissidissdiddissi
(1)
where gi was the average annual net growth of basal area of plot i between the two inventories (m2 ha-1
y-1), and the independent variables were levels at the time of the first inventory. The α’s were
coefficients estimated from the plot data. The residuals e(x,y) were assumed to have an isotropic and
spherical spatial autocorrelation (Cressie, 1993).
The parameters were estimated by generalized least squares (GLS) to account for spatial
autocorrelation and heteroskedasticity (unequal variance) of the residual, which was present especially
in the equations for recruitment and mortality. The analysis was conducted with geoR (Ribeiro and
Diggle, 2004) in R (R Development Core Team, 2006).
The most sweeping hypothesis was that species and size diversity had no effect on net growth:
0: 33222210 dsdssddssddsH . This used a chi-square test
comparing the log-likelihood in (1) with a restricted model, without any term in Hs or Hd:
iieiaisliDiCi yxeEASDCg ),(0 (2) 21
Forest Ecology and Management 243: 116-127 8

doi:10.1016/j.foreco.2007.02.028
1
2
3
4
5
6
7
8
9
10
11
12
13
14
15
16
17
18
19
20
21
22
23
If H01 was rejected, we next hypothesized that species diversity alone had an effect on net
growth: was tested by comparing the log-likelihood in
the full model (1) with a restricted model without terms in Hd:
(3)
0: 322220 ddssddsddH
DiCiBsississis CBHHH 33
22 iieiaislii yxeEASDg ),(0
If H02 was rejected , we then hypothesized that size diversity alone had an effect on net growth:
0: 322230 sdssdssdsH was tested by comparing the log-likelihood in the full
model (1) with a restricted model without terms in Hs:
iieiaisliDiCiBdiddiddidi yxeEASDCBHHHg ),(33
220 (4)
If H03 was rejected, size and species diversity were both likely to affect net growth. In this case,
and in the case where H01, H0
2 or H03 could not be rejected, more efficient and parsimonious versions
of models (1), (2), (3), or (4) were sought, with only statistically significant explanatory variables and
with minimum collinearity. To this end, the insignificant term with the highest p-value was removed
and the model re-estimated. This was repeated until the Akaike information criterion (AIC) (Akaike,
1973) and Bayesian information criterion (BIC) (Schwartz, 1978) could not be lowered, or the
coefficients of all explanatory terms were significant at the 0.05 level (Mac Nally, 2000). The last
model obtained in this way was re-estimated assuming a random error, to assess the significance of the
spatial autocorrelation of the residuals.
Based on the final models, effects of species and size diversity on net basal area growth,
survivor growth, recruitment, and mortality, were computed by varying them within the range of their
mean value plus or minus two standard deviations, while holding other factors fixed at their sample
mean. By doing this we could assess the biological importance of species and size diversity in addition
to their statistical significance.
Forest Ecology and Management 243: 116-127 9

doi:10.1016/j.foreco.2007.02.028
1
2
3
4
5
6
7
8
9
10
11
12
13
14
15
16
17
18
19
20
21
22
23
24
RESULTS & DISCUSSION
Statistical tests of diversity effects
The hypothesis H01, that neither species diversity nor size diversity had an effect, was rejected at the α
= 0.05 level for all but one component of growth in both forest types (Table 3). The only exception
was for survivor growth of Douglas-fir/western hemlock. Thus, there was evidence that either species
diversity, size diversity, or both affected at least one component of stand growth.
For net growth and recruitment, hypothesis H02 and H0
3 were also rejected at the 0.05 level,
suggesting that both species and size diversity affected net growth and recruitment, in both forest types.
The results were less general, across forest type, for survivor growth and mortality. While there
was no evidence of an effect of either type of diversity on the survivor growth of Douglas-fir/western
hemlock, size diversity had an effect on the survivor growth of mixed conifers. And, while the
mortality of mixed conifers was significantly affected (in a statistical sense) by both species and size
diversity, the mortality of Douglas-fir/western hemlock was affected by species diversity alone.
Growth models with diversity effects
The models (a) in Tables 4 and 5 are truncated versions of the general model (1), consistent with the
results of Table 3. For example, as we could not reject the hypothesis that both species and size
diversity influenced the net growth of Douglas-fir/western hemlock (Table 3), the corresponding
model (a) in Table 4 contains all the terms in Hs and Hd. And, as we could not reject the hypothesis
that tree-size diversity alone affected mortality of Douglas-fir/western hemlock (Table 3), the
corresponding model (a) in Table 4 contains only terms in Hd.
The P-values of the tests comparing the likelihood ratios of model (a) and model (b) showed
that, in all but one case, backward elimination applied to model (a) increased significantly the
Forest Ecology and Management 243: 116-127 10

doi:10.1016/j.foreco.2007.02.028
1
2
3
4
5
6
7
8
9
10
11
12
13
14
15
16
17
18
19
20
21
22
23
24
likelihood ratio, at the 0.05 significance level. The only exception was net growth of Douglas-
fir/western hemlock, for which the likelihood ratio of (b) was not significantly different from that of
(a). In model (b) for the mortality of mixed conifers, the terms in Hs and Hd were not significant
individually at the 0.05 level, but they were significant as a group, in agreement with Table 2.
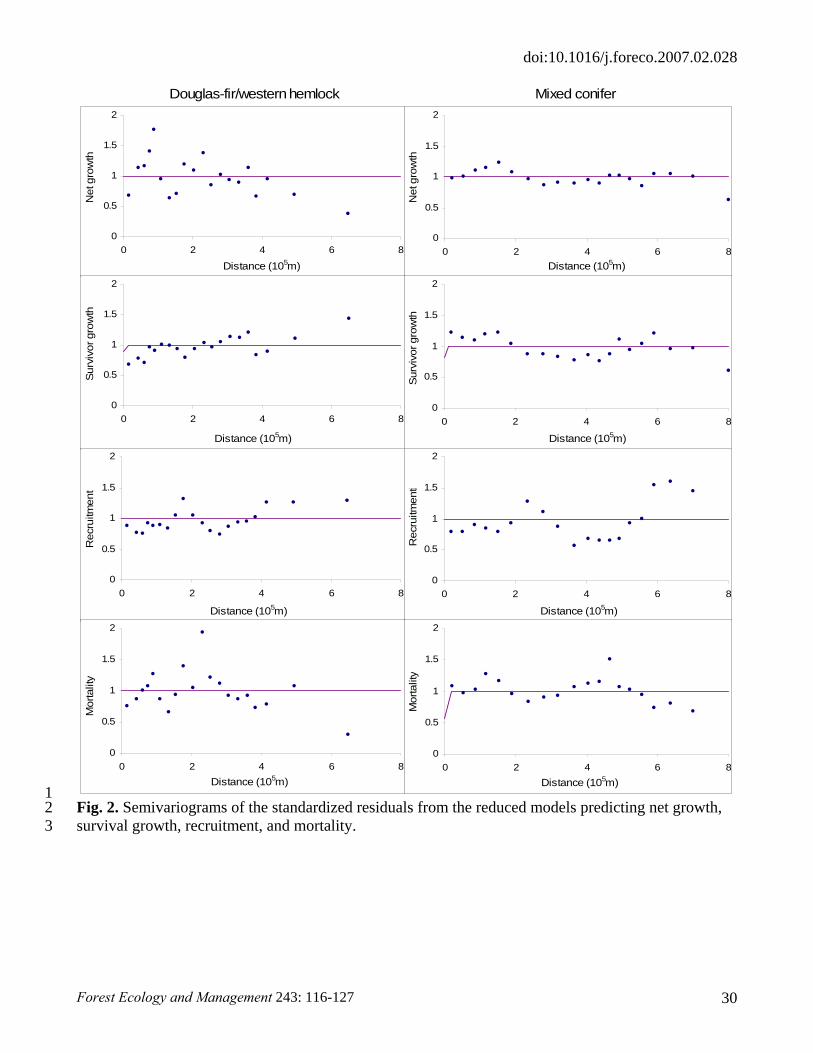
Comparison of the likelihood ratios of models (b) and (c) showed that there was no significant
spatial autocorrelation, at the 0.05 level. This was confirmed by the semivariograms of the
standardized residuals from the reduced models with respect to distance between plots (Fig. 2).
Therefore, the non-spatial linear models (Model (c) in Tables 4 and 5) estimated by GLS were used to
study the effects of changes in species and size diversity on net basal area growth, survivor growth,
recruitment, and mortality.
Biological significance of diversity effects
Figures 3 and 4 show the effects on the various growth components of changes in species diversity or
size diversity, within the range of the data, while other stand characteristics were being held constant at
their mean observed value.
Tree-species diversity and stand growth
As tree-species diversity increased, net basal area growth increased substantially and linearly for both
forest types (Fig. 3A, B). For Douglas-fir/western hemlock forests, a doubling of tree-species diversity
corresponded to a 38 percent increase in annual net basal area growth. For mixed conifers it
corresponded to a 21 percent increase.
The survivor growth of both Douglas-fir/western hemlock and mixed conifer forests did not
vary with tree-species diversity (Fig. 3C, D). Similarly, there was no significant relationship between
mortality and species diversity in either forest type (Fig. 3G, H).
Forest Ecology and Management 243: 116-127 11

doi:10.1016/j.foreco.2007.02.028
1
2
3
4
5
6
7
8
9
10
11
12
13
14
15
16
17
18
19
20
21
22
23
24
Recruitment in Douglas-fir/western hemlock forests and in mixed conifers was substantially
higher in stands of higher species diversity (Fig. 3E, F). The relationship was linear for mixed
conifers, and somewhat sigmoid (but with large standard errors at high diversity levels) for Douglas-
fir/western hemlock. If one ignores this nonlinearity, the relationship between recruitment and species
diversity appears to parallel that between net growth and species diversity. Thus, the entire effect of
species diversity on net growth could be traced to effects of species diversity on recruitment, with no
effect due to survivor growth and mortality.
Tree-size diversity and stand growth
The relationship between net growth and tree-size diversity was curvilinear for both vegetation types
(Fig. 4A, B). For Douglas-fir/western hemlock, net growth was highest at very low levels of tree-size
diversity, and it decreased rapidly as size diversity increased. For mixed conifers, net growth increased
slightly at first with increasing size diversity, reaching a maximum when size diversity was average
(Shannon index = 1.69, Table 2), and decreasing thereafter. At the highest tree-size diversity, net
growth was similar for mixed conifers and for Douglas-fir/western hemlock.
The survivor growth of Douglas-fir/western hemlock was unrelated to tree-size diversity, while
survivor growth tended to increased slightly with size diversity for mixed conifers (Fig. 4C, D).
Recruitment of Douglas-fir/western hemlock tended to decrease with tree-size diversity, while that of
mixed conifers was unaffected by tree-size diversity (Fig. 4E, F). Mortality was higher in mixed
conifer stands of high tree-size diversity, while there was a weak quadratic trend in the relation
between mortality of Douglas-fir western hemlock and tree-size diversity (Fig. 4G, H).
The overall conclusion from Fig. 4 is that the lower net growth of stands of high tree-size
diversity is related to lower recruitment in the case of Douglas-fir/western hemlock, and to higher
mortality in the case of mixed conifers.
Forest Ecology and Management 243: 116-127 12

doi:10.1016/j.foreco.2007.02.028
1
2
3
4
5
6
7
8
9
10
11
12
13
14
15
16
17
18
19
20
21
22
23
Taken as a whole, our findings indicate that there is a strong positive relationship between net
growth and tree-species diversity, in both Douglas-fir/western hemlock and mixed conifer stands. The
increase in net growth stemmed essentially from higher recruitment in stands of higher tree-species
diversity. Meanwhile, mortality and survivor growth were unaffected by tree-species diversity.
To determine how much tree diversity contributed to the goodness-of-fit of the dependent
variables measured by log likelihood, hierarchical portioning (Chevan and Sutherland, 1991) was
applied to Model (c) in Tables 4 and 5. Diversity terms were a substantial part of the total explanatory
power of Douglas-fir/western hemlock recruitment and mixed conifer mortality, while other models
were determined largely by the control variables (Table 6). Nevertheless, the expected effect of a
change in Hs or Hd alone, other things being equal, could be substantial.
That increasing tree-species diversity had a positive effect on net timber productivity, and
mostly through recruitment, is in agreement with the theory that marked differences in species life
histories lead to complementarity and niche differentiation (Fridley, 2003) or facilitation (Tilman et al.,
2001; Jonsson and Malmqvist, 2003; Bauhus et al., 2004). These effects can enhance ecosystem
productivity (Lusk and Ortega, 2003), especially when herbivory and decomposition are considered
(Jonsson and Malmqvist, 2003). This finding also agrees with the forest studies by Kelty (1989),
Caspersen and Pacala (2001), and Liang et al. (2005). One possible explanation of the strong positive
effect of tree species diversity on recruitment is that high species diversity led to an increase in
regeneration niches, or, owing to the diversity of propagules, an increase in the likelihood that existing
niches would be exploited. Another possibility is that, especially during periodic stress such as
protracted droughts, the overall growth and survival of smaller trees (potential recruits) was facilitated
by species diversity. Mulder et al. (2001) found that increases in plant species diversity resulted in
increased productivity through decreased overall mortality during drought. As younger trees are often
Forest Ecology and Management 243: 116-127 13

doi:10.1016/j.foreco.2007.02.028
1
2
3
4
5
6
7
8
9
10
11
12
13
14
15
16
17
18
19
20
21
22
23
24
most vulnerable to drought (e.g. Barden, 1988; Lawson et al., 1999), they might benefit most from
such stress-dependent facilitation.
The results were less general across forest types for the effects of tree-size diversity. The
strongest finding was that net basal area growth was lower in stands of highest tree-size diversity, in
both forest types. This finding is in agreement with the observations of Sterba and Monserud (1995),
Edgar and Burke (2001), and Liang et al (2005, 2006).
In contrast with results for tree-species diversity, relationships between components of net
growth and tree-size diversity differed by forest type. For Douglas-fir/western hemlock, the lower net
growth at high tree-size diversity could be traced mostly to lower recruitment rates at high tree-size
diversity (Fig. 4E). For mixed conifers, instead, it stemmed from higher mortality at high tree-size
diversity (Fig. 4H).
The observed trends are subject to the usual caveats due to the use of non experimental data.
On the positive side, we found no spatial autocorrelation in any model formulation. On the other hand,
multicollinearity is a pervasive problem with such data. Multicollinearity does not lead to biased
parameters, but it may lead to difficulty in measuring the partial effect of each variable (Goldberger,
1991, p. 248). The hypothesis tests in Table 1 are unaffected by multicollinearity, but the partial
effects of each variable (Fig. 3 and 4), may be more uncertain. Nevertheless, multicollinearity was not
excessive in the present case. The highest partial correlation was of 0.59 between Hs and D in mixed
conifers. Furthermore, the final parsimonious models of maximum likelihood (models (c) in Tables 4
and 5) did generally have parameters with low standard errors.
The question remains as to why diversity with respect to species but not size would have a
positive influence on basal area growth. If we assume that tree-size diversity is positively associated
with canopy depth and leaf area index, this would suggest higher efficiency of light capture by stands
of high tree-size diversity. However, this gain is necessarily accompanied by the loss of light
Forest Ecology and Management 243: 116-127 14

doi:10.1016/j.foreco.2007.02.028
1
2
3
4
5
6
7
8
9
10
11
12
13
14
15
16
17
18
19
20
21
22
23
24
transmittance to lower canopy strata and understory vegetation (Grace, 1999). In the two forest types
under study it appears that the benefit of increased light capture for the productivity of tree crowns in
the mid- and upper-canopy strata was more than offset by consequent decreases in establishment or
increases in mortality of trees beneath them.
A contribution of this study is that it differentiated the partial effects of the diversity of tree
species from the diversity of tree size (stand structure). Our findings suggest that maintaining species
diversity is an important means to obtain high growth rate in forest management. In contrast, the
finding that size diversity was negatively associated with net basal area growth suggests that multi-
layered forests were not better in growth rate than even-sized forests. For the purpose of optimizing
growth, forest managers should focus on tree species rather than size. Further studies should explore
whether keystone species exist, those with functional impacts on ecosystem disproportional to their
abundance (Power et al., 1996), which should be kept as a high priority by forest managers.
Acknowledgments
We thank D. Tilman, R.M. King., D.E. Calkin, and M. Clayton for their comments and insights. We
are also grateful to D. Parry, K. Waddell, and S.S. Hummel for assistance with data. This study was
supported in parts by the USDA Forest Service, Pacific Northwest Forest and Range Experiment
Station, by USDA-CSREES grant 2001-35108-10673, and by the School of Natural Resources,
University of Wisconsin-Madison.
References
Akaike, H., 1973. Information theory and an extension of the maximum likelihood principle. In:
Petrov, E.B.N., Csaki, F., Proc. 2nd Int. Symp. Info. Theory. Akademia Kiado, Budapest. pp. 267-
281.
Forest Ecology and Management 243: 116-127 15

doi:10.1016/j.foreco.2007.02.028
1
2
3
4
5
6
7
8
9
10
11
12
13
14
15
16
17
18
19
20
21
22
23
24
Anderson, R.C., Loucks, O.L., Swain, A.M., 1969. Herbaceous response to canopy cover, light
intensity, and throughfall precipitation in coniferous forests. Ecology, 50: 255-263.
Assmann, E., 1970. The principles of forest yield studies. Pergamon Press, Oxford. 506 p.
Barbour, M.G., Major, J. (eds), 1977. Terrestrial vegetation of California. John Wiley and Sons, New
York.
Barden, L.S., 1988. Drought and survival in a self-perpetuating Pinus pungens population: equilibrium
or nonequilibrium? American Midland Naturalist 119: 253-257.
Bauhus, J., van Winden, A.P., Nicotra, A.B., 2004. Aboveground interactions and productivity in
mixed-species plantations of Acacia mearnsii and Eucalyptus globulu. Can. J. For. Res. 34: 686-
694.
Boltzmann, L., 1872. Weitere studien über das wärmegleichgewicht unter gasmolekälen. S. K. Akad.
Wiss. Wein 66:275-370.
Buongiorno J., Dahir, S., Lu, H-C, Lin, C-R, 1994. Tree size diversity and economic returns in uneven-
aged forest stands. For. Sci. 40: 83–103.
Cardinale, B.J., Ives, A.R., Inchausti, P., 2004. Effects of species diversity on the primary productivity
of ecosystems: extending our spatial and temporal scales of inference. Oikos 104(3):437-450.
Caspersen, J.P., Pacala, S.W., 2001. Successional diversity and forest ecosystem function. Ecol. Res.
16: 895-903.
Chapin, F.S., Zavaleta, E.S., Eviner, V.T., Naylor, R.L., Vitousek, P.M., Lavourel, S., Reynolds, H.L.,
Hooper, D.U., Sala, O.E., Hobbie, S.E., Mack, M.C., Diaz, S., 2000. Consequences of changing
biotic diversity. Nature 405:234-242.
Chen, H.Y.H., Klinka, K., 2003. Above ground productivity of western hemlock and western redcedar
mixed-species stands in southern coastal British Columbia. For. Ecol. Manage. 184: 55-64.
Chevan, A., Sutherland, M., 1991. Hierarchical partitioning. Amer. Statistician 45: 90-96.
Forest Ecology and Management 243: 116-127 16

doi:10.1016/j.foreco.2007.02.028
1
2
3
4
5
6
7
8
9
10
11
12
13
14
15
16
17
18
19
20
21
22
23
Cressie, N., 1993. Statistics for spatial data. John Wiley and Sons, New York.
Dennis, B., Patil, G.P., Rossi, O., Stehnan, S., Taillie, C., 1979. A bibliography of literature on
ecological diversity and related methodology. In: Grassle, J.F., Patil, G.P., Smith, W.K., Taillie, C.
(eds) Ecological Diversity in Theory and Practice. International Cooperative Publishing House,
Fairland, Maryland. pp 319-353.
Edgar, C.B., Burk, T.E., 2001. Productivity of aspen forests in northeastern Minnesota, U.S.A., as
related to stand composition and canopy structure. Can. J. For. Res. 31: 1019-1029.
Franklin, J.F., Dyrness, C.T., 1988. Natural Vegetation of Oregon and Washington. Oregon State
University Press, Corvallis.
Fridley, J.D., 2003. Diversity effects on production in different light and fertility environments: an
experiment with communities of annual plants. J. Ecol. 91:396-406.
Gini, C., 1912. Variabilità e mutabilità. Reprinted in: Pizetti, E., Salvemini, T. (eds) Memorie di
metodologica statistica, Libreria Eredi Virgilio Veschi 1955, Rome.
Goldberber, A.S., 1991. A course in econometrics. Harvard University Press, Cambridge.
Gooevaerts, P., 1997. Geostatistics for natural resources evaluation. Oxford University Press, New
York.
Gorelick, R., 2006. Combining richness and abundance into a single diversity index using matrix
analogues of Shannon’s and Simpson’s indices. Ecography 29: 525-530.
Gower, S.T., McMurtrie, R.E., Murty, D., 1996. Aboveground net primary production decline with
stand age: potential causes. Trends. Ecol. Evol. 11:378-382.
Grace, J.B., 1999. Perspectives in Plant Ecology. Evol. Syst. 2(1): 1-28.
Gulden, J.M., Baker, J.B., 1988. Yield Comparisons from Even-Aged and Uneven-Aged Loblolly-
Shortleaf Pine Stands. Southern Journal of Applied Forestry 12(2): 107-114.
Forest Ecology and Management 243: 116-127 17

doi:10.1016/j.foreco.2007.02.028
1
2
3
4
5
6
7
8
9
10
11
12
13
14
15
16
17
18
19
20
21
22
Haight, R.G., Monserud, R.A., 1990. Optimizing any-aged management of mixed-species stands: II.
Effects of decision criteria. For. Sci. 36(1):125-144.
Hasse, W.D., Ek, A.R., 1981. A simulated comparison of yields for even-versus uneven-aged
management of northern hardwood stands. J. Environ. Manage. 12: 235–246.
Hector, A., Schmid, B., Beierkuhnlein, C., Caldeira, M.C., Diemer, M., Dimitrakopoulos, P.G., Finn,
J., Freitas, H., Giller, P.S., Good, J., Harris, R., Högberg, P., Huss-Danell, K., Joshi, J., Jumpponen,
A., Körner, C., Leadley, P.W., Loreau, M., Minns, A., Mulder, C.P.H., O'Donovan, G., Otway,
S.J., Pereira, J.S., Prinz, A., Read, D.J., Scherer-Lorenzen, M., Schulze, E-D., Siamantziouras,
A.S.D, Spehn, E.M., Terry, A.C., Troumbis, A.Y., Woodward, F.I., Yachi, S., Lawton, J.H., 1999.
Plant diversity and productivity experiments in European grasslands. Science 286:1123-1127.
Hiserote, B., Waddell, K., 2005. The PNW-FIA integrated database user guide (version 2.0). Data are
available at: http://www.fs.fed.us/pnw/fia/publications/data/data.shtml. Cited 27 June 2006.
Holland, D.N., Lielieholm, R.J., Roberts, D.W., 1994. Economic trade-offs of managing forests for
timber production and vegetative diversity. Can. J. For. Res. 24:1260-1265.
Huston, M.A., 1997. Hidden treatments in ecological experiments: re-evaluating the ecosystem
function of biodiversity. Oecologia 110:449-460.
Jonsson, M., Malmqvist, B., 2003. Mechanisms behind diversity effects on ecosystem functioning:
testing the facilitation and interference hypotheses. Oecologia 134: 554-559.
Kelty, M.J., 1989. Productivity of New England hemlock/hardwood stands as affected by species
composition and canopy structure. For. Ecol. Manage. 28: 237-257.
Keylock, C.J., 2005. Simpson diversity and the Shannon-Wiener index as special cases of a
generalized entropy. Oikos 109:203-207.
Forest Ecology and Management 243: 116-127 18

doi:10.1016/j.foreco.2007.02.028
1
2
3
4
5
6
7
8
9
10
11
12
13
14
15
16
17
18
19
20
21
22
23
24
Lawson, D., Inouye, R.S., Huntly, N., Carson, W.P., 1999. Patterns of woody plant abundance,
recruitment, mortality, and growth in a 65 year chronosequence of old-fields. Vegetatio 145: 267-
279.
Liang, J., Buongiorno, J., Monserud, R.A., 2005. Growth and Yield of All-aged Douglas-fir/western
hemlock Stands: A Matrix Model with Stand Diversity Effects. Can. J. For. Res. 35: 2369-2382.
Liang, J., Buongiorno, J., Monserud, R.A., 2006. Bootstrap simulation and response surface
optimization of management regimes for Douglas-fir/western hemlock stands. For. Sci. 52(5):579-
594.
Loreau, M., Mouquet, N., Gonzalez, A., 2003. Biodiversity as spatial insurance in heterogeneous
landscapes. PNAS 100 (22): 12765-12770.
Loreau, M., Naeem, S., Inchausti, P., Bengtsson, J., Grime, J.P., Hector, A., Hooper, D.U., Huston,
M.A., Raffaelli, D., Schmid, B., Tilman, D., Wardle, D., 2001. Biodiversity and ecosystem
functioning: current knowledge and future challenges. Science 294: 804-808.
Lusk, C.H., Ortega, A., 2003. Vertical structure influences basal area development of second-growth
Nothofagus stands in south-central Chile. J. Appl. Ecol. 40: 639–645.
Lyons, K.G., Brigham, C.A., Traut, B.H., Schwartz, M.W., 2005. Rare species and ecosystem
functioning. Conserv. Biol. 19(4): 1019-1024.
Magurran, A.E., 1988. Ecological Diversity and its Measurement. Princeton University Press,
Princeton, NJ.
Monserud, R.A., 2002. Large-scale management experiments in the moist maritime forests of the
Pacific Northwest. Landscape and Urban Planning 59(3): 159-180.
Mac Nally, R., 2000. Regression and model-building in conservation biology, biogeography and
ecology: The distinction between- and reconciliation of –‘predictive’ and ‘explanatory’ models.
Biodivers. and Conserv. 9: 655-671.
Forest Ecology and Management 243: 116-127 19

doi:10.1016/j.foreco.2007.02.028
1
2
3
4
5
6
7
8
9
10
11
12
13
14
15
16
17
18
19
20
21
22
23
24
Mulder, C.P.H., Uliassi, D.D., Doak, D.F., 2001. Physical stress and diversity-productivity
relationships: the role of positive interactions. Proceedings of the National Academy of Sciences
98: 6704-6708.
Omernik, J.M., Gallant, A.L., 1986. Ecoregions of the Pacific Northwest. EPA/600/3-86/033. U.S.
EPA, Environmental Research Laboratory, Corvallis, OR. 39 p.
Oren, R., Waring, R.H., Stafford, S.G., Barrett, J.W., 1987. Twenty-four years of ponderosa pine
growth in relation to canopy leaf area and understory competition. For. Sci. 33: 538-547.
Patil, G.P., Taillie, C., 1979. An overview of diversity. In: Grassle J.F., Patil, G.P., Smith, W.K.,
Taillie, C. (eds) Ecological Diversity in Theory and Practice. International Cooperative Publishing
House, Fairland, Maryland. pp 3-27.
Pielou, E.C., 1966. Shannon’s formula as a measure of specific diversity: its use and misuse. Am. Nat.
100: 463-465.
Power, M.E., Tilman, D., Estes, J.A., Menge, B.A., Bond, W.J., Mills, L.S., Daily, G., Castilla, J.C.,
Lubchenco, J., Paine, R.T. 1996. Challenges in the quest for keystones. BioScience 46: 609-620.
R Development Core Team, 2006. R: a language and environment for statistical computing. R
Foundation for Statistical Computing. Vienna, Austria.
Ribeiro, P.J., Diggle, P.J., 2004. geoR: package for geostatistical analysis. http://www.est.ufpr.br/
geoR. Cited June 27 2006.
Schulze, E.D., Mooney, H.A. (eds), 1993. Biodiversity and Ecosystem Function. Springer Verlag,
Berlin.
Schwarz, G., 1978. Estimating the dimension of a model. Annal. of Stat. 6(2):461-464.
Shannon, C.E., 1948. A mathematical theory of communication. Bell Syst Tech J 27: 379-423.
Shannon, C.E., Weaver, W., 1949. The Mathematical Theory of Communication. University of Illinois
Press, Champaign, IL.
Forest Ecology and Management 243: 116-127 20

doi:10.1016/j.foreco.2007.02.028
1
2
3
4
5
6
7
8
9
10
11
12
13
14
15
16
17
18
19
20
21
22
23
Simpson, E. H., 1949. Measurement of diversity. Nature 163: 688.
Smith, D.M., Larson, B.C., Kelty, M.J., Mark, P., Ashton, S., 1997. The practice of silviculture:
applied forest ecology, 9th ed. John Wiley and Sons, New York
Stathers, R.J., Trowbridge, R., Spittlehouse, D.L., Macadam, A., Kimmins, J.P., 1990. Ecological
principles: basic concepts. In: Lavender, D.P., Parish, R., Johnson, C.M., Montgomery, G., Vyse,
A., Willis, R.A., Winston, D. (eds) Regenerating British Columbia’s Forests. UBC Press,
Vancouver, pp 45-54.
Sterba, H., Monserud, R.A., 1995. Potential Volume Yield for Mixed-Species Douglas-Fir Stands in
the Northern Rocky Mountains. For. Sci. 41:531-545.
Snyder, J.P., 1987. Map Projections - A Working Manual. U.S. Geological Survey Professional Paper
1395. United States Government Printing Office, Washington, D.C..
Tilman, D., Reich, P., Knops, J., Wedin, D., Mielke, T., Lehman, C.L., 2001. Diversity and
Productivity in a Long-Term Grassland Experiment. Science 294: 843-845.
Tilman, D., Wedin, D., Knops, J., 1996. Productivity and sustainability influenced by biodiversity in
grassland ecosystems. Nature 379:718-720.
Tilman, D., Lehman, C.L., Thomson, K.T., 1997. Plant diversity and ecosystem productivity:
theoretical considerations. Proc. Natl. Acad. Sci. USA 94: 1857-1861.
Varga, P., Chen, H.Y.H., Klinka, K., 2005. Tree-size diversity between single- and mixed-species
stands in three forest types in western Canada. Can. J. For. Res. 35: 593-601.
Vilà, M., Vayreda, J., Gracia, C., Ibáñez, J.J., 2003. Does tree diversity increase wood production in
pine forests? Oecologia 135: 299-303.
Webster, R., Oliver, M., 2001. Geostatistics for environmental scientists. John Wiley and Sons, New
York.
Forest Ecology and Management 243: 116-127 21

doi:10.1016/j.foreco.2007.02.028
1
2
3
4
5
6
7
Wills, C., Condit, R., Foster, R.B., Hubbell, S.P., 1997. Strong density- and diversity-related effects
help to maintain tree species diversity in a neotropical forest. Proc. Natl. Acad. Sci. USA 94: 1252-
1257.
Wykoff, W.R., Crookston, N.L., Stage, A.R., 1982. User’s guide to the stand prognosis model. GTR-
INT-133. Ogden, UT: Intermountain For. Range Exp. Sta., Forest Service, U.S. Department of
Agriculture.
Forest Ecology and Management 243: 116-127 22

doi:10.1016/j.foreco.2007.02.028
1
2
Table 1. Definition, mean, and standard deviation (SD) of plot variables used in the analysis.
Douglas-fir/
western hemlock
Mixed conifer Var Description Unit
Mean (SD) Mean (SD)
Dependent Variables
n Net annual growth m2ha-1y-1 0.35 (0.71) 0.35 (0.36)
s Annual survivor growth m2ha-1y-1 0.47 (0.30) 0.41 (0.31)
r Recruitment, basal area of trees passing the 7.62 cm threshold
m2ha-1y-1 0.07 (0.12) 0.04 (0.08)
m Mortality, basal area of trees that died each year
m2ha-1y-1 0.19 (0.40) 0.10 (0.21)
Stand Diversity Variables
Hd Size diversity (Shannon’s Index) 2.22 (0.43) 1.69 (0.57)
Hs Species diversity (Shannon’s Index) 0.89 (0.44) 0.64 (0.45)
Control Variables
B Stand basal area in the first inventory
m2ha-1 43.38 (28.02) 32.26 (27.86)
C Site productivity m3ha-1y-1 6.65 (3.82) 5.90 (4.56)
D Mean diameter of all live trees at the first inventory
cm 13.19 (5.44) 14.72 (7.67)
S Average percent slope —— —— 40.12 (21.29)
A Aspect, the absolute angle between the south and the direction to which a slope faces
degree —— —— 92.46 (55.06)
E Elevation m 107.20 (50.04) 1830.89 (678.89)
x Easting of plot UTM coordinates 105m 5.47 (0.75) 4.43 (1.41)
y Northing of plot UTM coordinates 105m 50.43 (1.91) 42.10 (2.73)
3
Forest Ecology and Management 243: 116-127 23

doi:10.1016/j.foreco.2007.02.028
1 2
Table 2. Frequency of tree species in all sample plots, by forest type.
Common name Scientific name Frequency (%)
Douglas-fir/western hemlock
Mixed conifer
Douglas-fir Pseudotsuga menziesii 39.77 14.59 Western hemlock Tsuga heterophylla 13.06 0.03 Western redcedar Thuja plicata 4.18 0.00 Port Orford cedar Chamaecyparis lawsoniana 0.26 0.12 Noble fir Abies procera 1.02 0.00 Bigleaf maple Acer macrophyllum 1.21 0.42 Redwood Sequoia sempervirens 0.01 3.43 Jeffrey pine Pinus jeffreyi 0.08 7.27 Sitka spruce Picea sitchensis 0.59 0.04 Pacific silver fir Abies amabilis 6.08 0.00 White fir Abies concolor 3.57 16.75 Sugar pine Pinus lambertiana 0.57 3.45 Subalpine fir Abies lasiocarpa 1.62 0.00 Red alder Alnus rubra 3.34 0.29 Pacific yew Taxus brevifolia 0.12 0.02 Incense cedar Calocedrus decurrens 0.96 6.98 Grand fir Abies grandis 2.01 0.08 Black cottonwood Populus balsamifera ssp.trichocarpa 0.21 0.04 Engelmann spruce Picea engelmannii 0.87 0.00 Western juniper Juniperus occidentalis 0.28 1.77 Pacific madrone Arbutus menzeisii 0.64 1.70 Oregon ash Fraxinus latifolia 0.08 0.02 Mountain hemlock Tsuga mertensiana 4.15 0.72 Alaska cedar Chamaecyparis nootkatensis 0.35 0.00 Western white pine Pinus monticola 0.53 1.21 Ponderosa pine Pinus ponderosa 7.15 9.55 Lodgepole pine Pinus contorta 4.02 4.23 Western larch Larix occidentalis 0.33 0.00 Quaking aspen Populus tremuloides 0.07 0.16 Oregon white oak Quercus garryana 0.22 0.77 California black oak Quercus kelloggii 0.14 5.01 California red fir Abies magnifica 0.00 7.34 Canyon live oak Quercus chrysolepis 0.17 5.41 Golden chinkapin Castanopsis chrysophylla 0.20 0.08 Shasta red fir Abies magnifica var. shastensis 0.93 0.11 Tanoak Lithocarpus densiflorus 0.60 3.18 Others 0.62 5.22 All species 100.00 100.00
3
Forest Ecology and Management 243: 116-127 24

doi:10.1016/j.foreco.2007.02.028
Forest Ecology and Management 243: 116-127 25
1 2
Table 3. Tests of significance of overall effects of species diversity and size diversity.
Hypothesis1 P-value Hypothesis1 P-value
Douglas-fir/western hemlock Mixed conifer
Net growth 1 0.002 1 0.001
2 0.000 2 < 0.001
3 0.000 3 0.040
Survivor growth 1 0.077 1 0.000
2 n.a. 2 0.000
3 n.a. 3 0.429
Recruitment 1 0.000 1 < 0.001
2 0.000 2 0.036
3 0.000 3 0.004
Mortality 1 0.014 1 < 0.001
2 0.017 2 0.013
3 0.106 3 0.001 1Hypothesis 1, species and size diversity had no effect:
.
3
4
5
6
7
8
9
0: 33222210 dsdssddssddsH
Hypothesis 2, species diversity alone had an effect:
0: 322220 ddssddsddH .
Hypothesis 3, size diversity alone had an effect:
0: 322230 sdssdssdsH
n.a.: not applicable because hypothesis 1 could not be rejected.

doi:10.1016/j.foreco.2007.02.028
1 2
Table 4. Regression models to predict net growth and its components in Douglas-fir/western hemlock forests in Oregon and Washington. Model AIC BIC L P-value Net growth (m2ha-1y-1) (a):1.87+0.0001B+0.02C-0.0001E-0.02D*-2.40Hs-0.51Hd+0.42Hs
2-0.34Hd2+0.18Hs
3+0.13Hd3+1.87HsHd
-0.27Hs2Hd-0.38HsHd
2 816.1 882.1 -391.0
(b): 0.15+0.04C**-0.02D*+0.41HsHd*-0.15 HsHd2* 807.7 839.0 -395.9 0.381
(c): 0.15+0.04C**-0.02D*+0.41HsHd*-0.15 HsHd2* 803.7 827.1 -395.9 1.002
Survivor growth (m2ha-1y-1) (a): 0.39+0.005B**+0.03C**-0.0004E-0.02D** 29.5 60.7 -6.7 (b): 0.33+0.005B**+0.03C**-0.02D** 15.3 42.6 -0.7 < 0.01 (c): 0.33+0.005B**+0.03C**-0.02D** 15.8 35.3 -2.9 0.11
Recruitment (m2ha-1y-1) (a):1.26**+0.003B*-0.002C-0.001E**-0.01D**-0.30Hs-1.31Hd**-0.07Hs
2+0.40Hd2**-0.09Hs
3
-0.01Hd3+0.60HsHd** +0.18Hs
2Hd**-0.26HsHd2**
-629.5 -563.5 331.8
(b):1.22**-0.0005E**-0.01D**-0.36Hs-1.23Hd**+0.35Hd2**-0.11Hs
3*+0.61HsHd**+0.16Hs2Hd**
-0.26HsHd2**
-666.8 -616.2 346.4 < 0.01
(c):1.22**-0.0005E**-0.01D**-0.36Hs-1.23Hd**+0.35Hd2**-0.11Hs
3*+0.61HsHd**+0.16Hs2Hd**
-0.26HsHd2**
-670.8 -628.0 346.4 1.00
Mortality (m2ha-1y-1) (a): -0.06+0.004B**-0.001C+0.001E*-0.01D-0.23Hd+0.23Hd
2-0.06Hd3 404.7 447.6 -191.4
(b): -0.16+0.004B**+0.001E*-0.005D+0.09Hd2*-0.03Hd
3* 393.1 428.2 -187.5 < 0.01 (c): -0.16+0.004B**+0.001E*-0.005D+0.09Hd
2*-0.03Hd3* 389.1 416.4 -187.5 1.00
3 4 5 6 7 8 9
10 11 12
Hs, and Hd = tree-species diversity, and tree-size diversity. Other variables defined in Table 2. *, P<0.05; **, P<0.01 for test of significant difference of parameter value from 0. (a): Model consistent with the results of Table 1, with spatial autocorrelation, (b): Parsimonious version of model (a), with spatial autocorrelation, (c): Model (b), without spatial autocorrelation, AIC: Akaike Information Criterion (smaller is better). BIC: Bayesian Information Criterion (smaller is better). L: Log-likelihood ratio. 1P-value for the test of the increase in L from model (a) to model (b). 2P-value for the test of spatial autocorrelation.
Forest Ecology and Management 243: 116-127 26

doi:10.1016/j.foreco.2007.02.028
1 2
Table 5. Regression models to predict net growth and its components in California mixed conifer forests. Model AIC BIC L P-value Net growth (m2ha-1y-1) (a): 0.18+0.004B**+0.02C**-0.001S*+0.00003E+0.0003A-0.02D*-0.40Hs+0.52Hd**+ 0.14Hs
2*-0.32Hd2
-0.04Hs3+0.06Hd
3 +0.59HsHd**-0.06Hs2Hd-0.16HsHd
2* 490.8 579.1 -226.4
(b): 0.19**+0.004B**+0.02C**-0.002S**-0.02D*-0.25Hs*+0.30Hd**-0.08Hd2*+0.42HsHd*-0.13HsHd
2* 439.3 499.8 -206.6 < 0.011
(c): 0.19**+0.004B**+0.02C**-0.002S**-0.02D**-0.25Hs*+0.30Hd**-0.08Hd2*+0.42HsHd*-0.13HsHd
2* 435.3 486.5 -206.6 1.002
Survivor growth (m2ha-1y-1) (a): -0.04+0.01B**+0.02C**-0.001S**+0.0001E**+0.0004A**-0.02D**+0.34Hd**-0.05Hd
2-0.01Hd3 -94.7 -43.7 58.4
(b): -0.05+0.01B**+0.02C**-0.001S**+0.0001E**+0.0004A**-0.02D**-0.38Hd**-0.08Hd2** -102.0 -55.7 61.0 0.02
(c): -0.05+0.01B**+0.02C**-0.001S**+0.0001E**+0.0004A**-0.02D**-0.38Hd**-0.08Hd2** -103.0 -55.9 61.0 1.00
Recruitment (m2ha-1y-1) (a): 0.09**+0.0004B**+0.001C-0.0004S**+0.000004E-0.0001A-0.004D**-0.05Hs+0.06Hd+0.01Hs
2
-0.09Hd2*+0.01Hs
3 +0.02Hd3** +0.13HsHd**-0.02Hs
2Hd-0.04HsHd2**
-1741 -1653 889.7
(b): 0.10**+0.0005B**-0.0004S**-0.004D**-0.03Hs2*+0.01Hs
3 *+0.12HsHd**-0.04Hs2Hd** -1832 -1781 927.1 < 0.01
(c): 0.10**+0.0005B**-0.0004S**-0.004D**-0.03Hs2*+0.01Hs
3 *+0.12HsHd**-0.04Hs2Hd** -1836 -1794 927.1 1.00
Mortality (m2ha-1y-1) (a): -0.04+0.003B**-0.001C+0.00002S+0.00003E*+0.00002A-0.004D**-0.04Hs-0.003Hd-0.04Hs
2-0.01Hd2
+0.01Hs3+0.01Hd
3 +0.03HsHd +0.03Hs2Hd-0.04HsHd
2 -159.0 -70.7 98.5
(b): -0.04+0.003B**+0.00003E**-0.004D**+0.02Hs+0.01Hd-0.04Hs2-0.02Hd
2+0.003Hs3+0.02Hd
3
+0.05HsHd +0.02Hs2Hd-0.03HsHd
2 -203.0 -128.5 117.5
< 0.01
(c): -0.04+0.003B**+0.00003E**-0.004D**+0.05Hs+0.02Hd-0.09Hs2-0.03Hd
2+0.009Hs3+0.02Hd
3
+0.04HsHd +0.03Hs2Hd-0.04HsHd
2 -204.0 -138.9 116.0
0.23
3 4 5 6 7 8 9
10 11 12
Hs, and Hd = tree-species diversity, and tree-size diversity. Other variables defined in Table 1. *, P<0.05; **, P<0.01 for test of significant difference of parameter value from 0. (a): Model consistent with the results of Table 2, with spatial autocorrelation, (b): Parsimonious version of model (a), with spatial autocorrelation, (c): Model (b), without spatial autocorrelation, AIC: Akaike Information Criterion (smaller is better). BIC: Bayesian Information Criterion (smaller is better). L: Log-likelihood ratio. 1P-value for the test of the increase in L from model (a) to model (b). 2P-value for the test of spatial autocorrelation.
Forest Ecology and Management 243: 116-127 27

doi:10.1016/j.foreco.2007.02.028
Forest Ecology and Management 243: 116-127 28
1 2
Table 6. Independent contribution of tree diversity variables to the goodness-of-fit measured by log likelihood. Model Douglas-fir/western
hemlock type Mixed conifer type
Net basal area growth 0.241 0.27 Survival growth 0.00 0.14 Recruitment 0.76 0.26 Mortality 0.11 0.59 1 A va1ue of 1 indicates that the goodness-of-fit is solely determined by the diversity variables, Hs and Hd. A value of 0 indicates that 3
4 the goodness-of-fit is solely determined by the other variables.

doi:10.1016/j.foreco.2007.02.028
1
2 3 4 5
6
Fig. 1. Geographic distribution of the 1160 FIA plots and location of the study regions in the United States (dark shaded area of the inset at lower right). All the plots were reserved from human interference. In Washington and Oregon (two states to the north), all the plots belonged to Douglas-fir/western hemlock type. In California, all the plots were in mixed conifer type.
Forest Ecology and Management 243: 116-127 29
doi:10.1016/j.foreco.2007.02.028
0
0.5
1
1.5
2
0 2 4 6 8
Distance (105m)
Net g
row
th
0
0.5
1
1.5
2
0 2 4 6 8
Distance (105m)
Net g
row
th0
0.5
1
1.5
2
0 2 4 6 8
Distance (105m)
Surv
ivor gro
wth
0
0.5
1
1.5
2
0 2 4 6
Distance (105m)
Surv
ivor gro
wth
8
0
0.5
1
1.5
2
0 2 4 6 8
Distance (105m)
Recr
uitm
enti
0
0.5
1
1.5
2
0 2 4 6
Distance (105m)
Recr
uitm
ent
8
i
0
0.5
1
1.5
2
0 2 4 6 8
Distance (105m)
Mortalit
y
0
0.5
1
1.5
2
0 2 4 6 8
Distance (105m)
Mortalit
y
Douglas-fir/western hemlock Mixed conifer
1 2 3
Fig. 2. Semivariograms of the standardized residuals from the reduced models predicting net growth, survival growth, recruitment, and mortality.
Forest Ecology and Management 243: 116-127 30

doi:10.1016/j.foreco.2007.02.028
0
0.1
0.2
0.3
0.4
0.5
0.6
0 0.5 1 1.5 2
Net g
row
th
(m2 h
a-1y-1
)A B
0
0.1
0.2
0.3
0.4
0.5
0.6
0 0.5 1 1.5 2
B
Douglas-fir/western hemlock Mixed conifer
0
0.1
0.2
0.3
0.4
0.5
0.6
0 0.5 1 1.5 2
Surv
ivor gro
wth
(m2 h
a-1y-1
)
C B
0
0.1
0.2
0.3
0.4
0.5
0.6
0 0.5 1 1.5 2
D
0
0.1
0.2
0.3
0.4
0.5
0.6
0 0.5 1 1.5 2
Recr
uitm
ent (
m2 ha-1
y-1) E Mixed conifer
0
0.1
0.2
0.3
0.4
0.5
0.6
0 0.5 1 1.5 2
F
0
0.1
0.2
0.3
0.4
0.5
0.6
0 0.5 1 1.5Species Diversity
2
0
0.1
0.2
0.3
0.4
0.5
0.6
0 0.5 1 1.5 2Species Diversity
Mortalit
y (m
2 ha-1
y-1)
G H
1 2 3 4 5
Fig. 3. The expected effects of tree-species diversity (Shannon’s index) on net growth (A and B), survivor growth (C and D), recruitment (E and F), and mortality (G and H). Vertical bars show one standard deviation of the prediction. Species diversity varies within plus or minus two standard deviations around the mean, while other variables are held constant at their mean.
Forest Ecology and Management 243: 116-127 31

doi:10.1016/j.foreco.2007.02.028
Forest Ecology and Management 243: 116-127 32
0
0.1
0.2
0.3
0.4
0.5
0.6
1 1.5 2 2.5 3
Net g
row
th
(m2 h
a-1y-1
)
0
0.1
0.2
0.3
0.4
0.5
0.6
1 1.5 2 2.5 3
Douglas-fir/western hemlock Mixed conifer
A B
0
0.1
0.2
0.3
0.4
0.5
0.6
1 1.5 2 2.5 3
Surv
ivor gro
wth
(m2 h
a-1y-1
)
0
0.1
0.2
0.3
0.4
0.5
0.6
1 1.5 2 2.5 3
D
0
0.1
0.2
0.3
0.4
0.5
0.6
1 1.5 2 2.5 3
0
0.1
0.2
0.3
0.4
0.5
0.6
1 1.5 2 2.5 3
Recr
uitm
ent (
m2 ha-1
y-1) E F
0
0.1
0.2
0.3
0.4
0.5
0.6
1 1.5 2 2.5Size Diversity
3
0
0.1
0.2
0.3
0.4
0.5
0.6
1 1.5 2 2.5 3Size Diversity
Mortalit
y (m2
ha-1
y-1)
G H
C
1 2 3 4 5 6 7
Fig. 4. The expected effects of tree-size diversity (Shannon’s index) on net growth (A and B), survivor growth (C and D), recruitment (E and F), and mortality (G and H). Vertical bars show one standard deviation of the prediction. Size diversity varies within plus or minus two standard deviations around the mean, while other variables are held constant at their mean.