doi 10.1002/bit.25672 article - uliege · the live/dead viability/cytotoxicity kit (invitrogen) was...
TRANSCRIPT

Acc
epte
d A
rtic
le
This article is protected by copyright. All rights reserved
Tissue Engineering and Delivery Systems Biotechnology and Bioengineering DOI 10.1002/bit.25672
A three-dimensional computational fluid dynamics model of shear stress distribution during neotissue growth in a perfusion bioreactor †
Guyot Y1,2, Luyten FP1,3, Schrooten J1,4,Papantoniou I1,3*, Geris L1,2,5*.
1 Prometheus, Division of Skeletal Tissue Engineering, KU Leuven, Onderwijs en Navorsing 1 (+8), Herestraat 49 - PB813, B-3000, Leuven, Belgium. 2 Biomechanics Research Unit, Universite de Liège, Chemin des Chevreuils 1 - BAT 52/3, B-4000 Liège, Belgium
3 Skeletal Biology and Engineering Research Center, KU Leuven, Onderwijs en Navorsing 1 (+8), Herestraat 49 - PB813, B-3000 Leuven, Belgium. 4 Department of Materials Engineering, KU Leuven, Kasteelpark Arenberg 44 – PB 2450, B-3001 Leuven, Belgium 5 Biomechanics Section, KU Leuven, Celestijnenlaan 300C – PB 2419, B-3001 Leuven, Belgium Address for Correspondence: Yann Guyot; Email: [email protected] *these authors share last authorship. †This article has been accepted for publication and undergone full peer review but has not been through the copyediting, typesetting, pagination and proofreading process, which may lead to differences between this version and the Version of Record. Please cite this article as doi: [10.1002/bit.25672] This article is protected by copyright. All rights reserved Received November 23, 2014; Revision Received March 18, 2015; Accepted June 05, 2015

Acc
epte
d A
rtic
le
This article is protected by copyright. All rights reserved
Abstract
Bone tissue engineering strategies use flow through perfusion bioreactors to apply
mechanical stimuli to cells seeded on porous scaffolds. Cells grow on the scaffold surface but
also by bridging the scaffold pores leading a fully filled scaffold following the scaffold’s
geometric characteristics. Current computational fluid dynamic approaches for tissue
engineering bioreactor systems have been mostly carried out for empty scaffolds. The effect
of 3D cell growth and extracellular matrix formation (termed in this study as neotissue
growth), on its surrounding fluid flow field is a challenge yet to be tackled. In this work a
combined approach was followed linking curvature driven cell growth to fluid dynamics
modeling. The level-set method (LSM) was employed to capture neotissue growth driven by
curvature, while the Stokes and Darcy equations, combined in the Brinkman equation,
provided information regarding the distribution of the shear stress profile at the
neotissue/medium interface and within the neotissue itself during growth. The neotissue was
assumed to be micro-porous allowing flow through its structure while at the same time
allowing the simulation of complete scaffold filling without numerical convergence issues.
The results show a significant difference in the amplitude of shear stress for cells located
within the micro-porous neo-tissue or at the neotissue/medium interface, demonstrating the
importance of taking along the neotissue in the calculation of the mechanical stimulation of
cells during culture.The presented computational framework is used on different scaffold pore
geometries demonstrating its potential to be used a design as tool for scaffold architecture
taking into account the growing neotissue. This article is protected by copyright. All rights
reserved
Keywords: bioreactor, scaffold, computational fluid dynamics, tissue growth, level-set
method
Acc
epte
d A
rtic
le
This article is protected by copyright. All rights reserved
Introduction
Perfusion bioreactors have been extensively explored for the production of bone forming
tissue engineered constructs by supporting cell growth, metabolism, and differentiation.
Attempts to culture in vitro three dimensional (3D) tissue engineered (TE) constructs in static
conditions typically resulted in an outer shell of viable cells, while the inner core became
necrotic due to limited diffusive delivery of nutrients (Griffith et al., 2005). Using bioreactors,
cell proliferation and cell survival have been enhanced substantially when compared with
static setups, by improving mass transport of oxygen and nutrients throughout the TE
construct during cell growth (Martin, Wendt et al. 2004). However, fluid flow exerts stresses
on the cultured cells affecting functions such as migration, proliferation and apoptosis
(McCoy and O'Brien 2010). Furthermore shear stress can determine lineage commitment
(Song, Dean et al. 2013) but also promote osteogenic differentiation of bone marrow stromal,
periosteum and adipose derived mesenchymal stem (stromal) cells, and enhance extra-cellular
matrix deposition (McCoy and O'Brien 2010; Rauh, Milan et al. 2011; Papantoniou, Chai et
al. 2013).
In order to understand and characterize complex flow fields which are developed throughout
regular and irregular scaffolds during cell culture in bioreactors, computational fluid
dynamics (CFD) modeling has been extensively used in tissue engineering (for review see
(Hutmacher and Singh 2008)). The quantification of flow-associated shear stresses as well as
their spatial distribution within various 3D scaffold geometries has been thoroughly
investigated in perfused bioreactor setups (Raimondi, Boschetti et al. 2004; Porter, Zauel et al.
2005; Boschetti, Raimondi et al. 2006; Cioffi, Boschetti et al. 2006; Jungreuthmayer,
Donahue et al. 2009; Maes, Ransbeeck et al. 2009; Voronov, VanGordon et al. 2010). In
previous studies, local shear stresses were defined as a function of flow rate of the culture
medium, bioreactor configuration, porosity and porous scaffold micro-architecture (Voronov,
Acc
epte
d A
rtic
le
This article is protected by copyright. All rights reserved
VanGordon et al. 2010; Pham, Voronov et al. 2012). However the majority CFD studies to
date used empty scaffold geometries to calculate shear stress magnitude and distribution
across the empty scaffold surface i.e. wall shear stress. They did not take into account the
dynamics of the changing 3D environment as a result of cell/tissue growth. Efforts to mimic
3D cell growth on regular scaffolds were limited to a swelling of the scaffold struts (Lesman,
Blinder et al. 2010) or the use of a growing biomass (Nava, Raimondi et al. 2013), in both
cases modeling the cell layer to be impermeable whilst not being able to reach a full filling of
the scaffold void.
3D cell growth and neotissue formation starts with 2D cell migration and proliferation on the
strut surface, followed by cells bridging the scaffold void spaces and growing in the third
dimension with matrix deposition. This will eventually lead to complete scaffold void filling
as evidenced recently via synchrotron and nano-CT imaging (Voronov, VanGordon et al.
2013; Papantoniou, Sonnaert et al. 2014). This means that estimation of wall shear stress
values in empty scaffold geometries would only be indicative of the shear stress experienced
by cells during early culture time points. A current bottleneck to further advance and utilize
CFD strategies in the TE field is the inclusion of a domain composed of cells and extracellular
matrix (a growing permeable neotissue) on real scaffold geometries as recently stated
(Hendrikson, van Blitterswijk et al. 2014). This way the whole range of fluid-flow associated
stresses exerted on cells during neotissue growth could be determined.
In this paper we present a computational strategy that will help understand shear stress
magnitude and distribution along the fluid-neotissue interface but also within the permeable
3D neotissue during growth in a perfusion bioreactor. To achieve this, the level-set method
(LSM) was employed capturing neotissue growth on 3D macro-porous Titanium scaffolds
over time leading to complete scaffold pore closure (filling). Computational neotissue growth
was driven by the local curvature as previously described (Bidan, Wang et al. 2013; Guyot,

Acc
epte
d A
rtic
le
This article is protected by copyright. All rights reserved
Papantoniou et al. 2014). At various degrees of scaffold filling, the steady Brinkman equation
was used to continuously describe both flow through a micro-porous medium (neotissue) and
free flow through the macro-porous scaffold void. This shear stress mapping will allow to
eventually link experimentally determined biological responses (i.e. cell phenotype) to the
actual shear stress regime that cells experience during 3D neotissue growth in perfusion
bioreactors.
Materials and Methods
2.1. Ti6Al4V scaffolds
Regular, 3D additive manufactured Ti6Al4V scaffolds (diameter 6 mm, height 6mm) were
produced in-house using selective laser melting, based on a diamond-shaped unit cell (Pyka,
Burakowski et al. 2012) (Figure 1B) and a square unit cell (Van Bael et al. 2012) (Figure 1C).
Strut diameter for both scaffolds was 200 µm. Prior to use, the scaffolds were ultrasonically
cleansed for 10 min over three wash steps in acetone, ethanol and distilled water.
Subsequently they received an alkali treatment with 5M sodium hydroxide (Sigma-Aldrich) at
60°C for 24 h, rinsed with distilled water and finally sterilized in a steam autoclave. Prior to
cell seeding, all scaffolds were prewetted by vacuum impregnation in cell culture medium for
2 h in a humidified incubator.
2.2 Human periost-derived cells (hPDCs)
hPDCs were isolated from periosteal biopsies of different donors, as described previously
(Eyckmans and Luyten 2006). This procedure was approved by the Ethics Committee for
Human Medical Research (KU Leuven) and by the patients’ informed consent. hPDCs were
expanded in Dulbecco’s modified Eagle’s medium (DMEM) with high glucose (Invitrogen),

Acc
epte
d A
rtic
le
This article is protected by copyright. All rights reserved
containing 10% fetal bovine serum (FBS; Gibco), 1% sodium pyruvate (Invitrogen) and 1%
antibiotic–antimycotic (100 units/ml penicillin, 100 mg/ ml streptomycin and 0.25mg/ml
amphotericin B; Invitrogen).
2.3 Scaffold seeding
The cells were seeded at 5700 cells/cm2 and passaged at 80–90% confluence. Prior to the 3D
culture experiments, cells were harvested using Triple Express (Invitrogen) and drop-seeded
by a single drop onto the scaffolds at a density of 200 000 cells/60 µl drop, as performed in
earlier studies (Papantoniou, Chai et al. 2013). 45 min after seeding, 60 µl culture medium
was added and 135 min later the medium volume was topped up to 1 ml. Seeded scaffolds
were incubated overnight under standard culture conditions (37°C, 5% CO2,95% relative
humidity) before being positioned in the perfusion chamber.
2.4 Bioreactor culture
Seeded scaffolds were cultured in the perfusion bioreactors for up to 21 days. The perfusion
chamber was 26 mm long with a diameter of 6 mm, holding a single scaffold. This chamber
was connected to an individual medium reservoir (disposable 50 mL Falcon tubes, BD
Biosciences) containing 10 mL of cell culture medium via a Tygon1 (Cole Parmer, Antwerp,
Belgium) tubing and a two-stop tubing (BPT, Cole Parmer) connected to a peristaltic pump
(IPC-24, Ismatec, SA). Culture medium was refreshed every 2 days for the entire culture
period. All seeded scaffolds were positioned 10mm from the inlet of the perfusion chamber so
that a steady state flow profile was reached as shown in (Papantoniou, Guyot et al. 2014).

Acc
epte
d A
rtic
le
This article is protected by copyright. All rights reserved
2.5 SEM imaging
The micro-porosity of the neotissue between cells and extracellular matrix was approximated
by scanning electron microscopy (SEM) coupled with energy-dispersive X-ray (EDAX)
analysis (FEI XL30 FEG) at 10 kV. Briefly, the cultures were rinsed twice with PBS, fixed
with 2.5% glutaraldehyde (in PBS) for 1 h, and postfixed in 1% osmium tetroxide for 2 h
before dehydrated in 50%, 75%, 95%, and 100% ethanol solutions. Finally, the samples were
chemically dried with hexamethyldisilazane for 3 min and goldsputtered before SEM
analysis.
2.6. Live/Dead Assay
The live/dead viability/cytotoxicity kit (Invitrogen) was employed to evaluate qualitatively
cell viability and cell distribution and growth by fluorescence microscopy. Constructs were
rinsed with 1 mL PBS after which they were incubated in the staining solution (0.5 ml Calcein
AM and 2 ml Ethidium Homodimer in 1 mL PBS) for 20 min in normal cell culture
conditions. The constructs were imaged using a Leica M165 FC microscope.
2.7 Computational Framework
Neotissue growth with Level-set method (LMS): The evolution of the neotissue topology
occurring during the growth process was numerically treated with the LSM which has been
developed to deal with moving interfaces. This technique has been used here for its ability to
track the front-line between neotissue and void space in a mesh-free manner. In this study, the
simulated moving interface Γ represents the border between the neotissue domain and the
void domain . The principle of LSM is based on a continuous distance function defined
on the whole domain with the following properties:

Acc
epte
d A
rtic
le
This article is protected by copyright. All rights reserved
(1)
To simulate the evolution of the system, the time dependent advection equation (2) is solved
with a given velocity .
(2)
Neotissue growth kinetics are curvature-dependent meaning that neotissue grows faster where
the curvature is higher and also that it does not grow if the curvature is negative or equal to
zero. To tackle this, the advecting velocity of equation (2) has the following expression:
(3)
with representing the normal at the interface pointing towards the neotissue, and
representing the mean curvature. Growth simulations were run thanks to the model
developed in a previous study (Guyot et al. 2014) providing several neotissue topologies.
From these results, geometries corresponding to 10% to 90% of scaffold pore filling were
taken as starting points for the flow simulations (see below).
Fluid flow model: Neotissue growth leads to changes in morphology affecting the fluid
behavior over time. Two fluid flow regimes can be distinguished one within the void but also
in the neotissue. In the void part, due to a low Reynolds number, the flow profile can be
estimated with Stokes equation (4).

Acc
epte
d A
rtic
le
This article is protected by copyright. All rights reserved
(4)
Due to the presence of cells and extracellular matrix in the neotissue part (see Figure 2), the
flow profile in this region cannot be estimated with a simple Stokes equation. To address this
we consider this region as a porous medium with a given permeability and so the flow
profile will be governed by the Darcy equation (5).
(5)
In (4) and (5), µ represents the viscosity, u the fluid velocity and p the pressure. Due to the
LSM definition of the neotissue topology, the interface would not conform with the fluid
computational mesh, and so equations (4) and (5) could be difficult to couple together. One
solution to this problem is to model the flow with a penalization technique and the Brinkman
equation (6).
(6)
This technique is based on a penalization of the term K in the neotissue domain. For that
purpose, a smooth space and time dependent Heaviside function H was calculated with the
following equation:
(7)

Acc
epte
d A
rtic
le
This article is protected by copyright. All rights reserved
It should be noted that equation 6 does not take into account time, this corresponds to the fact
that the flow is calculated only on given neotissue geometries in order to estimate the
mechanical stimuli at that degree of scaffold filling.
The parameter was taken to be equal to 1.5*h, with h the mesh size. K is then updated
according to the following equation:
The permeability of the neotissue was calculated using a random fibers approximation to
simulate the random unstructured cell and extracellular matrix structure. To tackle this issue,
was estimated according to (Nabovati 2009), based on a method to approximate the
permeability of a random fibers web, resulting in the following expression for :
In this equation, represents the micro-porosity of the neotissue. According to Nabovati et al
(2009) is called the “percolation threshold”, and it corresponds to a threshold porosity
where fluid flow is permitted through the micro-porous medium. We assumed that such a
threshold did not exist, so was set to zero. An important parameter is , which corresponds
to the average size of the micro-porosity of the neotissue. Two values for , 25 and 50 µm

Acc
epte
d A
rtic
le
This article is protected by copyright. All rights reserved
were used based on experimental SEM observations, accounting for the fact that the micro-
porosity could be affected by the culture environment.
Finally, a poiseuille flow corresponding to the average inlet velocity was applied as a dirichlet
boundary condition at the entrance of the domain. Symmetry boundary conditions (u.n=0)
were applied on each lateral side and a free flow condition at the exit of the domain.
Shear stress estimation: Wall shear stress ( ) at the interface between neotissue and
void was calculated by:
where
In addition the shear stress associated with the interstitial flow through the micro-porous
neotissue ( ) was calculated based on the method presented in (Whittaker, Booth et al.
2009). The interstitial velocity magnitude was calculated, assuming that the
micro-porous neotissue is composed of cylindrical ducts of diameter . Hence, the flow
profile in each duct can be seen as a Poiseuille flow with a local radial coordinate r, and the
following velocity profile:
.
The inner neotissue shear stress would be:
.

Acc
epte
d A
rtic
le
This article is protected by copyright. All rights reserved
Implementation details: The full implementation of the model presented above has been
carried out with Freefem++ (http://freefem.org) (Hecht 2012). For each geometry (diamond
and square), the curvature-driven growth model (Guyot et al, 2014) was run on a mesh made
of approximatively 1 million tetrahedrons, corresponding to an average element size of 1e-5
m. From these simulations, neotissue topologies corresponding to 10,20,..,90% of scaffold
filling were calculated and used as input for the fluid model using the Brinkman equation. The
Brinkman equation was solved using the parallelization method of domain decomposition,
where the problem is distributed over and solved on 12 cores.
Results & Discussion
Live/dead images in Figure 2 show typical 3D cell growth and neotissue formation over time
during culture in a perfusion bioreactor for two different scaffold designs with square and
diamond pore shapes. In both cases the initial scaffold void was substituted gradually by
neotissue. Cells seeded on 3D scaffolds have been seen to be able to bridge across pores of 70
µm entering a 3D growth phase followed by neotissue formation in static conditions (Joly,
Duda et al. 2013). In previous studies we have also observed this behavior for bioreactor
based cell cultures in scaffolds of larger pores (~750 µm) (Papantoniou, Guyot et al. 2014;
Papantoniou, Sonnaert et al. 2014). The growing neotissue is a permeable micro-porous
structure as can be observed in the SEM image (Figure2). Neotissue growth will subsequently
influence the fluid flow profile in the remaining scaffold void space but also the fluid flow
derived shear stress distribution and magnitude within the neotissue itself. The flow rate used
in this study was 1 ml/min, for which the cells used in this study have been observed to be
able to grow up to 100% scaffold filling in a similar bioreactor set-up (Sonnaert, Papantoniou
et al. 2014). In this study, 100% scaffold filling was indeed reached for both pore shapes as

Acc
epte
d A
rtic
le
This article is protected by copyright. All rights reserved
shown in Figure2. Their growth under a constant flow rate meant that cells experienced a
cascade of increasing shear stresses until complete filling was reached. Two fluid flow
regimes could be distinguished, one for free fluid flow and one within the micro-porous
neotissue itself. Hence a dynamic multiphase approach was best suited to capture the
aforementioned events.
Starting from two different scaffold designs, cell growth was simulated following a curvature
dependent growth mechanism (Bidan, Kommareddy et al. 2012; Bidan, Wang et al. 2013;
Guyot, Papantoniou et al. 2014). Once coupled with fluid flow equations, computer
simulations were run to study shear stress magnitude and distribution over time. The average
inlet velocity used at the entrance of a single scaffold pore was (0.0012 m/s) and
corresponded to a 1 ml/min perfusion flow rate for the geometric features of the bioreactor.
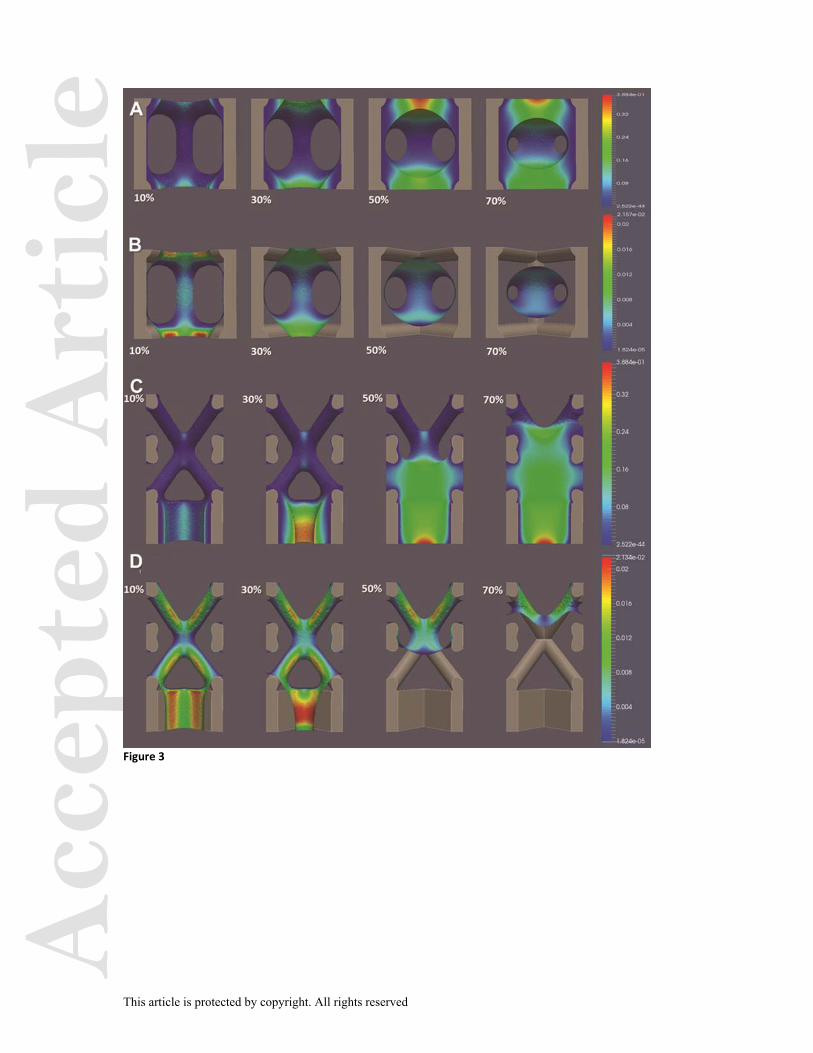
Figure 3 shows the gradual closure and the development of the correspondingly changing
flow profiles for the two different scaffold designs. Shear stress values were determined both
at the interface of the neotissue with the free flow domain and also within the neotissue itself.
For the square design, the average interface shear stress values evolved from 0.0034 to 0.005
Pa while for the diamond design the average interface shear stress values evolved from 0.004
to 0.008 Pa during the filling of the scaffold macro-pores. Interface shear stress values
reported here ranged from being comparable (for i.e. 10% filling) to two orders of magnitude
higher (for i.e. 60% filling upwards) compared to the ones calculated for empty scaffold
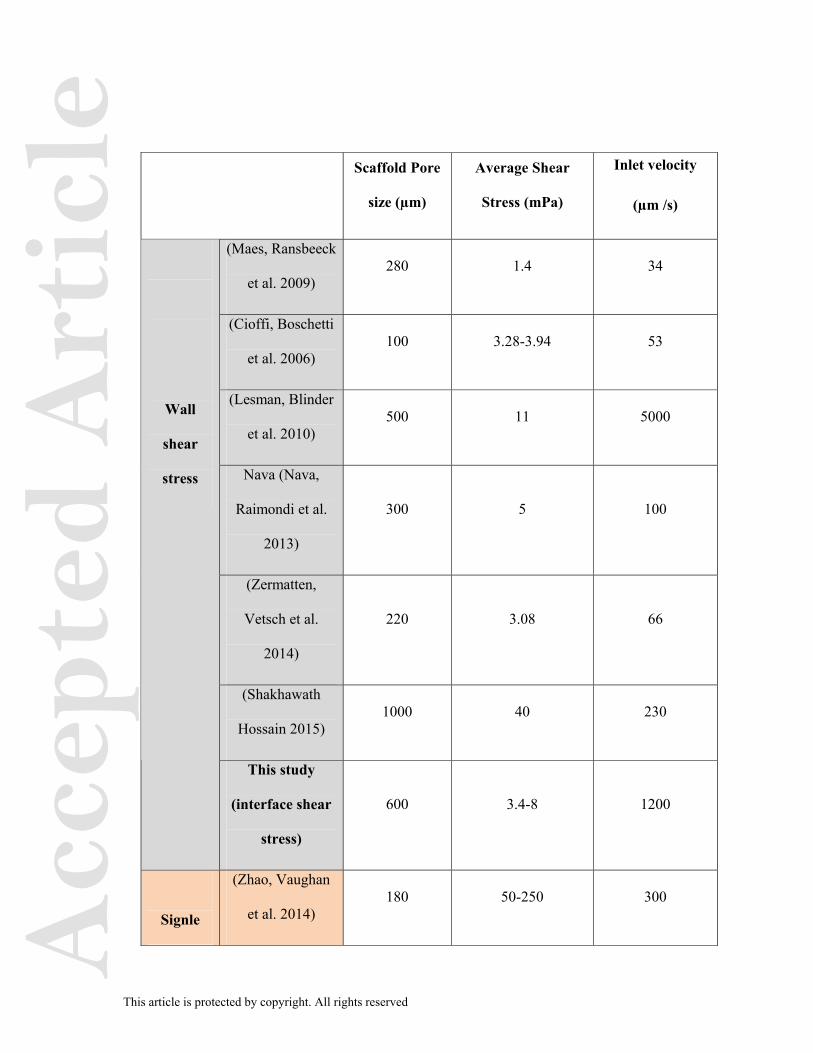
geometries in CFD modeling studies to date, as seen in Table 1. The average shear stresses
developed within the growing neotissue were higher as expected, evolving from 0.04 to 0.28
Pa in the diamond pore shape scaffold and from 0.03 to 0.18 Pa in the square pore shape
scaffold during the filling of the scaffold macro-pores. Additionally, the absolute values of
the shear stresses were dependent on the micro-porosity of the neotissue domain (Figure 4).

Acc
epte
d A
rtic
le
This article is protected by copyright. All rights reserved
Figure 5 shows the shear stress distribution within the neotissue for different degrees of
scaffold filling. Following this distribution for different degrees of scaffold filling (different
colors), it demonstrates the shift from lower towards higher shear stress values within the
neotissue due to the scaffold filling. The geometric homogeneity of the square pore scaffold
was reflected on the shear stress distribution inside the neotissue which was narrower for the
square pore scaffolds than for the diamond pore scaffolds. Furthermore it should be noted that
average inner shear stress values calculated here, especially in conditions with high degrees of
scaffold filling, were closer to calculated values experienced by cells in the in vivo setting,
reported to range from 0.8 Pa onwards (Weinbaum, Cowin et al. 1994) or, as calculated more
recently, from 0.1-10 Pa experienced by osteocytes due to fluid flow via canaliculi
(Verbruggen, Vaughan et al. 2014). Interestingly, these shear stress levels also closely
compared with recent work focusing on shear stresses experienced by single cells bridging
across scaffold pore struts (Jungreuthmayer, Jaasma et al. 2009; Zhao, Vaughan et al. 2014).
In this study a number of simplifications were made that warrant further investigation in
future work. First and foremost it will be necessary to couple the shear stress experienced by
the cells (and calculated in this study) to the neotissue growth rate. Various studies have
shown the influence of mechanical stimuli on the behavior of cells (McCoy and O'Brien 2010;
Rauh, Milan et al. 2011; Papantoniou, Chai et al. 2013 to but name a few of them). Adding a
more detailed description of the neotissue constituents (cells and extracellular matrix (ECM))
and/or additional variables such as oxygen and glucose will allow to capture additional
biological behavior observed in bioreactor experiments. These observations include the
decrease in neotissue micro-porosity due to ECM production, the cellular lineage commitment
and the oxygen consumption during culture.

Acc
epte
d A
rtic
le
This article is protected by copyright. All rights reserved
Conclusion
In conclusion, this framework provides insight into the dynamic microenvironment to which
cells are exposed in TE perfusion bioreactors. The development of such a model generates an
additional level of control by allowing operators to deliver controlled shear stress magnitudes
to cells during growth, e.g. by adapting flow rates during neotissue growth in order to
maintain fixed shear stress magnitudes and profiles causing minimal culture environment
variation. Moreover this model could be used for an in silico evaluation and screening of
scaffold designs, including their impact on neotissue growth and exposure to stress profiles,
avoiding costly and time consuming in vitro experiments.
Acknowledgments
YG is funded by Belgian National Fund for Scientific Research (FNRS) grant FRFC
2.4564.12. IP is funded by the European Research Council under the European Union's
Seventh Framework Programme (FP/2007-2013) / ERC Grant Agreement n. 294191. The
research leading to these results has received funding from the European Research Council
under the European Union's Seventh Framework Programme (FP/2007-2013) / ERC Grant
Agreement n. 279100 and the FWO-ENDEAVOUR project. This work is part of Prometheus,
the Leuven Research & Development Division of Skeletal Tissue Engineering of the KU
Leuven: www.kuleuven.be/prometheus.
Acc
epte
d A
rtic
le
This article is protected by copyright. All rights reserved
References
Bidan, C. M., F. M. Wang, et al. (2013). "A three-dimensional model for tissue deposition on complex surfaces." Comput Methods Biomech Biomed Engin.
Boschetti, F., M. T. Raimondi, et al. (2006). "Prediction of the micro-fluid dynamic environment imposed to three-dimensional engineered cell systems in bioreactors." Journal of Biomechanics 39(3): 418-425.
Cioffi, M., F. Boschetti, et al. (2006). "Modeling evaluation of the fluid-dynamic microenvironment in tissue-engineered constructs: A micro-CT based model." Biotechnology and Bioengineering 93(3): 500-510.
Eyckmans, J. and F. P. Luyten (2006). "Species specificity of ectopic bone formation using periosteum-derived mesenchymal progenitor cells." Tissue Eng 12(8): 2203-2213.
Guyot, Y., I. Papantoniou, et al. (2014). "A computational model for cell/ECM growth on 3D surfaces using the level set method: a bone tissue engineering case study." Biomech Model Mechanobiol.
Hecht F (2012) New development in freefem++. J Numer Math 20(4):251–265. doi:10.1515/jnum-2012-0013
Hendrikson, W. J., C. A. van Blitterswijk, et al. (2014). "Modeling mechanical signals on the surface of microCT and CAD based rapid prototype scaffold models to predict (early stage) tissue development." Biotechnol Bioeng 111(9): 1864-1875.
Hutmacher, D. W. and H. Singh (2008). "Computational fluid dynamics for improved bioreactor design and 3D culture." Trends Biotechnol 26(4): 166-172.
Joly, P., G. N. Duda, et al. (2013). "Geometry-driven cell organization determines tissue growths in scaffold pores: consequences for fibronectin organization." PLoS One 8(9): e73545.
Jungreuthmayer, C., S. W. Donahue, et al. (2009). "A Comparative Study of Shear Stresses in Collagen-Glycosaminoglycan and Calcium Phosphate Scaffolds in Bone Tissue-Engineering Bioreactors." Tissue Engineering Part A 15(5): 1141-1149.
Jungreuthmayer, C., M. J. Jaasma, et al. (2009). "Deformation simulation of cells seeded on a collagen-GAG scaffold in a flow perfusion bioreactor using a sequential 3D CFD-elastostatics model." Med Eng Phys 31(4): 420-427.
Lesman, A., Y. Blinder, et al. (2010). "Modeling of flow-induced shear stress applied on 3D cellular scaffolds: Implications for vascular tissue engineering." Biotechnol Bioeng 105(3): 645-654.
Maes, F., P. Ransbeeck, et al. (2009). "Modeling Fluid Flow Through Irregular Scaffolds for Perfusion Bioreactors." Biotechnology and Bioengineering 103(3): 621-630.
Martin, I., D. Wendt, et al. (2004). "The role of bioreactors in tissue engineering." Trends Biotechnol 22(2): 80-86.

Acc
epte
d A
rtic
le
This article is protected by copyright. All rights reserved
McCoy, R. J. and F. J. O'Brien (2010). "Influence of Shear Stress in Perfusion Bioreactor Cultures for the Development of Three-Dimensional Bone Tissue Constructs: A Review." Tissue Engineering Part B-Reviews 16(6): 587-601.
Nabovati, A., Llewellin, E.W, Sousa, A.C.M. (2009). "A general model for the permeability of fibrous porous media based on fluid flow simulations using the lattice Boltzmann method." Composites: Part A 40: 860-869.
Nava, M. M., M. T. Raimondi, et al. (2013). "A multiphysics 3D model of tissue growth under interstitial perfusion in a tissue-engineering bioreactor." Biomech Model Mechanobiol 12(6): 1169-1179.
Papantoniou, I., Y. C. Chai, et al. (2013). "Process Quality Engineering for Bioreactor-Driven Manufacturing of Tissue-Engineered Constructs for Bone Regeneration." Tissue Engineering Part C-Methods 19(8): 596-609.
Papantoniou, I., Y. Guyot, et al. (2014). "Spatial optimization in perfusion bioreactors improves bone tissue-engineered construct quality attributes." Biotechnol Bioeng.
Papantoniou, I., M. Sonnaert, et al. (2014). "Three-dimensional characterization of tissue-engineered constructs by contrast-enhanced nanofocus computed tomography." Tissue Eng Part C Methods 20(3): 177-187.
Papantoniou, I. I., Y. C. Chai, et al. (2013). "Process Quality Engineering for Bioreactor-Driven Manufacturing of Tissue-Engineered Constructs for Bone Regeneration." Tissue Eng Part C Methods.
Pham, N. H., R. S. Voronov, et al. (2012). "Predicting the stress distribution within scaffolds with ordered architecture." Biorheology 49(4): 235-247.
Porter, B., R. Zauel, et al. (2005). "3-D computational modeling of media flow through scaffolds in a perfusion bioreactor." Journal of Biomechanics 38(3): 543-549.
Pyka, G., A. Burakowski, et al. (2012). "Surface Modification of Ti6Al4V Open Porous Structures Produced by Additive Manufacturing." Advanced Engineering Materials 14(6): 363-370.
Raimondi, M. T., F. Boschetti, et al. (2004). "The effect of media perfusion on three-dimensional cultures of human chondrocytes: Integration of experimental and computational approaches." Biorheology 41(3-4): 401-410.
Rauh, J., F. Milan, et al. (2011). "Bioreactor systems for bone tissue engineering." Tissue Eng Part B Rev 17(4): 263-280.
Song, M. J., D. Dean, et al. (2013). "Mechanical modulation of nascent stem cell lineage commitment in tissue engineering scaffolds." Biomaterials 34(23): 5766-5775.
Sonnaert, M., I. Papantoniou, et al. (2014). "Human periosteal-derived cell expansion in a perfusion bioreactor system: proliferation, differentiation and extracellular matrix formation." J Tissue Eng Regen Med.
Van Bael S, Chai YC, Truscello S, Moesen M, Kerckhofs G, Van Oosterwyck H, Kruth JP, Schrooten J (2012) The effect of pore geometry on the in vitro biological behavior of

Acc
epte
d A
rtic
le
This article is protected by copyright. All rights reserved
human periosteum-derived cells seeded on selective laser-melted Ti6Al4V bone scaffolds. Acta Bio mater 8(7):2824–2834. doi:10.1016/j.actbio.2012.04.001
Verbruggen, S. W., T. J. Vaughan, et al. (2014). "Fluid flow in the osteocyte mechanical environment: a fluid-structure interaction approach." Biomech Model Mechanobiol 13(1): 85-97.
Voronov, R., S. VanGordon, et al. (2010). "Computational modeling of flow-induced shear stresses within 3D salt-leached porous scaffolds imaged via micro-CT." Journal of Biomechanics 43(7): 1279-1286.
Voronov, R. S., S. B. VanGordon, et al. (2013). "3D Tissue-Engineered Construct Analysis via Conventional High-Resolution Microcomputed Tomography Without X-Ray Contrast." Tissue Engineering Part C-Methods 19(5): 327-335.
Weinbaum, S., S. C. Cowin, et al. (1994). "A model for the excitation of osteocytes by mechanical loading-induced bone fluid shear stresses." Journal of Biomechanics 27(3): 339-360.
Whittaker, R. J., R. Booth, et al. (2009). "Mathematical modelling of fibre-enhanced perfusion inside a tissue-engineering bioreactor." J Theor Biol 256(4): 533-546.
Zhao, F., T. J. Vaughan, et al. (2014). "Multiscale fluid-structure interaction modelling to determine the mechanical stimulation of bone cells in a tissue engineered scaffold." Biomech Model Mechanobiol.
Acc
epte
d A
rtic
le
This article is protected by copyright. All rights reserved
Scaffold Pore
size (µm)
Average Shear
Stress (mPa)
Inlet velocity
(µm /s)
(Maes, Ransbeeck
et al. 2009) 280 1.4 34
(Cioffi, Boschetti
et al. 2006) 100 3.28-3.94 53
(Lesman, Blinder
et al. 2010) 500 11 5000
Nava (Nava,
Raimondi et al.
2013)
300 5 100
(Zermatten,
Vetsch et al.
2014)
220 3.08 66
(Shakhawath
Hossain 2015) 1000 40 230
Wall
shear
stress
This study
(interface shear
stress)
600 3.4-8 1200
Signle
(Zhao, Vaughan
et al. 2014) 180 50-250 300

Acc
epte
d A
rtic
le
This article is protected by copyright. All rights reserved
(Jungreuthmayer,
Jaasma et al.
2009)
96 30 235
cells /
µ-
porosity /
inner
shear
stress
This study
600 10-250 1200
Table 1:A comparison between empty scaffold shear stress values calculated in literature and
interface shear stress values obtained in this study. In the second group the inner shear
stresses obtained for the neotissue part were compared to literature shear stress values for
bridging single cell models,please note that shear stress units are in mPa.All shear stress
presented have been obtained for flow-through perfusion bioreactors.
Acc
epte
d A
rtic
le
This article is protected by copyright. All rights reserved
Figure 1: (A) Image indicating the the perfusion rig dimensions (Drig=6mm, Lrig=26mm) and
scaffold position which was Lentr=10 mm from the entrance of the rig. Both scaffolds had the
same external dimensions Dscaf=6mm and Lscaf=6mm, also the same strut thickness was used
for both pore designs were Dstrut=200µm. (B) Diamond scaffold pore size was 750 µm from
the center of one strut to the other as shown by the dashed arrows. (C) Square pore scaffold
pore size was 650 µm.
Figure 2: Live/dead staining indicating three dimensional neotissue growth during culture
over a culture period of 21 days in perfusion bioreactors in two different scaffolds designs:
(A) diamond and (b) square. In both cases neotissue eventually fills the scaffold void by day
21, (scale bar = 800 µm). SEM shows the micro-porosity of the growing neotissue
(representative image).
Figure 3: (A,C) Inner and (B,D) interface shear stress magnitude and distribution during
neotissue growth and gradual filling of the void in scaffolds with (A,B) square and (C,D)
diamond pore shape. Neotissue micro-porosity used for this simulation was 50µm.
Figure 4: Average inner (blue bars) and interface (red bars) shear stress values for both
scaffold geometries and neotissue micro-porosities investigated in this study for a range of
neotissue scaffold void filling percentages.
Figure 5: Shear stress distribution within the neotissue during growth. Different colors
represent the filling percentage of the scaffold void during neotissue growth, ranging from
10% to 90% as indicated in the figure.

Acc
epte
d A
rtic
le
This article is protected by copyright. All rights reserved
Figure 1

Acc
epte
d A
rtic
le
This article is protected by copyright. All rights reserved
Figure 2
Acc
epte
d A
rtic
le
This article is protected by copyright. All rights reserved
Figure 3

Acc
epte
d A
rtic
le
This article is protected by copyright. All rights reserved
Figure 4

Acc
epte
d A
rtic
le
This article is protected by copyright. All rights reserved
Figure 5