does the release of davis-bacon certified payrolls … · does the release of davis-bacon certified...
TRANSCRIPT

Does the Release of Davis-Bacon Certified Payrolls
Cause Competitive Harm to Contractors?
Submitted to Torres Law Group
2239 W. Baseline Road
Tempe, AZ 85283
Kevin Duncan, Ph. D.
Senior Economist,
BCG Economics, LLC
Professor of Economics
Colorado State University-Pueblo
Jeffrey Waddoups, Ph. D.
Senior Economist,
Economic Consulting of Nevada, LLC
Professor of Economics
University of Nevada, Las Vegas
August 31, 2014.

About the Authors
Kevin Duncan, Ph.D. Kevin Duncan is Professor of Economics, Hasan School of Business, Colorado State University-Pueblo
where he specializes in labor and regional economics. He received his
Ph.D. from the University of Utah in 1987 and his B.A. from the University
of California, Riverside in 1981. Duncan is the author of over 60 academic
papers and applied regional projects and is the winner of several honors and
awards including the Provost’s Award for Excellence in Teaching, the
Provost’s Award for Excellence in Scholarship, the Outstanding Faculty
Member Award for the Hasan School of Business, the Enterprise Rent-A-
Car Student Choice Award for Excellence in Teaching, the Dean’s Advisory
Council Award for Outstanding Faculty Member, as well as the Dean’s Award for Excellence in
Teaching. He is a nationally recognized expert on prevailing wage laws. His research on this topic has
appeared in leading national and international journals such as Industrial and Labor Relations Review
(forthcoming), Construction Management and Economics, and Industrial Relations (forthcoming). He
has provided expert testimony to the Colorado, Hawaii, and Vermont state legislatures on policy related
to construction labor markets. His research was referenced by the California Senate President pro Tem
(Darrel Steinberg) in support of SB7 (2013) that extends the payment of prevailing wages on public
works to charter cities. He has also provided data and analysis to the Legislative Auditors Office during
the review of Minnesota’s prevailing wage law. He is also a nationally recognized expert on economic
impact analysis and has authored numerous studies that examine the impact of the California
pharmaceutical industry, America’s Cup Races in San Diego, Colorado State Fair, CSU-Pueblo, project
labor and local hire agreements (in California, Colorado, and Hawaii), the installation and operation of
wind energy towers, the nonprofit sector, Amtrak’s Southwest Chief, as well as the impact of the
proposed Colorado Amendment 61. He has served on the Advisory Board for Economic Impact Analysis
of the Colorado Nonprofit Association. He teaches regional economics where his students learn
economic impact analysis.
Jeff Waddoups, Ph.D. Jeff Waddoups received a B.A. degree in 1984 and a Ph.D. degree in 1989 from the University of Utah
in Economics with specializations in labor economics and industrial relations. In
1989 he joined the Department of Economics at the University of Nevada, Las
Vegas where he has developed and taught courses at the graduate and
undergraduate levels in labor economics, research methods, labor law, statistics,
health economics, the economics of discrimination, and macroeconomics. He
has also held adjunct faculty positions at Penn State’s Human Resource and
Employment Relations masters’ program, at Griffith University’s Department of
Management, and at the Helsinki School of Economics Bachelor of Business
Administration Program. He is the author or co-author of 45 academic articles,
and is an internationally and nationally recognized scholar with publications in
some of the top journals in labor economics and industrial relations including in such journals as
Industrial & Labor Relations Review, Industrial Relations, and the British Journal of Industrial
Relations. Waddoups has developed a number of areas of research expertise over his career. Most
recently he has focused on the impact of responsible contracting policies on construction costs. He has
also examined the extent to which low-wage employers are subsidized through uncompensated health
care at public hospitals, the impact of collective bargaining on wages and other outcomes in the hotel-
casino industry, and the impact of unions and collective bargaining on the incidence of job training both
in Australia and the U.S. He currently directs the graduate program for the Department of Economics at
the University of Nevada, Las Vegas.
1
Table of Contents
Introduction/Executive Summary ................................................................................................... 4
Section 1. Construction Worker Labor Costs as a Percent of Total Construction Costs. ............ 10
Introduction ............................................................................................................................... 10
Labor Costs as a Percent of Total Construction Costs for Specialty Trade Contractors Related
to Certified Payroll Requests made by TCLG. ......................................................................... 15
Labor Cost Estimate for Solana Solar Generation Station, Arizona: Insulation Contractors .. 16
Labor Cost Estimate for Energy Systems Integration Facility Project, Colorado: Plumbing,
Heating and Air Conditioning and Electrical Contractors ........................................................ 19
Labor Cost Estimate for Hanford Tank Waste Treatment and Immobilization Plant,
Washington: Plumbing, Heating and Air Conditioning Contractors ....................................... 21
Conclusion of Labor Cost Section ............................................................................................ 22
Section 2: Certified Payrolls, Competitive Harm, and Trade Secrets.......................................... 23
Introduction ............................................................................................................................... 23
Deriving Labor Costs from Certified Payrolls .......................................................................... 25
Change Orders and Certified Payrolls ....................................................................................... 27
Off-Site Work and Certified Payrolls........................................................................................ 30
Labor Estimating Manuals, Bid Preparation, and Labor Costs ................................................. 31
Labor Costs and Total Construction Costs ................................................................................ 32
Differences in Construction Worker Productivity .................................................................... 33
Project Backlogs, Equipment Rentals, and Other Factors Affecting Bids ................................ 39
Incomplete and Inconsistent Labor Cost Data Reported in Certified Payrolls ......................... 42
Trade Secrets and Crew Mix ..................................................................................................... 45
Calculating Labor Costs Based on Incomplete Certified Payrolls ............................................ 50
Conclusion ................................................................................................................................. 51
Section 3: Uneven Reporting of Certified Payrolls ..................................................................... 52
Comparison of the Level of Redaction in Certified Payroll Releases for Selected Federal
Agencies .................................................................................................................................... 52
Section 4: The Availability of Certified Payrolls through FOIA often Results in Workers being
Paid Back Wages .......................................................................................................................... 54
Case 1: Faith Technologies, Inc. ............................................................................................... 54
Case 2: Faith Technologies, Bergelectric Corp., and International Electric, Inc. ..................... 55

2
Case 3: THECO, a division of Tom Hagen Enterprises ............................................................ 56
Case 4: Wilson Electric Services Corporation .......................................................................... 57
Section 5: Low-Bid Contracting is becoming Increasingly Rare in Construction Procurement .. 57
Section 6: Publicly Available Bid Results from State Departments of Transportation. .............. 59
Section 7: The Davis-Bacon Act, Prevailing Wage Policies, and Construction Costs ................. 64
Introduction ............................................................................................................................... 64
First Generation Studies ............................................................................................................ 65
Second Generation Studies: Cost Estimates using Regression Analysis .................................. 66
Third Generation Studies .......................................................................................................... 71
Economic Benefits of Prevailing Wage Laws........................................................................... 72
Related Research: Cost Effects of Project Labor Agreements and Responsible Bidding Policies
................................................................................................................................................... 74
Conclusion ................................................................................................................................. 75
References ..................................................................................................................................... 76
Appendix A………………………………………………………………………………………81

3
List of Tables
Table 1: Summary of Complete Certified Payroll Data, Electrical Specialty Contractor #1,
Projects for City of Denver, 2008-2009. ....................................................................................... 26
Table 2: Weekly Certified Payroll for a Self-Performing Plumbing Specialty Contractor, City of
Denver Project, 2013 .................................................................................................................... 43
Table 3: Certified Payrolls with Changing Retirement Contributions. Plumbing/HVAC
Specialty Contractor, City of Denver Project, 2013 ..................................................................... 44
Table 4: Percent of Project Labor Hours by Trade. Projects by Mechanical Contractor #2, 2013.
....................................................................................................................................................... 47
Table 5: Order of Applying Workers from Different Trades. Projects by Mechanical Contractor
#2, 2013......................................................................................................................................... 49
Table 6: Certified Payroll Data for Selected Weeks. Project by Mechanical Contractor #2, 2013.
....................................................................................................................................................... 51
Table 7: Publicly Released Bid Results from State Departments of Transportation for Highway
Construction. ................................................................................................................................. 61
Table 8: Information from a CDOT Bid Tabulation, Federal Highway Maintenance Project,
2014............................................................................................................................................... 62

4
Introduction/Executive Summary
The federal Davis-Bacon Act establishes minimum wage and benefit rates for
construction workers employed on federally funded or federally assisted construction projects.
The purpose of the act is to ensure that construction workers will not see their wages and benefits
undercut as a result of government spending practices.1 The infusion of federal dollars into an
area, along with a process that rewards low bids, may depress wages by attracting contractors
from other areas. These contractors may undercut local wage rates by importing lower paid
workers or by offering less pay to local workers. The purpose of the wage floor is to protect
construction workers’ pay and benefits and to establish a level playing field for contractors who
are bidding on federally funded projects. The Department of Labor’s Wage and Hour Division
(WHD) determines local prevailing wage and fringe benefit rates through the conduct of wage
surveys on government contracts covered by the Davis-Bacon Act.2 Data collection for these
surveys is dependent upon the voluntary submission of information from contractors and third
parties that have performed construction work within the geographic scope of the wage survey.
Other federal regulations require all contractors and subcontractors engaged on federally
funded projects to deliver weekly payroll statements to the federal or state agency in charge of
the construction site.3 Payroll records must include the name and address of each laborer and
mechanic, their job classifications, wage and benefit rates, daily and weekly number of hours
worked, deductions, and actual wages paid. These certified payrolls are made available for
1 See The Davis-Bacon Act Protecting Wage Equality Since 1931. Accessed at:
http://www.dol.gov/whd/programs/dbra/Survey/conformancefaq.htm. 2 Davis-Bacon prevailing wage rates are reported at Wage Determinations On-Line.gov. Accessed at:
http://www.wdol.gov/. 3 See Code of Federal Regulations, Title 29, Chapter 1, Secretary of Labor, 29 CFR 3.3 and 3.4. Accessed at:
http://www.dol.gov/dol/cfr/Title_29/Chapter_I.htm.
5
inspection by the federal or state contracting officer and by authorized representatives of the U.S.
Department of Labor.
Other parties may gain access to the certified payrolls by submitting a Freedom of
Information Act (FOIA) request to the appropriate contracting agency.4 Exemption 4 of FOIA
protects against the release of trade secrets and commercial or financial information that is
privileged or confidential. This protection is intended to assure the interests of the submitters of
information and the government by encouraging submitters to furnish accurate and reliable
information. The exemption protects submitters from competitive disadvantages that could
result from the disclosure of the payroll information.
Torres Consulting and Law Group has experienced inconsistent responses to FOIA
requests for certified payrolls from federal contracting agencies. Some agencies routinely redact
requested hours worked and other data based on Exemption 4. Other agencies provide complete
information. Third-party checks of certified payrolls are important for the enforcement of the
Davis-Bacon Act. If Exemption 4 is to be used to prevent the release of certified payroll
information, it is important that the exemption is properly justified.
The present study is a case-specific inquiry into the nature of the construction industry to
determine if the specific claims that have been made by federal agencies, regarding the potential
for competitive disadvantage associated with the release of certified payrolls, are relevant to the
industry. For example, the Department of Energy (DOE) has presented contactor affidavits
indicating that the labor cost data contained in a certified payroll is treated as confidential
information in the construction industry. The primary argument is that disclosing this
4 See the Department of Justice Guide to the Freedom of Information Act. Accessed at:
http://www.justice.gov/oip/doj-guide-freedom-information-act.

6
information would allow competitors to undercut bids on future contracts because labor costs are
a significant element of contractors’ costs and bids.
The claim that labor costs are a significant element of a contractor’s costs is not
supported by numerous peer-reviewed studies and white papers that use data from the Economic
Census of Construction to calculate construction worker labor costs as a percent of total
construction costs. Such studies reveal that labor costs range from 17 to 32 percent of
construction costs, depending on the type of construction. The results of these studies indicate
that construction worker labor costs are one of many factors that make up a bid, that the labor
cost information included in a certified payroll is insufficient to undercut bids, and that releasing
this information would not cause competitive harm to a contractor. A complete evaluation of
this issue is presented in Section 1 of the report.
The contractor affidavits presented by the DOE were considered sufficient evidence to
rule that the payroll information, if released, could be used by competitors to undercut future
bids. This decision was made in the absence of a detailed examination of certified payrolls. This
study conducts such an examination. In Section 2 certified payroll data for projects covered by
the City of Denver prevailing wage policy are examined. These data illustrate how numerous
factors limit the usefulness of the payroll information from one project in estimating the bid-
price of another project. For example, change orders and off-site work cause distortions between
the estimate of labor hours used in bid preparation and the labor hours reported in a certified
payroll. Qualitative and size differences between projects render the labor cost information from
one project of little use in undercutting the bid on another. The hours needed to complete a
project vary with the skills and experience of construction workers, but information on labor

7
productivity is not included in certified payrolls. Changes in contractor bid behavior, project
backlogs, and economic conditions contribute to changing bids from project to project.
Incomplete and selected certified payrolls contribute to inaccurate estimates of project labor
costs. These and other factors discussed in Section 2 illustrate that bids are moving targets from
project to project and that too much uncertainty limits the use of payroll information in bid
undercutting.
Another concern is that the job classification and hours worked data contained in a
certified payroll may reveal confidential information (trade secrets) about how a contractor
employs workers from different trades in particular ratios that allows the company to complete
projects efficiently and at a low cost. Our examination of certified payrolls illustrates how, even
among very similar projects, the ratios in which workers from different trades are employed
vary. Another possible concern is that a contractor applies labor in a particular order over the
course of a project in a unique manner that is efficient and is a trade secret. However, our
examination of certified payrolls indicates that, even on similar projects, the order of labor varies
from week to week and likely responds to factors such as the demands of the project schedule,
working around the schedule of other contractors, and work on other projects, etc. This analysis
demonstrates that information included in a certified payroll does not reveal trade secrets
regarding the order and application of workers.
As indicated above, third-party audits of certified payrolls are an important tool for
enforcing prevailing wage requirements under the Davis-Bacon Act. When information vital to
the enforcement of the law is redacted, verification of compliance by third parties becomes
impossible. Section 3 of the report provides evidence of the uneven compliance. The results
suggest that most federal agencies release the information that is required to adequately

8
determine whether contractors are in compliance with Davis-Bacon prevailing wage
requirements, with the notable exception of the Department of Energy. If construction
contractors were truly fearful of harming their competitive position because of the release of
certified payrolls, one would expect that there would be significantly more redactions among
other agencies as contractors were trying to protect their competitive position, and that there
would not be a concentration of noncompliance found in only one agency.
The inability to enforce Davis-Bacon prevailing wage requirements is not
inconsequential. Violations often leave workers with substantially lower wages and benefits
than they are entitled to. Section 4 details several examples of how the release of certified
payrolls allowed third-party auditors to uncover violations that resulted in penalties and back-pay
for workers.
The release of certified payrolls through a FOIA request becomes more useful to a
possible competitor to the extent that labor costs are an important factor in winning a bid, which
is mostly the case in situations where the lowest bid prevails. If bids are won or lost based on
something other than low bid, however, knowledge of labor costs becomes less important.
Section 5 cites evidence that low bid contracting is less prevalent in the private sector compared
to the public sector, and is becoming less important in the public sector, which is moving toward
best value contracting. The implication is that in much of the construction industry, knowledge
of a competitors labor costs as found in certified payrolls will not be particularly helpful in
gaining competitive advantage for the purpose of winning bids.
In many instances detailed information about construction bids are routinely released to
the public. For example, state departments of transportation provide detailed bid results including

9
the name and bid of the winning contractor. Section 6 shows that many departments of
transportation release to the public detailed bid-price information on specific items included in a
highway project. This information can be used by contractors to determine how much they lost
the bid by, and the specific areas of the bid that require changes to become more competitive.
This information is far more accurate and useful in obtaining information of competitor’s bids
than the labor cost information that is reported in a certified payroll. However, this information
is routinely released without apparent harm to contractors.
Finally, Section 7 contains a review of the literature regarding the effect of federal, state,
and municipal prevailing wage policies on total construction costs, bid competition, and local
economies. The preponderance of the research indicates that prevailing wage requirements are
not associated with increased construction costs. Supplemental information indicates that
projects covered by prevailing wage standards are characterized by increased productivity and
efficiency that is associated with stable costs. Projects covered by prevailing wage laws are not
less competitive than projects that are not covered by the policy. Economic impact studies
indicate increased spending and higher levels of economic activity in those jurisdictions with
prevailing wage policies. Also included in Section 7 is a summary of academic research detailing
the impact of project labor agreements and responsible contracting policies on construction costs.
Overall, the results of this study indicate that the justifications typically employed for the
use of FOIA Exemption 4 are not appropriate for the construction industry.

10
Section 1. Construction Worker Labor Costs as a Percent of Total
Construction Costs.
Introduction
In Torres Consulting and Law Group (TCLG) v. Department of Energy (DOE) 2013,
subcontractors involved in the Energy Systems Integration Facility (ESIF) construction project
located in Golden, Colorado submitted affidavits indicating that disclosing the wage and hour
data reported in a certified payroll request would be a competitive disadvantage.5 Multiplying
hourly wage rates by the number of hours worked yields labor costs, or what these
subcontractors refer to as “labor production rates.” The subcontractors assert that “labor
production rates are treated as confidential information in the construction industry and that
disclosing them would allow to (sic) competitors to underbid the contractors when competing for
work because labor production rates are a significant element of a contractor’s price.”6 These
affidavits were considered sufficient evidence for Judge Wake to rule in DOE’s favor.7
The claim that construction worker labor costs are a “significant element” of total
construction costs is at variance with publicly available information that has been reported in
peer-reviewed research and in white papers addressing the effect of prevailing wage laws on
building costs. These studies, which are reviewed below, indicate that labor costs range between
17% and 32% of the total cost of construction. These data reveal that other factors such as the
costs of materials, supplies, fuels, overhead, profit, etc. make up between 83% and 68% of
construction costs. If labor costs are at best a minor element of overall costs, then even knowing
5 See United States District Court for the District of Arizona, Torres Consulting and Law Group, LLC, Plaintiff, v.
Department of Energy, Defendant. No. CV-13-00858-PHX-NVW. Document 24 Filed 11/27/13, p. 7. 6 Ibid.
7 Ibid., p. 8.

11
them perfectly will be of little use to competitors seeking to undercut bids. In his decision, Judge
Wake indicated that “the essence of this dispute is whether the labor production rate is just one
of the many variables that make up a bid, or if the labor production rate is such a significant
piece of a bid that release of the data would essentially reveal the bid price, causing substantial
competitive harm.”8 The studies examining labor costs as a percent of total construction costs
provide consistent and clear evidence that labor costs are just one of the many variables that
make up a bid and that releasing this information will not cause competitive harm.
Azari-Rad, Phillips and Prus (2003) report that, for the overall U.S. construction industry,
construction worker labor costs were 30% of total construction costs in 1982 and 26% in 1992.
While the change over this period may be influenced by that stage of the business cycle, other
data discussed below indicates that labor costs have continued to fall as a percent of construction
costs over time. These authors define labor costs as including construction worker wages,
benefits, and payroll taxes. Total construction costs are defined as material and labor costs and
exclude land purchases and architect fees. The data used in the study by Azari-Rad, Philips, and
Prus was obtained from the Economic Census of Construction.
The U.S. Census Bureau conducts a survey of construction contractors in every state
regarding industry employment, compensation, value of construction, expenditures on materials,
and supplies, etc.9 The survey is conducted every five years.
10 Data from the 2012 survey have
not been released. Information from the 2007 survey is the most recent available. The
Economic Census of Construction (hereinafter, ECC) reports data by geographic area, type of
8 Ibid.
9 See the Construction Geographic Area Series: Detailed Statistics for Establishments: 2007. Accessed at:
http://factfinder2.census.gov/faces/tableservices/jsf/pages/productview.xhtml?pid=ECN_2007_US_23A1&prodTyp
e=table. 10
For an explanation of the sampling methodology used in the Economic Census of Construction see:
http://www.census.gov/econ/census/pdf/2007_meth/meth_23.pdf.
12
construction (residential, commercial, industrial, and highway, etc.), and for specialty trade
contractors (plumbing, and electrical, etc.).11
Therefore, it is possible to determine labor costs as
a percent of total construction costs in a state, a particular sector of the construction industry, and
to track changes over time.
Other studies have also used the ECC to measure labor costs as a percent of total
construction costs. For example, Philips (2014) uses data for Kentucky to measure differences
by sector and over time. Data indicate that construction worker labor costs as a percent of total
construction cost decreased steadily between 1977 and 2007 in the overall construction industry
in this state. Labor costs were approximately 30% of total costs in 1977 and 21% in 2007. In
this study labor costs include construction worker wages, benefits, and payroll taxes.
Construction costs are based on building costs, excluding land acquisition costs, construction
design and oversight services not provided by construction contractors. Philips also observes
that construction worker employment, as a percent of total contractor employment, has decreased
from 87% in 1972 to 73% by 2007. Philips attributes the trends in labor costs and employment
to technological change in the industry, increased construction worker productivity, and the
greater use of white-collar labor as construction contractors have expanded the array of services
they provide. These are national trends in the construction industry with effects that are not
isolated to Kentucky. Philips also reports labor costs for different sectors of the Kentucky
construction industry in 2007. For example, labor costs are 17% of total costs in for highway,
11
The classification of establishments covered in the 2007 Economic Census of Construction uses the industry
definitions in the North American Industry Classification System (NAICS). In the NAICS system, an industry is
generally defined as a group of establishments that use similar processes. The numeric coding system provides
progressively narrower definitions of establishments with similar processes through successive additions of
numerical digits. For example, the NAICS code of 23 identifies and covers all construction establishments and six-
digit codes identify specific types of establishments involved in highway, street, and bridge construction or in
particular specialty trades.

13
street, and bridge construction and 20% for other civil engineering construction. For all projects
funded by state, county, and municipal governments, labor costs are 20% of total construction
cost.
Philips also points out several reasons why some contractors may assert that their labor
costs are higher than the information obtained from the ECC. First, contractors may not
distinguish between blue-collar construction worker labor costs and the labor costs of all
employees (including white-collar workers). Second, if the contractor is a subcontractor, they
may not be responsible for, or aware of the costs of materials, fuels, and other supplies used on
the project. Third, the contractor may present data from an addition/renovation project that
involved primarily construction labor (and did not involve significant material or white-collar
labor costs). Finally, Philips points out that when contractors consider their labor costs they do
not typically consider their profit as part of total construction costs. While profits are a return on
the contractor’s investment, this income is part of the cost paid by the project owner. For these
four reasons, Philips concludes that data from the U.S. Economic Census of Construction are
more reliable than the testimony of individual contractors regarding construction worker labor
costs as a percent of total building costs. We agree with Professor Philips that the ECC is the
most reliable data available to obtain measures of labor and total costs. The data reported by the
ECC is based on information obtained from a large number of contractors, is publicly available,
and is collected by an agency that is objective with respect to the issues involved in legal matters
related to certified payroll requests.
Other researchers have used the ECC for different states and industries and have provided
labor cost estimates that are comparable to those reported by Philips. For example, Duncan
(forthcoming) reports that labor costs were approximately 21% of total costs for highway, street,

14
and bridge construction in Colorado in 2007. The ECC does not report labor costs as a percent
of total costs. This ratio must be calculated based on other ECC data. In the study by Duncan,
labor cost as a percent of total construction cost is derived by dividing total construction worker
payroll, plus proportionally allocated total fringe benefits, by the net value of construction
work.12
The net value of construction is based on the value of work completed by a contractor,
less the value of work subcontracted to other contractors.13
This measure of the value of
construction work is used as a measure of total construction costs because it is the price the
project owners paid for the work completed. Price can be thought of as the ‘cost’ incurred by the
project owner. The net value of construction is a broader measure of total costs than contractor
bid prices since this measure of the value of construction includes the costs associated with add-
on charges and follow-up maintenance. In the current study we use Duncan’s method to
determine labor costs as a percent of total construction costs as it is the most accurate way to
compare total construction worker payroll with contractor building costs (minus any work
subcontracted out).14
12
The ECC defines construction worker payroll as the gross earnings paid in the reporting year to all construction
workers on the payroll of construction establishments. It includes all forms of compensation such as salaries, wages,
commissions, dismissal pay, bonuses, and vacation and sick leave pay, prior to deductions such as employees' Social
security contributions, withholding taxes, group insurance, union dues, and savings bonds. See Construction:
Geographic Area Series: Detailed Statistics for Establishments: 2007. Accessed at:
http://factfinder2.census.gov/faces/tableservices/jsf/pages/productview.xhtml?pid=ECN_2007_US_23A1&prodTyp
e=table. 13
The ECC defines the net value of construction as the receipts, billings, or sales for construction work done by
contractors, less the value of construction work subcontracted to others. The net value of construction does not
include contractor business receipts from retail and wholesale trade, rental of equipment without operator,
manufacturing, transportation, legal services, insurance, finance, rental of property and other real estate operations,
and other nonconstruction activities. Receipts for separately definable architectural and engineering work for others
are also excluded. Nonoperating income such as interest, dividends, the sale of fixed assets, and receipts from other
business operations in foreign countries are also excluded. See Construction: Geographic Area Series: Detailed
Statistics for Establishments: 2007. Accessed at:
http://factfinder2.census.gov/faces/tableservices/jsf/pages/productview.xhtml?pid=ECN_2007_US_23A1&prodTyp
e=table. 14
Some may argue that the value of construction work added should be used as the measure of construction costs.
In the ECC, this measure of construction activity is equal to value of business done, less costs for construction work

15
Labor Costs as a Percent of Total Construction Costs for Specialty Trade
Contractors Related to Certified Payroll Requests made by TCLG.
In 2012 and 2013, TCLG made several requests for certified payroll data for DOE
projects in Arizona, Colorado, and Washington. These requests were made for work completed
by electrical, insulation, and plumbing/HVAC specialty trade contractors. In this section of the
study, we report construction worker labor costs as a percent of total construction costs for these
specialty trade contractors in the relevant states. The data, obtained from the ECC and reported
below, indicate that construction worker labor costs range between 26% and 32% of total
construction costs for applicable specialty trade contractors and states. This information is
compared to the DOE’s rationale for not releasing wage and hour data. The DOE claims that
the release of hours worked information would result in financial harm to the DOE and
competitive harm to participating contractors if competing contractors used the wage and hour
information to undercut the business of contractors participating on DOE projects.15
The threat
of this damage may discourage participation in future DOE bid offerings. The reduction in bid
competition would result in higher project costs for DOE. The range in labor costs described
above indicates that it is improbable that a competing contractor, with access to the certified
payroll information, could derive sufficient information to undercut the bids of participating
contractors. Because labor costs are such a low percent of total construction costs for the types
of specialty trade contractors involved in TCLG requests for certified payroll information, it is
unlikely that the release of this information would alter bid competition for DOE projects in a
way that would affect costs.
subcontracted out to others, and costs for materials, components, supplies, and fuels. This is a measure of the value
created by construction workers, but is not a measure of costs since materials, supplies, etc., are omitted. 15
See correspondence between Torres Consulting and Law Group and U.S. Department of Energy accessed at:
http://s3.documentcloud.org/documents/686508/az-2-2013cv00744-complaint-attachment-1.txt.

16
Labor Cost Estimate for Solana Solar Generation Station, Arizona: Insulation
Contractors
In June of 2012, Torres Consulting and Law Group requested certified payroll
information regarding the Solana Solar Generation Station located in Gila Bend, Arizona. The
request was made on behalf of the Heat and Frost Insulators Local 7. The requested materials
included three weeks of the most recent certified payroll for Petrochem Insulation Inc. and Brand
Energy Solution Infrastructure (A.K.A Brand Energy Services).16
The DOE response to the certified payroll request states that the information withheld
“includes payroll information such as individual employee's hours worked, net and gross wages,
which could be used to determine total labor costs. Release of this type of information could
cause substantial financial and competitive harm to this project, as competing sub-contractors
could utilize this information to respond to the bid request which would result in a less
competitive process now and in the future and result in a substantial increase in the cost of the
project. Similarly, the release of such information could result in substantial harm to the
competitiveness of the contractor in bidding future projects.”17
Data from the ECC can be used to derive a measure of labor costs as a percent of total
construction costs for insulation specialty trade contractors, like those involved in the Solana
Solar project in Arizona.18
Based on the definitions of labor and total construction cost described
16
Ibid. 17
Ibid., p. 6. 18
The type of workers and contractors involved in this project are best described by NAICS code 238310 for
drywall and insulation specialty contractors.
17
above, data from the ECC indicates that labor costs are approximately 32.1% of construction
costs.
The ECC is not a complete census. The estimates for the value of construction, etc. are
based on a sample and are subject to sampling variability. The ECC data includes a relative
standard error that is a measure of this sampling variability. The relative standard errors for the
information used to derive labor and total construction costs are low, ranging between 3% and
5%. These relative standard errors are used to obtain 95% confidence intervals for the
information used to calculate labor costs as a percent of total construction costs (construction
worker employment, construction worker payroll, fringe benefits, and net value of construction,
etc.).19
This information was used to obtain high and low-end estimates of construction worker
labor costs as a percent of total construction costs for drywall and insulation specialty contractors
involved in the type of work at the Solana solar power station.20
For purposes of illustration, we
use this specialty trade contractor because this category has the highest labor costs as a percent of
total costs of all those examined in this study (32.1%). The range based on these data is as high
as 37.7% and as low as 27.4%. Even if labor costs for this specialty contractor are the upper end
(37.7%), non-labor cost components represent about 62% of total construction costs. It is
unlikely that wage and hour information, even if labor costs are as high as 38% of total costs, is
sufficient to provide a competitor with the means to underbid either of the contractors involved
in the solar generation project.
19
For example, there were 14,689 construction workers employed by drywall and insulation specialty contractors in
Arizona in 2007. The relative standard error for the employment estimate is 5%. The upper-end value of the
confidence interval is 16,158 and the lower-end value is 13,220. The use of the 95% confidence interval means that
we are 95% confident that the true value of the parameter of interest is in our confidence interval (16,158 to 13,220
construction workers). This process was repeated for all of the information used in the calculation of labor costs as a
percent of total costs (net value of construction, fringe benefits, and construction worker payroll, etc.). 20
The upper end range of labor costs as percent of total costs was obtained by using the lower-end value of the
confidence interval for employment and the upper-end value of the confidence interval for the net value of
construction (and vice-versa to obtain the lower end range of labor costs as a percent of total costs).

18
There may be instances where labor costs as a percent of total construction costs for a
specialty trade contractor may deviate from the average. These instances may occur when
specialty contractors are, and are not responsible for the equipment, materials, and supplies, etc.,
that are used on a project. For example, if a project (Project A) involves the installation of
expensive equipment that requires very little labor to install, and if the equipment cost is
included in the specialty contractor’s bid, labor costs may be a relatively low percent of total
project costs. On the other hand, consider Project B where the cost of equipment is included in
the general contractor’s bid and the specialty subcontractor is only responsible for the installation
of the equipment. In this case, labor costs may be a high percent of the project cost for the
specialty contractor. Because of differences in the composition of the bids for projects A and B,
the labor cost estimate of one of these projects would not be useful in estimating the bid-price of
the other, even though these projects may be very similar with respect to the installation of
equipment. 21
The labor costs of Project A would be useful in estimating the labor costs of a
project that is very similar to A. But, characteristics differ from project to project and it is
unlikely that a future project will involve the installation of the same equipment with the same
price. In the next section of this report, we illustrate the various ways projects differ and how
these differences limit the usefulness of the labor costs information in certified payrolls in
undercutting bids.
21
The low relative standard error for the net value of construction for specialty contractors (for example, 4% for
drywall and insulation contractors in Arizona, versus 1% for all Arizona construction) suggests that extreme cases
like projects A and B are rare. The higher relative standard error for specialty trade contractors suggests a greater
dispersion around the estimate of the net value of construction. This suggests a wider range in the net value of
construction, perhaps due to project differences in equipment costs described above. However, if these cases were
common, the relative standard error for specialty contractors would be much larger.
19
Labor Cost Estimate for Energy Systems Integration Facility Project, Colorado:
Plumbing, Heating and Air Conditioning and Electrical Contractors
In July of 2012, TCLG filed a FOIA request with the DOE regarding the Energy Systems
Integration Facility construction project located in Golden, Colorado.22
Specifically, the payroll
request was made for project subcontractors M Tech Mechanical Technologies Group and
Diamond Fire Protection. TCLG received redacted payroll information based on DOE’s
rationale that “trade secrets and commercial or financial information obtained from a person are
privileged or confidential.”23
Services offered by Diamond Fire Protection and M Tech Mechanical Technologies
Group include plumbing, heating, ventilation, and air conditioning. Data from the ECC for
Colorado indicates that labor costs for this specialty trade are approximately 25.8% of total
construction costs.24
Certified payroll requests were also submitted for two electrical specialty
trade contractors (Encore Electrical and Weifield Group Contractors) that also worked on the
ESIF project.25
TCLG also received redacted payroll information regarding these requests.26
ECC data indicate that labor costs are approximately 27.8% of total construction costs for this
type of specialty trade contractor in Colorado.
The DOE response to the certified payroll request by TCLG stated that “Encore Electric
has substantial commercial interests in protecting the release of this information, since the public
release of this information could be used by competitors to undercut the bid prices of Encore
22
See United States District Court for the District of Arizona, Torres Consulting and Law Group, LLC, Plaintiff, v.
Department of Energy, Defendant. No. CV-13-00858-PHX-NVW. Document 24 Filed 11/27/13, p. 2. 23
Ibid. 24
The NAICS code for plumbing, heating, and air conditioning contractors is 238220. 25
The NAICS code for electrical contractors is 238210. 26
Based on information provided by TCLG personnel.

20
Electric in the future resulting in substantial harm to the competitive position of Encore
Electric.”27
Since labor costs are a low percent of total construction costs for electrical specialty
trade contractors in Colorado, it is very unlikely that releasing payroll information would be
associated with a competitive disadvantage for these electrical contractors.
In TCLG v. DOE 2013, the DOE submitted affidavits from Diamond Fire Protection and
M Tech Mechanical Technologies Group stating that “labor production costs could be calculated
by multiplying the government’s labor rate by the hours worked. They attest that labor
production rates are treated as confidential information in the construction industry and that
disclosing them would allow competitors to underbid the contractors when competing for work
because labor production rates are a significant element of a contractor’s price.”28
In his
decision, Judge Wake agreed with these conclusions, stating that “substantial competitive harm
occurs when disclosure would allow competitors to estimate and undercut a contractor’s bid”
and: “a likelihood of substantial competitive harm is often found when the disclosed information
would give a competitor conclusive insight into how it could modify its business to undercut
another’s.”29
Data from the ECC indicate that labor costs for plumbing, heating, and air
conditioning specialty contractors in Colorado are approximately 26% and do not represent a
“significant element of a contractor’s price.” Since labor costs are a relatively low percent of a
contractor’s costs, the information contained in a certified payroll request is insufficient to
provide competitors with sufficient information to undercut a contractor’s bids.
27
Correspondence between Torres Consulting and Law Group and U.S. Department of Energy, August 7, 2012. 28
See United States District Court for the District of Arizona, Torres Consulting and Law Group, LLC, Plaintiff, v.
Department of Energy, Defendant. No. CV-13-00858-PHX-NVW. Document 24 Filed 11/27/13, p. 9. 29
Ibid., p. 6.

21
In his decision, Judge Wake also indicated that “substantial competitive harm is less
likely to be found when the information redacted provides insight into only one of several
variables a competitor needs to gain an advantage.”30
The data for the types of specialty trade
contractors involved in the ESIF facility indicate that labor costs are indeed, “one of several
variables a competitor needs to gain an advantage.” Consequently, it is unlikely that substantial
competitive harm would have occurred with the release of the certified payroll information.
Labor Cost Estimate for Hanford Tank Waste Treatment and Immobilization
Plant, Washington: Plumbing, Heating and Air Conditioning Contractors
In August of 2013, TCLG submitted a FIOA request regarding certified payroll records
for the Hanford Tank Waste Treatment and Immobilization Plant located in Hanford,
Washington.31
The request was made on behalf of the United Association Local Union No. 598.
The payroll information was not provided. The DOE responded that the requested information
was the property of the contractors.32
Data from the ECC for Washington state indicate that
labor cost as a percent of total construction costs for plumbing, heating, and air conditioning
specialty contractors was 26.4% in 2007.
30
Ibid., p. 7. 31
See correspondence between TCLG and the U.S. Department of Energy. Accessed at:
http://www.hanford.gov/files.cfm/FOI%202013-01446.Response%20Letter.pdf. 32
Information provided by TCLG personnel.

22
Conclusion of Labor Cost Section
Various studies that use data from the Economic Census of Construction indicate that
construction worker labor costs are a low percent of total construction costs. This is the case for
labor costs in the aggregate construction industry, individual states, or particular types of
construction. Additional evidence indicates that labor costs as a percent of total construction
costs have decreased over time. Data specific to specialty trade contractors in states with recent
DOE projects uniformly indicate that labor costs are also a low percent of construction costs,
ranging between 26% and 32% in these cases. These estimates are based on data from 2007.
Given the long-term trend of decreasing labor costs in the construction industry, it is likely that
these costs have decreased further since 2007.
This evidence casts doubt on claims that if certified payroll information is released,
competitors would be able to estimate and undercut a contractor’s bid, bid competition on DOE
projects would be reduced, and costs of DOE projects would increase. Our empirical
examination of the specialty trades involved in recent DOE projects indicates that labor costs do
not represent a significant element of a contractor’s price, but should be considered one of many
variables that make up a contractor’s bid. Our empirically-based, case-specific inquiry into the
nature of the construction industry indicates that the rationale used to prevent the release of
certified payroll information is unfounded.

23
Section 2: Certified Payrolls, Competitive Harm, and Trade Secrets
Introduction
In this section of the report we present summary data from complete certified payrolls to
examine the implications regarding the release of this information and competitive harm. In
Torres Consulting and Law Group (TCLG) v. Department of Energy (DOE) 2013, the DOE
presented affidavits by contractors regarding the sensitivity of certified payroll information.
These affidavits were considered sufficient evidence to rule that the payroll information, if
released, could be used by competitors to undercut future bids. This decision was made in the
absence of a detailed examination of certified payrolls. This section of the report conducts such
an examination. The advantage of this analysis is that we are able to gain insight into the
possible effects of releasing the information through an examination of certified payrolls from
the beginning to the end of a project, payroll data for different projects for the same contractor,
as well as payroll data when different job classifications are involved in a project.
Payroll information was collected from LCPtracker archives for the City of Denver.
Public construction funded by the City and County of Denver is governed by a prevailing wage
standard.33
This policy closely follows the Davis-Bacon Act with respect to project value
threshold and apprenticeship programs, etc. Denver prevailing wage and benefit rates are based
on Davis-Bacon wage determinations. Union wage and benefit rates prevail for all of the job
classifications examined below.34
33
See Ordinance Section 20-76 at: http://www.denvergov.org/Portals/741/documents/PW_General/20-76.pdf. 34
See http://www.denvergov.org/auditor/DenverAuditor/PrevailingWage/tabid/443008/Default.aspx.

24
LCPtracker is labor compliance software used for prevailing wage reporting.35
Certified
payroll reports, based on federal, state, and municipal prevailing wage standards, are created for
public works construction. The certified payroll reporting for City of Denver projects contains
the same information included in form WH-347 that is used for federal projects covered by the
Davis-Bacon Act. The information contained in LCPtracker certified payroll reports includes
employee and contractor identification, job classification, hours worked each day of the reporting
week, wage rate, fringe benefits for the project, and payroll information for other work
completed during the reporting week. The City of Denver uses the LCPtracker software for city
and federal prevailing wage reporting within its jurisdiction. Contractors use the software to
submit weekly payroll reports and certification documents. In the analysis that follows,
information that identifies individual employees and contractors, specific projects, and specific
project dates are omitted. The analysis is restricted to certified payrolls for nonunion contractors.
There are thousands of certified payrolls within the LCPtracker archives for Denver
public works projects. Our analysis is not a comprehensive examination of all project types.
Instead, our analysis is based on the same types of specialty trade contractors included in the
section of the report on labor costs (electrical and plumbing/HVAC). This focus allows the
information on percent labor costs to be integrated into the discussion of how releasing payroll
data may be associated with competitive harm. We also limit the analysis to an examination of
building construction (omitting heavy and highway projects). In the subsections that follow, we
illustrate the implications regarding the use of payroll information by a competitor to undercut
the future bids of a participating contractor. We also discuss the implications of the use of the
job classification and hours worked data to reveal trade secrets. These data may be used to
35
See http://www.lcptracker.com/.

25
determine how workers from different classifications are employed in ratios that may reveal a
contractor’s unique ‘recipe’ for construction.
Deriving Labor Costs from Certified Payrolls
In this section we present summary data from four complete certified payrolls for an
electrical specialty contractor who completed these projects for the City of Denver between 2008
and 2009. These data are reported in Table 1. Projects 1, 2, and 3 are relatively small and were
completed in approximately the same number of hours (ranging from 60 to 63.5 hours). Projects
1 and 2 are both electrical repair projects. Project #1 involved work on an existing electrical
system in a historic building.36
Project 2 required repairs to mechanical equipment. Project 3
involved the installation of mechanical equipment. Project 4 was a large demolition project that
required approximately 590 labor hours to complete.
36
The LCPtracker records for Denver do not contain detailed job descriptions. These are available from the city,
but require a Colorado Open Records Act request to obtain them. Time limits for this study do not allow for this
process. The descriptions included in the records are sufficient to provide information on general differences
between the projects.

26
Table 1: Summary of Complete Certified Payroll Data, Electrical Specialty Contractor #1,
Projects for City of Denver, 2008-2009.
Project Total
Project
Hours
Prevailing
Wage &
Fringe
Hours at
Prevailing
Wage
Hours and Wages Above
Prevailing Wage
Hours and Wages/
Apprentices
Project 1
(repair work)
60.0 $30.00
($10.82)
60.0 – –
Project 2
(repair work)
63.5 $30.00
($10.82)
54.5 4 hours at $40.82 ($10.82)
5 hours at $33.32 ($10.82)
–
Project 3
(non-repair
project)
63.0 $30.00
($10.82)
57.0 – 6 hours at $11.63
($2.63)
Project 4
(demolition
project)
588.5 $28.91
($10.33)
385.5 – 203 hours at rates
ranging between
$12.00 and $14.65
($2.53 and $4.64)
Source: LCPtracker, City of Denver.
The first three projects (projects 1, 2, and 3 in Table 1) were started in early summer of
2009 and ended by early fall of the same year. The fourth and larger project (Project 4) was
started and completed before the other three jobs (with a start date in the fall of 2008, finishing at
year’s end). The contractor reported the payment of applicable prevailing wage rates for the
corresponding job classifications. Building electricians and electrician apprentices were the only
workers employed on all of these projects. The prevailing wage and benefit rate for electricians
engaged on projects 1-3 was $30.00 hourly wage, plus $10.82 in fringes in late 2009.37
Total
hourly prevailing compensation was $40.82 in this period ($30.00 plus $10.82). In 2008, when
Project 4 was conducted, the prevailing wage for electricians was $28.91 ($10.33 in fringes).
Consequently, total compensation was $39.24 an hour ($28.91 plus $10.33). The hourly
compensation for apprentices ranged between $11.63 and $14.65 (with $2.53 to $4.64 in fringe
benefits) over the period.
37
See http://www.denvergov.org/auditor/DenverAuditor/PrevailingWage/tabid/443008/Default.aspx.

27
Calculating labor costs for Project 1 from the information reported in the certified payroll
is straight forward. This project involved 60 hours of labor time. All workers earned the same
hourly compensation rate and only one job classification was employed. Consequently, labor
cost equals $2,449.20 ($40.82 x 60 hours). The argument used by the DOE is that if a
competitor were to gain access to this information, it could be used to undercut future bids by
this contractor. This could be the case if a future project is similar to Project 1 in terms of repair
work on an existing electrical system in a building with constraints imposed by historic structure
status and if construction worker skills, experience, and productivity are constant for this and the
competing contractor. But, information presented below indicates that change orders and
differences in off-site work cause distortions between the labor hour estimates included in bids
and the labor hours reported in a certified payroll that are needed to complete a project. Also,
projects differ in terms of size and technical requirements. The quantity and quality of
construction labor also varies from project to project. Construction worker skills and experience
vary within a contracting firm and between firms. These and other factors illustrate the difficulty
in using labor costs from one project to undercut a bid on another project.
Change Orders and Certified Payrolls
One fundamental problem with using labor costs from one project to undercut bids on
future projects has to do with differences in the labor hour estimates used in preparing a bid for a
project and the hours needed to complete the project. For example, if a competitor’s bid on
Project 1 was based on an expected 70 hours of labor, and Contractor #1 (that was awarded the
project) finished the job in 60 hours; this implies that the competitor needs to reduce labor hours

28
on a future bid by more than 10 hours (14.3%) to undercut Contractor #1 on a comparable future
project.38
The problem with this approach is that differences exist between the labor hour
estimates used in calculating the bid for the project and the hours actually expended to complete
the work, particularly on repairs to an existing electrical system in a historic structure where
uncertainty exists regarding the extent of the work. For example, Contractor #1 may have based
its winning bid on an expected 50, 60, 70, or 80 labor hours, but finished in 60 hours. If the
labor hours required to complete a project differ from the labor hours used in the preparation of
the bid, the hours reported in a certified payroll are of little use in bid undercutting. One source
of the difference between the labor hours estimate used in the preparation of the bid and the
hours needed to complete the project is change orders.
Change orders involve adding or deleting work that was originally specified in the
contract. These are common in the construction industry with the typical commercial project
involving 56 change orders.39
Philips, Mangum, Waitzman, and Yeagle’s (1995) examination of
highway construction projects in Utah indicates that, on average, change orders added two
percent to the winning bids of projects covered by the state’s prevailing wage policy.40
On the
other hand, change orders were more than three times higher on highway projects that were not
covered by Utah’s prevailing wage standard. In an examination of new school construction in
Massachusetts, Bellman, et al. (2010) report that change orders and other costs increase winning
bids by an average of 6.2%.
38
This ignores the role of material and supply costs in bid costs. This issue is pursued below. 39
See Kent Lang, “The Trouble with Change Orders.” Accessed at: http://www.lang-
baker.com/publications/constructionadvisor/changeorders.htm. See also “Common Causes of Change Orders” by
Juan Rodriguez, accessed at: http://construction.about.com/od/Claims-Management/a/Common-Causes-For-A-
Change-Order.htm. 40
The Utah state-level prevailing wage law was repealed in 1981. See Dollar Threshold Amount for Contract
Coverage, U. S. Department of Labor. Accessed at: http://www.dol.gov/whd/state/dollar2011.htm#1.
29
The changes in labor hours associated with change orders will be reflected in certified
payrolls. For example, if change orders add hours of work to a project, the labor costs reported
in a certified payroll will also increase. The final cost of the project will also increase and rise
above the level of the initial bid. While information on the bids of all participating contractors is
often available after the completion of a project, the costs associated with change orders are
rarely reported and are very difficult to obtain.41
When change orders add to the final cost of a
project, it is very difficult to accurately use the labor cost data in a certified payroll to estimate
the winning contractor’s bid. A competitor with a complete payroll record may be able to
calculate the labor costs required to complete the project, but the competitor will not be able to
determine how much change orders caused the final costs to exceed the winning bid. Also, a
competitor will not be able to distinguish between the hours reported in the certified payroll that
were accounted for in the original bid and the hours dedicated to change orders. In other words,
if change orders add to project costs and to hours of work, and if a competitor used the certified
payroll to attempt to undercut on a future bid, the competitor’s bid would be too high. This is
due to basing the bid undercut on the hours required to complete the project, not the hours
estimated to win the bid. The opposite is the case for change orders that are associated with
fewer hours of work. In this case the reduction in hours needed to finish the job would be lower
than the labor hours included in the bid. Due to the prevalence of change orders in the
construction industry, certified payrolls are very unreliable for the purpose of undercutting bids.
41
See Duncan (forthcoming).

30
Off-Site Work and Certified Payrolls
The labor cost information reported in a certified payroll will also vary depending on how
the off-site work for a project is conducted.42
For example, the wages of workers employed by a
contractor at an off-site fabrication facility are not covered by Davis-Bacon prevailing wages if
the location and operation of the fabrication plant are not dedicated exclusively to the federal
project. In these cases, the wages and benefits of these off-site workers would not be included in
the certified payrolls required under Davis-Bacon. However, the wages of these off-site workers
are part of the contractor’s expenses since they are producing components to be used on the
federal project. Only the wages and benefits for those working on-site or at a fabrication facility
exclusively dedicated to the project are covered by Davis-Bacon and reported in the certified
payrolls. If a contractor utilizes an off-site facility that is exclusively dedicated to the federal
project, the certified payrolls will reflect these labor costs. However, if an off-site facility that is
not exclusively dedicated to the project is used, the certified payrolls will not reflect all of the
labor costs of the project. Uncertainty regarding the use of off-site facilities limits the reliability
of the information reported in a certified payroll in estimating another contractor’s labor costs
and future bids.
42
See requirements for off-site work in DBA/DBRA Compliance Principles, US Department of Labor, Prevailing
Wage Resource Book. Accessed at: http://www.dol.gov/whd/recovery/pwrb/Tab9.pdf.

31
Labor Estimating Manuals, Bid Preparation, and Labor Costs
Labor estimating manuals are widely used in the construction industry during the
preparation of bids.43
These manuals provide estimates of the labor hours needed to complete a
project and are highly specialized. For example, members of the Mechanical Contractors
Association of America have access to WebLEM, a web-based labor estimating manual that
provides detailed labor units for typical HVAC, plumbing, and pipefitting tasks.44
Contractors
typically use labor estimating manuals to obtain initial labor cost estimates. These figures are
adjusted for any risk factors such as the height at which work will be performed and other project
features that increase construction time. The labor cost estimate is also marked up for overhead
costs and profit. If all contractors bidding on a project are using the same or similar labor
estimating software and all have access to the project description, their initial labor hour
estimates will be similar. If all contractors pay the required Davis-Bacon rate for a federal
project, their initial labor costs will also be similar. What differs between contractors is how
much the initial labor hours and cost estimates are adjusted for risk factors, profit, and overhead.
Contractors with higher (lower) risk factors and profit markups will submit bids based on higher
(lower) labor costs. These markups may influence whether a contractor wins the bid. In this bid
preparation setting, initial labor hour and cost estimates tend to be uniform. If a competitor is
seeking to undercut another contractor’s bid using labor costs data, they need information on the
43
See RS Means for a description. Accessed at: http://www.rsmeans.com/links/estimates.asp. 44
See MCAA “Labor Estimating Manual” for the mechanical trades. Accessed at: https: //www.weblem.org/.
Other examples include estimating software by RS Means that, in addition to labor hour estimates, calculates crew
sizing and allows for verification of subcontractor quotes. Accessed at: http://www.rsmeansonline.com/. The
National Electrical Contractors Association (NECA) offers the NECA Manual of Labor Units to members.
Accessed at: http://www.necanet.org/neca-store/publications.
32
rival’s risk, overhead, and profit markups. However, information on markups is not contained in
certified payrolls.
Labor Costs and Total Construction Costs
A contractor may have won the bid by a wider margin than the implied difference in
labor costs between the two companies. Contractor #1 may have won based on the non-labor
cost components. Data presented in the section of the report on construction worker labor costs
as a percent of total construction costs indicates that labor costs for electrical specialty
contractors in Colorado are, on average, approximately 28% of total costs. This suggests that
non-labor components make up about 70% of total project costs (on average). Contractor #1
may have won the project with a lower bid on non-labor components that constitute the majority
of a project. Since labor costs are a low percent of total construction costs, using this
information is not a reliable method to undercut the bids of other contractors.
Unless the bids of participating subcontractors are released by the general contractor
(which is unlikely), or if federal agencies release general contractor bid information after the
project has been awarded, a competing contractor will not know the winning bid. Under these
conditions, attempting to undercut future bids based on the labor cost component that constitutes
approximately 28% of project costs is very difficult. If contractors receive bid information from
a federal agency after the completion of a project, all losing firms can quickly calculate

33
differences between their bids and the winning bid without relying on labor cost estimates of the
winner.45
Differences in Construction Worker Productivity
The argument that knowing the labor costs on one project can be used to undercut the
bids on future projects assumes that the past and future projects are similar. Data reported in
Table 1 indicate that Contractor #1 was also engaged in repair-oriented Project 2 that required
similar labor hours to complete (60 hours for Project 1 and 63.5 hours for Project 2). While
projects 1 and 2 are both repair jobs with similar labor hours, there are qualitative differences
between these jobs. Project 1 required repair work on an existing electrical system in a historic
building. Work on these types of structures may require modern code compliance and system
upgrades (see Swanke Hayden Connell Architects, 2000). The types of tasks electricians would
perform on this project likely differ from the diagnostic work required of repairs to the
mechanical equipment involved in Project 2. Because of the qualitative differences between
projects 1 and 2, similarity in quantity of hours worked is of little use to a competitor who wishes
to use labor cost information from Project 1 to undercut the bid on Project 2.
In addition to qualitative differences, projects can also differ in terms of size. Contractor
#1 completed several projects for the City of Denver. We have selected three that had similar
labor hours, but hours ranged significantly between all projects completed by this contractor.
Project 4 is an example. It is clear that the labor cost data from a small project, Project #1 with
45
The availability of bid information is discussed in a following section.

34
60 hours, would be of little use in estimating the labor costs of a much larger project like Project
4 with approximately 590 hours.
Another problem with undercutting bids based on labor costs is that if the competitor
reduced its labor hours, by more than 14% in the example described above, the competitor would
have to produce at that rate, if it won the contract. Given the productivity of the existing
workforce, overhead, and current method of construction, this may not be a profitable practice.
Reducing labor costs involves changes to the existing workforce (additional training, or finding
and hiring more productive workers). In this situation it is likely easier for a competitor to find
ways to reduce bids based on non-labor cost components (such as purchasing cheaper supplies,
materials, etc.) to gain a competitive advantage.46
While Project 2 is also a repair job that required a similar number of hours to complete as
Project 1, the electricians used in Project 2 were not all paid the same wage rate (according to
data reported in the certified payrolls for Project 2). For example, of the total 63.5 total hours
reported, 54.5 hours were completed by employees who were paid the prevailing wage rate
($40.82 total hourly compensation). Two other employees were paid $40.82, plus $10.82 in
fringes (total hourly compensation of $51.64) and $33.32, plus a fringe of $10.82 per hour (for a
total hourly equal to $44.14). These two employees worked four and five hours on this project,
respectively. Labor cost for this project can be calculated by taking these differences into
account. Here, labor cost equals $2,651.95 ([54.5 hours x $40.82] + [4 hours x $51.64] + [5
hours x $44.14]). The labor hours for projects 1 and 2 are roughly similar ($2,449.20 versus
$2,651.95) with the difference due slightly more required time and to the workers receiving
46
Materials and supplies on government projects are typically standardized to achieve safety and quality standards.
See Duncan (forthcoming). In these situations, cost savings may be achieved by lower material prices rather than
the use of lower material quality.

35
higher pay in Project 2. The problem with comparing labor costs between these two projects is
that the quantitative measure of cost does not capture qualitative difference in the workers
completing these projects.
Construction worker compensation depends, in part, on skills and experience. The two
employees who received compensation in excess of the prevailing wage rate minimum for
Project 2 are likely more skilled and experienced than those employees receiving the prevailing
wage rate. Contractor #1 may have needed these skilled workers to address the diagnostic
requirements of Project 2 that involved repairs to mechanical equipment. Regardless, the
differences in rates of pay and the implied differences in worker skills and productivity
compound the use of labor costs by a competitor seeking to undercut bids on future projects.
While a competitor possessing the payroll data for Project 2 would know that different rates of
pay were used, the wage data does not reveal specifics regarding the worker productivity needed
to complete the project in 63.5 hours.47
This example illustrates the obvious: employees of an establishment, even those
performing the same work, will vary in terms of productivity. These differences make it very
difficult to accurately compare labor costs for different projects. This issue persists even if
employees on two comparable projects are all paid that same prevailing wage rate (as is the case
in Project 1). This is due to the division of labor used by nonunion contractors and the
requirements of prevailing wage standards.
47
In addition to variable productivity among workers receiving prevailing wages is the variable productivity of
supervisors of these workers. Project managers, superintendents, and foremen may also vary from project to project
and in the relative efficiency of managing construction workers. This variability will contribute to costs differences
between projects.

36
The crew mix for a typical nonunion contractor will consist of a skilled
journeyman/tradesman. This worker will supervise a larger crew of semi-skilled helpers and
low-skilled laborers. This crew may also include a nonunion apprentice.48
The skilled nonunion
journeymen may receive a rate comparable to or greater than union journeymen. Lower skilled
helpers and laborers earn substantially less.49
While the provisions of the Davis-Bacon Act
allow for a helper job classification, the requirements are restrictive and the use of this
classification is rare. This classification is not included on Davis-Bacon projects in Colorado or
for the City of Denver.50
Consequently, the typical nonunion contractor working on a prevailing
wage job must pay helpers the rate that corresponds to the journeymen. That is, if an electrician
helper was employed on a prevailing wage project in 2009, this worker would earn the prevailing
wage rate for a building electrician ($40.82 per hour). The prevailing wage sets a floor for
hourly rates of pay, but there is no guarantee that all workers earning this minimum wage are
equally skilled and productive.
It is likely that nonunion contractors select their most productive workers for prevailing
wage work, but productivity differences persist. Even if a nonunion contractor uses journeymen
on a prevailing wage project, this crew will likely vary in terms of skill and experience.
Bilginsoy’s (2007) comparison of joint union and management apprenticeship programs and
nonunion multi-employer programs provides insight into the extent of skill differences in the
construction industry, particularly in the nonunion side of the building trades. Bilginsoy’s
findings indicate that graduation rates are lower in nonunion apprenticeship programs.
Additionally, those who leave programs prior to graduation do so before a substantial buildup of
48
See Nothrup (1997) for a description of the division of labor in union and nonunion construction. See Bilginsoy
(2007) for a description of nonunion apprenticeship training programs. 49
Data reported by Duncan, Philips, and Prus (2008b) indicate that nonunion plumber helpers earn approximately
71% of the hourly wage of a nonunion journeymen plumber. 50
See Wage Determinations on-line.gov and site for City of Denver.

37
skills. This suggests that the range of skill differences is far greater in the nonunion sector of the
construction industry. While prevailing wage rates may be paid to all workers on a project, the
skills, experience, and productivity of these workers likely varies significantly. Even if a
competitor possessed the complete payroll data for Project 1 (where all workers earned the same
prevailing wage), this information would be of limited use because differences in labor
productivity between the two contracting firms are unknown. Workers completed Project 1 in 60
hours, but their level of productivity is unknown. It is also unknown how long it would take
workers with different (higher or lower) productivity to complete this project.
Labor hours and wage rates alone are insufficient for use in estimating future bids. Since
the skills and experience of workers can change from project to project, it is necessary to adjust
labor hours for differences in worker productivity. Project 1 employed relatively lower skilled
workers while Project 2 utilized more productive workers. Both projects were completed in
approximately 60 hours, but since Project 2 employed more productive workers, they were able
to produce more work and value in less time. With these types of differences in labor quality, it
is very difficult to compare the time required to complete different projects. This is further
complicated when a competing contractor employs workers with different skill and experience
levels.
Data from Project 3 illustrates the issue of varying labor productivity when apprentices
are employed on a project. Total labor hours for this project are equal to 63. Approximately
9.5% (six hours) were completed by a supervised apprentice. Productivity on this job may be
lower (and hours higher) due to the use of a trainee and due to the reduction in output associated
with time spent by a journeyman supervising the apprentice. The quantitative measure of labor
costs does not capture qualitative differences in the workers completing this project.
38
Project 4 was a larger project requiring approximately 590 labor hours. This demolition
job was completed prior to the other jobs in 2008. Contractors complete a variety of projects that
differ in technical requirements and size. Additionally, this project involved a large number of
apprenticeship hours. Apprenticeship hours represent approximately 35% of total labor hours for
this project. This example indicates that worker skills and experience can vary widely from
project to project, compounding the problem of using labor costs in undercutting bids. It also
illustrates that the cost of a smaller project is of little use in estimating the bid price of a larger
project.
The illustrations presented here are simplified as we have selected projects for ease of
presentation that employ a single job classification (electricians). The challenge of using labor
costs to undercut future bids is further complicated when projects involve job classifications for
multiple trades. In a section below, we present data from a plumbing/HVAC specialty contractor
that utilized pipefitters and sheet metal workers on projects for the City of Denver (see tables 4-
6). The use of these two classifications varies with the technical characteristics of the job. As
the ratio of sheet metal workers to pipefitters changes, so does labor costs as these workers
receive different prevailing wage rates. Hence, it is not possible to use the labor cost from a
multi-trade project to estimate the labor costs on a future project, unless the utilization of each
job classification is the same. This would occur if the technical characteristics of two jobs are
the same, which is an exceedingly rare occurrence as illustrated below.

39
Project Backlogs, Equipment Rentals, and Other Factors Affecting Bids
The data for projects 1, 2, and 3 suggest that this contractor was engaged in numerous
projects for the City of Denver in the summer of 2009. We are not able to determine how many
other projects this contractor was working on, but these data are consistent with a backlog of
projects and a high utilization of contractor capacity. Jofre-Bonet and Pesendorfer (2000, 2001,
and 2003) report that bids are higher when a high percentage of the firms’ productive capacity is
obligated to previously awarded projects. On the other hand, bids are lower when contractors
have less of their capacity dedicated to other projects. Also, winning bids are higher when all
bidders have a high percentage of capacity committed to previous projects. For example, Jofre-
Bonet and Pesendorfer find that when contractor backlog increases by 57 percent, bids increase
by 12 percent. Gugler, Weichselbaumer and Zulehner (2013) also find that contractors bid
higher when backlogs are higher and they also bid higher when they know their competitors’
backlogs are higher.
Results from these studies indicate that as contractor backlog and capacity utilization
change, so do bids. The labor costs and bid of a contractor at one point in time may not be
representative of the labor costs and bid for the same contractor at another point in time when
backlogs and capacity utilization change. This is another factor that limits the use of labor cost
information in undercutting bids. Statements from individual contractors may contradict the
findings of the empirical studies discussed above. While the experiences of individual
contractors may differ from overall averages, the findings of the studies by Jofre-Bonet and
Pesendorfer are based on the examination of approximately 2,200 highway construction projects
in California. The study by Gugler, Weichselbaumer and Zulehner is based on data from
approximately 2,000 bids for building and heavy construction projects.

40
Contractors may own or rent the equipment and machinery needed to complete a project.
If rentals are required, the additional cost of the equipment will not be included in the certified
payroll. The hours required to operate equipment are included in the payroll data regardless of
whether the contractor owns or rents the equipment. However, bids will vary depending on the
use of owned or rented equipment. Since differences in rental costs are not included in payroll
data, this adds to the difficulty in using certified payrolls to undercut bids.
The use of rental equipment and machinery varies by type of construction and is
concentrated in a few sectors. According to data from the Economic Census of Construction for
2007, heavy and civil engineering construction represented approximately 46% of all equipment
rentals in the Colorado construction industry while specialty trade contractors represented about
39% of all rentals.51
Rentals as a percent of the net value of construction are relatively low and
vary between sectors. Data from the Economic Census of Construction indicate that for
specialty electrical and wiring contractors, the rental of equipment and machinery represents
approximately 0.5% of the net value produced by this segment. The corresponding percentage
for contractors involved in highway, street, and bridge construction is 4.5%.
Data from highway construction studies by Jofre-Bonet and Pesendorfer (backlog effects)
and Philips et al. (change orders), and from the Economic Census of Construction (equipment
rentals and labor costs) can be used to illustrate how bids can change even for similar projects.
To illustrate, consider the change in a contractor’s highway bid as capacity utilization decreases
by 57% (corresponding to a 12% bid decrease), a decrease from the average level of change
orders to no change orders (resulting in a 2% decrease), and a change from the average
51
The Economic Census of Construction reports building rental expenses separately from equipment and machinery
rentals.

41
equipment rental to no rental (a 4.5% decrease). With these changes, the bid would fluctuate
(decrease) by 18.5 % (12% + 2% + 4.5%). Data presented in the section on labor costs indicates
that this component represents about 21% of total costs for highway and street and bridge
construction in Colorado. In this case the possible fluctuation in backlogs, change orders, and
equipment rentals represents approximately 88% of labor costs. This example illustrates that
with the potential for significant variation in bids from project to project, data from a certified
payroll is of limited use in bid undercutting.
Changes in contractor backlogs, change orders, and equipment rentals are only some
differences among firms, projects, and economic conditions that affect bids. For example, first-
time bidders, or new entrant contractors often lack production experience in the new area or
possess incomplete information about bid cost components. Li and Philips (2012) find that the
bids of entrants vary, or are more widely dispersed around the central tendency. De Silva,
Dunne, and Kosmopoulo (2003) find that entrants bid more aggressively (lower) than incumbent
firms. These studies suggest that bid behavior changes as bidders acquire experience. The bids
of one contractor, even for similar projects may change with the accumulation of information
over time. How this change affects bids is unknown to a competitor seeking to undercut future
bids. Flambard and Perrigne (2006) find that tenders from contractors who are closer to a project
location are more aggressive than those submitted by contractors located at a greater distance
from the project. This illustrates how a contractor’s bids on two similar projects, with similar
labor costs, may vary with increased transportation costs. It is unlikely that a competitor seeking
to undercut future bids could accurately estimate the effect of distance on future bids. Porter and
Zona’s (1999) examination of highway construction projects in New York reveals a pattern of
phony higher bids and one serious bid among contractors participating in a collusive cartel. This

42
demonstrates that contractor bids may vary from project to project if firms are involved in bid
rigging. Balat (2012) examines the effect of the American Recovery and Reinvestment Act on
bids for road construction in California and finds that profit markups and bid prices increased as
a result of the stimulus. This illustrates the effect of the level of demand for construction
services on bids. As economic conditions change so do markups and bid levels. However,
competitors do not know how much a particular contractor will change markups as economic
conditions change. These effects add to those of backlogs, change orders, and equipment rentals
and illustrate that bids are a moving target from project to project.
Incomplete and Inconsistent Labor Cost Data Reported in Certified Payrolls
The wage and hour data reported in a certified payroll may be insufficient to accurately
calculate project labor costs if the owner of the company worked on the project. The Davis-
Bacon Act allows for flexibility in payroll reporting in this case. If the subcontract price covers
the applicable prevailing wage rate for the number of hours worked by the company owner on a
Davis-Bacon project, the Department of Labor (DOL) considers this self-performing
subcontractor to have been paid in compliance. 52 Consequently, weekly hours and wage rates
for self-performing subcontractors may not be included in the certified payroll.
The impact of flexibility in reporting payroll data for company owners is illustrated by
the payroll data reported in Table 2. These data are for one week in the spring of 2013. The
plumbing specialty contractor reported total hourly compensation $0.01 below the corresponding
52
See: DOL: http://www.waptac.org/data/files/Website_docs/WAP_Basics/Tab6.pdf.
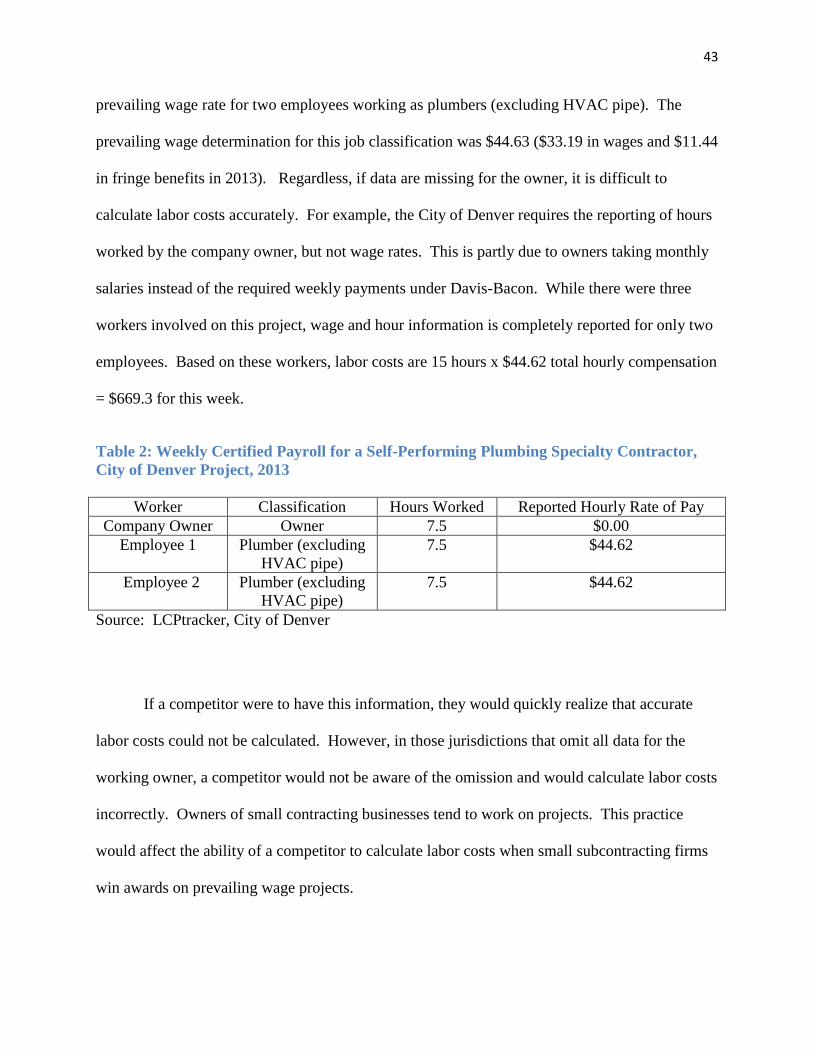
43
prevailing wage rate for two employees working as plumbers (excluding HVAC pipe). The
prevailing wage determination for this job classification was $44.63 ($33.19 in wages and $11.44
in fringe benefits in 2013). Regardless, if data are missing for the owner, it is difficult to
calculate labor costs accurately. For example, the City of Denver requires the reporting of hours
worked by the company owner, but not wage rates. This is partly due to owners taking monthly
salaries instead of the required weekly payments under Davis-Bacon. While there were three
workers involved on this project, wage and hour information is completely reported for only two
employees. Based on these workers, labor costs are 15 hours x $44.62 total hourly compensation
= $669.3 for this week.
Table 2: Weekly Certified Payroll for a Self-Performing Plumbing Specialty Contractor,
City of Denver Project, 2013
Worker Classification Hours Worked Reported Hourly Rate of Pay
Company Owner Owner 7.5 $0.00
Employee 1 Plumber (excluding
HVAC pipe)
7.5 $44.62
Employee 2 Plumber (excluding
HVAC pipe)
7.5 $44.62
Source: LCPtracker, City of Denver
If a competitor were to have this information, they would quickly realize that accurate
labor costs could not be calculated. However, in those jurisdictions that omit all data for the
working owner, a competitor would not be aware of the omission and would calculate labor costs
incorrectly. Owners of small contracting businesses tend to work on projects. This practice
would affect the ability of a competitor to calculate labor costs when small subcontracting firms
win awards on prevailing wage projects.

44
Fringe benefit contributions may vary from week to week, making it difficult for a
competitor, possessing payroll data, to accurately estimate complete labor costs. For example,
an employer may contribute to an employee’s 401(k) retirement plan. These contributions may
be based on the overall employment agreement and may not vary with Davis-Bacon wage
determinations (if they are in excess of prevailing wage requirements). The data reported in
Table 3 illustrate this issue. This plumbing specialty contractor made 401(k) contributions to
employees while working on a City of Denver prevailing wage project in 2013. The effect that
these contributions can have on the calculations of labor costs is illustrated by data for two
selected weeks. For example, Employee 1 earned $546.91 in gross weekly pay during Week#1
(13 hours x $42.07 wage). The prevailing wage rate for the pipefitter (including HVAC pipe)
during the spring of 2013 was $30.10 hourly, plus $11.52 in fringe benefits (for total hourly
compensation of $41.62). These workers received an hourly rate greater than the prevailing
wage floor.
Table 3: Certified Payrolls with Changing Retirement Contributions. Plumbing/HVAC
Specialty Contractor, City of Denver Project, 2013
Week #1 Classification Hours
Worked
Hourly
Wage
Gross
Wages
Combined
Benefits
Hourly
Benefits
Employee 1 Pipefitter
(including
HVAC pipe)
13.0 $42.07 $546.91 $252.64 $19.43
Employee 2 Pipefitter
(including
HVAC pipe)
5.5 $42.00 $230.97* $244.22 $44.40
Week #2
Employee 1 Pipefitter
(including
HVAC pipe)
26.0 $42.07 $1,093.75* $352.86 $13.57
Employee 2 Pipefitter
(including
HVAC pipe)
4.5 $42.00 $188.98* $154.98 $34.44
Source: LCPtracker, City of Denver. *error in certified payroll calculations.
45
Total fringe benefits were $252.64 (or $19.43 hourly). Some of these benefits consisted
of a 401(k) contribution. Employee 2 received total benefits of $244.22 that exceeded gross
wages of $230.97 for Week #1. Benefits were high because of the 401(k) contribution provided
by the employer that week. Retirement contributions were made to both workers during Week
#2, but not by the same amounts. On an hourly basis, benefits were $13.57 in Week #2 for
Employee 1, down from $19.43 in Week #1. The same is the case for Employee 2 who saw
his/her hourly benefits compensation fall from $44.40 in Week #1 to $34.44 in Week #2.
Retirement contributions appear under “All Other” on the LCPtracker payroll form.
Consequently, it is possible to separate this contribution from others. However, since
contributions vary from week to week, it is not possible for a competitor, in possession of the
payroll data, to accurately measure fringe benefits for these workers for this project. This
practice of making 401(k) contributions on prevailing wage projects may be a rare occurrence,
but it happens frequently enough for the City of Denver to have an approval process that allows
contractors to make these kinds of contributions.
Trade Secrets and Crew Mix
Data in Table 4 report percentage hours worked for plumbers and sheet metal workers
involved in four projects for a private company conducting business at a facility owned by the
City of Denver in 2013. Because the company was housed in a facility owned by the city, the
work was covered by Denver’s prevailing wage policy. All four projects were completed at the
same location in different areas of the facility. Projects 1 and 2 were in the same area of the

46
facility. Project 2 started immediately after the completion of Project 1 suggesting that the
former was an extension of the latter. Data for these two projects indicate that, in terms of hours
of work, the ratios of plumbers to sheet metal workers are similar. Approximately 55% of total
hours were completed by plumbers with about 45% of hours completed by sheet metal workers
on Project 1. Approximately 57% of total hours were completed by plumbers with about 43% of
hours completed by sheet metal workers on Project 2. This suggests that for these projects, the
contractor used the two job classifications in about the same ratio. This may indicate a specific
‘recipe,’ or trade secret used by this contractor that allows the company to complete projects
efficiently and at a low cost. However, the ratios between the two jobs are constant because
these projects are essentially identical. The ratio changes significantly for other projects in
different areas of the facility. Plumbers account for about 17% of total hours for Project 3 and
approximately 77% for Project 4. While these projects were completed by the same contractor,
in the same facility, the data indicate that the ratios are the same when the projects are the same.
But, this is a very rare occurrence. It is more likely that ratios vary between projects, even if
they are at the same location and involve the same general type of work.
Project 5 was a much larger project, involved a different type of work at another location,
and included plumber apprentices. This project extended over 60 payroll periods and overlapped
the projects 1-4. These data provide additional evidence that labor utilization ratios differ by
project. The mix of job classifications also varies within a classification due to the use of
apprentices.53
This information demonstrates that the hour and job classification data do not
reveal trade secrets regarding unique combinations employed by a contractor.
53
The use of apprentices depends, in part, on the availability of these workers and availability changes over time.
This variability compounds efforts to use the crew mix from one job to estimate the mix for another project.

47
Table 4: Percent of Project Labor Hours by Trade. Projects by Mechanical Contractor
#2, 2013.
Project Percent Hours Plumber (excluding HVAC) Sheet Metal Worker Total
1 54.5% 45.5% 100%
2 56.9% 43.1% 100%
3 16.6% 83.4% 100%
4 76.9% 23.1% 100%
5 96.4% = 86.0 (journeymen) + 10.4%
(apprentices)
3.6% 100%
Source: LCPtracker, City of Denver.
Another possible concern is that a contractor applies labor in a particular order over the
course of a project in a unique manner that is efficient. If so, this method may represent a trade
secret. Weekly hours worked on projects 1-4 are presented in Table 5 and are used to explore
the implications regarding the ordering of workers. Many of the same employees of this
contractor worked on both projects. Projects 1 and 2 are similar in terms of the ratio of hours
worked by plumbers and sheet metal workers. But, the order in which these workers are applied
varies. For example, during the first and second week of Project 1, plumber and sheet metal
worker hours are equal (8 hours for each job classification in the first week and 28 hours each
during week two). This implies that the contractor uses these types of workers in a fixed ratio of
one-to-one, at least at the inception of a project. The ratio of plumber to sheet metal worker
hours rises to 2.5 (40/16) in week three before returning to one-to-one in Week 4. A possible
explanation of this pattern is that the contractor uniquely developed this order because it is
efficient and, consequently it is a trade secret. However, the data for Project 2 suggests that this
explanation is unlikely. Projects 1 and 2 are similar, but there is no evidence of the consistent
application of workers between these projects. Rather than starting out at a one-to-one ratio,
plumbers and sheet metal workers in Project 2 are used in approximately 2.5-to-1 ratios during
the first two weeks. Only in week 6 of Project 2 are these workers used in a one-to-one ratio.
48
This ratio occurred in 5 of the 12 weeks of Project 1. There are several weeks in Project 1 where
2 plumbers worked with 1 sheet metal worker (see number of workers in parentheses for weeks
7, 8, and 12). However, in Project 2 there is only one week (the second) where two plumbers
worked with one sheet metal worker and two weeks where three plumbers worked together. The
data for projects 2 and 3 suggest that the order of labor is not uniquely applied in a manner
consistent with a trade secret. Even on similar projects, the order of labor varies from week to
week and likely responds to other factors such as the demands of the project schedule, working
around the schedule of other contractors engaged on this project, and work by this contractor on
other projects, etc. The skill and experience levels of workers vary from firm to firm. It is
unlikely that even if a competing contractor came into possession of the order of labor data
contained in a certified payroll that they could implement, or find use in this information.

49
Table 5: Order of Applying Workers from Different Trades. Projects by Mechanical
Contractor #2, 2013.
Project 1 Project 2 Project 3 Project 4
Week Plumb SM Plumb SM Plumb SM Plumb SM
1 8 8 40 (2) 16 – – 40 (2) 24
2 28 28 104 (3) 40 – – – –
3 40 16 56 (3) 40 32 32 – –
4 32 32 36 40 0 28 – –
5 40 28 4 40 24 40 40 0
6 24 40 32 32 3.5 29
7 43.5 (2) 29 24 40 3 40
8 43 (2) 40 32 33.5 0 32
9 28 32 16 0 0 40
10 40 40 – – 0 32
11 40 40 – – 0 40
12 80 (2) 40 – –
13 24 0
14 – –
15 – –
16 4 0
Total
Hours
412.5 373.0 372.0 281.5 62.5 313.0 80 24
Trade
Percent
54.5% 45.5% 56.9% 43.1% 16.6% 83.4% 76.9% 23.1%
Source: LCPtracker, City of Denver. The number of workers utilized in a week is reported in
parentheses, if the number exceeds one. Dashed line (–) means no work reported that week.
Even though all of the projects reported in Table 5 involve plumbing and sheet metal
work at the same facility, the order and application of labor varies between the individual
projects. For example, there are several weeks in Project 3 that do not involve plumbers. The
same is the case for one week in the very small Project 4. Other data reported in Table 5 include
the hours by trade for each project (Total Hours) and the percentage of total hours by trade that
are also reported in Table 4.
The variation in the use of trades between projects affects labor costs and complicates the
use of certified payrolls in undercutting bids. Prevailing wage rates vary between trades. As the

50
utilization of different trades varies between projects, so do labor costs as more (less) plumbers
and sheet metal workers are employed. For example, Project 3 will have a different labor cost
total than Project 2 because Project 3 has fewer hours and because it utilizes fewer relatively
higher paid plumbers. Total prevailing compensation (wages and benefits) was $44.62/hour for
plumbers (excluding HVAC) that worked on projects 2 and 3 in 2013. Total prevailing
compensation for sheet metal workers was $42.64/hour. As different trades are employed on
projects in different combinations, labor costs will vary from project to project. The relatively
simple examples used here illustrate this effect. The variation in labor costs increases as more
trades (laborers, apprentices, etc.) are utilized. This increases the difficulties in using certified
payroll data from one project to estimate the labor costs and bid of a future project.
Calculating Labor Costs Based on Incomplete Certified Payrolls
The analysis so far has used complete certified payroll information to demonstrate the
limitations of using these data to undercut bids or cause other competitive harm. While some
third-party requests for certified payrolls seek complete records, many data requests are made for
specific two or three-week periods. Certified payroll data for the Mechanical Contractor 2 for
plumbers and sheet metal workers engaged on Project 5 are used to illustrate the range of labor
cost estimates that can be calculated from different snap shots of a project.
Data reported in Table 6 are based on hours, wages, and benefits for reporting weeks 1
and 2, versus weeks 3 and 4. During weeks 1 and 2, plumbers, plumber apprentices, and sheet
metal workers were employed on the project. During this period total hours worked were
approximately 176 hours. During weeks 3 and 4 only plumbers and a plumber apprentice were

51
employed. Total hours worked equaled about 73 hours over this period. Total labor costs during
weeks 1 and 2 were approximately $6,200 compared to about $3,200 in weeks 3 and 4. This
illustrates that, depending on the period of the certified payroll, the estimate of labor costs can
vary significantly when incomplete payroll data are requested. A competitor attempting to use
partial certified payroll information would obtain significantly different estimates of project
labor costs depending on the payroll period.
Table 6: Certified Payroll Data for Selected Weeks. Project by Mechanical Contractor #2,
2013.
Payroll Period Total Hours Worked Total Payroll
Weeks 1 and 2 175.5 $6,193.56
Weeks 3 and 4 72.5 $3,193.44
Source: LCPtracker, City of Denver.
Conclusion
At first glance it may appear the certified payroll data could be used by a competitor to
undercut the future bids of a contractor participating in Davis-Bacon projects. However,
numerous factors conspire to make this an unproductive means of acquiring a competitive
advantage. For example, labor costs are typically a low percent of total construction costs
making this cost component of limited use in bid undercutting. Additionally, projects differ in
size and technical characteristics rendering one project a poor estimate of the costs of another.
Construction worker labor costs depend on, and vary with, the productivity of labor. Training
data from academic studies indicate that skill and experience levels among nonunion
construction workers vary widely. This suggests that worker productivity varies across

52
contractors. The wage data presented above indicates that worker productivity differs within a
company. These differences also contribute to the difficulty in accurately estimating labor costs.
The uneven payment of benefits and omission of the owner’s hours of work can also be
associated with difficulties in using payroll data to estimate labor costs. This estimation is also
compounded when different job classifications are used and when these ratios change over time.
Previous academic research indicates that a host of bidder and project characteristics (project
backlogs, bidder characteristics, and economic conditions) vary in such a way as to make bids a
moving target from project to project. Finally, the ratios of different job classifications that
contractors employ on a project vary with the technical characteristics of a project.
Consequently, the information on job classifications and hours worked contained in a certified
payroll do not reveal sensitive information regarding secret techniques employed by contractors.
Section 3: Uneven Reporting of Certified Payrolls
Comparison of the Level of Redaction in Certified Payroll Releases for Selected
Federal Agencies
As argued above, audits of certified payrolls are an important tool for enforcing
prevailing wage laws. In order to effectively audit compliance with prevailing wage
requirements, an inspector generally needs access to data on job classifications, daily and total
hours worked, rates of pay, fringe benefits, deductions, and net wages. Indeed, such information
is requested on the WH-347 form. To illustrate the differences in level of data released from
FOIA certified payroll requests, TCLG listed prevailing wage projects from five federal agencies
including the Department of Energy (DOE), Department of the Air Force (DAF), General
Services Administration (GSA), U.S. Army Corp. of Engineers (USACE), and the Department of

53
Veterans Affairs (DVA). These agencies represent the top five as measured by the volume of
FOIA requests made by TCLG. Appendix A documents the level of data released from 111
projects by these agencies (see pages 81-86).
In general the results in Appendix A demonstrate that redactions of certified payrolls are
not even across federal agencies. For example, the DOE commonly redacts almost everything
but job classifications and rates of pay in the projects listed. Such a high level of redaction
makes it impossible for auditors to inspect compliance with prevailing wages. There is one DOE
project, however, in which only personal and private information is redacted with the rest of the
information made available. That data suggests that DOE generally releases very little data, but
the level of release is uneven.
Compared to the DOE, the USACE releases virtually all relevant payroll data through a
certified payroll FOIA request. Similarly, the DOA, GSA, and DVA, release mostly un-redacted
certified payrolls, with a few exceptions.
The results suggest that most federal agencies release the information that is required to
adequately determine whether contractors are in compliance with Davis-Bacon prevailing wage
requirements. The notable exception is the DOE. If construction contractors were truly fearful
of harming their competitive position because of the release of certified payrolls, one would
expect that there would be significantly more redactions among other agencies as contractors
were trying to protect their competitive position, and that there would not be a concentration of
noncompliance found in only one agency.

54
Section 4: The Availability of Certified Payrolls through FOIA often
Results in Workers being Paid Back Wages
As previously discussed, the Davis-Bacon Act sets prevailing wage rates for federally
funded and federally assisted construction projects. Similarly, state-level prevailing wage laws
apply to projects using state funds. Such laws directly intervene in wage setting on public
construction projects by mandating specified wage rates and benefit contributions for a detailed
set of construction occupations. In addition, prevailing wage policies also mandate specific
ratios of journeymen to apprentices (Azari-Rad, Philips, and Prus 2003). Audits of certified
payrolls are an important tool for enforcing prevailing wage laws. This section of the report
details several examples of how the release of certified payrolls allowed auditors to uncover
violations which led to penalties and back-pay for workers.54
Case 1: Faith Technologies, Inc.
Faith Technologies is an electrical construction contractor incorporated in Wisconsin. It
was working as a subcontractor on the Irwin Army Community Hospital in Fort Riley, Kansas.
The contracting agency was the United States Army Corps of Engineers and the prime contractor
was Balfour-Walton (headquartered in Dallas, TX). Faith Technologies was working under a
registered apprenticeship program approved by the Department of Labor, which required a one-
to-one ratio of journeymen to apprentices.
Investigators found possible Davis-Bacon violations and requested certified payrolls for
the period between 7/18/2011 to 4/15/2012. The investigation yielded the following:
54
Details of the cases were provided by Torres Law & Consulting Group.

55
1. The correct wage determination was incorporated into the contract.
2. There were no violations of certified payrolls. Workers received the pay as indicated
under the prevailing wage guidelines and the hours were recorded correctly.
3. A violation occurred because the employer did not maintain the one-to-one ratio of
journeymen to apprentices on a number of days during the investigation period. There
were too many apprentices in relation to the journeymen. The remedy under Davis-
Bacon is to pay the apprentices not paired with a journeyman, or the last apprentices
hired, at the journeymen rate.
4. The total back compensation due to seven employees totaled $12,415.63 in back
wages and $4,221.22 in back fringe benefits.
Case 2: Faith Technologies, Bergelectric Corp., and International Electric, Inc.
This case also involved Faith Technologies and two other sub-contractors (Bergelectric
and International Electric) that were working on the hospital on the Fort Irwin Army base.
TCLG requested and received certified payrolls from Faith Technologies, Inc. commencing
November 25, 2011 through December 25, 2011. Investigators found the following compliance
failures:
1. Apprentices working out of ratio to journeymen.
2. Possible overtime violations.
3. Possible under-reporting of hours of work.
4. Total underpayment of wages of $11,042.62.

56
TCLG requested and received certified payrolls from International Electric commencing
November 28, 2011 through April 1, 2012. Investigators found the following compliance
failures:
1. Failure to pay prevailing wages amounting to $228.30.
TCLG requested and received certified payrolls from Bergelectric commencing
November 28, 2011 through December 25, 2011 and payrolls commencing March 5, 2012
through April 15, 2012. Investigators found the following compliance failures:
1. Employees paid on a salary basis in violation of the Davis-Bacon Act.
2. Reporting irregularities in which net wages are higher than gross wages, suggesting
unreported hours not on the certified payroll.
3. Irregularities in reporting fringe benefits.
4. Noncompliance suspected but not enough evidence to compute back wages owed.
Case 3: THECO, a division of Tom Hagen Enterprises
THECO provided work as a subcontractor on the Albuquerque Public Schools’ Westside
Sports Complex. THECO was subcontracted by Shumate Constructors, Inc. to provide electrical
needs for the project. TCLG investigated violations of the Davis-Bacon Act in which THECO
paid state prevailing wages rather than federal prevailing wages. Bid requirements mandated
that the federal rate should apply if it is higher than the state rate. The federal rate was indeed
higher by $3.00 per hour. TCLG requested and received certified payrolls commencing May 6,
2012 through July 28, 2012. The investigation revealed that THECO underpaid all its workers

57
on the project by $3.00 per hour for the entire project, amounting to $1,727.05 in back pay. A
more comprehensive review of THECO’s pay practices by TCLG led to a finding of $30,673.97
due in back wages.
Case 4: Wilson Electric Services Corporation
Wilson Electric Services Corporation was a subcontractor on the McKinley County
Courthouse. A DOL audit of payrolls from July 20, 2012 to January 3, 2014 found several
violations of the Davis-Bacon Act related to apprentices not working alongside journeymen.
When an apprentice is working alone, she/he is entitled to journeymen’s wages. Four instances
of underpayment were found amounting to $440.90 in back wages and $900.00 in fines.
The case studies demonstrate that the release of certified payrolls available under FOIA
allows auditors to uncover violations, which lead to penalties and materially significant back-pay
for workers.
Section 5: Low-Bid Contracting is becoming Increasingly Rare in
Construction Procurement
The release of certified payrolls through a FOIA request conceivably becomes more
useful to a possible competitor in cases where the lowest bid prevails. If bids are won or lost
based on something other than low bid, however, knowledge of a competitor’s certified payrolls
becomes less useful in a gaining competitive advantage. Although much of public sector
procurement is still conducted on the basis of low bid, a growing movement toward best value

58
contracting (BVC) is emerging in the public sector. BVC allows the contracting agency to
consider factors other than lowest bid (e.g. Sonn and Gebreselassie 2009; National Alliance for
Fair Contracting 2010). For example, cost, schedule, quality management, safety, and technical
ability are often bid considerations under BVC policies. Past performance, training, provision of
health insurance to workers, safety performance, and benefits to the local economy may also be
considered.55
Scott, Molenar, Gransberg, and Smith (2006: 6-8) also document the trend
suggesting, for example, that all GSA procurement is based on best value concepts.
To the authors’ knowledge there is no comprehensive study of the incidence of BVC or
responsible contracting policies (see Waddoups and May 20014). However, there are examples
of more narrowly-defined studies. For example, the Scott et al. (2006; Appendix B) list several
states whose Department of Transportation appear to allow for BVC as of 2006. The states
include Alaska, Delaware, Hawaii, Maryland, Minnesota, Montana, New Hampshire, North
Carolina, Oregon, Rhode Island, and Virginia. According to a PowerPoint presentation posted
by the Laborers-Employers Cooperation and Education Trust (n.d.), BVC is used in “50% or
more new federal construction projects.” The presentation also indicates that BVC statutes have
passed in Delaware, California, and Oregon. Since the time of these studies, other states have
adapted BVC legislation. During the 2013 legislative session, Colorado introduced a best value
bidding policy requiring the consideration of price, past performance, and experience, etc. for
public works projects funded by the state. This bid preference policy also includes the
consideration of domestic content and at least 80% Colorado resident employment on state-
funded public works construction.56
In 2013 and 2014, the Minnesota state legislature
55
For a complete discussion of best value contracting especially as it is applied to highway construction see (Scott,
Molenar, Gransberg, and Smith 2006. 56
See HB13-1292 accessed at: https://www.colorado.gov/pacific/sites/default/files/House%20Bill%2013-1292.pdf

59
introduced legislation allowing for bid awards to the lowest bidder or to the contractor providing
the best value. Best value considerations in this state also include performance on previous
projects, customer satisfaction, and cost containment, etc.57
In contrast to the public sector, private sector contracting agencies have long recognized
that simply awarding construction contracts to the lowest bidder can lead to suboptimal results.
Instead of following the typical public sector approach that relies on competitive bidding that is
open to all prequalified bidders, private owners of construction projects often choose to award
projects to selected contractors. Criteria for contractor selection may be based on reputation,
expertise, record of meeting deadlines, past experience with the project owner, and cost, etc. (see
Hendrickson 2008).
Even if a competitor’s labor costs were an important piece of information obtainable
through certified payrolls, the evidence suggests that such information is less important in the
private sector and becoming less important in the public sector which is moving toward best
value contracting. The implication is that in much of the construction industry, knowledge of a
competitor’s labor costs, as found in certified payrolls, will not be helpful in winning bids.
Section 6: Publicly Available Bid Results from State Departments of
Transportation.
The Federal Highway Administration (FHWA) requires state departments of
transportation to provide the FHWA with bid results on federally funded projects including
57
See 16C.28 Contracts Award accessed at: https://www.revisor.leg.state.mn.us/statutes/?id=16C.28.

60
detailed bid prices for each of the items included in the project.58
Departments of transportation
are also required to provide bid item details for at least the three lowest acceptable bids and total
amounts of all acceptable bids. All state departments of transportation make some of this
information available to the public.59
The type of information released by departments of
transportation is reported in Table 7.
The released bid information reported in Table7 varies from state to state. All states
provide the name and bid of the contractor that was awarded the project. Most states also report
the bids of each participating contractor. Twenty-five departments also provide the contractor
bid prices on each of the detailed items listed in the bid. These bid items identify each of the
specific tasks included in the project. The total bid is the sum of the item prices.60
Eighteen
states also release the department’s engineer’s estimate. This is the department’s estimate of the
cost of the project. The timing of the release of this information to the public varies by state.
Some departments of transportation release the information 30 minutes to a few days after the
opening of bids. Most departments release the information shortly (a month or two) after the
project is formally awarded to the winning contractor. Regardless of these differences all
participating contractors receive timely information on the winning bid and are able to determine
differences between winning and losing bids.
58
See regulation 23 CFR 635.113, accessed at: http://www.gpo.gov/fdsys/pkg/CFR-2011-title23-vol1/pdf/CFR-
2011-title23-vol1-sec635-113.pdf. 59
Information collected from the department of transportation for each state. 60
For an example, see Bid Results for Recently Let Projects, Colorado Department of Transportation. Accessed at:
http://www.coloradodot.info/business/bidding/Bid%20Results.

61
Table 7: Publicly Released Bid Results from State Departments of Transportation for
Highway Construction.
State Public Bid
Archive
Names and Bids of
Contractors
Prices of Bid Items Engineer’s Estimate Reported
Alabama X X X –
Alaska X X – X
Arizona X X X X
Arkansas X X X X
California X X X X
Colorado X X X X
Connecticut X X – –
Delaware X X X X
Florida X X X –
Georgia X X – –
Hawaii X X – –
Idaho X X – –
Illinois X X – –
Indiana X X X X
Iowa X X X –
Kansas X X X –
Kentucky X X X X
Louisiana X X X X
Maine X X – –
Maryland X X – –
Massachusetts X X – –
Michigan X X X X
Minnesota X X – –
Mississippi X X – X
Missouri X X – –
Montana X X – X
Nebraska X X X –
Nevada X X – –
New Hampshire X X X –
New Jersey X X – –
New Mexico X X X –
New York X X – –
North Carolina X X – –
North Dakota X X – X
Ohio X X – X
Oklahoma X X – –
Oregon X X – –
Pennsylvania X X – –
Rhode Island X X X X
South Carolina X X X –
South Dakota X X – X
Tennessee X X – X
Texas X X X –
Utah X X X –
Vermont X X X –
Virginia X X X –
Washington X X X –
West Virginia X X X –
Wisconsin X X X –
Wyoming X X – X
Source: Information obtained from each state department of transportation.
An official from the Colorado Department of Transportation (CDOT) indicated that
“disclosure of the bid tabs serves to improve the competition on our bids for both general

62
contractors and their subcontractors.” CDOT is one of the departments that releases the names
and bids of all participating contractors (on federally and state funded highway construction), the
engineer’s estimate, and the contractor’s bid for each of the listed items.61
Some of the
information from a CDOT bid tabulation is reported in Table 8.
Table 8: Information from a CDOT Bid Tabulation, Federal Highway Maintenance
Project, 2014.
Contractor Bid Cost Item: Asphalt
Removal
Item: Excavation
APC Southern
Construction Co. LLC
$9,455,860.78 $556,903.00 $81,440.70
A+S Construction Co, $9,827,077.48 $827,128.80 $200,100.00
Difference = $371,216.70 $270,225.80 $118,659.30
Engineer’s Estimate $9,943,738.18 $948,606.00 $133,400.00
Source: Bid Results for Recently Let Projects, CDOT.
This information is for a highway maintenance (resurfacing) project on I-25 in rural,
southeastern Colorado. Since the work on this interstate highway is federally funded, Davis-
Bacon prevailing wages apply. This highway project requires resurfacing of approximately 10
miles of the highway. The contract letting date was on March 13, 2014 with a completion date
on October 31, 2014. This resurfacing project required milling (asphalt removal), paving,
rebuilding the bridge approach, and minor repairs to 10 structures. Two contractors bid on this
project. The total bids for each contractor, the difference between their bids, prices for two
selected items listed in the bid, and CDOT’s engineer’s estimate are included in Table 8. Each
of the bids is less than CDOT’s cost estimate. The bid by APC Southern Construction Co. was
approximately 95.1% of the engineer’s estimate while the bid from A+S Southern Construction
Co, was about 98.8%. APC Southern Construction Co. was awarded this project with a bid of
61
Ibid.

63
approximately $9.5 million that was about $371,000 lower than the bid by A+S Southern
Construction Co. For illustration, we have included two of the 90 items listed in the project bid
tabulation. APC Southern Construction Co. included in their bid an estimated cost of
approximately $557,000 for the removal of asphalt and about $81,000 for excavation work. The
bids by A+S Construction Co. exceeded the estimates of the winning contractor for these two
items by about $389,000 (the sum of the differences for these two items or $270,225.80 +
$118,659.30).
The information reported in the bid tabulations can be used by both contractors when
considering future bids. For example, A+S Construction Co. can readily determine that the item
prices for asphalt removal and excavation on this project were extraordinarily high and that
differences in the prices of these items cost this contractor the project award. An examination of
bid tabs from other resurfacing projects involving APC Construction Co. can be used by A+S
Construction Co. to determine if these or other item prices should be re-evaluated to become
more competitive. On the other hand, the bid results allow APC Southern Construction Co. to
determine their winning margin for this and other projects. For example, this contractor can use
this information to determine if they are “leaving money on the table,” with bids that are
consistently too low.
The bid results that are released by departments of transportation contain far more
information, and more accurate information, about how a contractor won a bid than can be
obtained from the labor cost information contained in a certified payroll. The information
released by departments of transportation reveal how much a bid was won by and may also
contain detailed information on differences in the components (items) between winning and
losing bids. As discussed above, the labor cost information reported in a certified payroll is

64
based on the number of hours required to complete the project. Work hours needed to complete
a project may deviate from the hours estimated in the bid due to change orders, and off-site
work, etc. Additionally, since labor costs are typically a low percent of total construction costs
and bids, these costs are only one factor that determines the bid amount.
State departments of transportation routinely release bid information without apparent
harm to contractors. For example, in an examination of highway resurfacing projects in
Colorado between 2000 and 2011, Duncan (forthcoming) finds that of the 132 resurfacing
projects funded by the State of Colorado and the federal government, 115 of the projects were
completed by contractors who won more than one resurfacing contract over the period. If the
release of sensitive bid information is associated with ruinous competition, we would expect far
less repeat business by contractors.
Section 7: The Davis-Bacon Act, Prevailing Wage Policies, and
Construction Costs
Introduction
This section of the report summarizes the literature on how prevailing wage policies
affect construction costs. The preponderance of the recent studies indicates that prevailing wage
laws are not associated with increased construction costs. Other studies examining the effects of
prevailing wage policies on the efficiency of construction find that productivity is higher on
prevailing wage projects. Increased productivity is consistent with stable construction costs on
prevailing wage projects. Early, first generation studies examining the cost impact of prevailing

65
wage laws found modest positive impact of the wage policy on construction costs. However,
these studies suffer from flaws in statistical methodology and shortcomings in data.
First Generation Studies
Early studies of the cost effects of prevailing wage laws relied on an intuitive approach
where the difference between prevailing wage rates and open shop rates are used to calculate the
increase in project labor costs and total construction costs on a prevailing wage project (see
Gujarati 1967; GAO 1979, 1981; Goldfarb and Morrall 1978, 1981; Gould 1971; and for a more
recent example, Keller and Hartman 2001).62
This method is based on the assumption that the
number of construction workers employed on the project and construction worker productivity
does not change with wage rates. This is an intuitive approach and is consistent with the view
that if wage rates increase, so will total construction costs. Bilginsoy and Philips (2000) indicate
that the bulk of these studies suggest that prevailing wage requirements increase construction
costs from 1.5% to 3.0%. Even though these studies suggest a small cost effect, the method
employed provides an estimate that is too high. For example, the employment and productivity
of construction workers varies with wage rates in ways that reduces the cost impact measured by
the intuitive method (see Duncan, Philips, and Prus [forthcoming] for an illustration). Despite
the methodological errors of this approach, it is often used as evidence in the policy debate
regarding prevailing wage laws (see Philips 2014).
62
The following early studies are exceptions to this method. Allen (1983) adjusts his cost estimate for factor
substitution. He still finds a modest Davis-Bacon cost impact of 0.3% to 0.4%. Thieblot (1975) pursues a unique
approach by taking advantage of President Nixon’s temporary suspension of the Davis-Bacon Act in 1971.
Thieblot’s examination of the rebids allowed during the suspension suggests that the absence of the Davis-Bacon
wage requirements reduced costs on federal projects by 0.63%. Thieblot’s re-examination of the data indicates that
a repeal of the Act would result in a cost savings of 4.74% (see Thieblot 1986, 105-106).
66
Second Generation Studies: Cost Estimates using Regression Analysis
More recent studies rely on more advanced statistical techniques and improved
methodology to examine the effect of prevailing wages in construction costs (e.g., Azari-Rad,
Philips, and Prus 2003; Bilginsoy and Philips 2000; Duncan, Philips, and Prus 2009,
forthcoming; Duncan and Prus 2005; Duncan forthcoming; Dunn, Quigley, and Rosenthal 2005;
Fraundorf, Farrell, and Mason 1984). A major theme emerging from this research has been the
problem of adequately controlling for differences across construction projects that may not be
taken into account by the researcher. For example, if construction projects subject to the
prevailing wage requirements are systematically different than those not subject to them in ways
that are not observed by the researcher (or captured in the data), estimates of the prevailing wage
effect may be biased. In other words, comparing prevailing wage projects with other projects
may be like making a proverbial apples-to-oranges comparison.
To be more specific, ideally the researcher will be able to compare costs of projects that
are exactly the same except that one is subject to a prevailing wage policy and the other is not. A
good example of such an apples-to-oranges comparison is found in the study by Fraundorf,
Farrell, and Mason (1984), who compared public construction projects, which were subject to
prevailing wage requirements, to private projects, which were not. The study found construction
bid costs (as measured by construction bid prices reported in face-to-face interviews with the
researchers) to be 26% to 35% higher in projects subject to prevailing wage requirements. The
authors ascribed this cost difference to the effect of prevailing wage requirements.

67
There are several problems with this study and its conclusions. First, the Economic
Census of Construction indicates that labor costs were approximately 30% of total construction
costs at the time of the study by Fraundorf et al. It is unlikely that higher costs of the labor input,
which is roughly 30% of the total, would increase total costs from 26% to 35%. A better
explanation of the higher costs of federal projects is that many factors other than prevailing wage
standards, such as other federal regulations, and construction practices on federal projects,
influence the total construction cost of projects funded by the U.S. government. For example,
the greater life expectancy and higher quality components used in public construction may be
associated with higher costs. Unfortunately, the data used by Fraundorf, Farrell, and Mason
(1984) do not allow the researcher to make the kind of distinctions necessary to separate other
influences from the effect of the prevailing wage law.
Other studies have attempted to improve on the estimates of prevailing wage
requirements by making something more closely akin to an apples-to-apples comparison. A
number of articles confined their samples to school construction projects. Because school
construction projects are very similar from project to project, focusing on schools that were built
under prevailing wages and comparing them to those that were not constructed under the policy,
allows the researcher to more carefully isolate the potential cost effect of wage requirements. In
the first study of prevailing wage laws and school construction costs, Bilginsoy and Philips
(2000) examine the impact of British Columbia’s Skill Development and Fair Wage Policy
(SDFWP) of 1992, which is similar to prevailing wage policies in the U.S. In a comparison of
arithmetic means of construction costs before and after the policy, omitting controls for project
characteristics, the researchers found a 16 percent higher cost among projects built under the
SDFWP. After using regression analysis to control for a number of factors, including the
68
construction business cycle, number of competitors, type of school, and a time trend, the
construction bid costs under the policy were not statistically different than those built outside the
jurisdiction of the prevailing wage-like policy. Duncan, Philips, and Prus (forthcoming) also
examine the effect of British Columbia’s prevailing wage standard and include a control group of
private school projects. This analysis indicates that before the introduction of the prevailing
wage policy, construction costs for public schools was approximately 40% more expensive than
the costs of comparable private schools. This cost differential did not change after the wage
policy was introduced. This indicates that prevailing wage requirements do not affect the
relative construction costs of building public schools. In similar work, Azari-Rad, Philips, and
Prus (2003) modeled bid costs of school construction projects in the U.S. as a function of
whether they were built in a state with a prevailing wage law. After controlling for other
relevant factors, they found no evidence that schools built in states that had prevailing wage laws
were more costly.
The results of these studies are consistent with a more recent study of five northern
California cities by Philips and Kim (2009). In an examination of public works projects in five
northern California cities (Palo Alto, Mountain View, San Carlos, San Jose, and Sunnyvale) with
different municipal prevailing wage laws, the authors find no evidence that wage policies affect
the bid process or outcome in a way that increases construction costs. For example, the results
do not support the view that wage policies discourage bidding by nonunion contractors, reduce
the number of bidders, or prevent nonunion contractors from winning bids on prevailing wage
projects. Additionally, these authors find no statistically significant differences between the
winning bid and two measures of project costs (the engineer’s estimate and the median bid).

69
Their findings indicate that prevailing wage laws of northern California cities are not associated
with higher construction costs.
Not all studies are as sanguine about the negligible impacts of prevailing wage policies
on construction costs. Dunn, Quigley, and Rosenthal (2005), for example, used data on public
housing projects in California to find that prevailing wage requirements increased public housing
projects’ total costs by between 9.5% and 35.9%, depending on the specification of the model.
There are, however, several problems with the study. First, data from the Economic Census of
Construction indicates that construction labor costs range from 25% to 30% of total construction
costs. Consequently, it is unlikely that the total cost of construction would fall by up to 38%
from a regulatory change that primarily affects a cost component that accounts for only 25% to
30% of total costs.63
Second, the study is based on an examination of residential projects subsidized by the
California Low Income Housing Tax Credit and covered by the state prevailing wage law. The
Office of the Legislative Auditor, State of Minnesota (2007) has criticized this report on the basis
that the cost of the publicly funded projects included in this study may have been influenced by
prevailing wage laws and by other factors such as more exacting HUD construction standards
that may also affect construction costs. However, these additional factors are not considered
separately from prevailing wage effects. The result is that the prevailing wage policy gets the
blame for higher wages, when it is likely that the HUD standards and other characteristics raised
the costs.
63
The authors provide ‘rough’ data specific to housing construction in selected California cites indicating that
labor’s share of construction costs range from 42% to 46% of total costs. Even if labor costs are 46% of total costs,
it is unrealistic to assume that total costs would fall by up to 38%. The implication is that labor’s share of total costs
would fall from 46% to about 17% (0.46 x 0.38 reduction if the wage laws was repealed). This figure for labor’s
share of total cost (17%) is unrealistically too low.

70
Third, the study is based on a sample of 205 residential projects, yet the authors can only
identify if the prevailing wage law applies or does not apply to 175 of the projects. Yet the 30
unidentified projects are still included in the sample. An appropriate statistical test would be
based on the sample of 175 projects because the inclusion of the unidentified projects may bias
the cost estimate. Interestingly, Kessler and Katz (2001) find that repeal of state prevailing wage
laws reduced wages of construction workers by a modest 4.5%, which appears to be inconsistent
with Dunn, Quigley and Rosenthal (2005). Even assuming that everything else were equal in
prevailing wage and non-prevailing wage projects, a 4.5% decrease in wages is not going to
yield a large drop in construction costs.
More recently, Duncan (forthcoming) examines the cost of state and federally funded
highway maintenance projects in Colorado. All federally funded highway projects require the
payment of Davis-Bacon prevailing wage rates, adherence to disadvantaged business enterprise
(hereinafter, DBE) targets, and compliance with anti-discrimination and disability regulations.
Projects funded by the Department of Transportation of the State of Colorado require the same
federal discrimination and disability regulations. So the comparison between state and federally
funded highway maintenance projects is an examination of the effect of DBE and Davis-Bacon
requirements on project costs. Duncan finds that while federal projects are larger and more
complex, there is no statistically significant cost difference between state and federal projects
once size and complexity differences are taken into account. Duncan also finds that the level of
bid competition is the same for state and federal projects. This indicates that the combined effect
of DBE and Davis-Bacon requirements do not affect the level of bid competition on federally
funded construction.
71
Third Generation Studies
As mentioned above, possible reactions to prevailing wage policies are changes to the
crew mix, substituting equipment for labor, and other changes that alter the productivity and
efficiency of construction. This is the focus of third generation studies that apply a method of
estimating production efficiency (stochastic frontier regression) to the topic of prevailing wage
laws. For example, in an examination of the effect of prevailing wage laws on construction
efficiency in British Columbia, Canada, Duncan, Philips, and Prus (2006) find that prior to the
introduction of the wage legislation, public school projects were from 16% to 19% smaller, in
terms of square feet, than comparable private structures. This size differential did not change
after the policy was in effect. These results suggest that prevailing wage requirements do not
alter labor or other input utilization in a way that significantly affects the relative size of covered
and uncovered projects.
In a follow-up to this study the authors use data from public school projects in British
Columbia to provide a more direct test of the effect of prevailing wage policies on the efficiency
of construction (see Duncan, Philips, and Prus 2008a and 2009). Results indicate that average
technical efficiency for all construction projects included in the sample is 94.6% (100% is
optimal efficiency in terms of maximizing output from inputs). Average efficiency for projects
covered by the introductory stage of British Columbia’s construction wage legislation is 86.6%.
This policy mandated apprenticeship training requiring journeymen to divide time between
teaching and building. This can explain the decrease in efficiency when the policy was
introduced. However, by the time of the expansion of the policy 17 months later, the average
efficiency of covered projects increased to 99.8%. These findings suggest that the introduction
of prevailing wage laws disrupted construction efficiency. However, in a relatively short period

72
of time, the construction industry adjusted to wage requirements by increasing overall
construction efficiency in a way that is consistent with stable costs.
Economic Benefits of Prevailing Wage Laws
One of the motivations for prevailing wage legislation is to protect local labor standards
from public procurement auctions based on the lowest bid. Prevailing wage laws may be
associated with positive economic impacts through increased construction worker earnings and
increased construction worker employment in the area where the work is completed. For
example, Philips and Bilginsoy (2010) measure the effect of the state-level prevailing wage
standard on the Connecticut economy by measuring the change in average construction worker
income if the Connecticut wage law is suspended. These authors calculate that suspension of the
wage standard would be associated with a 4% decrease in construction sector earnings and a
corresponding decrease in state-wide economic activity of approximately $214 million. See
Kelsay, Sturgeon, and Pinkham 2011, Philips and Bilginsoy 2010, Greenberg, et al. 2005 and
Belman and Voos 1995 for other examples of this approach.
Others examine the effect of prevailing wage standards on the flow of “new dollars” and
spending into an area when prevailing wages apply. For example, Duncan (2011) examines the
impact of libraries built with and without prevailing wage policies in Santa Clara County,
California. He finds that 39% of the subcontractors employed on prevailing wage projects are
located in Santa Clara County. Only 23% of subcontractors are located in Santa Clara County
for projects that are not covered by the wage policy. Since local contractors are more likely to
employ county-resident construction workers, the wage policy prevents local tax dollars used in

73
public construction from leaking out of the county. Duncan finds that the construction of 16
libraries, costing about $177 million, under the local prevailing wage policy increased county
economic activity by about $11 million, created over 100 local jobs, and increased tax revenue in
the county by over $127,000.
More recently, Duncan and Lantsberg (forthcoming) measure the economic impact of
California’s state-level prevailing wage law. These authors find that prevailing wage policies
change construction spending in various ways, but the overall effect is a net increase in in-state
spending. For example, there is less spending on out-of-state contractors in states with
prevailing wage laws. Also, prevailing wages alter the distribution of income. Construction
worker wages and benefits are higher and contractor profits are lower when a prevailing wage
applies. This change in the distribution of income is associated with more spending in California
as lower-income construction workers spend more in the state than higher-earning owners of
contracting firms. Overall, the economic impact of California’s prevailing wage law creates
approximately 30,000 jobs annually, pumps about $2.5 billion in additional labor income into the
state as well as over $6.6 billion in value added.
In other research that examines the benefits of prevailing wage laws, Waddoups (2005)
explored the connection between the lack of employment-based health insurance and the
disproportionate uncompensated care costs that accrue to public hospitals and, by extension, the
community. In particular, the study documented the particularly low incidence of employment
based health insurance among construction workers and the corresponding disproportionately
high incidence of uncompensated care among construction workers at a local public hospital.
The findings clearly demonstrate that a large share of uncompensated care is attributable to the
construction industry relative to its size, which means that local taxes supporting the hospital are

74
higher than they would be otherwise. To the extent that cross-subsidies from paying patients
cover uncompensated care costs, prices of health care, and therefore insurance prices, are higher
than they would be without the high levels of uncompensated care.
Related Research: Cost Effects of Project Labor Agreements and Responsible
Bidding Policies
Like prevailing wage laws, project labor agreements also provide institutional support for
higher wages and more fringe benefits to construction workers. These agreements could
potentially raise construction costs. A project labor agreement (PLA) is collectively bargained
by project owners and building trades unions for certain, usually large, construction projects.
Such agreements require successful bidders, whether union or nonunion, to adhere to provisions
of the agreement, such as union hiring hall referral and collectively bargained compensation
packages, that apply only to the specified project (Belman et al. 2010).
To test whether project labor agreements raise costs Belman et al. (2010) gathered data
on school construction projects in Massachusetts. Some of the projects were conducted under
PLAs, while others were not. Although comparisons of mean construction costs in the PLA and
non-PLA groups initially indicated statistically significant higher total construction costs
associated with PLA schools, once more detailed characteristics of the buildings were accounted
for, the estimate on the PLA variable dropped approximately 40% (from an estimate of 17% to
10%) and became statistically insignificant. When a control for whether the project was built in
Boston was added, the size of the coefficient and t-statistic fell still further, indicating that PLAs
likely exerted little or no effect on construction costs.

75
In similar research, Waddoups and May (2014) address whether bid costs for schools
built in the state of Ohio between 1997 and 2008 were affected by responsible contractor policies
(RCP) that were adopted by some school districts. Like prevailing wage laws, critics argue that
RCPs, which extend bid requirements to include the provision of health insurance, pension
contributions, training, and other community and workforce criteria, raise labor costs. While
some schools in Ohio were built under such policies, others were not. A comparison of the two
groups, using regression analysis, found that once variation in geographic location of schools is
accounted for, RCPs exert no statistically discernible impact on construction bid costs. These
results are similar to findings in the prevailing wage literature.
Conclusion
Careful analysis of the impact of prevailing wage requirements on construction costs
reveals that there is no consistent evidence of an impact of prevailing wage policies on
construction costs. Other policy interventions such as project labor agreements and responsible
bidding policies, which also raise employment standards in construction, arrive at similar
conclusions. It appears as if contractors faced with prevailing wage and other requirements
deploy a combination of strategies to respond to higher compensation, which includes increasing
productivity through heightened managerial efficiency, the substitution of equipment for labor,
and/or the employment of labor with more training.

76
References
Allen, Steven. 1983. “Much Ado About Davis-Bacon: A Critical Review and New Evidence,”
Journal of Law and Economics, Vol. 2, No. 3, pp. 707-736.
Azari-Rad, H., Philips, P., and Prus, M. 2005. The Economics of Prevailing Wage Laws, Ashgate
Publishing Co., Burlington, VT.
Azari-Rad, Hamid, Peter Philips and Mark Prus. 2003 ‘State Prevailing Wage Laws and School
Construction Costs.’ Industrial Relations, Vol. 42, No. 3, pp. 445-457.
Balat, J. 2012. Highway Procurement and the Stimulus Package: Identification and
Estimation of Dynamic Auctions with Unobserved Heterogeneity. Working Paper.
Belman, Dale, Russell Ormiston, William Schriver, Richard Kelso and Kenneth A. Frank. 2010.
"The Effects of Project Labor Agreements on School Construction Costs in
Massachusetts." Industrial Relations, Vol. 9, No. 1, pp. 44-60.
Belman, D. and Voos, P. 1995. “Prevailing Wage Laws in Construction: The Costs of Repeal to
Wisconsin.” Institute for Wisconsin’s Future.
Bilginsoy, Cihan. 2007. “Delivering Skills: Apprenticeship Program Sponsorship and
Transition from Training.” Industrial Relations, vol. 46, No. 4, pp. 738-765.
Bilginsoy, Cihan and Peter Philips. 2000 ‘Prevailing Wage Regulations and School Construction
Costs: Evidence from British Columbia.’ Journal of Education Finance, Vol. 24, 415-
432.
Bourdon, Clinton C. and Raymond E. Levitt. 1980. Union and Open Shop Construction.
(Lexington, MA: Lexington Books).
De Silva, D., Dunne, T. and Kosmopoulou, G. 2003. “An Examination of Entrant and
Incumbent Bidding in Road Construction Auctions.” The Journal of Industrial
Economics, Vol. 21, No. 3, pp 295-316.
Duncan, K. Forthcoming. “The Effect of Federal Davis-Bacon and Disadvantaged Business
Enterprise Regulations on Highway Maintenance Costs.” Scheduled to appear in
Industrial and Labor Relations Review, Vol. 68, No. 1, (January) 2015.
______. 2011. “An Illustration of the Impact on the Santa Clara County Economy of Repealing
the Prevailing Wage Policy of the City of San Jose.” Project Submitted to Working
Partnerships USA. February 11, 2011.
Duncan, K. and Lantsberg, A. Forthcoming. The Impacts of Prevailing Wages Across
California’s Economy. Project submitted to Smart Cities Prevail. Scheduled for release
on September 1, 2014.

77
Duncan, K., Philips, P., and Prus, M. Forthcoming. “Prevailing Wage Regulations and School
Construction Costs: Cumulative Evidence from British Columbia.” Scheduled to appear
in Industrial Relations, fall 2014.
_____. 2012. “Using Stochastic Frontier Regression to Estimate the Construction Cost
Efficiency of Prevailing Wage Laws.” Engineering, Construction and Architectural
Management, Vo. 19, No. 3, pp 320-334.
_____. 2009. “The Effects of Prevailing Wage Regulations on Construction Efficiency in British
Columbia,” International Journal of Construction Education and Research, Vol. 5, No.1,
pp. 63-78.
_____. 2008a. “Prevailing Wage Laws, Productivity and Construction Efficiency?” CME25
Conference. Proceedings of the Inaugural Construction Management and Economics,
“Past, Present, and Future” Conference. Edited by Will Hughes. 2008, pp 1411-1418.
ISBN 978-0-415-46059-0 (3 vols.).
_____. 2008b. “The Union Threat Effect in Construction: An Illustration with Data from
Plumber and Pipefitter Union Locals.” Working Paper No. 0804, Department of
Economics, University of Otago, New Zealand.
______. 2006. “Prevailing Wage Legislation and Public School Construction Efficiency: A
Stochastic Frontier Approach,” Construction Management and Economics, Vol. 24, June
2006. pp. 625-634.
Duncan, K. and Prus, M. 2005. “Prevailing Wage Laws and Construction Costs: Evidence from
British Columbia’s Skills Development and Fair Wage Policy” in The Economics of
Prevailing Wage Laws, Azari-Rad, Hamid, Philips, Peter and Prus, Mark, eds.
(Aldershot, G.B.: Ashgate), pp. 123-148.
Dunn, S., Quigley, J., and Rosenthal, L. 2005. “The Effect of Prevailing Wage Regulations on
the Cost of Low-Income Housing,” Industrial Relations, Vol. 59, No. 1, pp. 141-157.
Flambard, Veronique and Isabelle Perrigne. 2006. Asymmetry in Procurement Auctions:
Evidence from Snow Removal Contracts.” The Economic Journal, 116, 1014-1036.
Fraundorf, Martha, John P. Farrell and Robert Mason. 1984. ‘The Effect of the Davis-Bacon Act
on Construction Costs in Rural Areas.’ The Review of Economics and Statistics, 66, 142-
146.
GAO. 1979. The Davis-Bacon Act Should Be Repealed, Washington, D.C. Analysis of
Prevailing Wage Laws (Washington, D.C.: American Enterprise Institute for Public
Policy Research).

78
_____. 1981. Modifying the Davis-Bacon Act: Implications for the Labor Market and the
Federal Budget, Washington, D.C.
Goldfarb, Robert S. and John F. Morrall, 1981. ‘The Davis-Bacon Act: An Appraisal of Recent
Studies.’ Industrial and Labor Relations Review, Vol. 34, pp. 191-206.
Goldfarb, John and John F. Morrall.1978, ‘The Cost Implications of Changing Davis-Bacon
Administration.’ Policy Analysis, Vol. 4, pp. 439-453.
Gould, John P. 1971. Davis-Bacon Act: The Economics of Prevailing Wage Laws (Washington,
D.C.: American Enterprise Institute for Public Policy Research).
Greenberg, M., Mantell, N., Lahr, M., Frisch, M., White, K. and Kehler, D. (2005). “Evaluating
the Economic Effects of a New State-Funded School Building Program: The Prevailing
Wage Issue.” Evaluation and Program Planning, Vol. 28, pp. 33-45.
Gugler, Klaus, Weichselbaumer, Michael, and Zulehner, Christine. 2013. “Competition in the
Economic Crisis: Analysis of Procurement Auctions. Paper presented at the European
Economic Association & Econometric Society, 2013 Parallel Meetings 26 - 30 August
2013, Gothenburg, Sweden. Accessed at: http://www.eea-esem.com/eea-
esem/2013/m/viewpaper.asp?pid=2501.
Gujarati, D.N. 1967. ‘The Economics of the Davis-Bacon Act.’ Journal of Business Vol. 40, pp.
303-316.
Hendrickson, Chris. 2008. “Project Management for Construction. Fundamental Concepts for
Owners, Engineers, Architects, and Bidders.” Department of Civil and Environmental
Engineering, Carnegie Melon University, Pittsburg, PA. Accessed at:
http://pmbook.ce.cmu.edu/
Jofre-Bonet, Mireia and Pesendorfer, Martin. 2000. “Bidding Behavior in a Repeated
Procurement Auction: A Summary.” European Economic Review, 44 (4-6): 1006-1020.
_____. 2001. Estimation of a dynamic auction game. Working paper, Yale University.
_____. 2003. “Estimation of a Dynamic Auction Game.” Econometrica, Vol. 71, No.
5, pp. 1443-1489.
Keller, Edward C. and William T. Hartman. 2001 ‘Prevailing Wage Rates: the Effects on School
Construction Costs, Levels of Taxation, and State Reimbursements,’ Journal of
Education Finance, Vol. 27, pp. 713-728.
Kelsay, M., Sturgeon, J., and Pinkham, K. 2011. “The Adverse Economic Impact from Repeal
of the Prevailing Wage Law in Missouri.” Department of Economics, University of
Missouri – Kansas City. Study Funded by the Council for Promoting American
Business.

79
Kessler, Daniel P. and Lawrence F. Katz. 2001. "Prevailing Wage Laws and Construction Labor
Markets." Industrial & Labor Relations Review, Vol. 54, No. 2, pp. 259-74
Li, Sheng and Peter Philips. 2012. Construction Procurement Auctions: Do Entrant Bidders
Employ More Aggressive Strategies than Incumbent Bidders?” Review of Industrial
Organization, 40, 3, 191-205.
National Alliance for Fair Contracting 2010. Resource Manual: Responsible
Bidder/Prequalification Ordinances <http://www.faircontracting.org/f.html> Accessed
July 12, 2012.
Northrup, Herbert. 1997. “Construction Union Programs to Regain Jobs: Background and
Overview,” Journal of Labor Research, Vol. 18, No. 1, winter, pp. 1-15.
Philips, Peter. 2014. “Kentucky’s Prevailing Wage Law: An Economic Impact Analysis,”
University of Utah Working Paper.
Philips, P. and Bilginsoy, C. 2010. “Impact of Prevailing Wages on the Economy and
Communities of Connecticut.” University of Utah.
Philips, P. and Kim, J. 2009. “The Effect of Prevailing Wage Regulations on Contractor Bidding:
The Case of Five Northern California Cities,” University of Utah, Department of
Economics, Working Paper.
Philips, Peter, Mangum, Garth, Waitzman, Norm and Yeagle, Ann. 1995. “Losing Ground:
Lessons from the Repeal of Nine "Little Davis-Bacon" Acts.” Working Paper,
Economics Department, University of Utah.
Porter, R. and Zona, J. 1993. “Detection of Bid Rigging in Procurement Auctions,” Journal of
Political Economy, Vol. 101, No. 3, pp. 518-538.
Scott, Sydney, Molenar K.R., Gransberg D.D., and Smith, N.C. (2006) Best Value Procurement
Methods for Highway Construction Projects: NCHRP Report 561. National Cooperative
Highway Research Program. Washington D.C.
Sonn, Paul K. and Gebresalassie,Tsedeye. 2009. The Road to Responsible Contracting. Lessons
from States and Cities Ensuring That Federal Contracting Delivers Good Jobs and Quality
Services. New York. National Employment Law Project.
Swanke Hayden Connell Architects. 2000. “Historic Preservation: Project Planning and
Estimating.” John Wiley & Sons. ISBN: 978-0-87629-573-1.
Thieblot, Armond J., Jr. 1975. The Davis-Bacon Act, Industrial Research Unit, Report No. 10,
Wharton School, University of Pennsylvania, Philadelphia.

80
Thieblot, Armond J., Jr. 1986. Prevailing Wage Legislation: The Davis-Bacon Act, State “Little
Davis-Bacon” Acts, The Walsh-Healey Act, and The Service Contract Act (Philadelphia:
Industrial Research Unit, The Wharton School, University of Pennsylvania).
Thieblot, Armand J., Jr., 1995. State Prevailing Wage Laws: An Assessment at the Start of 1995.
Rosslyn, VA: Associated Building Contractors.
Waddoups, C. Jeffrey. 2005. “Health Care Subsidies in Construction: Does the Public Sector
Subsidize Low Wage Contractors?” in Azari-Rad, Hamid, Peter Phillips, and Mark Prus,
eds. The Economics of Prevailing Wage Laws, Ashgate Publishers, pp. 205-224.
Waddoups, C. Jeffrey and May, D. 2014. “Do Responsible Contractor Policies Increase
Construction Bid Costs?” Industrial Relations, Vol. 53, No. 2, pp. 273-94.

81
Appendix A: TCLG - PREVAILING WAGE PROJECTS
TOP FIVE AGENCIES - PER FOIA VOLUME
AGENCY
RELEASED DATA
PERSONAL
PRIVATE
INFORMATION CLASSIFICATION
DAILY
HRS
WRKD
TOTAL
HRS
WRKD RATE
OF
PAY
FRINGES
GROSS
THIS
JOB
GROSS
ALL
WORK
DEDUCTIONS
TAKEN
NET
WAGES NOTES
DEPT. OF ENERGY
Solana Solar Generating Station (FSA-5 & IN-4&
HFI-1&SMAZ 12)
NO YES NO NO YES NO NO NO NO NO
Rentech Clear fuel IBR
Project (CBCTC- 67)
NO YES NO NO YES NO NO NO NO NO
Ingress Egress Upgrades
(CBCTC-34)
NO YES NO NO YES NO NO NO NO NO
Research Support Facility II (CBCTC-49)
NO YES YES YES YES NO NO NO NO NO
Energy Systems Integration
(CBCTC-63 &FSA 95)
NO YES NO NO YES NO NO NO NO NO
Mojave Solar Project (IW-
25)
NO YES NO NO YES NO NO NO NO NO
Field Route Injection and
Extraction Well Equipment (WAUA 9)
NO YES YES YES YES YES YES YES YES YES
DEPT. OF THE AIR
FORCE
Airfield Electric Vault Repair (KS-26)
NO YES YES YES YES YES YES YES YES YES
Construct National Guard
Readiness Center - Phoenix (IN-7)
NO YES YES YES YES NO YES YES YES YES FBS not
received
Camp Navajo Readiness
Center (IN-8)
NO YES YES YES YES N/A YES YES YES YES fringes paid in
cash
Youth Center at Buckley
AFB, CO (CBCTC-20)
NO NO NO NO NO NO NO NO NO NO
Cadet Modernization Phase
3 (CBCTC 38)
NO YES YES YES NO NO NO NO NO NO
Replace Generators B600
Schriever Air Force Base
(CBCTC-58&FSA16)
NO YES YES YES YES YES YES YES YES YES
East Gate Realignment
Peterson Air Force Base
(CBCTC-82)
NO YES YES YES YES YES YES YES YES YES
Mike O’Callaghan Federal
Hospital Nellis AFB (FS-
16)
NO YES YES YES YES YES YES YES YES YES
Simplified Acquisition of
Base Engineering
Requirements (FSA-36)
NO YES YES YES YES YES YES YES YES YES
Vandenberg Hall Renovation (FSA-35)
NO YES NO NO YES YES YES YES YES YES
Construct FamCamp
(CBCTC-48)
NO YES YES YES YES YES YES YES YES YES
Design-Build Relocate ILS
(SMAZ-10)
NO YES YES YES YES YES YES YES YES YES
GSA (General Services
Administration)
Mariposa LPOE (IN-24) NO YES YES YES YES NO YES YES PARTIAL* NO *"other"
deductions

82
were redacted
FBI Headquarters Building
(IN-29)
NO YES YES YES YES YES YES YES YES YES
U.S. Attorney's Office
(OKC-4)
NO YES YES YES YES YES YES YES YES YES
DFC Utility Infrastructure
(CBCTC-4)
YES YES YES YES YES YES YES YES YES YES
Caesar Chavez (CBCTC 7) NO YES YES YES YES YES YES YES YES YES
Recovery ARRA New
Custom Homes
Modernization (CBCTC-10)
NO YES YES YES YES YES YES YES YES YES
Byron G Rogers (CBCTC-
29)
NO YES YES YES YES YES YES YES YES YES
Denver Federal Center Building 45 (CBCTC 1)
NO YES YES YES YES YES YES YES YES YES
David Skaggs Research
Center EMC Construction
Project (CBCTC-6)
PARTIAL YES YES YES YES YES YES YES YES YES
Byron White Federal
Courthouse (CBCTC-50)
PARTIAL YES YES YES YES YES YES YES YES YES
Wayne Aspinell Federal
Building Modernization
(CBCTC 62)
NO YES YES YES YES YES YES YES YES YES
AGENCY
RELEASED DATA
PERSONAL PRIVATE
INFORMATION CLASSIFICATION
DAILY HRS WRKD
TOTAL HRS WRKD
RATE OF
PAY FRINGES
GROSS THIS JOB
GROSS ALL WORK
DEDUCTIONS TAKEN
NET WAGES NOTES
Mariposa Land Port of Entry (FSA-56)
NO YES YES YES YES YES YES YES YES YES
GSA Phoenix Professional Office Building (FSA-67)
NO NO YES YES YES YES YES YES YES YES
Department of State Facility at the Denver Federal Center (FSA-62)
NO YES YES YES YES NO YES YES NO NO
Alterations for 2 U.S. District Court Chambers, USMS TI and U.S. Army
NO YES YES YES YES NO YES YES NO NO
Yuma Federal Courthouse
NO YES YES YES YES NO NO NO NO NO
Utah Federal District Courthouse (FS-5)
NO YES YES YES YES YES YES YES YES YES
Denver Federal Center Utilities Infrastructure Project (CBCTC-4)
PARTIAL YES YES YES YES YES YES YES YES YES
New U.S. Federal Office Building
YES NO NO NO NO NO NO NO YES YES

83
San Ysidro Border Station-Phase 1
YES NO NO NO NO NO NO NO YES YES
FOIA Appeal - TCLG won and we got the net paid for the week and total deductions un-redacted.
New United States Courthouse
YES NO NO NO NO NO NO NO YES YES
US ARMY CORPS OF ENGINEERS
Irwin Replacement Hospital (KS-6)
NO YES YES YES YES NO YES YES NO YES
Fort Sill Physical Fitness Center (OKC-13)
NO YES YES YES YES PARTIAL YES YES YES YES If FBS was
available, TCLG received it
Brigade Transformation Company Operations Facility 7465 (KS-7)
NO YES YES YES YES YES YES YES NO YES
Naco Border Patrol Station (IN-12)
PARTIAL YES YES YES YES NO YES YES YES YES
Tactical Equipment Maintenance Facility (OKC-1)
NO YES YES YES YES YES YES YES YES YES
Mission Command Training Center (OKC-2)
NO YES YES YES YES YES YES YES YES YES
Reception BN Complex (OKC-3)
NO YES YES YES YES YES YES YES YES YES
THAAD Instructional Facilities (OKC-5)
NO YES YES YES YES YES YES YES YES YES
Supply Support Activity Warehouse (OKC-15)
NO YES YES YES YES YES YES YES YES YES
Mountain view Operations Facility (CBCTC 71 & FS 13)
NO YES YES YES YES YES YES YES YES YES
Construct a Commissary (CBCTC- 13)
NO YES YES YES YES YES YES YES YES YES
Security Forces Operational Facility (CBCTC-52)
NO YES YES YES YES YES YES YES YES YES
Design Build 3rd Floor Addition for Surgery Center (CBCTC-54)
PARTIAL YES YES YES YES YES YES YES YES YES
Construction of a New US Army Reserve Center
NO YES YES YES YES YES YES YES YES YES

84
(CBCTC 65&FSA 17) FY12 13th CAB Barracks, PNs 77264 &77265 (FS 23)
NO YES YES YES YES YES YES YES YES YES
Design Build 13th CAB, ASB Hangar (FS 11)
NO YES YES YES YES YES YES YES YES YES
Utah Data Center (FSA-12 )
PARTIAL YES YES YES YES YES YES YES YES YES
New Border Patrol Station Welton (FSA-41)
NO YES YES YES YES YES YES YES YES YES
Design Build 13th CAB ASB Control Tower (FS-12)
NO YES YES YES YES YES YES YES YES YES
Construct Army Reserve Center Las Vegas (FSA-27&IW-2)
NO YES YES YES YES YES YES YES YES YES
AGENCY
RELEASED DATA PERSONAL PRIVATE
INFORMATION CLASSIFICATION
DAILY HRS WRKD
TOTAL HRS WRKD
RATE OF
PAY FRINGES
GROSS THIS JOB
GROSS ALL WORK
DEDUCTIONS TAKEN
NET WAGES NOTES
Commissary Upgrades (FSA-37)
YES YES YES YES YES YES YES YES YES YES
Design 3rd Floor Surgery VA (FSA 80)
PARTIAL YES YES YES YES YES YES YES YES YES
Ajo Border Patrol Station (FSA-91)
NO YES YES YES YES YES YES YES YES YES
Design Build F22 Hangar (IW-12)
NO YES YES YES YES YES YES YES YES YES
Mission Control Project (IW-15)
NO YES YES YES YES YES YES YES YES YES
Recovery Child Development Center (IW-8)
NO YES YES YES YES YES YES YES YES YES
Add Alter Rescue Facilities (IW 14)
NO YES YES YES YES YES YES YES YES YES
Child Development Center, Hill AFB (FSA-83)
PARTIAL YES YES YES YES YES YES YES YES YES
MI Complex Battalion Headquarters (FSA-35)
NO YES YES YES YES YES YES YES YES YES
Construction of F-22 Radar Cross Section Test Facility (FSA-29)
PARTIAL YES YES YES YES YES YES YES YES YES
C-130 Squadron Operations Facility (CBCTC-3)
NO YES YES YES YES YES YES YES YES YES
310th Wing Headquarters Schriever AFB (CBCTC-46)
NO YES YES YES YES YES YES YES YES YES

85
nd 432 Wing HQ Mission
Support Facility (IW-13)
NO YES YES YES YES YES YES YES YES YES
FY11 SOF ADAL Simulator Facility for MC-130 Re Cap (SMW 3)
NO YES YES YES YES YES YES YES NO NO
High Explosive Pressing Facility Pantex Plant (SMW 4)
PARTIAL YES YES YES YES YES YES YES YES YES
AIT Barracks and Co. Operations Facility (MO 1)
NO YES YES YES YES YES YES YES NO YES
AIT Battalion Headquarters (MO 2)
NO YES YES YES YES YES YES YES NO YES
Training Barracks Upgrade FY 2011 (MO 3)
NO YES YES YES YES YES YES NO NO YES
Basic Combat Trainee Complex Battalion Headquarters (MO 4)
NO YES YES YES YES YES YES YES NO YES
Trainee Barracks Upgrade Program (MO 5)
NO YES YES YES YES YES NO NO NO YES
Permanent Party Barracks (MO 6)
NO YES YES YES YES YES YES YES NO YES
Mark Twain Lake Lift Station Improvements (MO 7)
PARTIAL YES YES YES YES YES YES YES YES YES
Replace A/C in Regimentar RM, TA244 (MO 9)
NO YES YES YES YES YES YES YES YES YES
Mission Installation Contracting (MO 10)
NO YES YES YES YES YES YES YES YES YES
Design/Bid/Build Training Barracks (MO 12)
NO YES YES YES YS YES YES YES NO YES
Water Supply Treatment Bldg. (MO 16)
NO YES YES YES YES YES NO NO NO YES
Army Aviation Support Facility (NM 6)
NO YES YES YES YES YES YES YES NO NO
FY-2011 SOF ADAL Simulator Facility for MC 130 RECAP (NM 18)
NO YES YES YES YES YES YES YES NO NO
Y-SOF Hanger/AM (MC-130) (NM 10)
NO YES YES YES YES YES YES NO NO NO
FY-12 SOF Maintenance AMXS Bldg. (NM 24)
NO YES YES YES YES YES YES YES NO
DEPT. OF VETERANS AFFAIRS
Renovate Bld. 9 HRC (KS-20)
NO YES YES YES YES YES YES YES NO YES
Inpatient/Outpatient Improvements
VA Denver Replacement Medical Center (CO-28& FS- 2)
NO YES YES YES YES YES YES YES YES YES

86
AGENCY
RELEASED DATA PERSONAL PRIVATE
INFORMATION CLASSIFICATION
DAILY HRS WRKD
TOTAL HRS WRKD
RATE OF
PAY FRINGES
GROSS THIS JOB
GROSS ALL WORK
DEDUCTIONS TAKEN
NET WAGES NOTES
Colmery O'Neil VAMC - Community Living Center (KS-24)
NO YES YES YES YES YES YES YES YES YES
VA Behavioral Health Bldg Construction (KS-19)
NO YES YES YES YES YES YES YES YES YES
Robert J Dole VAMC - Construct Structural Foundations B1 (KS-22)
NO YES YES YES NO NO NO YES YES YES
Robert J Dole VAMC - Install New Fire Pumps B36 (KS-23)
NO YES YES YES YES YES YES YES YES YES
Colmery O'Neil VAMC - Topeka & Leavenworth Improve Security Lighting/Cameras (KS-18)
NO YES YES YES NO NO YES YES NO NO
VA Medical Clinic Gilbert AZ (AZ IBEW-1&SMAZ 22)
NO YES YES YES YES YES YES YES YES YES
VA Hospital Phoenix AZ (AZ IBEW-2)
FOIA Submitted; Documents not yet received
VA outpatient Clinic Colorado Springs (CO-66)
NO YES YES YES YES YES YES YES YES YES
LV VA Hospital Phase IV Admin Building (FSA 32&IW-19)
NO YES YES YES YES YES YES YES YES YES
Energy Improvements Phase I (FSA-61)
NO YES YES YES NO NO YES YES NO NO
Patient Rehab and Prosthetics Dept. (FSA-92)
NO YES YES YES YES YES YES YES YES YES
New Rehabilitation Medicine Building (SMAZ-1)
NO YES YES YES YES YES YES YES YES YES
Renovate Urgent Care and Police Services (FSA 25)
NO YES YES YES YES YES YES YES YES YES
HVAC System 1 Energy Reduction (CBCTC-27)
NO YES YES YES YES YES YES YES YES YES
Southern AZ VA Special Procedures Unit & ED-Urgent Care B38 & B50 (SMAZ-7)
NO YES YES YES NO NO NO NO NO NO
Inpatient/Outpatient Improvements
YES NO NO NO NO NO NO NO NO NO
Jonathan W. Wainwright Memorial VA Medical Center (WAUA -3)
NO YES YES YES YES YES YES YES YES YES
Site Preparation of New Cardiac Catheterization Lab (NM 12)
PARTIAL YES YES YES YES YES YES YES YES YES