does the extent of per-case payment system affect hospital ... · 1 does the extent of per-case...
TRANSCRIPT

WP 15/29
Does the Extent of Per-Case Payment System Affect
Hospital Efficiency? Evidence from the Italian NHS
Marina Cavalieri, Calogero Guccio, Domenico Lisi & Giacomo Pignataro
December 2015
http://www.york.ac.uk/economics/postgrad/herc/hedg/wps/

1
Does the Extent of Per-Case Payment System Affect Hospital
Efficiency? Evidence from the Italian NHS
Marina Cavalieri1, Calogero Guccio
1,2, Domenico Lisi
1,2, Giacomo Pignataro
1
1 Department of Economics and Business, University of Catania, Catania, Italy
2 HEDG (Health, Econometrics and Data Group), Centre for Health Economics, University of York, York, UK
November, 2015
Abstract Recently increasing public pressure to contain costs in the healthcare sector has led many
national governments to introduce some type of prospective payment system and reduce the
scope of global budgeting. This study investigates the extent to which the reimbursement
systems of the Italian hospital sector have an impact on hospitals’ technical efficiency. Because
of high variation in the financing and provision of healthcare services among regions and
hospitals, Italy represents an interesting case study to test these effects. A two-stage Data
Envelopment Analysis was employed, in which the efficiency scores of all Italian hospitals were
first calculated and then regressed on different environmental variables to capture the role of
reimbursement systems. The results found a significant impact of the use of Diagnostic-Related
Group-based prospective payment systems on hospitals’ efficiency.
Keywords: Hospital efficiency, Data Envelopment Analysis, prospective payment systems,
hospital ownership type
JEL: C14; I11; I18
Corresponding Author: Calogero Guccio, Department of Economics and Business, University of Catania, Corso
Italia 55, 95129 Catania, Italy. E-mail address: [email protected].
2
1. Introduction
Public pressure to contain costs in the healthcare sector has increased in all of the
Organisation for Economic Co-operation and Development (OECD) countries during the
past few years, leading many national governments to strive for new approaches to reach
this important goal. This study investigates the effects of payment systems on hospitals’
technical efficiency using Italy as a case study. The Italian National Health Service
(NHS) is a particularly interesting case because it has been subject to a significant
decentralization process over time, in which healthcare responsibilities have been
progressively devolved to regional governments.
Beginning in the 1990s, the need to curb spending to meet the Maastricht criteria led
to a set of reforms with the threefold goal of introducing efficiency into the healthcare
system, creating an internal market for healthcare services, and increasing the autonomy
of regions regarding the financing and delivery of healthcare. As a result, within the
Italian national regulatory framework, regions are free to administer, organize, and
finance healthcare in accord with their populations’ needs. Therefore, marked regional
differences exist in the adopted models, particularly regarding the extent to which the
Diagnosis Related Group (DRG) system is employed for the coverage of overall
financing of hospital care.
In this study, we contribute to the existing empirical literature by providing an
econometric analysis of the relationship between the DRG-based reimbursement systems
used by the Italian regions and the performance of the hospital system. First, to estimate
the technical efficiency of the Italian hospital sector, we apply Data Envelopment
Analysis (DEA) to a large panel of Italian hospitals from 1999 through 2010. Then, we
investigate the impact of environmental variables (or non-discretionary inputs) on
hospital technical efficiency, focusing on the role played by different payment systems,
by performing a regression analysis using efficiency scores as the dependent variable
and the environmental variables as predictors.
Regarding the effects of payment systems, our analysis found a significant impact of
DRG-based prospective payment systems (PPSs) on hospital efficiency. In particular,

3
we found evidence that hospitals financed by PPS tended on average to be more efficient
than those financed by a global budget. This difference appears particularly marked for
public hospitals, where hospital trusts (financed by DRG tariffs) are clearly more
efficient than hospital units, which are financed by global budgets.
The remainder of the paper is organized as follows. In the next two sections we
provide the conceptual framework and a discussion of Italy’s institutional background,
respectively, followed by a review of the relevant literature on the relationship between
payment systems and hospitals’ efficiency. Then, we discuss some of the core methods
of measuring technical efficiency, describe the data and outline the empirical strategy,
before reporting and commenting the results. The final section offers some concluding
remarks.
2. Conceptual Framework
The payment system, with its associated incentives provided to economic actors, is
widely recognized as a relevant factor for explaining the performance of the hospital
sector. As has been discussed by a broad and established stream of research literature
(Ellis and McGuire 1986; Ma 1994), hospital payment schemes based on full
reimbursement of the incurred costs do not effectively incentivize cost containment,
which leads to a “medical arms race” among hospitals and, thus, to an escalation of
healthcare costs (Street et al. 2011). The considerable increases in healthcare
expenditures over time have stimulated several OECD countries to reform their provider
payment systems (Busse et al. 2011) to provide more effective incentives to achieve cost
containment. For example, in the US, a DRG-based PPS was introduced in 1983 to pay
hospitals for each episode of care provided to Medicare patients. Under that payment
system, hospitals were reimbursed a fixed tariff for each patient treated, based on the
DRG classifications. Following the US experience, many European countries have
implemented some type of prospective payments for hospital care, thus reducing the
scope of retrospective reimbursements.

4
The introduction of PPS intends to alter the incentives for hospitals to contain costs.
Generally, the adoption of PPS is associated with a variety of typical hospital incentives
(Busse et al. 2011), some, but not all, of which are desirable. First, hospitals that are paid
by a fixed-price are expected to reduce the average length of stay to the point where
shorter stays reduce inpatient costs and increase profit margins. PPS are also likely to
encourage hospitals to reduce unnecessary medical procedures for each patient treated.
Along with incentives to minimize costs per case, hospitals under PPS can attempt to
increase their revenues by increasing admissions (to the extent that this is possible)1.
As highlighted by Ellis and Miller (2008), the overall PPS effect on cost containment,
although always ambiguous, ultimately depends on the accuracy of the payment scheme.
Thus, a highly diversified scheme that minimizes cost variation within each payment
category may induce hospitals to “game” the system by classifying patients into higher
payment categories (referred to as “upcoding” or “DRG creep”). However, that scheme
also decreases incentives for hospitals to cream skim patients, by selecting the more
lucrative cases. The situation is reversed for the less diversified and accurate payment
scheme.
The expected incentives for hospitals to save on costs under PPS have caused many
concerns about possible reductions in the quality of care, although the current evidence
in the literature suggests that introducing PPS does not significantly deteriorate quality
(Coulam and Gaumer 1991; Cavalieri, Gitto and Guccio 2013; Cappellari, Paoli and
Turati 2014).
Many contextual factors could matter to the realization of the expected incentives
provided by PPS, among which hospital ownership appears to be particularly relevant. A
sizable body of literature (e.g. Alchian and Demsetz 1972; Brekke, Siciliani and Straume
2015) has emphasized that hospitals’ objective function ultimately determines their
incentives to cost containment. Moreover, there is a growing stream of empirical
1 According to Langenbrunner, Cashin, and O’Dougherty (2009), because providers usually have more
control over resource use per case than they have over the total number of admissions, the incentive to
restrain costs is typically stronger.

5
research investigating the ways that hospital ownership type affects treatment as well as
patient choices. Some of these studies find a significant difference among hospital types,
while others find little difference (Duggan 2000; Sloan et al. 2001; Horwitz and Nichols
2009; Bayindir 2012).
Thus, the objective function of private for-profit hospital organizations, of which the
owner is the residual claimant, should offer effective incentives to control costs. On the
other hand, public and private not-for-profit hospital organizations, which are
characterized by the presence of a non-distributional constraint, should have lower
incentives to reduce costs. Furthermore, even if they shared the same non-distributional
constraint, public and private not-for-profit hospitals could differ because only the latter
have effective incentives to comply with hard budget constraints, while the former tend
to operate under soft budget constraints (Kornai 2009; Shen and Eggleston 2009).
Moreover, in the presence of recurring governmental bailouts, the incentives to cost
containment provided by PPS could be significantly weakened.
In the Italian case, hospital type has a central role (Barbetta, Turati and Zago 2007)
because there are many different organizations that can be characterized as public,
private for-profit, or private not-for-profit hospitals. Moreover, the mixture is not
uniform across the country and there is significant heterogeneity in the distribution of
hospitals across Italian regions. Therefore, this analysis explicitly accounts for the
characteristics of hospitals when determining the effects of the payment system on
hospital performance.
3. Background
3.1 Hospital Care in Italy
The Italian NHS was established in 1978 to provide universal access to a uniform level
of care throughout the country, financed by general taxation. The system is organized as
a multi-tier structure. The national level (Ministry of Health) has exclusive power over
national health planning, including setting overall goals, annual financial resources for

6
healthcare, and regarding the definition of the Livelli Essenziali di Assistenza (Essential
Levels of Care [LEA]) that must be uniformly guaranteed across the country. The
nineteen regions and two autonomous provinces have the constitutional mandate to
organize and deliver healthcare through a network of geographic- and population-
defined Aziende Sanitarie Locali (Local Health Authorities [ASLs]) and public and
accredited private healthcare providers.
Beginning in the early 1990s, Italy undertook a set of reforms that fundamentally
shaped the organization, method of financing healthcare, and allocation of resources
among the different tiers of government (France, Taroni and Donatini 2005). The reform
process was inspired by the principles of regionalization, managed competition, and
managerialism. Regionalization implied a significant transfer of healthcare powers from
the state to the regions, which are now responsible for funding their healthcare
expenditures with regional taxes2
and user fees (despite the national equalization
mechanism that compensates cross-sectional differences in regional fiscal capacities).
Regions have full discretion for deciding how to organize their healthcare systems,
particularly regarding the choice to provide, and autonomously finance, healthcare
services beyond the mandatory standard benefit package (i.e. LEA) and whether to
retain the purchasing role or transfer it to the local health authorities (LHAs)
The separation of purchasing from providing functions has been endorsed as a part of
the quasi-market model introduced into the public health sector to boost competition
and, thereby, increase efficiency (Turati 2013). The creation of an internal market has
called for a managerial reorganization of the former Unità Sanitarie Locali (Local
Health Units), which were transformed into independent public entities (i.e. ASLs) with
their own budgets and management. ASLs were asked to hive-off major public hospitals,
which were granted the status of trusts, Aziende Ospedaliere (hospital trusts [AO]), with
full managerial autonomy. Thus, hospital providers in Italy’s public healthcare system
2 In 1997, the previous sickness contributions were substituted by both a new Imposta Regionale sulle
Attività Produttive (Regional Tax on Productive Activities) and an Addizionale IRPEF (Surcharge on
Personal Income Tax).

7
range from public hospital units directly run by LHAs (Ospedali a Gestione Diretta or
Presidi Ospedalieri [HUs]), public hospital trusts formally independent of LHAs (i.e.
AO), and accredited private hospitals (either for-profit or not-for-profit) that compete
with the public hospitals in the delivery of services.
To make the pro-competitive reform effective, a new financing system for hospital
services was defined. Regarding inpatient care 3 , the system is grounded on two
components. First, there are per case tariffs related to the DRG classification of
discharges (version 24 since 2009). Second, lump-sum transfers are used to finance
provision of those services (e.g. integrated care, preventive services, emergency
treatment, experimental programs, and transplants) for which “tariffs are deemed
inadequate or inappropriate” (Fattore and Torbica 2006, 252). 4 The fixed-price
component applies to both public and accredited private hospitals and has replaced the
previous financing systems based on full retrospective payments and per-day fees,
respectively. The sole exceptions are public hospitals directly run by LHAs (i.e. HUs),
whose activities continue to be financed retrospectively through the LHA budget.5
With the Decree of December 14, 1994 n. 169, the Italian Ministry of Health laid
down the first list of national tariffs, based on cost data collected from eight hospitals
located in Italy’s northern and central regions (Taroni 1996).6 Consistently with the logic
of regionalization, regional governments were allowed either to opt for the national
DRG rates or to establish their own DRG tariffs to make them closer to their actual costs
3 Outpatient care is paid on a fee-for-service basis.
4 The reasons for the inappropriateness of tariff financing for these services are different. Services, such as
organ transplants, have a regional interest, require sophisticated technologies, and need to be concentrated
in one or just a few hospitals. Other services, such as the ones related to emergency treatment, require an
amount of resources that is independent of demand. Finally, there are peculiarities to some hospitals (such
as teaching hospitals) that are difficult to deal with using the tariff mechanism (Morandi 2009). Ideally,
lump-sum transfers should be determined according to the efficient cost of their provision. Regions have
full autonomy over the identification of the services to include and, thus, may alter the composition of
hospital funding, which reduces the scope of activity-based payments. 5 According to Morandi et al. (2008), HUs are “… de facto financed on the basis of the consumption of
production factors (personnel, goods and services, etc.).” 6 Since then, national tariffs have been updated many times, specifically in 1997 (Decree of the Ministry
of Health, June 30, 1997), in 2006 (Decree of the Ministry of Health, September 12, 2006), and, recently,
in 2012 (Decree of the Ministry of Health, October 18, 2012).

8
and local specificities.7 Whichever route was taken, the new financing system had to
begin between 1995 and 1997.
While staying within the general criteria set by the national legislation, regional
governments have used their regulatory powers with a great deal of autonomy (e.g.
Jommi, Cantù and Anessi Pessina 2001; Anessi Pessina, Cantù and Jommi 2004; France
and Taroni 2005). As a result, organization of healthcare at the regional level is
extremely variable, which ultimately results in a different scope of competition in the
NHS. Regarding hospital care, regions have chosen the managerial structure of hospitals
(i.e. either run by LHAs or fully autonomous in management) as well as the extent to
which private hospitals are involved in the provision of services, through their
accreditation policy. Therefore, the regional institutional options have ranged from the
modello integrato (integrated model) of Veneto, in which most hospitals are part of
LHAs and competition is reduced to a minimum (in other words, accredited private
providers play a residual part), to the modello separato (separated model) of Lombardy,
in which none of the hospitals are run by LHAs and patients are free to select their
providers (public or accredited private) (Boni 2007). Nevertheless, since 2002,
Lombardy has gradually and deliberately relinquished competition in order to control
healthcare expenditure (Brenna 2011).8
Regarding the financing of hospital care, regional governments can autonomously
identify the specific services to be reimbursed by lump-sum payments within the broad
category of facilities described above. The related options influence the relative weight
of the forfeit and activity-based components in the overall financing of hospital care and,
hence, the strength of the incentives that result from the tariffs.
7 Specifically, by choosing their own tariff fees, regions can (Decree of the Ministry of Health, June 30,
1997 n. 178): (1) adopt the national tariffs, eventually modifying them (in excess or defect) on the basis of
a predetermined percentage or according to regional policies and needs; (2) define regional tariffs,
maintaining the relative weights set at the national level and changing just the DRG’s point value; and (3)
determine a system of new regional relative weights based on the analysis of actual hospital costs in their
territories. 8 The Lombardy region shifts from a quasi-market to a “quasi-administered” (budget-based) system
following the adoption by the central government of a more centralized approach in healthcare, as defined
in legislative decree 229/1999 (Cappellari, Paoli and Turati 2014).

9
With regard to the way tariffs are determined, many regions have adopted their own
set of tariffs, using them as incentive tools to pursue specific policy goals rather than
tailoring them to meet the efficient costs of providing hospital care (Di Loreto and
Spolaore 2004). In this respect, regional tariffs have often been differentiated by type of
provider, reflecting the fact that production costs and responses to price incentives are
not homogeneous, but vary according to numerous characteristics, such as ownership,
volume of activity, hospital functions, and case-mix. In particular, according to Morandi
et al. (2008), tariffs represent the real price only for the accredited private hospitals,
whereas, for the independent public ones (i.e. hospital trusts), tariffs are used as regional
devices to assess hospital activities and determine hospital budgets. Finally, to limit
providers’ tendencies to increase their volumes of services under activity-based
payments, some regions (e.g. Lombardy) have set caps, ceilings, or targets at the
regional, LHA, or hospital level, whereas others (e.g. Tuscany) control volumes of
production with bilateral contracts (between LHAs and hospitals).
3.2 Previous Literature
The empirical literature on hospital efficiency comprises a huge body of research with
numerous scopes, methodologies, and results (Hollingsworth et al. 1999; Hollingsworth
2003, 2012). For this study, attention is restricted to the stream of research that explicitly
considered the impact of financing systems, particularly PPS, on hospital efficiency.
Despite the preceding theoretical arguments for cost reductions and efficiency gains
under a PPS, empirical evidence is rare and, overall, mixed. In the US, Borden (1988)
found no significant technical efficiency gains for ninety-three New Jersey hospitals
between 1979 and 1984. Chern and Wan (2000) found similar results in a study of the
catch-up effect of technically inefficient hospitals in Virginia (US) over a ten-year
period (1984 to 1993). On the contrary, efficiency gains were found by Morey and
Dittman (1996), who analyzed the technical inefficiency of 105 hospitals in North
Carolina (US). Recently, Rosko and Mutter (2010) compared 543 small US hospitals in
rural areas subject to different payment systems. Among other results, they found that

10
the average estimated cost inefficiency was greater in the cost-reimbursed hospitals
(15.9 percent) than in the PPS hospitals (10.3 percent), concluding that PPS had a
positive impact on efficiency.
Findings from European countries also are mixed. Whereas a positive effect of PPS
introduction on technical efficiency was found in Portugal (Dismuke and Sena 1999,
2001), Sweden (Gerdtham et al. 1999a, 1999b), Finland (Linna 2000), Norway (Biorn et
al. 2003, 2010; Hagen, Veenstra and Stavem 2006), and Switzerland (Widmer 2011), no
efficiency gains were observed in Austria (Sommersguter-Reichman 2000) or Germany
(Herwartz and Strumann 2014). A recent study by Meyer (2015) analyzed a panel of 121
public hospitals in Switzerland subject to one of four payment schemes (per diem
payments, two flat-rate schemes, and a mixed system) between 2004 and 2009. By
isolating the cost-efficiency effects of the different payment schemes, the author found
that, compared to per diem, hospitals that are reimbursed by flat payments perform
better in terms of cost efficiency. Moreover, the results suggested that hybrid payment
schemes create incentives for cost containment, although less than pure ones.
Numerous factors could contribute to explaining the above mixed results. In
particular, country-level differences in pre-existing hospital payment systems, and the
ways that DRG-based systems are implemented and operated, may contribute to the
variation in studies’ results. Street et al. (2011) pointed out that, in countries where
global budgets preceded DRG-based payments (e.g. Sweden, Portugal, and Norway),
hospitals’ technical efficiency tended to improve, whereas in countries in which a
retrospective (e.g. US) or per-diem (e.g. Austria) payment system was replaced, no
significant efficiency gains were experienced as a result of the introduction of PPS.
However, the authors posited that these attributions are not definitive because they are
deeply influenced by the countries’ actual realizations of the payment system (e.g. the
presence of ceiling or other restrictions) or by the simultaneous introduction of other
healthcare reforms (as found by Gerdtham et al. 1999a, 1999b). All these factors may
confound the studied relationships and challenge the ability to isolate the relevant
effects.

11
Problems preventing consistency among the studies’ results include study-specific
methodological shortcomings that may explain the relatively weak evidence. It is
noteworthy that most of the above-cited country-level studies employed longitudinal
data. Generally, a time-series of four or five years was analyzed, but that may be a too
short of a time horizon to detect a relevant effect. On the other hand, when time horizons
are excessively long, analysis runs the concrete risk that the observed effect of PPS is
driven by unobserved exogenous shocks that occurred during the implementation of the
reform (such as other aspects of healthcare reform, advances in medical technology,
inflation, and so on). Furthermore, all these studies lack statistical controls for
observable characteristics that are strictly related to the hospitals’ productive structure,
such as ownership.
As for Italy, few studies have analyzed the effects of financing systems on hospital
technical efficiency. Among the most relevant ones, Barbetta, Turati, and Zago (2007)
investigated the technical efficiency of a balanced panel of 531 Italian hospitals between
1995 and 2000 when the DRG-based payment system was introduced to the hospital
sector. The authors estimated an output distant function with parametric (e.g. Corrected
Ordinary Least Squares and Stochastic Frontiers) and non-parametric (e.g. DEA or Free
Disposal Hull) approaches to explore the relationships among ownership structure,
payment system, and hospital performance. They found a convergence of mean
efficiency scores between not-for-profit and public hospitals that supported the general
hypothesis that these two types of providers differ in their responses to the introduction
of the new payment system, with the former responding more promptly than the latter to
PPS implementation. They concluded that these findings suggest that differences in
economic performances between competing ownership types are more the result of the
institutional settings in which they operate (including payment schemes) than an effect
of the incentive structures embedded in the different proprietary types. Contrary to
expectations, they further observed a decrease in technical efficiency, more marked for
private not-for-profit hospitals than for public hospitals, probably due to public policies
intending to reshape the hospital industry and reduce hospitalization rates.

12
Using a population-based dataset of all operating hospitals in the Lombardy region
between 1998 and 2007, Berta et al. (2010) analyzed the ways that three typical
distortions induced by the PPS (i.e. upcoding, cream skimming and readmissions)
influenced Italian hospitals’ production function. They found that upcoding and cream
skimming negatively affected hospitals’ technical efficiency, whereas readmissions had
a positive effect. Examining the differences in hospitals’ ownership structures, private
hospitals appear to be particularly engaged in cream skimming, not-for-profit hospitals
have the most readmissions, and no statistically significant differences exist for
upcoding among the hospital types. The authors concluded that not-for-profit and public
hospitals had similar technical efficiency levels and were more efficient than private
hospitals at the beginning of the observation period.
Recently, De Nicola et al. (2014) employed a two-stage bootstrapped DEA analysis
to investigate the ways that healthcare organization models, reimbursement systems, and
patient flows influenced the efficiency of the Italian regions’ healthcare services during
2004–2005. Because the decision-making unit (DMU) is the province (their final sample
comprised a balanced panel of 101 provinces), hospital inputs (physicians, nurses, and
number of beds) and outputs (total number of patients and case-mix index) were
aggregated at the provincial level. Their results found that, among the organizational
systems adopted by the Italian regions, the one implemented by Lombardy based on the
separation between providers and purchasers evidenced the best results in terms of
efficiency. Regarding the hospital reimbursement systems, the regions in which the
average costs to deliver healthcare account for the regional characteristics of the
population and healthcare structures are likely to improve their performances. Last,
patient mobility significantly influenced healthcare efficiency.
This study builds on this literature by explicitly investigating the ways that the
different DRG-based payment schemes adopted by Italian regions affect hospital
technical efficiency and, furthermore, whether responses vary by hospital type.
Compared to the study by Barbetta, Turati, and Zago (2007), this analysis advances our
understanding in several important ways. First, it covers a much longer period (twelve

13
versus six years), which arguably is a more appropriate time horizon to capture the
effects of the introduction of PPS. Second, in the estimates of hospital efficiency, it
adjusts the outputs to account for the cross-sectional and time series variations of case-
mix. Third, to model the effect of PPS introduction, we use a continuous indicator (along
with a dummy variable) to account for the different extents to which activity-based
payment systems are used in each of the regional hospital sectors.
4. Methods, Data, and Empirical Strategy
4.1 Methodological Framework
In this study we focus on the technical efficiency of Italian hospitals using DEA, which
involves the comparison of the actual performance of each hospital (here assumed as a
Decision Making Unit – DMU) with the optimal performance of the hospitals located on
the relevant frontier (or best practice frontier). The aim of this approach is the
measurement of technical efficiency by defining a frontier envelopment surface for all
sample observations, using linear programming techniques (namely, DEA). DEA is a
well-established and useful technique for measuring efficiency in public sector activities
and, in particular, in hospital sector.9 The DEA methodology calculates an efficiency
frontier for a set of hospitals, as well as the distance to the frontier for each unit. This
distance (efficiency score) between the observed hospital and the most efficient DMU
provides a measure of the radial reduction in inputs that could be achieved for a given
9 Sherman (1984) used DEA for the first time in the hospital sector to measure the efficiency of US
teaching hospitals. Thereafter, DEA techniques have been applied also to other health providers, as
physicians (Chilingerian and Sherman 1990) and nursing homes (Chattopadhyay and Ray 1996). In
particular, DEA hospital studies have spread considerably during ’90 in the US, followed by European
countries in the subsequent years. Consequently, many DEA applications started to appear also from
countries other than the US, such as Canada (Ouellette and Vierstraete 2004) and Turkey (Sahin and
Ozcan 2000). Even recently, DEA turns out to be the main technique used in hospital efficiency studies
(Hagen, Veenstr and Stavem 2006; Barbetta, Turati and Zago 2007; Mutter, Valdmanis and Rosko 2010;
Hadad, Hadad and Simon-Tuval 2013). For a quite comprehensive survey on DEA-based hospital
efficiency studies, where also the general findings of the literature are reported, see among the others
O’Neill et al. 2008.
14
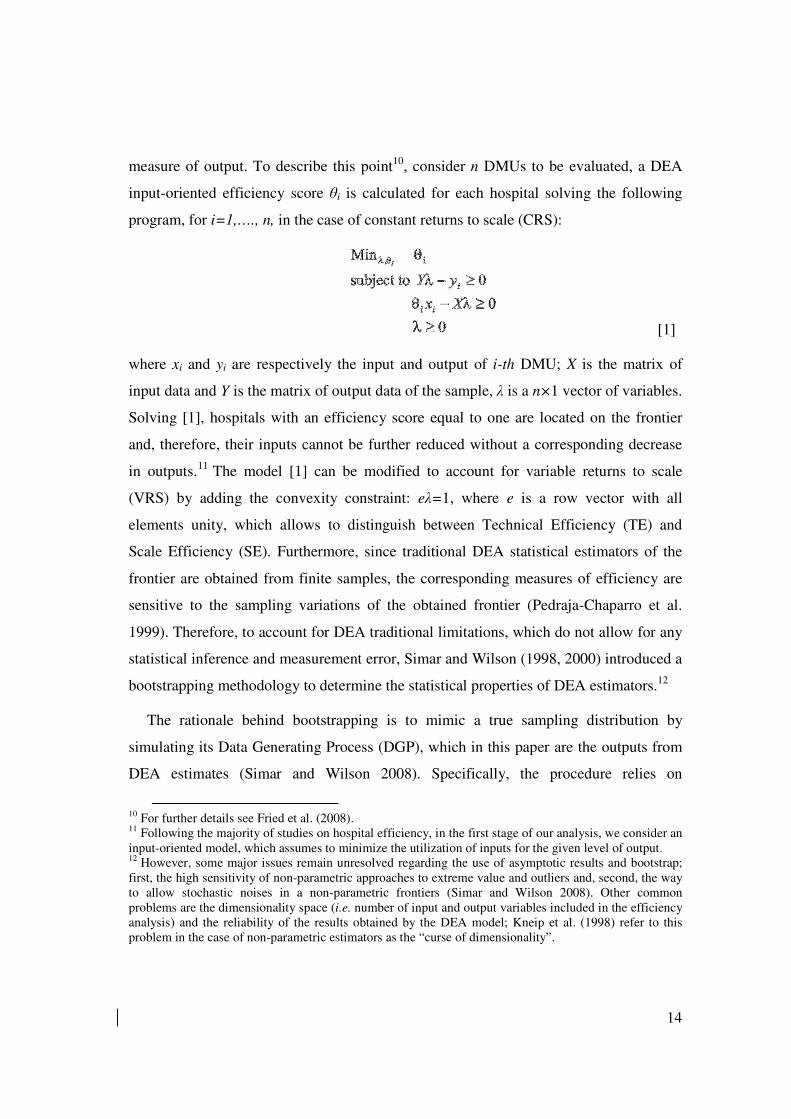
measure of output. To describe this point10, consider n DMUs to be evaluated, a DEA
input-oriented efficiency score θi is calculated for each hospital solving the following
program, for i=1,…., n, in the case of constant returns to scale (CRS):
[1]
where xi and yi are respectively the input and output of i-th DMU; X is the matrix of
input data and Y is the matrix of output data of the sample, λ is a n×1 vector of variables.
Solving [1], hospitals with an efficiency score equal to one are located on the frontier
and, therefore, their inputs cannot be further reduced without a corresponding decrease
in outputs.11
The model [1] can be modified to account for variable returns to scale
(VRS) by adding the convexity constraint: eλ=1, where e is a row vector with all
elements unity, which allows to distinguish between Technical Efficiency (TE) and
Scale Efficiency (SE). Furthermore, since traditional DEA statistical estimators of the
frontier are obtained from finite samples, the corresponding measures of efficiency are
sensitive to the sampling variations of the obtained frontier (Pedraja-Chaparro et al.
1999). Therefore, to account for DEA traditional limitations, which do not allow for any
statistical inference and measurement error, Simar and Wilson (1998, 2000) introduced a
bootstrapping methodology to determine the statistical properties of DEA estimators.12
The rationale behind bootstrapping is to mimic a true sampling distribution by
simulating its Data Generating Process (DGP), which in this paper are the outputs from
DEA estimates (Simar and Wilson 2008). Specifically, the procedure relies on
10
For further details see Fried et al. (2008). 11
Following the majority of studies on hospital efficiency, in the first stage of our analysis, we consider an
input-oriented model, which assumes to minimize the utilization of inputs for the given level of output. 12
However, some major issues remain unresolved regarding the use of asymptotic results and bootstrap;
first, the high sensitivity of non-parametric approaches to extreme value and outliers and, second, the way
to allow stochastic noises in a non-parametric frontiers (Simar and Wilson 2008). Other common
problems are the dimensionality space (i.e. number of input and output variables included in the efficiency
analysis) and the reliability of the results obtained by the DEA model; Kneip et al. (1998) refer to this
problem in the case of non-parametric estimators as the “curse of dimensionality”.

15
constructing a pseudo-data set and re-estimating the DEA model with this new data set.
Repeating the process many times allows to achieve a good approximation of the true
distribution of the sampling. The Simar and Wilson (1998) bootstrap procedure
estimates bias and the variance of the estimator, which in turn allow to determine
confidence intervals. Later, Simar and Wilson (2000) provide an improved and more
flexible procedure that automatically corrects for bias without explicit use of a noisy bias
estimator.13
Thus, we employ the latter bootstrapping algorithm (Simar and Wilson
2000) to control for consistency among the efficiency estimates.
Three major approaches have been proposed by the relevant literature to explain
efficiency differentials by including environmental variables in the model: the one-stage
approach, the two-stage approach (including the semi-parametric bootstrap-based
approach) and the conditional nonparametric approach (Simar and Wilson 2008). In the
two-stage approach, the nonparametric efficiency estimates obtained in a first stage are
regressed in a second stage on covariates interpreted as environmental variables. In this
paper we apply the two-stage semi-parametric bootstrap-based approach proposed by
Simar and Wilson (2007). More specifically in the second stage of our analysis, we
consider the impact of environmental variables (or non-discretionary inputs) on hospital
technical efficiency, focusing on the role played by reimbursement systems.
Specifically, we assume that the efficiency scores can be regressed – in a cross-section
framework – on a vector of environmental variables along the following general
specification:
θi = f(zi)+εi [2]
where θi represent the efficient scores resulting from the previous stage, zi is a set of
possible non-discretionary inputs and εi is a vector of error terms. In the next sections,
we will discuss in depth our explanatory variables zi , as well as some other control
variables, which are used to assess the impact of different reimbursement rules on
hospital efficiency.
13
See Simar and Wilson (2008) for the technical details on bootstrap procedures.

16
Simar and Wilson (2007) underlined that traditional estimators yield to biased
estimates due to serial correlation of efficiency scores and suggest to apply semi-
parametric two-stage techniques.14 Since this suggestion, there has been a wide debate
on the best method to apply the second-stage DEA analysis; criticism and alternative
proposals are based on different assumptions for the DEA-score DGP and sample
variation (e.g. Hoff 2007; Banker and Natarajan 2008; Ramalho et al. 2010). Recently,
Simar and Wilson (2011) showed that the two-step bias-corrected semi-parametric
estimator proposed by Simar and Wilson (2007) is the only known method that ensures a
feasible and consistent inference on the second stage regression.15
4.2 Data Description
All of the data used in this analysis were provided by the Italian Ministry of Health
(specifically, the Department of Healthcare) and refer to all Italian hospitals working on
behalf of the NHS. Data were examined for errors, outliers, and missing values. The
final sample was an unbalanced panel of 11,393 observations over the twelve-year
period between 1999 and 2010. For each year, hospital observations ranged from a
minimum of 885 to a maximum of 1,044, depending on the year. As a robustness check
of our findings, we also analyzed a balanced subsample of 492 hospitals over the twelve
years, comprising 5,904 observations.
Table 1 shows the composition of the unbalanced and the balanced panel samples by
type of hospital. The two samples include all of the types of hospitals working on behalf
of the Italian NHS. Although the unbalanced panel is almost twice the size of the
balanced one (11,393 versus 5,904 observations), differences in composition between
14
More specifically, estimating [2] with Tobit or OLS regressions leads to the violation of the assumption
of the independence between εi and zi. 15
However also this approach shows two weaknesses: first, the potential impact of the environmental
factors on the distribution of the efficiency scores occurs only if the separability condition is verified (i.e.
environmental factors do not influence the shape of the production set). Second, the two-stage approach
imposes parametric assumptions on the functional form of the regression and error distribution (Bădin et
al. 2013). However, in our case it seems reasonable to assume that the employed environmental factors
affect the production process but not the attainable set and its frontier.

17
the two samples are not very substantial.16
For both samples, the majority of hospitals
(47 percent in the unbalanced and 44 percent in the balanced sample) are public
hospitals directly managed by LHAs (Ospedali a Gestione Diretta or Presidi
Ospedalieri [hospital units]); followed by Case di Cura Accreditate (accredited private
for-profit hospitals) at 35 percent and 37 percent, respectively; Aziende Ospedaliere
(hospital trusts) at 9 percent and 7 percent, respectively; and, finally, by not-for-profit
hospitals17
, at 9 percent and 11 percent, respectively. Thus, in the following analysis, we
employ the full unbalanced panel data sample, and we provide and report some
robustness checks of our findings using the balanced subsample.
(Insert TABLE 1 about here)
Our dataset includes information on different inputs and outputs usually considered in
the literature on hospital efficiency. Among the input variables, we include the number
of beds as a proxy measure of capital and the number of personnel units (physicians,
nurses, and others). Similarly, output variables are measures of the number of inpatient
days, the number of discharged patients and the number of case-mix adjusted discharged
patients. Unfortunately, other variables related to the production process (e.g. day
hospital beds, outpatient’s departments and so on) or to the hospitals’ outcomes (e.g.
discharge mortality, readmission rates, and so on) 18
were not available for the analysis.19
(Insert TABLE 2 about here)
(Insert TABLE 3 about here)
16 The existing differences are due to several reasons such as missing information for some years, mergers
or closure, changes in hospital’s denomination, errors in hospital codes and so on. 17
Following the same classification as Barbetta, Turati and Zago (2007), we grouped in this category
teaching and research hospitals incorporated as both public and private bodies (Istituti di Ricovero e Cura
a Carattere Scientifico, pubblici e privati), university hospitals (Policlinici Universitari) and hospitals run
by religious bodies (Ospedali Classificati). 18
These data were not available for the entire study period; hence, we were able to collect only very
partial information that could not be exploited in our estimations. 19
Furthermore, data limitations preclude the opportunity to incorporate hospital costs (such as staff costs,
capital costs and operating expenses) in our efficiency models.

18
Table 2 presents the descriptive statistics of the main variables used in the DEA
analysis; in Table 3, these are also shown by year (only for the full data sample). We
observe that, although all of the output variables exhibit decreasing trends over time,
with respect to inputs, only the average number of beds decreases over time, from an
average of 234 in 1999 to an average of 211 in 2010. All of the other input variables
measuring hospital staff exhibit an increasing trend over the period. This picture reflects
the de-hospitalization policy pursued in Italy over the past twenty years (Piacenza et al.
2010).
To investigate our research topic, we first consider the different typology of hospitals
and, then, we use a set of regulatory variables, which have been shown to capture
differences in regional regulatory systems (Cavalieri, Gitto and Guccio 2013; Cappellari,
Paoli and Turati 2014; Finocchiaro Castro et al. 2014). In Table 4, descriptive statistics
for the variables employed in the second stage are presented. For convenience, full
discussion of these variables is postponed to the next sections.
(Insert TABLE 4 about here)
4.3 Empirical strategy
In this paper we employ different approaches to examine the impact of different PPS
schemes on hospital efficiency in the Italian regions. In the first step, we use the DEA
methodology to measure the technical efficiency of a large sample of Italian hospitals
over the twelve-year period between 1999 and 2010.
Following previous studies on hospital efficiency (O’Neill et al. 2008), we use an
input-oriented approach where the output levels do not change, whereas the input
quantities are reduced proportionately until the frontier is reached. Alternatively, the
output-oriented framework aims at maximizing the output levels keeping the inputs
constant. In this paper, the input orientation has been preferred as the underlying
hypothesis seems quite reasonable in the long term and more consistent with the

19
evidence provided by Piacenza, Turati and Vannoni (2010) concerning the de-
hospitalization policy pursued in Italy over the past twenty years.
The DEA technique allows to measure hospitals’ efficiency either with respect to a
unique frontier estimated by pooling the data (i.e. intertemporal frontier approach) or
separately by estimating a frontier for each year (i.e. contemporaneous frontiers
approach) (Jondrow et al. 1982). Under the intertemporal frontier approach, constant
technology over time is assumed; however, as the time span of our sample is rather
large, the assumption of time-invariant technology might be somewhat unreasonable.
Additionally, the approach does not allow for the identification of year-specific effects.
For these reasons, hereafter we employ the more reasonable contemporaneous frontier
approach, in which the frontier in each year is constructed based on the observations
solely of the current year.20
Finally, to control for consistency among DEA efficiency
estimates, we apply the bootstrapping algorithm proposed by Simar and Wilson (2000).
Once efficiency estimates are obtained, different empirical strategies are considered
to investigate our research topic. In line with the approach followed by Barbetta, Turati
and Zago (2007), we first apply several non-parametric tests to assess whether hospital
type matters for performance. Specifically, we test the hypothesis that HUs are
statistically different from all other hospitals (both public and private ones) as far as
efficiency scores are concerned.
As a further investigation, we then apply a DEA two-step methodology proposed by
Simar and Wilson (2007) to the DEA efficiency scores. Specifically, we estimate the
following general models:
θCRS it= hospital_typei,t + PPS_regulationk,t + REGIONk,t+ YEARt + εi,t [3]
θVRS= hospital_typei,t + PPS_regulationk,t)+ REGIONk,t+ YEARt + εi,t [4]
20
To provide robustness to our empirical findings, we also run DEA estimates by using the intertemporal
frontier approach. Results are largely comparable with those presented here and are available upon request
from the authors.
20
where i denotes the hospital, k the region and t the year, θCRS and θVRS are the efficiency
scores obtained under CRS and VRS assumption, respectively. Looking at the employed
variables, hospital_type denotes different typology of hospitals, PPS_regulation is a
vector of variables aiming to capture different reimbursement rules at the regional level
in time t (for a detailed description of these variables, see the next section). Finally,
REGION is a vector of region-specific control variables, YEAR is a vector of yearly
dummy variables and ε is the error term.
Concerning the two-step procedure, Simar and Wilson (2007) suggest to use
bootstrap truncated regression in the estimates of [3] and [4]. Banker and Natarajan
(2008) propose a different estimator where the two-stage approach can be applied if the
inputs are not (too much) correlated with the environmental variables and provide a
statistically consistent estimator, which involves nonparametric estimation of
productivity in the first stage followed by OLS regression. However, Banker and
Natarajan (2008) two-stage approach depends on quite restrictive assumptions on the
production process. Therefore, in what follows we use the Simar and Wilson (2007)
bootstrap truncated estimator as the baseline model.
5. Results and Discussion
5.1 DEA efficiency estimates
To assess the technical efficiency of Italian hospitals, we estimate different DEA
bootstrap models21
. Specifically, we consider four different production models as shown
in Table 5.
(Insert TABLE 5 about here)
21
Due to lack of space, results are hereafter provided mainly for the full sample. As previously mentioned,
we performed all of the estimates also for a balanced subsample of hospitals. Despite the difference in
sample dimension, DEA estimates from the balance panel barely confirm all the results from the full
sample. Results for the balanced subsample are available upon request from the authors.

21
Table 6 provides the pairwise correlation matrix for the estimated models, under boh
CRS and VRS assumptions. Overall, a high correlation across the different models is
observed, under the hypotheses of either CRS or VRS.
(Insert TABLE 6 about here)
Moreover, in Table 7 we provide the results of Mann–Whitney tests concerning the
estimated efficiency frontiers among the different models by using Model_1 as a
reference point. It can be seen that technical efficiency is unaffected by the choice of the
output variables. Thus, since Model_4 is clearly the most comprehensive and, therefore,
likely to be the most suited to account for the differences in hospitals’ production
functions (in particular, among different types of hospitals), in what follows we base our
discussion of results only upon the estimates from it. 22
(Insert TABLE 7 about here)
Finally, the kernel density functions, reported in Figures 2 and 4, show that, from the
perspective of sensitivity analysis, the efficiency estimates under both scale assumption
are quite robust with respect to sampling variation since there are only small differences
between biased and biased corrected efficiency estimates.
5.2 Preliminary findings
The average DEA efficiency scores for the full sample by year and type of hospital are
presented in Table 8, under both CRS and VRS assumptions. Similarly, the distribution
of the DEA efficiency scores by type of hospital and year, as well as the Kernel density
of the efficiency scores, are shown in Figures 1 to 4, under CRS and VRS assumptions,
respectively. To address the problem that DEA efficiency scores are estimated from a
finite sample and, thus, subject to sampling variation of the frontier, we implement a
22
The results also hold for model_1, model_2 and model_3; related tables are available upon request from
the authors.

22
bootstrap procedure, with 200 bootstrap draws, as described by Simar and Wilson
(1998). This procedure allows us to correct the bias in DEA estimators and to obtain
unbiased confidence intervals. Figures 2 and 4 present Kernel density estimates of the
efficiency scores that rely on the reflection method, before and after the bootstrap
correction and under different scale assumptions (Simar and Wilson 2008). 23
(Insert TABLE 8 about here)
(Insert FIGURE 1 about here)
(Insert FIGURE 2 about here)
(Insert FIGURE 3 about here)
(Insert FIGURE 4 about here)
From the upper part of Table 8 and from Figure 1 (CRS model), no significant
differences appear in the efficiency levels between those hospitals directly managed by
LHAs (i.e. HUs) and all the other types of hospitals. However, as emphasized by the
previous literature on the topic, the assumption of constant returns to scale might not
represent a proper specification for a hospital production function, being variable returns
to scale more appropriate for healthcare services. If the latter is the case, as Italian
hospitals exhibit significant differences in average size, then CRS efficiency scores
could be particularly affected by the wrong specification of the returns to scale.
On the empirical ground, the hypothesis of non-constant returns to scale seems to
be confirmed by the VRS efficiency scores shown in the lower part of Table 8 and in
Figure 3. Compared to the CRS ones, VRS efficiency scores exhibit larger differences
among types of hospitals. Particularly, looking at the median efficiency score values,
hospital trusts turn out to be the most efficient typology of public hospitals, while HUs
result the less efficient one. This piece of evidence is especially relevant for the
23
By doing so, we were able to avoid problems of bias and inconsistency at the boundary of support
(Simar and Wilson 2008).
23
objective of this study, given that, as previously mentioned, hospitals directly managed
by LHAs (i.e. HUs) are the only ones to be financed by global budget, whereas all of the
other Italian hospitals are financed by DRG-based PPSs.
Again from the lower part of Table 8 and from Figure 3, hospital units seem to be
more efficient than accredited private for-profit hospitals, despite the fact that the latter
are effectively financed by PPS. This apparently counter-intuitive result could be due
either to the choice of the selected output variables or to the great heterogeneity existing
among private hospital structures. Looking at the variability of the efficiency scores
within a given typology of hospitals (Figure 3), however, the latter seems the most
reasonable explanation. Indeed, accredited private for-profit hospitals show the greatest
variability of scores while hospital trusts exhibit the smallest one.
It should be also considered that VRS efficiency scores, apart from the pure
technical efficiency of production units, also include the efficiency scale with respect to
the best production frontier. As Italian accredited private for-profit hospitals tend to be
small in size and, thus, significantly below the efficient scale of production for
healthcare services, they might be technically efficient but still exhibit lower VRS
efficiency scores. To control for this problem, we perform the Banker’s test (Banker
1996) on scale assumptions. The results reject the null hypothesis of CRS at any
conventional level of significance. 24
Finally, as an attempted step of this first stage of the efficiency analysis, we test
the hypothesis that HUs are statistically different from all other hospitals (both public
and private ones) as far as efficiency scores are concerned. To this purpose, we compute
the two-sample Kolmogorov-Smirnov’s test for the equality of distribution of DEA
efficiency scores between hospital directly managed by LHAs (i.e. HUs) and all other
hospital types working on behalf of the Italian NHS. For the sake of completeness, we
24
Results are available upon request from the authors.

24
run this test for either CRS or VRS efficiency scores. Indeed, all different tests report a
p-value = 0.000, implying a significant difference in the distribution of DEA efficiency
scores between HUs and all the other typologies of hospitals.
Finally, we also compute the Bartlett’s test (Snedecor and Cochran 1983) for the
equality of variances between the efficiency scores of HUs and all other types of
hospitals. Again, the test show always a p-value = 0.000, meaning that the variance of
DEA efficiency scores between these two categories of hospitals (HUs and all other
hospitals) is significantly different.
5.3 Second stage analysis
In this section, we apply a two-stage analysis, to evaluate more in depth whether
different categories of hospitals show different performances depending on their
financing mechanisms. More specifically, we regress the DEA efficiency scores, under
the hypothesis of both CRS and VRS, against hospital categories, using hospitals
directly managed by LHUs (i.e. HUs) as the omitted category, since they are not actually
financed by tariffs. Although, the Banker’s test strongly favors VRS technology in our
sample, we provide also the estimates with respect to the CRS assumption, since these
represent a reference point in the two-stage analysis. Finally, we include regional and
time controls.
We apply both semi-parametric (Simar and Wilson, 2007) and parametric (Banker
and Natarajan, 2008) robust OLS estimators. Following Simar and Wilson (2007), we
estimate the truncated regression models given in [3] and [4] using maximum likelihood.
The Table 9 provides semi-parametric bootstrap truncated (Banker and Natarajan,
2008) robust OLS estimates for the full sample, under the hypothesis of CRS. Similar
estimation results under VRS assumption are reported in Table 10.
(Insert TABLE 9 about here)
(Insert TABLE 10 about here)
25
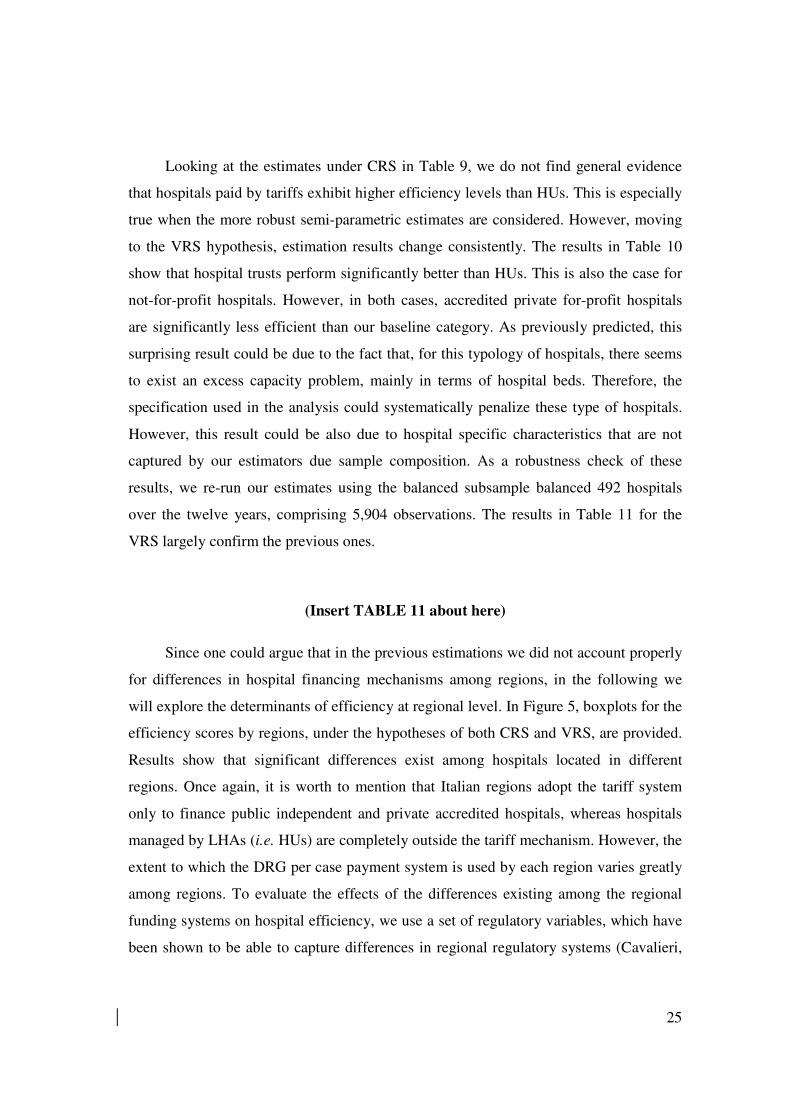
Looking at the estimates under CRS in Table 9, we do not find general evidence
that hospitals paid by tariffs exhibit higher efficiency levels than HUs. This is especially
true when the more robust semi-parametric estimates are considered. However, moving
to the VRS hypothesis, estimation results change consistently. The results in Table 10
show that hospital trusts perform significantly better than HUs. This is also the case for
not-for-profit hospitals. However, in both cases, accredited private for-profit hospitals
are significantly less efficient than our baseline category. As previously predicted, this
surprising result could be due to the fact that, for this typology of hospitals, there seems
to exist an excess capacity problem, mainly in terms of hospital beds. Therefore, the
specification used in the analysis could systematically penalize these type of hospitals.
However, this result could be also due to hospital specific characteristics that are not
captured by our estimators due sample composition. As a robustness check of these
results, we re-run our estimates using the balanced subsample balanced 492 hospitals
over the twelve years, comprising 5,904 observations. The results in Table 11 for the
VRS largely confirm the previous ones.
(Insert TABLE 11 about here)
Since one could argue that in the previous estimations we did not account properly
for differences in hospital financing mechanisms among regions, in the following we
will explore the determinants of efficiency at regional level. In Figure 5, boxplots for the
efficiency scores by regions, under the hypotheses of both CRS and VRS, are provided.
Results show that significant differences exist among hospitals located in different
regions. Once again, it is worth to mention that Italian regions adopt the tariff system
only to finance public independent and private accredited hospitals, whereas hospitals
managed by LHAs (i.e. HUs) are completely outside the tariff mechanism. However, the
extent to which the DRG per case payment system is used by each region varies greatly
among regions. To evaluate the effects of the differences existing among the regional
funding systems on hospital efficiency, we use a set of regulatory variables, which have
been shown to be able to capture differences in regional regulatory systems (Cavalieri,

26
Gitto and Guccio 2013; Cappellari, Paoli and Turati 2014; Finocchiaro Castro et al.
2014). Specifically, as a proxy for the extent to which the DRG per case payment system
is used in each region, we consider the share of total hospital beds owned by public
independent (hospital trusts) and private accredited for-profit hospitals
(DRG_EXTENT). Even if the variable DRG_EXTENT is a very rough representation of
the differences in financing systems across Italian regions, it certainly captures the
relative size, in each region, of two large groups of hospitals, which are strongly
characterized, among others, by differences in management and, above all, in financing.
We are well aware that the regional differences in the implementation of the tariff
system, within the subset of hospitals including the public independent and private
accredited ones, are not fully captured by our DRG_EXTENT variable. Therefore, to
capture residual regional differences in the financing mechanism, we distinguish,
through a dummy variable, between those regions that have established their own DRG
tariffs and those that have opted for the national DRG rates (REGIONAL_DRG).
In Table 12, we re-run the estimates that capture differences in regional regulatory
systems, under the VRS assumption. The results show that those regions that have a
higher hospital supply financed by an activity based payment system have a higher level
of efficiency (the DRG_EXTENT variable is significant and positive), ceteris paribus.
Moreover, the dummy variable referring to the residual regional differences in the
adoption of financing mechanisms (REGIONAL_DRG) is positive and highly
significant. Once again, as a robustness checks of our findings, we perform the estimates
using the balanced subsample under VRS. The results reported in Table 13 confirm the
robustness of the main findings of our analysis.
(Insert TABLE 12 about here)
(Insert TABLE 13 about here)
6. Policy Implications and Final Remarks

27
This study examined the impact of DRG-based PPS on the efficiency of Italian
hospitals. To this end, we carried out a two-stage efficiency analysis, in which the first
stage estimated the DEA efficiency scores of all Italian hospitals, and the second stage
regressed the scores on specific explanatory variables, aiming to capture the role of
regional financing systems.
We conclude from the results that a significant impact of the use of DRG-based PPS
on hospital efficiency level exists. In particular, we found evidence that hospitals
financed by PPS tend to be more efficient on average than those financed by a global
budget. This difference is particularly marked for public hospitals, in which hospital
trusts, financed by DRG tariffs, clearly resulted to be more efficient than HUs, which are
financed by global budgets. However, the comparison of HUs to accredited private for-
profit hospitals is problematic because of the smaller scale as well as the excess capacity
problem, mainly regarding hospital beds, of the latter. Moreover, the specification
employed in the analysis, which uses case-mix adjusted discharged patients, could
systematically penalize accredited private for-profit hospitals.
A controversial issue of our results concerns the interpretation of the decreasing trend
of DEA efficiency scores over time. Indeed, the DRG-based PPS was introduced to
increase the levels of efficiency of all Italian hospitals. Yet, surprisingly, our findings
indicate that efficiency levels began decreasing in 1999. One reasonable explanation for
this might be that the introduction of DRG-based PPS in the Italian NHS co-occurred
with a significant reshaping of healthcare policies aiming to reduce hospitalization rates.
Thus, the decreasing trend in efficiency levels could be caused by the consistent
decrease in outputs that were not followed by corresponding reductions in inputs.
Overall, the results of our efficiency analysis seem to support the hypothesis that the
introduction of a PPS financing system incentivizes hospitals to be more efficient. If so,
this empirical evidence from data on the Italian NHS represents further support for the
theoretical prediction that the introduction of a PPS should induce hospitals to operate
more efficiently.

28
In conclusion, our analysis provides important implications for healthcare policies. In
particular, the introduction of PPS should be considered an effective tool for policy
makers to increase hospitals’ efficiency in the provision of healthcare services.
Furthermore, this tool should be considered effective for any case-mix of providers
present in the system. However, our evidence on the efficiency of Italian private
hospitals suggests that the increase in technical efficiency induced by the introduction of
PPS might not be enough to overcome the low efficiency related to a small scale of
production. Consequently, a health system with a considerable proportion of private
providers should attend to the scale of production of each hospital operating within it.
Finally, healthcare policies aiming to lower hospitalization rates while avoiding
inefficient waste of resources should ensure that the induced reduction in outputs does
not generate an excess of capacity and, rather, correlates with a reduction in inputs.
Although our empirical findings are robust with respect to several statistical checks,
the conclusions that can be drawn by this study are tentative, and several issues are open
to scrutiny. Above all, this study evaluates efficiency by using imperfect output proxies.
In addition, a more appropriate evaluation of the impact of DRG-based PPSs would
involve outcomes, despite the potential trade-off between quality and technical
efficiency. Last but not least, as emphasized by our findings, further research and
analyses are needed to identify the short-term and long-term effects of PPS reforms on
healthcare systems.
References
Alchian, Armen A., and Harold Demsetz. 1972. Production, information costs, and
economic organization. American Economic Review 62 (5): 777-795.
Anessi Pessina, Eugenio, Elena Cantù, and Claudio Jommi. 2004. Phasing out market
mechanisms in the Italian National Health Service. Public Money and Management
24 (5): 309-316.
Bădin, Luiza, Cinzia Daraio, and Léopold Simar. 2013. Explaining inefficiency in
nonparametric production models: The state of the art. Annals of Operational
Research, 214 (1): 5-30.

29
Banker, Rajiv D. 1996. Hypothesis tests using data envelopment analysis. Journal of
Productivity Analysis, 7(2-3), 139-159.
Banker, Rajiv D., and Ramachandran Natarajan. 2008. Evaluating contextual variables
affecting productivity using data envelopment analysis. Operational Research 56 (1):
48-58.
Barbetta, Gian Paolo, Gilberto Turati, and Angelo Zago. 2007. Behavioral differences
between public and private not-for-profit hospitals in the Italian national health
service. Health Economics 16 (1): 75-96.
Bayindir, Esra E. 2012. Hospital ownership type and treatment choices. Journal of
Health Economics 31 (2): 359-370.
Berta Paolo, Giuditta Callea, Gianmaria Martini, and Giorgio Vittadini. 2010. The
effects of upcoding, cream skimming and readmissions on the Italian hospitals
efficiency: a population–based investigation. Economic Modelling 27 (4):812-821.
Biorn, Erik, Terje P. Hagen, Tor Iversen, and Jon Magnussen. 2003. The effect of
activity-based financing on hospital efficiency: a panel data analysis of DEA
efficiency scores 1992–2000. Health Care Management Science 6 (4): 271-283.
Biorn, Erik, Terje P. Hagen, Tor Iversen, and Jon Magnussen. 2010. How different are
hospitals’ responses to a financial reform? The impact on efficiency of activity-based
financing. Health Care Management Science 13 (1): 1-16.
Boni, Silvia, ed. 2007. I Sistemi di Governance dei Servizi Sanitari Regionali, Quaderni
Formez, No. 57, Formez.
Borden, James P. 1988. An assessment of the impact of diagnosis-related group (Drg)-
based reimbursement on the technical efficiency of New Jersey hospitals using data
envelopment analysis. Journal of Accounting and Public Policy 7 (2): 77-96.
Brekke, Kurt R., Luigi Siciliani, and Odd Rune Straume. 2015. Hospital competition
with soft budgets. The Scandinavian Journal of Economics 117 (3): 1019-1048.
Brenna, Elenka. 2011. Quasi-market and cost-containment in Beveridge systems: the
Lombardy model of Italy. Health Policy 103(2-3): 209-218.
Busse, Reinhard, Alexander Geissler, Wilm Quentin, and Miriam Wiley. 2011.
Diagnosis Related Groups in Europe. Moving Towards Transparency, Efficiency and
Quality in Hospitals, Maidenhead: Open University Press.
Cappellari, Lorenzo, Anna De Paoli, and Gilberto Turati. 2014. Do market incentives in
the hospital industry affect subjective health perceptions? Evidence from the Italian
PPS-DRG reform. IZA Discussion Paper, No. 8636.
Cavalieri, Marina, Lara Gitto, and Calogero Guccio. 2013. Reimbursement systems and
quality of hospital care: an empirical analysis for Italy. Health Policy 111 (3): 273–
289.

30
Chattopadhyay, Saibal, and Subhash Ray C.. 1996. Technical, scale, and size efficiency
in nursing home care: a non-parametric analysis of Connecticut homes. Health
Economics 5 (4): 363-373.
Chern, Jin-Yuan, and ThomasT.H. Wan. 2000. The impact of the prospective payment
system on the technical efficiency of hospitals. Journal of Medical Systems 24 (3):
159-172.
Chilingerian, Jon A., and David H. Sherman. 1990. Managing physician efficiency and
effectiveness in providing hospital services. Health Services Management Research 3
(1): 3-15.
Coulam, Robert F., and Gary L. Gaumer. 1991. Medicare’s prospective payment system:
a critical appraisal. Health Care Financing Review 13 (2): 45–77.
De Nicola, Arianna, Simone Gitto, Paolo Mancuso, and Vivian Valdmanis. 2014.
Healthcare reform in Italy: an analysis of efficiency based on nonparametric methods.
The International Journal of Health Planning and Management 29 (1): e48-e63.
Di Loreto, Paolo, and Paolo Spolaore, 2004. L’evoluzione del sistema nelle politiche
regionali. In Politiche innovative del Ssn: i primi dieci anni dei Drg in Italia, Nicola
Falcitelli, and Tommaso Langiano, eds., Bologna, Italy: Il Mulino.
Dismuke, Clara E., and Vania Sena. 1999. Has DRG payment influenced the technical
efficiency and productivity of diagnostic technologies in Portuguese public hospitals?
An empirical analysis using parametric and non-parametric methods. Health Care
Management and Science 2 (2): 107-116.
Dismuke, Clara E., and Vania Sena. 2001. Is there a trade-off between quality and
productivity? The case of diagnostic technologies in Portugal. Annals of Operations
Research 107 (1): 101-16.
Duggan, Mark G. 2000. Hospital ownership and public medical spending. The Quarterly
Journal of Economics 115 (4): 1343-1373.
Ellis, Randall P., and Thomas McGuire. 1986. Provider behavior under prospective
reimbursement. Cost sharing and supply. Journal of Health Economics 5 (2): 129-
151.
Ellis, Randall P., and Michelle Miller. 2008. Provider payment methods and incentives.
In International Encyclopedia of Public Health, Kris Heggenhougen, ed., 395-402,
San Diego, CA: Academic Press/Elsevier.
Fattore, Giovanni, and Aleksandra Torbica. 2006. Inpatient reimbursement system in
Italy: How do tariffs relate to costs. Health Care Management Science 9 (3): 251-
258.
Finocchiaro Castro, Massimo, Calogero Guccio, Giacomo Pignataro, and Ilde Rizzo.
2014. The effects of reimbursement mechanisms on medical technology diffusion in
the hospital sector in the Italian NHS. Health Policy 115 (2-3): 215-229.

31
France George, and Francesco Taroni. 2005. The evolution of health-policy making in
Italy. Journal of Health Politics, Policy and Law 3 (1-2):169-187.
France, George, Francesco Taroni, and Andrea Donatini. 2005. The Italian health care
system. Health Economics 14 (S1), 187–202.
Fried, Harold O., Knox C.A. Lovell, C.A., and Shelton S. Schmidt. 2008. Efficiency and
productivity. In The Measurement of Productive Efficiency and Productivity Growth.
Harold Fried, Knox C.A. Lovell, and Shelton S. Schmidt, eds., New York, NY:
Oxford University Press.
Gerdtham, Ulf-G., Mickael Löthgren, Magnus Tambour, and Clas Rehnberg. 1999a.
Internal markets and health care efficiency: a multiple-output stochastic frontier
analysis. Health Economics 8 (2):151-64.
Gerdtham, Ulf-G., Clas Rehnberg, and Mickael Tambour. 1999b. The impact of internal
markets on health care efficiency: evidence from health care reforms in Sweden.
Applied Economics 31 (8): 935–45.
Hadad, Sharon, Yossi Hadad, and Tzahit Simon-Tuval. 2013. Determinants of
healthcare system’s efficiency in OECD countries. European Journal of Health
Economics 14 (2): 253-65.
Hagen, Terje P., Marike Veenstra, and Knut Stavem. 2006. Efficiency and patient
satisfaction in Hagen, T.P., Veenstra, M., Stavem, hospitals. Hero On Line Working
Paper Series 2, Oslo University, Oslo.
Herwartz Helmut, and Tobias Strumann. 2014. Hospital efficiency under prospective
reimbursement schemes: An empirical assessment for the case of Germany.
European Journal of Health Economics 15 (2): 175-18.
Hoff, Ayoe. 2007. Second stage DEA: comparison of approaches for modelling the DEA
score. European Journal of Operational Research 181 (1): 425-435.
Hollingsworth, Bruce. 2003. Non-parametric and parametric applications measuring
efficiency in health care. Health Care Management and Science 6 (4): 203-218.
Hollingsworth, Bruce. 2012. Revolution, evolution, or status quo? Guidelines for
efficiency measurement in health care. Journal of Productivity Analysis 37 (1): 1-5.
Hollingsworth, Bruce, Philip Dawson, and Nikolaos Maniadakis. 1999. Efficiency
measurement of health care: a review of non-parametric methods and applications.
Health Care Management and Science 2 (3): 161-172.
Horwitz, Jill R., and Austin Nichols. 2009. Hospital ownership medical services: market
mix spillover effects, and nonprofit objectives. Journal of Health Economics 28 (5):
924-937.
Jommi, Claudio, Elena Cantù, and Eugenio Anessi-Pessina. 2001. New funding
arrangements in the Italian National Health Service. International Journal of Health
Planning and Management 16 (4): 347-68.

32
Jondrow, James, Knox C.A. Lovell, Ivan Materov, and Peter Schmidt.1982. On the
estimation of technical inefficiency in the stochastic frontier production function
model. Journal of Econometrics 19 (2-3), 233–238.
Kneip, Alois, Byeong Park, and Léopold Simar. 1998. A note on the convergence of
nonparametric DEA efficiency measures. Econometric Theory, 14 (06), 783-793.
Kornai, Janos. 2009. The soft budget constraint syndrome in the hospital sector.
International Journal of Health Care Finance and Economics 9 (2): 117-135.
Langenbrunner, John C., Cheryl Cashin, and Sheila O’Dougherty. 2009. Designing and
implementing health care provider payment systems. How-to manuals. Number
13806 in World Bank Publications. Washington, DC: The World Bank.
Linna, Miika. 2000. Health care financing reform and the productivity change in Finnish
hospitals. Journal of Health Care Finance 26 (3), 83-100.
Ma, Ching-To Albert. 1994. Health care payment systems: cost and quality incentives.
Journal of Economics and Management Strategy 3 (1): 93-112.
Meyer, Stefan. 2015. Payment schemes and cost efficiency: evidence from Swiss public
hospitals. International Journal of Health Economics and Management 15 (1): 73-97.
Morandi, Isabella. 2009. Le tariffe ospedaliere in Italia: nazionali e regionali.
Proceedings of the AIES-AGENAS meeting “Le tariffe in sanità: strumento di
finanziamento, regolazione e valutazione”, Rome.
Morandi, Isabella, Emanuela Pieroni, Francesca Giuliani, Cesare Cislaghi. 2008.
Criticità delle tariffe nel SSN. Proceedings of the AIES Conference, Matera.
Morey, Richard, and David A. Dittman. 1996. Cost pass-through reimbursement to
hospitals and their impacts on operating efficiencies. Annals of Operations Research
67 (1), 117-139.
Mutter, Ryan, Vivian Valdmanis, and Michael Rosko. 2010. High versus lower quality
hospitals: a comparison of environmental characteristics and technical efficiency.
Health Services and Outcomes Research Methodology 10 (3): 134-153.
O’Neill, Liam, Marion Rauner, Kurt Heidenberger, and Markus Kraus. 2008. A cross-
national comparison and taxonomy of DEA-based hospital efficiency studies. Socio-
Economic Planning Sciences 42 (3): 158-189.
Ouellette, Pierre, and Valérie Vierstraete. 2004. Technological change and efficiency in
the presence of quasi-fixed inputs: A DEA application to the hospital sector.
European Journal of Operational Research 154 (3): 755-763.
Pedraja-Chaparro, Francisco, Javier Salinas-Jiménez, and Peter Smith. 1999. On the
quality of the data envelopment analysis model. Journal of the Operational Research
Society 50(6): 636-644.
33
Piacenza, Massimiliano, Gilberto Turati, and Davide Vannoni. 2010. Restructuring
hospital industry to control public health care expenditure: the role of input
substitutability. Economic Modelling 27(4): 881-890.
Ramalho, Esmeralda A., Joaquim J.S. Ramalho, and Pedro D. Henriques. 2010.
Fractional regression models for second stage DEA efficiency analyses. Journal of
Productivity Analysis. 34 (3): 239-255.
Rosko, Michael D., and Ryan L. Mutter. 2010. Inefficiency differences between critical
access hospitals and prospectively paid rural hospitals. Journal of Health Politics,
Policy and Law 35 (1): 95-126.
Sahin, Ismet, and Yasar A. Ozcan. 2000. Public sector hospital efficiency for provincial
markets in Turkey. Journal of Medical Systems 24 (6): 307-320.
Shen, Yu-Chu, and Karen Eggleston. 2009. The effect of soft budget constraints on
access and quality in hospital care. International Journal of Health Care Finance and
Economics 9 (2): 211-232.
Sherman, David. 1984. Hospital efficiency measurement and evaluation. Empirical test
of a new technique. Medical Care 22 (10): 922-938.
Simar, Léopold, and Paul Wilson. 1998. Sensitivity analysis of efficiency scores: how to
bootstrap in nonparametric frontier models. Management Science, 44 (1): 49-61.
Simar, Léopold, and Paul Wilson. 2000. A general methodology for bootstrapping in
nonparametric frontier models. Journal of Applied Statistics, 27 (6): 779-802.
Simar, Léopold, and Paul Wilson. 2007. Estimation and inference in two-stage, semi-
parametric models of production processes. Journal of Econometrics. 136 (1): 31-64.
Simar, Léopold, and Paul Wilson. 2008. Statistical inference in nonparametric frontier
models: Recent developments and perspectives. In The measurement of productive
efficiency and productivity growth, Fried, Harold, Knox C.A. Lovell, Shelton S.
Schmidt, eds., New York, NY: Oxford University Press.
Simar, Léopold, and Paul Wilson. 2011. Two-stage DEA: Caveat emptor. Journal of
Productivity Analysis 36 (2): 205-218.
Sloan, Frank A., Gabriel A. Picone, Donald H. Taylor, and Shin Y. Chou. 2001.
Hospital ownership and cost and quality of care: is there a Dime’s worth of
difference?. Journal of Health Economics 20 (1): 1-21.
Snedecor, George W. and William G. Cochran. 1989. Statistical Methods. Eighth
Edition. Anes, Iowa: Iowa State University Press.
Sommersguter-Reichmann, Margit. 2000. The impact of the Austrian hospital financing
reform on hospital productivity: empirical evidence on efficiency and technology
changes using a nonparametric input-based Malmquist approach. Health Care
Management and Science 3 (4), 309-321.

34
Street, Andrew, Jacqueline O’Reilly, Padraic Ward, and Anne Mason. 2011. DRG-based
hospital payment and efficiency: Theory, evidence and challenges. In Diagnosis
Related Groups in Europe. Moving Towards Transparency, Efficiency and Quality in
Hospitals, Reinhard Busse, Alexander Geissler, Wilm Quentin.,and Miriam Wiley,
eds., Maidenhead, United Kingdom: Open University Press.
Taroni, Francesco. 1996. DRG/ROD e nuovo sistema di finanziamento degli ospedali.
Rome, Italy: Il Pensiero Scientifico editore.
Turati, Gilberto. 2013. The Italian Servizio Sanitario Nazionale: a renewing tale of lost
promises, In Federalism and Decentralization in European Health and Social Care:
Competition, Innovation, and Cohesion, Joan Costa-Font and Scott C. Greer, eds., 47-
66, Houndmills Basingstoke, United Kingdom: Palgrave MacMillan.
Widmer, Philippe K. 2011. Does Prospective Payment Increase Hospital (In)Efficiency?
Evidence from the Swiss Hospital Sector. University of Zurich, Department of
Economics Working Paper No. 53, Zurich, Switzerland.

35
Tables
Table 1. Sample Composition by Type of Hospital (Full data sample and subsample of balanced
panel data)
Type Full data sample Subsample of balanced panel data
No. Obs. % No. Obs. %
Hospital Trusts 1,036 9.09 431 7.30
Hospital Units 5,365 47.09 2,616 44.31
Private For Profit Hospitals 3,962 34.78 2,189 37.08
Not For Profit Hospitals
1,030 9.05 668 11.31
All sample 11,393 100.00 5,904 100.00
Source: our elaboration on data provided by the Italian Department of Healthcare.
Table 2. Descriptive Statistics for the Selected Variables in DEA models (Full data sample and
subsample of balanced panel data)
Variables Full data sample Subsample of balanced panel data
Mean S.D. Mean S.D.
Inputs
Beds 217.99 261.77 224.28 269.28
Physicians 119.00 158.67 125.02 170.69
Nurses 262.76 374.69 267.04 384.42
Other personnel 236.39 366.04 241.56 378.37
Outputs
Inpatient days 6,0784.15 7,9267.27 6,2330.11 8,2381.26
Discharged patients 8,489.08 10,088.61 8,704.14 10,411.26
Case-mix adjusted discharged patients 7,797.36 10,172.41 7,995.23 10,576.92
Source: our elaboration on data provided by the Italian Department of Healthcare.

36
Table 3. Descriptive Statistics for the Selected variables by Year (Full data sample)
Years No.
Obs.
Beds Physicians Nurses Other personnel Inpatient days Discharged
patients
Case-mix adjusted
discharged patients
Mean S.D Mean S.D Mean S.D Mean S.D Mean S.D Mean S.D Mean S.D
1999 1,044 233.6 288.1 100.8 144.9 236.5 342.4 218.6 342.1 64,629.0 85,120.1 8,968.1 10,746.8 8,309.5 10,944.1
2000 1,020 229.0 282.5 102.4 145.1 239.4 349.6 222.3 350.5 63,283.3 83,066.9 8,835.0 10,568.8 8,193.1 10,754.4
2001 1,012 226.5 276.4 106.9 147.8 248.7 363.8 227.1 353.4 62,104.7 81,948.1 8,803.7 10,471.3 8,135.3 10,734.6
2002 1,004 216.8 261.5 111.4 155.4 249.6 365.9 229.7 363.1 59,856.5 78,477.6 8,515.5 10,101.5 7,844.6 10,285.0
2003 981 214.0 253.8 115.1 155.5 254.5 365.3 235.5 369.9 58,206.7 75,885.2 8,214.2 9,774.6 7,557.6 9,853.0
2004 901 223.4 262.5 124.1 159.5 270.1 381.3 250.2 383.2 61,633.4 78,873.0 8,656.6 10,110.9 7,947.1 10,170.0
2005 904 222.8 261.7 127.4 165.4 266.5 375.5 256.9 402.4 61,887.0 78,514.6 8,648.8 10,064.3 7,906.6 10,030.9
2006 896 199.4 238.2 116.1 155.6 245.9 350.7 210.6 323.5 55,662.1 72,886.4 7,868.0 9,381.3 7,130.0 9,336.4
2007 930 213.2 252.9 128.8 166.0 280.1 394.7 243.6 371.6 60,235.2 78,670.4 8,356.2 9,979.2 7,647.8 9,988.5
2008 914 212.3 252.1 131.6 167.1 286.4 399.6 245.8 371.9 60,814.2 79,120.8 8,360.6 9,972.2 7,654.3 9,958.4
2009 902 209.6 248.7 133.8 168.2 289.9 400.3 249.5 379.9 60,264.5 78,432.3 8,305.8 9,903.4 7,584.5 9,871.0
2010 885 210.9 249.5 137.2 171.2 296.2 406.6 253.3 379.7 60,037.6 78,130.0 8,194.6 9,712.1 7,496.3 9,755.3
All 11,393 218.0 261.8 119.0 158.7 262.8 374.7 236.4 366.0 60,784.2 79,267.3 8,489.1 10,088.6 7,797.4 10,172.4
Source: our elaboration on data provided by the Italian Department of Healthcare.
Table 4. Main Variables Employed in the Second Stage (Full data sample)
Variables Definition Mean St. Dev.
DRG_EXTENT Proportion of total beds owned by public independent and private accredited
hospitals, at regional level 0.475 0.228
REGIONAL_DRG Dummy variable for regional DRG 0.336 0.474
Hospital Trusts Dummy variable for hospital trust 0.091 0.288
Hospital Units Dummy variable for hospital unit 0.471 0.499
Private For Profit Hospitals Dummy variable for private hospital 0.348 0.476
Not For Profit Hospitals Dummy variable for other hospitals 0.090 0.287
Source: our elaboration on data provided by the Italian Department of Healthcare.
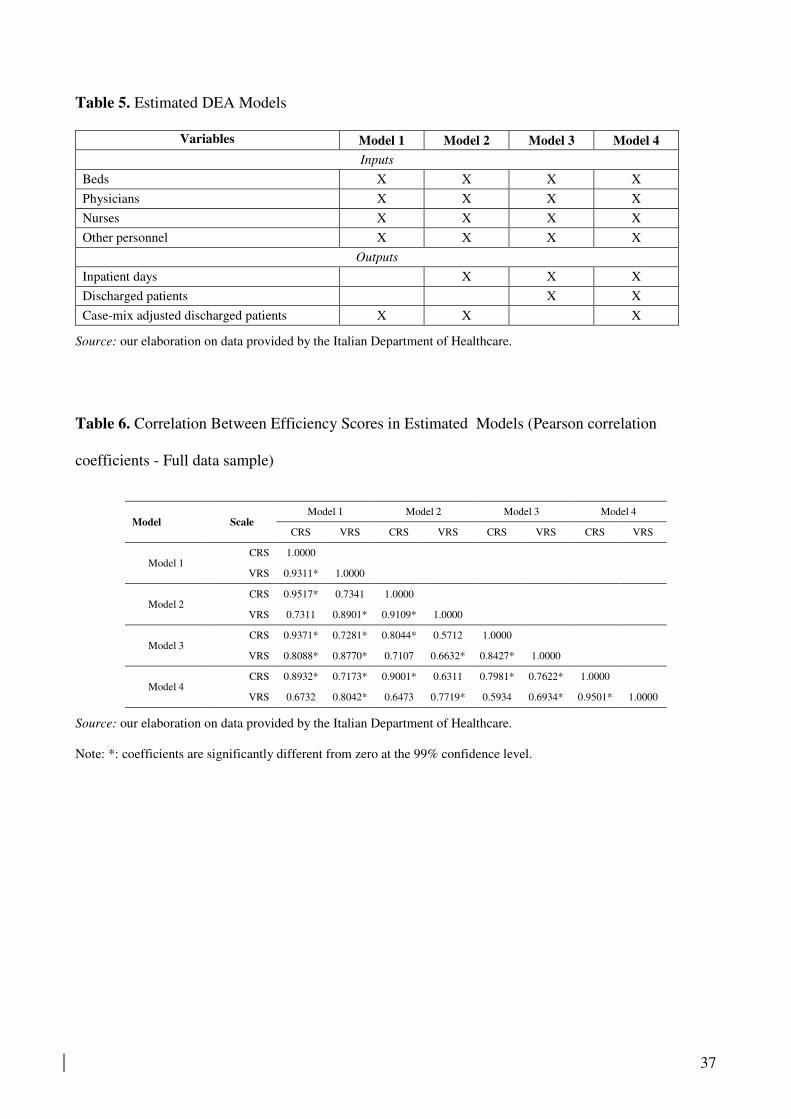
37
Table 5. Estimated DEA Models
Variables Model 1 Model 2 Model 3 Model 4
Inputs
Beds X X X X
Physicians X X X X
Nurses X X X X
Other personnel X X X X
Outputs
Inpatient days X X X
Discharged patients X X
Case-mix adjusted discharged patients X X X
Source: our elaboration on data provided by the Italian Department of Healthcare.
Table 6. Correlation Between Efficiency Scores in Estimated Models (Pearson correlation
coefficients - Full data sample)
Model Scale Model 1 Model 2 Model 3 Model 4
CRS VRS CRS VRS CRS VRS CRS VRS
Model 1 CRS 1.0000
VRS 0.9311* 1.0000
Model 2 CRS 0.9517* 0.7341 1.0000
VRS 0.7311 0.8901* 0.9109* 1.0000
Model 3 CRS 0.9371* 0.7281* 0.8044* 0.5712 1.0000
VRS 0.8088* 0.8770* 0.7107 0.6632* 0.8427* 1.0000
Model 4 CRS 0.8932* 0.7173* 0.9001* 0.6311 0.7981* 0.7622* 1.0000
VRS 0.6732 0.8042* 0.6473 0.7719* 0.5934 0.6934* 0.9501* 1.0000
Source: our elaboration on data provided by the Italian Department of Healthcare.
Note: *: coefficients are significantly different from zero at the 99% confidence level.

38
Table 7. Results of Mann–Whitney Tests on the Differences Between the Technical Efficiency
(TE) and Scale Efficiency (SE) of Hospital Units Between Models
Hypothesis tested
(H0) = equality distribution (p-value)
Technical efficiency (TE)
Model 1 vs. Model 2 (0.2841)
Model 1 vs. Model 3 (0.1340)
Model 1 vs. Model 4 (0.2010)
Scale efficiency (SE)
Model 1 vs. Model 2 (0.3707)
Model 1 vs. Model 3 (0.0947)
Model 1 vs. Model 4 (0.1443)
Source: our elaboration on data provided by the Italian Department of Healthcare.
Table 8. Average DEA Efficiency Scores by Year and Type of Hospital (Full data sample – CRS
and VRS estimates)
CRS DEA efficiency estimates
Hospital type 1999 2000 2001 2002 2003 2004 2005 2006 2007 2008 2009 2010 ALL
Hospital Trusts 0.4903 0.5290 0.5352 0.6206 0.5438 0.5594 0.6939 0.5813 0.5934 0.6115 0.5720 0.5957 0.5757
Hospital Units 0.5466 0.5573 0.5681 0.6117 0.5243 0.5729 0.6815 0.5759 0.5950 0.5975 0.5818 0.5791 0.5803
Private For Profit Hospitals 0.6111 0.5898 0.6447 0.6316 0.5426 0.5561 0.6030 0.5133 0.5405 0.5344 0.5311 0.5020 0.5657
Not For Profit Hospitals 0.5309 0.5519 0.5627 0.6353 0.5416 0.5970 0.6957 0.5733 0.6071 0.6145 0.5780 0.5897 0.5901
All sample 0.5596 0.5642 0.5884 0.6212 0.5336 0.5675 0.6554 0.5517 0.5758 0.5768 0.5615 0.5528 0.5757
VRS DEA efficiency estimates
Hospital Trusts 0.8283 0.8087 0.8134 0.8018 0.8066 0.7892 0.7957 0.7543 0.8177 0.7774 0.7949 0.8091 0.8011
Hospital Units 0.6475 0.6465 0.6499 0.6675 0.6433 0.6707 0.7062 0.6427 0.6706 0.6649 0.6631 0.6580 0.6598
Private For Profit Hospitals 0.6758 0.6446 0.7064 0.6893 0.6328 0.6164 0.6534 0.5680 0.6049 0.5990 0.6028 0.5712 0.6294
Not For Profit Hospitals 0.6983 0.6843 0.7044 0.7255 0.7078 0.7228 0.7329 0.6621 0.7483 0.7283 0.7249 0.7343 0.7159
All sample 0.6767 0.6640 0.6875 0.6929 0.6607 0.6679 0.6985 0.6237 0.6671 0.6565 0.6583 0.6453 0.6671
Source: our elaboration on data provided by the Italian Department of Healthcare.

39
Table 9. Semiparametric Bootstrap Truncated and OLS Regression Models (Full sample – CRS)
VARIABLES (1) (2) (3) (4) (5) (6)
Semiparametric bootstrap truncated regression OLS
Hospital Trusts 0.007 0.007 0.005 0.005 0.009** 0.007**
(0.006) (0.006) (0.006) (0.003) (0.004) (0.003)
Private For Profit Hospitals -0.014*** -0.014*** -0.014*** -0.015*** -0.014*** -0.014***
(0.003) (0.003) (0.003) (0.004) (0.004) (0.004)
Not For Profit Hospitals 0.009* 0.015*** 0.016*** 0.010** 0.016*** 0.016***
(0.005) (0.005) (0.005) (0.005) (0.005) (0.005)
Constant 0.572*** 0.518*** 0.496*** 0.580*** 0.526*** 0.504***
(0.002) (0.007) (0.008) (0.002) (0.006) (0.008)
Regional dummies no yes yes no yes yes
Time dummies no no yes no no yes
Observations 11,393 11,393 11,393 11,393 11,393 11,393
Source: our elaboration on data provided by the Italian Department of Healthcare.
Note: error terms in parentheses , *** p<0.01, ** p<0.05, * p<0.1
Table 10. Semiparametric Bootstrap Truncated and OLS Regression Models (Full sample – VRS)
VARIABLES (1) (2) (3) (4) (5) (6)
Semiparametric bootstrap truncated regression OLS
Hospital Trusts 0.168*** 0.179*** 0.178*** 0.141*** 0.154*** 0.153***
(0.007) (0.007) (0.007) (0.004) (0.005) (0.005)
Private For Profit Hospitals -0.031*** -0.029*** -0.027*** -0.030*** -0.029*** -0.027***
(0.008) (0.008) (0.008) (0.004) (0.004) (0.004)
Not For Profit Hospitals 0.062*** 0.061*** 0.063*** 0.056*** 0.056*** 0.058***
(0.011) (0.011) (0.012) (0.006) (0.006) (0.006)
Constant 0.601*** 0.515*** 0.497*** 0.660*** 0.578*** 0.560***
(0.019) (0.020) (0.020) (0.002) (0.007) (0.009)
Regional dummies no yes yes no yes yes
Time dummies no no yes no no yes
Observations 11,393 11,393 11,393 11,393 11,393 11,393
Source: our elaboration on data provided by the Italian Department of Healthcare.
Note: error terms in parentheses , *** p<0.01, ** p<0.05, * p<0.1

40
Table 11. Estimate on subsample of balance panel (VRS)
VARIABLES (1) (2) (3) (4) (5) (6)
Bootstrap truncated semiparametric regression OLS
Hospital Trusts 0.149*** 0.129*** 0.123*** 0.003 0.007 0.013*
(0.011) (0.010) (0.010) (0.008) (0.008) (0.007)
Private For Profit Hospitals -0.058*** -0.071*** -0.069*** -0.025*** -0.034*** -0.034***
(0.005) (0.006) (0.006) (0.004) (0.005) (0.005)
Not For Profit Hospitals 0.054*** 0.030*** 0.035*** 0.021*** 0.006 0.011*
(0.008) (0.009) (0.008) (0.007) (0.007) (0.007)
Constant 0.591*** 0.529*** 0.454*** 0.706*** 0.632*** 0.573***
(0.003) (0.007) (0.009) (0.004) (0.008) (0.010)
Regional dummies no yes yes no yes yes
Time dummies no no yes no no yes
Observations 5,904 5,904 5,904 5,904 5,904 5,904
Source: our elaboration on data provided by the Italian Department of Healthcare.
Note: error terms in parentheses , *** p<0.01, ** p<0.05, * p<0.1
Table 12. Impact of Regional Differences in Hospital Financing (Full sample – VRS)
VARIABLES (1) (2) (3) (4) (5) (6)
Bootstrap truncated semiparametric regression OLS
Hospital Trusts 0.151*** 0.129*** 0.124*** -0.016 0.004 0.009
(0.011) (0.010) (0.010) (0.008) (0.008) (0.007)
Private For Profit Hospitals -0.056*** -0.073*** -0.069*** -0.025*** -0.034*** -0.031***
(0.005) (0.006) (0.006) (0.004) (0.005) (0.005)
Not For Profit Hospitals 0.149*** 0.129*** 0.123*** 0.001 0.002 0.011
(0.011) (0.010) (0.010) (0.008) (0.008) (0.007)
DRG 0.051*** 0.677*** 0.286*** 0.043*** 0.648*** 0.323***
(0.013) (0.053) (0.071) (0.014) (0.067) (0.072)
REG_DRG 0.031*** 0.116*** 0.084*** 0.049*** 0.183*** 0.068*
(0.005) (0.010) (0.010) (0.006) (0.033) (0.035)
Constant 0.583*** 0.516*** 0.452*** 0.711*** 0.628*** 0.511***
(0.003) (0.007) (0.009) (0.007) (0.008) (0.012)
Regional dummies no yes yes no yes yes
Time dummies no no yes no no yes
Observations 11,393 11,393 11,393 11,393 11,393 11,393
Source: our elaboration on data provided by the Italian Department of Healthcare.
Note: error terms in parentheses , *** p<0.01, ** p<0.05, * p<0.1

41
Table 13. Robustness checks – (subsample of balanced panel – VRS)
VARIABLES (1) (2) (3) (4) (5) (6)
Bootstrap truncated semiparametric regression OLS
Hospital Trusts 0.181*** 0.201*** 0.161*** 0.102*** 0.095*** 0.091***
(0.016) (0.015) (0.015) (0.006) (0.006) (0.007)
Private For Profit Hospitals -0.019*** -0.034*** -0.034*** -0.021*** -0.038*** -0.038***
(0.005) (0.005) (0.005) (0.005) (0.006) (0.006)
Not For Profit Hospitals 0.019*** 0.006 0.010 0.055*** 0.042*** 0.046***
(0.007) (0.007) (0.007) (0.007) (0.008) (0.008)
DRG 0.053*** 0.677*** 0.286*** 0.043*** 0.648*** 0.323***
(0.013) (0.060) (0.063) (0.014) (0.067) (0.072)
REG_DRG 0.043*** 0.109*** 0.079*** 0.049*** 0.183*** 0.068*
(0.005) (0.011) (0.010) (0.006) (0.033) (0.035)
Constant 0.580*** 0.706*** 0.533*** 0.686*** 0.803*** 0.752***
(0.006) (0.017) (0.019) (0.006) (0.014) (0.017)
Regional dummies no yes yes no yes yes
Time dummies no no yes no no yes
Observations 5,904 5,904 5,904 5,904 5,904 5,904
Source: our elaboration on data provided by the Italian Department of Healthcare.
Note: error terms in parentheses, *** p<0.01, ** p<0.05, * p<0.1
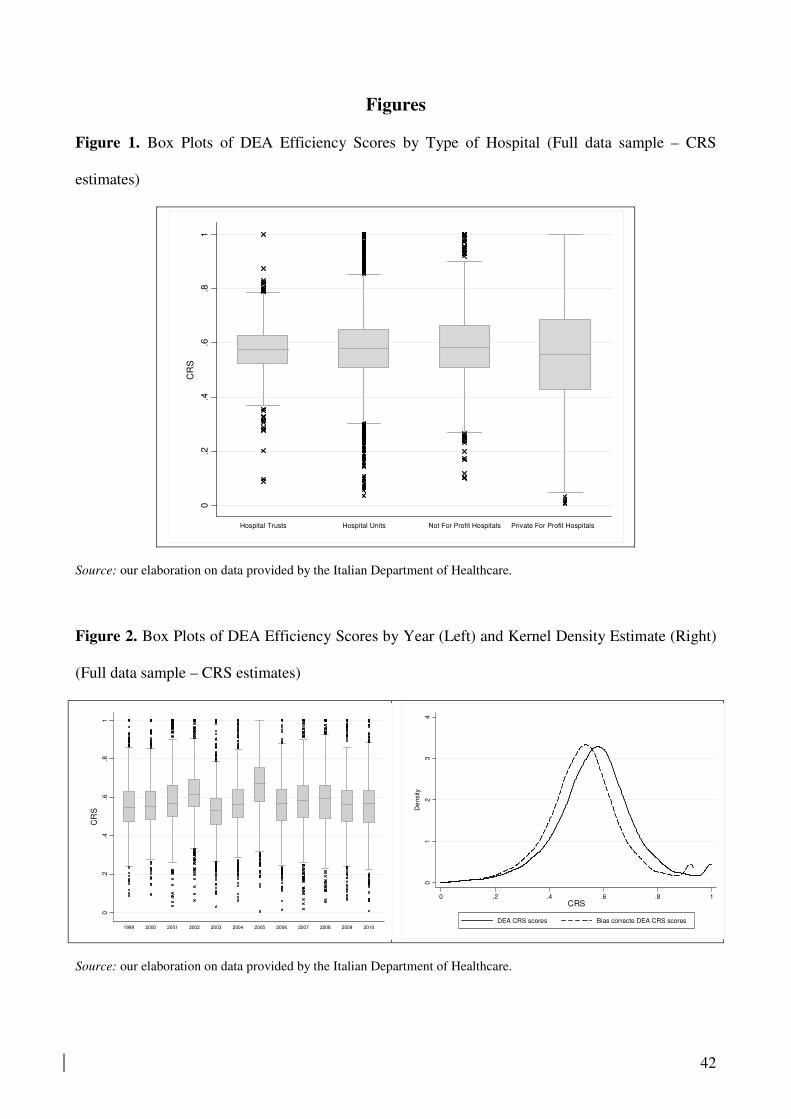
42
Figures
Figure 1. Box Plots of DEA Efficiency Scores by Type of Hospital (Full data sample – CRS
estimates)
Source: our elaboration on data provided by the Italian Department of Healthcare.
Figure 2. Box Plots of DEA Efficiency Scores by Year (Left) and Kernel Density Estimate (Right)
(Full data sample – CRS estimates)
Source: our elaboration on data provided by the Italian Department of Healthcare.
0.2
.4.6
.81
CR
S
Hospital Trusts Hospital Units Not For Profit Hospitals Private For Profit Hospitals
0.2
.4.6
.81
CR
S
1999 2000 2001 2002 2003 2004 2005 2006 2007 2008 2009 2010
01
23
4
De
nsity
0 .2 .4 .6 .8 1CRS
DEA CRS scores Bias correcte DEA CRS scores

43
Figure 3. Box Plots of DEA Efficiency Scores by Type of Hospital (Full data sample – VRS
estimates)
Source: our elaboration on data provided by the Italian Department of Healthcare.
Figure 4. Box Plots of DEA Efficiency Scores by Year (Left) and Kernel Density Estimate (Right)
(Full data sample – VRS estimates)
Source: our elaboration on data provided by the Italian Department of Healthcare.
0.2
.4.6
.81
VR
S
Hospital Trusts Hospital Units Not For Profit Hospitals Private For Profit Hospitals
0.2
.4.6
.81
VR
S
1999 2000 2001 2002 2003 2004 2005 2006 2007 2008 2009 2010
0.5
11
.52
De
nsity
0 .2 .4 .6 .8 1VRS
DEA VRS scores Bias corrected DEA VRS scores

44
Figure 5. Boxplots of DEA Efficiency Scores by Region –Full data sample - CRS (Left) and VRS
(Right)
Source: our elaboration on data provided by the Italian Department of Healthcare.
0 .2 .4 .6 .8 1CRS
VENETO
VALLEDAOSTA
UMBRIA
TOSCANA
SICILIA
SARDEGNA
PUGLIA
PROV. AUTON. TRENTO
PROV. AUTON. BOLZANO
PIEMONTE
MOLISE
MARCHE
LOMBARDIA
LIGURIA
LAZIO
FRIULI VENEZIA GIULIA
EMILIA ROMAGNA
CAMPANIA
CALABRIA
BASILICATA
ABRUZZO
0 .2 .4 .6 .8 1VRS
VENETO
VALLEDAOSTA
UMBRIA
TOSCANA
SICILIA
SARDEGNA
PUGLIA
PROV. AUTON. TRENTO
PROV. AUTON. BOLZANO
PIEMONTE
MOLISE
MARCHE
LOMBARDIA
LIGURIA
LAZIO
FRIULI VENEZIA GIULIA
EMILIA ROMAGNA
CAMPANIA
CALABRIA
BASILICATA
ABRUZZO