does lean improve labor standards? management...
TRANSCRIPT
Does Lean Improve Labor Standards?Management and Social Performance in the Nike Supply
Chain
Greg DistelhorstJens HainmuellerRichard M. Locke
August 29, 2015
Management Science, Forthcoming.
Abstract. This study tests the hypothesis that lean manufacturing improves thesocial performance of manufacturers in emerging markets. We analyze an interventionby Nike Inc. to promote the adoption of lean manufacturing in its apparel supply chainacross eleven developing countries. Using difference-in-differences estimates from apanel of over three hundred factories, we find that lean adoption was associated witha 15 percentage point reduction in noncompliance with labor standards that primarilyreflect factory wage and work hour practices. However, we find a null effect on factoryhealth and safety standards. This pattern is consistent with a causal mechanism thatlinks lean to improved social performance through changes in labor relations, ratherthan improved management systems. These findings offer evidence that capability-building interventions may reduce social harm in global supply chains.
Greg Distelhorst (corresponding author), Saıd Business School, University of Oxford, Park End Street,Oxford OX1 1HP, United Kingdom, Email: [email protected]. Jens Hainmueller, Stanford Uni-versity Department of Political Science, 616 Serra Street Encina Hall West, Room 100, Stanford, CA 94305-6044. Email: [email protected]. Richard M. Locke, Watson Institute for International Studies and De-partment of Political Science, Brown University, 111 Thayer Street, Box 1970, Providence, RI 02912. Email:richard [email protected].
We thank Gabriel Bitran, Joshua Cohen, Eli Friedman, Retsef Levi, Anita McGahan, Will Mitchell,Charles Sabel, and seminar participants at MIT, University of Toronto, the Labor and Employment RelationsAssociation, and the American Political Science Association for helpful feedback. Any remaining errors areour own.
1

1 Introduction
Corporate social performance has become an imperative in strategic management. As stake-
holders have grown increasingly adept at pressuring firms surrounding the social impacts of
their activities (Porter and Kramer 2006), scholars have linked corporate social performance
to a variety of positive outcomes, including improved access to finance (Cheng, Ioannou
and Serafeim 2014), the ability to attract talented employees (Turban and Greening 1997;
Bhattacharya, Sen and Korschun 2008), increased recommendations from stock analysts
(Luo et al. 2013), and improved risk management (Koh, Qian and Wang 2014). Social per-
formance is particularly important for firms transacting in foreign jurisdictions where their
social license to operate may be subject to the influence of powerful local stakeholders (Kytle
and Ruggie 2005; Henisz, Dorobantu and Nartey 2014).
A wide variety of multinational enterprises—including industry leaders in retail (Wal-
mart, Target, Ikea), electronics (Apple, Microsoft, HP), toys (Mattel, Hasbro), soft drinks
(Coca Cola), and the ten most valuable apparel brands1—have responded by adopting com-
pliance programs to enforce social standards in their global supply chains. The goal of these
programs is to improve the social performance of upstream business partners, primarily
in developing countries. They seek to address stakeholder concerns about the social im-
pact of production and to reduce reputational risk for lead firms (Locke 2013). Yet despite
widespread adoption of social compliance programs, research has repeatedly shown that
they yield only limited improvements in social performance (Barrientos and Smith 2007;
Egels-Zanden 2007; Locke, Qin and Brause 2007; Lund-Thomsen et al. 2012). Weak social
compliance means that important labor, safety, and environmental standards are violated
in the production of popular consumer goods, placing employees’ health and economic well-
being at risk. From the managerial perspective, ineffective compliance programs threaten
corporate social performance and its associated benefits. Socially irresponsible practices in
the supply chain expose lead-firms to the risk of negative financial shocks associated with
activist campaigns (King and Soule 2007) and the disclosure of socially harmful behavior
(Klassen and McLaughlin 1996; Flammer 2013).
This article explores an alternative approach to improving social performance in global
supply chains. We study the relationship between management practices and social perfor-
mance among apparel manufacturers in emerging markets. The global apparel industry
1The most valuable apparel brands ranked by Millward Brown Optimor (2013) are Zara, Nike, H&M,Ralph Lauren, Adidas, Uniqlo, Next, Lululemon, Hugo Boss, and Calvin Klein. All have adopted supplychain social compliance programs, which are detailed in their corporate citizenship reports.
2

employs over 25 million in low- to middle-income countries (International Labour Organiza-
tion 2005) and represents an important entry point for developing countries to global trade
in manufactures (Gereffi 1999). Since 2008, Nike Inc.—an international leader in the design
and retail of athletic apparel, footwear, and equipment—has promoted the adoption of lean
manufacturing in its apparel suppliers. This program provided training in lean manufactur-
ing to supplier management, encouraged the adoption of these management practices, and
verified that supplier production lines satisfied a set of lean standards. Adoption of this
production system required significant changes to the organization of production, worker
participation, and management systems.
What are the effects of lean manufacturing on social performance? Although the
proximal objectives of lean are to improve manufacturing performance, we hypothesize that
replacing traditional manufacturing practices with lean will also result in improved social
performance. We posit two mechanisms, which may operate in tandem, that link lean
manufacturing to improved workplace standards. The labor relations mechanism holds that
increased efforts to motivate and retain production workers under lean manufacturing results
in improved terms of employment, such as wages and benefits. The management systems
mechanism posits that new managerial capabilities lower the costs of complying with social
performance standards.
We estimate the effects of lean on social performance using panel data from over 300
factories across eleven developing countries between 2009 and 2013. Drawing on difference-
in-differences estimates, we find that the lean intervention was associated with significant
improvements in factory social performance. Adoption of lean manufacturing practices led to
a 15 percentage point reduction in noncompliant labor grades.2 This finding is robust to al-
ternative specifications, including controls for divergent labor market trends across countries,
controls for increased monitoring and enforcement by Nike, and an examination of pre-trends
among the lean-adopters. We estimate a modest effect on health, safety, and environmental
compliance, but it is imprecisely estimated and more sensitive to specification choices. This
pattern of improvements is consistent with the hypothesis that changes in labor relations
associated with high-involvement work link lean to improved labor standards. We also find
heterogeneity in workplace improvements by country; while the intervention significantly
raised labor compliance in India and Southeast Asian countries, factories in China showed
2“Noncompliant” grades are those in which auditors detected “Serious” or “Critical” violations of labor,health, or environmental standards, as opposed to “Minor” violations. In the Nike factory audit scoring rubric(Appendix Table A4), these are represented as C or D grades. More detail on factory social performancedata appears in Section 4.
3

no improvement.
Our work contributes to a deeper understanding of how multinational strategy af-
fects social outcomes in global markets in three ways. First, our findings represent the first
quantitative evidence linking capability-building to improved social performance in global
production. While a growing scholarly consensus affirms the importance of corporate so-
cial performance, major questions remain about how to achieve this performance in global
production networks. Capability-building interventions are increasingly promoted by both
global buyers and external stakeholders to improve supply chain social compliance (Oxfam
2010; IMPACTT 2011), but empirical evidence on their impact is limited and ambivalent,
leading to calls for new empirical work (Lund-Thomsen and Lindgreen 2014). Our exami-
nation of over 300 firms in eleven developing countries and our use of unit fixed-effects for
econometric identification allows us to improve both in terms of internal and external valid-
ity on previous research on management practices and social compliance, which has relied
on small samples and cross-sectional analysis (Locke et al. 2007).
Secondly, this study contributes new understanding about the social effects of modern
management in globalized production. Various studies have documented the effects of lean
and related high-performance work systems on business outcomes, including productivity
(MacDuffie 1995; Dunlop and Weil 1996; Ichniowski, Shaw and Prennushi 1997), product
quality (MacDuffie 1995; Bloom et al. 2013), and financial performance (Huselid 1995).
However, research on the social consequences of lean has focused on wages and worker mo-
tivation (Appelbaum 2000; Cappelli and Neumark 2001; Osterman 2006) or environmental
performance (King and Lenox 2001) in advanced economies. We instead study lean’s effect
on compliance with workplace social standards, which include wages and benefits but also
encompass a broader set of practices intended to protect employees and local communities.
By investigating this relationship among manufacturers in emerging markets, we contribute
to a debate on the effects of lean in the developing world. Some research suggests that
pressures to adopt lean manufacturing and develop fast turnaround capabilities have led to
a deterioration of working conditions in emerging market suppliers. Managers lacking the
resources to effectively implement modern manufacturing systems shift the costs of flexible
production onto the workforce in the form of longer hours, lower wages, and more precarious
employment (Dhanarajan 2005; Raworth and Kidder 2009). However, these claims have yet
to be subjected to quantitative hypothesis testing. Our findings offer evidence that lean
manufacturing can be meaningfully implemented in the context of export manufacturing in
emerging markets, and that its adoption yields benefits for social performance, linking eco-
4

nomic upgrading to social upgrading in global supply chains (Barrientos, Gereffi and Rossi
2011). Most importantly, because these management practices stand to benefit buyers, sup-
pliers, and workers, lean capability-building promises greater sustainability than traditional
social compliance programs.
Finally, these findings suggest a strategy for reconciling tension between the market
imperatives of modern supply chain management and social performance. Contemporary
sourcing strategies such as competitive costing, reduced lead-times, and smaller order sizes
shift risks onto suppliers and their workforces, thereby undermining key goals of social com-
pliance programs (Dhanarajan 2005; Barrientos 2013; Riisgaard 2009; Locke 2013). The
global apparel industry, where contemporary sourcing practices have been argued to be
particularly deleterious to labor outcomes (Anner, Bair and Blasi 2012), is a key case for ad-
dressing the tension between sourcing strategy and supplier social outcomes. A major goal of
the intervention we study was to improve supplier capabilities to deal with sourcing trends
toward smaller orders and more rapid turnaround. We show that adopting management
systems to meet these demands also led to improved social outcomes. Our results suggest
that contemporary trends in supply chain strategy need not depress working conditions so
long as emerging market manufacturers possess appropriate management capabilities. At
the same time, we show that promoting the adoption of new management practices is a
major undertaking. In the case we examine, it involved securing multi-year commitments
of support from supplier leadership, establishing a dedicated training facility, and intensive
engagement with suppliers’ operations personnel.
In the following section, we introduce supply chain social compliance programs and
the challenges of aligning business practice with social performance goals in global produc-
tion. We proceed to describe Nike’s intervention to promote lean manufacturing, developing
our hypothesis that lean manufacturing will yield improved workplace standards. After
describing our data and empirical strategy, we present our main finding: lean adoption pro-
duced a substantial reduction in poor grades associated with wage and work hours violations.
The final section discusses the limitations of this study and implications for future research
and management practice.
2 Managing Social Performance in Global Production
Global supply chains link thousands of firms across multiple political and economic bound-
aries. The diffusion of global supply chains in an array of different industries—including
5

apparel, electronics, footwear, food, toys, and others—has provided developing countries
with needed investment, employment, technology, and access to international markets. At
the same time, the social and environmental consequences of this pattern of economic devel-
opment have provoked controversies over the role of global buyers and their local suppliers,
often seen as exploiting low wages and regulatory laxity to produce low-cost goods at the
expense of workers’ welfare. As publicized by activists and social movements (Harrison and
Scorse 2010; King and Pearce 2010), child labor, hazardous working conditions, excessive
working hours, and poor wages plague many workplaces in the developing world (Verite
2004; Pruett, Merk and Ascoly 2005; Connor and Dent 2006; Kernaghan 2006). These rev-
elations create scandal and embarrassment for the global companies that source from these
factories and farms.
In the absence of a strong system of global justice (Cohen and Sabel 2006), and
given the limited ability (perhaps willingness) of many national governments to enforce their
own regulations, an array of actors—including transnational NGOs (Keck and Sikkink 1998;
Seidman 2007), global corporations and industry associations (Haufler 2001; Bartley 2007;
O’Rourke 2003; Ruggie 2008; Reich 2007), and some developed country governments (Bartley
2007)—began to promote private initiatives aimed at establishing and enforcing labor and
environmental standards in global supply chains. We refer to these initiatives as forms of
private regulation (Vogel 2008; 2010).
The prevalent model of private regulation involves establishing supply chain “Codes
of Conduct.” In theory, these standards are enforced on upstream suppliers through private
audits and the threat of withholding orders from noncompliant factories. However, a decade
of research has demonstrated the limitations of this strategy for enforcing labor standards.
Notwithstanding years of effort and significant investments by global corporations in devel-
oping more comprehensive monitoring tools, hiring growing numbers of internal compliance
specialists, conducting thousands of factory audits, and working with external consultants
and NGOs, working conditions and labor rights have improved among some supplier factories
but have stagnated or even deteriorated in many others (Locke 2013). Although pressure gen-
erated by anti-sweatshop campaigns has improved wages in some cases (Harrison and Scorse
2010), the scholarly literature on private regulation has generally found persistent noncom-
pliance in a variety of workplace standards (Barrientos and Smith 2007; Egels-Zanden 2007;
Locke et al. 2007). Despite private initiatives to equalize minimum workplace standards
across countries, domestic regulatory institutions and civil society remain key predictors of
social compliance in global supply chains (Distelhorst et al. 2014; Toffel, Short and Ouellet
6

2015).
One important critique of these programs is that they decouple compliance activities
from core business practices and thereby limit their impact on supplier social performance.
When needs for external legitimacy diverge from market demands, firms may design com-
pliance regimes that conflict with other business processes, a decoupling which has been
observed in other corporate ethics regimes (Weaver, Trevino and Cochran 1999; MacLean
and Behnam 2010). Within the global buyers that implement compliance programs, sourcing
decisions are often decoupled from the enforcement of private regulation, resulting in tension
between these two functions. It is not uncommon to hear complaints from social compli-
ance managers that their mission is not taken seriously by their colleagues in purchasing
departments (Harney 2008, 213). For their part, suppliers complain that despite lip-service
paid to ethical compliance, sourcing decisions appear to remain guided by traditional busi-
ness considerations, such as price, quality, or turnaround (Ruwanpura and Wrigley 2011).
Some buyers have publicly acknowledged that their own sourcing practices—including the
proliferation of styles, last-minute order changes, poor forecasting, and overloading supplier
capacity—contribute to the very social performance problems that compliance programs
attempt to remediate (Nike Inc. 2012; Locke 2013).
In light of the limitations of private regulation, we study a supply chain intervention
that focuses on developing the management capabilities of suppliers, rather than enforcing
standards through sourcing decisions. The immediate goal of capability-building is not to
monitor and incentivize socially responsible behavior, but rather to change suppliers’ day-
to-day managerial practices in ways that may also support improved social performance.
Capability-building for social performance has been pursued across a variety of industries
(Locke 2013), but claims of impact have yet to be subjected to quantitative hypothesis
testing. The following section describes Nike’s lean capability-building initiative and the
opportunity it provided to test whether such interventions improve social performance in
global production.
3 Lean Capability-Building in the Nike Supply Chain
Facing supply chain challenges in delivery time, product quality, and workplace conditions,
in the late 1990s, Nike began a search for management interventions for its supply base.3
3The following description of Nike’s lean capability-building program is based on interviews with eightsenior managers at Nike, internal documents provided by management, and a field visit to the lean trainingcenter in Vietnam.
7
The Toyota Production System (Ono 1988; Womack, Jones and Roos 1991) was selected for
emulation, and a Toyota consultant was hired to adapt lean concepts to footwear manufac-
turing. In 2002, Nike secured commitments from long-term footwear suppliers to implement
the lean management and production system it had developed, and a dedicated training
center was established in 2004 to train both factory managers and Nike staff. By May 2011,
80% of Nike’s footwear suppliers had committed to adopting the new system.
Lean concepts have been widely studied and applied without a clear consensus on
the definition of lean production (Shah and Ward 2007). In this study, we characterize the
Nike production system as “lean” by reference to common goals and features in lean systems
described by key works in the literature. The features of the Nike system (described in Table
1) included identifying the core value stream and orienting production around this concept;
balancing production processes using takt time (i.e. the available time for production divided
by consumer demand); eliminating waste through the reduction of inventory buffers and
works-in-progress; increasing operator participation in quality control and problem-solving
for continuous improvement; and improving operational stability with 5S, standardized work,
and visual management techniques (Womack and Jones 1996; MacDuffie 1995; Shah and
Ward 2003).
Nike reported business performance gains associated with its lean intervention in
footwear, including increased productivity, reduced defect rates, and reduced lead times for
both delivery and the introduction of new models (Nike Inc. 2012). If these practices im-
proved productivity and quality, why did manufacturers require outside intervention to adopt
them? In fact, management practices associated with inferior organizational performance
are relatively widespread even in advanced industrial economies (Bloom and Van Reenen
2007). The adoption of new management practices is not fully explained by superiority in
efficiency. It is instead constrained by prevailing intellectual dispositions, pre-existing as-
sumptions about human behavior, institutional conformity, and asymmetries between visible
costs versus hard-to-measure benefits (Guillen 1994; Pfeffer 2007). Implementing modern
management systems like lean also requires knowledge that may be difficult to acquire in
developing countries (Bloom et al. 2013). For these reasons, supply chain capability-building
is neither unusual nor unique to Nike. Its lean program resembles well-known initiatives to
develop supplier capabilities by Toyota, Honda, and other automakers (Sako 2004).
The perceived success of the footwear program led Nike to expand the lean program
to its apparel supply chain, which is the subject of our study. The global apparel industry
employs tens of millions of workers in the developing world (International Labour Organiza-
8

tion 2005) and has traditionally offered opportunities for developing countries to integrate
with global production networks (Gereffi 1999). As of November 2014, Nike contracted with
410 apparel factories across 41 countries, employing over 350,000 workers.4
The first wave of lean-adopters came from Nike’s Apparel Manufacturing Leadership
Forum, a group of strategic manufacturing partners with long-term relationships to Nike.
Subsequent waves of lean-adopters were nominated by Nike Apparel Liaison Office directors.
Senior management from invited suppliers were initially brought to the footwear training
center in Vietnam and introduced to the Nike lean production system. All invitees accepted
Nike’s offer to receive training and agreed to implement the system in their own plants. In
general, the factories receiving the intervention were larger plants with preexisting sourcing
relationships to Nike.5
The first group of apparel suppliers committed to the Nike lean program in 2007 and
began meeting to discuss lean concepts and receive limited training. A full training cur-
riculum was offered starting in 2009 at the newly-opened Apparel Innovation and Training
Center in Sri Lanka. The program trained supplier managers to oversee the lean transforma-
tion of their factories. The training program worked on a self-funding model that involved
significant commitment from suppliers. Participating factories sent managers to the Sri
Lanka training center for eight weeks and paid tuition to cover program costs.6 The train-
ing center was located inside an active apparel supplier, which allowed trainees to observe
and to practice what they learned in a lean manufacturing environment. After completing
the program, trainees worked with a Nike manager to develop a roll-out strategy for their
home factories. They began by establishing a pilot line and pursuing one element of the
transformation, adding new elements until all were adopted and stabilized.
After suppliers completed this reorganization of production lines, Nike personnel vis-
ited the plant to observe progress and to certify that the lines possess the core elements of
lean production. Their minimum definition of “lean” covered eight features, summarized in
Table 1. The production line must connect or link at least one process to the core value
stream; control inventory via flow racks, kanbans, and pull systems; use an Andon sys-
4For more detail, please see Nike’s global manufacturing map: http://nikeinc.com/pages/
manufacturing-map. Accessed January 4, 2015.5These selection criteria are one reason why cross-sectional comparisons of social compliance outcomes do
not produce credible estimates of lean’s effects on social outcomes. Previous research on working conditionsamong Nike’s suppliers found that strategic partners were more likely to have higher compliance scores(Locke et al. 2007). We illustrate the problem with cross-sectional estimations below after reporting theresults of our difference-in-differences analysis.
6The lean training program for apparel suppliers lasted twelve weeks, but managers returned from theSri Lanka training center to their home factories during the middle four weeks to work on assignments.
9

tem to signal problems in the line; track appropriate metrics for safety, quality, delivery,
and cost; use in-station quality inspection; use standardized work; show evidence of 5S and
visual management; and manage the core value stream as a single entity rather than indi-
vidual processes. In addition to these criteria, Nike personnel also looked for managerial
understanding of these processes and the use of takt time and cycle time to organize pro-
duction. These practices include key elements of the Toyota Production System (Monden
2012; Womack, Jones and Roos 1991) and many that appear in studies of modern manufac-
turing management, including techniques of inventory control, processes to support quality
improvement, and the collection and analysis of performance indicators (Bloom et al. 2013;
Bloom and Van Reenen 2007).
3.1 Hypothesized mechanisms linking lean to social performance
The intervention described in Table 1 primarily sought to transform the organization of pro-
duction, rather than to raise workplace labor, health, and environmental standards. While
lean manufacturing emphasizes the importance of trust and respect in the workplace (Mon-
den 2012), Nike’s lean program did not train suppliers on meeting social standards nor raise
social performance demands beyond those applied to other suppliers. Nonetheless, there are
theoretical reasons to expect that lean manufacturing may lead to improved factory social
performance. Drawing on previous research we posit two such mechanisms, one stemming
from changes in labor relations and the other from new management systems.
The first hypothesized mechanism involves increased employee involvement and its
effect on labor relations. Lean manufacturing systems, including Nike’s, include elements
of high-involvement work: workers possess increased skills and knowledge, the opportunity
to use those skills and knowledge, and the motivation to do so (Bailey, Berg and Sandy
2001). Lean involves more decentralized decision-making, giving workers responsibility for
a wider range of tasks than in traditional mass production7 (Appelbaum 2000; MacDuffie
1995). Workers in lean systems integrate quality inspection into production work, suggest
process improvements, and are more likely to engage in multiple production operations (Berg
et al. 1996; Dunlop and Weil 1996). In the Nike system, workers were trained to conduct in-
7Traditional apparel manufacturing is commonly referred to as the “progressive bundle system,” an appli-cation of the principles of scientific management to clothing production. Garment production is decomposedinto simple operations (e.g. individual seams), and workers specialize in performing one operation. To ac-commodate differences in worker speed, bundles of work-in-progress inventory buffer each step of production.It yields high levels of labor efficiency and machine utilization, but large inventory buffers also result in longcycle times. A garment that requires just a few minutes of actual labor may take several days to completethe process. (Dunlop and Weil 1996; Appelbaum 2000)
10

Table 1: Minimum Definitions of Nike Lean Production System (Apparel Manufacturing)
1. Connect or link at leastone process to the core valuestream.
Prior to lean, almost all apparel factories had physically disconnectedsewing, ironing, and packing, with high inventory buffers between each pro-cess. Connecting processes to the core value stream (sewing, in apparelfactories) means physically moving operators and machines into the line,with process cycle time balanced to the line takt time. In practice, mostapparel factories chose to connect ironing and packing at the end of eachsewing line.
2. Control inventory via flowracks, kanbans, and pull sys-tems
Flow racks allow for easy retrieval of inventory on a first-in-first-out basis;kanbans are cards used to signal the start and end of production. Both toolssupport pull systems, which drive production by demand at the end of theprocess and reduce waste by eliminating inventory that would ordinarilybuild up in the value stream to absorb variability in production processes.
3. Utilize an Andon systemto signal problems in the line
The Andon system allows production team members to quickly signal pro-duction problems to the entire team. Suppliers must adopt a visual system(e.g. colored flag, card, or digital signboard) to signal problems, such asproduction defects, machine malfunctions, or an operator’s need for relief.Depending on the problem, activating the Andon may temporarily stopproduction while the problem is addressed.
4. Track appropriate met-rics for safety, quality, deliv-ery, and cost
The minimum definition requires collection of these key performance indi-cators. Suppliers are expected to use these measures to track their perfor-mance and drive improvements in the value stream.
5. Use in-station quality in-spection
The concept of not accepting, making, or passing on a defect is introducedto the line. Operators are asked to self-inspect their own output rather thandepend on end-of-line inspection.
6. Utilize standard work inthe core value stream.
Standardized work involves specifying standards for the rate of production(takt time), required inventory, and sequence of operator actions. These arewritten on worksheets located at each work station.
7. Show evidence of 5S andvisual management.
5S (Sorting, Setting, Shining, Standardizing, and Sustaining) ensures oper-ational stability by eliminating waste from the work environment. Sortingremoves non-essential tools and materials from the workspace. Setting ar-ranges the workers, parts, and materials to minimize waste as value-addedtasks are performed. Shining maintains the cleanliness of the workstationand its usability to subsequent operators. The final two Ss refer to the in-stitutionalization of these practices. Visual management techniques includesigns, shadow boards, tape to mark walkways and production areas, andcolors to indicate performance.
8. Manage the core valuestream as a single entityrather than individual pro-cesses.
Prior to lean adoption, each production process was managed by separatesupervisors. Once ironing and packing are connected to the end of sewinglines, a single supervisor would be responsible for all processes in that lineand the final output.
Notes. Nike personnel certified lean production lines in apparel factories by evaluating the adoption of theseeight practices.
11

station quality inspection and to communicate problems to supervisors and coworkers. They
were also trained to halt production upon discovering major quality problems. Workers
also became responsible for cleaning and arranging their workstations according to the 5S
demands. These were significant new responsibilities in comparison to the routinized tasks
of traditional mass production.
Increased levels of worker involvement may lead to improved workplace standards
through two channels. First, motivating discretionary effort is key to unlocking the per-
formance benefits of high-involvement work systems (Bailey 1993; MacDuffie 1995; Becker
and Huselid 1998; Appelbaum 2000). Whereas individual efficiency under traditional mass
production can be incentivized through piece-rate compensation, in high-involvement work
systems, ”[w]orkers will only contribute their discretionary effort to problem-solving if they
believe that their individual interests are aligned with those of the company, and that the
company will make a reciprocal investment in their well-being” (MacDuffie 1995, 201). This
may involve raising incentives to reward performance either individually or collectively (e.g.
based on the quality or on-time delivery performance of the entire line). Alternatively, man-
agers may pay an efficiency wage premium to motivate difficult-to-observe dimensions of
employee effort (Appelbaum 2000; Bailey, Berg and Sandy 2001). Second, high-involvement
work requires increased firm investments in employee human capital. High-involvement work
systems require production workers to acquire skills that were not required in traditional mass
production, including both technical and interpersonal skills (Cappelli and Rogovsky 1994).
Firm-led employee training programs are therefore a key element of high-involvement work
systems (MacDuffie 1995; Ichniowski, Shaw and Prennushi 1997; Becker and Huselid 1998).
Increased need for training in high-involvement work systems increases the costs of worker
turnover; the more employers invest in workers, the more costly it is when workers leave the
firm (Cappelli and Rogovsky 1994; MacDuffie 1995). Thus, managers may improve terms of
employment in order to improve employee retention, a major challenge in many emerging
market manufacturers.
The key empirical prediction of the labor relations mechanism—whether it passes
through the need to motivate discretionary effort or to retain skilled employees—is an in-
crease in wages and non-wage benefits. In addition, other working conditions that influence
worker motivation and satisfaction may improve as well, such as total work hours, noise
and temperature on the shop-floor, and sanitation in worker dormitories. Consistent with
these predictions, several studies of U.S. firms show that high-involvement work systems are
associated with increased employee compensation (Appelbaum 2000; Bailey, Berg and Sandy
12

2001; Cappelli and Neumark 2001; Osterman 2006). The labor relations mechanism holds
that lean will raise labor standards for similar reasons.
An alternative mechanism is that management systems associated with lean manufac-
turing reduce the marginal cost of complying with certain labor, health and environmental
standards (King and Lenox 2001), even if labor relations remain largely unchanged. In
addition to changes of workers’ role in production, lean emphasizes development of process
improvement capabilities (Womack, Jones and Roos 1991). These modern management tech-
niques are not widely diffused in emerging markets (Bloom and Van Reenen 2007). If non-
compliance with certain workplace standards is the result of flawed management processes,
lean may provide the tools to correct those processes to ensure compliance. Examples include
the absence of processes to appropriately label and store hazardous chemicals or ineffective
inventory management that leads to obstruction of emergency exits. Improved production
planning and reduced cycle time (Dunlop and Weil 1996; Appelbaum 2000) may also re-
duce pressure on worker overtime to meet delivery deadlines (Locke, Amengual and Mangla
2009). By introducing improved systems of process improvement, industrial hygiene, and
production planning, lean may reduce the costs of remediating these violations of workplace
standards. Consistent with this account, previous research on U.S. firms finds that adoption
of lean manufacturing is associated with improved environmental performance (King and
Lenox 2001).
The labor relations and management systems hypotheses are not mutually exclusive;
both may be at work. However, they offer divergent predictions about lean’s effects on
factory social performance. If increased worker involvement necessitates efficiency wages or
raises the costs of turnover, we expect improvement in social performance standards that
directly influence employee motivation and wellbeing, such as wages and non-wage benefits.
In theory, workers might be sensitive to workplace health and safety standards as well.
However, we assume that wages and benefits are generally more influential in determining
worker motivation and job satisfaction. Survey evidence from migrant workers in China
finds that they are more than twice as likely to report “low pay” (80%) as “poor working
conditions” (35%) when reporting why they intend to leave a job (Smyth, Zhai and Li
2009). On the other hand, if lean’s effects on social performance are primarily due to new
management systems, we expect to see the largest effects in technical standards, such as
industrial hygiene, hazardous substances, and emergency egress.8 After estimating the effect
8Both mechanisms predict improvement in overtime compliance. Reduction of excessive overtime maybe the result of efforts to please employees by reducing the intensity of work or reduced cycle times andimproved production planning.
13

of lean on labor standards, we shed light on these mechanisms by examining the detailed
workplace practices associated with Nike’s compliance grades.
To our knowledge, this is the first study to estimate the effects of lean on workplace
standards across a large sample of emerging market manufacturers. Innovative case study
research offered initial support for lean’s effect on labor standards in emerging markets (Locke
et al. 2007), but a small sample size raised the possibility these effects were idiosyncratic to
particular factories or local labor markets. Moreover, other research suggests that the move
toward lean production in global supply chains has harmed labor standards in emerging
markets. In 2003-2004, Oxfam International led a research project on the supply chain
practices of 20 companies spanning 15 countries. On the basis of interviews with factory
and farm workers, managers, government officials, union and NGO representatives, trading
agents, importers, and staff from major brands and retailers, it concluded that: “...current
sourcing strategies designed to meet ‘just-in-time’ delivery (premised on flexibility and fast
turnaround), combined with the lowering of unit costs, are significantly contributing to the
use of exploitative employment practices by suppliers” (Dhanarajan 2005, p. 531). According
to this study, lean production is mimicked rather than genuinely practiced when suppliers
do not possess the capabilities to cope with demands by global buyers for shorter production
lead times, a greater diversity of products and styles, and lower unit prices. They conclude
that, “As a result, it is most definitely the workers at the labor-intensive stage of production
who are getting leaned on” (Raworth and Kidder 2009, 170). A study by the Clean Clothes
Campaign of 30 garment factories in Sri Lanka, Bangladesh, India, and Thailand found that
demands by large retailers like Wal-Mart, Carrefour, and Tesco for quick turnaround and
lower unit costs were undermining the ability of suppliers to comply with codes of conduct
(Clean Clothes Campaign 2008). Finally, field research in a footwear factory in China found
that lean manufacturing increased health and safety risks for workers (Brown and O’Rourke
2007). In light of these conflicting claims, it remains unclear whether lean manufacturing is
part of the problem or part of the solution.
4 Data and Empirical Strategy
Measuring workplace compliance with social standards is challenging even in advanced
economies (Weil 2008). Upstream suppliers in today’s global supply chains are predomi-
nantly located in emerging economies, where workplace inspectorates may be understaffed,
lack critical technology for managing data, or both (International Labour Organization 2011).
14

We address these challenges by measuring factory social performance with audits that assess
compliance with Nike’s supplier code of conduct. These audits use common inspection pro-
cedures and standards across factories in a range of developing countries. This permits for
repeated observations of compliance with social standards in several hundred factories that
would otherwise be difficult for researchers to access.9
Nike evaluates factory compliance with standards in labor, health, and environmental
performance using periodic factory audits. Supplier factories are audited for social compli-
ance every 12 to 18 months, according to a schedule that takes into account their previous
compliance ratings and levels of factory risk. Adoption of lean manufacturing does not factor
into this priority calculation, and there is no scheduling coordination between the operational
teams responsible for lean manufacturing and compliance auditing.
One-third to one-half of these audits are conducted by Nike compliance personnel, a
team of roughly 70 employees. Nike’s in-house auditors have technical expertise in human re-
source management, engineering, and health and safety. The remaining audits are performed
by third-party auditors. Third party audit vendors are trained by Nike and subjected to
annual reviews to ensure their auditing procedures and grades align with Nike’s in-house
team.10 Factories that fail to reach a minimum B grade within a defined timeframe have
been required to pay for their own third-party audits since June 2012. The purpose of the
dual-system is to allow higher-performing factories access to the Nike compliance personnel
who can facilitate improvements beyond the minimum compliance standard. A factory’s
progress in lean is not used when making decisions about audit scheduling or the use of
third-party versus internal auditors.
Nike divides its factory compliance program into two topic areas monitored through
two different factory audits: health, safety, and environment (HSE) and labor.11 In both,
9Nike Inc. provided audit results for its apparel suppliers from FY2009 through the first half of FY2014,as well as internal documents describing its lean program. Nike also made key managers involved in its leanprogram available for multiple interviews with researchers. We agreed to withhold the names of individualsuppliers as proprietary information in publications but were not otherwise constrained in our presentationof research outcomes.
10We tested for systematic differences in the labor audits conducted by Nike and third-party auditors.Comparing mean audit scores for a subsample of labor audits in the eleven countries studied, we find nosignificant difference in compliance grades. Using the four-point grading scale described below, the averagegrade assigned by third-party auditors was 2.35, and that assigned by Nike’s in-house auditors was 2.42,which yields a t-test p-value of 0.74. A chi-squared test of independence fails to detect differences in thecompliance grade distributions across auditor types (p-value of 0.79).
11Full documentation of these standards is available online in, “Nike Inc. Code Leader-ship Standards.” URL: http://www.nikeresponsibility.com/report/uploads/files/NIKE_INC_Code_Leadership_Standards.pdf Accessed September 10, 2014.
15

findings are based on auditor inspection of conditions in factory buildings, interviews with
workers and managers, and review of legal documents, timesheets, and wage records. These
audits summarize factory compliance using a four-point scale: A (4) to D (1). A description
of the scoring rubrics is reprinted in the appendix (Table A4). In labor compliance, factories
that score A or B demonstrate no serious violations of the standards. The key difference
is that A factories have fewer than five uncorrected minor issues, and B factories have
more than five minor issues to address. In labor compliance, factories rated C exhibit at
least one “serious” violation of the code. These include failure to provide basic terms of
employment, more than 10% of employees working between 60 and 72 hours each week,
and isolated instances of underage labor, verbal harassment, or failure to provide minimum
legal wage or benefits. Factories rated D exhibit “critical” violations of the labor code,
including denial of auditor access and provision of false information, unapproved outsourcing
to other factories, use of forced labor, systemic use of underage labor, pregnancy testing as
a condition of employment, failure to accurately record work hours, and more than 10% of
employees exceeding daily work hour limits. The grading rubric for HSE compliance follows
a similar pattern, with factories rated A or B being largely compliant and demonstrating
progress, and factories rated C or D exhibiting serious system failures and failing to show
improvement. In this study, noncompliant grades refer to audits resulting in Cs or Ds. We
analyze the relationship between these compliance grades and individual workplace practices
after presenting our main results.12
We built a panel of factory labor and HSE compliance ratings over time (Table 2).
These data consist of factory audit results from FY2009 to the first half of FY2014. (The
Nike fiscal year starts in June and ends in May.) As the lean-adopting factories are all apparel
manufacturers, our sample includes only apparel factories in the same 11 countries as the lean
adopters. When factories are not audited in a given half-year period, we impute factories’
compliance scores using the results of their most recent audit. We consider the imputation
of missing values preferable to assuming that data is missing at random. Although we
can test whether missingness is correlated with our indicator for lean adoption, we cannot
verify the assumption that missingness is uncorrelated with potential social performance
outcomes. We also have reason to believe that labor, health, and environmental conditions
12It is important to note that the specific content of these social compliance standards varies according tolocal law. For example, the minimum wage in China is different from the minimum wage in Vietnam. Ourempirical approach accounts for this in part by focusing on within-factory differences in compliance overtime. However, a necessary assumption is that these within-factory changes in grades are equivalent acrossfactories.
16

in factories exhibit considerable inertia. These workplace practices are tied to management
routines, the local labor market, and the priorities of factory leadership. Empirical evidence
suggests that factories’ most recent compliance scores are informative of their state between
audits. Analyzing consecutive audits within factories, we find that factories retain identical
compliance scores in 73% of consecutive labor audits and 84% of consecutive HSE audits.
Only in 8% of labor audits and 1% of HSE audits do factories change by more than one
grade. We therefore believe that imputing missing values is the empirical approach least
likely to introduce bias, as it retains information from the entire sample of factories in each
time period. However, we also repeat our main analysis with no imputation of missing data
with no change in findings. The larger number of imputed values for labor compliance results
from the larger number of labor scores available early in the panel. Roughly half the factories
are located in China, and one-third are in Southeast Asia. Noncompliant factories (rated C
or D) comprise over one-third of our labor panel and one-half of our HSE panel.
As of FY14, factories that adopted lean production exhibited better labor and HSE
compliance than non-adopters. Lean-adopters had a mean labor grade of 3.14, compared
to 2.63 among non-adopters (pval <.01). For HSE, they averaged 2.79 compared to 2.36
among non-adopters (pval <.01).13 These differences lend initial support to the idea that
lean production is associated with better social compliance. However, this cross-sectional
comparison cannot rule out the possibility that lean-adopters possess unobserved character-
istics that explain their higher levels of social performance.
We use the panel data structure and the gradual introduction of lean manufacturing
across the supply base to address concerns about unobserved confounders. Table 3 describes
the progress of lean adoption in the factory panels. While no factory had adopted lean at
the beginning of the sample period in FY09, about 20% of factories had implemented lean at
the end of our sample period in FY14. This progressive proliferation of lean manufacturing
allows us to control for both time-invariant factors associated with each factory and time-
varying compliance shocks to the entire pool of factories. We estimate lean’s effect on social
compliance using a standard two-way fixed effects regression model given by
(1) Yit = ηi + δt + α Leanit + εit.
13Nike compliance grades run on a four-point scale from D (1) to A (4). We examine compliance scoresfor apparel factories in Asia, Europe, the Middle East, and Africa as of FY14 Q1. For labor compliance,we report audit data for 64 lean-adopters and 236 non-adopters. In HSE compliance, we report 68 adoptersand 264 non-adopters. P-values reported from two-sided t-tests assuming unequal variances.
17

Table 2: Factory compliance panel summary
Labor HSEImputed values? No Yes No YesCountries 11 11 11 11Factories 300 300 332 332Observations 862 2704 959 2504Compliance scores (%)
A (4) 19.3 16.7 0.1 0.2B (3) 39.9 45.0 42.6 44.4C (2) 26.0 24.3 53.6 51.9D (1) 14.8 14.0 3.6 3.5
Observations by country (%)Bangladesh 3.5 2.8 2.8 2.5Cambodia 0.2 0.4 1.7 1.6China 47.4 43.3 43.1 42.9Egypt 0.6 0.7 0.8 0.9India 7.0 6.6 5.3 5.3Indonesia 7.5 8.7 8.2 8.1Malaysia 7.9 8.7 8.1 7.8Sri Lanka 6.5 7.5 5.0 5.3Thailand 12.2 11.9 11.6 10.9Turkey 2.6 3.4 3.0 3.9Vietnam 4.6 5.8 10.3 10.9
Notes. Summary statistics for the factory compliance panels in labor and health, safety and environment(HSE), showing pre- and post-imputation of missing values. Missing values imputed using startpoint impu-tation, carrying over each factory’s most recent compliance score from preceding periods. Our panels includeonly factories with at least two audits over the time period. Because Nike uses separate audits for labor andHSE, the samples are not identical.
18

In this equation, Yit is the compliance score on a four-point scale from A (4) to D
(1), ηi is a factory fixed-effect that controls for time-invariant unobserved confounders, δt
is a half-year fixed effect to control for common shocks across the pool of factories, Leanit
is our measure of lean adoption, and εit is an error term with E[ε|η, δ,Lean] = 0. The
parameter of interest is α, the effect of adopting lean production techniques on compliance
scores. Under the assumption of parallel counterfactual trends in the treatment and control
groups, the average treatment effect on the treated is identified by within-factory change in
compliance scores among factories that adopt lean production. This strategy improves upon
cross-sectional comparisons by eliminating concerns about time invariant and slow-changing
differences between lean adopters and non-adopters, such as factory location, product fo-
cus, business culture, size, ownership, and pre-lean levels of managerial competence. Even
though the four point compliance score is an ordinal variable, we estimate these models using
ordinary least squares (OLS) rather than ordered probit or logit. The maximum likelihood
estimator is inconsistent in the presence of fixed effects (Greene 2004), and OLS provides
the best linear approximation to the conditional expectation function (Angrist and Pischke
2008). Below we also conduct robustness checks that use dichotomized versions of the com-
pliance grades. All estimations cluster standard errors at the factory level to account for
potential serial correlation and heteroscedasticity.
Table 3: Lean adoption in the compliance panel
Labor sample HSE sampleYear Factories % Factories %FY09 0 0% 0 0%FY10 12 4% 12 4%FY11 27 9% 27 8%FY12 53 18% 56 17%FY13 60 20% 64 19%FY14 64 21% 68 20%
Notes. Displays the count of lean-adopting factories in the panels and their share of all factories at the startof each fiscal year.
For robustness we use two measures of lean adoption at the factory level. The first—
lean adoption—is a binary indicator of whether a factory has any certified lean production
lines at the start of a given time period. The certification of production lines represents the
major qualitative shift toward new management systems; it is the result of months of manager
19

training, numerous changes to production processes, and re-training of involved workers. Our
second measure captures the intensity of the lean treatment by measuring the share of total
production lines certified to Nike’s minimum lean standard; it varies continuously from 0 to
1. Because we use lean certification by Nike staff to measure the intervention, our treatment
variables are likely somewhat lagged. By the time that production lines are certified by Nike
personnel, supplier factories have already undergone an extended process of training and
production line modifications. Nonetheless, lean certification provides a useful metric as it
is measured against a uniform standard by Nike lean staff. The treatment is also slightly
lagged by our coding of lean adoption according to the state of the factory on the first day
of a time period, which ensures that lean adoption in our data pre-dates the factory audit.
Neither our lean measures nor our social compliance scores rely upon factory self-reporting,
which may be subject to biases motivated by self-interest.
4.1 Selection bias
As the lean intervention was not randomly assigned to factories, we must consider whether
the selection process that led to lean adoption biases our estimates of α. The key concern
with selection bias in difference-in-difference models is within-unit variation in unobserved
characteristics that correlates with within-unit variation in the treatment. For selection into
the lean program to bias our results—either through Nike’s decision about whom to invite
or suppliers’ decisions whether to participate—factory adoption of lean must correlate with
changes in unobserved characteristics that also affect social performance.
As described in Section 3, factories were invited by Nike to receive training that
ultimately led to adoption of lean manufacturing techniques. Their criteria for selecting
invitees included the length of Nike’s business relationship with the supplier, factory size,
and the perceived commitment of supplier leadership to engage with Nike’s lean program.
These qualities might be expected to produce higher levels social performance among the
invitees, which limits the credibility of cross-sectional comparisons between lean-adopters
and non-adopters for estimating the effect of lean. Our model is identified by within-factory
variation in lean adoption over time rather than cross sectional differences between plants.
We investigated the possibility that Nike’s invitation to join the lean program was correlated
with other within-factory changes that might directly affect factory social performance and
confound our estimates. Specifically, we researched possible changes in auditing frequency
(were lean-adopters audited more often?), auditing criteria (did the presence of lean lines
influence auditors’ evaluations?), and access to training (did lean-adopters receive additional
20

training on social compliance?). According to a review of internal documents and interviews
with Nike management, lean adoption did not produce changes in these aspects of their
relationship to suppliers. A second possible concern is whether factories’ decisions to accept
Nike’s training invitation correlated with their ability to demonstrate improvement in social
performance, but no suppliers declined the invitation to receive lean training.
We empirically explore threats to inference in three ways. We test whether changes
in auditing frequency confound estimates of lean’s effect. We also examine whether un-
observed labor market trends across countries may have influenced Nike’s decisions about
which factories to invite, thereby introducing bias. Finally, we examine the assumption of
parallel trends among lean-adopters and non-adopters in the pretreatment period. Consis-
tent with the parallel trends assumption, we find no evidence of divergent trends until after
lean adoption.
5 Results
Table 4 presents the main results of our estimation using two measures of lean adoption. Odd
numbered models use the binary indicator of lean adoption, and even numbered models use
the continuous measure: the percentage of lean-certified production lines in a plant. In both
specifications, lean manufacturing has a positive effect on labor compliance. The adoption of
any lean lines results in an improvement of 0.29 letter-grades, 11% of the dependent variable
mean (Model 1). Going from zero lean lines to a 100% lean factory is associated with an
improvement of over half a letter grade (Model 2). We estimate a small positive effect of
lean adoption on HSE compliance on the four-point scale, but the coefficients are imprecisely
estimated.14 We also test whether these results are driven by our approach to missing data
by comparing estimates from both imputed (balanced) and non-imputed (imbalanced) panel
data. Lean’s estimated effect on labor compliance is larger in the imbalanced panels (Models
3 and 4), but statistical comparisons fail to detect significant differences in effects across
alternative approaches to missing data.
One potential concern with the preceding analysis is the validity of the parallel trends
assumption, which implies that average outcomes for lean adopters and non-adopters would
follow parallel trends in the absence of the intervention. To inspect differences in treatment
14We would have come to apparently erroneous conclusions about lean’s effects on HSE compliance if wehad relied on estimates using cross-sectional variation. Examining compliance outcomes in our sample in FY2014, two-sided t-tests allowing for unequal variances estimate significant effects of lean adoption on bothlabor compliance (+ 0.51 grades, σ = .13) and HSE compliance ( + 0.44 grades, σ = .06).
21

Table 4: Effects of lean manufacturing on compliance scores
Dependent variable Labor compliance HSE complianceImputed values Yes No Yes NoMean score (no lean) 2.58 2.56 2.35 2.33Model (1) (2) (3) (4) (5) (6) (7) (8)
Lean adoption .29** .42** .08 .05(.11) (.14) (.07) (.09)
% lean lines .57** .77** .08 .03(.16) (.21) (.11) (.15)
Factory FEs X X X X X X X XHalf Year FEs X X X X X X X XEffect magnitudes (% of dep. variable mean)Point estimate 11% 22% 16% 30% 4% 3% 2% 1%95% CI upper 20% 34% 27% 46% 9% 12% 10% 13%95% CI lower 3% 10% 6% 14% -2% -6% -5% -11%Factories 300 300 300 300 332 332 332 332Total obs 2,704 2,704 862 862 2,504 2,504 959 959
Notes. OLS panel fixed effects regression from FY2009 H1 to FY2014 H1. Models fit using both startpointimputation of missing data and no imputation of missing data. Regression coefficients shown with robuststandard errors clustered by factory in parentheses. The outcomes are factory compliance grades on a four-point scale (A=4, B=3, C=2, D=1) for labor and health, safety, and environment (HSE). The two codingsof the independent variable are any lean adoption (1 if the factory has adopted any lean lines, 0 otherwise)and percentage of lean lines (count of lean lines / total lines in factory). Effect magnitudes expressed inpercents of mean compliance scores for all non-lean factory-half observations. ** p<0.01, * p<0.05.
22

and control groups before and after the intervention, we estimate a panel model using leads
and lags of the treatment, similar to that in Autor (2003). We recode our treatment indicator
as the “switch” from the last time period of no lean lines to the first time period with any lean
lines. We then add binary leads and lags of this indicator to the model. The coefficients on
these indicators estimate the differences between lean-adopters and non-adopters at periods
just before and after the adoption of lean in the treatment group.
(2) Yit = ηi + δt +4∑
a=−4
βaleanswitchi(t−a) + εit
Our fixed-effects remain the same as the ordinary panel model. The explanatory
variable leanswitchit is a binary indicator that takes the value 1 only if factory i certifies its
first lean production line in period t. The four leads and lags of this indicator take the value
1 only when factory i certifies its first lean line in the time period (t− a). For non-adopters,
these indicators always take the value 0. The result is a model with nine explanatory variables
corresponding to the switching period and four leads and lags of that switch. By estimating
coefficients for these leads and lags (βa), this specification allows us to inspect differences
between lean-adopting plants and non-adopters before and after they certify their first lean
lines. If unmodeled differences in compliance trends between the treatment and control
groups are driving our results, we may observe differences in labor compliance between
adopters and non-adopters prior to the introduction of lean manufacturing. Apart from
providing this check of the parallel trends assumption, this model also allows us to examine
how the effect of lean emerges over time.
Figure 1 plots the estimated coefficients for these indicators, including 95% confidence
intervals, highlighting the periods before and after lean adoption. We detect no significant
placebo effects in the two years prior to lean adoption, which suggests that unmodeled differ-
ences between adopters and non-adopters did not significantly affect labor compliance and
therefore the parallel trends assumption seems plausible. We would not expect to see par-
allel pre-treatment trends if lean adopters were cherry-picked based on recent improvements
in social performance. The figure also illustrates over time variation in the effect of the
intervention. The improvement in labor compliance grows consistently in the years following
lean adoption, reaching a statistically significant level 18 months after adoption. Two years
after certifying their first lean line, lean plants on average score 0.63 letter grades higher
on their labor audits than non-adopters. In periods prior to lean certification, we observe
23

statistically insignificant positive differences between adopters and non-adopters. These may
be the result of the lagged nature of our treatment indicator. Our coding shows when Nike
formally certified lean production lines, but not when factories initially adopted lean pro-
duction practices. In some cases, factories adopted their first pilot lines two years prior to
their first lean certification.
Figure 1: Leads and lags of lean adoption
Years before/after lean adoption
Diff
eren
ce in
labo
r co
mpl
ianc
e gr
ades
2 yearsbefore
1 yearbefore
Year of adoption
1 yearafter
2 yearsafter
0.0
0.4
0.8
● ●●
●
●
●
●
●
●
Pre−lean adoption Post−lean adoption
Notes. Results of estimating Equation 2. Estimated effects of lean manufacturing on labor compliance inperiods prior to (white area) and after (gray) factory adoption of lean manufacturing. Coefficients displayedwith 95% confidence intervals from panel regression using four leads and four lags of a lean adoption indicator(robust standard errors clustered by factory). The period of adoption represents the first period in whichthe factory had any lean production lines on the first day of that period. The plot shows no significantdifferences in labor compliance between lean-adopters and non-adopters prior to lean adoption, but adoptersimprove after switching to lean, with the difference reaching statistical significance 1.5 years after adoption.Results based on 300 factories and 2,704 factory-half observations; full regression results reported in TableA2.
A second concern with the previous tests is that we treat the four-point letter grades
as continuous variables, implicitly assuming that adjacent grades are equidistant from one
another. In Table 5 we relax this assumption and replicate the analysis with binary trans-
formations of the compliance scores. The first transformation codes A or B as 1, and C or
24

D as 0. Recall that Cs and Ds respectively indicate “serious” and “critical” violations of
labor standards, as detailed in Appendix Table A4. The second transformation codes only
A as 1, and all other scores as 0. We again use OLS rather than logit/probit due to the
inconsistency of the maximum likelihood estimator in fixed effects estimation (Greene 2004).
Again, we find a significant positive effect of lean adoption on labor compliance, present
in both transformations of the dependent variable. These specifications also highlight that
the weak effect on HSE compliance is primarily in moving factories up to a B score. The
effects reported in the first two columns of Table 5 are particularly important. As we explain
below, the gap between compliant (A and B) and noncompliant (C and D) grades is largely
a function of accurate payment of worker wages and benefits (see Figure 2). We estimate in
column (1) that lean adoption reduces the probability of receiving a noncompliant grade by
15 percentage points.
Table 5: Binary transformations of dependent variables
DV Labor compliance HSE complianceCutpoint AB|CD A|BCD AB|CD A|BCDDV mean (No lean) .59 .14 .39 .003Model (1) (2) (3) (4) (5) (6) (7) (8)Lean adoption .15* .08 .10 .00
(.07) (.05) (.06) (.00)% lean lines .28** .24** .12 .01
(.11) (.08) (.10) (.01)Factory FEs X X X X X X X XHalf FEs X X X X X X X XFactories 300 300 300 300 332 332 332 332Total obs. 2,704 2,704 2,704 2,704 2,504 2,504 2,504 2,504
Notes. OLS panel fixed effects regression from FY2009 H1 to FY2014 H1 (11 periods). Regression coef-ficients shown with robust standard errors clustered by factory in parentheses. The outcomes are binarytransformations of factory compliance scores for labor and health, safety, and environment (HSE). The firsttransformation codes factories receiving A or B grades as 1, and 0 otherwise. The second transformationcodes factories receiving only an A grade as 1, and 0 otherwise. The two codings of the independent variableare lean adoption (1 if the factory has adopted any lean lines, 0 otherwise) and percentage of lean lines(count of lean lines / total lines in factory). ** p<0.01, * p<0.05.
Finally, we examine the possibility that improvements might be explained by in-
creased auditing of the lean plants. Because audits identify noncompliant practices that
factories are instructed to improve, they might stimulate improvements in working condi-
tions. If lean-adopters received more frequent compliance audits, their labor standards could
25

improve due to the effect of auditing. We re-estimate our models with indicators of the cu-
mulative number of audits each factory has received and find no significant difference in the
estimated effect of lean-adoption (Appendix Table A1). This is consistent with previous
research showing limited improvements in labor standards from repeated factory inspections
(Locke 2013).
5.1 Mechanisms
Above we identified two mechanisms that may drive these results. The labor relations hy-
pothesis held that increased demands on worker skill and discretionary effort incentivized
managers to improve the terms of employment. In contrast, the management systems hy-
pothesis focused on how lean changes the marginal costs of compliance from managers’ per-
spective. By developing capabilities surrounding process improvement, industrial hygiene,
and production planning, lean may reduce the costs of complying with technical workplace
standards. The labor relations hypothesis predicts improvement in terms of employment
that directly bear on workers’ motivation and job satisfaction, such as wages and benefits.
The management systems hypothesis predicts improvement in technical areas of compliance,
such as hazardous materials and emergency egress.
Lean’s effect is predominantly on labor standards rather than health, safety, and the
environment. The difference between effects for labor and HSE is statistically significant for
three of the four models presented in Table 4. Because Nike’s labor audit includes measures
of wages and benefits, this offers preliminary support for the labor relations hypothesis. How-
ever, this depends on whether labor compliance grades are actually informative of terms of
employment that are important to worker motivation and satisfaction. To shed light on this
question, we analyze the relationship between labor compliance grades and detailed work-
place practices. We merged compliance grades with records of detailed workplace practices
for a subset of audits. This allows us to analyze the relationship between compliance grades
and workplace practices for 442 audits.15 We estimate the importance of 27 audit line items
for predicting overall labor compliance scores using the random forest algorithm (Breiman
2001). Random forests are among the most popular techniques to emerge from the machine
learning literature, in part because they offer extreme flexibility (Varian 2014). They do not
require parametric assumptions on the functional form relating predictors to outcomes and
can accommodate a range of nonlinearities and interactions that are difficult for researchers
15Ideally we would estimate the effects of lean on each workplace practice, but our data includes just 16pre-lean and 34 post-lean observations of the treatment group.
26

to specify when faced with a large number of predictors. In evaluating the relative con-
tribution of over two dozen practices to the overall grade, we faced exactly this modeling
challenge. We separately conducted analyses of the four-point compliance grade (A-D) and
a dichotomized version: compliant grades (As and Bs) versus non-compliant grades (Cs and
Ds). A similar analysis of HSE compliance grades appears in Appendix Figure A1.
Consistent with the labor relations hypothesis, these results show that variation in
labor compliance scores reflects important differences in employee compensation. Figure 2
plots variable importance scores for these workplace outcomes, which are grouped by cate-
gory.16 The most important workplace practices for predicting labor compliance grades are
related to employee compensation and hours, especially accurate payment of wages, one day
off per seven days of work, provision of legally mandated benefits, time-keeping for work
hours, and keeping work hours under the maximum limit. In contrast, HSE grades, where
we find no significant improvement, are primarily determined by technical and procedural
standards that do not play a major role in worker motivation and retention. The top predic-
tors are risks from confined spaces and the management of hazardous substances (Appendix
Figure A1). While these are important working conditions, workers cite them significantly
less often than wages as a reason for leaving the enterprise (Smyth, Zhai and Li 2009).
5.2 Heterogeneous Effects by Country
Finally, we examine the effects of lean in different countries. We interact the lean measures
in our panel model with country indicators to estimate country-specific treatment effects.
The seven countries that occupy at least 5% of the sample each have their own indicators,
and the remaining countries are pooled into a residual indicator comprising Bangladesh,
Cambodia, Indonesia, Egypt, and Turkey.
We find significant heterogeneity in the treatment effect across countries (Figure 3).
In India, Malaysia, and Thailand, any lean adoption is associated with over half a letter-
grade improvement in labor compliance. The effect in Vietnam is smaller but statistically
significant. However, in China, Sri Lanka, and our pool of residual countries, lean-adopters
do not improve significantly. F-tests reject the hypotheses that the effect in China is identical
to those of India (pval < .01), Thailand (pval < .01), and Malaysia (pval < .03). While lean
adoption appears to have a large effect on labor standards in several key apparel-exporting
16Variable importance scores summarize the predictive power of variables in classification trees, which donot yield coefficients in the same way as traditional regression models. Importance scores measure the totaldecrease in node impurities from splitting on a given variable, averaged over all trees. Node impurity ismeasured by the Gini index (Liaw and Wiener 2002).
27
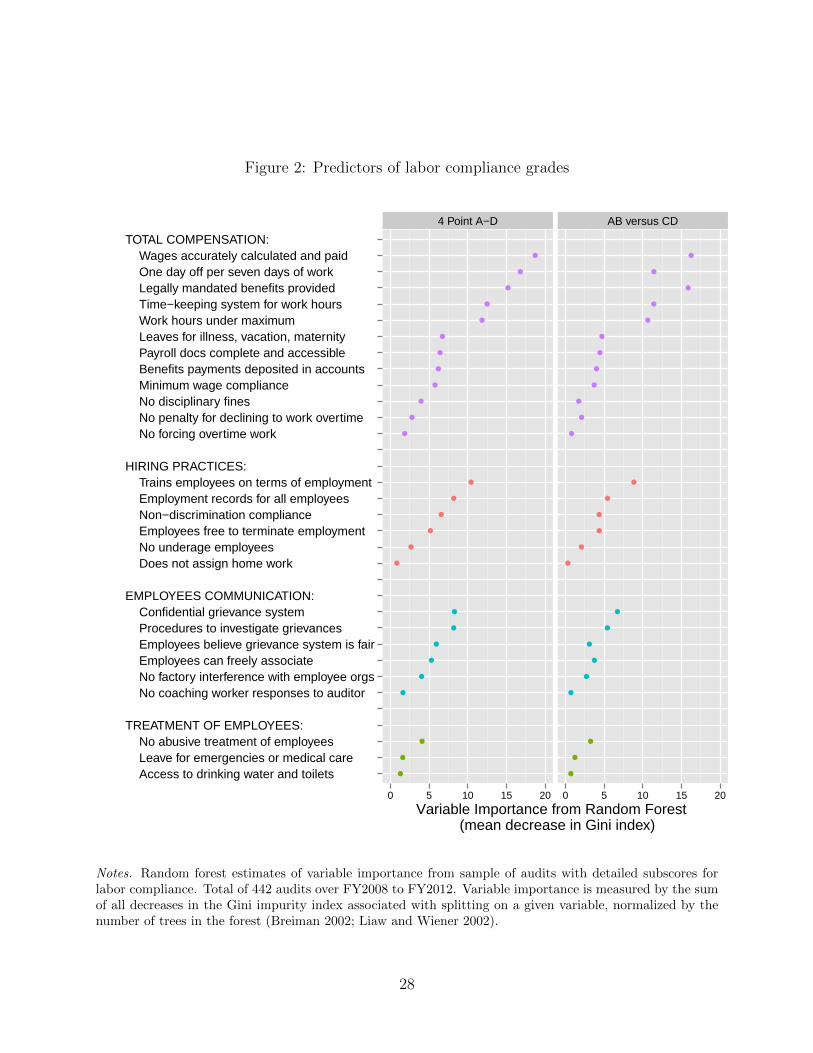
Figure 2: Predictors of labor compliance grades
4 Point A−D AB versus CD
●
●
●
●
●
●
●
●
●
●
●
●
●
●
●
●
●
●
●
●
●
●
●
●
●
●
●
●
●
●
●
●
●
●
●
●
●
●
●
●
●
●
●
●
●
●
●
●
●
●
●
●
●
●
●
●
●
●
●
●
●
●
●
●
●
●
●
●
Access to drinking water and toilets Leave for emergencies or medical care No abusive treatment of employeesTREATMENT OF EMPLOYEES:
No coaching worker responses to auditor No factory interference with employee orgs Employees can freely associate Employees believe grievance system is fair Procedures to investigate grievances Confidential grievance systemEMPLOYEES COMMUNICATION:
Does not assign home work No underage employees Employees free to terminate employment Non−discrimination compliance Employment records for all employees Trains employees on terms of employmentHIRING PRACTICES:
No forcing overtime work No penalty for declining to work overtime No disciplinary fines Minimum wage compliance Benefits payments deposited in accounts Payroll docs complete and accessible Leaves for illness, vacation, maternity Work hours under maximum Time−keeping system for work hours Legally mandated benefits provided One day off per seven days of work Wages accurately calculated and paidTOTAL COMPENSATION:
0 5 10 15 20 0 5 10 15 20
Variable Importance from Random Forest (mean decrease in Gini index)
Notes. Random forest estimates of variable importance from sample of audits with detailed subscores forlabor compliance. Total of 442 audits over FY2008 to FY2012. Variable importance is measured by the sumof all decreases in the Gini impurity index associated with splitting on a given variable, normalized by thenumber of trees in the forest (Breiman 2002; Liaw and Wiener 2002).
28

countries, we detect no effect on factories in China, where nearly half of our sample is located.
Figure 3: Country-specific treatment effects
−1.0 −0.5 0.0 0.5 1.0 1.5 2.0 2.5
Effect of lean on labor compliance
China
Sri Lanka
Other
Vietnam
Malaysia
Thailand
India ●
●
●
●
●
●
●● Lean adoption
% lean
Notes. Figure displays point estimates with 95% confidence intervals (using robust standard errors clusteredby factory) from fixed effects model interacting country indicators with treatment variables. The two codingsof the independent variable are lean adoption (1 if the factory has adopted any lean lines, 0 otherwise) andpercentage of lean lines (count of lean lines / total lines in factory). Countries pooled in the “other” indicatorare Bangladesh, Cambodia, Egypt, Indonesia, and Turkey. Results based on 300 factories and 2,704 factory-half observations. Regression results are available in the appendix, Table A3.
This country-level heterogeneity in effects raises the possibility that country-specific
labor market or regulatory trends may be confounding our estimates of the effects of lean.
Factories in countries experiencing wage increases or more stringent regulations may be
more motivated to embrace process changes to maintain competitiveness. At the same
time, those within-country labor market trends may exert their own effects on workplace
standards. To address this possibility, we estimate models that allow for country-specific
linear and quadratic time trends. These controls model the possibility that countries exhibit
divergent trends in workplace compliance unrelated to the presence of lean manufacturing.
The estimated effects of lean attenuate slightly but remain statistically indistinguishable
from the main estimations (Table A1).
29

6 Discussion
Our findings support the hypothesis that lean manufacturing and associated high-involvement
work practices can improve social performance in emerging market manufacturers. Based on
a five-year analysis of a capability-building intervention in the global apparel industry, we
estimate that adoption of any lean manufacturing is associated with an improvement of 0.29
labor compliance grades, or a 15 percentage point increase in the probability of compliance
(A or B grades). While this finding by no means obviates concerns about working condi-
tions in emerging markets, it does provide the first quantitative evidence on the efficacy of
capability-building in improving labor standards in global supply chains.
These results are consistent with the hypothesis that lean changes labor relations in
ways that stimulate improved workplace standards. Because lean requires increased invest-
ments in worker training and higher levels of discretionary effort, managers have an incentive
to improve labor conditions in order to retain and motivate skilled employees. We find that
the top predictor of labor compliance grades is wage compliance, an improvement that is
difficult to explain by improved techniques of process improvement, production planning,
or industrial hygiene. At the same time, these two mechanisms are not mutually exclusive,
and we cannot exclude the hypothesis that management systems also play a role. It is also
important to consider that compliance with some health, safety, and environment standards
may require structural changes to the plant, such as constructing new fire exits, changing
wiring, or investing in pollution mitigation equipment. Such changes may be more costly
and slow-changing than adopting new practices in worker hiring, compensation, and hours.
Future quantitative and qualitative research may clarify the relative contributions of
the labor relations and management systems mechanisms. One empirical approach would
involve estimating lean’s effect on more narrowly defined workplace outcomes whose im-
provements are attributable to one mechanism but not the other. Taking Nike’s compliance
subscores as an example, improvements in wages, verbal abuse by supervisors, disciplinary
fines, and worker grievance systems seem unlikely to be explained entirely by improved man-
agement sytems. On the other hand, standards dealing with wastewater management and
fire safety precautions appear unlikely to play a major role in worker motivation and re-
tention. Studying the effects of lean on these fine-grained workplace outcomes, including
worker turnover rates, could shed light on causal mechanisms. Qualitative research on man-
ufacturers negotiating changes in production systems would also be highly informative. Key
intermediate outcomes—such as new kinds of worker training and new channels of commu-
nication between workers and management under the labor relations hypothesis—may be
30

obvious from focused examination of individual workplaces but challenging to quantify for a
large sample of factories in the absence of panel surveys of employees and managers.
The effect of lean on labor standards was strongest in India, Malaysia, Thailand and
Vietnam. However, we detect no effect of the lean intervention in Sri Lanka, China, and
the pool of remaining countries. It is perhaps unsurprising to find little improvement in
Sri Lanka, a country known for high levels of factory social compliance (Ruwanpura and
Wrigley 2011). Among factories in Sri Lanka, 85% of non-lean observations exhibited a
labor compliance rating of B or higher, with 31% receiving A ratings. The same cannot be
said for China, where just 57% of non-lean observations received a B or higher and only 8%
received an A grade. China’s labor compliance grades are comparable to factories in India
(48% B or higher, 10% As), where factories exhibited significant improvement.
One clue to the absence of an effect in China is the lower intensity of lean adoption.
By the start of FY14, all twelve Thai lean-adopters, nine of ten in Malaysia, and all three
in India had certified more than 33% of their production lines to meet Nike’s minimum
definition. In contrast, six of the sixteen lean-adopters in China had less than 33% lean
lines. If the effects of lean are associated with a certain threshold level of adoption, then
perhaps factories in China have not yet reached that threshold.
A second possibility is that features of China’s industrial workplace create barriers
to the development of high-involvement work systems that devolve meaningful decisions to
workers. Previous research on lean and high-performance work systems emphasizes the im-
portance of complementary “bundles” of work and personnel practices in delivering benefits
for the firm (Milgrom and Roberts 1990; MacDuffie 1995; Dunlop and Weil 1996). If changes
in labor relations are the primary mechanism through which lean affects labor standards,
key elements of the bundle may include institutions that facilitate communication between
workers and management and foster the necessary trust to give workers meaningful decision-
making authority. Contemporary China has highly limited institutions of worker voice, with
the official labor union failing to provide significant bottom-up representation of worker inter-
ests and opposing higher levels of worker participation in decision-making (Friedman and Lee
2010; Brown and O’Rourke 2007). In the absence of institutions facilitating voice and trust,
employers may adopt the physical and managerial elements of lean without implementing
the high-involvement work practices that stimulate improved labor standards.
Learning more about mechanisms and heterogeneous effects across workplaces is the
focus of our future research. Regardless of the mechanisms that produce positive spillovers for
social performance, lean capability-building differs in fundamental ways from the traditional
31

private regulatory approach to social responsibility in supply chains. The dominant mode of
private regulation attempts to improve workplace conditions through the threat of external
sanction. Buyers mandate that suppliers meet social responsibility standards in order to do
business. For the sanction-based system to work, the buyer has to be willing to bear the
costs of adequately financing an auditing team to monitor compliance as well as switching
costs associated with terminating relationships with noncompliant suppliers. In turn, the
supplier must believe that investments in improved conditions are more valuable than losing
the buyer’s business. However, the last decade of research offers evidence that these programs
offer limited improvements, as buyers continue business relationships even under conditions
of sustained noncompliance (Barrientos and Smith 2007; Egels-Zanden 2007; Lund-Thomsen
et al. 2012; Locke 2013; Distelhorst et al. 2014). Even when traditional compliance regimes
function as designed, the buyer must continuously apply these pressures, with their associated
costs for all parties, to sustain improved workplace conditions. In contrast, previous research
shows that lean and other forms of modern manufacturing deliver substantial benefits to
business performance (Ichniowski et al. 1996; Bloom et al. 2013). If these practices can be
successfully introduced, suppliers themselves may have a stake in maintaining them.
How generalizable are our findings? The intervention we studied was firm-driven
and implemented in the naturalistic setting of actual manufacturers across eleven emerging
markets. The manufacturing practices that comprise Nike’s lean intervention (Table 1) are
widely known and commonly employed in a range of manufacturing settings. Because these
practices are not highly idiosyncratic or proprietary, our findings may be applicable to similar
interventions by other firms. Our findings also come from an industry in which emerging
markets play an important role. After China and the European Union, the world’s biggest
exporters of apparel are Bangladesh, Vietnam, India, and Turkey.17 With low barriers to
entry, apparel manufacturing is viewed as a “starter” industry for growth strategies that
emphasize export-oriented industrialization (Gereffi 1999). In these ways, our findings on
lean manufacturing and labor standards are theoretically applicable to firms across a variety
of emerging markets.
At the same time, there are important limits to generalizability. As a model for
improving social compliance in global supply chains, capability-building interventions may
be limited to large buyers like Nike. Large multinationals have more resources to support
training programs, and the scale of their orders makes it easier to persuade suppliers to
17World Trade Organization. 2014. “International Trade Statistics 2014” http://www.wto.org/english/
res_e/statis_e/its2014_e/its14_toc_e.htm (Accessed Dec 31, 2014)
32

invest in implementing new management systems. This intervention also targeted suppliers
with long-term business relationships with Nike. If such relationships are a precondition
for intensive collaboration on management systems, this intervention may not be plausible
in supply chains with high supplier turnover. In short, we should neither over- nor under-
generalize from the results of this research. Lean manufacturing is associated with improved
labor standards in this important case, but it would be prudent to replicate these analyses
with new industries and lead firms.
One important limitation to this study is our limited data on the features of individ-
ual factories and their sourcing relationships to Nike. It may be instructive in future research
to explore the effects of lean manufacturing on buyer order volume and, more generally, on
the relationship between buyers and suppliers. Capability-building programs may produce
higher levels of trust and relational contracting in the buyer-supplier relationship. A common
complaint from developing world suppliers is that buyers demand improvements in factory
labor conditions but lack commitment to continued sourcing (Ruwanpura and Wrigley 2011;
Locke, Amengual and Mangla 2009). Suppliers’ belief that customer relationships are fragile
and short-lived reduces incentives to invest in social compliance. In the Nike case, capabil-
ity building targeted suppliers that already enjoyed long-term sourcing relationships with
Nike. However, in other cases capability building may credibly signal commitment to an
extended sourcing relationship, thereby increasing supplier trust that investments in social
performance will not go to waste.
Our findings have straightforward implications for multinational management prac-
tice. Capability building diverges from traditional private regulation in its attempt to create
value for both the buyer and supplier, such that both parties have incentive to cultivate and
sustain new management practices. By offering evidence that certain forms of capability-
building enhance factory social performance, we identify a specific opportunity to create
“shared value” in global supply chains (Porter and Kramer 2006). If global buyers, sup-
plier management, and the production workforce simultaneously derive benefit from this
approach to manufacturing, lean capability building may represent a form of self-enforcing
institutional change that supports improved working conditions in emerging markets.
33

Appendix
Table A1: Effects of lean, controlling for cumulative compliance audits and country trends
DV Labor compliance HSE complianceModel (1) (2) (3) (4) (5) (6) (7) (8) (9) (10) (11) (12)Lean adoption .29** .29** .21 .08 .04 .00
(.11) (.11) (.11) (.07) (.07) (.06)% lean lines .57** .57** .44** .08 .00 .04
(.16) (.16) (.15) (.11) (.11) (.10)Cumul. audits .10 .04 .10 .04
(.13) (.13) (.13) (.13)(Squared) -.01 .01 -.01 .01
(.03) (.03) (.03) (.03)Country time trends X X X XFactory FEs X X X X X X X X X X X XHalf Year FEs X X X X X X X X X X X XFactories 300 300 300 300 300 300 332 332 332 332 332 332Observations 2,704 2,704 2,704 2,704 2,704 2,704 2,504 2,504 2,504 2,504 2,504 2,504
Notes. Alternative specifications of the compliance models estimated in Table 4, controlling for cumulative audits and country-specific timetrends (linear and quadratic) for each of the 11 countries in the sample. Cumulative audits are the total number of audits the factory hasexperienced as of the current period. The outcomes are factory compliance grades on a four-point scale (A=4, B=3, C=2, D=1) for labor andhealth, safety, and environment (HSE). The two codings of the independent variable are any lean adoption (1 if the factory has adopted anylean lines, 0 otherwise) and percentage of lean lines (count of lean lines / total lines in factory). ** p<0.01, * p<0.05.
34

Table A2: Effects of leads and lags of lean adoption on labor compliance
DV Labor complianceModel (1)
leanswitcht+4 .0272(.0658)
leanswitcht+3 .0443(.0966)
leanswitcht+2 .0662(.111)
leanswitcht+1 .0419(.126)
leanswitcht .115(.163)
leanswitcht−1 .220(.180)
leanswitcht−2 .283(.193)
leanswitcht−3 .490**(.205)
leanswitcht−4 .548**(.216)
Factory FEs XHalf FEs XFactories 300Total Obs. 2,704
Notes. OLS panel fixed effects regression from FY2009 H1 to FY2014 H1. Regression coefficients shownwith robust standard errors clustered by factory in parentheses. The outcomes are factory labor compliancegrades on a four-point scale (A=4, B=3, C=2, D=1). The binary indicator leanswitcht takes the value1 only in the first period after lean adoption. The leads and lags of this indicator allow us to examinedifferences between the treatment and control groups prior to (t + a) and after (t − a) lean adoption. Theresults are plotted in Figure 1. ** p<0.01, * p<0.05.
35

Table A3: Country-specific effects of lean on labor compliance
(1) (2)
Lean adoption× China -.074
(.225)× Thailand .704**
(.182)× Vietnam .239
(.211)× Sri Lanka -.023
(.240)× Malaysia .608**
(.220)× India .809**
(.187)× Other .184
(.256)
Percent lean lines× China .003
(.249)× Thailand .920**
(.260)× Vietnam 1.355**
(.514)× Sri Lanka .274
(.459)× Malaysia .912**
(.251)× India 1.360
(.359)× Other -.025
(.525)
Factory FEs X XHalf FEs X XFactories 300 300Total obs. 2,704 2,704
Notes. OLS panel fixed effects regression from FY2009 H1 to FY2014 H1. Regression coefficients shownwith robust standard errors clustered by factory in parentheses. The outcomes are factory labor compliancegrades on a four-point scale (A=4, B=3, C=2, D=1). The two codings of our lean measure have beeninteracted with country-indicators to estimate treatment effects within each country that represents at least5% of our sample. Bangladesh, Cambodia, Egypt, Indonesia, and Turkey make up the “other” category.Results are plotted in Figure 3. ** p<0.01, * p<0.05.
36

Table A4: Nike compliance audit scoring rubric
Grade Labor Health, Safety and Environment
A• Isolated violations of standards which do not rise to the level of “Serious”or “Critical” issues.• No more than five minor issues awaiting remediation.
• Fully compliant.• Demonstrates best practices.• Considered a leader.
B• Isolated violations of standards which do not rise to the level of “Serious”or “Critical” issues.• More than five minor issues awaiting remediation.
• Mostly compliant.• Minor system failures.• Factory making progress.
C
• Factory not providing basic terms of employment (contracts, docu-mented training on terms of employment, equal pay, discriminatory em-ployment screening.)• Isolated use of workers under the minimum legal age or above the min-imum legal age but under the minimum age of Nike’s standards.• Factory fails to honor a material term of a signed collective bargainingagreement.• Isolated case of not paying the legally mandated minimum wage; notproviding legally required non-income related benefits; or failure to pro-vide required income-related benefits.• Isolated verbal or mental harassment or abuse.• Violation of local laws regarding the use of migrant labor• Serious violation of hours of work standard: factory fails to provideverifiable timekeeping system to accurately record work hours; more than10 percent of employees work between 60 and 72 hours each week or workseven or more consecutive days without a break.
• Noncompliant.• Serious system failures.• Factory is making no progress.
D
• Management specifically refuses, or continues to demonstrate it is notwilling to comply with Nike Standards.• Any denial of access to authorized compliance inspectors.• Management provides false information (statements, documents ordemonstrates coaching).• Factory outsources to an unapproved or unauthorized facility or issueshomework to employees.• Any use of bonded, indentured, or prison labor.• Use of force to compel illegal work hours• Systemic use of workers under the minimum legal age for work• Factory denies workers freedom of association.• Systematically not paying the legally mandated minimum wage or notproviding legally required income related benefits.• Factory conducts pregnancy testing as a condition of employment.• Systematically not providing legally required maternity leave.• A confirmed serious incident of physical or sexual abuse; or systemicharassment and abuse and/or failure to timely respond to complaint(s).• Critical violation of hours of work standard: lack of verifiable time-keeping system results in workers not having hours or work accuratelyrecorded; more than 10 percent of employees exceed daily work hour lim-its, work more than 72 hours each week or work 14 or more consecutivedays without a break.
• Noncompliant• Demonstrates general disregard forNike codes and standards.• Unwilling or unable to drive impor-tant change.• Deliberately misleads auditors.• Audit shows critical systemic andwidespread problems.
Notes. More detail on the standards that these grades refer to is available at: http://www.
nikeresponsibility.com/report/uploads/files/NIKE_INC_Code_Leadership_Standards.pdf
37

Figure A1: Predictors of health, safety, and environment (HSE) compliance grades
4 Point A−D AB versus CD
●
●
●
●
●
●
●
●
●
●
●
●
●
●
●
●
●
●
●
●
●
●
●
●
●
●
●
●
●
●
●
●
●
●
●
●
●
●
●
●
●
●
●
●
●
●
●
●
●
●
●
●
●
●
●
●
●
●
●
●
●
●
●
●
●
●
●
●
●
●
●
●
●
●
●
●
●
●
●
●
●
●
●
●
●
●
●
●
UST PCB Solid Waste Asbestos Waste Water AST Air Emissions Hazardous Waste Hazardous MaterialsCHEMICAL MANAGEMENT:
Emergency Action Medical Services − First Aid Bloodborne Pathogens Fire SafetyFIRE & EMERGENCY ACTION:
Childcare Dormitory Drinking Water Occupational Health Sanitation CanteenHEALTH:
PMV Fall Protection Maintenance Safety Hazardous Energy Control Contractor Safety Electrical Safety Confined SpacesMAINTENANCE:
Non−Ionizing Raditiation Heat Stress General Work Ergonomics PPE − General Machine Guarding PPE − Respirators Occupational Exposure Limits Occupational NoiseWORKER PROTECTION:
0 5 10 15 20 0 5 10 15 20
Variable Importance from Random Forest (mean decrease in Gini index)
Notes. Random forest estimates of variable importance from sample of 313 audits with detailed subscores forHSE compliance. Includes factories from the eleven countries used in the main study. Variable importance ismeasured by the sum of all decreases in the Gini impurity index associated with splitting on a given variable,normalized by the number of trees in the forest (Breiman 2002; Liaw and Wiener 2002).
38

References
Angrist, Joshua D and Jorn-Steffen Pischke. 2008. Mostly harmless econometrics: An em-
piricist’s companion. Princeton university press.
Anner, Mark, Jennifer Bair and Jeremy Blasi. 2012. “Buyer Power, Pricing Practices, and
Labor Outcomes in Global Supply Chains.” Institutions Program Working Paper Series,
University of Colorado at Boulder .
Appelbaum, Eileen. 2000. Manufacturing advantage: Why high-performance work systems
pay off. Cornell University Press.
Autor, David H. 2003. “Outsourcing at will: The contribution of unjust dismissal doctrine
to the growth of employment outsourcing.” Journal of labor economics 21(1):1–42.
Bailey, Thomas. 1993. Discretionary effort and the organization of work: Employee partic-
ipation and work reform since Hawthorne. Teachers College and Conservation of Human
Resources, Columbia University.
Bailey, Thomas, Peter Berg and Carola Sandy. 2001. “The effect of high-performance work
practices on employee earnings in the steel, apparel, and medical electronics and imaging
industries.” Industrial & labor relations review 54(2):525–543.
Barrientos, S. and S. Smith. 2007. “Do Workers Benefit from Ethical Trade? Assessing Codes
of Labour Practice in Global Production Systems.” Third World Quarterly 28(4):713–729.
Barrientos, Stephanie. 2013. “Corporate Purchasing Practices in Global Production Net-
works: A Socially Contested Terrain.” Geoforum 44:44–51.
Barrientos, Stephanie, Gary Gereffi and Arianna Rossi. 2011. “Economic and Social Up-
grading in Global Production Networks: A New Paradigm for a Changing World.” Inter-
national Labour Review 150(3-4):319–340.
Bartley, Tim. 2007. “Institutional Emergence in an Era of Globalization: The Rise of
Transnational Private Regulation of Labor and Environmental Conditions.” American
Journal of Sociology 113(2):297–351.
Becker, Brian E and Mark A Huselid. 1998. “High performance work systems and firm
performance: A synthesis of research and managerial implications.” Research in Personnel
and Human Resource Management 16:53–101.
Berg, Peter, Eileen Appelbaum, Thomas Bailey and Arne L Kalleberg. 1996. “The per-
formance effects of modular production in the apparel industry.” Industrial Relations: A
Journal of Economy and Society 35(3):356–373.
Bhattacharya, CB, Sankar Sen and Daniel Korschun. 2008. “Using Corporate Social Re-
sponsibility to Win the War for Talent.” MIT Sloan management review 49(2):37–44.
39

Bloom, Nicholas, Benn Eifert, Aprajit Mahajan, David McKenzie and John Roberts. 2013.
“Does Management Matter? Evidence from India.” The Quarterly Journal of Economics
128(1):1–51.
Bloom, Nicholas and John Van Reenen. 2007. “Measuring and Explaining Management
Practices across Firms and Countries.” The Quarterly Journal of Economics 122:1351–
1408.
Breiman, Leo. 2001. “Random forests.” Machine learning 45(1):5–32.
Breiman, Leo. 2002. “Manual on setting up, using, and understanding random forests, v3.1.”
Statistics Department University of California Berkeley, CA, USA .
Brown, Garrett D and Dara O’Rourke. 2007. “Lean manufacturing comes to China: a case
study of its impact on workplace health and safety.” International journal of occupational
and environmental health 13(3):249–257.
Cappelli, Peter and David Neumark. 2001. “Do “High-Performance” Work Practices Improve
Establishment-Level Outcomes?” Industrial and Labor Relations Review 25(4):737–775.
Cappelli, Peter and Nikolai Rogovsky. 1994. “New Work Systems and Skill Requirements.”
International Labour Review 133(2):205–220.
Cheng, Beiting, Ioannis Ioannou and George Serafeim. 2014. “Corporate social responsibility
and access to finance.” Strategic Management Journal 35(1):1–23.
Clean Clothes Campaign. 2008. Cashing In: Giant Retailers, Purchasing Practices, and
Working Conditions in the Garment Industry.
Cohen, J. and C. Sabel. 2006. “Extra Rempublicam Nulla Justitia?” Philosophy & Public
Affairs 34(2):147–175.
Connor, T. and K. Dent. 2006. “Offside! Labour rights and Sportswear Production in Asia.”.
Dhanarajan, Sumi. 2005. “Managing Ethical Standards: When Rhetoric Meets Reality.”
Development in Practice 15(3-4):529–538.
Distelhorst, Greg, Richard Locke, Timea Pal and Hiram Samel. 2014. “Production Goes
Global, Standards Stay Local: Private Labor Regulation in the Global Electronics Indus-
try.” MIT Political Science Department Research Paper .
Dunlop, John T and David Weil. 1996. “Diffusion and Performance of Modular Production
in the US Apparel Industry.” Industrial Relations: A Journal of Economy and Society
35(3):334–355.
Egels-Zanden, Niklas. 2007. “Suppliers’ Compliance with MNCs’ Codes of Conduct: Behind
the Scenes at Chinese Toy Suppliers.” Journal of Business Ethics 75(1):45–62.
Flammer, Caroline. 2013. “Corporate Social Responsibility and Shareholder Reaction: The
40

Environmental Awareness of Investors.” Academy of Management Journal 56(3):758–781.
Friedman, Eli and Ching Kwan Lee. 2010. “Remaking the World of Chinese Labour: A
30-Year Retrospective.” British Journal of Industrial Relations 48(3):507–533.
Gereffi, Gary. 1999. “International Trade and Industrial Upgrading in the Apparel Com-
modity Chain.” Journal of International Economics 48(1):37–70.
Greene, William. 2004. “The behaviour of the maximum likelihood estimator of limited
dependent variable models in the presence of fixed effects.” The Econometrics Journal
7(1):98–119.
Guillen, Mauro F. 1994. Models of management: Work, authority, and organization in a
comparative perspective. University of Chicago Press.
Harney, Alexandra. 2008. The China Price: The True Cost of Chinese Competitive Advan-
tage. Penguin.
Harrison, Ann and Jason Scorse. 2010. “Multinationals and Anti-Sweatshop Activism.” The
American Economic Review 100(1):247–273.
Haufler, V. 2001. A Public Role for the Private Sector: Industry Self-regulation in a Global
Economy. Carnegie Endowment.
Henisz, Witold J, Sinziana Dorobantu and Lite J Nartey. 2014. “Spinning gold: The financial
returns to stakeholder engagement.” Strategic Management Journal 35:1727–1748.
Huselid, Mark A. 1995. “The Impact of Human Resource Management Practices on Turnover,
Productivity, and Corporate Financial Performance.” Academy of management journal
38(3):635–672.
Ichniowski, C., K. Shaw and G. Prennushi. 1997. “The Effects of Human Resource Man-
agement Practices on Productivity: A Study of Steel Finishing Lines.” The American
Economic Review 87(3):291–313.
Ichniowski, Casey, Thomas A Kochan, David Levine, Craig Olson and George Strauss. 1996.
“What Works at Work: Overview and Assessment.” Industrial Relations: A Journal of
Economy and Society 35(3):299–333.
IMPACTT. 2011. “Finding The Sweet Spot: Smarter Ethical Trade That Delivers More For
All.”.
International Labour Organization. 2005. “Promoting fair globalization in textiles and cloth-
ing in a post-MFA environment.” Report for discussion at the Tripartite Meeting on Pro-
moting Fair Globalization in Textiles and Clothing in a Post-MFA Environment .
International Labour Organization. 2011. “Labour Administration and Labour Inspection.”
International Labour Conference .
41
Keck, Margaret E and Kathryn Sikkink. 1998. Activists Beyond Borders: Advocacy Networks
in International Politics. Cambridge Univ Press.
Kernaghan, C. 2006. US Jordan Free Trade Agreement Descends Into Human Trafficking
and Involuntary Servitude. New York: The National Labor Committee.
King, Andrew A and Michael J Lenox. 2001. “Lean and green? An empirical examination
of the relationship between lean production and environmental performance.” Production
and operations management 10(3):244–256.
King, Brayden G and Nicholas A Pearce. 2010. “The contentiousness of markets: Poli-
tics, social movements, and institutional change in markets.” Annual Review of Sociology
36:249–267.
King, Brayden G and Sarah A Soule. 2007. “Social movements as extra-institutional en-
trepreneurs: The effect of protests on stock price returns.” Administrative Science Quar-
terly 52(3):413–442.
Klassen, Robert D and Curtis P McLaughlin. 1996. “The Impact of Environmental Man-
agement on Firm Performance.” Management Science 42(8):1199–1214.
Koh, Ping-Sheng, Cuili Qian and Heli Wang. 2014. “Firm litigation risk and the insurance
value of corporate social performance.” Strategic Management Journal 35(10):1464–1482.
Kytle, Beth and John Gerard Ruggie. 2005. “Corporate Social Responsibility as Risk Man-
agement: A Model for Multinationals.”.
Liaw, Andy and Matthew Wiener. 2002. “Classification and Regression by randomForest.”
R News 2(3):18–22.
Locke, R., M. Amengual and A. Mangla. 2009. “Virtue out of Necessity? Compliance, Com-
mitment, and the Improvement of Labor Conditions in Global Supply Chains.” Politics &
Society 37(3):319.
Locke, R., T. Kochan, M. Romis and F. Qin. 2007. “Beyond Corporate Codes of Conduct:
Work Organization and Labour Standards at Nike’s Suppliers.” International Labour Re-
view 146:21–40.
Locke, Richard M. 2013. The Promise and Limits of Private Power: Promoting Labor
Standards in a Global Economy. Cambridge University Press.
Locke, R.M., F. Qin and A. Brause. 2007. “Does Monitoring Improve Labor Standards?
Lessons from Nike.” Industrial and Labor Relations Review 61(1):3–31.
Lund-Thomsen, Peter and Adam Lindgreen. 2014. “Corporate social responsibility in global
value chains: Where are we now and where are we going?” Journal of Business Ethics
123(1):11–22.
42

Lund-Thomsen, Peter, Khalid Nadvi, Anita Chan, Navjote Khara and Hong Xue. 2012.
“Labour in Global Value Chains: Work Conditions in Football Manufacturing in China,
India and Pakistan.” Development and Change 43(6):1211–1237.
Luo, Xueming, Heli Wang, Sascha Raithel and Qinqin Zheng. 2013. “Corporate Social Per-
formance, Analyst Stock Recommendations, and Firm Future Returns.” Strategic Man-
agement Journal .
MacDuffie, John Paul. 1995. “Human resource bundles and manufacturing performance:
Organizational logic and flexible production systems in the world auto industry.” Industrial
& Labor Relations Review 48(2):197–221.
MacLean, Tammy L and Michael Behnam. 2010. “The Dangers of Decoupling: The Re-
lationship between Compliance Programs, Legitimacy Perceptions, and Institutionalized
Misconduct.” Academy of Management Journal 53(6):1499–1520.
Milgrom, Paul and John Roberts. 1990. “The economics of modern manufacturing: Tech-
nology, strategy, and organization.” The American Economic Review 80(3):511–528.
Monden, Yasuhiro. 2012. Toyota Production System: An Integrated Approach to Just-In-
Time, 4th Edition. Productivity Press.
Nike Inc. 2012. “Nike, Inc. FY10/11 Sustainable Business Performance Summary.”.
Ono, T. 1988. Toyota production system: beyond large-scale production. Productivity Pr.
O’Rourke, Dara. 2003. “Outsourcing Regulation: Analyzing Nongovernmental Systems of
Labor Standards and Monitoring.” Policy Studies Journal 31(1):1–29.
Osterman, Paul. 2006. “The wage effects of high performance work organization in manu-
facturing.” Industrial and Labor Relations Review 59(2):187–204.
Oxfam. 2010. “Better Jobs in Better Supply Chains.” Briefings for Business No. 5 .
Pfeffer, Jeffrey. 2007. “Human Resources from an Organizational Behavior Perspective:
Some Paradoxes Explained.” The Journal of Economic Perspectives 21(4):115–134.
Porter, Michael E and Mark R Kramer. 2006. “Strategy and Society.” Harvard business
review 84(12):78–92.
Pruett, D., J. Merk and N. Ascoly. 2005. Looking for a Quick Fix: How Weak Social Auditing
Is Keeping Workers in Sweatshops. Clean Clothes Campaign.
Raworth, Kate and Thalia Kidder. 2009. Mimicking ‘Lean’ in Global Value Chains: It’s
the Workers who Get Leaned on. In Frontiers of Commodity Chain Research, ed. Jennifer
Bair. Stanford University Press.
Reich, R.B. 2007. Supercapitalism: The Transformation of Business, Democracy and Every-
day Life.
43

Riisgaard, L. 2009. “Global Value Chains, Labor Organization and Private Social Standards:
Lessons from East African Cut Flower Industries.” World Development 37(2):326–340.
Ruggie, J. 2008. Taking Embedded Liberalism Global: The Corporate Connection. In Em-
bedding global markets: An enduring challenge, ed. J. Ruggie. Ashgate Publishing Group
pp. 231–238.
Ruwanpura, Kanchana N and Neil Wrigley. 2011. “The Costs of Compliance? Views of Sri
Lankan Apparel Manufacturers in Times of Global Economic Crisis.” Journal of Economic
Geography 11(6):1031–1049.
Sako, Mari. 2004. “Supplier development at Honda, Nissan and Toyota: comparative
case studies of organizational capability enhancement.” Industrial and Corporate Change
13(2):281–308.
Seidman, G. 2007. Beyond the Boycott: Labor Rights, Human Rights, and Transnational
Activism. Russell Sage Foundation Publications.
Shah, Rachna and Peter T Ward. 2003. “Lean Manufacturing: Context, Practice Bundles,
and Performance.” Journal of Operations Management 21(2):129–149.
Shah, Rachna and Peter T Ward. 2007. “Defining and Developing Measures of Lean Pro-
duction.” Journal of operations management 25(4):785–805.
Smyth, Russell, Qingguo Zhai and Xiaoxu Li. 2009. “Determinants of turnover intentions
among Chinese off farm migrants.” Economic change and restructuring 42(3):189–209.
Toffel, Michael W, Jodi L Short and Melissa Ouellet. 2015. “Codes in context: How states,
markets, and civil society shape adherence to global labor standards.” Regulation & Gov-
ernance .
Turban, Daniel B and Daniel W Greening. 1997. “Corporate Social Performance and Or-
ganizational Attractiveness to Prospective Employees.” Academy of management journal
40(3):658–672.
Varian, Hal R. 2014. “Big data: New tricks for econometrics.” The Journal of Economic
Perspectives 28(2):3–27.
Verite. 2004. Excessive Overtime in Chinese Supplier Factories: Causes, Impacts, and Rec-
ommendations for Action. Amherst, MA: Verite Research Paper.
Vogel, D. 2008. “Private Global Business Regulation.” Annual Review of Political Science
11:261–282.
Vogel, David. 2010. “The private regulation of global corporate conduct: achievements and
limitations.” Business & Society 49(1):68–87.
Weaver, Gary R, Linda Klebe Trevino and Philip L Cochran. 1999. “Integrated and Decou-
44

pled Corporate Social Performance: Management Commitments, External Pressures, and
Corporate Ethics Practices.” Academy of Management Journal 42(5):539–552.
Weil, David. 2008. “A Strategic Approach to Labour Inspection.” International Labour
Review 147(4):349–375.
Womack, James P and Daniel T Jones. 1996. Lean Thinking: Banish Waste and Create
Wealth in Your Corporation. Simon & Schuster.
Womack, James P, Daniel T Jones and Daniel Roos. 1991. The Machine That Changed the
World: The Story of Lean Production. Harper Perennial.
45