does information asymmetry affect corporate tax
TRANSCRIPT

Electronic copy available at: https://ssrn.com/abstract=2476224
1
Does Information Asymmetry Affect Corporate Tax Aggressiveness?
Tao Chen and Chen Lin*
June, 2017
* Chen (corresponding author), [email protected], Nanyang Business School, Nanyang
Technological University; Lin, [email protected], Faculty of Business and Economics, University of
Hong Kong. We thank Paul Malatesta (the editor) and an anonymous referee for their very valuable
and constructive comments and suggestions. We are grateful for constructive comments and
discussions from Thorsten Beck, Candie Chang, Xin Chang (Simba), Jianguo Chen, Agnes Cheng,
Louis Cheng, Jing Chi, Tarun Chordia, Stephen Dimmock, Huasheng Gao, Zhaoyang Gu, Xiaoxiao He,
Chuan Yang Hwang, Kose John, Jun-Koo Kang, Young Sang Kim, Kai Li, Wei-Hsien Li, Angie Low,
Chris Malone, John G. Matsusaka, Mujtaba Mian, James Ohlson, Kwangwoo Park, Xuan Tian, Naqiong
Tong, Wilson Tong, David Tripe, Kam-Ming Wan, Albert Wang, Cong Wang, Chishen Wei, Scott
Yonker, Hua Zhang, Lei Zhang, and conference and seminar participants at the 2015 China
International Conference in Finance (CICF), 2014 International Conference on Asia-Pacific Financial
Markets (CAFM), 2015 Auckland Finance Meeting, 2015 Conference on the Theories and Practices
of Securities and Financial Markets, 2014 Australasian Finance and Banking Conference (AFBC),
Massey University, Nanyang Technological University, Hong Kong Polytechnic University, Xiamen
University, and Chinese University of Hong Kong. We thank Scott Dyreng for providing the Exhibit
21 data. Chen is grateful for the financial support from Singapore Ministry of Education Academic
Research Fund Tier 1 (Reference number: RG58/15). Lin gratefully acknowledges the financial
support from the Research Grants Council of Hong Kong (Project No. T31/717/12R).

Electronic copy available at: https://ssrn.com/abstract=2476224
2
Abstract
We investigate the effect of information asymmetry on corporate tax avoidance. Using a
difference-in-differences matching estimator to assess the effects of changes in analyst
coverage caused by broker closures and mergers, we find that firms avoid tax more
aggressively after a reduction in analyst coverage. We further find that this effect is mainly
driven by firms with higher existing tax planning capacity (e.g., tax haven presence),
smaller initial analyst coverage, and a smaller number of peer firms. Moreover, the effect is
more pronounced in industries where reputation matters more, and in firms subject to less
monitoring from tax authorities.
JEL classification: G24; G32; G30
Keywords: Information asymmetry; Analyst coverage; Corporate tax aggressiveness;
Natural experiment; Broker closures and mergers
Electronic copy available at: https://ssrn.com/abstract=2476224
3
I. Introduction
What factors affect corporate tax avoidance?1 This question is drawing increasing
attention from both academics and policy makers around the world. Between 1998 and
2005, 30.5% of large U.S. firms reported zero tax liability (U.S. General Accounting Office
(2008)), and the U.S. Internal Revenue Service (IRS (2012)) reports that the official tax
compliance rate is estimated to be only 83.1%. A 2013 special report in the Economist
estimated that the amount of money stashed away in tax havens might be above $20
trillion.2 The recent “Panama Papers” revelations have also stimulated public attention and
interest in the use of offshore tax havens for tax evasion.3 Despite their obvious importance
to both academics and policy makers, the factors that have first-order effects in driving or
reducing corporate tax avoidance have, until recently, received limited attention in finance
and accounting research. In their survey of the literature, Hanlon and Heitzman ((2010), p.
145) conclude that “the field cannot explain the variation in tax avoidance very well,” and
they call for more research.
Recently public media and lawmakers have called for greater transparency from
1 Following Hanlon and Heitzman (2010), we define tax avoidance broadly as the reduction of
explicit cash taxes, which includes all types of transactions from investing in a municipal bond to
using tax shelters.
2 See “Tax Havens: The Missing $20 Trillion,” The Economist (Feb. 16, 2013).
3 See “What Are the Panama Papers? A Guide to History’s Biggest Data Leak,” The Guardian (Apr. 5,
2016); “‘Panama Papers’ Puts Spotlight on Boom in Offshore Services,” The Wall Street Journal (Apr.
6, 2016).

4
companies to help reduce tax avoidance.4 Although recent studies have linked tax
avoidance to various factors,5 few studies have examined the causal effect of information
asymmetry on tax avoidance. This gap is surprising, as managers clearly face conflicts
between financial reporting quality and tax planning (e.g., Scholes and Wolfson (1992)).6
The paucity of research might be partially driven by potential endogeneity concerns. The
primary source of endogeneity is reverse causality, as seen in the inconsistent conclusions
of previous studies. Using cross-country data, Kerr (2012) finds that information
asymmetry leads to tax avoidance. In contrast, several other studies find that aggressive tax
planning affects earnings quality and information asymmetry (e.g., Hanlon (2005), Ayers,
Jiang, and Laplante (2009), Comprix, Graham, and Moore (2011), and Balakrishnan, Blouin,
and Guay (2012)). Therefore, the question of whether the information environment affects
or is affected by tax avoidance is under debate, as the direction of the causality between
these two constructs is unclear. Furthermore, unobservable factors could be correlated
4 See “U.K. has Unwinnable Battle on Tax Avoidance, Panel Says,” Bloomberg (Apr. 26, 2013).
5 These factors include firm characteristics (e.g., Wilson (2009), Lisowsky, Robinson, and Schmidt
(2013)), corporate governance (e.g., Desai and Dharmapala (2006)), ownership structure (e.g.,
Chen, Chen, Cheng, and Shevlin (2010), McGuire, Wang, and Wilson (2014)), executives (e.g.,
Dyreng, Hanlon, and Maydew (2010)), cultural norms (DeBacker, Heim, and Tran (2015)), and
labor unions (Chyz, Leung, Li, and Rui (2013)), etc.
6 On the one hand, managers desire to report low levels of earnings to tax authorities. On the other
hand, they desire to report higher levels of earnings to investors. Therefore, firms often face a
trade-off between tax avoidance and lower reported earnings (e.g., Matsunaga, Shevlin, and Shores
(1992), Maydew (1997)).

5
with both information asymmetry and tax avoidance at the same time. In this study, we use
analyst coverage as a proxy for information transparency between firms and their
investors. Specifically, we rely on two natural experiments, brokerage closures and
brokerage mergers, which generate exogenous variations in analyst coverage, to examine
the effect of information on tax avoidance. Both brokerage closures and brokerage mergers
directly affect firms’ analyst coverage, but are not directly related to individual firms’
corporate decisions and policies.7
The change in the information environment caused by a reduction in analyst coverage
could affect corporate tax avoidance in the following ways. First, financial analysts care
about corporate tax policies, as a firm’s tax shield is associated with capital budgeting, cost
of capital, and eventually firm valuation. Analysts also analyze firms’ tax planning strategies,
effective tax rates, and abnormal tax patterns, and distribute both public and private
information to institutional and retail investors and various other information users
through research reports and media outlets such as newspapers and TV programs. In the
process, analysts assess the tax risks that firms take and distribute this information to
firms’ investors; this scrutiny discourages firms from using risky tax strategies. Ultimately,
if firms take on excessive tax risk, it is the investors who bear the cost when the
government imposes penalties and extracts taxes. Therefore, a drop in analyst coverage
could lead to an increase in tax avoidance.
Anecdotal evidence suggests that analysts pay attention to risky tax strategies. For
7 These settings have been used in recent studies, such as Kelly and Ljungqvist (2012), Derrien and
Kecskes (2013), and He and Tian (2013).

6
example, in a 2012 article in the Daily Telegraph, Bruce Packard, an analyst at Seymour
Pierce, said “Barclays risks ‘a fierce customer backlash’ if it does not reduce its exposure to
offshore tax havens or limit legitimate tax avoidance.”8 We further verify analysts’ interest
in firms’ tax avoidance activities by conducting a content analysis of 6,010,450 analyst
reports downloaded from Investext database. This sample includes all of the reports in the
database for all firms in the 2007–2013 period. We implement keyword searches related to
tax planning, and find that on average 12.46% of the universal analyst reports are
concerned with firms’ tax avoidance activities, indicating that analysts pay substantial
attention to the tax policies of the firms they cover.9
Second, analysts are well trained in finance and accounting, with substantial
background knowledge of the industry. They track firms on a regular basis and are
therefore able to identify potential irregularities in tax planning in a timely manner. As
8 See “Barclays ‘Risks Backlash’ Unless Its Tax Affairs Are Simplified,” The Daily Telegraph (Jan. 4,
2012).
9 Specifically, we include the following keywords: tax* avoid*, avoid* tax*, tax* avoidance, evad*,
evas*, tax*, tax* shelter*, effective tax rate, and tax* aggress*. We also read through some of the
reports and confirm that analysts are indeed expressing interest in tax avoidance. For example, in a
report on Affordable Residential Communities Inc (ARC) issued by Wachovia Securities on Mar. 7,
2006, Stephen Swett concluded that “ARC was giving up its real estate investment trust status to
escape from tax penalties.” In their Aug. 20, 2009 report on Northrop Grumman (NOC), Joseph F.
Campbell, Harry Breach, and Carter Copeland from Barclays Capital pointed out that the main
choice for the divestiture of The Analytical Science Corporation (TASC) is whether to sell and pay
taxes, or spin and avoid taxes by using a reverse Morris trust.
7
active information intermediaries, analysts disseminate information about a firm
throughout the financial market, and the dissemination of information about tax
aggressiveness to the general public could tarnish a firm’s reputation.10 Evidence from the
field indicates that corporate executives rate reputation concerns and the risk of adverse
media attention as important or very important factors in their decisions to not engage in
aggressive tax planning; these two factors are also more important for firms with more
analyst following (Graham, Hanlon, Shevlin, and Shroff (2014)). In our analysis, we find
that the effect of analyst coverage is more pronounced in firms in consumer-oriented
industries where customers’ perception is more important. Therefore, a reduction in
analyst coverage increases information asymmetry and thus decreases the reputation
concern related to tax avoidance, leading firms to avoid tax more aggressively.11
Third, one strand of research on tax avoidance suggests that the complexity and
obfuscatory nature of tax avoidance requires opacity (e.g., Desai and Dharmapala (2006),
(2009b), Kim, Li, and Zhang (2011)). Therefore, as a reduction in analyst coverage leads to
higher levels of information opacity, it also gives firms more opportunities for aggressive
10 Hanlon and Slemrod (2009) argue that firms risk being labeled bad corporate “citizens” if the
general public is aware of their tax aggressiveness, and they find negative market reactions for
firms detected in tax sheltering.
11 Also, there is a view that analysts do not really understand complicated tax issues (e.g., Plumlee
(2003), Hoopes (2014)). If analysts indeed fail to clearly understand tax issues, there is a possibility
that analyst coverage will have little effect on corporate tax avoidance. In response, this study
directly examines whether analyst coverage affects firms’ incentives to engage in tax avoidance and
avoidance activities.
8
tax avoidance. In addition, a drop in analyst coverage results in less competition among
analysts (Hong and Kacperczyk (2010)), which might further reduce the incentives of the
remaining analysts to produce more in-depth information. The weakened information
production incentives of financial analysts further increase information asymmetry, and
consequently increase managers’ ex-ante incentives for aggressive tax planning.
In sum, financial analysts have both the abilities and incentives to produce and
distribute tax-related information and hence reduce information asymmetry between the
firms they cover and their investors. This reduction in information asymmetry might make
it more difficult for a firm to hide earnings through tax sheltering or complicated financial
structures, as the transaction costs for tax avoidance will tend to be higher. The increased
likelihood of being detected also raises firms’ concerns about reputation and financing
costs.12 Therefore, more intensive analyst coverage could deter corporate tax avoidance.
Note that we are not arguing that analysts are pushing firms to pay more taxes, and we do
not take a stance on whether tax avoidance increases or decreases firm value.13 Our study
12 For instance, Shevlin, Urcan, and Vasvari (2013) find that tax avoidance increases the cost of
public debt, whereas Hasan, Hoi, Wu, and Zhang (2014) show that tax avoidance increases the cost
of bank loans.
13 In theory, firms are expected to maximize shareholders’ value by reducing tax liabilities, as long
as the incremental benefit exceeds the incremental cost as it reduces tax burdens and minimizes
cash outflows. The empirical literature has mixed findings. Armstrong, Blouin, and Larcker (2012)
find that tax managers are compensated to reduce ETRs. According to the agency view of tax
avoidance, however, the cost will eventually outweigh the benefit of tax avoidance (Desai, Dyck, and
Ziungales (2007)). Graham et al. (2014) also provide evidence suggesting that firms benefit from

9
suggests that because analysts distribute their findings on firms’ tax structure to the
investors through analyst report and mass media, analyst coverage increases the cost of tax
avoidance14 and reduces managers’ incentives to aggressively avoid taxes.
To test this hypothesis, we use a comprehensive set of 9 measures of tax avoidance
drawn from the literature (e.g., Hanlon and Heitzman (2010)).15 We run simple regressions
of our measures of tax avoidance on the number of analysts following a firm and a battery
of control variables and find a negative correlation between analyst coverage and tax
avoidance. We then strive to establish the causal effect of information asymmetry on tax
avoidance by using two natural experiments. Using both Abadie and Imbens’ (2006)
matching and propensity score matching strategies, our difference-in-differences (DID)
estimation results indicate that our measures of tax avoidance significantly increase after a
firm loses an analyst, compared to similar firms that do not experience a reduction in
analyst coverage. These results are robust to various alternative matching criteria. Looking
at the economic magnitude, treated firms’ CETR drops by 0.9 percentage points relative to
the control firms that do not experience a reduction in analyst coverage. The evidence
therefore suggests a strong negative effect of analyst coverage on tax avoidance.
avoiding taxes, but if tax avoidance hurts the firm’s overall reputation among customers, such firms
are more cautious in their tax avoidance behavior.
14 As analyzed above, the cost includes both direct cost and indirect cost. Direct costs are the risk of
being detected by tax authorities, and the indirect costs include reputation costs and financing costs.
15 The measures include 5 measures of book-tax difference, 1 measure of tax sheltering, and 3
measures of effective tax rates. Out of these 9 measures, we use 5 in the main test, and use the other
4 for robustness checks.

10
We further examine the factors that influence the link between analyst coverage and
corporate tax avoidance to explore the underlying economic channels. Our findings of a
strong effect of analyst coverage on tax avoidance rely on one important underlying
assumption: mangers have the ability to change tax planning quickly. Many firms with
unused tax planning capacity may not engage in aggressive tax planning if information
transparency is high. In such cases, an increase in information asymmetry due to broker
closures and mergers might provide managers with the opportunity to incrementally use a
firm’s existing tax planning capacity; in this situation, we expect that firms would avoid tax
more aggressively when there is a decrease in analyst coverage. As expected, we find that
our results are only significant for multinational firms and firms with more segments,
which can rapidly adopt more aggressive tax planning activities.
We also consider a specific form of existing tax planning capacity: tax haven presence.
Following Dyreng and Lindsey (2009), we collect this information from the subsidiary
disclosure in Exhibit 21 of firms’ annual reports. Consistent with our expectation, we find
that a significant effect of analyst coverage on tax avoidance only exists in the subset of
firms with tax haven presence, firms with a greater number of tax haven subsidiaries or
subsidiaries in more tax haven countries.
We then look at firms’ initial level of analyst coverage. As expected, we find that a
significant increase in tax avoidance only exists in the subsample of firms with low initial
analyst coverage. This finding further strengthens our main hypothesis that information
asymmetry materially affects corporate tax avoidance activities. We also find that the
strong effects of analyst coverage on tax avoidance are mostly concentrated in the

11
consumer-oriented industries, as customer perception of a firm is more important in these
industries (see Hanlon and Slemrod (2009) and Graham et al. (2014)). Specifically, Graham
et al. (2014) provide evidence that if tax avoidance hurts a firm’s overall reputation among
customers, it will be more cautious in its tax avoidance behavior. We also find that the
effect of a reduction in analyst coverage on tax avoidance is more pronounced for firms
with a smaller number of peer firms and when tax authority monitoring is low.
Our study contributes to several strands of research. Primarily, our study adds to the
tax avoidance literature (e.g., Johnson, Kaufmann, and Zoido-Lobatón (1998), Johnson
Kaufmann, McMillan, and Woodruff (2000), Crocker and Slemrod (2005), Desai and
Dharmapala (2006), (2009a), Hanlon and Heitzman (2010), and Beck, Lin, and Ma (2014))
by investigating a new potential factor in firms’ tax avoidance activities. Due to the
renewed intellectual and policy interest in tax avoidance from governments, media and
academics, it is important to empirically identify the factors that influence tax avoidance.
Our study is among the first to document that information asymmetry affects firms’
incentives to engage in tax avoidance activates. In a recent study, Hanlon, Maydew, and
Thornock (2015) find that country-level information-sharing agreements with tax havens
decrease the use of tax havens at the individual investor level. Our study finds that firm-
level information transparency decreases corporate tax avoidance. In this regard, our study
also contributes to the broader literature of tax avoidance.
Our study also adds to the literature on the role played by financial analysts in
corporate policies (e.g., Derrien and Kecskes (2013), He and Tian (2013), and Chen,
Harford, and Lin (2015)). We show that a decrease in analyst coverage caused by broker

12
mergers and closures lead to more tax avoidance. In a parallel study, Allen, Francis, Wu,
and Zhao (2016) examine the effect of analyst coverage on tax avoidance. We differ with
their study in two main aspects. First, our study uses a more comprehensive set of
measures of tax avoidance (5 measures of book-tax difference, 1 measure of tax sheltering,
and 3 measures of effective tax rates) along with many alternative matching criteria,
whereas their study uses effective tax rates as their main measure. Second, we explore in
detail the economic channels through which information asymmetry affects tax avoidance
by looking at existing tax planning capacity (e.g., tax haven presence), providing direct
evidence for the information production incentives of the analysts, and exploring industry
heterogeneity (i.e., differences between consumer-oriented industries and other
industries).
The remainder of the study is organized as follows: Section II presents the construction
of our sample and summary statistics. Section III describes our identification strategy and
presents the DID results. Section IV conducts further explorations of tax avoidance. Section
V provides additional robustness tests, and our conclusions are presented in Section VI.
II. Sample Construction and Summary Statistics
This section describes the construction of our sample and presents the summary
statistics for the major variables used in the study.
A. Sample Selection
To construct our sample, we first extract financial and accounting data from Compustat’s
13
North America Fundamentals Annual database for the 1999–2011 period. We choose listed
U.S. firms that are not financials or utilities, and that have the Center for Research in
Security Prices (CRSP) data. We eliminate firm-year observations for which information on
total assets is not available, and we also exclude observations with negative cash holdings,
sales, or total assets. Analyst coverage data are obtained from the Institutional Brokers’
Estimate System (IBES) database. We collect information about broker closures from IBES,
Factiva, and Kelly and Ljungqvist (2012) and information about broker mergers from the
SDC M&A database.
B. Measuring Tax Avoidance
Following the literature, we adopt 5 main measures of tax avoidance: total book-tax
difference (BTD), Desai and Dharmapala’s (2006) residual book-tax difference (DDBTD),
SHELTER, DTAX, and cash effective tax rate (CETR). The total book-tax difference is the
most commonly used measure of book-tax difference, calculated by book income less
taxable income standardized by lagged assets. Previous studies argue that total book-tax
gap does not necessarily reflect tax avoidance, and might partially capture earnings
management activities (e.g., Phillips, Pincus, and Rego (2003), Hanlon (2005)). Thus, we
follow Desai and Dharmapala (2006) and adjust book-tax difference for earnings
management by using an accruals proxy to isolate the component of the difference that is
due to earnings management (DDBTD). SHELTER measures an extreme form of tax
avoidance, tax sheltering. We estimate the probability that a firm uses a tax shelter using
Wilson’s (2009) tax sheltering model. DTAX is based on the work of Frank, Lynch, and Rego
(2009), who attempt to measure the discretionary portion of tax avoidance by removing

14
the underlying determinants of tax avoidance that are not driven by intentional tax
avoidance. CETR is the cash effective tax rate based on Chen et al. (2010), calculated as cash
taxes paid divided by pretax income. We use CETR as our main measure of effective tax rate
as it is less affected by changes in tax accounting accruals.16
In the robustness tests, we use 4 additional measures of tax avoidance: Manzon and
Plesko’s (2002) book-tax difference (MPBTD), ETR differential (ETRDIFF), effective tax rate
(ETR), and cash flow effective tax rate (CFETR). ETRDIFF is based on the measures given in
Frank et al. (2009) and Kim et al. (2011). ETR is the effective tax rate based on Zimmerman
(1983). Our final measure is CFETR, which is the cash flow effective tax rate, calculated as
cash taxes paid divided by operating cash flows. This measure only uses information from
the cash flow statements, which could further separate out the earnings management effect.
All of the detailed definitions and calculations are reported in Appendix A.
C. Measuring Analyst Coverage and Other Control Variables
Analyst information is obtained from IBES, and our major variable is the natural log of
the total number of analysts following the firm during the year. Following the tax avoidance
literature (e.g., Chen et al. (2010)), we include a vector of firm characteristics that could
affect corporate tax avoidance. These control variables include firm size (SIZE), Tobin’s Q
(Q), tangibility (PPE), foreign income (FI), leverage (LEV), ROA, NOL, ΔNOL, intangibility, 16 Note that we cannot use the long-term measure of tax effective rates (Dyreng, Hanlon, and
Maydew (2008)) as we find that our exogenous events are temporary shocks to the firms and the
effects disappear after 3 years, which is consistent with Derrien and Kecskes (2013). We discuss
this in detail in the persistence test in Section V.B.
15
and EQINC. Detailed information about the variable definitions is provided in Appendix A.
D. Summary Statistics
After merging the tax avoidance data with analyst coverage, our final sample consists of
23,475 firm-year observations from 5,401 publicly traded U.S. firms covering the 1999–
2011 period. We winsorize all of the parameters excluding the dummy variables at the 1st
and 99th percentiles to minimize the effect of outliers. Table 1 reports the descriptive
statistics on our measures of tax avoidance, analyst coverage, and other control variables
for this full sample prior to matching. For example, we find that the mean (median) value of
Desai and Dharmapala’s (2006) residual book-tax difference is 0.023 (0.004), and the mean
(median) value of the cash effective tax rate is 0.270 (0.256). The measures have significant
variations, as shown by their large standard deviations: 0.293 and 0.211, respectively.
[Table 1 about here]
III. Identification and Estimation Results
In untabulated results, we run regressions of our main measures of tax avoidance on the
number of analysts following the firm and other firm-level control variables, and find that
firms followed by a larger number of analysts practice less tax avoidance.17 A potential
concern in the interpretation of this result is that analyst coverage is likely to be
endogenous. Many studies have shown that analysts tend to cover higher quality firms
17 The regressions control for year and firm fixed effects, and standard errors are clustered at the
firm level. The results are available from the authors.

16
(Chung and Jo (1996)) and firms with less information asymmetry (e.g., Lang and
Lundholm (1996), Bhushan (1989)). Therefore, firms with certain levels of tax avoidance
and information asymmetry may attract more analyst coverage. In addition, unobservable
firm heterogeneity that is correlated with both analyst coverage and corporate decisions
and policies could also bias the estimation results. In this section, we introduce our
identification strategy and present our empirical tests by adopting a DID approach built on
broker merger and closure events.
A. Natural Experiments
Our identification strategy uses two natural experiments. The first one is brokerage
closure. As argued by Kelly and Ljungqvist (2012),18 broker closures provide an ideal
source of exogenous shocks to analyst coverage as these closures are mostly driven by
business strategy considerations of the brokers themselves and not correlated with firm-
specific characteristics. Therefore, such closures should only affect a firm’s tax avoidance
through their effect on the number of analysts covering the firm. The second natural
experiment is broker mergers, first adopted by Hong and Kacperczyk (2010) in their study
of how competition affects earnings forecast bias. As documented by Wu and Zang (2009),
when two brokerage firms merge, they typically fire analysts due to redundancy or cultural
clashes. Consequently, broker mergers also provide exogenous variations in analyst
coverage.
To identify broker closures, we use the IBES database to find a list of brokers who 18 Using closures as shocks to the supply of information, Kelly and Ljungqvist (2012) document the
importance of information asymmetry in asset pricing.

17
disappear from the database between 2000 and 2010, and then search Factiva to confirm
that the exit is due to closure. We also complement our sample with a list of brokerage
closures provided by Kelly and Ljungqvist (2012). The final sample consists of 30
brokerage closures. The construction of the broker merger sample follows Hong and
Kacperczyk (2010). We first collect broker merger events using Thomson Reuters SDC
M&A database, by searching for both the acquirer and target primary Standard Industrial
Classification (SIC) codes 6211 or 6282. We only consider completed deals and deals in
which 100% of the target is acquired. Then we manually match all of the acquirers and
targets with the names of brokerage houses in the IBES database. Our procedure produces
24 merger events.19 Together with the broker closure sample, our list of 54 broker exits is
similar to those of Kelly and Ljungqvist (2012) and Hong and Kacperczyk (2010)
combined.20
To obtain a sample of affected firms, we merge our final sample of broker exits with the
IBES unadjusted historical detail data set. For broker closures, we need the covered firms
to remain in the IBES sample in year t+1. For broker mergers, we restrict the firms to those
19 We select only those mergers where both merging houses analyze at least two of the same firms
(Hong and Kacperczyk (2010)). Note that Lehman is not in our sample, as it is not a suitable shock
for identification purpose, as also pointed out by Kelly and Ljungqvist (2012), because Barclays,
which had no U.S. equities business of its own, took over Lehman’s entire U.S. research department.
The data for Merrill Lynch and Bank of America are retrieved from data downloaded at an earlier
date, as their observations have been dropped from the current IBES database.
20 We examine whether our main results are driven by broker mergers or broker closures, and we
find no qualitative difference between the 2 groups.

18
that are covered by both the acquiring and target houses before the merger and continue to
be followed by the remaining broker after the merger. In addition, we choose listed U.S.
firms that are not financials or utilities, and that have CRSP and Compustat data in years
t−1 and t+1. Following recent studies (e.g., Derrien and Kecskes (2013)), we only keep the
firm-year observations of t−1 and t+1 to ensure that we capture only the direct effects of
the drop in analyst coverage. It is possible that in the long run the entry of other brokers
will make up for the diminished research or that the terminated analyst could find a job in
another brokerage house. Therefore, this setting enables us to make good use of short-term
deviations from the equilibrium in our analysis of how analyst coverage affects tax
avoidance.
B. Variable Description and Estimation Methodology
We match our sample of affected firms with our measures of tax avoidance. The final
sample consists of 1,415 firm-years for 1,031 unique firms (associated with 47 broker exits)
in the 1999–2011 period. Appendix B shows the number of broker exits and the
corresponding number of affected firms each year from 2000 to 2010. We find that there is
no obvious evidence of clustering in time and the exits are spread out evenly over the
sample period. On average, treated firms experience a 0.96 reduction in the number of
analysts. Firms in the top, median, and bottom quartiles all have precisely 1 analyst missing.
To investigate the effects of analyst coverage on corporate tax avoidance, we use a DID
matching estimator approach to minimize the concern that the variations in analyst
coverage and in tax avoidance are caused by cross-sectional or time-series factors that
affect both analyst coverage and avoidance. We use two matching strategies: Abadie and

19
Imbens’ (2006) matching and propensity score matching.
Abadie and Imbens’ (2006) matching estimator simultaneously minimizes the
Mahalanobis distance between a vector of observed matching covariates across treated and
non-treated firms.21 The primary matching variables include firm size (SIZE), Tobin’s Q (Q),
tangibility (PPE), foreign income (FI), and analyst coverage (COV) prior to broker
terminations. We also make sure that both the treatment firm and the control firm are in
the same Fama–French (1997) 48 industry and the data are from the same fiscal year.
Alternatively, we adopt the nearest-neighbor logit propensity score matching strategy
developed by Rosenbaum and Rubin (1983). The control pool is the remainder of the
Compustat universe that has analyst coverage and valid matching variables. We construct a
control sample of firms that are matched to the treated firms along a set of relevant firm
characteristics measured in the year prior to the broker exits. First, we estimate a logit
regression where the dependent variable equals 1 if a particular firm-year is classified as
treated, and 0 otherwise; our matching variables are the independent variables. We use a
panel of 1,415 treatment firm-years and the remainder of the Compustat universe of
premerger firm-years with analyst coverage and valid matching variables. Second, the
estimated coefficients are used to predict the propensity scores of treatment, which are
then used to perform a nearest-neighbor match.
To measure the effect of the decrease in analyst coverage on tax avoidance, we compare,
for each matching approach, the differences in tax avoidance for treated firm i 21 The Abadie and Imbens’ (2006) matching estimator approach has been used by, among others,
Campello, Graham, and Harvey (2010) and Campello and Giambona (2013).

20
(∆TAX_AVOIDANCE𝑖𝑖TREATED) between 1 year after the broker exit and 1 year prior to the
exit, to the differences of its matched control firm (∆TAX_AVOIDANCE𝑖𝑖CONTROL) for the
same years. We then take the mean of the DID across all of the firms in our sample.
Specifically, the average treatment effect of the treatment group (DID) is calculated as:
(1) DID(TAX_AVOIDANCE) =
1𝑁𝑁∑ ∆TAX_AVOIDANCE𝑖𝑖TREATED −𝑁𝑁𝑖𝑖=1 1
𝑁𝑁∑ ∆TAX_AVOIDANCE𝑖𝑖CONTROL𝑁𝑁𝑖𝑖=1 ,
where N refers to the number of treatment and control firms.
C. Estimation Results
Table 2 presents the DID estimation results. Panel A reports the summary statistics for
the matched samples prior to broker terminations. The balance test shows that the
treatment firms and the control firms are similar across all of the matching variables in the
pre-event year, ensuring that the change in tax avoidance is caused only by the drop in
analyst coverage.
[Table 2 about here]
A key identifying assumption central to our DID estimation results is that treatment and
control firms share parallel trends in tax avoidance prior to broker events. Following
Kausar, Shroff, and White (2016), we conduct a parallel trend test, and the results shown in
Panel B of Table 2 indicate that the pre-treatment trends in our measures of tax avoidance
are indeed indistinguishable for both t−1 and t−2.

21
In Panel C of Table 2, we present the DID results using Abadie and Imbens’ (2006)
matching estimator. Panel D presents the results using a nearest-neighbor logit propensity
score matching estimator. The dependent variables are our main measure of tax avoidance.
Higher values for the first 4 measures (BTD, DDBTD, SHELTER, and DTAX) indicate more
tax avoidance, whereas a lower value for the last measure (CETR) suggests more tax
avoidance. Using the Abadie and Imbens (2006) matching, we find that 4 of the tax
avoidance measures are consistent with our expectation that tax avoidance increases
significantly, relative to matched control firms, after a firm loses an analyst. These results
are not only statistically but also economically significant. Specifically, after a broker
closure or merger, BTD increases 2.3 percentage points over that of the control firms
(significant at the 5% level), holding everything else constant.22 Treated firms’ CETR drops
by at least 0.9 percentage points relative to the control firms that do not experience a
reduction in analyst coverage, which is 3.3% of the sample mean of CETR prior to broker
exits. The direction of the DID estimate of SHELTER is correct, but it is insignificant at
conventional significance levels, as shown in Panel C. This is not surprising, as it measures
an extreme form of tax avoidance (e.g., Hanlon and Heitzman (2010), Kim et al. (2011)). We
find that all of the main mean DIDs are highly significant when we use propensity score
matching. Note that even the DID estimate of SHELTER becomes significant at the 10%
level. In Section IV.A, we show that SHELTER is positive and statistically significant for
firms that already have a presence in tax havens, indicating that firms with subsidiaries in
22 Shevlin (2002) argues that one must be cautious when drawing inferences about the levels and
trends in tax avoidance based on book-tax differences. The consistent results we achieve using
alternative measures relax this concern.

22
tax havens more rapidly engage in tax sheltering following an increase in information
asymmetry.
Based on the sample in Panel D of Table 2, we further rerun our DID estimation using a
regression framework, and report our results in Panel E. POST denotes a dummy variable
that is equal to 1 in the period after the broker exit, and 0 otherwise. TREAT is a dummy
variable that indicates if a company is part of our treatment sample. We include firm fixed
effects in our regressions to capture unobservable and time-invariant firm characteristics.
We include industry-year fixed effects in all of our regressions to capture industry time
trends. We further include broker-year fixed effects to capture all the time-variant broker-
specific characteristics. In columns 6–10 of Panel E, we also control for our matching
variables.23 Standard errors are clustered at the firm level. We find that across all of the
regression specifications, our previous DID results hold.24
23 In untabulated results, we find that the results are similar if we include all of the control variables
as in the literature. We also find that the results do not change qualitatively if we cluster standard
errors by firm and year (double clustering), or by broker and year. These results are available from
the authors.
24 In later analyses, we focus on our original DID matching estimator in model (1). Compared to a
standard DID regression estimator, this strategy offers more flexible and non-linear functional
forms. We can also use Abadie and Imbens (2006) matching to do non-parametric estimation.
Furthermore, it could easily accommodate to different matching criteria. In addition, most of the
studies using this broker merger and/or closure setting adopt the same estimation approach, such
as Hong and Kacperczyk (2010), Derrien and Kecskes (2013), He and Tian (2013), and Chen et al.
(2015), etc. Nevertheless, we make sure that our results are robust to the regression approach.

23
The significant effect of changes in analyst coverage due to brokerage exit is consistent
with previous studies that use the same natural experiments of broker mergers and
closures (e.g., Kelly and Ljungqvist (2012), Fong, Hong, Kacperczyk, and Kubik (2014)).
Moreover, as we discuss in Section IV.B, we reestimate our results by partitioning the
whole sample into subsamples of low or high analyst coverage before brokerage exit, and
find that the increase in tax avoidance is largely driven by the subsample of firms with
initial low analyst coverage, where the effect of an individual analyst is larger (firms lose
about 20% of their analysts on average).25
D. Robustness Test: Alternative Measures of Tax Avoidance and Alternative
Matching Methods
We conduct a battery of robustness tests for our DID analysis. We first use 4 alternative
measures of tax avoidance to check whether our results are robust. Among them, ETRDIFF
measures the permanent portion of tax avoidance (Frank et al. (2009)), ETR is the rate that
affects accounting earnings, and CFETR further removes the effect of earnings accruals. We
redo the DID analysis using these measures. Appendix C reports the results. Panel A of
Table C1 shows the results using Abadie and Imbens (2006) matching, whereas Panel B
reports the results using propensity score matching. We find that across all of our
additional measures of tax aggressiveness, all of the DID estimates are statistically
25 In addition, we find that the broker exits strongly affect the information production incentives of
the remaining analysts by reducing competition, resulting in reports with lower information
content and more biased forecast estimates. These combined effects further amplify the effects of a
drop in analyst coverage. These results are not tabulated and available from the authors.

24
significant, except ETR with propensity score matching.
We then check the robustness of our results by using alternative combinations of
matching variables. The results are presented in Table 3. We focus on 4 major measures of
tax avoidance (BTD, DDBTD, DTAX, and CETR), but the results on other measures are
qualitatively similar. We begin with a simple matching that merely requires both treated
and control firms to have valid information about measures of tax avoidance and analyst
coverage. DID estimates of BTD, DDBTD, and DTAX are all significant and positive, whereas
CETR is negative and statistically significant. We then match firms by pre-event BTD and
analyst coverage. Firms with aggressive tax planning might differ from other firms in
dimensions that are not fully captured by our matching variables, so we include a pre-event
BTD level. We find that the results presented in the second row are similar to those
reported above. We further add matching criteria step by step until we include all of the
control variables as suggested in the literature (e.g., Chen et al. (2010)). We find that our
results are robust to these combinations of matching variables. Indeed, of the 28 models
presented in Table 3, only one DID estimate (DTAX), in row 6, is statistically insignificant at
conventional levels.
[Table 3 about here]
IV. Further Explorations of Corporate Tax Avoidance
In this section, we examine the factors that affect the relationship between analyst
coverage and tax avoidance, and how the effects on avoidance can be mitigated or
exacerbated. We concentrate on firms’ existing tax planning capacity (e.g., tax haven

25
presence), initial analyst coverage, industry type (consumer oriented or not), tax authority
monitoring, and the number of peer firms.
A. Existing Tax Planning Capacity
The results reported above suggest that managers are likely to take immediate short-
term opportunistic actions and avoid tax more aggressively when there is an increase in
information asymmetry between firms and investors. This interpretation of the data is
based on the underlying assumption that mangers have the ability to change tax planning
quickly. Previous studies (e.g., Desai and Dharmapala (2006), Chen et al. (2010), and
Hanlon and Heitzman (2010)) have identified several techniques for tax avoidance such as
investing in a municipal bond, transfer pricing, or using tax shelters. It is possible that
many firms have unused existing tax planning capacity; for example, they may have
complicated financial structures, own entities in tax havens, be familiar with transfer
pricing practices, etc. When information asymmetry is low, firms may not engage in much
aggressive tax planning However, an increase in information asymmetry caused by drops
in analyst coverage may provide a good opportunity for managers to incrementally use
firms’ available tax planning capacity. For instance, firms could effectively hide earnings
using their complicated financial structure, or could shelter more earnings in their entities
in tax havens. We directly test this hypothesis by dividing the sample into subsamples of
firms with high and low tax planning capacity prior to the broker exit events. We use 2
distinct sets of measures of existing tax planning capacity: i) the number of segments and
whether the firm is multinational; and ii) firms’ presence in tax havens.
The sample is first partitioned into subsamples according to the number of segments in

26
a firm or whether the firm is a multinational corporation. Intuitively, firms with a greater
number of business segments should have a complicated financial structure and be able to
more rapidly engage in aggressive tax planning activities (e.g., Desai and Dharmapala
(2006), Hanlon and Heitzman (2010)). We also look at whether the firm is multinational, as
multinational firms might have more mechanisms for avoiding taxes such as shifting profits
to low-tax foreign subsidiaries, shifting debt to high-tax jurisdictions, seeking offshore tax
havens, and related-party transactions with foreign subsidiaries (e.g., Chen et al. (2010),
Gravelle (2010)). The firms in the high number of segments subsample are in the top
tercile for number of segments, and firms in the low number of segments subsample are in
the bottom tercile in terms of number of segments. The data for the number of segments
come from Compustat’s Business Segment files. A firm is defined as multinational if it
realizes a positive foreign income in a specific year. Panel A of Table 4 presents the results.
[Table 4 about here]
As shown in Panel A of Table 4, we find that for both of the 2 measures of tax planning
capacity, the effect of the change in analyst coverage is more pronounced in the subset of
firms that had higher tax planning capacity prior to the broker merger or closure events.
Next we look at one specific mechanism through which these aggressive tax avoidance
activities are accomplished—tax haven presence prior to the broker exits. As subsidiary
locations are given in the Exhibit 21 in firms’ annual reports, we explore 3 measures of
firms’ presence in tax havens: Tax Haven, Haven Subsidiaries, and Haven Country Presence.
Tax Haven is an indicator variable that equals 1 if a firm has at least one tax haven presence
in a specific year, and 0 otherwise. Haven Subsidiaries is the total number of distinct tax

27
haven subsidiaries, and Haven Country Presence is the number of distinct tax haven
countries in which at least one subsidiary is located. We collect this information as in
Dyreng and Lindsey (2009). It is worth noting that analysts have access to this information
and may have fully analyzed firm’ sheltering behavior; therefore, firms with intensive
coverage from analysts might not fully use their capacity in tax havens. With a reduction in
analyst coverage, we expect that firms with tax haven presence, larger numbers of tax
haven subsidiaries, or a presence in more tax haven countries will avoid tax more
aggressively. Panel B of Table 4 presents the subsample results.
As expected, we find that our results are only significant in the subsample of firms with
all three types of tax haven presence. The estimates in the subsample with tax haven
presence, greater numbers of haven subsidiaries, or more haven countries are much larger
as well. The large DID estimates for the probability of using tax shelters in the tax haven
presence subsample is consistent with the estimation for the multinational firms
subsample, supporting the observation that firms with existing sheltering capacity are
more likely to take advantage of this capacity after an increase in information asymmetry.
B. Initial Analyst Coverage Before Broker Terminations
In this section, we look at the level of analyst coverage before broker terminations. To
be consistent with our information hypothesis, an intuitive prediction is that a loss of 1 of 5
analysts should have more effect than the loss of 1 of 15 analysts (Hong and Kacperczyk
(2010)). We first divide the whole sample into low and high initial analyst coverage
subsamples, and expect that the effects will be more pronounced in the low initial analyst
coverage firms. The initial analyst coverage subsample results are reported in Table 5.

28
[Table 5 about here]
We present the results for all 5 main measures of tax avoidance. In columns 1 and 2 of
Table 5, we partition the sample using arbitrary “low” and “high” numbers of analysts
following the firm before broker terminations: 5 and 15, respectively. Columns 3 and 4
divide the sample according to terciles sorted on initial analyst coverage. We further
consider excessive analyst coverage in columns 5 and 6, to alleviate the concern that
analyst coverage might capture the size effect or other characteristics of the firm. We
calculate the excessive analyst coverage by the residuals from a regression of analyst
coverage on firm size, lagged ROA, asset growth, external financing activities, cash flow
volatility, and year dummies (Yu (2008)). As shown in Panel A, we find that our DID
estimate is only statistically significant in the low analyst coverage subsample at
conventional significance levels for 4 out of 5 measures of tax avoidance, for both sample
division criteria. In regard to excessive analyst coverage, we find that our DID estimate is
only significant in the low excessive analyst coverage subsample for all 5 measures of tax
avoidance. These estimates are larger in magnitude than those in the whole sample
estimations. These results confirm our hypothesis that the large effect of a reduction in
analyst coverage is mainly driven by low initial analyst coverage firms.26
26 We further look at the summary statistics of the firms with low initial analyst coverage. One
possible concern is that if they are loss-making firms, we would expect to learn little about tax
avoidance. We find that the mean ROA of this subset of firms is 5.94%, indicating that they are in
general generating positive earnings, alleviating our concern that they avoid taxes because of poor
financial situations, rather than a higher degree of information asymmetry.

29
C. Firms in Consumer-Oriented Industries
Previous studies suggest that tax avoidance can create reputation concerns for firms in
consumer-oriented industries where customer perception is important (e.g., Hanlon and
Slemrod (2009), Graham et al. (2014)). Specifically, Graham et al. (2014) provide evidence
suggesting that although firms benefit from avoiding taxes, if tax avoidance hurts a firm’s
overall reputation among customers it is more cautious in tax avoidance behavior. In this
section, we directly test whether the significant effect of analyst coverage is stronger in
consumer-oriented industries.
Specifically, we divide the sample into retail industries and other industries and redo
our DID estimations. Retail industries include the firms with SIC codes ranging from 5200
to 5999. Table 6 presents the subsample analysis. We find that the DID estimates are more
statistically significant and more economically pronounced in the subset of firms in retail
industries. Out of our 5 measures of tax avoidance, 3 measures are only significant in retail
industries. In terms of economic significance, the coefficients of 3 measures in the retail
industries subsample approximately double the coefficients in the other industries
subsample. Taken together, the results indicate that the strong effect of analyst coverage on
tax avoidance is concentrated in consumer-oriented industries, which is consistent with
our expectation that information asymmetry has more effect on the tax avoidance behavior
of firms that value their reputation highly.
[Table 6 about here]
D. Tax Authority Monitoring and Enforcement

30
In this section, we examine how tax authority monitoring and enforcement influence the
relationship between analyst coverage and tax avoidance. One reasonable prediction is that
firms facing lower IRS monitoring would avoid tax more aggressively after a reduction of
analyst coverage due to lower risks. Following Hanlon, Hoopes, and Shroff (2014), we
define tax authority monitoring as the probability of an IRS audit measured by the ex-post
realizations of actual face-to-face audits. Specifically, we capture managers’ perception of
audit probability, measured by the annual number of audits by the IRS standardized by the
total number of returns in the previous fiscal year for a specific asset size group.27 The data
come from the Transactional Records Access Clearinghouse (TRAC).
We conduct subsample tests and report the results in Table 7. Consistent with our
expectation, we find that the effect of a reduction in analyst coverage on tax avoidance only
exists in the subsample of firms where IRS monitoring is low. These results further
strengthen our findings by showing the interaction between IRS monitoring and analyst
coverage.
[Table 7 about here]
E. Number of Peer Firms
In a survey of 169 CFOs, Dichev, Graham, Harvey, and Rajgopal (2013) find that peer-
firm comparisons are one of the most important sources for detecting earnings
27 Ideally this test would also use district variations in IRS monitoring, but the IRS stopped
providing district level data in 2000, the year our sample starts. Therefore, we focus on variations
in fiscal year and asset size.
31
management. Similarly, a reasonable prediction is that firms with many peer firms that
disclose information might be less affected by a reduction in analyst coverage, as investors
could use peer firms as an alternative information source about tax aggressiveness. We
empirically test this using the methodology in Badertscher, Shroff, and White (2013).
Specifically, we analyze subsamples categorized by the number of peers a firm has in its
primary industry, based on 4-digit SIC codes. The results are presented in Table 8.
[Table 8 about here]
In Table 8, the sample is divided into subsamples according to the number of peer firms.
We find supporting evidence that the effect of analyst coverage is indeed more pronounced
in the subsample of firms with fewer peers. These results lend further support to our
information story.
In sum, we show that analyst coverage reduces corporate tax avoidance, and the link
between analyst coverage and tax avoidance further depends on existing tax planning
capacity, initial level of analyst coverage, the number of peers, reputational concerns, and
tax authority monitoring.
V. Additional Robustness Checks
Overall, the results confirm our hypothesis that analyst coverage reduces corporate tax
avoidance. This hypothesis is strongly supported by our baseline regressions and DID
analysis using our natural experiments. In this section, we provide additional robustness
checks and a persistence test.

32
A. Persistence Test
In the preceding analyses, we directly test the effects of a decrease in analyst coverage
by comparing our measures of tax avoidance from 1 year prior to the brokerage exit (t−1)
to 1 year after the brokerage exit (t+1). It is not clear whether the increase in information
asymmetry is permanent. However, even if the change in the information environment is
not permanent, managers might still take advantage of this short period of increased
information asymmetry. This is consistent with the findings in Section IV.B that firms with
more unused tax planning capacity are more likely to aggressively avoid tax. The presence
of this short-term opportunistic behavior is also supported by other studies using the same
natural experiments of broker exits. For example, Derrien and Kecskes (2013) find that
firms change investment, financing, and payout decisions after broker exits.
In further tests we examine the long-term effect of the broker exits. We find that most of
our treatment firms regain their analyst coverage after 3 years. This is consistent with
Derrien and Kecskes (2013), who find that the shocks to analyst coverage due to broker
exits are one-time temporary decreases. We compare our tax avoidance variables 3 years
(t+3 vs. t−1) and 5 years (t+5 vs. t−1) after and 1 year prior to the shock in our tests, and
find no significant results. These findings suggest that managers observing a drop in
analyst coverage caused by broker exists are likely to take more aggressive tax planning
strategies immediately, to take full advantage of this short-window of opportunity and
incrementally use their tax planning capacity.
B. Other Potential Mechanisms
We find that after a reduction in analyst coverage, firms avoid taxes more aggressively,

33
and the effect is driven by the subset of the firms that have low initial analyst coverage and
a smaller number of peers prior to the broker exits. These findings are all consistent with
our information asymmetry hypothesis. Balakrishnan, Billings, Kelly, and Ljungqvist (2014)
find that some firms voluntarily disclose more information to shareholders in response to
exogenous decreases in analyst coverage, but this pattern only exists for a very small
proportion of firms (4.9% in their sample). We further test the robustness of our results by
excluding firms that increase voluntary disclosure, and find our previous findings are
maintained.28
VI. Concluding Remarks
In this study, we examine the effect of information asymmetry, as measured by analyst
coverage, on corporate tax avoidance. Using changes in analyst coverage caused by broker
closures and mergers, we find that when a firm experiences a decrease in analyst coverage,
it engages in more tax avoidance activities relative to similar firms that do not experience a
reduction in analyst coverage. This suggests a strong negative effect of analyst coverage on
tax avoidance. We further find that the effects are mainly driven by the firms with more
existing tax planning capacity, smaller initial analyst coverage, and a smaller number of
peer firms. Moreover, the effects are more pronounced in firms in consumer-oriented
industries and firms facing lower levels of monitoring from tax authorities. Overall, our
28 The data of management forecast come from the Company Issued Guidance section in the First
Call Historical Database (FCHD) by Thompson Reuters. The results are not tabulated here but are
available from the authors.

34
findings suggest that financial analysts help reduce the information asymmetry between
firms and investors, and as a consequence reduce corporate tax avoidance.

35
References
Abadie, A., and G. W. Imbens. “Large Sample Properties of Matching Estimators for Average
Treatment Effects.” Econometrica, 74 (2006), 235−267.
Allen, A. C.; B. B. Francis; Q. Wu; and Y. Zhao. “Analyst Coverage and Corporate Tax
Aggressiveness.” Working Paper, University of Nebraska-Lincoln (2016).
Armstrong, C. S.; J. L. Blouin; and D. F. Larcker. "The Incentives for Tax Planning." Journal of
Accounting and Economics, 53 (2012), 391−411.
Ayers, B. C.; J. Jiang; and S. K. Laplante. "Taxable Income as a Performance Measure: The
Effects of Tax Planning and Earnings Quality." Contemporary Accounting Research, 26
(2009), 15−54.
Badertscher, B.; N. Shroff; and H. D. White. "Externalities of Public Firm Presence: Evidence
from Private Firms' Investment Decisions." Journal of Financial Economics, 109 (2013),
682−706.
Balakrishnan, K.; J. L. Blouin; and W. R. Guay. “Does Tax Aggressiveness Reduce Corporate
Transparency?” Working Paper, London Business School (2012).
Balakrishnan, K.; M. B. Billings; B. Kelly; and A. Ljungqvist. "Shaping Liquidity: On the
Causal Effects of Voluntary Disclosure." Journal of Finance, 69 (2014), 2237–2278.
Beck, T.; C. Lin; and Y. Ma. "Why Do Firms Evade Taxes? The Role of Information Sharing
and Financial Sector Outreach." Journal of Finance, 69 (2014), 763–817.
Bhushan, R. “Firm Characteristics and Analyst Following.” Journal of Accounting and
Economics, 121 (1989), 255–274.
Campello, M., and E. Giambona. "Real Assets and Capital Structure." Journal of Financial and
Quantitative Analysis, 48 (2013), 1333–1370.

36
Campello, M.; J. R. Graham; and C. R. Harvey. "The Real Effects of Financial Constraints:
Evidence from a Financial Crisis." Journal of Financial Economics, 97 (2010), 470–487.
Chen, S.; X. Chen; Q. Cheng; and T. Shevlin. "Are Family Firms More Tax Aggressive Than
Non-Family Firms?" Journal of Financial Economics, 95 (2010), 41–61.
Chen, T.; J. Harford; and C. Lin. "Do Analysts Matter for Governance? Evidence from Natural
Experiments." Journal of Financial Economics, 115 (2015), 383–410.
Chung, K. H., and H. Jo. "The Impact of Security Analysts' Monitoring and Marketing
Functions on the Market Value of Firms." Journal of Financial and Quantitative
Analysis, 31 (1996), 493–512.
Chyz, J. A.; W. S. C. Leung; O. Z. Li; and O. M. Rui. "Labor Unions and Tax Aggressiveness."
Journal of Financial Economics, 108 (2013), 675–698.
Comprix, J.; R. C. Graham; and J. A. Moore. "Empirical Evidence on the Impact of Book-Tax
Differences on Divergence of Opinion among Investors." Journal of the American
Taxation Association, 33 (2011), 51–78.
Crocker, K. J., and J. Slemrod. "Corporate Tax Evasion with Agency Costs." Journal of Public
Economics, 89 (2005), 1593–1610.
DeBacker, J.; B. T. Heim; and A. Tran. "Importing Corruption Culture from Overseas:
Evidence from Corporate Tax Evasion in the United States." Journal of Financial
Economics, 117 (2015), 122–138.
Derrien, F., and A. Kecskes. "The Real Effects of Financial Shocks: Evidence from Exogenous
Changes in Analyst Coverage." Journal of Finance, 68 (2013), 1407–1440.
Desai, M. A., and D. Dharmapala. "Corporate Tax Avoidance and High-Powered Incentives."
Journal of Financial Economics, 79 (2006), 145–179.

37
Desai, M. A., and D. Dharmapala. "Corporate Tax Avoidance and Firm Value." Review of
Economics and Statistics, 91 (2009a), 537–546.
Desai, M. A., and D. Dharmapala. “Earnings Management, Corporate Tax Shelters, and Book-
Tax Alignment.” National Tax Journal, 62 (2009b), 169–186.
Desai, M. A.; A. Dyck; and L. Zingales. "Theft and Taxes." Journal of Financial Economics, 84
(2007), 591–623.
Dichev, I. D.; J. R. Graham; C. R. Harvey; and S. Rajgopal. "Earnings Quality: Evidence from
the Field." Journal of Accounting and Economics, 56 (2013), 1–33.
Dyreng, S. D.; M. Hanlon; and E. L. Maydew. "Long-Run Corporate Tax Avoidance."
Accounting Review, 83 (2008), 61–82.
Dyreng, S. D.; M. Hanlon; and E. L. Maydew. "The Effects of Executives on Corporate Tax
Avoidance." Accounting Review, 85 (2010), 1163–1189.
Dyreng, S. D., and B. P. Lindsey. "Using Financial Accounting Data to Examine the Effect of
Foreign Operations Located in Tax Havens and Other Countries on U.S. Multinational
Firms' Tax Rates." Journal of Accounting Research, 47 (2009), 1283–1316.
Fama, E. F., and K. R. French. “Industry Costs of Equity.” Journal of Financial Economics, 43
(1997), 153–194.
Fong, K. Y. L.; H. G. Hong; M. T. Kacperczyk; and J. D. Kubik. 2014. “Do Security Analysts
Discipline Credit Rating Agencies?” AFA 2013 San Diego Meetings Paper (2014).
Frank, M. M.; L. J. Lynch; and S. O. Rego. "Tax Reporting Aggressiveness and Its Relation to
Aggressive Financial Reporting." Accounting Review, 84 (2009), 467–496.
Graham, J. R.; M. Hanlon; T. Shevlin; and N. Shroff. "Incentives for Tax Planning and
Avoidance: Evidence from the Field." Accounting Review, 89 (2014), 991–1023.

38
Gravelle, J. “Tax Havens: International Tax Avoidance and Evasion.” Congressional Research
Service Report for Congress (2010).
Hanlon, M. "The Persistence and Pricing of Earnings, Accruals, and Cash Flows When Firms
Have Large Book-Tax Differences." Accounting Review, 80 (2005), 137–166.
Hanlon, M., and S. Heitzman. "A Review of Tax Research." Journal of Accounting and
Economics, 50 (2010), 127–178.
Hanlon, M.; J. L. Hoopes; and N. Shroff. "The Effect of Tax Authority Monitoring and
Enforcement on Financial Reporting Quality." Journal of the American Taxation
Association, 36 (2014), 137–170.
Hanlon, M.; E. L. Maydew; and J. R. Thornock. "Taking the Long Way Home: U.S. Tax Evasion
and Offshore Investments in U.S. Equity and Debt Markets." Journal of Finance, 70
(2015), 257–287.
Hanlon, M., and J. Slemrod. "What Does Tax Aggressiveness Signal? Evidence from Stock
Price Reactions to News About Tax Shelter Involvement." Journal of Public Economics,
93 (2009), 126–141.
Hasan, I.; C. K. Hoi; Q. Wu; and H. Zhang. "Beauty Is in the Eye of the Beholder: The Effect of
Corporate Tax Avoidance on the Cost of Bank Loans." Journal of Financial Economics,
113 (2014), 109–130.
He, J., and X. Tian. "The Dark Side of Analyst Coverage: The Case of Innovation." Journal of
Financial Economics, 109 (2013), 856–878.
Hong, H., and M. Kacperczyk. "Competition and Bias." Quarterly Journal of Economics, 125
(2010), 1683–1725.
39
Hoopes, J. “Financial Accounting Consequences of Temporary Tax Law: Evidence from The
R&D Tax Credit.” Working Paper, Ohio State University (2014).
IRS. “IRS Releases 2006 Tax Gap Estimates.” FS-2012-6 (2012).
Johnson, S.; D. Kaufmann; J. McMillan; and C. Woodruff. "Why Do Firms Hide? Bribes and
Unofficial Activity after Communism." Journal of Public Economics, 76 (2000), 495–520.
Johnson, S.; D. Kaufmann; and P. Zoido-Lobatón. "Regulatory Discretion and the Unofficial
Economy." American Economic Review, 88 (1998), 387–392.
Jones, J. “Earnings Management during Import Relief Investigations.” Journal of Accounting
Research, 29(1991), 193–228.
Kausar, A.; N. Shroff; and H. White. "Real Effects of the Audit Choice." Journal of Accounting
and Economics, 62 (2016), 157–181.
Kelly, B., and A. Ljungqvist. "Testing Asymmetric-Information Asset Pricing Models." Review
of Financial Studies, 25 (2012), 1366–1413.
Kerr, J. N. “The Real Effects of Asymmetry: Evidence from Tax Avoidance.” Working Paper,
Columbia Business School (2012).
Kim, J.-B.; Y. Li; and L. Zhang. "Corporate Tax Avoidance and Stock Price Crash Risk: Firm-
Level Analysis." Journal of Financial Economics, 100 (2011), 639–662.
Lang, M., and R. Lundholm. “Corporate Disclosure Policy and Analyst Behavior.” Accounting
Review, 71 (1996), 467–492.
Lisowsky, P.; L. Robinson; and A. Schmidt. "Do Publicly Disclosed Tax Reserves Tell Us
About Privately Disclosed Tax Shelter Activity?" Journal of Accounting Research, 51
(2013), 583–629.

40
Manzon, G., and G. Plesko. “The Relation Between Financial and Tax Reporting Measures of
Income.” Tax Law Review, 55 (2002), 175–214.
Matsunaga, S.; T. Shevlin; and D. Shores. "Disqualifying Dispositions of Incentive Stock
Options: Tax Benefits versus Financial Reporting Costs." Journal of Accounting
Research, 30 (1992), 37–68.
Maydew, E. “Tax-Induced Earnings Management by Firms with Net Operating Losses.”
Journal of Accounting Research, 35 (1997), 83−96.
McGuire, S. T.; D. Wang; and R. J. Wilson. "Dual Class Ownership and Tax Avoidance."
Accounting Review, 89 (2014), 1487–1516.
Phillips, J.; M. Pincus; and S. O. Rego. "Earnings Management: New Evidence Based on
Deferred Tax Expense." Accounting Review, 78 (2003), 491–521.
Plumlee, M. A. "The Effect of Information Complexity on Analysts' Use of That Information."
Accounting Review, 78 (2003), 275–296.
Rosenbaum, P. R., and D. B. Rubin. "The Central Role of the Propensity Score in
Observational Studies for Causal Effects." Biometrika, 70 (1983), 41–55.
Scholes, M., and Wolfson, M. Taxes and Business Strategy: A Planning Approach. Englewood
Cliffs, NJ: Prentice-Hall, Inc (1992).
Shevlin, T. “Commentary: Corporate Tax Shelters and Book-Tax Differences.” Tax Law
Review, 55 (2002), 427–443.
Shevlin, T.; O. Urcan; and F. Vasvari. “Corporate Tax Avoidance and Public Debt Costs.”
Working Paper, University of California Irvine (2013).

41
U.S. General Accounting Office. “Comparison of the Reported Tax Liabilities of Foreign- and
U.S.-Controlled Corporations, 1998-2005.” GAO-08-957, Washington, DC: U.S.
Government Printing Office (2008).
Wilson, R. J. "An Examination of Corporate Tax Shelter Participants." Accounting Review, 84
(2009), 969–999.
Wu, J. S., and A. Y. Zang. "What Determine Financial Analysts' Career Outcomes During
Mergers?" Journal of Accounting and Economics, 47 (2009), 59–86.
Yu, F. "Analyst Coverage and Earnings Management." Journal of Financial Economics, 88
(2008), 245–271.
Zimmerman, J. L. “Taxes and Firm Size.” Journal of Accounting and Economics, 5 (1983),
119–49.

42
TABLE 1
Summary Statistics for the Full Sample prior to Matching
Table 1 presents descriptive statistics on measures of tax avoidance, analyst coverage, and
firm characteristics for the full sample used in the paper prior to matching. Our sample
consists of 23,475 firm-years from 5,401 publicly traded U.S. firms covering the 1999–
2011 period. BTD, the total book-tax difference, is calculated by book income less taxable
income scaled by lagged assets (AT). Book income is the pretax income (PI) in year t.
DDBTD is Desai and Dharmapala’s (2006) residual book-tax difference. SHELTER is the
estimated probability that a firm uses a tax shelter based on Wilson’s (2009) tax sheltering
model. DTAX is based on Frank, Lynch, and Rego (2009). CETR is the cash effective tax rate
based on Chen et al. (2010), calculated as cash taxes paid (TXPD) divided by pretax income
(PI). MPBTD is Manzon and Plesko’s (2002) book-tax difference, which is calculated by U.S.
domestic book income less U.S. domestic taxable income less state tax income (TXS) less
other tax income (TXO) less equity in earnings (ESUB) scaled by lagged assets (AT). ETR is
the effective tax rate as calculated by Zimmerman (1983). CFETR is cash flow effective tax
rate, calculated as cash taxes paid (TXPD) divided by operating cash flows (OANCF).
ln(COVERAGE) is the natural log of the total number of stock analysts following the firm
during the year. Other variable definitions are given in Appendix A.

43
TABLE 1 (continued)
Variables Mean Std. Dev. Q1 Median Q3 N Measures of Tax Avoidance
BTD -0.062 0.421 -0.053 0.008 0.046 23,475 DDBTD 0.023 0.294 -0.036 0.004 0.061 20,421 SHELTER 0.152 3.846 -0.934 0.739 2.346 18,572 DTAX 0.031 0.441 -0.019 0.025 0.111 18,853 CETR 0.270 0.211 0.116 0.256 0.361 14,836 MPBTD -0.128 0.433 -0.095 -0.004 0.028 23,404 ETRDIFF -0.123 0.435 -0.076 0.002 0.020 23,343 ETR 0.267 0.255 0.045 0.227 0.388 16,395 CFETR 0.211 0.244 0.009 0.137 0.317 19,161
Analyst Coverage ln(COVERAGE) 1.421 0.943 0.693 1.447 2.150 23,475
Firm Characteristics Firm size (SIZE) 6.121 1.907 4.868 6.089 7.303 23,475
Tobin’s Q (Q) 2.438 2.307 1.223 1.729 2.734 23,475 Tangibility (PPE) 0.443 0.369 0.156 0.333 0.641 23,475 Foreign income (FI) 0.008 0.030 0.000 0.000 0.005 23,475 ROA 0.025 0.321 0.016 0.114 0.175 23,475 Leverage (LEV) 0.166 0.216 0.000 0.085 0.265 23,475 NOL 0.662 0.473 0.000 1.000 1.000 23,475 ΔNOL 8.746 47.195 0.000 0.000 0.058 23,475 EQINC 3.216E-04 0.005 0.000 0.000 0.000 23,475 Intangibility (INTAN) 0.209 0.284 0.006 0.099 0.306 23,475

44
TABLE 2
DID Analysis of Tax Avoidance
Table 2 presents the main DID estimates for our measures of tax avoidance following broker
closures or broker mergers. The sample consists of 1,415 treated firms that experienced a
reduction in analyst coverage between 2000 and 2010 and the same number of control firms.
Control firms are a subset of the non-treated firms selected as the closest match to the treated
firms, based on a set of firm characteristics, in the year before the broker termination. Both groups
of firms are publicly traded non-finance and non-utility firms. Panel A of Table 2 reports the
summary statistics for the matched samples prior to broker terminations, based on Abadie and
Imbens’ (2006) bias-corrected average treated effect matching estimator. The matching variables
include firm size (SIZE), Tobin’s Q (Q), tangibility (PPE), foreign income (FI), analyst coverage
(COV), Fama–French (1997) 48 industry, and fiscal year. Panel B reports the parallel trends in
measures of tax avoidance 1 year and 2 years prior to the broker exits. Panel C reports the DID
results using Abadie and Imbens’ (2006) matching estimator. Panel D reports the DID results for
tax avoidance using the nearest-neighbor logit propensity score matching estimator. SIZE is the
natural log of the market value of equity (CSHO × PRCC_F). Q is calculated as the market value of
assets over book value of assets, (AT − CEQ + CSHO × PRCC_F)/AT, and PPE is defined as property,
plant, and equipment (PPEGT) divided by total assets. FI is calculated as foreign income (PIFO)
divided by total assets (AT), and COV is the total number of stock analysts following the firm
during the year. Other variable definitions are given in Appendix A. Panel E shows the DID results
using a regression framework. Heteroskedasticity-consistent standard errors clustered at the firm
level are reported in square brackets below the estimates. *, **, and *** indicate statistical
significance at the 10%, 5%, and 1% levels, respectively.

45
TABLE 2 (continued)
Panel A. Summary Statistics for Matched Samples prior to Broker Terminations
Variable Treated Firms Matched Control Firms Difference
in Means t-Stat. Mean Std. Dev. Med. Mean Std. Dev. Med. SIZE 7.476 1.806 7.395 7.446 1.782 7.312 0.031 [0.49] Q 2.754 2.101 2.080 2.718 2.073 2.032 0.035 [0.49] PPE 0.439 0.346 0.339 0.427 0.343 0.322 0.012 [1.01] FI 0.012 0.030 0.000 0.014 0.031 0.000 -0.001 [-1.18] COV 11.701 7.253 10.000 11.556 7.261 10.000 0.145 [-0.21] Panel B. Parallel Trends in Tax Avoidance prior to Broker Terminations
Variable Treated Firms Matched Control Firms Difference
in Means t-Stat. Year Mean Std. Dev. Med. Mean Std. Dev. Med. ΔBTD 0.024 0.991 -0.002 -0.009 0.177 -0.007 0.033 [1.09] t−1 ΔDDBTD 0.039 1.316 0.000 -0.009 0.085 -0.005 0.048 [1.08] t−1 ΔSHELTER 0.221 2.572 0.102 0.087 1.416 0.081 0.133 [1.41] t−1 ΔDTAX 0.012 0.317 -0.003 0.015 0.138 0.009 -0.003 [-0.31] t−1 ΔCETR 0.005 0.207 0.011 0.004 0.195 0.011 0.002 [0.18] t−1 ΔBTD 0.057 0.549 0.000 0.051 0.427 0.004 0.007 [0.31] t−2 ΔDDBTD 0.120 2.275 0.000 0.021 0.187 0.013 0.099 [1.19] t−2 ΔSHELTER 0.181 2.370 0.125 0.260 1.803 0.109 -0.078 [-0.78] t−2 ΔDTAX 0.008 0.170 0.000 -0.009 0.135 0.007 0.018 [-0.52] t−2 ΔCETR 0.004 0.212 0.006 -0.002 0.231 -0.004 0.007 [0.63] t−2

46
TABLE 2 (continued)
Variables
Average Treated Difference
(year t+1 vs. t−1)
Average Control Difference
(year t+1 vs. t−1) DIDs: Treated versus Control
Panel C. DID Results Using Abadie and Imbens’ (2006) Matching Estimator BTD 0.037** 0.014 0.023**
[0.015] [0.012] [0.010] DDBTD 0.056*** 0.025** 0.031***
[0.016] [0.010] [0.009] SHELTER 0.259*** 0.141 0.118
[0.095] [0.092] [0.085] DTAX 0.065*** 0.010 0.055*
[0.022] [0.019] [0.029] CETR -0.007 0.017* -0.025**
[0.010] [0.009] [0.011] Panel D. DID Results Using Propensity Score Matching Estimator BTD 0.033*** -0.018*** 0.052***
[0.009] [0.005] [0.010] DDBTD 0.048*** 0.007 0.041***
[0.008] [0.004] [0.009] SHELTER 0.164** -0.013 0.177*
[0.078] [0.046] [0.091] DTAX -0.004 -0.028*** 0.024**
[0.009] [0.006] [0.011] CETR 0.007** 0.016*** -0.009*
[0.003] [0.003] [0.005]
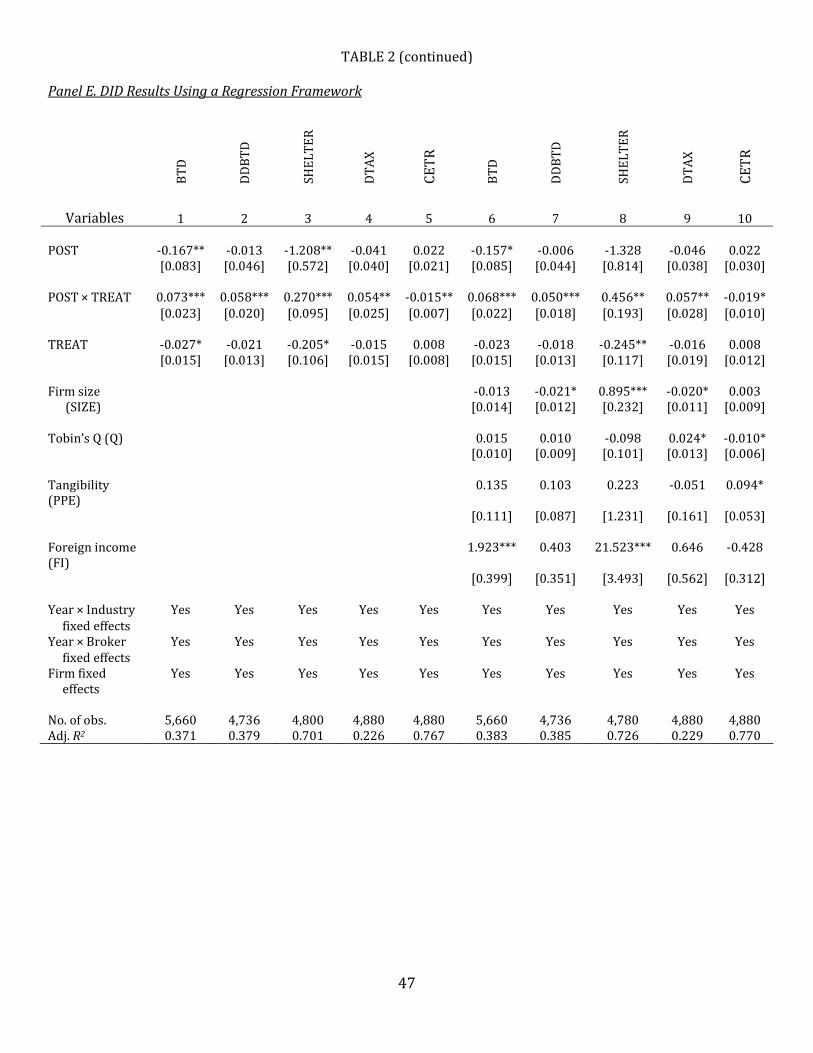
47
TABLE 2 (continued)
Panel E. DID Results Using a Regression Framework
BTD
DDBT
D
SHEL
TER
DTAX
CETR
BTD
DDBT
D
SHEL
TER
DTAX
CETR
Variables 1 2 3 4 5 6 7 8 9 10
POST -0.167** -0.013 -1.208** -0.041 0.022 -0.157* -0.006 -1.328 -0.046 0.022 [0.083] [0.046] [0.572] [0.040] [0.021] [0.085] [0.044] [0.814] [0.038] [0.030] POST × TREAT 0.073*** 0.058*** 0.270*** 0.054** -0.015** 0.068*** 0.050*** 0.456** 0.057** -0.019* [0.023] [0.020] [0.095] [0.025] [0.007] [0.022] [0.018] [0.193] [0.028] [0.010] TREAT -0.027* -0.021 -0.205* -0.015 0.008 -0.023 -0.018 -0.245** -0.016 0.008 [0.015] [0.013] [0.106] [0.015] [0.008] [0.015] [0.013] [0.117] [0.019] [0.012] Firm size -0.013 -0.021* 0.895*** -0.020* 0.003 (SIZE) [0.014] [0.012] [0.232] [0.011] [0.009] Tobin’s Q (Q) 0.015 0.010 -0.098 0.024* -0.010* [0.010] [0.009] [0.101] [0.013] [0.006] Tangibility (PPE)
0.135 0.103 0.223 -0.051 0.094*
[0.111] [0.087] [1.231] [0.161] [0.053] Foreign income (FI)
1.923*** 0.403 21.523*** 0.646 -0.428
[0.399] [0.351] [3.493] [0.562] [0.312] Year × Industry Yes Yes Yes Yes Yes Yes Yes Yes Yes Yes fixed effects Year × Broker Yes Yes Yes Yes Yes Yes Yes Yes Yes Yes fixed effects Firm fixed Yes Yes Yes Yes Yes Yes Yes Yes Yes Yes effects No. of obs. 5,660 4,736 4,800 4,880 4,880 5,660 4,736 4,780 4,880 4,880 Adj. R2 0.371 0.379 0.701 0.226 0.767 0.383 0.385 0.726 0.229 0.770
48
TABLE 3
DID Analysis of Tax Avoidance: Alternative Matching Criteria
Table 3 presents the DID estimates for our measures of tax avoidance following broker closures or
broker mergers, using alternative matching criteria. The sample consists of 1,415 treated firms
that experienced a reduction in analyst coverage in the 2000–2010 period, and the same number
of control firms. Control firms are a subset of the non-treated firms selected as the closest match
to the treated firms, based on a set of firm characteristics, in the year before the broker
termination. Both groups of firms are publicly traded non-finance and non-utility firms. Nearest-
neighbor logit propensity score matching is adopted for various combinations of the following
matching variables: BTD, COV, SIZE, Q, PPE, FI, ROA, LEV, NOL, ΔNOL, INTAN, and EQINC. SIZE is
the natural log of the market value of equity (CSHO × PRCC_F). Q is calculated as the market value
of assets over book value of assets, (AT-CEQ+ CSHO × PRCC_F)/AT, and PPE is defined as property,
plant, and equipment (PPEGT) divided by total assets. FI is calculated as foreign income (PIFO)
divided by total assets (AT), and COV is the total number of stock analysts following the firm
during the year. ROA is return on assets, measured as operating income (PI- XI) divided by lagged
assets. LEV is long-term leverage, defined as long-term debt (DLTT) divided by total assets (AT).
NOL is a dummy variable coded as 1 if the loss carry forward (TLCF) is positive, and 0 otherwise.
ΔNOL is defined as the change in loss carry forward, INTAN is calculated as intangible assets
(INTAN) scaled by lagged assets, and EQINC is equity income in earnings (ESUB) divided by lagged
assets. Other variable definitions are given in Appendix A. Heteroskedasticity-consistent standard
errors robust to clustering at firm level are reported in square brackets below the estimates. *, **,
and *** indicate statistical significance at the 10%, 5%, and 1% levels, respectively.

49
TABLE 3 (continued)
BTD DDBTD DTAX CETR
Variables 1 2 3 4
Simple-matched 0.021** 0.013* 0.056*** -0.015** [0.009] [0.008] [0.018] [0.007] BTD/COV-matched 0.050*** 0.024** 0.033** -0.018** [0.013] [0.012] [0.016] [0.008] SIZE/COV-matched 0.032** 0.033** 0.135** -0.013* [0.014] [0.014] [0.067] [0.007] SIZE/Q/PPE/COV-matched 0.028** 0.025* 0.040*** -0.012* [0.014] [0.014] [0.015] [0.007] SIZE/Q /PPE/FI/ROA/LEV 0.026* 0.031** 0.028* -0.017** /COV-matched [0.014] [0.012] [0.015] [0.007] SIZE/Q /PPE/FI /ROA/LEV 0.034** 0.029** 0.055 -0.015** /NOL/ΔNOL/COV-matched [0.013] [0.012] [0.058] [0.007] SIZE/Q /PPE/FI/ROA/LEV 0.028** 0.012*** 0.012*** -0.012*** /NOL/ΔNOL/INTAN/EQINC/ [0.014] [0.011] [0.014] [0.007] COV-matched
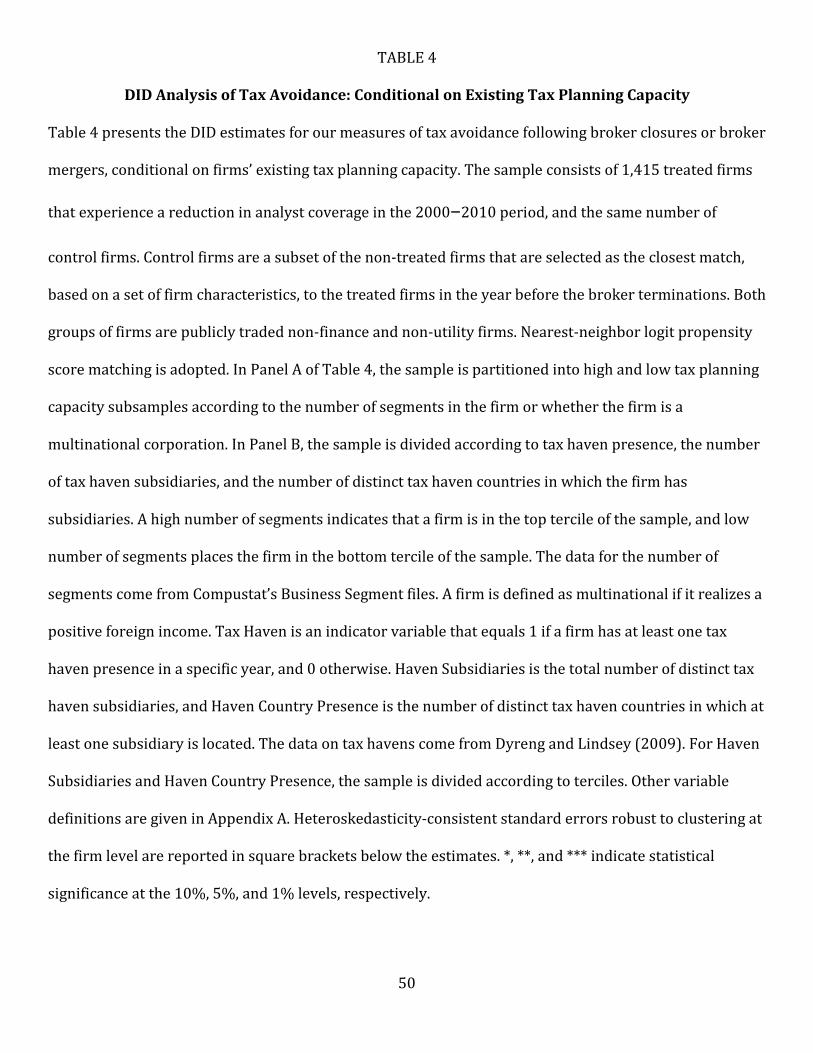
50
TABLE 4
DID Analysis of Tax Avoidance: Conditional on Existing Tax Planning Capacity
Table 4 presents the DID estimates for our measures of tax avoidance following broker closures or broker
mergers, conditional on firms’ existing tax planning capacity. The sample consists of 1,415 treated firms
that experience a reduction in analyst coverage in the 2000–2010 period, and the same number of
control firms. Control firms are a subset of the non-treated firms that are selected as the closest match,
based on a set of firm characteristics, to the treated firms in the year before the broker terminations. Both
groups of firms are publicly traded non-finance and non-utility firms. Nearest-neighbor logit propensity
score matching is adopted. In Panel A of Table 4, the sample is partitioned into high and low tax planning
capacity subsamples according to the number of segments in the firm or whether the firm is a
multinational corporation. In Panel B, the sample is divided according to tax haven presence, the number
of tax haven subsidiaries, and the number of distinct tax haven countries in which the firm has
subsidiaries. A high number of segments indicates that a firm is in the top tercile of the sample, and low
number of segments places the firm in the bottom tercile of the sample. The data for the number of
segments come from Compustat’s Business Segment files. A firm is defined as multinational if it realizes a
positive foreign income. Tax Haven is an indicator variable that equals 1 if a firm has at least one tax
haven presence in a specific year, and 0 otherwise. Haven Subsidiaries is the total number of distinct tax
haven subsidiaries, and Haven Country Presence is the number of distinct tax haven countries in which at
least one subsidiary is located. The data on tax havens come from Dyreng and Lindsey (2009). For Haven
Subsidiaries and Haven Country Presence, the sample is divided according to terciles. Other variable
definitions are given in Appendix A. Heteroskedasticity-consistent standard errors robust to clustering at
the firm level are reported in square brackets below the estimates. *, **, and *** indicate statistical
significance at the 10%, 5%, and 1% levels, respectively.
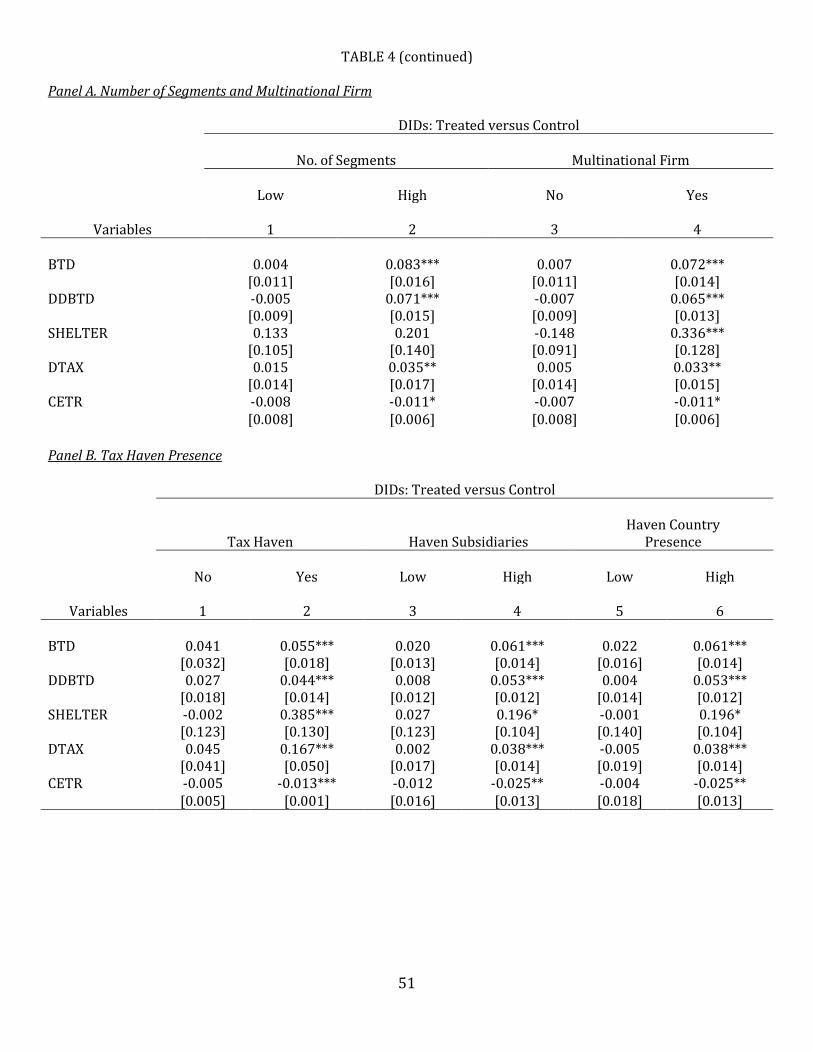
51
TABLE 4 (continued)
Panel A. Number of Segments and Multinational Firm DIDs: Treated versus Control
No. of Segments Multinational Firm
Low High No Yes
Variables 1 2 3 4
BTD 0.004 0.083*** 0.007 0.072***
[0.011] [0.016] [0.011] [0.014] DDBTD -0.005 0.071*** -0.007 0.065***
[0.009] [0.015] [0.009] [0.013] SHELTER 0.133 0.201 -0.148 0.336***
[0.105] [0.140] [0.091] [0.128] DTAX 0.015 0.035** 0.005 0.033**
[0.014] [0.017] [0.014] [0.015] CETR -0.008 -0.011* -0.007 -0.011*
[0.008] [0.006] [0.008] [0.006] Panel B. Tax Haven Presence DIDs: Treated versus Control
Tax Haven Haven Subsidiaries
Haven Country Presence
No Yes Low High Low High
Variables 1 2 3 4 5 6
BTD 0.041 0.055*** 0.020 0.061*** 0.022 0.061***
[0.032] [0.018] [0.013] [0.014] [0.016] [0.014] DDBTD 0.027 0.044*** 0.008 0.053*** 0.004 0.053***
[0.018] [0.014] [0.012] [0.012] [0.014] [0.012] SHELTER -0.002 0.385*** 0.027 0.196* -0.001 0.196*
[0.123] [0.130] [0.123] [0.104] [0.140] [0.104] DTAX 0.045 0.167*** 0.002 0.038*** -0.005 0.038***
[0.041] [0.050] [0.017] [0.014] [0.019] [0.014] CETR -0.005 -0.013*** -0.012 -0.025** -0.004 -0.025**
[0.005] [0.001] [0.016] [0.013] [0.018] [0.013]

52
TABLE 5
DID Analysis of Tax Avoidance: Conditional on Initial Analyst Coverage
Table 5 presents the DID estimates for our measures of tax avoidance following broker closures or
broker mergers, conditional on initial analyst coverage. The sample consists of 1,415 treated firms
that experience a reduction in analyst coverage in the 2000–2010 period, and the same number of
control firms. Control firms are a subset of the non-treated firms selected as the closest match to
the treated firms, based on a set of firm characteristics, in the year before the broker termination.
Both groups of firms are publicly traded non-finance and non-utility firms. Nearest-neighbor logit
propensity score matching is adopted. The sample is divided into subsamples according to the
initial analyst coverage. Columns 1 and 2 partition the sample using arbitrary “low” (5) and “high”
(15) numbers of analysts following the firm before broker terminations. Column 1 consists of 870
firm-year observations, and column 2 consists of 646 firm-year observations. Columns 3 and 4
divide the sample according to the terciles sorted on initial analyst coverage, where the firms in
the high initial analyst coverage subsample are those in the top tercile of the whole sample, and
firms in the low initial analyst coverage subsample are in the bottom tercile of the whole sample.
Column 3 consists of 930 firm-year observations, and column 4 consists of 948 firm-year
observations. Columns 5 and 6 divide the sample using excessive analyst coverage instead of
analyst coverage. Column 5 consists of 932 firm-year observations, and column 6 consists of 948
observations. Other variable definitions are given in Appendix A. Heteroskedasticity-consistent
standard errors robust to clustering at the firm level are reported in square brackets below the
estimates. *, **, and *** indicate statistical significance at the 10%, 5%, and 1% levels, respectively.
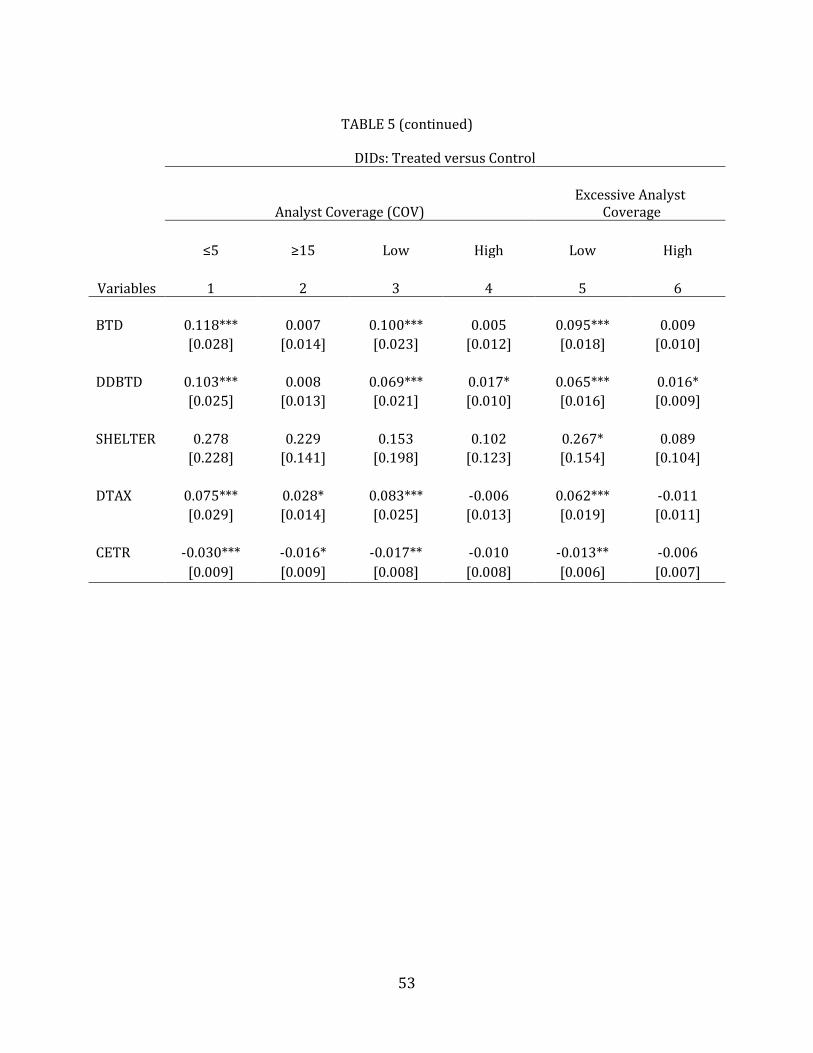
53
TABLE 5 (continued)
DIDs: Treated versus Control
Analyst Coverage (COV)
Excessive Analyst Coverage
≤5 ≥15 Low High Low High
Variables 1 2 3 4 5 6 BTD 0.118*** 0.007 0.100*** 0.005 0.095*** 0.009
[0.028] [0.014] [0.023] [0.012] [0.018] [0.010] DDBTD 0.103*** 0.008 0.069*** 0.017* 0.065*** 0.016*
[0.025] [0.013] [0.021] [0.010] [0.016] [0.009] SHELTER 0.278 0.229 0.153 0.102 0.267* 0.089
[0.228] [0.141] [0.198] [0.123] [0.154] [0.104] DTAX 0.075*** 0.028* 0.083*** -0.006 0.062*** -0.011
[0.029] [0.014] [0.025] [0.013] [0.019] [0.011] CETR -0.030*** -0.016* -0.017** -0.010 -0.013** -0.006
[0.009] [0.009] [0.008] [0.008] [0.006] [0.007]

54
TABLE 6
DID Analysis of Tax Avoidance:
Consumer-Oriented Industries vesus Other Industries
Table 6 presents the DID estimates for our measures of tax avoidance following broker
closures or broker mergers, conditional on retail industry versus other industries. The
sample consists of 1,415 treated firms that experience a reduction in analyst coverage in
the 2000–2010 period, and the same number of control firms. Control firms are a subset of
the non-treated firms selected as the closest match to the treated firms, based on a set of
firm characteristics, in the year before the broker termination. Both groups of firms are
publicly traded non-finance and non-utility firms. Nearest-neighbor logit propensity score
matching is adopted. The sample is divided into subsamples according to whether the firms
are in consumer-oriented industries. Column 1 consists of 430 firm-year observations and
column 2 consists of 2,400 firm-year observations. Other variable definitions are given in
Appendix A. Heteroskedasticity-consistent standard errors robust to clustering at the firm
level are reported in square brackets below the estimates. *, **, and *** indicate statistical
significance at the 10%, 5%, and 1% levels, respectively.
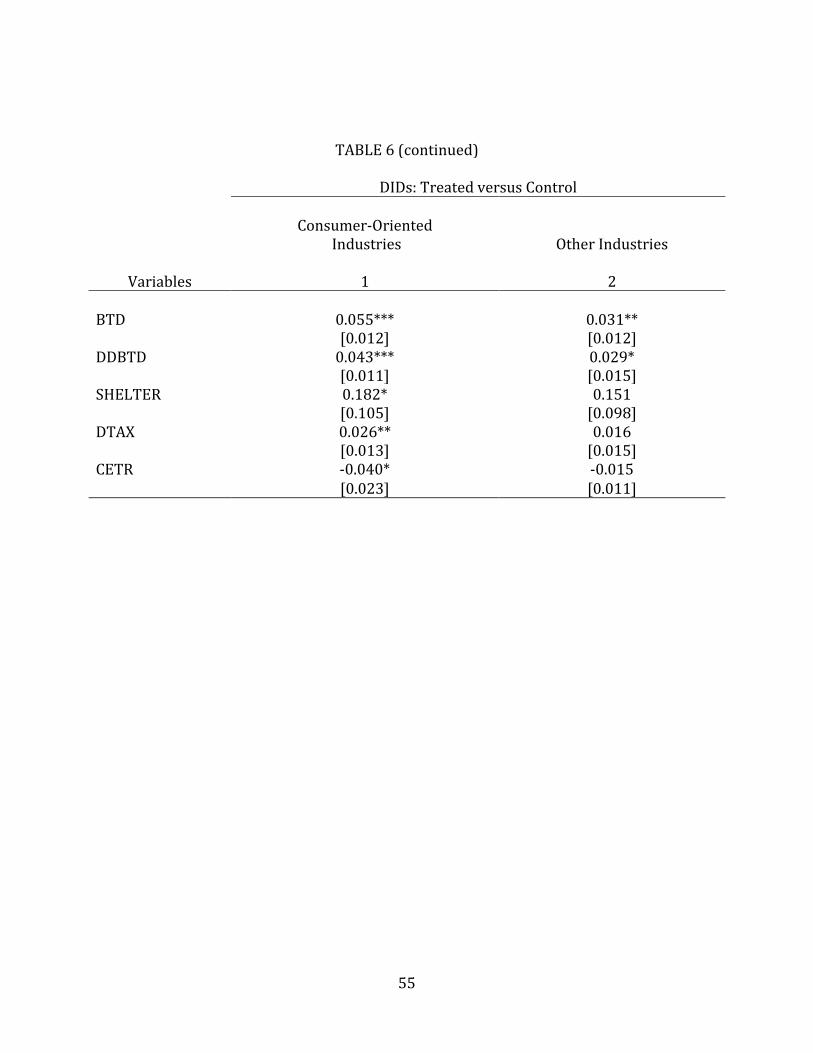
55
TABLE 6 (continued)
DIDs: Treated versus Control
Consumer-Oriented Industries Other Industries
Variables 1 2
BTD 0.055*** 0.031**
[0.012] [0.012] DDBTD 0.043*** 0.029*
[0.011] [0.015] SHELTER 0.182* 0.151
[0.105] [0.098] DTAX 0.026** 0.016
[0.013] [0.015] CETR -0.040* -0.015
[0.023] [0.011]

56
TABLE 7
DID Analysis of Tax Avoidance: Tax Authority Monitoring and Enforcement
Table 7 presents the DID estimates for our measures of tax avoidance following broker
closures or broker mergers, conditional on tax authority monitoring and enforcement. The
sample consists of 1,415 treated firms that experience a reduction in analyst coverage in
the 2000–2010 period, and the same number of control firms. Control firms are a subset of
the non-treated firms selected as the closest match to the treated firms, based on a set of
firm characteristics, in the year before the broker termination. Both groups of firms are
publicly traded non-finance and non-utility firms. Nearest-neighbor logit propensity score
matching is adopted. The sample is divided into subsamples according to tax authority
monitoring and enforcement. Following Hanlon, Hoopes, and Shroff (2014), tax authority
monitoring is defined as the probability of an IRS audit measured by the ex-post
realizations of actual face-to-face audits. The data come from the Transactional Records
Access Clearinghouse (TRAC). The sample division is based on the median value of tax
authority monitoring and enforcement, and the results are robust to a division based on
terciles. Column 1 consists of 1,470 firm-year observations and column 2 consists of 1,360
firm-year observations. Other variable definitions are given in Appendix A.
Heteroskedasticity-consistent standard errors robust to clustering at the firm level are
reported in square brackets below the estimates. *, **, and *** indicate statistical
significance at the 10%, 5%, and 1% levels, respectively.

57
TABLE 7 (continued)
DIDs: Treated versus Control
(tax authority monitoring and enforcement)
High Low
Variables 1 2
BTD 0.003 0.100***
[0.010] [0.018] DDBTD -0.008 0.086***
[0.008] [0.017] SHELTER 0.002 0.326**
[0.105] [0.141] DTAX 0.004 0.043**
[0.010] [0.018] CETR -0.015 -0.023*
[0.013] [0.014]
58
TABLE 8
DID Analysis of Tax Avoidance: Number of Peer Firms
Table 8 presents the DID estimates for our measures of tax avoidance following broker
closures or broker mergers, conditional on the number of peer firms. The sample consists
of 1,415 treated firms that experience a reduction in analyst coverage in the 2000–2010
period, and the same number of control firms. Control firms are a subset of the non-treated
firms selected as the closest match to the treated firms in the year before the broker
termination based on a set of firm characteristics. Both groups of firms are publicly traded
non-finance and non-utility firms. Nearest-neighbor logit propensity score matching is
adopted. The sample is divided into subsamples according to the number of peer firms. The
sample division is based on median values of the numbers of peer firms, and the results are
robust to a division based on terciles. Other variable definitions are given in Appendix A.
Heteroskedasticity-consistent standard errors robust to clustering at the firm level are
reported in square brackets below the estimates. *, **, and *** indicate statistical
significance at the 10%, 5%, and 1% levels, respectively.

59
TABLE 8 (continued)
DIDs: Treated versus Control
(NUM_OF_PEERS)
High Low
Variables 1 2
BTD 0.022*** 0.076***
[0.007] [0.018] DDBTD 0.010 0.066***
[0.008] [0.017] SHELTER -0.010 0.327***
[0.149] [0.087] DTAX 0.010 0.038**
[0.012] [0.017] CETR 0.012 -0.054***
[0.014] [0.014]

60
Appendix A. Variable Definitions
Appendix A presents the definitions and detailed calculations of the variables used
in the paper.
Measures of Tax Avoidance
Book-tax difference (BTD): The total book-tax difference, which is calculated by book
income less taxable income scaled by lagged assets (AT). Book income is pre-tax
income (PI) in year t. Taxable income is calculated by summing the current federal
tax expense (TXFED) and current foreign tax expense (TXFO) and dividing by the
statutory tax rate and then subtracting the change in net operating loss
carryforwards (TLCF) in year t. If the current federal tax expense is missing, the
total current tax expense equals the total income taxes (TXT) less deferred taxes
(TXDI), state income taxes (TXS), and other income taxes (TXO). We remove
observations with total assets less than $1 million and observations with negative
taxable income (TXFED<0). Source: Compustat
Desai and Dharmapala’s (2006) residual book-tax difference (DDBTD): Desai and
Dharmapala’s (2006) residual book-tax difference, which equals the residual from
the following fixed effects regression: BTDi,t=β1 TACCi.t + µi + εi,t,
where BTD is the total book-tax difference and TACC is the total accruals measured
using the cash flow method per Hribar and Collins (2002). Both variables are scaled
by lagged total assets. We remove observations with total assets less than $1 million
and observations with negative taxable income (TXFED<0). Source: Compustat
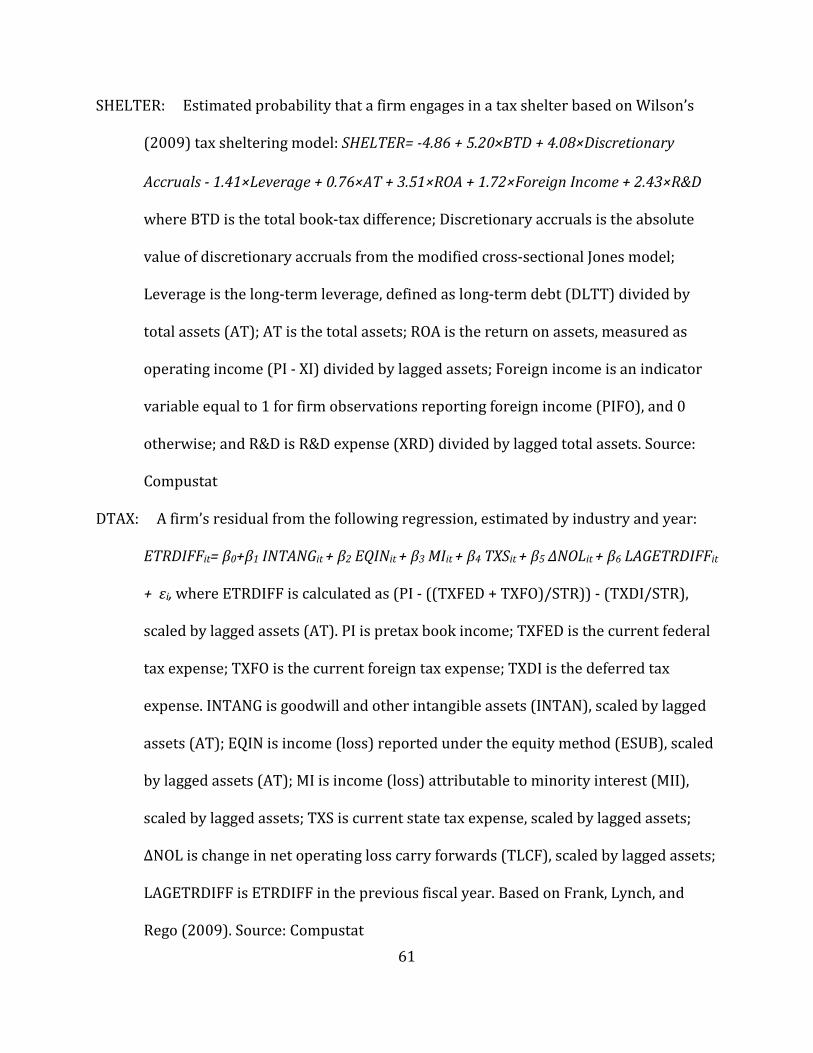
61
SHELTER: Estimated probability that a firm engages in a tax shelter based on Wilson’s
(2009) tax sheltering model: SHELTER= -4.86 + 5.20×BTD + 4.08×Discretionary
Accruals - 1.41×Leverage + 0.76×AT + 3.51×ROA + 1.72×Foreign Income + 2.43×R&D
where BTD is the total book-tax difference; Discretionary accruals is the absolute
value of discretionary accruals from the modified cross-sectional Jones model;
Leverage is the long-term leverage, defined as long-term debt (DLTT) divided by
total assets (AT); AT is the total assets; ROA is the return on assets, measured as
operating income (PI - XI) divided by lagged assets; Foreign income is an indicator
variable equal to 1 for firm observations reporting foreign income (PIFO), and 0
otherwise; and R&D is R&D expense (XRD) divided by lagged total assets. Source:
Compustat
DTAX: A firm’s residual from the following regression, estimated by industry and year:
ETRDIFFit= β0+β1 INTANGit + β2 EQINit + β3 MIit + β4 TXSit + β5 ΔNOLit + β6 LAGETRDIFFit
+ εi, where ETRDIFF is calculated as (PI - ((TXFED + TXFO)/STR)) - (TXDI/STR),
scaled by lagged assets (AT). PI is pretax book income; TXFED is the current federal
tax expense; TXFO is the current foreign tax expense; TXDI is the deferred tax
expense. INTANG is goodwill and other intangible assets (INTAN), scaled by lagged
assets (AT); EQIN is income (loss) reported under the equity method (ESUB), scaled
by lagged assets (AT); MI is income (loss) attributable to minority interest (MII),
scaled by lagged assets; TXS is current state tax expense, scaled by lagged assets;
ΔNOL is change in net operating loss carry forwards (TLCF), scaled by lagged assets;
LAGETRDIFF is ETRDIFF in the previous fiscal year. Based on Frank, Lynch, and
Rego (2009). Source: Compustat

62
Cash effective tax rate (CETR): Calculated as cash taxes paid (TXPD) divided by pretax
income (PI). Based on Chen et al. (2010). CETR is set to missing when the
denominator is 0 or negative. We winsorize CETR to the range [0, 1]. Source:
Compustat
Manzon and Plesko (2002) book-tax difference (MPBTD): U.S. domestic book-tax
difference, which is calculated by U.S. domestic book income less U.S. domestic
taxable income less state tax income (TXS) less other tax income (TXO) less equity in
earnings (ESUB) scaled by lagged assets (AT). U.S. domestic book income is
domestic pretax income (PIDOM) in year t. U.S. domestic taxable income is
calculated by the current federal tax expense (TXFED) divided by the statutory tax
rate. We remove observations with total assets less than $1 million and
observations with negative taxable income (TXFED<0). Based on Manzon and
Plesko (2002). Source: Compustat
ETR differential (ETRDIFF): Calculated as (PI - ((TXFED + TXFO)/STR)) - (TXDI/STR),
scaled by lagged assets (AT). PI is pretax book income; TXFED is the current federal
tax expense; TXFO is the current foreign tax expense; TXDI is the deferred tax
expense. Based on Frank, Lynch, and Rego (2009) and Kim et al. (2011). Source:
Compustat
Effective tax rate (ETR): Calculated as total tax expense (TXT) less change in deferred tax
(TXDI), divided by operating cash flows (OANCF). Based on Zimmerman (1983).
ETR is set to missing when the denominator is 0 or negative. We winsorize ETR to
the range [0, 1]. Source: Compustat

63
Cash flow effective tax rate (CFETR): Calculated as cash taxes paid (TXPD) divided by
operating cash flows (OANCF). We winsorize CFETR to the range [0, 1]. Source:
Compustat
Analyst Coverage
Coverage (COV): Total number of stock analysts following the firm during the year.
Source: IBES
Firm Characteristics
Firm size (SIZE): Natural log of the market value of equity (CSHO × PRCC_F). Source:
Compustat
Tobin's Q (Q): Market value of assets over book value of assets: (AT − CEQ + CSHO ×
PRCC_F)/AT. Source: Compustat
Tangibility (PPE): Property, plant, and equipment (PPEGT) divided by total assets. Source:
Compustat
Foreign income (FI): Foreign income (PIFO) divided by total assets. Source: Compustat
ROA: Return on assets, measured as operating income (PI - XI) divided by lagged assets.
Source: Compustat
Leverage (LEV): Long-term leverage, defined as long-term debt (DLTT) divided by total
assets (AT). Source: Compustat
NOL: Dummy variable coded as 1 if loss carry forward (TLCF) is positive. Source:
Compustat
ΔNOL: Change in loss carry forward. Source: Compustat

64
Intangibility: Intangible assets (INTAN), scaled by lagged assets. Source: Compustat
EQINC: Equity income in earnings (ESUB) divided by lagged assets. Source: Compustat
Cash holdings (CASH): Cash and short-term investments (CHE) divided by total assets.
Source: Compustat
Cash flow (CF): Income before extraordinary items (IBC) divided by total assets (AT).
Source: Compustat
No. of segments: Total number of business segments in the firm. Source: Compustat’s
Business Segment files
Multinational firm: A firm is defined as multinational if it realizes a positive foreign
income. Source: Compustat
Tax haven: An indicator variable that equals 1 if a firm has at least 1tax haven presence in
a specific year, and 0 otherwise. Source: Dyreng and Lindsey (2009)
Haven subsidiaries: Total number of distinct tax haven subsidiaries that a firm has.
Source: Dyreng and Lindsey (2009)
Haven country presence: Total number of distinct tax haven countries in which at least
one subsidiary of the firm is located. Source: Dyreng and Lindsey (2009)
Consumer-oriented industries: Industries with SIC codes from 5200 to 5999. Source:
Compustat
Tax authority monitoring and enforcement: Following Hanlon, Hoopes, and Shroff (2014),
tax authority monitoring is defined as the probability of an IRS audit measured by
the ex-post realizations of actual face-to-face audits. Source: Transactional Records
Access Clearinghouse (TRAC)

65
NUM_OF_PEERS: Total number of peer firms for a particular firm operating in an
industry based on 4-digit SIC codes. Source: Compustat

66
Appendix B. Broker Terminations
In Appendix B, we present the descriptive statistics for broker terminations,
including the number of broker terminations and the number of affected firms in each year
in our sample. Table B1 indicates that there is no obvious evidence of clustering in time and
the exits are spread out evenly over the sample period.
TABLE B1
Descriptive Statistics for Broker Terminations
Table B1 presents the number of broker terminations and the number of affected firms in
each year in our sample, for firms with valid information on the measures of corporate tax
avoidance and matching variables in the DID analysis framework.
Year No. of Broker Terminations
No. of Affected Firms
2000 8 233 2001 8 293 2002 4 227 2003 2 22 2004 2 41 2005 7 156 2006 3 68 2007 5 195 2008 3 122 2009 3 17 2010 2 41
Total 47 1,415

67
Appendix C. Alternative Measures of Tax Avoidance
In Appendix C, we show the DID estimates using alternative 4 measures of tax
avoidance following broker closures or broker mergers. The sample in Table C1 consists of
1,415 treated firms that experience a reduction in analyst coverage in the 2000–2010
period, and the same number of control firms. Control firms are a subset of the non-treated
firms selected as the closest match to the treated firms, based on a set of firm
characteristics, in the year before the broker termination. The results indicate that our
main results are quite robust.
68
TABLE C1
DID Analysis of Tax Avoidance: Alternative Measures of Tax Avoidance
Table C1 presents the DID analysis of tax avoidance using alternative measures of tax
avoidance. Panel A reports the Difference-in-Differences results using Abadie and Imbens’
(2006) matching. Panel B reports the DID results for tax avoidance using nearest-neighbor
logit propensity score matching. The matching variables include firm size (SIZE), Tobin’s Q
(Q), tangibility (PPE), foreign income (FI), analyst coverage (COV), Fama–French (1997) 48
industry, and fiscal year. SIZE is the natural log of the market value of equity (CSHO ×
PRCC_F). Q is calculated as the market value of assets over book value of assets, (AT − CEQ
+ CSHO × PRCC_F)/AT, and PPE is defined as property, plant, and equipment (PPEGT)
divided by total assets. FI is calculated as foreign income (PIFO) divided by total assets
(AT), and COV is the total number of stock analysts following the firm during the year.
Other variable definitions are given in Appendix A. Heteroskedasticity-consistent standard
errors robust to clustering at the firm level are reported in square brackets below the
estimates. *, **, and *** indicate statistical significance at the 10%, 5%, and 1% levels,
respectively.

69
TABLE C1 (continued)
Variables
Average Treated Difference
(year t+1 vs. t−1)
Average Control Difference
(year t+1 vs. t−1) DIDs: Treated versus Control
Panel A. DID Results Using Abadie and Imbens’ (2006) Matching MPBTD 0.056** 0.026* 0.030**
[0.022] [0.014] [0.011] ETRDIFF 0.055*** 0.027* 0.028***
[0.020] [0.015] [0.009] ETR -0.019*** -0.003 -0.016*
[0.006] [0.007] [0.009] CFETR -0.048*** -0.033*** -0.015**
[0.008] [0.008] [0.006]
Panel B. DID Results Using Propensity Score Matching MPBTD 0.056*** -0.008** 0.064***
[0.008] [0.004] [0.009] ETRDIFF 0.058*** -0.010** 0.067***
[0.009] [0.004] [0.010] ETR -0.011** -0.007 -0.004
[0.005] [0.007] [0.009] CFETR -0.034*** -0.014** -0.020**
[0.007] [0.007] [0.010]