does grassroots democracy reduce income inequality in china?
TRANSCRIPT
Journal of Public Economics 92 (2008) 2182–2198
Contents lists available at ScienceDirect
Journal of Public Economics
j ourna l homepage: www.e lsev ie r.com/ locate /econbase
Does grassroots democracy reduce income inequality in China?☆
Yan Shen, Yang Yao⁎China Center for Economic Research, Peking University, China
a r t i c l e i n f o
☆ We thank Abhijit Banerjee, Samuel Bowels, Esther“Liberalization experiences in Asia: A normative apprathe 2007 GDN conference (January 14-18, 2007, BeijinInstitute, the Huazhong University of Science and TechWashington University, University of Wisconsin-Macomments. We also thank Dwayne Benjamin, Loren BWang, and Shenwei Zhang provided excellent researcProjects Fund and thank the excellent data collectionChina.⁎ Corresponding author.
E-mail address: [email protected] (Y. Yao).
0047-2727/$ – see front matter © 2008 Elsevier B.V.doi:10.1016/j.jpubeco.2008.04.002
a b s t r a c t
Article history:Received 11 October 2007Received in revised form 17 March 2008Accepted 7 April 2008Available online 11 April 2008
Using village and household survey data collected from 48 villages of eight Chinese provincesfor the period 1986–2002, this paper studies how the introduction of village elections affectsincome distribution at the village level.We estimate both a static fixed-effect panel model and adynamic panel model for the within-village Gini coefficient and take care of the endogeneity ofthe introduction of elections. The dynamic panel model shows that having elections reduces theGini coefficient by 0.04, or 14.3% of the sample average. We also find that elections tend toincrease the income shares of poorer portions of the population. Further econometric analysisbased on dynamic panel models shows that elections increase per-capita public expendituresby 271 Yuan, but do not increase the level or progressiveness of net or total income transfer in avillage. Therefore, elections' positive role in reducing income inequality is not played throughmore income redistribution, but through more pro-poor public investment.
© 2008 Elsevier B.V. All rights reserved.
JEL classification:D63D72H41
Keywords:Grassroots democracyIncome distributionDynamic panel model
There is a growing interest in studying the role of local political institutions in promoting economic growth and equality. Thispaper adds to the literature by accomplishing two objectives. One is to test whether democratization of Chinese villages centered atthe village election has resulted in more equal income distribution within the village in the last twenty years. Besides its possibleconsequences on social justice, a topic frequently tackled at the national level, income inequality may result inmore adverse effectsin a local community in terms of public goods provision (Bardhan and Mookherjee, 2005), health outcomes, and for that matter,local economic growth (see Angus Deaton, 2003 for a critical survey). Our other objective is to find out the channel(s) by whichvillage elections have improved income distribution if any improvements have happened at all. Democracy could reduce incomeinequality by two ways. One is to lead the government to cater to the interests of the median voter who in general prefers theredistribution of income (Alesina and Rodrik, 1994; Benabou, 1996). The other is to press the government to spend more on publicprojects that enhance the income capability of the poorer. The second channel is preferred over the first under normalcircumstances because the first is more likely to lead to unproductive redistribution, but the second enhances productivity in thesociety.
Duflo, Justin Lin, John Strauss, Xiaobo Zhang, two anonymous referees, and participants of the conferenceisal” (January 12-13, 2006, Delhi), the 2006 NBER-CCER Annual Conference (June 30-July 2, 2006, Beijing)g), and seminars in the Shanghai University of Finance and Economics, Renmin University, the East Asiannology, the Institute for Rural Development at the Chinese Academy of Social Sciences, Cornell Universitydison, The New School, New York University, Colgate University, and Colby College for their valuablerandt and John Giles for their generosity to share with us part of their data. Mengtao Gao, Ang Sun, Shunah assistance. We are grateful for financial supports from the Chinese Medical Board and the National 211efforts provided by the Research Center of Rural Economy, the Ministry of Agriculture, People's Republic o
All rights reserved.
,
,
f

2183Y. Shen, Y. Yao / Journal of Public Economics 92 (2008) 2182–2198
Existing evidence suggests that grassroots democracy does raise the responsiveness of the local government and leads to pro-poorpolicies at the local level. Raghabendra Chattopadhyay and Esther Duflo (2004) found that the election of a woman village head inIndian villages had led to the introduction of pro-woman policies. Andrew Foster and Mark Rosenzwig (2001) found that villageelections in India had increased local governments' investment in road building and reduced their investment in irrigationfacilities. They interpreted this finding as evidence for a pro-poor policy because irrigation benefited landlords and building roadsprovided jobs to the landless. Xiaobo Zhang, Shenggen Fan, Linxiu Zhang, and Jikun Huang (2004) found that village electionsincreased the share of public investment in village expenditures using a sample from Jiangsu province, China. Shuna Wang andYang Yao (2007) found similar results using a larger sample covering eight Chinese provinces. Li Gan, Lixin Xu, and Yang Yao (2005,2006) further found that village elections helped to reduce the negative impacts of health shocks on farmers' income andstrengthen farmers' consumption smoothing capabilities. All these findings suggest that grassroots democracy could function toreduce income inequality at the local level. Nevertheless, they do not provide direct evidence for the strength of that relationship,nor do they tell us the channel by which democracy improves income equality. On the other hand, however, decentralizationassociated with grassroots democracy could also make elite capture easier at the local level when the local society is socially oreconomically divided (Bardhan andMookherjee, 2005). Therefore, it is theoretically unclearwhether income distributionwould beunequivocally improved by grassroots democracy.
Existing studies using country-level data have not provided conclusive results for the impacts of democracy on equality.1 Oneproblem with cross-country studies is that the function of democracy depends on a country's social settings and otherinstitutional arrangements, but cross-sectional regressions tend to ignore those factors. Since village elections operate in thesame institutional framework and roughly the same set of social settings, a micro-level study has an advantage over cross-country studies.
Our studymakes use of a unique panel dataset with a sample of 48 villages from 8 Chinese provinces for the period 1986–2002.China began to experiment village elections in 1987 and enacted The Organizational Law of Village Committees (OLVC) to formalizethem in 1998. Since then, almost all Chinese villages have held at least one election. In the meantime, income inequality rose from0.29 in 1987 to 0.35 in 2000 in rural China (Riskin et al., 2002). Our data thus cover a critical period of both the election and incomedistribution. It is also noteworthy that the election operates in what Daron Acemoglu calls “a weakly institutionalized polity”(Acemoglu, 2005) because no direct elections are found beyond the village in China. That is, village elections in China face extraconstraints imposed by the authoritarian nature of the Chinese state, so it remains a question as to whether the elections couldbring real power to the villagers in the first place. In this regard, our study contributes to the understanding of decentralizedgovernance in a weakly institutionalized polity.
To avoid the complexities arising from political cycles, we focus on the effects of the introduction of the first election. Weestimate both a static fixed-effect panel model and a dynamic panel model on the within-village Gini coefficient to pin downthem. We also deal with the endogeneity of the introduction of elections with the instrumental variables (IV) method. Inaddition to the Gini coefficient, we also study how elections affect the income shares of the lower income percentiles ofpopulation. Moreover, we explore the channels, i.e., by more income redistribution or by more public investment, for electionsto reduce income inequality.
The rest of the paper is organized as the follows. Section 1 provides a brief introduction to village elections in China. Section 2introduces the data and some key descriptive results. Section 3 presents the main results concerning the impacts of elections onincome distribution. Section 4 is comprised of two parts. The first part studies the effects of elections on income redistribution, andthe second part studies the effect of elections on public investment. Section 5 concludes.
1. A brief introduction to village elections in rural China
The Chinese commune system was dissolved in the early 1980s. The commune as an administrative unit was replaced by thetownship, and the production brigade under the commune was replaced by the village committee (VC). The 1982 Constitutiondefines the village committee as a self-governing body of the villagers (Clause 111). However, committee members had beenappointed rather than elected except in a few localities. In 1987, under the leadership of Vice Chairman Peng Zhen, the NationalPeople's Congress (NPC), the Chinese legislative body, passed a tentative version of the OLVC that required the village committee beelected. This law triggered elections in Chinese villages. By 1994, half of the Chinese villages had begun elections. By 1997, 25 of the31 mainland provinces had adopted a local version of the law, and 80% of the villages had begun elections (Ministry of Civil Affairs,1998). In 1998, the formal version of the OLVC was passed by the NPC and the election has since spread quickly to virtually all thevillages.
The VC is comprised of three to seven members depending on the size of the village. The core members are the chairman,vice chairman, and accountant. Before 1998, candidates for the chairman were usually appointed by the township governmentalthough popular nomination, a mixture of government appointment and popular nomination, and nomination by villagerrepresentatives also existed. The formal version of the OLVC requires that candidates be nominated by villagers, and theminimum number of villagers to propose a candidate is ten. A primary election, then, is held to reduce the number ofcandidates to two, and the formal contest is run between these two frontrunners. This version of election is popularly calledhai-xuan. Since 1998 hai-xuan has become more popular. The term of the committee is three years but no term limit isrequired.
1 For a recent and comprehensive study, see Branko Milanovic and Yvonne Ying (2001) and the references therein.

2184 Y. Shen, Y. Yao / Journal of Public Economics 92 (2008) 2182–2198
Village elections in China operate in a weak institutional environment. In a typical village, the elected VC faces two majorchallenges that may hinder its ability to serve the wills of the villagers. The first is its relationship with the communist partycommittee in the village. Despite the fact that the party committee is not popularly elected, the OLVC stipulates that the VC workunder the leadership of the party committee, reflecting the nature of China's one-party system. Since he/she is appointed by thehigher authority, the party secretary often pursues a different agenda than the VC's. Backed by popular votes, however, thechairman of the VC often defies the direction of the party secretary, but the result of the contest is not always in his favor (Oi andRozelle, 2000; Guo and Bernstein, 2004). To reconcile the conflicts between the VC and the party secretary, the centralgovernment has begun to encourage the latter to run for the VC chairman in elections. While this will ease the tension inside thevillage (Guo and Bernstein, 2004), the VC still needs to face a second challenge that comes from above. Since village electionsoperate in an authoritarian institutional environment, where the upper-level governments, the township and countygovernments in particular, are not elected and often intrude in village elections and other village affairs, their effectiveness toserve the wills of the villagers has been called in doubt. Evidence does show that informed local people tend not to trust theelection. For example, in a survey conducted in Fujian province, Yang Zhong and Jie Chen (2002) found that it was the villagerswho had low levels of internal efficacy and democratic values that were more likely to participate in elections, and those withhigher levels of internal efficacy and democratic orientation stayed away from elections due to their awareness of theinstitutional constraints placed on them.
The above two challenges raise the question as to whether elections would enhance the VC's accountability to the localpopulation. This question is compounded by the possibility of elite capture inside the village. Rising business elites have beenfrequently found to dominate village elections (Liu et al., 2001). Although there are not a priori reasons to believe thatbusiness elites would necessarily steer the VC to adopt pro-rich policies, this belief lingers within the Chinese academia andpolicy circles.
2. Data and descriptive evidence
2.1. Data
Our data come from two sources. One is the National Fixed-point Survey (NFS) maintained by the Research Center of RuralEconomy (RCRE), the Ministry of Agriculture, and the other is a retrospective survey conducted by ourselves in the spring of2003. The NFS was started in 1986 and has maintained a longitudinal survey frame of about 350 villages and 24,000households in all Chinese continental provinces. It adopted a mixture of typical and random sampling methods when it wasfirst started. The 29 provinces (Chongqing and Hainan were later separated from Sichuan and Guangdong, respectively) weredivided into three regions, east, central, and west. While the number of sample households was proportional to the populationin most provinces, some typical provinces in each region – eastern, central, and western – were given a larger sample size. A“typical” province is one whose characteristics (mainly income and cropping patterns) are about the average levels of theregion it belongs to. For example, Henan was regarded as a typical province in the central region. In each province, three stratawere identified. The first one, based on geographic topology, divided a province into three regions: plain, hilly, and moun-tainous. The second stratus consisted of counties that were divided into three groups by per-capita income: low, middle, andhigh. Several representative counties, i.e., counties with average characteristics (cropping pattern, population, and non-farmactivities) of their income group, were chosen for the sample. The last stratus was village. Within each county, one repre-sentative village was chosen for sampling. Within this chosen village, households were randomly sampled. There are about2600 counties in China; the NFS sample covers about 14% of them. The number of households surveyed in each village rangedfrom 50 to more than 100. These numbers would add up to reflect the population share of each geographic region in aprovince.
The NFS was intended to survey the same households all the time (that is also what “fixed-point” means). After 20 years inplace, however, about one third of the original households dropped out of the sample. One reason for the attrition is that thesample household migrated to the city. The other, and more important, reason is that the whole village dropped out because itwas annexed into a city. There have been roughly one fifth of the original villages that have dropped out. In contrast, only twocounties have dropped out. When drop-outs happened, replacements were made with survey units with similar char-acteristics of the drop-outs. However, the numbering of the replacements has not been properly handled. There are aconsiderable number of replacements that were assigned the same identification number of the survey units that they hadreplaced.
The NSF uses household bookkeeping to record household data. It collects detailed information on household pro-duction, consumption, asset accumulation, employment, and income. It also collects detailed village data covering a widerange of information on land, income, employment, and government revenue and spending. A nice feature of it is that itsurveys at least 50 households in a village so the calculation of the Gini coefficient can be carried out with reasonableaccuracy.
The 2003 retrospective survey was conducted on 1354 households in 48 villages of 8 provinces. From south to north, they areGuangdong, Hunan, Zhejiang, Henan, Sichuan, Gansu, Shanxi, and Jilin. They were deliberately selected to cover a wide range ofgeographic, economic, and social diversities. In particular, Guangdong and Zhejiang are located at China's coast andmore advancedthan the other provinces; Hunan, Henan, Sichuan, and Jilin represent the average province in the country; and Gansu and Shanxiare two of the poorest provinces. One major task of the retrospective survey was to establish a panel structure for the NFS data.

2 After the rural reform, Chinese land tenure has been characterized by a two-tier systemwith the village having the legal rights to land and households havingthe use rights. Villages have engaged in periodic land redistribution to maintain a roughly egalitarian distribution of land based on family population (Liu et al1998).
3 When the NPC passes a law that involves government actions, each province enacts a local law that specifies the details of the implementation of the centralaw. It is noteworthy that most provinces adopted the OLVC even when it was in the experimental stage.
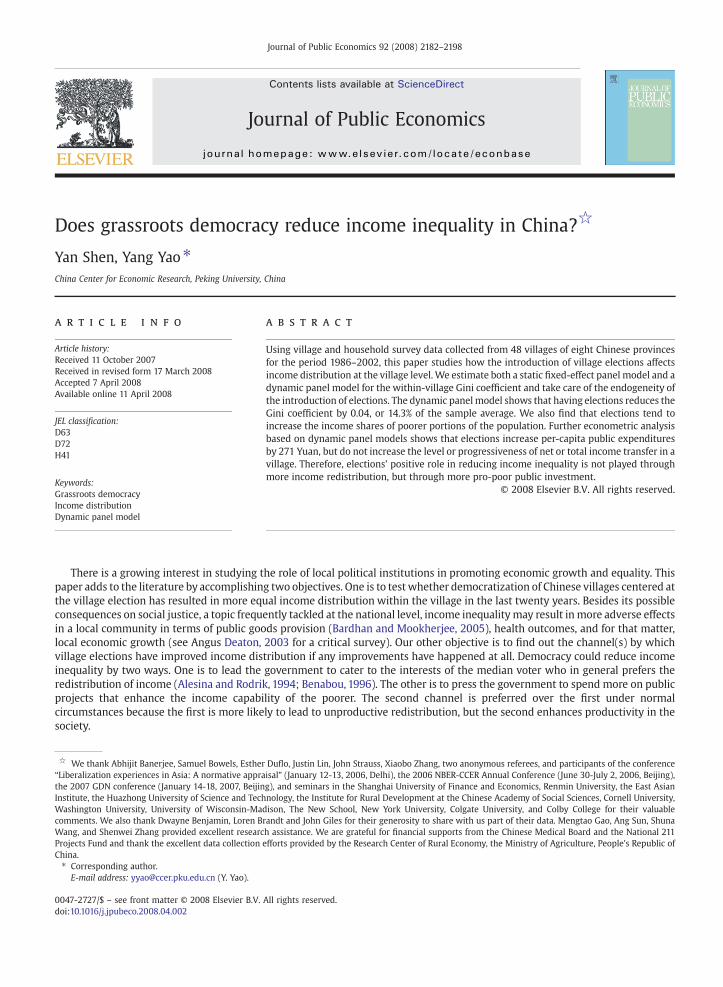
Fig. 1. Introduction of village election in the sample villages.
2185Y. Shen, Y. Yao / Journal of Public Economics 92 (2008) 2182–2198
Miss-numbering made it impossible to retrieve the panel structure directly from the NFS data. We then used three householdcharacteristics to match households through time: the building area of the house, the amount of land, and the number of landparcels. The building area of the house was used to identify households that had been split. It is usually the case that ruralhouseholds build new houses or expand old houses for their sons' marriages, which often leads to splits. NFS continues to surveyone of the split households. However, the split households may not be regarded as the same as the old household because theircharacteristics change dramatically. The amount of land and the number of land parcels are also important criteria because thechange of landholding should be small between two consecutive years although it could happen due to reallocation of land withinthe village.2 Using these three criteria, we calculated the Euclidean distance, i.e., the square-root of the sum of the squareddifferences, between two observations of consecutive years with the same household identification number. Those with a distancelarger than the medianwere dropped from the sample. The remaining observations were checked manually by the names of theirhousehold heads and other family characteristics. Household-year observations were kept in the sample if they shared the samehousehold head or experienced minor changes in household characteristics. Other households were dropped. Villages with fewmatched households were also dropped. This process required intensive manual reading and subjective judgments by the authors.The matched households were checked again in the survey to make sure that they had stayed in the survey for the entire sampleperiod. Notice that the households that we surveyed were a subset of the NFS sample households in a village. We will use the NFSsample to calculate the Gini coefficient because it hasmore households. For household-level panel analysis, wewill use our smallersample.
All the household-level data used in this study come from the NFS survey. So do most village-level data except those onelections which come from the retrospective survey. The village questionnaire of the survey was administered on the villagecommittee asking information about village elections, healthcare plans, and other kinds of public interventions. Later, phoneinterviews also retrieved information on village lineages and other information.
We have village-level data for the period of 1986–2002 and household-level data for the period of 1987–2002. Most of ourregressions are thus for the period of 1987–2002. The NFS did not conduct surveys in 1990, 1992, and 1994, so data for those threeyears are missing. We use the average of the nearby two years to make up the missing data in our analysis.
2.2. Village elections
Except a few cases of interruptions, our sample villages had held elections every three years as long as they had started them. Sothe introduction of the first election is the key. Fig. 1 presents the number of villages having started elections and theiraccumulative percentage in each year. The year 1987 was the start of village elections in China. Twelve villages in our sample hadtheir first election in that year. Except Hunan and Guangdong, all the other six provinces had some villages holding elections in thatyear.
The introduction of elections had a clear regional pattern. After the central government put the OLVC in experiment in 1988,provinces began to enact local laws to specify the details of the implementation of the law.3 However, the adoption of the
.,
l

Table 1Adoption of the OLVC in sample provinces
Guangdong Hunan Zhejiang Henan Sichuan Gansu Shanxi Jilin
Year adopting OLVC 1998 1989 1988 1992 1991 1989 1991 1991Median year of first election 1999 1988 1989 1991 1989 1995 1993 1989St. dev. of year of election 0.5 1.7 3.9 4.6 1.7 6.8 4.6 2.7
Source: survey data.
4 Guangdong adopted the OLVC in 1999. Before that year, Guangdong did not treat the village as a self-governing administrative unit, but rather a delegatedbranch of the township government. That is why it had not adopted the law.
5 Notice that in Hunan, Henan, Sichuan, and Jilin, the median year of election was earlier than the year of adopting the OLVC. It seems that these provinceswaited after some experiments to provide the implementation details of the law.
6 Benjamin, Brandt, and Giles (2005) study the period 1987-1999 and provide histograms for 1987 and 1999. Our distributions are slightly skewed toward thehigher end than their distributions. For example, the modes of their 1987 and 1999 distributions are about 0.18 and 0.21, respectively, whereas ours are o.23 and0.25, respectively. However, our distributions and their distributions also share some commonalties. For example, the mode is smaller than the median and themode moved by about the same amount from 1987 to 1999 in both our and their distributions. The number of villages in our sample is about half of their sampleso these differences and similarities are in acceptable range.
2186 Y. Shen, Y. Yao / Journal of Public Economics 92 (2008) 2182–2198
election in villages of the same province was not uniform. Some began elections before the province adopted the OLVC, andsome after. Table 1 presents the year for each sample province to adopt the OLVC and the median and standard deviation of theyear of the first election in its villages. Except Guangdong, a rich province in the sample, all the other provinces adopted theOLVC in the period 1988–1992.4 The median year of the first election was close to the year when a province adopted the OLVC,and the standard deviation was small in most provinces although Henan, Gansu, and Shanxi had large ones.5 In Gansu, thepoorest province in the sample, villages started elections much later than the province adopted the OLVC. By 2003, there wasstill one village in the province that had not started elections. This shows that at least in some provinces local initiatives played arole in starting elections in a village, which raises the possibility that the introduction of elections was endogenous. To addressthis issue, we will find instruments for the first election and perform two-stage estimations for it. The nice feature of our data isthat high-income and low-income villages were mixed in terms of the timing of the first election. The introduction of theelection is an irreversible process, so if the timing of the first election were closely associated with the income level, it would behard to distinguish between the true effects of elections and the effects of income. The mixed nature of our data helps us getaround this problem.
2.3. Trends of income distribution
We use the Gini coefficient to describe income distribution in a village. Income is per-capita household net income provided bythe NFS household survey. Household net income is defined as household income (earned income and net transfer from thegovernment) net of operational costs. We have converted it into 2002 Yuan using the rural CPI published in China StatisticalYearbook. We calculate the Gini coefficient for each village in each year using the original NFS sample. The calculation is based onindividuals, so people from the same household have the same income (i.e., the household per-capita income). Fig. 2 plots theaverage Gini coefficients of the 48 villages during 1987–2002. We have patched up the figures for 1990, 1992, and 1994 with theaverages of the nearest two years. There is apparently an increasing trend of income inequality in the study period. The Ginicoefficient rose from 0.26 in 1987 to 0.28 in 1992, and then to 0.32 in 2001, and 0.31 in 2002. This trendmatches the national trend.The Gini coefficient in rural China increased from 0.29 in 1987 to 0.35 in 2000 (Riskin et al., 2002). It is understandable that ourestimates of the Gini coefficient are smaller than the estimates for thewhole country. However, the growth of the Gini coefficient inour samplewas quite close to that at the national level: it grew by 0.05 in 15 years in our sample and grew by 0.06 in 13 years at thenational level.
Using data of nine provinces from the NFS survey (seven overlap with our provinces), Dwayne Benjamin, LorenBrandt, and John Giles (2005) have carefully documented the evolution of income inequality in rural China. In additionto using the rural CPI to deflate income, they also provided spatially deflated estimates. Fig. 3 provides the histograms ofour estimates of the Gini coefficients in 1987, 1999, and 2002. They largely agree with the histograms provided byBenjamin, Brandt, and Giles (2005) except minor differences,6 and show that income distribution was becoming moreunequal.
To provide a fuller picture of the within-village income distribution, Fig. 4 presents the Lorenz curves for 1987, 1999, and 2002.The curves are drawn using the average income shares for each year. There are no crossings between any two of the three curves, soincome distribution was unambiguously becoming more unequal. In particular, the shares of income of the lower ten and twentypercent of population decreased from 4.91% to 3.38% and from 10.9% to 8.37%, respectively. The introduction of elections is anirreversible event, so it is important to avoid capturing the time trend in estimating its effects on income inequality. Since income
,

Fig. 2. Trend of the Gini coefficient in the sample villages: 1987–2002.
Fig. 3. Histograms of the Gini in 1987, 1999, and 2002. Notes: The number for each bar in the figures is the average of the Ginis represented by the bar.
2187Y. Shen, Y. Yao / Journal of Public Economics 92 (2008) 2182–2198
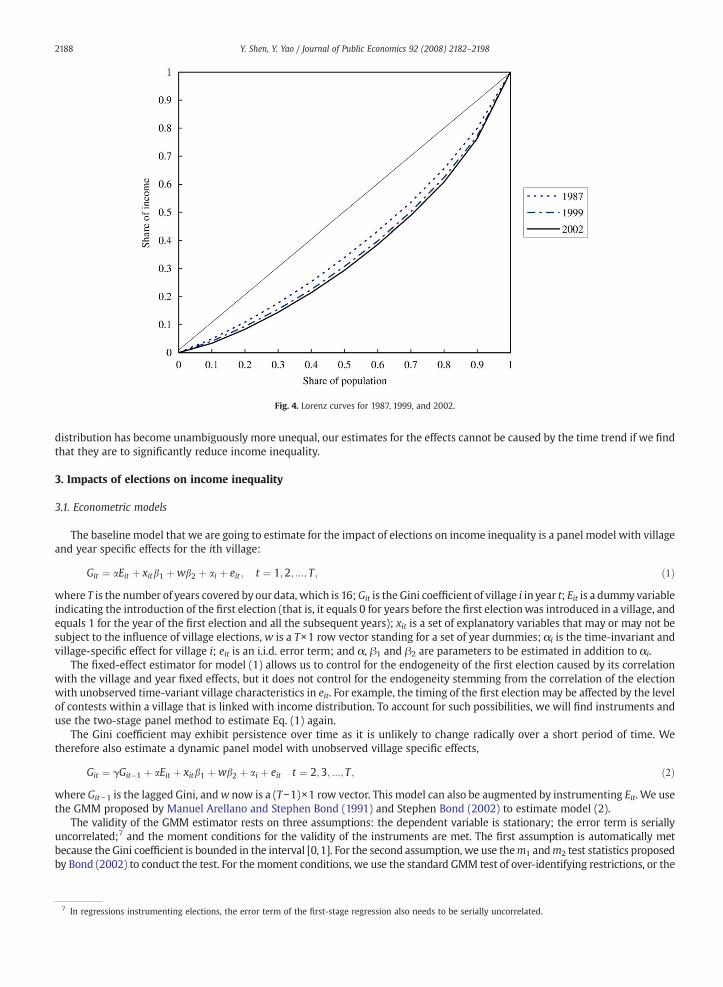
Fig. 4. Lorenz curves for 1987, 1999, and 2002.
7 In regressions instrumenting elections, the error term of the first-stage regression also needs to be serially uncorrelated.
2188 Y. Shen, Y. Yao / Journal of Public Economics 92 (2008) 2182–2198
distribution has become unambiguously more unequal, our estimates for the effects cannot be caused by the time trend if we findthat they are to significantly reduce income inequality.
3. Impacts of elections on income inequality
3.1. Econometric models
The baseline model that we are going to estimate for the impact of elections on income inequality is a panel model with villageand year specific effects for the ith village:
Git ¼ aEit þ xitb1 þwb2 þ ai þ eit ; t ¼ 1;2; :::; T; ð1ÞT is the number of years covered by our data, which is 16;Git is the Gini coefficient of village i in year t; Eit is a dummy variable
whereindicating the introduction of the first election (that is, it equals 0 for years before the first electionwas introduced in a village, andequals 1 for the year of the first election and all the subsequent years); xit is a set of explanatory variables that may or may not besubject to the influence of village elections, w is a T×1 row vector standing for a set of year dummies; αi is the time-invariant andvillage-specific effect for village i; eit is an i.i.d. error term; and α, β1 and β2 are parameters to be estimated in addition to αi.
The fixed-effect estimator for model (1) allows us to control for the endogeneity of the first election caused by its correlationwith the village and year fixed effects, but it does not control for the endogeneity stemming from the correlation of the electionwith unobserved time-variant village characteristics in eit. For example, the timing of the first election may be affected by the levelof contests within a village that is linked with income distribution. To account for such possibilities, we will find instruments anduse the two-stage panel method to estimate Eq. (1) again.
The Gini coefficient may exhibit persistence over time as it is unlikely to change radically over a short period of time. Wetherefore also estimate a dynamic panel model with unobserved village specific effects,
Git ¼ gGit�1 þ aEit þ xitb1 þwb2 þ ai þ eit t ¼ 2;3; :::; T ; ð2ÞGit −1 is the lagged Gini, andw now is a (T−1)×1 row vector. This model can also be augmented by instrumenting Eit. We use
wherethe GMM proposed by Manuel Arellano and Stephen Bond (1991) and Stephen Bond (2002) to estimate model (2).The validity of the GMM estimator rests on three assumptions: the dependent variable is stationary; the error term is serially
uncorrelated;7 and the moment conditions for the validity of the instruments are met. The first assumption is automatically metbecause the Gini coefficient is bounded in the interval [0,1]. For the second assumption, we use them1 andm2 test statistics proposedby Bond (2002) to conduct the test. For the moment conditions, we use the standard GMM test of over-identifying restrictions, or the

2189Y. Shen, Y. Yao / Journal of Public Economics 92 (2008) 2182–2198
Sargan test. Under the null that the moment conditions are valid, the Sargan statistic has an asymptotic chi-square distribution.Because the number of total instruments is different in difference estimations, in this paper we provide the p-value of each of theSargan statistics.
3.2. Control variables
We have included in xit per-capita income, its square, village population (in logarithm), share of emigrant workers,unemployment rate, and the coefficients of variation of household size, average schooling years of adult household members,household per-capita landholding, and number of wage earners in a household. Per-capita income and its square are included tocapture the Kuznets curve. Village population is included to control for the possibility that the Gini coefficient is linked to villagesize (for example, households in a larger village tended to be more heterogeneous so income inequality could be higher). Anemigrant worker is a person who works more than six months outside his own county. Share of emigrant workers is includedbecause it is found in the literature that it is the more educated people that are more likely to migrate to the city (Zhao, 1999),whichmay have different impacts onwithin-village income distribution depending on the nature of emigration. If people emigrateby families, then a village with a larger share of emigrants will have a more equal income distribution. But if emigration is seasonalor the amount of remittance is large, then a village with more emigrants will have a more unequal income distribution becauseemigrants' education usually has a larger return in their destinations than in their home villages. The NFS counts 300 days ofunemployment as one unemployed person and the unemployment rate is defined as the share of unemployed persons in the totalnumber of laborers in a village. It is natural to expect that a village with a higher unemployment rate would have a more unequalincome distribution because it is the poorer portion of the population that are more likely to be unemployed. The four coefficientsof variation (CVs) are included to control village variations along multiple dimensions of income sources. Supposedly, the Ginicoefficient would become larger as the households become more dispersed along these dimensions. Descriptive statistics of thevariables as well as the Gini coefficient and the election dummy are provided in Table 2.
Some further discussions about the control variables are warranted for their relationships with the estimation of the effect ofelections. Supposedly, elections can reduce income inequality in two broad ways. One is the direct way inwhich the elected villagecommittee either increases income transfers to the poor or invests more in pro-poor public projects. The other way is indirect andmay be specific to the Chinese reality. After the rural reform began at the end of the 1970s, the Chinese land tenure has become atwo-tier system in which land is legally owned by the village but farmed by individual farmers. The village has the right toredistribute land periodically in response to demographic changes so land distribution can bemaintained at a relatively egalitarianmanner (Dong, 1996). Therefore, one source of elections' positive effects in reducing income inequality could be that the electedvillage committee redistributes village land to the advantage of the poor. Another source could be that the elected villagecommittee raises the education of the poor, and a third source could be for the committee to spendmore resources to generate jobs
Table 2Summary statistics for variables
Variable Mean Std. Dev. Min Max
Village variables (48 villages for the period 1987–2002)Gini coefficient 0.28 0.08 0.09 0.69Lower 10% income share (%) 4.29 1.78 0.00 12.27Lower 20% income share (%) 9.69 2.99 0.00 17.85Lower 30% income share (%) 16.10 4.10 2.02 26.70Lower 40% income share (%) 23.43 5.20 3.10 36.78Election dummy 0.7 0.46 0 1Per-capita net income (1000 Yuan) 6.42 12.39 0.37 119.78Village population (logarithm) 7.06 0.71 5.46 8.57Share of emigrant workers (%) 14.51 13.42 0.00 65.91Unemployment rate (%) 0.18 0.69 0.00 17.09CV of household size 0.34 0.08 0.12 0.79CV of household adults' average schooling years 0.35 0.11 0.04 1.00CV of per-capita household landholding 0.58 0.72 0.04 5.57CV of number of household wage earners 2.05 1.45 0.00 5.57Per-capita public expenditures (1000 Yuan) 0.39 2.98 0.00 82.07
Household variables (1,111 households for the period of 1987–2002)Per-capita net transfer income 64.3 286.70 −349.9 2439.77Per-capita total transfer income 97.04 283.2 0 2519.29Per-capita net earned income (1000 Yuan) 2.32 2.47 −12.10 113.32Per-capita landholding (mu) 1.36 1.89 0.00 24.00Average age 31.70 9.56 8.20 82.50Male ratio 0.55 0.21 0.00 1.00Average schooling years of adults 5.20 1.87 0.00 12.00
Notes: All financial data are measured in 2002 Yuan using the rural CPI published by China Statistical Yearbook as the deflator. Net income is household income neof operational cost, taxes, and fees, plus transfer income. Taxes are income handed over to higher-level governments above the village. Fees are collected to financethe operation of the village government and village public good provision. The exchange rate between Yuan and US dollar is 7.11 Yuan to 1 dollar as of March 2008One mu is one fifteenth of a hectare. Per-capita public expenditures are for 1986–2002.
t
.

2190 Y. Shen, Y. Yao / Journal of Public Economics 92 (2008) 2182–2198
for the poor. By including the CVs of landholding, adult education, and the number of wage earners, our econometric modelsprovide an estimate for the direct (marginal) effect of elections. In addition to this direct effect, we will also estimate our model bytaking out all the control variables. This will give us the estimate for the gross effect of elections, that is, the sum of its direct andindirect effects.
3.3. Instruments
For the IV estimation of both the static and dynamic models, we find three instruments for the election dummy: a dummyindicating whether a province has adopted the OLVC and two variables describing lineages in a village: the number of surnamesand the percentage of population of the largest surname in a village. While the use of the first variable is self-evident, someexplanations are needed for the last two variables. Since parties other than the communist party are not allowed, villagers have tofind other vehicles for political mobilization. Although the role of lineages has diminished considerably in village life after theharsh suppression happening between 1949 and 1978, it seems that organizing along the line of lineages is a natural choice of thecandidates when it comes to competing for votes in elections. Many studies found that lineages played a significant role in thevillage political life (Huang, 1998; Dong, 2002; Liu et al., 2001). There can be two kinds of story for the roles of the two lineagevariables to play in elections. One is based on the premise that families with the same surname share common interests becausethey belong to the same lineage. When the number of surname is large, contests of interests could become more intensified so thedemand for elections becomes higher. On the other hand, the dominance of a single surname would defuse the need for electionsas people in the village tend to share the same interests from the beginning. The other kind of story recognizes the problem ofcoordination. When a village has many surnames and is not dominated by a large surname, it could be difficult for it to evenorganize an election. Both stories, however, indicate that lineages are important factors affecting the timing of the first election.Zhang et al. (2004) also used our two variables of surnames as instruments for the introduction of elections.We improve upon theirwork by adding a province's adoption of the OLVC as another instrument. Since the distribution of surnames does not change in ameaningful way over time, we interact the two variables of surnames with the provincial adoption dummy and use them togetherwith the latter in the first-stage regressions. This gives us the advantage to do the first-stage regressions also using the two-wayfixed-effect model.
There is a possibility that lineages also have a direct impact on income distribution because risk and income sharing mayhappen within a surname. However, Huang (1998) found that income sharing was weak among kinship groups; instead, “[t]heconnection and interaction between kin members nowadays is becoming more based on individual interests than merely onreciprocity and the obligation to aid one another.” (Huang, 1998; pp. 188) Even if income sharing happens among the samesurname, the scope of reciprocity is likely to be confined within a small number of closely knitted families.8 In this case, incomeinequality within the entire village may not be reduced by income sharing, just like club convergence does not necessarily lead toσ-convergence of income in the world. Therefore, we contend that the two lineage variables are reasonable instruments for theintroduction of village elections.
Variations in these two variables are large. The smallest number of surnames was 1, but the largest was 147, with the averagebeing 18.4. The smallest population share of the largest surnamewas 7% while the largest was 100%, with the average being 43.2%.When we run a regression of the election dummy on the three instruments and the village and year dummies using the linearprobability model, we yield an R2 of 0.68 and an F-statistic of 21.0. All the three instruments are highly significant. The adoption ofthe OLVC by a province increases the chances of its villages to start elections by 26%. Conditional on the adoption of the OLVC at theprovincial level, the chances of having elections increase by 0.2% for one percent increase of the population share of the largestsurname, but decrease by 0.4% for one more surname in the village. So it seems that the coordination story makes more sense. Onthe other hand, we have also found that none of the three instrumental variables are significantly correlated with the village Ginicoefficient. Therefore, they are reasonable instruments.
3.4. Results for the Gini coefficient
The results of the static models are presented in Table 3. The number of observations is 707 after observations withmissing dataare dropped.We run four regressions. Regressions (1) and (2) treat the introduction of elections as exogenous and estimate its totaland direct effects, respectively, and regressions (3) and (4) estimate the two effects again, but treat elections as endogenous.Regression (1) shows that elections reduce the Gini coefficient by 0.015, and the effect is significant at the 5% significance level.However, regression (2) finds that the effect of elections is highly insignificant. This shows that there are significant correlationsbetween elections and the control variables. These correlations are either a result of the interaction between elections and thecontrol variables or a result of their correlationswith some other common uncontrolled factors. It seems that the second possibilityis more plausible because by using IVs for elections, regressions (3) and (4) show that the total and direct effects of elections areboth significant at the 1% significance level. Regression (3) shows that the gross effect is −0.087, and regression (4) shows that thedirect effect is −0.074. To choose between these models, we rely on Hausman statistic to test the endogeneity of the electiondummy. As it is often of interest to just compare the estimates of the parameters of interest rather than comparing the estimates ofa linear combination of the parameters (Wooldridge, 2002), we test the endogeneity of elections by just comparing the estimates
8 Ssee Mobo Gao (1999) for an account of the migrant networks in his home village as well as Huang (1998)'s case study on the kinship in private firms.
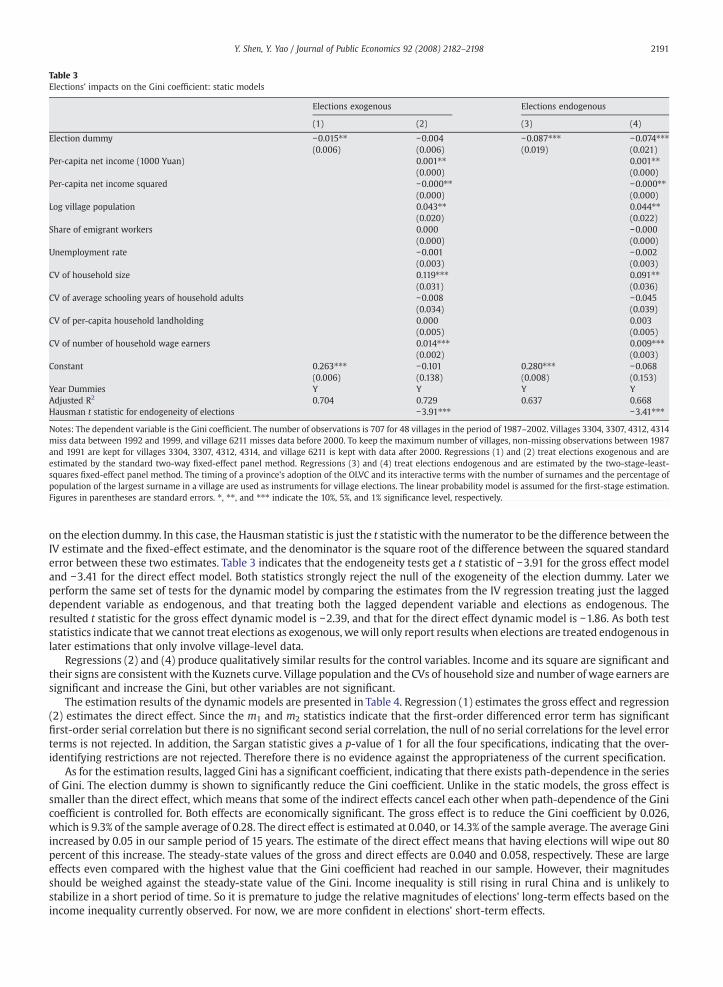
Table 3Elections' impacts on the Gini coefficient: static models
Elections exogenous Elections endogenous
(1) (2) (3) (4)
Election dummy −0.015⁎⁎ −0.004 −0.087⁎⁎⁎ −0.074⁎⁎⁎(0.006) (0.006) (0.019) (0.021)
Per-capita net income (1000 Yuan) 0.001⁎⁎ 0.001⁎⁎(0.000) (0.000)
Per-capita net income squared −0.000⁎⁎ −0.000⁎⁎(0.000) (0.000)
Log village population 0.043⁎⁎ 0.044⁎⁎(0.020) (0.022)
Share of emigrant workers 0.000 −0.000(0.000) (0.000)
Unemployment rate −0.001 −0.002(0.003) (0.003)
CV of household size 0.119⁎⁎⁎ 0.091⁎⁎(0.031) (0.036)
CV of average schooling years of household adults −0.008 −0.045(0.034) (0.039)
CV of per-capita household landholding 0.000 0.003(0.005) (0.005)
CV of number of household wage earners 0.014⁎⁎⁎ 0.009⁎⁎⁎(0.002) (0.003)
Constant 0.263⁎⁎⁎ −0.101 0.280⁎⁎⁎ −0.068(0.006) (0.138) (0.008) (0.153)
Year Dummies Y Y Y YAdjusted R2 0.704 0.729 0.637 0.668Hausman t statistic for endogeneity of elections −3.91⁎⁎⁎ −3.41⁎⁎⁎
Notes: The dependent variable is the Gini coefficient. The number of observations is 707 for 48 villages in the period of 1987–2002. Villages 3304, 3307, 4312, 4314miss data between 1992 and 1999, and village 6211 misses data before 2000. To keep the maximum number of villages, non-missing observations between 1987and 1991 are kept for villages 3304, 3307, 4312, 4314, and village 6211 is kept with data after 2000. Regressions (1) and (2) treat elections exogenous and areestimated by the standard two-way fixed-effect panel method. Regressions (3) and (4) treat elections endogenous and are estimated by the two-stage-least-squares fixed-effect panel method. The timing of a province's adoption of the OLVC and its interactive terms with the number of surnames and the percentage ofpopulation of the largest surname in a village are used as instruments for village elections. The linear probability model is assumed for the first-stage estimation.Figures in parentheses are standard errors. ⁎, ⁎⁎, and ⁎⁎⁎ indicate the 10%, 5%, and 1% significance level, respectively.
2191Y. Shen, Y. Yao / Journal of Public Economics 92 (2008) 2182–2198
on the election dummy. In this case, the Hausman statistic is just the t statistic with the numerator to be the difference between theIV estimate and the fixed-effect estimate, and the denominator is the square root of the difference between the squared standarderror between these two estimates. Table 3 indicates that the endogeneity tests get a t statistic of −3.91 for the gross effect modeland −3.41 for the direct effect model. Both statistics strongly reject the null of the exogeneity of the election dummy. Later weperform the same set of tests for the dynamic model by comparing the estimates from the IV regression treating just the laggeddependent variable as endogenous, and that treating both the lagged dependent variable and elections as endogenous. Theresulted t statistic for the gross effect dynamic model is −2.39, and that for the direct effect dynamic model is −1.86. As both teststatistics indicate that we cannot treat elections as exogenous, wewill only report results when elections are treated endogenous inlater estimations that only involve village-level data.
Regressions (2) and (4) produce qualitatively similar results for the control variables. Income and its square are significant andtheir signs are consistent with the Kuznets curve. Village population and the CVs of household size and number of wage earners aresignificant and increase the Gini, but other variables are not significant.
The estimation results of the dynamic models are presented in Table 4. Regression (1) estimates the gross effect and regression(2) estimates the direct effect. Since the m1 and m2 statistics indicate that the first-order differenced error term has significantfirst-order serial correlation but there is no significant second serial correlation, the null of no serial correlations for the level errorterms is not rejected. In addition, the Sargan statistic gives a p-value of 1 for all the four specifications, indicating that the over-identifying restrictions are not rejected. Therefore there is no evidence against the appropriateness of the current specification.
As for the estimation results, lagged Gini has a significant coefficient, indicating that there exists path-dependence in the seriesof Gini. The election dummy is shown to significantly reduce the Gini coefficient. Unlike in the static models, the gross effect issmaller than the direct effect, which means that some of the indirect effects cancel each other when path-dependence of the Ginicoefficient is controlled for. Both effects are economically significant. The gross effect is to reduce the Gini coefficient by 0.026,which is 9.3% of the sample average of 0.28. The direct effect is estimated at 0.040, or 14.3% of the sample average. The average Giniincreased by 0.05 in our sample period of 15 years. The estimate of the direct effect means that having elections will wipe out 80percent of this increase. The steady-state values of the gross and direct effects are 0.040 and 0.058, respectively. These are largeeffects even compared with the highest value that the Gini coefficient had reached in our sample. However, their magnitudesshould be weighed against the steady-state value of the Gini. Income inequality is still rising in rural China and is unlikely tostabilize in a short period of time. So it is premature to judge the relative magnitudes of elections' long-term effects based on theincome inequality currently observed. For now, we are more confident in elections' short-term effects.

9 For example, the Chinese government began to seriously implement the nine-year compulsory education policy in the countryside only after the mid-1990sIn the same time, government investment in rural roads and power supply has been increased dramatically. As a response to the widened urban-rural incomegap, the central government also introduced an agricultural subsidy program at the end of the 1990s. All these policies may benefit the poorer more than thericher in the countryside.
Table 4Elections' impacts on the Gini coefficient: dynamic models
(1) (2)
Lagged Gini 0.352⁎⁎⁎ 0.295⁎(0.097) (0.152)
Election dummy −0.026⁎ −0.040⁎⁎(0.015) (0.016)
Per-capita net income (1000 Yuan) 0.002⁎⁎(0.001)
Per-capita net income squared −0.908e−6(0.839e−6
Log village population −0.007(0.037)
Share of emigrant workers (%) 0.001(0.002)
Unemployment rate (%) 0.001(0.001)
CV of household size 0.194(0.182)
CV of average schooling years of household adults −0.016(0.055)
CV of per-capita household landholding 0.016(0.019)
CV of household wage earners 0.003(0.002)
Constant 0.004⁎⁎⁎ 0.003⁎⁎(0.001) (0.001)
Year Dummies Y Y
m1 −3.36 −2.55m2 0.66 0.49Sargan p-value 1.000 1.000
Notes: The dependent variable is the Gini coefficient. The sample is the one used by the regressions reported in Table 3. All results are estimated using the two-stepGMMmethod proposed by Arellano and Bond (1991), and Bond (2002). Year dummies are included in all models. Both regressions treat elections endogenous. Thetiming of a province's adoption of the OLVC and its interactive terms with the number of surnames and the percentage of population of the largest surname in avillage are used as instruments for village elections. The linear probability model is assumed for the first-stage estimation. Figures in parentheses are robusstandard errors. ⁎, ⁎⁎, and ⁎⁎⁎ indicate the 10%, 5%, and 1% significance level, respectively.
2192 Y. Shen, Y. Yao / Journal of Public Economics 92 (2008) 2182–2198
)
t
The above results of elections may suffer from the problem that the introduction of elections might have been concurrent withthe implementation of some government policies that reduce income inequality in the countryside.9 This problemmay have a bitebecause by 1999 all but two villages had introduced elections so our panel estimates for elections' impacts lose counterfactuals.Here we adopt a simple approach to tackle this problem, which is to rerun our regressions on a sub-sample of 1987–1998. By 1998there were 8 villages in the sample that had not introduced elections so our panel estimation has a relatively large set ofcounterfactuals. The results of the dynamic model regressions are presented in Table 5. Them1 andm2 statistics show no evidenceof first-order serial correlations for the level error terms and the Sargan statistic indicates that the over-identifying restrictions arenot rejected. The results largely agree with those shown in Tables 3 and 4 although there are more significant results among themthan among those in Table 4. In particular, both the gross and direct effects of elections remain significant. The sizes of estimates aresmaller thanwhat are found with the full sample, but are still substantial. The gross effect is to reduce the Gini coefficient by 0.015,which is 5.6% of the sample mean of 0.27 for the period of 1987–1998, and 50% of the growth of the Gini coefficient in the sameperiod. In addition, the statistical significance of the gross effect has been raised from 10% in the full sample to 1% in the currentsub-sample. Therefore, our estimates for elections' effects on income distribution cannot be attributed to the concurrentintroduction of pro-poor government policies and village elections.
3.5. Results for the poorer population
The Gini coefficient is a measure of the overall inequality and improvements on it may not be a direct result of improvementsmade to the income shares of the poorest portions of the population. To show that elections improve income distribution throughgenuinely pro-poor policies, we need to prove that they increase the income shares of the lower percentiles of population. For that,we study elections' impacts on the income shares of the lower 10%, 20%, 30%, and 40% of population and present selected results inTable 6 (the basic statistics of the dependent variables can be found in Table 2).
.

Table 5Dynamic models: 1987–1998 sub-sample
(1) (2)
Lagged Gini 0.575⁎⁎⁎ 0.476⁎⁎⁎(0.049) (0.103)
Election dummy −0.015⁎⁎⁎ −0.021⁎(0.005) (0.011)
Per-capita net income (1000 Yuan) 0.001(0.001)
Per-capita net income squared −7.35e−06(8.44e−06
Log village population 0.049(0.070)
Share of emigrant workers (%) 0.0001(0.0002)
Unemployment rate (%) 0.002⁎(0.001)
CV of household size 0.026(0.026)
CV of average schooling years of household adults −0.150(0.107)
CV of per-capita −0.023⁎household landholding (0.012)CV of household wage earners 0.006⁎⁎⁎
(0.002)Constant 0.002⁎⁎⁎ 0.002⁎
(0.000) (0.001)
Year Dummies Y Y
m1 −4.01 −3.44m2 −1.67 −1.50Sargan p-value 1.000 1.000
Notes: The dependent variable is the Gini coefficient. The data range is from 1987 to 1998. After first differencing and taking lags 442 observations for 47villages are used in the estimations. All results are estimated using the two-step GMM method proposed by Arellano and Bond (1991), and Bond (2002). Yeadummies are included in all models. Both regressions treat elections endogenous. The timing of a province's adoption of the OLVC and its interactive terms withthe number of surnames and the percentage of population of the largest surname in a village are used as instruments for village elections. The lineaprobability model is assumed for the first-stage estimation. Figures in parentheses are robust standard errors. ⁎, ⁎⁎, and ⁎⁎⁎ indicate the 10%, 5%, and 1%significance level, respectively.
2193Y. Shen, Y. Yao / Journal of Public Economics 92 (2008) 2182–2198
)
r
r
For each income group, we estimate both the static and dynamicmodels, andwithin eachmodel we study both the gross and directeffect of elections. The specifications of the regressions are the same as those used for the Gini coefficient except now thedependent variables are changed to the shares of income. The static models show that elections have significantly positive grossand direct effects on the income shares of all the four income groups. The gross effects for the lower 10%, 20%, 30%, and 40% ofpopulation are, respectively, 37.3%, 25.8%, 26.1%, and 22.2% of their respective samplemeans. These are very large effects. The directeffects are only slightly smaller, and in the case of the lower 10% of population, the direct effect is even slightly larger than the grosseffect. It is also interesting to find that the effect is significantly larger for the lower 10% of population than for the other threegroups of population, and it is the smallest for the lower 40% of population. The results from the dynamic models aremuchweaker,though. Although all the estimates are still positive, but we find significant results only for the gross effects on the lower 10% and30% of population and for the direct effect on the lower 20% of population. However, even with those weaker results, the samepattern established by the static models still holds, i.e., elections tend to have more pronounced impacts on poorer groups than onricher groups of the population. In other words, elections improve income distribution more likely by leading to pro-poor policies.
4. Sources of elections' positive effects on income equality
We found in the last section that elections' positive effects on income equality remained after a set of variables of a reasonablerange were controlled for. That is to say, elections have a significant direct effect on income distribution. As we discussed before,the direct effect could come from two possible sources. One is for the village to engage in more pro-poor income transfers, and theother is to increase public investment that benefits the poor more. The first kind of actions is detrimental to economic growth(Alesina and Rodrik,1994), but the second kindmay help growth. In particular, if it is not financed bymore taxes but by reallocationwithin government budget from consumption to investment, public investment has a much larger chance to help growth.However, the NFS does not provide information on public investment. Instead, it provides information on village publicexpenditures. Public expenditures include three items: transfer income to households, spending on local public services such asschools and village clinics, and investment in productive projects such as roads and irrigation. The first item is incomeredistribution, and the other two items are public investment. NFS does not provide village-level information on these specificitems. However, its household survey provides information on the amount of fees that a household pays to the village and the

Table 6Elections' impacts on income shares of the lower 40% of population
Lagged dependent variable Election dummy
Lower 10%Static model: gross effect 0.016⁎⁎⁎
(0.004)Static model: direct effect 0.017⁎⁎⁎
(0.005)Dynamic model: gross effect 0.382⁎⁎⁎ 0.006⁎⁎⁎
(0.091) (0.002)Dynamic model: direct effect 0.141 0.003
(0.156) (0.004)
Lower 20%Static model: gross effect 0.025⁎⁎⁎
(0.007)Static model: direct effect 0.022⁎⁎⁎
(0.008)Dynamic model: gross effect 0.329⁎⁎⁎ 0.006
(0.113) (0.005)Dynamic model: direct effect 0.008 0.011⁎⁎
(0.182) (0.006)
Lower 30%Static model: gross effect 0.042⁎⁎⁎
(0.010)Static model: direct effect 0.038⁎⁎⁎
(0.011)Dynamic model: gross effect 0.511⁎⁎⁎ 0.015⁎⁎⁎
(0.117) (0.007)Dynamic model: direct effect 0.375 0.020
(0.260) (0.014)
Lower 40%Static model: gross effect 0.052⁎⁎⁎
(0.012)Static model: direct effect 0.046⁎⁎⁎
(0.014)Dynamic model: gross effect 0.339⁎⁎⁎ 0.010
(0.116) (0.010)Dynamic model: direct effect 0.311 0.003
(0.192) (0.019)
Notes: The dependent variables are shares of income in decimal terms. The regressions are based on data for 45 villages in the period of 1987–2002 with variousdata lengths. Both village and year fixed effects are included in each regression. All models are estimated treating the election dummy endogenous. Instrumentsand estimationmethods are the same as used in previous tables. Dynamic models pass all the tests. Results of other variables are not shown. Figures in parenthesesare robust standard errors. ⁎, ⁎⁎, and ⁎⁎⁎ indicate the 10%, 5%, and 1% significance level, respectively.
10 Villages also collect taxes for higher level governments. They cannot use taxes to finance local affairs, nor can they change the rate of taxation.
2194 Y. Shen, Y. Yao / Journal of Public Economics 92 (2008) 2182–2198
amount of income that a household receives from the village.10 Fees are collected by the village to finance village affairs, includingthe operational costs of the village committee and public expenditures.
Using the available village and household-level information, we form a strategy to test whether elections have improvedincome distribution by more redistribution of income or by more public investment. We will first study how village electionschange the amount of net transfer income that a household gets from the village. Net transfer income is defined as the amount oftransfer incomeminus the amount of fees. If elections do not affect its level and progressiveness, we know that the improvement ofincome equality is not caused by more income redistribution. Next we will study village elections' impact on public investment.This amounts to studying elections' impacts on public expenditures and total transfer income. If elections increase the former butdo not affect the level of the latter, then we know that public investment must have increased because transfer income and publicinvestment are the only two components of public expenditures.
We obtain the figures for fees and transfer income for the period 1987–2002 from the accompanying household survey of theNFS. After households with missing data are dropped, 1,111 households remain in the sample. The longest time span is 16 yearsand the shortest is 5 years. The figures for public expenditures are obtained from the village survey of the NFS. There are 47villages in the sample providing 695 observations with valid data for the period of 1986 to 2002. We have converted all thefinancial data into 2002 Yuan and use their per-capita figures in regressions. The basic statistics of the three dependent variablescan be found in Table 2.

Table 8Effects of elections on net transfer income
(1) (2)
Lagged net transfer income 0.809⁎⁎⁎ 0.808⁎⁎⁎(0.008) (0.008)
Election dummy −2.234 −7.191(3.541) (5.082)
Relative per-capita net earned income −9.076⁎⁎⁎ −15.424⁎⁎⁎(2.326) (5.220)
Election dummy×Relative 7.900Per-capita net earned income (5.809)Per-capita land (mu) −2.512⁎⁎⁎ −2.560⁎⁎⁎
(0.796) (0.797)Average age 0.336⁎⁎ 0.326⁎
(0.168) (0.168)Male ratio 8.026 7.943
(7.005) (7.005)Average schooling years of adults −0.408 −0.400
(0.811) (0.811)Constant 4.055 8.467
(11.248) (11.706)
Year dummies Yes Yes
Hausman t statistic for endogeneity of elections 1.46 1.29
Notes: The dependent variable is per-capita net transfer income. Elections are treated as exogenous. The number of observations is 13,131 for 1,111 households inthe period of 1988–2002. GMM is used to estimate each model. The Hausman t statistic is calculated based on Wooldridge (2002). The timing of a province'adoption of the OLVC and its interactive terms with the number of surnames in a village and the percentage of population of the largest surnames are used as theinstruments for elections. The linear probability model is assumed for the first-stage estimation.⁎, ⁎⁎, and ⁎⁎⁎ indicate the 10%, 5%, and 1% significance levelrespectively.
Table 7Panel data unit-root tests for net transfer income
Chosen deterministics Lag Coefficient t-value t-star PN t
(1) (2) (3) (4) (5) (6)
Constant 1 −0.71 −141.75 −126.15 0.000Constant 2 −0.36 −54.05 −4.85 0.000Constant and trend 1 −0.94 −229.13 −198.04 0.000Constant and trend 2 −0.69 −66.77 −17.50 0.000
Notes: Column (1) allows different specifications of the deterministic terms, column (2) allows different lag orders used in the LLC test, column (3) gives theestimated coefficients, column (4) gives the usual t-values, and columns (5) and (6) provide the t-star statistics for inference and their p-values.
2195Y. Shen, Y. Yao / Journal of Public Economics 92 (2008) 2182–2198
4.1. Net transfer income
For net transfer income, we are interested in both the average effect of elections and their effect on households with differentlevels of income. The latter is concerned with the relative income of a household in its village. For that purpose, we define thevariable of relative income by dividing household per-capita net earned income (i.e., net income before taxation and transferincome) by the village mean earned income. If income redistribution is progressive, a higher relative incomewill result in a smalleramount of net transfer income. The equation that we will estimate is the following dynamic panel model:
Wijt ¼ kWijt�1 þ a1Ejt þ a2Yijt þ b1Ejt � Yijt þ Zijtb2 þ aij þwb3 þ eijt ; t ¼ 2; :::; T; ð3Þ
Wijt is per-capita net transfer income (Yuan) of the ith household in village j in year t, Yijt is its relative income, Zijt is a set of
wherefamily characteristics that may affect its payment of fees and transfer income, αij is the fixed-effect for this household, w is the setof year dummies, and eijt is an i.i.d. error term. Zijt includes per-capita landholding (mu), average age, male ratio, and averageschooling years of adults. All these variables are meant to control family attributes that may affect the amount of fees paid by ahousehold and the amount of transfer income received by it. Their basic statistics can be found in Table 2. The parameter α1captures elections' impact on the level of net transfer income, and the parameter β1 captures their impact on the progressivenessof income transfer in terms of earned income.
Before we run the regressions we need to test the stationarity of the dependent variable. As discussed by Richard Blundell,Stephen Bond, and FrankWindmeijer (2000) andMichael Binder, Cheng Hsiao, andM. Hashem Pesaran (2005), the first-differenceGMM estimator breaks down in the case of a unit root dependent variable. To see whether the series of net transfer income isstationary, we perform the Levin–Lin–Chu (LLC) panel unit root test as proposed in Andrew Levin, Chien-Fu Lin, and Chia-shangChu (2002). One can view this test as a pooled Augmented Dickey–Fuller (ADF) test when lags are included, with the null
s
,

2196 Y. Shen, Y. Yao / Journal of Public Economics 92 (2008) 2182–2198
hypothesis of nonstationarity (I(1) behavior). This test is suitable for the current dataset, as it is designed for panel data of moderatesample size like ours, and allows for individual effects, time effects and possibly a time trend. Serial correlation in the error term isalso allowed. In addition, the LLC test has the nice feature that the proposed t-star statistic is distributed standard normal under thenull hypothesis of nonstationarity so that it is very convenient to make inference. Table 7 provides the Levin–Lin–Chu panel dataunit root test statistics for net transfer income. The LLC panel data unit root test rejects the null of nonstationarity at the 1%significance level.
While elections appear to be an endogenous explanatory variable for the village-level data, it is not necessarily so for thehousehold-level data because the households covered in our panel study are only a small sample from each village. We haveperformed the Hausman t test for the endogeneity of elections following the suggestion of Wooldridge (2002). The t statisticindicates that the null of the exogeneity of elections survives with a large margin. Table 8 therefore provides the results for nettransfer income treating elections as exogenous.
Both regressions show that net transfer income is progressive in terms of relative earned income and per-capita landholding. Bythe short-run estimates provided in regression (1), a family would receive about 9.08 Yuan less of net transfer income if its earnedincome increased by an amount of the village average income, and having one mu more of land would lead to a reduction of 2.51Yuan. Neither is large effect. Although equality by household size is emphasized in land allocation (Liu et al., 1998), landdistribution deviates from equality because of demographic changes. The progressiveness of income redistributionwith respect tolandholding is a kind of compensation to this deviation. Themost important result is that elections are shown to have no significantimpact on either the level or the progressiveness of net transfer income. This concludes our first step to prove that electionsimprove income distribution not by engaging in more income redistribution or making it more progressive.
4.2. Public investment
The regression that we will run for public expenditures are the dynamic panel models presented in Eq. (2) where the Ginicoefficient is replaced by per-capita public expenditures in the village. The control variables are the same as before. We only studythe direct effect of elections so all the control variables are put in the regressions. We do this because wewant to know channels ofelections' direct effect on income distribution. Table 9 presents the results. Now elections are treated as endogenous as we did forother village-level regressions. Again, the LLC panel data unit root test rejects the null of nonstationarity at the 1% significance level.
Table 9Effects of elections on village per-capita public expenditures
Variables Estimated Coefficients
Lagged public expenditures 0.205⁎⁎⁎(0.040)
Election dummy 0.271⁎(0.142)
Per-capita net income 0.046⁎⁎⁎(1000 Yuan) (0.008)Per-capita net income squared −0.000⁎⁎⁎
(0.000)Log village population 1.735⁎⁎⁎
(0.323)Share of emigrant workers (%) 0.003⁎
(0.002)Unemployment rate (%) −0.008
(0.011)CV of household size −0.033
(0.556)CV of average edu. of household adults −0.477
(0.824)CV of per-capita 0.008household landholding (0.214)CV of number of household 0.045⁎wage earners (0.027)Constant −0.025⁎⁎
(0.011)
Year dummies Yes
m1 −1.38m2 0.20Sargan p-value 1.00
Notes: The dependent variable is per-capita public expenditures (1000 Yuan) in 2002 Yuan. After differencing and taking lags, 695 observations for 47 villages inthe period of 1987–2002 are in the sample. The model is estimated using the two-step GMMmethod proposed by Arellano and Bond (1991), and Bond (2002). Theelection dummy is treated endogenous. The timing of a province's adoption of the OLVC and its interactive terms with the number of surnames and the percentageof population of the largest surname in a village are used as instruments for village elections. The linear probability model is assumed for the first-stage estimationFigures in parentheses are robust standard errors. ⁎, ⁎⁎, and ⁎⁎⁎ indicate the 10%, 5%, and 1% significance level, respectively.
.

11 One piece of evidence supporting this argument was provided by Xiaobo Zhang and Shenggen Fan (2004) who worked with provincial-level aggregate dataand found that public investment enlarges income inequality in the richer east part of China whereas it reduces it in the much poorer west part.
Table 10Effects of elections on per-capita total transfer income
(1) (2)
Lagged total transfer Income 0.810⁎⁎⁎ 0.810⁎⁎⁎(0.008) (0.008)
Election dummy 4.973 1.877(3.511) (5.047)
Election dummy×relative 4.952Per-capita net earned income (5.801)Relative per-capita net −9.650⁎⁎⁎ −13.642⁎⁎⁎Earned income (2.307) (5.218)Per-capita land (mu) −0.314 −0.341
(0.787) (0.788)Average age 0.332⁎⁎ 0.325⁎
(0.167) (0.167)Male ratio 5.303 5.240
(6.962) (6.962)Average schooling years of adults 0.235 0.242
(0.806) (0.806)Constant −2.803 11.100
(11.195) (11.593)
Year dummies Yes Yes
Hausman t statistic for Endogeneity of elections 1.60 1.38
Notes: The dependent variable is per-capita total transfer income received by a household in 2002 Yuan. There are 13,131 observations for 1111 households for theperiod of 1988–2002. GMM is used to estimate each model. The Hausman t statistic is calculated based onWooldridge (2002). The timing of a province's adoptionof the OLVC and its interactive terms with the number of surnames and the percentage of population of the largest surname in a village are used as instruments fovillage elections. The linear probability model is assumed for the first-stage estimation. Robust standard errors are in parentheses. ⁎, ⁎⁎, and ⁎⁎⁎ indicate the 10%5%, and 1% significance level, respectively.
2197Y. Shen, Y. Yao / Journal of Public Economics 92 (2008) 2182–2198
r,
In addition, the m1 and m2 statistics show no evidence of first-order serial correlations for the level error terms and the Sarganstatistic indicates that the over-identifying restrictions are not rejected.
Elections are shown to significantly increase public expenditures. The magnitude of the effect is 237 Yuan, which is substantialbecause the sample average is 390 Yuan. The statistically significant control variables are village per-capita income, its square,village population, and the CV of the number of household wage earners. The effect of per-capita income shows an inverse U curve.The other two significant variables increase public expenditures. It seems that there is a scale effect that enables a larger village toafford more public expenditures. On the other hand, a more diverse village in terms of industrial employment may be correlatedwith a more vibrant local industry that provides a village more financial resources for public expenditures.
To showelections' effects on public investment, our remaining task is to study how per-capita total transfer income changes as avillage begins to hold elections. To that end, we repeat the two regressions for net transfer income by replacing the dependentvariable with per-capita total transfer income. The Hausman t statistics again indicate that the null of the exogeneity of election tohousehold is not rejected. The results are presented in Table 10 treating elections as exogenous.
Total transfer income is shown to be progressive with respect to relative earned income, but not with respect to landholding. Asin the case of net transfer income, elections are not significant in affecting either the level or the progressiveness of total transferincome. This concludes our second step of proof with a positive result that elections improve income distribution by increasingpublic investment.
5. Conclusions
In this paper we use a unique panel data set to study the effects of grassroots democracy on income distribution. Using thedynamic panel model and accounting for the endogeneity of the election, we have found that the direct effect of elections is toreduce the Gini coefficient by 14.3% and its gross effect is to do so by 9.3%. We have also found that elections tend to increase theincome shares of the poorer portions than of the richer portions of population, so their positive effect in reducing the Ginicoefficient is more likely to be brought by pro-poor policies. Further econometric analysis has shown that elections have notsignificantly changed the level and progressiveness of net and total transfer income. In addition, elections are found to significantlyincrease per-capita public expenditures. Therefore, the reduction of the Gini coefficient is not a result of pro-poor incomeredistribution, but instead a result of increased public investment. Since the level of public goods provision is generally low in ruralChina, it is reasonable to believe that poor households would benefit more from increased public investment because the rich canrely more on their own investment to generate income.11
Our work contributes to the analysis of decentralized governance inweakly institutionalized polities that by far the academialacks sufficient understanding on (Acemoglu, 2005). We show that grassroots democracy works to enhance local governance

2198 Y. Shen, Y. Yao / Journal of Public Economics 92 (2008) 2182–2198
even in the highly centralized political system in China. The period covered by our study was one when income inequality inrural China rose up quickly, so our finding of the positive role of village elections in reducing income inequality by way of morepublic investment is especially significant. Inside China, village elections have been frequently criticized as an expensive yetineffective device to strengthen the accountability of the village government. Our results provide strong evidence to disqualifysuch criticisms.
References
Acemoglu, Daron, 2005. Constitutions, politics, and economics: a review essay on Persson and Tabellini's The Economic Effects of Constitutions. Journal of EconomicLiterature XLIII (4), 1025–1049.
Alesina, Alberto, Rodrik, Dani, 1994. Distributive politics and economic growth. Quarterly Journal of Economics 109 (2), 465–490.Arellano, Manuel, Bond, Stephen, 1991. Some tests of specification for panel data: Monte Carlo evidence and an application to employment equations. Review of
Economic Studies 58 (194), 277–297.Bardhan, Pranab, Mookherjee, Dilip, 2005. Decentralizing antipoverty program delivery in developing countries. Journal of Public Economics 89 (4), 675–704.Benabou, Roland, 1996. Inequality and growth. NBER Working Paper 5658.Benjamin, Dwayne, Brandt, Loren, Giles, John, 2005. The evolution of income inequality in rural China. Economic Development and Cultural Change 53 (4),
769–824.Binder, Michael, Hsiao, Cheng, Pesaran, M. Hashem, 2005. Estimation and inference in short panel vector autoregressions with unit root and cointegration.
Econometric Theory 21 (4), 795–837.Blundell, Richard, Bond, Stephen, Windmeijer, Frank, 2000. Estimation in dynamic panel data models: improving on the performance of the standard GMM
estimators. Working paper 00/12. the Institute for Fiscal Studies.Bond, Stephen, 2002. Dynamic panel data models: a guide to micro data methods and practice. Portuguese Economic Journal 1 (2), 141–162.Chattopadhyay, Raghabendra, Duflo, Esther, 2004. Women as policy makers: evidence from a randomized policy experiment in India. Econometrica 72 (5),
1409–1443.Deaton, Angus, 2003. Health, inequality, and economic development. Journal of Economic Literature 41 (1), 113–158.Dong, Xiaoyuan, 1996. Two-tier land tenure system and sustained economic growth in post-1978 rural China. World Development 24 (5), 915–928.Dong, Leiming, 2002. ‘Trouble makers’ and village governance. (‘naoshipai’ he cunzhuang zhili). In: Fang, Yu, He, Xuefeng (Eds.), Village Foundations of Villager Self-
governance (cunmin zizhi de cunzhuang jichu). Northwest University Press, Xi'an.Foster, Andrew, and Rosenzwig, Mark. “Democratization, Decentralization and the Distribution of Local Public Goods in a Poor Rural Economy.” Mimeo,
Department of Economics, Brown University, 2001.Gan, Li, Xu, Lixin, Yao, Yang, 2005. Local Governance, Finance, and Consumption Smoothing. Memo, the World Bank Research Group.Gan, Li, Xu, Lixin, Yao, Yang, 2006. Health shocks, village elections, and long-term income: evidence from rural China. NBER Working Paper w12686. November.Gao, Mobo, 1999. Gao Village: Rural Life in Modern China. The University of Hawaii Press, Honolulu.Guo, Zhenglin, Bernstein, Thomas, 2004. The impact of elections on the village structure of power: the relations between the village committees and the party
branches. Journal of Contemporary China 13 (39), 257–275.Huang, Xiyi, 1998. Two-way changes: kinship in contemporary rural China. In: Flemming, Christiansen, Zhang, Junzuo (Eds.), Village Inc.: Chinese Rural Society in
the 1990s. Curzon Press, Surrey.Levin, Andrew, Lin, Chien-Fu, Chu, Chia-shang, 2002. Panel unit root tests: asymptotics and finite sample properties. Journal of Econometrics 108 (1), 1–24.Liu, Shouying, Carter, Michael, Yao, Yang, 1998. Dimensions and diversity of property rights in rural China: dilemmas on the road to further reform. World
Development 26 (10), 1789–1806.Liu, Yigao, Wang, Xiaoyi, Yao, Yang, 2001. The Chinese Village: Inside and Out (cunzhuang neiwai). Hebei Renmin Press, Shijiazhuang.Milanovic, Branko, Ying, Yvonne, 2001. Democracy and income inequality: an empirical analysis. World Bank Policy Research Working Paper Series 2561.Ministry of Civil Affairs, 1998. 1997 civil affairs statistical report. http://www.mca.gov.cn1998.Oi, Jean, Rozelle, Scott, 2000. Elections and power: the locus of decision-making in Chinese villages. China Quarterly 162, 513–539.Riskin, Carl, Zhao, Renwei, Li, Shi, 2002. China's Retreat from Equality. The University of Michigan Press, Ann Arbor.Wang, Shuna, Yao, Yang, 2007. Grassroots democracy and local governance: evidence from rural China. World Development 29 (10), 1635–1649.Wooldridge, Jeffery, 2002. Econometric Analysis of Cross Section and Panel Data. MIT Press, Cambridge, Mass.Zhang, Xiaobo, Fan, Shenggen, 2004. Public investment and regional inequality in rural China. Agricultural Economics 30 (1), 89–100.Zhang, Xiaobo, Fan, Shenggen, Zhang, Linxiu, Huang, Jikun, 2004. Local governance and public goods provision in rural China. Journal of Public Economics 88 (12),
2857–2871.Zhao, Yaohui, 1999. Labor migration and earnings differences: the case of rural China. Economic Development and Cultural Change 47 (4), 767–782.Zhong, Yang, Chen, Jie, 2002. To vote or not to vote: an analysis of peasants' participation in Chinese village elections. Comparative Political Studies 35 (6), 686–712.