does geography play a role in takeovers?
TRANSCRIPT

190DOES
GEOGRAPHYPLAY A ROLE
IN TAKEOVERS?
Petri BöckermanEero Lehto

PALKANSAAJIEN TUTKIMUSLAITOS • T Y Ö P A P E R E I T ALABOUR INSTITUTE FOR ECONOMIC RESEARCH • DISCUSSION PAPERS
*This study is a part of the project financed by the TEKES (National Technology Agency ofFinland). We thank Eija Ahola, Aki Kangasharju, Raimo Lovio, Pekka Ylä-Anttila and JyrkiAli-Yrkkö for comments. We are also grateful to Satu Nurmi for that she has prepared the
linked data set for our use. The usual disclaimer applies.
**Labour Institute for Economic Research, Pitkänsillanranta 3A, 00530 Helsinki.E-mails: [email protected] and [email protected]
Helsinki 2003
190DOESGEOGRAPHYPLAY A ROLE INTAKEOVERS?THEORY ANDFINNISH MICRO-LEVEL EVIDENCE*
Petri Böckerman**Eero Lehto**

ISBN 952−5071−83−9ISSN 1457−2923

3
ABSTRACT
This study explores domestic inter-regional merger flows. Theoretical considerations based on
monitoring are developed. The empirical part of the study is based on the comprehensive public
data on domestic mergers and acquisitions that is matched to the micro-level data sources
maintained by Statistics Finland in order to obtain several variables that help to characterize the
companies involved. The Finnish evidence reveals that geographical closeness matters a great
deal for inter-regional merger flows. This means that a great number of domestic mergers occur
within narrowly defined regions. Domestic merger flows substantially reinforce the core-
periphery dimension. The most important finding from matched data is that the strong ability by an
acquiring company to monitor the target (measured by the knowledge embodied in human capital)
is able to support mergers that occur across distant locations, other things being equal.
Geographical closeness and proximity across industries are not related, based on the Finnish
evidence.
Keywords: mergers, acquisitions, monitoring, agglomeration
JEL Classifications: G34, R12

4
TIIVISTELMÄ
Tutkimuksessa tarkastellaan kotimaisten yrityskauppojen aluerakennetta Suomessa. Tut-
kimuksessa esitetään teoreettinen kehikko, joka perustuu kohdeyrityksen monitorointiin.
Suomea koskevien empiiristen tulosten valossa ostaja- ja kohdeyrityksen maantieteellisellä
läheisyydellä on merkittävä vaikutus kotimaisiin yrityskauppoihin. Suuri osa fuusioista to-teutuu
alueiden sisäisinä yrityskauppoina. Kotimaiset yrityskaupat vahvistavat ytimen ja periferian eroja
Suomessa (ts. Uudenmaan maakunnassa sijaitsevat yritykset hankkivat yrityskaupoilla
nettomääräisesti määräysvaltaa muiden maakuntien talouselämästä). Yh-distetystä aineistosta
saatujen tulosten perusteella voidaan sanoa, että ostajayrityksen vah-va kyky monitoroida
kohdetta, jota voidaan mitata mm. korkeasti koulutettujen työnteki-jöiden osuudella
henkilöstöstä, tukee yrityskauppoja, jotka toteutuvat pitkästä maantie-teellisestä etäisyydestä
huolimatta. Maantieteellinen ja toimialoittainen läheisyys ovat sitä vastoin toisistaan
riippumattomia.

5
1. INTRODUCTION
Mergers and acquisitions (M&A) are important for regional development. Domestic inter-
regional mergers are a vehicle for the increase of regional disparities within countries. The
reason for this pattern is that an increase in the distance between acquiring and potential target
companies produces a substantial decline in the likelihood of a merger between companies. Most
of the acquiring companies are located in the core areas of economic activity. As a result of this,
domestic inter-regional mergers can yield an increase in the underlying regional disparities of
economic performance when mergers, for instance, are followed with the stimulation of
knowledge spillovers or they improve the productivity of the companies involved by other
means. Therefore, inter-regional mergers can reinforce the existing core-periphery relationship
within countries, because companies located in the core areas gradually gain control of the
economic activities of the nearby regions by conducting inter-regional mergers.
Regional disparities are sharp in Finland. As the European Union average is standardized as 100,
the level of gross domestic product per capita is 141 in the province of Uusimaa, which includes
the region around the Helsinki metropolitan area in Southern Finland, where roughly a third of
the total economic activity of the Finnish economy is located. In contrast, by using the same
measure, the level of GDP per capita is 75 in Eastern Finland (Behrens, 2003). This pattern
means that the dynamics of inter-regional merger flows is relevant from the regional policy
perspective in Finland.
The aim of this study is to investigate the previously unexplored pattern of domestic inter-
regional mergers in Finland during the last decade. This study contributes to the existing
literature on domestic inter-regional mergers in two ways. On the theoretical front,
considerations based on monitoring are developed. On the empirical front, the study applies
matched data. This means that the study is based on the comprehensive public data on domestic
mergers that is matched to the micro-level data sources maintained by Statistics Finland in order
to obtain several variables that help to characterize the companies involved. By doing this, this
study fills an important gap in the earlier literature that has typically applied aggregate data on
domestic mergers without taking into account other factors (beyond distance) that are able to
characterize the pattern of inter-regional mergers. In addition, most of the empirical studies on
the inter-regional pattern of merger flows have been limited to manufacturing. This
investigation that applies data on merger flows in Finland is not solely limited to manufacturing
industries. Thus, this study is able to provide evidence about this important issue from a broader
perspective.

6
The rest of the study is organized as follows. The second section develops theoretical
considerations based on monitoring for the importance of geographical closeness in the
determination of inter-regional mergers. The third section provides a survey of the previous
empirical literature that has investigated the role of distance in domestic takeovers. The fourth
section contains a description of the matched data. The fifth section documents that
geographical closeness is a matter of great importance for domestic takeovers in the Finnish
regions. The sixth section provides the estimation results for the factors that help to characterize
the geographical closeness of domestic mergers and acquisitions. The last section concludes.
2. THEORETICAL CONSIDERATIONS
There are three theoretical reasons for the relevance of geographical closeness in domestic
mergers. The first explanation stems from the consequences of product differentiation that has
been explored in detail in the earlier literature. The second explanation considers monitoring.
Poor monitoring from afar cannot distinguish a good target from an average target. This gives an
information advantage for the potential acquirer who is located close to the target firm. The
third explanation relies on increasing returns. This study considers a case in which the firms –
which are located close to each other – are jointly able to take advantage of a common asset.
2.1. Spatial competition
In certain industries the distance between the client and the firm is an important component of
product quality or the firm’s costs. Because firms’ locations vary, products become differentiated.
In the spatial competition models the impact of geographical closeness on the M&As is highly
contingent on the assumed nature of conjectures which describe how the other firms respond to
a unit change in the output of a firm considered. Cournot conjecture implies no response in
terms of output. In Bertrand competition, firms compete in setting prices, and then output
responses diverge. Levy and Reitzes (1992) show that a merger of nearby companies – which
eases competition – increases the merged firms’ profits in the spatial Bertrand price
competition.1 This means that there is an incentive for nearby companies to form coalitions in
spatial price competition. In contrast, Mathushima (2001) shows that a merge of nearby
companies, however, produces a decline in the merged companies profits in the standard non-
cooperative Cournot competition. These results show that the role of geographical closeness in
7
the determination of domestic mergers cannot be solved by theoretical considerations based on
the traditional frameworks of industrial organization.
2.2. Monitoring
In the earlier literature it has been argued that the geographical closeness between acquiring and
potential target companies improves monitoring or at least decreases the monitoring costs and
should therefore have a substantial positive impact on the scale of inter-regional merger flows
(see, for example, Green, 1990; Ashcroft et al., 1994). It is not, however, obvious that a more
precise assessment of the value of the target actually increases the M&A likelihood insofar as
firms are risk-neutral. The following presentation develops an explicit explanation why more
accurate monitoring by acquiring companies can indeed promote mergers between firms which
locate close to each other.
Averaging. Let us consider situations in which long distance impairs the ability to monitor the
value of potential targets. Suppose there are two potential acquirers: firm A and firm B, and a
target of which value is either high (=1) or low (=0). Firm A is located far from a target firm
and is therefore poorly informed of the target firm’s value. Firm B, which is located close to a
target firm, is perfectly informed.
Assumption 1. The targets are equally valuable to both acquirers (firm A and firm B).
Assumption 2. Firm A thinks that a target has low value with probability 0.5 and high value with
probability 0.5. This means that firm A values the target according to the population
average. Firm B knows the actual value of the target.
Assumption 3. Firm A is aware that firm B is fully informed, and, on the other hand, firm B knows
that A is poorly informed.
Assumption 4. The firms are risk-neutral and they participate, if the expected returns are non-
negative.
One should notice that assumption 1 says that the bidders’ values are affiliated (technically,
pair-wise positively correlated). The situation considered differs, in this respect, from the
standard auction model which assumes non-affiliation.2 We next consider more closely the
bidding game between firms A and B. Let hBb denote firm B’s bid when the value is high.
Respectively, lBb denotes B’s bid when the value is low. Firm A’s bid is denoted by Ab . Firm A
cannot distinct high value from low value. Firm B, which knows the actual values, will, in any

8
case, set 0=lBb (the lowest possible value). If hBA bb < , firm B wins the target. Suppose,
however, that hBA bb > (which is a fairly unrealistic assumption), then firm A’s expected value of
the deal, denoted by AEv , has the expression: .5.0)0(5.0)1(5.0 AAAA bbbEv −=−+−=
From the non-negativity requirement it follows that .5.0≤Ab Firm B realizes this restriction
and sets hBb just above 0.5, by which it forecloses firm A in any case and ensures positive
returns. There is therefore no equilibrium strategy for poorly informed A to make a non-negative
result, and so firm A abstains from the acquisition activity and leaves the whole field to firm B.
Blurred observations. Let us then consider a case in which firm A can make a distinction
between low and high value, but does not know the exact values. Assumption 2 above is
replaced by the following assumption:
Assumption 2b. Firm A is poorly informed, and it thinks that the low value is –0.5 with probability
1/3, 0 with probability 1/3 and 0.5 with probability 1/3. Respectively, the high value
is thought to be 0.5 with probability 1/3, 1 with probability 1/3 and 1.5 with
probability 1/3. Firm B is still perfectly informed, and so it knows the actual value of
the target.
In the situation considered, there is a logical contradiction in firm A’s beliefs. On the other
hand, it knows that firm B (which is better informed) considers that the support of the
distribution is [0; 1] but thinks, however, that for itself the support is [-0.5; 1.5]. This
contradiction can be weakened by assuming that firm A actually does not know that its
information is poorer than B’s information. Firm A merely thinks that it has a different view of
the actual state of affairs. Firm B still sets .0=lBb In the case considered, firm A can make a
distinction between a low value target and a high value target. Let lAb denote firm A’s bid when
the value of the target is low. Then hAb denotes firm A’s bid of the high value target. Suppose
firm A’s bid exceeds firm B’s bid. Firm A’s expected value of the deal, AEv , is then as follows:
)5.1(31)1(
31)5.0(
31)5.0(
31)0(
31)5.0(
31 h
AhA
hA
lA
lA
lA bbbbbb −+−+−+−+−+−− . (1)
This expression reduces to the form )1()0( hA
lA bb −+− , which indicates that it pays to set
0=lAb and 1≤hAb for firm A. Firm A then bids similarly as firm B. Both firm A and firm B tend
9
to set the bid concerning the high value target close to one. Firm A’s possibility to win the target
is actually the same as firm B’s possibility.
Non-affiliation. Suppose that the assumptions 2–4 are valid but assumption 1 is replaced by the
following assumption:
Assumption 1b. The value of the targets is non-affiliated so that if the value is high for firm B, it is
high for firm A with probability 0.5 and, respectively, if the value is low for firm B, it
is low for firm A with probability 0.5.
According to assumption 1b “low value” for firm B is not necessarily low value for firm A. If the
value is low for firm A, it is low for firm B with probability 0.5. Firm A cannot distinct low value
from high value, and Ab again denotes firm A’s bid. Suppose that hBA
lB bbb << . AEv has then
the expression:
.5.025.0)]0[(5.0)]1(5.0[5.0 AAA bbb −=−+− (2)
This, together with the participation condition, yield the requirement .5.0≤Ab But if hBA bb > ,
we have the expression: AAA bbb −=−+− 5.0)]0(5.0)1(5.0 for AEv . This again leads to the
condition .5.0≤Ab We conclude that in non-affiliation there is also an upper limit 0.5 for A’s
bid. If hBA bb > , firm B is foreclosed. But setting 5.0>hBb , firm B can be sure that h
BA bb < , and
so firm A is foreclosed despite the non-affiliation assumption. When 5.0>hBb firm B wins and
its value is )1( hBb− leaving firm B plenty of room to make profits. Clearly firm B sets h
Bb just
above 0.5.
Discussion. In the situation in which firm A has unbiased expectations, firm A is not actually
aware that it has, in all respects, inferior information about the target’s value. Firm A thinks that
the actual support of the distribution is [-0.5; 1.5] although it knows that the minimum value for
firm B is 0 and the maximum value for firm B is 1. This contradiction cannot be explained by
the misunderstanding, if all parties know that B is better informed (because of the shorter
distance). But we can still assume that firm A is actually different from firm B, which explains
the difference in both the minimum and the maximum of these firms.
We think, however, that ignorance primarily appears as a tendency toward ”averaging” in the
situations where the firms monitor the quality of the potential targets. Suppose, for example,
that the potential targets are characterized by 5 properties. Let ),,,,( 54321 zzzzzz = be the
10
value of target z. The actual value of each component, iz , is assumed to range from 1 to 5. The
most valuable target then has the value (5,5,5,5,5) and the value of the most invaluable target
has a value of (1,1,1,1,1). If the monitor of the target is poor, the missing properties are replaced
by some medium value like 3. Suppose that the acquirer is unaware of the value of the second
and the fourth property. The most valuable target is regarded as (5,3,5,3,5), instead of
(5,5,5,5,5). Respectively, the value of the most invaluable target is considered to be (1,3,1,3,1)
instead of (1,1,1,1,1). This shows why poor monitoring easily leads to bias in the evaluations
concerning extremely high or low values.
The simple examples analysed above could be enlarged to cover such situations in which poor
monitoring distorts only the expected values at both ends of that distribution which captures the
values of the target firms. Insofar as the average targets are concerned, the deterioration of
monitoring would increase the variance of estimation error but would not, necessarily, distort
the estimated expected value. The deterioration of monitoring would not then decrease the
acquisition likelihood of average firms insofar as the bids of the risk-neutral firms are based on
the expected values. But when it concerned the extremely good and bad firms, the monitoring
would matter. Better monitoring would correct the errors in the evaluated expected values, and
therefore only the well-informed acquirers could make a profit in these markets.
2.3. Sharing common assets
An important motive for mergers is to intensify the utilization of the assets which firms possess.
The joint use of common assets leads to a strictly subadditive cost function:
),(),0()0,( jiji qqCqCqC >+ . In this expression C denotes the costs and iq denotes firm i’s
output. The cost function above is said to imply the economies of scale (or scope). In particular,
we consider a situation in which the parties of the merger may jointly use the assets which the
new parent firm possesses after the merger. Strict subadditivity requires in this setting that the
merger does not remove the pre-merger production sites. In some cases too long a distance
between the merged firms may hinder the use of these common assets. In any kind of network
industries the location of the tangible assets which belong to the network may determine the
area within which the joint utilization of the network is possible. This especially concerns many
service industries. The location of the depots, the warehouses and the various supporting
activities can limit the geographical scope of cooperation and M&As in the wholesale trade and
the transport industries and in other services. In addition, after the merger the utilization of
human capital – and the technological and managerial knowledge which is incorporated in
11
human capital – can also, to some extent, be shared by those production sites which were
independent firms before the merger. For various reasons the distant location of a production
site may be a handicap that produces extra costs.
Let us then consider how the joint utilization of assets affect the likelihood of mergers. In the
standard Cournot model the mergers do not easily turn out to be profitable. Suppose there are
two firms – firm i and firm j – which merge. When the merged firm – firm i plus firm j –
maximizes its profits a negative externality arises that captures the negative impact of an
increase in firm j’s output on firm i’s profits, and vice versa. To internalize this externality, the
merged firm restricts its output. In the most simple models with linear demand and constant
marginal costs (see Salant et al., 1983), Cournot behaviour does not leave any room for a
profitable merger insofar as the number of firms in the industry exceeds two. This result is
obvious, because as a consequence of the merger one regular post-merger firm only replaces two
regular pre-merger firms. As a result, the price increase which results from a decrease in the
number of firms is not sufficient to compensate the losses from the decrease of the output
volume unless the original number of the firms is only two. Later, Perry and Porter (1985)
considered the model in which the output is produced by the fixed and variable factors of inputs.
Because the fixed input (or capital input) is given, the total cost function – which is the dual of
the original production function – becomes non-linear and, in a special case, quadratic in the
volume of output. In this framework, and in the more general framework analysed by Farrell and
Shapiro (1990), the scope of the profitable mergers enlarges from the situation analysed by
Salant et al. (1983). The invariability of capital input deters the merged firm from decreasing its
output and, respectively, the competitive firms (outside the group of merged firms) from
increasing their outputs, as much as in the case in which both inputs – labour and capital – are
variable. In principle, the fixed investments play a similar role as they do in the entry deterrance
analysed by Dixit (1980). In the long-run, all inputs are, however, variable. For this reason one
is entitled to be sceptical about the results which stem from such non-linearity of the costs
which is explained by the assumed invariability of some input factors.
But even allowing all inputs to be variable, the scope for the profitable merger enlarges in a
remarkable way if the merged firms are allowed to jointly utilize the assets which they possess.
To clarify our point we construct a framework which is not too far from the setting analysed by
Salant et al. (1983) and Perry and Porter (1985). Let us assume there are n firms and the regular
firms’ profits are determined as follows: ,kkkk wLrKPq −−=Π where P is the uniform price
level, kq denotes firm k’s output, r is the uniform price of the capital input, kK is firm k’s capital

12
input, w is the uniform wage level and kL is firm k’s labour input. We assume that the inverse of
the demand is linear in total output and so the price level has an equation: QAP −= , where
Q is the total output ∑=
n
kkq
1. This implies that the outputs are perfect substitutes. It also assumed
that the output is determined from the Cobb-Douglas function of the form: .kkk KLq = If the
capital input were fixed, the cost function ),( kk KqC , which is dual to the production function,
is quadratic and of the form: k
k
Kq2
. This corresponds to the case analysed by Perry and Porter
(1985). Instead, we assume that firm k maximizes profits with respect to kq , kL and kK and that
firm k has the Cournot conjectures. In the equilibrium of n (non-merging) oligopolies
12maxarg+
−=Π
nwrA
kqk. We assume that n ≥ 2. Firm k’s profits will settle in the non-
merging equilibrium to the level:
.1
22
+−n
wrA (3)
Let us then consider the consequences of a merger. Suppose that firms i and j will merge and
that other n-2 firms will not merge. After the merger, firms i and j become separate plants which
belong to a merged parent firm. We assume that capital input is jointly utilized to some extent.
More explicitly, we assume that the capital costs of the merged firm are:
))(1()1()1( ijjjii KKsrKsrrKKsrrK −−+−−+−− , (4)
where .ij KK ≥ In other words, for each jK the capital costs for firm i – which are originally
jrK – are lowered by iKsr )1( − and for each iK the capital costs for firm j are lowered by
jKsr )1( − . The scalar s captures the effect of the savings which follows from the joint use of
capital inputs. This implies: ½ ≤ s ≤ 1. If s = 1, then no costs savings are obtained. When s =
1/2, the capital inputs are fully shared and the costs savings are maximal. The term
))(1( ij KKsr −− in the expression (4) represents the lost savings owing to the disparity
between iK and jK . To maximize the costs savings the merged firm will set ij KK = when s
< 1. This lets us eliminate the term )( ij KKrs − (when ij KK ≥ ) in (4). The capital costs of
the merged firm are then of size )( ji KKrs + . The fact that ij KK = and the symmetry of the

13
model also make the merged firm to set ij LL = and ij qq = . We use the notation
KKK ij ≡= , LLL ij ≡= and qqq ij ≡= . The merged firm will then maximize
wLrsKPqM 222 −−=Π with respect to q, L and K. Above qQAP 2−−= − , when
.∑≠≠
− =
jkik
kqQ Let Mq denote q2 , which is the output of the merged firm. In the equilibrium in
which the merging and non-merging firms maximize their own profits:
.24)(2maxargn
wrswrAwrswrMq
−−+−= (5)
From the above, we see that if s = 1, Mq will be the same as the regular firm’s output in the
equilibrium which consists of n firms. But when s falls below 1, Mq will increase. Thus, the
merged firm’s profits will be in the Cournot equilibrium on the level:
.)2(2)1(22
−+−−n
wrnwrsnA (6)
The profitability of a merger is discovered when one compares the sum of pre-merger profits of
firms i and j (which is twice the size of the expression in (3)) with the post-merger profits
expressed in (6). The comparison shows that when s = 1, the merger is profitable only if n = 2.
In this respect the result is the same as that obtained by Salant et al. (1983). Making the capital
input variable, the decreasing returns implied by the invariability of capital input vanish in the
considered model, restricting the profitability of a merger. But when s < 1, the scope of
profitable mergers enlarges. We have assumed that there exist increasing returns in the number
plants which belong to a parent firm, but not in the size of a single plant. In this setting, a
merger of two separate firms can become attractive, and after merger the number of plants in the
industry does not decrease. In this setting, the original pre-merger location of firms is an
important factor for takeovers.
14
3. PREVIOUS RELATED STUDIES
There has been extensive empirical literature on various direct and indirect effects of merger
flows on regional economies (see, for example, Ashcroft and Love, 1993). However, there have
been a limited number of empirical studies that aim to characterize the economic fundamentals
that have an influence on merger flows across regions within countries. In addition, these studies
have been based on aggregated data. The following investigation that is based on the Finnish
data is able to provide a previously neglected micro-level perspective on this important issue.
The earlier empirical studies have applied aggregate data on U.S., Canadian, UK and German
inter-regional merger flows. Ellison and Glaeser (1997) observe that only a very small portion of
the total geographic concentration is attributable to intrafirm agglomeration in the U.S.
manufacturing industries. This pattern means that there is an important role for domestic
merger flows in the concentration of economic activity within industries. In other words, the
pace of inter-firm reallocation may have an important influence on the magnitude of
agglomeration. Green and Gromley (1984), Green (1987) and Green (1990) investigate the U.S.
pattern in takeovers across regions. They discover that distance is indeed an important factor in
the determination of regional takeovers as suggested by the famous gravity equation of inter-
regional interaction. In addition, Sorenson and Stuart (1999) point out that geographical
proximity matters a great deal for venture capital investments in the U.S. states via transmission
of information about the potential investment opportunities.
Green and McNaughton (1989), and Aliberti and Green (1999) provide empirical evidence
from Canada. They conclude that the acquisition process across regions is reinforcing the core-
periphery nature of Canada’s urban system. In particular, domestic merger activity is heavily
concentrated in four major concentrations of economic activity that are Toronto, Montreal,
Vancouver and Calgary. In addition, Green and Lisle (1991) investigate the inter-regional
merger flows in Canada by using the Markov chain models. The results show that there is strong
empirical evidence for the distance decay effect. This pattern is highlighted in the feature that
only a limited number of cities made acquisitions in cities other than their own.
Ashcroft et al. (1994) provide the available UK empirical evidence. The sectoral coverage of the
study is limited, because their study excludes banking, insurance, finance and other services.
The study discovers that the estimation of gravity equation provides an appropriate framework
for the empirical investigation of regional takeover activity in the UK. Consistent with the
famous gravity equation of inter-regional interaction, there is a decrease in the total volume of

15
takeovers as there is an increase in the distance between regions, and an increase in the total
number of inter-regional takeovers as there is an increase in the size of regional economic
potential measured by the value of domestic product.
Rodriguez-Pose and Zademach (2003) have concluded that M&As has resulted in a major
concentration of firms and economic activity in the main German metropoli. The study on the
determinants of M&As is based on aggregated information about the background characteristics
of the German regions in the 1990s. Rodriguez-Pose and Zademach (2003) discover that
proximity plays an important role in the dynamics of M&A activity, when estimated in
conjunction with agglomeration.
4. THE DATA
4.1. The selection of variables
The matched data is created in order to obtain variables that can be used to characterize the
geographical closeness of domestic mergers and acquisitions. This matching is made possible by
the inclusion of the unique identification codes for the population of firms used in different
registers maintained by Statistics Finland. Most of the included variables can be interpreted from
the point of monitoring and available information.
The variables used in the empirical investigation are documented in Table 1. The age of a
company is directly related to the available information. Older firms are often listed and there is
more public information available about them. This means that in the light of theoretical
considerations based on monitoring, domestic takeovers of younger firms should be more
common within the same regions. The feature that a company consists of several establishments
loosens the importance of geographical closeness. The reason for this is that multi-establishment
companies are able to gather and process information from a broader geographical scope. Hall
(1987) provides evidence that an increase in the scale of a company measured by the turnover
positively contributes to the likelihood of a merger between companies. Geographical closeness
can play a role in this feature. In addition to this, large companies equipped with better
monitoring capacity may be able to overcome geographical boundaries more easily than small
companies.

16
According to Jensen (1988), better performing companies – measured by indebtedness or by
profitability – are more willing to acquire. It is interesting to see whether there is any spatial
dimension in this respect. Fixed tangible assets of the companies involved are chosen to capture
the possibilities to take advantage of common assets. These possibilities can often be utilized
across distant locations.
Table 1. Description of the variables.
Variables Definition/measurement
Financial status of companies:
VINTAGE The age of a firm is measured in years. The variableis the employment-weighted average of the ages offirm’s plants (Source: Business Register by StatisticsFinland).
MULTI Company consists of several establishments=1,otherwise 0 (Source: Business Register by StatisticsFinland).
TURNOVER A log of the turnover of a firm (Source: BusinessRegister by Statistics Finland).
PROFITS Gross margin divided by the turnover of a firm(Source: Financial Statements Data by StatisticsFinland).
DEBTS Short- and long-term debts divided by the totalassets of a firm (Source: Financial Statements Databy Statistics Finland).
FIXED A log of fixed tangible assets (Source: FinancialStatements Data by Statistics Finland).
Information about the personnel of companies:
SIZE A log of the size of a firm measured by the number ofemployees (Source: Employment Statistics byStatistics Finland).
EDU1 The share of highly educated with technicalqualifications of the total number of employees in afirm (Source: Employment Statistics by StatisticsFinland).
EDU2 The share of highly educated (excluding the numberof highly educated with technical qualifications) ofthe total number of employees in a firm (Source:Employment Statistics by Statistics Finland).
Knowledge capital:
PATENTS1 The number of domestic patents that firm ownscurrently (Source: the National Board of Patents andRegistration of Finland).
17
PATENTS2 The number of U.S. registred patents that firm ownscurrently (Source: the National Board of Patents andRegistration of Finland).
STOCK R&D stock of a company that is estimated based onthe previous R&D expenditures (see Lehto andLehtoranta 2003).
Geographical closeness:
PROXIMITY Acquiring and acquired companies are located in thesame NUTS-region=1, otherwise 0 (Source:Talouselämä magazine and Business Register byStatistics Finland).
DISTANCE A log of distance is defined as a distance inkilometres between acquiring and acquiredcompanies (Source: Statistics Finland based on GIS).
Geographical clustering:
AGGLOMERATION The number of firms those turnover is over FIM 3million in the same region (Source: Business Registerby Statistics Finland). The variables are separatelycalculated for the locations of acquiring and targetcompanies. This restriction of FIM 3 million is thesame restriction as the one used by the Talouselämämagazine in its listings of mergers.
Additional variables:
YEARS 12-1SAMEINDU The acquiring company and the target company are
in the same 2-digit industry as classified by StatisticsFinland=1, otherwise 0.
Monitoring is becoming more difficult as the size of the company measured by the number of
employees increases. This suggests that the takeovers of large firms should be more likely within
the same region, other things being equal. Based on the earlier theoretical considerations, it can
be argued that the education structure of the companies involved is an important factor for the
spatial structure of mergers. An acquiring company that consists of highly educated workers or is
characterized by extensive knowledge capital is better equipped to monitor targets. This feature
tends to downplay the role of geographical distance. In other words, it provides support to the
inter-regional mergers that occur across distant locations within a single country. However,
monitoring is more difficult when the personnel of the target company consist of highly educated
workers with specific skills. Therefore, it is expected that mergers that consists of target
companies with highly educated workers are more likely to occur within the same region. In

18
addition, monitoring of targets becomes more difficult in the presence of patents and knowledge
capital.3
The size of regions should be important for mergers. The amount of geographical clustering is
measured as the number of firms that are located in the same region. It is expected that mergers
are more likely within regions that contain a great number of firms. In addition, there is a
dummy variable that captures the mergers in which the acquiring and the target company are in
the same industry. This means that it is possible to investigate the connection between
geographical closeness and proximity across industries.
4.2. Mergers
The data on mergers and acquisitions is gathered from the Talouselämä magazine, which is
published on a weekly basis. The magazine contains all mergers in which either an acquiring or
an acquired firm is a Finnish one, or in which either an acquiring or an acquired firm is owned
by a Finnish company. This means that the data is truly comprehensive in terms of domestic
mergers. The merger data covers the period from 1989 to 2001. Because some variables are not
available from 2001, most of the analysis covers the period 1989–2000. The total number of
mergers is 5126 (including non-domestic mergers) during this period of investigation (Table 2).
The sub-population of mergers that consists of the cases where existing companies change their
organizational form without the involvement of other companies is excluded from the study of
domestic merger flows, because there fails to be, for obvious reasons, a discrepancy of location in
terms of the acquiring and the target company for these particular mergers. The Talouselämä
magazine contains the list of the names of the companies that have been involved in the
transactions. This means that it is possible to manually link the firm codes to those names of the
companies listed by the magazine.
Table 2. The data about mergers in Finland 1989–2000.(Source: Talouselämä magazine).
Definition Number of mergers
All mergers listed by the magazine (1989-2000) 5126The acquiring company is located in a foreign country 880The target company is located in a foreign country 685Internal reorganization of a domestic firm 589
Domestic mergers used in the analysis 2972

19
4.3. Financial status of companies
The information about domestic mergers is linked to the Business Register and Financial
Statements Data by the firm codes. The VINTAGE, the MULTI, the TURNOVER, the
PROFITS, the DEBTS, and the FIXED variables are obtained from the Business Register and
Financial Statements Data.
4.4. Information about the personnel of companies
This matched data is then linked to Employment Statistics also maintained by Statistics Finland,
which compiles information on the economic activity of individuals and their background
characteristics (such as the education of an employee). Employment Statistics contains a piece
of information (i.e. firm code) on the employee’s employer in the last week of each year. This
makes it possible to link the Employment Statistics to the Business Register in order to create
linked longitudinal employer-employee data. Employment Statistics effectively covers the whole
population.4 The variables that capture the size of the company measured by the number of
employees and the educational structure of the companies involved are obtained from
Employment Statistics.
4.5. Knowledge capital
The number of patents that capture a perspective on the knowledge capital are obtained from
the comprehensive registers of the National Board of Patents and Registration of Finland. The
information about R&D expenditures that is used to calculate the R&D stock of the companies
involved can be obtained from R&D surveys of the Finnish companies, 1989, 1991–2000.5
Matching is made possible by the fact that R&D surveys by Statistics Finland contain the same
firm codes as the Business Register, Financial Statements Data and Employment Statistics.
4.6. Geographical closeness
The Talouselämä magazine contains information about the geographical location of the targets
classified in terms of the Finnish municipalities. This measure of location is a plant-level

20
measure. This information about the location of targets can then be aggregated to various
geographical divisions of Finland (including the so-called NUTS regions by the European
Union).6 Most acquiring companies have only one site. In those cases the definition of the
location is unambiguous. But when acquiring companies have many sites the location is defined
according to the site which has the largest number of personnel. The geographical location of
acquiring companies is obtained from the Business Register by Statistics Finland as it contains
the home municipality of the Finnish companies. First, the geographical closeness is defined as a
case when acquiring and acquired companies are located in the same region. Second, the
geographical closeness is measured as a distance between acquiring and acquired companies.
The distance is measured in kilometres based on the location of acquiring and acquired
companies at the municipality level.7

21
5. STYLIZED FEATURES
The geographical pattern of domestic mergers and acquisitions is interesting in Finland. Table 3
shows that a great number of domestic mergers occur within narrowly defined regions. For
instance, about 38% of the total number of domestic mergers occur within the same provinces.
In contrast, roughly 31% of domestic mergers and acquisitions occur within the same industry by
using the 2-digit industry classification by Statistics Finland. The Kernel density estimate of
distance decay function based on the Finnish municipalities further underlines the important
role of geographical closeness (Figure 1).8 Thus, the volume of domestic mergers substantially
declines as there is an increase in the distance between the acquiring and the target company
provided that a domestic merger has occurred in the first place.
Table 3. The share of domestic mergers in which the acquiring company and the targetcompany are located in the same region of Finland 1989–2000 (i.e. the values of thePROXIMITY variable).(Sources: Talouselämä magazine and Business Register by Statistics Finland).
Regional division: Share (%)
NUTS5-regions (446 regions) 20.3NUTS4-regions (85 regions) 32.9NUTS3-regions (21 regions) 38.2

22
Figure 1. The estimated distance decay function based on the distances between acquiringand target companies at the municipality level of the Finnish regions 1989–2000.
The information provided in Table 3 and Figure 1 suggests that geographical closeness is very
important for domestic M&As. However, it may also reflect the fact that most firms are located
in the Helsinki metropolitan area (a NUTS4 region) – which is a part of the Uusimaa province
(a NUTS3 region) – or in a few other NUTS4 regions. To take explicitly into account the
density of firms in various sub-regions, we have compared the actual share of intra-regional
mergers with the hypothetical probability for the intra-regional mergers in a situation in which
the acquiring firm chooses the target firm randomly, given the existing locations of the firms in
Finland. This probability is denoted by )(np . Its derivation is presented in Appendix 1. Using
the data on the number of firms in various sub-regions (their turnover is above FIM 3 million
and they are included in the Business Register by Statistics Finland), we have computed )(np .
The share of actual intra-regional acquisitions of all acquisitions for the NUTS4 regions and
derived )(np are presented in Figure 2. The share of actual intra-regional acquisitions is well
above )(np over the period of investigation supporting the conclusion that the acquiring firms
tend to locate geographically close to the target firms.
0.002
.004
.006
.008
Density
0 200 400 600 800 1000distance
.
23
Figure 2. The computational probability of an intra-regional merger and the value of thePROXIMITY variable for the NUTS4-regions 1989–2000.
The share of the Finnish provinces in the total volume of takeover activity by acquiring companies
shows the overwhelming dominance of Uusimaa, which is the heaviest populated area in Finland
(Figure 3). Although the share of Uusimaa in the total volume of takeover activity by target
companies is also high, it is not as high as the share of takeover activity by acquiring companies.9
This means that the firms located in the province of Uusimaa are gradually gaining control of firms
located in the rest of the Finnish regions in net terms by conducting mergers and acquisitions. The
losers of control seem to be fairly evenly distributed across the other NUTS3 regions, including
provinces such as Varsinais-Suomi, Pohjois-Savo and Pohjois-Pohjanmaa. This feature means that
domestic mergers and acquisitions substantially reinforce the core-periphery dimension of the
Finnish economic geography in an interesting way. In this sense, the situation is the same as in
Canada.
0,050
0,100
0,150
0,200
0,250
0,300
0,350
0,400
0,450
0,500
1989 1990 1991 1992 1993 1994 1995 1996 1997 1998 1999 2000
Computational probability Proximity (NUTS4)

24
Figure 3. The share of the Finnish provinces in the total volume of takeover activity byacquiring and target companies 1989–2000 (Source: Talouselämä magazine).
6. EXPLAINING GEOGRAPHICAL CLOSENESS
An important feature in the interpretation of the findings is that a number of variables are able
to capture the monitoring capacity of an acquiring company and the potential of an acquiring
company to obtain economics of scope and complementaries from a merger. Moreover, a
number of variables that characterize the target companies are able to capture the possibilities to
monitor a target company and complementaries from a merger. The most important finding
from matched data is that the strong ability by an acquiring company to monitor the target
(measured by the knowledge embodied in human capital) is able to support mergers that occur
across distant locations, other things being equal. The same pattern applies to knowledge capital
of an acquiring company measured by the R&D stock. This observation is consistent with the
earlier theoretical considerations for the role of distance in inter-regional mergers within a single
country.
The findings are reported in Table 4. (Additional results are reported in Appendix 2-3.) A number
of interesting patterns emerge despite the fact that a substantial number of domestic mergers and
acquisitions is lost in the construction of the matched data. The results from Table 4 show that the
likelihood that a domestic merger occurs within the same municipality decreases as the age of the
target company increases. This pattern is in line with the feature that the activities of older
25
companies are easier to monitor for acquiring companies. As a result, the young target companies
are more likely to be located geographically near the acquiring company. In addition, the likelihood
that a domestic merger will occur within the same municipality decreases as the turnover of the
acquiring company increases.10 This means that the larger companies are able to overcome the
geographical boundaries of municipalities more easily. The variables that capture patents of the
companies involved are not statistically significant and geographical closeness and proximity
across industries are not related, based on the Finnish evidence. These results are robust across
models.
Table 4. The estimation results (with t-statistics), 1989–2000. The results for Probitmodels are reported as marginal effects. The models include unreported year dummies.
Notes: ** (*) indicates that the parameter estimate is statistically significant at the 5 (10) per cent significancelevel.
Probit Model(dependentvariable:PROXIMITYfor NUTS5-level)
t-statistics Probit model(dependentvariable:PROXIMITYfor NUTS4-level)
t-statistics Probit model(dependentvariable:PROXIMITYfor NUTS3-level)
t-statistics Tobit model(dependentvariable:DISTANCE)
t-statistics
VINTAGE (acquirer) 0.001621 0.67 0.005559* 1.67 0.004505 1.33 -1.71475* -1.84VINTAGE (target) -0.00649** -2.75 -0.00314 -0.98 -0.0039 -1.21 0.528337 0.59MULTI (acquirer) -0.02911 -0.9 -0.06662* -1.51 -0.07431* -1.69 17.7116 1.46MULTI (target) -0.03731 -1.05 -0.03125 -0.65 -0.05081 -1.04 32.78766** 2.42TURNOVER (acquirer) -0.02906** -3.14 -0.04877** -3.85 -0.03141** -2.55 9.129417** 2.71TURNOVER (target) 0.011429 1.31 0.013983 1.15 0.001665 0.14 -1.56039 -0.48EDU1 (acquirer) -0.07315 -0.74 -0.22806 -1.61 -0.24778* -1.67 106.4833** 2.66EDU1 (target) 0.057967 0.55 0.120055 0.83 0.077868 0.51 20.17847 0.49EDU2 (acquirer) 0.512989** 3.00 -0.05352 -0.22 0.169302 0.63 -112.422* -1.52EDU2 (target) 0.536957** 3.41 0.29989 1.28 0.235817 0.95 -131.6* -1.84PATENTS1 (acquirer) 0.005697 1.28 0.000529 0.08 -0.00098 -0.2 0.434065 0.5PATENTS1 (target) 0.001244 0.38 0.002056 0.56 0.001318 0.35 -0.12253 -0.12PATENTS2 (acquirer) -0.03767* -1.74 -0.0227 -1.15 -0.0073 -0.64 -1.5167 -0.77PATENTS2 (target) -0.0054 -0.78 -0.00671 -0.95 -0.00521 -0.73 -0.62791 -0.32AGGLOMERATION(acquirer)
.. .. 0.075413** 5.93 0.058876** 3.14 -7.50257** -2.17
AGGLOMERATION(target)
.. .. 0.176554** 13.71 0.240744** 12.86 -42.0703** -12.27
SAMEINDU 0.012247 0.47 0.004924 0.14 -0.04635 -1.31 5.861413 0.60
Pseudo R2 for Probitmodels
0.08 0.36 0.23 ..
Number of observations 1057 1057 1057 1056
26
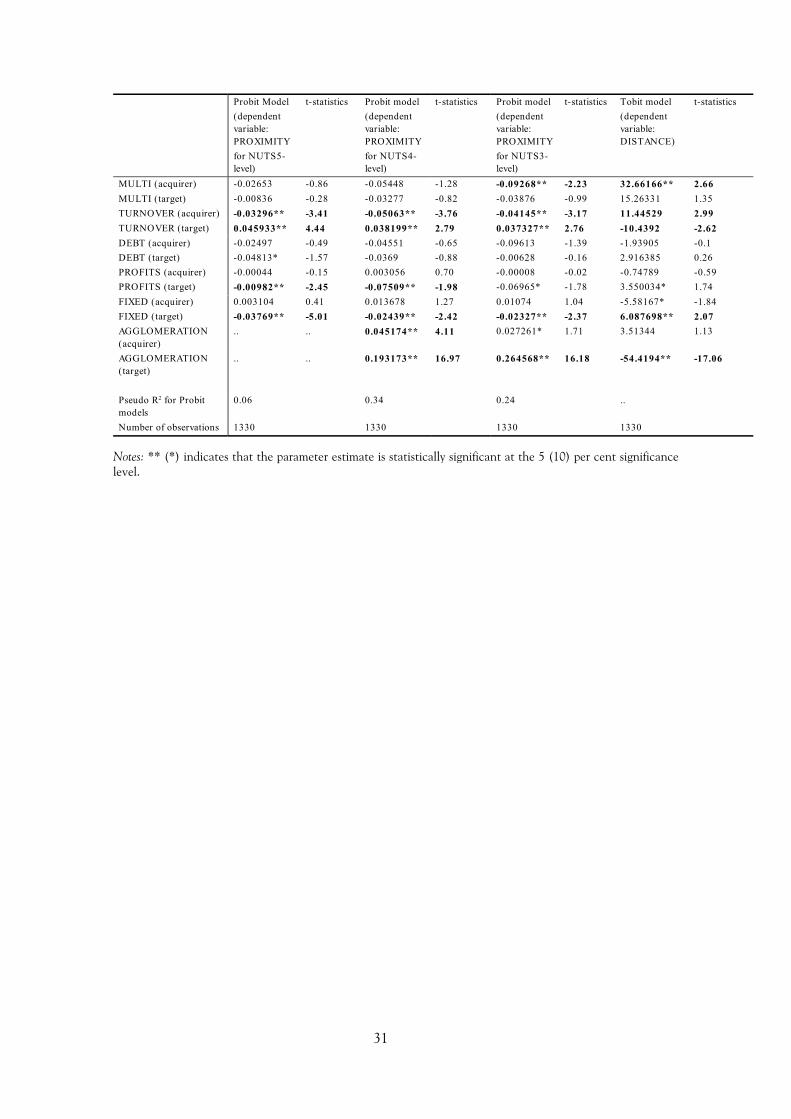
The results for NUTS4 regions reveal that the turnover of an acquiring company plays the very
same role as stated earlier. However, there is some evidence that geographical closeness matters
less for acquiring companies that consist of a number of establishments. In addition, the
educational composition of the companies seems to have some influence on the pattern of
domestic inter-regional mergers. The agglomeration of companies matters a great deal for the
pattern of domestic mergers. This means that mergers are substantially more likely to occur
within regions that contain a great number of companies. This result extends to provinces.
The findings for the DISTANCE variable reveal an interesting pattern according to which the
high share of highly educated employees with technical qualifications in an acquiring company is
able to support mergers that occur across distant locations. The explanation for this is that those
particular acquiring companies have more capacity to monitor the target companies. In contrast,
the coefficient of the EDU2 variable for the target company implies the same pattern as
explaining the PROXIMITY variable for NUTS5 regions. Our reading of this evidence is that
difficulties to monitor the target companies tend to compress the distance between the acquiring
and the target company as suggested by the earlier theoretical notions.
The results from the estimation of models that include financial variables are reported in
Appendix 2. The indebtedness (DEBT) of a target firm or an acquiring firm seems to have no
impact on the geographical dimension of domestic mergers and acquisitions. The reported
results concerning the impact of the PROFITS variable give some evidence that those targets
which are in good shape in terms of profitability can be monitored across distant locations. This
increases the share of those domestic mergers in which the target firm is located in another area
than an acquiring firm. The fixed tangible assets of the target firm (FIXED) negatively
contribute to the geographical closeness between a target firm and an acquiring firm. This
feature may reflect the fact that it is easy to monitor the quality of fixed tangible assets.
Therefore, the target company can locate in a location that is distant from an acquiring firm. On
the other hand, there is some evidence that the fixed tangible assets in the hands of an acquiring
company seem to shorten the distance. This pattern can be interpreted to reflect the fact that
the joint use of fixed tangible assets – which makes a merger profitable – may have certain
geographical limits.
Finally, the impact of R&D stock on the economic geography of domestic mergers and
acquisitions is considered. The number of observations substantially decreases due to the size of
the R&D survey data by Statistics Finland. The findings that are reported in Appendix 3 reveal
that an increase in the R&D stock of acquiring companies decreases the likelihood of mergers

27
that occur within the same regions. As stressed earlier, this feature may reflect the strengthened
monitoring capacity of acquiring companies, but it may also hint that the acquiring firms possess
knowledge capital of which joint utilization is not geographically restricted after a merger. In this
respect, it is noteworthy that there is some evidence for the perspective that the R&D stock of
the target firm decreases the likelihood that a takeover occurs within the same region. This
pattern may emerge from the fact that the joint use of the R&D stock has no geographical
limits.
7. CONCLUSIONS
This study explored mergers and acquisitions from a regional point of view. Theoretical
considerations based on monitoring were developed. The Finnish evidence reveals that
geographical closeness matters a great deal for inter-regional merger flows. This means that a
great number of domestic mergers occur within narrowly defined regions. Domestic merger flows
substantially reinforce the core-periphery dimension. The most important finding from matched
data is that the strong ability by an acquiring company to monitor the target (measured by the
knowledge embodied in human capital) is able to support mergers that occur across distant
locations, other things being equal. In addition, mergers and acquisitions are more likely within
regions that contain a great number of firms. This means that agglomeration of economic
activity matters a lot for regional pattern of domestic takeovers. However, geographical closeness
and proximity across industries are not related, based on the Finnish evidence.

28
REFERENCES
Aliberti, V., Green, M. (1999) A spatio-temporal examination of Canada’s domestic merger activity,1971-1991, Cahiers de Geographie du Quebec, 119: 239-250.
Ashcroft, B., Love, J.H. (1993) Takeovers, Mergers and the Regional Economy. Edinburgh: EdinburghUniversity Press.
Ashcroft, B., Coppins, B., Raeside, R. (1994) The regional dimension of takeover activity in the UnitedKingdom, Scottish Journal of Political Economy, 41: 163-175.
Behrens, A (2003) Regional gross domestic product in the European Union 2000. Statistics in Focus,Theme 1 – 1/2003, Eurostat.
Deneckere, R., Davidson, C. (1985) Incentives to form coalitions with Bertrand competition, Rand Journalof Economics, 16: 473-486.
DiNardo, J., Tobias, J.L. (2001) Nonparametric density and regression estimation, Journal of EconomicPerspectives, 15: 11-28.
Dixit, A. (1980) The role of investment in entry deterrence, The Economic Journal, 90: 95-106.
Ellison, G., Glaeser, E.L. (1997) Geographic concentration in U.S. manufacturing industries: a dartboardapproarch, Journal of Political Economy, 105: 889-927.
Farrell, J., Shapiro, C. (1990) Horizontal mergers: an equilibrium analysis, The American Economic Review,80: 107-126.
Green, M.B. (1987) Corporate-merger-defined core-periphery relations for the United States, Growth andChange, 18: 12-35.
Green, M.B. (1990) Mergers and Acquisitions. Geographical and Spatial Perspectives. London: Routledge.
Green, M.B., Cromley, R.G. (1984) Mergers and acquisitions fields for large United States cities, 1955-1970, Regional Studies, 18: 291-301.
Green, M.B., Lisle, N.W. (1991) Merger and acquisition projections in Canada: a markov approach,Ontario Geography, 36: 26-42.
Green, M.B., Naughton, R.B. (1989) Canadian interurban merger activity, 1962-1984, The CanadianGeographer, 33: 253-264.
Grunfeld, L.A. (2002) International R&D spillovers and the effect of absorptive capacity: an empiricalstudy, Unpublished.
Hall, B.H. (1990) The effect of takeover activity on corporate research and development. In Auerbach,A.J. (ed) Corporate Takeovers: Causes and Consequences. Chicago. University of Chicago Press.
Jensen, M.C. (1988) Takeovers: their causes and consequences, Journal of Economic Perspectives, 2: 21-48.
Jaffe, A.B., Trajtenberg, M., Henderson, R. (1993) Geographic localization of knowledge spillovers asevidenced by patent citations, The Quarterly Journal of Economics, 108: 577-598.
Keller, W. (2002) Geographical localization of international technology diffusion, The American EconomicReview, 92: 120-142.

29
Lehto, E., Lehtoranta, O. (2003) Becoming an acquirer and becoming acquired, Technological Forecastingand Social Change, (Forthcoming).
Levy, D., Reitzes, J. (1992) Anticompetitive effects of mergers in markets with localized competition, TheJournal of Law, Economics & Organization, 8: 427-440.
Matsushima, N. (2001) Horizontal mergers and merger waves in a location model, Australian EconomicPapers, 35: 265-286.
Milgrom, P.R., Weber, R.J. (1982) A theory of auctions and competitive bidding, Econometrica, 50: 1089-1122.
Perry, M.K., Porter, R.H. (1985) Oligopoly and the incentive for horizontal merger, The AmericanEconomic Review, 75: 219-227.
Rodriguez-Pose, A., Zademach, H-M (2003) Rising metropoli: the geography of mergers and acquisitionsin Germany, Urban Studies, 40: 1895-1923.
Salant, S.W., Switzer, S., Reynolds, R.J. (1983) Losses from horizontal merger: the effects of an exogenouschange in industry structure on Cournot-Nash equilibrium, The Quarterly Journal of Economics, 108: 185-199.

30
Appendix 1. The calculation of computational probability of an intra-regional merger.
Suppose there are N firms in the whole country, and that the number of firms in the sub-region i
is .in Then Nni i =∑ . The number of intra-regional combinations of two firms in sub-region i
is then
2in which is denoted by ).( inc The total number of combinations in the population is
2N
. This figure is denoted by ).(Nc The computational probability, denoted by )(np , for
such random acquisitions in which both parties locate in the same sub-region can be
approximated by the formula )(
)(1
Nc
nck
ii∑
= . We have calculated )(np annually. The larger the
number of sub-regions is and the more asymmetrically the firms are distributed over the sub-
regions, the lower )(np is. At the highest )(np approaches 0.5 (when there are only two sub-
regions of equal size and the number of firms is large). Calculating )(np , we have taken into
account all those firms of which turnover exceeds FIM 3 million (the same limit which is valid in
our M&A-data) in all sub-regions of Finland.
Appendix 2. The estimation results (with t-statistics), 1989–2001. The results for Probit models
are reported as marginal effects. The models include unreported year dummies.
31
Notes: ** (*) indicates that the parameter estimate is statistically significant at the 5 (10) per cent significancelevel.
Probit Model(dependentvariable:PROXIMITYfor NUTS5-level)
t-statistics Probit model(dependentvariable:PROXIMITYfor NUTS4-level)
t-statistics Probit model(dependentvariable:PROXIMITYfor NUTS3-level)
t-statistics Tobit model(dependentvariable:DISTANCE)
t-statistics
MULTI (acquirer) -0.02653 -0.86 -0.05448 -1.28 -0.09268** -2.23 32.66166** 2.66MULTI (target) -0.00836 -0.28 -0.03277 -0.82 -0.03876 -0.99 15.26331 1.35TURNOVER (acquirer) -0.03296** -3.41 -0.05063** -3.76 -0.04145** -3.17 11.44529 2.99TURNOVER (target) 0.045933** 4.44 0.038199** 2.79 0.037327** 2.76 -10.4392 -2.62DEBT (acquirer) -0.02497 -0.49 -0.04551 -0.65 -0.09613 -1.39 -1.93905 -0.1DEBT (target) -0.04813* -1.57 -0.0369 -0.88 -0.00628 -0.16 2.916385 0.26PROFITS (acquirer) -0.00044 -0.15 0.003056 0.70 -0.00008 -0.02 -0.74789 -0.59PROFITS (target) -0.00982** -2.45 -0.07509** -1.98 -0.06965* -1.78 3.550034* 1.74FIXED (acquirer) 0.003104 0.41 0.013678 1.27 0.01074 1.04 -5.58167* -1.84FIXED (target) -0.03769** -5.01 -0.02439** -2.42 -0.02327** -2.37 6.087698** 2.07AGGLOMERATION(acquirer)
.. .. 0.045174** 4.11 0.027261* 1.71 3.51344 1.13
AGGLOMERATION(target)
.. .. 0.193173** 16.97 0.264568** 16.18 -54.4194** -17.06
Pseudo R2 for Probitmodels
0.06 0.34 0.24 ..
Number of observations 1330 1330 1330 1330

32
Appendix 3. The estimation results (with t-statistics), 1989–2000. The results for Probit models
are reported as marginal effects. The models include unreported year dummies.
Notes: ** (*) indicates that the parameter estimate is statistically significant at the 5 (10) per cent significancelevel.
Probit Model t-statistics Probit model t-statistics Probit model t-statistics Tobit model t-statistics(dependent (dependent (dependent (dependentvariable: variable: variable: variable:PROXIMITY PROXIMITY PROXIMITY DISTANCE)for NUTS5- for NUTS4- for NUTS3-level) level) level)
VINTAGE (acquirer) 0.001385 0.52 0.004621 43101 0.000482 0.12 -2.69061** -2.19VINTAGE (target) -0.00546** -2.20 -0.00769** -2.15 -0.00928** -2.38 1.679965* 1.53MULTI (acquirer) 0.032147 0.96 -0.07925* -1.57 -0.13382** -2.50 23.84076* 1.59MULTI (target) -0.03668 -0.92 -0.0451 -0.76 -0.13691** -2.19 49.63836** 2.75TURNOVER (acquirer) -0.00612 -0.56 -0.01832 -1.11 0.002333 0.14 2.601524 0.53TURNOVER (target) 0.003922 0.40 0.02892** 37682 0.020625 12055 -7.60571* -1.73STOCK (acquirer) -0.04827** -3.50 -0.06667** -3.53 -0.07617** -3.96 14.83996** 2.83STOCK (target) -0.00461 -0.34 -0.04338** -2.13 -0.03621* -1.70 6.416652 1.08AGGLOMERATION .. .. 0.063086** 18354 0.051072** 2.27 -7.68372* -1.84(acquirer)AGGLOMERATION .. .. 0.171591** 11628 0.254615** 10.76 -44.0449** -10.14(acquirer)SAMEINDU -0.04363 -1.48 -0.02282 -0.54 -0.07454* -1.65 21.60481* 1.70Pseudo R2 for Probit models 0.08 0.37 0.25 ..Number of observations 678 678 678 678

33
1 Deneckere and Davidson (1985) have shown earlier that the coalition formation can be profitable for itsmembers in the Bertnard competition, because the rest of the companies raise their prices in response to a priceincrease by the merged companies.
2 The relaxation of affiliation assumption changes the outcome of different types of auctions (see Milgrom andWeber, 1982).
3 Jaffe et al. (1993), Keller (2002), among others, document the fact that knowledge and technology flows areseriously dampened by geographical distance. Grunfeld (2002) stresses that one interpretation of this regularityis that more resources are needed to enable learning from innovations that are undertaken at a geographicaldistance.
4 The primary data of Employment Statistics is gathered altogether from 22 different sources. The observationunit of Employment Statistics is a person. The Central Population Register is one of the basic registers in theEmployment Statistics system. The information on employment relationships is obtained from several differentsources. The Central Pensions Security Institute provides all the available data on employment relationshipswithin the private sector in the Finnish economy. In particular, it lists all employment relationships lasting overone month during the one-year period.
5 The procedure to calculate the R&D-stock variable is explained in detail in Lehto and Lehtoranta (2003).
6 The regional divisions of Finland are based on the various NUTS regions stipulated by the European Union.All in all, there are three kinds of NUTS regions in this study. The NUTS5 regions correspond to the Finnishmunicipalities (the total number of these regions is 446). The so-called NUTS4 regions consist of commutingareas. The number of these regions is 85. In addition, there are NUTS3 regions that correspond to theprovinces of Finland. The number of these regions is 21.
7 The point of location of a firm within a municipality is based on the concentration of economic activity withinthat particular municipality as defined by Statistics Finland. For this reason, for instance, the distance betweenthe municipalities of Vantaa and Helsinki is twelve kilometres despite the fact that these municipalities arelocated near to one another and they share elements of common borders.
8 The Epanechnikov is the applied kernel density estimate. It has the property that it is the most efficient inminimizing the mean integrated squared error. DiNardo and Tobias (2001) provide a survey of nonparametricdensity and regression estimation. The non-parametric smoothing of the observations by the Kernel densityestimate explain the small negative values for the distance observed in the left-hand side of the figure.
9 An important feature of the data is that Talouselämä magazine contains a description of plant-level measure oftargets. However, the unreported results based on the firm-level measure that are obtained from the BusinessRegister by Statistics Finland carry the same conclusion.
10 There are two ways to measure the scale of the involved companies. The results remain the same if the scaleof a company is measured by the SIZE variable instead of the TURNOVER variable.