does federal research funding increase university research...
TRANSCRIPT

Does Federal Research Funding Increase University Research Output?
March 2000First version: October 1998
A. Abigail Payne*University of Illinois
and
Aloysius Siow**University of Toronto
Abstract: This paper estimates the effects of federal research funding on research outcomes at 71research universities. We provide a new interpretation of the instrumental variable estimate of thecoefficient of a regression of the output of an institution on an input. Absent parameter heterogeneity, itmeasures the total change in output when an institution obtains an additional unit of the input due to achange in the shadow price of the input. Our instrument for research funding is alumni representation onU.S. Congressional appropriations committees. The estimates show that an increase of $1 million infederal research funding (1993$) to a university results in 11-18 more articles and $353,000 more in totalfaculty salaries. The change in citations per article is small and imprecisely estimated. With respect topatents, the results are mixed. When the shadow price of federal research funding falls, as a firstapproximation, universities buy more federal research funding and produce more but not necessarilyhigher quality research output.
We gratefully acknowledge financial assistance from the Andrew W. Mellon Foundation. We thank HaiChe, Gordon Davis, Max Hollott, Kate Melino, Lucas Siow, Mingli Zheng, and especially Marie Rekkasfor excellent research assistance. We also thank James Adams, Michael Baker, Vaughn Blankenship,David Card, James Heckman, Angelo Melino, Ariel Pakes, and participants of workshops at University ofCalifornia at Berkeley, Rutgers University, Clemson University, IGPA/Federal Reserve Bank of Chicago,Northwestern University, University of Georgia, University of Toronto, IUPUI WINE II, North AmericanEconometric Society Meetings, ASSA Meetings, SOLE, and Canadian Public Economics Study Groupfor useful discussions.
*may be reached at: [email protected]; Institute of Government & Public Affairs, University of Illinois,815 W. Van Buren Street, Suite 525, Chicago, Illinois, 60607; (312)413-3031.** may be reached at: [email protected]; Department of Economics, University of Toronto, 150 St.George Street, Toronto, Ontario, M5S 3G7; (416)978-4139.

1
For over 50 years, the U.S. federal government has systematically funded research and
development (R&D) at universities. Its role in this regard has increased substantially during this
same period so that today federal funding accounts for approximately 60 percent of total research
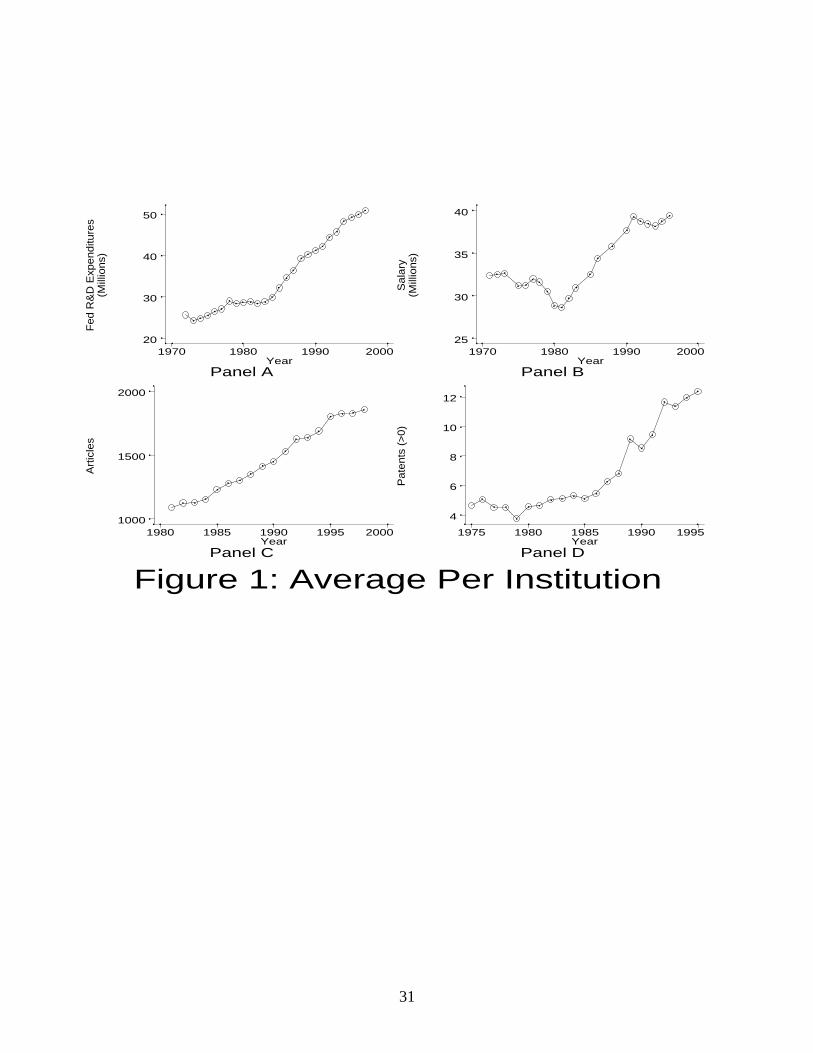
funding to universities (Gieger (1993)). Figure 1 shows the recent trends in real federal R&D
expenditures (1993$) and different research outcomes per research and doctoral university.
From the mid-1980s, there is a slow steady increase in average R&D funding to these
universities. Similarly, there are steady increases in the number of articles published, patents
issued, and faculty salaries at research universities during this same period.
Surprisingly, there is little systematic evidence on how federal funding affects
universities.1 A notable precursor to our study is Adams and Griliches (1998).2 Using
longitudinal data by school, they could not reject the hypothesis that the positive correlation
between research output (number of articles published and citations to those articles) and
research funding is due primarily to differences across schools. Their finding illustrates the major
difficulty that a researcher faces in studying the causal impact of funding on output. Due to the
peer review process, federal funding for R&D and the research capabilities of universities will be
positively correlated. Since universities differ widely in their research capabilities, a positive
correlation between funding and research output is primarily dominated by differences in
research capabilities across schools. The challenge is to find variation in research funding that is
orthogonal to a university’s research capability. This problem is well known in the much larger
private R&D literature. In their survey of over twenty years of research on the causal effects of
private investment and R&D, Griliches and Mairesse (1997) concluded: “The challenge is to find
1 In her comprehensive survey on the economics of science, Stephan (1996) has no estimate of the returnsto federal research funding of universities.2 Drew (1985) summarizes other studies that examine the relationship between federal research fundingand various output measures.

2
(instrumental variables) that have genuine information about factors which affect firms
differentially as they choose their input levels”.
Our paper is an attempt in that direction. First, controlling for school effects, we use
alumni affiliation on the U.S. congressional appropriations committees as the instrument for
federal R&D funding. In other words, within a school, we look at the variation in funding caused
by alumni members as they gain and lose membership on the U.S. congressional appropriations
committees and its correlation with research output.
The second contribution of our paper is methodological. Using micro panel data, many
researchers use an instrumental variable (IV) estimator to estimate the causal effect of an input
on an output measure.3 When there is no parameter heterogeneity, we provide a new
interpretation of the IV estimator. In this context, the IV estimate captures the total change in
output produced by an institution when it obtains an additional unit of input due to a change in
the shadow price of the input.
As a first pass, Table 1 presents the average level of federal research funding and various
outcome measures for universities with and without alumni representation on the appropriations
committees over time. The first row shows that, on average, alumni representation significantly
increases a school’s federal R&D funding by 38%. The second row shows that, on average,
alumni representation significantly increases the number of articles from a school by 28%. The
third row shows that, on average, alumni representation decreases the number of citations per
article by 8 percent. The results in Table 1 show that alumni representation is correlated with
both funding and output measures and so may be a useful instrument for studying the question of
interest.
3 Examples include Angrist (1990), Angrist and Lavy (1997), Card (1995), Cutler and Glaeser (1997),Hoxby (1996), Kane and Rouse (1993), Mairesse and Hall (1996).

3
Our detailed empirical findings, which control for school and year effects, endogeneity,
and omitted input bias, shows the following: for two of our four outcome measures (faculty
salaries, number of articles published, citations to articles, and patents issued) there is a strong
positive correlation between outcome and research funding. Under the preferred empirical
specifications, an increase of $1 million in federal research funding (1993$) to a university, due
to a fall in the shadow price of funding, results in 11 to 18 more articles and $353,000 more in
total faculty salaries. With the number of citations per articles published, a $1 million increase in
federal funding has either no or a slightly negative effect in the number of citations per article.
With respect to patents, the results are mixed. Under an IV tobit specification, the results
suggest a $1.4 million increase in federal funding results in an additional patent being produced.4
In summary, as a first approximation, lowering the shadow price of federal research
funding results in more but not necessarily higher quality research output. The paper is set out as
follows. Section I discusses the empirical framework. Section II provides a brief overview of the
role of Congress in affecting federal research funding and how we construct our instruments.
Section III explains the other data sources. Empirical results are presented in Section IV and the
conclusion is in Section V.
I Empirical Framework
To study the relationship between outcomes and federal research funding, consider
regressing an outcome measure on funding using school level data.5 We have a semi-reduced
form where unmeasured inputs are be captured by the error term of the regression:
4 This estimate ignores spillover effects, an important focus of recent research (E.g. Henderson, Jaffe, andTrajtenberg (1998), Jaffe (1989), Trajtenberg, Henderson, Jaffe (1997)).5 This is a common strategy among empirical researchers who often regress the output of a productionprocess on some but not all inputs.

4
(1) yjt�� �� �fjt + vjt
yjt : measure of output of production unit j at time t.
fjt : measure of an input of production unit j at time t.
vjt : error term of regression.
In the above equation, fjt is potentially correlated with the error term of the regression which
includes other inputs in the production process and production unit specific effects. With panel
data on different production units, researchers control for permanent differences across
production units with fixed effects. We also control for fixed effects in our estimation and
abstract from fixed effects for the rest of this discussion.6
To deal with the potential correlation between the fjt and the error term, researchers
HPSOR\�DQ�LQVWUXPHQWDO�YDULDEOH�HVWLPDWRU�WR�HVWLPDWH� ��7KHUH�DUH�DW�OHDVW�WZR�LQWHUSUHWDWLRQV�RI
WKH�LQVWUXPHQWDO�YDULDEOH�HVWLPDWRU�RI� �� IV : 7
A. IV estimates the total effect on yjt from an exogenousmarginal increase in fjt . It incorporates optimal adjustmentsby all other inputs to the increase in fjt .
B. IV estimates the marginal product of fjt .
The confusion about what IV estimates is due to the lack of an economic model in which (1) is
embedded.8 We provide an economic model to resolve this ambiguity.
Dealing with the empirical context of this paper, we model universities as profit
maximizing institutions for appropriately chosen shadow prices. University j at time t chooses
federal funding, Fjt , and other inputs, represented as a composite input Xjt , to solve:
6 Adams and Griliches have already shown the importance of controlling for fixed effects in this context.Moreover, the peer review process allocates more federal research funds to schools which are moreproductive in research (Cole and Cole (1981)).7 The classic discussion is Marschak and Andrews (1944). Recent discussions include Angrist andKrueger (1998), Card (1998), Griliches and Mairesse (1997), Heckman (1997), Heckman and Vytlacil(1998).

5
(2) Max E{ Yjt ( Fjt , Xjt )Zjt – Wjt Fjt – Rjt Xjt }
E : Expectations operator at time t by school j.
Yjt : Research output at time t by school j.
Zjt : Random productivity shock to school j at time t.
Wjt : Shadow price of federal funding at time t to school j.
Rjt : Shadow price of other input at time t to school j.
The other inputs in the production of research output captured by Xjt include knowledge learned
from teaching, research funded by non-government agencies, and unfunded research such as
private donations and income generated by endowments. We normalize the price of research
output to one. This is without loss of generality since we allow for individual school and time
specific shadow input prices. Any variation in the variables of interest is due to changes in the
shadow prices and productivity shocks that the school faces. Let log Zjt = zjt + zjt , two random
variables where zjt is observed before input decisions are made and zjt is observed after input
decisions are made. The means of zjt and zjt are both 0 and uncorrelated with each other, Wjt, and
Rjt. Wjt and Rjt may be correlated.
For any variable V, let V* denote the choice of V which solves (1). Let v and v* denote
the log of their respective upper case variables Using a log linear approximation to the
production function, and abstracting from fixed effects, observed log output will satisfy:
(3) yjt* = a fjt
* + b xjt* + zjt + zjt
It is convenient to parameterize the correlation between wjt and rjt as rjt = θwjt + rjt where wjt is
uncorrelated with rjt.9 If θ is zero, the two shadow prices are uncorrelated.
8 Card (1998), Heckman (1997), Marschak and Andrews (1944).9 It is important to allow for correlated shadow prices because Connolly (1997) finds a positiverelationship between internal and external funding and Payne (1998) finds a positive relationship betweenprivate donations and government grants.
6
Our interest is to estimate the optimal response of a school’s research output as its log
shadow price of research funding, wjt, falls, holding the other independent log shadow price, rjt,
constant. The change in output due to a marginal change in wjt is captured by:
(4) �yjt* / �wjt = a {�fjt
* / �wjt + θ�fjt* / � rjt } + b {�xjt
* / �wjt + θ�xjt* / � rjt }
Using (4), if wjt is increased by Zjt= {�fjt* / �wjt + θ�fjt
* / � rjt }-1, the increase in log research
funding is:
(5) ̈ fjt* = 1
and our object of interest, the increase in log output is:
(6) ̈ yjt* = a + b {�xjt
* / �wjt + θ�xjt* / � rjt }{ �fjt
* / �wjt + θ�fjt* / � rjt }
-1
(6) is the formula for the percentage change in research output induced by increasing wjt by Zjt
such that the school is also induced to buy an additional unit of fjt. There are two effects in (6).
The first term on the right hand side of (6) is the effect on research output due to a 1% increase
in research funding induced by Zjt. The second term on the right hand side of (6) is the effect
on research output due to the change in other input induced by Zjt. This last term allows for a
cross price elasticity effect as well as an own price elasticity effect which is induced by the
correlation between the input prices.
To evaluate (6) further, we posit the following input demand system:
(7) fjt* = w wjt + x rjt + z zjt = ( w + θ x) wjt + x rjt + z zjt = f wjt + x rjt + z zjt
(8) xjt* = βw wjt + x rjt + βz zjt = (βw + θβx) wjt + βx rjt + βz zjt = βf wjt + βx rjt + βz zjt
Thus, ̈ yjt* becomes:
(9) ̈ \* = a + b f� f-1
Using (7) and (8) to solve out wjt:
(10) xjt* = f f
-1 fjt* + ( f x - x f ) f
-1 rjt + ( f z – z f ) f -1 zjt

7
And, so, (3) may be rewritten as:
(11) yjt* = λ fjt
* + vjt
where λ = ¨\* = a + b f f –1
and vjt = b ( f x - x f ) f -1 rjt + b ( f (b
-1 + z) – z f ) f -1 zjt + zjt
The SOLP�RI�WKH�2/6�HVWLPDWRU�RI� �LQ������� OLS , is:
(12) SOLP� OLS = plim ( jt fjt* yjt )( jt fjt
* fjt* )-1
= a + b f f –1 + cov( fjt
* , vjt )[var( fjt* )]-1
= a + b f f –1 + b{( f x - x f) x var(rjt) + ( f (b
-1� z) – z f) z var(zjt)}[ f var( fjt* )]-1
OLS is an inconsistent estimator of a or ̈ y*.
Consider a vector Qjt which is correlated with wjt, and uncorrelated with rjt, zjt or zjt. As a
consequence, Qjt is correlated with fjt* and uncorrelated with vjt in (11). Let Qjt be an instrument
for fjt*. Since Qjt satisfies the standard properties of an instrument in (11), the plim of the
LQVWUXPHQWDO�YDULDEOH�HVWLPDWRU�IRU� ��� IV , is:
(13) plim IV = a + b f f –1 = ¨\*
Thus, (13) implies that IV estimates:
C. IV estimates the change in log output when school buys anadditional unit of log funding due to a change in theshadow price of funding.
Equation (13) applies even when productivity shocks are partially observed before input
decisions are made, i.e. var(zjt) ≠0 and when the input shadow prices are correlated, i.e. θ ≠ 0.10
That is, we allow the instrument to be correlated with the other input shadow price. Using (12)
and (13), the relationship between IV and OLS is:
10 Olley and Pakes (1996) also consider the case of partially observed productivity shocks without timevarying shadow input prices.

8
(14) ∆λ = plim IV – plim OLS
= b{( x f - f x ) x var(rjt) + ( z f - f (b-1 + z)) z var(zjt)}[ f var( fjt
* )]-1
In general, it is difficult to interpret the determinants of the sign of ∆λ. Consider the special case
where θ equal 0, there is no correlation between the shadow prices of inputs, and var(zjt) ≈ 0, the
pre-observed productivity shocks are small. ∆λ then becomes:
(15) ∆λ = b{( x f - f x ) x var(rjt)}[ f var( fjt* )]-1
In this case, f = w and f = w. Convexity of the profit function implies (x f - f x) and f are
both negative. Thus, the sign of ∆λ depends on the sign of x, the cross price elasticity for input
fjt. The sign of x is the same as the sign of f , the cross price elasticity for input xjt. If x ( f) is
positive, the substitution effect dominates the output effect due to an increase in rjt (wjt) and ∆λ is
positive.11 The reverse is true when x ( f) is negative. The profit function also implies f has
the same sign as x. So when ∆λ > 0, a > plim IV > plim OLS. Then, IV provides a lower bound
estimate of a, the marginal product of federal funding. On the other hand, when ∆λ < 0, a <
plim IV < plim OLS and IV provides an upper bound measure of a.
Finally, if (11) is not log-linear, we argue by analogy that:
D. IV estimates the change in measured outcome when aschool buys an additional unit of the measured input due toa change in the shadow price of the measured input.
II Congress and Federal R&D Funding of Universities
To implement the IV estimator, we need instruments that are correlated with the shadow
price of federal research funding and uncorrelated with other independent shadow prices and
productivity shocks that affect a university. Potentially, alumni representation on congressional
11 Recent IV estimates of the return to schooling typically exceed the OLS estimates (Card (1998)). Ourframework provides a new explanation of that finding.

9
appropriations committees is such an instrument. In 1995, approximately 14 percent of total
federal discretionary spending went towards research funding. As a proportion of total
discretionary spending, R&D funding rose from 11.5 percent in 1980 to 13.3 percent in 1998
(NSF (1998)). Discretionary spending provides opportunities for Congress to channel funds to
particular schools. Below we discuss the role of the congressional appropriations committees
with respect to the federal government budget and our construction of instruments to reflect this
role.
Congress plays several roles in funding research. The most prominent role is that of
appropriations (Kleinman (1995)). Both chambers have an appropriation committee responsible
for establishing the budget and allocating discretionary funds. Although the appropriations bill
must be approved by the entire Congress and signed by the President, members on the
appropriations committees have substantial power in establishing the budget.12 In addition to
widespread anecdotal evidence, there is also systematic evidence that individual Congress
members do influence budget allocations (e.g. Hird (1991), Rich (1989), and Savage (1999)).13
Examples of direct congressional influence include appropriating (or not appropriating)
money to particular agencies as well as particular programs within each agency and earmarking
funds directly to schools. A study by Johns Hopkins University found some individual diseases
receive more federal research money than would be predicted if financing were distributed solely
based on indicators that reflect deaths and loss of years of healthy life because of disability
(Chronicle of Higher Education, 1999). The reasons for this difference in federal research
12 In practice, the President submits a proposed budget to Congress. The House appropriations committeereviews and changes the proposed budget and then submits it for review by the Senate appropriationscommittee. The Senate committee plays a role similar to that of an appeals board. Once both chambersapprove the budget it is then presented to the President for his approval.13 See Payne (1999) for a more extensive analysis of the political economy of federal research funding touniversities.

10
funding has been attributed, at least in part, to the efforts of politically connected advocates of
certain diseases such as AIDS and breast-cancer research to influence Congress to spend more on
these diseases.14 In general, there is increasingly more evidence that Congress is providing more
directives as to how to spend the agency’s funding (Chronicle of Higher Education, 1998a). For
example, the Senate appropriations committee issued a report for fiscal 1999 that included a very
detailed list of instructions to the National Science Foundation (“NSF”). Included in this list was
a request to exclude major research institutions from two new research competitions as well as to
broaden the distribution of research money across more research institutions.
With respect to appropriating funds directly to schools, since 1983, earmarking has
played a significant role in allocating funds to universities. Currently, less than five percent of
research funding to universities is through earmarked funds; in 1998, Congress passed spending
measures that included more than $495 million earmarked projects (Chronicle of Higher
Education (1998b)).
If members have emotional and political ties to their alma maters, we expect schools with
alumni representation on the committees to receive disproportionately more funds than when
there is no alumni representation. In other words, when an alumni member is appointed to an
appropriations committee, the shadow price of federal research funding falls. The timing of a
member’s appointment on the appropriations committee is not determined by attributes of the
member’s alma mater. That is, the fall in the shadow price of funding induced by a member’s
appointment is not caused by changes in other shadow prices or productivity shocks that the
school faces. Thus, alumni representation on the appropriations committee is arguably a valid
instrument for federal research funding to a school.
14 Similarly, agencies seeking bigger budgets may seek to allocate research funding in a manner whichfavors schools affiliated with the members on the appropriations committees.
11
To that end, we collected data on congressional membership on the appropriations
committee for both chambers of Congress for the period 1970 to 1996. Except for the
occurrence of a death or resignation, both committees may change members every two years.15
For each general member that served on the appropriations committee during this period, we
identified the undergraduate alma mater of the member and the congressional chamber to which
the member was elected.
With the congressional data we created five dummy variables, three for the House of
Representatives and two for the Senate. Each dummy variable represents whether that university
has a specific number of general members serving the appropriations committee with an
undergraduate degree from that university. At most there are two members on the Senate and
three members on the House committees with an alma mater affiliation.
Because we include year and university fixed effects in all specifications, the above five
measures, when used to explain government funding, will have explanatory power only when
there is a change in one of the five measures for a school in the sample under analysis. In other
words, the average level of representation in a school is not exploited in the analysis.
There are 71 research or doctoral universities that experience at least one change in
representation over the period 1971-1997. The average length in which a school experiences no
change in any of the five congressional dummy variables we use is 7 years. Put another way,
ignoring year effects, our predicted funding for a school keeps the same value for an average of 7
years. They change an average of 3 times per school over the period studied.
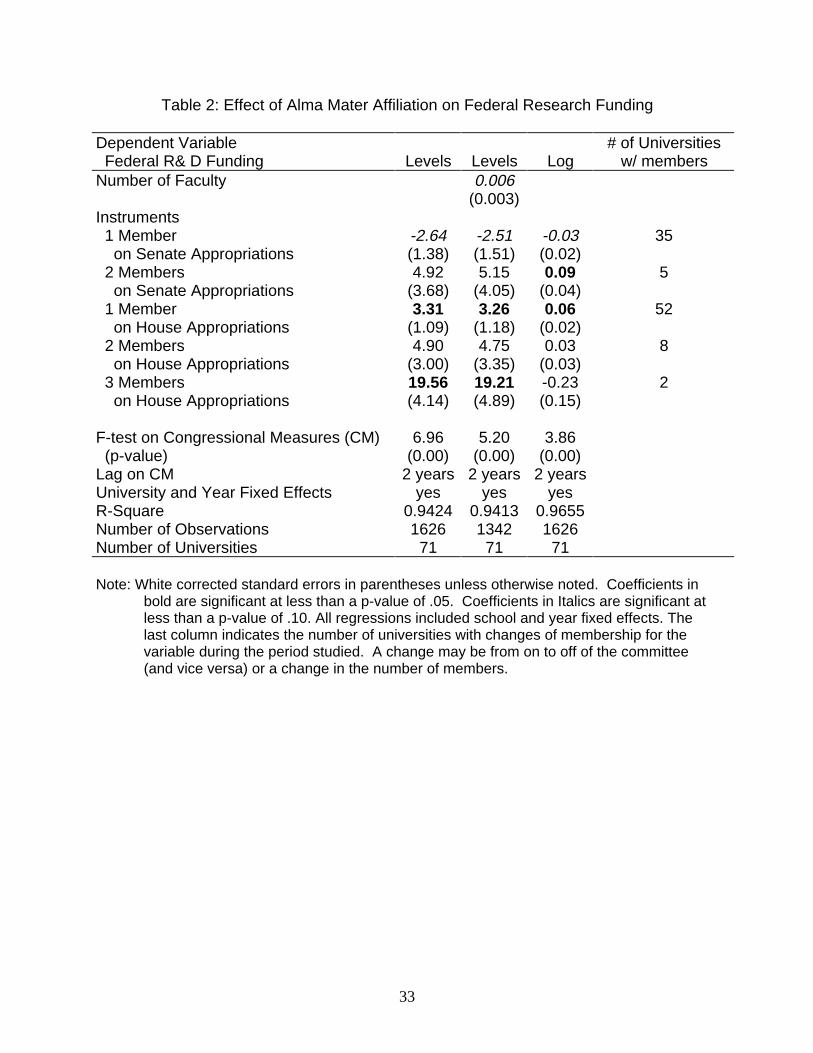
Results from regressing annual federal research funding on the congressional variables
for the period 1973-1997 are presented in Table 2. The data are discussed in detail in the next
15 There are elections for both chambers every two years. In the House, all members must be elected orre-elected every two years. In the Senate, one-third of the members are elected or re-elected every two

12
section. There are 71 research or doctoral institutions and an average of 18.5 years of data for
each school. There is a two year lag between research funding and the congressional variables.
The last column of Table 2 indicates for each measure the number of schools with a change for
each measure.
Overall, the F-tests show the congressional variables, as a group, have significant
explanatory power in all regressions. While congressional representation affects funding at
universities, the primary variation in funding across schools is determined by school level
effects. School and year effects alone have an R2 of .9391. The incremental R2 contributed by
congressional representation is only .0033. For the purpose of this paper, however, having a
variable that affects the shadow price of funding and is independent of the quality of the
institutions involved is what matters. As shown in Table 2, intertemporal variation in
congressional representation within a school satisfies this criterion. In the language of Griliches
and Mairesse, we have found a set of instrumental variables that have genuine information about
the shadow price of federal funding which affect universities differentially as they choose their
funding levels.16
Across specifications, the most consistent and significant results are the estimates of
having one alumnus as a general member of the House appropriations committee. There are
more schools with this type of representation than all the other types of representation combined.
In the levels specification, a general member on the House committee increases expenditures by
about $3.3 million per year. In logs, evaluated at the mean, it increases expenditures by 6% or
years since a given member holds office for six years.16 In their discussion of small sample bias caused by weak instruments, Bound et al. suggests that the Fstatistic on the instruments in the first stage regression should be used to gauge whether there may be aweak instruments problem. The p-values on the F statistics are less than 0.01 in all the first stageregressions mitigating our concern for weak instruments.

13
$3.9 million. Since the average duration of representation is 7 years, the increase in funding
obtained by a school due to this representation is quantitatively significant. The value of having
a member on the Senate appropriations committee is less clear. The point estimates are negative
and statistically significant at less than a ten percent level for all three specifications. If we
remove any one of eight universities from the sample, however, the estimated coefficient
becomes insignificantly different from zero. When there are two members, the point estimates
are positive but only statistically significant in one case. In general, we do not want to place
undue weight on the point estimates for the impact of more than one member because there are
so few schools with more than one alma mater affiliation.
III Other Data
To study the effect of federal research funding on research outcomes, we use
publications, patents, and faculty salaries as the measures for research outcomes. The other key
data sources are: CASPAR data on federal funding and institutional characteristics, Institute for
Scientific Information data on articles published and citations to articles published, and Chi
Research data on patents issued to universities. Funded by the National Science Foundation
(NSF), CASPAR is a compendium of data sources on higher educational institutions.17 Data
from this source are at the institutional and academic discipline level and are available on a
yearly basis from as far back as 1972. The schools are classified under the Carnegie (1994)
classification scheme. We have selected those schools for which the classification is research or
doctoral university.18 This selection covers 224 institutions. For the period under analysis, there
17 An overview of the data can be found at their web site, “www.caspar.nsf.gov”.18 Research universities are defined as those that offer a full range of baccalaureate programs, arecommitted to graduate education through the doctorate, and give high priority to research, awarding atleast 50 doctoral degrees each year. Doctoral schools differ from Research schools in that they do notmeet minimum requirements with respect to federal support and they may award fewer doctorate degrees.The Research and Doctoral schools are further divided into classes I and II. Research I differs from

14
are 71 universities with changes in their alumni representation on the congressional
appropriations committee.19
Table 3 reports the distribution of schools by Carnegie code and ownership status (private
or public) for the schools analyzed in this paper (columns 1 and 2) and for the entire sample
(columns 3 and 4).20 The majority of the schools are classified as Research I schools, which are
those considered to be the most research intensive. Of the schools studied in this paper, 62
percent of the schools are Research I. With respect to the distribution between public and private
schools, over 60 percent of the schools are public universities. Table A1 identifies the
universities studied in this paper. From the CASPAR data set, we are using the following
measures: federal obligations for research and development, number of faculty, and total faculty
salaries.21 The number of faculty and faculty salary data are missing for all schools for 1974,
1984, 1987, and 1989.
Research II in that Research I schools receive more than $40 million annually in federal support.Doctoral I differs from Doctoral II in that Doctoral I schools must offer at least 40 doctoral degrees in atleast five disciplines; Doctoral II schools must award 20 or more doctorate degrees in at least onediscipline or more than 10 degrees in at least three disciplines.19 Carnegie Classifications exist for 1973 and 1987 in addition to the 1994 classification. All of theschools that have a classification of Research or Doctoral Institution in 1973 were also classified as aresearch or doctoral institution in 1994. Between 1973 and 1994, the number of institutions classified asresearch or doctoral increased; most of the “new” schools in the classification are Doctoral institutions.Thus, it appears that once a school decides to qualify as a doctoral institution, there is no attrition of theseschools. Since our research and doctoral schools were selected by the 1994 classification, we do notsuffer from any attrition bias in the data. Carnegie Classifications exist for 1973 and 1987 in addition tothe 1994 classification. All of the schools that have a classification of Research or Doctoral Institution in1973 were also classified as a research or doctoral institution in 1994. Between 1973 and 1994, thenumber of institutions classified as research or doctoral increased; most of the “new” schools in theclassification are Doctoral institutions. Thus, it appears that once a school decides to qualify as a doctoralinstitution, there is no attrition of these schools. Since our research and doctoral schools were selected bythe 1994 classification, we do not suffer from any attrition bias in the data.
21 The federal obligations for research and development report the dollars allocated to a university on anannual basis. Given that many research grants are awarded on multi-year basis, the obligations reflect theannual allotment of these grants for each year and not the entire grant amount awarded in the first year.
15
Data on articles published and citations to articles are available each year from 1981 to
1998. We use data at the institutional level for papers published during that year for all
disciplines.22 The articles published are measured from a set of approximately 4,800 journals.
These data are reported only for the most prolific universities. There are 50 universities that
have congressional representation and data on articles published. Over 90 percent of the schools
are Research I universities with more public than private universities.
The citations per article are the total number of citations to articles published in a
particular year, accumulated to 1998, divided by the number of articles published in that year.
Thus, the number of citations per article in earlier years will be higher on average than the
number of citations per article near the end of the sample period; the year fixed effects should
control for this difference.
Data on patents cover the period 1975 to 1994. The data report for 58 of the universities
with congressional representation the number of patents issued to the university on an annual
basis.23
The seventy-one schools in our sample are not necessarily a random sample of research
universities. We are not, however, comparing outcomes for the schools with representation
versus those without. Rather, we are comparing outcomes for the seventy-one schools when they
22 For some of the article and citation counts the name of the school represents the school system and nota particular campus. To address this issue we did the following: if the system for which the school isattributed has only one major research university then the full value of the measure is attributed to thatuniversity. If, however, there is more than one major research university affiliated with the system, thenwe use the rankings of the National Research Council to weight the measures across the researchuniversities in the system. This occurred with two systems, however, only one system is used in ouranalysis, the University of Alabama.23 For some of the patent the name of the school represents the school system and not a particular campus.As with the articles data, we followed the same methods to address this issue (see previous footnote). Forthe patent data, the problem occurred with ten systems; only five systems are used in our analysis:University of Alabama, University of California, University of Maryland, University of Texas, andUniversity of Wisconsin.

16
have representation versus the periods when they do not. So the potential non-random selection
of schools with representation is not of first order concern.
Table 4 reports summary measures of the key measures from the CASPAR and other data
sets. Columns 1 through 4 report the summary measures for the universities studied; columns 5
through 8 report the summary measures for all data on the research and doctoral universities. All
dollars are reported in real dollars with 1993 as the base year. Overall, the measures for the
universities studied are higher than the measures for all universities. Average annual federal
R&D funding for the universities studied is $65 million and ranges between $50,000 and $288
million. Federal R&D funding represent, on average, 62 percent of total R&D expenditures.
The average funding per faculty is $56,000 with a minimum of less than $1,000 and a maximum
of $505,000. Average total faculty salary is $49 million, ranging from $7 to $211 million. The
average number of articles published is 1716 per year and the average number of citations per
article is 17. The average number of patents issued per year is 7.
IV Results
In all our outcome regressions, we include school and year effects. We will present
results by OLS and IV. As explained in Section I, a change in the shadow price of federal
funding affects other inputs. Without other exogenous measures to explain the other inputs,
including them in the regression is inappropriate.
Our empirical framework assumes that all changes in the shadow price of federally
funded research of the same magnitude, independent of its source, will result in the same
changes in outcomes. If the funded grants are heterogeneous, this assumption may not be valid.
For example, assume all grants funded by federal granting agencies are the same ex-ante. Due to
the noisy screening process, some rejected grant applications may be of the same expected

17
quality as those funded. Congressional representation means a qualified application from the
represented school has a lower probability of being rejected. All funded grants, regardless of
congressional intervention, produce the same expected outcomes. In this case, our instrumental
variable estimator estimates the average outcome due to a fall in the shadow price of funding.
At the other extreme, assume funded grants are not alike ex-ante. The first grant to be
funded is of higher expected quality than the last grant to be funded. Congressional
representation may induce a lower standard for a grant application to receive funding. In this
case, our instrumental variable estimator provides a lower bound estimate of the average
outcome due to a fall in the shadow price of federal funding. To be conservative, we will use the
first interpretation of our estimator, that it provides an estimate of the average outcome due to a
fall in the shadow price of funding. If funded grants are ex-ante heterogeneous, our estimator
underestimates the average outcome.
Because the appropriate functional form for (11) is not known apriori, we report results
using three linear specifications: levels, level with a control for faculty size, and logs.24 If a
particular functional form is inadequate, higher order funding will be incorporated in the error
term of that regression. These higher order terms will be correlated with our instruments since
our instruments change the shadow price of research funding. As such, the IV estimator would
be inconsistent. We use an over-identification (over-id) test as a means to determine which
empirical specification approximates the true specification. The over-id test tests the exogeneity
of the instruments in the second stage regression. A high p-value suggests the instruments
belong in the first stage regression but not the second stage regression, permitting us to estimate
24 We assume faculty size is exogenous. Because this may be a fairly strict assumption, however, we donot place much emphasis on this specification. This measure is included as a specification in order tocontrol, to some extent, for time varying changes in the school that are not captured in the year and schoolfixed effects.

18
the effect of a change in the shadow price of funding on output. Thus, we will use a high p-value
as an indication of the appropriate specification.
When interpreting the qualitative differences in estimates obtained by λOLS versus λIV, we
assume that var(zjt) and θ are both approximately zero. Otherwise, the differences do not have
simple interpretations.
In principle, the specification of lag structures should be an important concern in this
paper because of the lags between funding measures and research outcomes such as publication
and patent counts. In practice, because our predicted funding measure, attributable to changes in
congressional representation, changes so infrequently, different lag structures have little effect on
our IV estimates. We report the lag lengths that generate the smallest standard errors. The level
of time aggregation may also be important. We discuss results with a different level of time
aggregation in the following section.
Although we control for fixed effects, the quality of a school may change over time. If
higher quality schools obtain more funding, then the OLS estimate of the impact of funding on
output will be biased upward. In this case, the IV estimate should be smaller than the OLS
estimate. As will be seen below, in general the IV estimate is larger or similar to the OLS
estimate. Thus, bias due to changing school quality over time is not an overwhelming problem.
An alternative interpretation when the IV estimate is larger than the OLS estimate is
measurement error in federal funding. The IV estimates, as we change the output measures, are
not consistently larger than the OLS estimates. Since the regressor does not change as we change
output measures, the effect of measurement error in the regressor should remain across output
measures. Thus, a simple measurement error in federal funding cannot explain our results.

19
A. Effect of Funding on Articles Published
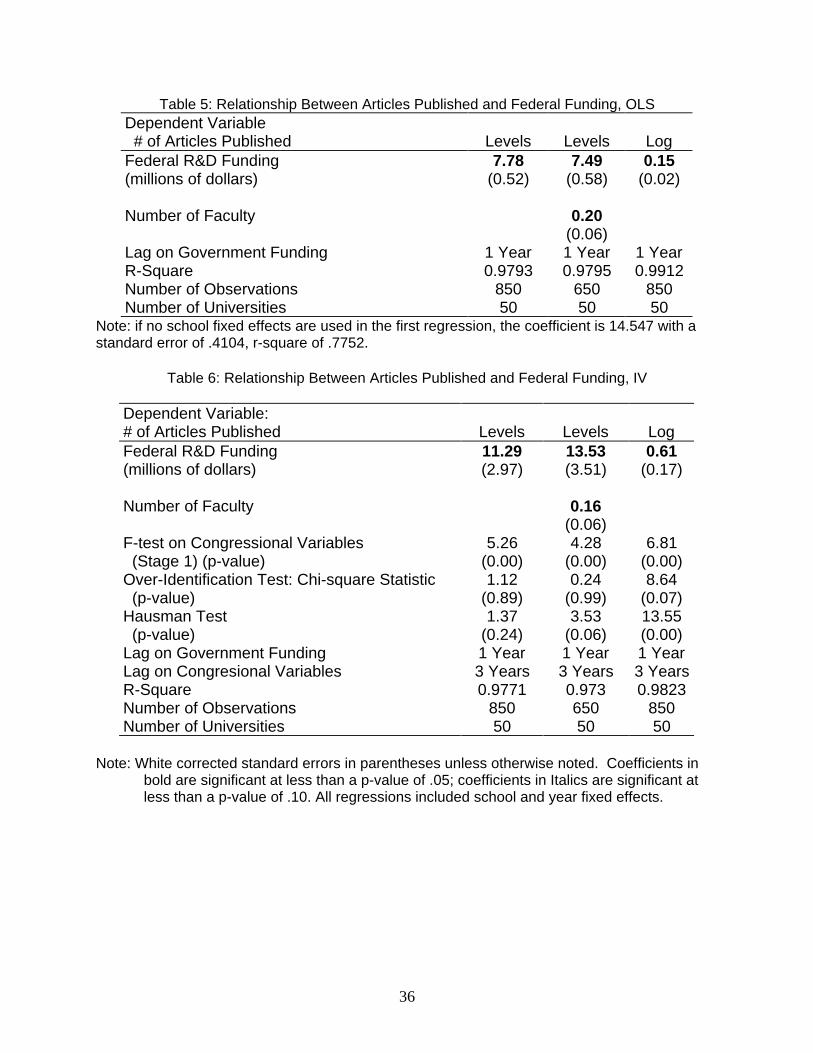
Tables 5 and 6 report the OLS and IV results when the number of articles published is
used as the outcome measure. This is a traditional measure of research output that universities
and the funding agencies care about. The analysis of this output measure covers 50 universities
and 850 observations, representing 17 years of data for each university. For all specifications,
we lag government expenditures by one year and the instruments by three years. Although the
results for the first stage regressions for the period and universities covered by the articles
measure are not reported here, the results are similar to those reported in Table 2 which includes
all possible schools and years in the regression.25
Columns 1 and 2 are the two specifications for which the over-id test is satisfied. The
Hausman test, testing whether the IV coefficient is significantly different from the OLS
coefficient is satisfied the 24 percent level in column 1 and at the 6 percent level in column 2.
The OLS estimate suggests an additional 7-8 articles are published for each additional $1 million
in federal funding obtained by the university whereas the IV estimate suggests an additional 11-
14 articles are published.
In Column 3, under a log specification, the results suggest a one percent increase in
federal funding will increase articles published by .15 percent under the OLS specification and
.61 percent under the IV specification. Evaluated at the mean funding level, the log IV
specification implies that an additional $1 million in federal funding obtained by the university
results in 11 more articles. On the whole, the results in Table 6 suggest the effect of federal
funding on articles published is higher than the OLS results. When producing articles,
universities substitute toward other inputs if the shadow price of federal funds increase. In
25 The results from the specific first stage regression for the publication measures are available from theauthors.

20
summary, our results unambiguously show that controlling for school effects, when its shadow
price of federal funds falls and the university obtains more funding, the university will produce
more articles.
B. Effect of Federal Funding on Citations to Articles Published
In this section, we use citations per article as the outcome variable. It provides a measure
of the quality of the articles published. As discussed in the data section, citations per article are
the total number of citations to an article published, accumulated to 1998. We use year fixed
effects to control for the difference in the number of years covered in the citation counts. Tables
7 and 8 report the coefficients on federal expenditures for the citations outcome measure. Unlike
the other outcome measures, the OLS coefficients on federal funding are negative for the levels
specifications and positive for the log specification. The coefficients are statistically significant
in all three specifications. Taken literally, the negative coefficients imply that additional federal
funding reduces the quality of research.
The IV estimates present a different story. In Table 8, the estimated funding coefficients
are negative for the level specifications but are not statistically significant. The estimated
funding coefficient is positive for the log specification but it is also not statistically significant.
The Over-Id test is not rejected for the log specification. Overall, we cannot reject the
hypothesis that the estimated IV coefficient on funding is zero. Thus the results in Table 8 show
that, when the shadow price of federal funds fall, the school receives more funding but does not
produce higher quality research.
Finally, even though the Hausman tests suggest that there is no difference between the IV
and the OLS estimates, it is difficult to provide a consistent interpretation of the OLS results.
21
While the point estimates may not be different, the IV estimator captured the imprecision of the
estimates whereas the OLS estimates are misleadingly precise.
C. Time Aggregation
Thus far, using our IV estimates, we have shown that when the shadow price of federal
funding falls, a university obtains more funding and produces more, but not higher quality,
research. An alternative interpretation of our finding is that the result is due to time aggregation.
The OLS fixed effects estimator puts disproportionate weight on estimating high frequency
causal effects. Permanent causal differences carry zero weight. Given the nature of research
funding, we should expect there to be a gradual effect of funding on output. With the fixed-
effects specification, however, transitory non-causal fluctuations will tend to obscure any gradual
effect funding on output.26
The instruments used in the IV specification addresses this time-aggregation issue insofar
as representation on budget committees changes infrequently.27 Thus, our instrument set
captures any gradual effect of funding on research output. Aside from the endogeneity and
omitted variables problems, our IV estimator also picks up the causal effect of funding on output
off lower frequency effects than the OLS estimator.
To address this issue of time aggregation, we constructed three-year averages of the
output and funding measures. Tables 9 and 10 provide OLS and IV estimates of the impact of
funding on the number of articles using these time-averaged measures.28 Compared with the
estimated OLS coefficients using annual data in Table 5, the time-averaged OLS estimates are
larger, consistent with the time aggregation effect discussed above. The IV estimates in the
26 See Baker, Benjamin and Stanger (1999).27 In our sample, the average tenure on the committees was 7.2 years.28 The instruments are not time-averaged.

22
levels specifications are also larger than that using the annual data. The hypothesis that there is a
difference between the OLS and IV estimates is no longer as convincingly rejected, however,
due to the large standard errors. In the log specification, the time averaged IV estimate is the
same as the annual estimate. There is still a statistically significant difference between the OLS
and IV time average estimates. In summary, part of the difference between the OLS and the IV
estimates of the impact of funding on the number of article using annual data is due to the fact
that transitory changes in funding do not have large effects on output. The results also suggest,
after controlling for time aggregation, there is a causal effect from a change in the shadow price
of funding to changes in the number of articles.
Tables 11 and 12 present time-averaged OLS and IV estimates of funding on citations per
article. As with the annual estimates, the time averaged OLS estimates imply that a fall in the
shadow price of funding reduces the average quality of research. In the levels specification, the
time averaged IV estimates are not statistically different from zero, consistent with the annual
estimates. On the other hand, the time average IV estimate for the log specification implies a
statistically significant improvement in quality. Thus, when we look at lower frequency data,
there is some evidence that lowering the shadow price of funding marginally increases average
research quality.
D. The Effect of Federal Funding on Patents
Patents are another measure of research output. Patentable research consists mainly of
applied research in the sciences. A university also conducts non-patentable research such as
basic research in the sciences, and social sciences. Since non-patentable research also receives
federal research support, our estimates of the impact of total federal research support on patent
counts underestimate the efficacy of federal funds in producing patents.

23
This measure of output has two significant problems. First, prior to the enactment of the
Bayh-Dole Act of 1980 by Congress, patents could not be issued to universities for federally
funding research. In practice, this often encouraged scientists to have two lines of parallel
research, one that was federally funded and one that was not, thereby allowing for patents to be
issued for the non-federally funded research. With the enactment of the Bayh-Dole Act,
federally funded research is now eligible for patent rights.
The second problem concerns the incentives set up by the universities with respect to the
distribution of benefits resulting from patents issued to the university. Historically, universities
were not generous in rewarding its scientists for university owned patents. So scientists had an
incentive to establish entities separate from the university and seek the issuance of patents
outside of the university. The measure of patents issued to a university is underreported more
severely at those universities with low distributions of benefits. Many universities have changed
the distribution agreements to encourage scientists to seek patents through the university. We
have been unable to identify those universities that undertook this change.
Tables 13 and 14 report the results under the OLS and IV specifications. Because the
patent measure contains many zeros, we do two things in our log linear specification, following
Bound et al. (1984) and Pakes and Griliches (1984) in their work on patent counts in for profit
firms. First, we assign the log value for zero as zero and, second, we create a dummy variable
equal to one if the number of patents is zero. We also report the results under the same levels
specifications as used with the other types of research outcomes. In all specifications, we lag the
government funding measure by three years. In addition, we lag the congressional measures by
five years. Given the process for getting a patent is lengthy we use a specification to reflect this
length. We tried other lag lengths and obtained similar results.

24
In the levels specifications, the IV estimates are not statistically different from zero
whereas the OLS estimates are positive. In the log specification, both the OLS and the IV
estimates are not different from zero. Thus at a first pass, there is not much evidence that
lowering the shadow price of federal funding affects the number of patents filed by a university.
Because of the problem of zeros in the patent data, Tables 15 and 16 analyze the data
under a fixed effects Tobit specification.29 The coefficients in the Tobit IV specification differ
from those reported in Table 14. Using the levels specification in column 1, the coefficient is .14
but is not statistically significant. Using the levels specification in column 2, the coefficient is
.73 suggesting an additional $3 million in funding will have increase the number of patents by
two. Thus, the Tobit IV specification suggests that federal research funding has a positive effect
on patents. As explained above, the differences in the number of patents reported is likely to
vary across time within a school because of the Bayh-Dole Act of 1980 and because of the
policies within the school concerning the rewards for obtaining a patent. The results, however,
are potentially affected because the measure of research expenditures reflects all disciplines and
not just those for which a patent is a possible outcome. Overall, the results across all of the
tables in which patents are used as an outcome measure suggests either no impact or a slightly
positive impact from an increase in federal funding.
E. Effect of Federal Funding on Faculty Salary
Professors have to expend resources to obtain federal research funding and, thus, it is
important to study their pecuniary benefit from doing so.30 The number of faculty who receive
some form of federal funding at universities is on the order of 50 percent (NSF (1998)). Federal
29 We follow Amemiya (1979) to compute the variance-covariance matrix in a two equation model whereone endogenous variable is completely observed and the other truncated. Honore (1994) provides anothermethod computing these errors under more relaxed assumptions concerning the distribution of the data.30 Siow (1998) considers the general problem of incentives in academia.

25
research funding may increase salaries directly if federal grants award stipends as well as
indirectly if universities reward faculty members who bring in more grants.
In these regressions, we have 71 schools and an average of 18.5 years of data for each
school. We lag federal expenditures by one year and the instruments by three years. Tables 17
and 18 report the results from the levels and log specifications for OLS and IV, respectively.
The first stage regressions are reported in Table 1. The IV estimate of λ is larger than the OLS
estimate in two specifications. The over-id test is significant at less than a 10 percent level in
two of the three regressions. That is, the instruments proxying congressional representation have
an effect on faculty salaries over and above their effect on federal funding for R&D.
Congressional representation may also affect funding for the university for other items other than
R&D and these other items also affect faculty salaries.
F. Robustness Issues
In addition to the regressions reported above there are many other regressions we could
and have run. We will discuss some of these other regressions below. In general, however, we
have found the results to be quite robust.
The first question we address concerns the potential problems associated with non-
separabilities in the production process insofar as past values of funding or research output may
be relevant measures to include in the regressions. With respect to the first stage analysis, it is
highly unlikely that the political measures would be correlated with past values of the production
process. To test this, however, we included values lagged values of the research output (lagged
at the same level as the political instruments) in both the first and second stage regressions. The
results are analogous to those reported above. In the first stage, the political measures continue
to be strong despite the lagged value of the output being significant. In the second stage, the
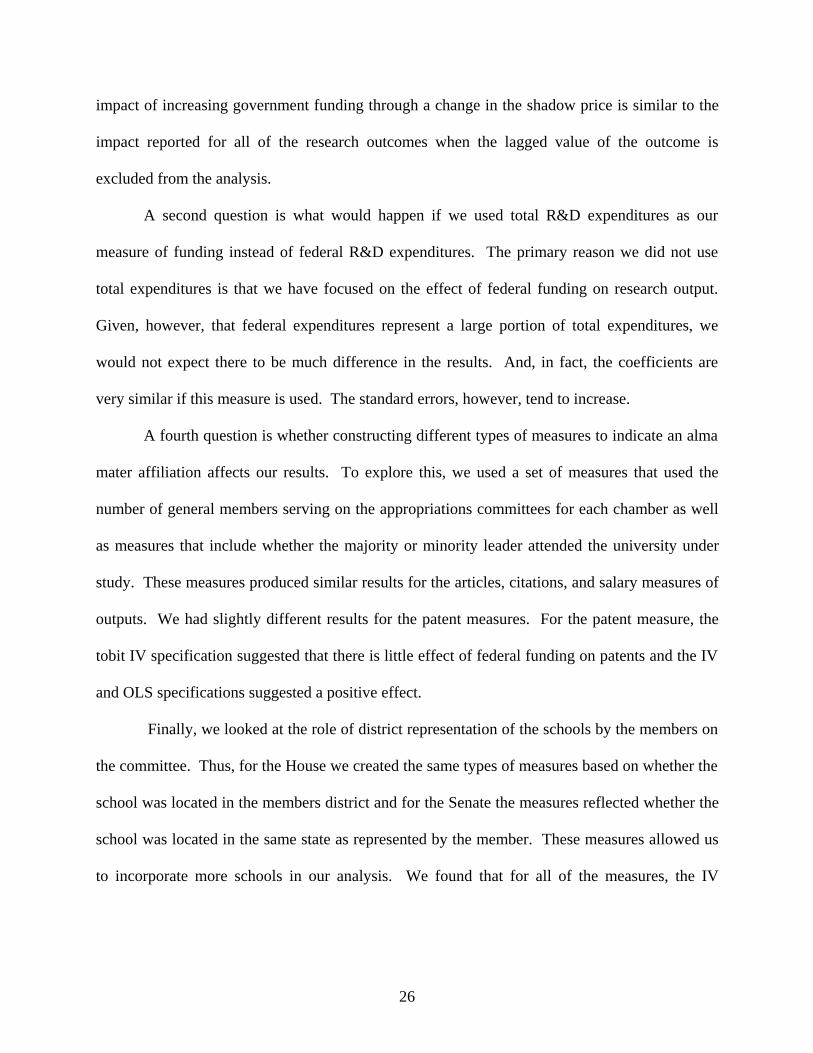
26
impact of increasing government funding through a change in the shadow price is similar to the
impact reported for all of the research outcomes when the lagged value of the outcome is
excluded from the analysis.
A second question is what would happen if we used total R&D expenditures as our
measure of funding instead of federal R&D expenditures. The primary reason we did not use
total expenditures is that we have focused on the effect of federal funding on research output.
Given, however, that federal expenditures represent a large portion of total expenditures, we
would not expect there to be much difference in the results. And, in fact, the coefficients are
very similar if this measure is used. The standard errors, however, tend to increase.
A fourth question is whether constructing different types of measures to indicate an alma
mater affiliation affects our results. To explore this, we used a set of measures that used the
number of general members serving on the appropriations committees for each chamber as well
as measures that include whether the majority or minority leader attended the university under
study. These measures produced similar results for the articles, citations, and salary measures of
outputs. We had slightly different results for the patent measures. For the patent measure, the
tobit IV specification suggested that there is little effect of federal funding on patents and the IV
and OLS specifications suggested a positive effect.
Finally, we looked at the role of district representation of the schools by the members on
the committee. Thus, for the House we created the same types of measures based on whether the
school was located in the members district and for the Senate the measures reflected whether the
school was located in the same state as represented by the member. These measures allowed us
to incorporate more schools in our analysis. We found that for all of the measures, the IV

27
estimates are similar to those reported above. The coefficient for the salary measure was slightly
greater when we included the district representation measures.
V Conclusion
The causal effect of federal R&D funding on universities is difficult to detect. Between
schools heterogeneity, endogeneity and time aggregation all work to confound this causal effect.
Our results show that, if the above difficulties are properly accounted for, variations in the
shadow price of federal R&D funding do affect the behavior of universities. Universities are not
passive institutions. They use less federal funds and substitute towards other inputs when the
shadow price of these funds rises. As a first approximation, when the shadow price of federal
research funds falls, universities produce more research without a significant change in its
quality. Finally, the effect of changes in the shadow price of R&D funding on outcomes is
gradual. Efforts to estimate the effect of high frequency changes in this shadow price on
outcomes are likely to be unsuccessful.
28
References
Adams, James D., and Zvi Griliches. 1998. “Research Productivity In A System of Universities,”Annales d’Economie et de Statisque, 49/50.
Amemiya, Takeshi. 1979. “The Estimation of A Simultaneous-Equation Tobit Model,”International Economic Review,20:169-181.
Angrist, Joshua D. 1990. “Lifetime Earnings and the Vietnam Era Draft Lottery: Evidence fromSocial Security Administrative Records.” American Economic Review 80:313-36.
Angrist, Joshua and Victor Lavy. 1997. “Using Maimonides' Rule to Estimate the Effect of ClassSize on Scholastic Achievement.” Quarterly Journal of Economics: forthcoming.
Angrist, Joshua and Alan Krueger. 1998. “Empirical Strategies in Labor Economics.”forthcoming in Handbook of Labor Economics, vol. 3, edited by O. Ashenfelter and D.Card. Amsterdam: North Holland.
Baker, Michael and et al. 1999. “The Highs and Lows of the Minimum Wage Effect: A Time-Series Cross-Section Stduy of the Canadian Law”. Journal of Labor Economics 17(2):318-350.
Bound, John and et al. 1984. “Who Does R&D and Who Patents?” R&D, Patents, andProductivity. NBER Conference Report. Griliches, Zvi, ed. Chicago and London:University of Chicago Press :21-54.
Bound, John et al. 1995. “Problems with Instrumental Variables Estimation when the CorrelationBetween the Instruments and the Endogenous Explanatory Variable is Weak” Journal ofthe American Statistical Association 90: 443-450.
Card, David. 1995. “Using Geographic Variation in College Proximity to Estimate the Return toSchooling.” Pp. 201-22 in Aspects of labour market behaviour: Essays in honour of JohnVanderkamp., edited by L. N. G. Christofides, E. Kenneth; and R. Swidinsky. Toronto,Buffalo and London: University of Toronto Press.
Card, David. 1998. “The Causal Effect of Education on Earnings.” forthcoming in Handbook ofLabor Economics, vol. 3, edited by O. Ashenfelter and D. Card. Amsterdam: NorthHolland.
Chronicle of Higher Education June 18,1999. “With 2 Noteworthy Exceptions, NIH SpendingMatches Burden of Disease, Study Finds.”
Chronicle of Higher Education July 10, 1998a. “Senate Bill may Portend More CongressionalDirectives on the NSF Budget.”
Chronicle of Higher Education June 19, 1998b. “A List of Congressional Earmarks to HigherEducation in Fiscal 1998”.
Chronicle of Higher Education March 2, 1994. “Institutions That Win Earmarks May LoseGrants from NSF.”
Cole, Jonathan R. and Stephen Cole. 1981. Peer review in the National Science Foundation :phase two of a study with the Committee on Science and Public Policy, NationalAcademy of Sciences. Washington, D.C. : National Academy Press, 1981.
Connolly, Laura S. 1997. “Does External Funding of Academic Research Crowd OutInstitutional Support?,” Journal of Public Econoomics 64:389-404.
Cutler, David M. and Edward L. Glaeser. 1997. “Are Ghettos Good or Bad?” Quarterly Journalof Economics 112:827-72.
Drew, David E. 1985. Strengthening Academic Science, Praeger.

29
Geiger, Roger L. 1993. Research and Relevant Knowledge: American Research UniversitiesSince World War II, Oxford: Oxford University Press.
Griliches, Zvi and Jacques Mairesse. 1984. “Productivity and R&D at the Firm Level.” R&D,Patents, and Productivity. NBER Conference Report. Griliches, Zvi, ed. Chicago andLondon: University of Chicago Press :339-74.
Griliches, Zvi and Jacques Mairesse. 1997. “Production functions: The Search forIdentification.” forthcoming in The Ragnar Frisch Centennial Symposium, edited by S.Strom. Cambridge: Cambridge University Press.
Griliches, Zvi. 1998. R&D and Productivity: The Econometric Evidence. Chicago: University ofChicago Press.
Hall, Bronwyn H. 1993. “The Stock Market's Valuation of R&D Investment during the 1980's.”American Economic Review 83:259-64.
Heckman, James J. 1997. “Instrumental Variables: A Study of Implicit Behavioral AssumptionsUsed in Making Program Evaluations.” Journal of Human Resources 32:441-62.
Heckman, James and Edward Vytacil. 1998. “Instrumental Variables Methods for the CorrelatedRandom Coefficient Model: Estimating the Average Rate of Return to Schooling Whenthe Return Is Correlated with Schooling.” Journal of Human Resources 33(4):974-987.
Henderson, Rebecca, Jaffee, Adam B., Trajtenberg, Manuel. 1998. “Universities as a Source ofCommercial Technology: A Detailed Analysis of University Patenting 1965-1988.”Review of Economics and Statistics 80(1): 119-27.
Hird, John A.. 1991. “The Political Economy of Pork: Project Selection at the U.S. Army Corpsof Engineers.” The American Political Science Review 85(2):429-456.
Honore, Bo E. 1993. “Efficiency Considerations in Tobit Models with Fixed Effects.” in Bunzel,Henning, Jensen, Peter; Westergard-Nielsen, Niels, eds., Panel data and labour market dynamics. Contributions to Economic Analysis, vol. 222. Amsterdam: North-Holland:247-62.
Hoxby, Caroline M. 1996. “The Effects of Class Size and Composition on Student Achievement:New Evidence from Natural Population Variation.” . Harvard Department of Economicsmanuscript.
Jaffe, Adam. B. (1989). “Real Effects of Academic Research.” American Economic Review79(5): 957-70.
Kane, Thomas and Cecilia Rouse. 1993. “Labor Market Returns to Two- and Four-YearColleges: Is a Credit a Credit and Do Degrees Matter?”. NBER Working Paper #4268.
Kleinman, Daniel L., 1995. Politics on the Endless Frontier: Postwar Research Policy in theUnited States, Duke University Press: Durham and London.
Mairesse, J. and B. H. Hall. 1996. “Estimating the Productivity of Research and Development inFrench and United States Manufacturing Firms: An Exploration of Simultaneity Issueswith GMM Methods.” Pp. 285-315 in International productivity differences:Measurement and explanations., vol. 233, Contributions to Economic Analysis, edited byK. v. A. and Bart Wagner. Amsterdam, New York and Oxford: Elsevier Science, North-Holland.
Marschak, Jacob and William Andrews. 1944. “Random Simultaneous Equations and the Theoryof Production.” Econometrica 12:143-205.
National Science Board. 1998. Science and Engineering Indicators – 1998, Arlington, VA:National Science Foundation.
Olley, G. Steven and Ariel Pakes. 1996. “The Dynamics of Productivity in the
30
Telecommunications Equipment Industry.” Econometrica 64:1263-97.Pakes, Ariel and Zvi Griliches. 1984. “Patents and R&D at the Firm Level: A First Look.” R&D,
Patents, and Productivity. NBER Conference Report. Griliches, Zvi, ed. Chicago andLondon: University of Chicago Press :55-72.
Pakes, Ariel. 1985. “On Patents, R&D, and the Stock Market Rate of Return.” Journal ofPolitical Economy 93:390-409.
Payne, A. Abigail. 1999. “Congressional Representation of Alma Maters and Districts: ThePolitical Economy of Federal Funding to Research Universities.” mimeo.
Payne, A. Abigail. 1998. “Do Government Grants Indicate Quality of Research at Universities?Evidence Suggesting the Grants are More Than Substitutes for Private Donations.”mimeo.
Rich, Michael J. 1989. “Distributive Politics and the Allocation of Federal Grants.” TheAmerican Political Science Review 83(1):193-213.
Savage, James D. 1999. Funding Science in America: Congress, Universities, and the Politics ofthe Academic Pork Barrel. Cambridge University Press.
Siow, Aloysius. 1998. “Tenure and Other Unusual Personnel Practices in Academia.” Journal ofLaw, Economics and Organization 14(1):152-173.
Stephan, Paula E. 1996. “The Economics of Science.” Journal of Economic Literature 34:1199-1235.
Stratmann, Thomas. 1997. “Logrolling.” In Dennis C. Mueller, ed., Perspectives on PublicChoice. Cambridge University Press.
Trajtenberg, Manuel, Rebecca Henderson and Adam Jaffe. (1997). “University versus CorporatePatents: A Window on the Basicness of Invention.” Economics of Innovation and NewTechnology 5(1): 19-50.
31
Figure 1: Average Per Institution
Fed
R&
D E
xpen
ditu
res
(Mill
ions
)
Panel AYear
1970 1980 1990 200020
30
40
50
Sa
lary
(Mill
ions
)
Panel BYear
1970 1980 1990 200025
30
35
40
Art
icle
s
Panel CYear
1980 1985 1990 1995 20001000
1500
2000P
ate
nts
(>
0)
Panel DYear
1975 1980 1985 1990 1995
4
6
8
10
12

32
Table 1: Impact of Alma Mater Affiliation on Research Funding and Publications
Average Average T-TestNo Representation With Representation No Rep=Rep (p-value)
Federal R&D Funding (millions) 54.1 74.8 6.9 (0.00)
Number of Articles Published 1483.1 1899.2 5.5 (0.00)
Number of Citations Per Article 18.1 16.7 2.3 (0.02)
33
Table 2: Effect of Alma Mater Affiliation on Federal Research Funding
Dependent Variable # of Universities Federal R& D Funding Levels Levels Log w/ membersNumber of Faculty 0.006
(0.003)Instruments 1 Member -2.64 -2.51 -0.03 35 on Senate Appropriations (1.38) (1.51) (0.02) 2 Members 4.92 5.15 0.09 5 on Senate Appropriations (3.68) (4.05) (0.04) 1 Member 3.31 3.26 0.06 52 on House Appropriations (1.09) (1.18) (0.02) 2 Members 4.90 4.75 0.03 8 on House Appropriations (3.00) (3.35) (0.03) 3 Members 19.56 19.21 -0.23 2 on House Appropriations (4.14) (4.89) (0.15)
F-test on Congressional Measures (CM) 6.96 5.20 3.86 (p-value) (0.00) (0.00) (0.00)Lag on CM 2 years 2 years 2 yearsUniversity and Year Fixed Effects yes yes yesR-Square 0.9424 0.9413 0.9655Number of Observations 1626 1342 1626Number of Universities 71 71 71
Note: White corrected standard errors in parentheses unless otherwise noted. Coefficients inbold are significant at less than a p-value of .05. Coefficients in Italics are significant atless than a p-value of .10. All regressions included school and year fixed effects. Thelast column indicates the number of universities with changes of membership for thevariable during the period studied. A change may be from on to off of the committee(and vice versa) or a change in the number of members.

34
Table 3: Distribution of Universities By Carnegie Classification
Analyzed Data All DataCarnegie Code Private Public Private Public
Research I 14 30 29 58
Research II 3 11 10 27
Doctoral I 2 2 20 27
Doctoral II 3 6 22 31
Total 22 49 81 143

35
Table 4: Summary Statistics of Federal R&D Funding and Research Outcomes
Analyzed Data All DataNumber of Mean Minimum Maximum Number of Mean Minimum Maximum
Obs (Std Err) Obs (Std Err)Federal R&D Funding 1770 65.05 0.05 327.71 5685 37.15 0.00 368.06 (millions of dollars) (64.22) (52.22)Federal R&D Funding 1407 71.18 0.09 840.45 4504 54.85 0.02 1387.22 Per Faculty (1000s) (70.54) (87.83)Total Faculty Salary 1329 49.21 9.00 209.54 4458 33.70 0.19 209.54
(28.16) (24.17)Number of Articles 850 1715.64 176.00 7306.00 1729 1430.86 142.00 7306.00
(1124.80) (978.09)Number of Cites Per Article 850 17.36 1.35 45.16 1729 17.76 1.27 71.55
(8.96) (9.58)Number of Patents 1217 6.63 0.00 66.00 3433 4.54 0.00 128.00
(10.71) (9.80)Number of Faculty 1329 972.14 226.00 3258.00 4515 696.04 7.00 3258.00
(483.88) (436.45)
36
Table 5: Relationship Between Articles Published and Federal Funding, OLSDependent Variable # of Articles Published Levels Levels LogFederal R&D Funding 7.78 7.49 0.15(millions of dollars) (0.52) (0.58) (0.02)
Number of Faculty 0.20(0.06)
Lag on Government Funding 1 Year 1 Year 1 YearR-Square 0.9793 0.9795 0.9912Number of Observations 850 650 850Number of Universities 50 50 50
Note: if no school fixed effects are used in the first regression, the coefficient is 14.547 with astandard error of .4104, r-square of .7752.
Table 6: Relationship Between Articles Published and Federal Funding, IV
Dependent Variable:# of Articles Published Levels Levels LogFederal R&D Funding 11.29 13.53 0.61(millions of dollars) (2.97) (3.51) (0.17)
Number of Faculty 0.16(0.06)
F-test on Congressional Variables 5.26 4.28 6.81 (Stage 1) (p-value) (0.00) (0.00) (0.00)Over-Identification Test: Chi-square Statistic 1.12 0.24 8.64 (p-value) (0.89) (0.99) (0.07)Hausman Test 1.37 3.53 13.55 (p-value) (0.24) (0.06) (0.00)Lag on Government Funding 1 Year 1 Year 1 YearLag on Congresional Variables 3 Years 3 Years 3 YearsR-Square 0.9771 0.973 0.9823Number of Observations 850 650 850Number of Universities 50 50 50
Note: White corrected standard errors in parentheses unless otherwise noted. Coefficients inbold are significant at less than a p-value of .05; coefficients in Italics are significant atless than a p-value of .10. All regressions included school and year fixed effects.

37
Table 7: Relationship Between Citations Per Article and Federal Funding, OLS
Dependent Variable Citations Per Article Levels Levels LogFederal R&D Funding -0.06 -0.05 0.07(millions of dollars) (0.01) (0.01) (0.02)
Number of Faculty -0.001(0.001)
Lag on Government Funding 1 Year 1 Year 1 YearR-Square 0.9222 0.9203 0.9848Number of Observations 850 650 850Number of Universities 50 50 50
Note: if no school fixed effects are used in the first regression, the coefficient is .0533 with astandard error of .0029, r-square of .6364.
Table 8: Relationship Between Citations Per Article and Federal Funding, IV
Dependent Variable Citations Per Article Levels Levels LogFederal R&D Funding -0.01 -0.04 0.24(millions of dollars) (0.05) (0.05) (0.18)
Number of Faculty -0.001(0.001)
F-test on Congressional Variables 5.26 4.28 6.81 (Stage 1) (p-value) (0.00) (0.00) (0.00)Over-Identification Test: Chi-square Statistic 7.96 10.01 2.98 (p-value) (0.09) (0.04) (0.56)Hausman Test 1.57 0.12 1.04 (p-value) (0.21) (0.73) (0.31)Lag on Government Funding 1 Year 1 Year 1 YearLag on Congresional Variables 3 Years 3 Years 3 YearsR-Square 0.914 0.9196 0.9834Number of Observations 850 650 850Number of Universities 50 50 50
Note: White corrected standard errors in parentheses unless otherwise noted. Coefficients inbold are significant at less than a p-value of .05. All regressions included school andyear fixed effects.

38
Table 9: Relationship Between Articles Published and Federal Funding, OLS3 Year Average
Dependent Variable # of Articles Published Levels Levels LogFederal R&D Funding 11.01 11.29 0.18(millions of dollars) (0.61) (0.65) (0.02)
Number of Faculty 0.44(0.11)
Lag on Government Funding 1 Year 1 Year 1 YearR-Square 9599 0.9567 0.994Number of Observations 840 690 840Number of Universities 50 50 50
Table 10: Relationship Between Articles Published and Federal Funding, IV3 Year Average
Dependent Variable# of Articles Published Levels Levels LogFederal R&D Funding 18.43 17.60 0.61(millions of dollars) (5.67) (5.38) (0.17)
Number of Faculty 0.41(0.10)
F-test on Congressional Variables 14.70 12.10 8.31 (Stage 1) (p-value) (0.00) (0.00) (0.00)
Over-Identification Test: Chi-square 0.92 0.85 14.14 (p-value) (0.92) (0.93) (0.01)
Hausman Test 1.95 1.35 12.88(0.16) (0.25) (0.00)
Lag on Government Funding 1 Year 1 Year 1 YearLag on Congresional Variables 3 Years 3 Years 3 YearsR-Square 0.9509 0.9516 0.9894Number of Observations 840 690 840Number of Universities 50 50 50
Note: White corrected standard errors in parentheses unless otherwise noted. Coefficients inbold are significant less than a p-value of .05. All regressions included school and yearfixed effects.

39
Table 11: Relationship Between Citations Per Article and Federal Funding, OLS3 Year Average
Dependent Variable Citations Per Article Levels Levels LogFederal R&D Funding -0.04 -0.05 0.07(millions of dollars) (0.01) (0.01) (0.02)
Number of Faculty -0.002(0.001)
Lag on Government Funding 1 Year 1 Year 1 YearR-Square 9351 0.9327 0.9855Number of Observations 840 690 840Number of Universities 50 50 50
Table 12: Relationship Between Citations Per Article and Federal Funding, IV3 Year Average
Dependent Variable Citations Per Article Levels Levels LogFederal R&D Funding 0.01 -0.0014 0.57(millions of dollars) (0.04) (0.0409) (0.24)
Number of Faculty -0.0020(0.0007)
F-test on Congressional Variables 14.70 12.10 8.31 (Stage 1) (p-value) (0.00) (0.00) (0.00)
Over-Identification Test: Chi-square 5.58 4.22 5.80 (p-value) (0.23) (0.38) (0.21)
Hausman Test 1.47 1.30 8.58(0.23) (0.25) (0.00)
Lag on Government FundingLag on Congressional VariablesR-Square 0.9287 0.9268 0.972Number of Observations 840 690 840Number of Universities 50 50 50
Note: White corrected standard errors in parentheses unless otherwise noted. Coefficients inbold are significant at less than a p-value of .05. All regressions included school andyear fixed effects.

40
Table 13: Relationship Between Patents and Federal Funding, OLS
Dependent Variable:# of Patents Received Levels Levels Log
Federal R&D Expenditures 0.218 0.214 0.076 (millions of dollars) (0.018) (0.018) (0.070)Number of Faculty 0.002
(0.002)Dummy = 1 if Patent =0 -0.524
(0.055)Lag on Government Funding 3 years 3 years 3 yearsR-Square 0.751 0.752 0.785Number of Observations 1105 1105 1105Number of Schools 53 53 53
Note: if no school fixed effects are used in the first regression, the coefficient is 0.093 with astandard error of .006, r-square of .4742.
Table 14: Relationship Between Patents and Federal Funding, IV
Dependent Variable# of Patents Received Levels Levels Log
Federal R&D Expenditures 0.182 0.172 1.336 (millions of dollars) (0.072) (0.003) (0.586)Number of Faculty 0.003
(0.002)Dummy = 1 if Patent =0 -0.485
(0.066)F-test on Congressional 10.300 9.540 4.980 Variables (Stage 1) (p-value) (0.000) (0.000) (0.000)
Over-Identification Test 4.223 4.984 12.492 Chi-square (4 d.f.) (p-value) (0.377) (0.289) (0.014)
Hausman Test 0.320 0.039 4.810 (p-value) (0.572) (0.533) (0.029)
Lag on Government Funding 3 years 3 years 3 yearsLag on Cong. Variables 5 years 5 years 5 years
R-Square 0.754 0.755 0.739Number of Observations 1044 1044 1044Number of Schools 53 53 53
Note: White corrected standard errors in parentheses unless otherwise noted. Coefficients inbold are significant less than a p-value of .05. All regressions included school and year fixedeffects.

41
Table 15: Relationship Between Patents and Federal Funding, Tobit
Dependent Variable # of Patents Received Levels LevelsFederal R&D Funding 0.17 0.20(millions of dollars) (0.02) (0.02)
Number of Faculty 0.01(0.00)
Lag on Government Funding 3 years 3 yearsNumber of Observations 1160 982Number of Universities 58 58
Table 16: Relationship Between Patents and Federal Funding, IV Tobit
Dependent Variable # of Patents Received Levels LevelsFederal R&D Funding 0.14 0.73(millions of dollars) (0.16) (0.05)
Number of Faculty 0.04(2.77)
Lag on Government Funding 3 years 3 yearsLag on Congresional Variables 5 years 5 yearsNumber of Observations 1160 982Number of Universities 58 58
Note: Standard errors in parentheses unless otherwise noted. Coefficients in bold aresignificant less than a p-value of .05. All regressions included school and year fixedeffects.

42
Table 17: Relationship Between Faculty Salary and Federal Funding, OLS
Dependent Variable Total Faculty Salary Levels Levels Log
Federal R&D Obligations 124294.0 99081.2 0.01(millions of dollars) (15001.2) (7977.7) (0.02)
Number of Faculty 60314.1(1818.6)
Lag on Government Funding 1 Year 1 Year 1 YearR-Square 0.9098 0.9842 0.9612Number of Observations 1329 1329 1329Number of Universities 71 71 71
Note: if no school fixed effects are used in the first regression, the coefficient is 279321.4 with astandard error of 10172.8, r-square of .4343.
Table 18: Relationship Between Faculty Salary and Federal Funding, IV
Dependent Variable Total Faculty Salary Levels Levels Log
Federal R&D Funding 353467.1 91833.1 0.19(millions of dollars) (105607.4) (44813.5) (0.10)
Number of Faculty 60406.8(1834.5)
F-test on Congressional Variables 5.82 5.71 4.61 (Stage 1) (p-value) (0.00) (0.00) (0.00)Over-Identification Test: Chi-square Statistic 9.02 7.16 14.54 (p-value) (0.06) (0.13) (0.01)Hausman Test 5.94 0.02 3.92 (p-value) (0.01) (0.88) (0.05)Lag on Government Funding 1 Year 1 Year 1 YearLag on Congresional Variables 3 Years 3 Years 3 YearsR-Square 0.8937 0.9843 0.9549Number of Observations 1325 1325 1325Number of Universities 71 71 71
Note: White corrected standard errors in parentheses unless otherwise noted. Coefficients inbold are significant less than a p-value of .05. All regressions included school and year fixedeffects.

43
Table A1: Research and Academic Institutions AnalyzedState University Publications Data Patent Data Salary DataAlabama University of Alabama 0 1 1Arkansas University of Arkansas 0 0 1Arizona Arizona State University 1 1 1
University of Arizona 1 1 1California California Institute of Technology 1 1 1
San Diego State University 0 1 1Stanford University 1 1 1University of California-Berkeley 1 1 1University of California-Los Angeles 1 1 1
Colorado University of Colorado 1 1 1University of Denver 0 1 1
Connecticut University of Connecticut 1 1 1Yale University 1 1 1
District of Columbia Georgetown University 1 1 1Howard University 0 1 1
Delaware University of Delaware 1 1 1Florida University of Florida 1 1 1Georgia University of Georgia 1 1 1Hawaii University of Hawaii at Manoa 1 0 1Iowa Iowa State University 1 0 1Illinois Northwestern Univ 1 1 1Indiana Purdue University 1 1 1
University of Notre Dame 0 1 1Kansas Kansas State University 0 1 1
Wichita State University 0 1 1Kentucky University of Kentucky 1 1 1
University of Louisville 0 0 1Louisiana Tulane University 1 1 1Massachusetts Boston College 0 1 1
Harvard University 1 1 1Maryland University of Maryland at College Park 1 1 1Michigan Michigan State University 1 1 1
University of Michigan 1 1 1Minnesota University of Minnesota 0 0 1Missouri University of Missouri, Columbia 1 0 1Mississippi Mississippi State University 0 1 1
University of Mississippi 0 1 1North Carolina Duke University 1 1 1
University of North Carolina at Chapel Hill 1 0 1Wake Forest University 1 0 1
North Dakota North Dakota State University 0 1 1Nebraska University of Nebraska at Lincoln 1 1 1New Hampshire Dartmouth College 1 1 1
University of New Hampshire 1 1 1New Jersey Princeton University 1 1 1
Rutgers the State Univ of NJ 1 1 1New Mexico University of New Mexico 1 1 1Nevada University of Nevada-Reno 0 0 1New York Columbia University in the City of New York 1 1 1
Cornell University 1 1 1Rensselaer Polytechnic Institute 0 0 1Syracuse University 1 1 1
Oklahoma Oklahoma State University 0 1 1University of Oklahoma 0 0 1
Oregon University of Oregon 1 1 1Pennsylvania Pennsylvania State U 1 1 1
University of Pennsylvania 1 1 1University of Pittsburgh 1 1 1
Tennessee Middle Tennessee State University 0 0 1Vanderbilt University 1 1 1
Texas Baylor University 0 1 1Texas A&M University 1 1 1University of Houston 0 1 1University of Texas at Austin 1 1 1
Utah University of Utah 1 1 1Utah State University 1 1 1
Virginia College of William and Mary 0 1 1Virginia Polytechnic Institute and State Univ 1 1 1
Washington University of Washington - Seattle 1 1 1Washington State University 1 0 1
Wisconsin University of Wisconsin-Madison 1 1 1
Note: These universities have members of Congress serving on the appropriations committees who received anundergraduate degree from the institution. A one in the last three columns indicates that there are data for the type ofresearch outcome measure identified.

44
Table A2: Research & Doctoral Universities Not AnalyzedState UniversityAlaska University of Alaska, FairbanksAlabama Auburn University
University of Alabama at BirminghamUniversity of Alabama in Huntsville
Arizona Northern Arizona UniversityCalifornia Biola University
Claremont Graduate SchoolLoma Linda UniversityPepperdine UniversityUniversity of California-DavisUniversity of California-IrvineUniversity of California-RiversideUniversity of California-San DiegoUniversity of California-San FranciscoUniversity of California-Santa BarbaraUniversity of California-Santa CruzUniversity of La VerneUniversity of San DiegoUniversity of San FranciscoUniversity of Southern CaliforniaUniversity of the Pacific
Colorado Colorado School of MinesColorado State UniversityUniversity of Northern Colorado
District of Columbia American UniversityCatholic University of AmericaGeorge Washington University
Florida Florida Atlantic UniversityFlorida Institute of TechnologyFlorida International UniversityFlorida State UniversityNova Southeastern UniversityUniversity of Central FloridaUniversity of MiamiUniversity of South Florida
Georgia Clark Atlanta UniversityEmory UniversityGeorgia Institute of TechnologyGeorgia State University
Iowa University of IowaIdaho Idaho State University
University of IdahoIllinois De Paul University
Illinois Institute of TechnologyIllinois State UniversityLoyola University of ChicagoNorthern Illinois UniversitySouthern Illinois University-CarbondaleUniversity of ChicagoUniversity of Illinois at ChicagoUniversity of Illinois at Urbana-Champaign
Indiana Ball State UniversityIndiana State University
Kansas University of KansasLouisiana Louisiana State Univ
Louisiana Tech UniversityUniversity of Southwestern Louisiana
Massachussetts Boston UniversityBrandeis UniversityClark UniversityMassachusetts Institute of TechnologyNortheastern UniversityTufts UniversityUniversity of Massachusetts at AmherstUniversity of Massachusetts LowellWorcester Polytechnic Institute
Maryland University of Maryland Baltimore CountyJohns Hopkins University*
Maine University of MaineMichigan Andrews University
Michigan Technological UniversityUniversity of Detroit MercyWayne State UniversityWestern Michigan University
Missouri St Louis UniversityUniversity of Missouri, Kansas City

45
State UniversityMissouri University of Missouri, Rolla
University of Missouri, St. LouisWashington University
Mississippi University of Southern MississippiMontana Montana State University - Bozeman
University of MontanaNorth Carolina North Carolina State University at Raleigh
University of North Carolina at GreensboroNorth Dakota University of North DakotaNew Jersey New Jersey Institute Technology
Seton Hall UniversityStevens Institute of Technology
New Mexico New Mexico State UniversityNew York Adelphi University
Clarkson UniversityCUNY Graduate School and University CenterFordham UniversityHofstra UniversityNew School for Social ResearchNew York UniversityPace UniversityPolytechnic UniversityRockefeller UniversitySt John’s University (JamaicaSUNY at AlbanySUNY at BinghamtonSUNY at BuffaloSUNY at Stony BrookUniversity of RochesterYeshiva University
Ohio Bowling Green State UnivCase Western Reserve UniversityCleveland State UniversityKent State UniversityMiami UniversityOhio State UniversityOhio UniversityUniversity of AkronUniversity of CincinnatiUniversity of ToledoWright State University
Oklahoma University of TulsaOregon Oregon State University
Portland State UniversityPennsylvania Allegheny University of the Health Sciences
Carnegie Mellon UniversityDrexel UniversityDuquesne UniversityIndiana University of PALehigh UniversityTemple University
Rhode Island Brown UniversityUniversity of Rhode Island
South Carolina Clemson UniversityUniversity of South Carolina
South Dakota University of South DakotaTennessee Tennessee State University
University of MemphisUniversity of Tennessee at Knoxville
Texas Rice UniversitySouthern Methodist UniversityTexas Christian UniversityTexas Southern UniversityTexas Tech UniversityTexas Woman’s UniversityUniversity of North TXUniversity of Texas at ArlingtonUniversity of Texas at Dallas
Utah Brigham Young UniversityVirginia George Mason University
Old Dominion UniversityUniversity of VirginiaVirginia Commonwealth University
Vermont University of VermontWisconsin Marquette University
University of Wisconsin-MilwaukeeWest Virginia West Virginia UniversityWyoming University of Wyoming

46