does ethnic discrimination vary across minority …andrewleigh.org/pdf/auditdiscrimination.pdf ·...
TRANSCRIPT
547© Blackwell Publishing Ltd and the Department of Economics, University of Oxford 2011. Published by Blackwell Publishing Ltd,9600 Garsington Road, Oxford OX4 2DQ, UK and 350 Main Street, Malden, MA 02148, USA.
OXFORD BULLETIN OF ECONOMICSAND STATISTICS, 74, 4 (2012) 0305-9049doi: 10.1111/j.1468-0084.2011.00664.x
Does Ethnic Discrimination Vary Across MinorityGroups? Evidence from a Field Experiment*
Alison L. Booth†, Andrew Leigh‡ and Elena Varganova�
†Economics Department, University of Essex, Wivenhoe Park CO4 3SQ, UK and Research Schoolof Economics, Australian National University, ACT 0200, Australia (e-mail: [email protected])‡Research School of Economics, Australian National University, ACT 0200, Australia(e-mail: [email protected])�Research School of Economics, Australian National University, ACT 0200, Australia(e-mail: [email protected])
AbstractWe conduct a large-scale field experiment to measure labour market discrimination inAustralia, one quarter of whose population was born overseas. To denote ethnicity, we usedistinctively Anglo-Saxon, Indigenous, Italian, Chinese and Middle Eastern names. Wecompare multiple ethnic groups, rather than a single minority as in most other studies. Inall cases we applied for entry-level jobs and submitted a CV indicating that the candidateattended high school in Australia. We find significant differences in callback rates: ethnicminority candidates would need to apply for more jobs in order to receive the same numberof interviews. These differences vary systematically across ethnic groups.
‘After completing TAFE in 2005 I applied for many junior positions where no experience insales was needed – even though I had worked for two years as a junior sales clerk. I didn’treceive any calls so I decided to legally change my name to Gabriella Hannah. I applied forthe same jobs and got a call 30 minutes later.’
∼Gabriella Hannah, formerly Ragda Ali, Sydney
ÅFor valuable comments, we are grateful to two anonymous referees, Boyd Hunter, Gigi Foster, Steven Haider,and seminar participants at the 2010 World Conference of the European Association of Labour Economists and theSociety of Labor Economists, theAustralianNationalUniversity’s Social and PoliticalTheory Seminar, theAustralianNational University Centre forAboriginal Economic Policy Research seminar, theAustralasian Labour EconometricsWorkshop, and Monash University. Iktimal Hage-Ali and Amy King put us in touch with Gabriella Hannah, whois quoted at the start of the paper. Pablo Mateos kindly allowed us to use a beta version of his Onomap softwareto impute ethnicity to the names of employers. Mathias Sinning provided invaluable programming assistance andSusanne Schmidt outstanding research assistance. The background section of this paper uses unit record data fromthe Household, Income and Labour Dynamics inAustralia (HILDA) Survey. The HILDAProject was initiated and isfunded by theAustralian Government Department of Families, Housing, Community Services and IndigenousAffairs(FaHCSIA) and is managed by the Melbourne Institute of Applied Economic and Social Research (MIAESR). Thefindings and views reported in this paper, however, are those of the authors and should not be attributed to eitherFaHCSIA or the MIAESR. We take very seriously the ethical issues surrounding this research. Our experimentreceived approval from the Australian National University’s Human Research Ethics Committee. It involves somedeception of participants – for a thoughtful discussion on the ethics of deception in such field experiments, see Riachand Rich (2004).JEL Classification numbers: J71, C93.

548 Bulletin
I. IntroductionHow should we measure ethnic discrimination? Among economists, the most commonapproach has been to compare labour market outcomes across ethnic groups. But thismethod may not provide an accurate answer. If an individual’s ethnicity is correlated withsome unobserved productive trait, then differences in economic outcomes will reflect morethan just discrimination. Similarly, social researchers have often used surveys to measurethe degree of racism in a society. But if respondents know the socially correct response,then this approach will also provide a biased estimate of true attitudes towards ethnicgroups. When studying labour market outcomes, the problem arises from unobservablecharacteristics of ethnic minorities. When analysing social attitudes, the problem stemsfrom unobservable biases in the reporting of ethnic attitudes.1In both cases, field experiments can help solve the unobservables problem by creating
a context in which all other factors except ethnicity are held constant. In a context wherethe subject is unaware that he or she is participating in an experiment – or in which it isdifficult for the subject to provide a socially acceptable response – it is more likely that theoutcomewill provide an accuratemeasure of racism thanwithmore traditional approaches.The strengths of field experiments of this type are that they are randomized experimentsthat establish causality and provide strong evidence for the existence of discrimination.Explanations of employer motives generally call for other methods.2 So too do explana-tions as to why some particular ethnic groups might be discriminated against more thanothers.In this article, we present the results of a field experiment that we conducted in order
to estimate discrimination against ethnic minorities in Australia, a country whose immi-gration policy based on a points system has been admired and adopted by other coun-tries, including New Zealand and the UK. Unlike many field experiments, looking onlyat a single minority group, we take a broader focus: comparing attitudes to Anglo-SaxonAustralians with attitudes to Indigenous Australians (the original inhabitants of the con-tinent), Italian Australians (a relatively established migrant group), Chinese Australians(a more recent migrant group), and Middle Eastern Australians (another recent migrantgroup). By comparing across these groups, we hope to shed light on how the process ofimmigrant assimilation might change over time. However, we would not wish to pushtoo hard the use of our experiment as a measure of how time in the country matters fordiscrimination rates, for there are other conjectures as to how stereotypes are formed. Forinstance, Eagly and Kite (1987, p. 452) hypothesise that individuals form stereotypes ofpeople from particular countries based not somuch on direct forms of interaction but rather
1We define an ethnic group as comprising individuals who are perceived as having a common heritage consistingof a common language, culture and ancestry.2As Arrow (1998, p. 96) notes, without explicit measures for the individual’s marginal productivity, it is impossi-
ble to distinguish between taste-based and statistical forms of discrimination. While in our experiment all applicantsattended school in Australia, and we hold constant their education and experience, it is likely that stereotypes aboutproductivity still remain. For example, employers might view ethnic minority workers as less productive becauseof poor language skills that are not manifest in the application. This might be so even though such beliefs receivelittle support in, for example, the HILDA data. Among HILDA respondents who were born in Australia, but whoseparents were born overseas, 98–99% report speaking English ‘very well’ (the highest category in the survey). Sincewe cannot give in our fictional CVs precise measures of the applicant’s productivity, we are unable in this study toseparately identify the extent of statistical discrimination.
© Blackwell Publishing Ltd and the Department of Economics, University of Oxford 2011
Discrimination across minority groups 549
on ‘newsworthy events that draw these nations to their attention’, often unfavourably. Thismight explain some of our results below (for example, for people from the Middle Easterncountries), although we cannot formally test this in our analysis.With one in four residents born overseas, Australia is often regarded as something of
a poster child for its ability to absorb new migrants into its social and economic fabric.3Skilled migrants are selected through a points system, which gives preference to appli-cants with high qualifications and workers in high-demand occupations.4 Perhaps becauseof this, most research has found little discernable impact of migrants on the labour marketconditions of Australian natives.Yet recent events suggest that theAustralian melting pot may not be so successful after
all. In the late 1990s, Pauline Hanson’s One Nation Party, with its policy of reducingAsianimmigration toAustralia, polled well in a number of federal and state elections.At the timeof the 2000 Sydney Olympics, many journalists drew attention to the poor social indica-tors among Indigenous Australians. And in 2005, anti-Muslim riots on Sydney’s CronullaBeach drew international attention. As a series of reports have shown, some minoritygroups in Australia suffer extreme forms of persecution at work and in public places (seee.g. Walker, 2001; Kabir and Evans, 2002; Poynting and Noble, 2004; VicHealth, 2007;Berman, and The Victorian Equal Opportunity & Human Rights Commission, 2008).Moreover, the fact that firms specializing in helping migrants find work in Australia
counsel clients to disguise their identity also raises concern. For example, a commercialfirm that specializes in assisting migrants find work in Australia advises its clients ‘If thejob absolutely specifically requires second language skills then include your proficiencywith that language only. Otherwise do not write anything about your other language skills.Especially never write anything about your English language proficiency’. Jobseekers arealso told ‘never include your country of birth’, and ‘shorten and or anglicise names wherepossible and appropriate’ (see http://www.migrantjobsservices.com.au, checked 18 June2009).Against this background, our experiment aims to estimate ethnic discrimination by
employers. To do this, we conduct a correspondence discrimination study. In audit orcorrespondence studies, fictitious individuals who are identical in all respects apart fromthe one of interest (typically gender or ethnicity) apply for jobs. Audit studies, relyingon actor pairs who apply for jobs, have been criticized on numerous grounds includingwhether or not the applicants from different groups actually appear identical to employers.In response to these criticisms, correspondence studies substitute fictitious online or paperapplications for fictitious personal candidates, thereby reducing potential heterogeneity inunobservables.In our correspondence study conducted over 6 months in 2007, we randomly submitted
over 4,000 fictional applications for entry-level jobs, varying only the name as an indicatorof ethnicity. In terms of number of applications submitted, ours is one of the largest corre-spondence studies ever conducted. This allows us to look at multiple ethnic groups, and tosee if our effects differ by the gender of the fictitious applicant, the type of job advertised,and the city in which the job is located. Relative to other work on discrimination, our3The 2006 Census indicates that 28% of the foreign-born inAustralia are from ‘Anglo’ countries, namely the UK,
New Zealand, South Africa, USA, Ireland and Canada (listed in order of numerical importance).4See Hatton (2005).
© Blackwell Publishing Ltd and the Department of Economics, University of Oxford 2011

550 Bulletin
correspondence study is novel in that we compare across multiple ethnic groups.5 Thisallows us to learn more about the assimilation process than is possible with studies thatfocus on just one minority. In addition, we are the first to test discrimination against anIndigenous group compared with immigrant minority groups. Indeed, to our knowledgewe are the first to consider discrimination against an Indigenous group.The rest of the article is structured as follows. In section II, we present background
information on the share ofAustralians falling into the four ethnic categories studied in thisarticle, and review the available evidence on labour market outcomes and attitudinal sur-veys. In section III, we discuss the experiment and the various discrimination hypothesesthat our research proposes to test. In section IV, we present the results of our experiment,and compare ourfindingswith those fromother similar studies. Thefinal section concludes.
II. BackgroundWe briefly outline the characteristics of the ethnic groups that are the focus of this study byreviewing the literature on their population share, employment outcomes, and levels of sur-veyed discrimination. Figure 1 depicts the share ofAustralian residents in each of the fourethnic minority groups, based upon data from theAustralian census, which was conductedin 1901, 1911, 1921, 1933, 1947, 1954, and every five years from 1961 onwards. Untilthe 1960s, the share of Australians reporting their ethnicity as Indigenous was about 1%of the population. Since then, the share has risen steadily, and was over 2% in 2006. Thischange has been driven by two factors: higher fertility rates, and a growing willingness ofrespondents to self-identify as Indigenous.For Italian, Chinese and Middle Eastern Australians, our estimates are based upon
country of birth (thereby ignoring second-generation immigrants). As the graph shows,Australia experienced a large influx of Italian migrants immediately after World War II.
0%
1%
2%
3%
4%
5%
6%
1900 1920 1940 1960 1980 2000
Middle Eastern-bornItalian-bornChinese-bornIndigenous
Figure 1. What share of the population do our minority groups comprise?
5While a comparison across three ethnic groups – black, white and Latino – was conducted by Pager, Western andBonikowski (2009), theirs was an audit study, in which they recruited college-educated individuals to role-play andapply for 340 entry-level jobs in New York City. Since we conducted our correspondence study, Oreopoulos (2009)carried out a similar field experiment with 6,000 CVs in Canada.
© Blackwell Publishing Ltd and the Department of Economics, University of Oxford 2011
Discrimination across minority groups 551
From the late-1970s, the share of Australians who are Italian-born has steadily declined.By contrast, immigration from China and the Middle East only began to expand in the1970s and 1980s. By 2006, the share of Australians born in Italy, China and the MiddleEast was about 1% each.Since our experiment will focus on ethnicity rather than country of birth, a more appro-
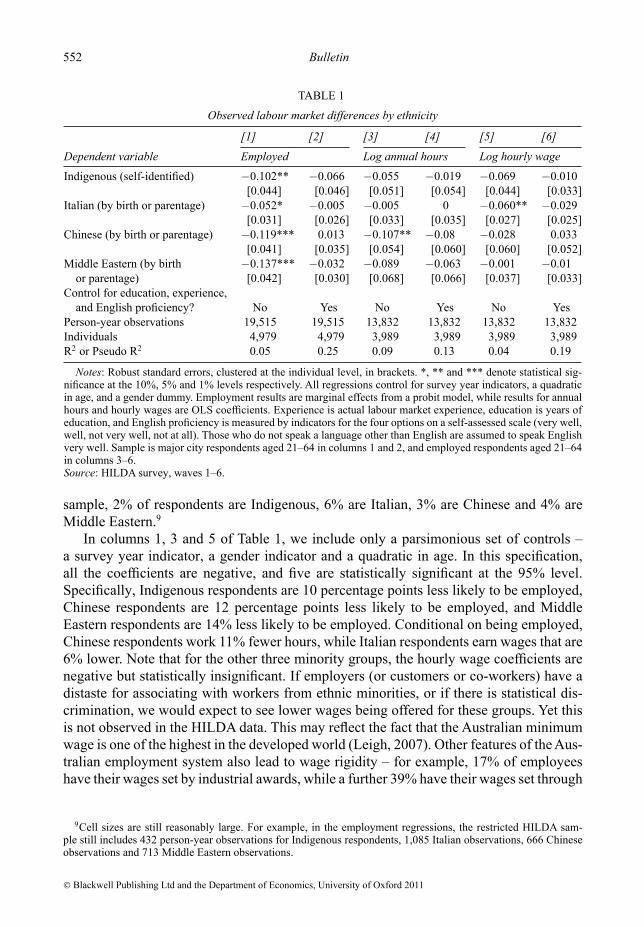
priate comparator might be ancestry. However, the Australian census has not consistentlyasked respondents about their ancestry. Therefore, it is only possible to look at recentdata, and not to construct a time series of ancestry shares. We focus here on respon-dents’ first answer to the ancestry question in the 2006 census (it was possible to givemultiple ancestries). The ancestries that are relevant to our analysis are Italian (4%),Chinese (3%) andArab (1%). By comparison, the most common ancestries are Australian(27%) and British (35%). It is not possible to distinguish Indigenous ancestry. While thecountry of birth figures suggest that Italians, Chinese and Middle Easterners are aboutequally represented among first-generation migrants, the ancestry data indicate that Ital-ians are substantially more numerous among second-generation (and higher generation)migrants.Table 1 shows how these four minority groups perform in the Australian labour mar-
ket.6 We estimate three outcome measures – participation, log annual hours and log hourlywages – with the omitted group being Australian-born non-Indigenous respondents. Forthis analysis, we require a large dataset with good information on employment partici-pation and hourly wages. Although the census samples are relatively large, earnings andhours are coded in bands, leading to very imprecise measures of hourly wages.7 We there-fore opt to use the 2001–06 Household, Income and Labour Dynamics inAustralia survey(HILDA), pooling all six waves and clustering standard errors at the person level. Thesample is restricted to those who are aged 21–64, with non-missing information for allcovariates.Indigenous respondents are coded according to whether or not they self-identified as
Aboriginal or Torres Strait Islander (HILDA respondents are not asked whether their par-ents are Indigenous). Respondents are coded as Italian, Chinese or Middle Eastern if they– or either of their parents – were born in one of those countries/regions.8 We exclude first-generation or second-generation migrants from other regions, so that the omitted groupcomprises respondents who were born in Australia and whose parents were both bornin Australia. Because our field experiment focuses on three large Australian cities, wesimilarly restrict the HILDA sample to those living in major cities. Across this particular
6Naturally, we are not the first to use standard surveys to analyse migrant performance in the Australian labourmarket. For studies that have looked at various aspects of the labour market performance of migrants in Australia,see eg. Cobb-Clark (2003); Mahuteau and Junankar (2008).7An alternative approach would have been to simply look at unemployment rates, using data on country of birth
from the August 2006 Employee Earnings and Hours Survey (representative of all employees in the labour force),and data on ethnicity from the August 2006 census. The unemployment rates by country of birth in 2007 were:born in Australia 4.0%, born in Italy 3.7%, born in China 7.2%, and born in North Africa/Middle East 9.5%. Theunemployment rate by ethnicity in 2006 was 5.0% for non-Indigenous people, and 15.6% for Indigenous people.8We include Hong Kong and Taiwan as part of China. Countries defined as Middle Eastern are Algeria, Egypt,
Libya, Morocco, Sudan, Bahrain, Iran, Iraq, Israel, Kuwait, Lebanon, Oman, Syria and Turkey. Because of the waywe code ethnicity, the categories are not mutually exclusive. Dropping respondents who are inmore than oneminorityethnic category makes no tangible difference to the results.
© Blackwell Publishing Ltd and the Department of Economics, University of Oxford 2011
552 Bulletin
TABLE 1
Observed labour market differences by ethnicity
[1] [2] [3] [4] [5] [6]
Dependent variable Employed Log annual hours Log hourly wageIndigenous (self-identified) −0.102** −0.066 −0.055 −0.019 −0.069 −0.010
[0.044] [0.046] [0.051] [0.054] [0.044] [0.033]Italian (by birth or parentage) −0.052* −0.005 −0.005 0 −0.060** −0.029
[0.031] [0.026] [0.033] [0.035] [0.027] [0.025]Chinese (by birth or parentage) −0.119*** 0.013 −0.107** −0.08 −0.028 0.033
[0.041] [0.035] [0.054] [0.060] [0.060] [0.052]Middle Eastern (by birth −0.137*** −0.032 −0.089 −0.063 −0.001 −0.01or parentage) [0.042] [0.030] [0.068] [0.066] [0.037] [0.033]
Control for education, experience,and English proficiency? No Yes No Yes No Yes
Person-year observations 19,515 19,515 13,832 13,832 13,832 13,832Individuals 4,979 4,979 3,989 3,989 3,989 3,989R2 or Pseudo R2 0.05 0.25 0.09 0.13 0.04 0.19
Notes: Robust standard errors, clustered at the individual level, in brackets. *, ** and *** denote statistical sig-nificance at the 10%, 5% and 1% levels respectively. All regressions control for survey year indicators, a quadraticin age, and a gender dummy. Employment results are marginal effects from a probit model, while results for annualhours and hourly wages are OLS coefficients. Experience is actual labour market experience, education is years ofeducation, and English proficiency is measured by indicators for the four options on a self-assessed scale (very well,well, not very well, not at all). Those who do not speak a language other than English are assumed to speak Englishvery well. Sample is major city respondents aged 21–64 in columns 1 and 2, and employed respondents aged 21–64in columns 3–6.Source: HILDA survey, waves 1–6.
sample, 2% of respondents are Indigenous, 6% are Italian, 3% are Chinese and 4% areMiddle Eastern.9In columns 1, 3 and 5 of Table 1, we include only a parsimonious set of controls –
a survey year indicator, a gender indicator and a quadratic in age. In this specification,all the coefficients are negative, and five are statistically significant at the 95% level.Specifically, Indigenous respondents are 10 percentage points less likely to be employed,Chinese respondents are 12 percentage points less likely to be employed, and MiddleEastern respondents are 14% less likely to be employed. Conditional on being employed,Chinese respondents work 11% fewer hours, while Italian respondents earn wages that are6% lower. Note that for the other three minority groups, the hourly wage coefficients arenegative but statistically insignificant. If employers (or customers or co-workers) have adistaste for associating with workers from ethnic minorities, or if there is statistical dis-crimination, we would expect to see lower wages being offered for these groups. Yet thisis not observed in the HILDA data. This may reflect the fact that the Australian minimumwage is one of the highest in the developed world (Leigh, 2007). Other features of theAus-tralian employment system also lead to wage rigidity – for example, 17% of employeeshave their wages set by industrial awards, while a further 39% have their wages set through
9Cell sizes are still reasonably large. For example, in the employment regressions, the restricted HILDA sam-ple still includes 432 person-year observations for Indigenous respondents, 1,085 Italian observations, 666 Chineseobservations and 713 Middle Eastern observations.
© Blackwell Publishing Ltd and the Department of Economics, University of Oxford 2011

Discrimination across minority groups 553
registered collective agreements (ABS, 2009).10 Given this institutional framework, theprincipal margin on which employers can adjust is likely to be through hiring (Becker,1971). We would therefore expect to see lower employment rates for ethnic minorities.This is indeed what is observed in column 1.But what happens when additional observables are added to the specification? In
columns 2, 4 and 6 of Table 1, we include controls for years of actual labour marketexperience, years of education, and self-assessed English proficiency. In this specification,the coefficients tend to be closer to zero, and none are statistically significant at the 95%level. However, the standard errors in Table 1 are sufficiently large that we cannot rule outmodest ethnic differences in employment and wages, even controlling for observable pro-ductivity differences. Moreover, there are potentially important productivity differencesthat are unobservable, including school quality, interpersonal skills, and work ethics. Tothe extent that these are correlatedwith a respondent’s ethnicity, they could help explain (orconfound) estimates of labour market discrimination. In addition, any observed negativeeffects of immigrant status on the outcomes reported inTable 1might reflect discriminationat one or more of the different stages in the employment process, ranging from selectionfor interviews, to the hiring decision conditional on being interviewed, to the level ofwages actually offered. In principle, the level of discrimination in the pre-interview stage–which iswhatwe estimate in ourfield experiment described in section III below– could benegatively or positively correlated with discrimination in hiring decisions and wage offers.Can we learn more about employers’ ‘tastes for discrimination’ by examining reports
ofAustralians’attitudes to these minority groups? One way to address this is to use surveysasking Australians if immigration from particular regions should be reduced. Accordingto a telephone survey of randomly selected representative voting-age Australians con-ducted in the first quarter of 2007, around 12% of Australians thought immigration fromEurope should be reduced, 23% thought immigration from Asia should be reduced, and38% thought immigration from the Middle East should be reduced (Issues DeliberationAustralia, 2007). Surveys on attitudes to intermarriage find similar results (Dunn, 2003;Forrest andDunn, 2007).Thesefindings certainly seem to suggest that, forwhatever reason,there is prejudice inAustralia against particular ethnic groups. This could manifest itself intaste-based discrimination by employers, workers or customers. Next we consider whetheror not there is discrimination in hiring, as measured by the initial stage of the process –callback for an interview.
III. The correspondence discrimination experimentThe basic notion underlying correspondence discrimination studies is that an estimate ofthe extent of hiring discrimination can be determined by conducting an experiment inwhichfictional CVs, carrying ethnically identifiable names, are sent to employers. By comparingthe callback rates for different ethnic groups, the researcher can estimate the degree ofethnic discrimination in a particular context.
10Registered collective agreements are defined by the ABS as ‘An agreement between an employer (or group ofemployers) and a group of employees (or one or more unions or employee associations representing the employees).Acollective agreement sets the terms of employment (pay and/or conditions) for a group of employees, and is usuallyregistered with a Federal or State industrial tribunal or authority.’
© Blackwell Publishing Ltd and the Department of Economics, University of Oxford 2011
554 Bulletin
According to a comprehensive review of the literature (Riach and Rich, 2002), corre-spondence discrimination studies were initially conducted by British sociologists in 1969(Jowell and Prescott-Clarke, 1970). Since then, researchers have applied the techniqueto Australia, Canada, France, the Netherlands, Sweden and the United States. In auditstudies, researchers have also trained pairs of actors to show up for job interviews, applyfor rental housing, and negotiate to purchase used cars (for a recent survey, see Pager(2007)). Using written CVs, the correspondence discrimination technique has been usedto measure discrimination on the basis of gender, age, obesity, having a criminal record,facial attractiveness and sexual orientation. As noted above, in-person audit studies havebeen criticized on several bases, including the possibility that the actors may not in factappear identical to employers.11 In response to these criticisms, correspondence studiesreplace fictitious personal candidates with fictitious online or paper applications, therebyreducing potential heterogeneity in unobservables. This is the approach we follow in thisarticle. However, correspondence studies are still vulnerable to the critique of Heckmanand Siegelman (1993), who show that if the distribution of unobservable productivity-relevant attributes of the various groups differ, the correspondence studies may produceover or under-estimation of discrimination.12During the 6 months fromApril 2007 to October 2007, we applied for over 4,000 jobs
using a major online job-finding website. We applied for jobs in Australia’s three largestcities – Sydney, Melbourne and Brisbane. For each job-category, we created four fakeCV templates, obtained from a broad Internet search for similar CVs and tailored to theparticular job. Applicants’ names appeared in large type at the top of the CV, and wererandomized across CV types. Note that we have a total of five ethnic groups. To ensure thatthe four applicants at each firm were from four different ethnic groups, we randomized andthen ‘balanced’; that is, if a firm’s random draw included two people from the same ethnicgroup, we did another random draw. We continued to make random draws until each firmhad four applicants from different ethnic groups.Such a large sample size provides sufficient statistical power to look not only at differ-
ences across five ethnic groups (Anglo-Saxon, Indigenous, Chinese, Italian and MiddleEastern), but also to see whether such effects differed by gender, city and job type. Forexample, we still have around 280 individuals per cell when looking at differences byethnicity and city. However, our results are fragile once we go to three-level tabulations(e.g. ethnicity by job type by gender), so we do not show such results in our tabulations.Booth and Leigh (2010) focus specifically on issues of gender.In selecting appropriate occupations for this study, we focused on jobs that did not
require any post-school qualifications, and for which the application process was relatively
11Heckman (1998) and Heckman and Siegelman (1993) present a number of additional critiques of the method-ology used in correspondence and audit studies. Since these primarily deal with studies that use actors, we do notaddress them here, but one response may be found in Pager (2007).12Neumark (2010) shows that, if correspondence studies explicitly include variations in applicant quality, an un-
biased estimate of discrimination can be uncovered. Neumark (2010) applied his technique to the correspondencestudy of Bertrand and Mullainathan (2004), and showed that their measured discrimination was actually an under-estimate. Our experiment was designed and undertaken before Neumark’s paper was written, and we were unableto follow his approach since employers in our experiment did not respond to differences in applicant quality in asystematic fashion across job types (eg. higher-educated applicants received more callbacks in some job types, andfewer callbacks in others).
© Blackwell Publishing Ltd and the Department of Economics, University of Oxford 2011

Discrimination across minority groups 555
straightforward (to ensure that we could complete a sufficient number of applications tohave good statistical power).
Conjectures
While our primary goal is to establish the extent of discrimination and how it varies acrossethnic minorities inAustralia, we also wished to test a number of related conjectures. Theseare as follows.First, we aim to test the conjecture that employers differentially discriminate in response
to perceived customer preferences. To assess this, we deliberately select occupations forour analysis that involve face-to-face contact, and those that do not. The four occupationswe select are: waitstaff, data entry, customer service and sales. Data entry involves nocustomer contact, and therefore customer discriminatory preferences should not play arole in the employer’s callback decision. In contrast, waitstaff jobs entail a high degree ofinterpersonal contact. Hence for these jobs we would expect ethnic applicants to receivelower callback rates if customer discriminatory preferences matter.Examples of the types of jobs falling within these occupational categories are as fol-
lows. Waitstaff jobs included positions at bistros, cafes, bars, restaurants and hotels. Dataentry positions – also known as document processing officers or technical records officers –included jobs working for an airline, a radio station, a bank and a charity. Customer servicejobs were a mix of telephone support and face-to-face positions (it was often difficult todistinguish these from the information available) and included staffing the front desk at abowling alley, answering customer support calls at a private health insurance company,and staffing the front desk at a parking garage. Sales positions almost entirely involvedin-person sales, and included jobs at a tiling store, a supermarket, an electrical goods storeand a pizzeria.Table 2 gives average wages and share female in these occupations, based on data from
the Australian Bureau of Statistics’ Employee Earnings and Hours survey, conducted inAugust 2006. The four jobs, more feminized than the non-managerial workforce as awhole, also have a slightly above-average share of employees from non-English-speakingbackgrounds.Across the four jobs, workers are paid about three quarters of average wages.
TABLE 2
Characteristics of the jobs
Wage($) Share female(%) Share NESB(%)Waitstaff 18.90 80 17Data entry 19.10 85 15Customer service 21.60 68 17Sales 18.50 69 16All full-time non-managerial 26.00 46 15Notes: NESB denotes respondents who were born in a non-English-speaking coun-
try. Since we only have access to the 2-digit occupation code, we classify the fouroccupations using ISCO-88 codes 51, 41, 42 and 52 respectively.Source: Wage and share female fromAustralian Bureau of Statistics, Employee Earn-ings and Hours survey, conducted inAugust 2006. Share Non-English Speaking Back-ground (NESB) from HILDA, pooling waves 1–6.
© Blackwell Publishing Ltd and the Department of Economics, University of Oxford 2011

556 Bulletin
The second conjecture that we wished to test was whether or not employers in differentAustralian cities differentially discriminate against ethnicminority applicants.We thereforeapplied for jobs inAustralia’s three largest cities: Sydney, Melbourne and Brisbane. Thesecities differ in terms of their ethnic composition (with Sydney being the most ethnicallydiverse of the three), their immigration history, and in the prevailing rate of unemploymentat the time of our study (with Brisbane having the tightest labour market).Our third conjecture is whether or not racial-majority employers discriminate against
minority groups. We explore this in two ways, to be explained in greater detail towardsthe end of this section. The first involves matching on the characteristics of the zipcode inwhich the employer is located. The second exploits the fact that, for many jobs, we knowthe name of the contact person listed on the advertisement, the person who responded toone or more of our applicants, and sometimes both.
Collecting the data
For each job category, we created four fictional CV templates that we used to apply forjobs. These were obtained from a broad Internet search for similar CVs, and tailored byus to the particular job. The CV template was augmented with the addition of an address(we selected four street-suburb combinations in middle-income neighbourhoods, and ran-domized the street number between 1 and 20). Two sample CVs are depicted in FiguresA1 and A2.The ethnicity of the applicant was denoted by an ethnically distinguishable name,which
appeared in large print at the top of the CV. For each ethnic group, we identified five femalefirst names, five male first names, and five last names, which were combined randomly tocreate the job applicant’s name. Ideally, we would have obtained access to a large databaseof Australians, containing names and self-identified ethnicity. However, we were unableto locate a suitable public database, and sample surveys such as the HILDA survey (orIndigenous databases such as those held by theAustralian Institute ofAboriginal andTorresStrait Islander Studies) turned down our requests to tabulate lists of common names. Wetherefore chose our Anglo-Saxon, Italian, Chinese, and Middle Eastern names by consult-ing the website http://www.behindthename.com, and our Indigenous names by consultingthe indexes of various books listing Indigenous artists.13 The full list of names used in thisstudy is provided in Table A1.The job-finding website that we used had an online application process. For each adver-
tised position, we submitted four applications, ensuring as described above that each of thefour applications was from a different ethnic group.14 Each application included a shortcovering letter, plus a fake CV. For each sex-cell, we set up an email address plus a separatephone line with an answering machine. (All answering machines had a message left by aperson with a regular Australian accent. We did this because applicants were supposed to13Since our CVs suggest that the job applicants are aged in their twenties, it is unlikely that employers would
have thought that female applicants with non-Anglo names were actually Anglo respondents who had taken on anon-Anglo last name by marriage.14A referee pointed out that our results hold when there is an Anglo-Saxon applicant with similar merits applying
for the same position. If there was not an applicant with anAnglo-Saxon name, the callback rates for the ethnic minor-ities would probably have been higher. We would also point out that if there had been more than one Anglo-Saxonapplicant with similar merits applying for the same position the callback rate could well have been lower.
© Blackwell Publishing Ltd and the Department of Economics, University of Oxford 2011
Discrimination across minority groups 557
differ only with regard to their ethnicity, and wewanted to guard against the possibility thata prospective interviewer would simply hang up if they heard a foreign-sounding voice.)Employers could invite the applicant back for an interview by either sending an email ormaking a telephone call.
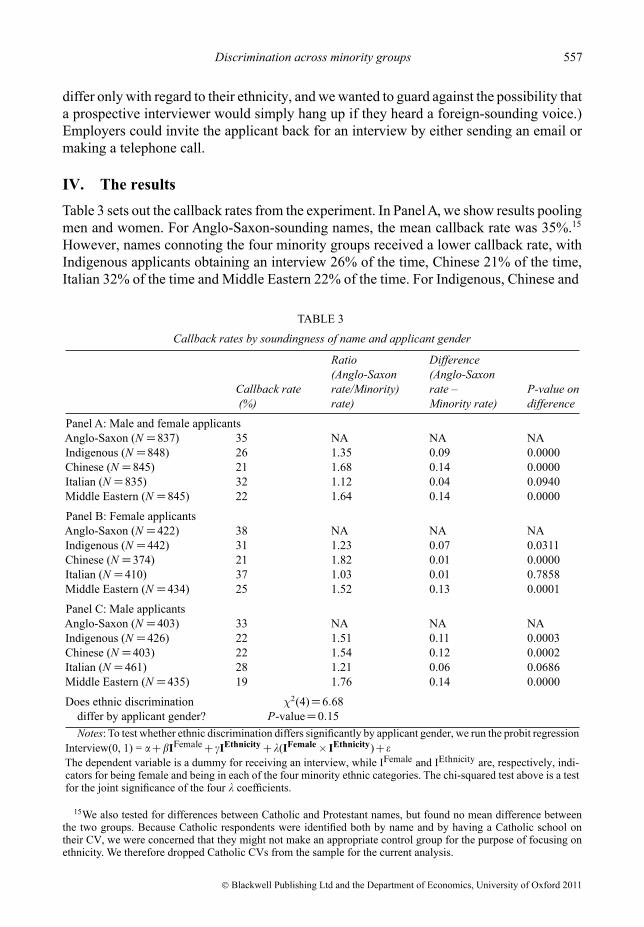
IV. The resultsTable 3 sets out the callback rates from the experiment. In PanelA, we show results poolingmen and women. For Anglo-Saxon-sounding names, the mean callback rate was 35%.15However, names connoting the four minority groups received a lower callback rate, withIndigenous applicants obtaining an interview 26% of the time, Chinese 21% of the time,Italian 32% of the time and Middle Eastern 22% of the time. For Indigenous, Chinese and
TABLE 3
Callback rates by soundingness of name and applicant gender
Ratio Difference(Anglo-Saxon (Anglo-Saxon
Callback rate rate/Minority) rate – P-value on(%) rate) Minority rate) difference
Panel A: Male and female applicantsAnglo-Saxon (N =837) 35 NA NA NAIndigenous (N =848) 26 1.35 0.09 0.0000Chinese (N =845) 21 1.68 0.14 0.0000Italian (N =835) 32 1.12 0.04 0.0940Middle Eastern (N =845) 22 1.64 0.14 0.0000
Panel B: Female applicantsAnglo-Saxon (N =422) 38 NA NA NAIndigenous (N =442) 31 1.23 0.07 0.0311Chinese (N =374) 21 1.82 0.01 0.0000Italian (N =410) 37 1.03 0.01 0.7858Middle Eastern (N =434) 25 1.52 0.13 0.0001
Panel C: Male applicantsAnglo-Saxon (N =403) 33 NA NA NAIndigenous (N =426) 22 1.51 0.11 0.0003Chinese (N =403) 22 1.54 0.12 0.0002Italian (N =461) 28 1.21 0.06 0.0686Middle Eastern (N =435) 19 1.76 0.14 0.0000
Does ethnic discrimination χ2(4)=6.68differ by applicant gender? P-value=0.15Notes: To test whether ethnic discrimination differs significantly by applicant gender, we run the probit regression
Interview(0, 1) = �+�IFemale + �IEthnicity+�(IFemale× IEthnicity)+ �The dependent variable is a dummy for receiving an interview, while IFemale and IEthnicity are, respectively, indi-cators for being female and being in each of the four minority ethnic categories. The chi-squared test above is a testfor the joint significance of the four � coefficients.
15We also tested for differences between Catholic and Protestant names, but found no mean difference betweenthe two groups. Because Catholic respondents were identified both by name and by having a Catholic school ontheir CV, we were concerned that they might not make an appropriate control group for the purpose of focusing onethnicity. We therefore dropped Catholic CVs from the sample for the current analysis.
© Blackwell Publishing Ltd and the Department of Economics, University of Oxford 2011
558 Bulletin
Middle Eastern applicants, the difference is highly statistically significant at the 1% level,but theAnglo vs. Italian difference is only statistically significant at the 10% level (see lastcolumn of Table 3, where the P-value on the difference is 0.940).16The middle column of Table 3 expresses the difference as a ratio. This is useful because
it provides an intuitive metric for the level of discrimination in terms of the number ofadditional job applications that a minority applicant must submit to get the same numberof callbacks as anAnglo applicant. These ratios indicate that, in order to get as many inter-views as anAnglo applicant, an Indigenous person must submit 35% more applications, aChinese person must submit 68% more applications, an Italian person must submit 12%more applications, and a Middle Eastern person 64% more applications.Panels B and C separate the analysis into female and male applicants. The results in
Panel B indicate that female Italian applicants are not discriminated against (relative tofemale Anglo applicants), but otherwise the minority groups all have significantly lowercallback rates (see the P-values in the last column). Notice that the difference betweencallback rates for Indigenous andAnglo females is statistically significant at the 3% level,while for Chinese andMiddle Eastern relative toAnglo females it is statistically significantat the 1% level. Panel C shows that, relative toAnglo applicants of the same sex, discrimi-nation is generally worse for minority men than for minority women (the exception beingthose with Chinese-sounding names) and for all groups except Italian the difference isstatistically significant at the 1% level.17 However, when we formally test whether ethnicdiscrimination differs by gender, we cannot reject the hypothesis that the level of discrim-ination is the same for men and women of the same ethnic group. In Booth and Leigh(2010), we explore gender differences in more detail and find that, overall, female candi-dates are more likely to receive a callback than male candidates (the differences are largestfor waitstaff and data entry occupations).One way to benchmark our results is to compare the number of additional applications
that a minority candidate must submit in order to expect the same number of interviews.Another is to think about the kind of labourmarket that minority applicants face.18 In effect,we can ask the question: what would the prevailing unemployment rate have to be for anAnglo person to face the same job-finding task as a member of a minority group?To answer this, we exploit the fact that the unemployment rate differs across time, and
across the three cities in our experiment. Using only Anglo-Saxon respondents, we run asimple probit regression of whether a given respondent gets an interview on the prevailingunemployment rate in that month and city. The coefficient from this regression is −0.065(standard error 0.033), suggesting that a 1-point increase in the unemployment rate reducesthe probability of anAnglo-Saxon applicant getting an interview by 6.5%. On average, theprevailing unemployment rate during our analysis was 4.3%.However, the analysis in the previous paragraph, taken together with the results in
Table 3, suggests the following. First, Indigenous applicants faced the same difficulties16Although all applicants attended school inAustralia, and we are able to hold constant their education and experi-
ence, it is possible that stereotypes about productivity still remain. However, as noted below, we find little evidencethat second-generation immigrants have inferior English-speaking skills.17We are inclined not to make much of the larger effect for Chinese women, since many non-Chinese would
probably have difficulty distinguishing between male and female Chinese first names.18Another approach would be to benchmark the magnitude of our effects against the benefit of more education.
However, returns to education did not differ systematically within jobs. We return to this issue below.
© Blackwell Publishing Ltd and the Department of Economics, University of Oxford 2011
Discrimination across minority groups 559
in obtaining an interview as an Anglo applicant when the unemployment rate was 5.6%.Second,Chinese applicants faced the samedifficulties in obtaining an interview as anAngloapplicant when the unemployment rate was 6.4%. Third, Italian applicants faced the samedifficulties in obtaining an interview as an Anglo applicant when the unemployment ratewas 4.8%. Fourth, Middle Eastern applicants faced the same difficulties in obtaining aninterview as an Anglo applicant when the unemployment rate was 6.4%.In summary, we have found clear evidence of discrimination in selection for inter-
views for entry-level jobs in Australia. Of course, the audit discrimination technique onlyobserves the first stage of the employment process – selection for an interview – and hencewe cannot comment on the second stage of receiving a job offer. Nonetheless, our resultsprovide clear evidence of ethnic discrimination at the callback stage. This contrasts withthe pooled cross-sectional estimates summarized in Table 1, based on survey data andcombine the various stages of the employment process. Thus employment in that tableinvolves selection for callback and selection for an employment offer at the interviewstage. But this regression approach may not provide an accurate answer, as we noted in theIntroduction. If an individual’s ethnicity is correlated with some unobserved productivetrait, differences in economic outcomes are likely to reflect more than just discrimination.In contrast to those regression results based on survey evidence, our field experiment isa randomized experiment. As such, it is better able to establish causality, and it providesstrong evidence for the existence of discrimination at the callback stage. Next we attemptto tease out more information about the reasons for such discrimination and to test theconjectures outlined in the previous section.
Is there evidence of customer discrimination?
We constructed our experiment so that some of the jobs for which we applied required nocustomer contact, and therefore customer discriminatory preferences should play no rolein the employer’s callback decision. In contrast, others entail a high degree of interpersonalcontact. A test for whether or not customer preferences might matter involves testing ifthe degree of ethnic discrimination differs across the four job types in the survey. Theseare waitstaff, data entry, customer service, and sales. If customer discrimination is impor-tant, then one should expect to see substantially more discrimination in jobs that involvethe highest degree of interpersonal contact (waitstaff) than those involving no customercontact (data entry).These results are presented in Table 4. Across the four jobs, we observe the greatest
amount of discrimination against minority applicants seeking waitstaff jobs. A Chineseand Middle Eastern person seeking a job as a waiter or waitress must submit fully twice asmany applications in order to get as many interviews as an Anglo-Saxon applicant. How-ever, there is only slightly less discrimination in data entry jobs, and a formal test cannotreject that the degree of discrimination is the same in both occupations. This suggests thatrelatively little of the observed discrimination can be attributed solely to customer-baseddiscrimination.Curiously, the one job in which the level of discrimination appears to be lower is
customer service, in which there is no statistically significant discrimination against anyof the minority ethnic groups. This is also the one occupation in which those with more
© Blackwell Publishing Ltd and the Department of Economics, University of Oxford 2011

560 Bulletin
TABLE 4
Callback rates by soundingness of name and job type
Ratio Difference(Anglo- (Anglo-Saxon rate / Saxon rate –
Callback Minority Minority P-value onrate (%) rate) rate) difference
Panel A: WaitstaffAnglo-Saxon (N =223) 50 NA NA NAIndigenous (N =215) 29 1.70 0.20 0.0000Chinese (N =200) 25 1.99 0.25 0.0000Italian (N =211) 39 1.27 0.10 0.0288Middle Eastern (N =214) 22 2.27 0.28 0.0000
Panel B: Data entryAnglo-Saxon (N =222) 34 NA NA NAIndigenous (N =209) 21 1.60 0.13 0.0031Chinese (N =199) 19 1.82 0.15 0.0004Italian (N =213) 29 1.18 0.05 0.2472Middle Eastern (N =207) 20 1.71 0.14 0.0011
Panel C: Customer serviceAnglo-Saxon (N =196) 26 NA NA NAIndigenous (N =215) 28 0.91 −0.02 0.5836Chinese (N =215) 23 1.12 0.03 0.5196Italian (N =201) 32 0.79 −0.07 0.1337Middle Eastern (N =220) 25 1.02 0.01 0.9048
Panel D: SalesAnglo-Saxon (N =196) 31 NA NA NAIndigenous (N =209) 27 1.16 0.04 0.3369Chinese (N =231) 18 1.71 0.13 0.0018Italian (N =210) 26 1.19 0.05 0.2717Middle Eastern (N =204) 20 1.59 0.12 0.0081
Does ethnic discrimination χ2(4)=3.55differ between waitstaff and data entry? P-value=0.47Notes: To test whether ethnic discrimination differs significantly by job, we run the probit regression
Interview(0, 1) = �+�IWaitstaff + �IEthnicity+�(IWaitstaff × IEthnicity)+ �The dependent variable is a dummy for receiving an interview, while IWaitstaff and IEthnicity are, respectively, indica-tors for applying for a waitstaff job and being in each of the four minority ethnic categories. The chi-squared test aboveis a test for the joint significance of the four � coefficients. We run this test with waitstaff and data entry positionsonly.
education were significantly more likely to receive an interview (a pattern that did not holdin other occupations, as we discuss below). This suggests that there could potentially beless discrimination in higher-skill occupations than in the low-skill jobs analysed here.
Are there differences in discrimination across cities?
Our second conjecture was that employers in the majorAustralian cities differentially dis-criminate against ethnic-minority applicants. The three largest cities – Sydney,Melbourne,and Brisbane – differ in terms of their immigration history and ethnic composition. For
© Blackwell Publishing Ltd and the Department of Economics, University of Oxford 2011

Discrimination across minority groups 561
example,Melbourne has the largest proportion of immigrant Italians andSydneyofChineseand Middle Eastern immigrants. The cities also differed slightly in their unemploymentrates at the time of our study (with Brisbane having the tightest labour market). To whatextent do levels of discrimination differ across the three cities in our experiment?In Table 5, we present results tabulated separately for Brisbane,Melbourne and Sydney.
In general, the patterns are quite similar. In each of the cities, discrimination is highestagainst Chinese and Middle Eastern applicants, followed by Indigenous applicants, fol-lowed by Italian applicants. However, the point estimates are suggestive of non-trivialdifferences. For example, if they are to get as many interviews as an applicant with anAnglo name, Chinese applicants must put in 57% more applications in Brisbane, but92% more applications in Sydney. In addition, there is a statistically significant degree of
TABLE 5
Callback rates by soundingness of name and city
Ratio Difference(Anglo- (Anglo-Saxon rate / Saxon rate –
Callback Minority Minority P-value onrate (%) rate) rate) difference
Panel A: BrisbaneAnglo-Saxon (N =269) 42 NA NA NAIndigenous (N =281) 30 1.41 0.12 0.0030Chinese (N =283) 27 1.57 0.15 0.0002Italian (N =286) 33 1.28 0.09 0.0261Middle Eastern (N =280) 28 1.51 0.14 0.0005
Panel B: MelbourneAnglo-Saxon (N =282) 27 NA NA NAIndigenous (N =272) 18 1.48 0.09 0.0154Chinese (N =278) 17 1.61 0.10 0.0039Italian (N =282) 29 0.93 −0.02 0.5722Middle Eastern (N =284) 16 1.64 0.10 0.0026
Panel C: SydneyAnglo-Saxon (N =286) 38 NA NA NAIndigenous (N =295) 31 1.25 0.08 0.0537Chinese (N =284) 20 1.92 0.18 0.0000Italian (N =267) 34 1.14 0.05 0.2450Middle Eastern (N =281) 21 1.80 0.17 0.0000
Does ethnic discrimination Sydney vs. Sydney vs. Brisbane vs.differ by city? Melbourne Brisbane Melbourne
χ2(4)=4.59 χ2(4)=4.47 χ2(4)=5.00P-value=0.33 P-value=0.35 P-value=0.29
Note: To test whether ethnic discrimination differs significantly by city, we run the probit regressionInterview(0, 1)=�+�ICity + �IEthnicity+�(ICity × IEthnicity)+ �The dependent variable is a dummy for receiving an interview, while ICity and IEthnicity are, respectively,indicators for being in a particular city and being in each of the four minority ethnic categories. The chi-squared test above is a test for the joint significance of the four � coefficients. We run this test three times,for each of the three city-pair combinations.
© Blackwell Publishing Ltd and the Department of Economics, University of Oxford 2011
562 Bulletin
discrimination against Italians in Brisbane, but no evidence of discrimination against Ital-ians in Melbourne.19 To the extent that such differences exist, they could be due to thetightness of the labour market, the ethnic mix of the city, or differences in social norms.However, when we formally test the hypothesis that discrimination is equal across thethree cities, we are unable to reject it for any of the three city-pair combinations. (Focusingon individual ethnicities, the only significant difference is the degree of discriminationagainst Italians in Brisbane and Melbourne).
Does discrimination vary with employer characteristics?
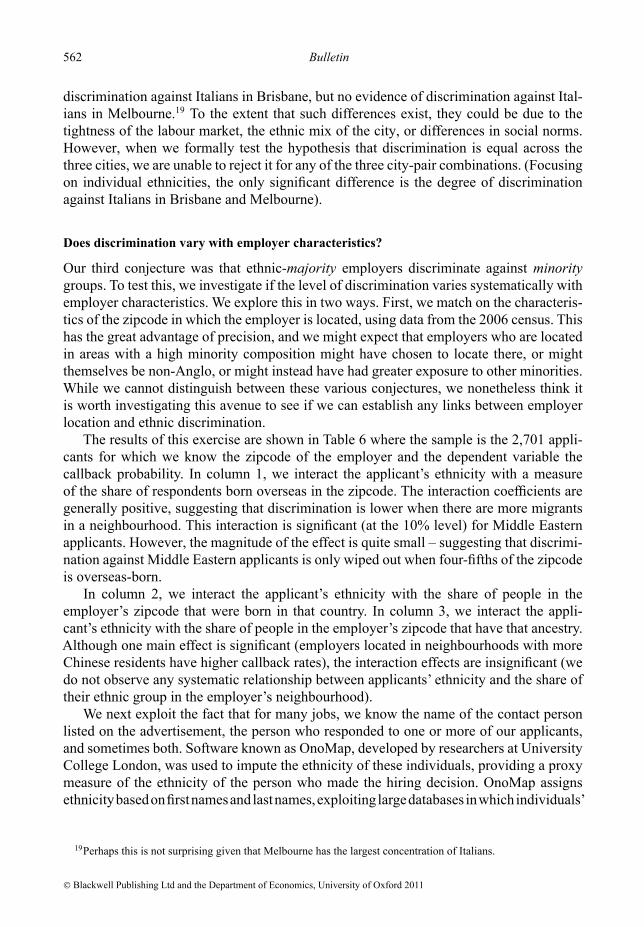
Our third conjecture was that ethnic-majority employers discriminate against minoritygroups. To test this, we investigate if the level of discrimination varies systematically withemployer characteristics. We explore this in two ways. First, we match on the characteris-tics of the zipcode in which the employer is located, using data from the 2006 census. Thishas the great advantage of precision, and we might expect that employers who are locatedin areas with a high minority composition might have chosen to locate there, or mightthemselves be non-Anglo, or might instead have had greater exposure to other minorities.While we cannot distinguish between these various conjectures, we nonetheless think itis worth investigating this avenue to see if we can establish any links between employerlocation and ethnic discrimination.The results of this exercise are shown in Table 6 where the sample is the 2,701 appli-
cants for which we know the zipcode of the employer and the dependent variable thecallback probability. In column 1, we interact the applicant’s ethnicity with a measureof the share of respondents born overseas in the zipcode. The interaction coefficients aregenerally positive, suggesting that discrimination is lower when there are more migrantsin a neighbourhood. This interaction is significant (at the 10% level) for Middle Easternapplicants. However, the magnitude of the effect is quite small – suggesting that discrimi-nation against Middle Eastern applicants is only wiped out when four-fifths of the zipcodeis overseas-born.In column 2, we interact the applicant’s ethnicity with the share of people in the
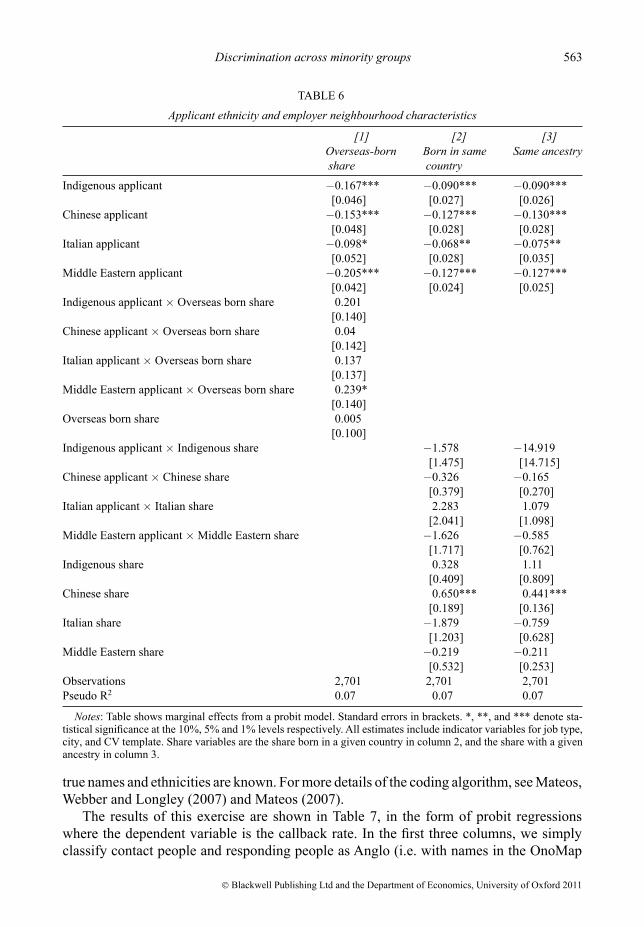
employer’s zipcode that were born in that country. In column 3, we interact the appli-cant’s ethnicity with the share of people in the employer’s zipcode that have that ancestry.Although one main effect is significant (employers located in neighbourhoods with moreChinese residents have higher callback rates), the interaction effects are insignificant (wedo not observe any systematic relationship between applicants’ ethnicity and the share oftheir ethnic group in the employer’s neighbourhood).We next exploit the fact that for many jobs, we know the name of the contact person
listed on the advertisement, the person who responded to one or more of our applicants,and sometimes both. Software known as OnoMap, developed by researchers at UniversityCollege London, was used to impute the ethnicity of these individuals, providing a proxymeasure of the ethnicity of the person who made the hiring decision. OnoMap assignsethnicitybasedonfirstnamesandlastnames,exploiting largedatabases inwhichindividuals’
19Perhaps this is not surprising given that Melbourne has the largest concentration of Italians.
© Blackwell Publishing Ltd and the Department of Economics, University of Oxford 2011
Discrimination across minority groups 563
TABLE 6
Applicant ethnicity and employer neighbourhood characteristics
[1] [2] [3]Overseas-born Born in same Same ancestryshare country
Indigenous applicant −0.167*** −0.090*** −0.090***[0.046] [0.027] [0.026]
Chinese applicant −0.153*** −0.127*** −0.130***[0.048] [0.028] [0.028]
Italian applicant −0.098* −0.068** −0.075**[0.052] [0.028] [0.035]
Middle Eastern applicant −0.205*** −0.127*** −0.127***[0.042] [0.024] [0.025]
Indigenous applicant × Overseas born share 0.201[0.140]
Chinese applicant × Overseas born share 0.04[0.142]
Italian applicant × Overseas born share 0.137[0.137]
Middle Eastern applicant × Overseas born share 0.239*[0.140]
Overseas born share 0.005[0.100]
Indigenous applicant × Indigenous share −1.578 −14.919[1.475] [14.715]
Chinese applicant × Chinese share −0.326 −0.165[0.379] [0.270]
Italian applicant × Italian share 2.283 1.079[2.041] [1.098]
Middle Eastern applicant ×Middle Eastern share −1.626 −0.585[1.717] [0.762]
Indigenous share 0.328 1.11[0.409] [0.809]
Chinese share 0.650*** 0.441***[0.189] [0.136]
Italian share −1.879 −0.759[1.203] [0.628]
Middle Eastern share −0.219 −0.211[0.532] [0.253]
Observations 2,701 2,701 2,701Pseudo R2 0.07 0.07 0.07
Notes: Table shows marginal effects from a probit model. Standard errors in brackets. *, **, and *** denote sta-tistical significance at the 10%, 5% and 1% levels respectively. All estimates include indicator variables for job type,city, and CV template. Share variables are the share born in a given country in column 2, and the share with a givenancestry in column 3.
true names and ethnicities are known. Formore details of the coding algorithm, seeMateos,Webber and Longley (2007) and Mateos (2007).The results of this exercise are shown in Table 7, in the form of probit regressions
where the dependent variable is the callback rate. In the first three columns, we simplyclassify contact people and responding people as Anglo (i.e. with names in the OnoMap
© Blackwell Publishing Ltd and the Department of Economics, University of Oxford 2011
564 Bulletin
TABLE 7
Applicant ethnicity and employer ethnicity
[1] [2] [3] [4] [5]Contact Responder Contact or Contact Respondernon-anglo non-anglo responder same same
non-anglo ethnicity ethnicityIndigenous applicant −0.111*** −0.132*** −0.111*** −0.106*** −0.126***
[0.025] [0.036] [0.025] [0.024] [0.033]Chinese applicant −0.178*** −0.236*** −0.169*** −0.169*** −0.225***
[0.023] [0.034] [0.024] [0.021] [0.031]Italian applicant −0.065** −0.054 −0.055** −0.063** −0.059*
[0.027] [0.038] [0.027] [0.026] [0.035]Middle Eastern applicant −0.145*** −0.231*** −0.160*** −0.146*** −0.218***
[0.024] [0.034] [0.024] [0.022] [0.031]Indigenous applicant ×Non-Anglo employer 0.044 0.033 0.085
[0.084] [0.087] [0.074]Chinese applicant ×Non-Anglo employer 0.048 0.024 0.065
[0.087] [0.085] [0.073]Italian applicant ×Non-Anglo employer 0.081 −0.003 0.077
[0.088] [0.086] [0.074]Middle Eastern applicant ×Non-Anglo employer −0.019 0.068 0.079
[0.078] [0.085] [0.073]Non-Anglo employer −0.001 0.021 0.016
[0.053] [0.060] [0.048]Chinese applicant × Chineseemployer 0.14 0.055
[0.102] [0.101]Italian applicant × Italianemployer −0.178** −0.244*
[0.086] [0.131]Middle Eastern applicant ×Middle Eastern employer −0.125 −0.078
[0.141] [0.219]Chinese employer 0.157 0.209***
[0.101] [0.077]Italian employer 0.02 −0.001
[0.039] [0.043]Middle Eastern employer 0.041 0.021
[0.090] [0.099]Observations 2,335 2,319 3,313 2,335 2,319Pseudo R2 0.07 0.09 0.06 0.07 0.09
Notes: Table shows marginal effects from a probit model. Standard errors in brackets. *, **, and *** denotestatistical significance at the 10%, 5% and 1% levels respectively. All estimates include indicator variables for jobtype, city, and CV template. Employer ethnicity is imputed using the name of the contact in the job advertisement incolumns 1 and 4, the name of the person who responded to candidates in columns 2 and 5, and either of those peoplein column 3 (if either is non-Anglo, the employer is coded as non-Anglo).
© Blackwell Publishing Ltd and the Department of Economics, University of Oxford 2011

Discrimination across minority groups 565
Celtic or English categories), or non-Anglo (i.e. with names in the following OnoMapgroups: African, East Asian & Pacific, European, Greek, Hispanic, International, Jewish&Armenian, Muslim, Sikh or SouthAsian). In columns 4–6, we classify employer namesas being the same or different from the applicant’s name (Italian applicants are matchedto OnoMap’s European and Greek groups, Chinese applicants are matched to OnoMap’sEast Asian & Pacific and South Asian groups, and Middle Eastern applicants are matchedto OnoMap’s Muslim group).20We observe positive main effects for Chinese employers, who appear to have a higher
callback rate. However, the only interaction effect we observe is for Italian employers,who appear to be significantly less likely to call back job candidates with Italian names.This is a surprising pattern, which suggests that a group with a relatively long history inAustralia is actually less inclined to assist members of the same group.
How do our results compare with similar correspondence studies from other countries?
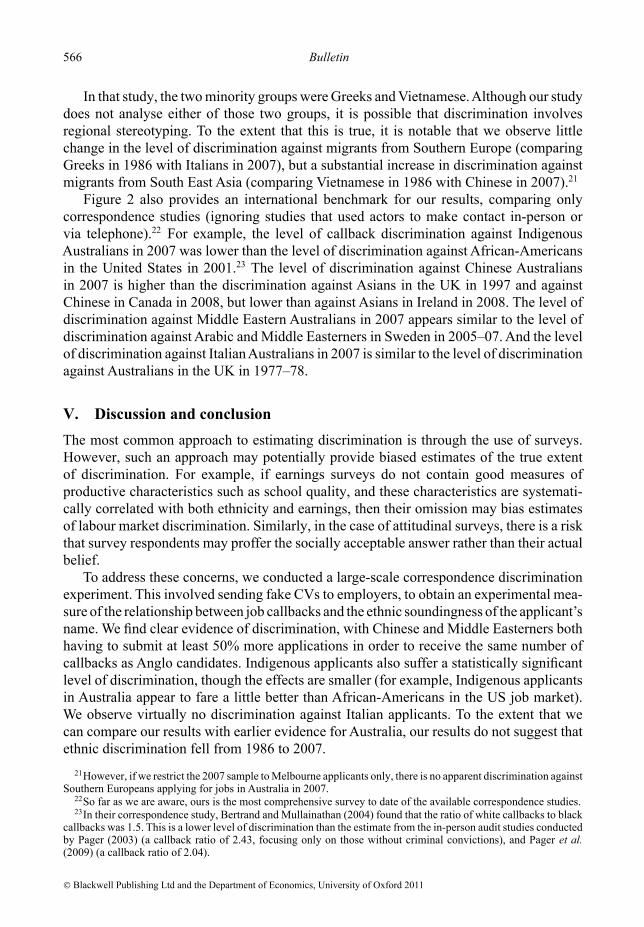
A survey by Riach and Rich (2002), supplemented with a literature review, returned 18comparable correspondence studies (including ours), covering 34 minority ethnic groups.The results are set out in full in Table A2, and graphed in Figure 2. Of course there areproblems inmaking such comparisons, not least the differentminorities tested, the differenthistories of immigration in each country, the economic state of the countries and the like.Nonetheless this is a parsimonious way ofmaking some comparisons. The first comparisonis with the earlier Australian discrimination estimates from the correspondence study ofRiach and Rich (1991), who ran an experiment in Melbourne between 1984 and 1988.
1
1.5
2
Maj
ority
cal
lbac
k/m
inor
ity c
allb
ack
AUS
Gre
ek 1
984
Vie
tnam
ese
1984
Chi
nese
200
7In
dige
nous
200
7Ita
lian
2007
Mid
dle
Eas
tern
200
7
Chi
nese
200
8In
dian
200
8P
akis
tani
200
8
Tur
kish
199
4
Asi
an 1
969
Wes
t Ind
ian
1969
Asi
an/W
est I
ndia
n 19
73Ita
lian
1973
Afr
ican
197
7A
sian
197
7A
ustr
alia
n 19
77F
renc
h 19
77Ita
lian
1977
Wes
t Ind
ian
1977
Asi
an/W
est I
ndia
n 19
84A
sian
199
2A
sian
199
7
Afr
ican
200
8A
sian
200
8G
erm
an 2
008
Sur
inam
ese
1993
Mid
dle
Eas
tern
200
5A
rabi
c/A
fric
an 2
006
Afr
ican
-Am
eric
an 2
001
Note: Chart omits Bovenkerk et al. (1979), who found a ratio of 3.47 for Antillian job applicants in France in 1976.CAN DEU GBR IRE NLD SWE USA
Figure 2. Comparing our resuls with prior correspondence studies
20Matching more narrowly – e.g. matching Italian applicants to OnoMap’s Italian names, and Chinese applicantsto OnoMap’s Chinese names – makes little difference to the results.
© Blackwell Publishing Ltd and the Department of Economics, University of Oxford 2011
566 Bulletin
In that study, the twominority groups were Greeks andVietnamese.Although our studydoes not analyse either of those two groups, it is possible that discrimination involvesregional stereotyping. To the extent that this is true, it is notable that we observe littlechange in the level of discrimination against migrants from Southern Europe (comparingGreeks in 1986 with Italians in 2007), but a substantial increase in discrimination againstmigrants from South East Asia (comparing Vietnamese in 1986 with Chinese in 2007).21Figure 2 also provides an international benchmark for our results, comparing only
correspondence studies (ignoring studies that used actors to make contact in-person orvia telephone).22 For example, the level of callback discrimination against IndigenousAustralians in 2007 was lower than the level of discrimination against African-Americansin the United States in 2001.23 The level of discrimination against Chinese Australiansin 2007 is higher than the discrimination against Asians in the UK in 1997 and againstChinese in Canada in 2008, but lower than against Asians in Ireland in 2008. The level ofdiscrimination against Middle Eastern Australians in 2007 appears similar to the level ofdiscrimination againstArabic and Middle Easterners in Sweden in 2005–07.And the levelof discrimination against ItalianAustralians in 2007 is similar to the level of discriminationagainst Australians in the UK in 1977–78.
V. Discussion and conclusionThe most common approach to estimating discrimination is through the use of surveys.However, such an approach may potentially provide biased estimates of the true extentof discrimination. For example, if earnings surveys do not contain good measures ofproductive characteristics such as school quality, and these characteristics are systemati-cally correlated with both ethnicity and earnings, then their omission may bias estimatesof labour market discrimination. Similarly, in the case of attitudinal surveys, there is a riskthat survey respondents may proffer the socially acceptable answer rather than their actualbelief.To address these concerns, we conducted a large-scale correspondence discrimination
experiment. This involved sending fake CVs to employers, to obtain an experimental mea-sure of the relationship between job callbacks and the ethnic soundingness of the applicant’sname. We find clear evidence of discrimination, with Chinese and Middle Easterners bothhaving to submit at least 50% more applications in order to receive the same number ofcallbacks as Anglo candidates. Indigenous applicants also suffer a statistically significantlevel of discrimination, though the effects are smaller (for example, Indigenous applicantsin Australia appear to fare a little better than African-Americans in the US job market).We observe virtually no discrimination against Italian applicants. To the extent that wecan compare our results with earlier evidence for Australia, our results do not suggest thatethnic discrimination fell from 1986 to 2007.21However, if we restrict the 2007 sample toMelbourne applicants only, there is no apparent discrimination against
Southern Europeans applying for jobs in Australia in 2007.22So far as we are aware, ours is the most comprehensive survey to date of the available correspondence studies.23In their correspondence study, Bertrand and Mullainathan (2004) found that the ratio of white callbacks to black
callbacks was 1.5. This is a lower level of discrimination than the estimate from the in-person audit studies conductedby Pager (2003) (a callback ratio of 2.43, focusing only on those without criminal convictions), and Pager et al.(2009) (a callback ratio of 2.04).
© Blackwell Publishing Ltd and the Department of Economics, University of Oxford 2011

Discrimination across minority groups 567
Naturally, the use offield experiments tomeasure discrimination has its own limitations.For example, the way in which ethnicity is denoted may not necessarily be representativeof the general population. In our experiment, we use names that were chosen on the basisthat we judged them to be representative of the various ethnic groups. This allows us toconduct an experiment in which we only vary the names, but it has the limitation thatour results will not necessarily generalize to individuals of the same ethnicity, but withanAnglicized name. Another limitation is that our experiment provides a precise estimateon the callback stage, but we are unable to speak of discrimination at the interview stage,nor on the job. Indeed, a drawback of the correspondence approach relative to the auditapproach is that the pure correspondence approach does not allow one to explore discrim-ination at different stages of the application procedure (progressing from application, toinvitation for an interview, to job offer, as was done by Bovenkerk, Gras and Ramsoedh,1995, for Moroccan versus Dutch male applicants for semiskilled jobs). Hence our esti-mates are probably an underestimate of the extent of discrimination in the labour market.Moreover, as Pager et al. (2009, p. 793) note, the emphasis on jobs advertised through theonline job site also probably understates the extent of discrimination, since firms wantingto discriminate may be more likely to use informal networks.Yet in spite of these caveats, our findings are important, since our study is one of the first
to compare multiple groups of immigrants in a country in which one in four individuals areborn overseas. As noted at the start of section II, these groups range from earlier intakes ofItalians to more recent intakes of Chinese and Middle Eastern individuals, as immigrationpolicy inAustralia has been progressively relaxed to admit immigrants from more diversebackgrounds. In a stark reminder of how far our country has yet to go, we have found clearevidence of discrimination against ethnic minorities – especially the more recently admit-ted groups–at the initial stage of the job-finding process. But what explains this prejudice?The higher rate of discrimination in the most customer-focused job (waitstaff) is consistentwith some degree of customer-based discrimination. However, the fact that we observediscrimination in an occupation requiring no direct customer contact (data entry) suggeststhat customer discrimination is not the whole story. Other alternatives could include taste-based discrimination (on the part of co-workers or employers) or statistical discrimination.We have not been able to distinguish between these two broad hypotheses, in commonwith the vast majority of other studies investigating this issue with a variety of differ-ent methodologies. We suspect it is a bit of both: statistical discrimination in the face ofuncertainty and the conservative tastes of the majority group revealed by attitudinal surveyevidence.In audit or correspondence studies,fictitious individualswho are identical in all respects
apart from the one of interest apply for jobs. Audit studies have been criticized on numer-ous grounds including whether or not the applicants from different groups actually appearidentical to employers. In response to these criticisms, correspondence studies substitutefictitious online or paper applications for fictitious personal candidates, thereby reducingpotential heterogeneity in unobservables. This was the approach followed in this paper.However, correspondence studies are still vulnerable to the critique of Heckman andSiegelman (1993), who show that, if the distribution of unobservable productivity-relevant attributes of the various groups differ, the correspondence studies may produceover or under-estimation of discrimination. This is an important argument that we have not
© Blackwell Publishing Ltd and the Department of Economics, University of Oxford 2011

568 Bulletin
been able to address in our study. Neumark (2010) shows that – if correspondence studiesexplicitly include variations in applicant quality, an unbiased estimate of discriminationcan be uncovered. It is interesting to note that Neumark (2010) applied his technique to thecorrespondence study of Bertrand and Mullainathan (2004), and showed that their mea-sured discrimination was actually an under-estimate. Since our experiment did not revealsystematic returns to applicant quality, Neumark’s procedure is not open to us. However,in future work we hope to pursue this line of research.
Final Manuscript Received: May 2011
ReferencesArrow, K. J. (1998). ‘What has economics to say about racial discrimination?’ The Journal of EconomicPerspectives, Vol. 12, pp. 91–100.
Australian Bureau of Statistics (ABS) (2009). Employee Earnings and Hours, Cat No 6306.0, ABS, Canberra.Becker, G. S. (1971). The Economics of Discrimination, The University of Chicago Press, Chicago.Berman, G. and The Victorian Equal Opportunity & Human Rights Commission (2008). Harnessing diver-sity: addressing racial and religious discrimination in employment. A collaborative project between theVictorian Multicultural Commission and the Victorian Equal Opportunity & Human Rights Commission,Victorian Equal Opportunity & Human Rights Commission, Melbourne.
Bertrand, M. and Mullainathan, S. (2004). ‘Are Emily and Greg more employable than Lakisha and Jamal:a field experiment on labor market discrimination’, American Economic Review, Vol. 94, pp. 991–1013.
Booth, A. L. and Leigh, A. (2010). ‘Do employers discriminate by gender?Afield experiment in female-dom-inated occupations’, Economics Letters, Vol. 107, pp. 236–238.
Bovenkerk, F., Kilborne, B., Raveau, F. and Smith, D. (1979). ‘Comparative aspects of research on discrim-ination against non-white citizens in Great Britain, France and the Netherlands’, in Berting J., Geyer F.and Jurkovich R. (eds), Problems in International Comparative Research in the Social Sciences, Oxford:Pergamon Press, pp. 105–122.
Bovenkerk, F., Gras, M. and Ramsoedh, D. (1995). Discrimination Against Migrant Workers and EthnicMinorities in Access to Employment in the Netherlands, International Migration Papers 4, ILO, Geneva.
Brown, C. and Gay, P. (1985). Racial Discrimination 17 Years After the Act, Policy Studies Institute, London.Bursell, M. (2007). What’s in a Name? A Field Experiment Test for the Existence of Ethnic Discriminationin the Hiring Process, Working Paper 2007:7, The Stockholm University Linnaeus Center for IntegrationStudies, Stockholm.
Carlsson, M. and Rooth, D.-O. (2007). ‘Evidence of ethnic discrimination in the Swedish labour market usingexperimental data’, Labour Economics, Vol. 14, pp. 716–729.
Cobb-Clark, D. A. (2003). ‘Public policy and the labour market adjustment of new immigrants to Australia’,Journal of Population Economics, Vol. 16, pp. 655–681.
Dunn, K. (2003). Racism in Australia: Findings of a Survey on Racist Attitudes and Experiences of Racism,National Europe Centre Paper No. 77, The University of New South Wales, Sydney.
Eagly,A. H. andKite,M. E. (1987). ‘Are stereotypes of nationalities applied to both women andmen?’Journalof Personality and Social Psychology, Vol. 53, pp. 451–462.
Esmail, A. and Everington, S. (1993). ‘Racial discrimination against doctors from ethnic minorities’, BritishMedical Journal, Vol. 306, pp. 691–692.
Esmail, A. and Everington, S. (1997). ‘Asian doctors are still being discriminated against’, British MedicalJournal, Vol. 314, p. 1619.
Firth, M. (1981). ‘Racial discrimination in the British labour market’, Industrial and Labor Relations Review,Vol. 34, pp. 265–272.
Forrest, J. and Dunn, K. (2007). Strangers in our midst? Intolerance and discrimination toward minoritycultural groups in Victoria. Report to VicHealth.
© Blackwell Publishing Ltd and the Department of Economics, University of Oxford 2011

Discrimination across minority groups 569
Goldberg, A., Mourinho, D. and Kulke, U. (1996). Labour Market Discrimination Against ForeignWorkers in Germany, International Migration Papers 7, ILO, Geneva. Available at: http://www.ilo.org/public/english/protection/migrant/equality/discrimination/evidence.htm
Hatton, T. J. (2005). ‘Explaining trends in UK immigration’, Journal of Population Economics, Vol. 18, pp.719–740.
Heckman, J. (1998). ‘Detecting discrimination’, Journal of Economic Perspectives, Vol. 12, pp. 101–116.Heckman, J. and Siegelman, P. (1993). ‘The Urban Institute audit studies: Their methods and findings’, inFix M. and Struyk R. J. (eds), Clear and convincing evidence: Measurement of Discrimination in America,Washington, DC: Urban Institute Press, pp. 187–258.
Hubbuck, J. and Carter, S. (1980). Half a Chance? A Report on Job Discrimination against Young Blacks inNottingham, Commission for Racial Equality, London.
Issues Deliberation Australia (2007). ‘The voice Of Australians: a national random sample survey of theAustralian population’, in Australia Deliberates: Muslims And Non-Muslims In Australia. Available at:http://www.ida.org.au/publications.php (accessed 22 June 2011).
Jowell, R. and Prescott-Clarke, P. (1970). ‘Racial discrimination and white-collar workers in Britain’, Race,Vol. 11, pp. 397–417.
Kabir, N. and Evans, E. (2002). ‘Muslims and the Australian labour market, 1980–2001’, Immigrants andMinorities, Vol. 21, pp. 70–95
Leigh, A. (2007). ‘Does raising the minimum wage help the poor?’ Economic Record, Vol. 83, pp. 432–445.
Mahuteau, S. and Junankar, P. N. (2008). ‘Do migrants get good jobs inAustralia? The role of ethnic networksin job search’, Economic Record, Vol. 84, pp. S115–S130.
Mateos, P., Webber, R. and Longley, P. (2007). The Cultural, Ethnic and Linguistic Classification of Popula-tions and Neighbourhoods using Personal Names, CASAWorking Paper 116, Centre for Advanced SpatialAnalysis, University College London, London.
Mateos, P. (2007). ‘A review of name-based ethnicity classification methods and their potential in populationstudies’, Population Space and Place, Vol. 13, pp. 243–263.
McGinnity, F., Nelson, J., Lunn, P. and Quinn, E. (2009). Discrimination in Recruitment: evidence from aField Experiment, The Equality Authority and The Economic and Social Research Institute, Dublin.
Neumark, D. (2010). Detecting Discrimination in Audit and Correspondence Studies, NBER Working Paper16448, NBER, Cambridge, MA.
McIntosh, N. and Smith, D. (1974). The Extent of Racial Discrimination, Political and Economic PlanningBroadsheet no. 547, Political and Economic Planning, London.
Oreopoulos, P. (2009). Why Do Skilled Immigrants Struggle in the Labor Market? A Field Experiment withSix Thousand Resumes, NBERWorking Paper No. 15036, NBER, Cambridge, MA.
Pager D. (2003). ‘The mark of a criminal record’, American Journal of Sociology, Vol. 108, pp. 937–975.Pager, D. (2007). ‘The use of field experiments for studies of employment discrimination: Contributions, cri-tiques, and directions for the future’, The ANNALS of the American Academy of Political and Social Science,Vol. 609, pp. 104–133.
Pager, D., Western, B. and Bonikowski, B. (2009). ‘Discrimination in a low-wage labor market: A FieldExperiment’, American Sociological Review, Vol. 74(5), 777–779.
Poynting, S. and Noble, G. (2004). Living with Racism: The Experience and Reporting by Arab and MuslimAustralians of Discrimination, Abuse and Violence Since 11 September 2001. Report to The Human Rightsand Equal Opportunity Commission, University of Western Sydney, Sydney.
Riach, P. and Rich, J. (1991). ‘Testing for racial discrimination in the labour market’, Cambridge Journalof Economics, Vol. 15, pp. 239–256.
Riach, P. and Rich, J. (2002). ‘Field experiments of discrimination in the market place’, Economic Journal,Vol. 112, pp. F480–F518.
Riach, P. and Rich, J. (2004). ‘Deceptive field experiments of discrimination: are they ethical?’ Kyklos, Vol.57, pp. 457–470.
Walker, I. (2001). ‘The changing nature of racism: from old to new?’ in Augoustinos M. and Reynolds K.(eds), Understanding Prejudice, Racism and Social Conflict, London: Sage, pp. 24–42.
© Blackwell Publishing Ltd and the Department of Economics, University of Oxford 2011
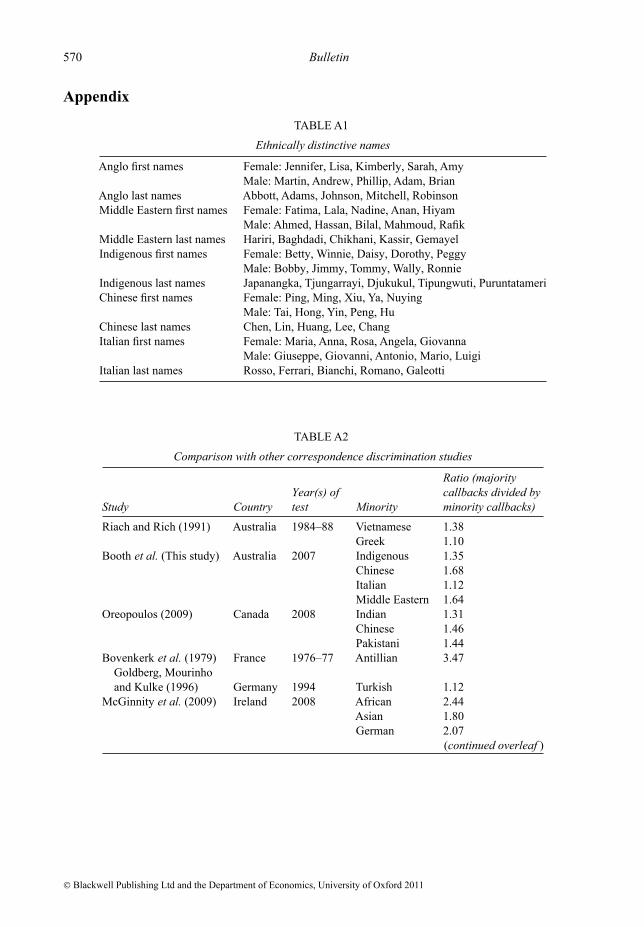
570 Bulletin
Appendix
TABLEA1
Ethnically distinctive names
Anglo first names Female: Jennifer, Lisa, Kimberly, Sarah, AmyMale: Martin, Andrew, Phillip, Adam, Brian
Anglo last names Abbott, Adams, Johnson, Mitchell, RobinsonMiddle Eastern first names Female: Fatima, Lala, Nadine, Anan, Hiyam
Male: Ahmed, Hassan, Bilal, Mahmoud, RafikMiddle Eastern last names Hariri, Baghdadi, Chikhani, Kassir, GemayelIndigenous first names Female: Betty, Winnie, Daisy, Dorothy, Peggy
Male: Bobby, Jimmy, Tommy, Wally, RonnieIndigenous last names Japanangka, Tjungarrayi, Djukukul, Tipungwuti, PuruntatameriChinese first names Female: Ping, Ming, Xiu, Ya, Nuying
Male: Tai, Hong, Yin, Peng, HuChinese last names Chen, Lin, Huang, Lee, ChangItalian first names Female: Maria, Anna, Rosa, Angela, Giovanna
Male: Giuseppe, Giovanni, Antonio, Mario, LuigiItalian last names Rosso, Ferrari, Bianchi, Romano, Galeotti
TABLEA2
Comparison with other correspondence discrimination studies
Ratio (majorityYear(s) of callbacks divided by
Study Country test Minority minority callbacks)Riach and Rich (1991) Australia 1984–88 Vietnamese 1.38
Greek 1.10Booth et al. (This study) Australia 2007 Indigenous 1.35
Chinese 1.68Italian 1.12Middle Eastern 1.64
Oreopoulos (2009) Canada 2008 Indian 1.31Chinese 1.46Pakistani 1.44
Bovenkerk et al. (1979) France 1976–77 Antillian 3.47Goldberg, Mourinhoand Kulke (1996) Germany 1994 Turkish 1.12
McGinnity et al. (2009) Ireland 2008 African 2.44Asian 1.80German 2.07
(continued overleaf )
© Blackwell Publishing Ltd and the Department of Economics, University of Oxford 2011

Discrimination across minority groups 571
TABLEA2
(Continued)
Ratio (majorityYear(s) of callbacks divided by
Study Country test Minority minority callbacks)Bovenkerk et al. (1995) Netherlands 1993–94 Surinamese 1.22Carlsson and Rooth (2007) Sweden 2005–06 Middle Eastern 1.50Bursell (2007) Sweden 2006–07 Arabic/African 1.80Jowell and Prescott-Clarke (1970) UK 1969 Asian 2.08
West Indian 1.13McIntosh and Smith (1974) UK 1973 Asian /West Indian 1.47
Italian 1.12Firth (1981) UK 1977–78 Asian 1.95
West Indian 1.76Australian 1.14French 1.25African 1.60
Hubbuck and Carter (1980) UK 1977–79 Asian 1.80West Indian 1.81Italian 1.12
Brown and Gay (1985) UK 1984–85 Asian/West Indian 1.49Esmail and Everington (1993) UK 1992 Asian 2.00Esmail and Everington (1997) UK 1997 Asian 1.44Bertrand and Mullainathan (2004) US 2001–02 African-American 1.50
Notes: All studies dated before 2000 (except Goldberg et al. 1996) are summarized in Riach and Rich (2002).Note that Jowell and Prescott-Clarke (1970) changed not only the names but also the qualifications. For Bovenkerket al. (1995), we take the average of the estimate for Surinamese males (1.27) and females (1.17). Estimates fromOreopoulos (2009) are based on respondents with Canadian qualifications and experience. Note that we summarizeonly estimates from correspondence studies, and not those in which actors contacted employers in person or bytelephone.
© Blackwell Publishing Ltd and the Department of Economics, University of Oxford 2011
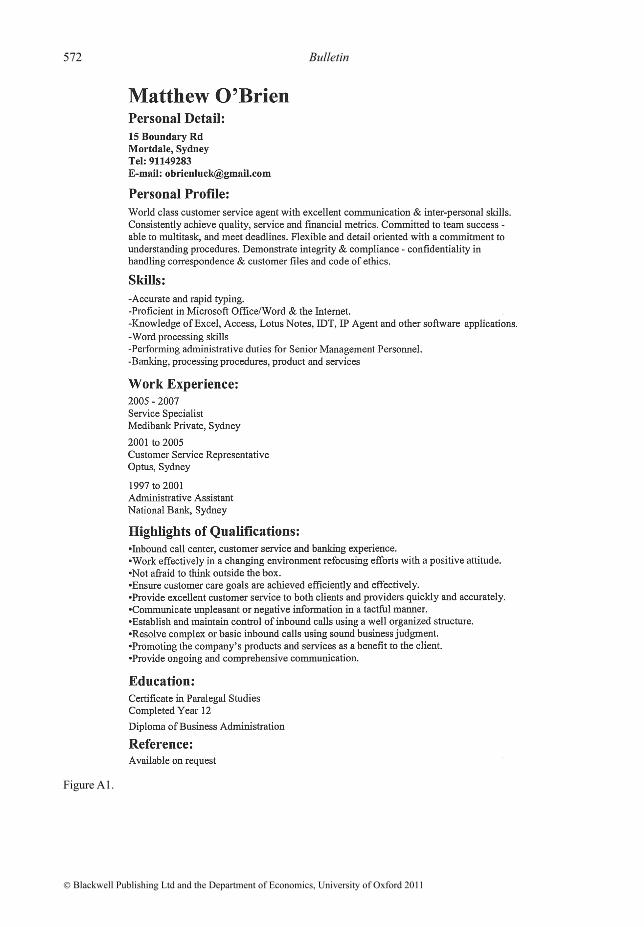
572 Bulletin
Figure A1.
© Blackwell Publishing Ltd and the Department of Economics, University of Oxford 2011

Discrimination across minority groups 573
Figure A2.
© Blackwell Publishing Ltd and the Department of Economics, University of Oxford 2011