does e-government improve government capacity? evidence ... · does e-government improve government...
TRANSCRIPT

Introduction and motivation Empirical strategy Results Conclusion
Does e-government improve governmentcapacity? Evidence from tax compliance cost,
tax revenue and public procurementcompetitiveness
Anna Kochanova,∗ Zahid Hasnain∗∗ & Bradley Larson ∗∗
∗Max Planck Institute for Research on Collective Goods, Bonn
∗∗The World Bank, Washington, DC
WIDER Development Conference, Maputo
July 5-6, 2017

Introduction and motivation Empirical strategy Results Conclusion
MOTIVATION
I Many countries lack capacities to raise and spend fiscalresources effectively (Besley and Persson, 2010)
I High tax compliance costs deter investment, encourage taxevasion, and undermine economic growth (Djankov et al.,2006; Coolidge, 2012; Alm et al. 2016)
I Public procurement is often rife with collusive practicesand corruption, resulting in the misallocation of resources(Auriol, 2016; Center for Global Development, 2014)
I Many countries have invested in ICT and e-government over thelast two decades
I But very little is known about the returns on suchinvestments

Introduction and motivation Empirical strategy Results Conclusion
OVERVIEW
I Whether the use of ICT by government (e-government) canstrengthen governments capacity to raise and spend fiscalresources?
I E-filing of taxes→ tax compliance costs, tax revenue,corruption
I E-procurement→ public procurement competitiveness,corruption
I Approach: Difference-in-difference
I Result:
I E-filing adoption reduces tax compliance costs; mixedresults on tax revenue; almost no effect on bribes
I E-procurement adoption increases the likelihood of biddingby firms and reduces corruption only in more developedcountries

Introduction and motivation Empirical strategy Results Conclusion
MECHANISMSI E-filing of taxes
I reduce time and resources spent on gathering informationto file taxes
I reduce errors in filing tax forms, delays in submitting taxforms and receiving tax refunds
I reduce face-to-face interactions with tax officials
I E-procurement
I more widely available and transparent informationI reduce the costs of submitting bidsI attract bidders of higher quality and from outside of
existing collusive cartels
I E-government initiative may fail if countries lack human capital,technology, and good institutions to exploit the advantages ofICT (Yilmaz and Coolidge, 2013; Lewis-Faupel et al., 2016; Heeks,2005)

Introduction and motivation Empirical strategy Results Conclusion
LITERATURE
I ICT and various outcomes: development, health, financialinclusion, industry competition and aggregate economicperformance
I Empirical research on the impact of e-government is scarce
I Electronic machines to record sales transactions improvedtax compliance and raised revenue in Ethiopia and Rwanda(Ali et al., 2014; Eissa and Zeitlin, 2014)
I E-filing of taxes significantly reduced tax compliance costsfor firms in South Africa, but not in Ukraine or Nepal(Yilmaz and Coolidge, 2013)
I E-procurement increased the amount of markettransactions and improved supply chain management inseveral European countries (Nepelski, 2006)
I E-procurement reduced prices of contracts and governmentadministrative costs in Chile (Singer et al., 2009)

Introduction and motivation Empirical strategy Results Conclusion
LITERATURE
I Empirical research on the impact of e-government is scarce
I E-procurement in India and Indonesia improved the qualityof public infrastructure projects (Lewis-Faupel et al., 2016)
I Biometric registration, authentication, and paymentsystems reduced corruption and inefficiencies ingovernment workfare in India (Muralidharan et al., 2014and Barnwal, 2014)
I E-government reduces fiscal leakages, but does notnecessarily improve outcomes of public programs in oneIndian state (Banerjee et al., 2014)
I Importance of organizational changes within firms (Bresnahan etal., 2002; Brynjolfsson and Hitt, 2000) or in public sector(Garicano and Heaton, 2010; Seri and Zenfei, 2013) to reap thebenefits of ICT
Introduction and motivation Empirical strategy Results Conclusion
DATA
I Global e-Government Systems Database (World DevelopmentReport 2016: Digital Dividends)
I E-filing adoption dates: transactional systems andtransactional with e-payment functionality systems
I E-procurement adoption dates: informational, transactionaland connected systems [graph]
I Doing Business Database (2004 - 2014):
I Time required to prepare and pay taxesI Proxy for reform pace: PCA of several doing business
indicators
I World Revenue Longitudinal Dataset:
I Income tax revenue to GDP ratioI Goods and services tax revenue to GDP ratio
Introduction and motivation Empirical strategy Results Conclusion
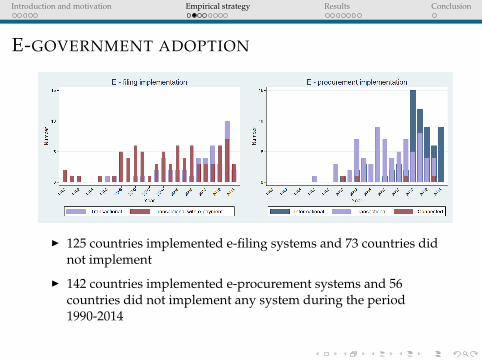
E-GOVERNMENT ADOPTION
I 125 countries implemented e-filing systems and 73 countries didnot implement
I 142 countries implemented e-procurement systems and 56countries did not implement any system during the period1990-2014

Introduction and motivation Empirical strategy Results Conclusion
DATA
I World Bank Enterprise Surveys (WBES) (at least 2 waves percountry, 2006 - 2015)
I whether the firm was visited or inspected by tax officialsI the frequency of such visitsI whether a gift or informal payment was expected or
requested in any of the inspectionsI the extent to which tax administration is perceived as an
obstacle to business operations
I whether the firm has secured or attempted to secure agovernment contract over the last year
I whether the firm had to pay a bribe to get the contract

Introduction and motivation Empirical strategy Results Conclusion
DATA
I World Development Indicators Database
I GDP per capita in PPP termsI Number of internet uses per capitaI Secondary school enrolment
I World Governance Indicators Database
I Rule of law, government efficiency
I Polity IV Database
I Polity score
I Heritage Foundation
I Business freedom

Introduction and motivation Empirical strategy Results Conclusion
METHOD / IDENTIFICATION
I Difference-in-difference method in a fixed effects regressionframework
I Control group: countries that have never implementede-government AND those that implemented before the sampleperiod [graph]
I Solution: individual-specific trends for countries thatadopted earlier
I Assumption #1 of DID: the control and treated groups havesimilar trends in the outcome variable prior to treatment
I Solution: test if pre-treatment effects are zero (Autor, 2003)
I Assumption #2 of DID: e-government implementation dates areexogenous
I Solution: control for time-varying variables (GDP, Polity,Reform); full set of region-time fixed effects

Introduction and motivation Empirical strategy Results Conclusion
TIME TO PREPARE AND PAY TAXES

Introduction and motivation Empirical strategy Results Conclusion
EMPIRICAL SPECIFICATIONCountry-level specification:
yct =5∑
n=−4
α1,−nEgov2ct−n +5∑
n=−4
α2,−nEgov3ct−n + βXct+
+ηc + λt + νr × λt + ec × t + εct
I yct - outcome variableI for n < 0, Egov2ct−n (Egov3ct−n) is an indicator for an observation
taking place |n| years before the adoption of a transactionale-filing system (with e-payment functionality)
I for n ≥ 0, Egov2ct−n (Egov3ct−n) is an indicator for an observationtaking place n years after the adoption of a transactional e-filingsystem (with e-payment functionality)
I Xct - logarithm of GDP per capita (PPP), Polity, Reform indexI ηc - country fixed effects; λt - time fixed effects; νr - region fixed
effects; ec - earlier adopters; t - time trend

Introduction and motivation Empirical strategy Results Conclusion
EMPIRICAL SPECIFICATION
Firm-level specification:
yict = α1Egov2ct + α2Egov3ct + βXct + γZict + µs + ηc + λt + ec × t + εict
I yict - outcome variableI Egov2 - indicator for transactional (e-filing) / informational
(e-procurement)I Egov3 - indicator for transactional with e-payment (e-filing) /
transactional (e-procurement)I Zict - firm-level characteristicsI µs - sector fixed effectsI εct and εict are clustered at the country level
Introduction and motivation Empirical strategy Results Conclusion
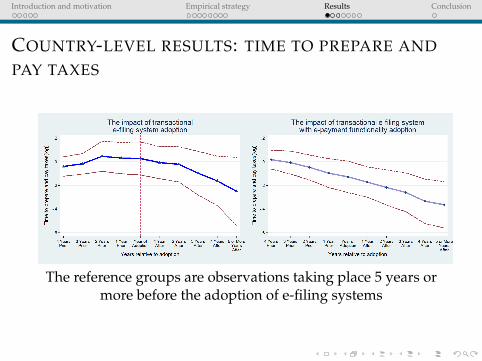
COUNTRY-LEVEL RESULTS: TIME TO PREPARE AND
PAY TAXES
The reference groups are observations taking place 5 years ormore before the adoption of e-filing systems

Introduction and motivation Empirical strategy Results Conclusion
COUNTRY-LEVEL RESULTS: INCOME TAX REVENUE TO
GDP RATIO
The reference groups are observations taking place 5 years ormore before the adoption of e-filing systems

Introduction and motivation Empirical strategy Results Conclusion
COUNTRY-LEVEL RESULTS: GOODS AND SERVICES TAX
REVENUE TO GDP RATIO
The reference groups are observations taking place 5 years ormore before the adoption of e-filing systems

Introduction and motivation Empirical strategy Results Conclusion
COUNTRY- AND FIRM-LEVEL RESULTS
Tax Income Goods Tax Tax Tax Tax Proc. Proc.time tax tax visit visit N obstacle bribe bribe
E-filing2 0.025 0.746** 0.226 -0.075* -0.111* -0.043 -0.047(0.047) (0.300) (0.339) (0.044) (0.058) (0.087) (0.053)
E-filing3 -0.124*** 0.200 -0.647** -0.033 -0.062# -0.140*** 0.075***(0.047) (0.227) (0.275) (0.050) (0.041) (0.052) (0.025)
E-proc.2 0.001 -0.060(0.037) (0.073)
E-proc.3 -0.020 0.058(0.027) (0.046)
Controls YES YES YES YES YES YES YES YES YESN obs 1,626 1,226 1,217 67,655 37,227 68,144 39,860 40,588 5,983N count 150 127 126 68 68 68 68 44 44R2 w/adj 0.413 0.304 0.251 0.153 0.231 0.099 0.156 0.099 0.158
All fixed effects are included. Standard errors are clustered at the country level
*** <0.01, ** <0.05, *<0.1, #<0.15

Introduction and motivation Empirical strategy Results Conclusion
FIRM-LEVEL RESULTS, ECA REGION, FIRM FIXED
EFFECTS
Tax visit Tax visit Tax Tax Procurement Procurementnumber obstacle bribe bribe
E-filing2 -0.020 -0.073 -0.010 -0.137**(0.036) (0.090) (0.171) (0.044)
E-filing3 -0.140** -0.218** -0.159 -0.123**(0.041) (0.090) (0.121) (0.041)
E-procurement2 0.075* -0.200(0.044) (0.234)
E-procurement3 0.055* 0.005(0.027) (0.054)
Controls YES YES YES YES YES YESN obs 20,477 10,592 20,614 11,495 20,417 3,661N countries 29 29 29 29 29 29R2 adjusted 0.055 0.084 0.153 0.094 0.025 0.209
All fixed effects are included. Standard errors are clustered at the country level
*** <0.01, ** <0.05, *<0.1, #<0.15
Introduction and motivation Empirical strategy Results Conclusion
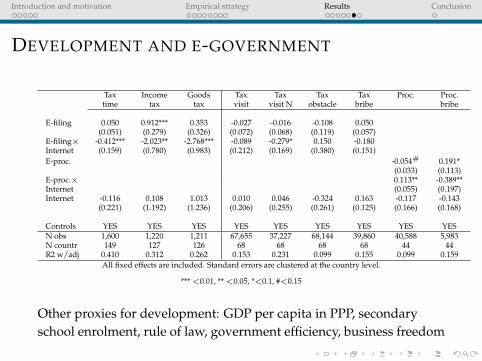
DEVELOPMENT AND E-GOVERNMENT
Tax Income Goods Tax Tax Tax Tax Proc. Proc.time tax tax visit visit N obstacle bribe bribe
E-filing 0.050 0.912*** 0.353 -0.027 -0.016 -0.108 0.050(0.051) (0.279) (0.326) (0.072) (0.068) (0.119) (0.057)
E-filing× -0.412*** -2.023** -2.768*** -0.089 -0.279* 0.150 -0.180Internet (0.159) (0.780) (0.983) (0.212) (0.169) (0.380) (0.151)E-proc. -0.054# 0.191*
(0.033) (0.113)E-proc.× 0.113** -0.389**Internet (0.055) (0.197)Internet -0.116 0.108 1.013 0.010 0.046 -0.324 0.163 -0.117 -0.143
(0.221) (1.192) (1.236) (0.206) (0.255) (0.261) (0.125) (0.166) (0.168)
Controls YES YES YES YES YES YES YES YES YESN obs 1,600 1,220 1,211 67,655 37,227 68,144 39,860 40,588 5,983N countr 149 127 126 68 68 68 68 44 44R2 w/adj 0.410 0.312 0.262 0.153 0.231 0.099 0.155 0.099 0.159
All fixed effects are included. Standard errors are clustered at the country level.
*** <0.01, ** <0.05, *<0.1, #<0.15
Other proxies for development: GDP per capita in PPP, secondaryschool enrolment, rule of law, government efficiency, business freedom
Introduction and motivation Empirical strategy Results Conclusion
ROBUSTNESS CHECKS
I Drop region-specific shocks from specification
I Drop individual-specific trends for countries earlier adopters
I Drop countries earlier adopters
I “Balanced sample” - restrict the sample of countries to those thatimplemented e-filing systems during the 2006-2012 period, andexclude those that implemented in 2004-2005 and 2013-2014
I Falsification/placebo tests, by randomly assigning years ofe-government implementation to a group of random countries

Introduction and motivation Empirical strategy Results Conclusion
CONCLUSION
I We assess the impact of e-government adoption on public sectorcapacity to raise and spend resources across countries
I e-filing of taxes and tax compliance costs, tax revenue
I e-procurement and public procurement competitiveness
I We show that e-government can improve government capacity
I but the estimated effects vary by the type and functionalityof e-government systems adopted
I country context