does a student’s use - montana state university
TRANSCRIPT

DOES A STUDENT’S USE
OF SELF-REGULATION CHANGE IN
THE FLIPPED CLASSROOM?
by
Denise Marie Elakovich
A dissertation submitted in partial fulfillment
of the requirements for the degree
of
Doctor of Education
in
Education
MONTANA STATE UNIVERSITY
Bozeman, Montana
April 2018
©COPYRIGHT
by
Denise Marie Elakovich
2018
All Rights Reserved

ii
TABLE OF CONTENTS
1. INTRODUCTION TO THE STUDY ..............................................................................1
Introduction ......................................................................................................................1
Context .............................................................................................................................8
Statement of Problem .......................................................................................................8
Purpose Statement ............................................................................................................9
Significance of the Study ...............................................................................................11
Theoretical Framework ..................................................................................................11
Research Design.............................................................................................................14
Operational Definitions ..................................................................................................15
Data Analysis ................................................................................................................16
Summary ........................................................................................................................16
2. LITERATURE REVIEW ..............................................................................................18
Introduction ...................................................................................................................18
Theoretical Framework: Self-Regulation .....................................................................19
Lecture versus Flipped Model Classrooms ..............................................................26
Models of a Flipped Classroom ...............................................................................33
MSLQ ......................................................................................................................35
Summary ..................................................................................................................36
3. METHODOLOGY .......................................................................................................38
Introduction…………………………………………………………………………...38
Context of the Study .....................................................................................................41
Research Design............................................................................................................47
Setting ...........................................................................................................................47
Data Collection Procedures...........................................................................................50
Sample Population ........................................................................................................51
Group Equivalence........................................................................................................57
Instrument Overview ....................................................................................................57
MSLQ Survey ..........................................................................................................58
Validity and Reliability of the Original MSLQ Survey ...........................................58
ACT COMPASS Placement Test ............................................................................62
Variables .......................................................................................................................63

iii
TABLE OF CONTENTS CONTINUED
Data Analysis ...........................................................................................................68
External Validity ......................................................................................................69
Internal Validity .......................................................................................................70
Summary ......................................................................................................................71
4. RESULTS .....................................................................................................................73
Introduction…………………………………………………………………………...73
Descriptive Data Results ..............................................................................................75
Student Characteristics.............................................................................................75
Prior Academic Experience .....................................................................................77
Dependent Variables ................................................................................................80
Regression Analysis of Variables ............................................................................85
Summary of Results ...............................................................................................101
5. CONCLUSIONS.........................................................................................................106
Introduction .................................................................................................................106
Overview of Study ......................................................................................................106
Methodology ...............................................................................................................108
Discussion of Research Results .............................................................................110
Research Question #1 ............................................................................................111
Research Question #2 ............................................................................................114
Research Question #3 ............................................................................................115
Research Question #4 ............................................................................................116
Research Question #5 ............................................................................................117
Research Question #6 ............................................................................................119
Research Question #7 ............................................................................................120
Research Question #8 ............................................................................................122
Instructor Reflections of the Flipped Classroom ........................................................123
Recommendations from Study ....................................................................................125
Recommendation #1 ..............................................................................................126
Recommendation #2 ..............................................................................................127
Recommendation #3 ..............................................................................................128
Limitation of Study .....................................................................................................129
Recommendations for Future Research ......................................................................130
Conclusions .................................................................................................................131
iv
TABLE OF CONTENTS CONTINUED
REFERENCES CITED ....................................................................................................136
APPENDICES .................................................................................................................142
APPENDIX A: Motivated Student Learning Questionnaire ..................................143
APPENDIX B: Observations ..................................................................................151
v
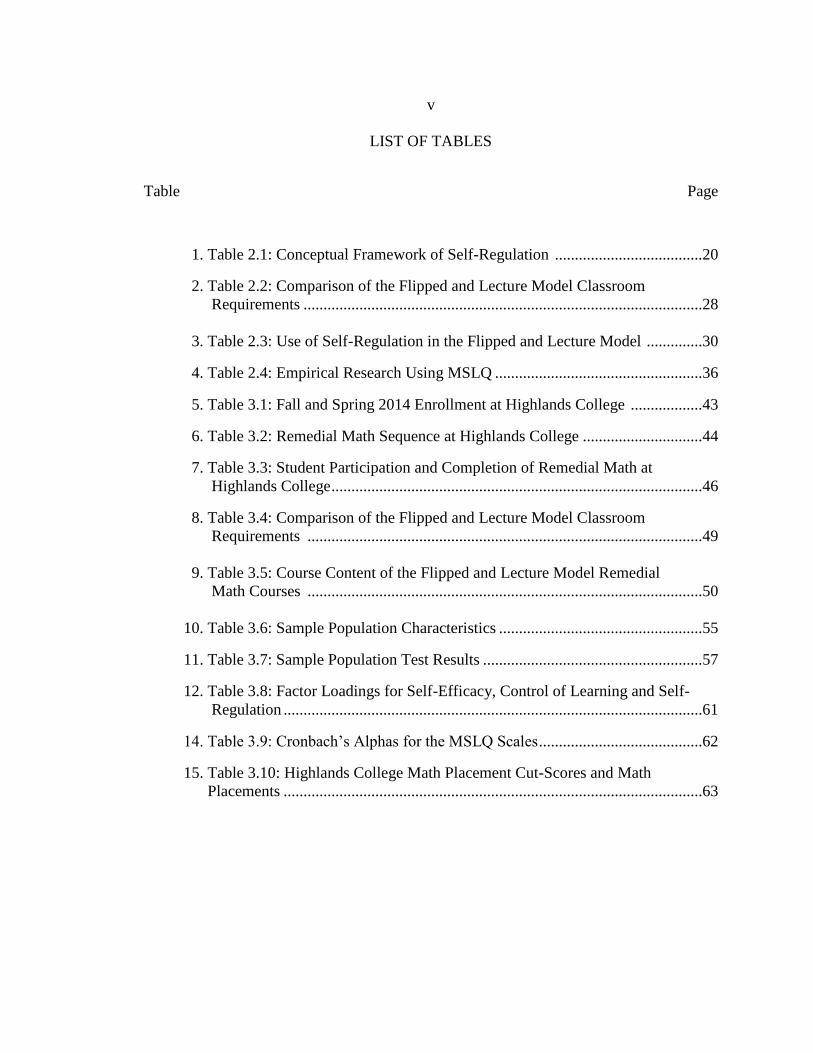
LIST OF TABLES
Table Page
1. Table 2.1: Conceptual Framework of Self-Regulation .....................................20
2. Table 2.2: Comparison of the Flipped and Lecture Model Classroom
Requirements ....................................................................................................28
3. Table 2.3: Use of Self-Regulation in the Flipped and Lecture Model ..............30
4. Table 2.4: Empirical Research Using MSLQ ....................................................36
5. Table 3.1: Fall and Spring 2014 Enrollment at Highlands College ..................43
6. Table 3.2: Remedial Math Sequence at Highlands College ..............................44
7. Table 3.3: Student Participation and Completion of Remedial Math at
Highlands College .............................................................................................46
8. Table 3.4: Comparison of the Flipped and Lecture Model Classroom
Requirements ...................................................................................................49
9. Table 3.5: Course Content of the Flipped and Lecture Model Remedial
Math Courses ...................................................................................................50
10. Table 3.6: Sample Population Characteristics ...................................................55
11. Table 3.7: Sample Population Test Results .......................................................57
12. Table 3.8: Factor Loadings for Self-Efficacy, Control of Learning and Self-
Regulation .........................................................................................................61
14. Table 3.9: Cronbach’s Alphas for the MSLQ Scales .........................................62
15. Table 3.10: Highlands College Math Placement Cut-Scores and Math
Placements .........................................................................................................63
vi
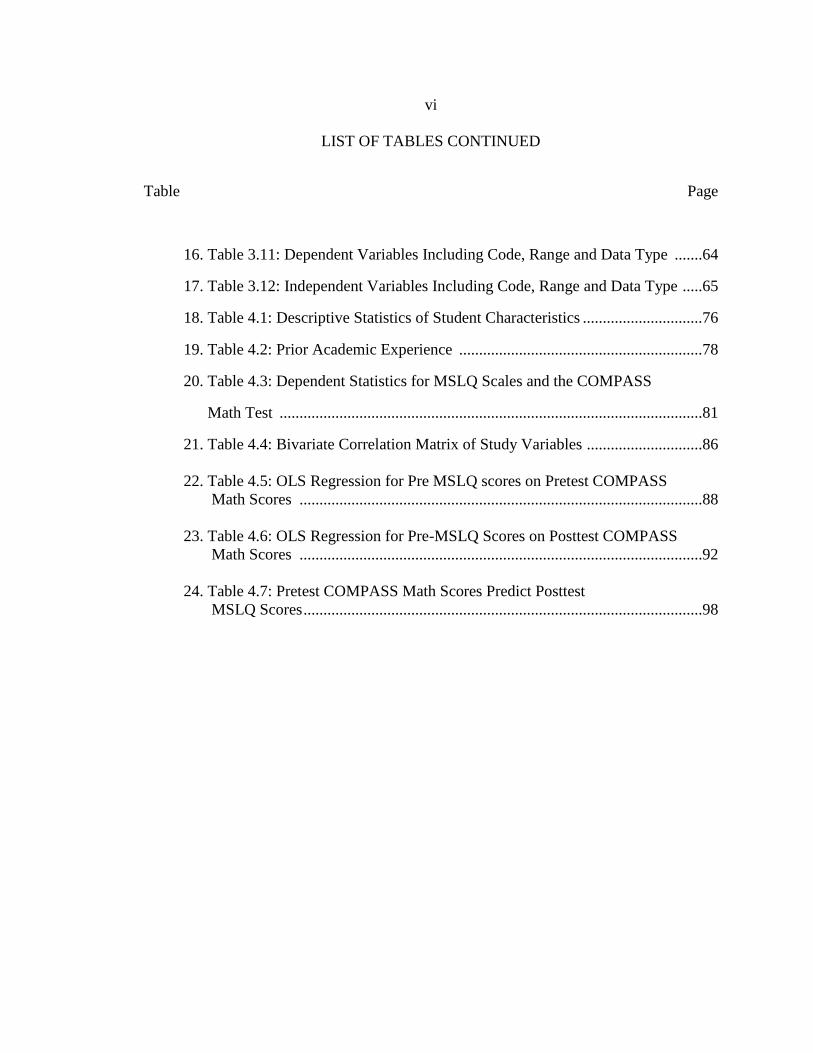
LIST OF TABLES CONTINUED
Table Page
16. Table 3.11: Dependent Variables Including Code, Range and Data Type .......64
17. Table 3.12: Independent Variables Including Code, Range and Data Type .....65
18. Table 4.1: Descriptive Statistics of Student Characteristics ..............................76
19. Table 4.2: Prior Academic Experience .............................................................78
20. Table 4.3: Dependent Statistics for MSLQ Scales and the COMPASS
Math Test ..........................................................................................................81
21. Table 4.4: Bivariate Correlation Matrix of Study Variables .............................86
22. Table 4.5: OLS Regression for Pre MSLQ scores on Pretest COMPASS
Math Scores .....................................................................................................88
23. Table 4.6: OLS Regression for Pre-MSLQ Scores on Posttest COMPASS
Math Scores .....................................................................................................92
24. Table 4.7: Pretest COMPASS Math Scores Predict Posttest
MSLQ Scores ....................................................................................................98

vii
LIST OF FIGURES
Figure Page
1. Theoretical Framework………………………………………………………12

viii
ABSTRACT
Many college freshmen are required to enroll in remedial math every semester as a
result of low college placement exams with many of these students failing to succeed in
their remedial math courses. Students may fail their remedial math course due to low
levels of control of learning, self-efficacy or self-regulation. The purpose of this study
was to investigate if the flipped classroom is an effective teaching method for students in
a remedial math course and if this method increases a student’s control of learning, self-
efficacy and self-regulation.
This study implemented a quasi-experimental design to compare students in a flipped
remedial math class to students in a lecture remedial math class using the Motivated
Strategies Learning Questionnaire (MSLQ) designed by Pintrich (1991) to measure
control of learning, self-efficacy and self-regulation. Data analyses included frequency
data to report the descriptive statistics of students in remedial math; independent t-tests to
report significant differences of MSLQ scores and posttest COMPASS math scores; and
multiple regressions to report associations among dependent and independent variables in
the study.
The results found no significant difference for control of learning, self-efficacy, or self-
regulation of students in the flipped classroom compared to students in the lecture
classroom. A significant difference at ρ < .10 was found for math outcomes for students
in the flipped classroom compared to students in the lecture classroom. The findings also
indicate a small net effect for control of learning, self-efficacy and self-regulation on
math placement as well as math outcomes for students in a remedial math course. Also, a
student’s self-efficacy at the end of the course was predicted by a student’s level of self-
efficacy and prior academic knowledge at the start of the semester.
In conclusion, the findings of this study suggest that the flipped classroom is an
effective teaching method to use in a remedial math class. Limitations of this study
include a small sample size as well as validity and reliability concerns with the use of the
MSLQ survey suggesting further research is needed to investigate the effectiveness of the
flipped classroom in a remedial math class.

1
CHAPTER ONE
INTRODUCTION TO THE STUDY
Introduction
Community Colleges and Universities recommend or require many new college
freshmen to enroll in remedial math courses every semester as a result of college
placement exams. Developmental math courses often referred to as “remedial math” are
math courses designed to remedy a student’s math deficiencies allowing them to enroll in
a college level math course. Approximately 60% of community college students enroll in
remedial math or writing courses at community colleges each semester (Bailey, Jeong &
Cho, 2010). The national average of students enrolling in remedial math was 43% for
students at two year colleges and 30% for students at four year public universities as
reported by “Strong American Schools” (2008).
Some estimates suggest that only one-third of high school graduates finish ready
for college work (Bettinger, Boatman & Long, 2013). It is even more alarming as
reported by Bailey, Jeong & Cho (2010) that very few students enrolled in remedial math
will complete their required sequence of remedial courses despite the purpose of remedial
math courses to promote a student’s success in college. They estimate only a third of the
community college students enrolled in remedial math complete their required sequence
of remedial math courses. However, their research does indicate that math remediation
has benefits for students in terms of retention for students that complete their math
sequence. They utilized data from the Achieving the Dream sample which was an
2
initiative designed to improve outcomes of community college students. Similar results
were found by Attwell, Lavin, Domina, and Levey (2006) who report only 30% of
students pass all their remedial math courses. In their study they utilized data from the
National Educational Longitudinal Study of 1988 (NELS: 88) to determine student
completion of remedial math. These findings illustrate a low percentage of students who
enroll in remedial math courses are successful in gaining the skills necessary to succeed
in their college-level math course and eventually graduating or acquiring an industry
recognized credential. In another study conducted to investigate math remediation and
academic attainment, Bahr (2008) found that the majority of remedial math students do
not complete their remedial math course or series of courses but his research indicated
that if students do complete their remedial math course or courses they experience
outcomes that are effectively equivalent to those students who were not required to take a
remedial math course. According to Esch (2009), remedial education can be referred to
as the Bermuda Triangle of higher education because large numbers of students enter
remediation and for all intent and purposes they disappear. Therefore, one of the most
pressing challenges facing community colleges is improving outcomes for students that
place into remedial math courses (Biswas, 2007).
Day & McCabe (1998) suggest that remedial education is important because it is
intended to restore opportunity to those who otherwise may be downgraded to meager
wages, poor working conditions and other consequences of socioeconomic
marginalization. In addition, today’s labor market requires a workforce to have an
education higher than a high school diploma. Individuals will need to gain different job
3
skills which will require them to complete special training; such as an industry
recognized credential, certificate or degree. Complete College America (2011) estimates
that 63% of jobs will require a career certificate or college degree by 2020.
It is clear due to the high number of remedial math students, the low completion
rates of remedial math courses and the needs of the current labor market that different
teaching methods to improve the success rates of students enrolled in remedial math
courses are needed. According to Esch (2009), there is no hard evidence about what
works and what does not work in remedial math. This is supported by Levin and
Calcagno (2008) who report that the traditional drill and skill approach used to increase
the performance of remedial students at community colleges is not as productive as other
available alternatives. Other alternatives include but are not limited to inquiry-based
learning, cooperative or group learning, or computer assisted instruction. The traditional
drill and skill approach or direct instruction is commonly used in college math courses
including remedial math courses where the instructor lectures the material in class by
writing problems on the board and students are asked to complete homework outside of
class. In many of these courses, students are not required to turn in homework
assignments and need only to recall the material from class to pass a test. In this setting,
students are passive in class watching or taking notes while the instructor solves
problems. In this passive setting some students become inattentive during the lecture and
find it difficult to recall information from class to complete homework assignments.
They are unable to evaluate what they know or do not know about the new material and

4
have a difficult time completing homework assignments on their own and do not have
sufficient notes to aid them.
In contrast, an active learning environment requires students to engage in
activities and requires them to think about what they are doing. In this setting, students
are engaging in the learning process because they are given responsibility for their own
learning rather than waiting for the teacher to teach them. An example of an active
learning environment is the flipped model.
The flipped model requires students to complete the lecture material outside of
class on their own as homework so they are engaging with material prior to coming to
class. During class students participate in activities that in other teaching models are
considered homework (Baker, 2000). Lecture material can include videos, interactive
problems, power point presentations or pen casts. Students have the opportunity to watch
videos as many times as needed and take notes at their own pace. They are given time to
process new material and to evaluate their learning to determine what concepts they
know and where they have questions. At the start of class, students may be asked to
recall basic information about the lecture material they reviewed on their own and the
remaining class time will be used to answer questions, reinforce concepts through solving
problems or completing activities. The goal of the flipped model is to encourage active
learning and student engagement in the class room. Flipping the classroom is an
inversion of learning activities which puts the responsibility on the student to complete
the tasks of gathering information outside of class and applying learning while in class
(Berrett, 2012). In other word, students practice skills needed to learn how to acquire
5
knowledge independently and the role of the instructor shifts to a facilitator of
knowledge. According to Baker (2000) this disposition of learning allows the instructor
to replace their repertoire of “sage of the stage” with “guide on the side” and bring the
higher level learning as described in Bloom’s Taxonomy of Learning to the classroom
where instructors help students with the more difficult tasks of application rather than
rote memorization. As Shibley and Wilson (2012) describe, technology prior to class
should be used to help students fulfill the lowest levels of knowledge attainment and
understanding while time in class should focus on application and analysis. No matter
the technology used, the purpose of this type of course design is to increase engagement.
The engagement with the material in the flipped model is the primary component of
learning (Koller, 2011). The flipped model is a fairly new model and little research exists
to determine if this teaching model is an effective method to influence student learning in
a remedial math course.
A study conducted by Lage, Platt, and Treglia (2000) suggests that students
generally prefer the flipped model classroom to the traditional lecture classroom. In
addition, students in the study reported that they like working in groups and learned a lot
working in groups. Overall students in this study reported that they believed they learned
more course content in the flipped model format of the class. In this study perceptions of
sophomore students enrolled in a microeconomics course used technology to view lecture
material outside of class and in class they worked in groups and on more complex
problems. Also as stated by Lage, Platt and Treglia (2000) the flipped model classroom
addressed the benefits of using technology in teaching such as increased participation and

6
motivation, increased faculty-student interactions and increased information-sharing
among faculty. In an article by Brunsell and Horejsi (2011) where they interviewed two
chemistry teachers who used the flipped model reported that this model frees up more
class time for doing hands-on activities and helping students work through concepts they
do not understand and they felt student learning deepens as student to student and
individual student to teacher interactions increase.
Robert Talbert (2012) has been chronicling both the flipping of his courses and
the study he is performing regarding the flipped classroom and he states:
“In fact one of the biggest marks in the “con” column of the flipped
classroom right now is the lack of systematic research on its effectiveness.
There is a lot of enthusiasm and interest but not a lot of data”
He further states that the flipped model puts students in a position where they
need to apply the study skill strategies of self-regulated learning such as being an active
participant in the learning process while monitoring and controlling his/her own thinking
as well as applying a motivation for learning. The term self-regulated learning is defined
by Pintrich (2000b, p. 253) as an active, constructive process where learners set goals for
their learning and then attempt to control, monitor, and regulate their cognition,
motivation, and behavior. Self-regulated learning theory views a student as an active
participant in the learning process and according to Pintrich (2004) students that
demonstrate self-regulated learning skills are more successful learners. The successful
application of self-regulated learning skills teaches students how to become learners
(Talbert, 2012). This concept of how students learn and research conducted on self-
regulated learning by Pintrich and colleagues resulted in the development of the
7
Motivated Strategies Learning Questionnaire (MSLQ) which is an instrument used to
measure college students motivation and self-regulated learning in the classroom
(Schunk, 2005).
Many students that are unsuccessful academically lack or have weak self-
regulated learning skills (Pintrich & DeGroot, 1990). According to Knowles, Holton III
& Swanson (2005) many adults have not learned to be self-directing inquirers because
they have been conditioned to be dependent on teachers to teach them so they often
experience a form of culture shock when first exposed to an active learning experience
and they will prefer to be passive in the classroom or they lack the skills to actively
participate in their own learning. They report that an adult learner may be dependent on
the instructor if they have no previous experience with a content area or when they do not
understand the relevance of a content area. (Knowles, Holton III, & Swanson, 2005 p.
70) This is often the case for students that enter college underprepared especially those
students in a remedial math course so it is critical for remedial math students to learn how
to use self-regulation skills to become successful learners. According to Zimmerman
(1990) at a time when students lack the will and skill to achieve academically, educators
need instructional approaches that can offer direction and insight into the processes of
self-regulated learning. The remedial math class is an appropriate setting for students to
learn and apply self-regulated learning skills because in most instances remedial
instruction as defined by NADE (2002) addresses course specific deficiencies as well as
motivational and learning deficiencies. In addition, remedial math courses usually have a

8
smaller number of students enrolled in each class as well as offer many other support
services such as supplemental instruction or tutoring.
Context
In Montana, the proportion of students enrolling in remedial math is lower than
the national average, but at Montana two-year colleges, the proportion of remedial math
students remains high. According to the MUS High School Follow-up Report (2011),
26% of students entering the Montana University System enrolled in remedial math and
8% enrolled in remedial writing for the fall 2011 semester. Students enrolled in remedial
math at Montana’s two-year colleges for fall 2011 was 44% and 20% of students at four-
year colleges in Montana enrolled in remedial math for fall 2011 as reported by the MUS
Follow-up Report (2011). In fall 2010, 21.2% of students enrolled at four-year
institutions in Montana completed their remedial course in one academic year (MUS
Follow-up Report, 2011).
Statement of the Problem
Improving how remedial math courses are delivered to college students is needed
to improve the success of students. Traditionally remedial math courses are delivered
using the lecture model and according to Le, Rodgers & Santos (2011) the lecture method
to deliver remedial math does not lead to success in remedial math. The flipped model
classroom shows promise as an effective instructional method for teaching college level
remedial math courses because it utilizes computer-based instruction as well as

9
incorporates active and collaborative learning activities in the classroom. Pascarella and
Terenzini (2005, p. 90) found that instructional approaches that include active,
collaborative, cooperative and constructivist approaches shape learning more powerfully
than the conventional lecture-discussion and text-based approaches. In addition, the
flipped model provides the following to promote student learning: time for students to
watch, process and record lecture material, time for students to evaluate what they know
and where they have questions, time in the class for students to actively engage with the
course material, time in the classroom to interact with other students and the instructor,
and it promotes students in the development of study skill strategies to become
independent learners. However, there is little research concerning how remedial math
students negotiate the self-regulation requirements of the flipped classroom and whether
this aspect of the flipped classroom can help students to become more autonomous
learners.
Purpose Statement
The purpose of this quasi-experimental study is to compare the self-regulated
learning scores for students that participate in a remedial math course that uses the
flipped model to students that participate in a remedial math course that uses the lecture
model. The Motivated Strategies for Learning Questionnaire (MSLQ) will be used to
measure the self-regulated learning scores of students in each classroom and outcomes
will be compared using COMPASS math posttest scores of student in each classroom.
The study asks the following questions:

10
1) What are the student characteristics of students who enroll in a remedial math
course?
2) Do the control of learning scores on the MSLQ increase in students that
participate in a flipped model remedial math course compared to students that
participate in a lecture model remedial math course?
3) Do the self-efficacy scores on the MSLQ increase in students that participate
in a flipped model remedial math course compared to students that participate
in a lecture model remedial math course?
4) Do the self-regulation scores on the MSLQ increase in students that
participate in a flipped model remedial math course compared to students that
participate in a lecture model remedial math course?
5) How do the posttest COMPASS math scores of students who participate in a
flipped model remedial math course compare to posttest COMPASS math
scores of students who participate in a lecture model remedial math course?
6) Do the results of pre MSLQ scores of control of learning, self-efficacy or self-
regulation predict the pretest COMPASS math scores (course placement) of
students in this study?
7) Do the results of the pre MSLQ scores of control of learning, self-efficacy or
self-regulation predict the posttest COMPASS math scores (course outcome)
of students in this study?

11
8) Do the results of pretest COMPASS math scores predict post MSLQ scores of
control of learning, self-efficacy and self-regulation for students that
participate in this study?
Significance of the Study
The results of this study will be used by Remedial Math Instructors and
Administrators at Highlands College as well as other remedial math instructors at similar
educational settings to learn more about the flipped model classroom. This study will
inform remedial math instructors by providing comparisons of self-regulation scores from
the MSLQ post-survey of students that participate in a flipped model remedial math
course to students that participate in a lecture model remedial math course. COMPASS
post-math placements of students in both classrooms will also be compared. In addition,
this study will illustrate if further research needs to be conducted to determine if the
flipped model is a feasible teaching method.
Theoretical Framework
The goal of this study is to determine if the flipped model that requires students to
apply self-regulatory processes to complete required tasks such as self-instruction and
active learning will increase a remedial math student’s ability to self-regulate. Therefore,
the theoretical framework for this study is the flipped teaching model and self-regulated
learning. Figure 1 shows the theoretical framework for this study.

12
Figure 1: Theoretical Framework
The flipped model classroom uses technology to deliver course content to
students outside of class allowing more time for students to practice and apply concepts
during class time. The basic design of this teaching model as defined by Baker (2011) as
moving the rote transmission of information out of the classroom using technology to
open up class time for the students to work on applying principles from that content while
the instructor can observe students, answer questions and make suggestions. In the

13
flipped model classroom students are provided an environment that promotes students to
learn how to become self-regulated learners by requiring students to learn and practice
how to initiate, monitor and exert control over their own learning. This change in
pedagogy requires students to apply self-regulated learning skills to acquire knowledge
from the lecture material on their own so they can apply and practice concepts in class.
Self-regulated learning skills are not an exclusive requirement of the flipped model and
are a requirement in any learning environment for students to be successful. According
to Zimmerman (2000), self-regulated learning is an important concept in education
because self- regulated learners are cognitively, metacognitively, and motivationally
active learners who are more successful learners than students that fail to apply self-
regulated learning techniques. The lack of self-regulation is linked to lower levels of
achievement, regardless of students’ intellectual ability, motivation, and self-efficacy
beliefs (Bakracevic-Vukman & Licardo, 2010). Students that are self-regulated have the
ability to plan, organize, self-monitor and self-evaluate during the learning process.
Zimmerman (1990) defines self-regulated learning theories of academic achievement as
the following: 1) how a student selects organizes or creates an advantageous learning
environment for themselves and 2) how they plan and control self-instruction. He further
states the following:
“A self-regulated learning perspective on students’ learning and
achievement is not only distinctive, but it has profound implications for the
way teachers should interact with students and the manner in which schools
should be organized. This perspective shifts the focus of education analyses
from students’ learning ability and environments as “fixed” entities to their
personally initiated processes and responses designed to improve their
ability and their environments for learning.” (p. 4)
14
Research Design
This study will be a quasi-experimental design to collect quantitative data. The
rationale for this study is to examine if there is an increase in the self-regulation skills of
students that participate in a flipped model remedial math course compared to students
that participate in a lecture model remedial math course. Course content in both sections
of the remedial math course will be the same and both sections of the remedial course
will utilize computer software for the completion of homework assignments. The
curriculum for both courses will introduce and reinforce the use of self-regulatory skills
throughout the semester. Since this study will include students from different sections of
the same remedial math course an overall group equivalence will be conducted
comparing students in each section of the course before conducting research. The group
equivalence will be established by comparing the following mean scores: COMPASS
math placement scores, COMPASS reading placement scores, a student’s previous math
experience in years, enrollment status, and time since last math class. Independent t-tests
will be performed to determine group equivalence.
Quantitative data will be collected by utilizing the Motivated Strategies for
Learning Questionnaire (MSLQ) survey. This instrument was developed by Paul Pintrich
and colleagues (Pintrich et al, 1991), to measure students’ motivational beliefs and self-
regulated learning. An electronic version of the MSLQ survey will be administered as a
pre and post survey to students in a flipped model remedial math course and lecture
model remedial math course. The MSLQ survey is a student self-reported survey that
includes 24 questions and asks students to answer questions using a scale of 1-7 where 1

15
is not all true of me and 7 is very true to me. The survey will be administered at the
beginning and at the end of the fall 2014 and spring 2015 semesters. The study will
utilize independent series t-tests to determine the difference in control of learning, self-
efficacy and self-regulation scores by comparing the mean scores of the pre and post
MSLQ survey results of students that participate in the flipped model and lecture model
remedial math course. Group equivalence will be determined by performing a series of t-
tests using the COMPASS pretest math scores and student characteristics.
Operational Definitions
The operational definitions used in this study include the following:
1. Remedial math student- a student who is considered under-prepared to be
successful in a college level math course based on their college placement
exams.
2. Remedial math courses- math courses designed to prepare students for a
college level math course.
3. Flipped Model- Is a teaching model/method that utilizes technology to provide
lecture material to students to complete outside of the traditional class time
and uses class time to reinforce concepts by solving problems or providing
activities for students.
4. Lecture Model- Is a teaching model/method where the instructor delivers
course content to students in class in the form of a lecture.

16
5. Meta-cognition- is defined as “cognition about cognition” or “knowing about
knowing”. It includes knowledge about when and how to use particular
strategies for learning or for problem solving.
6. Cognition- is a group of mental processes that include attention, memory,
producing and understanding language, learning, reasoning, problem solving
and decision making.
7. Self- Regulated Learning- is metacognitively, motivationally, and
behaviorally active in one’s own learning process and in achieving one’s own
goals. (Eccles & Wigfield, 2002)
Data Analysis
A goal of this study is to determine if the flipped model is an effective teaching
model for a remedial math course and if students demonstrate an increase in their self-
regulation skills as a result of their participation. The results of this study can be used to
inform other college remedial math instructors to improve the success of their students so
every effort will be made to eliminate threats to external and internal validity.
Summary
The subject of this study is to investigate how the flipped model influences the
self-regulation skills for remedial math students at a two-year college. Students will be
given the MSLQ questionnaire at the beginning of the semester and at the end of the
semester. Their answers to the questions will be analyzed to determine if their self-
regulation skills have changed as a result of their experience in the flipped model

17
classroom. The outcomes of this study may indicate the use of the flipped model in a
remedial math course is beneficial for remedial math students to become more successful
learners.

18
CHAPTER TWO
LITERATURE REVIEW
Introduction
How remedial math education is delivered to students at colleges and universities
is a topic of discussion in recent years due to its high cost and low completion rates of
students. Critics of remedial education argue that taxpayers should not be required to pay
twice for the same educational opportunities arguing for a major restructuring of math
remediation or even the elimination of remedial programs altogether (Bahr, 2008).
According to Le, Rodgers & Santos (2011) students that enter community college
needing to take remedial math fare worst in terms of outcomes with Bailey, Jeong, & Cho
(2010) reporting only one-third of students complete their remedial math sequence
successfully. This failure to succeed in a remedial math course may be due to the
inability for some remedial math students to apply the proper self-regulation skills needed
to be successful. It is well documented that students who apply self-regulation skills
have been found to foster active cognitive engagement in learning resulting in higher
levels of achievement (Weinstein & Mayer, 1986). Van Den Hurk (2006) reports
students who are better time planners and who have better self-monitoring skills achieve
higher scores on cognitive tests. The review of the literature will contribute to the
discussion of implementing a flipped teaching model in remedial math courses to
increase the use of self-regulation skills of students in a remedial math course. The
review of the literature is presented by discussing the theoretical framework of self-

19
regulation, similarities and differences of the flipped and lecture models, models of the
flipped classroom and the MSLQ.
Theoretical Framework: Self-Regulation
The theoretical framework for this study is self-regulation and how the flipped
model classroom influences self-regulatory processes of students in a remedial math
course. Self-regulated learning is an active, constructive process where learners set goals
for their learning and attempt to monitor, regulate, and control their cognition, motivation
and behavior, guided and constrained by their goals and the contextual features in the
environment (Pintrich, 2000). Similarly, Zimmerman (2008) defines self-regulatory
processes as proactive processes such as a students’ ability to plan, organize, self-monitor
and self-evaluate during the learning process. The model of self-regulated learning
developed by Pintrich is based on a social-cognitive framework (Schunk, 2005) and is
comprised of four phases. See Table 2.1: Conceptual Framework of Self-Regulation.

20
Table 2.1: Conceptual Framework of Self-Regulation Phases of Self-
Regulation
Areas for Self-
Regulation
Processes
Forethought,
planning, activation
Cognition Goals- Setting and modifying task-specific goals
that serves as criteria against which to gauge
progress.
Prior content knowledge- Activation of relevant
content knowledge may occur without awareness
through prompting and self-questioning.
Metacognitive knowledge- Activation includes
declarative knowledge such as learning strategies
(rehearsal and note-taking), procedural knowledge
(how to implement different strategies), and
conditional knowledge (when and why to use
different strategies)
Monitoring Motivation Goal orientations- reasons learners engage in a
task.
Self-efficacy- an individual’s beliefs about their
capabilities to learn or perform.
Perceptions of difficulty and ease of learning-
individual judgments about how hard or easy they
believe the material will be to learn.
Task value- individual perceptions of the
relevance, importance, and usefulness of the
learning.
Interest- an individual’s degree of liking of the
content area or topic being learned.
Control Behavior Time and effort planning- time management skills
such as creating study schedules and planning time
for different activities.
Planning for self-observation- determining what
methods one will use to assess progress and
regulate behaviors.
Reaction, reflection Context Students’ perceptions of the task and context- may
include perceptions about classroom features that
may help or hinder learning, types of tasks to be
completed, grading practices, and classroom
climate factors such helpfulness of the teacher.
Schunk, D. H. (2005). Self-regulated learning: The educational legacy of Paul R. Pintrich.
Educational Psychologist, 40, 85-94

21
This model of self-regulation developed by Pintrich in the Table 2.1 outlines the
four phases of self-regulation (forethought, planning, activation, monitoring; control;
reaction and reflection) and the four possible areas for self-regulation (cognition,
motivation, behavior, and context). Schunk (2005) notes that this model does not
presume the phases are linearly ordered and they may occur at any time during task
engagement. In addition, there are learning situations when learners may engage in some
but not all of the phases and individuals may simultaneously engage in more than one.
This model of self-regulated learning has been used by numerous researchers/educators
to improve educational practices. The following paragraphs describe studies that
investigated student self-regulation in math courses.
In a study conducted by Bembenutty (2009) designed to examine the
associations between students’ homework activities and their reported use of self-
regulated learning strategies found many at-risk students fail to do their homework
because they lack the self-discipline necessary to complete their homework. Not
completing homework assignments is a huge disadvantage for students because as
defined by Zimmerman (2008) as cited in Bembenutty (2009) homework should prompt
students to engage in self-initiated and self-directed studying and self-regulation of
learning. The study further concluded that many remedial programs designed to assist at-
risk students fail because they do not provide the motivational beliefs and self-regulation
strategies at-risk students need to become proactive learners. Participants of the study
consisted of college freshman (n=58) enrolled in an introductory math course at a New
York City College. They consisted of students enrolled in an associated degree program

22
within a large urban community. Students were selected for this study because they failed
their math placement exam and placed in remedial math. They were diverse in terms of
college majors, demographics and the number of hours they work a week. All
participants were enrolled in a self-regulation of learning project which was designed to
assist at-risk students to become self-regulated learners before enrolling in the remedial
math course. The project helped students become actively involved in the learning
process by providing skills necessary to set goals, use strategies, self-monitor, self-adjust
and self-evaluate their progress. The participants in the study were asked to complete a
survey to determine their motivation for learning math, their use of learning strategies
and their activities during homework completion. In addition, students were asked to
complete a homework log to report their homework activities. The participants
completed four homework logs over two weeks. Pearson correlation coefficients were
calculated to assess the direction and magnitude of the linear relations between student’s
homework activities and the other variables of the study. The results indicated that
student’s homework activities and beliefs are associated with their reported homework
activities especially their beliefs of self-efficacy to learn. The mastering of course
material was related to the grade they expected on the midterm exam and the number of
hours spent on homework tasks. The study concluded that active involvement of at-risk
college students during homework was significantly associated with their academic
success. Limitations of this study include the small sample size of participants and a
larger sample size may result in different results but overall the results may be
generalized to students enrolled in a remedial math course at a technical college.
23
Shores & Shannon (2007) also conducted a study to investigate the relationships
between self-regulated learning, motivation, anxiety, attributions and achievement in
mathematics. A total of 761 students selected from fifth and sixth grade math classes in
Alabama were surveyed using a version of the Motivated Strategies for Learning
Questionnaire, a Test Anxiety Inventory and an Attribution Survey. In addition,
academic achievement data was collected for each student participating in the study.
Results of the study indicated relationships between motivation, anxiety and test scores
for both fifth and sixth grade students in the study but self-regulation and cognitive
strategy use were not significantly related to academic performance for the fifth grade
students, only the sixth grade students. Researchers in this study concluded that teachers
need to design learning environments in math classes that consider students’ motivation,
anxiety and attributions. Limitations of this study include the use of multiple sections of
the math course with multiple instructors, the use of a self-reported survey and different
tests used to measure academic performance. This study resulted in similar results to
previous research in regard to how motivation and student self-regulation effect student
achievement but the study may not be generalizable to college students even though the
course content is similar to remedial math courses in college.
In another study investigating self-regulation by Kramarski & Gutman (2006)
indicated that a student’s knowledge of self-regulated learning strategies is usually
insufficient in promoting students achievement because students must also be motivated
to use the strategies as well as regulate their time and meta-cognition. They also
highlight that many inexperienced learners or at-risk students that lack self-regulatory
24
skills can learn these skills to become more successful learners. In their study they
compared two math courses that utilized e-learning. In one classroom they included a
program called IMPROVE which is used to teach students self-regulation skills. The
IMPROVE program was designed to support self-regulated learning by using a self-
metacognitive questioning approach. The goal of the study was to determine if the
student’s exposed to IMPROVE would have higher grades than students in the other class
that was not exposed to IMPROVE. There were 65 ninth grade students who participated
in the study which took place in one junior high school in central Israel. Students in both
groups were given a math test as a pretest before starting the unit on linear equations and
at the end of the five week unit they were given a posttest. The test included three
components: problem solving of procedural tasks that assess students’ ability to solve
standard tasks to assess student ability of basic concepts, problem solving of transfer
tasks which included more complex problems and the last component asks students to
provide mathematical explanations. Participants in the study also answered a Self-
Regulated Learning Questionnaire (SRLQ). The questionnaire consisted of problem
solving strategies and self-monitoring questions. An ANCOVA using the pretest scores
as a covariate was performed and determined that no significant differences existed in
prior problem solving of procedural tasks between the two classes in the study. The
results of the posttest indicated that there was a significant difference between the
students that experienced IMPROVE during instruction compared to students that did
not. Students that experienced IMPROVE outperformed students that did not experience
IMPROVE in solving procedural tasks (E=.44), transfer skills of problem solving

25
(E=.77), and providing mathematical explanations (E=.46). The results of the SRLQ
found significant correlations between using self-monitoring strategies and performance
on transfer skills and mathematical explanations for the students that experienced
IMPROVE while student that did not experience IMPROVE no significant correlations
were found between using self-monitoring strategies and performance on procedural
tasks. The study concluded that supporting math students with knowledge of self-
regulation skills results in positive effects on problem solving, mathematical explanations
and self-monitoring. These findings strengthen the recommendations for supporting self-
regulated learning in math instruction. A limitation of this study is the short duration of
this study as well as the small sample size. This study consisted of junior high school
students and the results may not generalize to adult learners in a post-secondary setting
but warrants further research with adult learners.
Similar results were found from a study conducted by Perels, Dignath & Schmitz
(2009) where they investigated teaching self-regulation skills in a math course. The
study compared two math courses where one course incorporated self-regulated skills in
addition to teaching the math content and the other course taught just the math content.
The study was conducted before and after teaching a unit on “divisor’s and multipliers”.
The participants were two sixth-grade classes (n=53) in Germany taught by the same
teacher. The design of the study was similar to the previous study where participants
completed a pre and post math test in addition to a self-regulated learning questionnaire
before the teacher taught a unit lasting 3 weeks. This study also indicated that teaching
self-regulated learning strategies in conjugation with math content has a positive outcome
26
for students. The study found students who received self-regulation instruction within
regular mathematics lessons of sixth grade students showed knowledge on the trained
self-regulation strategies as well as had higher scores on the self-regulation questionnaire.
In addition, the study found that it is also possible to support mathematical performance
by teaching self-regulatory strategies during regular classes. Limitations of this study
were the small sample size and the short duration of the study.
All four studies indicate the importance of a student’s ability to use self-regulation
skills because they positively influence a student’s performance and academic
achievement in college. The following paragraphs will discuss the similarities and
differences of the flipped model and lecture model to investigate if the flipped model
format increases a student’s use of self-regulation skills.
Lecture versus Flipped Model Classrooms
Traditionally, in a remedial math classroom students are taught using the
traditional lecture method where the instructor provides students with a lecture of new
material in class and students’ complete homework outside of class. The lecture model
creates a teacher-centered classroom where the instructor is in control of how students
interpret new material. The instructor chooses the material to be presented in class and
how it is presented by providing the course notes and demonstrating how to solve the
problems in class while controlling the pace of the material being presented to students.
In contrast, the flipped model is a constructivist approach to teaching which is
based on the belief that learning is an active process where learners construct new
knowledge by connecting new concepts to existing knowledge. The goal of having

27
students view the material outside of class is to have them actively engage in the new
material so they can begin to create a foundation of the new material that will be
reinforced in the classroom. The lecture material may consist of videos, power points, or
reading assignments. The flipped model is a pedagogical approach that uses technology
to deliver lecture material to students outside of class while class time is used to practice
new concepts through small group and activity based assignments, in other words, what
is normally done in the classroom happens outside the classroom and vice versa (Lage,
Platt & Treglia, 2000). The flipped teaching model is also referred to as the inverted
classroom and is similar to a hybrid class which is a class that is taught online and in the
classroom. Table 2.2 shows the comparison of the flipped and lecture model classroom
requirements.

28
Table 2.2: Comparison of the Flipped and Lecture Model Classroom
Flipped Model Lecture Model
Teaching
Methodology
Active Learning- students
regulate ideas to determine what
knowledge is important in lecture
material.
Direct Instruction- Instructor
controls how students interpret
new material by providing new
material to students.
Class Time Student’s actively complete math
problems and activities from
hand-outs provided in class to
practice concepts they viewed in
the lecture material on their own.
The instructor roams the room
answering student questions. In
addition, students may work or
are required to work problems
with peers.
Students listen and watch
Instructor present and display
new material in class. Students
are expected to record notes and
example problems from the
board. Students have limited time
to ask questions about previously
presented material.
Homework
Assignments
Students are required to take
notes from lecture material
provided electronically outside of
class. In addition, students
complete math problems utilizing
technology to reinforce math
concepts.
Students complete assigned math
problems utilizing technology and
hand-outs provided in class on
their own time.
Role of
the Student
Student required being an active
participant in the learning
process.
Students assumed to be or are
expected to be an active
participant in the learning
process.
As outlined in Table 2.2 the main difference of the flipped model and lecture
model is the requirement of active participation. Students need to be active participants
in both models to be successful in their math course but in the lecture model classroom it
is difficult to assess to what degree a student is active in the learning process. The
flipped model is different from the lecture model according to Fulton (2012) because in
the traditional lecture classroom the teacher is doing the active work and the students are
passively listening while in the flipped classroom students need to be active in the
29
learning process by viewing lecture material using technology and participating in class
activities. According to Le, Rodgers & Santos (2011) the lecture method to deliver
remedial math does not lead to success because in a lecture model environment of
teaching, some students passively receive information from the professor and internalize
it through some form of memorization. Anthony (1996) defines passive learning as
activities where students are passive receivers of information listening to the teacher’s
exposition, being asked a series of closed questions where they practice and apply
information already presented. In contrast, Anthony (1996) defines active learning as an
educational environment where students are given considerable autonomy and control of
the direction of the learning activities. The requirements of the flipped model such as
using technology to view lecture material, take notes of the lecture material and working
actively during class time with peers and the instructor may promote students to be more
active in class which may result in an increase in a student’s use of self-regulation skills.
According to Epper and Baker (2009) the blending of traditional and online instruction of
programs at community colleges are providing an initial look at how technology can be
used to expand, strengthen, and create efficiencies in the delivery of remedial math.
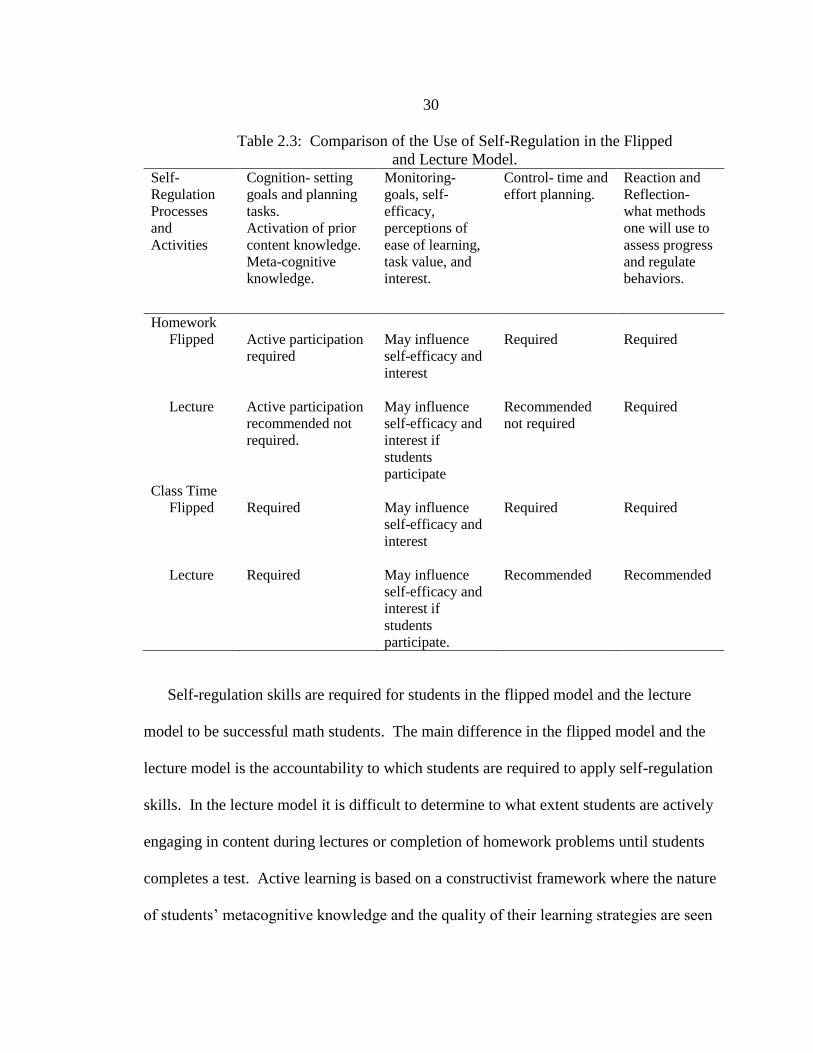
Table 2.3 shows a comparison of the use self-regulation processes and activities in the
flipped and lecture model classrooms.
30
Table 2.3: Comparison of the Use of Self-Regulation in the Flipped
and Lecture Model. Self-
Regulation
Processes
and
Activities
Cognition- setting
goals and planning
tasks.
Activation of prior
content knowledge.
Meta-cognitive
knowledge.
Monitoring-
goals, self-
efficacy,
perceptions of
ease of learning,
task value, and
interest.
Control- time and
effort planning.
Reaction and
Reflection-
what methods
one will use to
assess progress
and regulate
behaviors.
Homework
Flipped Active participation
required
May influence
self-efficacy and
interest
Required Required
Lecture Active participation
recommended not
required.
May influence
self-efficacy and
interest if
students
participate
Recommended
not required
Required
Class Time
Flipped Required May influence
self-efficacy and
interest
Required Required
Lecture Required May influence
self-efficacy and
interest if
students
participate.
Recommended Recommended
Self-regulation skills are required for students in the flipped model and the lecture
model to be successful math students. The main difference in the flipped model and the
lecture model is the accountability to which students are required to apply self-regulation
skills. In the lecture model it is difficult to determine to what extent students are actively
engaging in content during lectures or completion of homework problems until students
completes a test. Active learning is based on a constructivist framework where the nature
of students’ metacognitive knowledge and the quality of their learning strategies are seen
31
to be critical factors in successful learning outcomes (Anthony, 1996) which is a main
component of self-regulated learning where learners actively participate in their own
learning to plan, organize, self-monitor and self-evaluate while learning new material. In
the flipped classroom students are expected to put time into learning the foundational
skills independently and use classroom time to practice and apply those skills (Cole &
Kritzer, 2009). The change in the homework requirements of the flipped model may be
less threatening for some students because they are not just required to just complete
math problems on their own. The active involvement of students participating in the
lecture material taking notes may increase motivation while requiring students to practice
and improve their use of self-regulation skills. According to Ramdass and Zimmerman
(2011), assigning and encouraging students to complete homework can improve their
self-efficacy beliefs for learning, thereby enabling them to take more responsibility for
their academic achievement. In addition, they state that assignments that are tailored to
the interest and achievement level of struggling students may enhance motivation, effort
and achievement.
A key learning strategy that students apply while actively engaging in new content is
note-taking. Note-taking requires students’ to be able to apply self-regulation skills.
Students need to actively record and comprehend new material in addition to organize
and restructure existing knowledge structures while storing and integrating the freshly
processed material (Makany, Kemp and Dror, 2009). They further report that learners
misperceive the task demands of note-taking in addition to not realizing the importance
of note-taking. The role of good note-taking aids a student in learning new material in a

32
college classroom and it is a skill that students are expected to know. Titworth and
Kiewra (1998) found that the level of details in lecture notes accounted for half of the
variance in students’ final test scores. Unfortunately, many students’ especially
inexperienced learners do not take proper notes to aid in them in learning of new material
in a math course. In some cases, in the lecture model math course many of these students
passively sit in class and watch the instructor work problems on the board and have a
difficult time taking notes at the same time. According to Kierwa (1985), a student’s
note taking efficiency in a lecture situation is only around twenty to forty percent. These
same students struggle or fail to do their homework because they don’t remember how to
apply the steps presented in a lecture to complete the math problems on their own as
homework. They are solely relying on their auditory skills to learn the new material and
miss the opportunity to refer back to their notes. The ability to refer back to their notes
for assistance in learning new material according to Makany, Kemp and Dror (2009)
would refine their metacognitive knowledge and strategy use. Nolting (2008)
summarizes note-taking into two main categories: how to become an active listener and
learner. He stresses the importance of students to become active participants in the
process of note-taking. In the flipped model classroom students are required to take class
notes on their own as homework which allows them to view the lecture material many
times and at their own pace. This may be especially helpful for inexperienced learners in
a remedial math course that need time to learn how to manage the tasks demands of note-
taking influencing their use of self-regulated learning skills. The following paragraphs
illustrate research conducted investigating the use of the flipped model classroom.

33
Models of a Flipped Classroom
A pilot study conducted at Byron School District near Rochester, Minnesota by
the math department used the flipped model to teach a calculus and pre-calculus course
during the fall 2010 semester due to budget cuts that eliminated funding for new text
books as reported by Fulton (2012). They began by flipping a few chapters at a time and
the results indicated that the flipped model was an effective method to teach math. The
calculus course illustrated a 9.8% average increase in course proficiency and a 6.1%
average increase in course proficiency in the pre-calculus course. As a result of this
study they changed all math courses to the flipped model. The article did not include
sufficient evidence or data to make concrete conclusions about the flipped model as an
effective teaching method but the preliminary results are promising.
Another study examining the flipped classroom was conducted at Western
Michigan University where they transformed an Introductory Business course (Reck,
Schullery & Schullery, 2011). The course was traditionally a taught in a large lecture
hall accommodating up to 300 students. This course is a foundations course in the
business department and concerns about the lack of student engagement and a lack of
faculty willing to teach a large number of students developed which resulted in the new
classroom design. The course was transformed to 24 person seminars that met weekly
and students were required to prepare for the weekly meeting by engaging in the lecture
material before the class meeting. To avoid the pitfall of students not being prepared
before the class meeting a five-question quiz was given to students at the beginning of the
class meeting as a motivational tool. The remaining class time students worked in small

34
groups on business related topics related to the lecture material. Surveys were distributed
to students at the end of the spring 2009 (n= 210) and fall 2009 (n=653) semesters to
determine if the new format engaged students and helped them learn. Results of the
study indicated that 90% of the students said they usually agree, agree, or strongly agree
that students in their sections were prepared for class indicating students were engaged in
the course. Furthermore, over 90% of the students agreed that the new format
encouraged students to participate in class discussions. In addition, 71.5% and 81.8% of
students described themselves as satisfied or very satisfied with the course. They
concluded that the redesign of the course was an improvement and the college gained a
cost-effective way to promote student engagement in the course. Limitations of the study
include the self-selected student survey which students were given extra credit for their
responses. Also, students in the traditional format were not given a satisfaction survey so
a comparison of both formats could not be obtained. The results of this study indicate
that the flipped model may improve student engagement in the classroom and because the
course consisted of mainly first-time freshman students one may conclude the same result
for first time freshman math students.
The research on the flipped classroom is limited but definitely shows promise as a
valid teaching methodology in a remedial math course to promote the use of self-
regulation skills to encourage students to become more successful in their math courses.
The following paragraphs provide an explanation of the instrument that will be utilized
for this study to investigate a students’ use of self-regulation skills in a remedial math
course.

35
MSLQ
This study will utilize the MSLQ survey developed by Pintrich et al. (1991). The
survey can be used to measure a student’s motivation and use of self-regulation skills. It
was developed using a social-cognitive view of motivation and learning strategies
(Duncan & McKeachie, 2005). Correlational field studies were conducted over a five
year period of time using a sample of two-thousand students to investigate college
student learning. The results of the studies had consistent results demonstrating that
students who possess more positive motivational beliefs engage in a better use of self-
regulation skills and were more likely to perform better academically. According to
Duncan and McKeachie (2005), the theoretical framework of the MSLQ assumes that
motivation and learning strategies are not traits of the learner but rather that motivation is
dynamic and contextually bound and learning strategies can be learned and brought under
the control of the learner. It was the belief of the researchers of the MSLQ that students’
motivation and strategy use might vary depending on the course and specific academic
tasks. This aspect of the MSLQ is different from other research on college student
learning that focused on students individual differences or learning styles such as the
Myer-Briggs (Duncan & Mckeachie, 2005). The MSLQ was chosen for this study
because it has been used extensively to evaluate the effects of courses on students and to
assess the motivational and cognitive effects of different aspects of instruction (Duncan
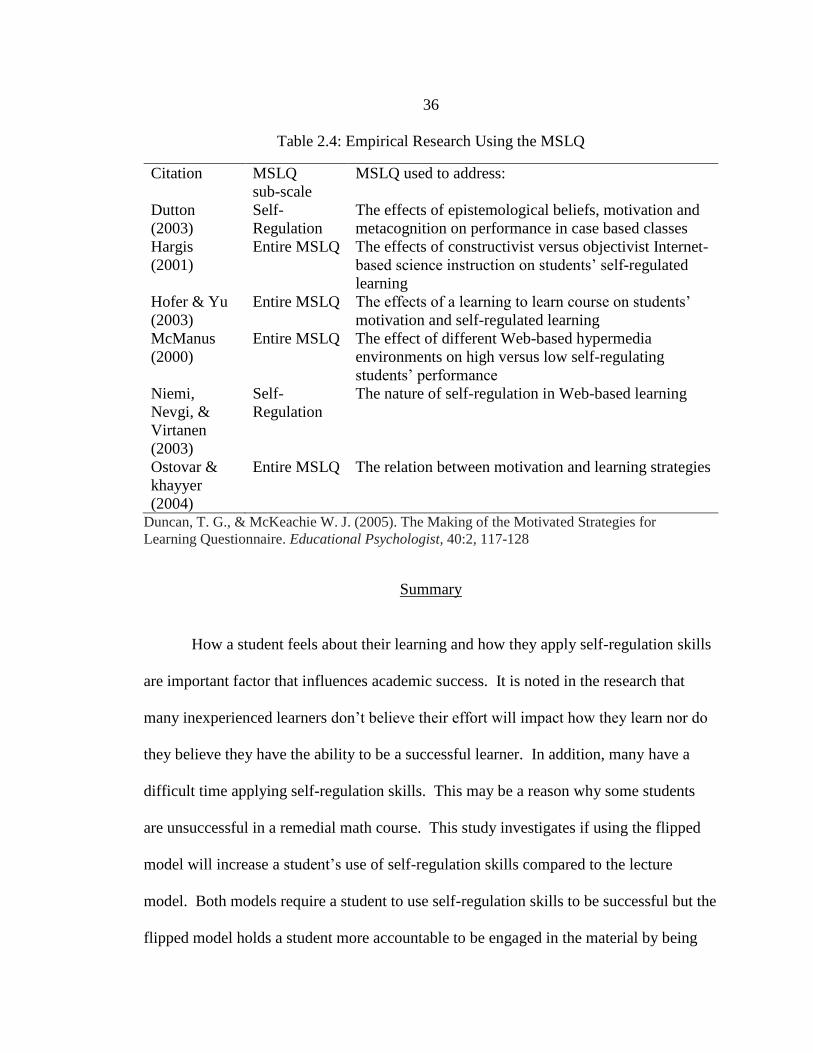
& McKeachie, 2005) similar to this study. Table 2.4 shows a sample of empirical
research investigating self-regulated learning that used the MSLQ with undergraduate
college students.
36
Table 2.4: Empirical Research Using the MSLQ
Citation MSLQ
sub-scale
MSLQ used to address:
Dutton
(2003)
Self-
Regulation
The effects of epistemological beliefs, motivation and
metacognition on performance in case based classes
Hargis
(2001)
Entire MSLQ The effects of constructivist versus objectivist Internet-
based science instruction on students’ self-regulated
learning
Hofer & Yu
(2003)
Entire MSLQ The effects of a learning to learn course on students’
motivation and self-regulated learning
McManus
(2000)
Entire MSLQ The effect of different Web-based hypermedia
environments on high versus low self-regulating
students’ performance
Niemi,
Nevgi, &
Virtanen
(2003)
Self-
Regulation
The nature of self-regulation in Web-based learning
Ostovar &
khayyer
(2004)
Entire MSLQ The relation between motivation and learning strategies
Duncan, T. G., & McKeachie W. J. (2005). The Making of the Motivated Strategies for
Learning Questionnaire. Educational Psychologist, 40:2, 117-128
Summary
How a student feels about their learning and how they apply self-regulation skills
are important factor that influences academic success. It is noted in the research that
many inexperienced learners don’t believe their effort will impact how they learn nor do
they believe they have the ability to be a successful learner. In addition, many have a
difficult time applying self-regulation skills. This may be a reason why some students
are unsuccessful in a remedial math course. This study investigates if using the flipped
model will increase a student’s use of self-regulation skills compared to the lecture
model. Both models require a student to use self-regulation skills to be successful but the
flipped model holds a student more accountable to be engaged in the material by being

37
required to take and bring notes to class and to actively participate in the classroom on
math problems. It is documented in research that self-regulation skills can be learned
therefore a teaching method like the flipped model may increase the use of one’s self-
regulation skills benefiting students in a remedial math course.

38
CHAPTER THREE
METHODOLOGY
Introduction
Remedial math has been the topic of discussion nationally at many colleges in
recent years. There is a concern with the high percentage of students that are required or
recommended to enroll in remedial math courses when they attend college. A recent
report published by ACT (2014) found that the average ACT math score for 2012
graduates was 21. This score translates to 46% of 2012 graduates will be required or
recommended to enroll in a remedial math course in college. Enrolling in remedial math
courses can delay graduation for students especially if more than one course is required
before students can enroll in their degree required math course in addition; it is an added
expense in terms of tuition. This is troublesome because many students do not complete
their remedial math course or series of remedial math courses successfully. Merseth
(2011) refers to remedial math courses as the graveyard of dreams and aspirations due to
high failure rates, increased debt burdens, and a lack of credits on a transcript. On the
other hand, many students will not complete their college level math course required for
degree completion successfully without completing remedial math courses. Some
students may perform poorly in remedial math courses due to their lack of ability to self-
regulate their own learning. Students who are motived learners and apply self-regulation
skills are more successful learners and most importantly students can learn to become
self-regulated learners (Duncan & McKeachie, 2005). In addition, students who exhibit

39
higher levels of control of learning and self-efficacy are more successful learners
(Pintrich, Smith, Garcia & McKeachie, 1991). They define control of learning as a
student’s beliefs that their efforts to learn will result in positive outcomes and self-
efficacy as one's ability to master a task which includes judgments about one's ability to
accomplish a task as well as one's confidence in their skills to perform that task (Pintrich,
Smith, Garcia & McKeachie, 1991). So, if a student can increase their ability to control
their own learning, their levels of self-efficacy and their use of self-regulation skills as
well as become proficient in their remedial math course, they have a better chance of
achieving their educational goals. Therefore, the purpose of this study is to answer the
following research questions:
1) What are the characteristics of students who enroll in a remedial math course?
2) Do the control of learning scores on the MSLQ increase in students that
participate in a flipped model remedial math course compared to students that
participate in a lecture model remedial math course?
3) Do the self-efficacy scores on the MSLQ increase in students that participate
in a flipped model remedial math course compared to students that participate
in a lecture model remedial math course?
4) Do the self-regulation scores on the MSLQ increase in students that
participate in a flipped model remedial math course compared to students that
participate in a lecture model remedial math course?

40
5) How do the posttest COMPASS math scores of students who participate in a
flipped model remedial math course compare to posttest COMPASS math
scores of students who participate in a lecture model remedial math course?
6) Do the results of pre MSLQ scores of control of learning, self-efficacy or self-
regulation predict the pretest COMPASS math scores (course placement) of
students in this study?
7) Do the results of the pre MSLQ scores of control of learning, self-efficacy or
self-regulation predict the posttest COMPASS math scores (course outcome)
of students in this study?
8) Do the results of pretest COMPASS math scores predict post MSLQ scores of
control of learning, self-efficacy and self-regulation for students that
participate in this study?
The findings of this study will inform remedial math instructors about the
influence of motivation (control of learning and self-efficacy) and study skills (self-
regulation) on students who participate in a flipped model and lecture model remedial
math course. Knowledge of these findings will allow remedial math instructors to
examine the two different pedagogical approaches to teaching a remedial math course
which may result in helping students become successful learners resulting in better
completion rates in remedial math courses.
The following sections of this chapter describes the context of the study, research
design, setting, data collection procedures, sample population, group equivalence,
instrumentation overview, and data analysis.

41
Context of the Study
This study took place at Highlands College which is the two-year college of
Montana Tech of the University of Montana. Highlands College is small open
enrollment public land grant college located in rural southwest Montana. The college
provides educational opportunities to meet the needs of people in the surrounding areas
as well as labor and industry. Highlands College offers Certificate and Associate of
Applied Science (AAS) degrees in a variety of degree programs (www.mtech.edu) with
the largest percentage of students enrolled in the Associate of Science (AS) degree
program. A total of 17% of students were enrolled in the AS program in fall 2013 and
29% of students were enrolled in the AS program in spring 2014 at Highlands College.
The AS degree program was developed specifically as a transfer degree program where
students have the option to complete their general education credits at two year fees
before transferring to another college. At Highlands College students who place into
remedial math or writing courses are required to enroll in the AS program to complete
their remedial coursework before transferring to a four year degree program.
The total headcount of students for fall 2013 was 913 students and 817 students
for the spring 2014. The majority of the students enrolled at Highlands College during
fall 2013 and spring 2014 are students that originate from the surrounding areas of
Beaverhead, Deerlodge, Jefferson, Madison, or Silverbow counties with 72% of students
during the fall 2013 semester and 73% of students during the spring 2014 semester. Most
students were enrolled as full-time students where 58% of students were enrolled full-
time during the fall 2013 and spring 2014 semester. The comparison of male students to

42
female students is approximately 1:1. In fall 2013, 47% of students were male compared
to 53% of female students. In spring 2014, 52% of students were male compared to 48%
female students. More students enrolled at Highlands College during fall 2013 and
spring 2014 were under the age of 25. There were 73% of students enrolled during fall
2013 and 68% of students enrolled during the spring 2014 semester that were under the
age of 25. Dual enrollment students accounted for 267students or 30% of the total
headcount of students enrolled at Highlands College. Dual enrollment students are not
eligible to enroll in remedial math courses at the college level. Therefore, the total
number of students on campus excluding the dual enrollment students who are eligible to
enroll in remedial math courses at Highlands College was 646 or 30% of students for the
fall 2013 semester. A total of 584 students or 28% of students were eligible to enroll in
remedial math courses for the spring 2014 semester. Table 3.1 shows the population of
all students enrolled at Highlands College for the fall 2013 and spring 2014 semesters.

43
Table 3.1: Fall 2013 and Spring 2014 Enrollment at Highlands College Fall 2013 Spring 2014
Total Headcount Including Dual Enrollment Students
Male
Female
913
433 (47%)
480 (53%)
817
421 (52%)
396 (48%)
Enrollment Status
Full-time Students
Part-time Student
Full-time students from surrounding
Counties (Beaverhead, Deerlodge, Jefferson, Madison,
and Silverbow
Enrollment Status by Age
Non-traditional age (25 or older)
Traditional age
529 (58%)
384 (42%)
656 (72%)
248 (27%)
665 (73%)
474 (58%)
343 (42%)
595 (73%)
260 (32%)
557 (68%)
Student Headcount by Department
Associate of Science
Accounting Business Technology
Health Programs
Network Technology
Trades and Technical
Dual Enrollment Students (High School students)
Non-Degree Students
Total Number of Students eligible to enroll in remedial
course work. (students not enrolled in
Dual Enrollment Courses)
154 (17%)
68 (7%)
119 (13%)
36 (4%)
131 (14%)
267 (30%)
138 (15%)
646
234 (29%)
70 (8%)
96 (12%)
31 (4%)
144 (18%)
233 (28%)
9 (1%)
584
A remedial math course in the Montana University System is defined as a course
that is a basic skills course with a course number less than 100. Students with low math
placement scores are required to complete their required remedial math courses before
they can enroll into a college level math course. The series of remedial math courses
offered at Highlands College include Basic College Math (Math 061), Introduction to
Algebra (Math 090), and Intermediate Algebra (Math 095). The remedial math courses
are delivered in a 16 week semester or a 5 week summer semester. All sections of the
remedial math courses are offered in a lecture only format or lecture with an online

44
component used to deliver homework assignments and supplementary information.
Table 3.2 shows the Remedial Math Sequence at Highlands College.
Table 3.2: Remedial Math Sequence at Highlands College
Course Content Duration of Course and Type Credits
Math 061 Whole Numbers
Fractions
Decimals
Percent
Ratios
Proportions
16 week semester
Lecture only or Lecture with
online component
3
Math 090 Review of fractions and decimals
Real number system
Algebraic expressions
Linear Equations
Exponents
Polynomials
Factoring Polynomials
16 weeks fall and spring
5 weeks summer
Lecture only or Lecture with
online component
4
Math 095 Review of Polynomials
Factoring expressions
Quadratic equations
System of Equations
Graphing
Radical Expressions
16 weeks fall and spring
5 weeks summer
Lecture only or Lecture with
online component
3
Remedial math courses typically have a higher enrollment compared to remedial
writing courses (http://mus.edu/CCM/CCA%20Progress%20Metric%201%20-
%20Remediation%20Rates%20by%20Subject.pdf). According to Complete College
Montana more students at Highlands College enrolled in a remedial math courses (40%)
compared to remedial writing courses (3%) after averaging the enrollment of students for
the fall 2009, 2010, 2011, and 2012 semesters.
Math 095 was chosen for this study because it is the required math course for
degree completion for many two-year degree programs (AAS degrees) and it is the pre-
requisite course for the entry level college math course (Math 121) at Montana’s four
year institutions. During the fall 2013 and spring 2014 semesters, a total of 625 students
enrolled in remedial math courses at Highlands College. The majority (46%) of those

45
students were enrolled in Math 095 which is one level below the college level math
course of college algebra (Math 121) followed by 33% of students enrolled in Math 090
and 21% of students enrolled in Math 061. During the fall 2013 semester 379 students
out of a total of 646 students or 59% of students enrolled in remedial math courses and
during the spring 2014 semester 246 students out of 584 students or 42% of students
enrolled in remedial math courses.
A successful completion rate of students enrolled in remedial math courses was
determined by using a grade of a C or higher. A grade of a C indicates a student passed
the course but it does not necessarily indicate that a student has gained the skills to be
successful in the next course. According to an interview with Paul Nolting conducted by
Boylan (2011), Nolting states “the reason few students complete the developmental
[remedial] math sequence is that math is extremely linear so earning a C in a current
algebra course most likely translates to failing the next algebra course”. The completion
of students in remedial courses for fall 2013 and spring 2014 resulted in the following
percentages: 65%, 57% (Math 061), 61%, 59% (Math 090), and 62%, 61% (Math 095).

46
Table 3.3: Student Participation and Completion of Remedial Math at Highlands College
The high number of students enrolled in remedial math courses and the low
completion rates of these courses at Highlands College illustrates how important it is to
identify teaching methods that help students increase their use of self-regulation skills so
more students successfully complete their remedial math courses leading to the
achievement of their educational goals.
Course
Fall 2013
Enrolled Completion
Spring 2014
Enrolled Completion
Total
Enrolled
Math
061
81 (21%)
A 25 (31%)
B 18 (22%)
C 10 (12%)
C or better (65%)
D 8 (10%)
F 17 (21%)
W 3 (4%)
49 (19%)
A 13 (27%)
B 6 (12%)
C 9 (18%)
C or better (57%)
D 3 (6%)
F 15 (31%)
W 3 (6%)
130 (21%)
Math
090
125
(33%)
A 34 (27%)
B 28 (23%)
C 14 (11%)
C or better (61%)
D 18 (14%)
F 19 (15%)
W 12 (10%)
72 (30%) A 12 (17%)
B 13 (18%)
C 17 (24%)
C or better (59%)
D 13 (18%)
F 16 (22%)
W 1 (1%)
197 (32%)
Math
095
173
(46%)
A 38 (22%)
B 40 (23%)
C 29 (17%)
C better (62% )
D 11 (6%)
F 38 (22%)
W 17 (10%)
125 (51%) A 29 (23%)
B 23 (18%)
C 25 (20%)
C or better (61%)
D 13 (11%)
F 30 (24%)
W 5 (4%)
298 (48%)
Total
Enrolled
379/646
(59%)
246/584
(42%)
625/1230
(51%)

47
Research Design
This quasi-experimental pretest and posttest design utilized a paper version of the
MSLQ survey (Pintrich et al., 1991) to investigate levels of control of learning, self-
efficacy and self-regulation of students who participated in a flipped model remedial
math course compared to students who participated in a lecture model remedial math
course. Also, the educational outcomes of students in each classroom were investigated
using the COMPASS math placement exam as a pretest and posttest design. The
COMPASS math placement exam is used to predict a student’s level of preparedness for
students enrolled in the flipped or lecture model classrooms. Descriptive data was
collected to learn more about the characteristics of remedial math students and to serve as
control variables which are described in greater detail in the section below to determine
group equivalence. A series of Pearson Chi-Square and T-tests were used to test group
equivalency across a number of individual characteristics. The results of the test of group
equivalency is described below. The study instrument, independent variables and
dependent variables will be described later in the chapter.
Setting
The study takes place at Highlands College during the fall 2014 and spring 2015
semesters. Students in the study were enrolled in an Intermediate Algebra course (M095)
where one section was delivered using the flipped model and one section was delivered
using the lecture model for the fall 2014 and spring 2015 semesters. In the flipped model
classroom the lecture material and homework assignments were “flipped” where students

48
were required to complete lecture material on their own as homework assignments and
during class time they were required to complete homework problems and activities. In
the lecture model classroom students were required to take notes during class time of
instructor provided lecture material and complete homework problems outside of class.
A comparison of the flipped classroom and lecture classroom is in Table 3.4.

49
Table 3.4: Comparison of the Flipped and Lecture Model Classroom Flipped Model Lecture Model
Teaching
Methodology
Active Learning- students regulate
ideas to determine what knowledge
is important in lecture material.
Direct Instruction- Instructor controls
how students interpret new material by
providing new material to students.
Class Time Student’s actively complete math
problems and activities from hand-
outs provided in class to practice
concepts they viewed in the lecture
material on their own. The instructor
roams the room answering student
questions. In addition, students may
be required to work problems with
peers.
Students listen and watch Instructor
present and display new material in
class. Students are expected to record
notes and example problems from the
board. Students have limited time to
ask questions about previously
presented material.
Homework
Assignments
Students are required to take notes
from lecture material provided
electronically outside of class. In
addition, students complete math
problems utilizing technology to
reinforce math concepts.
Students complete assigned math
problems utilizing technology and
hand-outs provided in class on their
own time.
Role of
the Student
Student required to be an active
participant in the learning process.
Students assumed to be or are expected
to be an active participant in the
learning process.
At the start of the semester, it was necessary to prepare students in both
classrooms how to use study skills or apply self-regulation skills to be successful in a
math course. All students in the study were required to participate in study skill activities
in and outside of the classroom and given credit for completion of assignments as
homework assignment. Study skills assignments and activities were reinforced in both
classrooms during the entire semester. After the completion of the time management and
notetaking activities the remaining study skills were included with math content for both
classrooms. Both classrooms utilized the same curriculum, course handouts, course
quizzes, and course final. See Table 3.5 for a list of course content of for the flipped and
lecture classrooms.

50
Table 3.5: Course Content for the Flipped and Lecture Model Remedial Math Courses
Math Content Math Study Skills
Review Material and Syllabus
Handout-Polynomials
Handout-Solving Equations
How to read the syllabus
Presentation- How to Learn Math
Presentation-Time Management
Handout-Weekly Time Management
Handout- Time Management Month at a
Glace
Factoring Units (Review Material): Presentation-Notetaking
Class Activity for Notetaking
Presentation-Active Listening
Rational Expressions Unit Presentation-How to study for a Test
MSLQ Pre-Survey
Presentation-How to Evaluate My
Understanding
Handout-Test Corrections
Graphing Unit Verbal Reminders to Apply Study Skills
System of Equations Verbal Reminders to Apply Study Skills
Radical Expressions MSLQ Post-Survey
COMPASS Post-Exam
Data Collection Procedures
The study population includes all students enrolled in two sections of Math 095
during the fall 2014 semester and two sections of Math 095 during the spring 2015
semester. Class lists, the COMPASS placement exam, a Demographic Questionnaire,
and the MSLQ survey were used to collect data. Data collected from class lists provided
information of class rank and degree option. The COMPASS placement exam was used
to determine pre and post math placements as well as reading score of students. The
COMPASS pre math scores were collected from the COMPASS database the first week

51
of classes and the post math scores were collected the last week of classes. Students that
did not have COMPASS scores were assigned to complete the COMPASS placement test
outside of class as homework during the first week of classes. The Demographic
Questionnaire provided data of student characteristics and was collected when students
completed the MSLQ pre-survey. The MSLQ survey provided pre and post scores for
control of learning, self-efficacy and self-regulation. The MSLQ pre-survey was
completed by students approximately the fourth week of classes after the completion of
the rational expressions unit. The MSLQ post-survey was completed in class the week of
scheduled classes. The MSLQ survey took approximately an hour to complete and was
given to students during scheduled class time. All data collected was entered into SPSS
for analyses.
Sample Population
The sample population of students that participated in this study are students that
completed all of the following requirements: signed a consent form, completed a pre and
post Compass exam, and completed a pre and post MSLQ survey. The flipped classroom
had a total response rate of 28 out of 53 (53%) of students that completed the
requirements of the study and the lecture classroom had a total of 32 out of 59 (54%) of
students that completed the requirements of the study.
Data collected for the both samples includes student characteristics; pre
COMPASS Math Placement scores; and pre MSLQ survey scores. A Chi-Square was
performed using sample characteristics and pre-math placements. In addition, an
independent series t-test was performed using pre COMPASS math scores and pre MSLQ

52
survey scores. See Table 3.6 below for a description of both groups in the study and
results of the analyses. The analysis is discussed in more detail in the group equivalence
section below.
There were a total of 28 students that participated in the flipped classroom and 32
students that participated in the lecture classroom. The chi-square tests for group
equivalency across a number of participant characteristics showed no differences in
students in each class. The flipped classroom consisted of 79% female and 21% male
students. The students in the lecture classroom was 81% female and 19% male. In the
flipped classroom 64% of students were traditional age and 36% of students were non-
traditional age. The lecture classroom had 56% traditional age and 44% non-traditional
age students. In the flipped classroom 18% were first semester students and 82%
returning students. In the lecture classroom 28% traditional age and 72% returning
students. There were more students enrolled in the AS degree program in the lecture
classroom which was 62% of students compared to 47% of students in the flipped
classroom. There were 14% of students enrolled in a four-year degree program and 39%
of students enrolled in a two-year program in the flipped classroom. The lecture
classroom had 16% of students enrolled in a four-year program and 22% of students
enrolled in a two-year program. The majority of students in both groups scored between
80 to 89 on the reading placement exam with 68% in the flipped classroom and 69% in
the lecture classroom. The majority of the students in this study had earned a high school
diploma. There were fewer students in the flipped classroom that completed four math
courses in high school and earned a diploma with 57% percent in the flipped classroom

53
compared 78% of students in the lecture classroom. In the flipped classroom 29% of
students completed 3 math courses in high school and earned a diploma compared to 19%
of students in the lecture classroom. There were 14% of students that completed two or
less math courses in high school and earned a GED compared to 3% of students in the
lecture classroom. The majority of students in both groups reported their last math
course was completed within the last year with 75% in the flipped classroom and 81% in
the lecture classroom. There were 18% of students in the flipped classroom who reported
it was greater than or equal to four years since their last math course compared to 13% of
students in the lecture classroom. There were 43% of students in the flipped classroom
who reported a positive or no opinion in terms of the math emotions compared to 44% of
students who reported a positive math emotion and 34% of students who reported no
opinion in terms of math emotions in the lecture classroom. More students in the flipped
classroom completed two courses in college with 50% of students compared to 25% of
students in the lecture classroom. There were 25% of students in the flipped classroom
that completed one course in the flipped classroom compared to 41% of students in the
lecture classroom. This would indicate that more students in the flipped classroom
initially tested in lower remedial math courses during their first semester compared to
students in the lecture classroom. Most of the students in the study were enrolled in or
had completed a college success course with 75% of students in the flipped classroom
and 81% of students in the lecture classroom. Fewer students in both groups were
required to enroll in a remedial writing course with 14% of students in the flipped
classroom compared to 6% of students in the lecture classroom. There were fewer

54
students in the flipped classroom that reported that they had good computer technology
skills with 46% of students in the flipped classroom compared to 69% of students in the
lecture classroom. The pre-math placements were higher for students enrolled in the
lecture classroom with 31% of students placing in Math 095 compared to 14% of students
in the flipped classroom. The flipped classroom had 39% of students place into math 061
compared to 22% of students in the lecture classroom.

55
Table 3.6: Sample Population Characteristics Characteristics Flipped
n=28
Lecture
n=32
Pearson Chi-Square
Gender
Male
Female
6 (21%)
22 (79%)
6 (19%)
26 (81%)
.796
Age
Non-traditional ( >24 )
Traditional Age
10 (36%)
18 (64%)
14 (44%)
18 (56%)
.526
Class Rank
First Semester
Returning
5 (18%)
23 (82%)
9 (28%)
23 (72%)
.357
Degree Option
4-year degree
2-year degree
AS Degree or transfer
4 (14%)
11 (39%)
13 (47%)
5 (16%)
7 (22%)
20 (62%)
.328
Reading Scores
30 to 79
80 to 98
9 (32%)
19 (68%)
10 (31%)
22 (69%)
.941
Previous Math Experience
No H.S. and GED
2 or more and GED
3 in H.S. and Diploma
4 in H.S. and Diploma
2 (7%)
2 (7%)
8 (29%)
16 (57%)
1 (3%)
0 (0%)
6 (19%)
25 (78%)
.226
Last math class
Less than or equal to 1
2 years
3 years
Greater than or equal to 4
21 (75%)
2 (7%)
0 (0%)
5 (18%)
26 (81%)
1 (3%)
1 (3%)
4 (13%)
.633
Math Emotions
Negative
No opinion
Positive
4 (14%)
12 (43%)
12 (43%)
7 (22%)
11 (34%)
14 (44%)
.687
College Math
No courses
1 course in college
2 courses in college
7 (25%)
7 (25%)
14 (50%)
11 (34%)
13 (41%)
8 (25%)
.130

56
Table 3.6: Sample Population Characteristics Continued Characteristics Flipped
n=28
Lecture
n=32
Pearson Chi-Square
College Success .558
Yes 21 (75%) 26 (81%)
No 7 (25%) 6 (25%)
Writing 095 .301
Yes 4 (14%) 2 (6%)
No 24 (86%) 30 (94%)
Computer Skills .176
Fair 7 (25%) 6 (19%)
Good 13 (46%) 22 (69%)
Excellent 8 (14%) 4 (13%)
Pre Math Placement .187
Math 061 11 (39%) 7 (22%)
Math 090 13 (46%) 15 (47%)
Math 095 4 (14%) 10 (31%)
To complete the MSLQ students were instructed to select their response to the
questions using a likert-scale ranging from 1 (not at all true of me) to 7 (very true of me).
Analysis indicated that the two groups in the study were equivalent on control of learning
beliefs, self-efficacy and self-regulation (See Table 3.7). Students in the flipped model
classroom had a mean score of 5.18 (SD = 1.41) for control of learning beliefs, 5.23
(SD=1.17) for self-efficacy and 4.62 (SD = 1.08) for self-regulation. The lecture model
classroom had a mean score of 5.18 (SD = 1.41) for control of learning beliefs, 5.23
(SD=1.17) for self-efficacy and 4.64 (SD = .979) for self-regulation.

57
Table 3.7: Sample Population Test Results
Test Results Mean (SD) Mean (SD) T-test
Pre Math Scores 28.68 (8.61) 33.69 (11.76) ρ= .068
Pre MSLQ
Control of Learning 5.18 (1.41) 5.18 (1.28) ρ= .997
Self-Efficacy 5.23 (1.17) 5.23 (1.21) ρ= .978
Self-Regulation 4.63 (1.08) 4.64 (.979) ρ= .955
* The survey results reflect values before the factorial analysis was conducted
Group Equivalence
In order to answer the research questions for this study it was necessary to
establish that the students participating in the flipped classroom were equivalent to
students participating in the lecture classroom. Group equivalence was determined by
comparing the sample characteristics; pretest Compass results and the pre-MSLQ survey
results. A Pearson Chi-square was performed for variables that were nominal and an
independent sample t-tests was used for scored variables. The results of the tests
indicate that there is no significant difference between students participating in the
flipped classroom compared to students participating in the lecture classroom, therefore
the two groups in this study are equivalent. A Pearson Chi-square is a non-parametric
tool designed to analyze group differences when the variable is measured at a nominal
level (McHugh, 2013).
Instrumentation Overview
This study utilized the MSLQ survey and the COMPASS Math test. Both
instruments utilized a pre and posttest design. The MSLQ was used to measure student’s
pre and post control of learning, self-efficacy and self-regulation scores. The COMPASS

58
math test was used to measure a student’s initial math score at the start of the study and to
measure a student’s final math score at the end of the study. Additional data collected
from a demographic questionnaire and class lists was used to examine student
characteristics and determine group equivalence. Dependent and Independent variables
are discussed in more detail in the variables section. The following paragraphs provide
more detail about the instruments used in this study.
MSLQ Survey
The MSLQ survey developed by Pintrich et al. (1991) was used for this study.
The survey can be used to measure a student’s motivation and use of self-regulation
skills. The original survey contains 81 questions but the survey is not discipline specific
and categories can be customized by the user to measure specific areas of interest
(Pintrich et al., 1991). For this study students answered the entire survey but the only the
sections of control of learning, self-efficacy and self-regulation of interest to answer the
research questions. To complete the MSLQ students were instructed to select their
response to the questions using a likert-scale ranging from 1 (not at all true of me) to 7
(very true of me). A copy of the original MSLQ survey is located in Appendix A.
Validity and Reliability of the Original MSLQ Survey
The results for validity and reliability of the Original MSLQ survey were
presented by Pintrich et al. (1991) in the manual for the use of the MSLQ. Validity was
determined using confirmatory analysis and Lambda-Ksi (LX) estimates were calculated
for the motivation and self-regulation skills scale items. Lambda-Ksi estimates of .8 or
higher indicates well-defined latent constructs. As a result of the confirmatory factor

59
analyses the subscales represent a coherent conceptual and empirically validated
framework for assessing student motivation and use of self-regulation skills in the college
classroom (Pintrich et al., 1991).
In order to begin the analysis of the data collected for this study utilizing the
MSLQ survey. Student were asked to respond to the survey questions using a likert scale
of 1-7 where 7 = very true of me and 1= not at all true of me. For responses between 1
and 7, students were asked to select the number that best described them. There were two
questions that were recorded as reverse values (1=6, 2=5, 3=4, 4=3, 5=2, 6=1 and 7=0).
All data was entered into SPSS for analyses.
A factor analysis was performed to validate the factor validity of the constructs
used for this study. The factor analysis was performed using all 24 questions utilized for
this study to determine if the questions would be reduced from one factor into the three
factors of control of learning, self-efficacy and self-regulation as defined by the authors
of the MSLQ. The analysis included the extraction and rotation using principle
components method which indicated that there are six factors that accounted for 72% of
the variance. The scree plot illustrated that the construct with 24 dimensions would
demonstrate validity when loaded into four factors. Another factor analysis was
performed and the 24 dimensions were reduced to four factors. The analysis included the
extraction and rotation using principle components method. The resulting three
interpretable factors are Self-Efficacy (5, 6, 12, 15, 20, 21, 29 and 31), Self-Regulation
(36, 44, 54, 55, 56, 76), and Control of Learning (57r, 33r, 18, 2, 9). The resulting
eigenvalues range from .507 to .836. Eigenvalues of .70 or greater when the number of

60
variables used are less than 30 are considered fairly reliable (Mertler and Vannatta, 2010)
and factor loadings of .8 or higher indicate well-defined latent constructs (Pintrich, 1991).
According to Stevens (2001) as reported by Mertler and Vannatta (2010), components
with four or more loadings above .60 are reliable regardless of sample size. After
examination of the results Question #61 was eliminated from this study due to low
validity result below .40. The resulting factors with loadings for this study and the
original MSLQ (Pintrich, 1991) and responding questions are listed in Table 3.9.
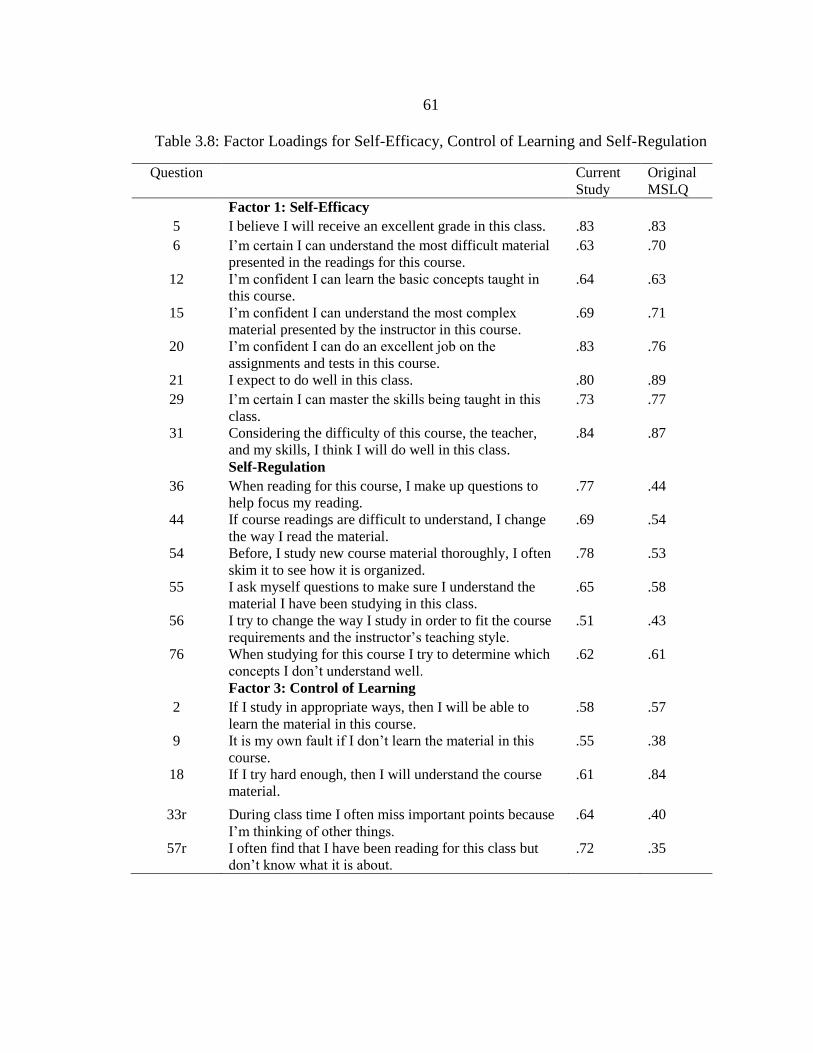
61
Table 3.8: Factor Loadings for Self-Efficacy, Control of Learning and Self-Regulation
Question Current
Study
Original
MSLQ
Factor 1: Self-Efficacy
5 I believe I will receive an excellent grade in this class. .83 .83
6 I’m certain I can understand the most difficult material
presented in the readings for this course.
.63 .70
12 I’m confident I can learn the basic concepts taught in
this course.
.64 .63
15 I’m confident I can understand the most complex
material presented by the instructor in this course.
.69 .71
20 I’m confident I can do an excellent job on the
assignments and tests in this course.
.83 .76
21 I expect to do well in this class. .80 .89
29 I’m certain I can master the skills being taught in this
class.
.73 .77
31 Considering the difficulty of this course, the teacher,
and my skills, I think I will do well in this class.
.84 .87
Self-Regulation
36 When reading for this course, I make up questions to
help focus my reading.
.77 .44
44 If course readings are difficult to understand, I change
the way I read the material.
.69 .54
54 Before, I study new course material thoroughly, I often
skim it to see how it is organized.
.78 .53
55 I ask myself questions to make sure I understand the
material I have been studying in this class.
.65 .58
56 I try to change the way I study in order to fit the course
requirements and the instructor’s teaching style.
.51 .43
76 When studying for this course I try to determine which
concepts I don’t understand well.
.62 .61
Factor 3: Control of Learning
2 If I study in appropriate ways, then I will be able to
learn the material in this course.
.58 .57
9 It is my own fault if I don’t learn the material in this
course.
.55 .38
18 If I try hard enough, then I will understand the course
material.
.61 .84
33r During class time I often miss important points because
I’m thinking of other things.
.64 .40
57r I often find that I have been reading for this class but
don’t know what it is about.
.72 .35

62
Reliability was determined by calculating internal consistency estimates of
reliability of the defined factors of control of learning, self-efficacy, and self-regulation.
Cronbach’s Alpha was also performed to determine the internal consistency of the
constructs where values close to 1.0 which indicate a good internal reliability.
Cronbach’s Alpha values that are greater than .70 are considered acceptable to excellent.
The results of Cronbach’s Alpha for this study ranged from .77 to .93. Overall, the
results of the tests for validity and reliability indicate the MSLQ survey for this study is a
valid instrument. The results for the factors of control of learning, self-efficacy and self-
regulation are listed in Table 3.9.
Table 3.9: Cronbach’s Alphas for the MSLQ scales Scale Question Numbers Reliability Coefficients
Current Study Original MSLQ
Control of Learning Belief 2, 9, 18, 33r, 57r .78 .68
Self-Efficacy 5, 6, 12, 15, 20, 21, 29, 31 .93 .93
Self-Regulation *r indicates reverse code
36, 44, 54, 55, 56, 76 .83 .79
ACT COMPASS Placement Test
The ACT COMPASS placement test is a computer-adaptive placement test used
at Highlands College to place students in the appropriate math course. The math
placement test is a multiple-choice test that evaluates a students' math ability. The test
offers five placement domains (test areas): pre-algebra, algebra, college algebra,
geometry and trigonometry. In this study students started the test in the Algebra domain
which consists of approximately 10 questions. The test is intuitive so if a student answers
the questions correctly they will be moved to a higher domain and if they answer

63
questions incorrectly they will be moved to lower domain. A concordance scale
created by ACT was used to convert pre-algebra domain scores to algebra domain scores.
When students finish the test they are given a cut-score and a math placement which is
the name of the course that is appropriate for their skill level. The cut-scores and the
math placements used at Highlands College were established using ACT
recommendations.
Table 3.10: Highlands College Math Placement Cut-Scores and Math Placements
Cut-score Math Placement
Placement Domain Algebra 0-23
24-44
Math 061
Math 090
45-70 Math 095
71-100 Math 121
The reading test was also administered to assist in establishing group equivalency
when students completed the math pretest. The reading test is a multiple-choice test that
is comprised of five types of reading comprehension passages. The test is scored out of a
total of 100 points. A cut-score of 80 or higher is used to indicate if a student has the
reading skills required to be successful in a college level course. Details of the math and
reading test are located at the ACT website
(http://www.act.org/compass/tests/math.html).
Variables
The dependent variables used in this study are post scores for control of learning,
self-efficacy, self-regulation, and posttest COMPASS math. The scores for control of
learning, self-efficacy and self-regulation were self-reported student responses from the

64
MSLQ survey. Students rated their responses using a seven point Likert scale and
responses were coded as 1 = not at all true of me and 7 = very true of me. Questions on
the MSLQ were not grouped by each construct and appeared on the survey in random
order. The MSLQ survey is located in Appendix A. Table 3.11 shows the dependent
variables in this study as well the code, range and data type.
Table 3.11: Dependent Variables including code, range and data type
Dependent Variables Code Range Data Type
MSLQ Post Control of Learning 1-7 5-35 Scale
MSLQ Post Self-Efficacy 1-7 8-56 Scale
MSLQ Post Self-Regulation Score 1-7 6-42 Scale
COMPASS Post Math Placement 0-100 Scale
The independent variables for this study were chosen because each student
characteristic or a combination of student characteristics may influence the results in this
study. Table 3.12 shows the independent variables used in this study as well their code,
range and data type.

65
Table 3.12: Independent Variables including Code, Range and Data Type
Independent Variables
Code
Range
Data Type
Gender
Male
Female
0
1
0-1 Nominal
Enrollment Status
Non-traditional Age (> or =25)
Traditional Age
0
1
0-1 Nominal
Class Rank
First Semester College
Returning Student
Degree Option
4-year degree (BS)
2-year degree (AAS)
AS transfer (AS)
0
1
0
1
2
0-1
0-2
Nominal
Nominal
Math Experience
How many years of math did you complete in high
school
Did not complete math in H.S. and earned GED
Completed 2 or more years in H.S. and earned
GED
Completed 3 years in H.S. and earned diploma
Completed 4 years in H.S. and earned diploma
1
2
3
4
1-4
Ordinal
How many math courses did you complete in college
Did not complete a college math course
Completed one math course in college
Completed two math courses in college
1
2
3
1-3 Ordinal
Time since last math class
Less than or equal to 1 year
Two years
Three years
Greater than or equal to four years
1
2
3
4
1-4 Ordinal
What are your feelings about Math (Math Emotions)
Negative
No Opinion
Positive
1
2
3
1-3 Ordinal
Completed or Enrolled in a College Success Course
(study skills course)
Yes
No
0
1
0-1 Nominal

66
Table 3.12 Continued
Independent Variables Code Range Data Type
Enrolled in Writing 095
Yes
No
0
1
0-1 Ordinal
Computer Technology Skills
I never or rarely use a computer (poor)
I use a computer to access email and internet
(fair)
I frequently use a computer and utilize various
programs (good)
I’m confident using a computer and can
troubleshoot
most technical problems (excellent)
1
2
3
4
1-4 Ordinal
COMPASS Reading Placement Test 0-100 Scale
The following paragraphs provide a description of independent variables for this
study:
Gender refers to the sex of the participant.
Age refers to the age of a participant where a traditional-age students is defined as
student who is less than or equal to twenty-four years old and non-traditional student is a
student who is twenty-five years old or older.
Class rank asks participants to identify if they a first semester college student or a
returning college student. Students who are first semester students may have more
difficulty adjusting to the culture of college than students who have more experience.
Degree option asks participants to identify if they are enrolled in a transfer
program (AS), a two-year program (AAS) or a four-year program (BS).
Math experience asks participants to identify how many math courses they
completed in high school as well as whether they received a high school diploma or
GED. They are also asked to identify how many courses they completed in college.
67
Time since last math class asks participants to indicate how long it has been since
they were enrolled in a math course. This information may indicate if a student simply
needs a review of material or if a student needs to learn forgotten material.
How you feel about math (math emotions) asks participants to indicate if they
have negative or positive feelings towards math. Negative feelings towards math may
impact a participant’s performance in a math course
Completed or enrolled in a College Success Course (study skills course) asks
participants to indicate if they are enrolled in or completed a College Success Course. A
participant’s knowledge of study skills could influence how they respond to the MSLQ
survey.
Enrolled in Writing 095 asks participants to indicate if they are enrolled in the
writing 095 course. The writing 095 course at Highlands College is a remedial writing
course. It is noted by previous research that students who are enrolled or place in more
than one remedial course are more academically at-risk than students that students that
place in one remedial course.
Computer Technology Skills asks participants to rate their computer skills
because both courses in this study require students to use a computer. Poor computer
technology skills may influence a participant’s performance in a math course.
COMPASS Math Placement results were recorded at the start and the end of the
study. The pre math placements were used to determine group equivalence of students in
the flipped and lecture model classrooms because students with a low math placement
may have too many deficiencies to perform well in Math 095 and should in reality be

68
enrolled in the prerequisite course of Math 090. Also, students who score on the higher
end of the range for enrollment into Math 095 may only need a brief review of concepts
and may not apply study skills strategies as a result of their participation in either
classroom.
COMPASS Reading Placement test scores were recorded for each participant in
the study. These scores were used to determine group equivalence. In addition, was
necessary to determine if a student had the adequate reading skills to be successful in a
college math course due to notetaking requirements of students in both classrooms.
Students that scored below 80 in reading were advised they may have difficulty in college
level courses with reading requirements.
Data Analysis
This study investigated if the flipped model is an effective teaching model for
students enrolled in a remedial math course. The results of this study will be used to
inform other college remedial math instructors so every effort will be made to eliminate
threats to external and internal validity.
Group equivalency was determined by performing a Pearson chi-square on
categorical data and t-tests were performed on scored data to determine if students in the
flipped classroom were the same as students in the lecture classroom. Also, a factor
analysis and reliability measures were analyzed using pre MSLQ scores to establish
validity and reliability of the MSLQ survey.
The questions of the study were answered by utilizing frequency data to report
descriptive statistics of student characteristics and prior academic experience for students

69
enrolled in the remedial math. In addition, independent series t-tests were performed to
compare the post MSLQ scores and posttest COMASS math scores of students in the
flipped and lecture classroom. A series of linear multiple regressions were performed to
determine if there are associations between pre MLSQ scores on pretest and posttest
COMPASS math scores as well as associations between pretest COMPASS scores on
post MSLQ scores.
External Validity:
The Instructor for both the flipped and lecture model courses in this study is also
the researcher for this study. The instructor will avoid any chance of experimenter bias
by not communicating expectations of the study with student participants or
demonstrating enthusiasm towards one teaching model. Another threat to external
validity in this study may be students that have already completed or are enrolled in the
College Success course on the results of the MSLQ pre-survey. These students have
been introduced to study skill strategies in the College Success course so they have a
better awareness of how they should study and may self-report rating themselves higher
on the survey than students that do not have that knowledge. To control for this threat all
students in the study were asked to identify if they have completed or are enrolled in the
College Success course so data analyses can be performed to determine if they had an
influence on the results. Every effort was made to ensure the study results are
generalizable to other remedial math courses.

70
Internal Validity:
The potential sources of internal validity with this pre and posttest design research
study includes the following: the two groups being compared in this study may be
different, students may do better on the posttest than they did on the pretest but the
improvement in the score may or may not be a result of the flipped model classroom;
students who complete the MSLQ questionnaire may not answer the questions honestly
or they do not have the experience to be able to reflect on their use of study skills or their
experience accurately. According to Bowman (2011), students who have lower
standardized test scores may offer inflated estimates of their cognitive, intrapersonal and
interpersonal development. To avoid these threats of internal validity controls were
implemented. Sample selection for this study was random and students enrolled in a
math 095 course based on the availability of their schedules. Students did not have
knowledge of the course differences when they registered for class. Both math 095
courses in the study were the same. The only difference was the delivery method. Both
classes had the same curriculum, homework assignments, tests, and final. They utilized
the same text book and online material. Student demographic data was collected to
perform statistical analyses to determine if the groups in the study are equivalent. Also,
the survey was administered to students after they were introduced to new math concepts
to encourage students to reflect accurately on their use of self-regulation to avoid the
situation where students did not need to apply many self-regulation skills during the
review material. In addition, the instructor reinforced the importance of students
responding to the survey honestly by discussing there are no right or wrong answers to

71
the survey and they will benefit more from the results if they answer the survey honestly.
To avoid threats of internal validity to the COMPASS posttest, students will receive
points for their performance to encourage students to put effort into the test so students
do not simply take the posttest to complete it.
Summary
This quasi-experimental study that utilized a pretest and posttest design
investigated the effectiveness of the flipped model to teach a remedial math course. The
study utilized class lists, a 24 item version of the MSLQ test, an 11 item demographic
survey to collect data, and the COMPASS test. The class list was used to identify student
characteristics of class rank and degree option. The MSLQ was used to measure a
student’s use of control of learning, self-efficacy and self-regulation. The demographic
survey was used to collect student characteristics of gender, age, and prior academic
knowledge. The COMPASS test was used to collect pretest math scores, posttest math
scores and reading scores. The study included students that completed the following
requirements: signed a consent form, completed a pre and post Compass exam, and
completed a pre and post MSLQ survey. The flipped classroom had a total of 28 out of
53 (53%) students that completed the requirements of the study and the lecture classroom
had a total of 32 out of 59 (54%) students that completed the requirements of the study.
There was a total of 60 students that participated in the study.
Data was analyzed using SPSS software to determine group equivalence of the
students in the flipped and lecture classrooms and a factor analysis was performed to
determine the validity and reliability of the MSLQ survey. The factor analysis
72
determined that it was necessary to remove one construct from MSLQ survey but overall
the instrument was determined to be reliable. To answer the research questions analyses
included frequency data to report the descriptive statistics of students in remedial math;
independent t-tests were performed to report significant difference of MSLQ data and
posttest COMPASS scores; and multiple regressions were performed to report
associations among dependent and independent variables in the study.
Results of this study will be used to inform remedial math instructors if the
flipped classroom is an effective teaching method for students in a remedial math course
and if this method influences a student’s use of control of learning, self-efficacy and self-
regulation in a remedial math course.
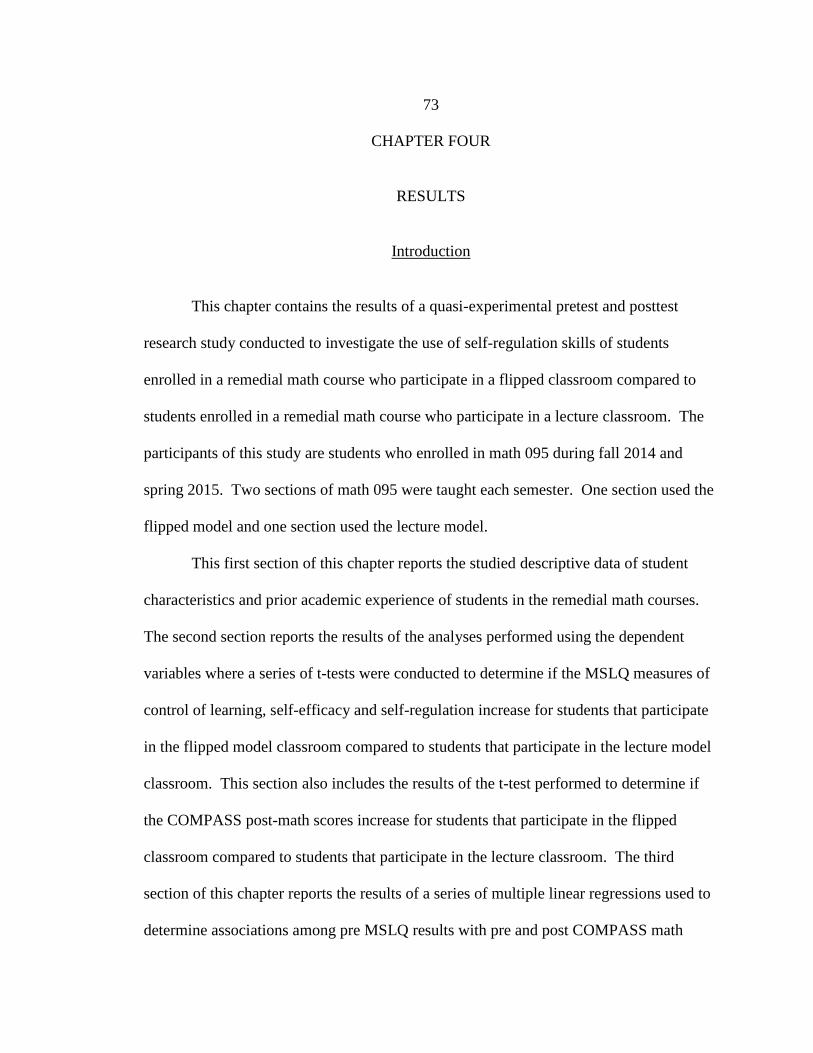
73
CHAPTER FOUR
RESULTS
Introduction
This chapter contains the results of a quasi-experimental pretest and posttest
research study conducted to investigate the use of self-regulation skills of students
enrolled in a remedial math course who participate in a flipped classroom compared to
students enrolled in a remedial math course who participate in a lecture classroom. The
participants of this study are students who enrolled in math 095 during fall 2014 and
spring 2015. Two sections of math 095 were taught each semester. One section used the
flipped model and one section used the lecture model.
This first section of this chapter reports the studied descriptive data of student
characteristics and prior academic experience of students in the remedial math courses.
The second section reports the results of the analyses performed using the dependent
variables where a series of t-tests were conducted to determine if the MSLQ measures of
control of learning, self-efficacy and self-regulation increase for students that participate
in the flipped model classroom compared to students that participate in the lecture model
classroom. This section also includes the results of the t-test performed to determine if
the COMPASS post-math scores increase for students that participate in the flipped
classroom compared to students that participate in the lecture classroom. The third
section of this chapter reports the results of a series of multiple linear regressions used to
determine associations among pre MSLQ results with pre and post COMPASS math

74
scores for students in the flipped and lecture classroom. The research questions for this
study are as follows:
1) What are characteristics of students who enroll in a remedial math course?
2) Do the control of learning scores on the MSLQ increase in students that
participate in a flipped model remedial math course compared to students that
participate in a lecture model remedial math course?
3) Do the self-efficacy scores on the MSLQ increase in students that participate
in a flipped model remedial math course compared to students that participate
in a lecture model remedial math course?
4) Do the self-regulation scores on the MSLQ increase in students that
participate in a flipped model remedial math course compared to students that
participate in a lecture model remedial math course?
5) How do the posttest COMPASS math scores of students who participate in a
flipped model remedial math course compare to posttest COMPASS math
scores of students who participate in a lecture model remedial math course?
6) Do the results of pre MSLQ scores of control of learning, self-efficacy or self-
regulation predict the pretest COMPASS math scores (course placement) of
students in this study?
7) Do the results of the pre MSLQ scores of control of learning, self-efficacy or
self-regulation predict the posttest COMPASS math scores (course outcome)
of students in this study?

75
8) Do the results of pretest COMPASS math scores predict post MSLQ scores of
control of learning, self-efficacy and self-regulation for students that
participate in this study?
Descriptive Data Results
Student Characteristics
Students in a remedial math course are a diverse group of learners with different
learning needs in the classroom. Some students need to refresh skills while others may
need to learn the material for the first time. Individual student characteristics also can
influence a student’s learning needs in the classroom. Research question#1 asks, “What
are the student characteristics of students who enroll in a remedial math course?” The
intent of this question was to learn more about students who enroll in a remedial math
course to better understand their individual learning needs by exploring the sample
characteristics.
Previously, in Chapter 3 (Table 3.6) group equivalence for students in both
classrooms determined that students in both classrooms were the same when comparing
student characteristics. To investigate characteristics of students in this study, the sample
was combined to increase the power of analysis to test remedial math student’s
relationships with the dependent variables of pre math test, post math test, and the pre
and post test results of the MSLQ (control of learning, self-efficacy, and self-regulation)
discussed later in this chapter. Descriptive data for participants in the study was
collected using class lists, a demographic survey, the MSLQ survey and results of the
COMPASS test. Student characteristics include gender, age, class rank, and degree

76
option. A summary of the student characteristics are provided in Table 4.1. The table
includes the frequency data for the student characteristics of students that participated in
the flipped and lecture classroom.
Table 4.1: Descriptive Statistics of Student Characteristics
Student Characteristics Flipped Lecture Total
Sample
Study Sample N (%) 28 (47%) 32 (53%) 60 (100%)
Gender
Male 6 (21%) 6 (19%) 12 (20%)
Female 22 (79%) 26 (81%) 48 (80%)
Age
Non-traditional(≥25) 10 (36%) 14 (44%) 24 (40%)
Traditional Age 18 (64%) 18 (56%) 36 (60%)
Class Rank
First Semester 5 (18%) 9 (28%) 14 (23%)
Returning 23 (82%) 23 (72%) 46 (67%)
Degree Option
4-year degree 4 (14%) 5 (16%) 9 (15%)
AS Degree or transfer 13 (47%) 20 (62%) 33 (55%)
2-year degree 11 (39%) 7 (22%) 18 (30%)
There were a total of 60 students that participated in this study. 47% of students
were enrolled in the flipped classroom and 53% of students were enrolled in the lecture
classroom. There were more female students in the study than male students. The
flipped classroom was 79% female and the lecture classroom was 81% female. The
majority of students in the study were traditional age with a total of 60% traditional age
students compared to 40% non-traditional age students. Both classrooms were similar
when comparing the age of students with 64% traditional age students in the flipped
classroom compared to 56% traditional age students in the lecture classroom. Students in
the study were primarily returning students with 82% of students in the flipped classroom
compared to 72% of students in the lecture classroom. There were 39% of students

77
enrolled in a two year degree program in the flipped classroom compared to 22% of
students enrolled in a two year degree program in the lecture classroom. The majority of
students in both classrooms were enrolled in the AS degree option with 47% in the
flipped classroom and 62% in the lecture classroom. There were 14% of students in the
flipped classroom compared to 16% of students in the lecture classroom enrolled in a
four-year degree program.
Prior Academic Experience
Descriptive data of prior academic experience was also collected to learn more
about remedial math students. The analysis below combined the two classes into one
sample to increase the power to test the relationship between the student’s characteristics
on MSQL results and COMPASS math scores. Overall, the prior academic knowledge
(pretest COMPASS math) of students in both classrooms were similar and not found to
be significantly different (Table 3.7).
The intent was to understand how prior math experience may influence the
relationship between student’s characteristics as well as measures of pretest and posttest
math scores and posttest MSQL results. Data was collected utilizing a demographic
questionnaire that accompanied the MSLQ pre-survey. Data for prior academic
experience includes the following: reading scores, previous math experience, time since
last math class, math emotions, participation in a college math course, participation in a
college success course, enrollment in a remedial writing course, computer skills and pre
COMPASS math placements. A summary of student prior academic experience is
provided in Table 4.2. This table includes frequency data for students that participated in

78
the flipped and lecture classroom. Results for pretest and posttest math scores and the
MSLQ are in Table 4.3.
Table 4.2: Prior Academic Experience
Variable Flipped (%) Lecture (%) Total
Sample (%)
Study Sample N (%) 28 (47%) 32 (53%) 60 (100%)
Reading Scores
30 to 79 9 (32%) 10 (31%) 19 (32%)
80 to 98 19 (68%) 22 (69%) 41 (68%)
Previous Math Experience
No H.S and GED 2 ( 7%) 1 ( 3%) 3 ( 5%)
2 H.S. and GED 2 ( 7%) 0 ( 0%) 2 ( 4%)
3 H.S. and Diploma 8 (29%) 6 (19%) 14 (23%)
4 H.S. and Diploma 16 (57%) 25 (57%) 41 (68%)
Time since last math class
Less than or equal to 1 21 (75%) 26 (81%) 47 (78%)
2 years 2 ( 7%) 1 ( 3%) 3 ( 5%)
3 years 0 ( 0%) 1 ( 3%) 1 ( 2%)
Greater than or equal to 4 5 (18%) 4 (13%) 9 (15%)
Math Emotions
Negative 4 (14%) 7 (22%) 11 (18%)
No Opinion 12 (43%) 11 (34%) 23 (39%)
Positive 12 (43%) 14 (44%) 26 (43%)
College Math
No courses 7 (25%) 11 (34%) 18 (30%)
1 course in college 7 (25%) 13 (41%) 20 (33%)
2 courses in college 14 (50%) 8 (25%) 22 (37%)
College Success Course
Yes 21 (75%) 26 (81%) 47 (78%)
No 7 (25%) 6 (19%) 13 (22%)
Enrolled in Writing 095
Yes 4 (14%) 2 ( 6%) 6 (10%)
No 24 (86%) 30 (94%) 54 (90%)
Computer Technology
Fair 7 (25%) 6 (19%) 13 (22%)
Good 13 (46%) 22 (69%) 35 (58%)
Excellent 8 (29%) 4 (13%) 12 (20%)
Pre Math Placements
Math 061 11 (39%) 7 (22%) 18 (30%)
Math 090 13 (46%) 15 (47%) 28 (47%)
Math 095 4 (14%) 10 (31%) 14 (23%)
Test Result Mean (SD) Mean (SD) ρ-Value
Pretest COMPASS Math 28.68 (8.61) 33.69 (11.76) .063

79
Approximately, one-third of students in both classrooms demonstrated reading
scores below 80%. There were 32% of students in the flipped classroom and 31% of
students in the lecture classroom with low reading scores. The majority of students
reported completing three or four years of math in high school and earning a high school
diploma. 57% of students in both classrooms indicated completing four years of math in
high school and earning a diploma. There were 29% of students in the flipped classroom
and 19% of students in the lecture classroom that reported completing three years of math
in high school and earning a high school diploma. In addition, most students in the study
reported completing a math course within the past year with 75% of students in the
flipped classroom and 81% of students in the lecture classroom. Also, 50% of students in
the flipped classroom indicated they completed two college math courses compared to
25% of students in the lecture classroom. There were 41% of students in the lecture
classroom compared to 25% of students in the flipped classroom. There were 25% of
students in the flipped classroom that indicated they did not complete a college math
course compared to 34% of students in the lecture classroom. Overall, 70% of students
in the study required prior math remediation before enrolling in the study. Most of the
students in the study indicated they were currently enrolled in or had completed a college
success course with 75% students in the flipped classroom and 81% of the students in the
lecture classroom. A small number of students were required to enroll in a remedial
writing course with 14% of students in the flipped classroom and 6% of students in the
lecture classroom. More students in the lecture classroom indicated that they had good
computer technology skills with 69% of students in the lecture classroom compared to

80
46% of students in the flipped classroom. There were 25% of students in the flipped
classroom that reported their computer technology skills as fair compared to 19% of
students in the lecture classroom. More students in the flipped classroom reported their
computer technology skills as excellent with 29% of students compared to 13% of
students in the lecture classroom. There were no students in either classroom that
reported their computer technology skills as poor.
Dependent Variables
The dependent variables for this study are the measures of the posttest scores for
the MSLQ and COMPASS math test. The MSLQ scales are control of learning, self-
efficacy, and self-regulation. This data was collected to answer the research questions
testing for group differences on control of learning, self-efficacy, self-regulation, and
posttest COMPASS math scores. The means for the dependent variables are listed in
Table 4.3. The table includes the mean scores for the pretest, the posttest, gain scores
(posttest minus pretest), the t-values and the ρ-values for the dependent variables. The
overall findings indicate that there were no statistical differences between the class type
and the MSLQ results or COMPASS math scores for any of the pre and post measures.

81
Table 4.3: Descriptive Statistics for the MSLQ Scales and the COMPASS Math Test
MSLQ Results
Range 1-7
Flipped
N=28
Lecture
N=32
T-Value p-value
Mean
(SD)
Mean
(SD)
Control of Learning
Pretest 5.19
(1.30)
5.43
(1.18)
-.763 .448
Posttest 5.51
(0.82)
5.66
(0.93)
-.650 .518
Gain Scores .32 .23 .362 .719
(1.27) (.762)
Self-Efficacy
Pretest 5.23
(1.17)
5.22
(1.21)
.031 .976
Posttest 5.42
(1.28)
5.41
(1.41)
.029 .977
Gain Scores .19 .19 .002 .502
(1.30) (.998)
Self-Regulation
Pretest 4.35
(1.25)
4.36
(1.14)
-.015 .988
Posttest 5.51
(0.82)
5.66
(0.94)
-.650 .518
Gain Scores .49 .53 -.123 .903
(1.72) (.964)
COMPASS Math*
Pretest
28.68
(8.61)
33.69
(11.76)
-1.897 .063
Posttest 41.32
(13.36)
40.56
(13.93)
.215 .831
Gain Scores 12.64 6.88 1.76 .084
(12.03) (13.25)
*COMPASS Math cut-scores: Math 061 (0-23), Math 090 (24-44), Math 095 (45-70).
Independent t-tests were conducted to test the group differences using the mean
scores for the pretest and posttest of control of learning as well as using the mean gain
scores (posttest minus pretest) of control of learning. The results of the independent t-
tests using the mean scores for the pretest and posttest control of learning scores found

82
students in the flipped classroom (M = 5.19, SD = 1.30) and students in the lecture
classroom (M = 5.43, SD = 1.18) did not differ significantly on pre control of learning,
t (58) = -.763, ρ = .45. Students in the flipped classroom (M = 5.66, SD = 0.93) and
students in the lecture classroom (M = 5.51, SD = 0.82) did not differ significantly on
post control of learning, t (58) = -.650, ρ = -.52. The results of the independent t-test
using the mean gain scores for control of learning found that students in the flipped
classroom (M = .32, SD = 1.27) and students in the lecture classroom (M = .23,
SD = .762) did not differ significantly in control of learning, t (58) = .362, ρ = .72. The
overall gain of control of learning from the pretest to the posttest for students in the
flipped classroom was 0.32 compared to 0.23 for students in the lecture classroom.
Independent t-tests were conducted to test the group differences using the mean
scores for the pretest and posttest of self-efficacy as well as using the mean gain scores
(posttest minus pretest) of self-efficacy. The results of the independent t-tests using the
mean scores for the pretest and posttest self-efficacy scores found students in the flipped
classroom (M = 5.23, SD = 1.17) and students in the lecture classroom (M = 5.22,
SD = 1.21) did not differ significantly on pre self-efficacy, t (58) = .031, ρ= .98. Students
in the flipped classroom (M = 5.42, SD = 1.28) and students in the lecture classroom (M
= 5.41, SD = 1.41) did not differ significantly on post self-efficacy, t (58) = .029, ρ= .98.
The results of the independent t-test using the mean gain scores for self-efficacy found
that students in the flipped classroom (M = .19, SD = 1.30) and students in the lecture
classroom (M = .19, SD = .10) did not differ significantly in self-efficacy, t (58) = .002,

83
ρ = .50. The overall gain in self-efficacy from the pretest to the posttest for students in
both classrooms was 0.19.
Independent t-tests were conducted to test the group differences using the mean
scores for the pretest and posttest of self-regulation as well as using the mean gain scores
(posttest minus pretest) of self-regulation. The results of the independent t-test using the
mean scores for pretest and posttest self-regulation scores found students in the flipped
classroom (M = 4.35, SD = 1.25) and students in the lecture classroom (M = 4.36,
SD = 1.14) did not differ significantly on pre-self-regulation, t (58) = -.01, ρ= .988.
Students in the flipped classroom (M = 5.51, SD = 0.82) and students in the lecture
classroom (M = 5.66, SD = 0.94) did not differ significantly on post self-regulation,
t (58) = -.650, ρ = .518. The results of the independent t-test using the mean gain scores
of self-regulation found that students in the flipped classroom (M = .49, SD = 1.72) and
students in the lecture classroom (M = .53, SD = .96) did not differ significantly in self-
regulation, t (58) = -.123, ρ = .90. The overall gain in self-regulation from pretest to
posttest for students in the flipped classroom was 1.16 compared to 1.30 for students in
the lecture classroom.
Independent t-tests were conducted to test the group differences using the mean
scores for the pretest and posttest of COMPASS math scores as well as using the mean
gain scores (posttest minus pretest) of COMPASS math scores. The results of the
independent t-tests using the mean scores for the pretest and posttest COMPASS math
scores found students in the flipped classroom (M = 28.68, SD = 8.61) and students in the
lecture classroom (M = 33.69, SD = 11.76) did not differ significantly on pretest math
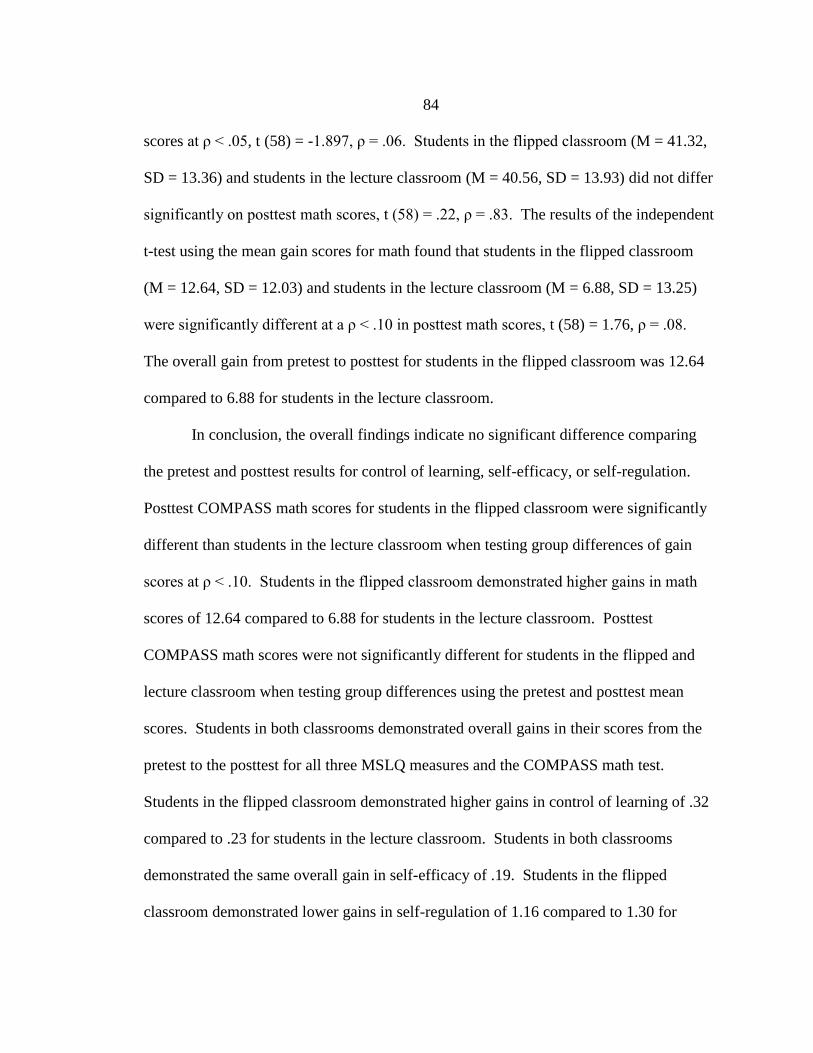
84
scores at ρ < .05, t (58) = -1.897, ρ = .06. Students in the flipped classroom (M = 41.32,
SD = 13.36) and students in the lecture classroom (M = 40.56, SD = 13.93) did not differ
significantly on posttest math scores, t (58) = .22, ρ = .83. The results of the independent
t-test using the mean gain scores for math found that students in the flipped classroom
(M = 12.64, SD = 12.03) and students in the lecture classroom (M = 6.88, SD = 13.25)
were significantly different at a ρ < .10 in posttest math scores, t (58) = 1.76, ρ = .08.
The overall gain from pretest to posttest for students in the flipped classroom was 12.64
compared to 6.88 for students in the lecture classroom.
In conclusion, the overall findings indicate no significant difference comparing
the pretest and posttest results for control of learning, self-efficacy, or self-regulation.
Posttest COMPASS math scores for students in the flipped classroom were significantly
different than students in the lecture classroom when testing group differences of gain
scores at ρ < .10. Students in the flipped classroom demonstrated higher gains in math
scores of 12.64 compared to 6.88 for students in the lecture classroom. Posttest
COMPASS math scores were not significantly different for students in the flipped and
lecture classroom when testing group differences using the pretest and posttest mean
scores. Students in both classrooms demonstrated overall gains in their scores from the
pretest to the posttest for all three MSLQ measures and the COMPASS math test.
Students in the flipped classroom demonstrated higher gains in control of learning of .32
compared to .23 for students in the lecture classroom. Students in both classrooms
demonstrated the same overall gain in self-efficacy of .19. Students in the flipped
classroom demonstrated lower gains in self-regulation of 1.16 compared to 1.30 for

85
students in the lecture classroom. Students in the flipped classroom demonstrated higher
gains in math scores of 12.64 compared to 6.88 for students in the lecture classroom.
Regression Analysis of Variables
A series of linear multiple regression equations were performed to examine the
associations among students enrolled in the flipped and lecture classroom using measures
of the math pretest, math posttest, the pre MSLQ and the post MSLQ scores. A series of
Ordinary Least Squares (OLS) regression models were estimated to answer the research
questions. All OLS regression assumptions were tested before analysis and data was
found not to violate any assumptions (http://www.statisticssolutions.com/assumptions-of-
linear-regression/). In addition, a bivariate correlation analysis was performed to
determine if multicollinearity existed among variables in the study (Table 4.5). The
following paragraphs discuss the results of the bivariate correlation analysis, the
descriptions of the OLS regression models and the results of the OLS models.
A bivariate correlation analysis was used to examine significant correlations
between variables in the OLS models and determined a number of items are significantly
correlated. Multicollinearity is a problem that arises when moderate to high correlations
exits among predator variables (IV’s) used in a regression analysis because the variables
may be measuring the same amount of variance on the dependent variable (Mertler and
Vannatta, 2010). The variables of pre control of learning and pre self-efficacy are
significantly correlated, r = .615, ρ < .01. An r = .615 illustrates a moderate to high
correlation between pre control of learning and pre self-efficacy suggesting further
investigation was needed to determine the presence of multicollinearity. The variables
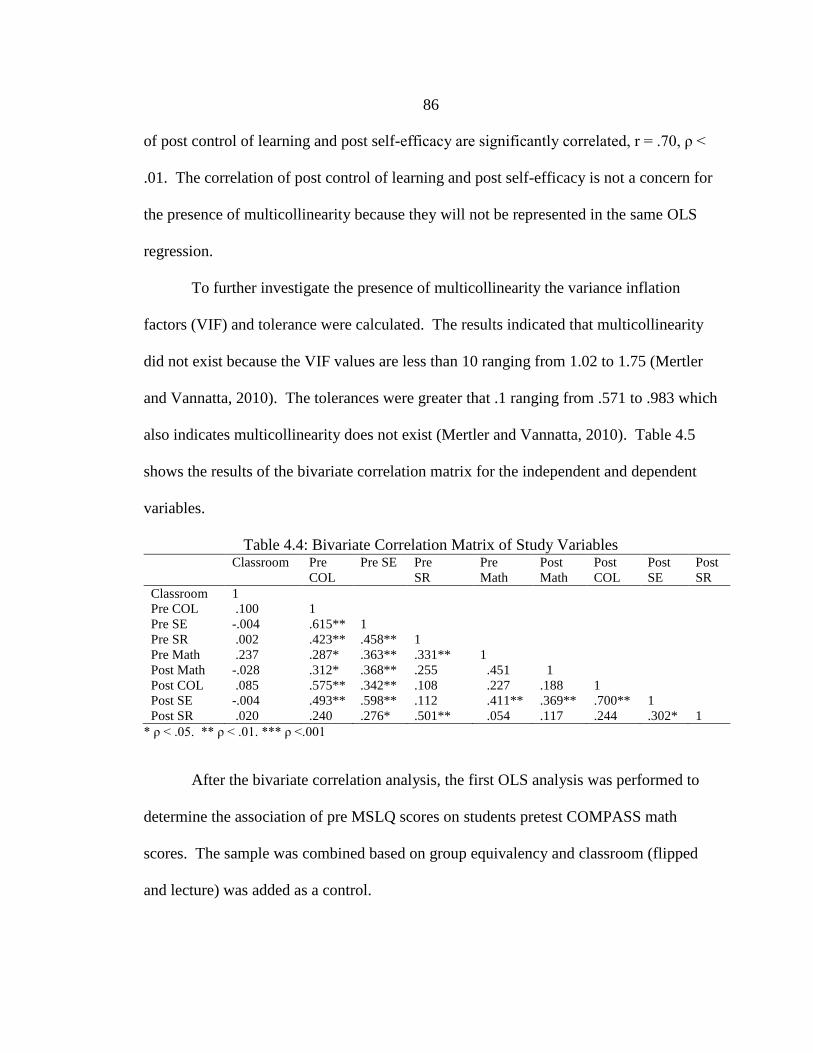
86
of post control of learning and post self-efficacy are significantly correlated, r = .70, ρ <
.01. The correlation of post control of learning and post self-efficacy is not a concern for
the presence of multicollinearity because they will not be represented in the same OLS
regression.
To further investigate the presence of multicollinearity the variance inflation
factors (VIF) and tolerance were calculated. The results indicated that multicollinearity
did not exist because the VIF values are less than 10 ranging from 1.02 to 1.75 (Mertler
and Vannatta, 2010). The tolerances were greater that .1 ranging from .571 to .983 which
also indicates multicollinearity does not exist (Mertler and Vannatta, 2010). Table 4.5
shows the results of the bivariate correlation matrix for the independent and dependent
variables.
Table 4.4: Bivariate Correlation Matrix of Study Variables Classroom Pre
COL
Pre SE Pre
SR
Pre
Math
Post
Math
Post
COL
Post
SE
Post
SR
Classroom 1
Pre COL .100 1
Pre SE -.004 .615** 1
Pre SR .002 .423** .458** 1
Pre Math .237 .287* .363** .331** 1
Post Math -.028 .312* .368** .255 .451 1
Post COL .085 .575** .342** .108 .227 .188 1
Post SE -.004 .493** .598** .112 .411** .369** .700** 1
Post SR .020 .240 .276* .501** .054 .117 .244 .302* 1
* ρ < .05. ** ρ < .01. *** ρ <.001
After the bivariate correlation analysis, the first OLS analysis was performed to
determine the association of pre MSLQ scores on students pretest COMPASS math
scores. The sample was combined based on group equivalency and classroom (flipped
and lecture) was added as a control.

87
The first OLS regression was performed to answer research question #6, “Do the
results of pre MSLQ scores of control of learning, self-efficacy or self-regulation predict
the pretest COMPASS math scores (course placement) of students in this study?” To
answer this question, a model-building strategy was used to conduct the OLS regression.
Model 1 is the baseline association of classroom plus the pretest score for control of
learning on pretest COMPASS math scores. Model 2 is the baseline association of
classroom plus the pretest score for self-efficacy on the pre COMPASS math scores.
Model 3 is the baseline association of classroom plus the pretest score for self-regulation
on the pretest COMPASS math scores. Model 4 is the association of classroom plus all
three pre MSLQ measures of control of learning, self-efficacy and self-regulation on the
pretest COMPASS math scores. A summary of the model building steps are below and
the results of the analyses are in Table 4.5:
Model 1: Pretest COMPASS math score = Classroom + Pre Control of Learning
Model 2: Pretest COMPASS math score = Classroom + Pre Self-Efficacy
Model 3: Pretest COMPASS math score = Classroom + Pre Self-Regulation
Model 4: Pretest COMPASS math score = Classroom + Pre Control of Learning +
Pre Self-Efficacy + Pre Self-Regulation

88
Table 4.5: OLS Regression for Pre MSLQ scores on Pretest COMPASS Math Scores Model
1
Model
2
Model
3
Model
4
B
(SE)
T-
Value
(ρ)
B
(SE)
T-
Value
(ρ)
B
(SE)
T-
Value
(ρ)
B
(SE)
T-
Value
(ρ)
Constant 12.35
(6.78)
1.82
(.07)
6.50
(6.95)
.935
(.35)
10.73
(6.28)
1.71
(.09)
2.69
(7.49)
.359
(.72)
Pre COL 2.29
(1.07)
2.13*
(.04)
.146
(1.34)
.356
(.721)
Pre SE 3.278
(1.08)
3.046*
(.004)
2.34
(1.42)
1.65
(.11)
Pre SR 2.97
(1.09)
2.73**
(.008)
1.84
(1.23)
1.50
(.14)
Classroom 4.45
(2.63)
1.69
(.096)
5.04
(2.52)
2.00
(.05)
5.00
(2.56)
1.95
(.056)
4.99
(2.53)
1.97
(.054)
F-value
df
4.11*
2
6.61**
2
5.65**
2
3.94**
4
R2 0.13 0.19 0.17 0.22
Adj R2 0.10 0.16 0.14 0.17
* ρ < .05. ** ρ < .01. *** ρ <.001
The results of the association of classroom plus pre control of learning on pretest
COMPASS math scores (Model 1) reports an evaluation of how well the pretest
COMPASS math score are predicted by students (classroom) and their pre control of
learning score. Results of the regression indicated students and pre control of learning
explained 13% variance (R2 = .13, F (2, 59) = 4.11, ρ = .02). It was found that students
(classroom) did not significantly predict pretest math scores (β = 4.45, ρ = .096),
however, pre control of learning significantly predicted pretest COMPASS math scores
(β = 2.29, ρ = .04).
The results of the association of classroom plus pre self-efficacy on pretest
COMPASS math scores (Model 2) reports an evaluation of how well the pretest
COMPASS math score is predicted by students (classroom) and their pre self-efficacy
score. Results of the regression indicated students and pre self-efficacy explained 19%
variance (R2 = .19, F (2, 59) = 6.61, ρ = .003). It was found that classroom did
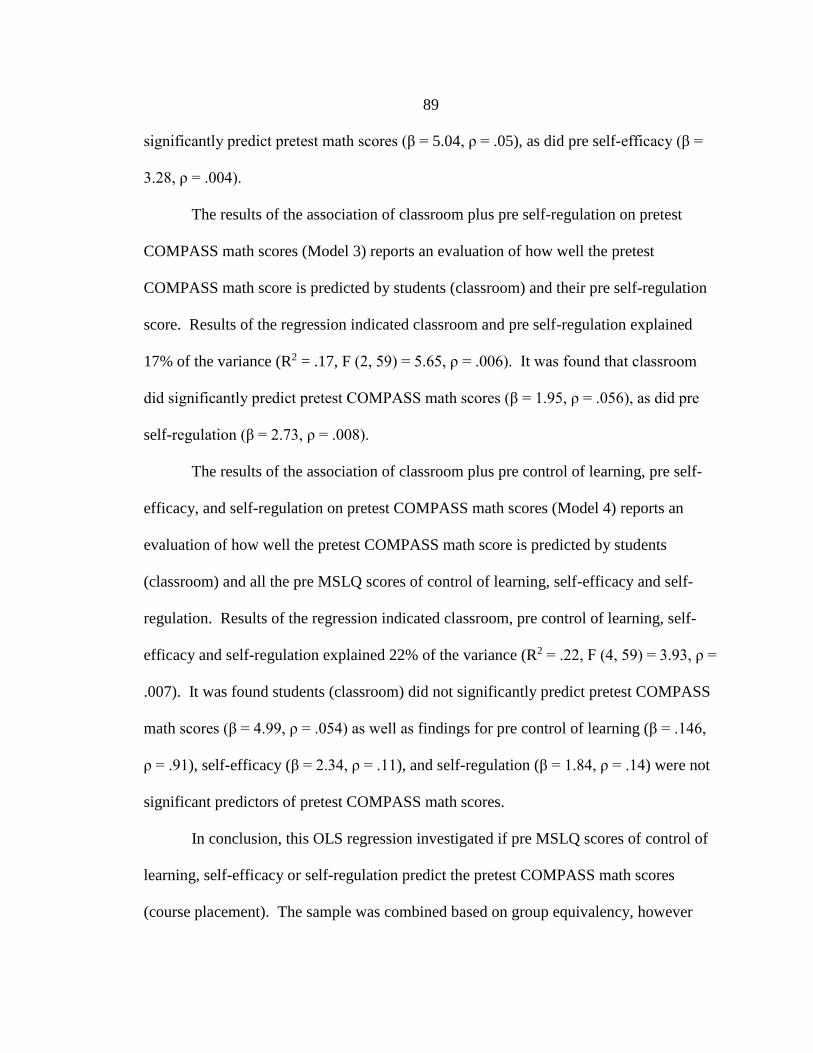
89
significantly predict pretest math scores (β = 5.04, ρ = .05), as did pre self-efficacy (β =
3.28, ρ = .004).
The results of the association of classroom plus pre self-regulation on pretest
COMPASS math scores (Model 3) reports an evaluation of how well the pretest
COMPASS math score is predicted by students (classroom) and their pre self-regulation
score. Results of the regression indicated classroom and pre self-regulation explained
17% of the variance (R2 = .17, F (2, 59) = 5.65, ρ = .006). It was found that classroom
did significantly predict pretest COMPASS math scores (β = 1.95, ρ = .056), as did pre
self-regulation (β = 2.73, ρ = .008).
The results of the association of classroom plus pre control of learning, pre self-
efficacy, and self-regulation on pretest COMPASS math scores (Model 4) reports an
evaluation of how well the pretest COMPASS math score is predicted by students
(classroom) and all the pre MSLQ scores of control of learning, self-efficacy and self-
regulation. Results of the regression indicated classroom, pre control of learning, self-
efficacy and self-regulation explained 22% of the variance (R2 = .22, F (4, 59) = 3.93, ρ =
.007). It was found students (classroom) did not significantly predict pretest COMPASS
math scores (β = 4.99, ρ = .054) as well as findings for pre control of learning (β = .146,
ρ = .91), self-efficacy (β = 2.34, ρ = .11), and self-regulation (β = 1.84, ρ = .14) were not
significant predictors of pretest COMPASS math scores.
In conclusion, this OLS regression investigated if pre MSLQ scores of control of
learning, self-efficacy or self-regulation predict the pretest COMPASS math scores
(course placement). The sample was combined based on group equivalency, however

90
classroom (flipped and lecture) was added as a control. It was found that each individual
pre MSLQ measure is a significant predictor on pretest COMPASS math scores. The
variable classroom which represented all students in the study was not a significant
predictor on pretest COMPASS math scores, although the p-values for classroom in all
four models suggest they may be significant with a larger sample size. When all the
variables of pre MSLQ measure are included with students in the classroom no
significant predictors were determined on the pretest COMPASS math scores.
The second OLS regression analysis was used to determine the association of pre
MSLQ scores on student’s posttest COMPASS math scores to answer research question
#7. The sample was combined based on group equivalency and classroom (flipped and
lecture) was added as a control. Research #7 asks, “Do the results of the pre MSLQ
scores of control of learning, self-efficacy or self-regulation predict the posttest
COMPASS math scores (course outcomes) of students in this study?” To answer
research question #7, a model-building strategy was used to conduct the OLS regression.
Model 1a is the baseline association of classroom plus the pretest scores for control of
learning on the posttest COMPASS math scores. Model 1b includes Model 1a plus the
pretest COMPASS math scores. Model 2a is the baseline association of classroom plus
the pretest scores for self-efficacy on the posttest COMPASS math scores. Model 2b
includes Model 1a plus the pretest COMPASS math scores. Model 3a is the baseline
association of classroom plus the pretest scores of self-regulation on the posttest
COMPASS math scores. Model 3b includes Model 3a plus the pretest COMPASS math
scores. Model 4a is the baseline association of classroom plus all three pre-MSLQ scores

91
of control of learning, self-efficacy and self-regulation on the posttest COMPASS math
scores. Model 4b includes Model 4a plus the pretest COMPASS math scores. A
summary of the model building steps is below and the results of the analyses are in Table
4.6:
Model 1a: Posttest COMPASS math scores = Classroom + Pre Control of
Learning
Model 1b: Posttest COMPASS math scores = Classroom + Pre Control of
Learning + Pretest COMPASS math
Model 2a: Posttest COMPASS math scores = Classroom + Pre Self-Efficacy
Model 2b: Posttest COMPASS math scores = Classroom + Pre Self-Efficacy +
Pretest COMPASS math
Model 3a: Posttest COMPASS math scores = Classroom + Pre Self-Regulation
Model 3b: Posttest COMPASS math scores = Classroom + Pre Self-Regulation +
Pretest COMPASS math
Model 4a: Posttest COMPASS math scores = Classroom + Pre Control of
Learning + Pre Self-Efficacy + Pre Self-Regulation
Model 4b: Posttest COMPASS math scores = Classroom + Pre Control of
Learning + Pre Self-Efficacy + Pre Self-Regulation + Pretest COMPASS math
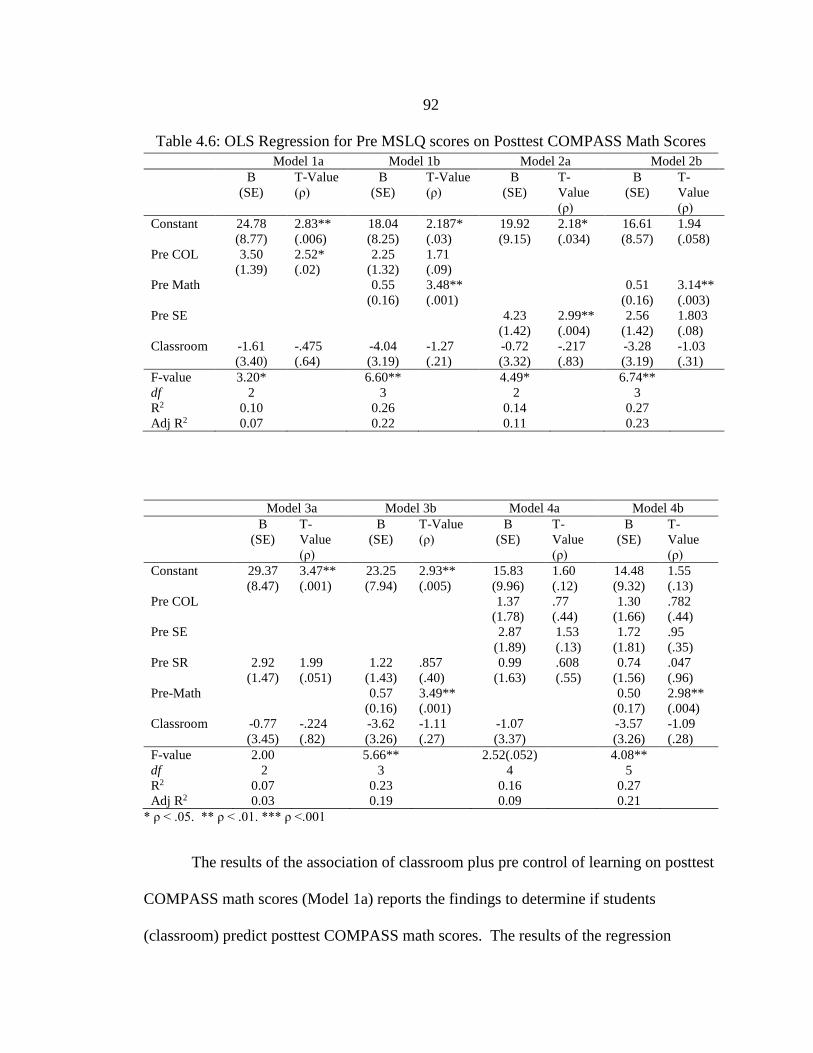
92
Table 4.6: OLS Regression for Pre MSLQ scores on Posttest COMPASS Math Scores
Model 1a Model 1b Model 2a Model 2b
B
(SE)
T-Value
(ρ)
B
(SE)
T-Value
(ρ)
B
(SE)
T-
Value
(ρ)
B
(SE)
T-
Value
(ρ)
Constant 24.78
(8.77)
2.83**
(.006)
18.04
(8.25)
2.187*
(.03)
19.92
(9.15)
2.18*
(.034)
16.61
(8.57)
1.94
(.058)
Pre COL 3.50
(1.39)
2.52*
(.02)
2.25
(1.32)
1.71
(.09)
Pre Math 0.55
(0.16)
3.48**
(.001)
0.51
(0.16)
3.14**
(.003)
Pre SE 4.23
(1.42)
2.99**
(.004)
2.56
(1.42)
1.803
(.08)
Classroom -1.61
(3.40)
-.475
(.64)
-4.04
(3.19)
-1.27
(.21)
-0.72
(3.32)
-.217
(.83)
-3.28
(3.19)
-1.03
(.31)
F-value
df
3.20*
2
6.60**
3
4.49*
2
6.74**
3
R2 0.10 0.26 0.14 0.27
Adj R2 0.07 0.22 0.11 0.23
Model 3a Model 3b Model 4a Model 4b
B
(SE)
T-
Value
(ρ)
B
(SE)
T-Value
(ρ)
B
(SE)
T-
Value
(ρ)
B
(SE)
T-
Value
(ρ)
Constant 29.37
(8.47)
3.47**
(.001)
23.25
(7.94)
2.93**
(.005)
15.83
(9.96)
1.60
(.12)
14.48
(9.32)
1.55
(.13)
Pre COL 1.37
(1.78)
.77
(.44)
1.30
(1.66)
.782
(.44)
Pre SE 2.87
(1.89)
1.53
(.13)
1.72
(1.81)
.95
(.35)
Pre SR 2.92
(1.47)
1.99
(.051)
1.22
(1.43)
.857
(.40)
0.99
(1.63)
.608
(.55)
0.74
(1.56)
.047
(.96)
Pre-Math 0.57
(0.16)
3.49**
(.001)
0.50
(0.17)
2.98**
(.004)
Classroom -0.77
(3.45)
-.224
(.82)
-3.62
(3.26)
-1.11
(.27)
-1.07
(3.37)
-3.57
(3.26)
-1.09
(.28)
F-value
df
2.00
2
5.66**
3
2.52(.052)
4
4.08**
5
R2 0.07 0.23 0.16 0.27
Adj R2 0.03 0.19 0.09 0.21
* ρ < .05. ** ρ < .01. *** ρ <.001
The results of the association of classroom plus pre control of learning on posttest
COMPASS math scores (Model 1a) reports the findings to determine if students
(classroom) predict posttest COMPASS math scores. The results of the regression

93
indicated classroom and pre control of learning explained 10% of the variance (R2 = .10,
F (2, 59) = 3.20, ρ = .048). It was found students (classroom) did not significantly
predicted posttest COMPASS math scores (β = -1.61, ρ = .64) but findings indicate pre-
control of leaning is a significant predictor of posttest COMPASS math scores (β = 3.50,
ρ = .02).
The results of the association of students (classroom) plus pre control of learning
and pretest COMPASS math scores on posttest COMPASS math scores (Model 1b).
Model 1b reports the findings to determine if the posttest COMPASS math score is
predicted by students (classroom), their pre control of learning score and their pretest
COMPASS math score. The results of the regression indicated students (classroom), pre
control of learning and pretest COMPASS math scores explained 26% of the variance (R2
= .26, F (3, 59) = 6.60, ρ = .001). It was found that classroom did not significantly
predict posttest COMPASS math scores (β = -4.04, ρ =.21) and pre control of learning
did not significantly predict posttest COMPASS math scores (β = 2.24, ρ = .09), but
pretest COMPASS math scores did significantly predict posttest COMPASS math scores
(β = .55, ρ = .001).
The results of the association of classroom plus pre self-efficacy on posttest
COMPASS math scores (Model 2a) report the findings to determine if students
(classroom) predict posttest COMPASS math scores. The results of the regression
indicated classroom and pre self-efficacy explained 14% of the variance (R2 = .14, F (2,
59) = 4.49, ρ = .015). It was found students (classroom) did not significantly predicted

94
posttest COMPASS math scores (β = -.719, ρ = .83) but findings indicate pre self-
efficacy is a significant predictor of posttest COMPASS math scores (β = 4.23, ρ = .004).
The results of the association of students (classroom) plus pre self-efficacy and
pretest COMPASS math scores on posttest COMPASS math scores (Model 2b). Model
2b reports the findings to determine if posttest COMPASS math scores are predicted by
students (classroom), their pre self-efficacy score and their pretest COMPASS math
score. The results of the regression indicated students (classroom), pre self-efficacy and
pretest COMPASS math scores explained 27% of the variance (R2 = .27, F (3, 59) = 6.74,
ρ = .001). It was found that classroom did not significantly predict posttest COMPASS
math scores (β = -3.28, ρ =.31) and pre self-efficacy did not significantly predict posttest
COMPASS math scores (β = 2.56, ρ = .08), however pretest COMPASS math scores did
significantly predict posttest COMPASS math scores (β = .51, ρ = .003).
The results of the association of classroom plus pre self-regulation on posttest
COMPASS math scores (Model 3a) reports the findings to determine if students
(classroom) predict posttest COMPASS math scores. The results of the regression
indicated classroom and pre self-efficacy did not significantly explain 7% an amount of
the variance (R2 = .07, F (2, 59) = 2.00, ρ = .14). It was found students (classroom) did
not significantly predict posttest COMPASS math scores (β = -.77, ρ = .14) as well as pre
self-regulation did not predict posttest COMPASS math scores (β = 2.92, ρ = .051).
The results of the association of students (classroom) plus pre self-regulation and
pretest COMPASS math scores on posttest COMPASS math scores (Model 3b). Model
3b reports the findings to determine if posttest COMPASS math scores are predicted by
95
students (classroom), their pre self-regulation score and their pretest COMPASS math
score. The results of the regression indicated students (classroom), pre self-regulation
and pretest COMPASS math scores explained 23% of the variance (R2 = .23, F (3, 59) =
5.66, ρ = .002). It was found that classroom did not significantly predict posttest
COMPASS math scores (β = -3.62, ρ =.27) and pre self-regulation did not significantly
predict posttest COMPASS math scores (β = 1.22, ρ = .40), however, pretest COMPASS
math scores did significantly predict posttest COMPASS math scores (β = .57, ρ = .001).
The results of the association of pre control of learning, pre self-efficacy, pre self-
regulation and students (classroom) on posttest COMPASS math scores (Model 4a)
reports the findings to determine if posttest COMPASS math scores are predicted by all
three pre MSLQ scores of control of learning, self-efficacy, and self-regulation as well as
students. The results of the regression indicated pre control of learning, pre self-efficacy,
pre self-regulation and students (classroom) explained 16% of the variance (R2 = .16, F
(4, 59) = 2.52, ρ = .052).
It was found pre control of learning did not significantly predict posttest
COMPASS math scores (β = 1.37, ρ = .44); pre self-efficacy did not significantly predict
posttest COMPASS math scores (β = 2.89, ρ = .13); pre self-regulation did not
significantly predict posttest COMPASS math scores (β = .994, ρ = .55), and classroom
did not significantly predict posttest COMPASS math scores (β = -1.07, ρ = .75).
In conclusion, this OLS regression analysis was used to determine the association
of pre MSLQ scores on student’s posttest COMPASS math scores (placement). The
sample was combined based on group equivalency and classroom (flipped and lecture)

96
was added as a control. The findings of each individual measure of pre control of
learning, and pre self-efficacy pre self-regulation are significant predictors of posttest
COMPASS math scores. The finding for pre self-regulation with a ρ-value of .051
indicates it may be a significant predictor on posttest COMPASS scores. The finding for
classroom indicates is it not a significant predictor in all four models on posttest
COMPASS math scores. When all the pre MSLQ measures plus students in the study
were included in the model no significant associations were found on posttest COMPASS
math scores. The models were repeated and the control for pretest COMPASS math
scores was added to all four models. When the pretest COMPASS math scores are
included the pre MSLQ measures are not significant predictors on posttest COMPASS
math scores. When all the variables of pre MSLQ measures, students in the classroom
and pretest COMPASS math scores are included in the regression the results indicate that
pretest COMPASS math scores are the only significant predictor on posttest COMPASS
math scores.
The third OLS regression was used to determine the association of pre
COMPASS math scores on post MSLQ scores to answer research question #8, “Do the
results of pretest COMPASS math scores predict post MSLQ scores of control of
learning, self-efficacy and self-regulation for students that participate in this study?” To
answer this question the sample was combined based on equivalency (Table 3.6) and a
model-building strategy was used to conduct the OLS regression. Model 1a is the
baseline association of pretest COMPASS math scores on post control of learning scores.
Model 1b is Model 1a plus pre control of learning scores. Model 2a is the baseline

97
association of pretest COMPASS math scores on post self-efficacy scores. Model 2b is
Model 2a plus pre self-efficacy scores. Model 3a is the baseline association of pretest
COMPASS math scores on post self-regulation scores. Model 3b is Model 3a plus pre
self-regulation scores. A summary of the model building steps is below and the results of
the analyses are in Table 4.7:
Model 1a: Post Control of Learning = Pretest COMPASS Math
Model 1b: Post Control of Learning = Pretest COMPASS Math + Pre Control of
Learning
Model 2a: Post Self-Efficacy = Pretest COMPASS Math
Model 2b: Post Self-Efficacy = Pretest COMPASS Math + Pre Self-Efficacy
Model 3a: Post Self-Regulation = Pretest COMPASS Math
Model 3b: Post Self-Regulation = Pretest COMPASS Math + Pre Self-Regulation
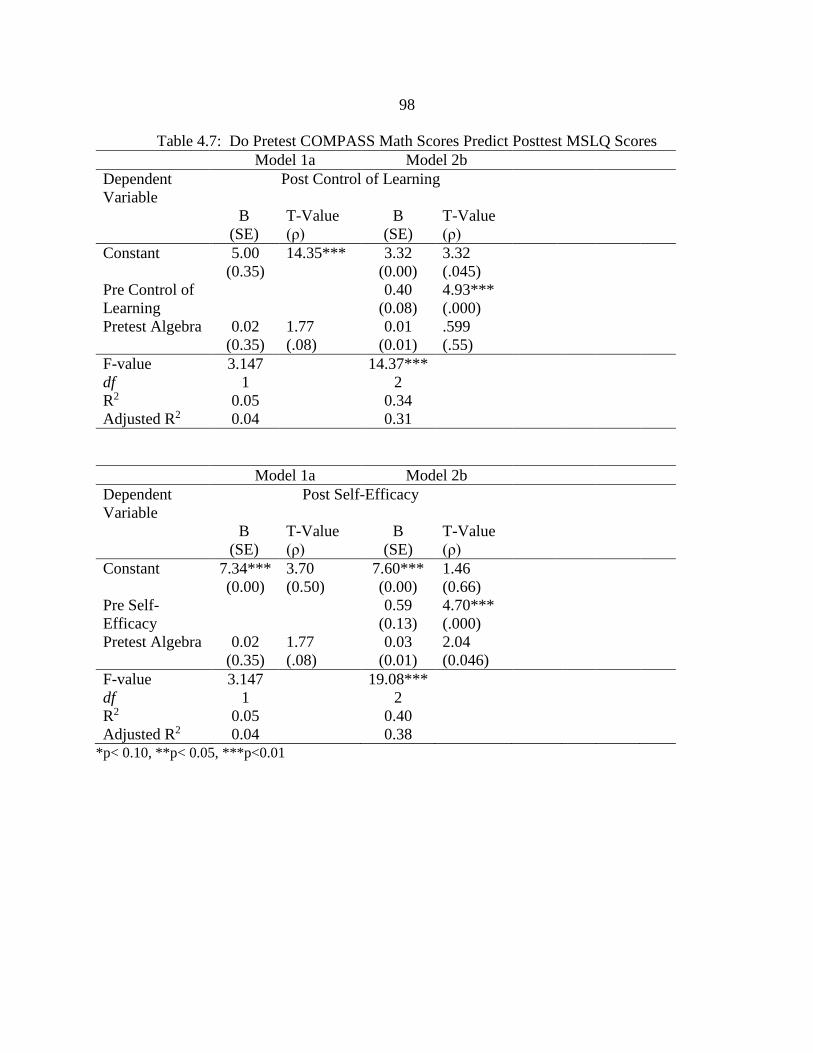
98
Table 4.7: Do Pretest COMPASS Math Scores Predict Posttest MSLQ Scores
Model 1a Model 2b
Dependent
Variable
Post Control of Learning
B
(SE)
T-Value
(ρ)
B
(SE)
T-Value
(ρ)
Constant 5.00
(0.35)
14.35***
3.32
(0.00)
3.32
(.045)
Pre Control of
Learning
0.40
(0.08)
4.93***
(.000)
Pretest Algebra 0.02
(0.35)
1.77
(.08)
0.01
(0.01)
.599
(.55)
F-value
df
3.147
1
14.37***
2
R2 0.05 0.34
Adjusted R2 0.04 0.31
Model 1a Model 2b
Dependent
Variable
Post Self-Efficacy
B
(SE)
T-Value
(ρ)
B
(SE)
T-Value
(ρ)
Constant 7.34***
(0.00)
3.70
(0.50)
7.60***
(0.00)
1.46
(0.66)
Pre Self-
Efficacy
0.59
(0.13)
4.70***
(.000)
Pretest Algebra 0.02
(0.35)
1.77
(.08)
0.03
(0.01)
2.04
(0.046)
F-value
df
3.147
1
19.08***
2
R2 0.05 0.40
Adjusted R2 0.04 0.38 *p< 0.10, **p< 0.05, ***p<0.01

99
Table 4.7: Do Pretest COMPASS Math Scores Predict Posttest MSLQ Scores Continued
Model 3a Model 3b
Dependent
Variable
Post Self-Regulation
B
(SE)
T-Value
(ρ)
B
(SE)
T-Value
(ρ)
Constant 4.70
(0.42)
11.30***
(.000)
3.20
(0.49)
6.53***
(.000)
Pre Self-
Regulation
0.47
(0.10)
4.51***
(.000)
Pretest Algebra 0.01
(0.01)
.415
(.68)
-0.12
(0.12)
-1.04
(.30)
F-value
df
0.172
1
10.27***
2
R2 0.00 0.27
Adjusted R2 -0.01 0.24
*p< 0.10, **p< 0.05, ***p<0.01
The results of the association of pretest COMPASS math scores on posttest
control of learning (Model 1a) reports the findings to determine if pretest COMPASS
math scores predict the posttest control of learning scores. The results of the regression
indicated pretest COMPASS math scores did not significantly explain variance in posttest
control of learning scores (R2 = .05, F (1, 59) = 3.15, ρ = .081). It was found that pretest
COMPASS math scores did not significantly predict posttest control of learning scores (β
= .02, ρ =.08).
The results of the association of pretest COMPASS math plus pretest control of
learning (Model 1b) reports the findings to determine if pretest COMPASS math scores
and pretest control of learning scores predict the posttest control of learning scores. The
results of the regression indicated pretest COMPASS math scores and pretest control of
learning scores did explain 34% variance (R2 = .34, F (1, 59) = 14.37, ρ = .000). It was
found that pretest COMPASS math scores did not significantly predict posttest control of

100
learning scores (β = .01, ρ = .55). The findings indicate that pretest control of learning
scores did significantly predict the posttest control of learning scores (β = .40, ρ = .000).
The results of the association of pretest COMPASS math scores on posttest self-
efficacy scores (Model 2a) reports the findings to determine if pretest COMPASS math
scores predict the posttest self-efficacy scores. The results of the regression indicated
pretest COMPASS math scores did significantly explain 17% of the variance (R2 = .17, F
(1, 59) = 11.02, ρ = .001). It was found that pretest COMPASS math scores did
significantly predict posttest control of learning scores (β = .05, ρ =.001).
The results of the association of pretest COMPASS math plus pretest self-
efficacy (Model 2b) reports the findings to determine if pretest COMPASS math scores
and pretest pre self-efficacy scores predict the posttest self-efficacy scores. The results of
the regression indicated pretest COMPASS math scores and pretest self-efficacy scores
did significantly explain 40% variance (R2 = .40, F (2, 59) = 19.08, ρ = .000). It was
found that pretest COMPASS did significantly predict posttest self-efficacy scores (β =
.03, ρ = .046) as well as pretest self-efficacy scores (β = .59, ρ = .000).
The results of the association of pretest COMPASS math scores on posttest self-
regulation scores (Model 3a) reports the findings to determine if pretest COMPASS math
scores predicts the posttest self-regulation scores. The results of the regression indicated
pretest COMPASS math scores did not significantly explain variance in posttest self-
regulation scores (R2 = .003, F (1, 59) = .172, ρ = .68). It was found that pretest
COMPASS math scores did not significantly predict posttest control of learning scores
(β = .01, ρ =.68).

101
The results of the association of pretest COMPASS math plus pretest self-efficacy
(Model 3b) reports the findings to determine if pretest COMPASS math scores and
pretest pre self-regulation scores predict the posttest self-regulation scores. The results of
the regression indicated pretest COMPASS math scores and pretest self-regulation scores
did significantly explain 27% variance (R2 = .27, F (2, 59) = 8.13, ρ = .000). It was
found that pretest COMPASS math scores did not significantly predict posttest self-
regulation scores (β = -.12, ρ = .30). It was found that pretest self-regulation scores did
significantly predict posttest self-regulation scores (β = .47, ρ = .000).
In conclusion the third OLS regression was used to determine the association of
pretest COMPASS math scores on post MSLQ scores. The results indicate that pretest
COMPASS math scores is a significant predictor on posttest self-efficacy scores. In
addition, pretest MSLQ measures are significant predictors on their posttest MSLQ score.
Summary of Results
The purpose of this research is to investigate efficiency of using the flipped model
in a remedial math course. To answer the research questions, the MSLQ scores of
control of learning, self-efficacy and self-regulation of students that participate in a
flipped model remedial math course were compared to students that participate in a
lecture model remedial math course. The study also examined course outcomes of
students in both classrooms using posttest COMPASS math scores. In addition, three
separate models were constructed to perform linear multiple regressions to investigate if
pre MSLQ scores predict pretest COMPASS math scores, if pre MSLQ scores predict

102
posttest COMPASS math scores and if pretest COMPASS math scores predict posttest
COMPASS math scores.
There were a total of 60 students in the study with 47% of the students in the
flipped classroom and 53% of students in the lecture classroom over a two semester
period. The students in both classrooms were found to be equivalent across student
characteristics and prior academic knowledge. A series of t-tests performed found no
significant differences of between students in the flipped and lecture classroom (Table
3.6). Notable differences although not significant are as follows: more students is the
flipped classroom (50%) compared to students in the lecture classroom (25%) completed
two math courses in college before enrolling in Math 095, and 39% of students in the
flipped classroom placed in math 061 on their COMPASS pretest compared to 22% of
students in the lecture classroom.
A series of independent series t-tests were performed to compare the MSLQ
scales for students in both classrooms and the data revealed no significant difference for
the measures of control of learning, self-efficacy, or self-regulation of students in the
flipped classroom compared to students in the lecture classroom. A significant difference
of ρ < .10 was found for math outcomes using posttest COMPASS math gain scores for
students in the flipped classroom compared to students in the lecture classroom. The
overall change in posttest COMPASS math scores was 12.64 for students in the flipped
classroom compared to 6.87 for students in the lecture classroom.
The last series of analyses included three separate models constructed for linear
multiple regressions. The first linear multiple regression was performed to investigate

103
the association of students in the flipped and lecture classroom plus pre MSLQ scales on
the pretest COMPASS math scores. A small association was found to be significant for
all three pre MSLQ scales when the regression was conducted using the variables of
classroom and each separate MSLQ scale of control of learning, self-efficacy and self-
regulation. The amount of variance for each separate MSLQ scale plus classroom was
13% for control of learning, 19% for self-efficacy and 17% for self-regulation. When all
variables are included in the regression no significant associations were found for
individual variables although the combined variables contribute to 22% variance in the
COMPASS pretest scores. Therefore, the variation found in pretest COMPASS math
scores when all the variables are combined may be due to the explanatory power and
significance of the independent variables coefficients of pre control of learning, pre self-
efficacy, and pre self-regulation being divided up between them even though the bivariate
correlation and VIF values did not indicate multicollinearity (Table 4.5).
The second linear multiple regression was performed to investigate the
association of students in the flipped and lecture classroom plus pre MSLQ scores on
posttest COMPASS math scores. The regression were repeated including the pretest
COMPASS math scores. When the pretest COMPASS math scores were not included in
the regression model control of learning, and self-efficacy were found to have a small but
significant association with posttest COMPASS math scores. Self-regulation did not
have a significant association with posttest COMPASS math scores, however a ρ = .051
suggest the results may have been significant with a larger sample size. When the
regression model included the pretest COMPASS scores and each separate pre MSLQ

104
scores for control of learning, self-efficacy and self-regulation they were not significant
but pretest COMPASS math scores were found to be significant. The significant effect
size for the pretest COMPASS math scores were small ranging from .50 to .57. When all
variables are included the combined variables contribute to 27% variance in the
COMPASS pretest scores. Similar to the OLS regression the variation found in posttest
COMPASS math scores when all the variables are combined may be due to the
explanatory power and significance of the variable coefficients of pre control of learning,
pre self-efficacy, and pre self-regulation being divided up between them even though the
bivariate correlation and VIF values did not indicate multicollinearity (Table 4.5).
The third OLS regression model was performed to investigate the association of
pretest COMPASS math scores on post MSLQ scores of control of learning, self-efficacy
and self-regulation. The regression was repeated including the pre MSLQ scores. It was
determined that the pre MSLQ scores did have significant associations with post MSLQ
scores (Table 4.8). The self-efficacy model was the only regression to demonstrate an
association for pretest COMPASS math scores with post MSLQ scores. Model 2a
indicates a significant association between pretest COMPASS scores and post self-
efficacy scores. The effect size of the pretest COMPASS math score is small at .05. In
Model 2b when the variable for the pre self-efficacy score is added to the regression and
the effect size for the pretest COMPASS math score decreases to .03. The variable of pre
self-efficacy is also found to have a significant association with post self-efficacy scores
but has a higher effect size of .59. The combined variables contribute 40% variance in
post self-efficacy scores. It would be expected that the pre self-efficacy score would

105
have an association to the post self-efficacy score because both variables were correlated
to one another. The significant association of the pretest COMPASS math score would
indicate that a student’s prior math knowledge plus their belief in their ability to succeed
in math at the beginning of the semester has an impact on their level of self-efficacy at
the end of the math course.

106
CHAPTER FIVE
CONCLUSIONS
Introduction
The purpose of this study is to investigate the flipped teaching model in a
remedial math course compared to lecture model in a remedial math course at Highlands
College. The study uses the MSLQ survey to compare control of learning, self-efficacy
and self-regulation of students in each classroom. In addition, the study uses posttest
COMPASS math scores to compare the course outcomes of students in each classroom.
The results of the study determined there are no significant differences between students
in each classroom when comparing the results of the MSLQ survey. The study also finds
that there is no significant difference in course outcomes using posttest COMPASS math
scores of students in each classroom. The study also investigates the associations of pre
MSLQ results with pretest math scores (math placement), pre MSLQ results with posttest
math scores (course outcomes), and pretest math scores with post MSLQ results. This
chapter includes an overview of the study, methodology, and a discussion of the results.
It also includes the limitations of the study as well as recommendations for practice and
future research.
Overview of Study
Many colleges and universities are researching and investigating best practices to
teach remedial math courses to help students prepare for their degree required math
course (Engagement Center for Community College Student, 2016). Remedial math is a
107
concern for many colleges due to low retention and completion rates for students enrolled
in remedial math in addition to the added expense of remedial math for students and
colleges. Research of best practices discuss alternative methods to deliver remedial math
courses to students to encourage remedial math course completion as well as retention of
students leading to an increase in graduation rates. Research also indicates that students
that exhibit higher levels of motivation (control of learning and self-efficacy) and self-
regulation are more successful learners (Pintrich, 2004). An alternative method to
improve the delivery of remedial math discussed in this study is the flipped classroom.
This study investigates if the requirements of the flipped classroom encourage students to
become successful learners by increasing their motivation and self-regulated learning
skills.
This study is designed to determine if the flipped model is an effective teaching
model for teaching remedial math. One group of students participated in a remedial math
course that used the flipped model and the other group participated in a remedial math
course that used the lecture model. Students completed a pretest and posttest using the
MSLQ and COMPASS math test. At the end of the semester students completed a
posttest using the MSLQ and COMPASS math test. To determine effectiveness of the
flipped model the post MSLQ scores and posttest Compass math scores were compared
for students in each classroom. In addition, associations of the MSLQ scores with pretest
and posttest COMPASS math scores are investigated. The method and the research
design which asked eight questions are explained in Chapter 3. The data analyses
consisted of frequency data to present the descriptive statistics, t-tests results and a series
108
of linear multiple regressions. The presentation of results are explained in Chapter 4 and
discussed in further detail below.
Methodology
This study utilized a pretest and posttest design using the MSLQ survey
developed by Pintrich, Smith, Garcia & McKeachie (1991) and the COMPASS math test.
Student descriptive data was collected using class lists and a demographic survey
administered to students during the MSLQ pretest. To participate in the study students
were required to sign a consent form, complete the pre and post MSLQ survey, and
complete the pre and post COMPASS math test. There were a total of sixty students
enrolled in math 095 that completed all the requirements to participate in the study during
the fall 2014 and spring 2015 semesters. The flipped classroom had a total 28 out of 53
(53%) students that participated and the lecture classroom had a total of 32 out of 59
(54%) students that participated. All data was entered into SPSS software for analysis.
Before analysis could be conducted to answer the research questions, it was
necessary to determine if the students in the flipped classroom and the lecture classroom
were equivalent. Group equivalence was established by comparing the sample
characteristics; pretest scores for math and reading; and the pretest MSLQ results. A
Pearson Chi-Square was performed for variables that were categorical and an
independent series t-test was used for scored variables. The results indicated there was
no significant differences between students in the flipped classroom compared to students
in the lecture classroom, therefore it was determined the two groups were equivalent.
After group equivalence was determined, it was necessary to perform a factor analysis to

109
validate the factor validity of the constructs of the MSLQ survey. The factor analysis
resulted in three interpretable factors consisting of control of learning, self-efficacy and
self-regulation with factor loadings ranging from .51 to .84 indicating fairly reliable
constructs (Mertler & Vannatta, 2010).
The dependent variables used for this study are the post scores for control of
learning, self-efficacy, self-regulation and post math test. Independent variables included
student characteristics and their prior academic experience (Table 4.1 and 4.2). Data
analysis included descriptive statistics that reported frequency data for student
characteristics and prior academic experience; t-tests that reported significance of the
MSLQ survey results and the posttest math scores; and OLS regressions reported
associations of MSLQ survey results with COMPASS math test scores for all students in
the study. The results of the analysis is discussed in Chapter 4. A discussion of the
results and the research questions are below. The research questions for this are as
follows:
1) What are characteristics of students who enroll in a remedial math course?
2) Do the control of learning scores on the MSLQ increase in students that
participate in a flipped model remedial math course compared to students that
participate in a lecture model remedial math course?
3) Do the self-efficacy scores on the MSLQ increase in students that participate
in a flipped model remedial math course compared to students that participate
in a lecture model remedial math course?

110
4) Do the self-regulation scores on the MSLQ increase in students that
participate in a flipped model remedial math course compared to students that
participate in a lecture model remedial math course?
5) How do the posttest COMPASS math scores of students who participate in a
flipped model remedial math course compare to posttest COMPASS math
scores of students who participate in a lecture model remedial math course?
6) Do the results of pre MSLQ scores of control of learning, self-efficacy or self-
regulation predict the pretest COMPASS math scores (course placement) of
students in this study?
7) Do the results of the pre MSLQ scores of control of learning, self-efficacy or
self-regulation predict the posttest COMPASS math scores (course outcome)
of students in this study?
8) Do the results of pretest COMPASS math scores predict post MSLQ scores of
control of learning, self-efficacy and self-regulation for students that
participate in this study?
Discussion of Research Results
This section will discuss the research questions and results used to answer each
question. This study obtained a variety of demographic characteristics providing a look
inside the remedial math classroom as well as providing insight about students who enroll
in a remedial math course but the sample size of students in each classroom was small.
The small sample size limited the power of analysis to accurately reflect on the influence
of the flipped classroom in a remedial math course which leading to an exploratory

111
analysis. The sample was combined based on group equivalency (Table 3.6) for research
questions 1, 6, 7 and 8 due to the small sample size. This allowed for a more accurate
investigation of the characteristics of students enrolled in a remedial math course and
further explorations of associations among dependent and independent variables. To
answer research questions 2, 3, 4 and 5 the data remained separate for students in the
flipped and lecture classroom to allow for comparisons of both teaching methods.
Research Question #1
Research Question #1 addresses the student characteristics and prior academic
experience of students enrolled in a remedial math course at Highlands College. The
research question is as follows, “What are the student characteristics and prior academic
experience of students enrolled in a remedial math course?”
Previous literature reviewed in chapter 2 discusses the diverse background and
characteristics of students that enroll in a remedial math course. These different
characteristics of students provide an opportunity for remedial math instructors to learn
more about the unique learning needs of students enrolled in their classes. To answer this
research question the following paragraphs will discuss the characteristics of gender, age,
and degree option of students in this study (Table 4.1) and how these characteristics
compare to previous research of remedial math students.
This study found that 80% of the remedial math students were female compared
to 20% of the students were male. This result is consistent with research that indicates
that more female students enroll in remedial math courses than male students (Bettinger
& Long, 2007; Bailey, Jeong, & Cho, 2010; Bettinger, Boatman, & Long, 2013). There

112
are many different reasons that may contribute to gender differences in remedial math
courses such as but limited to socio-cultural influences that may lead to female students
avoiding additional math courses or STEM pathways in high school (Wang & Degol,
2017). According to NCES (2015), only 31% of female students accounted for STEM
degree attainment in 2012. Current enrollment trends indicate an increase of female
students attending post-secondary education compared to male students which may
contribute to a higher number of female students that enroll in remedial math especially if
these students have been out of school for a period of time. The majority of students
(56%) enrolled in post-secondary education were female in 2014 (NCES, 2016).
This study also found 60% of students in the study were traditional age compared
to 40% non-traditional age students. A traditional age student refers to individuals who
less than or equal to twenty-four years old. The higher number of traditional age students
in remedial math courses is consistent with research that indicates that a high number of
recent high school graduates are not prepared for college-level work (Bettinger, Boatman,
& Long, 2013). Also, it is estimated that 20% of first-year undergraduate college
students who enroll at four year universities will be recommended/required to enroll in
one or more remedial math course before they can enroll in their gateway level math
course (Pachhofer & Putton, 2014). Complete College America (2016) similarly reports
that 24% of first-semester undergraduate students will require math remediation and 52%
of students enrolling at two-year colleges will require math remediation. In 2014-2015
all students who enrolled at Montana Tech that placed in remedial courses were required
to enroll in a two-year AS degree program at Highlands College. This requirement may

113
account for a higher number of traditional age students in this study because 70% of
students in this study were enrolled in the AS degree program or other four-year degree
program.
According to Horton (2015), both traditional and non-traditional students face a
variety of barriers that put them at-risk of not achieving their academic goals. Horton
reports that older students who have delayed enrollment in post-secondary education that
are also academically unprepared have a greater risk of dropping out of college.
Similarly, other research indicates non-traditional age students suffer higher attrition rates
compared to traditional age students (Grabowski et al, 2016; NCES, 2011). Possible
causes for the high attrition rates of non-traditional students as reported by Horton (2015)
are due to multiple organizational, instructional, and interpersonal barriers non-traditional
students have in reaching their academic goals. According to Complete College America
(2017), only 15% of non-traditional students graduate with an associate’s degree over a
three year time period compared to 24 % of traditional age students who graduate with an
associate’s degree over a three year period of time. Also, 22% of non-traditional age
students graduate with a bachelor’s degree over a six year period of time compared to
71% of traditional age students who graduate with a bachelor’s degree over a six year
period.
The majority of the students in this study indicated they were returning students
who completed one or more remedial math course in college before they enrolled in math
095. Overall, 33% of students reported they had completed one remedial math course in
college which indicates they started in math 090 and 37% of students reported they had

114
completed two remedial math courses in college which indicates they started in math 061.
This finding is also consistent with research that indicates that more students who are
enrolled at a public two year institutions will be required to complete one or more
remedial math courses (Dillon & Smith, 2013). Literature suggests students that need to
complete math remediation especially a series of math courses are less likely to complete
their math series leading to degree attainment (Bahr, 2008; Bailey, Jeong, & Cho, 2010).
In conclusion, the characteristics of students in this study illustrate the unique
academic needs of students in a remedial math course. These characteristics and being
academically disadvantaged in math places students at a higher risk of not achieving their
academic goals. A greater understanding of remedial students by utilizing the knowledge
of individual characteristics and the influence of motivation and self-regulation on
student success will lead to future success for students enrolled in a remedial math
course.
Research Question #2
This question compares the control of learning scores of students in the flipped
classroom to students in the lecture classroom. Control of learning was defined by
questions on the MSLQ that ask students to reflect on how they applied study skills to
complete class assignments (Table 3.9). The questions tried to identify if a student
believed whether or not they were responsible or in control of their own learning inside
and outside of the classroom. The research question asked the following: “Do control of
learning scores using the MSLQ survey increase in students that participate in a flipped
model remedial math course compared to students that participate in a lecture model

115
remedial math course? The results indicate the increase of control of learning was not
significant between the two classrooms (Table 4.4). Therefore, the requirement of the
flipped classroom of students extending effort outside of class in the form of note-taking
and viewing class lectures did not result in a higher level of control of learning compared
to students in the lecture classroom. One plausible explanation may be students in the
flipped classroom as a group, were struggling to learn how perform these tasks on their
own. Overall, there was a general trend in control of learning from the pretest to the post
test for both classes. The flipped classroom had the overall larger gain.
Control of learning refers to a student’s beliefs that their efforts to learn will
result in positive outcomes (Pintrich, Smith, Garcia & McKeachie, 1991). Research
indicates that students that exhibit higher levels for control of learning experience more
positive educational outcomes compared to students that exhibit a low level of control of
learning (Pintrich, 2004; Pintrich & De Groot, 1990). Generally students enrolled in a
remedial math course would have a lower levels of control of learning related to math.
Research Question #3
Research Question #3 addresses the relationship between self-efficacy and
students in the flipped and lecture classroom. Self-efficacy was characterized by
questions on the MSLQ that asked students to reflect on their confidence and belief that
they would be successful in their math class (Table 3.9). The research question asks the
following: “Do self-efficacy scores on the MSLQ increase in students that participate in
a flipped model remedial math course compared to students that participate in a lecture
model remedial math course?” The results of indicate the increase for self-efficacy was

116
not significant between the two classes (Table 4.4). Therefore, the requirement of the
flipped classroom did not encourage students to become more confident in their ability as
math learners than students in the lecture classroom. Overall, there was a general
increasing trend in self-efficacy scores from the pretest to the post test for both classes.
The flipped and lecture classroom had the same gain.
Self-efficacy is a self-appraisal of one's ability to master a task which includes
judgments about one's ability to accomplish a task as well as one's confidence in their
skills to perform that task (Pintrich, Smith, Garcia & McKeachie, 1991). Students with a
higher self-efficacy for a particular task are more likely to extend the effort needed to
succeed compared to students that exhibit lower levels of self-efficacy for a particular
task (Pachloffer & Putten, 2014). In other words, students with high self-efficacy or
belief that they can do well in math will perform better than students that do not believe
they can do well in math. Success in a remedial class is expected to increase a student’s
self-efficacy for math.
Research Question #4
Research Question #4 addresses the relationship of self-regulation between
students in the flipped and lecture classroom. Self-regulation was characterized by
questions on the MSLQ that asked student to reflect on how they plan and organize how
they are going to study and prepare for class (Table 3.9). The research question asks the
following: “Do the self-regulation scores on the MSLQ increase in students that
participate in a flipped model remedial math course compared to students that participate
in a lecture model remedial math course?” The results indicate the increase for self-

117
regulation was not significant between the two classes. Therefore, the requirements of
the flipped classroom did not encourage students to become more independent learners
than students in the lecture classroom. Overall, there was a general trend in self-
regulation increasing from the pretest to the post test for students in both classrooms.
Students in the lecture classroom had the overall larger gain in scores. One plausible
explanation is the difficulty as a group students in the flipped classroom are having
adjusting to the requirements of the flipped classroom.
Self-regulation refers to planning activities such as goal setting and task analysis
which help to activate, or prime, relevant aspects of prior knowledge that make
organizing and comprehending the material easier. Self-regulating activities are believed
to improve performance by assisting learners in checking and correcting their behavior as
they proceed on a task (Pintrich, Smith, Garcia & McKeachie, 1991).
Research Question #5
Research Question #5 addresses the relationship between posttest COMPASS
math scores for students in the flipped and lecture classroom. The research question asks
the following: “How do the posttest COMPASS math scores of students who participate
in a flipped model remedial math course compare to posttest COMPASS math scores of
students who participate in a lecture model remedial math course?” The results of the
independent series t-tests found significant levels of ρ < .10 when testing group
differences using the pretest and posttest math scores as well as the overall gain scores
for math (Table 4.3). These finding suggest a moderate level of significance (ρ < .10) for
math outcomes of students that participated in the flipped classroom compared to

118
students that participated on the lecture classroom. In terms of social significance these
findings suggest that math outcomes of students in the flipped classroom meet standards
of efficacy by demonstrating overall math gains of students in the flipped classroom
twice that of students in the lecture classroom (Rapoff, 2010). These findings are also of
interest because the results of research question #7 discussed below found pre MSLQ
scores of control of learning, self-efficacy and self-regulation to be significant predictors
on posttest COMPASS math scores.
Bhagat, Chang, & Chang (2016) compared the flipped and lecture classroom
using outcomes of students in a high school trigonometry course and found the difference
in outcomes for middle-level achievers and high-level achievers was not significant.
They did find a significant difference in outcomes of low-level achievers in the flipped
classroom compared to low-level achievers in the lecture classroom. The researchers
conclude that students with the lowest scores on the pretest benefited the most in terms of
outcomes due to their experience in the flipped classroom. Another study conducted by
Clark (2015) indicates the difference in outcomes between students in a flipped
classroom and students in a lecture classroom are not significant for students enrolled in a
secondary Algebra I course. The study was conducted over a seven week period and
used unit tests to measure student performance.
In conclusion, several studies have been conducted examining the effectiveness
of the flipped classroom compared to other traditional face-to-face instruction resulting in
mixed results where some studies report positive results while others report negative
results. The difference in results as noted by Sun, Xie & Anderman (2016) may be due to

119
the variability in the design and implementation of the flipped classroom. These studies
differ in subject area, measures of achievement to determine outcomes or general
delivery of the flipped classroom.
Research Question #6
Research Question #6 addresses the relationship between pre MSLQ scores for
control of learning, self-efficacy and self-regulation and their association with pretest
math scores (Table 4.6). The research question asks the following: “What is the
relationship between pre MSLQ scores of control of learning, self-efficacy and self-
regulation with pretest COMPASS math scores of students in the flipped and lecture
classroom?” The results indicate that each individual measure of control of learning,
self-efficacy and self-regulation is a significant predictor of pretest math scores. When
the measures are combined in the regression model control of learning, self-efficacy and
self-regulation are significant predictors of pretest math scores indicating a small net
effect or overlap between the MSLQ variables of control of learning, self-efficacy and
self-regulation.
Similar results were found in a study conducted by Brown and Walberg (1993)
who conducted a study to determine if motivational factors have an impact on student
standardized tests scores. The study consisted of middle grade students who were
separated into two groups. One group was provided motivational instructions before they
completed a mathematics concepts test and the other group was given traditional
instructions before they completed the same test. The results indicate a significant
difference in test performance between students that received motivational instructions

120
compared to students that received traditional instructions. They concluded that an
attempt to increase motivation in students can make a substantial difference in
standardized test scores.
In conclusion, the possibility of using measures of control of learning, self-
efficacy or self-regulation to predict math placement scores warrants further
investigation. The idea that an increase in these measures may positively influence math
placement resulting in higher math placements or more accurate math placements would
benefit students in several ways. Students may be able to avoid enrollment in remedial
math courses or enroll in fewer remedial math leading to graduation sooner saving money
and time.
Research Question #7
Research Question #7 addresses the relationship between pre MSLQ scores with
posttest math scores (Table 4.7). The question asks the following: “What is the
relationship between pre MSLQ scores of control of learning, self-efficacy and self-
regulation with the posttest COMPASS math scores for students in the flipped and lecture
classroom?” The results indicate each individual pre MSLQ measure is a significant
predictor of posttest math scores. When the results of all measures are included in the
regression model the variables are not significant predictors of posttest math scores.
Overall, these results suggest a student’s level of control of learning, self-efficacy and
self-regulation at the start of a math class may influence their performance outcomes in
class. Further investigation was performed including pretest math scores in the
regression models indicating a significant association for pretest math scores only. These

121
findings suggests prior knowledge is a larger predictor of course outcomes compared to
control of learning, self-efficacy or self-regulation.
As previously discussed studies utilizing the MSLQ concluded that the control of
learning, self-efficacy and self-regulation positively influences academic performance of
students in various educational settings (Pintrich, Smith, Garcia & McKeachie, 1991;
Duncan and McKeachie, 2005). In another study performed by Sun, Xie & Anderman
(2018) utilizing the MSLQ in a flipped classroom which examined the relationships
between self-efficacy, self-regulation and prior math knowledge on achievement of
homework assignments in an online class. They found significant associations for all
three variables on achievement of homework assignments. They conclude that their
findings suggest that the more confident students feel in their abilities for learning math,
the more often they would take actions to control when and where to learn online
materials, and they would monitor as well as reflect on their own understandings of
learned knowledge when completing their homework goals. In contrast, a study
conducted by Pachlhofer and Putten (2015) using the MSLQ resulted in opposite findings
concluding that a student’s previous ACT score was not a significant predictor of
predicting a student’s overall outcome in their self-paced remedial math course. In
addition, the findings indicated that self-efficacy and self-regulation were not significant
factors of course outcomes. They did find a significant relationship with a students need
or interest to perform well in their remedial math course.
In conclusion, previously reported research findings of studies that use the flipped
model have mixed results and are difficult to generalize to this study due to variability in
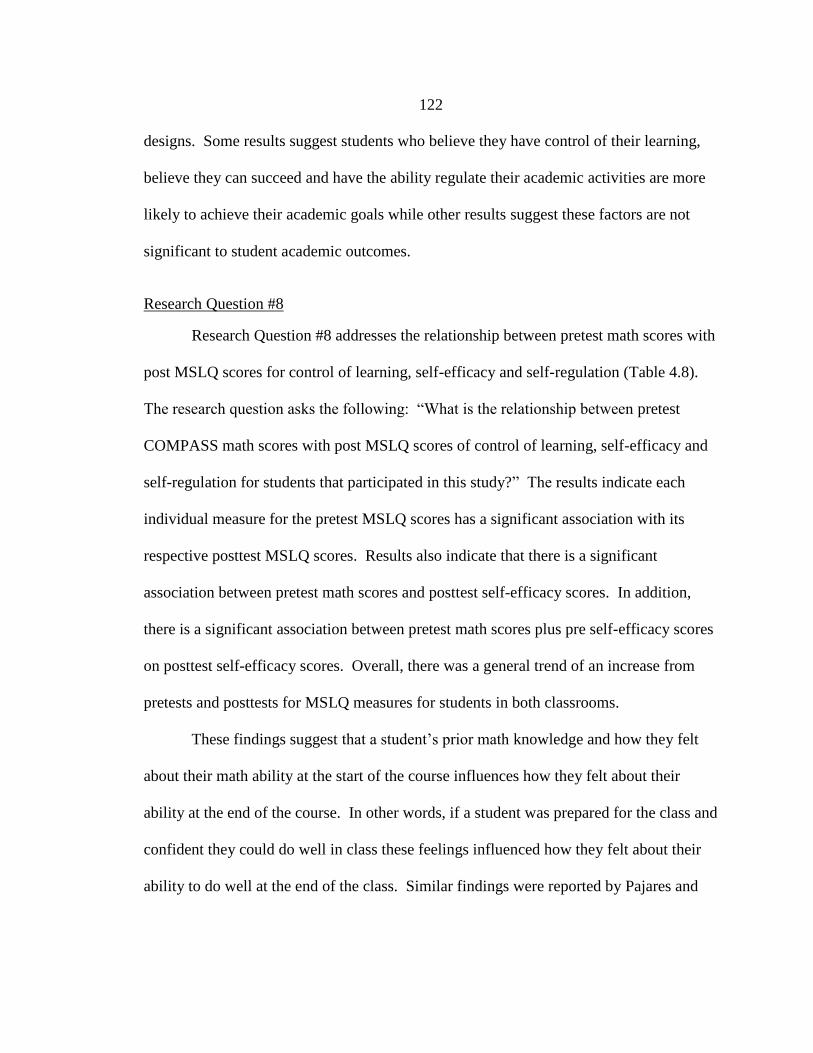
122
designs. Some results suggest students who believe they have control of their learning,
believe they can succeed and have the ability regulate their academic activities are more
likely to achieve their academic goals while other results suggest these factors are not
significant to student academic outcomes.
Research Question #8
Research Question #8 addresses the relationship between pretest math scores with
post MSLQ scores for control of learning, self-efficacy and self-regulation (Table 4.8).
The research question asks the following: “What is the relationship between pretest
COMPASS math scores with post MSLQ scores of control of learning, self-efficacy and
self-regulation for students that participated in this study?” The results indicate each
individual measure for the pretest MSLQ scores has a significant association with its
respective posttest MSLQ scores. Results also indicate that there is a significant
association between pretest math scores and posttest self-efficacy scores. In addition,
there is a significant association between pretest math scores plus pre self-efficacy scores
on posttest self-efficacy scores. Overall, there was a general trend of an increase from
pretests and posttests for MSLQ measures for students in both classrooms.
These findings suggest that a student’s prior math knowledge and how they felt
about their math ability at the start of the course influences how they felt about their
ability at the end of the course. In other words, if a student was prepared for the class and
confident they could do well in class these feelings influenced how they felt about their
ability to do well at the end of the class. Similar findings were reported by Pajares and

123
Miller (1994) that concluded prior knowledge affected student performance largely
through its influence on math self-efficacy.
In conclusion, summary findings of this study indicate that students in the flipped
classroom and the lecture classroom both experience increases in their control of
learning, self-efficacy and self-regulation as well as math outcomes. In addition, the
findings indicate a small net effect for control of learning, self-efficacy and self-
regulation on math placement as well as math outcomes for students in a remedial math
course. Also, an association of a student’s self-efficacy at the end of the course was
predicted by a student’s initial level of self-efficacy and prior academic knowledge.
Instructor Reflections of the Flipped Classroom
This study resulted in a small sample size of 28 students in the flipped classroom
and 32 students in the lecture classroom. The study took place during the fall 2014 and
spring 2015 semesters. There were two instructor observations performed using the
format outlined by Millis (1992) during the study to determine if researcher bias existed
in the instruction of the flipped and lecture classroom. As a result of these observations
and the researcher’s observations it was determined not to continue the study using
additional classes to obtain a larger sample size. Instead the current design of the flipped
classroom was altered to improve class delivery and teaching in future remedial math
classrooms using the flipped model.
A common theme that emerged from classroom observations of the flipped
classroom was the extra time provided for the instructor to “present more examples and
more difficult problems in class” (Appendix B). As the instructor, the researcher found

124
this aspect of the flipped classroom to have a positive influence on students encouraging
them to seek individual help from the instructor or from their peers. The extra time in
class as observed by the researcher increased student engagement during class time as
well as helped them learn how to better prepare for a math course through evaluation of
their notes and their understanding of the assigned material.
Another common theme noted by the researcher and the class observations was
the difficulty students had preparing notes for class. Even though students in the flipped
classroom were instructed on how to take notes at the start of the semester some students
would arrive to class with incomplete notes and in some instances without notes to
participate in class. The intervention of the flipped classroom was changed at the
completion of the spring 2015 semester due to the difficulty some students experienced
taking notes and preparing for class in the flipped classroom. Changes to the flipped
classroom include providing more explanation and hands-on activities designed to teach
students how to take notes when preparing for class which are reinforced during the
semester in contrast to the lesson on note-taking provided during the study. Another
change as a result of the observations and findings of this study are the addition of class
discussions and activities regarding student’s attitudes toward math and how their beliefs
can influence their success in a math course.
In conclusion, the flipped classroom was observed to have a positive influence on
students in the classroom as noted by the researcher, classroom observations and findings
of this study. The study findings that influenced the continuation of the flipped
classroom in a remedial math course were the group differences in math outcomes (ρ <

125
.10) of students in the flipped classroom compared to students in the lecture classroom as
well as the findings that indicate control of learning, self-efficacy and self-regulation are
significant predictors of math outcomes. In the flipped classroom students are allowed
more time to interact with the instructor as well as other students. Modifications of the
flipped classroom include more time teaching students how to take notes when they
prepare for class and the addition of class discussions/activities designed to help students
develop a positive attitude toward math to increase their self-efficacy.
Recommendations from Study
The purpose of this study was to investigate if the flipped classroom was an
effective teaching model to increase the motivation and self-regulation of students
enrolled in a college remedial math course. The results from this study did find
significant results when comparing math outcomes at ρ < .10 for students that
participated in the flipped classroom compared to students that participated in the lecture
classroom. The results from this study did not find significant results when comparing
the increase of motivation or self-regulation when comparing students who participated
in a flipped classroom compared to students who participated in a lecture classroom. The
results OLS regressions performed to further explore the associations between
independent and dependent variables resulted in small net effects. After reviewing the
results of this study and reviewing literature addressing similar questions
recommendations for practice include:

126
1. Develop and implement a system to identify at-risk characteristics of students in
remedial math courses to allow math instructors to develop interventions designed
to address the individual learning needs of students at the start of the semester.
2. Develop and implement a system to have students self-assess on measures of
control of learning, self-efficacy and self-regulation at the start of the semester.
3. Develop a systemized flipped classroom model to promote greater development
of control of learning, self-efficacy and self-regulation in the flipped classroom.
Recommendation #1
The first recommendation as a result of this study is to develop and implement a
system to identify at-risk characteristics of students in remedial math courses to allow
math instructors to develop interventions designed to address the individual needs of
students at the start of the semester. Often times the student that may be at-risk goes
unidentified until the student is failing academically leading to academic suspension. As
discussed in research question #1, “What are the characteristics of students in a remedial
math course?” the findings indicate student characteristics such as age or being a non-
traditional student places students at-risk of not achieving their academic goals.
According to Horton (2015), factors that impact college persistence and success include
under preparation, completion of high school by GED, poverty, being a first-generation
college student, being a minority student, having older siblings who dropped out of high
school, lacking knowledge about college admissions/matriculation, caring for a child,
delayed entry into post-secondary education or financial independence. A possible
intervention to identify at-risk characteristics of students is to ask students to complete

127
math autobiographies at the start of the semester in combination with more detailed
demographic questionnaires to gain more information about student’s characteristics that
may impact their success.
Recommendation #2
The second recommendation is to develop and implement a system to have
students self-assess on measures of control of learning, self-efficacy and self-regulation at
the start of the semester. Research question 6, investigated the influence of pre MSLQ
measures of control of learning, self-efficacy and self-regulation on pretest COMPASS
math scores. The findings of this study indicated a student’s level of control of learning,
self-efficacy and self-regulation are significant predictors of pretest COMPASS math
scores. Math instructors could use this information to make better informed math
placement decisions, especially for students who have math placement scores near the top
or bottom range of cut-off scores for math placement.
Another benefit of assessing a student’s level of control of learning, self-efficacy
and self-regulation is their influence on course outcomes. Research question 7,
investigated the influence of pre MSLQ measures of control of learning, self-efficacy and
self-regulation on posttest COMPASS math scores. The findings indicated a student’s
level of control of learning, self-efficacy and self-regulation at the start of the semester
are significant predictors of posttest COMPASS math scores (course outcomes). Math
instructors could use this knowledge to identify at-risk students at the start of the
semester and implement individual study plans or classroom interventions designed to

128
greater develop the skills of control of learning, self-efficacy and self-regulation for
students in a remedial math course.
Recommendation #3
The third recommendation as a result of this study is to develop a systemized
flipped classroom model to promote greater development of control of learning, self-
efficacy and self-regulation in the flipped classroom. A more systemized flipped model
would allow for more accuracy when evaluating specific learning tasks of the flipped
classroom. According to Anderman, Sun & Xie (2016) current research on the use of
flipped teaching lacks a systematic design to investigate what features of the flipped
classroom influence motivation and self-regulation factors of students in the flipped
classroom. A possible method is to identify specific learning tasks that lead to the
development of motivation and self-regulation skills would be including students in the
evaluation process. The accumulation of qualitative data in combination of quantitative
data would provide more detail needed to determine the effectiveness of these learning
tasks.
In conclusion, the three recommendations as a result of the findings of this study
include activities to enhance the learning environment and learning skills of students in a
remedial math courses. The focus of the recommendations of the study is how to
improve the success of students in a remedial math course that uses the flipped
classroom. Recommendations include learning more about students to identify students
that may be at-risk of failure through utilizing student’s characteristics as well as
measures of motivation and self-regulation. In addition to systemizing the design of the

129
flipped classroom to identify and evaluate specific learning tasks in the flipped classroom
that may influence the development of motivation and self-regulation of students in
remedial math.
Limitations of Study
The limitations of this study were identified during the implementation and review of the
findings of this study. The limitations discuss how to improve this study based on
reviewed research. The limitations that influenced the findings of this study are sample
size, as well as validity and reliability concerns with the use of the MSLQ survey. The
following paragraphs discuss the possible implications of sample size and the use of the
MSLQ on research findings of this study.
The small sample size of this study limited the ability to research the differences
among students in the flipped classroom and the lecture classroom. The impact of a
small sample size resulted in combining the students in this study leading to an
exploratory study to investigate the associations of the dependent and independent
variables. The small sample size may have impacted the findings of my study. The ρ-
value criteria of ρ < .05 for this study may not have accurately reflected the analysis of
comparisons in the study. According to Faber and Fonseca (2014), very small samples
undermine the internal and external validity of a study leading to less confidence in the
findings of the study.
Another limitation that may have impacted the findings of this study was the
implementation of the MSLQ survey. The results of the factorial analysis indicated that
validity and reliability results for this study using the MSLQ differed from research
130
reported by Pintrich, Garcia and McKeachie (1991) the creators of the MSLQ survey as
well as other research reported in Chapter 2. As a result of the factorial analysis of the
data collected for this study it was determined the factor structure was different for
control of learning and self-regulation. The factor structure for self-efficacy remained the
same. According to Pintrich and DeGroot (1991), social desirability response bias may
influence student self-reported responses leading to a change in factor structure as well as
reliability of results. They note they have observed a change of factor structures using
the MSLQ with junior high students compared to college students but the results fit into
the general conceptual model (Pintrich and DeGroot, 1991). Response bias in this study
in addition to the sample size may account for the change of factor structure. As
discussed previously the majority of the students in this study were enrolled in or had
completed a college success course which may have created response bias when students
rated their control of learning and self-regulation skills.
Recommendations for Future Research
The recommendations for future research are based on the recommendations and
limitations of this study to further research the effectiveness of the use of the flipped
classroom in a remedial math course. Recommendations for future research include
increase sample size, use multiple instruments to measure outcome data and include
qualitative measures to enrich the data collection to evaluate the effectiveness of the
flipped classroom.

131
The first recommendation for future research is to increase sample size. This may
involve changing the requirements of the study to encourage students completing the
criteria to participate in the study. This study utilized a pre and posttest design with the
posttest delivered at the end of the semester. Some students did not meet the requirement
of the study because they either finished the course early or dropped the course at mid-
term so not all students that completed the course were represented in the data. Another
strategy to increase sample size and improve the research methods of this study is to
conduct the research with other remedial math instructors at two year colleges.
Coordinating research with other math instructors may enable the expansion of
participants as well as expand the knowledge of researchers of the flipped classroom.
The second recommendation for future research is to use multiple instruments to
measure outcome data and include qualitative measure to enrich the data collection. The
use of multiple instruments for measuring motivation and self-regulation in addition to
the MSLQ would provide more insight an accuracy to these factors. In addition, multiple
instruments for measuring course outcomes would provide more information about a
student’s academic performance in the classroom.
Conclusions
The purpose of remedial math courses are to teach students prerequisite math
skills needed for them to be successful in their degree required math course leading to
degree attainment. Remedial math courses are viewed as a barrier to degree attainment
for students due to the low completion rates of students in remedial math courses. This

132
study investigated the use of the flipped classroom in a remedial math course by asking
the following research questions:
1) What are the student characteristics of students who enroll in a remedial math
course?
2) Do the control of learning scores on the MSLQ increase in students that
participate in a flipped model remedial math course compared to students that
participate in a lecture model remedial math course?
3) Do the self-efficacy scores on the MSLQ increase in students that participate
in a flipped model remedial math course compared to students that participate
in a lecture model remedial math course?
4) Do the self-regulation scores on the MSLQ increase in students that
participate in a flipped model remedial math course compared to students that
participate in a lecture model remedial math course?
5) How do the posttest COMPASS math scores of students who participate in a
flipped model remedial math course compare to posttest COMPASS math
scores of students who participate in a lecture model remedial math course?
6) Do the results of pre MSLQ scores of control of learning, self-efficacy or self-
regulation predict the pretest COMPASS math scores (course placement) of
students in this study?
7) Do the results of the pre MSLQ scores of control of learning, self-efficacy or
self-regulation predict the posttest COMPASS math scores (course outcome)
of students in this study?

133
8) Do the results of pretest COMPASS math scores predict post MSLQ scores of
control of learning, self-efficacy and self-regulation for students that
participate in this study?
The findings of the research questions resulted in three recommendations. The
first recommendation is for remedial math instructors to better assess student
characteristics of students in their classrooms. This recommendation is based on the
finding that students in a remedial math course have other student characteristics in
addition to being academically disadvantaged that place them at-risk of not achieving
their academic goals. For instance, students that are non-traditional age are considered
at-risk of not achieving their academic goals and may have specific learning needs to be
successful (Horton, 2015). The increased knowledge of student characteristics may
enable math instructors to better identify and address specific learning needs of students
in a remedial math course at the start of the semester in contrast to reacting to student
failure later in the semester.
The second recommendation is to have students self-assess their levels of
motivation (control of learning and self-efficacy) and self-regulation at the start of the
semester. This recommendation is developed to address two findings of the study. The
first finding that lead to this recommendation is the finding that indicated that pre MSLQ
measures of control of learning, self-efficacy and self-regulation were found to be
significant predictors on pretest COMPASS math results. Math instructors can use this
information to better evaluate a student’s math placement into a remedial math course as
well as identify students that may be at-risk of succeeding in a remedial math course due

134
to low levels of control of learning, self-efficacy or self-regulation. The second finding
that lead to this recommendation is the finding that indicated that the pre MSLQ
measures of control of learning, self-efficacy and self-regulation were found to be
significant predictors of posttest COMPASS math scores. Math instructors could use
knowledge of these measures to improve classroom practice by providing individual
study plans or classroom interventions designed to greater develop the skills of control of
learning, self-efficacy and self-regulation for students in a remedial math course.
Overall, armed with this knowledge, math instructors can implement remedies to address
deficiencies in motivation and self-regulation skills for students enrolled in remedial
math to promote student success.
The third recommendation is to develop a systemized flipped classroom model to
promote greater development of control of learning, self-efficacy and self-regulation in
the flipped classroom. This recommendation is based on the findings that pre MSLQ
measures of control of learning, self-efficacy and self-regulation were a significant
predictor of pretest COMPASS scores as well as posttest COMPASS scores. Also,
research conducted by Anderman, Sun & Xie (2016) recommends a systematic design to
investigate what features of the flipped classroom influences motivation and self-
regulation factors for students in the flipped classroom. Identifying specific learning
tasks that lead to the development of motivation and self-regulation skills involves
students in the evaluation process of specific learning tasks to learn more about the
effectiveness of the flipped classroom.

135
The future research recommendations addressed the limitations of sample size and
validity concerns with the results obtained from the MSLQ. Future research
recommendations included working with other remedial math instructors to conduct
research to determine the effectiveness of the flipped classroom. In addition, use
multiple instruments to measure outcome data and include qualitative data to provide
more information to evaluate the effectiveness of the flipped classroom.

136
REFERENCES CITED

137
Anthony, G. (1996). Active Learning in a Constructivist Framework. Educational
Studies in Mathematics, 31(4), 349-369.
Attewell, P., Lavin, D., Domina, T., & Levey, T. (2006). New Evidence on College
Remediation. Journal of Higher Education, 77(5), 886–924.
Diploma To Nowhere. (2008). Washington, DC: Strong American Schools. (2011).
MUS Developmental Education Report. Montana University System.
Bahr, R. (2008). Does Mathematics Remediation Work? A Comparative Analysis of
Academic Attainment. Springer Science & Business Media. LLC 2008.
Bahr, R. (2013). The Aftermath of Remedial Math: Investigating the Low Rate of
Certificate Completion among Remedial Math Students. Springer Science &
Business Media. LLC 2013.
Baker, J. W. (2000). The "classroom flip": Using web course management tools to
become the guide by the side. Paper presented at the 11th International
Conference on College Teaching and Learning, Jacksonville, FL.
Bakracevic Vukman, K., & Licardo, M. (2010). How cognitive, metacognitive,
motivational and emotional self-regulation influences school performance in
adolescence and early adulthood. Educational Studies, 36(3), 259–268.
Bailey, T., Jeong, D. W., & Cho, S-W. (2010). Referral, enrollment, and completion in
developmental education sequences in community colleges. Economics of
Education Review, 29(2), 255.–270.
Bembenutty, H. (2009). Self-Regulation of Homework Completion. Psychology Journal,
p. 138-153.
Berret, D. (2012). How "flipping" the classroom can improve the traditional lecture. The
Chronicle of Higher Education, retrieved from http://chronicle.com/article/how-
flipping-the classroom/130857
Biswas, R. (2007). Accerlerating Remedial Math Education: How Institutional
Innovation and State Policy Interact. Jobs for the Future.
Bettinger, E. P., Boatman, A., & Long, B. T., (2013). Student Supports: Developmental
Education and Other Academic Programs. The Future of Children. 23 (1), 93-115.
Brunsell, E., & Horejsi, M. (2011, February). "Flipping" Your Classroom. Science
Teacher, p. 10.

138
Chris, R.K., Daigle, S., & Windy, R.S. (2007). Learning Problems Reported by College
Students: Are they Using Learning Strategies? Journal of Instructional
Psychology, 34(4), 191-199.
Cole, J. E., & Kritzer, J. B. (2009). Strategies for success: Teaching an online course.
Rural Special Education Quarterly, 28(4), 36-40.
Cribbie, R. A., Gruman, J. A., & Arpin-Cribbie C. A. (2004). Recommendations for
Applying Tests of Equivalence. Journal of Clinical Psychology, 60(1), 1-10
Duncan, T. G., & McKeachie W. J. (2005). The Making of the Motivated Strategies for
Learning Questionnaire. Educational Psychologist, 40:2, 117-128, DOI:
10.1207/s15326985ep4002_6
Eccles, J. S., & Wigfield, A. (2002). Motivational beliefs, values, and goals. Annual
Review of Psychology, 53(1), 109-132.
Esch, C. (2009). Higher Ed's Berumda Triangle. Washington Monthly.
Faber, J., & Fonseca, L. M. (2014). How sample size influences research
outcomes. Dental Press Journal of Orthodontics, 19(4), 27–29.
http://doi.org/10.1590/2176-9451.19.4.027-029.ebo
Fulton, K. (2012). Upside doen and inside out: Flip your classroom to improve student
learning. Learning & Leading with Technology,39(8), 12-17
Gay, L. R., Mills, G. E., & Airasian, P. (2009). Educational Research Competencies for
Anaysis and Applications. Columbus: Pearson Education.
Henderson, C., Dancy, M. & Niewiadomska-Bugaj, M. (2012). Use of Research-Based
Instructional Strategies in Introductory Physics: Where do Faculty Leave the
Innovation-Decision Process?, Physical Review Special Topics-Physics Education
Research
Koller, D. (2011). Death knell for the the lecture: Technology as a passport to personlized
education. Retrieved from http://www.seas.upenn.edu/about-
seas/overseers/pdf/kaphnekollerTechnologyasapassporttopersonlizededucationNY
Times.pdf
Knowles, M. S., Holton III, E. F., & Swanson, R. A. (2005). The Adult Learner, Sixth
Edition. Burlington: Elsevier.

139
Kramarski, B., & Gutman, M. (2006). How can self-regulated learning be supported in
mathematical E-learning environments? Journal of Computer Assisted Learning,
22,24−33.
Kuncel, N. R., Crede, M., & Thomas, L. L. (2005). The validity of
self-reported grade point averages, class ranks, and test scores: A meta-analysis
and review of the literature. Review of Educational Research, 75(1), 63–82.
Lage, M. J., Platt, G. J., & Treglia, M. (2000). Inverting the Classroom: A Gateway to
Creating an Inclusive Learning Enviroment. The Journal of Economic Education,
30-43.
Le, C., Rogers, K., & Santos, J. (2011). Innovations In Developmental Math. Jobs for the
Future.
Levin, H., & Calcagno, J. (2008). Remediation in the Community College. Community
College Review, 181-207.
Lichtinger, E. & Kaplan, A. (2011). Purpose of Engagement in Acacemic Self-regulation.
New Directions for Teaching and Learning, 126, 9-18.
Makany, T., Kemp, J., & Dror, I. E. (2009). Optimising the use of note-taking as an
external cognitive aid for increasing learning. DBritish Journal of Educational
Technology,40(4), 619-635.
McCabe, R., & Day, P. (1998). Developmental Education: A Twenty-First Century Social
and Economic Imperative. Mission Viejo: League for Innovation in the
Community College.
Millis, Barbara J. (1992). Conducting Effective Peer Classroom Observations. To
Improve the Academy. Paper 250.
http://digitalcommons.unl.edu/podimproveacad/250
MUS Follow Up Report. (2011). MUS Follow Up Report.
Nolting, P. (2008). Winning at Math fith edition. Academic Success Press.
Pascarella, E. T., & Terenzini, P. T. (2005). How College Affects Students Volume 2. San
Francisco: Jossey-Bass.
Perels, F., Dignath, C., & Bernhard, S. (2009). Is it possible to improve mathematical
achievement by means of self-regulation strategies? Evaluation of an intervention
in regular math classes. European Journal of Psychology of Education, 17-31.
140
Pintrich, P. R. (2004). A Conceptual Framework for Assessing Motivation and Self-
Regulated Learning in College Students. Educational Psychology Review, 385-
407.
Pintrich, P. R., & De Groot, E. V. (1990). Motivational and Self-Regulated Learning
Components of Classroom Academic Performance. Journal of Educational
Psychology, 33-39.
Pintrich, P. R., Smith, D.A.F., Garcia, T., & McKeachie, W. J. (1991). A manual for the
use of the Motivated Strategies for Learning Questionnaire (MSLQ). (Technical
Report No. 91-B-004), Ann Arbor, MI: University of Michigan, National Center
for Research to Improve Postsecondary Teaching and Learning.
Pintrich, P. R., Smith, D.A.F., Garcia, T., & McKeachie, W. J. (1993). Reliability and
Predictive validity of the Motivated Strategies for Learning Questionnaire
(MSLQ). Educational and Psychological Measurement, 53, 801-813.
Rapoff, M. A. (2010). Editorial: Assessing and Enhancing Clinical Significance/Social
Validity of Intervention Research in Pediatric Psychology. Journal of Pediatric
Psychology, 114-119.
Ramadass, D. & Zimmerman, B. J. (2011). Developing Self-Regulation Skills: The
Important
Role of Homework. Journal of Advanced Academics, 22(2), 194-218.
Rusticus, S. A., & Lovato, C. Y. (2011). Applying Tests of Equivalence for Multiple
Group Comparisons: Demonstration of the Confidence Interval Approach.
Practical Assessment, Research & Evaluation, 16(7), 1-6.
Schullery, N. M., Reck, R. F., & Schullery, S. E. (2011). Toward Solving the High
Enrollment, Low Engagement Dilemma: A Case Study in Introductory Business.
International Journal of Business, Humanities and Technology, 1(2), 1-9.
Schunk, D.H. (2005). Self-Regulated Learning: The Educational Legacy of Paul R.
Pintrich.
Educational psychologist, 40, 85-94.
Shibley, I. A., Jr & Wilson, T.D. (2012). The Effects of Self-Regulation, Motivation,
Anxiety, and Attributions on Mathematics Achievement for Fifth and Sixth Grade
Students. School Science and Mathematics.

141
Shores, M., & Shannon, D. (2007). The Effects of Self-Regulation, Motivation, Anxiety,
and Attributions on Mathematics Achievement for Fifth and Sixth Grade
Students. School Science and Mathematics, 225-236
Stewart-Wingfield, S., & Black, G. S. (2005). Active versus passive course designs: The
impacet on student outcomes. NJournal of Education for Business, 81, 119-125.
Svinicki, M. D. (1999). New Directions in Learning. New Directions for Teaching and
Learning.
Talbert, R. (2012). How do student attitudes toward learning change in a flipped
classroom: [blog] Retrieved from
http://chronicle.com/blognetwork/castingoutnines/2012/09/10/student-attitudes-
toward-learning-change-in-a-flipped-classroom/.
Wang, MT. & Degol, J.L. Educ Psychol Rev (2017) 29: 119. Retrieved from
https://doi.org/10.1007/s10648-015-9355-
Zimmerman, B. J. (1998). Academic Studying and The Development of Personal Skill: A
Self-
Regulatory Perspective. Educational psychologist, 33(2/3), 73-86.
Zimmerman, B. J. (1990). Self-regulated learning and academic achievement: An
overview. Educational psychologist, 25(1), 3-17.
Zimmerman, B. J. (2008). Investigating Self-regulated and Motivation: Historical
Background,
Methodological Developments, and Future Prospects. American Educational
Research Journal, 45(1), 166-183.

142
APPENDICES

143
APPENDIX A
MOTIVATED STUDENT LEARNING QUESTIONNAIRE
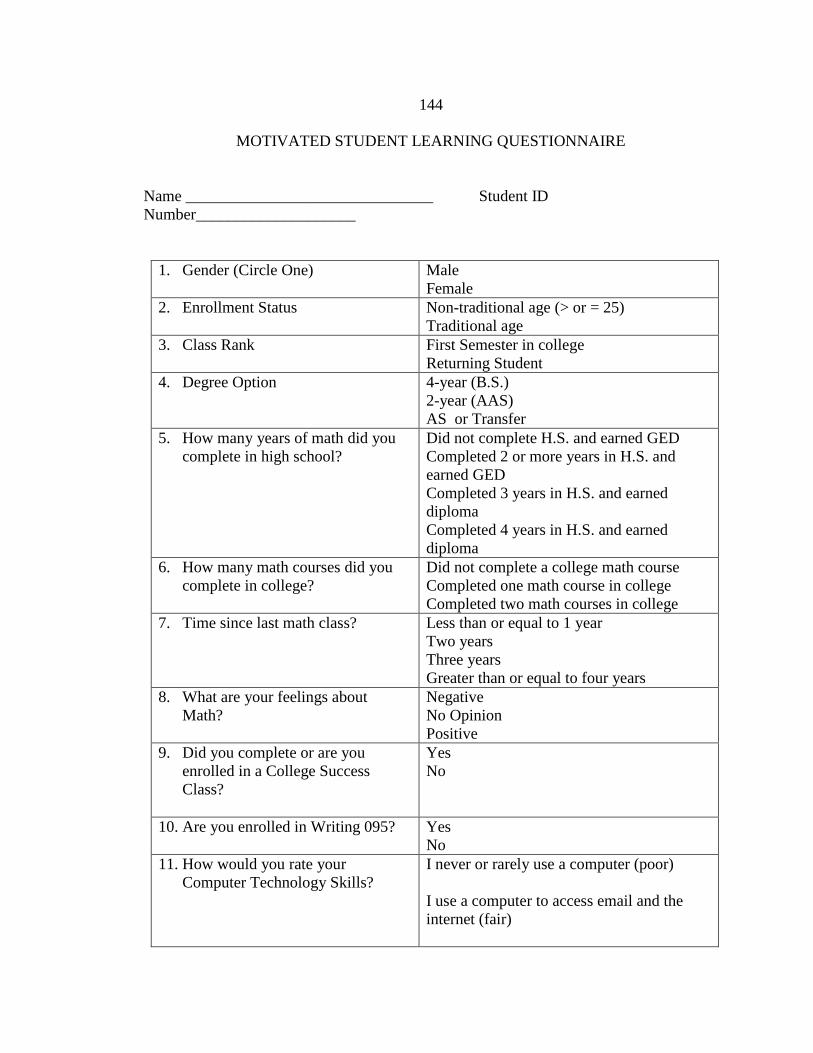
144
MOTIVATED STUDENT LEARNING QUESTIONNAIRE
Name _______________________________ Student ID
Number____________________
1. Gender (Circle One)
Male
Female
2. Enrollment Status
Non-traditional age (> or = 25)
Traditional age
3. Class Rank
First Semester in college
Returning Student
4. Degree Option 4-year (B.S.)
2-year (AAS)
AS or Transfer
5. How many years of math did you
complete in high school?
Did not complete H.S. and earned GED
Completed 2 or more years in H.S. and
earned GED
Completed 3 years in H.S. and earned
diploma
Completed 4 years in H.S. and earned
diploma
6. How many math courses did you
complete in college?
Did not complete a college math course
Completed one math course in college
Completed two math courses in college
7. Time since last math class?
Less than or equal to 1 year
Two years
Three years
Greater than or equal to four years
8. What are your feelings about
Math?
Negative
No Opinion
Positive
9. Did you complete or are you
enrolled in a College Success
Class?
Yes
No
10. Are you enrolled in Writing 095? Yes
No
11. How would you rate your
Computer Technology Skills?
I never or rarely use a computer (poor)
I use a computer to access email and the
internet (fair)

145
I frequently use a computer and utilize
various programs (good)
I’m confident using a computer and can
troubleshoot most technical problems
(excellent)
THANK YOU FOR YOUR PARTICIPATION
The below information is to be filled out by the researcher
Placement Score and date:
Compass Pretest scores and placement:
Compass Posttest scores and placement:
Midterm average and grade
Final course average and grade
Number of days absent

146
The following questions ask about your learning strategies and study skills for this class.
There are no right or wrong answers, so please answer the questions about how you
study in a math class as accurately as possible.
Use the scale below to answer the following questions. If you think the statement is very
true of you, circle 7; if a statement is not true of you, circle 1. If a statement is more or
less true of you, find the number between 1 and 7 that best describes you.
1 2 3 4 5 6 7
Not at all true of me Very true of me
1. In a class like this, I prefer course material
that really challenges me so I can learn new
things.
1 2 3 4 5 6 7
2. If I study in appropriate ways, then I will
be able to learn the material in this
course.
1 2 3 4 5 6 7
3. When I take a test I think about how poorly
I am doing compared with other students. 1 2 3 4 5 6 7
4. I think I will be able to use what I learn in
this course in other courses. 1 2 3 4 5 6 7
5. I believe I will receive an excellent grade
in this class. 1 2 3 4 5 6 7
6. I’m certain I can understand the most
difficult material presented in the
readings for this course.
1 2 3 4 5 6 7
7. Getting a good grade in this class is the
most satisfying thing for me right now. 1 2 3 4 5 6 7
8. When I take a test I think about items on
other parts of the test I can’t answer. 1 2 3 4 5 6 7
9. It is my own fault if I don’t learn the
material in this course. 1 2 3 4 5 6 7
10. It is important for me to learn the course
material in this class. 1 2 3 4 5 6 7
11. The most important thing for me right now
is improving my overall grade point
average, so my main concern in this class is
getting a good grade.
1 2 3 4 5 6 7

147
12. I’m confident I can learn the basic
concepts taught in this course. 1 2 3 4 5 6 7
13. If I can, I want to get better grades in this
class than most of the other students. 1 2 3 4 5 6 7
14. When I take tests I think of the
consequences of failing. 1 2 3 4 5 6 7
15. I’m confident I can understand the most
complex material presented by the
instructor in this course.
1 2 3 4 5 6 7
16. In a class like this, I prefer course material
that arouses my curiosity, even if it is
difficult to learn.
1 2 3 4 5 6 7
17. I am very interested in the content area of
this course. 1 2 3 4 5 6 7
18. If I try hard enough, then I will
understand the course material. 1 2 3 4 5 6 7
19. I have an uneasy, upset feeling when I take
an exam. 1 2 3 4 5 6 7
20. I’m confident I can do an excellent job on
the assignments and tests in this course. 1 2 3 4 5 6 7
21. I expect to do well in this class. 1 2 3 4 5 6 7
22. The most satisfying thing for me in this
course is trying to understand the content as
thoroughly as possible.
1 2 3 4 5 6 7
23. I think the course material in this class is
useful for me to learn. 1 2 3 4 5 6 7
24. When I have the opportunity in this class, I
choose course assignments that I can learn
from even if they don’t guarantee a good
grade.
1 2 3 4 5 6 7
25. If I don’t understand the course material,
it is because I didn’t try hard enough. 1 2 3 4 5 6 7
26. I like the subject matter of this course. 1 2 3 4 5 6 7
27. Understanding the subject matter of this
course is very important to me. 1 2 3 4 5 6 7
28. I feel my heart beating fast when I take an
exam. 1 2 3 4 5 6 7
29. I’m certain I can master the skills being
taught in this class. 1 2 3 4 5 6 7
30. I want to do well in this class because it is
important to show my ability to my family,
employer, or others.
1 2 3 4 5 6 7

148
31. Considering the difficulty of this course,
the teacher, and my skills, I think I will
do well in this class.
1 2 3 4 5 6 7
32. When I study the readings for this course, I
outline the material to help me organize my
thoughts.
1 2 3 4 5 6 7
33. During class time I often miss important
points because I’m thinking of other
things.
1 2 3 4 5 6 7
34. When studying for this course, I often try to
explain the material to a classmate or friend. 1 2 3 4 5 6 7
35. I usually study in a place where I can
concentrate on my course work. 1 2 3 4 5 6 7
36. When reading for this course, I make up
questions to help focus my reading. 1 2 3 4 5 6 7
37. I often feel so lazy or bored when I study
for this class that I quit before I finish what
I planned to do.
1 2 3 4 5 6 7
38. I often find myself questioning things I hear
or read in this course to decide if I find the
convincing.
1 2 3 4 5 6 7
39. When I study for this class, I practice saying
the material to myself over and over. 1 2 3 4 5 6 7
40. Even if I have trouble learning the material
in this class, I try to do the work on my
own, without help from anyone.
1 2 3 4 5 6 7
41. When I become confused about
something I’m reading for this class, I go
back and try to figure it out.
1 2 3 4 5 6 7
42. When I study for this course, I go through
the readings and my class notes and try to
find the most important ideas.
1 2 3 4 5 6 7
43. I make good use of my study time for this
course. 1 2 3 4 5 6 7
44. If course readings are difficult to
understand, I change the way I read the
material.
1 2 3 4 5 6 7
45. I try to work with other students from this
class to complete the course assignments. 1 2 3 4 5 6 7
46. When studying for this course, I read my
class notes and the course readings over and
over again.
1 2 3 4 5 6 7
47. When a theory, interpretation, or conclusion
is presented in class or in the readings, I try 1 2 3 4 5 6 7

149
to decide if there is good supporting
evidence.
48. I work hard to do well in this class even if I
don’t like what we are doing. 1 2 3 4 5 6 7
49. I make simple charts, diagrams, or tables to
help me organize course material. 1 2 3 4 5 6 7
50. When studying for this course, I often set
aside time to discuss course material with a
group of students from the class.
1 2 3 4 5 6 7
51. I treat the course material as a starting point
and try to develop my own ideas about it. 1 2 3 4 5 6 7
52. I find it hard to stick to a study schedule. 1 2 3 4 5 6 7
53. When I study for this class, I pull together
information from different sources, such as
lectures, readings, and discussions.
1 2 3 4 5 6 7
54. Before, I study new course material
thoroughly, I often skim it to see how it is
organized.
1 2 3 4 5 6 7
55. I ask myself questions to make sure I
understand the material I have been
studying in this class.
1 2 3 4 5 6 7
56. I try to change the way I study in order
to fit the course requirements and the
instructor’s teaching style.
1 2 3 4 5 6 7
57. I often find that I have been reading for
this class but don’t know what it is about. 1 2 3 4 5 6 7
58. I ask the instructor to clarify concepts I
don’t understand well. 1 2 3 4 5 6 7
59. I memorize key words to remind me of
important concepts in this class. 1 2 3 4 5 6 7
60. When course work is difficult, I either give
up or only study the easy parts. 1 2 3 4 5 6 7
61. I try to think through a topic and decide
what I am supposed to learn from it
rather than just reading it over when
studying for this course.
1 2 3 4 5 6 7
62. I try to relate ideas in this subject to those in
other courses whenever possible. 1 2 3 4 5 6 7
63. When I study for this course, I go over my
class notes and make an outline of
important concepts.
1 2 3 4 5 6 7
64. When reading for this class, I try to relate
the material to what I already know. 1 2 3 4 5 6 7
65. I have a regular place set aside for studying. 1 2 3 4 5 6 7

150
66. I try to plan around the ideas of my own
related to what I am learning in this course. 1 2 3 4 5 6 7
67. When I study for this course, I write brief
summaries of the main ideas from the
readings and my notes.
1 2 3 4 5 6 7
68. When I can’t understand the material in this
course, I ask another student for help. 1 2 3 4 5 6 7
69. I try to understand the material in this class
by making connections between the
readings and the concepts from the lectures.
1 2 3 4 5 6 7
70. I make sure that I keep up with the weekly
readings and assignments for this course. 1 2 3 4 5 6 7
71. Whenever I read or hear an assertion or
conclusion in this class, I think about
possible alternatives.
1 2 3 4 5 6 7
72. I make lists of important items for this
course and memorize the lists. 1 2 3 4 5 6 7
73. I attend this class regularly. 1 2 3 4 5 6 7
74. Even when course materials are dull and
uninteresting, I manage to keep working
until I finish.
1 2 3 4 5 6 7
75. I try to identify students in this class whom
I can ask for help if necessary. 1 2 3 4 5 6 7
76. When studying for this course I try to
determine which concepts I don’t
understand well.
1 2 3 4 5 6 7
77. I often find that I don’t spend very much
time on this course because of other
activities.
1 2 3 4 5 6 7
78. When I study for this class, I set goals for
myself in order to direct my activities in
each study period.
1 2 3 4 5 6 7
79. If I get confused taking notes in class, I
make sure I sort it out afterwards. 1 2 3 4 5 6 7
80. I rarely find time to review my notes or
readings before an exam. 1 2 3 4 5 6 7
81. I try to apply ideas from course readings in
other class activities such as lecture and
discussions.
1 2 3 4 5 6 7

151
APPENDIX B
OBSERVATIONS
152

153