doe f 4600.2 (03/11) u.s. department of energy all other
TRANSCRIPT

1
1. Identification Number: DE-FE0006821
2. Program/Project Title: Small Scale Field Test Demonstration CO2 Sequestration
3. Recipient: University of Kansas Center for Research, Inc.
4. Reporting Requirements:
A. MANAGEMENT REPORTING Research Performance Progress Report (RPPR)
Special Status Report
B. SCIENTIFIC/TECHNICAL REPORTING (Reports/Products must be submitted with appropriate DOE F 241. The 241 forms are available at www.osti.gov/elink)
Report/Product Form Final Scientific/Technical Report DOE F 241.3 Conference papers/proceedings* DOE F 241.3 Software/Manual DOE F 241.4 Other (see special instructions) DOE F 241.3
* Scientific and technical conferences only C. FINANCIAL REPORTING
SF-425 Federal Financial Report D. CLOSEOUT REPORTING
Patent Certification
SF-428 & 428B Final Property Report
Other E. OTHER REPORTING
Annual Indirect Cost Proposal
Audit of For-Profit Recipients
SF-428 Tangible Personal Property Report Forms Family
Other – see block 5 below
Frequency Addressees
Q A
FG A
Q, FG
FC
FC
O
A A
http://www.osti.gov/elink-2413
http://www.osti.gov/elink-2413
See block 5 below for instructions.
FREQUENCY CODES AND DUE DATES:
A - Within 5 calendar days after events or as specified. FG- Final; 90 calendar days after the project period ends. FC- Final; End of Effort. Y - Yearly; 90 calendar days after the end of the reporting period. S - Semiannually; within 30 calendar days after end of project year and project half-year. Q - Quarterly; within 30 days after end of the reporting period. Y180 – Yearly; 180 days after the end of the recipient’s fiscal year O - Other; See instructions for further details.
5. Special Instructions:
Annual Indirect Cost Proposal – If DOE is the Cognizant Federal Agency, then the proposal should be sent to [email protected] . Otherwise, it should be sent to the Cognizant Federal Agency. Other – The Recipient shall provide all deliverables as contained in Section D of Attachment 2 Statement of Project Objectives.
DOE F 4600.2 (03/11) All Other Editions Are Obsolete
U.S. Department of Energy
FEDERAL ASSISTANCE REPORTING CHECKLIST AND INSTRUCTIONS FOR RD&D PROJECTS

2
QUARTERLY PROGRESS REPORT To
DOE-NETL Brian Dressel, Program Manager Award Number: DE-FE0006821
SMALL SCALE FIELD TEST DEMONSTRATING CO2 SEQUESTRATION IN
ARBUCKLE SALINE AQUIFER AND BY CO2-EOR AT WELLINGTON FIELD, SUMNER COUNTY, KANSAS
Project Director/Principal Investigator:
W. Lynn Watney Senior Scientific Fellow
Kansas Geological Survey
Ph: 785-864-2184, Fax: 785-864-5317 [email protected]
Joint Principal Investigator:
Jason Rush
Date of Report: July 30, 2012 Revised 8-5-12
DUNS Number: 076248616
Recipient: University of Kansas Center for Research &
Kansas Geological Survey 1930 Constant Avenue Lawrence, KS 66047
Project/Grant Period: 10/1/2011 through 9/30/2015
Third Quarterly Report
Period Covered by the Report: April 1, 2012 through June 30, 2012
Signature of Submitting Official:
__________________________

3
EXECUTIVE SUMMARY
Project Objectives
The objectives of this project are: (1) inject under supercritical conditions approximately 40,000 metric tons of CO2 into the Arbuckle saline aquifer; (2) demonstrate the application of state-of-the-art MVA (monitoring, verification, and accounting) tools and techniques to monitor and visualize the injected CO2 plume; (3) develop a robust Arbuckle geomodel by integrating data collected from the proposed study area, and a multi-component 3D seismic survey; (4) conduct reservoir simulation studies to map CO2 plume dispersal and estimate tonnage of CO2 sequestered in solution, as residual gas and by mineralization; (5) integrate MVA data and analysis with reservoir modeling studies to detect CO2 leakage and to validate the simulation model; (6) develop a rapid-response mitigation plan to minimize CO2 leakage and a comprehensive risk management strategy; and (7) establish best practice methodologies for MVA and closure. Additionally, approximately 30,000 metric tons of CO2 shall be injected into the overlying Mississippian to evaluate miscible CO2-EOR potential in a 5-spot pilot pattern. The CO2 shall be supplied from the Abengoa Bioenergy ethanol plant at Colwich, Kansas who has operated the facility since 1982 demonstrating reliability and capability to provide an adequate stream and quality of CO2. The project shall install compression, chilling, and transport facilities at the ethanol plant for truck transport to the injection site. Project Goals The proposed small scale injection will advance the science and practice of carbon sequestration in the Midcontinent by refining characterization and modeling, evaluating best practices for MVA tailored to the geologic setting, optimize methods for remediation and risk management, and provide technical information and training to enable additional projects and facilitate discussions on issues of liability and risk management for operators, regulators, and policy makers.
The data gathered as part of this research effort and pilot study will be shared with the Southwest Sequestration Partnership (SWP) and integrated into the National Carbon Sequestration Database and Geographic Information System (NATCARB) and the 6th Edition of the Carbon Sequestration Atlas of the United States and Canada.
Project Deliverables by Task 1.5 Well Drilling and Installation Plan (Can be Appendix to PMP or Quarterly Report) 1.6 MVA Plan (Can be Appendix to PMP or Quarterly Report) 1.7 Public Outreach Plan (Can be Appendix to PMP) 1.8 Arbuckle Injection Permit Application Review go/no go Memo 1.9 Mississippian Injection Permit Application Review go/no go Memo 1.10 Site Development, Operations, and Closure Plan (Can be Appendix to PMP)

4
2.0 Suitable geology for Injection Arbuckle go/no go Memo 3.0 Suitable geology for Injection Mississippian go/no go Memo 11.2 Capture and Compression Design and Cost Evaluation go/no go Memo 19 Updated Site Characterization/Conceptual Models (Can be Appendix to Quarterly Report) 21 Commercialization Plan (Can be Appendix to Quarterly Report). 30 Best Practices Plan (Can be Appendix to Quarterly or Final Report)
ACCOMPLISHMENTS
1. Completed NEPA, budget/contract reviews during the quarter. NEPA statements have been approved and budget/contract review nearly complete.
2. Significant progress made in compiling information and characterizing site for use in the application for Class VI CO2 injection permit in the Arbuckle.
3. Conducted area of review of wells and USDW. 4. Incorporated depth-migrated seismic into initial Petrel geocellular model, but obtaining
reprocessed seismic volume for use in revising the Petrel model for eventual use in simulation modeling for the Class VI permit application.
5. Completed geochemical and isotopic analyses of the brines samples in two wells previously drilled in DE-FE0002056. Results indicate that the Upper and Lower Arbuckle are hydraulically isolated by a mid Arbuckle barrier. This tight ~300 ft thick interval is also recognized on well logs, core, and 3D impedance mapping. While potentially reducing the injection interval to the ~300 ft thick lower Arbuckle, the mid Arbuckle will likely serve as an interval to “pancake” the CO2 plume into thin layers of higher porosity and higher permeability intervals mixed with tight rock. Multiple layers perhaps accesses by localized fractures will facilitate mixing of CO2 and brine, promote capillary entrapment of the CO2, and limit or eliminate free phase CO2 from accumulated beneath the primary caprock. The net effect could be to notably increase CO2 storage.
6. Initial geomechanical modeling of the caprock interval is very positive. The 120 ft-thick lower Mississippian-age dark argillaceous siltstones are tight and have relatively minor evidence of fracturing based on a fully cored, logged, and seismically imaged and analyzed interval.
7. Two preliminary coupled dynamic models of the small scale CO2 injection in the Arbuckle have been completed. Between solubility trapping and capillary effects the 40,000 tons will be likely be rapidly trapped in the lower Arbuckle where the CO2 is injected. Further analysis will continue. Pressures are such that CO2 escape from a worst case scenario of open wells in the AOR will likely not cause a leak of CO2 to the surface due to relatively low pressure beyond the injection well. However, more modeling is needed to firmly conclude this.

5
8. The geomechanical component in the simulation run under CMG software is based on a complete suite of mechanical tests from core analysis. Initial results indicate mechanical integrity in this rock system will not be compromised by the 40,000 ton injection into the lower Arbuckle over 9 month timeframe.
9. Reprocessing of the 3D seismic will be used to discretely map fractures and faults. Yet, current geomechanical modeling indicates that reactivation of these structures is unlikely. An updated geomodel from Petrel based on a new seismic volume will used as input into final simulations including sensitivity analyses, as required by EPA for use in the Class VI application. These will be the results to confirm the Area of Review.
Milestone Status Report
Budget Period #1 includes two milestones, Milestone 1 (Task 2) -- Site Characterization of Arbuckle Saline Aquifer System - Wellington Field, and Milestone 2 (Task 3.) -- Site characterization of Mississippian Reservoir for CO2 EOR - Wellington Field. Planned completion for Milestone 1 and 2 were set for 3/1/12, but as explained below were delayed for the following reasons: 1) core analysis measurements were not obtained until February 2012, 2) seismic processing and analysis required more iteration, 3) calibration of well logs could not be completed until core analyses were available, 4) data integration into Petrel required steps 1-3 to be completed, and 5) dynamic modeling requiring steps 1-4 could only proceed using generalized geomodel prior to the integrated geocellular model from Petrel becoming available. Milestone 1 will be completed in next quarter for use in the application for a Class VI injection permit. Milestone 2 will require an additional quarter due to above delays.
Project Schedule
An abbreviated Gantt Chart follows that describes suggested changes to accommodate delays in obtaining Milestones 1 and 2 and concerns about receiving a Class VI injection permit from EPA. The Gantt Chart is based on the scenario with CO2 initially being injected into the Mississippian oil reservoir under a Class II permit from the State of Kansas followed by injection into the Arbuckle saline aquifer, if the Class VI permit is granted. If the Class VI application is not forthcoming from EPA, all the CO2 would be injected into the Mississippian oil reservoir for CO2-EOR. Under this scenario MVA technologies would be deployed in an observation well near the Mississippian CO2 injection well to insure 99% efficacy of CO2 storage in the oil reservoir.
Task Budget Period Number Milestone DescriptionTask 2. 1 1 Site Characterization of Arbuckle Saline Aquifer System - Wellington FieldTask 3. 1 2 Site characterization of Mississippian Reservoir for CO2 EOR - Wellington FieldTask 10. 2 3 Pre-injection MVA - establish background (baseline) readingsTask 13. 2 4 Retrofit Arbuckle Injection Well (#1-28) for MVA Tool InstallationTask 18. 3-yr1 5 Compare Simulation Results with MVA Data and Analysis and Submit Update of Site Characterization, Modeling, and Monitoring PlanTask 22. 3-yr1 6 Recondition Mississippian Boreholes Around Mississippian CO2-EOR injectorTask 27. 3-yr2 7 Evaluate CO2 Sequestration Potential of CO2-EOR Pilot Task 28. 3-yr2 8 Evaluate Potential of Incremental Oil Recovery and CO2 Sequestration by CO2-EOR - Wellington field

6
The Field Work Proposal (FWP) with Lawrence Berkley National Lab has been approved, but activities to date have been limited to planning discussions regarding deployment of MVA technologies that they are responsible for. Field activities are being deferred until the submittal of the Class VI permit application.
ONGOING ACTIVITIES –
TASK 1. PROJECT MANAGEMENT AND REPORTING
Subtask 1.5. Drilling and Well Installation Plan
Well Drilling and Installation topics have focused material necessary for application for a Class VI injection permit. Completed wells and boreholes including drilling and installation methods, the well-borehole designs (casing design, centralizer plan, cement design, etc.) (e.g., Figure 1), method for determining perforation zones, contingencies for anticipated problems encountered during drilling such as loss circulation zones, completion and development plan. Additionally, the drilling and well installation plan will include a description of mud logging, wire line logging, coring, swabbing and laboratory analysis of samples, and any other testing that may be performed on the well-borehole.
original BP1 BP2 BP3-Yr1 BP-Yr2
BP Task Task Name Sep-11 Sep-12 Sep-13 Sep-14 Sep-151 Task 1. Project Management and Reporting
1 Task 2. Site Characterization of Arbuckle Saline Aquifer System - Wellington FieldClass VI Application
1 Task 3. Site characterization of Mississippian Reservoir for CO2 EOR - Wellington FieldClass II Application
1 Task 5. Drill CO2 Injection Borehole at the Center of Mississippian CO2-EOR Pattern Mississippian activity Retrofit Existing Mississippian or Drill New Well for Monitoring ? ?
1 Task 6 Reenter, Deepen, & Complete Existing Plugged Arbuckle Borehole (Peasel 1) Arbuckle activity pending receipt of Class VI permit and DOE funding
1 Task 7. Revise Site Characterization Models and Simulations for CO2 Sequestration and submit a revised Site Characterization, Modeling, and Monitoring Plan to DOE:
1 Task 8. Inventory Well and Borehole Completions within Area of Influence of Small Scale CO2 Sequestration Project
1 Task 9. Establish MVA Infrastructure - Around CO2 Injector for CO2 Sequestration
1 Task 10 Pre-injection MVA - Establish Background (Baseline) Readings
1 Task 11 Design and Construct CO2 Compression & Loading Facility at CO2 Source Abengoa needs 1 year to install CO2 capture Go ahead for field activities
1 Task 12 Build Infrastructure for CO2 Pressurization at Mississippian Injection Borehole for CO2 Sequestration
1 Task 22 Recondition Mississippian Boreholes Around Mississippian CO2-EOR injector
Task 4. Drill Monitoring Borehole (#2-28) for CO2 Sequestration in Arbuckle Saline Aquifer
2 Task 13 Retrofit Arbuckle Injection Well (#1-28) for MVA Tool Installation
2 Task 14 Retrofit Arbuckle Observation Well (#2-28) for MVA Tool Installation
2 Task 15 Begin Injection at Arbuckle Injector
2 Task 16 MVA During Injection - Mississippian and Arbuckle CO2 Sequestration Mississippan only or both Mississippian and Arbuckle
2 Task 24 CO2 Transported to Mississippian Injector inject for another 9 months if no Class VI and no DOE funding
2 Task 25 Monitor Performance of CO2-EOR Pilot
2 Task 26 Compare Pilot EOR Performance with Model Results
3-1 Task 17 Risk Management Related to CO2 Sequestration in Arbuckle Saline Aquifer
3-1 Task 18 Compare Simulation Results with MVA Data and Analysis and Submit Update of Site Characterization, Modeling, and Monitoring Plan
3-1 Task 23 Equipment Dismantlement
3-2 Task 19 Post injection MVA - CO2 sequestration site post MVA limited to 9 months
3-2 Task 20 Evaluate CO2 Sequestration Potential in Arbuckle Saline Aquifer at Wellington
3-2 Task 21 Evaluate regional CO2 Sequestration Potential in Arbuckle Saline Aquifer in Kansas
3-2 Task 27 Evaluate CO2 Sequestration Potential of CO2-EOR Pilot
3-2 Task 28 Evaluate Potential of Incremental Oil Recovery and CO2 Sequestration by CO2-EOR - Wellington field
3-2 Task 29 Closure of CO2 Sequestration Project in Arbuckle Saline Aquifer at Wellington field
3-2 Task 30 Develop a Best Practice Manual:

7
Figure 1. Wellbore diagram CO1 injection well, Berexco Wellington KGS #1-28.
Subtask 1.6. Monitoring Verification and Accounting (MVA) and Mitigation Plan
The MVA and mitigation plans will be completed as part of the Class VI application and submitted as a separate report. MVA plan will now include equipting same technologies and methodologies for the Mississippian CO2 injection ahead of the Arbuckle. This will require adapting the MVA to the CO2-EOR to establish 99% sequestration of the CO2.

8
Subtask 1.7. Public Outreach Plan:
The Public Outreach Plan will also be submitted as part of the Class VI application. The DOE document will describe workshops, presentations, and publications in technical and trade journals to be used to transfer lessons learned best practices, geomodels, simulation results, MVA data and observations to the public, regulators, legislators, and local industry. The PI is actively discussing the project with stakeholders.
Subtask 1.8. (Go-No Go Decision for CO2 saline formation sequestration) Arbuckle Injection Permit Application
Effort during the third quarter was focused on firming up key elements of the application for a Class VI injection permit including interpreting and integrating new seismic data and review of the tests and expanding characterization to include an understanding of the USDW and regional flow and pressure within the Arbuckle saline aquifer. Key topics discussed and evaluated among the team and DOE program manager related to Subtask 1.8 include:
o Location and timing of project – Field activities will get underway including installation of wells and equipment to inject and monitor CO2 in the Mississippian as soon as the application for the Class VI inject permit is administratively accepted by EPA. Application is approximately one month from submittal to EPA.
o Site of Arbuckle saline formation injection – Initially, 30,000 tons of CO2 will be
injected into the Mississippian oil reservoir accompanied by a complete deployment of MVA technologies. MVA will focus on CO2-EOR to verify 99% sequestration of the CO2 in the oil reservoir. As soon as the Class VI permit is approved by EPA, DOE will determine if CO2 injection into the Arbuckle saline formation will be deployed. Additional funds would be required to capture additional CO2, if the amount injected into the Mississippian had exceeded the allocated 30,000 tons. Additional funds would also be needed to deploy MVA for the Arbuckle CO2 injection and extend the monitoring period.
o Injection zone – The characterization of the lower Arbuckle, Gasconade Dolomite to
Gunter Sandstone Member has determined that this interval has sufficient permeability and net porous thickness of strata in the interval to accommodate the 40,000 tons of CO2 to be injected during the small scale test (Figure 2). The assessment is based on analysis of core, wireline logs, interference test, and continuity of impedance/porosity mapping from 3D seismic and new coupled flow

9
and geomechanical dynamic modeling. Similarly, the excellent response of the waterflood in the Mississippian oil reservoir strongly suggests that the 30,000 ton CO2 injection will have a favorable response.
Figure 2. Representative samples from the injection zone in KGS #1-32 core.
• Baffle and trapping of CO2 in the Arbuckle saline formation – The comprehensive set of measurements from wells #1-32 and #1-28 and inversion and impedance analysis of the 3D seismic indicate that the middle ~300 ft interval of the Arbuckle (lower Jefferson City Cotter down to near the top of the Roubidoux Formation) is predominantly tight, slightly argillaceous dolomite with thin alternating shales and permeable intervals (Figure 3). Moreover, major and minor element, cation and anion geochemical and isotopic (carbon and deuterium) analyses of formation brines using multiple limited interval drill stem tests and perforation of casing and swabbing indicate that brines in the upper and lower Arbuckle are not in communication on the scale of geologic time. This isolation of the hydrostratigraphic units is at least the case for the local area studied. Core, wireline logs, seismic, and geochemistry together corroborate the extensive continuity of the tight mid Arbuckle interval. The result should be at least baffling of the CO2 that is injected beneath and flow of CO2 into thinner permeable intervals leading to CO2 trapping in the finer pores and mixing and solution of the CO2 into the brine making it heavier and further decreasing the buoyant, free phase CO2.
5089-92 ft
5053-56
5080-83
4995-97.7 ft

10
Figure 3. Mid Arbuckle barrier/baffle interval lower Jefferson City-Cotter. Note shale at 4431 ft an abundant darker laminated micritic dolostone that dominates the baffle/barrier in the mid Arbuckle.
• Primary caprock interval – A very important elements besides injectivity and
storage in the saline aquifer where the CO2 injection will take place is the integrity of the primary caprock. The caprock interval that is being intensely studied includes the 1) ~120 ft thick, Middle and Lower Mississippian-age tight, dark argillaceous dolosiltite that is tentatively correlated to the Pierson Formation and 2) the black, clay-rich Upper Devonian Chattanooga Shale (Figure 4). The underlying Simpson Group shales and sandstones rest on the Arbuckle and appear to be locally sealing since oil is locally trapped in the sandstones on this structural dome in Wellington Field, albeit off to the edge of the structure and not near the injection site.
An abundance of data is being synthesized from existing study for use in the application for injection including 1) core analysis consisting of mechanical tests,

11
CO2 “soak” tests of plug samples to examine reaction via geochemical and CT scans of plugs, capillary pressure, and helical CT scans of whole core; 2) and wireline logs including dipole sonic, density, microimaging, and NMR; and 3) 3D seismic imaging to correlate to well calibration data and map properties for use in buiding a refined geomodel. The latter activity, specifically, the geomechanical dynamic modeling is only now beginning due to recent receipt of final mechanical measurements from the lab during the quarter.
Figure 4. Synthetic seismogram, impedance, and triple combo log suite KGS #1-28 (CO2 injection well in Arbuckle at Wellington Field). Vertical scale is in 2-way seismic travel time with tick marks and depth noted alongside this scale. The illustration identifies the Arbuckle injection zone, baffle/barrier in mid Arbuckle, primary caprock interval (Pierson, Chattanooga, and where predominately shale, the Simpson Group), pay and CO2-EOR test interval in the Mississippian, and the secondary caprock of the Arbuckle and primary caprock of the Mississippian injection.
The primary caprock as noted above continues to be studied at a micro to macro field-wide level. The interval has generally lower seismic impedance and can be distinguished from surrounding strata (Figure 4). The relatively thick (120 ft) silty lower Mississippian that is tentatively correlated to the Pierson Formation is mappable with seismic, an
Pay
100 Hz
Top Mississippian
Top Arbuckle
Roubidoux Fm.
Baffle/barrier-Tight, dense- High impedance
Top Cherokee Gp.Secondary caprock
CO2-EOR pilot
Primary caprock interval
Gasconade Dol.
Gunter Ss.
Precambrian granite – bottom of core
CO2 Injection zone
Jefferson City-Cotter
ImpedanceSonicNeutron-Den-PeMicroresistivityGR/CGR/SP/Cal
ReflectionCoefficient
SyntheticTime
DepthEquiv.
Pierson Fm.?
Chattanooga Sh.Simpson Group

12
activity that is still being refined, and is distinctively dark and tight argillaceous dolomite siltstone. The higher organic content (one sample is 1% TOC) is enough to give the rock a dark gray-brown to black color (Figure 5). Measurements of permeability from two samples of this interval were carried out in the NETL lab in Pittsburgh during fall 2011 and results indicated pico- and nano-darcy permeability.
Figure 5. Representative samples from the lower Mississippian Pierson Formation that overlies the Chattanooga Shale is being evaluated as part of the primary caprock overlying the Arbuckle.
The complexity of the stratigraphic succession of the dark fined-grained interval of the Pierson Formation is illustrated by the spectral gamma ray spectral imaging tool, Java freeware app developed at the KGS with DOE support of the characterization project , DE-FE0002056, http://www.kgs.ku.edu/stratigraphic/ KIMELEON/ (Figure 6). The more organic rich intervals generally ties very closely to the higher uranium interval, the middle track in Figure 6. The organic matter may be an important contributor to both the integrity of the caprock providing an additional means to trap CO2 that may move along fractures within the interval.
3927- 3939: olive gray, argillaceous dolomitic siltstone; 50% silt; wispy shale laminations; indistinct bedding; faint discontinuous laminations; gradational contact
3939-3975.6: medium dark gray; very argillaceous dolomitic siltstone; faintly laminated irregular; 30% silt; 3972-3973 cm-sized irregular calcareous nodules/coarse calcite; faint lenticular bedding alternating olive gray and medium dark gray
3975.6-3993: very dark greenish gray; shale; tight; dolomitic; around 20% silt; scattered black shale laminae; uniform; scattered pyrite; 3983 starts increasing silt; gradational contact

13
Figure 6. Gamma ray spectral imager of the portion of the lower Mississippian Pierson Formation that appears to be able to serve as part of the primary caprock. A complex succession of strata are denoted via potassium, uranium, and thorium distribution.
The caprock is further examined using the nuclear magnetic resonance (NMR) imaging tool (Figure 7). The tool is a mature technology, but not often used to help define pore size distribution, water/hydrocarbon saturation, and estimate permeability. It was run in both wells drilled under DE-FE0002056, KGS #1-32 and #1-28. It has been compared with porosity and permeability from core analysis and used to compare Kh from drill stem tests and step-rate test. Together with the sonic, density, and resistivity logs, it provides a means to substantially increase the understanding of both porous and permeable rocks and distinguish them from low porosity and low permeability rocks. Such is the case for the interval considered as the primary caprock for the Arbuckle.
Range-adjusted KIMELEON spectral GR image

14
Figure 7. Magnetic resonance imaging profile in well KGS #1-28 from the interval being considered as the primary caprock for the Arbuckle CO2 injection at Wellington Field. The NMR is very useful in allowing continuous comparison of properties of the matrix pore system that comprises this interval.
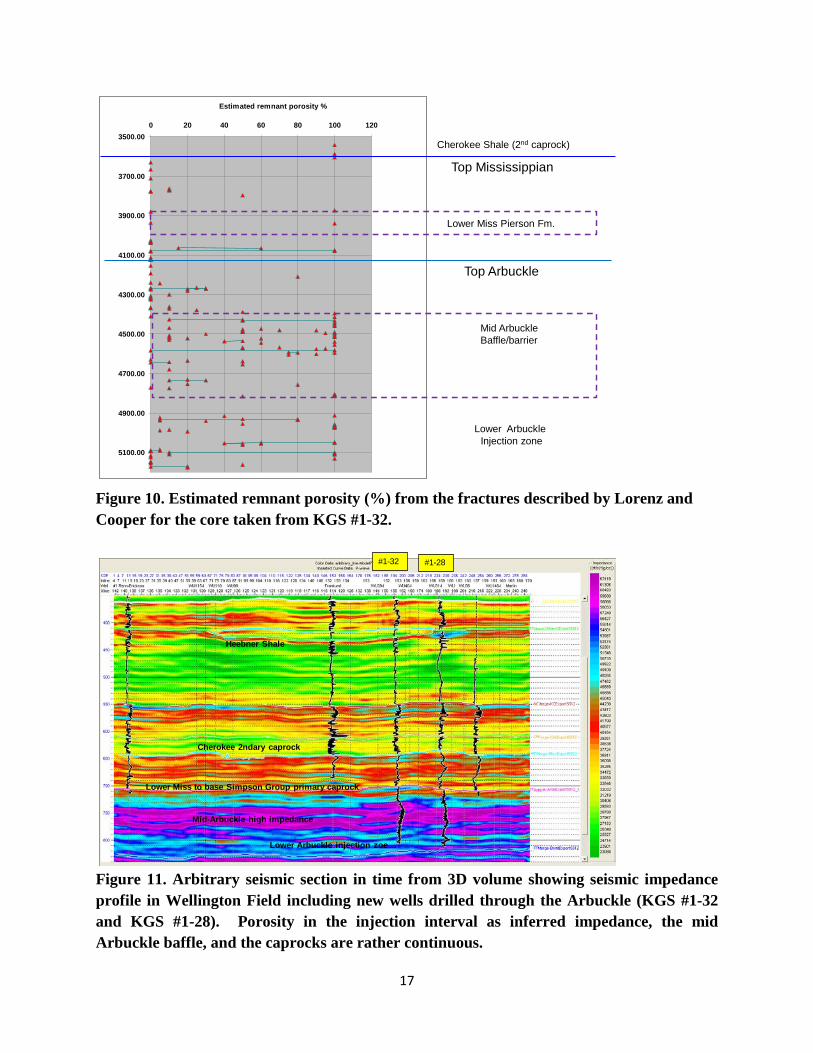
Fracture and fault characterization is being completed for the application for Class VI injection. The 1600 ft of core taken from KGS #1-32 was described over the course of a week by Lorenz and Cooper. Figure 8, 9, and 10 summarize the fracture distribution as visually described from the interval extending from the Cherokee shale, the secondary caprock above the Mississippian, to below the CO2 injection zone near the base of the Arbuckle. The fracture summary show that both the primary (particularly the lower Mississippian Pierson Formation) and secondary caprock have low fracture densityand lack the horizontal high porosity enhanced fractures(HZ HPZ) seen the Arbuckle. Fracture heights are also less than 1 ft in the caprocks compared to several feet common to the mid Arbuckle baffle/barrier and the lower injection zone of the Arbuckle. Finally, remmant porosity varies but tends to be higher in the mid Arbuckle baffle/barrier as the brine geochemistry and microbial population suggests that the interval is more isolated
Magnetic resonance imaging analysis
Lower Mississippian argillaceous dolosiltone, small pores
Chattanooga Shale Smallest pores
Simpson shales, Smallest pores
Top Arbuckle
T2(pore size)Permeability
low high small large
Porositylowhigh

15
and less cement due to smaller pore volumes of brine passing through might be a logical conclusion.
Figure 8. Fracture characterization of KGS #1-32 core by Lorenz and Cooper showing fracture density (# fractures in 1 ft intervals) (left) and frequency of horizontal high porosity zones (Hz HPZ) (right).
Additional fracture characterization has been made with the microresisitivity imaging tool, the spectral (oriented dipole) sonic, and 3D seismic. The spectral sonic establishes the fracture intensity, the imaging logs similar map the fracture and recognizing open, partial, closed. The seismic is being used to recognize discrete fracture networks that are resolvable with the seismic. A final version of the 3D seismic data will be depth migrated and used to map faults, fractures, and apparent porosity. The seismic time-impedance presented as an arbitrary section through Wellington Field that includes available velocity control is shown in Figure 11. The injection zone and upper Arbuckle have lower impedance than the middle
3500
3600
3700
3800
3900
4000
4100
4200
4300
4400
4500
4600
4700
4800
4900
5000
5100
5200
0 5 10 15 20
Hz HPZ's density (# of all HZ HPZ's in 1 ft intervals)
Dept
h (f
t)
Top Arbuckle
Top Mississippian
Horizontal High Porosity Zones
(Hz HPZ)
3500
3600
3700
3800
3900
4000
4100
4200
4300
4400
4500
4600
4700
4800
4900
5000
5100
5200
0 5 10 15 20 25 30 35 40 45 50
Fracture density (# of all fracture types in 1 ft intervals)
Dept
h (f
t)
Mid ArbuckleBaffle/barrier
Lower Miss Pierson Fm.
Cherokee Shale (2nd caprock)

16
Arbuckle baffle/barrier, and the lower Mississippian and Cherokee shale have lower impedance indicative of their shaly nature. The higher low impedance interval above the Cherokee is the upper Pennsylvanian shale that dominates the southern portion of the Kansas and is clearly a thick rather uniform interval of strata that can serve to prevent CO2 from moving upward toward the USDW. This entire interval up to the level of the Heebner Shale (Figure 11) is deep enough for CO2 to be in a supercritical state.
Figure 9. Fracture height (left) and fracture width (right).
3500.00
3700.00
3900.00
4100.00
4300.00
4500.00
4700.00
4900.00
5100.00
0.00 1.00 2.00 3.00 4.00 5.00
fracture width (mm)
Dep
th
fracture height (ft)
3500.00
3700.00
3900.00
4100.00
4300.00
4500.00
4700.00
4900.00
5100.00
0.00 1.00 2.00 3.00 4.00 5.00
Top Arbuckle
Top Mississippian
Mid ArbuckleBaffle/barrier
Lower Miss Pierson Fm.
Cherokee Shale (2nd caprock)
Lower Arbuckle Injection zone
17
Figure 10. Estimated remnant porosity (%) from the fractures described by Lorenz and Cooper for the core taken from KGS #1-32.
Figure 11. Arbitrary seismic section in time from 3D volume showing seismic impedance profile in Wellington Field including new wells drilled through the Arbuckle (KGS #1-32 and KGS #1-28). Porosity in the injection interval as inferred impedance, the mid Arbuckle baffle, and the caprocks are rather continuous.
Estimated remnant porosity %
3500.00
3700.00
3900.00
4100.00
4300.00
4500.00
4700.00
4900.00
5100.00
0 20 40 60 80 100 120
Top Arbuckle
Top Mississippian
Mid ArbuckleBaffle/barrier
Lower Miss Pierson Fm.
Cherokee Shale (2nd caprock)
Lower Arbuckle Injection zone
#1-32 #1-28
Mid-Arbuckle high impedance
Lower Arbuckle injection zoe
Cherokee 2ndary caprock
Lower Miss to base Simpson Group primary caprock
Heebner Shale

18
The static geomodel used in the Class VI application will include a combination of the information obtained from the wireline logs, core analyses, and seismic data. Once a final version of the seismic interpretation is made the results will be imported into Petrel geocellular model for additional processing and visualization. The updated Petrel geomodel will be imported into CMG to conduct the dynamic model. The iteration of dynamic model to be used for the Class VI injection permit is based on both the geomechanical and physical properties that have been obtained from the characterization project, DE-FE0002056. The models will dictate 1) the area of review; 2) the location, size, and composition of the CO2 plume over time; 3) design the injection profile so that conformable sweep is obtained in multiple flow units, plume is observable in the observation well, but injection is designed to limit longer lateral migration; 4) the extent of the free phase CO2 both vertically and laterally as the plume interacts with the flow units baffles, barriers, and fracture systems; 5) the pressure field and the stresses imposed on the caprock to understand and avoid parting existing fractures or create new fractures. The dynamic model and its updated versions during injection will predict the degradation of the plume and its location so that the project can be brought to closure. An initial coupled geomechanical and flow model is currently being tested and refined, integration appropriate data that has been analyzed, but short of having a refined Petrel model that includes the latest seismic interpretation. Thus this model is isotropic with no compartments or larger scale fractures. The mature model will have included shallower caprock and seals to demonstrate that the CO2 injection will not affect the USDW.
Goals of modeling – To evaluate different injection scenarios for selection of optimal operation
procedures To understand a pressure response of Arbuckle reservoir as a result of
CO2 injection To project the reservoir injectivity and transmissibility properties To estimate a degree of CO2 solubility in the in-situ brine To correlate reservoir and cap-rock properties with existing data analyses
and other modeling results
Model Parameters -- 40,000 metric tons of CO2 injection into lower Arbuckle zone where
middle Arbuckle is considered as impermeable barrier Closed boundaries Dual porosity/permeability (Table 1, Figure 12)

19
3D “Layered Cake” (50x50x46 cells) model with homogeneous properties within each layer representing geologic formations:
• Chattanooga Shale (low porosity no perm) • Upper Arbuckle (high porosity and perm) • Lower Arbuckle (lower porosity and perm) • Arbuckle injection zone (high porosity and perm)
CO2 solubility in water is considered 3 cases of permeability estimations were considered (P10; P50; & P90)
(Table 1, Figure 12).
Table 1. Permeability applied in the dual-porosity model.
Figure 12. Model parameter permeability shown for stratigraphic divisions used in this initial coupled geomechanical-flow simulation.
Case Name Perm –Matrix,
Top Arbuckle,
md
Perm –Fractures,
Top Arbuckle,
md
Perm –Matrix,
Mid. Arbuckle,
md
Perm –Fractures,
Mid Arbuckle,
md
Perm –Matrix,
Inj. Arbuckle,
md
Perm –Fractures,
InjArbuckle,
md
Fracturespacing,
m
CO2Injected,
MT
High Permeability 1000 1500 1e-7 1e-7 600 1500 3 40
Mid. Permeability 500 1000 1e-7 1e-7 300 1000 3 40
LowPermeability 200 500 1e-7 1e-7 100 500 3 40
Injection zone
Tight Arbuckle
Top Arbuckle
Cap-Rock
Lower Mississippian
3600 ft Model Top
5200 ft Model Bottom
Por = 0.10 Frac. Por = 0.15 Perm = 200 Frac. Perm = 400
Por = 0.03 Frac. Por = 0 Perm = ~0 Frac. Perm = ~0
Por = 0.05 Frac. Por = 0.15 Perm = 200 Frac. Perm = 400
Por = 0.10 Frac. Por = 0.15 Perm = 200 Frac. Perm = 600
Por = 0.15 Frac. Por = 0.20 Perm = 250 Frac. Perm = 1000

20
Table 2. Geomechanical model parameters used in initial coupled simulation. Properties obtained from mechanical measurements to core from KGS #1-32.
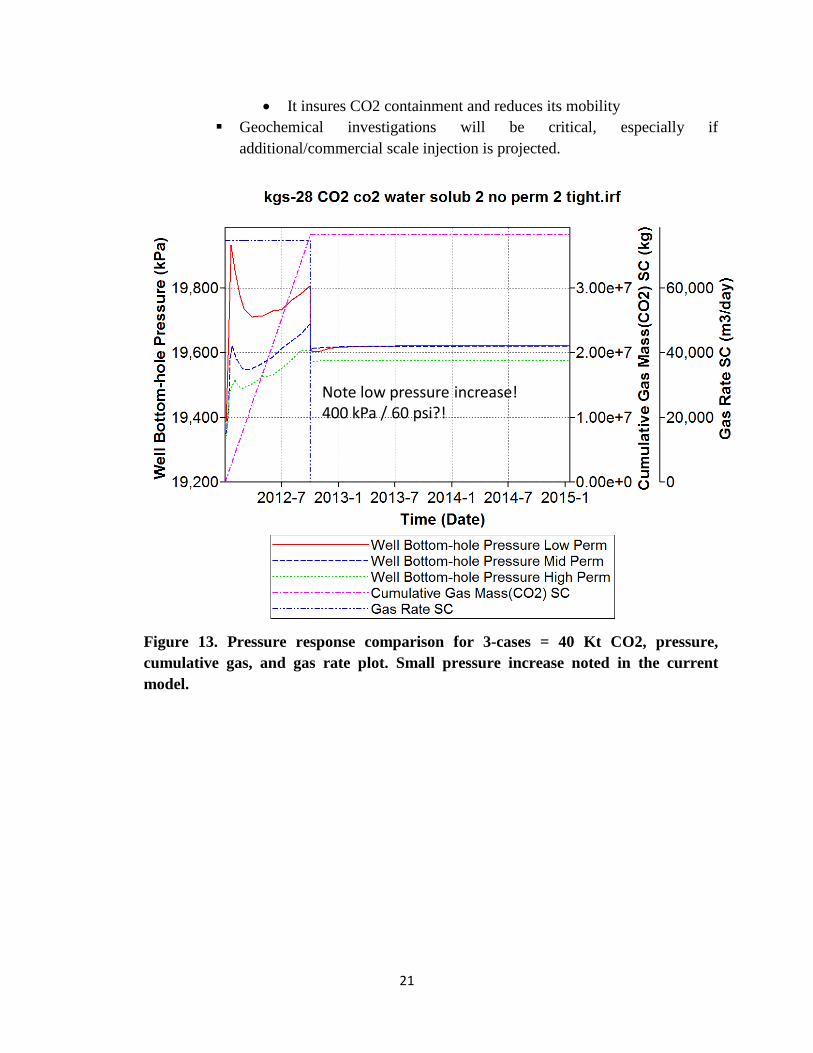
The modeled injection was also carried out using three injection scenarios. The modeled injection scenarios --
• 9 months, 70 kt CO2 injection o Projected amount of CO2 at projected rate
• 3 months, 100 kt CO2 injection o Rapid pressure increase to brake a cap-rock
• 1 months, 70 kt CO2 injection o Projected amount of CO2 in shorter time period, or “economically
safe” The results are very encouraging (Figures 13 and 14). The pressure exerted on the caprock is minimal and the plume undergoes degradation in the lower Arbuckle, as currently modeled. The pressure/stress regimen from the injected CO2 was not sufficient to compromise the cap-rock integrity in this modeling configuration. Additional configurations will be examined including fracture & fault scenarios once the new Petrel model is available.
Interim results – The pressure response to 40 kt CO2 injection is minimal for all three
estimated permeability cases (~400 kPa or ~60 psi max) even if closed boundaries model is utilized
It is suggested to investigate a higher injection rate and higher volume of injected CO2 scenarios
Additional attention and analysis are required for permeability estimations It is projected that most of the injected CO2 will be dissolved in water
Rock Type Poisson’s Ratio
Young’s Modulus *106,
kPa
Cohesion, kPa
Fracturespacing,
m
Rock Compressibility,
1/kPa
Cap-rock - Matrix 0.25 4.997 689285 3 5.8e-7
Cap-rock -Fractures 0.25 4.997 689285 3 5.8e-6
Arbuckle - Matrix 0.30 9.720 689285 3 5.8e-7
Arbuckle -Fractures 0.30 9.720 689285 3 5.8e-6
21
• It insures CO2 containment and reduces its mobility Geochemical investigations will be critical, especially if
additional/commercial scale injection is projected.
Figure 13. Pressure response comparison for 3-cases = 40 Kt CO2, pressure, cumulative gas, and gas rate plot. Small pressure increase noted in the current model.
Note low pressure increase!400 kPa / 60 psi?!

22
Figure 14. Nine month injection scenario – high permeability case – 40 kt CO2 with fracture flow. CO2 plume develops in the lower Arbuckle below and top of the plume is defined by the base of the tight mid Arbuckle. See model parameters in Figure 12.
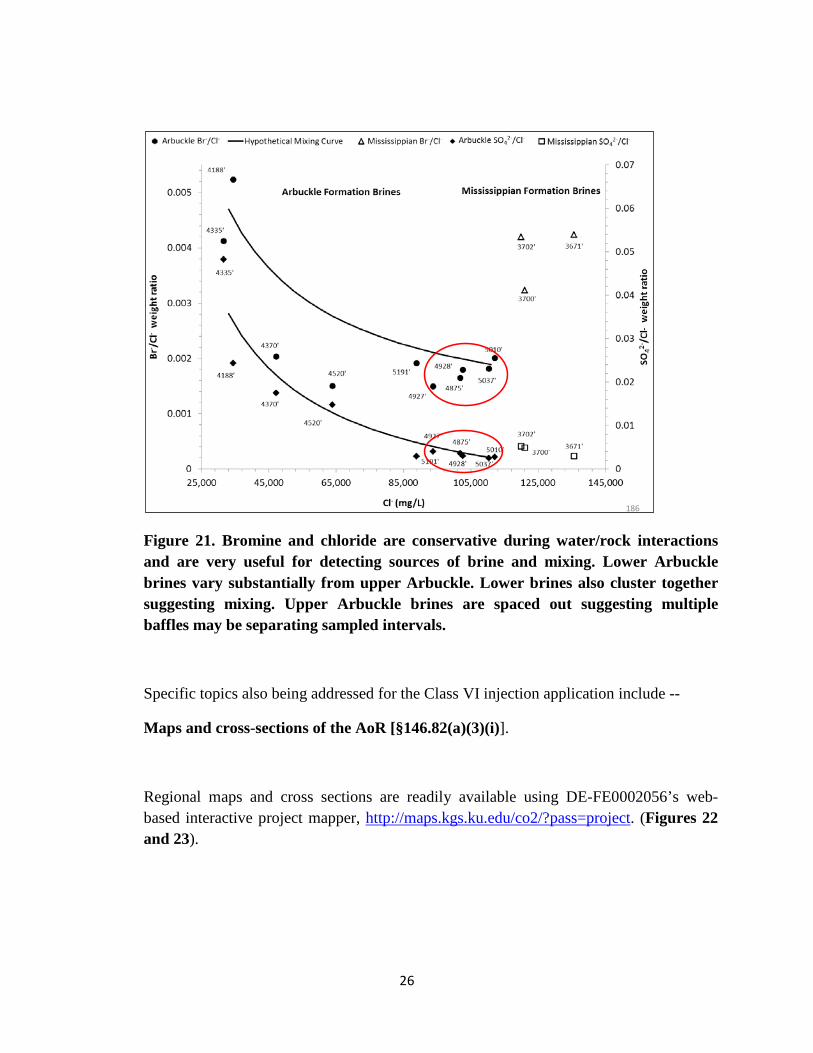
• USDW Regional and local review and characterization of the freshwater has been completed. It will be demonstrated in the Class VI application that considerable seals exists above the primary (lower Mississippian argillaceous dolosiltstone, Chattanooga Shale), and secondary caprock (Cherokee shale) by multiple thick shales and finally 200 ft thick evaporite near the surface below the USDW (Figures 15, 16, 17, 18, 19). Geochemical and isotopic studies of brines in the Arbuckle and Mississippian show no linkage to the USDW. Mississippian and Arbuckle brines also do not appear to be hydraulically connected in this area even though they are considered to be part of the same regional hydrogeologic aquifer system (Figures 20 and 21).
9 Months Injection Scenario – High Permeability Case – 40 kt CO2Fracture Flow

23
Figure 15. Stratigrahic colume showing the stratigraphic succession in KGS #1-32 highlighting the CO2 injection intervals (Mississippian and Arbuckle), overlying thick shales, near surface evaporites, and the land surface. USDW is very thin aluvium, coluvium, and Permian Ninnescah Shale.
Figure 16. Surficial geologic map of Sumner County showing wells and surface USDW deposits – alluvium, coluvium,and Permian shales (Ninnescah Shale).
USDW• Freshwater Aquifers• Groundwater Recharge• Potentiometric Surface• Lateral Seepage Velocity• Water Use • Major Water Users• Withdrawal Rates
Draft Underground Injection Control (UIC) Program Class VI Well Site Characterization Guidance for Owners and Operatorshttp://water.epa.gov/type/groundwater/uic/class6/upload/GS_Site_Char_Guidance_DRAFT_FINAL_031611.pdf
Land Surface
Permian Evaporites
(behind casing)
3600 ft
5200 ft
500 ft
600 ft
Multiple intervals of thick shale and interbedded Pennyslvanian and Permian carbonate strata
6
Arbuckle
Mississippian
Surficial Geology
Permian Shale
Alluvium – coarse sand
Colluvium – silt/clay
KGS 1-28
KGS 1-28

24
Figure 17. Cross sections through the shallow USDW deposits in Sumner County.
Figure 18. Groundwater wells in a three-mile radius around the CO2 small scale injection site.
Geologic Cross Sections
A A’
B B’
C C’
A
A’
B B’
C C’
Ninnescah Shale/Wellington Formation – shale/silty shale, small quantities of hard water
Thin Alluviual Deposits Moderate/large quantities of water
Groundwater Wells
• No major municipal supply within 3 miles of 1-28

25
Figure 19. Water level map of Sumner County and location of two wells drilled in DE-FE0002056.
Figure 20. The upper Arbuckle is isotopically depleted form other brines and meteoric water. Lower Arbuckle brines all cluster together suggesting a high rate of mixing. Values of upper brines differ substantially from those of the lower brines.
Water Levels (feet, amsl)
KGS 1-28
KGS 1-28
•Water levels in surficial aquifer ~ 1200 ft, amsl
• ~ 400 ft > Arbuckle ?
• Need to obtainstatic at 1-28/1-32
• AOR may be small
Seawater
4187.5'
4335'
4520'
4928'5010'
5036.5' 5191.5' 3702'
3700'
3671'
4370'
-4927'4875'
-70
-60
-50
-40
-30
-20
-10
0
10
20-10 -8 -6 -4 -2 0 2
δ2H
VSM
OW
(‰)
δ18O VSMOW (‰)
GMWL
SEAWATER
Arbuckle
Mississippian
GMWL
MWL δ2H
GMWLMWL δ18O
Results- Oxygen Isotopes
26
Figure 21. Bromine and chloride are conservative during water/rock interactions and are very useful for detecting sources of brine and mixing. Lower Arbuckle brines vary substantially from upper Arbuckle. Lower brines also cluster together suggesting mixing. Upper Arbuckle brines are spaced out suggesting multiple baffles may be separating sampled intervals.
Specific topics also being addressed for the Class VI injection application include --
Maps and cross-sections of the AoR [§146.82(a)(3)(i)].
Regional maps and cross sections are readily available using DE-FE0002056’s web-based interactive project mapper, http://maps.kgs.ku.edu/co2/?pass=project. (Figures 22 and 23).
186

27
Figure 22.
Top Mississippian Subsystem
KGS #1-32 KGS #1-28

28
Figure 23. (Previous page) Subregional cross section in the region of new well #1-32 and #1-28 datumed on top of the Arbuckle showing major subdivisions of the Arbuckle saline formation.
The location, orientation, and properties of known or suspected faults and fractures that may transect the confining zone(s) in the AoR [§146.82(a)(3)(ii)].
This topic continues to be reviewed with the new seismic processing and will be incorporated into Petrel as a discrete fracture network.
Data on the depth, areal extent, and thickness of the injection and confining zone(s) [§146.82(a)(3)(iii)]..
Maps and cross sections of the 1) Arbuckle injection interval – Gasconade to Gunter, 2) baffle/storage interval in upper Arbuckle, 3) Chattanooga Shale, and 4) lower Mississippian “Pierson” to base of Simpson Group will refined in new Petrel model using latest depth-migrated seismic data.
Information on lithology and facies changes [§146.82(a)(3)(iii)].
Lithology and facies work done to date are based on core, samples, and well logs. New seismic will be inverted and will be used to obtained refined 3D distribution of these rock properties in addition to porosity using Petrel geocellular modeling.
Information on the seismic history of the area, including the presence and depth of seismic sources [§146.82(a)(3)(v)].
Seismic occurrence map prepared by US Geological Survey will be used to convey historical earthquakes and to access risk of future earthquakes. Area has no record of earthquakes that have occurred near the site, nor are the risks for seismic activity elevated at the site.
Geologic and topographic maps and cross-sections illustrating regional geology, hydrogeology, and the geologic structure of the local area [§146.82(a)(3)(vi)].
This data is readily available. See Figure 16.
Maps and stratigraphic cross-sections indicating the general vertical and lateral limits of all USDWs, water wells, and springs within the AoR, their positions relative to the injection zone(s), and the direction of water movement (where known) [§146.82(a)(5)].

29
See Figures 17, 18, and 19. In additional, regional inventory of over 3700 drill stem tests from the Arbuckle have established a reliable static shut-in pressure that has been converted to equivalent freshwater head (Figure 24).
Baseline geochemical data on subsurface formations, including all USDWs in the area of review [§146.82(a)(6)].
This information has been identified and will be summarized in the Class VI application.
Figure 24. Arbuckle shut-in pressures are a reflection of the saline formation being hydraulically connected to the surface exposures of the unit in Missouri ~150 miles east of the injection site.
Regional Geology –
Regional geologic mapping is well underway in DE-FE0002056 for the Arbuckle based on stratigraphic tops correlated from hundreds of key wells. Reference wireline logs that penetrate deeply into the Arbuckle with good suites of wireline logs provide lithology, porosity, and eventually will be used to estimate permeability (Figure 25). The regional extent of the mapping extends over 25,000 mi2 includes regions of the Arbuckle in southern Kansas where CO2 would be in a supercritical state in the saline formation.
Arbuckle exposure at base of Missouri River, north-central Missouri –
Elevation 450 ft; surface exposures located ~200 mi northeast
Assume hydrostatic gradient = 0.435 psi/ft
Map of the difference between estimated hydraulic head at base of Arbuckle test interval and measured shut-in pressure
Arbuckle Saline Aquifer Connected to Outcrop
50 mi
Sorensen (2005)
Permian Hugoton Gas Field Western Kansas Original SIP = 435 psi
Sumner Co.
Wellington Field

30
The regional mapping is also being used to identify significant fracture and fault systems in relationship to degree of flexure and evaluation of any accompanying stratigraphic changes (Figure 26).
Figure 25. Regional mapping has been accomplished to provide regional context the Wellington small scale test injection and background needed for the Class VI CO2 injection application.
Wellington Field
http://maps.kgs.ku.edu/co2/?pass=project
Contours = Elevation on Top of ArbuckleZoom-in and obtain map of seismic time on top of Arbuckle at Wellington Field
Central Kansas Uplift
Nemaha UpliftSW Kansas
CO2 Inititiative

31
Figure 26. Three dimensional perspective of the top of the Arbuckle in south-central Kansas.
Subtask 1.10. Site Development, Operations, and Closure Plan
A site development plan has been delayed until next quarter to describe the details of the site development, operations, and site closure including:
• list of available infrastructure in and around Wellington Field related to small scale CO2 injection; • identify all major activities, roles of responsibility, and environmental health and safety issues that the Applicant will face during all stages of the project; • identify the necessary permits and respective agencies; • describe the information required for each permit; • schedule of when permit applications shall be submitted and anticipated approval dates. • A list of responsible persons for completion and negotiation of the permits shall be identified for each permit.
TASK 2. SITE CHARACTERIZATION OF ARBUCKLE SALINE AQUIFER SYSTEM - WELLINGTON FIELD
Information regarding site characterization has been conveyed above, built on studies being conducted in DOE contract DE-FE0002056.
32
Key Findings
(as described in accomplishments)
1. Completed NEPA, budget/contract reviews during the quarter. NEPA statements have been approved and budget/contract review nearly complete.
2. Significant progress made in compiling information and characterizing site for use in the application for Class VI CO2 injection permit in the Arbuckle.
3. Conducted area of review of wells and USDW. 4. Incorporated depth-migrated seismic into initial Petrel geocellular model, but obtaining
reprocessed seismic volume for use in revising the Petrel model for eventual use in simulation modeling for the Class VI permit application.
5. Completed geochemical and isotopic analyses of the brines samples in two wells previously drilled in DE-FE0002056. Results indicate that the Upper and Lower Arbuckle are hydraulically isolated by a mid Arbuckle barrier. This tight ~300 ft thick interval is also recognized on well logs, core, and 3D impedance mapping. While potentially reducing the injection interval to the ~300 ft thick lower Arbuckle, the mid Arbuckle will likely serve as an interval to “pancake” the CO2 plume into thin layers of higher porosity and higher permeability intervals mixed with tight rock. Multiple layers perhaps accesses by localized fractures will facilitate mixing of CO2 and brine, promote capillary entrapment of the CO2, and limit or eliminate free phase CO2 from accumulated beneath the primary caprock. The net effect could be to notably increase CO2 storage.
6. Initial geomechanical modeling of the caprock interval is very positive. The 120 ft-thick lower Mississippian-age dark argillaceous siltstones are tight and have relatively minor evidence of fracturing based on a fully cored, logged, and seismically imaged and analyzed interval.
7. Two preliminary coupled dynamic models of the small scale CO2 injection in the Arbuckle have been completed. Between solubility trapping and capillary effects the 40,000 tons will be likely be rapidly trapped in the lower Arbuckle where the CO2 is injected. Further analysis will continue. Pressures are such that CO2 escape from a worst case scenario of open wells in the AOR will likely not cause a leak of CO2 to the surface due to relatively low pressure beyond the injection well. However, more modeling is needed to firmly conclude this.
8. The geomechanical component in the simulation run under CMG software is based on a complete suite of mechanical tests from core analysis. Initial results indicate mechanical integrity in this rock system will not be compromised by the 40,000 ton injection into the lower Arbuckle over 9 month timeframe.
9. Reprocessing of the 3D seismic will be used to discretely map fractures and faults. Yet, current geomechanical modeling indicates that reactivation of these structures is unlikely. An updated geomodel from Petrel based on a new seismic volume will used as input into

33
final simulations including sensitivity analyses, as required by EPA for use in the Class VI application. These will be the results to confirm the Area of Review.
Plans
1. Top priority is to finalize and submit application for Class VI injection permit to EPA with updated geomodel and simulation of the Arbuckle saline formation so that field activities can begin.
2. Submit updated management plan, well drilling and installation plan, MVA plan, Public Outreach Plan based on material included in Class VI application.
6. Submit Mississippian Injection Permit Application (Class II injection well under Kansas primacy, regulated by Kansas Corporation Commission) using updated geomodel and simulation of the Mississippian oil reservoir.
7. Once permission granted for field deployment, install LiDAR, InSAR, CGPS, seismometers, groundwater monitoring wells above and below evaporite beds, drilling of Mississippian CO2 injection well, and construction of facility at Abengoa Biofuels ethanol plant to capture CO2.
PRODUCTS
Publications, conference papers, and presentations
Watney, W.L. et al., 2011, Small Scale Field Test Demonstrating CO2 sequestration in Arbuckle Saline Aquifer and by CO2-EOR at Wellington field, Sumner County, Kansas --Presentation to KCC-KDHE-EPA, Wichita
Barker, R., Watney, L., Bhattacharya, S., Strazisar, B., Kelly, L., Ford, S., Datta, S., 2011, Analytical description of the mineralogy and geochemistry of the Arbuckle deep saline aquifer in south central Kansas and implications for CO2 sequestration, T125. Assessing Potential Impacts of Geological Carbon Sequestration on Groundwater Quality: Geochemical and Hydrological Approaches, Annual GSA, Minneapolis.
Barker, R., Watney, L., Bhattacharyya, S., Strazisar, B., Kelly, L., Ford, S., Datta, S., 2011, Geochemical and mineralogical characterization of the Arbuckle aquifer with laboratory flow cell experiments under supercritical conditions: Implications for CO2 sequestration: AGU, GC30: Carbon Sequestration 3. Mineral Carbonation Under Low Temperature Conditions, San Francisco.

34
W. Lynn Watney, Jason Rush, 2011, GC44A-02. Modeling CO2 Sequestration in Saline Aquifer and Depleted Oil Reservoirs to Evaluate Regional CO2 Sequestration Potential of Ozark Plateau Aquifer System, South-Central Kansas, AUG Fall Meeting, San Francisco.
Watney, W.L., 2012, Business Implications of A Class VI Permit – The Long View? -- A Kansas Perspective, PUTTING THE BUSINESS ELEMENTS TOGETHER FOR CO2 EOR USING CAPTURED CARBON, April 4-5, 2012 - Golden, Colorado, sponsored by Permian Basin CCUS Center and Colorado PTTC.
Scheffer, A.A., Gulliver, D., Roberts, J.A., Fowle, D., Watney, W.L., Doveton, J., Stotler, R., Whittemore, D., ms. in review, Geochemical, Microbiological, and Permeability Characteristics Indicating Vertical Zonation of the Arbuckle Saline Aquifer, a potential CO2 storage reservoir.
PARTICIPANTS & OTHER COLLABORATING ORGANIZATIONS:
A project organization chart follows. The work authorized in this budget period include office tasks related to preparation of reports and application for a Class VI permit to inject CO2 into the Arbuckle saline aquifer. Tasks associated with reservoir characterization and modeling are funded in contract DE-FE0002056.
ORGANIZATION CHART
Kansas Geological Survey Name Project Job Title Primary Responsibility Lynn Watney Project Leader, Joint Principal Investigator Geology, information synthesis, point of contactSaibal Bhattacharya Joint Principal Investigator Reservoir engineer, dynamic modeling, synthesisJason Rush Joint Principal Investigator Geology, static modeling, data integration, synthesisJohn Doveton Co-Principal Investigator Log petrophysics, geostatisticsDave Newell Co-Principal Investigator Fluid geochemistryRick Miller Geophysicist 2D seismic aquire & interpretation
LiDAR support, water well drilling/completionTBN Geology Technician Assemble and analyze data, report writingTBN Engineering Technician Assemble and analyze data, report writing
KU Department of GeologyMichael Taylor Co-Principal Investigator Structural Geology, analysis of InSAR and LiDARTBN Graduate Research Assistant Structural Geology, analysis of InSAR and LiDAR
Kansas State UnversitySaugata Datta Principal Investigator Aqueous and gas geochemistryTBN Graduate Research Assistant Aqueous and gas geochemistryTBN 3- Undergraduate Research Assistants Aqueous and gas geochemistry
Lawrence Berkeley National LaboratoryTom Daley Co-Principal Investigator Geophysicist, analysis of crosshole and CASSM dataJennifer Lewicki Co-Principal Investigator Hydrogeology, analysis of soil gas measuremntsBarry Freifeld Co-Principal Investigator Mechanical Engineer, analysis of U-Tube sampler
Sandia Technologies, HoustonDan Collins Geologist Manage CASSM and U-Tube operation David Freeman Field Engineer Manage field install of CASSM and U-Tube
Berexco, LLCDana Wreath VP Berexco Engineering, Manager of Wellington FieldRandy Kouedele Reservoir engineer EngineringStaff of Wellington Field field operationsBeredco Drilling team Mississippian and Arbuckle drilling operations
Abengoa Bioenergy Corp. - Colwich, KSChristopher Standlee Exec. VP Manager, ethanol supply
Tiraz Birdie Consulting Engineer
Christopher Standlee, Danny Alllison
Aqueous geochemistryAqueous geochemistry
CO2 supply – Colwich Ethanol Facility

35
IMPACT
The project has been discussed in public venues – presentations at professional meetings, legislative committees, and town hall meeting, and has provided information on the project via the website to encourage a dialog on the merits and economies related to carbon management in Kansas. Kansans are realizing the potential for an important collaboration between the two of the largest economies in Kansas – agriculture and related ethanol industry and the petroleum industry to advance energy and contribute to a viable rural economy.
The small scale field test at Wellington Field as designed integrates two petroleum business activities: 1) use of CO2 for enhanced oil recovery and revitalizing many older mature oil fields and 2) disposal/storage of CO2 in the underlying saline aquifer for the longer term. It has been conveyed to the local petroleum industry that drilling and oil production infrastructure of an active oil field are important components that could lead to a successful carbon sequestration project including 1) knowledge about the subsurface including injection zones and caprock, 2) knowledge about abandoned wells, 3) access and suitability of land with greater likelihood for participation by landowner, and 4) access to insurance and investors to facilitate economic success.
CHANGES/PROBLEMS
The delays in activities prerequisite to completing the application for a Class VI injection permit have slowed progress. Yet, review of other applications for Class VI injection and getting reports from those who have applied for Class VI and failed to date have strongly influenced our approach to completing the Class VI permit application. We have a considerable amount of new data from DE-FE0002056 that factoring into a very strong application that we intend to submit at the end of September. Essentially, all of the key requirements of the permitting requested by EPA have been addressed.
BUDGETARY INFORMATION
Cost Status Report
See next page for the cost status for quarters 1-3.

36
COST PLAN/STATUSBP1 Starts: 10/1/11 Ends: 9/30/1210/1/11-12/31/11 1/1/12-3/31/12 4/1/12-6/30/12
Baseline Reporting Quarter Q1 Q2 Q3Baseline Cost Plan (from 424A,
(from SF-424A) Sec. D)
Federal Share $1,589,619.25 $1,589,619.25 $1,589,619.25
Non-Federal Share $365,421.00 $365,421.00 $365,421.00
Total Planned (Federal and $1,955,040.25 $1,955,040.25 $1,955,040.25Non-Federal)
Cumulative Baseline Cost $1,955,040.25 $3,910,080.50 $5,865,120.75
Actual Incurred Costs
Federal Share $326.84 $17,208.52 $17,282.92
Non-Federal Share $0.00 $6,475.85 $43,028.94
Total Incurred Costs-Quarterly $326.84 $17,208.52 $60,311.86(Federal and Non-Federal)
Cumulative Incurred Costs $326.84 $17,535.36 $77,847.22
Variance
Federal Share $1,589,292.41 $1,572,410.73 $1,572,336.33
Non-Federal Share $365,421.00 $358,945.15 $322,392.06
Total Variance-Quarterly $1,954,713.41 $1,931,355.88 $1,894,728.39Federal and Non-Federal)
Cumulative Variance $1,954,713.41 $3,886,069.29 $5,780,797.68