documenting for care: evaluating an emr …€¦ · · 2011-02-21documenting for care: evaluating...
TRANSCRIPT
DOCUMENTING FOR CARE:EVALUATING AN EMR FOR PRIMARY CARE
PROVIDERS
Christopher L. Schaefbauer
Submitted to the faculty of the Department of Computer Sciencein partial fulfillment of the requirements
for the degreeBachelor of Science
University of ColoradoDecember 2010

Accepted by the Faculty, University of Colorado at Boulder, in partial fulfillment of therequirements for the degree of Bachelor of Science.
Katie A. Siek, Ph.D.
Leysia Palen, Ph.D.
Kenneth Anderson, Ph.D.
December 2010
ii

Acknowledgements
I thank the Wardenburg health center for hosting our research study. The support of
the administrative and clinical staff helped me complete all the work for this project. I
especially would like to thank Edna Kinzley and Barbara Brandt for their committment to
this project and amazing insights.
I cannot thank my advisor, Katie Siek, enough for her support throughout this project.
She provided me a rare opportunity to play a leading role in this research project as an
undergraduate with little previous experience. Her trust in my abilities has been the most
valuable asset to my success.
I thank my thesis committee: Leysia Palen for her insights into the world of Human
Computer Interaction outside health informatics; and Kenneth Anderson for introducing
me to software design and architecture which kept me interested in computer science when
I began to question my interest in the major.
Research from this thesis has been supported by the National Science Foundation
under Grant No. 0846024.
iii

Abstract
Healthcare providers generate a large volume of patient documentation. Healthcare
facilities adopt EMRs as one strategy to store and manage the data generated by providers,
however these systems do not allow for easy information input or extraction. We
conducted a cognitive walkthrough study to understand the user interface and interactions
with the EMR system. Our qualitative observational study of 10 providers, which collected
52 hours of data, found that providers do not always interact with meaningful patient
information. Follow-up interviews with 7 of those providers verified our findings from
the observational studies.
We analyzed our data and report different places, processes, tools and motivations
for creating documentation of patient encounters. Providers either document in the exam
room or in their pod office space. Providers either document a patient encounter during
one sitting or iterate on the note over several sessions. The various ways providers
document have different strengths and weaknesses, but a single theme persists - providers
attempt to document to improve the care of the patient, but often struggle because their
duties require them to document for billing.
From this understanding we present a reconceived model of the EMR that better
supports patient information input and retrieval. This model would center around linking
patient information, then presenting that information to the provider. The goal for
information presentation would be delivering only the information they need, when they
need it. In addition to presenting a long-term design goal, we also recommend short-term
solutions to improve EMR usage and provider workflows. In the short term, additional
staff should be utilized to offload administrative tasks for providers and paper documents
designed for patient care should be scanned into the EMR.
iv

Contents
List of Figures vii
Chapter 1. Introduction 1
1. Introduction 1
Chapter 2. Background 4
1. Project Background 4
2. Study Site Overview 5
3. Participants 6
4. The Electronic Medical Record system 7
5. Summary 8
Chapter 3. EMR Evaluation and Design 10
1. EMR Design and Evaluation 10
Chapter 4. Observational Studies of EMR Usage 13
1. Workflow Studies of EMR Implementations 13
Chapter 5. Methods 15
1. Data Collection 15
2. Data Analysis 17
Chapter 6. Design for Use :
The Cognitive Walkthrough Study 19
v
1. Information Input 19
2. Information Output 23
3. Summary 25
Chapter 7. Design for Administration :
The Shadowing Study 26
1. Where Providers Document Patient Encounters 28
2. How Providers Document Patient Encounters 33
3. What Tools Are Used to Document Patient Information 39
4. Summary 44
Chapter 8. Design for Care :
Discussion and Recommendations 46
1. Managing Flowsheets 48
2. Managing Administrative Information 49
Chapter 9. Conclusion 51
1. Cognitive Walkthrough Study 51
2. Shadowing Study 52
3. Recommendations 53
Appendix A. Acronyms 55
Appendix B. Cognitive Walkthrough Raw Results 56
Appendix. Bibliography 69
vi

List of Figures
1 An image of the layout at this primary care clinic. The colored rooms without
labels are exam rooms that are managed by the pod of the same color. 5
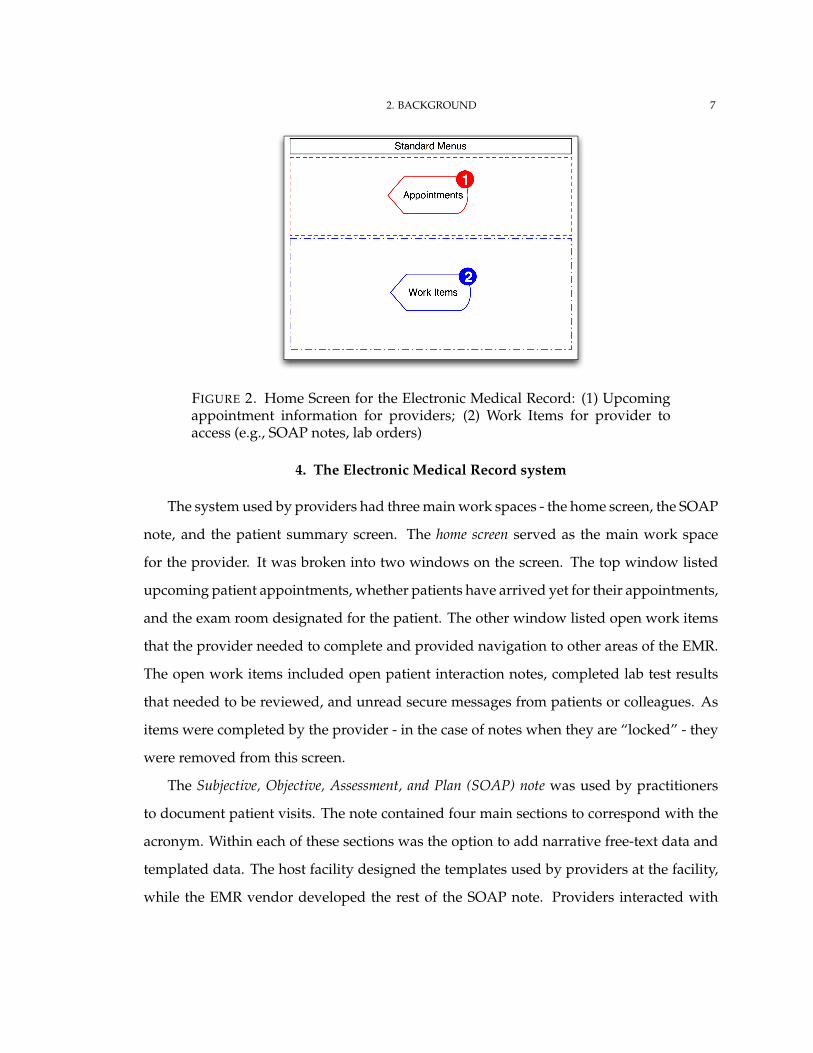
2 Home Screen for the Electronic Medical Record: (1) Upcoming appointment
information for providers; (2) Work Items for provider to access (e.g., SOAP notes,
lab orders) 7
3 SOAP Note screen for the Electronic Medical Record: (1) interface frames available
on Patient Summary and SOAP Notes; (2) SOAP Note work area 8
1 Patient Encounter Documentation Process. The numbers on each line represent
the number of providers who documented in the particular way. 27
vii

1Introduction
1. Introduction
Electronic Medical Records (EMRs) have the potential to revolutionize patient care.
They can provide an interoperable repository to capture a lifetime of patients’ health
stories and link relevant health metrics to personal health information leading to improved
patient care. In addition, administrators would be able to acquire information about care
to inform policy and charging for services without unduly burdening care providers.
Unfortunately, the current reality of EMRs does not support these ideal interactions.
Initiatives to create interoperable EMRs through Regional Health Information Organizations
and Health Information Exchanges have been largely unsuccessful at enabling sharing
between the silo data repositories of different health facilities [10, 13, 28]. Small health
1
1. INTRODUCTION 2
clinics suffer the most because they do not have the resources or expertise to select and
deploy a suitable EMR system. The EMR systems that they choose will most likely be
directly linked with administrative processes in an attempt to streamline their billing.
Providers are forced to bounce between their goal of documenting for care and their
requirement to document for billing, sometimes failing to meet the requirements of both.
Researchers have explored what tools providers use to document for care - from
transitional objects [7] to provider-driven interface personalization[30]. In addition, work
has been done to identify the needs of patients during provider encounters [27] and how
this personal health and psychosocial information should be captured [34]. This research
informed the design of EMR user interfaces by identifying some patient and provider
information needs. These studies did not, however account for the broader interactions
providers have with the system to support documenting for care.
In this thesis, we studies the providers’ EMR documentation workflows. We collaborated
with a small clinic at a large, public university to evaluate their EMR system usage.
We shadowed 10 providers for 52 hours interacting with 15 patients. We confirmed
observations and discussed problems we observed of the providers we shadowed during
semi-structured interviews.
The study found providers documented patient encounters in different places, using
different processes, and interacting with different EMR interfaces. A portion of providers
documented their patient encounters in the exam room while the rest completed the
documentation in the shared pod office space. The providers were also divided into
an iterative note creation process as opposed to completing documentation for a patient
encounter in one sitting. But all of the providers had problem-some interactions with the
documentation form and the patient summary information screens.
This thesis helps clinical informatics researchers and practitioners understand provider
workflows and EMR system needs. Based on these needs We present a new model for EMR
design based on our understanding of the provider-system interactions.
In Chapter 2, we will present a background of the research project including an
overview of the research site and the EMR system deployed. In Chapters 3 and 4, we

1. INTRODUCTION 3
review related work in the areas of EMR design and medical practice workflow studies. I
explain the methods used for the study in Chapter 5, followed by the findings of the study
in Chapters 6 and 7. Finally I discuss the implications of my findings and provide design
recommendations in Chapters 8 and 9.

2Background
1. Project Background
Administrative staff from the Wardenburg Health Center at the University of Colorado,
Boulder approached our team about decreased patient throughput after the implementation
of an EMR system. They deployed the system for a year before meeting with our team to
discuss system problems. The main goal of our work was to understand the utilization
of the EMR system by the clinical staff, find the reasons for diminished performance, and
suggest improvements. For my thesis, I focused on how the providers in the medical clinic
of Wardenburg used the EMR system to provide primary care.
4

2. BACKGROUND 5
Pod 1 Pod 2
Pod 3
Shared Triage/Nurses Space
FIGURE 1. An image of the layout at this primary care clinic. The coloredrooms without labels are exam rooms that are managed by the pod of thesame color.
2. Study Site Overview
The Wardenburg health center at the University of Colorado, Boulder hosted our
research study. This health facility served a campus with an undergraduate population of
over 27,000. The primary consumers of health services were students, both graduate and
undergraduate, typically ranging from age 18-24 years, but non-traditional students made
up part of the patient body. The on-site services included a primary care medical clinic,
sports medicine, psychological health and psychiatry, women’s health clinic, pharmacy,
X-ray, and laboratory. All the services utilized a single EMR system and operated under
the same administration.
This study covered only on the primary care service operated by 15 providers and
additional support staff. Providers were assigned to one of the three pod spaces that
served as shared office spaces. Each pod had a laser printer, secure prescription printer,
white board for managing exam rooms for that pod, shared computer stations for medical
assistants, and assigned computer workspaces for each provider. As seen in Figure 1, each
pod was assigned a set of the exam rooms to see their patients. Staff within each pod
coordinated exam room utilization by verbal communication and white board usage.
Each exam room contained a computer workstation in addition to standard medical
equipment and supplies. These computer workstations provided full access to the EMR
2. BACKGROUND 6
system, but operated noticeably slower than pod space computers. Providers logged into
these systems by typing their username and password.
In the center of the medical clinic was a shared triage space and nurses station. Nurses
examined walk-in patients in this area prior to placing them in an exam room to see a
doctor. They also admitted travel clinic patients and immunized patients within this area.
The space includes two shared computer workstations to provide nurses the ability to
document patient encounters prior to seeing the doctor. This supports continuity of care
for admitted patients.
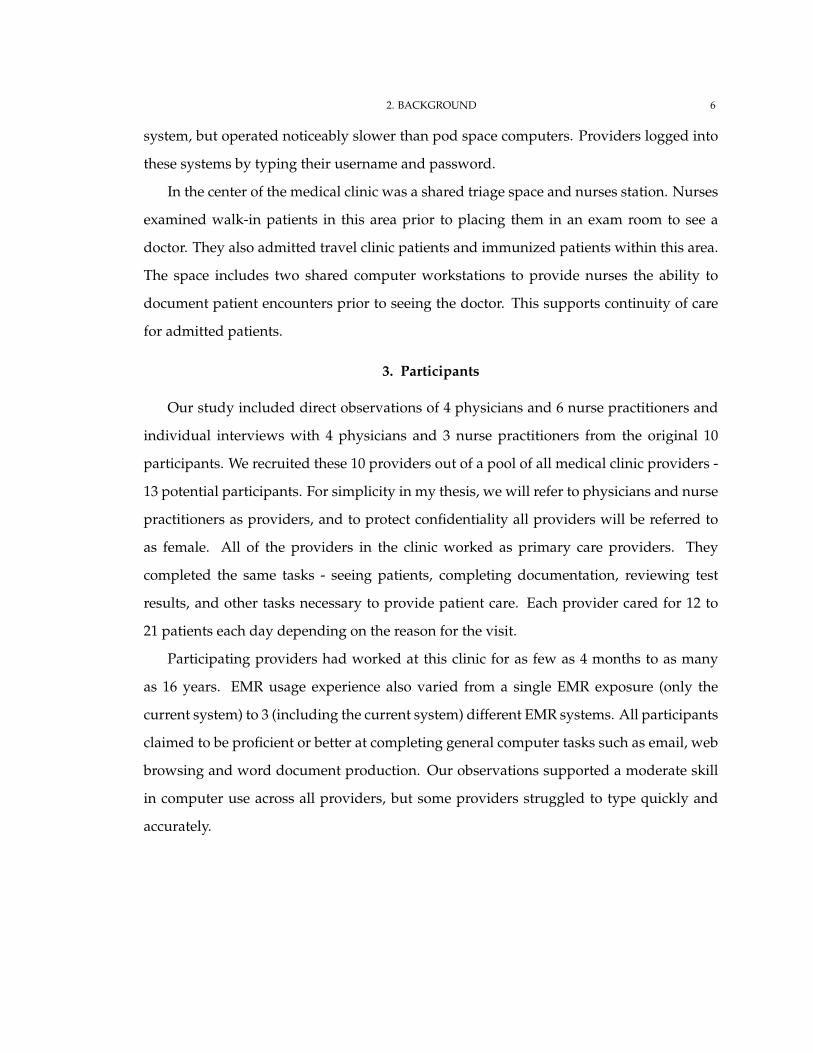
3. Participants
Our study included direct observations of 4 physicians and 6 nurse practitioners and
individual interviews with 4 physicians and 3 nurse practitioners from the original 10
participants. We recruited these 10 providers out of a pool of all medical clinic providers -
13 potential participants. For simplicity in my thesis, we will refer to physicians and nurse
practitioners as providers, and to protect confidentiality all providers will be referred to
as female. All of the providers in the clinic worked as primary care providers. They
completed the same tasks - seeing patients, completing documentation, reviewing test
results, and other tasks necessary to provide patient care. Each provider cared for 12 to
21 patients each day depending on the reason for the visit.
Participating providers had worked at this clinic for as few as 4 months to as many
as 16 years. EMR usage experience also varied from a single EMR exposure (only the
current system) to 3 (including the current system) different EMR systems. All participants
claimed to be proficient or better at completing general computer tasks such as email, web
browsing and word document production. Our observations supported a moderate skill
in computer use across all providers, but some providers struggled to type quickly and
accurately.
2. BACKGROUND 7
FIGURE 2. Home Screen for the Electronic Medical Record: (1) Upcomingappointment information for providers; (2) Work Items for provider toaccess (e.g., SOAP notes, lab orders)
4. The Electronic Medical Record system
The system used by providers had three main work spaces - the home screen, the SOAP
note, and the patient summary screen. The home screen served as the main work space
for the provider. It was broken into two windows on the screen. The top window listed
upcoming patient appointments, whether patients have arrived yet for their appointments,
and the exam room designated for the patient. The other window listed open work items
that the provider needed to complete and provided navigation to other areas of the EMR.
The open work items included open patient interaction notes, completed lab test results
that needed to be reviewed, and unread secure messages from patients or colleagues. As
items were completed by the provider - in the case of notes when they are “locked” - they
were removed from this screen.
The Subjective, Objective, Assessment, and Plan (SOAP) note was used by practitioners
to document patient visits. The note contained four main sections to correspond with the
acronym. Within each of these sections was the option to add narrative free-text data and
templated data. The host facility designed the templates used by providers at the facility,
while the EMR vendor developed the rest of the SOAP note. Providers interacted with

2. BACKGROUND 8
FIGURE 3. SOAP Note screen for the Electronic Medical Record: (1)interface frames available on Patient Summary and SOAP Notes; (2) SOAPNote work area
a single screen to complete the SOAP note - only seeing additional screens when adding
templates or orders. This meant that providers scrolled down the long SOAP note screen
to reach all of the sections. After working on a SOAP note, providers had the option to
save a draft of the note or lock the note. If a note was “locked,” it was immutable and sent
to administration for billing purposes.
The patient summary screen showed providers relevant information regarding each
patient. The main page of the patient summary screen listed pertinent history, allergies,
medications, discontinued medications, family history, diagnosis history, learning barriers,
and immunizations for the selected patient. Providers accessed notes from past visits to
this facility, lab results, and xray history for a specific patient by clicking on a navigation
bar.
5. Summary
The Wardenburg health center contacted us to evaluate their EMR after they noticed
decreased patient throughput. With their assistance we studied over 3/4 of the healthcare
providers’ workflows and EMR interactions. This involved 52 hours of shadowing, 7

2. BACKGROUND 9
individual interviews, and a focus group. We also studied the EMR system using a
cogntivie walkthrough methodology to identify usability concerns.
3EMR Evaluation and Design
1. EMR Design and Evaluation
1.1. Implementation. Interoperation and implementation of EMR systems continues
to be a focus of research and development time. Unlike security, research in this area
can, and has, directly improve patient care. Researchers have explored strategies for
interoperation since the early 1990’s [10]. There have been many proposals to solve
the problem, and new models continue to develop. Though the ability for EMRs to
interoperate has improved significantly, policy development and the fragmentation in the
EMR market remain the biggest barriers. Because of the value of interoperability [28],
developers have spent time building interfaces to other systems to increase the value of
their offerings [13]. Often health facilities are forced to develop and maintain custom
10

3. EMR EVALUATION AND DESIGN 11
interfaces to connect their different systems. This turns into an n-squared problem for
building these interfaces, as n, the number of systems a facility uses, increases, the more
time and money the facility must spend.
Software architecture and design is also an active area of research for EMR systems.
Jakob Bardram developed a software architecture for EMR systems around the activity
based computing concept [4]. In this model, ”computational activity” represent real-world
actions of providers. Actions are taken on these activities and their states. This represents
a clear case where the software model must be considered when design the user interface
for the system. In this case, the UI design approach would vary significantly from the
approach taken with a personnel object centered EMR model [17, 24].
If facilities adopt systems that interoperate with a large array of facilities, usability
designers may have a concern about displaying information from the local facility separate
than information from outside facilities. If patients are the main object of interaction
within a system, the usability designer may choose to deploy controls for interacting
and displaying information for each object in one place. They may group all results
and history for each patient on their screen. Or they may choose to group all the labs
together regardless of the patient. They may choose both display methods. Regardless,
there is significant consideration that must be given to interoperability and software design
choices that directly impact usability research.
1.2. Usability in EMR Systems. Sources have cited usability problems as being
a major barrier to EMR adoption among physicians [6, 12, 33]. Chief among these
are problems with information presentation, excessive UI customizations, complex or
excessive user interface interactions, and data entry problems [5, 16].
Studies have been conducted to try and find better solutions for organizing and
presenting patient information [19, 30]. Previous research on the importance of information
presentation in EMR systems, and the lack of research on the topic directly in primary care
medicine motivated our team to focus on information presentation as one of the themes
for our study. Because of the distinct differences in primary care workflow and treatment

3. EMR EVALUATION AND DESIGN 12
focus [18], it is possible that the information demands are different for this population of
clinicians.
Commercial EMR systems have struggled with balancing the presentation of information
to be meaningful for providers. Systems overwhelm practitioners with excessive data
presented in a non-meaningful way [25, 31, 32]. Several studies have proposed different
methods of presenting data to providers [9, 32], yet EMR implementations have not
deployed solutions to information overload problems. These studies focused primarily on
the information retrieval process, not the information input process. Alternatively studies
have looked at the way that providers enter information into EMR systems [26]. They have
looked at different approaches for practitioners to document information into the EMR [3].
Speech recognition software represents a possible solution to the time consumption of free-
text input [2]. However this technology is immature and performs inconsistently in most
clinical use [8]. Our study builds on these previous works, simultaneously looking at both
the information input and output from EMR systems.

4Observational Studies of EMR Usage
1. Workflow Studies of EMR Implementations
In order to design usable systems and effective user interfaces, researchers have
realized the importance of understanding the target users [11] and their workflows [30].
There is a history of significant workflow study of hospital work and EMR usage [15, 27].
The complexities of hospital work, and the high cost of care in these facilities make it a
priority for developing ideal EMR solutions. Recently, Chen [7] and other researchers [34]
studied workflows of hospital staff in different facilities.
Chen discovered the usage of transitional objects, both permanent and temporary,
at a hospital emergency department. Our research identified similar behaviors but in a
primary care setting. The different ”transitional artifacts” [7] served to bridge the gap
13

4. OBSERVATIONAL STUDIES OF EMR USAGE 14
between patient visit and computer documentation, as well as to workaround limitations
within the system itself. Our study builds on that research identifying different transitional
artifacts within a primary care facility, clarifying their role in the bigger picture of the
clinical workflow, and the illuminating the process of translation into the EMR system.
Workflow studies conducted in primary care settings have not focused on the provider-
computer interaction [14, 18, 21]. Alternatively Walsh mixed his personal experiences with
a literature review to discuss the impact of the computer on the provider documentation
process [29]. Our study looks at the same topic as that paper, narrative documentation in
the EMR, and we expand on his work by completing an observational study of the topic.

5Methods
1. Data Collection
We used a mixed methods approach to collect data for this study. Initially, we
collaborated with the Systems Training Coordinator at Wardenburg to identify tasks and
conduct a cognitive walkthrough to better understand the system and identify potential
usability issues. After we completed the initial cognitive walkthrough, we shadowed
providers in the primary care unit while they met with patients. Based on these
observations, we continued the cognitive walkthrough study to evaluate the system with
how providers use the system in practice. The final part of the data collection included
interviews where we could discuss and confirm what we observed and usability problems
we identified.
15
5. METHODS 16
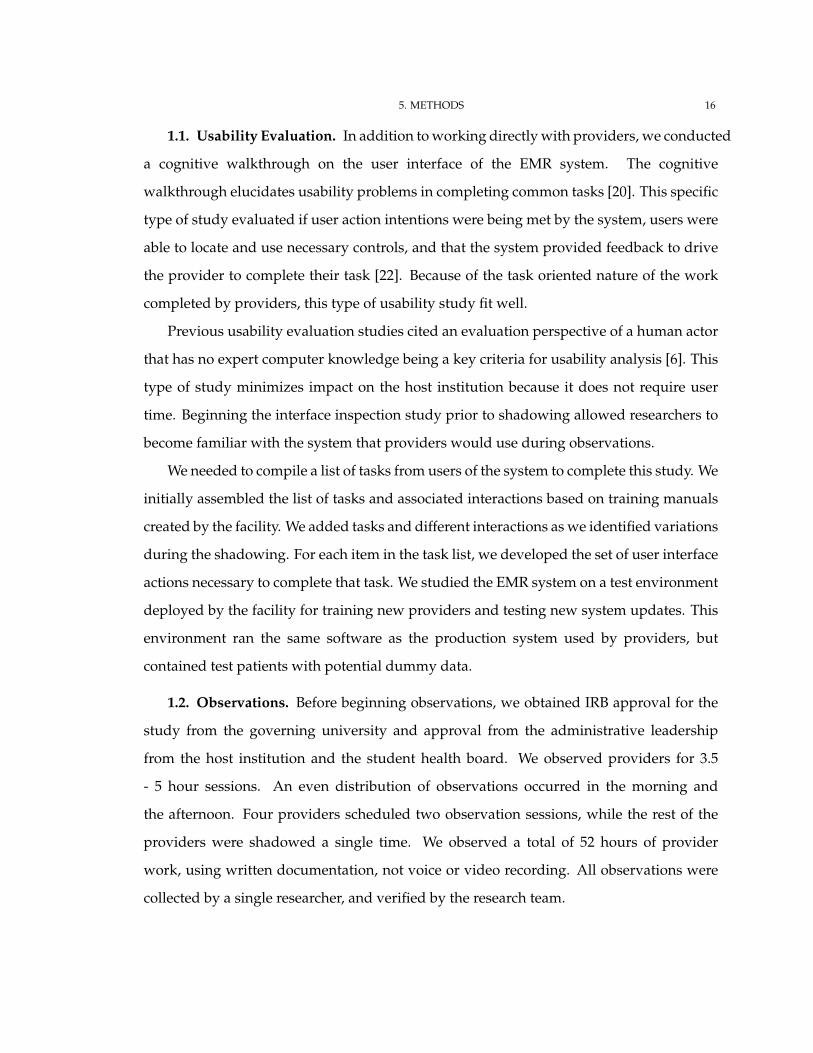
1.1. Usability Evaluation. In addition to working directly with providers, we conducted
a cognitive walkthrough on the user interface of the EMR system. The cognitive
walkthrough elucidates usability problems in completing common tasks [20]. This specific
type of study evaluated if user action intentions were being met by the system, users were
able to locate and use necessary controls, and that the system provided feedback to drive
the provider to complete their task [22]. Because of the task oriented nature of the work
completed by providers, this type of usability study fit well.
Previous usability evaluation studies cited an evaluation perspective of a human actor
that has no expert computer knowledge being a key criteria for usability analysis [6]. This
type of study minimizes impact on the host institution because it does not require user
time. Beginning the interface inspection study prior to shadowing allowed researchers to
become familiar with the system that providers would use during observations.
We needed to compile a list of tasks from users of the system to complete this study. We
initially assembled the list of tasks and associated interactions based on training manuals
created by the facility. We added tasks and different interactions as we identified variations
during the shadowing. For each item in the task list, we developed the set of user interface
actions necessary to complete that task. We studied the EMR system on a test environment
deployed by the facility for training new providers and testing new system updates. This
environment ran the same software as the production system used by providers, but
contained test patients with potential dummy data.
1.2. Observations. Before beginning observations, we obtained IRB approval for the
study from the governing university and approval from the administrative leadership
from the host institution and the student health board. We observed providers for 3.5
- 5 hour sessions. An even distribution of observations occurred in the morning and
the afternoon. Four providers scheduled two observation sessions, while the rest of the
providers were shadowed a single time. We observed a total of 52 hours of provider
work, using written documentation, not voice or video recording. All observations were
collected by a single researcher, and verified by the research team.

5. METHODS 17
The majority of observations were made in the pod space and the movement between
the different on-site services. We observed the order in which the providers completed
work tasks, and how those tasks related to the overall process of patient care. Our
observations were able to capture screens and screen patterns used by providers in their
work. This helped to better understand the interactions of providers with the system. We
also documented observations of colleague interaction, phone communications, and paper
artifact usage.
We observed 15 patient visits in the exam room to better understand the role of the
computer system in the patient-provider interaction. Patients signed informed consent
forms after researchers fully explained the study. Because our study focused on the
computer interaction, we did not document any information regarding the patient. Instead
we documented what EMR tasks, if any, the providers completed in the exam room and
whether that usage hindered patient-provider communication.
1.3. Interviews. After completing the shadowing events, 4 physicians and 3 nurse
practitioners participated in semi-structured interviews. These events lasted between
22 and 55 minutes. We asked a small set of identical questions to all providers and
questions specific to each provider about events we observed during shadowing. A total of
eight interviews were conducted, with one provider being interviewed twice because she
wanted to provide additional information. Five of the interviews were audio recorded,
while the other three were only documented by writing due to scheduling constraints.
The audio recorded interviews were transcribed for analysis.
2. Data Analysis
We used elements from Grounded Theory to analyze our data. Our observation
notes and interview transcriptions were open coded using the TAMS Analyzer Qualitative
Research Tool [1]. Our analysis was informed by the constant comparative method
where we iteratively analyzed the data individually (analyst triangulation) for thematic
content. We met as a team to discuss and debate codings until consensus was reached.
Once the data was coded, we confirmed observed behavioral commonalities with coding

5. METHODS 18
frequencies. We used co-frequency analysis to further refine a set of findings from our
data.
In addition to studying the codes of the data, we reviewed the specific quotes and
observations surrounded by recurrent codes. We had cases where the whole picture of
provider behavior was not captured in the information we coded. In these cases, we gained
a “bigger picture” of the workflow by looking outside the quotes. These details became
cases in support of our findings.

6Design for Use :
The Cognitive Walkthrough Study
The cognitive walkthrough revealed usability problems with input and output of information.
In this section we report the findings of our cognitive walkthrough with respect to the most
problematic interfaces. The findings are broken into a section looking at problems with
information input and a section focused on the problems with information extraction. The
complete findings of the cognitive walkthrough can be found in Appendix B.
1. Information Input
1.1. SOAP Note. Providers spent the most time working with the SOAP note interface.
This interface was built to capture all patient information from a visit, however it was
19
6. DESIGN FOR USE : THE COGNITIVE WALKTHROUGH STUDY 20
tedious and time consuming. The SOAP note interface was a single window that providers
scrolled through to get to each section. In the various windows on this screen there were
additional scroll bars. This created a series of nested scroll bars within the main SOAP
note. Each section allowed providers to enter patient information using free-text narrative
and placing templated responses. The following are different sections of the SOAP note
which had problematic usability interaction.
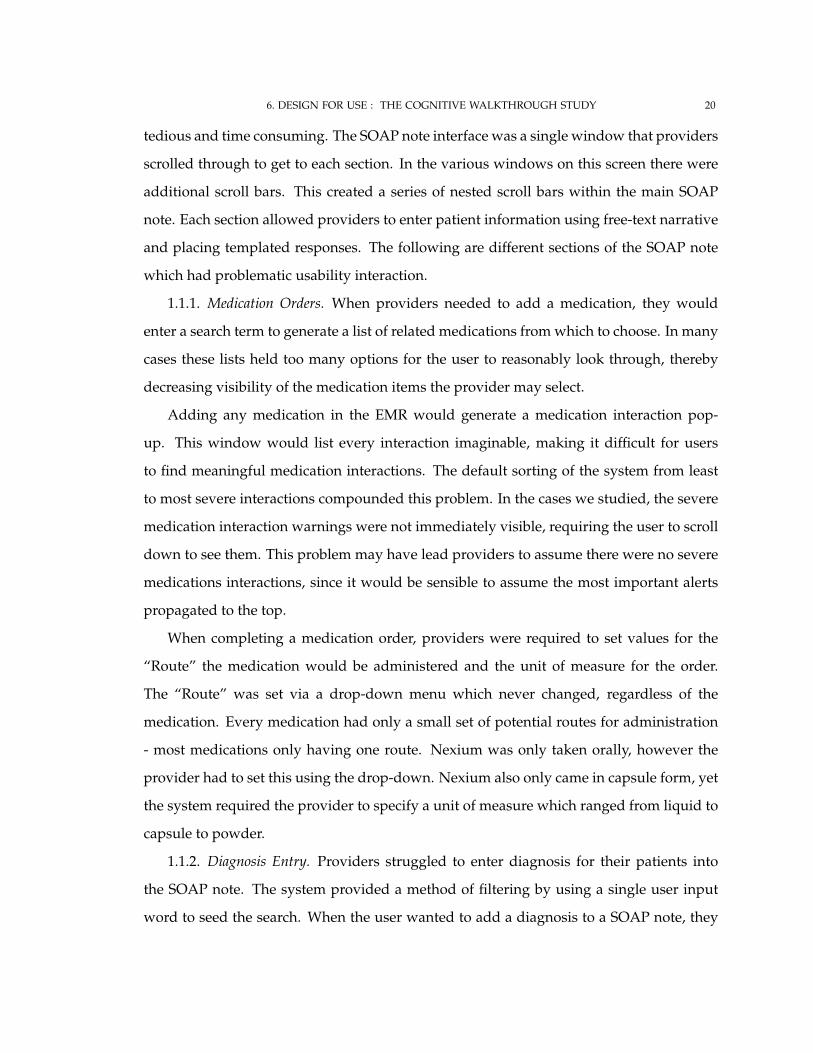
1.1.1. Medication Orders. When providers needed to add a medication, they would
enter a search term to generate a list of related medications from which to choose. In many
cases these lists held too many options for the user to reasonably look through, thereby
decreasing visibility of the medication items the provider may select.
Adding any medication in the EMR would generate a medication interaction pop-
up. This window would list every interaction imaginable, making it difficult for users
to find meaningful medication interactions. The default sorting of the system from least
to most severe interactions compounded this problem. In the cases we studied, the severe
medication interaction warnings were not immediately visible, requiring the user to scroll
down to see them. This problem may have lead providers to assume there were no severe
medications interactions, since it would be sensible to assume the most important alerts
propagated to the top.
When completing a medication order, providers were required to set values for the
“Route” the medication would be administered and the unit of measure for the order.
The “Route” was set via a drop-down menu which never changed, regardless of the
medication. Every medication had only a small set of potential routes for administration
- most medications only having one route. Nexium was only taken orally, however the
provider had to set this using the drop-down. Nexium also only came in capsule form, yet
the system required the provider to specify a unit of measure which ranged from liquid to
capsule to powder.
1.1.2. Diagnosis Entry. Providers struggled to enter diagnosis for their patients into
the SOAP note. The system provided a method of filtering by using a single user input
word to seed the search. When the user wanted to add a diagnosis to a SOAP note, they
6. DESIGN FOR USE : THE COGNITIVE WALKTHROUGH STUDY 21
could type into the diagnosis field. Based on this word the system would generate a list of
diagnosis with names containing the input text. For example, if a provider wanted to add
the diagnosis of “Esophageal Reflux” to a SOAP note, they could type “esoph” or “reflux”
into the diagnosis field. After hitting return, the system would generate a list containing
the diagnosis “Esophageal Reflux” below the input field. The provider would then click on
that entry to add the diagnosis. However, if the user were to type “gerd”, “gastro”, “acid”,
or other words related to the diagnosis, they would not be presented with the diagnosis of
“Esophageal Reflux”. This meant the provider tried to guess the correct search term every
time they added a diagnosis.
1.1.3. Templates. Templates allowed providers to quickly document portions of patient
interactions by clicking on pre-developed answers to common questions or prompts.
Administrative staff and providers collaborated to build templates for providers using
tools supplied by the EMR vendor. Template usability suffered because many of the
templates had too many questions, the lists of answer options for some questions were
excessive and repetitive, and templates overused acronyms.
The “Basic Illness Exam” objective template had 14 prompts for providers to input
information including Skin, Eyes, Ears, and Nasal Passages. Each prompt could have as
many as 10 different responses, which were not mutually exclusive meaning they could
all be selected. On most occasions when a provider selected abnormal for a prompt, the
system generated a pop-up window allowing the provider to further clarify the abnormal
state. This forces users to make numerous clicks, and manage additional windows. The
provider also scrolled down a large portion of the screen to find all the prompts. Although
we included the “Basic Illness Exam” template specifically in our cognitive walkthrough,
we noticed that other templates suffered from similar problems.
Most templates had duplicated answers for some of the prompts and questions. In
the case of the “Basic Illness Exam”, the “Skin:” prompt had options for “Warm and dry”,
“No lesions”, “No rashes”, “Warm and dry, No lesions, no rashes”, and several additional
abnormal options. There was an opportunity to consolidate some of these options by
determining the minimal set of options that would allow providers to document the

6. DESIGN FOR USE : THE COGNITIVE WALKTHROUGH STUDY 22
different cases. Additionally the providers could type text into fields next to the values
to provide additional details. Instead of having a larger number of options to cover all the
possible cases, it may be more effective to prompt providers to type clarifying details in
these fields.
Medical facilities commonly use acronyms to communicate in written and verbal form.
The medical field accepts many acronyms as official medical lingo, but many facilities
adopt their own acronyms. Wardenburg staff utilized many acronyms in their template
prompts and answers. In the “Basic Illness Exam” template the “Eyes:” prompt utilized
the acronyms EOM-I, “Extraocular Movements Intact” and PERRLA, “Pupils equal round,
reactive to light and accommodation”. The “Lungs:” section used the acronym CBTA,
which refers to clear bilateral air movements, but was not a normally recognized medical
acronym. The “Neck Exam:” prompt and the “Abdomen:” prompt also had acronyms.
All of these prompts were part of one template, but many other acronyms were found
throughout the entire template library. Most acronyms would be recognized by providers,
but some acronyms were likely to cause confusion in providers, especially new providers.
Providers completed most templates by using checkbox controls. Occasionally, a
template required use of text input, radio buttons, or drop-downs. Marking certain
checkboxes in a template generated additional pop-ups with more questions allowing
providers to further clarify information. The problem was that the controls were
not consistent throughout the same interface and across separate interfaces. Mixing
checkboxes with radio button inputs presented a confusing series of interactions.
1.1.4. Documentation Tools. The EMR system we studied provided several tools for
decreasing the time required for inputting information into the system. These tools worked
by automatically populating fields for the provider based on their specifications, but
required configuration by the user. The tools included Default Medication Settings and
Favorites.
The setup process for these tools differed from the the process a reasonable user
would intend to take. The average user would want use a “Create Medication Default”
or “Create Favorite” type of control. However these controls did not exist. Instead the

6. DESIGN FOR USE : THE COGNITIVE WALKTHROUGH STUDY 23
system required providers to fill out the information, as if they were completing the
documentation for a patient, then click a “Set Default” button. In the case of creating a
default medication setting, the provider would open a SOAP note for any patient, add
the medication according to the normal process, then before submitting the medication,
click the “Set Default Rx” button at the bottom. After doing this the provider could cancel
the prescription, close the note, and not bother to save. This process would fit well if the
provider was thinking about creating a default medication entry when they were ordering
a medication for a patient, but this did not always occur. Setting the default medication
should be uncoupled from the workflow of ordering medications for a patient.
The same problem occurred when creating a favorite for later use. Favorites allowed
providers to set default entries for all, or some, of the sections of a SOAP note. To create the
favorite, the provider would need to create a SOAP note and fill in the different sections
according to their preference. After this they would click a button on the SOAP note to
create the favorite. Again, this process worked well if the provider was thinking about
creating a favorite while they were completing documentation on a patient, but this was
not common. There should be a control for creating favorites separate from workflow.
1.2. Patient Summary Screen. To update the patient summary screen, providers
would manually enter significant medical history for the patient. Although the provider
already entered diagnosis into the SOAP notes for their patients, this information would
not populate the patient summary screen under the medical history section into which it
belonged. Providers were forced to input this information more than once because the
system already had the information in another location.
2. Information Output
2.1. Home Screen. The home screen helped providers get a quick glance at their
appointments for the day and the pending work items they needed to complete. In the
upper half of the home screen providers would have a list of patients for the day, including
those already seen, and those yet to be seen. When a patient arrived, their name would
change color on the home screen for the provider. When they completed the check-in form

6. DESIGN FOR USE : THE COGNITIVE WALKTHROUGH STUDY 24
their name would change color again. After being taken to an exam room and seen by
the MA, their name would change color yet again. The meaning of the color changes was
not clear without clarification or exposure. Even when the providers knew the meaning of
colors, they had difficulty discerning different colors from a distance. If the patients name
was selected, the provider would be unable to see any coloring.
In the bottom half of the home screen, the system listed pending work items for the
provider to complete. These included incomplete SOAP notes, unreviewed test results,
secure messages from patients or colleagues, and to-do items. Because so many items
could appear in this window, we found items began to move off screen. Some providers
had the majority of their open work items off the screen, which required scrolling to see
everything. This posed a problem because it increased the chance providers would miss
important tasks.
2.2. Patient Summary Screen. On the patient summary screen, the system listed
current medications, discontinued medications, immunizations, medical histories, allergies,
family medical histories, and several other categories of information. It was rare to see a
patient summary screen where the information did not go beyond the screen requiring
providers to scroll. The patient summary screen had no obvious controls for sorting these
lists or searching the lists for pertinent information.
2.3. Past Notes. Past visit notes were accessed from an interface called “All Notes”.
This interface listed all notes from past visits. SOAP notes from visits were the items
providers most often needed to review. This interface was cluttered with additional notes
including templates that were already embedded in the SOAP notes, secure message
communications, and progress notes used to document minor patient interactions such
as phone calls. There was no use in having the templates listed in this interface alone,
when they were already included in the SOAP note and held little meaning outside of the
SOAP note. Much like the patient summary screen described above, this interface could
hold many items, especially if the patient was seen often. Relevant SOAP notes could be
pushed off the screen, which increased the likelihood that they would be missed.

6. DESIGN FOR USE : THE COGNITIVE WALKTHROUGH STUDY 25
There was not a good mechanism to sort or search these notes to help the provider
find relevant information. If a provider tried to sort by the type of note, it would only
sort within each separate visit date, instead of across all the notes. In this case, all SOAP
notes from November 1st would be grouped together and all the templates completed
on November 1st would be grouped together. All the SOAP notes from November 14th
would be grouped together but separate from the SOAP notes from November 1st, and so
on. Many notes were poorly labeled because the system used the visit summary field to
describe each note, and that field was optional. The field did not have a set format and was
free-text input by providers. The only way to find relevant notes was through manually
reviewing the contents of each note.
2.4. Lab Results. The lab results interface suffered from the same problem as the
previous two interfaces - too many items and no mechanisms to identify the relevant
information. Lab results had cryptic labels based on ordering codes. Much like the “All
Notes” interface, providers searched through the lab results one by one to identify relevant
information.
3. Summary
The cognitive walkthrough revealed problems with information input and export in
the EMR system. The main interfaces used by providers, including the patient summary
screen, the home screen, and the SOAP note, all had problems identified by the cognitive
walkthrough. At times, the system overwhelmed providers with too much information.
In other cases, providers could not locate the information they were looking for in one
intuitive location.
7Design for Administration :
The Shadowing Study
We were originally asked by clinical staff at the Wardenburg health center to evaluate their
EMR because they noticed a significant decrease in the volume of patients being seen by
providers after adopting the EMR system over three years ago. Based on discussions, we
thought that this decrease in productivity was because of the EMR user interface design
and workflows - providers were going back and forth between exam rooms and pods to
interact with the system. Based on our analysis, we theorized that impressions of workflow
productivity depended on one’s preference for patient care or administrative efficiency.
Although going back to the pod may have been time consuming, the documentation was
26
7. DESIGN FOR ADMINISTRATION : THE SHADOWING STUDY 27
Provider Visits Patient in
Exam Room
Provider Documents
Visit in Exam Room
Provider Returns to Pod to Document
Visit
Completes note in one
sessionIterates
Over Note
2 6
EMR
2 82
2
Whe
reW
hat
How
NarrativeTemplate
4 6
Home SOAPNote
Patient Summary Screen
TranslationalArtifacts
8
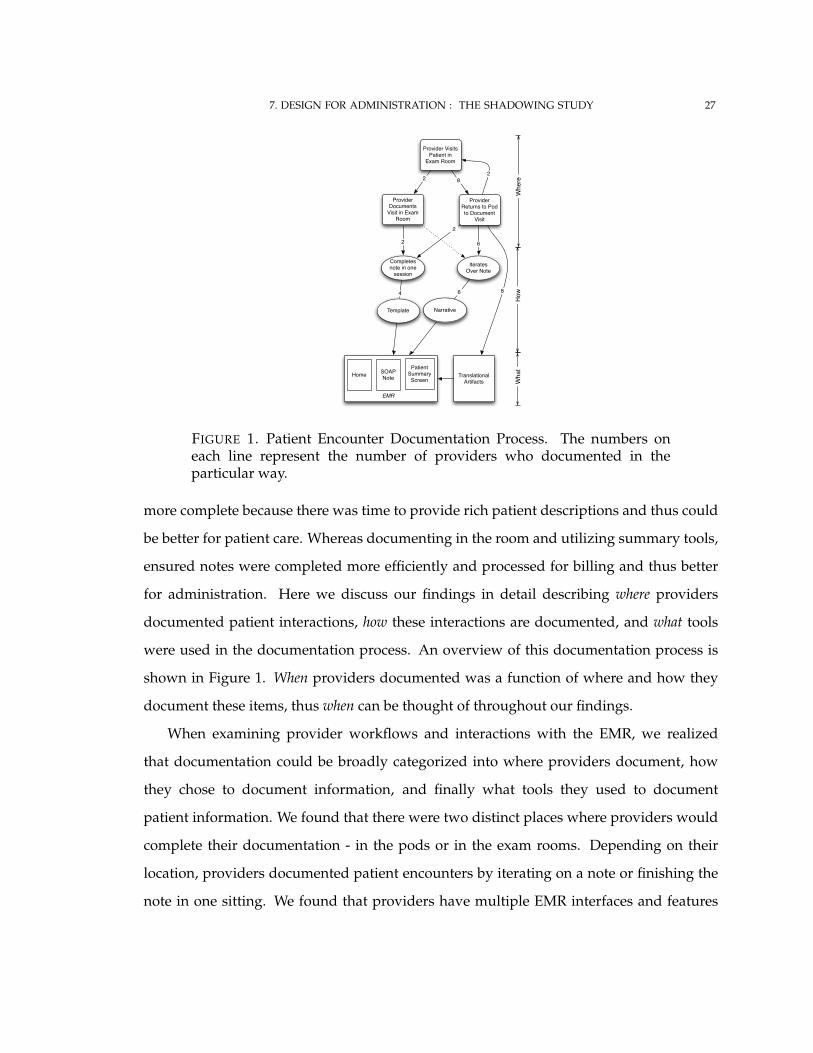
FIGURE 1. Patient Encounter Documentation Process. The numbers oneach line represent the number of providers who documented in theparticular way.
more complete because there was time to provide rich patient descriptions and thus could
be better for patient care. Whereas documenting in the room and utilizing summary tools,
ensured notes were completed more efficiently and processed for billing and thus better
for administration. Here we discuss our findings in detail describing where providers
documented patient interactions, how these interactions are documented, and what tools
were used in the documentation process. An overview of this documentation process is
shown in Figure 1. When providers documented was a function of where and how they
document these items, thus when can be thought of throughout our findings.
When examining provider workflows and interactions with the EMR, we realized
that documentation could be broadly categorized into where providers document, how
they chose to document information, and finally what tools they used to document
patient information. We found that there were two distinct places where providers would
complete their documentation - in the pods or in the exam rooms. Depending on their
location, providers documented patient encounters by iterating on a note or finishing the
note in one sitting. We found that providers have multiple EMR interfaces and features

7. DESIGN FOR ADMINISTRATION : THE SHADOWING STUDY 28
with which they interacted to complete their documentation, and in some cases retrieve
information. We found that although inputting and retrieving information from the EMR
were usually done at different times, the way information was input into the system often
had a direct impact on the ability for providers to retrieve that information.
1. Where Providers Document Patient Encounters
In this primary care facility, providers utilized the EMR system in their pod work space
or in patient exam rooms. Some providers favored EMR interactions in one area over the
other, forming two distinct groups. Documenting in each location had unique benefits and
barriers that we outline below.
1.1. Return to Pod for EMR Usage. Providers that returned to the pod to complete
documentation had limited interaction with the EMR system during the patient interaction.
Returning to the pod to document was beneficial because it allowed providers to focus on
the patient interaction during a visit, to have better awareness of patient care coordination,
and to create more detailed narratives. Documenting in the pod space carried with it
several disadvantages as well, including forgetting information and losing transitional
artifacts.
P1 walked into exam rooms and did not interact with the EMR at any point. After
finishing a patient interaction, the provider returned to the pod to complete the orders
and documentation for the patient. Returning to the pod for documentation allowed the
provider to more effectively communicate with the patient. The computer system did not
have the opportunity to capture the provider’s attention from the patient.
This workflow also supported the providers ability to prioritize patient care even
before seeing the patient. They could participate in the coordination of patient treatment
more readily because they were present in the pod space more often than providers
documenting in the exam room. If a patient required a test or treatment prior to seeing
the provider, this could be communicated between the provider and MA because they
were more accessible. P2 was completing documentation from a previous visit encounter
as a MA explained to her that the next patient had a sore throat and might need a strep
7. DESIGN FOR ADMINISTRATION : THE SHADOWING STUDY 29
test. The provider agreed and gave an order for the MA to complete conduct a strep test
on the patient. If the provider had not been available the MA would have kept the patient
waiting until the procedure could be verified with the provider. This made efficient use of
the patient’s time allowing the provider to gather required information necessary to treat
the patient before examining them. The MA did not need to sit in the pod waiting for the
provider to arrive, allowing them to get back to completing other work.
The last benefit we found in providers that returned to the pod was that they had more
time to document details of the patient encounter. Because they went back to the pod, they
were less rushed to complete the documentation and could give more thought to their
narratives.
Like I will write down everything on [a piece of paper] and then when I get back into my [pod],
not only will I have had some more time to think about it, but if I had transcribed things directly as
the patient said them, it would be kind of gobbelty gook.
Writing a narrative at a separate time from the patient encounter avoided their note
reading as an unconnected set of actions - a ”gobbelty gook” with no common themes or
meaning. And the quote supported the idea that better documentation can come out of
additional thought about an interaction.
The return to pod workflow displayed problems that may inhibit the provider from
successfully completing patient documentation. All of the providers that returned to the
pod to document wrote on pieces of paper, creating transitional artifacts [7], to temporarily
hold notes of the patient encounter. Providers were at risk of losing their notes during the
day. Two providers encountered this problem during shadowing, including P5 in Case 1
below.
Case 1: P5 visited a patient during her day without using the EMR in
the exam room. She interacted directly with the patient, taking notes of
pertinent findings on a piece of paper. She returned to her pod space
to enter a pharmacy order into the EMR system and drop off the notes
from the visit. Once the order was entered, the practitioner returned to

7. DESIGN FOR ADMINISTRATION : THE SHADOWING STUDY 30
finish the patient visit. This visit was not documented until over two
hours later. When the provider began documenting the visit they could
not locate the paper containing the visit notes. Even with the help of a
medical assistant, the provider was unable to locate the note after fifteen
minutes of searching. The provider had concerns about missing details
of the visit because of the lost note, but proceeded to document as best
she could.
A majority of providers expressed concern about missing visit documentation. Not
simply due to losing notes, but because extra time passed between seeing patients and
being able to document their interaction. For some providers, there could be as many
as eight hours between seeing a patient and documenting the visit. Losing a paper note,
missing paper or a pen to take notes, or choosing not to write notes about the visit only
served to exacerbate the problem. If all practitioners had the opportunity to return to the
pod space then this risk might be mitigated, however this rarely happened in this busy
clinic. As demonstrated by P1 above, returning to the pod for documentation allowed the
provider to more effectively communicate with her patient. But if the provider had another
patient waiting after the visit, she may not have had time to document the previous visit.
We found that the more time between the visit and documentation, the more problem
a provider had recalling information about that visit. Several providers commented that
they tried not to leave visits undocumented for long because they can ”forget what’s going
on” (P9) with that patient. The similarities among many acute care patients also makes it
more likely to forget specific details for a patient. P9 worried that after a while she might
lose track of patients:
And yea, I don’t like to leave charts sitting. Cus then I also forget whats going
on. I don’t feel like, I think theres safety issues there ... or like if there are a lot of
things that are similar, then it can start being like - which patient is that?
Returning to the pod to document allowed providers to interact more closely with their
MAs. Since this relationship had shown to be beneficial for providers in our observations,

7. DESIGN FOR ADMINISTRATION : THE SHADOWING STUDY 31
returning the pod provided an advantage. Our team considered the idea, however, that
spending more time in the pod increased the chance for providers to be distracted from
their work by colleagues. This intuitively would be a problem, but our data did not capture
enough of these interactions to confirm. We observed participants spent more time at work
when they returned to the pod to document than providers that documented in the exam
room.
1.2. Documenting in the Exam Room. Two of the observed providers completed
the entirety of their patient documentation in the exam room during and immediately
after the patient interaction. These providers had the benefit of having all the patient
information available during their visit and completing notes more quickly. They were
also less likely to forget information obtained during a patient interaction by documenting
as they worked. A negative side effect of documenting in the exam room, however was
the increased distraction from the patient interaction during a visit. It also left less time for
the provider to think about the content of the note before locking it.
During shadowing, we observed that providers who documented in the room would
complete all the work for a patient before seeing the next. Here we highlight this benefit of
documenting in the exam room:
Case 2: During one shadowing period, P4 saw three patients at the
beginning of the day before turning on the computer in the pod space.
She went directly from one exam room, to the next exam room without
stopping to interact with any individuals. The researchers were unable
to observe these patient interactions and the documentation associated
with them, but P4 identified that the notes for all three patients were
completed before touching the pod space computer. At this time the
provider had not fallen behind on her schedule.
This process appears to be effective for completing documentation and seeing patients.
Neither of these providers had to spend much additional time working on their notes
outside of the time spent in the exam room. The only time P4 was observed working on

7. DESIGN FOR ADMINISTRATION : THE SHADOWING STUDY 32
notes in the pod was when a patient arrived late and disturbed her workflow. Since these
providers were inputting the information for the patient interaction into the EMR as the
interaction occurred, there was very little time between the interaction and the providers
documentation of the interaction. This meant the information in the SOAP note had an
increased chance of being more accurate.
Providers documenting in the exam room had easier access to patient information
during the visit because they were already working in the EMR system. We observed
P4 check the immunization and histories for one patient during the visit, switching from
the open SOAP note to the patient summary screen, then back. This provider would be
more likely to check this information than providers who returned to the pod to document
because she already completed the tasks of logging in and opening the patients records.
There were negative consequences associated with documenting in the exam room. The
most problematic was the distraction from the patient interaction due to the provider being
engaged with the computer system as shown below.
Case 3: Before she began discussing the symptoms of the patient, P7
logged into the system and pulled up the patient’s summary information.
As they began discussing the problem, the provider started typing into
the Subjective narrative section of a SOAP note about the encounter.
As the conversation between the patient and provider continued, the
provider kept documenting the interaction in the SOAP note, not verbalizing
what she was doing in the system. Throughout the visit the provider
conversed with the patient while looking at the computer screen.
We were unable to follow-up with patients and understand their perceptions of
the computer usage. It was intuitively clear that the computer distracted from their
interaction. Although P5 did not document in the exam room, she was able to clearly
summarize the potential problem with documenting in the exam room:

7. DESIGN FOR ADMINISTRATION : THE SHADOWING STUDY 33
Yes, I know that is the problem with the computer system - it just sucks you right
in enough so that you move your focus. You move your attention to that. It takes
attention away from the patient, whereas jotting notes does not.
When a note was completed in the exam room, there was less time for the provider
to review that note and think about any additional information that might be necessary.
Occasionally the missed information would be necessary to have in the note, so the
provider would have to make sure this information was added into the system. This EMR
system did not make that easy, as demonstrated by the following case.
Case 4: We observed P7 during a patient encounter complete the entire
note for the visit. She used several templates while speaking with the
patient then flushed out the note with a small amount of free-text and
orders before locking the note in the exam room. Before the provider
left the exam room at the end of the visit, she realized she had not input
the lab order for this patient. She then had to append the locked SOAP
note saying that a specific lab test was ordered and to refer to a second
SOAP note for the details. The provider then had to open up a second
SOAP note for the same visit, add some necessary diagnosis information
required for ordering the lab test, complete the order, and lock this note.
In the end, what seemed to be a time savings, by documenting in the exam room,
turned out to take extra time and create documentation clutter. The additional documentation
did not add additional meaning to the visit, it only served to make sure the lab test was
ordered and that the order was documented.
2. How Providers Document Patient Encounters
Figure 1 shows the two processes of how a provider documented their encounters -
an iterative process or a single session of documentation. The figure also highlights the
number of providers which adhered to the different methods - six providers used an
iterative process and four providers completed a note in one sitting. When iterating on a
note, providers would document a portion of the visit, then temporarily save the note, and

7. DESIGN FOR ADMINISTRATION : THE SHADOWING STUDY 34
return to it later to complete it or add additional information, then save again. Providers
following this process typically used more free-text narratives in their documentation.
In the single sitting approach, providers worked through the note in a more sequential
process and locked the note before moving on to another task. Providers following this
process typically used more templates in their documentation.
It is important to note that although these providers completed the majority of their
notes one way or another, no provider was 100 percent consistent in their approach to note
completion due to the exceptional nature of medicine (ie patients arriving late, colleagues
asking for advice, patients arriving to the visit with a laundry list of problems). All
providers used some templates and some narratives, regardless of the way they completed
their documentation. The associations between template and narrative use, and the way a
provider documented were based on the majority of their interactions.
2.1. Iterative Note Development. Providers who iterated on notes completed some
of the work on a note, then saved it to be added to later. Upon return, some notes might
get completed, others edited and saved again for later addition. The process of adding
and saving continued for an indefinite amount of time. Iterating on notes provided the
benefits of building a more complete story by considering the encounter over a longer
period of time and then creating more elaborate documentation to portray this story. This
process had negative consequences because it built up a list of open items on the home
screen, typically took more time, and increased the chance providers would forget patient
information.
P10 preferred iterating on notes because of the time it gave her to think about the
patient interaction. This was so valuable that the provider typically stayed one to three
hours after her last patient of the day to further refine documentation. She said:
And actually at the end of the day or at the end of the morning, whenever I get around to the
subjective [note], it doesnt take me that long, but going back to what I said earlier it has given me a
chance to think about it in between.

7. DESIGN FOR ADMINISTRATION : THE SHADOWING STUDY 35
To capture the additional details described above, the researchers observed more free-
text style narrative documentation from providers that iterated on their notes. Although
this study could not draw the conclusion that this additional information improves patient
care there was a general consensus that it was valuable for care. P9 appreciated “[a
provider’s] thoroughness” when they provided additional narrative information about
a patient. “[She knew] what [was] going on” with those patients after following a
provider documenting details in complete narratives. P5 agreed that detailed narratives
are so important ”so that the next [provider] seeing the patient really has a meaningful
description thats extremely precise of that person”, allowing for a better overall healthcare
experience and continuity of care. P8 explained that detailed narratives were imperative
to be able to ”trigger [their] memory” about their own past patients.
Providers that completed notes in an iterative process, also returned to earlier already
completed sections of a note after working on another section. During individual
interviews, researchers found later sections of the note reminded the providers of different
aspects of the visit that they would then add to the appropriate section. This required
a significant amount of scrolling and moving around in the note which was fairly time
consuming. During an interview P2 summarized that the process was:
[Jumping to an earlier section of the note] was the result of remembering something pertinent
while working on a later section. The biggest one she thought of during the interview was regarding
a patient being new. She needs to charge and document a visit different based on patient being new
or established and often needs to look to earlier sections to remember this
Jumping between sections may have helped remind the provider to add additional
information to the note, but it also slowed down the providers documentation. This
problem was not the only negative consequence of iterating on notes. Because all
documentation notes, results, and messages appeared on the home page for a provider
if they were temporarily saved and had not been locked they could accumulate on this
screen. A build up of uncompleted notes and work items represented a primary concern
when a provider iterated on her documentation.
7. DESIGN FOR ADMINISTRATION : THE SHADOWING STUDY 36
Case 5: P3 hesitated to lock notes after working on them. The practitioner
would document as many as three different patient encounters simultaneously.
The researchers observed the provider complete one section of one SOAP
note, switch to another SOAP note and complete one section in that SOAP
note, then switch to yet another SOAP note and complete a single section.
After working on each note the provider would ”draft” the note. This
would temporarily save the note for completion at a later time. As many
as sixteen different notes persisted on the providers home screen because
they had not been locked. These items pushed more recent matters
outside the initial view of the home page.
The provider needed to scroll down in the home screen to see additional work items.
Even more important, time sensitive work items were pushed outside the view of the
provider if too many notes remained open. This represented a possible hazard to patient
safety because providers might miss important labs or forget to finish a note. The issue
stemmed from the failure of the EMR system to provide a reasonable sorting methodology.
Additionally, when providers did not consistently lock their notes, more items appeared
on the home screen making it more difficult to find important items.
The story of P3 above also exemplified a potential loss of time in an iterative note
completion. By switching between different notes, the provider lost time navigating
between screens to get to each note. In the EMR system studied, a provider would need to
navigate through at least four screens, and make at least six clicks to get from one note to
the next note. Over time this would amount to a substantial amount of time that had no
direct correlation to the ability to treat patients.
Forgetting information because of iterating on a note over time has a similar process to
that identified in the return to pod workflow. The choice of where to document and how to
document both contribute to providers forgetting information. P5 identified her process
of iterating on notes that was high risk for forgetting information:

7. DESIGN FOR ADMINISTRATION : THE SHADOWING STUDY 37
What tends to happen is that I get as far as I can in the note and I try real hard to do the physical
exam because I’d forget that ... I put the history notes in, and then whenever I get time I go back to
the note and theres a list of open notes. And I just open the note, scroll down and find where I was
and go back in.
This provider understood that some parts of the note were more at risk for forgetting
than others. In this case, and for most providers, the details of a physical exam, which
were documented into the objective section, were more likely to be forgotten.
A small note: P3 did not use significant narration in documentation, although heavily
iterated on notes. This formed an outlier case for providers iterating on notes. The five
other providers conformed to the concept of heavy utilization of free-text narratives in
patient documentation.
2.2. Completing Documentation in One Sitting. Some providers chose to complete
a note in a single sitting from top to bottom. This process benefited providers by limiting
the accumulation of notes on the home screen and allowing providers to quickly complete
documentation to move on to the next patient interaction. It presented problems because
notes created in this way were less likely to have the rich narrative details found in iterated
notes.
We observed P1 and P7, both providers who documented in one sitting, had very few
items on their home screen. The struggles of providers, such as P8, who documented
iteratively demonstrted the value of closing notes quickly by documenting in one sitting:
It still is easy to miss things, you know phone calls that are coming in. there
is a lot of stuff that doesnt need immediate attention, like the open template, the
template that somebody fills out today for an appointment tomorrow. I would
rather not see that. It just clutters my screen. And potentially I miss a phone
call or I miss a forwarded note from a nurse or something like that which really
does need to be paid attention to.
Providers who documented in one sitting had less open items present on the home
screen, making it less likely to have important items pushed off the screen.
7. DESIGN FOR ADMINISTRATION : THE SHADOWING STUDY 38
Some providers would complete every section in the order it appeared, which
intuitively seemed like an efficient process since it supposedly followed the cognitive
process for patient interactions. We observed providers were able to close more open
work items and completed their documentation quicker than providers documenting by
iteration when they documented in one sitting. We observed that P1 would return to her
pod after seeing a patient, then begin the note. She would complete each section in the
order S-O-A-P, and then lock the note upon completion. This provider spent noticeably
less time documenting visits than individuals that iterated on their notes. She left the
office sooner than her colleagues who had documented iteratively because she completed
her documentation in a more timely manner.
The provider relied more heavily on templated data entry in order to complete patient
documentation so efficiently. The simple interaction of clicking check boxes to identify
symptoms, concerns, or physical examination allowed templates to be completed quickly.
Templates also reminded providers about parts of an examination they may have forgotten
to complete, or questions they forgot to ask for a patient presenting with a specific set
of symptoms. P2 stated she would be working through a template and see a question
that reminded her about a piece of educational information handed to the patient, or a
prescription she wrote by hand but did not document. The template increased the chances
that the provider documented all of the care provided to the patient.
Using templates typically minimized the amount of narrative information existing
in these notes. The templates could capture most of the information from the visit and
a provider may feel a narrative is not necessary. As discussed above, narrative data
provided rich patient information, much of which directly influenced a patient’s care.
Templated data entry could not capture every detail about a patient, so pertinent patient
history may escape a provider without detailed narratives. Although P8 did not follow the
”complete documentation in one sitting” workflow, she explained the weakness in relying
on templates and why she used narratives:
7. DESIGN FOR ADMINISTRATION : THE SHADOWING STUDY 39
I tend to write a narrative with a cold anyway, because it sort of personalizes it for me, so it
helps me remember and understand who the person was and maybe get a sense of how sick they are.
Whereas I dont think the templates adequately capture that
This points to a problem with utilizing only templates for documentation as was
observed in a small portion of providers. Their notes may not be useful at a later date,
especially if seen by another provider. Providers found it frustrating when they pulled up
the past notes of their next patient and found no details to build a story of what happened
during the last visit.
3. What Tools Are Used to Document Patient Information
The providers voiced two primary complaints during our study in regards to the EMR
itself. The first was that they were often presented with too much information. The other
was that they were unable to access some of the information in the system when they
actually needed it. When providers are unable to access all of the pertinent information
for a patient, or are unable to identify the pertinent information, there is an increased risk
of adverse outcomes [23]. Our team did not observe this problem across all EMR features.
The SOAP note data entry form and patient summary screen were two specific screens in
the EMR that presented the most common difficulties for the provider in terms of their
information presentation and accessibility.
3.1. SOAP Note. The major usability concern identified with the SOAP note was the
excessive data entry requirements. The whole note felt overwhelming because it required
large amounts of scrolling to move around it. Every section of the note contained a free-
text input field which consumed a lot of the screen real estate. P4, P8, and P10 were
observed struggling with scrolling to the correct section of the SOAP note, each of them
deploying different navigation methods. P4 [scrolled] by dragging the scrollbar even though
[the provider had] a mouse wheel to scroll through. We later found out that because of the
software implementation some sections of the EMR did not allow scroll wheel interactions,
while others did.

7. DESIGN FOR ADMINISTRATION : THE SHADOWING STUDY 40
Case 6: P10 used tab to navigate down a long note, but would often
overshoot the target field and be forced to scroll back manually. The
provider became frustrated with the amount of movement around the
note to get different information so she kept a pre-developed narrative
assessment in a Word document. When documenting a physical exam,
the provider would edit the Word document template to fit the current
patient, then copy and paste it into the EMR. While editing the Word
template the provider kept the subjective section visible in the EMR
window to reference information. A useful spell checking system and
the easier interaction with Microsoft Word were cited as the main reasons
for using this process.
This provider developed a workaround because the system did not support the
interaction she desired. The idea of working around problematic EMR interactions was
a common observance during our study. Some interactions, such as entering diagnosis
codes, required paper workarounds because there was no electronic solution available.
The diagnosis code entry field found in the assessment section of the SOAP note was
intended to support providers typing a word relating to the diagnosis, then hitting return.
Immediately the EMR would return all possible diagnosis the provider might use in a
window below the field. Our cognitive walkthrough, in Chapter 6, identified multiple
usability concerns with this task. It was possible the provider might not have seen the
diagnosis she looked for in the first place. Even when a provider would find the correct
diagnosis in the list she may not have recognized it as the correct diagnosis for the patient
since the naming was inconsistent and often confusing. If the diagnosis was stored in
the database under a different name, or it was an abbreviated form of the name, and the
provider typed the entire name, she would not see the desired result.
Case 7: P5 consistently had trouble adding diagnosis to her patient
documentation. On one occasion she tried more than 5 different text
inputs to try and find a diagnosis that would match her needs. When

7. DESIGN FOR ADMINISTRATION : THE SHADOWING STUDY 41
she typed in ”ankle”, the system presented a list of too many possible
diagnosis that she would have had to look through to pick the correct
one. When she typed ”sprain” into the field, the system presented her
with a list that was longer than before. She tried a few more different
strings to try and find the correct diagnosis before returning to the input
of ”ankle”. The system forced her to pick a diagnosis that she claimed
was ”close enough”.
This presents a problem since the diagnosis entered by the provider partly determines
the ability to bill a patient. P8 gave an example of her difficulties and paper-based
workaround she has used:
Yes, it is because I [do not] find typing in this EMR that you get what you are
looking for ... Well the cheat sheet I use is by systems, so here is the GI list, here is
the cheat sheet of the 200 most commonly used codes probably that is put out by
the American Academy of Family Practice and it is by system or symptom ... an
example from this morning, I am seeing somebody because he had an abnormal
chest x-ray and there is a code to follow up an abnormal test. How do you find
that? I dont know, so that is when I look at that cheat sheet.
P5 provided his interpretation of the method behind the mechanism:
... if you put in the word fever and there is actually a code for fever, you get I
think six choices or something to start with. It is eighth, so you actually have to
scroll down, you just typed in fever. You have to scroll down to get to the one
that says fever, because there is Scarlett fever and rheumatic fever and it goes
through a bunch of other ones first.
Both quotes conveyed the extra work required to find correct diagnosis codes. Sometimes
the system would return the desired diagnosis code, other times it would require using
paper tools or multiple attempts. An update to the EMR system sought to alleviate this
problem by allowing providers to add diagnosis from lists grouped by type or area of
injury/illness. Once a list of a certain type was selected, specific diagnosis codes could be

7. DESIGN FOR ADMINISTRATION : THE SHADOWING STUDY 42
selected from these smaller subsets. Only 1 provider consistently used this feature. The
rest of the providers claimed to not have time outside of seeing patients and generating
documentation to learn new EMR features.
The researchers observed an inefficiency in the way providers had to document office
visit (OV) levels for billing purposes. Within a ”Procedures” field in the Plan section of
the SOAP note the administration requires providers document the level of care provided
to the patient. Although three providers directly expressed frustration at the process of
documenting office visit levels, we observed one provider struggle. There was no clear
indication as to whether a patient was a new patient to Wardenburg of not. To document
correctly, P6 had to temporarily draft the note in progress, to switch to the patient summary
screen to check if the patient had a visit history at Wardenburg, then return to the SOAP
note and document the OV level based on that.
P8 clarified the process for documenting the office visit level for a patient interaction.
She also identified that there are standards by which to document this information defined
by The Center for Medicare Services, which is a federal guideline. P8 seemed confused
why the system could not automate this process if there were standards for the visit
level. This would further decrease the amount of non-patient centric work required of
the provider.
There is a category for new patients and a category for established patients
and the numbers are 99211, 99212, 213, 214, 215 and so it is [pause] level of
complexity, how much history you gathered, how detailed the exam was, how
much data you had to analyze, did you order an x-ray, is there lab data, did you
prescribe a medicine. It all increased the complexity of the visit ... So in an ideal
world to code a level four, you need six symptoms and an exam that has ten
elements. So the ideal system counts those for you and suggests a coding level.
3.2. Patient Chart. The patient summary theoretically presents a picture of the current
status of a patient’s health and care history. We have seen that this record may contain
inaccuracies and be out-of-date. Within the patient chart is a summary screen that provides

7. DESIGN FOR ADMINISTRATION : THE SHADOWING STUDY 43
a quick snapshot of some of the most important information about a patient. One of
these sections is the discontinued and current medication lists. P2 had problems using
the information on these screens:
The lab results from patient summary screen is overwhelming and busy.
Discontinued medications should be hidable or on a different screen that it is
linked to. If a patient has had a long history with Wardenburg, they may
have a discontinued medication history that is just huge ... Education bulletin
history could be removed. Standing orders could also be removed. The current
medication list is based on prescription but does not actually tell the “story”. An
example being a patient prescribed 1 mg and 5 mg of a med but overall the dosage
is 12 mg daily. The fact that the patient was prescribed 1 mg and 5 mg tabs is
not useful, the fact that they take 12 mg total daily is useful.
From this provider’s explanations, it became clear that human-error and software
deficiencies both contribute to the problem. The clinic does not adhere, even if it were
defined, to a strict policy in regards to who, when, and how these lists should be managed.
In this case the ability to retrieve information from the system relies on the quality of
information entered into the system. The system did not provide the proper tools to
manipulate the data into a meaningful form without manually doing calculations, such
as the medication dosage to a patient. It also failed to provide a way to suppress certain
information at a useful granularity when it got out of control. At the time of the study the
system only allowed providers to set preferences for all the notes they view, not per note.
Within the patient chart, providers could access lab results for studies completed
at the health facility. The lab staff and systems documented this information in the
EMR automatically, without the need for provider interaction. Providers did access this
information on a regular basis. One theme persisted from all the providers; the idea of
correlating lab results with other patient information. In medical practice, a flowsheet
fits this need of providers. In the EMR, however, there was no way to view lab result

7. DESIGN FOR ADMINISTRATION : THE SHADOWING STUDY 44
information and other patient information at the same time. Two workarounds arouse in
this clinic to alleviate the problem.
P2, P5, P9, P10 kept permanent paper flowsheets that allowed them to track patients
with chronic diseases or medications that needed to be tracked.
Case 8: We observed P5 working with a flowsheet for a patient taking
Coumadin, a blood thinner which required tracking dosages and a lab
value known as INR indicating the effectiveness of the drug. It was
impossible to get this information out of the EMR in a usable format,
so the provider manually put all of the visits with the patient, the dose
of medication at that time, and the INR lab value at that visit, into the
flowsheet. The flowsheet even included a table of dose references at the
bottom that told the provider - based on the current dosage, the current
INR value, and the desired INR value, adjust the medication dosage to a
certain value.
The other option was seen by almost every provider observed during our study. They
wrote the information from the lab result screen on a temporary piece of paper then
switched to the patient medication history to cognitively correlate the values. Our team
did not observe any providers document the outcome of these cognitive reviews in the
permanent electronic medical record.
4. Summary
Providers documented in different places. The majority of providers returned to the
pod to document, allowing them to craft more elaborate narratives to capture complex
patient information. Additionally these providers were not distracted by the EMR system
during patient encounters and were more present in the pod space to collaborate with
their MA and other colleagues. Providers who documented in the exam room finished
their notes more quickly and were less likely to forget patient information in their
documentation.

7. DESIGN FOR ADMINISTRATION : THE SHADOWING STUDY 45
We found that providers that documented in the pod space were able to prioritize care
over the demands of administration. They had more time to craft comprehensive notes
that supported quality care and were able to collaborate more readily with colleagues.
Providers that documented in the exam room were able to finish their documentation more
quickly, increasing the throughput of patients and allowing patient encounters to be billed
more expediently.
Providers documented in different ways. One group of providers iterated on their
notes over a period of time. This methodology allowed providers to give more thought
to narrative free-text notes in their documentation and ensure time to review all potential
diagnosis. Another group of providers completed notes in one session. This methodology
allowed providers to close their notes more quickly, and spent less time documenting
patient encounters.
The different EMR tools used by all providers, including SOAP notes and patient charts
were difficult to use by providers. The usability concerns with these interfaces drove
providers to develop EMR system workarounds to improve documentation and develop
workflows that allowed them to document as much patient information as possible.
8Design for Care :
Discussion and Recommendations
Based on the plethora of research on EMR usability and pracitioners’ experiences with
various EMR systems reported to the researchers in this study, we acknowledge that there
is not an ideal EMR system. Since EMRs are expensive to adopt [28], we suggest short-term
solutions to problems identified in this study. Additionally, we conceptualize long-term
design goals to move the community closer to an ideal EMR system that meets providers’
needs.
Providers wanted to document patient encounters to improve patient care - in a sense,
documenting for care. We assert that the EMR we studied did not support capturing or
46
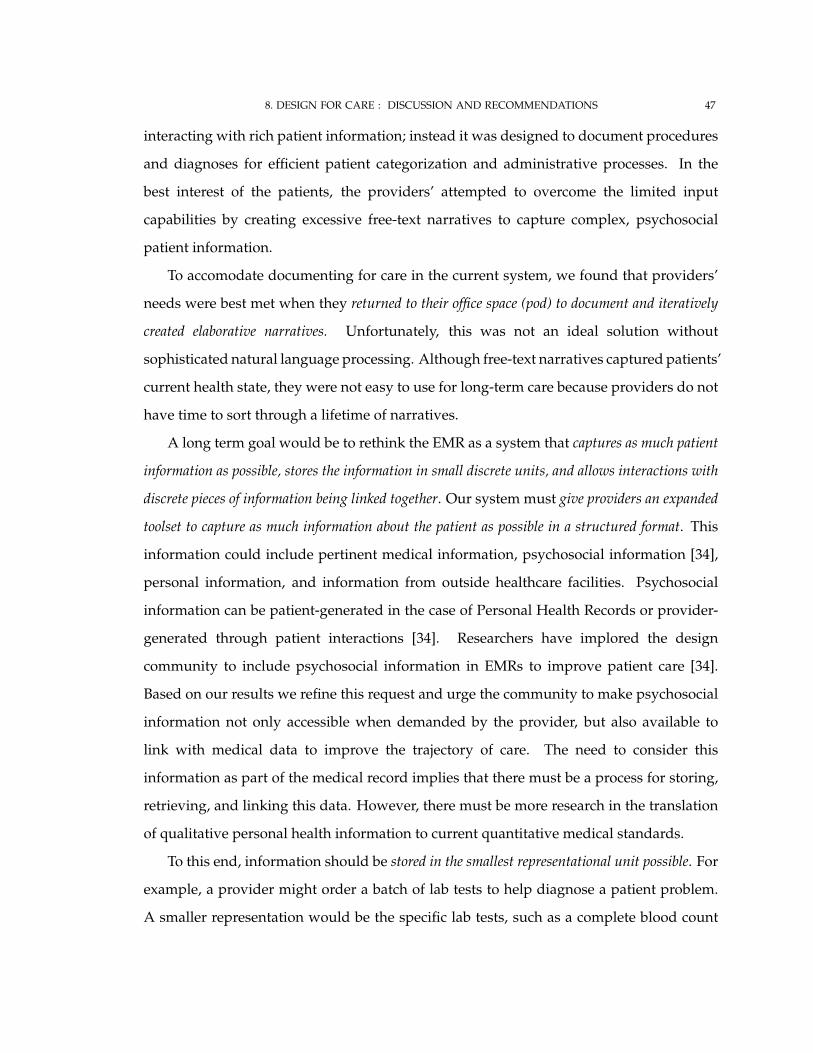
8. DESIGN FOR CARE : DISCUSSION AND RECOMMENDATIONS 47
interacting with rich patient information; instead it was designed to document procedures
and diagnoses for efficient patient categorization and administrative processes. In the
best interest of the patients, the providers’ attempted to overcome the limited input
capabilities by creating excessive free-text narratives to capture complex, psychosocial
patient information.
To accomodate documenting for care in the current system, we found that providers’
needs were best met when they returned to their office space (pod) to document and iteratively
created elaborative narratives. Unfortunately, this was not an ideal solution without
sophisticated natural language processing. Although free-text narratives captured patients’
current health state, they were not easy to use for long-term care because providers do not
have time to sort through a lifetime of narratives.
A long term goal would be to rethink the EMR as a system that captures as much patient
information as possible, stores the information in small discrete units, and allows interactions with
discrete pieces of information being linked together. Our system must give providers an expanded
toolset to capture as much information about the patient as possible in a structured format. This
information could include pertinent medical information, psychosocial information [34],
personal information, and information from outside healthcare facilities. Psychosocial
information can be patient-generated in the case of Personal Health Records or provider-
generated through patient interactions [34]. Researchers have implored the design
community to include psychosocial information in EMRs to improve patient care [34].
Based on our results we refine this request and urge the community to make psychosocial
information not only accessible when demanded by the provider, but also available to
link with medical data to improve the trajectory of care. The need to consider this
information as part of the medical record implies that there must be a process for storing,
retrieving, and linking this data. However, there must be more research in the translation
of qualitative personal health information to current quantitative medical standards.
To this end, information should be stored in the smallest representational unit possible. For
example, a provider might order a batch of lab tests to help diagnose a patient problem.
A smaller representation would be the specific lab tests, such as a complete blood count

8. DESIGN FOR CARE : DISCUSSION AND RECOMMENDATIONS 48
(CBC) and a basic metabolic panel (BMP). An even smaller representation would be the
specific lab values tested within that test, such as a sodium level in the basic metabolic
panel. The sodium test and its result should be represented as a distinct object. The other
values in the CBC and BMP should also be represented as separate distinct objects as well.
This process would allow the smallest informational objects to be linked with each other
based on the providers needs at the point of patient care. This model represents a dynamic
information linked EMR system as opposed to the static data repository model that persists
in EMR systems today. Once information pieces are linked together, providers could draw
diagnostic and prognostic conclusions based on the information.
An implication of providing access to a large set of patient data that can be linked
together in a nearly endless number of ways is providers may have difficulty understanding
data relationships. The challenge is determining meaningful interactions with the information
and how to guide providers to having meaningful interactions. We considered a rule set to
guide and control interactions as one possible approach to the problem. Utilizing context
based views of the information is a well documented approach to presenting information.
This means, for example, a patient with a history who is over 40 years of age, and a 20
year old individual with no pertinent medical history would have different information
presented. More research would need to be done to identify what information providers
might want linked together to support patient care.
Another implication of having a large set of data available is that there an increased
risk of overloading providers with information. From a design perspective, we need to
explore how to visualize a lifetime of data, or an long list of tests. We also need more
research to develop a more effective process for providers to capture psychosocial data
beyond free-text narratives.
1. Managing Flowsheets
Correlating lab results and medication dosages over time was an example of where
we could apply dynamic information linked EMRs. We identified this need by observing
the interations with physical flow sheets documented in Case 8. Paper flowsheets were

8. DESIGN FOR CARE : DISCUSSION AND RECOMMENDATIONS 49
tedious to manage since values had to be manually transcribed from the EMR. They had
limited impact because individual providers managed the flow sheets and other providers
would not easily be able to share this information.
A short term improvement to the process of managing paper flow sheets problem
would be to scan the paper flow sheets into the EMR so all providers can view the flow
sheet for a given patient. An expanded EMR should support storage of other multimedia and
information outside the scope of basic text documentation, which would help capture some
forms of psychosocial information.
This improvement is not ideal, but the idea of a dynamic information linked EMR
presented above could provide an ideal solution. In this model the physical flowsheet
would be translated to an electronic version where a specific lab value, such as a drug
marker level (e.g., INR with Coumadin), could be grouped from all the labs that included
that drug marker level. The drug marker levels could be correlated with a grouping of
medication information units based on date.
2. Managing Administrative Information
We acknowledge that it is necessary for providers to document treatment so that they
can track their services. We argue, however, that treatment tracking for administrative
purposes (e.g., office visit levels) should be automated as much as possible and separated
from the documentation of care. For example, in the “what” section of our shadowing
findings, we observed that providers manually input the office visit level into the
documentation based on their perceptions of care. Since there is a guideline for documenting
office visit levels, it can be automated.
A short term solution for administrative treatment tracking is to have a dedicated, trained
staff member to review patient documentation and procedurally generate the office visit level.
There would be a cost associated with having a dedicated individual do this task, but the
individual would most likely be more accurate in billing for treatments because currently
providers estimate their levels without reflecting on accuracy. A long term solution would

8. DESIGN FOR CARE : DISCUSSION AND RECOMMENDATIONS 50
be developing algorithms that utilize natural language processing and coded data to automatically
generate office visit levels.

9Conclusion
1. Cognitive Walkthrough Study
We found this EMR system had significant problems supporting the input and
extraction of data. The full cognitive walkthrough results in Appendix B point out specific
problems in completing different tasks with regard to visibility, labeling, matching the
intentions of users, and feedback. In Chapter 5 we summarized the results in a narrative
form, describing usability concerns with the Home Screen, Patient Summary Screen, All
Notes interface, Lab Results interface, and the SOAP note. Tedious information input
interfaces slowed the documentation of patient interactions. We found the EMR failing
to automate information input, which led to providers replicating their information input
into the system.
51

9. CONCLUSION 52
The EMR system did not present information in a meaningful manner to providers.
This forced them to search through various interfaces to find relevant information in order
to treat their patients. We found that information was most useful to providers when
it could be connected with other information, such as a treatment plan with treatment
outcomes. The EMR system did not support this type of information retrieval.
2. Shadowing Study
In Chapter 6 we described the different workflow patterns of providers at the
Wardenburg health center. More specifically, we described a difference in where and how
providers document patient encounters.
Providers documented in either the exam room or their pod office space. Each
different location had benefits and disadvantages. Documenting in the exam room allowed
provider to completed documentation quicker, however documenting in the pod space
allowed for providers to craft extensive narratives that identified the patient’s problems
and resolutions more completely.
Providers iterated on their notes over a several sessions or they completed their
documentation in one sitting. As time passed between when a provider saw a patient
and when the provider documented the visit, they had an increase chance of forgetting
information, but they were able to develop more thorough narratives regarding their
patient encounter. In contrast, providers that completed their note in one session were
less likely to forget information, but had less details in their notes.
Our study had several limitations, which suggest further study of the EMR system,
the practices of Wardenburg healthcare providers, and other facilities. The Wardenburg
administration explained to our team that the volume of patients fluctuates throughout
the semester. Our study took place during the last 5 weeks of the semester which may be
significantly different from the beginning of the semester. The work habits would need to
fluctuate to accomodate changes in patient volume.
Updates to the EMR system would also change the typical work patterns of individuals.
Our study began two weeks after our host facility deployed a new update to the system.

9. CONCLUSION 53
This change added a useful feature called “favorites”, which could change documentation
behaviors. We observed that providers did not use this feature during our study. Some
providers cited a lack of familiarity as their reason for not using this feature. It is possible
that when providers became more familiar with the feature, that they would use it more
readily and adjust their work process.
Although we found that providers notes were more detailed when they returned to the
pod and iterated on their notes, we cannot claim that these notes were more effective for
patient care or for other providers. Providers explained that they found detailed narratives
of previous visits made it easier to see a patient, which suggested that the notes crafted by
providers returning to the pod and iterating were more useful. Additional research into the
readability and usability of notes created by providers following different work patterns
would be required to verify this hypothesis.
We studied only a single EMR system at a single primary care facility. It is probable
that other facilities would have different workflows and operational attributes. We cannot
extend our findings with regard to the usability of the EMR system to other EMR systems
without seeing those systems. We propose that, because many EMR systems are based on
database-centric administrative systems, many of the same problems may exist in these
systems.
3. Recommendations
We suggested that EMR systems need to be reimagined from the point of view of the
users, the medical professionals utilizing the system. Reinventing the EMR will require
additional research on the needs of providers across different facilities. This process
will take time but will yield more effective systems than adding additional layers of
functionality on top of already problematic software. In the meantime, we suggest that
providers document in their office spaces and seek to capture as much information about
the patient as possible with the tools at their disposal. We also suggest facilities utilize
additional staff to offload administrative tasks, such as billing, from providers, so they

9. CONCLUSION 54
can focus on working with patients. Additional staff could also support scanning paper
artifacts into the system to improve continuity of care for patients.

AAcronyms
• EHR - Electronic Health Record
• EMR - Electronic Medical Record
• MD - Medical Doctor
• NP - Nurse Practitioner
• MA - Medical Assistant
• SOAP Note - A note used for documenting almost all patient encounters broken
into the sections: Subjective, Objective, Assessment, Plan
• OV level - Office Visit level, referring to the tier of treatment that the facility can
bill a patient based on the interaction with the provider
55

BCognitive Walkthrough Raw Results
56

Steps for Medical Assistant Tasks
Task 1: Set Patient As Admitted
Return to the Home Screen Match to intent – The MA was just working on the patients record and SOAP note for intake, why wouldn’t the next step be in the same place instead of going back several levels
Refresh Home Screen Match to intent – The system can be unreliable in refreshing information on the home screen, in order to ensure the most recent information. The user will make the assumption most times that the information is updated and not think about this step.
Right click on Patient Listing Visibility – Users may not think of, or have prior experience with, a right click menu. There is no indicator that a right click will bring up the menu that allows the completion of the task
Click on Admitted from Right-Click Menu
None
Task 2: Complete Patient Intake with SOAP Note
Check for Patient Completed Templates in “All Notes”
Match to intent – The patient completed templates should be accessible from the places the MA will already be intending to go. Not in an additional location.
Lock Patient Completed Templates
Visibility – This list of notes contains all the notes associated with this patient for all time, so it is difficult to find the specific templates that are created by the patient for this specific visit. Match to intent – The lock action is typically associated with work completed by the individual. This template was not completed by the MA, yet they have to lock.
Open New SOAP Note Visibility/Labeling – The “SOAP Note” icon is in the upper right corner of the left navigation bar. It is hard to tell that the left navigation bar control items are actually clickable buttons at first. The left navigation bar is too crowded.
Add Patient Completed Template to SOAP Note
Match to intent – The user already reviewed this template, what would indicate they had more to do with this template, especially after locking it, which is typically a final action on an item. Visibility – The MA must already know ahead of time that the patient completed template can be found in the Subjective template dropdown. Labeling - There is no separate control for adding a patient template. There is no clear indication that a template in the list is completed by the patient, except by the fact that certain templates are typically completed by patients.
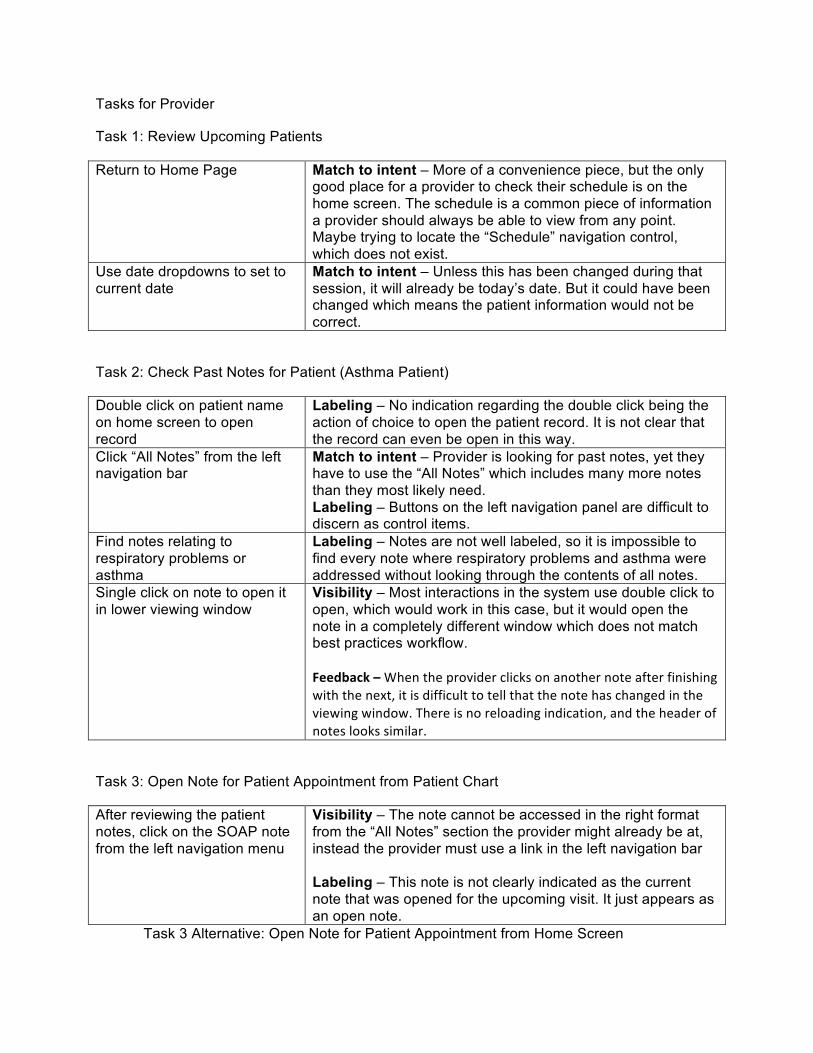
Tasks for Provider
Task 1: Review Upcoming Patients
Return to Home Page Match to intent – More of a convenience piece, but the only good place for a provider to check their schedule is on the home screen. The schedule is a common piece of information a provider should always be able to view from any point. Maybe trying to locate the “Schedule” navigation control, which does not exist.
Use date dropdowns to set to current date
Match to intent – Unless this has been changed during that session, it will already be today’s date. But it could have been changed which means the patient information would not be correct.
Task 2: Check Past Notes for Patient (Asthma Patient)
Double click on patient name on home screen to open record
Labeling – No indication regarding the double click being the action of choice to open the patient record. It is not clear that the record can even be open in this way.
Click “All Notes” from the left navigation bar
Match to intent – Provider is looking for past notes, yet they have to use the “All Notes” which includes many more notes than they most likely need. Labeling – Buttons on the left navigation panel are difficult to discern as control items.
Find notes relating to respiratory problems or asthma
Labeling – Notes are not well labeled, so it is impossible to find every note where respiratory problems and asthma were addressed without looking through the contents of all notes.
Single click on note to open it in lower viewing window
Visibility – Most interactions in the system use double click to open, which would work in this case, but it would open the note in a completely different window which does not match best practices workflow. Feedback – When the provider clicks on another note after finishing with the next, it is difficult to tell that the note has changed in the viewing window. There is no reloading indication, and the header of notes looks similar.
Task 3: Open Note for Patient Appointment from Patient Chart
After reviewing the patient notes, click on the SOAP note from the left navigation menu
Visibility – The note cannot be accessed in the right format from the “All Notes” section the provider might already be at, instead the provider must use a link in the left navigation bar Labeling – This note is not clearly indicated as the current note that was opened for the upcoming visit. It just appears as an open note.
Task 3 Alternative: Open Note for Patient Appointment from Home Screen

Double click on note in lower (pending items) section of home screen
Visibility – The note being the control is not clear, and the double click action is not clear either. Feedback – The provider is not at the note yet, and there is no indication of the next step to get the note open.
Provider clicks on the SOAP note from the “Open Notes” section of left navigation menu
Match to intent – The provider clicks on the note from the home screen, yet the note did not launch, instead another step is taken. Why open the note again to actually get the note? Labeling – May be difficult to find the correct note, if there are multiple notes. There is no labeling indicating this as the note for the visit that the provider should use.
Task 4: Enter Subjective Data for Patient Visit
Review patient completed subjective template
Visibility – The template listing for the subjective section is above the subjective heading so it is not clear that these are the subjective templates
Type information gathered from patient into “Narrative” box of “Subjective” section
Feedback – After typing into the field the provider does not complete any actions, there is no submit for this section, or lock for this section.
Task 5: Enter Objective Data for Patient Visit (Throat, cough, nasal congestion)
Select “MC – A Basic Illness Exam” from Template dropdown next to “Objective” heading
Match to intent – Provider is simply trying to get information into the document, may not think of template as a way to do this effectively, more obvious to just type Labeling – Many templates to look through, and many descriptors may not be clearly identifying the control as the one the provider is looking for Feedback – After selecting the template nothing occurs. The next step is required before anything actually happens.
Click the plus icon next to the dropdown
Labeling – Not clear that this icon adds the template to the note, looks more like a click to see more options
Click Checkbox next to “Well Developed, well nourished, A&O, NAD” for “General Appearance”
Labeling – (This feedback on this set of template questions is he same for the rest of the questions in this template in the rows below) There are too many options for these templates for providers to complete. Some of the options are replicated. “Warm and dry, no lesions, no rashes” as well as “No lesions”, “No rashes”, “Warm and dry” are all options that can be selected. This makes the template excessively long, and more difficult to read; Abbreviations found throughout the template make it difficult to quickly figure out which options to select, some providers might not use the same abbreviation, which destroys extensibility.
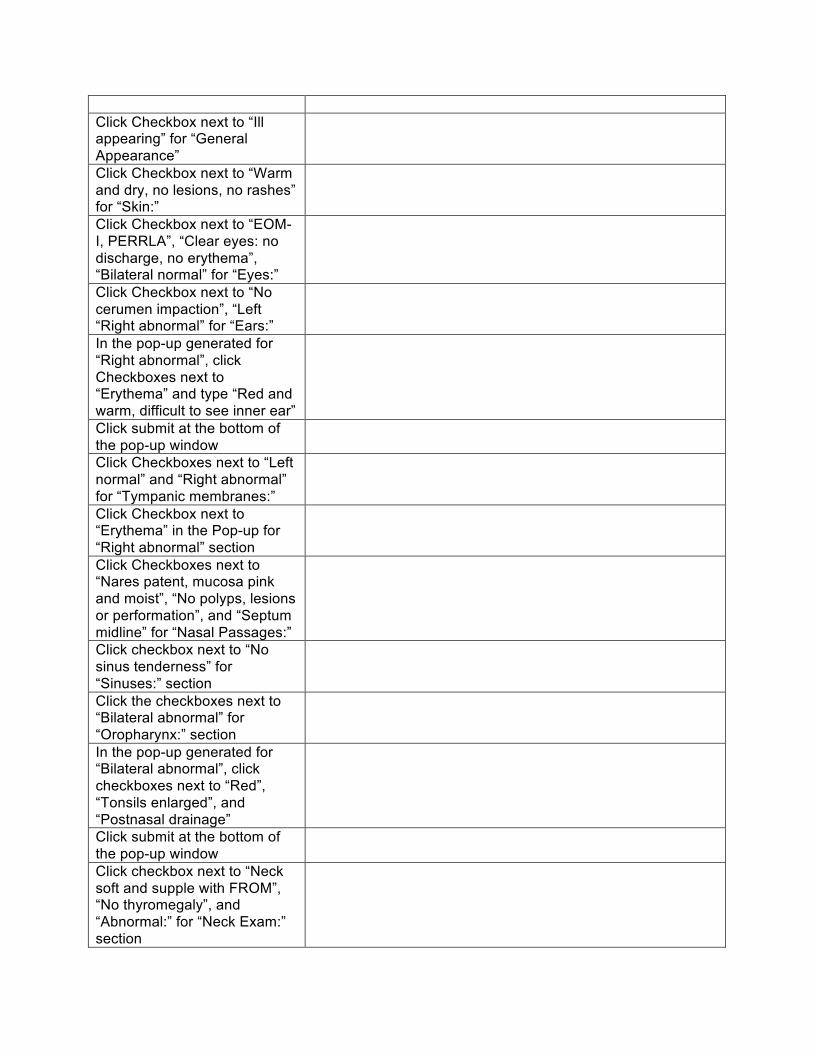
Click Checkbox next to “Ill appearing” for “General Appearance”
Click Checkbox next to “Warm and dry, no lesions, no rashes” for “Skin:”
Click Checkbox next to “EOM-I, PERRLA”, “Clear eyes: no discharge, no erythema”, “Bilateral normal” for “Eyes:”
Click Checkbox next to “No cerumen impaction”, “Left “Right abnormal” for “Ears:”
In the pop-up generated for “Right abnormal”, click Checkboxes next to “Erythema” and type “Red and warm, difficult to see inner ear”
Click submit at the bottom of the pop-up window
Click Checkboxes next to “Left normal” and “Right abnormal” for “Tympanic membranes:”
Click Checkbox next to “Erythema” in the Pop-up for “Right abnormal” section
Click Checkboxes next to “Nares patent, mucosa pink and moist”, “No polyps, lesions or performation”, and “Septum midline” for “Nasal Passages:”
Click checkbox next to “No sinus tenderness” for “Sinuses:” section
Click the checkboxes next to “Bilateral abnormal” for “Oropharynx:” section
In the pop-up generated for “Bilateral abnormal”, click checkboxes next to “Red”, “Tonsils enlarged”, and “Postnasal drainage”
Click submit at the bottom of the pop-up window
Click checkbox next to “Neck soft and supple with FROM”, “No thyromegaly”, and “Abnormal:” for “Neck Exam:” section

In the pop-up generated for “Abnormal:” click checkbox next to “Adenopathy”
Click submit at the bottom of the pop-up
Click checkboxes next to “Respirations are even and unlabored, CBTA, Good ait entry” and “Abnormal:” for the “Lungs:” section
In the pop-up generated for “Abnormal:”, provider clicks checkbox next to “Strong retching cough”
Click submit at the bottom of the pop-up
Click checkboxes next to “Regular rate and rhythm” and “S1, S2 without murmurs, rubs or gallops” for the “Heart:” section
Click checkboxes next to “Active bowel sounds throughout”, “Soft and nontender without rebound or guarding” for the “Abdomen:” section
In the text input box labeled “Other narrative:”, provider types information about cough and throat.
Match to intent – Provider is using this template to quickly click through and complete documentation, not intending to add text. There is also a narrative outside of the template that is used by most providers, do not need double.
Provider hits “Submit” at the bottom of the template
Task 6: Enter Diagnosis (Swelling and Ankle Pain, Heartburn)
Uses dropdown labeled “Dx Groups” to select “MskFractur”
Labeling – Title may lead user to think that the menu will allow the addition of an entire group of diagnosis. Feedback – After clicking on the desired dx group, the name is populated in the dropdown, but nothing else changes Visibility – There are a lot of diagnosis groups from the list of diagnosis groups, which makes it hard to find them. Labeling – There are several diagnosis groups that begin the “Msk” which makes it hard to determine the exact type of grouping the provider might want
Click plus icon to launch a Match to intent – After already selecting from a dropdown,

selection pop-up not clear that this very small icon is required to actually launch the selection menu
Click checkboxes next to “FX ANKLE LATERAL MALLEOLUS” and “STRESS FX METATARSALS” from list
Visibility – The list is not well sorted, and it becomes difficult to find the different diagnosis one would want from the long list. One may expect alphabetical or a body systems approach but there is no sorting.
Click “OK” at bottom of pop-up Uses dropdown labeled “Dx Groups” to select “PAIN”
See dropdown usage in first step. Match to intent – Why would the provider need to go to another diagnosis group to find the pain option. Most fractures are painful so why is this option not found there? Provider may skip adding this diagnosis.
Click plus icon to launch a selection pop-up
Click checkbox next to “PAIN JOIN ANKLE/FOOT” from list
Click “OK” at bottom of pop-up Type “reflux” into the “Dx Groups” field “4.” and hit return
Match to intent – Other menus have dropdowns to add, this however is an empty text field with no prompt to type a keyword in order to get a listing of diagnosis. Feedback - After typing there is no response from the system, no preview of results, only after hitting return is this available. Labeling – Typing gerd, gastro, acid, or other tag words would not retrieve the right code, so it is up to the provider to know to type those exact words.
Click code “53081” with label “Esophageal Reflux”
Clicks box with green check mark once to switch it to display a question mark
Labeling - It is not clear that this is a control. Even if the provider knew this was a control, how would they know what each of the two settings meant without any clarification or labeling. A question mark and a green check mark could mean anything.
Type details to support diagnosis in “Narrative” field within the “Assessment” section
Visibility – Difficult to determine if this free-text field is for the assessment section, since the section heading is not obviously associated with this
Task 7: Check “up to date” database for practical guidelines
Type “up” into “Procedures” field of “Plan” section
Match to intent – No reason to think a provider would type into the procedures field to get clinical support information
Hit return Feedback – As soon as the provider hits return the system sits there for several moments while launching the web browser pointed at the website but at first no reaction from
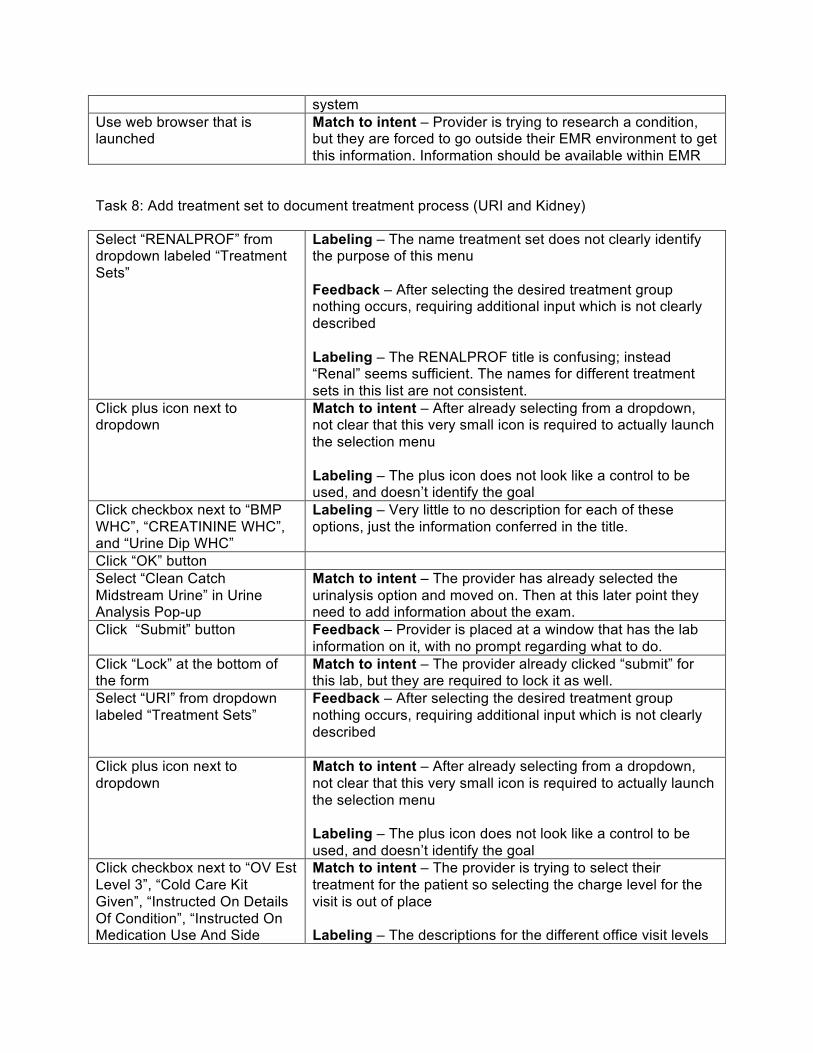
system Use web browser that is launched
Match to intent – Provider is trying to research a condition, but they are forced to go outside their EMR environment to get this information. Information should be available within EMR
Task 8: Add treatment set to document treatment process (URI and Kidney)
Select “RENALPROF” from dropdown labeled “Treatment Sets”
Labeling – The name treatment set does not clearly identify the purpose of this menu Feedback – After selecting the desired treatment group nothing occurs, requiring additional input which is not clearly described Labeling – The RENALPROF title is confusing; instead “Renal” seems sufficient. The names for different treatment sets in this list are not consistent.
Click plus icon next to dropdown
Match to intent – After already selecting from a dropdown, not clear that this very small icon is required to actually launch the selection menu Labeling – The plus icon does not look like a control to be used, and doesn’t identify the goal
Click checkbox next to “BMP WHC”, “CREATININE WHC”, and “Urine Dip WHC”
Labeling – Very little to no description for each of these options, just the information conferred in the title.
Click “OK” button Select “Clean Catch Midstream Urine” in Urine Analysis Pop-up
Match to intent – The provider has already selected the urinalysis option and moved on. Then at this later point they need to add information about the exam.
Click “Submit” button Feedback – Provider is placed at a window that has the lab information on it, with no prompt regarding what to do.
Click “Lock” at the bottom of the form
Match to intent – The provider already clicked “submit” for this lab, but they are required to lock it as well.
Select “URI” from dropdown labeled “Treatment Sets”
Feedback – After selecting the desired treatment group nothing occurs, requiring additional input which is not clearly described
Click plus icon next to dropdown
Match to intent – After already selecting from a dropdown, not clear that this very small icon is required to actually launch the selection menu Labeling – The plus icon does not look like a control to be used, and doesn’t identify the goal
Click checkbox next to “OV Est Level 3”, “Cold Care Kit Given”, “Instructed On Details Of Condition”, “Instructed On Medication Use And Side
Match to intent – The provider is trying to select their treatment for the patient so selecting the charge level for the visit is out of place Labeling – The descriptions for the different office visit levels
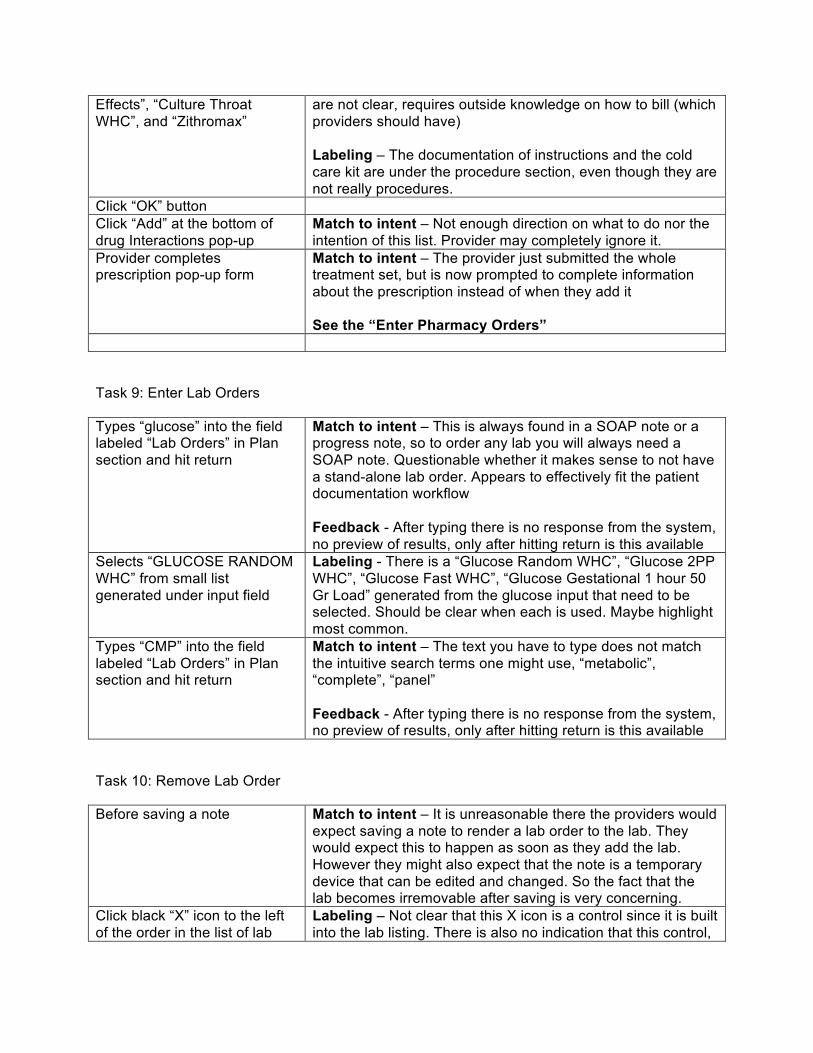
Effects”, “Culture Throat WHC”, and “Zithromax”
are not clear, requires outside knowledge on how to bill (which providers should have) Labeling – The documentation of instructions and the cold care kit are under the procedure section, even though they are not really procedures.
Click “OK” button Click “Add” at the bottom of drug Interactions pop-up
Match to intent – Not enough direction on what to do nor the intention of this list. Provider may completely ignore it.
Provider completes prescription pop-up form
Match to intent – The provider just submitted the whole treatment set, but is now prompted to complete information about the prescription instead of when they add it See the “Enter Pharmacy Orders”
Task 9: Enter Lab Orders
Types “glucose” into the field labeled “Lab Orders” in Plan section and hit return
Match to intent – This is always found in a SOAP note or a progress note, so to order any lab you will always need a SOAP note. Questionable whether it makes sense to not have a stand-alone lab order. Appears to effectively fit the patient documentation workflow Feedback - After typing there is no response from the system, no preview of results, only after hitting return is this available
Selects “GLUCOSE RANDOM WHC” from small list generated under input field
Labeling - There is a “Glucose Random WHC”, “Glucose 2PP WHC”, “Glucose Fast WHC”, “Glucose Gestational 1 hour 50 Gr Load” generated from the glucose input that need to be selected. Should be clear when each is used. Maybe highlight most common.
Types “CMP” into the field labeled “Lab Orders” in Plan section and hit return
Match to intent – The text you have to type does not match the intuitive search terms one might use, “metabolic”, “complete”, “panel” Feedback - After typing there is no response from the system, no preview of results, only after hitting return is this available
Task 10: Remove Lab Order
Before saving a note Match to intent – It is unreasonable there the providers would expect saving a note to render a lab order to the lab. They would expect this to happen as soon as they add the lab. However they might also expect that the note is a temporary device that can be edited and changed. So the fact that the lab becomes irremovable after saving is very concerning.
Click black “X” icon to the left of the order in the list of lab
Labeling – Not clear that this X icon is a control since it is built into the lab listing. There is also no indication that this control,

orders would be used to delete.
Task 11: Enter Radiology Order (Ankle and Ribs)
Type “ankle” into text input field labeled “Radiology Orders” and hit return
Match to intent – No guidance on using the text input field to find orders to add. No indication to just type and hit return to add.
Type “ribs” into the field labeled “Radiology Orders” and hits enter.
From the list generated they click “Ribs Bilateral W/Pa Chest Min 4 Views”
Visibility - The descriptions of the three options for rib x-rays go outside the view because the space allocated for descriptions is small. This means that they have to either resize the window, or hover over the name if they notice this is an option.
Task 12: Enter Pharmacy Order (Acid Reflux)
In the text input field next to the “Pharmacy Orders” heading the provider types “nexium” and hits return
From the list generated select “Nexium 40mg DR Cap”
Click on the “Severity” heading in the “Medication Interactions” pop-up to move most important interactions to top, then review list by scrolling through
Match to intent - More importantly; the list is sorted from least severe to most severe. The severe interactions and by far the most important to concern with, so it should be sorted in that way. The provider would not think to sort by severity, and may never think to scroll down to see the severe interactions. Visibility – There are so many medication interactions for most medications that it is difficult to find the truly important interactions
Click “Add” at bottom of interactions menu
Select “Oral” from route dropdown
Match to intent - However there is no reason to think this should be done at all. There is only one-way to take this medication, why do I have to sort through a list to find the route?
Select 1 Times per day” from “Freq” dropdown
Visibility - The list is really long, with no reasonable sorting methodology Labeling - There are several different spellings, capitalization patterns, and formulas that are actually the same thing. How is the provider to know which of these is the correct one? Feedback - after selecting one of the options it gets put into the field, but nothing changes with the prescription itself. It

does not get propagated to the prescription as a whole, it is still only the freq.
Types “30” into the “Dispense” field
Visibility - This control is at the bottom of the screen, and to be honest doesn’t look like it is even a part of the RX. Labeling - On top of that, there is not enough description to know this is where you put the quantity of the medication to be dispensed, no indication to put a number here. Also there are up and down controls, so the provider may think they need to use those to input the number, when in truth then can quickly type the number into the field.
Types “Capsule” into the “UOM”
Match to intent - There is little reason to think to set the unit of measure for a medication, especially when it only comes in pill form. The majority of meds only come in one form. Visibility - The field is at the bottom and difficult to find Labeling - The dropdown is labeled UOM – not a very good acronym, many people may ignore it
Uses arrow controls to set # of refills to 3
Visibility - This is mainly problematic because refills are very common in prescriptions yet it is in the furthest most obscure corner of this screen. Labeling - It is also just a simple check box at first which may make providers think that it is not the control they are looking for at first. Once the box is checked the other fields become visible and it is pretty clear at that point.
Uses dropdown calendar to set the expiration date a year from today
Click “OK” at bottom of prescription form
An additional problem across the entire pharmacy screen, is
that there seems to be no method to the listing of information. The actual prescription information is towards the bottom of the screen and there are plenty of other fields that look like fields to be completed for the prescription itself. There is a large field for the favorites, and a large field for the allergies and current meds in the center. These should be on the sides and the pharmacy form itself should be centered. There should probably be a complete prescription form that has all of the pieces (route, freq, desc, dispense, UOM) in one place so the provider can see the complete version of the rx as they built it, and can review it as a whole to ensure it is all together.
Task 13: Enter Referral (Allergy)
Types “allergy” into the field Labeling – Potentially difficult to find if you type the wrong

labeled “Referrals” in the “Plan” section and hits return
seeding phrase. Immunology may not actually give you the same.
Clicks on the option labeled “Allergy and Immunology Out” with the code “AllergyImm”
Labeling – There is more than one allergy/immunology option listed in the table, they seem like a replica but makes it confusing.
Checks the fields for first name, last name and SID to ensure they are correct
Types working diagnosis into “Diagnosis” section
Match to intent – There most likely was already a working diagnosis assigned to this patient, why can’t that be auto populated like name
Select “Allergy and Immunology” from “Speciality referred to:” dropdown
Match to intent – Provider clicked on the allergy and immunology referral at the beginning, why do they need to select it again?
Selects “Referral Start Date” from calendar dropdown if different from today
Selects “”Consult and treat” from dropdown labeled “Referral services requested:”
Labeling – The prompt for this control is not clear what it accomplishes without looking at options in the dropdown.
Types additional details into “Comments:” field
Clicks “Lock” button at bottom of referral
Match to intent – Why would a provider think to lock a small piece of their note, typically locking is more relevant to the overall note.
Clicks “Close” button at bottom of referral
Match to intent – Locking would end the ability to work on the note, so it is no use to remain open. Should either lock or close.
Task 14: Add a pharmacy order to quick list (Nexium)
In the text input field next to the “Pharmacy Orders” heading the provider types “nexium” and hits return
Match to intent – Provider is required to open up a note, just to be able to set his or her own system setting. There should be a menu for changing settings separate from the workflow of documenting a patient.
From the list generated select “Nexium 40mg DR Cap”
Complete pharmacy order as normal
See Task 12: Enter Pharmacy Order
Cicks the “Set Rx Default” buutton
Labeling - This control label is not indicative of its purpose, it does not make it clear that this will add it to the favorites list. It may be mistaken for using the default or the name default will make them think that it will make it a default for all providers which would break it for other people
Click “Cancel” at the bottom of the Pharmacy window
Feedback – After hitting the “Set Rx Default” button the provider gets no feedback. There is no way to know at this point they should just cancel the order and then get rid of the note.
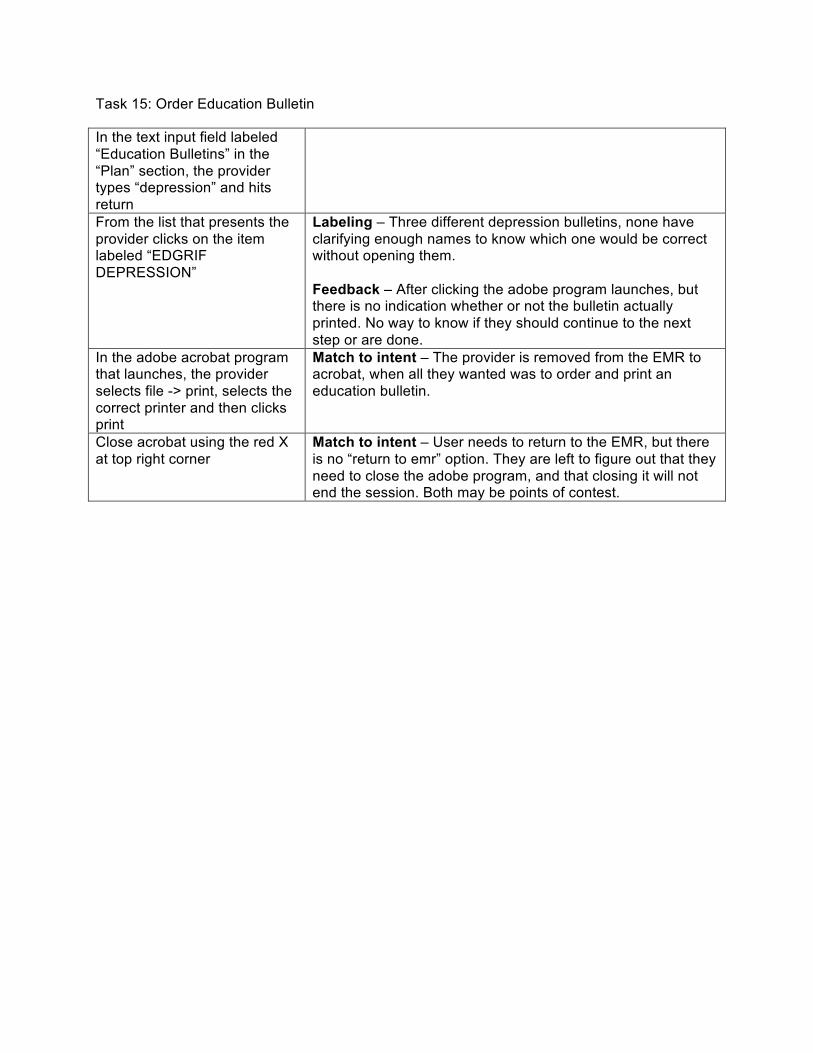
Task 15: Order Education Bulletin
In the text input field labeled “Education Bulletins” in the “Plan” section, the provider types “depression” and hits return
From the list that presents the provider clicks on the item labeled “EDGRIF DEPRESSION”
Labeling – Three different depression bulletins, none have clarifying enough names to know which one would be correct without opening them. Feedback – After clicking the adobe program launches, but there is no indication whether or not the bulletin actually printed. No way to know if they should continue to the next step or are done.
In the adobe acrobat program that launches, the provider selects file -> print, selects the correct printer and then clicks print
Match to intent – The provider is removed from the EMR to acrobat, when all they wanted was to order and print an education bulletin.
Close acrobat using the red X at top right corner
Match to intent – User needs to return to the EMR, but there is no “return to emr” option. They are left to figure out that they need to close the adobe program, and that closing it will not end the session. Both may be points of contest.
Bibliography
[1] Tams analyzer. http://tamsys.sourceforge.net/.
[2] A. Alapetite, H. Bojeandersen, and M. Hertzum. Acceptance of speech recognition by
physicians: A survey of expectations, experiences, and social influence. International
Journal of Human-Computer Studies, 67(1):36–49, January 2009.
[3] G. J. Arvary. The limited use of digital ink in the private-sector primary care
physician’s office. Journal of the American Medical Informatics Association : JAMIA,
6(2):134–142, 1999.
[4] J. E. Bardram. Activity-based computing for medical work in hospitals. ACM Trans.
Comput.-Hum. Interact., 16(2):1–36, 2009.
[5] T. Brinck and G. York. User interfaces for computer-based patient records. In CHI ’98:
CHI 98 conference summary on Human factors in computing systems, pages 214+, New
York, NY, USA, 1998. ACM.
[6] W. Chan. Increasing the success of physician order entry through human factors
engineering. Journal of healthcare information management : JHIM, 16(1):71–79, 2002.
[7] Y. Chen. Documenting transitional information in emr. In CHI ’10: Proceedings of the
28th international conference on Human factors in computing systems, pages 1787–1796,
New York, NY, USA, 2010. ACM.
[8] E. G. Devine, S. A. Gaehde, and A. C. Curtis. Comparative evaluation of three
continuous speech recognition software packages in the generation of medical
reports. Journal of the American Medical Informatics Association : JAMIA, 7(5):462–468,
69

Bibliography 70
2000.
[9] R. B. Elson and D. P. Connelly. The impact of anticipatory patient data displays on
physician decision making: a pilot study. Proceedings : a conference of the American
Medical Informatics Association / ... AMIA Annual Fall Symposium. AMIA Fall Symposium,
pages 233–237, 1997.
[10] D. J. Essin and T. L. Lincoln. Healthcare information architecture: elements of a new
paradigm. In NSPW ’94: Proceedings of the 1994 workshop on New security paradigms,
pages 32–41, Los Alamitos, CA, USA, 1994. IEEE Computer Society Press.
[11] D. Forsythe. Expanding the concept of medical information: An observational study
of physicians’ information needs. Computers and Biomedical Research, 25(2):181–200,
April 1992.
[12] M. S. Granlien and M. Hertzum. Implementing new ways of working: interventions
and their effect on the use of an electronic medication record. In GROUP ’09:
Proceedings of the ACM 2009 international conference on Supporting group work, pages
321–330, New York, NY, USA, 2009. ACM.
[13] I. S. Kohane, P. Greenspun, J. Fackler, C. Cimino, and P. Szolovits. Building national
electronic medical record systems via the world wide web. Journal of the American
Medical Informatics Association : JAMIA, 3(3):191–207, 1996.
[14] M. Linzer, L. B. B. Manwell, E. S. Williams, J. A. Bobula, R. L. Brown, A. B. Varkey,
B. Man, J. E. McMurray, A. Maguire, B. Horner-Ibler, M. D. Schwartz, and MEMO
(Minimizing Error, Maximizing Outcome) Investigators. Working conditions in
primary care: physician reactions and care quality. Annals of internal medicine, 151(1),
July 2009.
[15] J.-T. Lium, H. Lærum, T. Schulz, and A. Faxvaag. From the front line, report from a
near paperless hospital: Mixed reception among health care professionals. Journal of
the American Medical Informatics Association, 13::668–675, November 2006.
[16] H. Miller-Jacobs and J. Smelcer. Usability of electronic medical record system:
An application in its infancy with a crying need. In M. Smith and G. Salvendy,
editors, Human Interface and the Management of Information. Interacting in Information

Bibliography 71
Environments, volume 4558 of Lecture Notes in Computer Science, chapter 83, pages 759–
765–765. Springer Berlin / Heidelberg, Berlin, Heidelberg, 2007.
[17] Y. Nisanbayev, H. Na, D. Lim, and F. Ko. Designing an electronic medical records
system using design patterns. In ICIS ’09: Proceedings of the 2nd International Conference
on Interaction Sciences, pages 1410–1415, New York, NY, USA, 2009. ACM.
[18] L. Pizziferri, A. F. Kittler, L. A. Volk, M. M. Honour, S. Gupta, S. Wang, T. Wang,
M. Lippincott, Q. Li, and D. W. Bates. Primary care physician time utilization before
and after implementation of an electronic health record: a time-motion study. J. of
Biomedical Informatics, 38(3):176–188, June 2005.
[19] C. Plaisant, R. Mushlin, A. Snyder, J. Li, D. Heller, and B. Shneiderman. Lifelines:
using visualization to enhance navigation and analysis of patient records. Proceedings
/ AMIA ... Annual Symposium. AMIA Symposium, pages 76–80, 1998.
[20] P. G. Polson, C. Lewis, J. Rieman, and C. Wharton. Cognitive walkthroughs: a method
for theory-based evaluation of user interfaces. Int. J. Man-Mach. Stud., 36:741–773,
May 1992.
[21] G. Samoutis, E. S. Soteriades, D. K. Kounalakis, T. Zachariadou, A. Philalithis, and
C. Lionis. Implementation of an electronic medical record system in previously
computer-naive primary care centres: a pilot study from cyprus. Informatics in Primary
Care, 15(4):207–216, January 2008.
[22] K. A. Siek, D. U. Khan, and S. E. Ross. A usability inspection of medication
management in three personal health applications. In HCD 09: Proceedings of the 1st
International Conference on Human Centered Design, pages 129–138, Berlin, Heidelberg,
2009. Springer-Verlag.
[23] P. C. Smith, R. Araya-Guerra, C. Bublitz, B. Parnes, L. M. Dickinson, R. Van Vorst,
J. M. Westfall, and W. D. Pace. Missing clinical information during primary care visits.
JAMA, 293(5):565–571, February 2005.
[24] A. Taddei, C. Carpeggiani, M. Emdin, R. Balocchi, S. Dalmiani, G. Cecchetti,
A. Macerata, D. Pierotti, and C. Marchesi. Development of an electronic medical
record for patient care in cardiology. pages 641–644, 1997.
Bibliography 72
[25] P. C. Tang, M. A. Jaworski, C. A. Fellencer, M. P. LaRosa, J. M. Lassa, P. Lipsey,
and W. C. Marquardt. Methods for assessing information needs of clinicians in
ambulatory care. Proceedings / the ... Annual Symposium on Computer Application [sic] in
Medical Care. Symposium on Computer Applications in Medical Care, pages 630–634, 1995.
[26] H. Tange, A. Hasman, P. Devriesrobbe, and H. Schouten. Medical narratives in
electronic medical records. International Journal of Medical Informatics, 46(1):7–29,
August 1997.
[27] K. T. Unruh, M. Skeels, A. C. Hartzler, and W. Pratt. Transforming clinic environments
into information workspaces for patients. In CHI ’10: Proceedings of the 28th
international conference on Human factors in computing systems, pages 183–192, New
York, NY, USA, 2010. ACM.
[28] J. Walker, E. Pan, D. Johnston, J. Adler-Milstein, D. W. Bates, and B. Middleton. The
value of health care information exchange and interoperability. Health Aff, pages
hlthaff.w5.10+, January 2005.
[29] S. H. Walsh. The clinician’s perspective on electronic health records and how they can
affect patient care. BMJ (Clinical research ed.), 328(7449):1184–1187, May 2004.
[30] L. Wilcox, J. Lu, J. Lai, S. Feiner, and D. Jordan. Physician-driven management of
patient progress notes in an intensive care unit. In CHI ’10: Proceedings of the 28th
international conference on Human factors in computing systems, pages 1879–1888, New
York, NY, USA, 2010. ACM.
[31] A. S. Young, E. Chaney, R. Shoai, L. Bonner, A. N. Cohen, B. Doebbeling, D. Dorr,
M. K. Goldstein, E. Kerr, P. Nichol, and R. Perrin. Information technology to support
improved care for chronic illness. Journal of general internal medicine, 22 Suppl 3(0):425–
430, December 2007.
[32] Q. Zeng and J. J. Cimino. Providing multiple views to meet physician information
needs. Hawaii International Conference on System Sciences, 5:5006+, 2000.
[33] K. Zheng, R. Padman, M. P. Johnson, and H. S. Diamond. An interface-driven analysis
of user interactions with an electronic health records system. Journal of the American
Medical Informatics Association, 16(2):228–237, March 2009.

Bibliography 73
[34] X. Zhou, M. S. Ackerman, and K. Zheng. Doctors and psychosocial information:
records and reuse in inpatient care. In CHI ’10: Proceedings of the 28th international
conference on Human factors in computing systems, pages 1767–1776, New York, NY,
USA, 2010. ACM.