documentation of gtap-eucalc interface and design of gtap
TRANSCRIPT

This project has received funding from the European Union’s Horizon 2020 research and innovation programme under grant agreement No 730459.
Documentation of GTAP-EUCalc
interface and design of GTAP scenarios _________
D7.2
October/2018

D7.2
2
Project Acronym and Name
EU Calculator: trade-offs and pathways towards sustainable and low-carbon European Societies - EUCalc
Grant Agreement
Number
730459
Document Type Report
Work Package WP7
Document Title Documentation of GTAP-EUCalc interface and design of
GTAP scenarios
Main authors Gino Baudry, Francesco Clora, Onesmus Mwabonje, Boris Thurm, Jeremy Woods, Wusheng Yu
Partner in charge Imperial College London
Contributing partners
University of Copenhagen, École Polytechnique Fédérale de Lausanne
Release date July 2018
Distribution Public/Confidential All involved authors and co-authors agreed on the
publication.
Short Description
This deliverable lays out the key challenges in linking the EUCalc CORE modules and GTAP to translate the lever settings into compatible data to generate a set
of perturbations/shocks mimicking the EUCalc pathways at the aggregated GTAP sectoral classifications, in the objective of facilitating the computation of the trans-boundary impacts.
Quality check
Name of reviewer Date
Marc Vielle (EPFL) 22.08.2018
Luis Costa (PIK) 3.09.2018
Statement of originality:
This deliverable contains original unpublished work except where clearly indicated
otherwise. Acknowledgement of previously published material and of the work of others
has been made through appropriate citation, quotation or both.

D7.2
3
Table of Contents
1 Executive Summary ............................................................................ 6
2 Introduction ....................................................................................... 7
3 The GTAP model and database ......................................................... 10
4 Conceptual design for the EUCalc-GTAP interface ............................ 11 4.1 Lifestyles (WP1) ............................................................................... 12 4.2 Buildings & Transport (WP2) .............................................................. 13 4.3 Industry (WP3) ................................................................................ 16 4.4 Agriculture, land-use, water and biodiversity (WP4) .............................. 17 4.5 Energy supply and balancing (WP5 & 8) .............................................. 20 4.6 Common variables (from WP2-5)........................................................ 21
5 Potential scenarios to be simulated .................................................. 22 5.1 Scenarios consisting of common lever settings across sectors and across EU
member states ...................................................................................... 22 5.2 Scenarios consisting of different lever settings across sectors but common across EU member states ....................................................................... 22 5.3 Scenarios consisting of deviations by specific EU member states from common EU-wide pathways .................................................................... 23
6 Conclusions ...................................................................................... 23
7 References ....................................................................................... 25
List of Tables Figure 1 –Possible EUCalc-GTAP interface for the WPs ................................... 11
Figure 2 –Possible EUCalc-GTAP interface for Lifestyles (WP1) ....................... 12
Figure 3 –Possible EUCalc-GTAP interface for Buildings (WP2) ........................ 14
Figure 4 –Possible EUCalc-GTAP interface for Transport (WP2) ....................... 15
Figure 5 –Possible EUCalc-GTAP interface for Industry (WP3) ......................... 16
Figure 6 –Possible EUCalc-GTAP interface for Agriculture (WP4) ..................... 18
Figure 7 –Possible EUCalc-GTAP interface for Energy (WP5) ........................... 20
D7.2
4
List of abbreviations atp: Air transport
b_t: Beverages and Tobacco products
c_b: Cane & Beet
CGE: Computable General Equilibrium
cmn: Communications
cmt: Cattle Meat
cns: Construction
crp: Chemical Rubber Products
ctl: Cattle
dwe: Dwellings
ele: Electronic Equipment
ely: Electricity
EUCalc: European Calculator
frs: Forestry
fsh: Fishing
GTAP: Global Trade Analysis Project
gro: Other Grains
i_s: Iron & Steel
mil: Milk dairy products
mvh: Motor vehicles and parts cars
nmm: Non-Metallic Minerals
oap: Other Animal Products
ocr: Other Crops
ofd: Other Food
ome: Other Machinery & Equipment
omt: Other Meat, meals and pellets of meat or inedible meat offal; greaves
osd: Oil Seeds
otn: Other Transport Equipment
otp: Other transport
pcr: Processed Rice
pfb: Plant Fibbers
pop: population
ppp: paper and paper products
qf: Intermediate demand of commodity

D7.2
5
qg: Government demand
qp: Private demand
rmk: Raw milk
sgr: Sugar
vol: Vegetable Oils
wht: Wheat
wol: Wool
WP: Work Package
wtp: Water transport

D7.2
6
1 Executive Summary This deliverable first lays out the key challenges in linking the EUCalc CORE
modules designed by WP1-5, for interfacing sectoral lever settings into inputs for WP7. This will then be used to formulate model scenarios in a computable general
equilibrium (CGE) modelling framework based on the GTAP (Global Trade Analysis Project) model for simulating the transboundary effects of alternative EU decarbonization pathways. This deliverable aims to provide a conceptual design of
the interface between EUCalc modules (WP1-5) and GTAP (WP7) by identifying the correspondence between lever settings and relevant CGE modelling variables for
further implementations. Given the evolving nature of module designing in WP1-5, particularly regarding levers and their associated ambition levels, as well as the clarities to be attained regarding further development of the CGE model, further
adjustments and substantiations of the design of the interface will have to be made at a later stage.
D7.2
7
2 Introduction The EUCalc project aims at assessing the impacts of decarbonisation pathways in
Europe. The goal is to design a transparent, user-friendly and tractable model, called a calculator. Each user of the calculator will be able to create his own
pathways and visualize the associated impacts by controlling a set of nearly 40 levers, to express different ambition levels regarding behaviour, technology, practices (and so on) patterns in the different sectors/countries. In line with the
Calculator Philosophy, each lever enables users selecting 4 ambition levels, ranging from the least to the most ambition effort to address climate change
issues. For instance, one may explore the current trends regarding meat consumption or, at the opposite, explore the impact of a possible rupture in behaviour, such as lowering meat consumption to fit the World Health Organisation
recommendations. The European Calculator is a trans-regional Calculator, which means that the lever setting will not only affect national patterns, but also other
countries. Keeping the previous illustration, lowering meat consumption may affect the import/export balance of meat products. WP7 computes the transboundary effects of these alternative pathways towards 2050. The main modelling tool used
for calculating the transboundary effect is a CGE model based on the GTAP modelling framework 1 . Building on GTAP and the Calculator complementary
approaches, WP7 aims at enabling EUCalc framework to consider transboundary effects by formulating pathways as model scenarios. To this end, WP7 aims at translating the EUCalc levers and ambition levels settings across WP1-5 into model
variables in line with the needs of the CGE model that is derived from the GTAP modelling framework but which is also tailored to the specific needs of the EUCalc
(WP7). Therefore, this deliverable aims to investigate the correspondence between the key variables in the various sectors covered by the EUCalc across WP1-5 (lifestyles, transport, building, industry, agriculture, energy supply) and the
variables in the GTAP-based CGE model. This constitutes the starting point for interpreting and quantifying the EUCalc lever settings as numerical perturbations
of relevant model variables in the CGE model, relative to the levels of these variables projected and implemented in the baseline scenario.
To analyse the trade and transboundary effects (i.e. import and export in monetary
terms2) of EUCalc decarbonization pathways, WP7 will adopt a modified version of the GTAP-E model, a CGE model of the global economy developed specifically to
address global trade and environmental issues, to analyse trade and transboundary flows within the EUCalc framework. Computable general equilibrium (CGE) models are a typical instrument for empirical analysis of
distributional and welfare impact of different policies (Wing, 2004; Burfisher, 2011). A CGE model measures the result of a shock to an economy (i.e.
computable), encompassing simultaneously all economic activities (consumption, production, employment, taxes, savings, trade etc.) and the linkages among them
(i.e. general), in an economy where at a given set of prices all agents are satisfied (i.e. equilibrium) (Burfisher, 2011).
1 see Hertel (1997) for the structure of the GTAP model and www.gtap.org for an overview
of the GTAP modelling framework. 2 Other simple indicators, such as energy and food security, can be derived from the import
and export results.

D7.2
8
One of the main challenges of developing this interface lies in the combination of the EUCalc and the GTAP modelling approaches. EUCalc adopts a modularized
approach in which the lever setting reflects a range of ambition levels expressed by the end-users for exploring alternative decarbonisation pathways, without imposing economic constraints and with no explicit economic optimization
behaviour of agents. The question of how and whether a particular ambition level can be realized in a social-economic setting is not emphasized in EUCalc, as its
main objective is to explore the technical and engineering possibilities. Complementary, the GTAP model, as an economic model, is built on the assumptions of optimizing consumers and producers under income and resources
constraints, enforces equilibrium conditions in both products and factor markets, and imposes consistencies in bilateral trade linkages amongst countries. As such,
seen from the perspective of the standard GTAP model, the feasible space of decarbonization choices may be considerably smaller than the engineering and technological possibilities envisioned by users of EUCalc, implying that not all user-
defined pathways are compatible with the economic model. Moreover, while the ambition of a certain carbon emission outcome may be feasible in an
engineering/technical sense, the CGE model must explicitly deal with the question regarding how such ambitions can be realized. To this end, it is necessary to distinguish exogenous and endogenous variables in CGE models. Exogenous
variables generally are policy variables that can be changed or shocked in a model simulation whereas endogenous variables are to be determined by the model itself.
Thus, the relevant variables corresponding to the sectoral variables in WP1-5 are a mixture of exogenous and endogenous variables in the chosen CGE model3. While exogenous variables can be directly perturbed in model simulations,
endogenous variables cannot be changed to predetermined levels without resorting to additional instrument variables and possible new modelling structure.
For instance, aggregated food demand in economic models are typically specified as functions of prices, income levels, and demographic variables. To realize a
particular ambition level of food demand as specified in a user-defined pathway, it would normally be necessary to assume exogenous changes in the underlying determinants of food demand, or to apply certain tax instruments or shifts in
consumer tastes/preferences.
Another challenge lies in combining the “bottom-up” engineering approach used
by the EUCalc for calculating energy demand/supply and emissions across WP1-5 and the “top-down” approach adopted in the CGE model where many of the sectoral details are suppressed (such as different energy sources and electricity
production methods). Therefore, the variable granularity will be conceptually aggregated to enable the implementation of the EUCalc variables in the GTAP.
3 To solve a CGE model such as GTAP, i.e. to find a new equilibrium in the economic system,
the number of endogenous variables must be equal to the number of equations describing
the world economy. However, in GTAP, more variables than equations are included.
Therefore, a number of variables needs to be set as exogenous, meaning that each of
these variables is either held constant throughout a simulation or assumed to change by a
certain degree (i.e. predetermined outside of the model). This leads to a shock to the
economy, and the new equilibrium situation is reached thanks to adjustment to the
endogenous variables, as regulated by the equations present in the model. The designation
of the variables in the model as either endogenous or exogenous is often called the model
closure.

D7.2
9
A third challenge can also arise from the equilibrium requirements in the CGE model where quantities of demand must be matched exactly with quantities of
total supply at equilibrium price levels. For example, for each country, domestic supply plus net imports (i.e. the difference between imports and exports) of the final outputs of each sector must be equal to the domestic demand for this product.
In the CGE framework, in addition to the market clearing which generates equilibrium quantities and prices for final outputs of each sector, such clearing
conditions must also be satisfied in the factor markets. Here, factor demand from different sectors that compete for the use of various economic resources such as labour, capital, and land must not exceed the available economic resources.
Further complicating the equilibrium requirements is the need to account for the demand and supply of intermediate inputs. To enforce these equilibrium conditions
in the CGE model, a set of market prices and factor prices are simultaneously solved for to satisfy these market-clearing conditions. The ambition levels specified in a given user-defined EUCalc pathways will change the levels and structures of
the demand and/or supply of the economy, leading to the need to rebalance demand and supply through changed price signals. In the case where a user-
selected pathway is inherently inconsistent with current or projected economic structure, feasible solutions in the CGE model may not exist or corner solutions representing non-optimum model outcomes may arise. It is also possible that the
absence of optimization behaviours under income and resources constraints by consumers and producers in EUCalc may lead to internally inconsistent pathways;
however, a “flag” mechanism in the core model has been under development to minimize such occurrence.
Finally, specific mathematical functional forms employed to characterize the
demand, supply and trade behaviours in the CGE model (as in most other economic models) also limit the extent to which large changes can be imposed on the
realized outcomes from a given scenarios/pathways envisioned by users of EUCalc. For instance, a particular ambition level set at level 3 or 4 (i.e. very high ambition)
may very well represent a drastic departure from the outcomes of current economic system. The demand and supply behaviours of the CGE model represented by demand and supply elasticities4 (or the parameters that generate
such elasticities) may be over-stretched to reproduce these ambitions. This is because typically such elasticities are estimated/calibrated to represent
responsiveness of key endogenous variables to exogenous shocks as local departures from known optimal choices. For instance, on the demand side, demand elasticities (both price and income elasticities) implied by typical demand
systems used in CGE models (and also most other simulation models) generally have limited variability relative to income and relative price shocks, thereby
limiting the model’s ability to generate large structural changes to demand patterns that may occur well into the future. On the production side, as production functions are specified around current technologies (e.g. cost shares and fuel mix
in electricity generation) and typically adopt constant elasticity of substitution among different inputs, it may also be difficult to implement envisioned future
technology shifts.
4 In economics, elasticity means the responsiveness of a variable to changes in another
variable that has a causal influence on it (e.g. the percentage change in quantity of a good
demanded, given an increase by 1% in the price of the given good)

D7.2
10
It is understandable that not all pathways chosen by users can be successfully computed in the CGE model. The above challenges will be taken into considerations
for designing the conceptual interface between WP1-5 and WP7. This does not mean that some pathways will not be simulated a priori. However, if corner solutions (or other operational impossibilities to produce a solution) arise, certain
pathways may not be included in WP7’s final computations. Conversely, there is a need to design new model structures to mitigate the limitations of the CGE model
for purposes of making it more “flexible” in both the behavioural and technological dimensions, to allow the model to better represent large structural changes envisioned in the more ambitious EUCalc pathways. Potential improvements
include preference shift parameters in the demand system so that consumer budget shares can be re-allocated according to assumed future behavioural
changes, and additional parameters in the production function to allow for shifts of cost structure.
Currently, the model is being tested with data retrieved from the Global Calculator
lever settings5. After mapping the Global Calculator sectors onto GTAP sectors, a correspondence between levers and GTAP variables is identified. The data from
each lever, then, are compared to the 2050 baseline that was formulated by Yu and Clora (2018) in Deliverable 7.1, and one of the four lever settings is chosen to be the counterfactual scenario in GTAP. Following this conceptual work, for each
lever, the remaining three settings are defined as alternative scenarios. This prototypic work is useful to further develop the GTAP-E model and to improve its
adherence to the EUCalc needs. In fact, the replication of the Global Calculator’s simulations allows us to assess GTAP-E’s resilience to major shocks, to understand the model’s bottlenecks and to design ad hoc solutions to overcome these barriers.
First, the deliverable briefly introduces the GTAP model and database, which will be used to compute the transboundary effects in the EUCalc (section 3). Second,
a conceptual design of the interface will be presented that highlights the correspondence between EUCalc and GTAP variables for each of the main sectors
contained in WP1-5 (section 4). Section 5 concludes.
3 The GTAP model and database The GTAP core consists of a database and a standard model (Hertel et al. 1997) on which multiple models have been developed. The dataset contains input-output
tables on bilateral trade flows, transport, and protection linkages across regions. The GTAP 9 database (Aguiar, Narayanan, and McDougall 2016) characterizes the world economy, with the available benchmark years being 2011, 2007 and 2004.
The dataset is projected to 2050 for the scope of the EUCalc, drawing from the work of Yu and Clora (2018) for Deliverable 7.1. It includes data on consumption,
production, trade, energy data and CO2 emissions. The GTAP 9 database is composed of 140 regions, 57 tradable commodities, and 5 non-tradable primary
factors. In other words, GTAP 9 enables WP7 to cover the spatial granularity of the EUCalc, which includes the European Union Member states, Switzerland and several aggregated world regions. Carbon dioxide emissions are displayed by
region, commodity, and use. A satellite GTAP dataset is the non-CO2 emissions database, developed by Irfanoglu and van der Mensbrugghe (2015), departing
5 Global Calculator: http://www.globalcalculator.org/

D7.2
11
from the work of Rose and Lee (2009). It includes non-CO2 emissions by regions and sectors, for the three main non-CO2 gases (i.e. CH4, N2O and a cluster
encompassing fluorinated gases (F-gases)). The GTAP9 database can be aggregated according to the study’s scope.
The standard GTAP model (Hertel et al. 1997) is a starting point for many CGE
models utilizing the GTAP database. It is a static multi-region, multi-sector, CGE model, with constant returns to scale and perfect competition. It contains
treatment of private household behaviour, global investments/savings relationship, and international trade and transport activity. It includes two types of equations. It has both accounting (identity) relationships, guaranteeing that
revenues and expenses of every agent in the economy are balanced, and behavioural equations, specifying the behaviour of optimizing agents in the
economy (Brockmeier 2001).
For the scope of EUCalc, WP7 will mainly use a modified version of the GTAP-E
model (Burniaux and Truong 2002; McDougall and Golub, 2009). It is the energy-
environmental version of the standard GTAP model. It mainly differs from the
standard GTAP because it adds an explicit capital-energy composite input into the
production structure, allowing for a degree of capital-energy substitution
(Nijkamp, Wang, and Kremers 2005). In addition, it comprises a different
treatment of energy demand, inter-fuel substitution, CO2 accounting, taxation and
emission trading (Antimiani et al. 2013).
4 Conceptual design for the EUCalc-
GTAP interface
Figure 1 presents how the lever settings can be translated into data to generate a
set of perturbations/shocks mimicking the EUCalc pathways at the aggregated GTAP sectoral classifications, in the objective of facilitating the computation of their transboundary impacts.
Figure 1 –Possible EUCalc-GTAP interface for the WPs
D7.2
12
The EUCalc modules outputs can be interpreted as:
1) Outputs by sectors, each of which corresponds to one or multiple GTAP
sectors6; 2) Intermediate consumption of a given commodity by a given sector7; 3) Private household and government sector demand for outputs by sectors,
each of which corresponds to one or multiple GTAP commodities.
Some outputs and flows may require aggregation depending on GTAP and EUCalc
modules granularity. The following sections will provide a first GTAP-EUCalc interface based on the current development stage of each module outputs and levers.
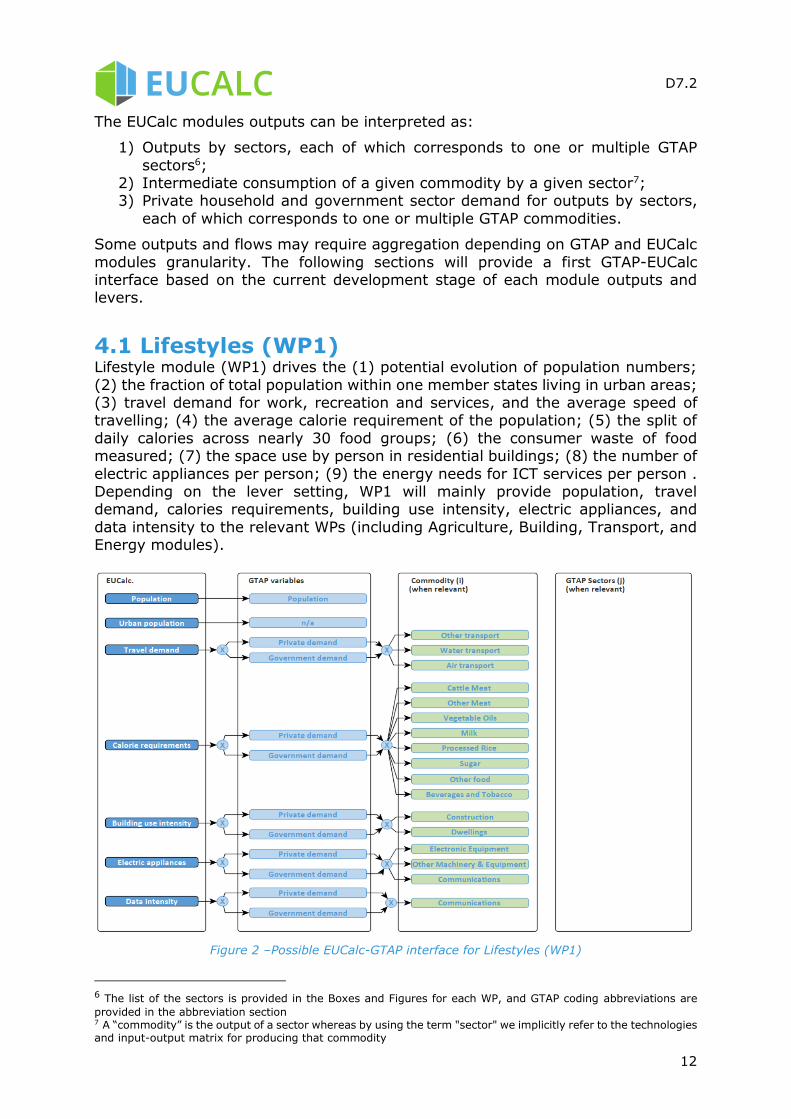
4.1 Lifestyles (WP1) Lifestyle module (WP1) drives the (1) potential evolution of population numbers;
(2) the fraction of total population within one member states living in urban areas; (3) travel demand for work, recreation and services, and the average speed of travelling; (4) the average calorie requirement of the population; (5) the split of
daily calories across nearly 30 food groups; (6) the consumer waste of food measured; (7) the space use by person in residential buildings; (8) the number of
electric appliances per person; (9) the energy needs for ICT services per person . Depending on the lever setting, WP1 will mainly provide population, travel demand, calories requirements, building use intensity, electric appliances, and
data intensity to the relevant WPs (including Agriculture, Building, Transport, and Energy modules).
Figure 2 –Possible EUCalc-GTAP interface for Lifestyles (WP1)
6 The list of the sectors is provided in the Boxes and Figures for each WP, and GTAP coding abbreviations are
provided in the abbreviation section 7 A “commodity” is the output of a sector whereas by using the term "sector" we implicitly refer to the technologies and input-output matrix for producing that commodity

D7.2
13
Figure 2 presents a possible interface to link Lifestyles features from EUCalc to
GTAP. For a higher granularity, Box 1 presents the details of the different sectors/commodities included in GTAP database. As an illustration for Figure 2, calories demand can be interpreted as private and government demand, which
correspond to multiple commodities, such as cattle meat, vegetable oils, and so on.
As observable, WP1 deals with the question on how various demand side forces (such as population, urbanization, consumer preferences and income growth)
influence travel/transportation demand, food demand, building and dwelling demand, and direct energy consumption. As these demands will drive the “supply”
side in WP2-5 (i.e. these demands will be matched on the supply side), WP7 would opt to build a storyline on the demand drivers (population, urbanization, consumer preferences and income growth) that are consistent with what is embodied in WP2-
5, rather than targeting the detailed lifestyle choices. As will be detailed later in this document, supply side variables corresponding to the lever settings in WP2-5
will be targeted in the GTAP model runs. In the presence of equilibrium conditions in the model that equate demand and supply, it would be redundant to also directly target the demand side variables. The joint impacts on emission and energy
demand from the detailed lifestyle choices would be captured by the outcomes from WP2-5 regarding emission and energy use.
Box 1 – Possible GTAP component list for Lifestyles
Travel demand - Commodities: Other transport (otp): road, rail, pipelines, auxiliary transport activities, travel agencies; Water transport (wtp); Air transport (atp);
Calorie requirements - Commodities: Cattle Meat (cmt): fresh or chilled meat and edible offal of cattle, sheep, goats, horses, asses, mules, and hinnies. raw fats or grease from any animal or bird; Other Meat (omt): pig meat and offal. preserves and preparations of meat, meat offal or blood, flours, meals and pellets of meat or inedible meat offal; greaves; Vegetable Oils: crude and refined oils; Milk (mil): dairy product; Processed Rice (pcr): rice, semi- or wholly milled; Sugar (sgr); Other Food (ofd): prepared and preserved fish or vegetables, fruit juices and vegetable juices, prepared and preserved fruit and nuts, all cereal flours, groats, meal and pellets of wheat, cereal groats, meal and pellets n.e.c., other cereal grain products (including corn flakes), other vegetable flours and meals, mixes and doughs for the preparation of bakers' wares, starches and starch products; sugars and sugar syrups n.e.c., preparations used in animal feeding, bakery products, cocoa, chocolate and sugar confectionery, macaroni, noodles, couscous and similar farinaceous products, food products n.e.c.; Beverages and Tobacco products (b_t)
Building use intensity - Commodities: Construction (cns): building houses factories offices and roads; Dwellings (dwe): ownership of dwellings, imputed rents of houses occupied by owners
Electric appliances - Commodities: Electronic Equipment (ele): office, accounting and computing machinery, radio, television and communication equipment and apparatus; Other Machinery & Equipment (ome): electrical machinery and apparatus n.e.c., medical, precision and optical instruments, watches and clocks; Communications (cmn): post and telecommunications
Data intensity - Commodities: Communications (cmn): post and telecommunications
4.2 Buildings & Transport (WP2)
As abovementioned, Lifestyles will partly drive the demand for Transport & Building sectors (WP2). Beyond the lifestyle patterns, the transport and building
sectors sector will be affected by their respective levers.
In the building module (WP2.1), levers will drive the (1) the average floor area per
person; (2) the average level of heat loss; (3) the average room temperature during warm and cold times of the year, and also control hot water demand per

D7.2
14
person per year for urban and rural populations; (4) the amount of material required to construct a building and manufacture the Heating, Ventilation and Air-
Conditioning (HVAC) systems; (5) the average rate of energy use in heating, cooling and ventilation systems; (6) the share of the different renewable energy carriers used for heating in buildings; (7) the level of heating energy demand
covered by district heating; (8) the fuels used to heat, cool and ventilate homes. It included conventional energy carriers such as gas and oil, and it also considers
the share of renewables such as biomass (wood chips, pellets). The lever setting will drive the building area construction demand, the insulation renovation demand, the appliances and infrastructures demand.
Figure 3 –Possible EUCalc-GTAP interface for Buildings (WP2)
In GTAP, the lever setting on buildings and energy use in existing buildings and
from new buildings will be characterized in the CGE model by changes in the outputs of the construction sector as well as changes in the outputs of the dwelling
sector (i.e. housing activities). The use of energy from new buildings and renovations will be captured by changes in the intermediate use of energy in the construction sector, whereas the direct consumption of energy from dwelling will
be captured by the intermediate use of energy in that sector. The implied changes in emissions from the use of energy will be captured by changes in energy use and
changes in emission intensities. As most of these variables are endogenous in the GTAP model, appropriate instrumentations will be carried out to make the changes to these variables envisioned in a scenario possible. For changes in individual
outputs or intermediate demand, detailed tax instruments either directly targeting the levels of these activities or indirectly targeting the emission outcomes of these
individual activities can be deployed. This would be the best strategy to ensure the detailed lever settings can be exactly reproduced in the GTAP model runs. Alternatively, in cases where knowledge of technical/productivity changes are
available, these latter instruments may also be used in conjunctions with the tax instruments. However, in cases/sectors where there are too many such changes
to implement, involving large set of member states and countries, it might be necessary to adopt a simplifying treatment. In such cases, we may consider the use of sector-specific carbon tax that would restrict the overall emission outcomes
of the sector (rather than the use of multiple tax instruments targeting the activity levels of final outputs and intermediate uses separately), as it is commonly done
in most economic analyses of carbon emissions. The final choices of detailed instrumentations will be decided at a later stage when data from WP1-5 are made available for designing the actual scenarios. These modelling options will also apply
to the implementation of inputs from other WPs to be detailed below.

D7.2
15
Box 2 – Possible GTAP component list for Buildings
Building construction - Sectors: Construction (cns): building houses factories offices and roads;
Building insulation - Sectors: Dwellings (dwe): ownership of dwellings, imputed rents of houses occupied by owners;
Renewable share - Sectors: Construction (cns): building houses factories offices and roads; Dwellings (dwe): ownership of dwellings, imputed rents of houses occupied by owners;
Renewable share - Commodities: Oil, gas, oil products, electricity, coal;
Fuel mix – Commodities: Oil, gas, oil products, electricity, coal. Sectors: Construction (cns): building houses factories offices and roads; Dwellings (dwe): ownership of dwellings, imputed rents of houses occupied by owners.
In the transport module, the demand will be driven by the following levers: (1) the occupancy which is expressed as number of passenger per vehicle, and only
has an impact on road vehicles; (2) the utilization rate, which is the number of kilometres travelled by a vehicle yearly; (3) the lifetime of vehicles, expressed in
total kilometres that can be travelled by a vehicle before being discarded; (4) the modal share, which describes how passenger are travelling: by car, bus, train, etc; or how goods are being transported; (5) the vehicle efficiency, expressed in MJ/km
for road vehicles and in MJ/pkm for rail, aviation and shipping; (6) the level of adoption of low emission technologies; (7) the fuel mix. The lever setting will drive
the demand for new vehicles and infrastructures, the energy demand and the level of transport activity.
Figure 4 –Possible EUCalc-GTAP interface for Transport (WP2)
Consistently with the Building module, lever settings in the transportation sector
and its energy use will be captured in the CGE model by targeting the resulted changes in the transportation service sectors in the CGE model regarding their average use of energy and the associated average emission intensities from the
use of energy. Due to the differences in granularity of the transport module in EUCalc and the transport sectors in GTAP, the exogenous shocks in GTAP will be

D7.2
16
characterized as percentage changes to the aggregated sector based on weighted averages of its sub-sectors (e.g. changes in both road and railway transport will
be mapped onto the “otp” transport sector in GTAP, based on their projected quantity share in this sector).
Box 3 – Possible GTAP component list for Transport
New vehicles (sectors): Motor vehicles and parts (mvh): cars, lorries, trailers and semi-trailers; Other Transport Equipment (otn): manufacture of other transport equipment;
Transport activity (sectors): Other transport (otp): road, rail, pipelines, auxiliary transport activities, travel agencies; Water transport (wtp); Air transport (atp);
Fuel mix (sectors): Other transport (otp): road, rail, pipelines, auxiliary transport activities, travel agencies; Water transport (wtp); Air transport (atp);
Fuel mix (commodities): Oil, gas, oil products, electricity;
Modal shares (sectors): Motor vehicles and parts (mvh): cars, lorries, trailers and semi-trailers; Other Transport Equipment (otn): manufacture of other transport equipment;
Modal shares (commodities): Other transport (otp): road, rail, pipelines, auxiliary transport activities, travel agencies; Water transport (wtp); Air transport (atp);
4.3 Industry (WP3)
The demand for industrial products will be driven by the lifestyles, transport,
building and agriculture modules. The WP3 levers will then drive (1) the switching to substitute materials (e.g. using more aluminium and less steel in cars); (2) the material intensity thanks to smarter design and more efficient materials (e.g.
replacing common steel with high strength steel); (3) technology changes in the material production; (4) Switching to less carbon intensive energy vectors in the
material production; (5) the progress in terms of energy efficiency of each technology; (6) CO2 capture through CCS. The main outputs of the Industry module will be an energy demand by career and raw material demand.
Figure 5 –Possible EUCalc-GTAP interface for Industry (WP3)
The main categories of materials used for buildings, home appliances, transportation equipment, roads and rails will be mapped into the relevant GTAP
manufacturing sectors. Changes in material switch, intensity and technology will be modelled as changes in the input (i.e. the materials) -output (i.e. the material
using sectors) matrix. As showed by Figure 5, material switches and modifications in material intensity in a given sector can be intended, in economic terms, as shifts

D7.2
17
in the consumption patterns by that sector. This variation can be modelled as a change in intermediate inputs used by each sector. To allow these transitions
foreseen by WP3 modelling work, a tax instrument (exogenous in the standard GTAP closure) has to be exogenized, and the intermediate consumption of the given commodity (endogenous in the standard GTAP closure) endogenized. Such
changes will result in the changes in the total supply of these materials. Fuel switch will be modelled by improvements in the emission intensities in producing the
materials.
Box 4 – Possible GTAP component list for Industry
Materials - Sectors: Motor vehicles and parts (mvh): cars, lorries, trailers and semi-trailers; Other Transport Equipment (otn): manufacture of other transport equipment, Chemical Rubber Products: basic chemicals, other chemical products, rubber and plastics products (crp), Electronic Equipment (ele): office, accounting and computing machinery, radio, television and communication equipment and apparatus; Construction (cns): building houses factories offices and roads;
Materials - Commodities: Iron & Steel: basic production and casting (i_s), Non-Metallic Minerals: cement, plaster, lime, gravel, concrete (nmm), Chemical Rubber Products: basic chemicals, other chemical products, rubber and plastics products (crp), paper and paper products (ppp), Non-Ferrous Metals: production and casting of copper, aluminum, zinc, lead, gold, and silver (nfm), Fabricated Metal Products: Sheet metal products, but not machinery and equipment (fmp);
Fuel switch - Sectors: Other transport (otp): road, rail, pipelines, auxiliary transport activities, travel agencies; Water transport (wtp); Air transport (atp);
Fuel switch - Commodities: Oil, gas, oil products, electricity;
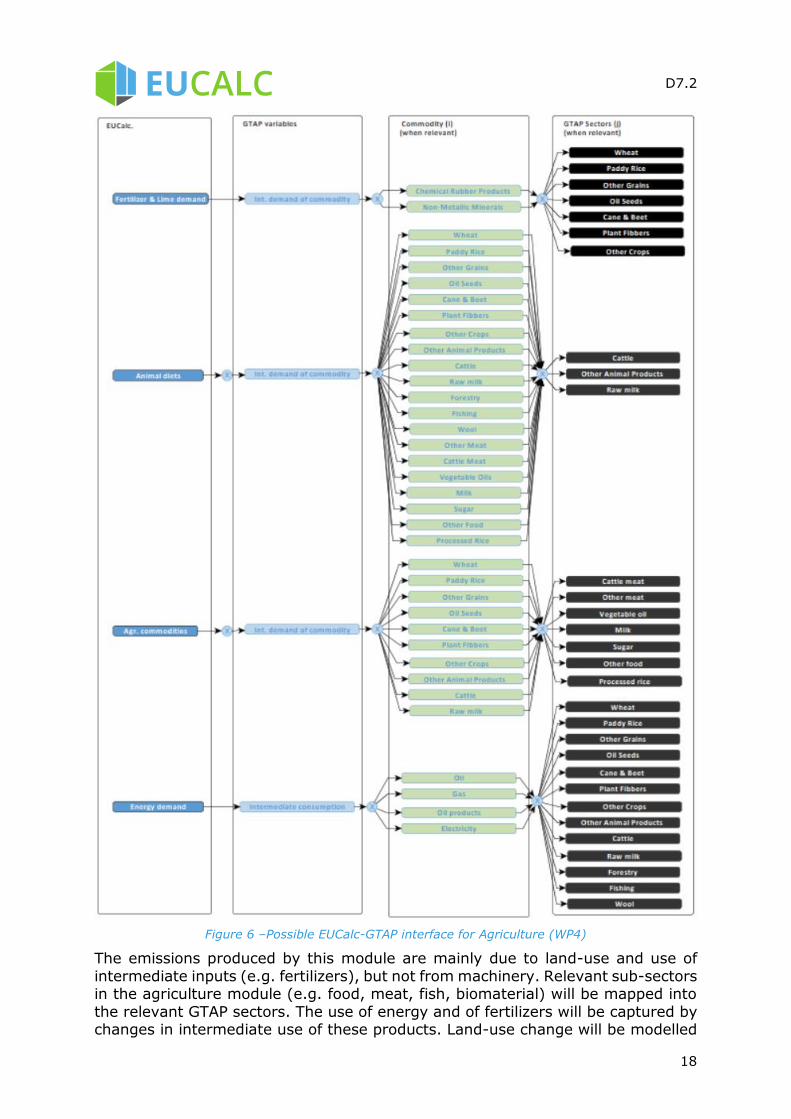
4.4 Agriculture, land-use, water and biodiversity
(WP4)
In the Agriculture module, the Lifestyle module drives the demand by food group; industry drives the demand for biomaterials; industry, building and transport drive
the demand for bioenergy. In turn, to produce its output, it demands energy from the power sector, and lime and ammonia-based fertilizers from industry (organic
and biogas-based fertilizers will be produced internally). WP4 levers consists of (1,2,3) the agricultural, fishery and forestry practices respectively, which will affect water-use, biodiversity impacts, land-use and so on; (4) livestock diet, which will
affect the demand for corps and feed compounds and their associated energy, water and land-use demand; (5) waste & residues from food production; (6)
biomass availability, which will set the scope of the biomass availability (e.g. using or not using food crops) as well as the use competition; (7) land-management practices; The module also include as non-CORE modules the water, biodiversity
and minerals modules which will be implemented later. The lever setting will mainly drive the energy, water and fertilizer demand as well as the land-use.
D7.2
18
Figure 6 –Possible EUCalc-GTAP interface for Agriculture (WP4)
The emissions produced by this module are mainly due to land-use and use of
intermediate inputs (e.g. fertilizers), but not from machinery. Relevant sub-sectors in the agriculture module (e.g. food, meat, fish, biomaterial) will be mapped into
the relevant GTAP sectors. The use of energy and of fertilizers will be captured by changes in intermediate use of these products. Land-use change will be modelled

D7.2
19
as shares of land used by each sub-sector. Intermediate use of machineries, as in the partial module, will not be taken into account. The implied changes in
emissions due to different practices will be captured by changes in the use of energy products and intermediate goods (e.g. energy) and changes in emission intensities.
As envisioned in this module, agriculture also produce biomass, which will be used for generating bioenergy to meet bioenergy demand from other sectors. The
availability of biomass for generating bioenergy is set by the waste and biomass availability levers. This would require a matching sector in the CGE model to “produce” the wastes and biomass and another sector for generating bioenergy,
whose end-products will enter into the energy mix used by other sectors.
Box 5 – Possible GTAP component list for Agriculture
Fertilizer & lime demand - Commodity: Chemical Rubber Products: basic chemicals, other chemical products, rubber and plastics products (crp); Non-Minerals Material; Sector: wheat, paddy rice, other grains, oil seeds, cane & beet, plant fibbers, other crops;
Feed demand - Commodities: Paddy Rice: rice, husked and unhusked; Wheat: wheat and meslin; Other Grains (gro): maize (corn), barley, rye, oats, other cereals; Oil Seeds (osd): oil seeds and oleaginous fruit; soy beans, copra; Cane & Beet (c_b): sugar cane and sugar beet; Plant Fibers (pfb): cotton, flax, hemp, sisal and other raw vegetable materials used in textiles; Other Crops (ocr): live plants; cut flowers and flower buds; flower seeds and fruit seeds; vegetable seeds, beverage and spice crops, unmanufactured tobacco, cereal straw and husks, unprepared, whether or not chopped, ground, pressed or in the form of pellets; swedes, mangolds, fodder roots, hay, lucerne (alfalfa), clover, sainfoin, forage kale, lupines, vetches and similar forage products, whether or not in the form of pellets, plants and parts of plants used primarily in perfumery, in pharmacy, or for insecticidal, fungicidal or similar purposes, sugar beet seed and seeds of forage plants, other raw vegetable materials; Cattle (ctl): cattle, sheep, goats, horses, asses, mules, and hinnies; and semen thereof; Other Animal Products (oap): swine, poultry and other live animals; eggs, in shell (fresh or cooked), natural honey, snails (fresh or preserved) except sea snails; frogs' legs, edible products of animal origin n.e.c., hides, skins and fur skins, raw, insect waxes and spermaceti, whether refined or colored; Raw milk (rmk) ; Wool (wol): wool, silk, and other raw animal materials used in textile; Forestry (frs): forestry, logging and related service activities; Fishing (fsh): hunting, trapping and game propagation including related service activities, fishing, fish farms; service activities incidental to fishing; Cattle Meat (cmt): fresh or chilled meat and edible offal of cattle, sheep, goats, horses, asses, mules, and hinnies. raw fats or grease from any animal
or bird.; Other Meat (omt): pig meat and offal. preserves and preparations of meat, meat offal or blood, flours, meals and pellets of meat or inedible meat offal; greaves; Vegetable Oils (vol): crude and refined oils of soya-bean, maize (corn), olive, sesame, ground-nut, olive, sunflower-seed, safflower, cotton-seed, rape, colza and canola, mustard, coconut palm, palm kernel, castor, tung jojoba, babassu and linseed, perhaps partly or wholly hydrogenated, inter-esterified, re-esterified or elaidinised. Also margarine and similar preparations, animal or vegetable waxes, fats and oils and their fractions, cotton linters, oil-cake and other solid residues resulting from the extraction of vegetable fats or oils; flours and meals of oil seeds or oleaginous fruits, except those of mustard; degras and other residues resulting from the treatment of fatty substances or animal or vegetable waxes.; Milk (mil): dairy products ; Processed Rice (pcr): rice, semi- or wholly milled; Sugar (sgr); Other Food (ofd): prepared and preserved fish or vegetables, fruit juices and vegetable juices, prepared and preserved fruit and nuts, all cereal flours, groats, meal and pellets of wheat, cereal groats, meal and pellets n.e.c., other cereal grain products (including corn flakes), other vegetable flours and meals, mixes and doughs for the preparation of bakers' wares, starches and starch products; sugars and sugar syrups n.e.c., preparations used in animal feeding, bakery products, cocoa, chocolate and sugar confectionery, macaroni, noodles, couscous and similar farinaceous products, food products n.e.c. Sectors: Cattle: cattle, sheep, goats, horses, asses, mules, and hinnies; and semen thereof; Other Animal Products (oap): swine, poultry and other live animals; eggs, in shell (fresh or cooked), natural honey, snails (fresh or preserved) except sea snails; frogs' legs, edible products of animal origin n.e.c., hides, skins and fur skins, raw, insect waxes and spermaceti, whether or not refined or colored
Food demand – Commodities: wheat, paddy rice, other grains, oil seeds, cane & beet, plant fibbers, other crops, fisheries, cattle, other animal products; Sectors: Cattle meat, other meat, vegetable oils, milk, sugar, other food, processed rice;
Energy demand - Commodities: Oil, gas, coal, oil products, electricity; Sectors: Paddy Rice: rice, husked and unhusked; Wheat: wheat and meslin; Other Grains (gro): maize (corn), barley, rye, oats, other cereals; Oil Seeds (osd): oil seeds and oleaginous fruit; soy beans, copra; Cane & Beet (c_b): sugar cane and sugar beet; Plant Fibers (pfb): cotton, flax, hemp, sisal and other raw vegetable materials used in textiles; Other Crops (ocr): live plants; cut flowers and flower buds; flower seeds and fruit seeds; vegetable seeds, beverage and spice crops, unmanufactured tobacco, cereal straw and husks, unprepared, whether or not chopped, ground, pressed or in the form of pellets; swedes, mangolds, fodder roots, hay, lucerne (alfalfa), clover,
D7.2
20
sainfoin, forage kale, lupines, vetches and similar forage products, whether or not in the form of pellets, plants and parts of plants used primarily in perfumery, in pharmacy, or for insecticidal, fungicidal or similar purposes, sugar beet seed and seeds of forage plants, other raw vegetable materials; Cattle (ctl): cattle, sheep, goats, horses, asses, mules, and hinnies; and semen thereof; Other Animal Products (oap): swine, poultry and other live animals; eggs, in shell (fresh or cooked), natural honey, snails (fresh or preserved) except sea snails; frogs' legs, edible products of animal origin n.e.c., hides, skins and fur skins, raw, insect waxes and spermaceti, whether refined or colored; Raw milk (rmk) ; Wool (wol): wool, silk, and other raw animal materials used in textile; Forestry (frs): forestry, logging and related service activities; Fishing (fsh): hunting, trapping and game propagation including related service activities, fishing, fish farms; service activities incidental to fishing
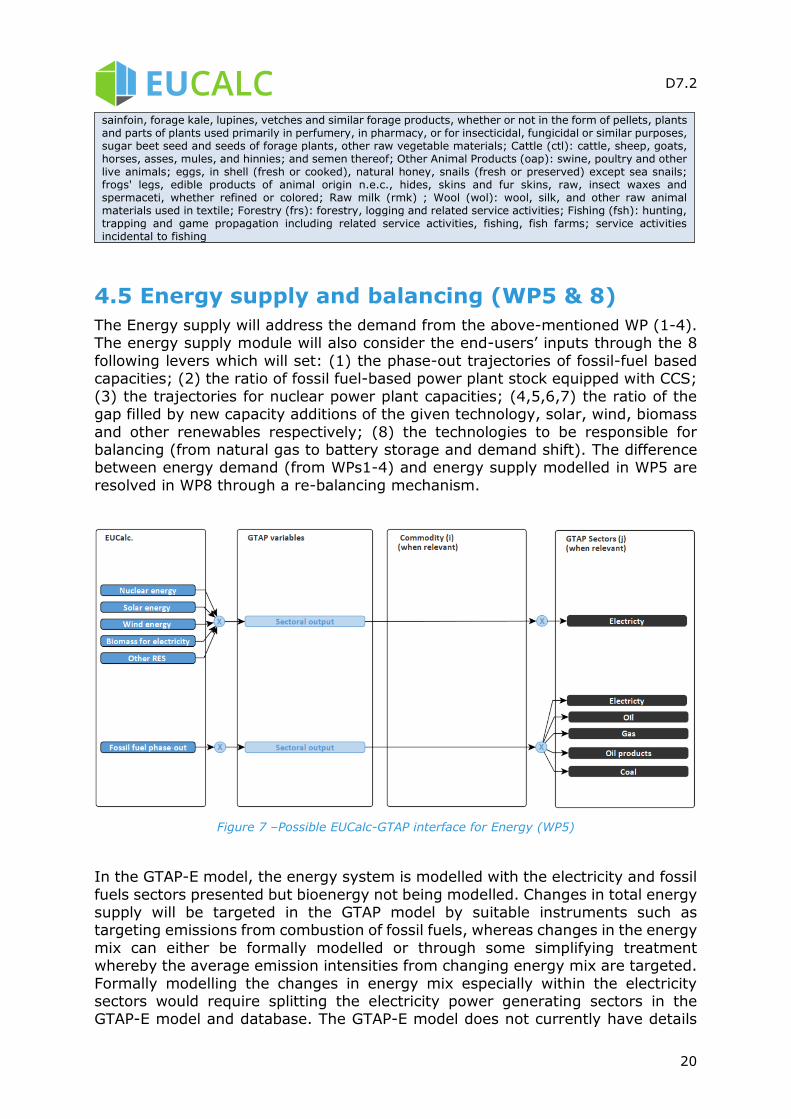
4.5 Energy supply and balancing (WP5 & 8)
The Energy supply will address the demand from the above-mentioned WP (1-4). The energy supply module will also consider the end-users’ inputs through the 8
following levers which will set: (1) the phase-out trajectories of fossil-fuel based capacities; (2) the ratio of fossil fuel-based power plant stock equipped with CCS;
(3) the trajectories for nuclear power plant capacities; (4,5,6,7) the ratio of the gap filled by new capacity additions of the given technology, solar, wind, biomass
and other renewables respectively; (8) the technologies to be responsible for balancing (from natural gas to battery storage and demand shift). The difference between energy demand (from WPs1-4) and energy supply modelled in WP5 are
resolved in WP8 through a re-balancing mechanism.
Figure 7 –Possible EUCalc-GTAP interface for Energy (WP5)
In the GTAP-E model, the energy system is modelled with the electricity and fossil
fuels sectors presented but bioenergy not being modelled. Changes in total energy supply will be targeted in the GTAP model by suitable instruments such as targeting emissions from combustion of fossil fuels, whereas changes in the energy
mix can either be formally modelled or through some simplifying treatment whereby the average emission intensities from changing energy mix are targeted.
Formally modelling the changes in energy mix especially within the electricity sectors would require splitting the electricity power generating sectors in the GTAP-E model and database. The GTAP-E model does not currently have details

D7.2
21
on the different electricity sectors but recent advancement in model development provide some directions and data on how to split the electricity sectors. For
example, Peters (2016a) extends the GTAP 9 Database generating the GTAP-Power Data Base, disaggregating the electricity sector (present in GTAP and GTAP-E databases) into the following subsectors: transmission and distribution, nuclear,
coal, gas, hydroelectric, wind, oil, solar, and other. Gas, oil, and hydroelectric are further differentiated as base and peak load. The current GTAP-E model, however,
does not allow for the utilization of this database, and further model development is needed to fully exploit this database. The current GTAP-E-Power (Peters, 2016b), after a series of preliminary tests, does not seem to be as “stable” as
GTAP-E and has a generally lower solution accuracy (mostly due to the additional sectoral disaggregation). Therefore, ad hoc solutions are necessary to implement
EUCalc shocks in the GTAP-E. For example, the quantity of capital used in the electricity sector (that could be intended as investments in ‘clean’ technologies) may be increased to simulate a growth in renewable resources in the electricity
generation, or a reduction of fossil fuel inputs to the electricity sector can be imposed to simulate a phase out. These possibilities will be investigated further
vis-à-vis model demand and available resources.
Box 6 – Possible GTAP component list for Energy supply
Nuclear, solar, wind, biomass - Sectors: Electricity: production, collection and distribution
Fuel switch - Sectors: Oil, gas, coal, oil products; Electricity: production, collection and distribution
4.6 Common variables (from WP2-5)
Each module tracks its own GHG direct emission which are not associated with energy consumption (e.g. manure emissions in Agriculture). Energy demand is
going through the Energy Supply module (WP5) which will keep track of energy related emissions for each module. In the GTAP-E model and the associated CO2
and non-CO2 emissions database, a scheme for allocating all GHG emissions have also been developed which largely resembles the allocation of GHG emissions within EUCalc (Table 1).
EUCalc
variables
GTAP
variables GTAP sector
Emission intensity GHG/sectoral output
All
Efficiency
(e.g. materials, energy, and so on) Technical change variables All
Table 1 – GTAP-EUCALC correspondence across WP2-5

D7.2
22
5 Potential scenarios to be simulated As this document also lays out potential scenarios to be simulated in GTAP, we
present in this section three sets of scenarios under consideration of formulation and computation for our trade analysis. The selection of these scenarios is based
on their representativeness in likely policy debates. Additionally, together they provide an envelope within which other scenarios can be derived by altering part of the formulations in an existing scenario. For instance, other relevant scenarios
may surface from the expert consultation workshop to be conducted later in the project period.
5.1 Scenarios consisting of common lever settings
across sectors and across EU member states
The first set of scenarios to be simulated corresponds to the pathways that specify
uniform lever settings across all EU member states for all relevant sectors as discussed in section 4, with identical ambition levels. More specifically, against the
baseline scenario, each of these scenarios/pathways will correspond to a particular identical level setting for all levers in each and every sectors across all EU member states. There are four such scenarios/pathways, corresponding to the four
ambition levels. These scenarios/pathways are designed to reflect a set of common decarbonization strategies across the member states and sectors. By varying the
ambition levels across the different scenarios but keeping them uniform across member states and sectors, we illustrate how economic interdependencies between the EU and the ROW as well as within the EU would respond to these
common ambition levels.
5.2 Scenarios consisting of different lever settings
across sectors but common across EU member
states
The second set of scenarios is designed to explore potential sectoral sensitivities
in evaluation decarbonization pathways in the EU context, as different sectors may have different emission-reduction potentials and/or may face different constraints in reaching a particular ambition level, or users may have different focus in
exploring particular combinations of ambition levels across sectors. Therefore, even though an EU-wide decarbonization pathway is envisioned, such pathway
may feature different lever settings for different sectors.
In this set of scenarios, each scenario will contain a set of sectoral ambition levels imposed uniformly across the EU member states (i.e. the ambition levels for any
given sector is common across member states); however, differences in ambition levels across sectors are allowed. For instance, within the same scenario, the
building and transport sector may have all levers set at level 1, whereas other sectors set their respective levers at levels 2 or 3 or 4. Taking the simplifying approach of setting all levers within any given sector at the same level for a given
scenario, there are potentially 256 possible combinations of sectoral lever settings for the four sectors defined in WP2-5, assuming that each lever contains level
setting 1, 2, 3, and 4. In reality, the meaningful set of scenarios may be smaller,

D7.2
23
due to the presence of incompatible cross-sector lever combinations (to be captured by the initial flag system under development for the core modules), as
well as possible computational infeasibilities arising from the CGE simulations of certain scenarios.
Of particular analytical interests within these scenarios are the ones focusing on
varying the ambition levels of a particular sector while allowing all the other sectors to remain at a common ambition level. Such a design allows users to appreciate
the sensitivities of emission-reduction outcomes arising from changing ambition level in a particular sector, conditional upon a common setting for other sectors. The identification of such interesting cases would be based on relevant literature
and policy documents, as well as by consultations through the expert workshop and discussions with partners of the EUCalc project.
5.3 Scenarios consisting of deviations by specific
EU member states from common EU-wide
pathways
In certain cases, a user may be particularly interested in knowing the
consequences of a particular member state adopting a decarbonization strategy that is different from the common strategy/pathway pursued by all other EU
member states. In responding to this possibility, a third set of scenarios involving deviations by individual countries from EU-wide ambition levels will be formulated
and computed, to address these idiosyncratic concerns.
This set of scenarios are essentially a further refinement of the first set of scenarios envisioned in section 5.1. That is, for each of the four core scenarios envisioned in
the first set, one EU member state is assumed to deviate its level settings (uniform across sectors) from the common level setting assumed for all other member
states in the core scenario. For each of the four core scenarios, there are three alternative positions that can be applied by each member state; hence, there are 3*N additional scenarios (with N denoting the number of EU member states)
corresponding to the core scenario. As there are four such core scenarios, theoretically speaking, this refinement would result in 4*3*N additional scenarios
(or 12*N scenarios) to be formulated and simulated. As cautioned earlier, it is possible that not all these scenarios consisting of mutually compatible lever settings and/or that some of these scenarios may not solvable. So in reality the
number of scenarios to be actually simulated may be fewer than 12*N.
6 Conclusions This deliverable proposes a conceptual design of the EUCalc-GTAP interface with
respect to each of the CORE modules (i.e. WPs1-5 and WP8). A preliminary correspondence between sectoral lever settings and relevant CGE modelling variables are also proposed for further implementations.
However, the selection of such variables and sectors is not final, as it is depending on modelling possibilities and on further development of the EUCalc levers.
Furthermore, many of the corresponding variables in the CGE model are endogenous variables that are determined by model structures; therefore, any
D7.2
24
changes to these variables from the baseline level are likely to be implemented by targeting some instrument variables such as carbon emission tax, technical
efficiencies or emission intensities. Finally, not all listed correspondences will be captured in the scenarios to be simulated in the CGE model. This is because in the CORE modules of EUCalc, demand side forces directly drive changes in the supply
side without markets and price mechanism, whereas in the CGE model, demand (inclusive of demand for domestic product and imported product) and supply
(inclusive of domestic supply and export supply) are matched in market “equilibrium” under through the price mechanism. Therefore, it is redundant to simultaneously target both demand and supply directly.
One important limitation that needs to be addressed when developing the economic model, which is based on the CGE model nicknamed GTAP-E, is about
the robustness of the model to represent long-term structural changes from both the behavioural and technological sides of the economic system, as assumed in EUCalc core modules. In relation to the large number of decarbonisation pathways,
it may be the case that not all such pathways can be simulated by the model. In some cases, this may be due to the fundamental incompatibilities within the
assumptions adopted in the same pathways (i.e. what is technical feasible may not be achievable given market equilibrium requirements and resource constraints). In other cases, however, the reason may be that the model is not
“flexible” enough due to rigidities in the demand system and production functions specified in the model. Therefore, an important effort to undertake in the
development of the model is to design additional model structures so as to allow for better representation of future pathways with large structural changes with respect to both behaviours and technologies. Details of such efforts will be
documented in relevant subsequent.

D7.2
25
7 References Aguiar, Angel; Narayanan, Badri; Mcdougall, Robert. An Overview of the GTAP 9
Data Base. Journal of Global Economic Analysis, [S.l.], v. 1, n. 1, p. 181-208, june 2016. ISSN 2377-2999.
doi:http://dx.doi.org/10.21642/JGEA.010103AF.
Antimiani, A., Costantini, V., Martini, C., Palma, A., Tommasino, M.C., 2012. The GTAP-E: Model Description and Improvements, in: The Dynamics of
Environmental and Economic Systems. Springer, Dordrecht, pp. 3–24. https://doi.org/10.1007/978-94-007-5089-0_1
Burniaux, J., & Truong, T. (2002). GTAP-E: An Energy-Environmental Version of the GTAP Model (GTAP Technical Paper No. 16). Purdue University, West Lafayette, IN: Global Trade Analysis Project (GTAP). Retrieved from
https://www.gtap.agecon.purdue.edu/resources/res_display.asp?RecordID=923
Brockmeier, M. (2001). A Graphical Exposition of the GTAP Model (GTAP Technical Paper No. 08). Purdue University, West Lafayette, IN: Global Trade Analysis Project (GTAP). Retrieved from
https://www.gtap.agecon.purdue.edu/resources/res_display.asp?RecordID=311
Burfisher, M. (2011). Introduction to Computable General Equilibrium Models. Cambridge: Cambridge University Press. doi:10.1017/CBO9780511975004
Irfanoglu, Zeynep Burcu and van der Mensbrugghe, Dominique (2015). Development of the version 9 non-CO2 GHG emissions database
McDougall, R., & Golub, A. (2009). GTAP-E: A Revised Energy-Environmental Version of the GTAP Model (GTAP Research Memorandum No. 15). Purdue University, West Lafayette, IN: Global Trade Analysis Project (GTAP).
Retrieved from https://www.gtap.agecon.purdue.edu/resources/res_display.asp?RecordI
D=2959
Nijkamp, P., Wang, S., Kremers, H., 2005. Modeling the impacts of international climate change policies in a CGE context: The use of the GTAP-E model.
Econ. Model. 22, 955–974. https://doi.org/10.1016/j.econmod.2005.06.001
Peters, Jeffrey C.. The GTAP-Power Data Base: Disaggregating the Electricity Sector in the GTAP Data Base.Journal of Global Economic Analysis, [S.l.], v. 1, n. 1, p. 209-250, june 2016a. ISSN 2377-2999. Available at:
<https://www.gtap.agecon.purdue.edu/resources/jgea/ojs/index.php/jgea/article/view/15>. Date accessed: 07 july 2018.
doi:http://dx.doi.org/10.21642/JGEA.010104AF.
Peters, J. (2016b). GTAP-E-Power: An electricity-detailed extension of the GTAP-
E model (Presented at the 19th Annual Conference on Global Economic Analysis, Washington DC, USA). Purdue University, West Lafayette, IN: Global Trade Analysis Project (GTAP). Retrieved from
https://www.gtap.agecon.purdue.edu/resources/res_display.asp?RecordID=4891

D7.2
26
Rose, S., & Lee, H. (2008). Non-CO2 Greenhouse Gas Emissions Data for Climate Change Economic Analysis (GTAP Working Paper No. 43). Purdue
University, West Lafayette, IN: Global Trade Analysis Project (GTAP). Retrieved from https://www.gtap.agecon.purdue.edu/resources/res_display.asp?RecordI
D=2604
Hertel, T., Powell, A., Frisvold, G., Gehlhar, M., Gray, D., Hanslow, K., Huff, K.,
Ianchovichina, E., Kuhn, B., Lanclos, D., MacLaren, D., Martin, W., McDonald, B., McDougall, R., Pearson, K., Perroni, C., Swaminathan, P., Tsigas, M., Tyers, R., Wigle, R., Yang, Y., Yanagishima, K., & Young, L.
(1997). Global Trade Analysis: Modeling and Applications (University of Cambridge). Purdue University, West Lafayette, IN: Global Trade Analysis
Project (GTAP). Retrieved from https://www.gtap.agecon.purdue.edu/resources/res_display.asp?RecordID=4840
Wing, Ian Sue (2004). Computable general equilibrium models and their use in economy-wide policy analysis." Technical Note, Joint Program on the
Science and Policy of Global Change, MIT.
Yu, W. and Clora, F. 2018. Deliverable 7.1: Formulation of baseline projections and documentation on modeling approach review – Public deliverable of
the EU-calculator project.