x4455m.pdf - fao.org
TRANSCRIPT
Al o
CD
0 I-1 o
*215u)(I)
CD
-0
u)0
0rat
4-Kgg
OFIE
4-a u)u)
kgiE
J(i)
wim
a 1-10 al
co)
440
40,01voll
(l) 00 414
0 4')0)0)
i0
VT
O)
V t
1-1
4hi 0
00
1,40
1,4I
Tr
0 1mi
14 o14 0
0)
4riT
4 alC
104.4A
i 44-40)I
=1
,13
zN
CO
C(0(00
C00(5-0
0)03(0.zea_
E
06'O
WZ431,
(1)c
criasE0)...0c1
a)u)o
Oz)Z
7C1.0.)
O z
fInzgi.M4rxR*SENT-tIVE.ffiAElitftlittE4*IVER.Mitfling. r8V, AX.T.
4f4B?'911, RRIVORRIAM*3111filtlede. 81333VIVE/M3X12.43'&38M8Vittcl
ff.Pizi: MQ0/5311. *4441h.kiti+Iliafg±.RANTEEHIOilf53013*V0-01VMEM
**AMEN tiMIIMgJUJtWta jr:. /..ptwilsotliET,
114V4M91.04tilERAiliflUfPThetto
The FAO Yearbook of Forest Products is a compilation of statistical data on basicforest products for all countries and territories of the world. It contains series ofannual data on the volume of production and the volume and value of trade inforest products. It includes tables showing direction of trade and average unitvalues of trade for certain products. Statistical information in the yearbook is
based primarily on data provided to the FAO Forestry Department by the countriesthrough questionnaires or official publications. In the absence of official data, FAO
makes an estimate based on the best information available.
L'Annuaire FAO des produits forestiers est un recueil de données statistiques surles produits forestiers de base pour tous les pays et territoires du monde. Il
contient les chiffres annuels concernant le volume de la production ainsi que levolume et la valeur du commerce. Des tableaux relatifs A la direction du commerce
qui montrent des courants commerciaux principaux y sont inclus ainsi que destableaux indiguant la valeur unitaire des échanges de certains produits. Les
données se basent essentiellement sur des renseignements fournis par les pays enréponse aux questionnaires qui parviennent au Département des foréts de la FAOou à des publications officielles. Lorsque ces renseignements font défaut, la FAO
établit des estimations A partir des meilleures informations dont elle dispose.
El Anuario FAO de productos forestales es un compendio de datos estadísticossobre los productos forestales básicos para todos los países y territorios del mundo.Se presentan datos anuales sobre el volumen de la producción y el volumen y valor
del comercio. Se incluyen cuadros que muestran la dirección del comercio y elvalor unitario del comercio de algunos productos. Los datos estadísticos se basan
sobre todo en la información que los paises proporcionan al Departamento deMontes de la FAO a través de cuestionarios o de publicaciones estadísticas oficiales.
Cuando no se dispone de esta información, la FAO realiza estimaciones utilizandolos mejores datos en su poder.
ISBN 92 5-004407-0 ISSN 0084-3768
11111111 11111 II9 78 M 0 04 4 O 7.1
X4455muliV1/6.0413700
NANVOAAAIS33
A' 47 if155 tL
FAO Forestry SeriesNo. 33FAO Statistics SeriesNo. 155
Collection FAO:Forets N 33Collection FAO:Statistiques N 155
Colección FAO:Montes N 33Colección FAO:
t ad is tic a N 155
tt/tca
2000
FOODAND AGRICULTUREORGANIZATIONOF THEUNITED NATIONSRome, 2000
ORGANISATIONDES NATIONS UNIESPOURL'ALIMENTATIONET L'AGRICULTURERome, 2000
ORGANIZACIÓNDE LASNACIONES UNIDASPARALA AGRICULTURAY LA ALIMENTACIÓNRoma, 2000
F r
yearbooknuaire
anuario
netosforestales
*fflItt+fstfflr~11-minulivairm**avAkmv,nifflm*.ipAsigm,iLtxomAmnamite.anAitalammAmftA7T-Imgx.The designations employed and the presentation of material in this publication do not imply the expression of any opinionwhatsoever on the part of the Food and Agriculture Organization of the United Nations concerning the legal status of anycountry, territory, city or area or of its authorities, or concerning the delimitation of its frontiers or boundaries.
Les appellations employées dans cette publication et la présentation des données qui y figurent n'impliquent de la part del'Organisation des Nations Unies pour l'alimentation et l'agriculture aucune prise de position quant au statut juridique despays, territoires, villes ou zones, ou de leurs autorités, ni quant au tracé de leurs frontières ou limites.
Las denominaciones empleadas en esta publicación y la forma en que aparecen presentados los datos que contiene noimplican, de parte de la Organización de las Naciones Unidas para la Agricultura y la Alimentación, juicio alguno sobre lacondición jurídica de países, territorios, ciudades o zonas, o de sus autoridades, ni respecto de la delimitación de susfronteras o límites.
*fflNtqlnR*470. 1,11ARR*N.aPtiVffiC 144MtEil5lig*Mffiistffl/~c*.WIE )(J : Chief, Publishing and Multimedia Service, lnformation Division, FAO, Viale delle Terme di Caracalla,00100 Rome, Italy.
The data contained in this publication may be quoted provided that reference is made to the source. Two copies of the textindicating the data used should be sent to the Chief, Publishing and Multimedia Service, lnformation Division, FAO,Viale delle Terme di Caracalla, 00100 Rome, ltaly.
Les données contenues dans cette publication peuvent "ètre reproduites à condition d'en indiquer la source. Prière d'envoyerdeux exemplaires de toute représentation ou reproduction au Chef du Service des publications et du multimédia,Division de l'information, FAO, Viale delle Terme di Caracalla, 00100 Rome, Italie.
Pueden citarse los datos contenidos en esta publicación, siempre que se indique la fuente. Se ruega enviar dos copias deltexto en que aparecen los datos utilizados al Jefe del Servicio de Publicaciones' y Multimedia, Dirección deInformación, FAO, Viale delle Terrne di Caracalla, 00100 Roma, Italia.
EbtrivmmmulimitaglgfftcÀmma*N4Ini4,mAffi:VVIM4RIAXRittq Fg OV : [email protected]
4-*Akitta A.: +39 06 57055137
FAO, Viale delle Terme di Caracalla00100 Rome, Italy
Prepared by the statistics and economic analysis staff of the Forestry Department, FAO. Inquiries about the technicalcontent should be addressed to:
Forestry Planning and Statistics Branch E-mail: [email protected] Policy and Planning Division Fax: +39 06 57055137
FAO, Viale delle Terme di Caracalla00100 Rome, Italy
Préparé par le personnel des statistiques et de l'analyse économique du Département des foréts de la FAO.La correspondance d'ordre technique au sujet de cette publication doit átre adressée à:
Sous-Division des données de base, Division de la statistique Mél.: [email protected] des politiques et de la planification forestières Télécopie: +39 06 57055137FAO, Viale delle Terme di Caracalla00100 Rome, Italie
Preparado por el personal de estadística y análisis económico del Departamento de Montes, FAO. La correspondenciarelativa al contenido técnico de esta publicación debe ser dirigida a:
Subdirección de Planificación y Estadísticas Forestales Correo electrónico: [email protected]ón de Políticas y Planificación Forestales Fax: +39 06 57055137FAO, Viale delle Terme di Caracalla00100 Roma, Italia
FAO agricultural statistics are avallable atLes statistiques agricoles de la FAO sont disponibles surLas estadísticas agrícolas de la FAO se pueden consultar en
www.fao.org
ISBN 92-5-004407-0
ISSN 0084-3768
O FAO 2000
62
6465
2
, 11 5 66
7 67
` /-1H\' tr,,±)9 68
(70
11 Hi ii 71
14
17
18 E
H. (t±0-1- ) HH HI 74
19 5I1 1 ;J 77
(1!--tt9±) JiH H J 80
20 'tgitJ ( -rLi-i- )
82
22 j11,i ] JJ 1 85
.111'1 I IR , ut 25 1111 187
II; [ ] '11,:, ' I fril 27 tEt.?± (-=1, ''' d
V,)012\7 (i±ww) ,,, ,., 89
29 i)I Ji 1 i ii'l 92
Ji J, H 31 H i '.- II fl'f. 94
L 33
1-1.)1.kffli ' -',!-1-T-2t, (rt--t+)35
ji1 1 iL 38
111; i J 40. 11"(V.:'11',-, 98
illUt; 5T,tiLlil (4Ad-H-) !al I.1',,,, II 11)) 101
42 l': JI l',,,, W, [ 1 fri, 10443
MilLT.Y1- - .r.-,oi--/T t: (Hrt-hit) 106A I i 44 .L.1 108W 1 1
46 IIII J 110
t,,, tl'S 71.1 1 '7' N8'..111
:i'L 1,111 I WI: 114
491'11,11U] 116
51
1
53t,(j.+)
gl; )
. ' d-L)
M
v 54
vi ( T-1 -i-ri--,-)
vi 55x A !-- .-1_
xi ,''' 56
96 -,-L-4_E: -,,,--L-i-Eisiar717,3--,=, P,,,)11!( - +F,± )xii ''-' 58
xiii ;a:LIU i- (1f----1-0-1- )
/-t :; -xv ,,,, J. 59
L A-1
ii'cf, - )-----, A-3
1998 _ni--FLI ri- - A-4
JA *
118
HL;JJH 120
11;1 iI 122
IHLft'
123
125127
1281 130
132
138140
1, f1,1 142
_ A. -*t3 xfk. *-/k
144I 146I 148
-4-
:t 149ij 1 15011' 151
133135137
155I
157159
-'A TI,,az-Lir:160161162
163.]íL 164
11,i 1 ft'l 165
: , 166J HIlL 167
fh 168
174175176
177178179
180182
I 184
iv
gE4=1 45,
LE
210
)2. 21211;II 213
F:C7
214216218
--;- ->5!1/\F!ffl&
219ILi:I 221
223
-4* .)". tra
L.IuIL.L 226
Jti
152
, 154
169171
173
186
189192
194
I in 196
I MI 198
ffigh,j :a
199201
203
204206208
\II0TJ5 Q-H+ 230
.11AkM.MFP - 'PJ0:111 1 231
ir_AP.J1J-7.77JP - 232233
-i -) 234235236237238239240241
Pt;+r,ft 242
LTC 243
ti52 !V] (fI (-K jr 4,
11,NNJ 1994 1998 L 4H.1997 PI 1998 Ir %).) ;,d h 9,1111
1"),, 1961 4 4.H H 7.1vJJJ,),,; jEJ,
ill .3: j. NJ, I `Jr J\
:!,,'kJ ,V 1,1 )/Y., )I 1-; 1.
http://apps.fao.org forestry k, <;),'U.f rV,11"(J 11"H public;rcions-sales(wrno.org H. r, ;IS 9J;42 ifhttp://apps.fao.org/products.htm
,)J , ', , 1?(A. 4 U fit h VII (P. J31
j VI', .0)i, .4', 11'') -0 A,
),N» , 'LN , 'EJ jPINU 74 1.1.<j(N.-h-J ,
1),j 4f 1")J
'1 41.1 liH.k 1)1, J' A ;,1,; 1/a j 1
h fa 4, a '%(<-
--,1(,11¡ H' ((INN ).1 Ifil
J), 1999 L. 3j 4 f»14), f' IN \ 19982,z 1997 t Vr 1-2',4,4/,', :
" , (41:1(-- 03- )/'.1 - fii
.14(11 c((., fl LIli.11,1 -Pc fl (ri
)i 111, vJJ .(1.1,Y,1»-, 'qJ [1,11-1(,)
4f ,f!: . H. H (ri .NV Nt /12. Hi 1(1
',aßj,f i, 1 1998
u'u fi',J
,. ;41, 1:1 4 411fii 411 .J
412' fi.11(1.( 1411- L), .`(1( it',
k1/6 Hd), )111 ifJ1 H. )'. ...At,
HUff,, 1994 1998 1 I, ;I Fi
f , : : .-1. , ,j11_ 41J,;
4,31i1 !I(JJ H; ,
4, 1,1 74J'"(': Uk 1H.,'1,ill H. if 4;
i)14 f 13 .(1i( fU- I H a 4, 11ii
H 'ffa,(' .-I 11 'LP
jdj, 1, j H 1`,J i f 1.A -(1 rirl J fij '(' JuJ
j LJ ;2". V!, V., f4 I')J
15 1'11, If i 25 /al i i,111() "Ot .1)
L.i,111 11`.1 fl 1-g.13(1 i N ,'; . 1(7_
»f,", ] 1 U 1H LI1,1
J, f .. (J-1
%. .11`,."%;;'t , J' )1
Jti.i)( h 1- on leJ) 4"'.
I- ]J" 4H r"'J 411 ',J(2, 1- ,
, II , ,`-N;1 6 ,K J(J,
R`,.) <-»), LE' I'
K.{(1-1('R , 1982 11 , 'PM i`j"JL. U fl 4'
1, (,1 '(; 1,,,(
2, ryj f
I ;'.1 n L1, (i H fi. j 0:
,i; , ' 411'((( ;1; J E1 1
1 ¡4)41, 111 fJ , '(1.J ft, TY, -1
tsifi ((a U SITC rt. , 14"hi
11`4 ( HS ) ,
"L- 1'6 1 111 ' 1J',J
JI l',11/L,J_-<_"b -L 143311, 111 1-11.,1,1,
IL 1¡1-1, 11<j - (.1( Fr
if fJ 111J-41:( l< ,
IL '411 ) tI (
: .ft, ;
1.1' ,
,, 2; 111 I
,;;. ;a b; L
11,1 NJ- 4(,- 4.
4l r.K3- liJ (J ,12 fr. ,(1' 1P
"If d L L if ,T 1/J I' 911 In .1"
iJk (z:( /6,6 '66.16, 6 :.,,J6:; `4
(t, J(L, '(,1 J, h (s- t.`41),< 9[J 11,'.1
44 14'(,,J `,(J` L 4(4 1 sHJIJJ, 11.-t Y:
J 74 15 (L L) NJ 111
I,IiÁJLU, 1 000 ) 1, ,
H).J:t/4 )W1:,1 )
ILL- 17)1 (i 1(L (1, 'l 'I 11(1.1<
(J " ", 1JJ I< , 1 500
1- 500 .
xN;
{1 .')t; r,11).! 1:1
;; "JI,, F o
1, J1,11' r`,( r F ) .}.11 * , ¡II (I,
f(J,
11 juZ
.- ',II',),/ , );J
/II Ord 4 J JK J)1 rr,j 1.0) j
1" Y, '1( II I ri<J'ir...r.(-1,,",
I'] -11L fi: J ,',4.cI I,j J'd. 'A 11-Y,
44I)LI 'f Planing and Statistics Branch, FAO ForestryDepartment, Viale delle Terme di Caracalla, 00100 Rome,
Italy +39-06-5705.5514 J,41+39-06-5705.5137:
J. J V. [email protected]:J.--crissis.vici©fao.org, X. J '(((
--eva.borzillo©fao.org. X J'L 7413'
0,11j; vi-'[email protected],
CUM
MT
NC
'140 L I 4'4iL 11],11t-: ,I14: (111-1T: 4144
X ., )444 , 1982 41 H ftIt:III 'A_ X -11- 4-14k f4) "11,0:1- :141:1
tie )44/
.11:14111'. . . f`f
fì iff ,`ft . z, 1 ,
-414,14
1,1,L J'"(I I 1411Cf ,
,I11 L y )
1 htL'1'.3 'I I_ 1994 )
° 1411 Li !ik
11 [1! t 4, 1,0,1 1.2a
L fI 1 1f' 1'1 I ! f
14 t/1 i '11 111' 1'10.4,
ut 2f LY zf [4' 4-)1.
I 1 "11
L k I ' f'v, Ji 4,44 /1 1'114111:I f
eaM11 4, 4144:91I: )
:f4. Érf t'y H f HHHI :11111:'
1I1 411.444 , 1):,11-4!f.) ):,
4 I t If 4.11-144.14k ';t:11
HL41,44,
.4:1 I 1
. 1t,it, 1 1t11,1_
ftf, t, y'd .
r/t
1111:4141 4,14k 411:144.- IQ eRT:&:
1-'41;41 I 414'0' ik' 144 44. If; ['III). 41¡.11421,4.
L f ),J I
,, , 4414III o[i ,
Hi' 444.41:I 14: e 441":1: IA; 'III (4' lz>/fif
Vi
tu-
,Liff¡f tiff: ,u [t,,f
:14:41If) fqt ttft. J:k
L:114 /1
ffy,ftartiy:
Urflittjf. 1,1 f
{),-/t2/.fi:,t
L Hf''ft), Lt. L. '' L Lj6,; 6
fI-k),- ...) JR LI ffr fftf .ffif
011 ;I(' 11:1411 I
111 1 44 ilf/1 -44If
t-VrAiger,f[l r,
414111.1',U
' 11101101 81', 11 I: I 41 111, )1' ii411
:If., 'i rrz )1_ X. 6- 'L' I:111.1 '41 11: : :III 'U
14)1 .1`4.1`444-11'11 I III H 11 Ill 1. I:1111)
4:41 1411::11I4Th:
/1),1k,ii)I L ILL4`) ).4,44:4. 11,11f. 444 Ili/ 'fi H'[;17:L 'f L.1') f[i l f f.'"K 4k 1114x In 1414
If 'i' 1:r . 144`r 1. 4. "11 Yji111I
111. b il)1:1`4.114.: 4,H . "NA- 1,)
'-; VIII411U 1. '')." k 44: II
1/ s 1/Il L L fi. 144 U P) ) );. (.41 t)4),
. ' ), Uk UL L ki'111.11`I " 14). T
rt.i *it . L- H ¡HI III 0.4
)4) 41 : :144,_ 4, H. I f] fLff iAI411i
.34/.Z14.:1 t o FIL )y. 1
,4. <, L 1'4_1
11 'J : I :4411'111 444_ 11I1)
41.1)1_
H(y,-1-[]-L)
14: . If( ko/.4)k J.! I, 'I o 't
ftf , di14: H /111
)14;411414/' ) :WU 11 : 44: 1)11!11 I 4444:i :01
Ifif II:4)1'41X I Lf.- if.. u .' II fA, ",1
60 ,1.1,44(,'. f. [i[fii '1 .1 el
4,1,1i )14 )4f44 4, 44 )..) 41-- 0, 44, 41141' f4,41
I)1:1-fl II/4) 1}.4'i' 14:4-./4;41f,
dJ, 6 Irj "61- IA .1;11
1,; udj,.Ct. ut I r[1t y yam:tq, i. Hitt ff't ft1t.i4;Iff
18-441,e141,
//)
ffr rfu.'1111t'
11
EK: '4L
1,L,
tki[t,,
91-441i 441,111kk J
it; ftt riffAtaTtif-,J.J t'f' iz.;
), t)11 11' 44jI
)))1, od 11 ' AIT1111; )i '1.J))!k 1.14 11J
)4c )1) {44 IdJ [1i [11.11/ ) 1')J tolM,
11 ,1L)) 11 `1')J ,L )[_. 11i-t.. tA 1,k )3 11 );
A' f HI )4. 'kJ"; fi]
111'14 ) , 1).14, oA t- L H
)14 ) 'Y fir
,
44-11-f )
,H k A (I-rot14-0-14)
1)1 1 '..)(1 1)44.),),) tfi 1,!. 4\
11 " Ai i)1 H k ,9") ,k), Al 11111 "11 1,k 4-
)4 .4" 1,!¿. )
(..[)4;
. HH,
.Arefil)11/,tR1I
, irAiz
.-1',113 91- 111 11.1))" '1 11, iLL 411 .'k.
. . Al tA II L f4 , ,1.11)1,
f A. A 1-1 )); ;,),K
).. . 5.), k) f)) )
**,4H44 .. .1111.1*
fl14,J1, 4 HA 11. f-.4.11,11t , ,..),41.11141A),A
fi)));:i)1)..)..)k -1- 11, 4.; i, 11111 . YE]
14, 011 kITT 11 ,1 ,6 11 1 .1'.1
5"H .k.)), I .-.14,0.; ti t) ;).. 1, 1.Th A h J.
'f) .4k.1), "Si', ) Li -41)4111<. ToJ
o'T it\ '1. .t k 1,)] t.41.. ,
1Ifi 1,4 ii-1)4"ilp; .1, , 5 ',L,H4t
V.,+-ff, 11_4 it 141-)1 _ri ), -1; I., ft: 11
V )1), 4k )14 , 14, ,
)11 A ).)., id
. 04)4. 1)1, o 4 11,
AetR.
1.1atIti1. rt.i
*i.,-[-rz .1 to. ., 1995 ":1::ToL
)1»j N f, FE ' 1995
)11,
1. 4.1.4( ),J //,' ,
f-111», :))))..i');', 11 15 11'1'3 K
44M: 111 .
11)))))).; 4,- '1)4 loiT, 11.
,/
All
t1T.
ITKI"1 f11. !11))< I 1 ).C2 r';', '1 "0 11 141, EL
11)<, AH'] L. 114),Iti)1'
',`2 J 44,JJ'
1!11 [I' '. IL 11.1iii 11',
f!,, , )1 IA , 1.1
) 'L]
[1,1
T. .J'k 1J.,o vt,. . ['()
flQ )_/ o: .
{1)))f ii)))&12_. )i 14'4, ) '
f).)..) ;4 )1 .411' 4, 44 j A..1) ), I f, 1)1
1 rd ' %f
..),
1,; ,1 A A) '1' 1L;41-1.
Hi+J+ . ,11; '1) 44 c" A !fli 1H ))1i
I )11 (.11444 )1,-) 4 I-1. fir) 1't A))11 ',1( .. f 1
-11 :)11 1 )4H ( )1 HP!)il.f; 4,1
4,I. K Rif) 1,114 1)1, 04 ,
11" . 4.11, 1 '0*. 11i 14P f) ,YA /1
)1,: )1,
'IJ 'It 14 C, ;Hi
!1-. T1,1 I [12,
H
'11 fl )
111 'f.J ft. t11 ,
1.1 2)-
)1,-4) fir 14.)
4- 4,L).])111A
ffY
H 1,1
i I )11).11J 11. 1,
141 I; 11 t] 01 TJ1...
.1.1). ..1)-
)1), '/Ì 1-1) 31' '1', 11 /I
IL Ili Li..frff, : 11
O 'PI f
i. 41.1,k )1-' f"..-1-411.
1 rzYq F- )1;-: F
(,/
0.80
11 'ff ''' ti
1 1994 1,1,P4 f'»,
4Lr :LK r"/rf: 1 .."1. -IL 44 41 '.1¡/,,"
o f:"0/L H I 1 11 ffk Off f": f
fr'ff
1995 ,I
OCH ,)11,L 1994
12 4',
0.5 ;,/ Pt'H 1995 i :L"
ffi f".3f. ff< 11 " !,)), )/K s
As 40 J.15c.M.
11 54 lu
1 0.5 ic./ s' i fL O 0.8 rf`rirt
F.14.1 ff;LU.41. )4- 51
f-..k 4.14 54.4".. IA ;1) ;in bk rfrfFf
fr'Q fffE L.. . frlY/ N VO.
-F 'k"-;:. fliff-k 1 g )5: fk 'I 414 4.4: ft. VJ *1)14.:
4).; 41...` 4 10 if 44 4/1)- ) /1. ;(fs
E'k [..11;
:
i. 10frz, )
!...ffiI-4.1..4K 1 k ;I"! .jr' 411.
5L1.41t 411 fL,'"! 1415.' fd ...II J Pt' `kL- 1J )J F)
4, 1,r; 14;54.1; f J rJ1
IL .4r trf 4, ;K. 1L. 1"1. 14, )51,K br
fi ;IL Ft!, F; L ,F 10/./.;o-fri )
g. H f4L- 1
ffkT;f14 4t4 .)11)
. tA:F 10 s'sfH
t'l I- to1 115L H .; 1,1
." I Fr; o '4.1;4 -`44.4f4.: H, 1 En frfr ffIr
viii
T fs'3.1sZ
-ffiE-fl.L-f2' PP, T1/ Lfx 8-2.}
L 1,1111 f-r, fItk 4.) HFL 11.1! 4K. 41,- -41
gt 11' )Iy 44)
1-;L:
t10'( rf)./z;4i,ti fir
r"F' rql 1.1
3;'S :Eii 1" _ .
E
srfr . rf,f - !ff. fr.] riff vsk V ), r`rfrL444. H is I fik
:4ff]Or' il1 I ffk -9)-; 111 i. FL ,f),( )
t ft i'ffi ,;;;,) ,4';411
11f. FJ Ff FIJ 10
) -f;"f/z4Iff f'kc If) j"-.. 441' r 4;1 Jrrr 'I' JP I
rffir J T-,, HL li
4-4o'4_144
141: {A)),
- ;Ir.: Pr 90,
1)), ) Fi
,11't f 'AL ffr 'JO "fsr.
. ' 1, 10 ,fL, /1(
'Lrf i fs
ji
rfffi fd 11).1 k r.; r 4111f4.K.
1411.11'i»( tJK ,fo FiJi fir'ta+A. ¡ILE rr '41 , rn-
) . r141',1411I , Of; . H (1) 44.
-`).: .. : . Hi 151 4`.4 14--,1 L.Fk
'i i( 10 < ) Y.1'0JV4L4j
EI
'Ti 20 J , ff, fiL rfrk
fir JJ
LL.. 1st rf,',1,J'ILL:
/14 141 -L4H FT LtH20LLT4aitz 1 ij 2ft ,
j3_",,'s i - ttk 5 ),1, ',If 48.13
''Pr, 48 19 151 1)1.1 36 , LOr Ir
frk a F. 36 ILI, .1<:, : FF3 K )1 )f
TEiJri ..t.: , rr'ff
..4444./4;4'i
4.k.;12 41% Pr VL
=1- Nt HL. ,L , I'»rf'r 1ff 'I' L, l(r r 'r
40 rit!, 4,41 pf 60 ,;cf. fi ft".. 1, irlr' 4frf. rffi, f [J.
r
ri'IJ 'L i, q j i i --
I-
.1t
:L J..- di At . 1.),
EEz
d 3'
_4():
Pfr
N.:+t 1-1.
-k
r
ftk ,
''C':;
ix
*tfriAFIP [M*1/4H 4'14 lid 11. . {111 Id( 411,1.1R (411 -.4g , 6).44 )L44-1:4
Y: ,d, II H. I 41 1,44
JP144444 HI li)<)itti I Li: 44414 I tit 4)14.1114i) 14
iLL 41)1114iIrriL 414A1 [144
,/
. H )4, rO, ,O. I- 441, 4444.4'4 ,4,14), fl`".1
r d FL 11 z4' L//'.4 fY
6 'I rir 4-11LA ),". 11 i rL.f L4. , 141444
' .11,4 LL '.LL -- r))L .1 r 'Ili 14) It. l.) I r it! rrir 44i ri ,
1988 4.14. k 164 'if //,1
IY"J V.: 11'1 :1 '1' U 4-1 Fri)21.-11:'
111.11-4L it". 1((lb . .:47 HS /4k. 42. trt I 74: fill 1:Y 11/' ! 44, 'LLî, SITC Rev 3 4 HI
). 'rrr : )41) J. Pi [V: <klid 11 iii 1 000 K. 441) ,4 2,36r 11 ( ).41. 14. Lc... d'd '1/4 J.Li. Jiltritz 4: itiltr'11,44) -1 000 )1. 44 '14 fr 414 (Li
41, H,4)., kitÌ.1 %1K ; !lit<
4I1L Ill 4444.41 :, ,41.1)1)it. Ji 1..6 54, 'I L 44441 411 4)4;14 itll 'V (L (4.
r 4)), 4444L4 44, 14.44). 44 jJ, 11 I ii! ).4,H L. Lr Jdur, !.14
1,114,441,.4, itlit 14 . j 111r, trdi 14; 16.1.x.144,r" ><141.41,4,4. L4, 3 r , Ifil i.1(1( L.1), riL I 41
4. I', FL H FI -( 1,r''F IL;%, Hrt.rz LK.) 414- 4","41,
27 , 1995 fr fill IV L 6 I Hi,' I r' 1, 4'414ri tr)
I : j'irt I_ 1,1 NI 111c.f)Z
d'd , '),),t111141,4-)41. 41 1.411
41 Id' 414, id, 14J tl
ht;t, ji.1 4.1,. 444 .411i L '14 )Z.4 ,14,4 1,) f.( , )(
''. N. Ill 41, .1 Li: ILL
Iril QL. tli I 'H F"
4,"4, !,]
Ase&1'1'1
Jlit 1, Li) 44446 4,I I '' '1 i'
K. 6 .41 jt, t.r. .1)4. ILL
!-1`, .411 )111' lx 'id:
111,1, Id 41 454114
L.11i11: 4,:r.644.14, Lit-4A ll1
VJ'YrtA
i), IriL L.' i I '4,44'
1:1_1141 " !". '4111.1144 iir.
" 1(4
'PI 4,, 14 j ,', .
L' . (411- iL44).L. , I. It , : "I)
.44.1 t...itIL.LQ L 4) ill 41,
'Li( 41)11( ki 6 k , L 114 IV, irk fr.41):41.'4*
rd L' 1,4 f .(4,;]
.144-1144). !I,"44./ '11 Hi: ; 4I
IL 414111dr
f1MAR
I Ill K2 )11 rfr itt, 4. K. 1,Yri4
lit 4,1 ,i ,4,444, ,i 4.,.14t, oh 4i..44.
I41
e=t'
[I
1,[
cr 1
14-'^
(P
.i-e)
LP.
A .:
R *
(1-1
,4-1
1.9.
(1(1
11[4
-
1.-
-::::
::::-
-
,,i)1
1-01
-)
(AM
':fti
R21
(-1(
(k(
1
u.-(
11A
.4-[
(7(.
(14-
4-*
g[t.
1)(
:* ,K
4-([
1([4
.5(
I)eA
k:1)
:f.:,
tk
ft..,"
'Mrf
f.(
.1.q
CU
MC
UM
CU
MC
UM
CU
MC
UM
CU
MC
UM
GU
MC
UM
CU
MC
UM
CU
MM
TM
TdA
Tm
rU
S$P,
I,E
,CP,
I,E
,CP,
I,E
,CP,
I,E
,CP,
I,E
,CP,
I,E
,C P
,I,E
,CP,
I,E
,C P
,I,E
,C P
,I,E
,CP,
I,E
,C P
,I,E
,CI.
E
CU
Mi.e
p p p p p p p pi.e i.e 1,
ei,
e
p,i,e
,cp,
i,e,c
p,i,e
,cp,
i,e,c
p,i,e
,cp,
i,e,c
p,i,e
,cp,
i,e,c
p,i,e
,cp,
i,e,c
p,i,e
,cp,
i,e,c
p,i,e
, cp,
1, e
, cp,
i,e,c
p,i,e
,cp,
I, e
, cp.
1,4
-C
p,i,e
,cp,
i,e,c
p,i,e
,cp,
i,e,c
p,i,e
,p,
i,e,c
p,1,
4-C
p,i,e
,cp,
i,e,c
p,i,e
,cp,
i,e,c
p,i,e
,c
i, e
[..,
"kt
CU
M
:t
CU
M
CU
M
CU
M
CU
M
)C
UM
CU
M
CU
M
1^.(
1'C
UM
i, e
IIC
UM
1,e
.;
.C
UM
e
MT
i, e
fRIK
t4C
UM
CU
Mi,
ei,
eC
UM
e(
(11f
1[1-
)C
UM
eC
UM
eC
UM
1,e
k^[..
'1(
CU
Mi,
eC
UM
eC
UM
i, e
CU
Me
MT
i, e
MT
i.e,1
(t.
fg
MT
11 IF
114-
4-M
T
KiV
2M
T
M7'
ed
MT
mr
EI^
Ka:
MT
e
Ar.
."((
Pf
e
[11(
3^1^
,(11
11,,,
,M
Te
(*".
[(4
; 1,
r-M
T1,
e(^
T[f
^JM
T
5(1
^M
T
VA
T:
g,i1
Ii(P
)"k
` f
[(((
k''-[
(if;
y (p
)":
p.,
=y1
) I
r;f.
r,#
(1fP
,"[I
W (
E)
1.4(
1(e
f,1
E=
1.11
Lry
:Jf
lillh
ii (C
)1
(P)
,(1_
)44
Ii..^
1^,^
^14-
^ (E
)I
;,).
te)
rrjq
l. ^I
)If
(E)
.e)
P-
Ofr]
111634.12
C=1137T7V R7143 er'J .7'6134r4 i'-cralAt4)57 :
(1996. - ) Er13)V (T) -Rt*.Cf).7'' CM 96-t&iiti
44.01.10 44.03 245.01 247
44.01.10 245.01
44.03 247
1 CO ) ex 44.03.10 44.03.20 ex 247.3 247.4
I I ex 44.03.10 44.03.40 44.03.90 ex 247.3 247.5
:i'l 1 ) ex 44.03.10 44.03.40 ex 44.03.99 ex 247.3 247.51 ex 247.52
44.02.00 245.02
/1' 44.01.20 246.1
44.01.30 246.2
44.06 44.07 44.09 248
ex 44.06 44.07.10 44.09.10 ex 248.1 248.2 248.3
( 11:6. ex 44.06 44.07.2044.07.90 44.09.20 ex 248.1 248.4 248.5i',{j: f1 44.08 44.10 44.11 44.12 634.1 634.22 634.23 634.3 634.4 634.5
44.08 634.1
F. t. 44.12 634.3 634.4
44.10 634.22 634.23
r P h 44.11 634.5
11'2 7 1,., 44.11.10 634.51[1 tt, I f I (if r 44 .20 634.52
IL P. 44.11.30 44.11.90 634.53 634.59
1E3 1, 47.01 47.02 47.03 47.04 47.05 251.2 251.3 251.4 251.5 251.6 251.91
Pi_ lq,. I, ',.. 47.01 251.2
47.05 251.91
ft,'' ,k '1 . 47.03 47.04 251.4 251.5
, '1' tr[. i' .,. ,.. 47.04.10 25 1
1 1 'F ,,,',,s 6 47.04.20 251.62
1, '1, Tri. '1, ,' F1 47.03.10 251.4
I 1,1,1 47.03.20 251.5
47.02 251.3
11, - I 1, 1.. 47.06 251.92
I 47.07 251.1
[. 11 P. /E, 48.01/02103/04/05/06/07/ 08109/10/11 641.1, 3 4 641.51.'52 535456157"58 9 64j.6'7 641 91/921 lE11.6 48.01 641.1
11'1 E,E. "E / 61k 48.02 48.09 48.10.10 48.10.20 641.2 641.3
E IE, ' I It. N. 48.03/04/05/06107/08/11 48.10.30 48.10.90 641.4 64! ,5j 52'53 .54 -1 59 '41.67 64j .9j 92
kL 1 l' III Ij. 'I 'k, 48.03 641.63
I L I, -Q, I,. 5 48.04/05/06/08 48.10.30 641.4 641.51/52. 53;54156/5- 5' 5916162 -64:69'74 7 6
48.07/11 48.10.90 641.71172:731771779,91.192
f9ii /hp-
x44.03.111- 4.03.10 j-111-I./Li I >.'1.11 4:4,--
) : 44.08.301A4:1144.08.31
frA115:9-111:1:.',1/..111 /1'11".11.. 634.1 L4Ló34. Il
AFRICA
AlgeriaAngolaBeninBotswanaBurkina FasoBurundiCameroonCape VerdeCent Afr RepChadComorosCongo, Dem RCongo, RepCote DivoireDjiboutiEgyptEq GuineaEritreaEthiopiaGabonGambiaGhanaGuineaGuineabissauKenyaLesothoLiberiaLibya
MadagascarMalawiMaliMauritaniaMauritiusMoroccoMozambiqueNamibia IiLLLLL ,11,
Niger 1[1! I %J.Nigeria'U IVReunionRwandaSt HelenaSao Tome PmnSenegalSeychellesSierra LeoneSomaliaSouth Afr caSudanSwazilandTanzaniaTogoTunisiaUganda
.)L Lt
itafflAVJN6- cip 3Z
N C AMERICA JX fn 41
AnguillaAntigua BarbBahamasBarbados LBelizeBermudaBr Virgin IsCanadaCayman IsCosta RicaCubaDominicaDominican RpEl SalvadorGrenadaGuadeloupeGuatemalaHaitiHondurasJamaicaMartiniqueMexicoMontserratNethAntillesNicaraguaPanamaSt Kitts NevSt LuciaSt Pier MqSt VincentTrinidad TobTurks CaicosUSA
ArgentinaBoliviaBrazilChileColombiaEcuadorFalkland IsFr GuianaGuyanaParaguayPeruSurinameUruguayVenezuela
ASIA
SOUTH AMERIC
HE A
ZambiaZimbabwe
WORLD
AfghanistanArmenia 'I,
Azerbaijan1
Bahrain LBangladeshBhutanBrunei DarsmCambodiaChinaCyprusGeorgiaIndia
IndonesiaIran
Iraq
Israel
JapanJordanKazakhstanKorea D P RpKorea RepKuwaitKyrgyzstanLaosLebanonMalaysiaMaldivesMongoliaMyanmarNepalOmanPakistanPhilippinesQatarSaudi ArabiaSingaporeSri LankaSyriaTajikistanThailandTurkeyTurkrnenistanUntd Arab EmUzbekistanViet NamYemen
EUROPE
AlbaniaAndorraAustriaBela rus
Bel-LuxBosnia HerzgBulgariaCroatiaCzech RepDenmarkEstonia
I Id
;-
it tIL V] tPFy 3Z
LA.KP,,P111,1
xiv
Faeroe IsFinlandFranceGermanyGibraltarGreeceHungary NIceland ,[!,
IrelandItaly
LatviaLithuaniaMacedoniaMaltaMoldova RepNetherlandsNorwayPoland
PortugalRomaniaRussian FedSlovakiaSloveniaSpainSwedenSwitzerlandUK ,- I
UkraineYugoslavia
OCEANIA
Amer SamoaAustralia
J
Cook Is f
Fiji
Fr PolynesiaGuamKiribatiNauru
Newcaledonia L L ,11;New Zealand LNiuePapua N GuinSamoaSolomon IsTokelauTongaTuvalu ..J''VanuatuWallis Fut I
11_ 11,f1111.,-;
AX414-1-{V_
1 00C;
50 /,. 111,1:
,
1
1 A'/../Ci
1 000 ,j9
XV
f1.1 t-V-41:7 1R fifil
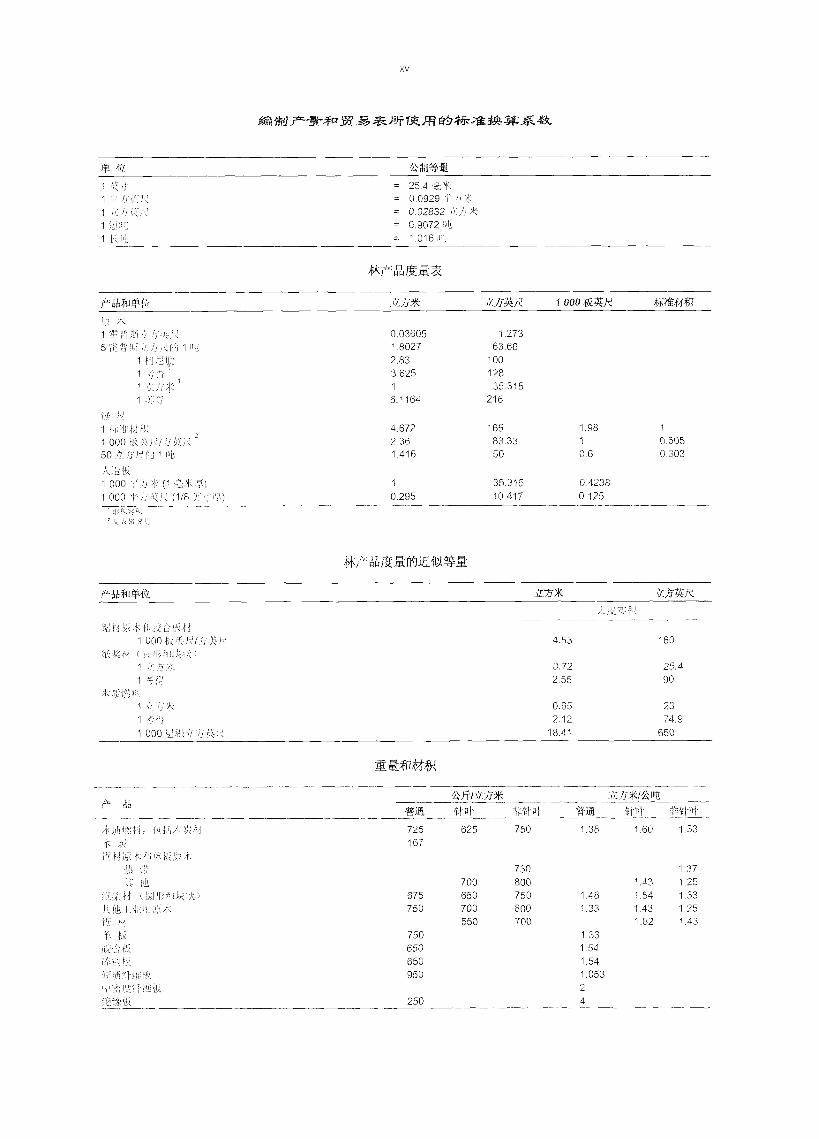
= 25.4= 0.0929= 0.02832= 0.9072
= 101641f
*V-'nnnlirMLFV- 1
),1
/37-5* ii'Llf*PL;Pit
.t-to
725 625 750 1.38 1.60 1.33
167
730 1.37
700 800 1.43 1.25675 650 750 1.48 1.54 1.33
750 700 800 1.33 1.43 1.25
550 700 1.82 1.43
750 1.33650 1.54
,
10'
650
950
1.54
1.053
7 2
250 4
000 &4X
0.03605 1.2731.8027 63.662.83 100
3.625 128
1 35.3156.1164 216
4.672 165 1.98 1
2.36 83.33 1 0.5051.416 50 0.6 0.303
1 35.315 0.42380.295 10.417 0.125
4.53 160
0.72 25.42.55 90
0.65 23
2.12 74,9
18.41 650
1 000 1/1 000
1
(1/8 /f

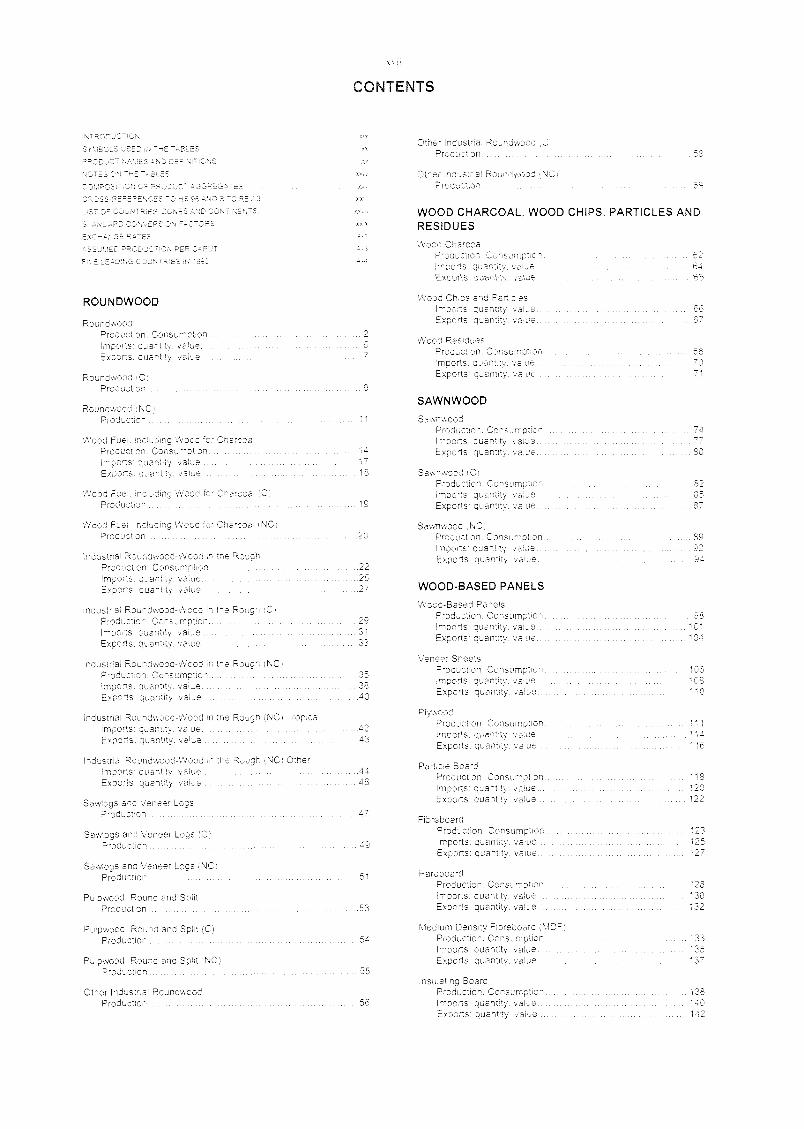
ROUND WOOD
Pr - r 2
5
E
P:
ROL:" 7 NC)
Industrial Roundwous-.'. di. Ine Rougn .CiProduction ConsumptionImports: quantity. value 31
Exports quantity, value
Industria! P3i..ndwood-Wood in the RouchNatOtinsurnptior 35
vadue ,,,, 38
Exports .7' Llet. value
industrial Rc d-iiVood in. the Rough iNCi Tropicaliimport:, alue 42
Expon: e
Industrial Rc n :he Rough INCi OtherImpori: ue
Expors .alue .46
Sawl:gs a- . sineer LogsProc :n
Puipwood Round anc Spilt
:0"; for Crarcoa,
or Charcoal INC)
Sawioas and Veneer Logs (C)Production
Pulpwood. Round and Split f,C)Production 54
Pulpwood. Round and Split (NC)Production
Other Industria] RoundwoocProduction 56
CONTENTS
WOOD CHARCOAL, WOOD CHIPS, PARTICLES ANDRESIDUES
SAWNWOOD
SawrwoodProductiod C-Imoorts guar: d.Exports Qua 1:
Sa wrwood iCiProduction C[6r:cords c.Exports c.:
SawnwoogP-:: '2!
e RoughPro:: 22imp° . di;
Expo-di: qua 27 WOOD-BASED PANELS
Ext. nw quantity e
Wood-Based PanelProduction. C:imports: qua: !
Veneer ..Pro 7. -t
Exg txds
PlywoodProduct in!mpiortsExports:
Pardiote Boa-.:Product': hImpDrtsExports .tu
Sawiogs and Veneer Loos iNCProdLction Hardboard
Procuct :n CoPsimports tiu e
Production 53 Exports Qua--;
5,6
FibrecoardProducton Cons mptio6Imports q.:antity. vame 125Exports quantity. value
Medium Density F re::Production. Cons.. 133
Imports: quan::. 135Exports: quantity. . 137
for Cha
.
Insplating BoardProduction, Consumption 138
Imports: quantity. value ,, 140Exports: quantity. value 142
one
118
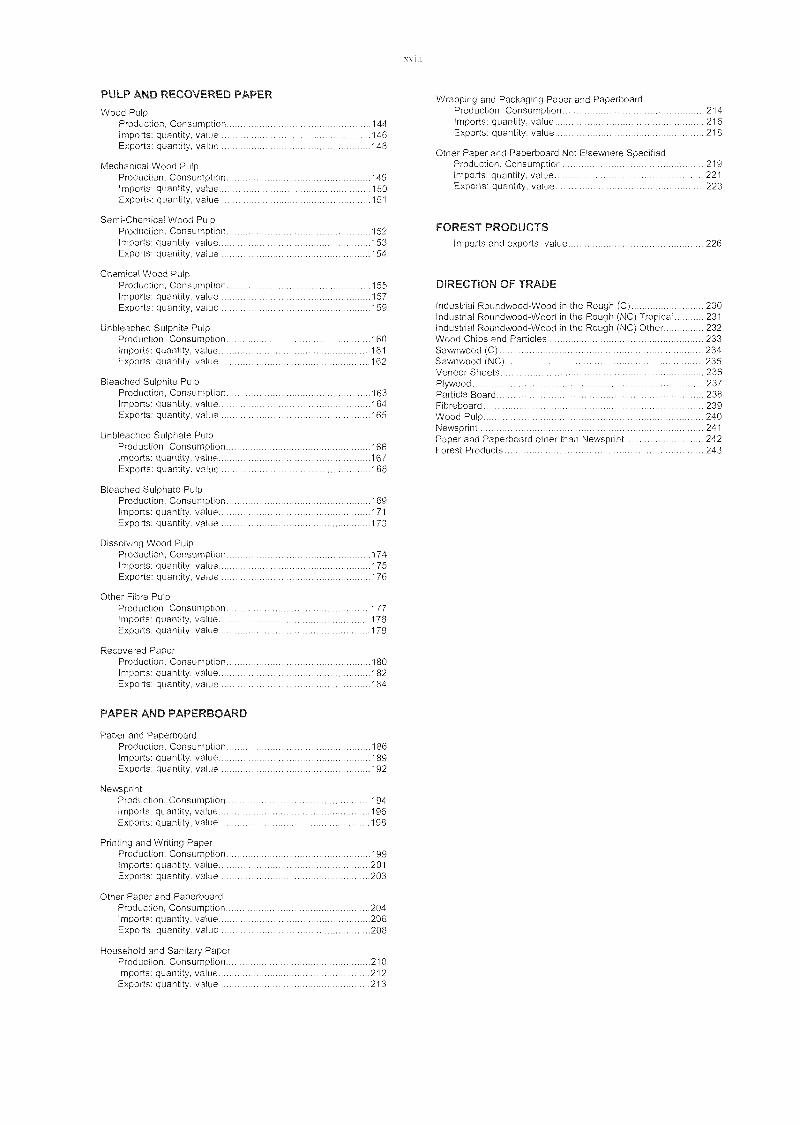
PULP AND RECOVERED PAPER
VVood PulpProduction, Consumption 144Imports: quantity, value 146Exports: quantity. value 148
Mechanical Wood PulpProduction, Consumption 149Imports: quantity, value 150Exports: quantity, value 151
Semi-Chemical VVood PulpProduction. Consumption 152Imports: quantity, value 153Exports: quantity. value 154
Chemical Wood PulpProduction, Consumption 155Imports: quantity, value 157Exports: quantity, value 159
Unbleached Sulphite PulpProduction, Consumption 160Imports: quantity. value 161Exports: quantity, value 162
Bleached Sulphite PulpProduction. Consumption 163Imports: quantity, value 164Exporta: quantity, value 165
Unbleached Sulphate PulpProduction, Consumption 166Imports: quantIty, value 167Exports: quantity, value 168
Bleached Sulphate PulpProduction, Consumption 169Imports: quantity, value 171
Exports: quantity, value 173
Dissolving VVood PulpProduction, Consumption 174Imports: quantity, value 175Exports: quantity, value 176
Other Fibre PulpProduction, Consumption 177Imports: quantity, value 178Exports: quantity, value 179
Recovered PaperProduction, Consumption 180Imports: quantity, value 182Exports: quantity, value 184
PAPER AND PAPERBOARD
Paper and PaperboardProduction, Consumption 186Imports: quantity, value 189Exports: quantity, value 192
NewsprintProduction, Consumption 194Imports: quantity, value 196Exports: quantity. value 198
Printing and Writing PaperProduction, Consumption 199Imports: quantity, value 201Exports: quantity, value 203
Other Paper and PaperboardProduction, Consumption 204Imports: quantity, value 206Exports: quantity, value 208
Household and Sanitary PaperProduction, Consumption 210Imports: quantity, value 212Exports: quantity, value 213
Wrapping and Packaging Paper and PaperboardProduction, Consumption 214Imports: quantity. value 216Exports: quantity. value 218
Other Paper and Paperboard Not Elsewhere SpecifiedProduction, Consumption 219Imports: quantity. value 221Exports: quantIty. value 223
FOREST PRODUCTSImports and exports: value 226
DIRECTION OF TRADE
Industrial Roundwood-VVood in the Rough (C) 230Industrial Roundwood-VVood in the Rough (NC) Tropical 231Industrial Roundwood-VVood in the Rough (NC) Other 232VVood Chips and Particles 233Sawnwood (C) 234Sawnwood (NC) 235Veneer Sheets 236Plywood 237Particle Board 238Fibreboard 239VVood Pulp 240Newsprint 241Paper and Paperboard other than Newsprint 242Forest Products 243
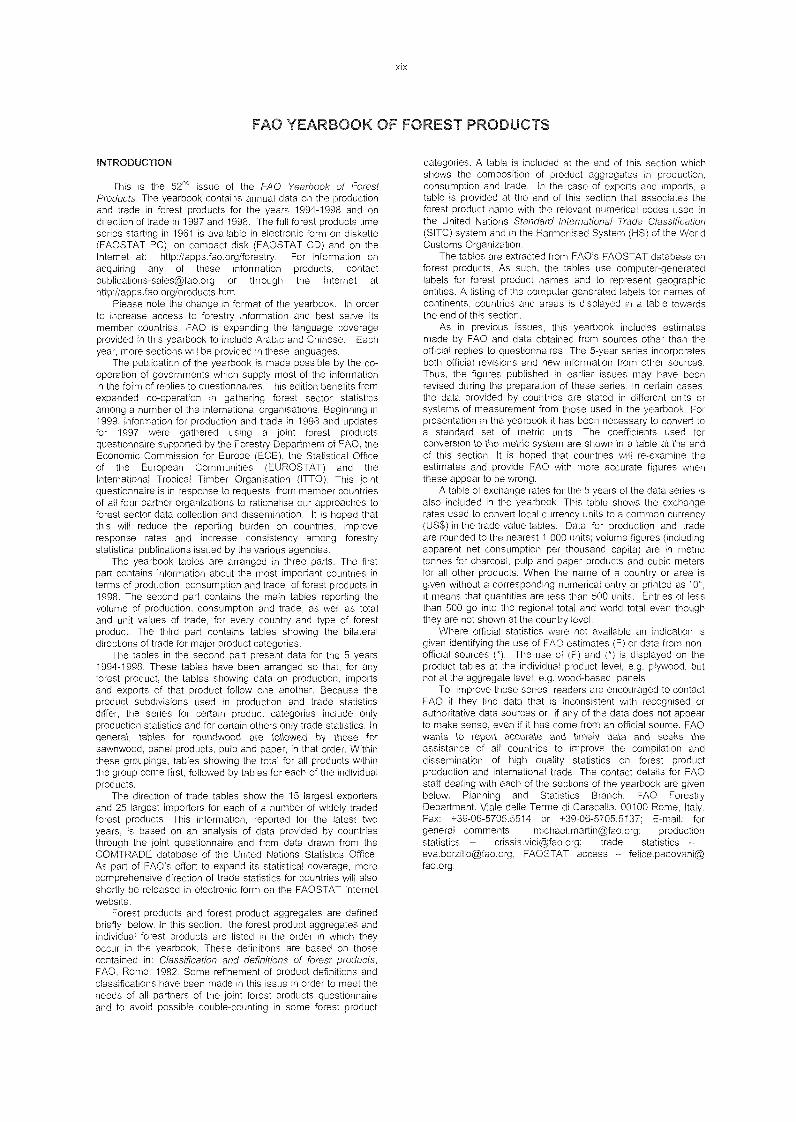
INTRODUCTION
This is the 52'd issue of the FAO Yearbook of ForestProducts. The yearbook contains annual data on the productionand trade in forest products for the years 1994-1998 and ondirection of trade in 1997 and 1998. The full forest products timeseries starting in 1961 is available in electronic form on diskette(FAOSTAT PC), on compact disk (FAOSTAT CD) and on theInternet at: http://apps.fao.org/forestry. For information onacquiring any of these information products, contactpublications-sales©fao.org or through the Internet athttp://appstao.org/products.htm
Please note the change in format of the yearbook. In orderto increase access to forestry information and best serve itsmember countries, FAO is expanding the language coverageprovided in this yearbook to include Arabic and Chinese. Eachyear, more sections will be provided in these languages.
The publication of the yearbook is made possible by the co-operation of governments which supply most of the informationin the form of replies to questionnaires. This edition benefits fromexpanded co-operation in gathering forest sector statisticsamong a number of the international organisations. Beginning in1999, information for production and trade in 1998 and updatesfor 1997 were gathered using a joint forest productsquestionnaire supported by the Forestry Department of FAO, theEconomic Commission for Europe (ECE). the Statistical Officeof the European Communities (EUROSTAT) and theInternational Tropical Timber Organisation (ITTO). This jointquestionnaire is in response to requests from member countriesof all four partner organizations to rationalise our approaches toforest sector data collection and dissemination. It is hoped thatthis will reduce the reporting burden on countries, improveresponse rates and increase consistency among forestrystatistical publications issued by the various agencies.
The yearbook tables are arranged in three parts. The firstpart contains information about the most important countries interms of production, consumption and trade of forest products in1998. The second part contains the main tables reporting thevolume of production, consumption and trade, as well as totaland unit values of trade, for every country and type of forestproduct. The third part contains tables showing the bilateraldirections of trade for major product categories.
The tables in the second part present data for the 5 years1994-1998. These tables have been arranged so that, for anyforest product, the tables showing data on production, importsand exports of that product follow one another. Because theproduct subdivisions used in production and trade statisticsdiffer, the series for certain product categories include onlyproduction statistics and for certain others only trade statistics. Ingeneral, tables for roundwood are followed by those forsawnwood, panel products, pulp and paper, in that order. VVithinthese groupings, tables showing the total for all products withinthe group come first, followed by tables for each of the individualproducts.
The direction of trade tables show the 15 largest exportersand 25 largest importers for each of a number of widely tradedforest products. This information. reported for the latest twoyears, is based on an analysis of data provided by countriesthrough the joint questionnaire and from data drawn from theCOMTRADE database of the United Nations Statistics Office.As part of FAO's effort to expand its statistical coverage, morecomprehensive direction of trade statistics for countries will alsoshortly be released in electronic form on the FAOSTAT Internetwebsite.
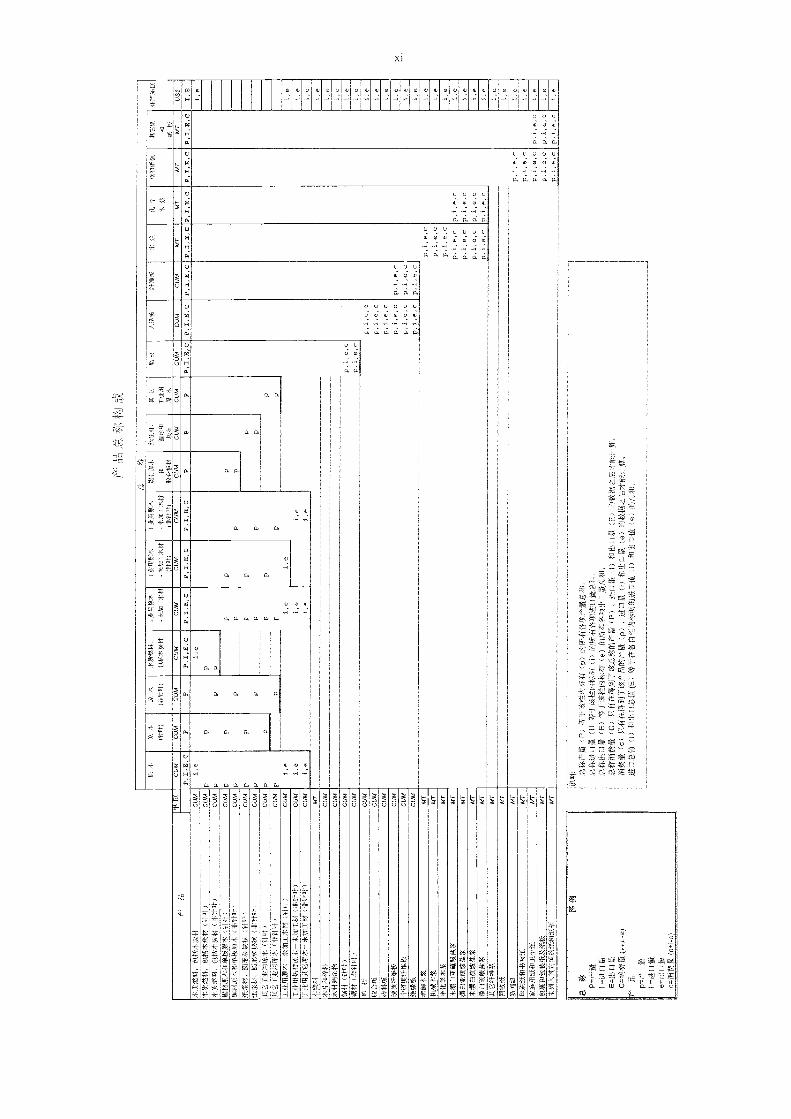
Forest products and forest product aggregates are definedbriefly below. In this section, the forest product aggregates andindividual forest products are listed in the order in which theyoccur in the yearbook. These definitions are based on thosecontained in: Classification and definitions of forest products,FAO, Rome, 1982. Some refinement of product definitions andclassifications have been made in this issue in order to meet theneeds of all partners of the joint forest products questionnaireand to avoid possible double-counting in some forest product
xix
AO YEAR:::, ,t'f> OF FOREST PRODUCTS
categories, A table is included at the end of this section whichshows the composition of product aggregates in production,consumption and trade. In the case of exports and imports, atable is provided at the end of this section that associates theforest product name with the relevant numerical codes used inthe United Nations Standard International Trade Classification(SITC) system and in the Harmonised System (HS) of the WorldCustoms Organization.
The tables are extracted from FAO's FAOSTAT database onforest products. As such, the tables use computer-generatedlabels for forest product names and to represent geographicentities. A listing of the cornputer generated labels for names ofcontinents, countries and areas is displayed in a table towardsthe end of this sect ion.
As in previous issues, this yearbook includes estimatesmade by FAO and data obtained from sources other than theofficial replies to questionnaires. The 5-year series incorporatesboth official revisions and new information from other sources.Thus, the figures published in earlier issues may have beenrevised during the preparation of these series. In certain cases,the data provided by countries are stated in different units orsystems of measurement from those used in the yearbook. Forpresentation in the yearbook it has been necessary to convert toa standard set of metric units. The coefficients used forconversion to the metric system are shown in a tabie at the endof this section. It is hoped that countries will re-examine theestimates and provide FAO with more accurate figures whenthese appear to be wrong.
A table of exchange rates for the 5 years of the data series isalso included in the yearbook. This table shows the exchangerates used to convert local currency units to a common currency(USS) in the trade value tables. Data for producfion and tradeare rounded to the nearest 1 000 units; volume figures (includingapparent net consumption per thousand capita) are in metrictonnes for charcoal, pulp and paper products and cubic metersfor all other products. When the name of a country or area isgiven without a corresponding numerical entry or printed as "0",it means that quantities are less than 500 units. Entries of lessthan 500 go into the regional total and world total even thoughthey are not shown at the country level.
VVhere official statistics were not available an indication isgiven identifying the use of FAO estimates (F) or data from non-official sources ('). The use of (F) and (*) is displayed on theproduct tables at the individual product level, e.g. plywood, butnot at the aggregate level, e.g. wood-based panels.
To improve these series. readers are encouraged to contactFAO if they find data that is inconsistent with recognised orauthoritative data sources or if any of the data does not appearto make sense, even if it has come from an official source. FAOwants to report accurate and timely data and seeks theassistance of all countries to improve the compilation anddissemination of high quality statistics on forest productproduction and international trade. The contact details for FAOstaff dealing with each of the sections of the yearbook are givenbelow. Planning and Statistics Branch, FAO ForestryDepartment, Viale delle Terme di Caracalla, 00100 Rome, Italy.Fax: +39-06-5705.5514 or +39-06-5705.5137; E-mail: forgeneral comments -- michael.martin©fao.org; productionstatistics crissis.vici©fao.org: trade statisticseva.borzillo©fao.org: FAOSTAT access felice.padovani©fao.org.
SYMBOLS USED IN THE TABLES
cum Cubo metreMT Metric ton
ConiferousNC Non-coniferous
FAO estimateUnofficial fiaure
S United States do llar
PRODUCT NAMES AND DEFINITIONS
General ternts and forest product narres used in the yearbookare listed below and briefly defined. Where possible thedefinitions used follow Class/fir:at/On and definitions of forestproducts. FAO. Rome. 1982. Some of these have been refinedfor use with the joint forest products questionnaire.
General terms
COniferoLisAll woods derived from trees classified botanically asGymnospermae e.a fir (Abies) Paraná pine (Araucaria)deodar (Cedrus) ginkgo (Ginkgo) larch (Larix). spruce (Picea)pine. chir. kail (Pous) etc (These are also generally referred toas softwoods)
Non-coniferousAli woods derived from trees classified botanically asAngiospermae, e.g. maple (Acer). alder (Alnus). ebony(Diospyros). beech t'Fagtis). lignum vitae (Gtialacum), poplar(Poputus). cae )t'ercus), sal (Shorea). teak (Tectorta).casuarina etc. (These are generally referred to asbroadleaves or hardwoods).
TropicalTropical timber is defined in the International Tropical TimberAgreement (1994) as follows "Non-coniferous tropical wood forindustrial uses, which grows or is produced in the countriessituated between the ropio of Cancer ard the Tropic ofCapricorn. The term covers logs sawnwood veneer sheetsand plywood. Plywood which includes in some measureconifers of tropicai origin sha also be covered by thedefinition." The term is oniy used here in reference to non-coniferous industrial roundwood.
OtherCountries that are not tropical (as defined above). The terrn isonly used here in reference to non-coniferous industrialroungwood.
RemovalsThe volume of all trees. living or dead, that are felled andremoved from the forest. otner wooded and or Other fellingsites. It includes: natural losses that are recovered (i.e.harvested). removals durina Me year of wood felled during anearlier per 'd tehmvals of non-stem wood: such as stumpsand branches these are harvested) and removal oftrees killed or damaged by natural causes (i.e, natural losses).e.g. fire windblou. insects and diseases. It excludes: barkad other non-woody biomass and any wood that is notreimoved, e.g. stumps branches and Pee tops (h,vhere theseare not hamested) and fellina residues (nahvesting waste). It isreported in cubo metres underbark (i.e. excluding bark).\Nhere it is measured overbark (i.e. including bark). thevolume has to be adjusted downthards to convert to anunderbark estimate
Pm:The sc ;tie or weight of ail production of the productsspa : w. It includes: the production of products that mayrr meo. e consumed in the prodLiction of another product(e.g. ro :op oh 0b may immediately be converted ioto paperas part di a continuous process). It excludes: the production ofveneer sheets that are used for ply,w,00d production within thesame country. It is reported in cubic metres of so lid volume inthe case of roundirood. sawnwood and wood based panes and
XX
metro tonnes in the case of charcoal. pulp and paper products.
ImportsProducts imported for domestic consumption or processingshipped ioto a country. It includes: imports for re-expon in somecircumstances. It excludes: "In-transit" shipments. It isreported in cubo metres of so lid volurne or metro tonnes andvalues normally include cost. insurance and freight (i.e. CIF).
ExportsProducts of domestic origin or manufacture shipped out of thecountry. It includes: re-exports jr' some circumstances. It
excludes: "In-transit" shipments. It is reported in cubic rnetresof so lid volume or metro tonnes and values are normallyrecorcied as free-on-board (i.e. FOB)
Unit va/uesUnit va res have been obtained by dividing the total value oftrade by the total volume of trade. The figures for exportsrepresent average FOB values. while those for imports representaverage CIF values.
ConsumptionConsumption is Apparent Net Consumption. oh oh equalsproduction plus imports minus exports: it can therefore only becalculated when data are available for all three elements.
Forest product aggregates and names
The names cf individual forest products and product aggregatesare listed below in the order in oh oh they occur in the tableslater on Separate definitions are not provided for coniferous (C)and non-con tercos (NC) components where the generaldefinition given above applies. Unless indicated otherwise. eachforest product category includes both con tercos ano non-coniferous components. A SUMMary, showing now al l of theproduct categories and aggregates are linked together. is givenin a table at the end of this section.
ROUND WOOD
RoundwoodRoundwood (C)Roundwood (NC)
Ail roundwood felled or otherwise harvested ano removed. It
comprises all wood obtained from removals, i.e. the quantitiesremoved from forests and from trees outside the forest. includingwood recovered from naturnl. felling and logging losses duringthe period, calendar year or forest year It includes: all woodremoved iytvith or without bark. including wood removed in ita
round form or split. roughly squared or in other form (e .g.branches roots stumps and burls (where these are harvested)and wood that is roughly shaped or pointed. In the productionstatistics, it represents the sum of: wood fucl. including woodfor charcoal: sawloas and veneer logs: pulpwood round anosplit: and other industrial roundwood. In the trade statistics, itrepresents the sum of: industrial roundwood wood in therough: and wood fuel. including wood for charcoal. It isreported in cubo metres underbark (i.e. excluding bark). Thestatistics include recorded volumes. as well as estimatedunrecorded volumes as indicated in the notes.
\Alood Fuel. including Wood for CharcoalWood Fuel. including Wood for Charcoal (C)Wood Fue Wood for Charcoal (NC)
Roundwood that will be used as fuel for purposes such ascooking, heating or power production, It includes: woodharvested from main stems branches and other parts of trees(where these are harvested for fuel) and wood that will be usedfor charcoal production (e .g. in pit kilns and portable ovens). Thero orne of roundwood used in charcos l production. is estimatedby usina a factor of 6.0 to convert from the weight (MT) ofcharcos l produced to the so lid volume (cum) of roundwoodused in production. It is reported in cubo metres underbark(i.e. excludina bark).
Industrial Round...DC D..... ;DC: n the RoughIndustrial Roundv.: in the Rough (C)Industrial Roundv. DC J-Wood in the Rough (NC)lht: .ist is Round...cod-Wood in the Rough (NC) Tropical
Roundwood-Wood in the Rough (NC) OtherRouncwood that will be used in the production of other pocosand ser. oes (except as a source of fuel). It includes: all
roundwood except wood fuel. In the production statistics, it
represents the sum of: sawlogs and veneer logs: pulpwood.round and split: and other industrial roundwood. Trace statisticsfor this category are only divided ioto coniferous and non-coniferous and the latter is further subdivided ioto tropical andnon-tropical). It is reported in cubic metres underbark (i.eexcluding bark).
Savvlogs and Veneer LogsSawlogs and Veneer Loas (a)Sawlogs ano Veneer Logs (NC
Roundvvood that will be sao. . sr chipped) lengthways for themanufacture of Sa3VIllV005 Or r r sr sleepers (tes ) or used forthe production of venedr f-ol-11. by peeling or slicing). It
includes: roundwood (whether or not it is roudhly squared) thatwill be used for these purposes: shingle bolts and stave boltsmatch billets and other spec r t.oes of round\xood (e .g. burlsand roots etc.) used fo- \ \ rootictiso It is reported incubic metres underbark e '1g ::are)
Pulpwood. Round and SplitPulpwood. Round and Split (C)Pulpwood. Round ano Split (NCI
Roundwood that will be used for the production of pulp.
particleboard or fibreboard. It includes: roundwood with orvvithout bark) th.at vvill be used for these purposes ,ts roundform oras so ur..od or wood chips maceo iteotl ' :heforestI 'roo' rioun:v,o2ol. It is reported in s o imetresunderbark (i.e. ,:u,oluding bark)
Other Industrial Roundwc.mtOther Industrial Rc sod C)Other Industrial Rc . j. NC)
Roundwood that t. sed outside the forest processingsector for the p f cther aoods and ser ces (except asa source of fuel). It includes: roundwood that will be used fortanning. distillation. match blocks. dadocenes poles. piling.posts. fencing and pitprops. etc. It is reported in cubic metresunderbark (i.e. exclUdind bark).
WOOD CHARCOAL, WOOD CHIPS, PARTICLES ANDRESIDUES
Charcoaltrbonised by partial combustion or the application of
hea: from externa l sources. It includes: charcoal used as afue. or for other uses e g. as a reduction agent in metallurgyor as an absorption or filtration mediUM. It is reported inmetric tonnes.
Wood Chips and ParticlesWood that has been deliberately reduced to small reces clunnothe manufacture of other wood p.roducts and is suitable forpulping. for particle board and fibreboard production. for use as afuel. or for other purposes. It excludes: \vood chips madedirectly a e. in the forest) from roundwood (i.e. already countedas pulpwood. round and split). It is reported in cubo metresso lid volume excluding bark.
Wood ResiduesThe volume of roundwood that is left over after the production offorest products in the forest processing industry tie. forestprocessing residues) and that has not been reduced to chips orparticles. It includes: sawmill rejects slabs eddings andtrimmings. veneer log cores veneer rejects sawdust residuesfron-1 carpentry and joinery prodLictiOn. etc. It excludes: woodchips made either directly (i.e. in the forest) from roundwood ormade from residues (i.e. already COUnted as pulpwood. roundand split or wood chips and particles). It is reported in cubic
XXI
..-. board
metres so lid volume excludir re
SAWNWOOD
SawnwoodSavvrmr:g (C)
l\Nood t'-at produced fro r ,th cc "es: :tearouniwoc.-A. either by sao. 'g
and that lb a fe.--ess. It includes
se aths. themaued. finger-
IC chart's- rabbeted. etc. Itexcludes: v.: It is reported in J metresso lid volume.
WOOD-BASED PANELS
Wood-Based PanelsThe wood-based panels categ: -. is m .r:s'::s:: .r::goo, Inthe production and trade statstics, it represents the sum of:yeneer sheets. until1995. fibreboar.:
non-comg.-dseed 't..a.r.:
":SSE: ret -d has p.It is reported in CULHC rl'ISIreS SC
re ser SheetsThin sheets of vvxod of uniform . e ratar\ cut le Deere°sliced or sawn. It includes: woog: tr. n re o'plywood. laminated construction 3 fUrnir er-pe-corta riere etc. It excludes: wood useir In the same country. It is reported involume.
-odO oel consisting] of an assembly of yeoeer s its bonded
ner v.ith the direction of the grain alt.(rig:tg s generallyat ght angles. The veneer sheets me plaoedsymmetrically on both sides of a centrai - mayitself be made from a re re.,includes: veneer plywood notogether more toar taw o
alternate veneer sheets is .
core plywood or blockboardcentral layer. generally es ) that c.-os sisof narrow boards. bidokssed side by s,,Je.which may st may no: cellular boardp I ywo o.-re of ceiruiar c.: and composite
plywood o s. ood with the core or in layers made of'ratera l c: or than so lid wooc or .q:s). It excludes:laminated construction materials (e.g. Dr7,. where the graoof the vencer sheets generally runs in tire same direction It isreported in cubic metres so lid volume.
Part :le BoardA nanel manufactured from small pieces of wood or other lignc-
.. os s materials te .d. chips. flakes. so oler strands shreds.sn s etc.) bonded together by the use ,-- tit organic bindertcae:nier with one or tms: e of the .stents: heat.pressure humidity. a :a:a .st etc. It includes: waterboardoriented strandboard DSP an.: fiaxboard. It excludes: woodwool and other particle boa -organicbinders. It is reported in c
FibreboardA panel manufacture ,rom fibres :-cellulosic materials th primaryfelting of the fibres :he ir Ínhe..,-,flt ertiestalthough bond nd r d added inroe manufactur.;:g g It includes: thatare flat-pressed a.m. sed In theproduction and trade statistics, it represents the sum of:hardboard: mediUM density fibreboard (rxIDF) leulating
board. It is reported in cubic metres solid volume.
HardboardFibreboard with a density exceeding 0.80 g/cm3. Before 1995.this product was a component of the compressed fibreboardproduct category, so data for this product is not available for1994 and earlier years. It excludes: similar products made frompieces of wood, wood flour or other ligno-cellulosic materialwhere additional binders are required to make the panel; andpanels made of gypsum or other mineral material. It isreported in cubic metres solid volume.
Medium Density Fibreboard (MDF)Fibreboard of a density exceeding 0.5 g/cm3 but not exceeding0.8 gicm3. Before 1995, this product was a component of thecompressed fibreboard product category, so data for this productis not available for 1994 and earlier years. It is reported incubic metres solid volume.
Insulating BoardFibreboard of a density not exceeding 0.5 g/cm3. Before 1995,this product was referred to as non-compressed fibreboard. It isreported in cubic metres solid volume.
PULP AND RECOVERED PAPER
VVood PulpFibrous material prepared from pulpwood, wood chips,particles, residues or recovered paper by mechanical and/orchemical process for further manufacture into paper.paperboard, fibreboard or other cellulose products. In theproduction and trade statistics, it represents the sum of:mechanical wood pulp; semi-chemical wood pulp; chemicalwood pulp; and dissolving wood pulp. It is reported in metrictonnes air-dry weight (i.e. with a 10% moisture content).
Mechanical Wood PulpWood pulp obtained by grinding or milling pulpwood or residuesinto fibres, or through refining chips or particles. Also calledground wood pulp and refiner pulp, it may be bleached orunbleached. It includes: chemi-mechanical and thermo-mechanical pulp. It excludes: exploded and defibrillated pulp. Itis reported in metric tonnes air-dry weight (i.e. with a 10%moisture content).
Semi-Chemical VVood PulpWood pulp obtained by subjecting pulpwood, wood chips,particles or residues to a series of mechanical and chemicaltreatments, none of which alone is sufficient to make the fibresseparate readily. It may be bleached or unbleached. It includes:semi-chemical wood p.ulp; chemi-ground wood pulp; and chemi-mechanical wood pulp etc.(named in the order and importanceof the treatment during the manufacturing process). It isreported in metric tonnes air-dry weight (i.e. with a 10%moisture content).
Chemical VVood PulpWood pulp obtained by subjecting pulpwood, wood chips,particles or residues to a series of chemical treatments. Itincludes: sulphate (kraft) wood pulp; soda wood pulp; andsulphite wood pulp. It may be bleached, semi-bleached orunbleached. It excludes dissolving grades of wood pulp. It isreported in metric tonnes air-dry weight (i.e. with a 10%moisture content). VVhere detail is available, statistics for thefollowing four component pulpa are also given: unbleachedsulphite pulp: bleached sulphite pulp: unbleached sulphate pulp;and bleached sulphate pulp.
Unbleached Sulphite PulpBleached Sulphite PulpWood pulp obtained by mechanically reducing pulpwood, woodchips, particles or residues to small pieces that aresubsequently cooked in a pressure vessel in the presence of abisulphite cooking liquor. Bisulphites such as ammonium,calcium, magnesium and sodium are commonly used in thisprocess. It excludes dissolving grades of wood pulp. It isreported in metric tonnes air-dry weight (i.e. with a 10°/0
moisture content) and data for two classes: bleached (includingsemi-bleached): and unbleached, are reported separately.
Unbleached Sulphate PulpBleached Sulphate PulpVVood pulp obtained by mechanically reducing pulpwood, woodchips, particles or residues to small pieces that aresubsequently cooked in a pressure vessel in the presence ofsodium hydroxide cooking liquor (soda pulp) or a mixture ofsodium hydroxide and sodium sulphite cooking liquor (sulphatepulp). It excludes dissolving grades of wood pulp. It isreported in metric tonnes air-dry weight (i.e. with a 10%moisture content) and data for two classes: bleached (includingsemi-bleached): and unbleached. are reported separately.
Dissolving VVood PulpChemical pulp (sulphate, soda or sulphite) made from wood ofspecial quality, with a very high alpha-cellulose content (usually90 percent and over). This type of pulp is always bleached and isreadily adaptable for uses other than paper-making. It is usedprincipally as a source of cellulose in the manufacture ofproducts such as synthetic fibres, cellulose plastic materials,lacquers and explosives. It is reported in metric tonnes air-dry weight (i.e. with a 10% moisture content).
Other Fibre PulpPulp manufactured from fibrous vegetable materials other thanwood and used for the manufacture of paper, paperboard andfibreboard. It includes pulps made from: straw; bamboo;bagasse; esparto; other reeds or grasses; cotton fibres; flax:hemp; rags; and other textile wastes. It excludes pulp madefrom recovered paper. It is reported in metric tonnes air-dryweight (i.e. with a 10% moisture content).
Recovered PaperVVaste and scraps of paper or paperboard that have beencollected for re-use as a raw material for the manufacture ofpaper and paperboard. It includes: paper and paperboard thathas been used for its original purpose and residues from paperand paperboard production. It is reported in metric tonnes.
PAPER AND PAPERBOARD
Paper and Paperboard
The paper and paperboard category is an aggregate category. Inthe production and trade statistics, it represents the sum of:newsprint; printing and writing paper; and other paper andpaperboard. Products in this category are generallymanufactured in strips or rolls of a width exceeding 15 cm (36cm for HS 48.13 and 48.19) or in rectangular sheets with oneside exceeding 36 cm and the other exceeding 15 cm in theunfolded state. It excludes manufactured paper products suchas boxes, cartons, books and magazines, etc. It is reported inmetric tonnes.
NewsprintUncoated paper, unsized (or only slightly sized), containing atleast 60 percent mechanical wood pulp (percentage of fibrouscontent), usually weighing not less that 40 g/m2 and generallynot more than 60 g/m4, of the type used mainly for the printing ofnewspapers. It is reported in metric tonnes.
Paper and Paperboard other than NewsprintThe paper and paperboard category is an aggregate category. Itcomprises: other printing and writing paper; and other paperand paperboard. It only appears in tables showing direction oftrade. It is reported in metric tonnes.
Printing and VVriting PaperPaper, except newsprint, suitable for printing and businesspurposes, writing, sketching, drawing, etc. Made from a varietyof pulp blends and with various finishes. It includes: papersused for books and magazines: wallpaper base stock: box liningand covering; calculator paper: rotonews; duplicating tablet orblock; labels; lithograph paper; banknotes: tabulating card stock;bible or imitation bible paper; stationery; manifold paper;
onionskin; typevvriter paper: and poster paper, etc. It isreported in metric tonnes.
Other Paper and PaperboardAll other types of paper. It includes: construction paper andpaperboard; household and sanitary paper; special thin paper:wrapping and packaging paper and paperboard: and other paperand paperboard not elsewhere specified. It is reported inmetric tonnes. VVhere detail is available, statistics for thefollowing three components are also given: household andsanitary paper; wrapping and packaging paper and paperboard;and other paper and paperboard not elsewhere specified.
Household and Sanitary PaperAbsorbent paper (creped or uncreped and sometimesembossed) made from bleached or unbleached chemical woodpulp, sometimes with a mixture of pulp from waste paper andmechanical pulp. It includes: towelling; napkins; facial tissue;toilet tissue; wadding: and disposable tissues. etc. It isreported in metric tonnes.
VVrapping and Packag ng Paper and PaperboardPaper or paperboard used for wrapping, packaging and themanufacture of sacks and boxes. It includes: vegetableparchment, greaseproof paper and glassine paper (made frompure chemical wood pulp or from a mixture of chemical woodpulp, cotton fibre pulp, treated (e.g. highly hydrated or hard-beaten) to render the resulting paper resistant to oil, grease andwater and used pdmarily for packaging frozen, moist or greasymaterials such as butter, marganhe, meat or fish): linerboard(paper or paperboard used as facing material on corrugated orsolid paper or paperboard boxes and containers): fluting medium(paper or paperboard used as medium when combining paperand paperboard for conversion into a corrugated board); sackkraft paper (strong paper made from sulphate pulp and used inthe manufacture of single or multiwall sacks); other kraftwrapping paper (all other wrapping and packaging papers madeprincipally from sulphate pulp); folding boxboard (all types ofpaperboard used in the manufacture of folding boxes); and otherwrapping and packaging paper and paperboard. It is reportedin metric tonnes.
Other Paper and Paperboard Not Elsewhere SpecifiedPaper and paper board used for construction, special purposesand other uses not elsewhere specified. It includes: kraftpapers used for vvaxing, asphalting. waterproofing, laminating.impregnating, spinning or twisting, gumming, etc.; papersmanufactured principally from furnishes other than sulphate pulpand not elsewhere specified (such as rope and jute paper, folderstock, blotting paper, filter paper, photographic sensitising paper,etc.); construction paper and paperboard (papers, paper feltsand paperboards used in the constmction of buildings and otherstructures for insulation, vapour seal, roofing and flooringundeday. etc. (these papers are generally made from fullyrefined material such as wood pulp, waste paper, othervegetable pulp and mineral fibre and their principlecharacteristics are low thennal conductivity, moisture resistance,fire resistance, permanency and insect and vermin resistance));special thin paper (papers made for special purposes, theircommon characteristics being their relative thinness, thesepapers may be made from mechanical or chemical wood pulps,bleached or unbleached, but frequently from pulpa containingflax, hemp or cotton fibre and the principal characteristics ofsome of these papers are: uniformity or surface and calliper,freedom from pinholes, strength. close formation, opacity, lowpermeability, chemical pudty, examples of this type of paperincludes: carbonising tissue, condenser and capacitor paper.cigarette paper, lens tissue, pattern tissue, and tea-bag paper):and paperboards not elsewhere specified (such as shoe board,gasket board, transformer board, press textile board, indexpressboard, panel board (car). trunk and suitcase board andmatrix board). It excludes: papers, felts or boards that areimpregnated, saturated, laminated or further manufactured inany way and fibreboard or fibre building-board, in the form ofinsulating board, medium hardboard and hardboard. It isreported in metr.c tonnes.
NOTES ON THE TABLES
Production and trade
ROUND WOOD
Rc
oroduction are not available for anu- bee- es: mated by converting the
tne triun:hy to the volume ofreqL ..de that volume the roundwood
su...d_zi. forest products includedinr strial itoL : cannot be calculated due to theere Products used in the production and
trade a number of countries that wereme-in e Oust:fit s Co-operation Council (nczw named the
Orgar ii ation) introduced a revised classificationn t eir trace statistics the Harmonized Commodityand Coding System (HS). This has also been
adr.:tet: r.. be United Nations in Revision 3 of the Standardintir at ade h.lasscation (SITC Rev. 3) formo f . this is a straightforward transforma: I'm mthe itissification. in the case of industrial roLno,von.d
s between sawlogs ad veneer logs. ;t..
.her industrial roundwood are not included. Thus tables fortrade t ese products are discontinued. The incompletede.11ara of roundwood productich o.: eta explains the presenceof ansumption in sor .-tries (i.e. this is aerare: re re:. ern). These inat are included in the
- -Id
Wood F - CharcoalTh formerly knoviiin as fuelwood
- on of this product is not reportedni./ of which are believed to beE.IST mates for these countries are
ate re sed as neo surveysused the annual
same as the anindalThe per ca.:: :a
ipdat re
WOOD-BASED PANELS
Direction of trade
f fibreboarg areforest
tal fibrecoaromt oraductioh s
possicie
t-e ales: tv.onforn.aoneqtihnnai-6ase cf5 not oeee
a 'hit- natoo--
.rret.tion of ..main yeamock.basis of
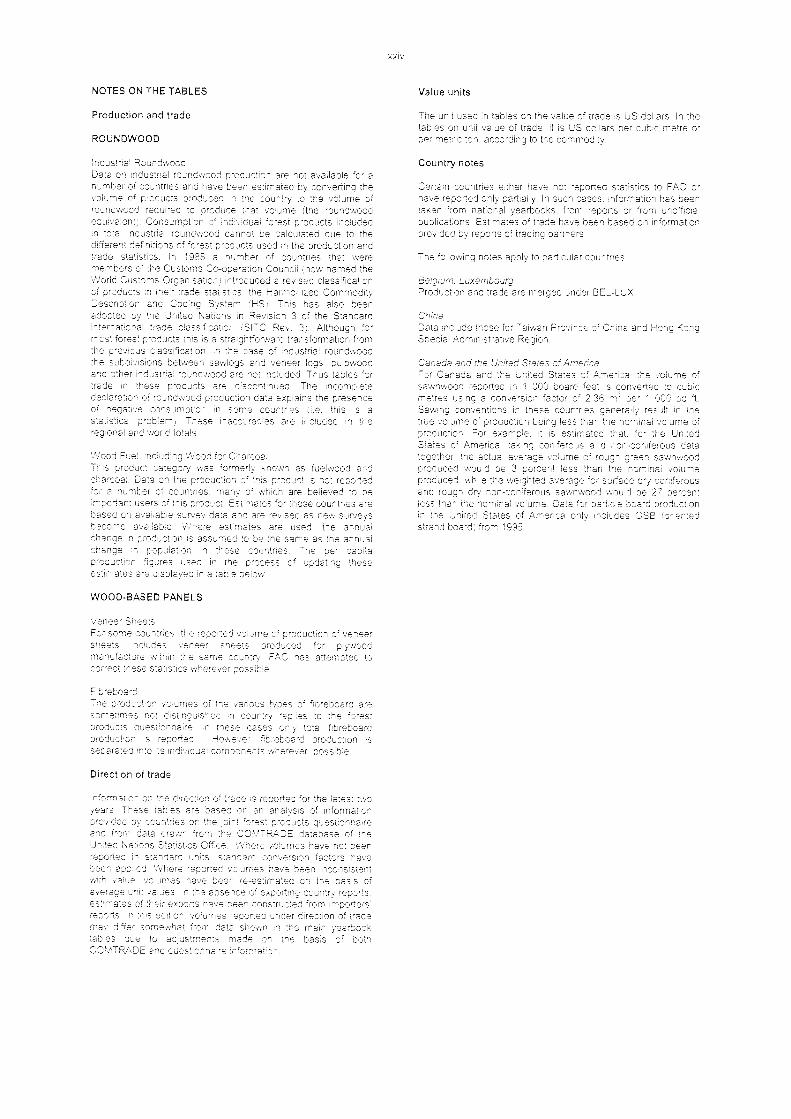
Value un ts
The unit usen in tables on the value of trade is US dollars. In thetables on unit value of trade. it is US dollars per cubo metre orper metro ton according to the commodity.
Country notes
Certain countries either have not reported statistics to FAO orhave reported only partially. In such cases. inforrnation has caentaken from national yearbooks from reports or from unofficialpublications. Estimates of trade nave been based on informationprovided by reports of trading partners
The following notes apply to particular countries:
Belgium. LuxembourgProductor ano trade are margen under BEL-LUX.
ChinaData -c une :hose for Taiwan Province of China and Hong KongSpecial Administrative Region.
Canana and 'he United States of AmericaFor Canada and the Untad States of America. the volume ofsawhwood 'aporten in 1 000 board feet is converted to cucometres using a conversion factor of 2.36 rnriI per 1 000 bd ft.Se .% mn conventions in these countries generally result in the
....me of productor being less t-an the nominal volume ofproduotion For example. it is es: ated That. for the UntenStates of Ame' ca taking con faro _s and non-coniferous datatogether. the actual average volume iof rough green saiwnwoodproduced would be 3 ercent less than :he nominal volumeproduced. )while the v. Li tiThted average for surface dry coniferousand rough dry nrn-ic ',ins us sawnwood would be 27 percentiess than the ric. ¡me. Data for particle board productionin the United States s' 4rneric,a only no «as OSB (orientedstrand board) from 1S
Lege
ndA
ggre
gate
sP
=P
rodu
ct,o
n1=
Impo
riE
gExp
C. n
sum
ptIo
n (P
*TE
)P
rodu
cts
-,T
Ct,o
rl
e(t
ytga
mpt
on tp
+Ite
)
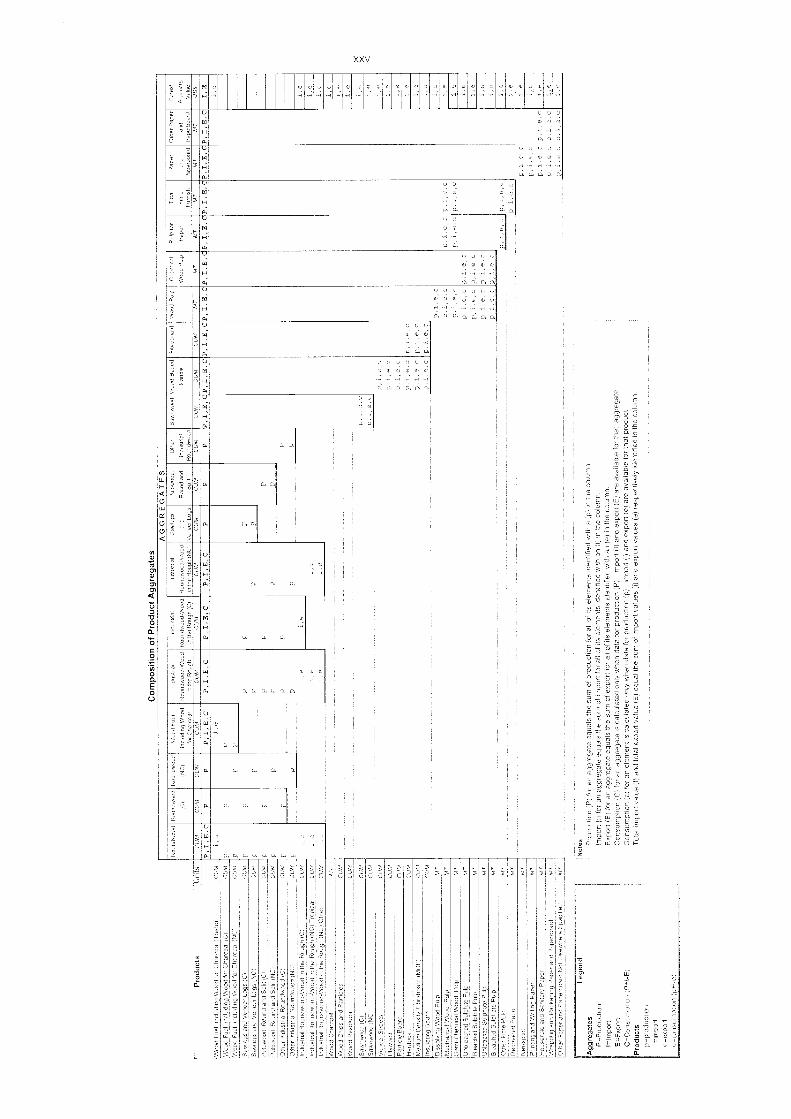
Com
posi
tion
of P
rodu
ct A
ggre
gate
s
Not
es.
Pro
du)
(') fo
r1
aggr
egat
e eq
uals
the
sum
of p
rodu
ctIo
n fo
r al
l of i
ts &
en-t
ents
ale
ntlft
ed w
an a
(p)
in th
e co
lum
nIn
gr
tga
tqua
ls th
e su
m o
f tm
port
for
a/1
of a
s el
erne
nts
dent
tfted
got
ta a
n (t
) in
the
colu
mn
Ex.
.te
equ
als
the
sum
of e
xpor
t for
ail
of a
s el
emen
ts a
ient
ated
wtth
an
(e)
tn th
e co
lum
nC
o st
.:
tt, a
n ag
greg
ate
ts c
alcu
late
d on
ly w
nen
data
for
crod
uctto
n (P
)[m
ood
(I)
and
expo
rt (
E)
are
avat
labl
e fo
r th
at a
ggre
gate
Con
sum
í'an
ele
men
t ts
calc
ulat
ed o
nly
whe
n da
ta fo
r pr
oduc
tIon
(p)
trnp
ort (
I) a
nd e
xpor
t (e)
are
ava
llabl
e fo
r th
at p
rodu
ctT
otal
tmr
rt v
alue
(I)
and
tota
l exp
ort v
alue
(E
) eq
ual t
he s
um o
f aro
ort v
alue
s (,
) an
d ex
port
val
ues
(e)
resp
echv
ely
Iden
tate
d In
the
colu
mn
AG
GR
EG
AT
ES
Rou
od,
, '1
...'
1
;,, ,
,
Ft o
un..
pr.
d
w th
-:1(C
I
1,1,
,,,,,o
l
F. ,
lI
Le
otE
.t
111
WI
sL
,
Saw
1ogs
end
Ven
eer
Logs
CU
A.,/
Pul
pi,
I.el
ZF
For
roer
Indo
5Ina
lR
ound
woo
d00
M
Saw
nwoo
d
CU
M
Woo
d-B
ased
Pan
els-
CU
M
l=br
eboa
rd
CU
M
Woo
d P
ulp
MT
Chw
rnal
Woo
d P
ulp
MT
Pul
p fo
r
Pap
er
MT
'ta
1P
aper
and
F..
,boa
rd
WM
, Pap
er
and
Pap
erbo
ard
MT
For
est
Pro
duct
sV
alue
000
TT
Fod
ucts
\ir.,
oel
,W
rIg
V .
for
..
.,w
mum CU
M
c U
,..1
,I,E
,Cr
,1C
UM
F
PP
P,I,
E,C
P,I.
E,C
P,I,
E,C
P ,I
,E,C
PP
PP,
I,E
,CP,
I,E
,CP,
I,E
,CP,
I,E
,CP,
I,E
,CP,
I,E
,CP,
I,E
,CP,
I,E
,CP,
I,E
,CI,
E1
, e
1.S p
P P
P P o P
P
P P F P r P
i, e
i ,e
T.:
i, e 1 e
p P
P
p P
p ,
i , e
, c1
p, 1
, e ,
C
p, i
, e, c
p ,
,, e
, C
p,i,e
,cp,
i , e
, c
p, i
, e ,
C
p, 1
, e, c
p ,
0 , e
, cp,
i,e,c
p, 1
, e,
cp,
i, e
, cp,
i,e,
0p,
i,e,c
p, i,
e,c
p, 1
, e, c
p,i,e
,cp,
i,e,c
e
p, 1
, e, c
p, i,
e ,
c
tt , i
, e
.,,e
p, i,
e, c
p, i,
e, c
p, i,
e ,
C
p, i
, e ,
cp,
-,,
e , c
p ,
1, e
, c,
p,i,e
,c
p ,
1, e
, c.,
p , i
, e
, Cp,
i,e,c
...
. -,
m
..
.,
,,.
.
.i ,e
..1,
eA
l;
W, .
1, P
wtl,
1 w
,1.1
i e i e.
n, e
Mi ,
el
.o
e
1-:
'.r
:i W
DF)
0.: P
.1p
r00
i e:
Polo
MT
e , e
S. -
..1
Woo
dPu
lpM
T
L111
bIE
:,
, Pul
pM
T1
e i,e
.lp
o,o
lpe
,,,M
Tli.
, e e
,1r
r',,1
1, =
1 ,
f.f
7
5 I,
iII
' ,,,P
PM
r-1
e
r e
,,
I s
-I1
, Pr
pr
1M
T1,
74 t.
1P.
w,r
d t,
. 4,I
._ 3
i.1
E w
rer
eo,
pesf
ied
MT
1,e
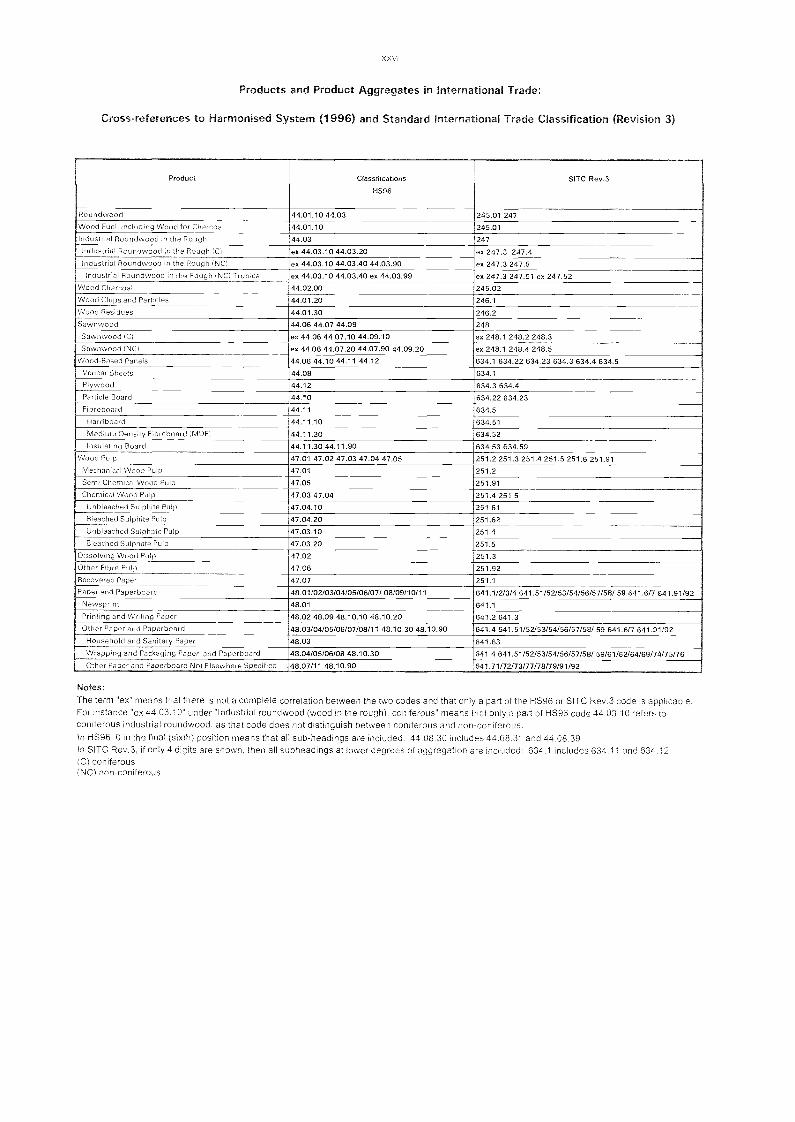
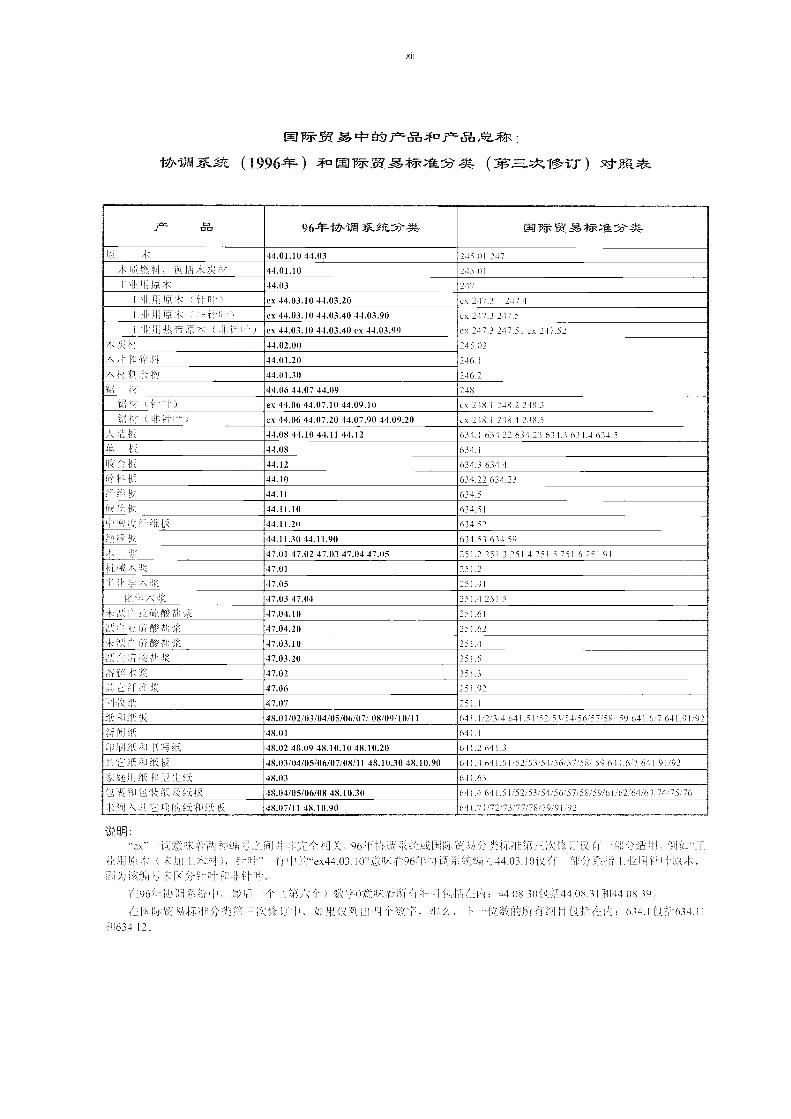
Products and Product Aggregates in International Trade:
Cross-references to Harmonised System (1996) and Standard International Trade Class cation (Revision 3)
Notes:The term "ex" means that there is not a complete correlation between the two codes and that only a part of the HS96 or SITC Rev.3 code is applicable.For instance "ex 44.03.10" under "Industrial roundwood (wood in the rough), coniferous" means that only a part of HS96 code 44.03.10 refers toconiferous industrial roundwood, as that code does not distinguish between coniferous and non-coniferous.In HS96, 0m the final (sixth) position means that all sub-headings are included: 44.08.30 includes 44.08.31 and 44.08.39In SITO Rev.3, if only 4 digits are shown, then all subheadings at lower degrees of aggregation are included: 634.1 includes 634.11 and 634.12(C) coniferous(NC) non-coniferous
Product Classifications
HS96
SITC Rev.3
Roundwood 44.01.10 44.03 245.01 247
Wood Feet, iecieding VVood for Charcoal 44.01.10 245.01
iedostrrai Roundwood io the Rough 44.03 247
industria] Roundwood in the Rough (C) ex 44.03.10 44.03.20 ex 247.3 247.4Industrial Roundwood in the Rough (NC) ex 44.03.10 44.03.40 44.03.90 ex 247.3 247.5Industrial Roundwood in theRough (NC) Tropical ex 44.03.10 44.03.40 ex 44.03.99 ex 247.3 247.51 ex 247.52
Wood Charcoal 44.02.00 245.02
Wood Chips and Particles 44.01.20 246.1
Wood Residues 44.01.30 246.2
Sawnwood 44.06 44.07 44.09 248
Sawnwood (Ci ex 44.06 44.07.10 44.09.10 ex 248.1 248.2 248.3Sawnwood (NCI ex 44.06 44.07.20 44.07.90 44.09.20 ex 248.1 248.4 248.5
Wood-Based Panels 44.08 44.10 44.11 44.12 634.1 634.22 634.23 634.3 634.4 634.5Veneer Sheets 44.08 634.1
Plywood 44.12 634.3 634.4Particle Board 44.10 634.22 634.23
Fibreboard 44.11 634.5
Hardboard 44.11.10 634.51
Medium Oeesrty Fibreboard IMOFI 44.11.20 634.52Insulating Board 44.11.30 44.11.90 634.53 634.59
Wood Pulp 47.01 47.02 47.03 47.04 47.05 251.2 251.3 251.4 251.5 251.6 251.91Mechanical Wood Pulp 47.01 251.2
Seroi-citemicai Wood Pulp 47.05 251.91
Chemical Wood Pulp 47.03 47.04 251.4 251.5Unbleached Seiphite Pulp 47.04.10 251.61
Bleached Sulphite Pulp 47.04.20 251.62Unbleached Sulphate Pulp 47.03.10 251.4
Bleached Sulphate Pulp 47.03.20 251.5
Dissolving Wood Pulp 47.02 251.3
Other Fibre Pulp 47.06 251.92
Recovered Paper 47.07 251.1
Paper and Paperboard 48.01/02/03/04/05/06/07/ 08/09/10/11 641.1/2/3/4 641.51/52/53/54/56/57/58/ 59 641 7 641.9 92
Newsprint 48.01 641.1
Prieting and Writìng Paper 48.02 48.09 48.10.10 48.10.20 641.2 641.3Other Paper and Paperboard 48.03/04/05/06/07/08/11 48.10.30 48. 0.90 641.4 641.51/52/53/54/56/57/58/ 59641.5/7 641.91/92Household and Saeitary Paper 48.03 641.63
Wrapping arrd Packaging Paper and Paperboard 48.04/05/06/08 48.10.30 641.4 641.51/52/53/54/56/57/58/ 59/61/62164/69/74/75/76Other Paper and Paperboard Not Elsewhere Sp Ofied 48.07/11 48.10.90 641.71/72/73/77/78/79/91/92
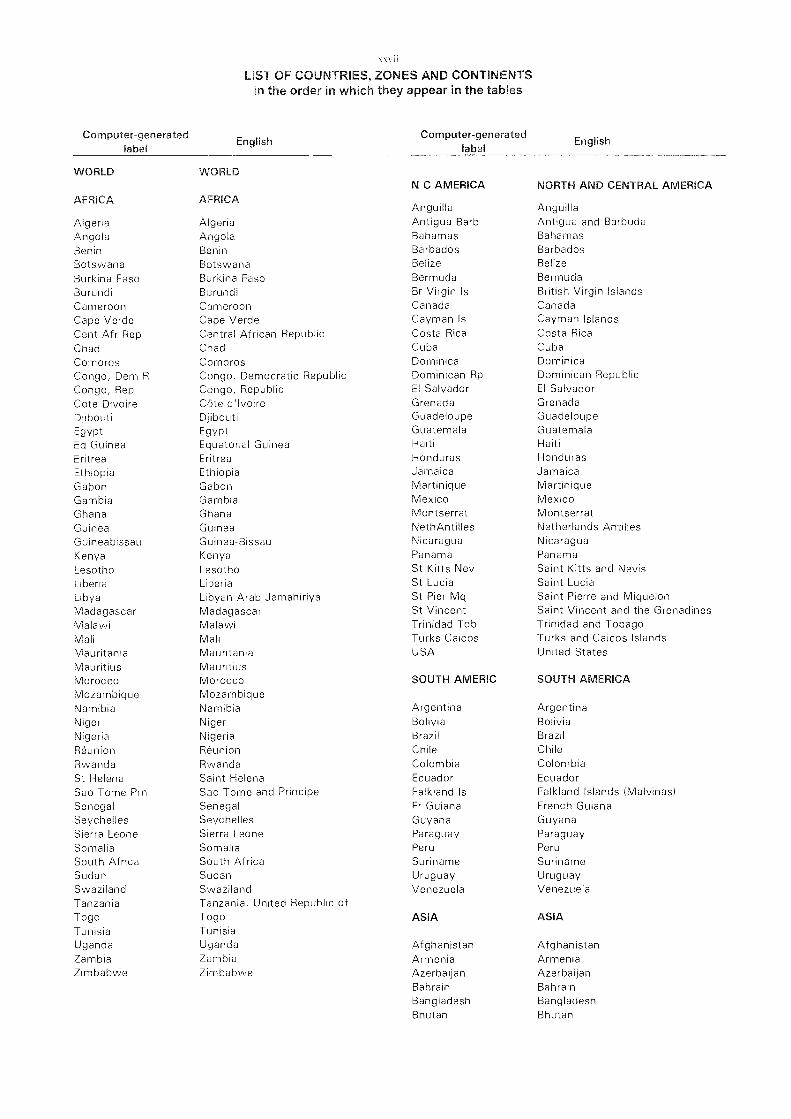
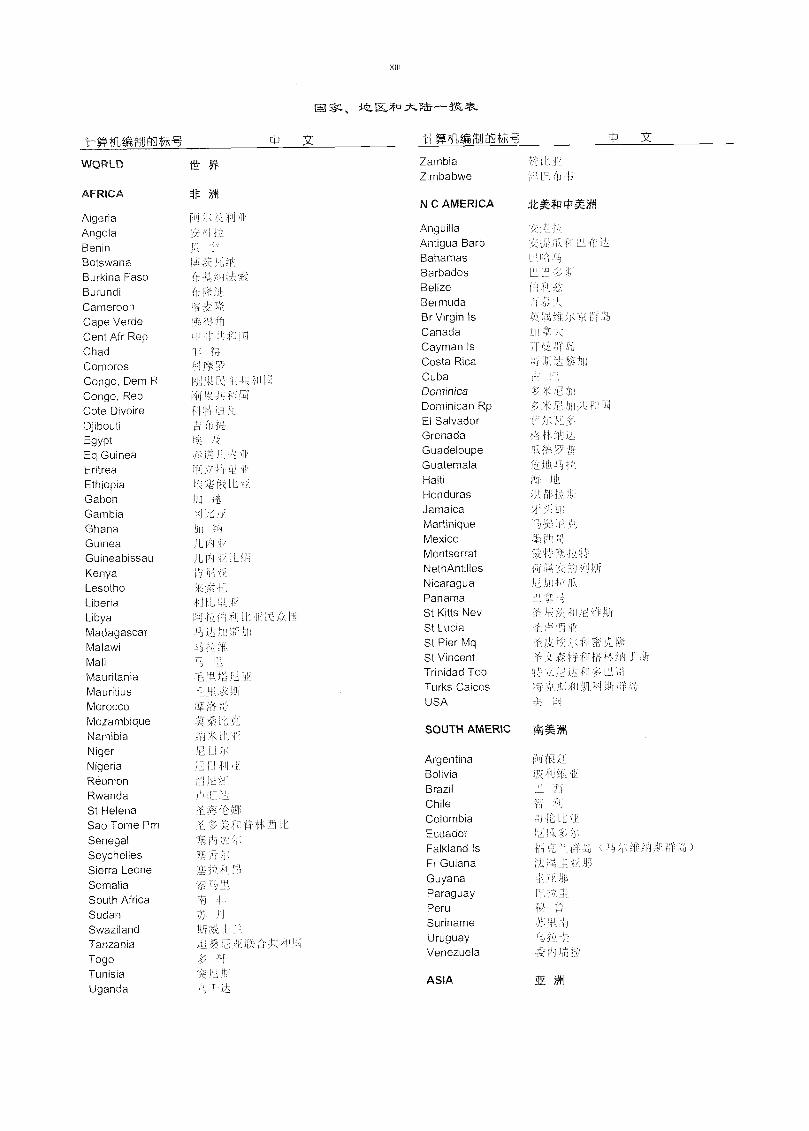
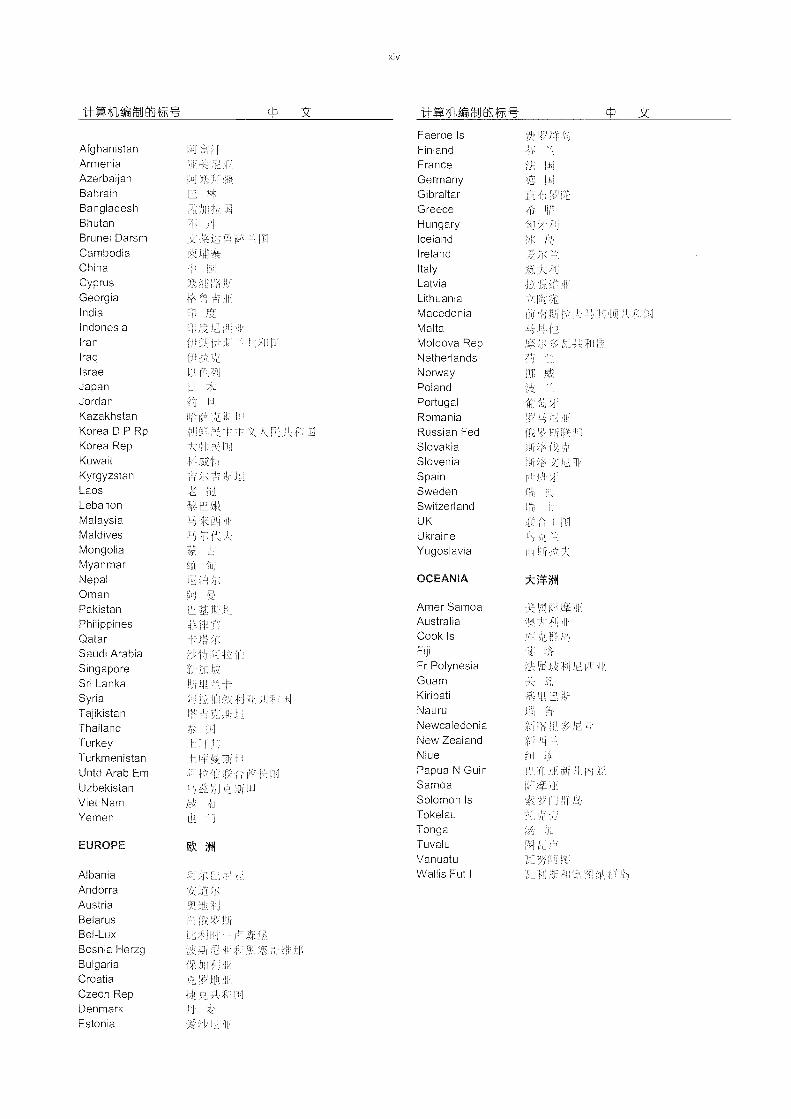
\\iiLIST OF COUNTRIES, ZONES AND CONTINENTS
in the order in which they appear in the tables
Computer-generatedlabel
EnglishComputer-generated
labelEnglish
WORLD WORLDN C AMERICA NORTH AND CENTRAL AMERICA
AFRICA AFRICAAnguilla Anguilla
Algeria Algeria Antigua Barb Antigua and BarbudaAngola Angola Bahamas BahamasBenin Benin Barbados BarbadosBotswana Botswana Belize Belize
Burkina Faso Burkina Faso Bermuda BermudaBurundi Burundi Br Virgin Is British Virgin IslandsCameroon Cameroon Canada CanadaCape Verde Cape Verde Cayman Is Cayman IslandsCent Afr Rep Central African Republic Costa Rica Costa RicaChad Chad Cuba Cuba
Comoros Comoros Dominica DominicaCongo, Dem R Congo, Democratic Republic Dominican Rp Dominican RepublicCongo, Rep Congo, Republic El Salvador El SalvadorCote Divoire Côte d'Ivoire Grenada Grenada
Djibouti Djibouti Guadeloupe GuadeloupeEgypt Egypt Guatemala GuatemalaEq Guinea Equatorial Guinea Haiti HaitiEritrea Eritrea Honduras HondurasEthiopia Ethiopia Jamaica JamaicaGabon Gabon Martinique MartiniqueGambia Gambia Mexico MexicoGhana Ghana Montserrat MontserratGuinea Guinea NethAntilles Netherlands AntillesGuineabissau Guinea-Bissau Nicaragua NicaraguaKenya Kenya Panama Panama
Lesotho Lesotho St Kitts Nev Saint Kitts and NevisLiberia Liberia St Lucia Saint LuciaLibya Libyan Arab Jamahiriya St Pier Mq Saint Pierre and MiquelonMadagascar Madagascar St Vincent Saint Vincent and the Grenad nesMalawi Malawi Trinidad Tob Trinidad and TobagoMali Mali Turks Caicos Turks and Calcos IslandsMauritania Mauritania USA United StatesMauritius MauritiusMorocco Morocco SOUTH AMERIC SOUTH AMERICAMozambique MozambiqueNamibia Namibia Argentina ArgentinaNiger Niger Bolivia BoliviaNigeria Nigeria Brazil BrazilRéunion Réunion Chile ChileRwanda Rwanda Colombia ColombiaSt Helena Saint Helena Ecuador EcuadorSao Tome Prn Sao Tome and Principe Falkland Is Falkland Islands (Malvinas)Senegal Senegal Fr Guiana French GuianaSeychelles Seychelles Guyana GuyanaSierra Leone Sierra Leone Paraguay ParaguaySomalia Somalia Peru Peru
South Africa South Africa Suriname SurinameSudan Sudan Uruguay UruguaySvvaziland Swaziland Venezuela VenezuelaTanzania Tanzania, United Republic ofTogo Togo ASIA ASIATunisia TunisiaUganda Uganda Afghanistan AfghanistanZambia Zambia Armenia ArmeniaZimbabwe Zimbabwe Azerbaijan Azerbaijan
Bahrain BahrainBangladesh BangladeshBhutan Bhutan
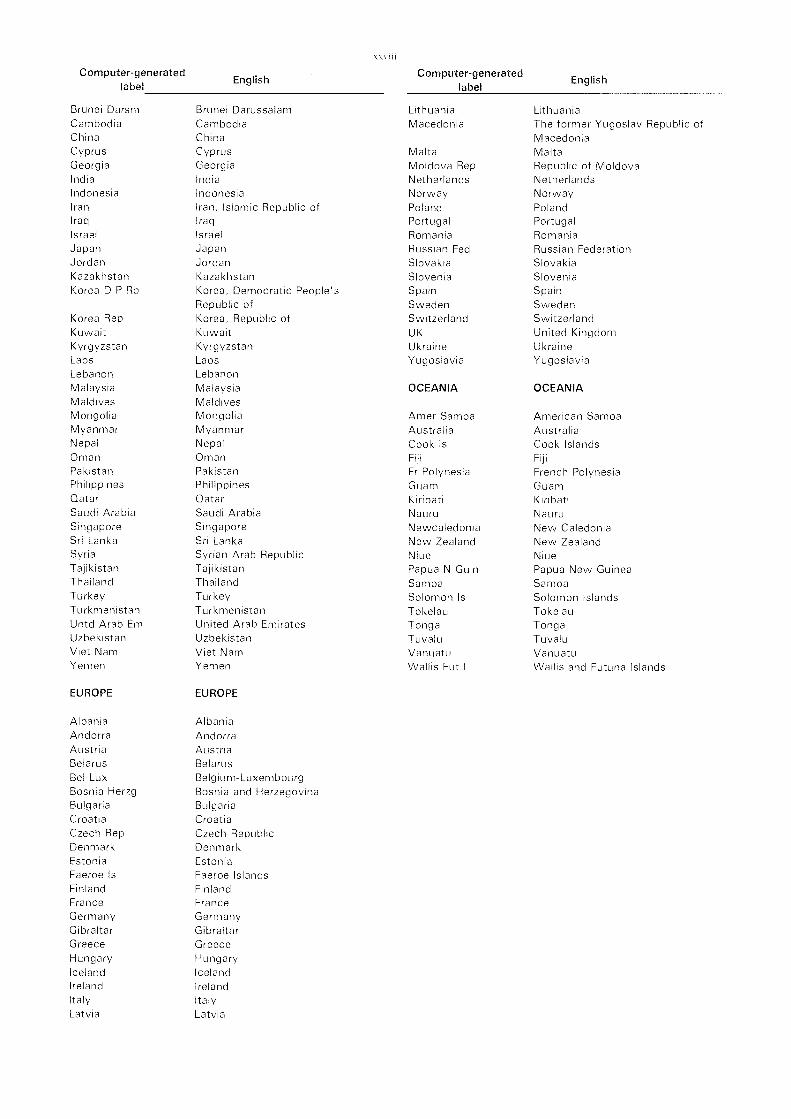
\ 11
Computer-generatedlabel
EnglishComputer-generated
labelEnglish
Brunei Darsm Brunei Darussalam Lithuania LithuaniaCambodia Cambodia Macedonia The former Yugoslav Republic ofChina China MacedoniaCyprus Cyprus Malta MaltaGeorgia Georgia Moldova Rep Republic of MoldovaIndia India Netherlands NetherlandsIndonesia Indonesia Norvvay NorwayIran Iran, Islamic Republic of Poland PolandIraq Iraq Portugal PortugalIsrael Israel Romania RomaniaJapan Japan Russian Fed Russian FederationJordan J or dan Slovakia SlovakiaKazakhstan Kazakhstan Slovenia SloveniaKorea D P Rp Korea, Democrat c People's Spain Spain
Republic of Svveden SvvedenKorea Rep Korea, Republ c of Svvitzerland SwitzerlandKuwait Kuvvait UK United KingdomKyrgyzstan Kyrgyzstan Ukraine UkraineLaos Laos Yugoslavia YugoslaviaLebanon LebanonMalaysia Malaysia OCEANIA OCEANIAMaldives MaldivesMongolia Mongolia Amer Samoa American SamoaMyanmar Myanmar Australia AustraliaNepal Nepal Cook Is Cook IslandsOman Oman Fiji FijiPakistan Pakistan Fr Polynes a French PolynesiaPhilippines Philippines Guam GuamQatar Qatar Kiribati KiribatiSaudi Arabia Saudi Arabia Nauru NauruSingapore Singapore Newcaledonia New CaledoniaSri Lanka Sri Lanka New Zealand New ZealandSyria Syrian Arab Republic Niue NiueTajikistan Tajikistan Papua N Guin Papua New GuineaThailand Thailand Samoa SamoaTurkey Turkey Solomon Is Solomon IslandsTurkmenistan Turkmenistan Tokelau TokelauUntd Arab Ent United Arab Emirates Tonga TongaUzbekistan Uzbekistan Tuvalu TuvaluViet Nam Viet Nam Vanuatu VanuatuYemen Yemen Wallis Fut I Wallis and Futuna Islands
EUROPE EUROPE
Albania AlbaniaAndorra AndorraAustria AustriaBelarus BelarusBel-Lux Belgium-LuxembourgBosnia Herzg Bosnia and HerzegovinaBulgaria BulgariaCroatia CroatiaCzech Rep Czech RepUblicDenmark DenmarkEstonia EstoniaFaeroe Is Faeroe IslandsFinland FinlandFrance FranceGermany GermanyGibraltar GibraltarGreece GreeceHungary HungaryIceland IcelandIreland IrelandItaly ItalyLatvia Latvia
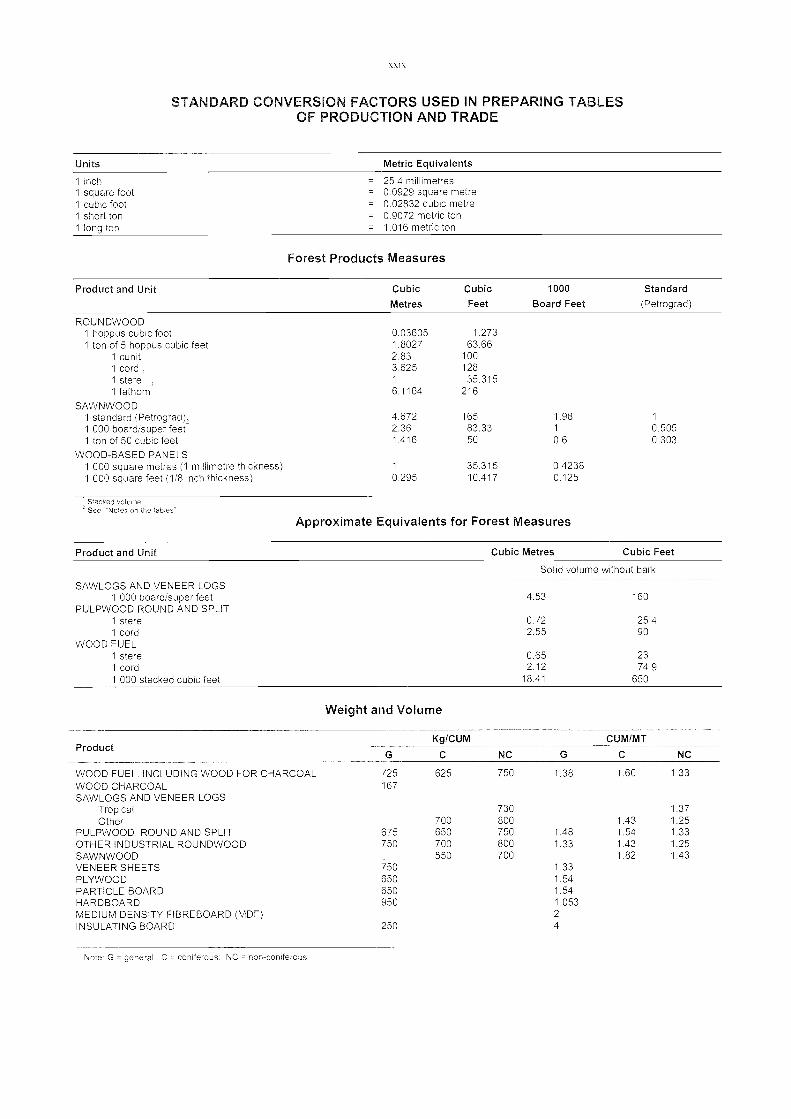
STANDARD CONVERSION FACTORS USED IN PREPARING TABLESOF PRODUCTION AND TRADE
Forest Products Measures
Stacked volume2 See Notes on the tables
Approximate Equivalents for Forest Measures
SAVVLOGS AND VENEER LOGS1 000 board/super feet 4.53 160
PULPWOOD ROUND AND SPLIT1 stere 0.72 25.41 cord 2.55 90
VVOOD FUEL1 stere 0.65 231 cord 2.12 74.91 000 stacked cubic feet 18.41 650
Kg/CUM CUM/MTProduct
NC G C NC
Note: G = general C = coniferous, NC = non-coniferous
Weight and Volume
Solid volume without bark
WOOD FUEL. INCLUDING VVOOD FOR CHARCOAL 725 625 750 1.38 1.60 1.33
WOOD CHARCOAL 167SAWLOGS AND VENEER LOGS
Tropical 730 1.37Other 700 800 1.43 1.25
PULPWOOD, ROUND AND SPLIT 675 650 750 1.48 1.54 1.33OTHER INDUSTRIAL ROUNDWOOD 750 700 800 1.33 1.43 1.25SAWNWOOD
'
550 700 1.82 1.43VENEER SHEETS 750 1.33PLYVVOOD 650 1.54PARTICLE BOARD 650 1.54HARDBOARD 950 1.053MEDIUM DENSITY FIBREBOARD (MDF) 2
INSULATING BOARD 250 4
Product and Unit Cubic Cubic 1000 Standard
Metres Feet Board Feet (Petrograd)
ROUNDVVOOD1 hoppus cubic foot 0.03605 1.2731 ton of 5 hoppus cubic feet 1.8027 63.66
1 cunit,1 cord ,1 stere ,
1 fathom
2.833.6251
6.1164
10012835.315
216
SAVVNVVOOD1 standard (Petrograd)2 4.672 165 1.98 1
1 000 board/super feet 2.36 83.33 1 0.5051 ton of 50 cubic feet 1.416 50 0.6 0.303
VVOOD-BASED PANELS1 000 square metres (1 millimetre thickness) 1 35.315 0.42381 000 square feet (1/8 inch thickness) 0.295 10.417 0.125
Product and Unit Cubic Metres Cubic Feet
Units Metric Equivalents
1 inch = 25.4 millimetres1 square foot = 0.0929 square metre1 cubic foot = 0.02832 cubic metre1 short ton = 0.9072 metric ton1 long ton = 1.016 metric ton

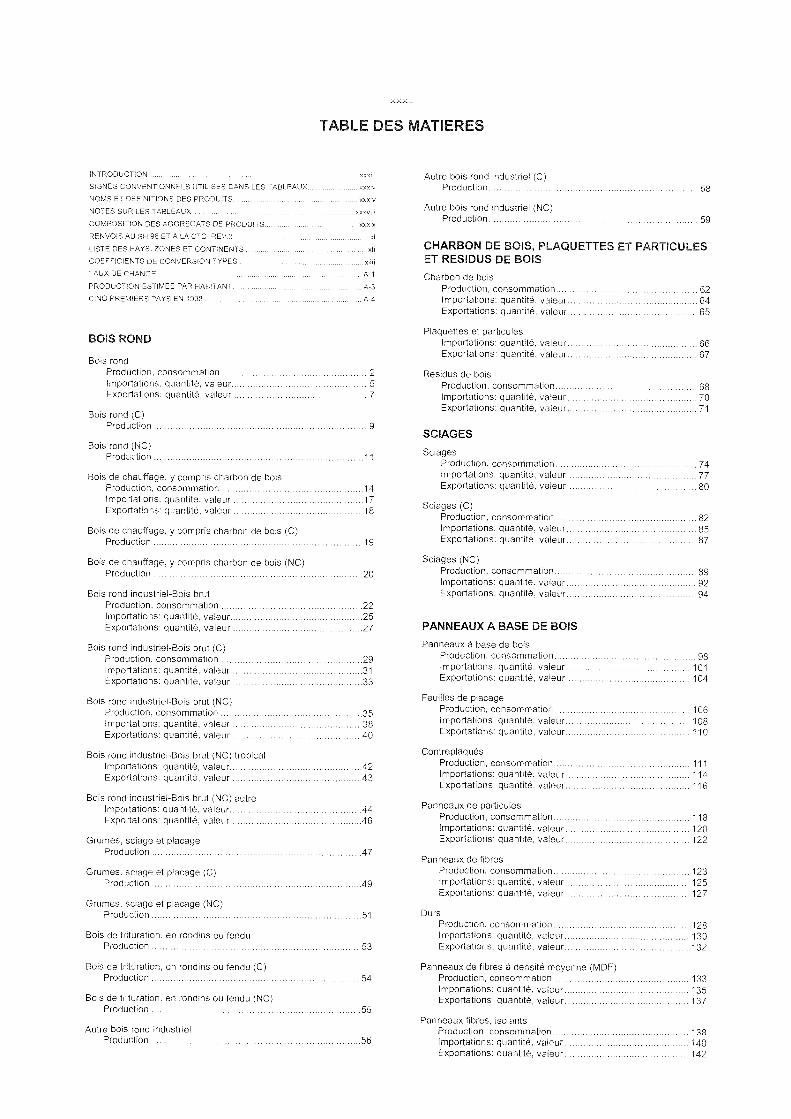
INTRODUCTION xxxF1
SIGNES CONVENTIONNELS UTILISES DANS LES TABLEAUX xxxlv
NOMS ET DEFINITIONS DES PRODUITS xxx3.,
NOTES SUR LES TABLEAUX xxxv1F
COMPOSITION DES AGGREGATS DE PRODUITS xxxIx
RENVOIS AU SH 96 ET A LA CTCI REV 3
LISTE DES PAYS. ZONES ET CONTINENTS xt/
COEFFICIENTS DE CONVERSION TYPES xtin
TAUX DE CHANGE A-1
PRODUCTION ESTIMEE PAR HABITANT A-3
CINQ PREMIERS PAYS EN 1998 A-4
BOIS ROND
Bois rondProduction, consommation 2Importations: quantité, valeur 5
Exportations: quantité, valeur 7
Bois rond (C)Production 9
Bois rond (NC)Production 11
Bois de chauffage, y compris charbon de boisProduction, consommation 14Importations: quantité. valeur 17Exportations: quantité, valeur 18
Bois de chauffage, y compris charbon de bois (C)Production 19
Bois de chauffage, y compris charbon de bois (NC)Production 20
Bois rond industriel-Bois brutProduction, consommation 22Importations: quantité. valeur 25Exportations: quantité. valeur 27
Bois rond industriel-Bois brut (C)Production, consommation 29Importations: quantité, valeur 31
Exportations: quantité, valeur 33
Bois rond industriel-Bois brut (NC)Production. consommation 35Importations: quantité, valeur 38Exportations: quantité, valeur 40
Bois rond industriel-Bois brut (NC) tropicalImportations: quantité, valeur 42Exportations: quantité, valeur 43
Bois rond industriel-Bois brut (NC) autreImportations: quantité. valeur 44Exportations: quantité. valeur 46
Grumes, sciage et placageProduction 47
Grumes. sciage et placage (C)Production 49
Grumes, sciage et placage (NC)Production 51
Bois de trituration, en rondins ou fenduProduction 53
Bois de trituration, en rondins ou fendu (C)Production 54
Bois de trituration, en rondins ou fendu (NC)Production 55
Autre bois rond industrielPrOduCtiOn 56
TABLE DES MATIERES
Autre bois rond industriel (a)Production 58
Autre bois rond industriel (NC)Production 59
CHARBON DE BOIS, PLAQUETTES ET PARTICULESET RESIDUS DE BOIS
Charbon de boisProduction. consommation 62Importations: quantité, valeur 64Exportations: quantité, valeur 65
Plaquettes et particulesImportations: quantité, valeur 66Exportations: quantité, valeur 67
Résidus de boisProduction, consommation 68Importations: quantité. valeur 70Exportations: quantité, valeur 71
SCIAGES
SciagesProduction, consommation 74Importations: quantité, valeur 77Exportations: quantité, valeur 80
Sciages (C)Production, consommation 82Importations: quantité. valeur 85Exportations: quantité, valeur 87
Sciages (NC)Production. consommation 89Importations: quantité. valeur 92Exportations: quantité, valeur 94
PANNEAUX A BASE DE BOIS
Panneaux a base de boisProduction, consommation 98Importations: quantité, valeur 101Exportations: quantité, valeur 104
Feuilles de placageProduction, consommation 106Importations: quantité, valeur 108Exportations: quantité, valeur 110
ContreplaquésProduction, consommation 111Importations: quantité, valeur 114Exportations: quantité, valeur 116
Panneaux de particulesProduction, consommation 118Importations: quantité. valeur 120Exportations: quantité, valeur 122
Panneaux de fibresProduction. consommation 123Importations: quantité, valeur 125Exportations: quantité, valeur 127
DursProduction, consommation 128Importations: quantité, valeur 130Exportations: quantité, valeur 132
Panneaux de fibres a densité moyenne (MDF)Production, consommation 133Importations: quantité, valeur 135Exportations: quantité, valeur 137
Panneaux fibres, isolantsProduction, consommation 138Importgons: quantité, valeur 140Exportations: quantité, valeur 142
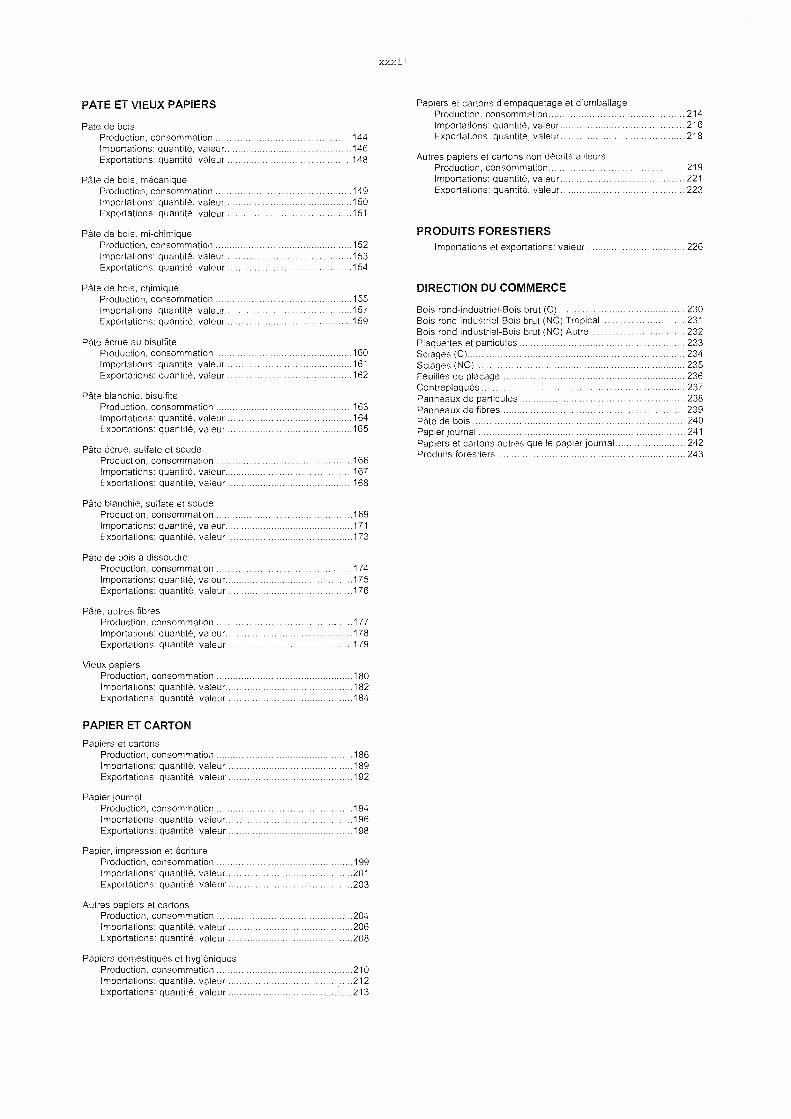
PATE ET VIEUX PAPIERS
Päte de boisProduction, consommation 144Importations: quantité, valeur 146Exportations: quantité, valeur 148
Päte de bois, mécaniqueProduction, consommation 149Importations: quantité, valeur 150Exportations: quantité, valeur 151
PM° de bois, mi-chimiqueProduction, consommation 152Importations: quantité, valeur 153Exportations: quantité, valeur 154
Päte de bois, chimiqueProduction, consommation 155Importations: quantité, valeur 157Exportations: quantité, valeur 159
Päte écrue au bisulfiteProduction, consommation 160Importations: quantité, valeur 161
Exportations: quantité, valeur 162
Päte blanchie, bisulfiteProduction. consommation 163Importations: quantité, valeur 164Exportations: quantité, valeur 165
Päte écrue, sulfate et soudeProduction, consommation 166Importations: quantité, valeur 167Exportations: quantité, valeur 168
Päte blanchie, sulfate et soudeProduction, consommation 169Importations: quantité, valeur 171
Exportations: quantité, valeur 173
Päte de bois â dissoudreProduction, consommation 174Importations: quantité, valeur 175Exportations: quantité, valeur 176
Päte, autres fibresProduction, consommation 177
Importations: quantité, valour 178Exportations: quantité, valeur 179
Vieux papiersProduction, consommation 180Importations: quantité, valeur 182Exportations: quantité, valeur 184
PAPIER ET CARTON
Papiers et cartonsProduction, consommation 186Importations: quantité, valeur 189Exportations: quantité, valeur 192
Papier journalProduction, consommation 194Importations: quantité, valeur 196Exportations: quantité, valeur 198
Papier, impression et écritureProduction, consommation 199Importations: quantité, valeur 201Exportations: quantité, valeur 203
Autres papiers et cartonsProduction, consommation 204Importations: quantité, valeur 206Exportations: quantité, valeur 208
Papiers domestiques et hygiéniquesProduction. consommation 210Importations: quantité, valeur 212Exportations: quantité, valeur 213
Papiers et cartons d'empaquetage et d'emballageProduction. consommation 214Importations: quantité, valeur 216Exportations: quantité, valeur 218
Autres papiers et cartons non décrits ailleursProduction, consommation 219Importations: quantité, valeur 221Exportations: quantité, valeur 223
PRODUITS FORESTIERSImportations et exportations: valeur 226
DIRECTION DU COMMERCE
Bois rond-industriel-Bois brut (C) 230Bois rond industriel-Bois brut (NC) Tropical 231
Bois rond industriel-Bois brut (NC) Autre 232Plaquettes et particules 233Sciages (C) 234Sciages (NC) 235Feuilles de placage 236Contreplaqués 237Panneaux de particules 238Panneaux de fibres 239Päte de bois 240Papier journal 241
Papiers et cartons autres que le papier journal 242Produits forestiers 243
INTRODUCTION
Le present volume est la 52ème edition de l'Annuaire FAOdes produits forestiers. II contient les chiffres annuels de laproduction et du commerce des produits forestiers pour la*lode 1994-1998 et de la direction des échanges en 1997 et1998. Toutes les series chronologiques relatives aux produitsforestiers, à partir de 1961, sont disponibles sous formeélectronique sur disquettes (FAOSTAT PC), sur disque compact(FAOSTAT CD) et sur Internet a l'adresse suivante:http://apps.fao.org/forestry. Pour acheter ces produits, adressez-vous publications-sales©fao.org ou sur Internet a l'adressesuivante: http://appslao.org/products.htm
Vous noterez un changement dans la présentafion del'Annuaire. Afin de faciliter l'accès a 'Information sur la foresterieet de mieux servir ses Etats Membres, la FAO a introduitégalement des sections en arabe et en chinois qui serontaugmentées chaque année.
La publication de l'Annuaire a été rendue possible grace a lacooperation des gouvernements qui ont fourni la plupart desrenseignements en répondant a des questionnaires. La présenteedition a bénéficie d'une cooperation élargie dans la collecte destatistiques sur le secteur foresfier entre plusieurs organisationsinternationales. A partir de 1999, les renseignements concernantla production et le commerce en 1998 et les mises à jour pour1997 ont été recueillis à l'aide d'un questionnaire commun surles produits forestiers sous l'égide du Departement des foréts dela FAO, de la Commission économique pour l'Europe (CEE), del'Office statistique des Communautés européennes(EUROSTAT) et de l'Organisation internationale des boistropicaux (0IBT). Ce questionnaire commun répond a la
demande des pays membres des quatre organisationspartenaires de rationaliser nos méthodes de collecte et dediffusion des données relatives au secteur forestier. Cela devraitfaciliter la communication de données par les pays, améliorerles taux de réponse et rendre plus cohérents les documents destatistiques forestières publies par les diverses organisations.
Les tableaux de l'Annuaire sont classes en trois parties. Lapremière contient des renseignements au sujet des paysclasses les premiers pour la production, la consommation et lecommerce des produits forestiers en 1998. La deuxièmecontient les principaux tableaux relatifs au volume de la
production, à la consommation et au commerce, ainsi que lesvaleurs totales et unitaires du commerce, pour chaque pays etpour chaque type de produit forestier. La troisième pate estconstituée de tableaux indiquant les directions bilatérales ducommerce pour les principales categories de produits.
Les tableaux de la deuxième pate présentent les donnéesrelatives aux cinq années 1994-1998. Ces tableaux sontdisposes de telle sorte que, pour chaque produit forestier, lesdonnées sur la production, les importations et les exportationsse suivent. Comme la ventilation des produits n'est pas la memepour les statistiques de la production que pour celles ducommerce, certains produits figurent seulement dans lestableaux de la production et d'autres seulement dans ceux ducommerce. En general, sont présentés tout d'abord les tableauxrelatifs au bois rond, puis ceux des sciages, des panneaux, de lapate et du papier (dans cet ordre). A l'intérieur de cesgroupements figurent d'abord les tableaux relatifs au total desproduits, puis ceux relatifs a cheque produit.
Les statistiques sur la direction du commerce indiquent les15 premiers exportateurs et les 25 premiers importateurs pourchacun des produits forestiers faisant l'objet d'échangesimportants. Ces renseignements, concernant les deux dernièresannées, sont fondés sur une analyse des données fournies parles pays par le biais du questionnaire commun ou tires de labase de données COMTRADE du Bureau de statistique del'ONU. Dans le cadre des efforts menés par la FAO pouretendre la couverture statistique, une direction plus large desstatistiques sur le commerce sera bientöt publiée égalementsous forme électronique sur le site web FAOSTAT.
On donne ci-après de breves definitions des produitsforestiers et des agrégats de produits forestiers. Dans cettesection, les agrégats de produits forestiers et les produitsforestiers individuels sont énumérés dans le mérne ordre quedans l'Annuaire. Ces definitions s'appuient sur celles contenuesdans: Classification et definitions des produits forestiers, FAO,
ANNUAIRE FAO DES PRODUITS FORESTIERS
Rome, 1982. Dans le present Annuaire. on a peaufine lesdefinitions et les classifications des produits afin de répondreaux besoins de tous ceux qui ont repondu au questionnairecommun sur les produits foresfiers et d'éviter que des produitsfigurent dans deux categories a la fois. A la fin de cette section.un tableau présente la composition des agrégats de produits ence qui concerne la producfion, la consommafion et le commerce.Dans le cas des exportations et des importations, un tableaufigurant a la fin de cette section associe au nom du produitforestier un code ufilisé dans la Classification type pour lecommerce intemational (Cid) et dans le Système harmonise(SH) de l'Organisation mondiale des douanes.
Les tableaux sont tires de la base de données FAOSTAT dela FAO sur les produits forestiers. Ils utilisent les étiquettescréées par ordinateur pour les noms des produits forestiers etpour presenter des entités geographiques. Une liste de cesétiquettes pour les noms de continents, zones et pays figureplus loin dans un tableau.
Comme dans les volumes precedents, certains chiffres sontdes estimations de la FAO ou des données obtenues d'autressources que les reponses officielles aux questionnaires. Pour lesseries de cinq ans, il a été tenu compte des revisions officielleset des renseignements nouveaux provenant d'autres sources.Ainsi. les chiffres publiés dans des édifions precedentes ontparfois été revises pour ces series. Dans certains cas, I es payscommuniquent les données dans des unites ou systemes demesure différents de ceux qui sont adoptés pour l'Annuaire. Ona cif, les convertir en unites standard. Le lecteur trouvera lescoefficients de conversion au système métrique à la fin de cettesection. La FAO espère que les pays lui communiqueront lescorrections lorsqu'une modification semble se justifier.
Un tableau des taux de change pour la série de 5 annéesfigure également dans l'Annuaire. II indique les taux de changeutilises pour convertir les monnaies locales en une monnaiecommune (dollars des Etats-Unis) dans les tableaux contenantles chiffres du commerce. Les chiffres de la production ou ducommerce sont arrondis à 1 000 unites; les chiffres serapportant au volume (y compris la consommation netteapparente par millier d'habitants) sont exprimés en tonnes pourle charbon de bois, la pate et les produits du papier et en metrescubes pour tous les autres produits. Quand le nom d'un pays oud'une zone apparait dans un tableau mais qu'il n'y a pasd'entrée numérique correspondante ou qu'elle est égale a "0",cela signifie que les quantités enregistrées sont inferieures a 500unites. Cependant, les totaux régionaux et mondiaux sontcalculés à partir des chiffres non arrondis et comprennent doneces quantités.
Lorsqu'on ne disposait pas de statistiques officielles, lesestimations de la FAO sont signalées par un (F) et les donnéesnon officielles par un asterisque (*). L'utilisation de (F) et de (*)est indiquée dans les tableaux des produits au niveau de chaqueproduit, par exemple pour les contreplaqués, mais pas au niveaudes aggregats, par exemple pour les panneaux de bois.
Pour améliorer ces series, veuillez nous contacter quandvous constatez que des données ne concordent pas avec cellesde sources reconnues ou autorisées, et avertissez-nous quandelles n'ont pas de sens, mérne si elles sont officielles. Noussouhaitons communiquer des données précises en temps utileet demandons à tous les pays de nous aider à améliorer lacompilation et la diffusion de statistiques de qualité sur laproduction et le commerce international des produits forestiers.Vous trouverez cl-dessous tous les details concernant lescontacts avec les fonctionnaires de la FAO charges de chacunedes sections de l'Annuaire: Sous-Division de la planification etdes statistiques forestières, Département des forets de la FAO.Viale delle Terme di Caracalla, 00100 Rome, 'take. Télécopieur :+39-06-5705.5514 ou +39-06-5705.5137; Courrier électronique:pour des observations générales michael.martin©fao.org;pour les statistiques sur la production crissis.vici©fao.org;pour les statistiques sur le commerce -- eva.borzillo©fao.org;pour accéder à FAOSTAT felice.padovani© fao.org.
SIGNES CONVENTIONNELS UTILISES DANS LESTABLEAUX
CUM Metre cubeMT Tonne métrique
ConifèresNC Non-conifères
Estimation de la FAOChiffre non officielDollar des Etats-Llnis
NOMS ET DEFINITIONS DES PRODUITS
Les termes généraux et les flOMS des produits forestiers utilisesdans l'Annuaire sont énumérés ci-après, suivis d'une brevedefinition. La Classification et definitions des produits forestiers,FAO, Rome. 1982, a été suivie autant que possible. Certainesdes definitions ont été peaufinées par souci d'harmonisationavec le questionnaire commun sur les produits forestiers.
Termes généraux
ConifèresBois provenant d'arbres classes en botanique sous le nom de"gymnospermes-, par exemple: sapin (Abies), pin de Parana(Araucaria). cedre (Cedrus). ginkgo (Ginkgo), méleze (Larix),épicea (Picea), pin, chir. kail (Pious), etc. (On les appellegénéralement bo's tendres).
Non-conifèresBois provenant d'arbres classes en botanique sous le nomrangiospermes par exemplel érable (Acer); aulneétpène (Diospyros), hétre (Paps), gayac (Guaiscum), peuplier(Populas), chéne (Quercus), sal (Shores), teck (Tectona), filao(Casuarina), etc. (On les appelle géneralement feuillus ou boisdurs).
TropicalSeIon l'Accord international sur les bois tropicaux de 1994, parbois tropicaux, "il faut entendre le bois tropical non conifère àusage industriel (bois d'oeuvre) qui pousse ou est produitdans les pays situes entre le Tropique du Cancer et leTropique du Capricorne. Cette expression s'applique auxgrumes, sciages, placages et contre-plaqués. Les contre-plaques qui se composent en partie de conifères d'originetropicale sont également inclus dans la présente definition".Ce terme n'est utilise ici que pour designer le bois rondindustriel (non-conifère).
AutresBois provenant de pays autres que les pays tropicaux (tels quedéfinis ci-dessus). Ce terme n'est utilise ici que pour designerle bois rond industriel (non-conifère).
Quantités enlevéesLe volume de tous les arbres, vivants ou morts, qui sontabattus et enlevés de la foret, d'autres terres boisées oud'autres chantiers d'abattage. Cette rubrique comprend: lespertes naturelles qui sont récupérées (c'est-a-dire récoltées).les quantités enlevées durant une période précédente, lesquantités enlevées de bois autres que le bois de fût tels quesouches et branches (la où celles-ci sont récoltées) et lesarbres tués ou endommages par des causes naturelles (c'est-a-dire les pertes naturelles), par exemple feu, déracinementspar le vent, insectes et maladies. Sont exclus: l'écorce etd'autres types de biomasse non ligneuse et tout le bois quin'est pas enlevé, par exemple souches, branches et cimesdes arbres (la où celles-ci ne sont pas récoltées) et les résidusd'exploitation (déchets d'abattage). Les chiffres sontexprimés en metres cubes sous écorce (c'est-à-dire sansécorce). Lorsque le volume est mesuré sur écorce (c'est-a-dire avec écorce), il faut le rajuster a la baisse pour faire laconversion en une estimation sous-écorce.
ProductionLe volume solide ou le poids de toute la production des produitsspecifies ci-après. Cette rubrique comprend: la production deproduits pouvant étre consommés immédiatement pourfabriquer un autre produit (par exemple, la pate de bois qui peut
atre transformée immédiatement en papier dans un processuscontinu). Est exclue: la production de feuilles de placage quisont utilisées pour la fabrication de contreplaqués dans le pays.Les chiffres se rapportent au volume solide exprimé en metrescubes dans le cas du bois rond, des sciages et des panneaux àbase de bois et en tonnes dans le cas du charbon de bois, de lapate et des produits du papier.
ImportationsProduits destines a la consommation ou a l'industrie nationalepenetrant dans le pays. Cette rubrique comprend: lesimportations destinées à etre réexportées dans certains cas.Sont exclues: les marchandises en transit. Les chiffres serapportent au volume solide exprimé en metres cubes ou entonnes et les valeurs sont généralement c.a.f. (coût, assurance,fret).
ExportationsTout ce qui est produit ou transformé dans le pays et expédiefetranger. Cette rubrique comprend: les reexportations danscertains cas Sont exclues: les marchandises en transit. Leschiffres se lapportent au volume solide exprimé en metrescubes ou en tonnes et il s'agit normalement de valeurs f.o.b.
Valeurs Ull'tairesLes valeurs unitaires peuvent 'etre, obtenues en divisant la vateurtotale du commerce par le volume total du commerce. II s'agitde valeurs moyennes f.o.b, pour les exportations et c.a.f. pourles importations.
ConsommationConsommation nette apparente -= production + importations -exportations; elle ne peut donc étre calculée que lorsque desdonnées sont disponibles pour les trois elements.
Agrégats de produits forestiers et noms de produitsforestiers
Les agrégats de produits forestiers et les noms de produltsforestiers figurent ci-après dans le mérne ordre que dans lestableaux. On n'a pas redéfini séparément les conifères (C) et lesnon-conifères (NC) lorsque les definitions générales ci-dessussont valables. Sauf indication contraire, chaque catégorie deproduit forestier comprend les conifères et les non-conifères. Ala fin de cette section, un tableau recapitule les categories et lesagrégats de produits, montrant comment ils sont lies les uns auxautres.
BOIS ROND
Bo s rondBois rond (C)Bois rond (NC)
Tout le bois rond abattu ou autrement récolté et enlevé. Catecatégorie comprend tous les bois provenant des quantitésenlevées. c'est-à-dire les quantités enlevées en forêt ouprovenant des arbres poussant hors fork. y compris le volumerécupéré sur les déchets naturels et les déchets d'abattage et detransport pendant la période envisagée (année civile ouforestière). Cette rubrique comprend: tout le bois enlevé avecou sans écorce. y compris le bois enlevé à l'état naturel, oufendu. grossièrement equarri ou sous une autre forme (parexemple branches, racines, souches, loupes - la où celles-cisont récoltées) et le bois degrossi ou taillé en pointe. Lesstatistiques sur la production englobent: bois de chauffage, ycompris le charbon de bois; les grumes de sciage et de placage:le bois de trituration, en rondins ou fendu; et d'autres bois rondsindustriels. Les statistiques commerciales englobent: boisrond industriel - bois brut; et bois de chauffage. y compris lecharbon de bois. Les chiffres sont exprimés en metrescubes sous écorce (c'est-à-dire sans écorce). Les statistiquescomprennent les volumes enregistrés ainsi que des volumesestimés. selon les indlcations figurant dans les notes.
Bois de chauffage, y compris charbon de boisBois de chauffage, y compris charbon de bois (C)Bois de chauffage, y compris charbon de boa (NC)
Bois rond destine a servir de combustible pour la cuisine. le
chauffage la production d'énergie, etc. Cette rubriquecomprend: bois récolté sur les tiges principales les branches etd'autres parties de l'arbre (la ()Li celles-ci sont récoltées pour lechauffage) et le bois qui sert a la production de charbon de bois(par exemple dans fours souterrains et fours mobiles). Onestime le volume de bois rond utilise pour la production decharbon de bois en appliquant un coefficient de 6,0 pourconvertir les unites de poids (tonnes) de charbon de bois produiten unites de volume solide (metres cubes) de bois rond utilisepour la production. Les chiffres sont exprimés en metrescubes sous écorce (c'est-a-dire sans écorce).
Bois rond industriel-Bois brutBois rond industriel-Bois brut (C)Bois rond industriel-Bois brut (NC)Bois rond industriel-bois brut (NC) TropicalBois rond industriel-Bois brut (NC) Autre
Bois rond qui sert à produire dautres biens et services (saufcomme source de combustible). Cette rubrique comprend:tous les bois Fonds sauf le bois de chauffage. Les statistiquessur la production englobent: grumes de sciage et de placage;bois de trituration, en rondins ou fendu, et d'autres bois rondsindustriels. Les statisfiques sur le commerce pour cettecatégorie sont divisées seulement en coniferes et non-coniferes(eux-rnémes divisés en tropicaux et non tropicaux). Les chiffressont exprimés en metres cubes sous écorce (c'est-a-diresans écorce).
Grumes, sciage et placageGrumes, sciage et placage (C)Grumes, sciage et placage (NC)
Bois rond qui sera scié (ou fendu) longitudinalement pour lafabrication de sciages ou de traverses de chemins de fer ouutilise pour la production de placages (essentiellement pardéroulage ou tranchage). Cette rubrique comprend: bois rond(grossièrement équarri ou non) qui servira a ces fins; billots pourbardeaux et douves; buches pour la fabrication des allumeries etd'autres types spéciaux de bois rond (par exemple loupes,racines, etc.) utilises dans la fabrication des placages. Leschiffres sont exprimés en metres cubes sous écorce (c'est-a-dire sans écorce).
Bois de trituration, en rondins ou fenduBois de trituration, en rondins ou fendu (C)Bois de trituration, en rondins ou fendu (NC)
Bois rond destine a la fabrication de pale, de panneaux departicules ou de panneaux de fibres. Cette rubrique comprend:bois rond (écorcé ou non) pu i servira a ces fins sous forme derondins de bois fendus ou de plaquettes élaborées directement(c'est-a-dire dans la forét) du bois rond. Les chiffres sontexprimés en metres cubes sous écorce (c'est-a-dire sansécorce).
Autre bois rond industrielAutre bois rond industriel (C)Autre bois rond industriel (NC)
Bois rond utilise hors du secteur de l'industrie forestière pour laproduction d'autres biens et services (sauf comme source decombustible). Cette rubrique comprend: bois ronds utilisespour la tannerie, la distillation les tiges d'allumettes, bois pourgazogènes, poteaux, pilotis et piquets, clôtures et etais de mine,etc. Les chiffres sont exprimés en metres cubes sousécorce (c'est-a-dire sans ecorce).
CHARBON DE BOIS, PLAQUETTES ET PARTICULES ETRESIDUS DE BOIS
Charbon de boisBois carbonise par combustion partielle ou par l'appl cation dechaleur fournie par des sources externes. Cette rubriquecomprend: charbon de bois utilise comme combustible oudestine a d'autres usages, par exemple comme agentréducteur en métallurgie ou comme milieu d'absorption ou defiltrage. Les chiffres sont exprimés en tonnes.
XXX,/Plaquettes et particulesBois transformé délibérément en petits fragments pour lafabricafion d'autres produits tels que pate, panneaux departicules et panneaux de fibres. pour Futilisation commecombustible ou a d'autres fins. Sont exclues: les plaquettes debois provenant directement (c'est-a-dire dans la foret) de boisFond (pu i sont donc déjà comptees comme bois de trituration, enrondins ou fendu). Les chiffres se rapportent au volumesolide exprimé en metres cubes, écorce non comprise.
Residus de boisVolume de bois rond restant apres la production de produitsforestiers dans l'industrie de transformation (par exemple résidusde la transformation en foret) et qui n'ont pas été réduits enparticules ou en plaquettes. Cette rubrique comprend: déchetsde scierie, dosses, délignures et déchets d'ébranchage, noyauxde déroulage et déchets de placages, sciure, déchets decharpenterie et de menuiserie, etc. Sont exclues: les plaquettesfaites soit directement (c'est-a-dire dans la forét) du bois rondsoit a partir de résidus (qui sort donc dé)à comptées commebois de trituration, en rondins et fendus ou plaquettes etparticules). Les chiffres se rapportent au volume solideexprimé en metres cubes, écorce non comprise.
SCIAGES
SciagesSciages (C)Sciages (NC)
Bois produits a partir de bois Fond national ou importé, soit sciésdans le sens de la longueur soit obtenus a l'aide d'un precedede profilage par enlèvement de copeaux et qui, a quelquesexceptions près, ont plus de 5 mm dépaisseur. Cette rubriquecomprend: madriers, pouffes, solives, planches, chevrons.voliges, lattes, planches de caisserie, bois d'oeuvre, etc. sousles formes suivantes: non rabotés, rabotés, rainés, languetés,joints digitiformes, chanfreines, à feuillures, à joints en V, arebords, etc. Sont exclus: les elements de parquet en bois. Leschiffres se rapportent au volume solide exprimé en metrescubes.
PANNEAUX A BASE DE BOIS
Panneaux a base de boisII s'agit d'un agregat de produits. Les statistiques sur laproduction et le commerce englobent: feuilles de placage,contreplaques, panneaux de particules et de fibres. Jusqu'en1995, les panneaux de fibres étaient divisés en panneauxcomprimés et panneaux non comprimes. A partir de 1995, lespanneaux de fibres comprimes ont été decomposes enpanneaux durs et panneaux a densité moyenne (MDF) et lespanneaux de fibres non comprimes sont appelés maintenantpanneaux isolants. Les chiffres se rapportent au volumesolide exprimé en metres cubes.
Feuilles de placageMinces couches ou feuilles de bois d'épaisseur uniforme,obtenues par déroulage (c'est-a-dire placage a coupe rotative),tranchage ou sciage. Cette rubrique comprend: bois utilisepour la fabrication des contreplaqués. des structures lamellées,du mobilier, des emballages, etc. Sont exclus: les bois utilisespour la fabrication de contreplaqués dans le pays. Les chiffresse rapportent au volume solide exprime en metres cubes,
ContreplaquésPanneaux fabriques en collant plusieurs feuilles de placagedisposées à fils croisés, généralement a angles droits. Lesfeuilles de placage sont toujours placees symétriquement desdeux cotes d'une couche ou ame centrale qui peut elle-mêmeetre faite d'une feuille de placage ou d'un autre matériau. Cetterubrique comprend: /e contreplaqué à pHs (contreplaquéfabriqué en collant plus de deux feuilles de placage, où lescouches sont disposées à fils croisés, généralement a anglesdroits); /e contreplaqué à âme ou panneau latté (contreplaquédont Lame, c'est-a-dire la couche centrale, généralement plusépaisse que les autres couches, est en bois plein et se composede planchettes, de lattes ou de lamelles de bois placées cote acote, qui peuvent étre collées ou non); les contreplaquésalvéolaires (contreplaqués dont 'âme consiste en une structure
cellulaire); et les contreplaqués composites (contreplaquésdont l'âme ou certaines couches sont faites de matériaux autresque le bois plein ou les placages). Sont exclus: les matériauxde construction laminés (par exemple le glulam), où les feuillesde placage sont géneralement dans le sens de la longueur. Leschiffres se rapportent au volume solide exprimé en metrescubes.
Panneaux de particulesPanneaux fabriques avec des padicules de bois ou autresmatières ligno-cellulosiques (par exemple plaquettes, flocons,éclats, copeaux longs, debris d'anas de lin, etc.) aggloméréespar un liant organique à l'aide d'un ou de plusieurs des agentssuivants: chaleur, pression, humidité, catalyse, etc. Cetterubrique comprend: panneaux de grandes particules,panneaux de particules orientées (PPO) et panneaux de lin.Sont exclus: les panneaux de laine de bois et autres panneauxde particules agglomérés dans des liants minéraux. Les chiffressont exprimés en metres cubes de volume solide.
Panneaux de fibresPanneaux faits de fibres de bois ou d'autres substances ligno-cellulosiques agglomérées essentiellement grace au feutragedes fibres et à leurs propriétés adhesives naturelles (bien quedes liants et/ou des additifs puissent étre ajoutés durant lafabrication). Cette rubrique comprend: panneaux de fibrespresses à plat et moulés. Les statistiques sur la production etle commerce englobent: panneaux durs, panneaux à densitémoyenne (MDF) et panneaux isolants. Les chiffres serapportent au volume solide exprimé en metres cubes.
Panneaux dursPanneaux de fibres dont la densité est supérieure a 0,80 9/cm3.Avant 1995, ce produit faisait partie de la catégorie despanneaux de fibres comprimés: on ne dispose donc pas dedonnées pour ce produit pour 1994 et les années précédentes.Sont exclus: les produits analogues fabriqués à partir demorceaux de bois, de farine de bois ou d'autres matériaux ligno-cellulosiques avec adjonction de liants, el panneaux de gypse oud'autre matériau mineral. Les chiffres se rapportent auvolume solide exprimé en metres cubes.
Panneaux de fibres a dens te moyenne (MDF)Panneaux de fibres dont la densité est comprise entre 0,5g/cm3 et 0.8 g/cm3. Avant 1995, ce produit faisait partie de lacatégorie des panneaux de fibres comprimés: on ne disposedonc pas de données pour 1994 et les années précédentes.Les chiffres se rapportent au volume solide exprimé enmetres cubes.
Panneaux fibres, isolantsPanneaux de fibres dont la densité ne dépasse pas 0,5 g/cm3.Avant 1995, ce produit était appelé panneau de fibre noncomprimé. Les chiffres se rapportent au volume solideexprimé en metres cubes.
PATE ET VIEUX PAPIERS
Pate de boisLa matière fibreuse préparee â partir de bois de trituration, deplaquettes, de particules, de résidus ou de vieux papiers parun processus mecanique et/ou chimique pour une nouvelletransformation en papier, carton, panneaux de fibres ou autresproduits cellulosiques. Les statistiques sur la production etle commerce englobent: pate de bois mécanique; pate de boismi-chimique; pate de bois chimique et pate de bois à dissoudre.Les chiffres se rapportent au poids sec a l'air (c'est-à-direavec une teneur en humidité de 10%) exprimé en tonnes.
Pate de bois, mécaniquePates de bois obtenues par le broyage ou le räpage de bois detrituration ou de résidus de bois en fibres, ou par le raffinage deplaquettes ou de particules. Appelées également patemécanique de défibreur et pate mécanique raffinée, ellespeuvent étre blanchies ou non. Cette rubrique comprend: patechimico-mecanique et pate thermo-mécanique. Sont exclues:pate éclatée et pate defibrée. Les chiffres se rapportent aupoids sec à l'air (c'est-b-dire avec une teneur en humidité de10%) exprimé en tonnes.
Pate de bois, mi-chimiquePates de bois obtenues en soumettant du bois de trituration, desplaquettes et particules de bois ou des résidus de bois à uneserie de traitements mécaniques et chimiques dont aucun n'estsuffisant seul pour que les fibres se séparent aisement Ellespeuvent étre blanchies ou non. Cette rubrique comprend: patede bois mi-chimique; pate de bois chimico-mécanique dedéfibreur et pate de bois chimico-mécanique, etc. (suivant l'ordreet l'importance des traitements subis durant la fabrication). Leschiffres se rapportent au poids sec a l'air (c'est-à-dire avecune teneur en humidité de 10%) exprimé en tonnes.
Pate de bois, chimiquePates de bois obtenues en soumettant du bois de trituration, desplaquettes et particules de bois ou des résidus de bois à unesérie de traitements chimiques. Cette rubrique comprend:pate de bois au sulfate (kraft), à la soude et au bisulfite. Ellespeuvent étre blanchies, mi-blanchies ou écrues. Sont exclues:les pates de bois à dissoudre. Les chiffres se rapportent aupoids sec a l'air (c'est-a-dire avec une teneur en humidité de10 0/e) exprimé en tonnes. Lorsque les details sont disponibles,les statistiques sont ventilées entre les quatre categoriessuivantes: pate écrue au bisulfite, pate au bisulfite blanchie, pateécrue au sulfate et pate au sulfate blanchie.
Prate écrue, bisulfitePate blanchie, bisulfitePate de bois obtenue en récluisant mécaniquement du bois detrituration, des plaquettes et particules de bois ou des résidus debois en petits fragments et en les cuisant sous pression avecune lessive de cuisson au bisulfite. Les bisulfites les pluscommunément utilises sont ceux d'ammonium, de calcium, demagnesium et de sodium. Sont exclues: les pates de bois edissoudre. Les chiffres se rapportent au poids sec a l'air(c'est-a-dire avec une teneur en humidité de 10%) exprimé entonnes et deux sous-categories sont prévues: les patesblanchies (y compris les pates mi-blanchies) et les pates &rues.
Pate écrue, sulfatePate blanchie, sulfatePate de bois obtenue en réduisant mécaniquement du bois detrituration, des plaquettes de bois, des particules ou résidus enpetits fragments et en les cuisant sous pression avec unelessive de cuisson a base de soude caustique (pour les patesla soude) ou d'un mélange de soude caustique et de sulfate desodium (pour les pates au sulfate). Sont exclues: les pates debois à dissoudre. Les chiffres se rapportent au poids sec al'air (c'est-a-dire avec une teneur en humidité de 10%) et deuxsous-categories sont prévues: les pates blanchies (y comprisles pates mi-blanchies) et les pates écrues.
Pate de bois à dissoudrePate chimique (au sulfate, e la soude ou au bisulfite) de boisd'une qualité spéciale, ayant une très forte teneur en alpha-cellulose (en general 90 pour cent ou plus). Ce type de pate esttoujours blanchi et se prete aisément a des utilisations autresque la fabrication du papier. Ces pates sont principalementutilisées comme matières cellulosiques dans la fabrication deproduits tels que fibres artificielles, matières plastiquescellulosiques, laques et explosifs. Les chiffres se rapportentau poids sec a raft (c'est-a-dire avec une teneur en humiditéde 10%) exprimé en tonnes.
Pate, autres fibresPate obtenue à l'aide de matière végétale fibreuse autres que lebois el utilisée pour la fabrication de papier, de carton et depanneaux de fibres. Cette rubrique comprend: pätes obtenuese partir de: paille, bambous, bagasse, alpha, divers roseaux ouplantes herbacées; linters de coton; lin; chanvre, chiffons etautres déchets textiles. Est exclue: la pate obtenue a partir devieux papiers. Les chiffres se rapportent au poids sec a l'air(c'est-a-dire avec une teneur en humidité de 10%) exprimé entonnes.
Vieux papiersPapiers et cartons de rebut qui ont été ramassés en vue d'uneréutilisation comme matière première pour la fabrication depapier et de carton. Cette rubrique comprend: papiers et
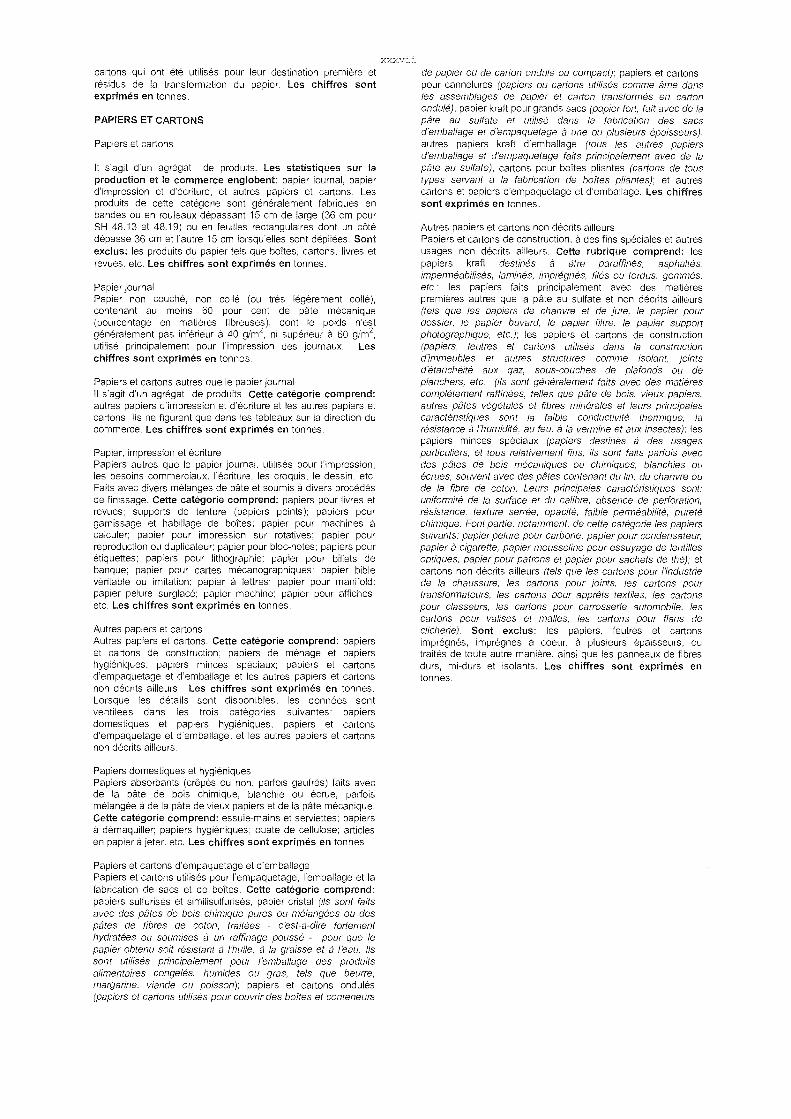
xxxvcartons qui ont été utilises pour leur destination première etrésidus de la transformation du papier. Les chiffres sontexprimés en tonnes.
PAPIERS ET CARTONS
Papiers et cartons
II s'agit d'un agrégat de produits. Les statistiques sur laproduction et le commerce englobent: papier journal, papierd'impression et crécriture, et autres papiers et cartons. Lesproduits de cette catégorie sont généralement fabriqués enbandes ou en rouleaux dépassant 15 cm de large (36 cm pourSH 48.13 et 48.19) ou en feuilles rectangulaires dont un cbtedépasse 36 cm et l'autre 15 cm lorsqu'elles sont dépliées. Sontexclus: les produits du papier tels que bottes, cartons, livres etrevues, etc. Les chiffres sont exprimés en tonnes.
Papier journalPapier non couché, non colle (ou très légèrement collé),contenant au moins 60 pour cent de päte mécanique(pourcentage en matières fibreuses), dont le poids n'estgénéralement pas inférieur a 40 g/m2, ni supérieur a 60 g/m2,utilise principalement pour l'impression des journaux. Leschiffres sont exprimés en tonnes.
Papiers et cartons autres que le papier journalII s'agit d'un agrégat de produits. Cette catégorie comprend:autres papiers d'impression et d'écriture et les autres papiers etcartons. Ils ne figurent que dans les tableaux sur la d rection ducommerce. Les chiffres sont exprimés en tonnes.
Papier, impression et écriturePapiers autres que le papier journal, utilises pour l'impression,les besoins commerciaux, l'écriture, les croquis, le dessin, etc.Faits avec divers mélanges de päte et soumis a divers procédésde finissage. Cette catégorie comprend: papiers pour livres etrevues; supports de tenture (papiers peints); papiers pourgarnissage et habillage de boites; papier pour machines acalculer; papier pour impression sur rotatives; papier pourreproduction ou duplicateur; papier pour bloc-notes; papiers pourétiquettes; papiers pour lithographie; papier pour billets debanque; papier pour cartes mécanographiques; papier bibleveritable ou imitation; papier a lettres; papier pour manifold;papier pelure surglacé; papier machine; papier pour affiches,etc. Les chiffres sont exprimés en tonnes.
Autres papiers et cartonsAutres papiers et cartons. Cette catégorie comprend: papierset cartons de construction; papiers de ménage et papiershygiéniques; papiers minces speciaux; papiers et cartonsd'empaquetage et d'emballage et les autres papiers et cartonsnon décrits ailleurs. Les chiffres sont exprimés en tonnes.Lorsque les details sont disponibles, les données sontventilées dans les trois categories suivantes: papiersdomestiques et papiers hygiéniques, papiers et cartonsd'empaquetage et d'emballage, et les autres papiers et cartonsnon décrits ailleurs.
Papiers domestiques et hygiéniquesPapiers absorbants (crepes ou non, parfois gaufrés) faits avecde la pate de bois chimique, blanchie ou écrue, parfoismélangée a de la pate de vieux papiers et de la pate mecanique.Cette catégorie comprend: essuie-mains et serviettes; papiers
dernaquiller; papiers hygiéniques; ouate de cellulose; articlesen papier a jeter, etc. Les chiffres sont exprimés en tonnes.
Papiers et cartons d'empaquetage et d'emballagePapiers et cartons utilises pour l'empaquetage, l'emballage el lafabrication de sacs et de bottes. Cette catégorie comprend:papiers sulfurisés et similisulfurisés, papier cristal (ils soot faitsavec des pätes de bois chimique pures ou mélangées ou despätes de fibres de coton, traitées - cest-à-dire fortementhydratées ou soumises à un raffinage poussé - pour que lepapier obtenu spit resistant a Inuile, à la graisse et a l'eau. Ilssont utilises principalement pour l'emballage des produitsalimentaires congelés, humides ou gras, tels que beurre,margarine, viande ou poisson); papiers et cartons ondulés(papiers et cartons utilises pour couvrir des boites et conteneurs
de papier ou de carton ondulé ou compact); papiers et cartonspour cannelures (peelers ou cartons utilises comme atne dansles assemblages de papier et carton transfonnés en cartonondulé); papier kraft pour grands sacs (papier fort, fait avec de lapate au sulfate et utilise dans la fabrication des sacsd'emballage et d'empaquetage à une ou plusieurs épaisseurs):autres papiers kraft d'emballage (tous les autres papiersdemballage et d'empaquetage faits pnhcipalement avec de lapate au sulfate); cartons pour boftes pliantes (cartons de toustypes servant a la fabrication de boîtes plientes); et autrescartons et papiers d'empaquetage et d'emballage. Les chiffressont exprimés en tonnes.
Autres papiers et cartons non décrits ailleursPapiers el cartons de construction, a des fins spéciales et autresusages non décrits ailleurs. Cette rubrique comprend: lespapiers kraft destines à étre paraffines, asphaltés,imperméabilises, lamines, imprégnés, files ou tordus, gommés,etc.; les papiers faits principalement avec des matièrespremières autres que la pate au sulfate el non décrits ailleurs(tels que les papiers de chanvre et de jute, le papier pourdossier, le papier buvard, le papier filtre, le papier supportphotographique, etc.); les papiers el cartons de construction(papiers, feutres et cartons utilises dans la constructiond'immeubles et autres stnictures comme isolant, jointsdetanchéité aux gaz, sous-couches de plafonds ou deplanchers, etc. (ils sont généralement faits avec des matièrescomplètement raffinées, telles que pate de bois, vieux papiers,autres pätes végétales et fibres minérales et leurs principalescaractéristiques sont la faible conductivite thermique, laresistance à l'humidité, au feu, à la vermine et aux insectes); lespapiers minces spéciaux (papiers destines à des usagesparticuliers, et tous relativement fins, ils sont faits parfois avecdes pates de bois mécaniques ou chirniques, blanchies ouécrues, souvent avec des pätes contenant du lin, du chanvre oude la fibre de coton. Leurs principales caractéristiques sont:uniformité de la surface et du calibre, absence de perforation,resistance, texture serree, opacité, faible permeabilité, puretéchimique. Font partie, notamment, de cette catégorre les papierssuivants: papier pelure pour carbone, papier pour condensateur,papier à cigarette, papier mousseline pour essuyage de !entitlesoptiques, papier pour patrons et papier pour sachets de thé); etcartons non décrits ailleurs (tels que les cartons pour l'industnede la chaussure, les cartons pour joints, les cartons pourtransfomiateurs, les cartons pour appréts textiles, les cartonspour classeurs, les cartons pour carrossene automobile, lescartons pour valises et malles, les cartons pour flans declichene). Sont exclus: les papiers, feutres et cartonsimprégnés, imprégnes à coeur, à plusieurs épaisseurs, outraités de toute autre manière, ainsi que les panneaux de fibresdurs, mi-durs el isolants. Les chiffres sont exprimés entonnes.
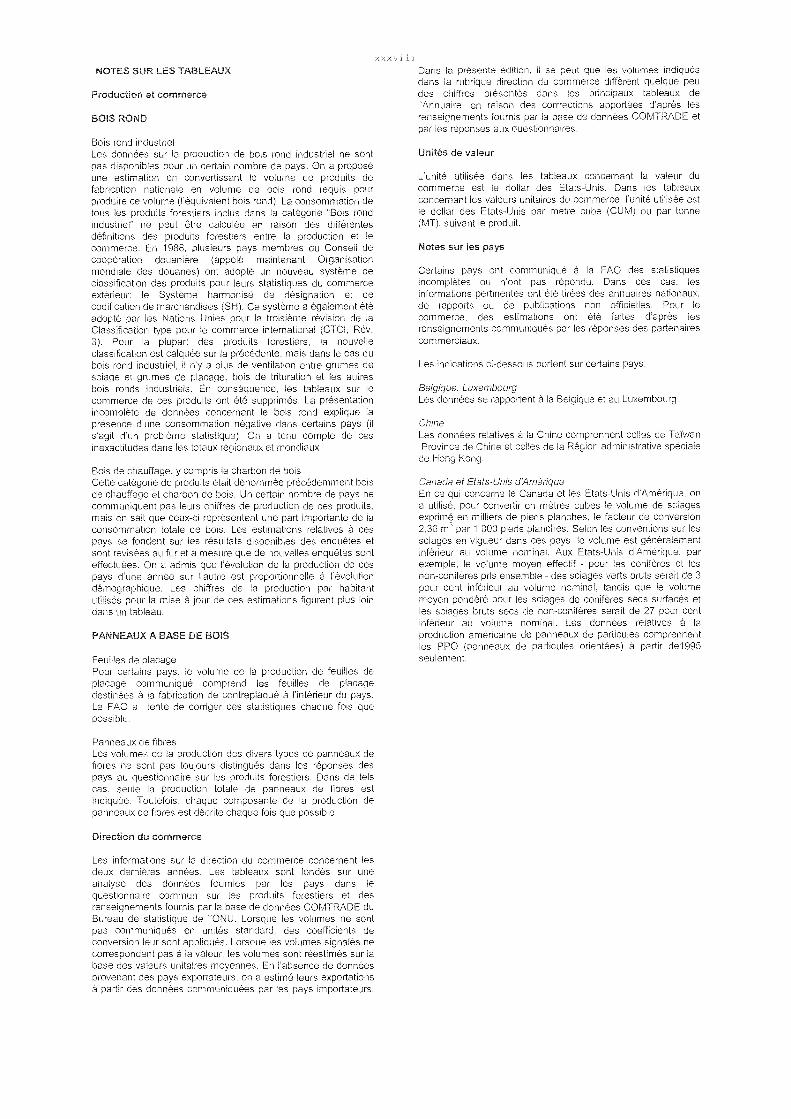
Bois de chauffage. y compris le charbon de boisCette catégorie de produits était dénommee précédemment boisde chauffage et charbon de bois. Un certain nombre de pays necommuniquent pas leurs chiffres de production de ces produits,mais on sait que ceux-ci représentent une part importante de laconsommation totale de bois. Les estimations relatives a cespays se fondent sur les résultats disponibles des enquetes etsont révisées au fur et a mesure que de nouvelles enquetes sonteffectuées. On a admis que revolution de la production de cespays d'une année sur l'autre est proportionnelle à revolutiondémographique. Les chiffres de la production par habitantutilises pour la mise ä jour de ces estimations figurent plus loindans un tableau.
PANNEAUX A BASE DE BOIS
Feuilles de placagePour certains pays, le volume de la production de feuilles deplacage communiqué comprend les feuilles de placagedestinées a la fabrication de contreplaqué à l'intérieur du pays.La FAO a tenté de corriger ces statistiques chaque fois quepossible.
Panneaux de fibresLes volumes de la production des divers types de panneaux defibres ne sont pas toujours distingues dans les réponses despays au questionnaire sur les produits forestiers. Dans de telscas. seule la production totale de panneaux de fibres estindiquée. Toutefois, chaque composante de la production depanneaux de fibres est décrite chaque fois que possible.
Direction du commerce
Les informations sur la direct on du commerce concernent lesdeux dernières années. Les tableaux sont fondés sur uneanalyse des données fournies par les pays dans lequestionnaire commun sur les produits forestiers et desrenseignements fournis par la base de données COMTRADE duBureau de stafistique de l'ONU. Lorsque les volumes ne sontpas communiqués en unites standard. des coefficients deconversion leur sont appliqués. Lorsque les volumes signalés necorrespondent pas a la valeur, les volumes sont réestimes sur labase des valeurs unitaires moyennes. En l'absence de donnéesprovenant des pays exportateurs. on a estimé leurs exportationsa partir des données communiquées par les pays importateurs.
Canada et Etats-Unis dAmériqueEn ce qui concerne le Canada et les Etats-Unis d'Amérique, ona utilise, pour convertir en metres cubes le volume de sciagesexprimé en milliers de pieds planches. le facteur de conversion2,36 m3 par 1 000 pieds planches. Selon les conventions sur lessciages en vigueur dans ces pays. le volume est généralementinférieur au volume nominal. Aux Etats-Unis d'Amérique, parexemple, le volume moyen effectif - pour les conifères et lesnon-coniféres pris ensemble - des sciages verts bruts serait de 3pour cent inférieur au volume nominal, tandis que le volumemoyen pondéré pour les sciages de conifères secs surfaces etles sciages bruts secs de non-conifères serait de 27 pour centinférieur au volume nominal. Les données relatives a la
production americaine de panneaux de particules comprennentles PPO (panneaux de particules orientées) a partir de1995seulement.
xxxviNOTES SUR LES TABLEAUX Dans la présente edition, il se peut que les volumes indiqués
dans la rubrique direction du commerce different quelque peuProduction et commerce des chiffres présentés dans les principaux tableaux de
l'Annuaire, en raison des corrrections apportées d'après lesBOIS ROND renseignements fournis par la base de données COMTRADE et
par les *crises aux questionnaires.Bois rond industrielLes données sur la production de bois rond industriel ne sont Unites de valeurpas disponibles pour un certain nombre de pays. On a proposeune estimation en convertissant le volume de produits de Lunité utilisée dans les tableaux concemant la valeur dufabrication nationale en volume de bois rond requis pour commerce est le dollar des Etats-Unis. Dans les tableauxproduire ce volume (réquivalent bois rond). La consommation de concernant les valeurs unitaires du commerce, [unite utilisée esttous les produits forestiers inclus dans la catégorie "Bois rond le dollar des Etats-Unis par metre cube (CUM) ou par tonneindustriel- ne peut etre calculée en raison des differentes (MT), suivant le produit.definitions des produits forestiers entre la production et lecommerce. En 1988, plusieurs pays membres du Conseil de Notes sur les payscooperation douanière (appelé maintenant Organisationmondiale des douanes) ont adopté un nouveau système de Certains pays ont communiqué a la FAO des statistiquesclassification des produits pour leurs statistiques du commerce incomplètes ou n'ont pas répondu. Dans ces cas, les
extérieur: le Systeme harmonise de designation et de informations pertinentes ont été tirées des annuaires nationaux,codification de marchandises (SH). Ce système a égalernent été de rapports ou de publications non officielles. Pour le
adopté par les Nations Unies pour la troisième revision de la commerce, des estimations ont été faites daprès les
Classification type pour le commerce international (CTCI, Rev. renseignements communiques par les réponses des parten es
3). Pour la plupart des produits forestiers, la nouvelle commerciaux.classification est calquée sur la précédente, mais dans le cas dubois rond industriel, il n'y a plus de ventilation entre grumes de Les indications ci-dessous portent sur certains pays:sciage et grumes de placage, bois de trituration et les autresbois ronds industriels. En consequence, les tableaux sur le Belgique, Luxembourgcommerce de ces produits ont été supprimés. La presentation Les données se rapportent a la Belgique et au Luxembourg.incomplete de données concernant le bois rond explique la
presence d'une consommation negative dans certains pays (il Chines'agit d'un problème statistique). On a tenu compte de ces Les données relatives a la Chine comprennent celles de TaTwaninexactitudes dans les totaux regionaux et mondiaux. Province de Chine et celles de la Region administrative spéciale
de Hong Kong.
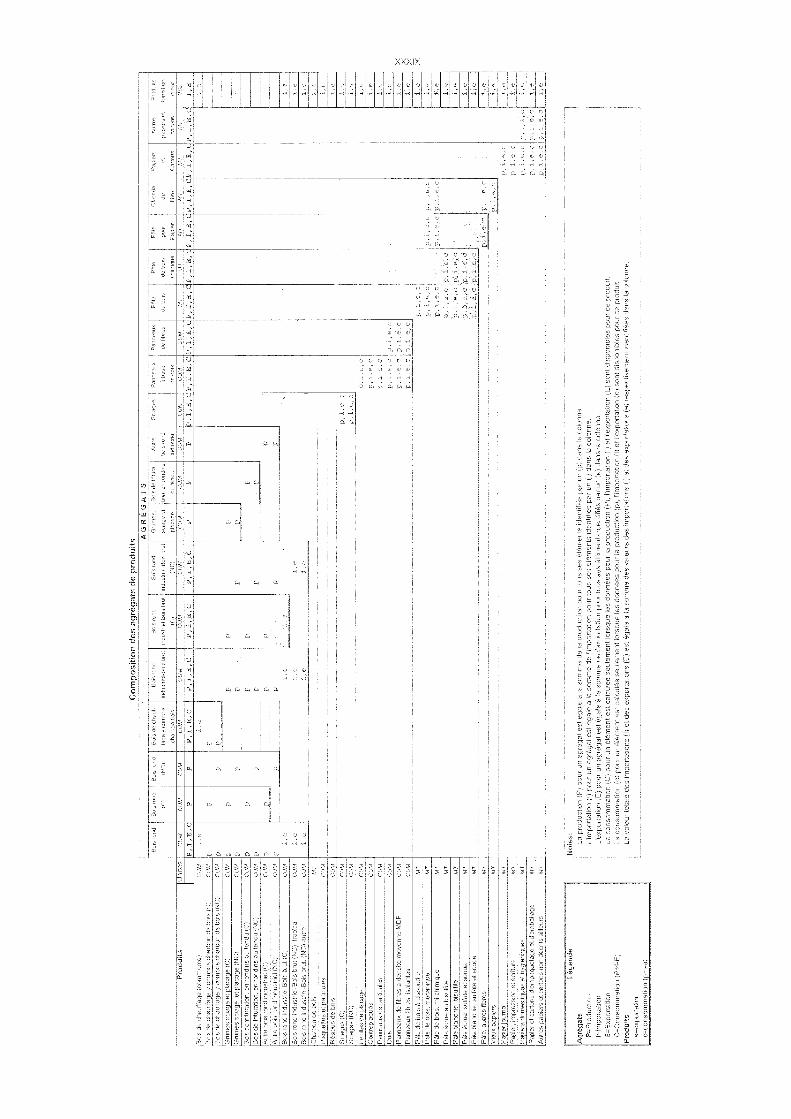
.
P,
rkbp
i,d
u,ya
gErx
etc
)
v.,
Pe
VS
rnal
rr
tr-
,
Ege
nd
CT
FIlt
esu
PE
P,I,
E,C
EC
PE
C P
E
Jr.3
donn
epo
w.1
ut
tflqt
ptrr
rke
erd
ly,
r -, If
.
EE
xpor
t y
des
expo
rtal
,r11
11
P, E
, C P
, x,
PP
,-E
ta,
Yy
Pt I
tE
rn u
)
l'f/
1,1,
3I
irIr
trttr 't
Pry
, rrir
rer
,/
F -
rrrI
n rt
kg/o
pals
PaP
rrte
-7T
od-d
its
Co-
Cor
rEm
atio
n (P
+I.E
)P
rodu
es=
r,
EP
EE
rry
rir
Not
esa
Ek
r a
E,
.n
yer
y.. e
at e
ao r
tasu
rnt
le r
trep
o
La,n
EE
onLa
val
eur
Pea
k de
s
iner
t.
E e
lem
5t
reL)
et d
3
..
Com
posi
tion
des
agré
gats
de
l.00d
uits
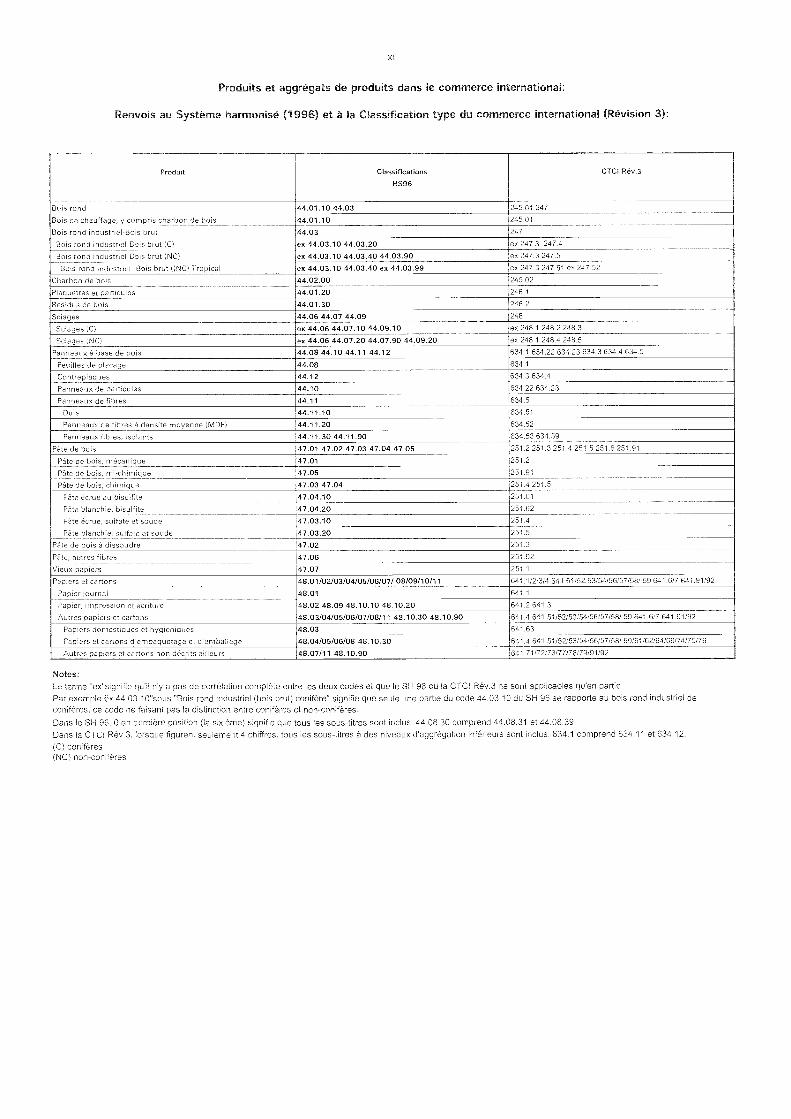
XL
Produits et aggrégats de produits dans le commerce international:
Renvois au Système harmonise (1996) et à la Classification type du commerce international (Revision 3):
Notes:Le terme "ex"signifie qu'il ny a pas de corrélation complete entre les deux codes et que le SH 96 ou la OTC! Rév.3 ne sont applicables qu'en partie.Par exemple ex 44.03.10"sous "Bois rond industriel (bois brut) conifére" signifie que seule une partie du code 44,03.10 du SH 96 se rapporte au boisrond industriel deconifères, ce code ne faisant pas la distinction entre conifères et non-conifères.
Dans le SH 96, 0 en dernière position (la sixième) signifie que tous les sous-titres sont inclus: 44.08.30 comprend 44.08.31 et 44.08.39.Dans la OTC! Rév.3. lorsque figurent settlement 4 chiffres, tous les sous-titres a des niveaux d'aggrégation inférieurs sont inclus: 634.1 comprend 634.11 et 634.12.(C) conifèresINC( non-coniféres
Produit Classifications
HS96
CTCI Rév.3
Bois rond 44.01.10 44.03 245.01 247
Bois de chauftacje,compos c arbon de bois 44.01.10 245.01
Beis rond nd IS el-Bois brut 44.03 247
Bob rond industriel-Bao brut (C) ex 44.03.10 44.03.20 ex 247,3 247.4
Bois rend industriel-Bois brot iNci ex 44.03.10 44.03.40 44.03.90 ex 247.3 247.5
Bois rond industriel 'Bots b t (taci TropcaI ex 44.03.10 44.03.40 ex 44.03.99 ex 247.3 247_51 ex 247.52
Charbon de bots 44.02.00 245.02
Plaguettes et particules 44.01.20 246.1
Résidus de bois 44.01.30 246.2
Sciages 44.06 44.07 44.09 248
Sciages 1C) ex 44.06 44 07 0 44 09 10 ex 248 1 248.2 248.3
Sciages 1 C ex 44.06 44 07 20 44.07 90 44.09 20 ex 248.1 248.4 248.5
Panneaux a base de boo 44.08 44.10 44.11 44.12 634.1 634.22 634.23 634.3 634.4 634.5
Fe es de placage 44.08 634.1
Contreplagues 44.12 634.3 634.4
P nne ux de particules 44.10 1634.22 634.23
Panneaux de fibres 44.11 634.5
Durs 44.11.10 634.51
Panneaux de fibres e densi e eroyenne DF 44.11.20 634.52
Panneaux fibres, ,sotaots 44.11.30 44.11.90 634.53 634.59
P te de bois 47.01 47.02 47.03 47.04 47.05 251 2251 3 251.4 251 .5 25 6 25 91
Pate de bou, enécueique 47.01 251.2
Pâte de lao s, 1 igue 47.05 251.01
Pete de bois, chrnriqse 47.03 47.04 251.4 251.5
Pate écrue au bisultite 47.04.10 251.61
Pâte blanchie,bisult,te 47.04.20 251.62
Pe e ecrue, sulfate el soude 47 03. 0 251 4
Pete blanchie, sulfate et soude 47 0 .20 251 5
Pâte de bo s a dissoudre 47.02 251.3
Pâte, autres fibres 47.06 251 92
Vieux papiers 47.07 251 1
Papiers et cartons 48.01/02/03/04/0 06/07/ 08/09/ 0 64 1/2/3/4 641.51/52153/54/56/57/581 9 64 6/7 64 91/92
Papier Journal 48.01 641.1
Papier, inrprensrerr et écriture 48.02 48.09 48.10.10 48.10.20 641.2841
Autres papiers et cartons 48.03/04/05/06f07/08/11 48.10.30 48.10.90 641.4 64 5 2/5 /54/56 7 58 9 64 6/7 641 9 92
P pie s domestqseu et frygìéniqses 48.03 641.63
Papiers et cartons tile p g ge et d e bal 48.04/05/06/08 48.10,30 64154 641.51/52/53/54/56/57/58/ 59/61/62/64169/74/75/76
Autres papiers el cartons non decrits ailleurs 48.07/11 48.10.90 641.71/72/73/77/78/79/91/92
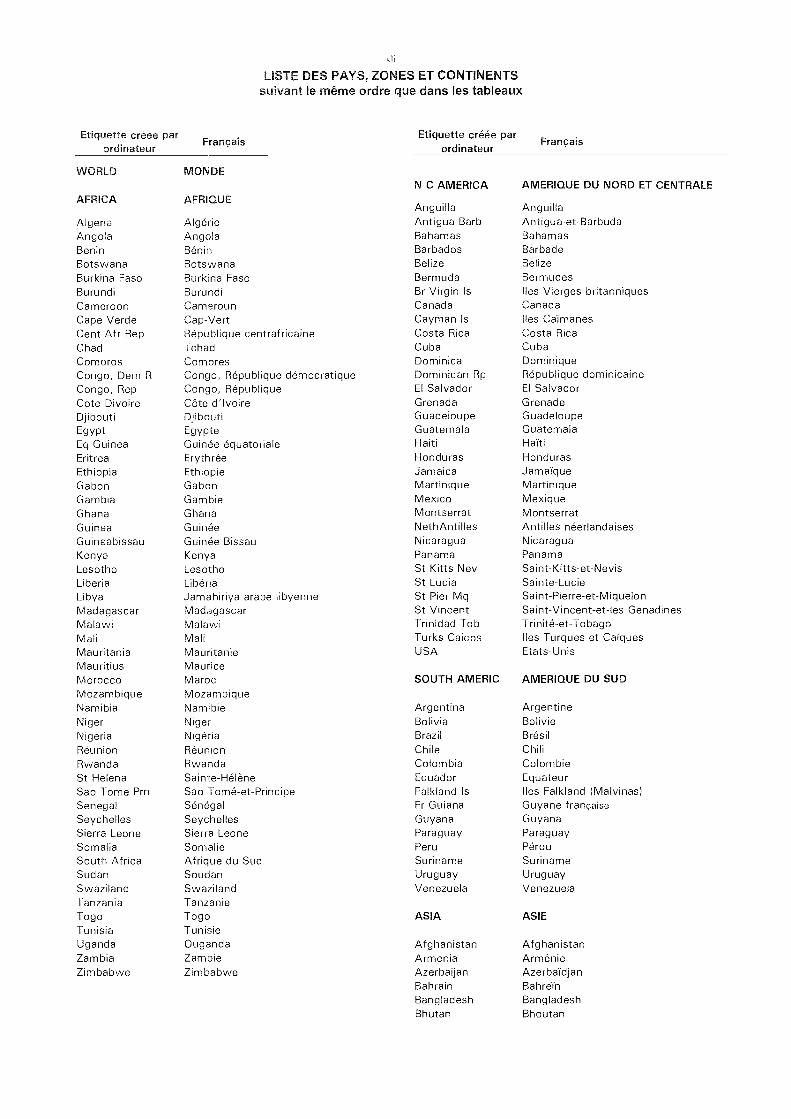
\iiLISTE DES PAYS, ZONES ET CONTINENTS
suivant le merle ordre que dans les tableaux
Etiquette créée parordinateur
FrançaisEtiquette créée par
ordinateurFrançais
WORLD MONDEN C AMERICA AMERIQUE DU NORD ET CENTRALE
AFRICA AFRIQUEAnguilla Anguilla
Algeria Algérie Antigua Barb Antigua-et-BarbudaAngola Angola Bahamas BahamasBenin Benin Barbados BarbadaBotswana Botswana Be liza Belize
Burkina Faso Burkina Faso Bermuda BermudesBurundi Burundi Br Virgin Is Iles Vierges britanniquesCameroon Cameroun Canada CanadaCape Verde Cap-Vert Cayman Is Iles CaTmanes
Cent Afr Rep Republique centrafricaine Costa Rica Costa RicaChad Tchad Cuba CubaComoros Comores Dominica DominiqueCongo, Dem R Congo, Republique démocratique Dominican Rp Republique dominicaineCongo, Rep Congo, Republique El Salvador El SalvadorCote Divoire Côte d'Ivoire Grenada GrenadeDjibouti Djibouti Guadeloupe GuadeloupeEgypt Egypte Guatemala GuatemalaEq Guinea Guinea équatoriale Haiti HaitiEritrea Erythrée Honduras HondurasEthiopia Ethiopie Jamaica JamatqueGabon Gabon Martinique MartiniqueGambia Gambie Mexico MexiqueGhana Ghana Montserrat MontserratGuinea Guinea NethAntilles Antilles néerlanda sesGuineabissau Guinée-B ssau Nicaragua NicaraguaKenya Kenya Panama PanamaLesotho Lesotho St Kitts Nev Saint-Kitts-et-Nev sLiberia Liberia St Lucia Sainte-LucieLibya Jamahiriya arabe I byenne St Pier Mq Saint-Pierre-et-MiquelonMadagascar Madagascar St Vincent Saint-Vincent-et-les GenadinesMalawi Malawi Trinidad Tob Trinité-et-TobagoMali Mali Turks Caicos Iles Turques et CatquesMauritania Mauritania USA Etats-UnisMauritius MauriceMorocco Maroc SOUTH AMERIC AMERIQUE DU SUDMozambique MozambiqueNamibia Namibie Argentina ArgentineNiger Niger Bolivia BolivieNigeria Nigeria Brazil BrésilReunion Reunion Chile ChiliRwanda Rwanda Colombia ColombieSt Helena Sainte-Hélène Ecuador EquateurSao Tome Pm n Sao Tomé-et-Princïpe Falkland Is Iles Falkland (Malvinas)Senegal Senegal Fr Guiana Guyana frangaiseSeychelles Seychelles Guyana GuyanaSierra Leone Sierra Leone Paraguay ParaguaySomalia Somalia Peru PérouSouth Africa Afrique du Sud Suriname SurinameSudan Soudan Uruguay UruguaySwaziland Swaziland Venezuela VenezuelaTanzania TanzaniaTogo Togo ASIA ASIETunisia TunisieUganda Ouganda Afghanistan AfghanistanZambia Zambie Armenia ArmeniaZimbabwe Zimbabwe Azerbaijan Azerbatdjan
Bahrain Bah re'in
Bangladesh BangladeshBhutan Bhoutan
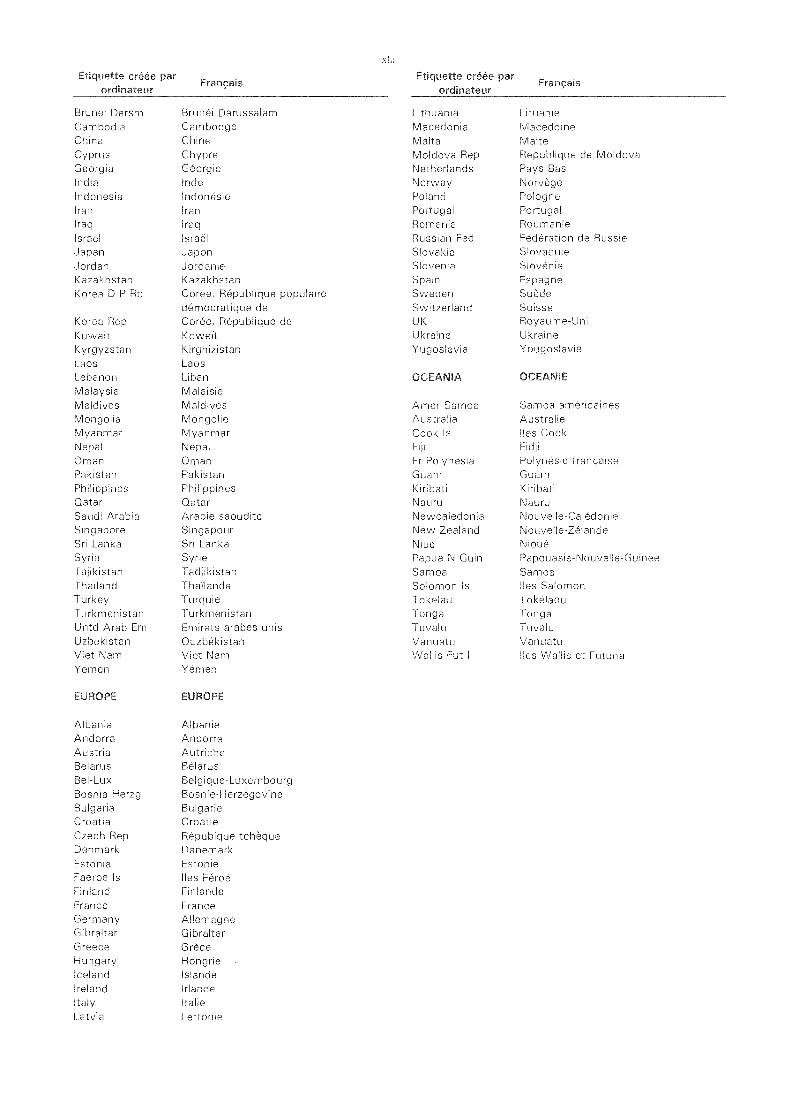
Etiquette créée parordinateur
FrançaisEtiquette c
ordinate,Français
Brunei Darsm Brunei Darussalam Lithuania LituanieCambodia Cambodge Macedon i a MacedoineChina Chine Malta MalteCyprus Chypre Moldova Rep Republique de MoldovaGeorgia Georgie Netherlands Pays-BasIndia Inde Norway NorvègeIndonesia Indonésie Poland PologneIran Iran Portugal PortugalIraq Iraq Romania RoumanieIsrael Israel Russian Fed Federation de RussieJapan Japon Slovakia SlovaquieJordan Jordanie Slovenia SlovénieKazakhstan Kazakhstan Spain EspagneKorea D P Rp Corée, Republique populaire Sweden Suede
démocratique de Switzerland SuisseKorea Rep Corée, Republique de UK Royaume-UniKuwait KoweTt Ukraine UkraineKyrgyzstan Kirghizistan Yugoslavia YougoslavieLaos LaosLebanon Liban OCEANIA OCEANIEMalaysia MalaisieMaldives Maldives Amer Samoa Samoa amérIcainesMongolia Mongolia Australia AustralieMyanmar Myanmar Cook Is Iles CookNepal Nepal Fiji Fidji
Ornan Oman Fr Polynesia Polynésie franeaisePakistan Pakistan Guam GuamPhilippines Philippines Kiribati KiribatiQatar Qatar Nauru NauruSaudi Arabia Arabie saoudite Newcaledonia Nouvelle-CalédonieSingapore Singapour New Zealand Notivelle-ZélandeSri Lanka Sri Lanka Niue NiouéSyria Syrie Papua N Guin Papouasie-Nouvelle-GuinéeTajikistan Tadjikistan Samoa SamoaThailand ThaTlande Solomon Is Iles SalomonTurkey Turquie Tokelau TokélaouTurkmenistan Turkmenistan Tonga TongaUnté Arab Em Ernirats arabes unis Tuvalu TuvaluUzbekistan Ouzbékistan Vanuatu VanuatuViet Nam Viet Nam Wallis Fut I Iles Wallis et FutunaYemen Yemen
EUROPE EUROPE
Albania AlbanieAndorra AndorreAustria AutricheBelams BélarusBel-Lux Belgique-LuxembourgBosnia Herzg Bosnie-HerzégovineBulgaria BulgarieCroatia CroatieCzech Rep Répubique tchèqueDenmark DanemarkEstonia FstonieFaeroe Is Iles FéroéFinland EiniandeFrance FranceGermany AllemagneGibraltar GibraltarGreece GrèceHungary HongrieIceland IslandeIreland MandeItaly ItalieLatvia Letto e
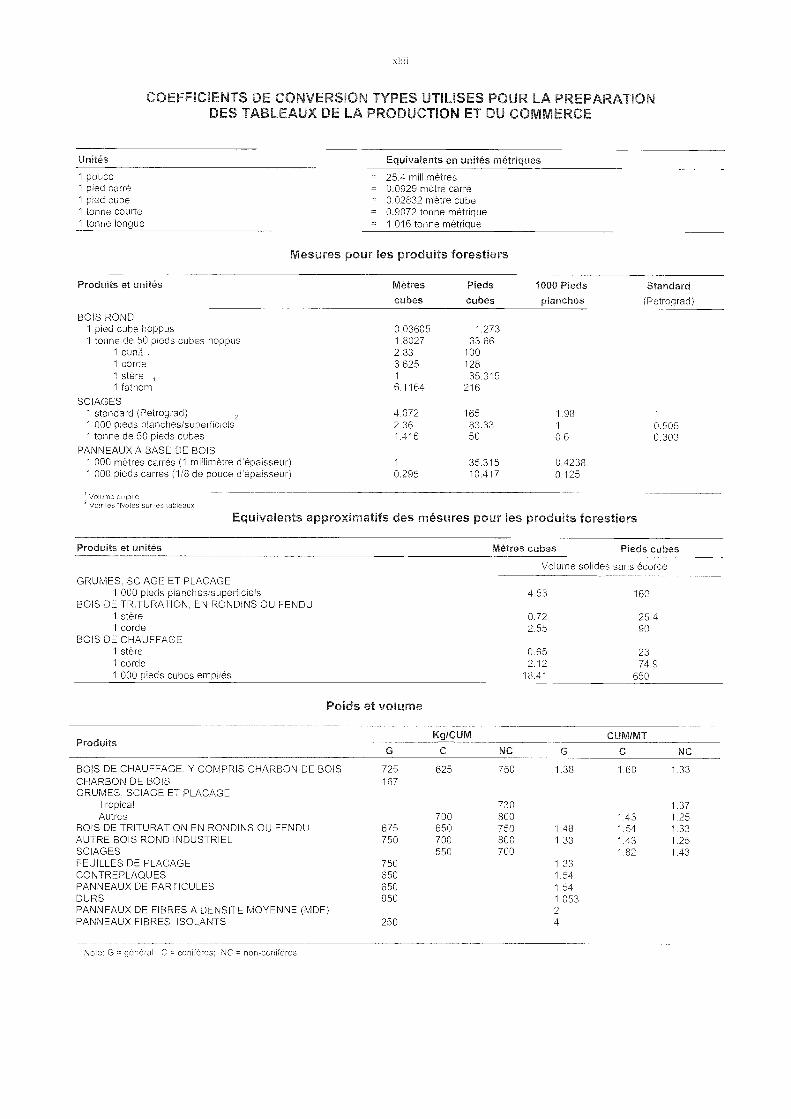
Unites Equivalents en unites métriques
Volume empileVoir les "Notes sur ,es tableaux
Equivalents approximatifs des mésures pour les produits forestiers
COEFFICIENTS DE CONVERSION TYPES UTILISES POUR LA PREPARATIONDES TA.. LEAUX DE LA PRODUCTION ET DU COMMERCE
Note: G genéral; C = conifères: NC = non-conifères
Mesures pour les produits forestiers
Poids et volume
Volume solides sans ecorce
GRUMES, SCIAGE ET PLACAGE1 000 pieds planches/superficiels 4.53 160
BOIS DE TRITURATION, EN RONDINS OU FENDU1 stère 0.72 25.41 corde 2.55 90
BOIS DE CHAUFFAGE1 stère 0.65 231 corde 2.12 74.91 000 pieds cubes empilés 18.41 650
Kg/CUM CUM/MTProduits
NC G C NC
BOIS DE CHAUFFAGE. Y COMPRIS CHARBON DE BOIS 725 625 750 1.38 1.60 1.33CHARBON DE BOIS 167GRUMES, SCIAGE ET PLACAGE
Tropical 730 1.37Autres 700 800 1.43 1.25
BOIS DE TRITURATION EN RONDINS OU FENDU 675 650 750 1.48 1.54 1.33AUTRE BOIS ROND INDUSTRIEL 750 700 800 1.33 1.43 1.25SCIAGES 550 700 1.82 1.43FEUILLES DE PLACAGE 750 1.33CONTREPLAQUES 650 1.54PANNEAUX DE PARTICULES 650 1.54DURS 950 1.053PANNEAUX DE FIBRES A DENSITE MOYENNE (MDF) 2PANNEAUX FIBRES, ISOLANTS 250 4
Produits et unites Metres
cubesPieds
cubes
1000 Pieds
planchesStandard
(Petrograd)
BOIS ROND1 pied cube hoppus1 tonne de 50 pieds cubes hoppus
0.036051.8027
1.27363.66
1 cunit 1 2.83 1001 corde 3.625 1281 stère i 1 35.3151 fathom 6.1164 216
SCIAGES1 standard (Petrograd) 4.672 165 1.98 1
1 000 pieds planches/superficiels 2.36 83.33 1 0.5051 tonne de 50 pieds cubes 1.416 50 0.6 0.303
PANNEAUX A BASE DE BOIS1 000 metres carrés (1 millimetre d'epaisseur) 1 35.315 0.42381 000 pieds carries (1/8 de pouce diépaisseur) 0.295 10.417 0.125
Produits et unites Metres cubes Pieds cubes
1 pouce = 25.4 millimetres1 pied carré = 0.0929 metre carre1 pied cube = 0.02832 metre cube1 tonne courte = 0.9072 tonne métrigue1 tonne longue = 1.016 tonne métrigue

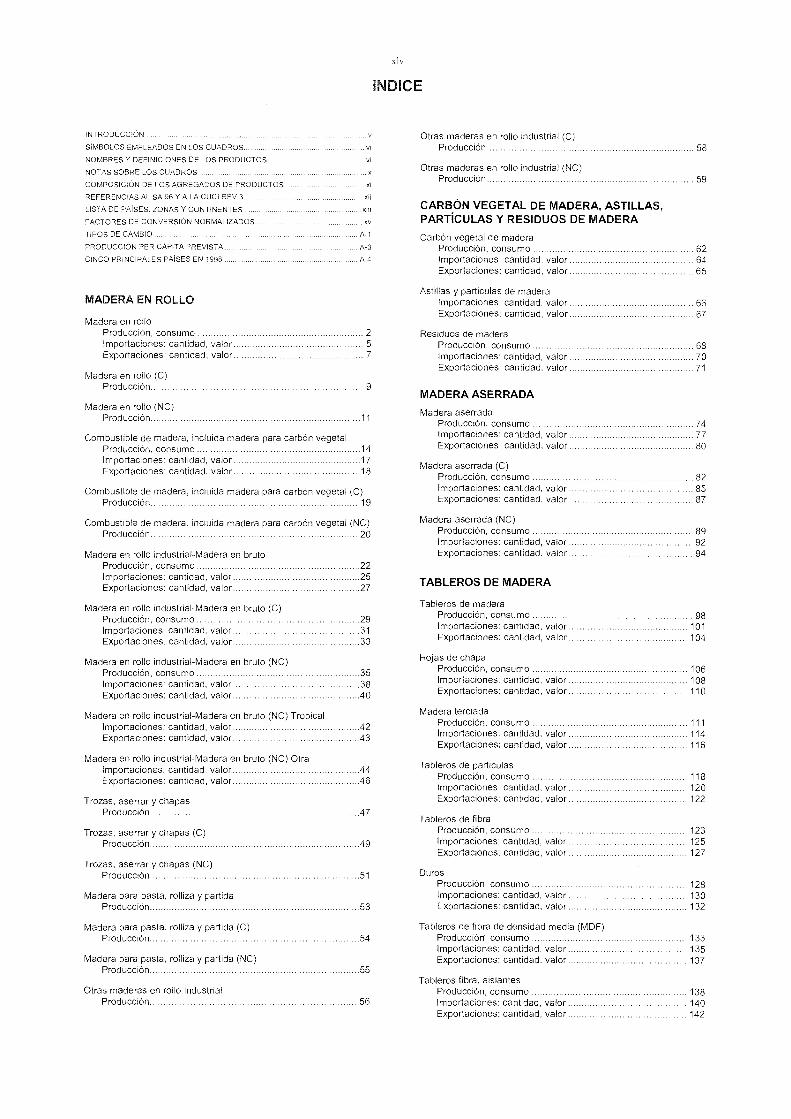
INTRODUCCIÓN
SÍMBOLOS EMPLEADOS EN LOS CUADROS
NOMBRES Y DEFINICIONES DE LOS PRODUCTOS
NOTAS SOBRE LOS CUADROS
COMPOSICIÓN DE LOS AGREGADOS DE PRODUCTOS x/
REFERENCIAS AL SABE Y A LA CUCI REV.3
LISTA DE PAÍSES. ZONAS Y CONTINENTES xiii
FACTORES DE CONVERSIÓN NORMALIZADOS xv
TIPOS DE CAMBIO A-1
PRODUCCIÓN PER CAPITA PREVISTA A-3
CINCO PRINCIPALES PAISES EN 1998 A-4
MADERA EN ROLLO
Madera en rolloProducción, consumo 2Importaciones: cantidad, valor 5
Exportaciones: cantidad, valor 7
Madera en rollo (C)Producción 9
Madera en rollo (NC)Producción 11
Combustible de madera, incluida madera para carbón vegetalProducción, consumo 14
Importaciones: cantidad, valor 17Exportaciones: cantidad, valor 18
Combustible de madera, incluida madera para carbón vegetal (C)Producción 19
Combustible de madera, incluida madera para carbón vegetal (NC)Producción 20
Madera en rollo industrial-Madera en brutoProducción, consumo 22Importaciones: cantidad, valor 25Exportaciones: cantidad, valor 27
Madera en rollo industrial-Madera en bruto (C)Producción, consumo 29Importaciones: cantidad, valor 31
Exportaciones: cantidad, valor 33
Madera en rollo industrial-Madera en bruto (NC)Producción, consumo 35Importaciones: cantidad, valor 38Exportaciones: cantidad, valor 40
Madera en rollo industrial-Madera en bruto (NC) TropicalImportaciones: cantidad, valor 42Exportaciones: cantidad, valor 43
Madera en rollo industrial-Madera en bruto (NC) OtraImportaciones: cantidad, valor 44Exportaciones: cantidad, valor 46
Trozas, aserrar y chapasProducción 47
Trozas, aserrar y chapas (C)Producción 49
Trozas, aserrar y chapas (NC)Producción 51
Madera para pasta, rolliza y partidaProducción 53
Madera para pasta, rolliza y partida (C)Producción 54
Madera para pasta, rolliza y partida (NC)Producción 55
Otras maderas en rollo industrialProducción 56
xlv
INDICE
Otras maderas en rollo industrial (C)Producción 58
Otras maderas en rollo industrial (NC)Producción 59
CARBÓN VEGETAL DE MADERA, ASTILLAS,PARTÍCULAS Y RESIDUOS DE MADERA
Carbón vegetal de maderaProducción, consumo 62Importaciones: cantidad, valor 64Exportaciones: cantidad, valor 65
Astillas y particulas de maderaImportaciones: cantidad, valor 66Exportaciones: cantidad, valor 67
Residuos de maderaProducción, consumo 68Importaciones: cantidad, valor 70Exportaciones: cantidad, valor 71
MADERA ASERRADA
Madera aserradaProducción, consumo 74Importaciones: cantidad, valor 77Exportaciones: cantidad, valor 80
Madera aserrada (C)Producción, consumo 82Importaciones: cantidad, valor 85Exportaciones: cantidad, valor 87
Madera aserrada (NC)Producción, consumo 89Importaciones: cantidad, valor 92Exportaciones: cantidad. valor 94
TABLEROS DE MADERA
Tableros de maderaProducción, consumo 98Importaciones: cantidad, valor 101Exportaciones: cantidad, valor 104
Hojas de chapaProducción, consumo 106Importaciones: cantidad, valor 108Exportaciones: cantidad, valor 110
Madera terciadaProducción, consumo 111Importaciones: cantidad, valor 114Exportaciones: cantidad, valor 116
Tableros de particulasProducción, consumo 118Importaciones: cantidad. valor 120Exportaciones: cantidad, valor 122
Tableros de fibraProducción. consumo 123Importaciones: cantidad, valor 125Exportaciones: cantidad, valor 127
DurosProducción, consumo 128Importaciones: cantidad, valor 130Exportaciones: cantidad, valor 132
Tableros de fibra de densidad media (M DF)Producción, consumo 133Importaciones: cantidad. valor 135Exportaciones: cantidad, valor 137
Tableros fibra, aislantesProducción, consumo 138Importaciones: cantidad, valor 140Exportaciones: cantidad, valor 142
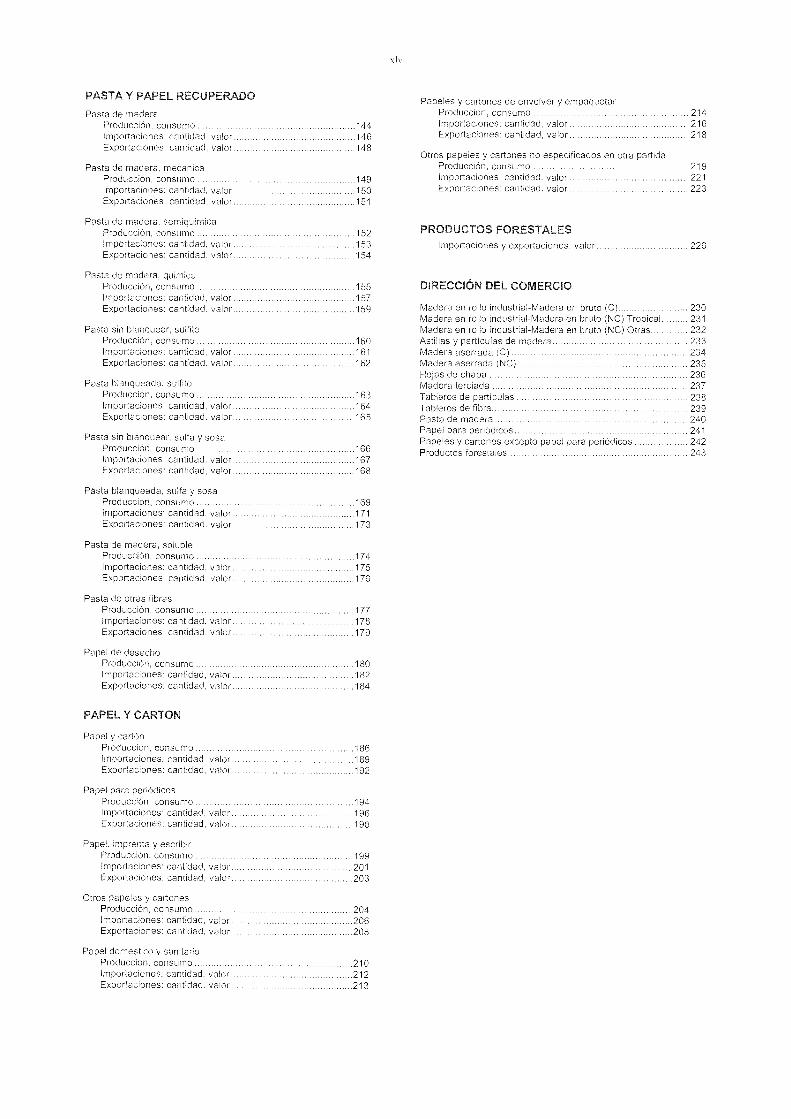
PASTA Y PAPEL RECUPERADO
Pasta de maderaProducción. consumo 144Importaciones: cantidad. valor 146Exportaciones: cantidad, valor 148
Pasta de madera, mecanicaProducción, consumo 149Importaciones: cantidad, valor 150Exportaciones: cantidad, valor 151
Pasta de madera, semiquimicaProducción, consumo 152Importaciones: cantidad. valor 153Exportaciones: cantidad. valor 154
Pasta de madera, quimicaProducción, consumo 155Importaciones: cantidad, valor 157Exportaciones: cantidad. valor 159
Pasta sin blanquear. sulfitoProducción, consumo 160Importaciones: cantidad. valor 161Exportaciones: cantidad. valor 162
Pasta blanqueada, sulfitoProducción, consumo 163Importaciones: cantidad. valor 164Exportaciones: cantidad, valor 165
Pasta sin blanquear, sulfa y sosaProducción, consumo 166Importaciones: cantidad. valor 167Exportaciones: cantidad, valor 168
Pasta blanqueada, sulfa y sosaProducción, consumo 169Importaciones: cantidad. valor 171Exportaciones: cantidad. valor 173
Pasta de madera, solubleProducción, consumo 174Importaciones: cantidad, valor 175Exportaciones: cantidad, valor 176
Pasta de otras fibrasProducción, consumo 177Importaciones: cantidad. valor 178Exportaciones: cantidad. valor 179
Papel de desechoProducción, consumo 180Importaciones: cantidad, valor 182Exportaciones: cantidad, valor 184
PAPEL Y CARTON
Papel y cartónProducción, consumo 186Importaciones: cantidad, valor 189Exportaciones: cantidad. valor 192
Papel para periódicosProducción, consumo 194Importaciones: cantidad, valor 196Exportaciones: cantidad, valor 198
Papel, imprenta y escribirProducción. consumo 199Importaciones: cantidad. valor 201Exportaciones: cantidad, valor 203
Otros papeles y cartonesProducción, consumo 204Importaciones: cantidad, valor 206Exportaciones: cantidad, valor 208
Papel domestico y sanitarioProducción, consumo 210Importaciones: cantidad. valor 212Exportaciones: cantidad. valor 213
Papeles y cartones de envolver y empaquetarProducción, consumo 214Importaciones: cantidad, valor 216Exportaciones: cantidad. valor 218
Otros papeles y cartones no especificados en otra partidaProducción. consumo 219Importaciones: cantidad. valor 221Exportaciones: cantidad. valor 223
PRODUCTOS FORESTALESImportaciones y exportaciones: valor 226
DIRECCIÓN DEL COMERCIO
Madera en rollo industrial-Madera en bruto (C) 230Madera en rollo industrial-Madera en bruto (NC) Tropical 231Madera en rollo industrial-Madera en bruto (NC) Otras 232Astillas y partículas de madera 233Madera aserrada (C) 234Madera aserrada (NC) 235Hojas de chapa 236Madera terciada 237Tableros de partículas 238Tableros de fibra 239Pasta de madera 240Papel para periódicos 241Papeles y cartones excepto papel para periódicos 242Productos forestales 243
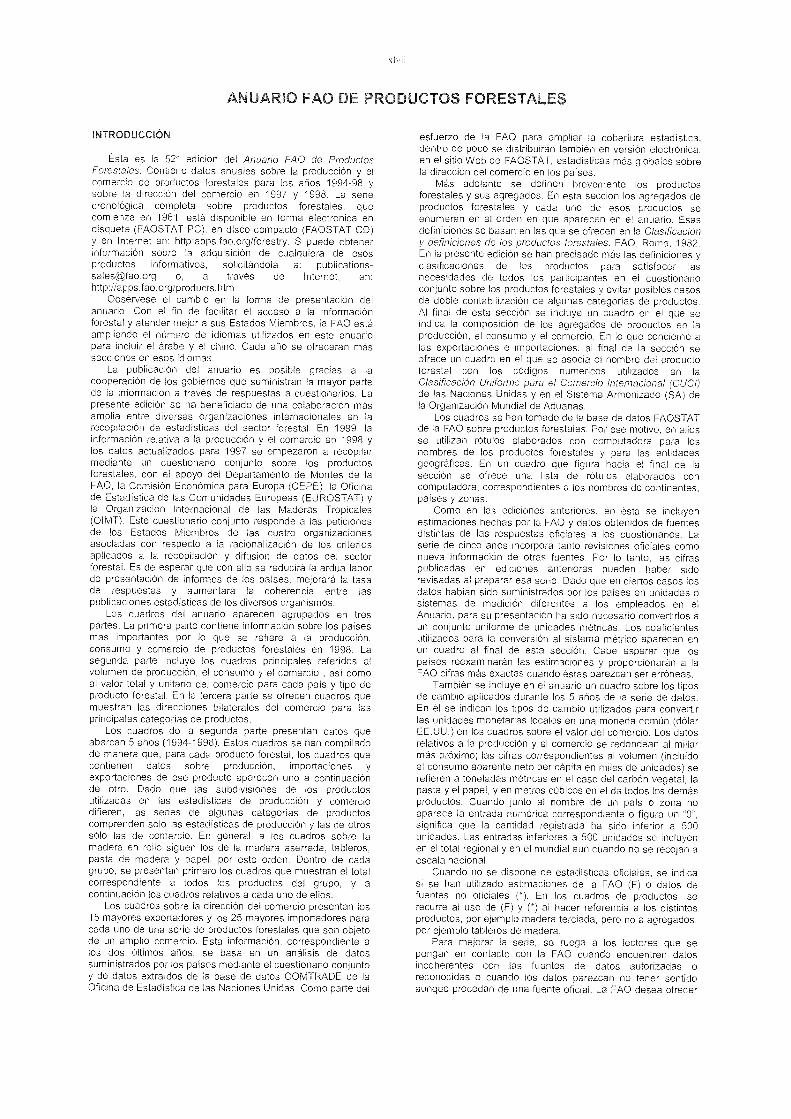
ANL1AMO FAO
INTRODUCCIÓN
Ésta es la 52a edición del Anuario FAO de ProductosForestales. Contiene datos anuales sobre la producción y elcomercio de productos forestales para los años 1994-98 ysobre la dirección del comercio en 1997 y 1998. La seriecronológica completa sobre productos forestales. quecomienza en 1961, está disponible en forma electrónica endisquete (FAOSTAT PC), en disco compacto (FAOSTAT CD)y en Internet en: http:apps.fao.org/forestry. S puede obtenerinformación sobre la adquisición de cualquiera de esosproductos informativos, solicitándola a: [email protected] o. a través de Internet, en:http://apps.fao.org/products. htm
Obsérvese el cambio en la forma de presentación delanuario. Con el fin de facilitar el acceso a la informaciónforestal y atender mejor a sus Estados Miembros, la FAO estáampliando el número de idiomas utilizados en este anuariopara incluir el árabe y el chino. Cada ano se ofrecerán mássecciones en esos idiomas.
La publicación del anuario es posible gracias a lacooperación de los gobiernos que suministran la mayor partede la información a través de respuestas a cuestionarios. Lapresente edición se ha beneficiado de una colaboración másamplia entre diversas organizaciones internacionales en larecopilación de estadísticas del sector forestal. En 1999, lainformación relativa a la producción y el comercio en 1998 ylos datos actualizados para 1997 se empezaron a recopilarmediante un cuestionario conjunto sobre los productosforestales. con el apoyo del Departamento de Montes de laFAO, la Comisión Económica para Europa (CEPE), la Oficinade Estadística de las Comunidades Europeas (EUROSTAT) yla Organización Internacional de las Maderas Tropicales(OIMT). Este cuestionario conjunto responde a las peticionesde los Estados Miembros de las cuatro organizacionesasociadas con respecto a la racionalización de los criteriosaplicados a la recopilación y difusión de datos del sectorforestal. Es de esperar que con ello se reducirá la ardua laborde presentación de informes de los países, mejorará la tasade respuestas y aumentará la coherencia entre laspublicaciones estadísticas de los diversos organismos.
Los cuadros del anuario aparecen agrupados en trespartes. La primera parte contiene información sobre los paísesmás importantes por lo que se refiere a la producción.consumo y comercio de productos forestales en 1998. Lasegunda parte incluye los cuadros principales referidos alvolumen de producción, el consumo y el comercio asi comoal valor total y unitario del comercio para cada país y tipo deproducto forestal. En la tercera parte se ofrecen cuadros quemuestran las direcciones bilaterales del comercio para lasprincipales categorías de productos.
Los cuadros de la segunda parte presentan datos queabarcan 5 años (1994-1998). Estos cuadros se han compiladode manera que, para cada producto forestal, los cuadros quecontienen datos sobre producción, importaciones yexportaciones de ese producto aparecen uno a continuaciónde otro. Dado que las subdivisiones de los productosutilizadas en las estadísticas de producción y comerciodifieren, las series de algunas categorías de productoscomprenden sólo las estadísticas de producción y las de otrossólo las de comercio. En general, a los cuadros sobre lamadera en rollo siguen los de la madera aserrada, tableros,pasta de madera y papel, por este orden. Dentro de cadagrupo, se presentan primero los cuadros que muestran el totalcorrespondiente a todos los productos del grupo, y a
continuación los cuadros relativos a cada uno de ellos.Los cuadros sobre la dirección del comercio presentan los
15 mayores exportadores y los 25 mayores importadores paracada uno de una serie de productos forestales que son objetode un amplio comercio. Esta información, correspondiente alos dos últimos anos, se basa en un análisis de datossuministrados por los países mediante el cuestionario conjuntoy de datos extraídos de la base de datos COMTRADE de laOficina de Estadística de las Naciones Unidas. Como parte del
CTOS F0f,ZES- ALES
esfuerzo de la FAO para ampliar la cobertura estadística,dentro de poco se distribuirán también en versión electrónica.en el sitio Web de FAOSTAT. estadisticas más globales sobrela dirección del comercio en los países.
Más adelante se definen brevemente los productosforestales y sus agregados. En esta sección los agregados deproductos forestales y cada uno de esos productos seenumeran en el orden en que aparecen en el anuario. Esasdefiniciones se basan en las que se ofrecen en la Clasificacióny definiciones de los productos forestales. FAO. Roma, 1982.En la presente edición se han precisado más las definiciones yclasificaciones de los productos para satisfacer lasnecesidades de todos los participantes en el cuestionarioconjunto sobre los productos forestales y evitar posibles casosde doble contabilización de algunas categorías de productos.Al final de esta sección se incluye un cuadro en el que seindica la composición de los agregados de productos en laproducción, el consumo y el comercio. En lo que concierne alas exportaciones e importaciones, al final de la sección seofrece un cuadro en el que se asocia el nombre del productoforestal con los códigos numéricos utilizados en laClasificación Uniforme para el Comercio Internacional (CUCI)de las Naciones Unidas y en el Sistema Armonizado (SA) dela Organización Mundial de Aduanas.
Los cuadros se han tomado de la base de datos FAOSTATde la FAO sobre productos forestales. Por ese motivo, en ellosse utilizan rótulos elaborados con computadora para losnombres de los productos forestales y para las entidadesgeográficas. En un cuadro que figura hacia el final de lasección se ofrece una lista de rótulos elaborados concomputadora, correspondientes a los nombres de continentes,países y zonas.
Como en las ediciones anteriores, en ésta se incluyenestimaciones hechas por la FAO y datos obtenidos de fuentesdistintas de las respuestas oficiales a los cuestionarios. Laserie de cinco anos incorpora tanto revisiones oficiales comonueva información de otras fuentes. Por lo tanto. las cifraspublicadas en ediciones anteriores pueden haber sidorevisadas al preparar esa serie. Dado que en ciertos casos losdatos habían sido suministrados por los países en unidades osistemas de medición diferentes a los empleados en elAnuario, para su presentación ha sido necesario convertirlos aun conjunto uniforme de unidades métricas. Los coeficientesutilizados para la conversión al sistema métrico aparecen enun cuadro al final de esta sección. Cabe esperar que lospaíses reexaminarán las estimaciones y proporcionarán a laFAO cifras más exactas cuando éstas parezcan ser erróneas.
También se incluye en el anuario un cuadro sobre los tiposde cambio aplicados durante los 5 anos de la serie de datos.En él se indican los tipos de cambio utilizados para convertirlas unidades monetarias locales en una moneda común (dólarEE.UU.) en los cuadros sobre el valor del comercio. Los datosrelativos a la producción y el comercio se redondean al millarmás próximo; las cifras correspondientes al volumen (incluidoel consumo aparente neto per capita en miles de unidades) serefieren a toneladas métricas en el caso del carbón vegetal, lapasta y el papel, y en metros cúbicos en el de todos los demásproductos. Cuando junto al nombre de un país o zona noaparece la entrada numérica correspondiente o figura un "0",significa que la cantidad registrada ha sido inferior a 500unidades. Las entradas inferiores a 500 unidades se incluyenen el total regional y en el mundial aun cuando no se recojan aescala nacional.
Cuando no se dispone de estadísticas oficiales, se indicasi se han utilizado estimaciones de la FAO (F) o datos defuentes no oficiales ('). En los cuadros de productos, serecurre al uso de (F) y (*) al hacer referencia a los distintosproductos, por ejemplo madera terciada, pero no a agregados,por ejemplo tableros de madera.
Para mejorar la serie, se ruega a los lectores que sepongan en contacto con la FAO cuando encuentren datosincoherentes con las fuentes de datos autorizadas o
reconocidas o cuando los datos parezcan no tener sentidoaunque procedan de una fuente oficial. La FAO desea ofrecer
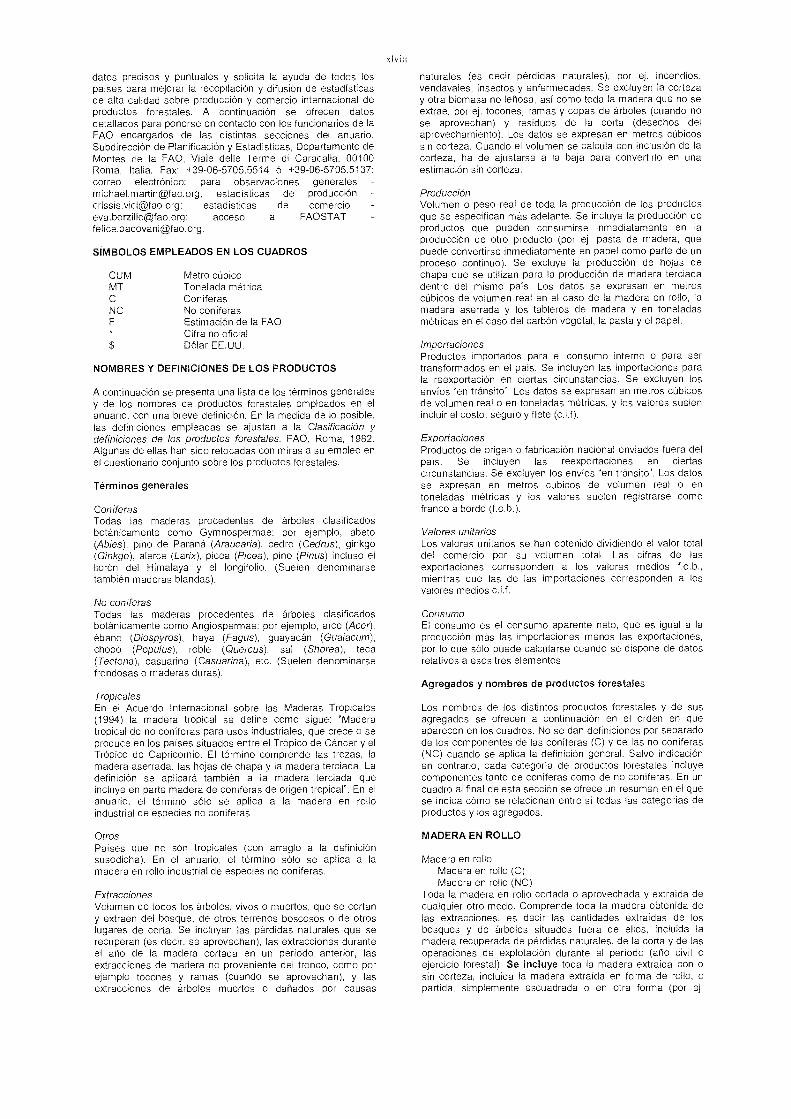
datos precisos y puntuales y solicita la ayuda de todos lospaíses para mejorar la recopilación y difusión de estadísticasde alta calidad sobre producción y comercio internacional deproductos forestales. A continuación se ofrecen datosdetallados para ponerse en contacto con los funcionarios de laFAO encargados de las distintas secciones del anuario.Subdirección de Planificación y Estadísticas, Departamento deMontes de la FAO. Viale delle Terme di Caracalla, 00100Roma, Italia. Fax: +39-06-5705.5514 ó +39-06-5705.5137;correo electrónico: para observaciones generalesmichael.martin©fao.org; estadísticas de produccióncrissis.vici©fao.org; estadísticas de comercioeva.borzillo©fao.org: acceso a FAOSTATfelice.padovani©fao.org.
SÍMBOLOS EMPLEADOS EN LOS CUADROS
CUM Metro cúbicoMT Tonelada métrica
ConíferasNC No coníferas
Estimación de la FAOCifra no oficialDólar EE.UU.
NOMBRES Y DEFINICIONES DE LOS PRODUCTOS
A continuación se presenta una lista de los términos generalesy de los nombres de productos forestales empleados en elanuario, con una breve definición. En la medida de lo posible,las definiciones empleadas se ajustan a la Clasificación ydefiniciones de los productos forestales, FAO, Roma, 1982.Algunas de ellas han sido retocadas con miras a su empleo enel cuestionario conjunto sobre los productos forestales.
Términos generales
ConíferasTodas las maderas procedentes de árboles clasificadosbotánicamente como Gymnospermae por ejemplo, abeto(Abies), pino de Paraná (Araucana), cedro (Cedrus), ginkgo(Ginkgo), alerce (Larix), picea (Picea), pino (Pinus) incluso elllorón del Himalaya y el longifolio. (Suelen denominarsetambién maderas blandas).
No coníferasTodas las maderas procedentes de árboles clasificadosbotánicamente como Angiospermae: por ejemplo, arce (Acer),ébano (Diospyros), haya (Fagus), guayacán (Guaiacum),chopo (Populus), roble (Quercus), sal (Shorea), teca(Tectona), casuarina (Casuarina), etc. (Suelen denominarsefrondosas o maderas duras).
TropicalesEn el Acuerdo Internacional sobre las Maderas Tropicales(1994) la madera tropical se define como sigue: "Maderatropical de no coníferas para usos industriales, que crece o seproduce en los países situados entre el Trópico de Cáncer y elTrópico de Capricornio. El término comprende las trozas, lamadera aserrada, las hojas de chapa y la madera terciada. Ladefinición se aplicará también a la madera terciada queincluye en parte madera de coníferas de origen tropical". En elanuario, el término sólo se aplica a la madera en rolloindustrial de especies no coníferas.
OtrosPaíses que no son tropicales (con arreglo a la definiciónsusodicha). En el anuario, el término sólo se aplica a la
madera en rollo industrial de especies no coníferas.
ExtraccionesVolumen de todos los árboles, vivos o muertos, que se cortany extraen del bosque, de otros terrenos boscosos o de otroslugares de corta. Se incluyen las pérdidas naturales que serecuperan (es decir, se aprovechan), las extracciones duranteel ano de la madera cortada en un período anterior, lasextracciones de madera no proveniente del tronco, como porejemplo tocones y ramas (cuando se aprovechan), y lasextracciones de árboles muertos o dañados por causas
naturales (es decir pérdidas naturales), por ej. incendios,vendavales, insectos y enfermedades. Se excluyen la cortezay otra biomasa no leñosa, así como toda la madera que no seextrae, por ej. tocones, ramas y copas de árboles (cuando nose aprovechan) y residuos de la corta (desechos delaprovechamiento). Los datos se expresan en metros cúbicossin corteza. Cuando el volumen se calcula con inclusión de lacorteza, ha de ajustarse a la baja para convertirlo en unaestimación sin corteza.
ProducciónVolumen o peso real de toda la producción de los productosque se especifican más adelante. Se incluye la producción deproductos que pueden consumirse inmediatamente en la
producción de otro producto (por ej. pasta de madera, quepuede convertirse inmediatamente en papel como parte de unproceso continuo). Se excluye la producción de hojas dechapa que se utilizan para la producción de madera terciadadentro del mismo país. Los datos se expresan en metroscúbicos de volumen real en el caso de la madera en rollo, lamadera aserrada y los tableros de madera y en toneladasmétricas en el caso del carbón vegetal, la pasta y el papel.
ImportacionesProductos importados para el consumo interno o para sertransformados en el país. Se incluyen las importaciones parala reexportación en ciertas circunstancias. Se excluyen losenvíos "en tránsito". Los datos se expresan en metros cúbicosde volumen real o en toneladas métricas, y los valores suelenincluir el costo, seguro y flete (c.i.f).
ExportacionesProductos de origen o fabricación nacional enviados fuera delpaís. Se incluyen las reexportaciones en ciertascircunstancias. Se excluyen los envíos "en tránsito". Los datosse expresan en metros cúbicos de volumen real o entoneladas métricas y los valores suelen registrarse comofranco a bordo (f.o.b.).
Valores unitariosLos valores unitarios se han obtenido dividiendo el valor totaldel comercio por su volumen total. Las cifras de lasexportaciones corresponden a los valores medios f.o.b.,mientras que las de las importaciones corresponden a losvalores medios cit.
ConsumoEl consumo es el consumo aparente neto, que es igual a laproducción más las importaciones menos las exportaciones,por lo que sólo puede calcularse cuando se dispone de datosrelativos a esos tres elementos.
Agregados y nombres de productos forestales
Los nombres de los distintos productos forestales y de susagregados se ofrecen a continuación en el orden en queaparecen en los cuadros. No se dan definiciones por separadode los componentes de las coníferas (C) y de las no coníferas(NC) cuando se aplica la definición general. Salvo indicaciónen contrario, cada categoría de productos forestales incluyecomponentes tanto de coníferas como de no coníferas. En uncuadro al final de esta sección se ofrece un resumen en el quese indica cómo se relacionan entre sí todas las categorías deproductos y los agregados.
MADERA EN ROLLO
Madera en rolloMadera en rollo (C)Madera en rollo (NC)
Toda la madera en rollo cortada o aprovechada y extraída decualquier otro modo. Comprende toda la madera obtenida delas extracciones, es decir las cantidades extraídas de losbosques y de árboles situados fuera de ellos, incluida la
madera recuperada de pérdidas naturales, de la corta y de lasoperaciones de explotación durante el período (año civil oejercicio forestal). Se incluye toda la madera extraída con osin corteza, incluida la madera extraída en forma de rollo, opartida, simplemente escuadrada o en otra forma (por ej.
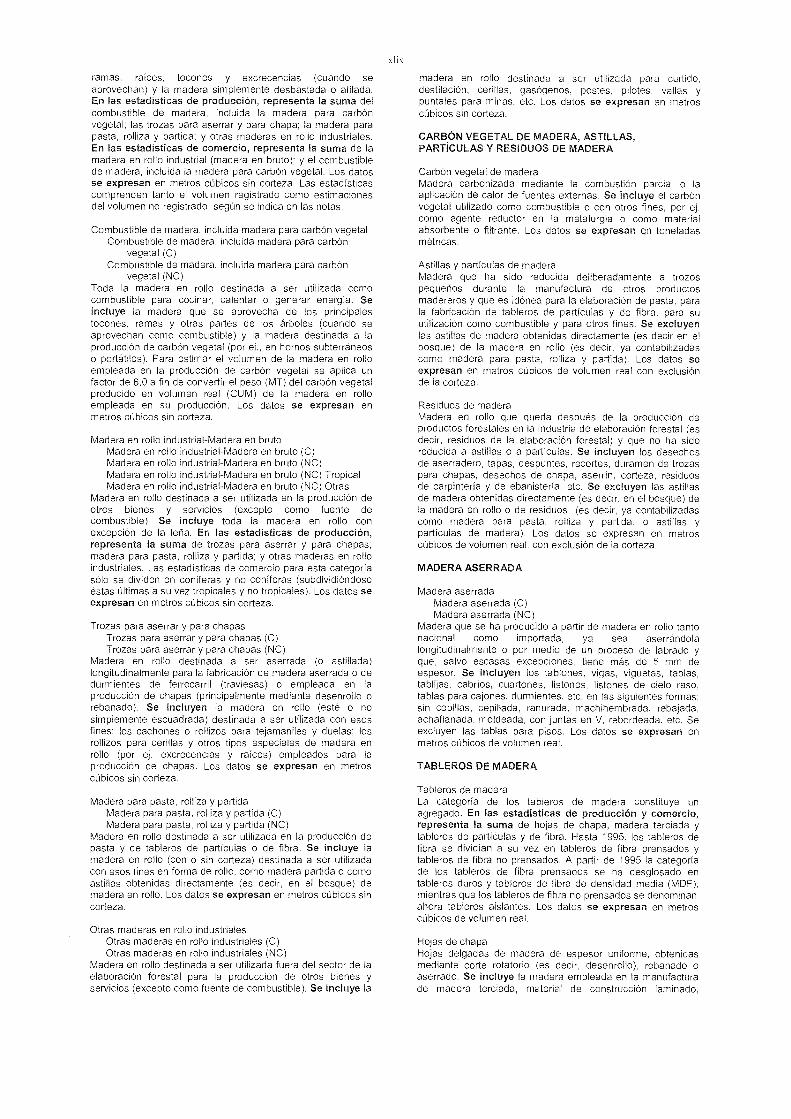
ramas, raíces, tocones y excrecencias (cuando seaprovechan) y la madera simplemente desbastada o afilada.En las estadísticas de producción, representa la suma delcombustible de madera, incluida la madera para carbónvegetal; las trozas para aserrar y para chapa: la madera parapasta, rolliza y partida; y otras maderas en rollo industriales.En las estadísticas de comercio, representa la suma de lamadera en rollo industrial (madera en bruto); y el combustiblede madera, incluida la madera para carbón vegetal. Los datosse expresan en metros cúbicos sin corteza. Las estadísticascomprenden tanto el volumen registrado como estimacionesdel volumen no registrado, según se indica en las notas.
Combustible de madera, incluida madera para carbón vegetalCombustible de madera, incluida madera para carbón
vegetal (C)Combustible de madera, incluida madera para carbón
vegetal (NC)Toda la madera en rollo destinada a ser utilizada comocombustible para cocinar, calentar o generar energía. Seincluye la madera que se aprovecha de los principalestocones, ramas y otras partes de los árboles (cuando seaprovechan como combustible) y la madera destinada a la
producción de carbón vegetal (por ej., en hornos subterráneoso portátiles). Para estimar el volumen de la madera en rolloempleada en la producción de carbón vegetal se aplica unfactor de 6,0 a fin de convertir el peso (MT) del carbón vegetalproducido en volumen real (CUM) de la madera en rolloempleada en su producción. Los datos se expresan enmetros cúbicos sin corteza.
Madera en rollo industrial-Madera en brutoMadera en rollo industrial-Madera en bruto (C)Madera en rollo industrial-Madera en bruto (NC)Madera en rollo industrial-Madera en bruto (NC) TropicalMadera en rollo industrial-Madera en bruto (NC) Otras
Madera en rollo destinada a ser utilizada en la producción deotros bienes y servicios (excepto como fuente decombustible). Se incluye toda la madera en rollo conexcepción de la leña. En las estadísticas de producción,representa la suma de trozas para aserrar y para chapas;madera para pasta, rolliza y partida; y otras maderas en rolloindustriales. Las estadísticas de comercio para esta categoríasólo se dividen en coníferas y no coníferas (subdividiéndoseéstas últimas a su vez tropicales y no tropicales). Los datos seexpresan en metros cúbicos sin corteza.
Trozas para aserrar y para chapasTrozas para aserrar y para chapas (C)Trozas para aserrar y para chapas (NC)
Madera en rollo destinada a ser aserrada (o astillada)longitudinalmente para la fabricación de madera aserrada o dedurmientes de ferrocarril (traviesas) o empleada en laproducción de chapas (principalmente mediante desenrollo orebanado). Se incluyen la madera en rollo (esté o nosimplemente escuadrada) destinada a ser utilizada con esosfines; los cachones o rollizos para tejamaniles y duelas; losrollizos para cerillas y otros tipos especiales de madera enrollo (por ej. excrecencias y raíces) empleados para laproducción de chapas. Los datos se expresan en metroscúbicos sin corteza.
Madera para pasta, rolliza y partidaMadera para pasta, rolliza y partida (C)Madera para pasta, rolliza y partida (NC)
Madera en rollo destinada a ser utilizada en la producción depasta y de tableros de partículas o de fibra. Se incluye lamadera en rollo (con o sin corteza) destinada a ser utilizadacon esos fines en forma de rollo, como madera partida o comoastillas obtenidas directamente (es decir, en el bosque) demadera en rollo. Los datos se expresan en metros cúbicos sincorteza.
Otras maderas en rollo industrialesOtras maderas en rollo industriales (C)Otras maderas en rollo industriales (NC)
Madera en rollo destinada a ser utilizada fuera del sector de laelaboración forestal para la producción de otros bienes yservicios (excepto como fuente de combustible). Se incluye la
madera en rollo destinada a ser utilizada para curtido,destilación, cerillas, gasogenos, postes, pilotes, vallas y
puntales para minas, etc. Los datos se expresan en metroscúbicos sin corteza.
CARBÓN VEGETAL DE MADERA, ASTILLAS,PARTÍCULAS Y RESIDUOS DE MADERA
Carbón vegetal de maderaMadera carbonizada mediante la combustión parcial o laaplicación de calor de fuentes externas. Se incluye el carbónvegetal utilizado como combustible o con otros fines, por ej.como agente reductor en la metalurgia o como materialabsorbente o filtrante. Los datos se expresan en toneladasmétricas.
Astillas y partículas de maderaMadera que ha sido reducida deliberadamente a trozospequeños durante la manufactura de otros productosmadereros y que es idónea para la elaboración de pasta, parala fabricación de tableros de partículas y de fibra, para suutilización como combustible y para otros fines. Se excluyenlas astillas de madera obtenidas directamente (es decir en elbosque) de la madera en rollo (es decir, ya contabilizadascomo madera para pasta, rolliza y partida). Los datos seexpresan en metros cúbicos de volumen real con exclusiónde la corteza.
Residuos de maderaMadera en rollo que queda después de la producción deproductos forestales en la industria de elaboración forestal (esdecir, residuos de la elaboración forestal) y que no ha sidoreducida a astillas o a partículas. Se incluyen los desechosde aserradero, tapas, despuntes, recortes, duramen de trozaspara chapas, desechos de chapa, aserrín, corteza, residuosde carpintería y de ebanistería, etc. Se excluyen las astillasde madera obtenidas directamente (es decir, en el bosque) dela madera en rollo o de residuos (es decir, ya contabilizadascomo madera para pasta, rolliza y partida, o astillas ypartículas de madera). Los datos se expresan en metroscúbicos de volumen real, con exclusión de la corteza.
MADERA ASERRADA
Madera aserradaMadera aserrada (C)Madera aserrada (NC)
Madera que se ha producido a partir de madera en rollo tantonacional como importada, ya sea aserrándolalongitudinalmente o por medio de un proceso de labrado yque, salvo escasas excepciones, tiene más de 5 mm deespesor. Se incluyen los tablones, vigas, viguetas, tablas,tablijas, cabríos, cuartones, listones, listones de cielo raso,tablas para cajones, durmientes, etc. en las siguientes formas:sin cepillas, cepillada, ranurada, machihembrada, rebajada,achaflanada, moldeada, con juntas en V, rebordeada, etc. Seexcluyen las tablas para pisos. Los datos se expresan enmetros cúbicos de volumen real.
TABLEROS DE MADERA
Tableros de maderaLa categoría de los tableros de madera constituye unagregado. En las estadísticas de producción y comercio,representa la suma de hojas de chapa, madera terciada ytableros de partículas y de fibra. Hasta 1995, los tableros defibra se dividían a su vez en tableros de fibra prensados ytableros de fibra no prensados. A partir de 1995 la categoríade los tableros de fibra prensados se ha desglosado entableros duros y tableros de fibra de densidad media (MDF),mientras que los tableros de fibra no prensados se denominanahora tableros aislantes. Los datos se expresan en metroscúbicos de volumen real.
Hojas de chapaHojas delgadas de madera de espesor uniforme, obtenidasmediante corte rotatorio (es decir, desenrollo), rebanado oaserrado. Se incluye la madera empleada en la manufacturade madera terciada, material de construcción laminado.
muebles, envases de chapa, etc. Se excluye la maderaempleada en la producción de madera terciada dentro delmismo país. Los datos se expresan en metros cúbicos devolumen real.
Madera terciadaTablero que consiste en un conjunto de hojas de chapaencoladas, con la dirección del hilo en capas alternasgeneralmente en ángulo recto. Las chapas suelen colocarsesimétricamente a ambos lados de una capa o núcleo centralde hoja de chapa o de otro material. Se incluyen la maderaterciada de chapa (madera terciada que se fabrica encolandomás de dos chapas, con las fibras de las hojas de chapaalternas atravesadas generalmente en ángulo recto); lostableros con alma (madera terciada con un alma maciza (esdecir, una capa central, generalmente más gruesa que lasotras), que consiste en tablas angostas. bloques o listones demadera yuxtapuestos, encolados o no): los tableros celulares(madera terciada con un alma de construcción celular); y lostableros compuestos (madera terciada que tiene un alma oalgunas capas de un material que no consiste ni en chapas nien madera maciza). Se excluyen los materiales deconstrucción laminados (por ejemplo, la madera laminada), enlos que las fibras de las hojas de chapa van por lo general enla misma dirección. Los datos se expresan en metros cúbicosde volumen real,
Tableros de partículasTableros fabricados con trozos pequeños de madera u otrasmaterias lignocelulósicas (por ej.. astillas, hojuelas, virutas,etc.) aglomeradas por medio de un aglutinante orgánico y unoo más de los agentes que se mencionan a continuación: calor,presión, humedad, catalizador, etc. Se incluyen los tablerosde obleas, los tableros de virutas largas orientadas (OSB) ylos tableros de lino. Se excluyen los tableros de lana demadera y otros tableros de partículas con aglutinantesinorgánicos. Los datos se expresan en metros cúbicos devolumen real.
Tableros de fibraTableros fabricados con fibras de madera u otros materialeslignocelulosicos utilizando como ligazón primaria las fibrasafieltradas y sus propiedades de cohesión inherentes (aunqueen el proceso de fabricación pueden añadirse aglutinantes yaditivos). Se incluyen los tableros de fibra prensados conprensa lisa y moldeados. En las estadísticas de produccióny comercio, representan la suma de los tableros duros, lostableros de fibra de densidad media (MDF) y los tablerosaislantes. Los datos se expresan en metros cúbicos devolumen real.
Tableros durosTableros de fibra de densidad superior a 0,80 g/cm". Antes de1995, este producto formaba parte de la categoría de lostableros de fibra prensados, por lo que no se dispone de datospara este producto relativos a 1994 y anos anteriores. Seexcluyen los productos similares fabricados con partículas demadera, polvo de madera u otros materiales lignocelulósicosque requieren otros aglutinantes para fabricar el tablero, asícomo los tableros de yeso o de cualquier otra materia primade origen mineral. Los datos se expresan en metros cúbicosde volumen real.
Tableros de fibra de densidad media (MDF)Tableros de fibra de densidad comprendida entre 0,5 g/cm3 y0,8 g/cm'. Antes de 1995, este producto formaba parte de lacategoría de los tableros de fibra prensados, por lo que no sedispone de datos para este producto relativos a 1994 y anosanteriores. Los datos se expresan en metros cúbicos devolumen real.Tableros aislantesTableros de fibra de densidad no superior a 0,5 g/cm3. Antesde 1995. este producto se incluía entre los tableros de fibra noprensados. Los datos se expresan en metros cúbicos devolumen real.
PASTA Y PAPEL RECUPERADO
Pasta de maderaMaterial fibroso preparado a partir de madera para pasta,astillas, partículas y residuos de madera o papel recuperado,mediante procesos mecánicos o químicos, para su ulteriortransformación en papel, cartón, tableros de fibra u otrosproductos celulosicos. En las estadísticas de producción ycomercio, representa la suma de la pasta de maderamecánica, pasta de madera semiquimica, pasta de maderaquímica y pasta de madera soluble. Los datos se expresan entoneladas métricas de peso seco al aire (es decir, con un 10por ciento de humedad).
Pasta de madera mecánicaPasta de madera obtenida triturando o desfibrando maderapara pasta o residuos , o refinando astillas o partículas. Sedenomina también pasta mecánica de madera triturada ypasta de refino. Puede ser blanqueada o no. Se incluyen lapasta de madera semimecánica, la pasta de madera química-mecánica y la termomecánica. Se excluyen la pasta de fibrasdesintegradas. Los datos se expresan en toneladas métricasde peso seco al aire (es decir, con un 10 por ciento dehumedad).
Pasta de madera semiquímicaPasta de madera obtenida sometiendo pasta de madera,astillas, partículas o residuos de madera a una serie detratamientos mecánicos y químicos, ninguno de los cuales porseparado es suficiente para hacer que las fibras se separencon facilidad. Puede ser blanqueada o no. Se incluyen lapasta de madera semiquímica, la pasta química de maderatriturada, la pasta química-mecánica, etc. (se citan en ordende importancia del tratamiento durante el proceso defabricación). Los datos se expresan en toneladas métricas depeso seco al aire (es decir, con un 10 por ciento de humedad).
Pasta de madera químicaPasta de madera obtenida sometiendo pasta de madera,astillas, partículas o residuos de madera a una serie detratamientos químicos. Se incluyen la pasta de madera alsulfato (kraft), a la sosa y al sulfito. Puede ser blanqueada,semiblanqueada o sin blanquear. Se excluyen las calidadessolubles de pasta de madera. Los datos se expresan entoneladas métricas de peso seco al aire (es decir, con un 10por ciento de humedad). Cuando se dispone de informacióndetallada, se dan también estadísticas para los cuatrocomponentes siguientes: pasta al sulfito sin blanquear, pastaal sulfito blanqueada, pasta al sulfato sin blanquear y pasta alsulfato blanqueada.
Pasta al sulfito sin blanquearPasta al sulfito blanqueadaPasta de madera obtenida reduciendo mecánicamente pastade madera, astillas, partículas o residuos de madera a trozospequeños que se cuecen después en autoclave en presenciade licor de cocción al bisulfito. En este proceso suelenemplearse bisulfitos como los de amonio, calcio, magnesio ysodio. Se excluyen las calidades solubles de pasta demadera. Los datos se expresan en toneladas métricas depeso seco al aire (es decir. con un 10 por ciento de humedad)y se dan por separado para dos clases: blanqueada (incluidala semiblanqueada) y sin blanquear.
Pasta al sulfato sin blanquearPasta al sulfato blanqueadaPasta de madera obtenida reduciendo mecánicamente pastade madera, astillas, partículas o residuos de madera a trozospequeños que se cuecen después en autoclave en presenciade licor de cocción al hidróxido de sodio (pasta a la sosa) o deun licor de cocción consistente en una mezcla de hidróxido desodio y sulfito de sodio (pasta al sulfato). Se excluyen lascalidades solubles de pasta de madera. Los datos seexpresan en toneladas métricas de peso seco al aire (esdecir, con Lin 10 por ciento de humedad) y se dan porseparado para dos clases: blanqueada (incluida la
semiblanqueada) y sin blanquear.
Pasta de madera solublePasta química (al sulfato, a la sosa o al sulfito) hecha demadera de calidad especial, con un contenido muy alto de alfacelulosa (por lo general el 90 por ciento o más). Este tipo depasta se blanquea siempre y es fácilmente adaptable aaplicaciones distintas de la fabricación de papel. Se empleaprincipalmente como fuente de celulosa en la fabricación deproductos tales como fibras artificiales, materiales plásticoscelulosicos, lacas y explosivos. Los datos se expresan entoneladas métricas de peso seco al aire (es decir, con un 10por ciento de humedad).
Pasta de otras fibrasPasta de materiales vegetales fibrosos distintos de la maderaque se emplea en la fabricación de papel, cartón y tableros defibra. Se incluyen las pastas de paja, bambú, bagazo,esparto, otras canas o gramíneas, borra de algodón, lino,cáñamo, trapos y otros desechos textiles. Se excluye la pastade papel recuperado. Los datos se expresan en toneladasmétricas de peso seco al aire (es decir, con un 10 por cientode humedad).
Papel recuperadoDesechos y pedazos de papel o cartón que se han recogidopara su reutilización como materia prima para la fabricación depapel y cartón. Se incluyen los papeles y cartones que hasido utilizados para su fin original y los residuos de laproducción de papel y cartón. Los datos se expresan entoneladas métricas.
PAPEL Y CARTÓN
Papel y cartón
La categoría del papel y el carbón constituye un agregado. Enlas estadísticas de producción y comercio, representa lasuma de papel para periódicos, papel de imprenta y deescribir, y otros papeles y cartones. Los productos de estacategoría se suelen fabricar en tiras o rollos de una anchurasuperior a 15 cm (36 cm en el caso de las partidas 48.13 y48.19 del SA) o en hojas rectangulares que sin plegar midenmás de 36 cm x 15 cm de lado. Se excluyen los productos depapel manufacturados tales como cajas, envases, libros yrevistas, etc. Los datos se expresan en toneladas métricas.
Papel para periódicosPapel sin estuco, sin apresto (o con muy poco apresto) quecontiene como mínimo un 60 por ciento de pasta mecánica demadera (porcentaje de fibras) y pesa no menos de 40 g/m2 ypor lo general no más de 60 g/m2. del tipo empleadoprincipalmente para la impresión de periódicos. Los datos seexpresan en toneladas métricas.
Papeles y cartones distintos del papel para periódicosLa categoría del papel y el carbón constituye un agregado.Comprende otros papeles de imprenta y de escribir y otrospapeles y cartones. Aparece solamente en los cuadros en losque se indica la dirección del comercio. Los datos seexpresan en toneladas métricas.
Papel de imprenta y de escribirPapeles. con la excepción del papel para periódicos, idóneospara la impresión y para fines comerciales, escritura, grabado,dibujo, etc., hechos con diversas mezclas de pastas y diversosacabados. Se incluyen los papeles empleados para libros yrevistas, base de papel mural, forro interior y exterior de cajas,papel de calculadora, papel de rotativa, papel de copia,etiquetas. papel litográfico, papel moneda, papel de tarjetas detabulación, papel biblia o imitación biblia. papel de carta, papelde copia para máquina de escribir, papel cebolla, papel paramáquina de escribir, papel para carteles, etc. Los datos seexpresan en toneladas métricas.Otros papeles y cartonesTodos lo demás tipos de papel. Se incluyen los papeles ycartones de construcción, el papel de uso doméstico y
sanitario, el papel especial fino, el papel y cartón de envolver yempaquetar, y otros papeles y cartones no especificados enotra partida. Los datos se expresan en toneladas métricas.Cuando se dispone de información detallada, se ofrecen
también estadísticas para los tres componentes siguientes:papel doméstico y sanitario, papel y cartón de envolver yempaquetar, y otros papeles y cartones no especificados enotra partida.
Papel doméstico y sanitarioPapel absorbente (crepé o no y a veces gofrado) hecho depasta química de madera, blanqueada o no, a veces conmezcla de pasta de papel viejo y de pasta mecánica. Seincluyen las toallas, servilletas, papel facial, papel higiénico,guata y pañuelos desechables, etc. Los datos se expresan entoneladas métricas.
Papel y cartón de envolver y empaquetarPapel o cartón empleado para envolver, para empaquetar ypara la fabricación de bolsas y cajas. Se incluyen elpergamino vegetal, el papel impermeable a las grasas y elpapel cristal (hechos de pasta química de madera pura o deuna mezcla de pasta química de madera, pastas de fibra dealgodón, tratadas (por ej. altamente hidratadas o bataneadasenérgicamente) para que el papel obtenido sea resistente alaceite, a la grasa y al agua, empleados principalmente paraenvasar productos congelados, húmedos o grasosos talescomo mantequilla, margarina, carne o pescado); el cartón decapa o cara (papel o cartón empleado corno cara de cajas yenvases de papel o cartón sólido u ondulado); el medio paraacanalar (papel o cartón empleado corno medio cuando secombinan papel y cartón para fabricar cartón ondulado); elpapel kraft para bolsas (papel resistente de pasta al sulfatoempleado en la fabricación de bolsas simples o múltiple s);otros papeles kraft de envolver (todos los demás papeles deenvolver y empaquetar hechos principalmente de pasta alsulfato); el cartón para cajas plegables (todos los tipos decartón empleados en la fabricación de cajas plegables); yotros papeles y cartones de envolver y empaquetar. Los datosse expresan en toneladas métricas.
Otros papeles y cartones no especificados en otra partidaPapeles y cartones empleados en la construcción, para usosespeciales y para otros fines no especificados en otra partida.Se incluyen los papeles kraft empleados para encerar,asfaltar, impermeabilizar, laminar, impregnar hilar o torcer,engomar, etc.: los papeles hechos especialmente con mezclasde pasta, con excepción de la pasta al sulfato, que no seespecifican en otra partida (Como por ejemplo, papel decordeles y de yute, papel de carpeta, papel secante, papelfiltro, papel sensible fotográfico, etc.); los papeles y cartonespara la construcción (papeles, fieltros de pape/ y cartonesempleados en la construcción de edificios y otras estructuraspara aislar y sellar contra emanaciones, para colocar debajode los techos y pisos, etc. (estos papeles se hacen por logeneral de material totalmente refinado, como por ejemplo,pasta de madera, papel viejo, pasta de otros vegetales y fibramineral y sus características básicas son poca conductividadtérmica, resistencia a la humedad, resistencia al fuego,permanencia y resistencia a los insectos y otros animalesdañinos)); el papel especial fino (papeles elaborados parafines especiales, cuya característica común es su delgadezrelativa, y que pueden estar hechos de pastas mecánicas oquímicas de madera, blanqueadas o no, pero quefrecuentemente se hacen de pastas que contienen fibras delino, cáñamo o algodón, siendo las características principalesde algunos de esos papeles /a uniformidad de sus superficie yespesor; ausencia de poros, resistencia, densidad, opacidad,escasa permeabilidad y pureza química: pueden citarse comoejemplos de este tipo de papel el papel carbón, papel paracondensador, papel para cigarrillos, pañuelos para (entes,papel para estarcidos y papel para bolsitas de té); y loscartones no especificados en otra partida (como por ejemplocartón de zapatos, carón de empaquetadora, cartón detransformador, cartón prensado textil, cartón prensado paraíndices, cartón panel (automóviles), cartón de baúles ymaletas y cartón de matrices). Se excluyen los papeles,fieltros o cartones impregnados, saturados, laminados oelaborados ulteriormente de cualquier modo, y los tableros defibra o los tableros de fibra para la construcción, en forma detableros aislantes, tableros semiduros y tableros duros. Losdatos se expresan en toneladas métricas.
NOTAS SOBRE LOS CUADROS
Producción y comercio
MADERA EN ROLLO
Madera en rollo industrialDado que no se dispone de datos sobre la producción demadera en rollo industrial para varios países, ésta se haestimado convirtiendo el volumen de los productos producidosen el país al volumen de madera en rollo necesario paraproducirlo (equivalente de madera en rollo). No se puedecalcular el consumo de los distintos productos forestalesincluidos en el total de la madera en rollo industrial, debido alas diferencias en las definiciones de los productos forestalesutilizadas en las estadísticas de producción y comercio. En1988, varios países miembros del Consejo de CooperaciónAduanera (actualmente denominado Organización Mundial deAduanas) introdujeron una clasificación revisada de losproductos en sus estadísticas comerciales: el SistemaArmonizado de Designación y Codificación de Mercancías(SA). Este sistema ha sido adoptado también por las NacionesUnidas en la Revisión 3 de la Clasificación Uniforme para elComercio Internacional (CUCI Rev. 3). Aunque para la
mayoría de los productos forestales esto supone una simpletransformación con respecto a la clasificación anterior, en loque respecta a la madera en rollo industrial no se incluyen lassubdivisiones entre trozas para aserrar y para chapas, maderapara pasta y otras maderas en rollo industriales. Por ello sehan dejado de preparar los cuadros relativos al comercio deesos productos. El carácter incompleto de la declaración dedatos sobre producción de madera en rollo explica lapresencia de un consumo negativo en algunos países (esdecir, se trata de un problema estadístico). Estas inexactitudesse recogen en los totales regionales y mundiales.
Combustible de madera, incluida madera para carbón vegetalEsta categoría de productos se denominaba anteriormenteleña y carbón vegetal. Varios países no suministran datossobre la producción de estos productos, aunque se sabe quemuchos de ellos son consumidores importantes. Lasestimaciones correspondientes a esos países se basan en losdatos de las encuestas disponibles y se revisan a medida quese dispone de nuevas encuestas. Cuando se utilizanestimaciones, se supone que las variaciones anuales de laproducción de esos países son análogas a las variacionesanuales de la población. En un cuadro que figura másadelante se ofrecen las cifras correspondientes a la
producción por habitante que se han utilizado para actualizaresas estimaciones.
TABLEROS DE MADERA
Hojas de chapaEn algunos países, el volumen declarado de la producción dehojas de chapa incluye las hojas de chapa destinadas a lafabricación de madera terciada en el mismo país. La FAO haintentado corregir esas estadísticas siempre que ha sidoposible.
Tableros de fibraA veces, en las respuestas de los países al cuestionario sobrelos productos forestales no se distinguen los volúmenes deproducción de los diversos tipos de tableros de fibra. En talescasos, sólo se indica la producción total de tableros de fibra.Sin embargo, la producción de tableros de fibra se hadesglosado en sus distintos componentes siempre que ha sidoposible.
Dirección del comercio
Se ofrece información sobre la dirección del comerciocorrespondiente a los dos últimos años. Los cuadros al
respecto se basan en un análisis de la informaciónsuministrada por los países mediante el cuestionario conjuntosobre los productos forestales y de datos extraídos de la basede datos COMTRADE de la Oficina de Estadística de lasNaciones Unidas. Cuando el volumen no estaba expresado enunidades estándar, se han aplicado coeficientes de conversión
normalizados. Cuando el volumen notificado no era coherentecon el valor, se ha procedido a estimarlo de nuevo sobre labase del promedio de los valores unitarios. En ausencia deinformes de los países exportadores, se han elaboradoestimaciones de sus exportaciones a partir de informes de losimportadores. En la presente edición, los volúmenes indicadosen relación con la dirección del comercio pueden variar enalguna medida con respecto a los datos que aparecen en loscuadros principales del anuario, debido a los ajustes hechosen función de la información obtenida de COMTRADE y de loscuestionarios.
Unidades de valor
La unidad empleada en los cuadros relativos al valor delcomercio es el dólar EE.UU, y en los relativos al valor unitariodel comercio, el dólar EE.UU. por metro cúbico o por toneladamétrica, según el producto.
Notas sobre los paises
Algunos países no han suministrado estadísticas a la FAO ohan proporcionado sólo datos parciales. En tales casos, se hatomado información de anuarios nacionales, informes y
publicaciones no oficiales. Las estimaciones del comercio sehan basado en datos proporcionados por informes de losinterlocutores comerciales.
A continuación se hacen algunas observaciones sobredeterminados países:
Bélgica. Luxemburgo.La producción y el comercio se han fusionado en BEL-LUX.
ChinaLos datos incluyen los relativos a Taiwán, Provincia de China,y a la Región Administrativa Especial de Hong Kong.
Canadá y Estados Unidos de AméricaPara Canadá y los Estados Unidos de América, el volumen dela madera aserrada, expresado en miles de pies tablares, seha convertido a metros cúbicos mediante un factor deconversión de 2,36 m3 por 1 000 pies tablares. Las normasrelativas al aserrado en esos países hacen que por lo generalel volumen real de producción sea inferior al volumen nominal.Por ejemplo. se estima que, en el caso de los Estados Unidosde América, tomando en conjunto las coníferas y las noconíferas, el volumen medio efectivo de la madera aserradaverde sin cepillar sería inferior en un 3 por ciento al volumennominal producido, mientras que el volumen medio ponderadode la madera aserrada seca cepillada de coníferas y de lamadera aserrada seca sin cepillar de especies no coníferassería inferior en un 27 por ciento. A partir de 1995, los datosrelativos a la producción de tableros de partículas en losEstados Unidos de América sólo comprenden los tableros devirutas largas orientadas (OSE).
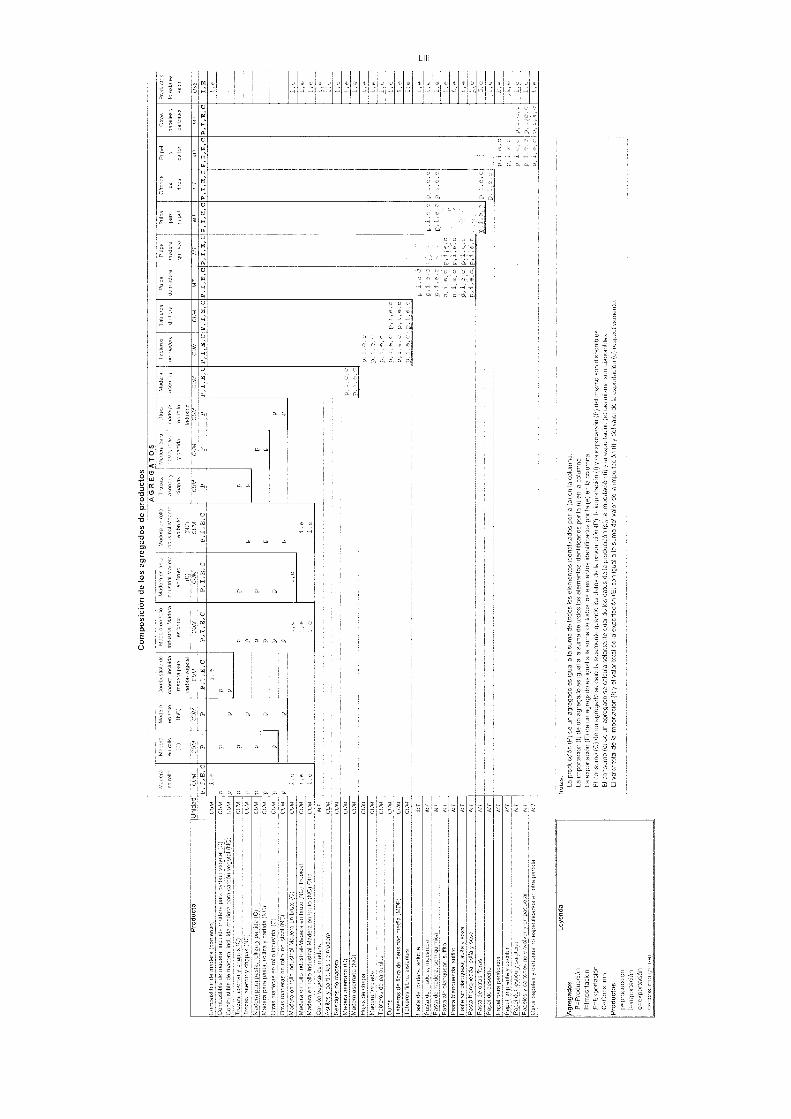
Pro
duc1
13
For
re.
ole
'ora
d.:
blr
:r
Lora
, inc
.oi
ader
a.
.
ombu
stib
le d
e. J
ara.
indo
:m
ader
a pa
ra c
avey
bal (
NC
)T
roza
s, a
serr
ar y
alm
a)
Tro
zas,
ase
rrar
y c
hapa
s (N
O)
Mad
era
para
pas
ta, r
olliz
a y
part
ida
(C)
Mad
era
para
pas
ta, r
olliz
a y
part
ida
(NC
)
Otr
as o
rado
ras
en r
ollo
indu
stria
l (C
)
Otr
as m
ader
as e
n ro
lo in
dust
rial (
N(
Mad
e: e
n ro
llo in
clus
trla
l-Mad
era
:
Mad
er .
es r
olo
indu
stria
l-Mar
-Vira
-ir
u) T
ropi
cal
Mad
.::ID
inc:
tria
blva
.d
te. '
NO
) C
era
Mad
.va
is.)
msd
o. e
sorr
ada
(NC
)y.
,de
epa
Mad
era
terc
iada
Tab
lero
s de
par
as...
Dur
os
Tab
lero
s de
fibr
a de
de,
med
ia (
MD
F)
Tab
lero
s fe
b. il
Iffi.7
1I
Pas
ta d
e m
adur
alu
tru
Pas
ta d
e m
arra
ra.
:
Pas
ta d
e m
adur
a rs
mac
aP
asta
s/n
bla
siu
r .
-
Pas
ta b
lanq
uoad
a, s
ulfit
oL
,re
sin
bar
mar
, si..
r. s
osa
Mar
a:am
or!r
'mea
yle
a
greg
ados
P=
Pro
diro
ciiin
Ixtin
port
acio
nE
eExp
orta
ciei
n=
Con
sum
oP
rodu
ctos
pror
amsd
n )1
Oda
iion
Lsye
udu
005 Uf-
CU U U
CU
M
CU M M
T
MT
MT
MT
MT
mr
MT
MT
MT
5.40 T
Not
as:
La p
rodu
cuon
(P
) de
un
agre
gado
es
igua
lLe
irap
oria
iO
rli d
er
lual
La e
xpor
ta,
oro
es.
gual
El
.If
os:
7 se
cal
cula
El
,aun
x..
cdo
se c
alcu
laE
l val
or to
lo d
ers
ibio
ng
el v
alor
a /a
sun
. de
todo
s lo
s el
emen
tos
Iden
tific
ados
oor
'en
la c
olor
ó.a
la s
uma
de to
dos
los
elem
ento
s de
n' i
xdox
..
lailu
mna
a la
sum
a de
todo
s lo
s el
emen
tos
ideo
'ra
cpo
r /
.i l
ólu
mna
sola
men
te g
uand
o lo
s da
tos
de la
nr
x.la
irr
. ira
y la
sola
men
te g
uand
o lo
s da
tos
de.
impo
it.to
tal d
e la
exp
orta
ción
(E
) so
n ig
ual a
la s
uma
del v
alor
de
I.:iri
y
F-
0
Com
posi
ción
de
los
agre
gado
s de
pro
duct
osA
GR
EG
AT
OS
es r
o.M
ader
a
en r
ollo
(C)
111.
.
IN0r
es to
llo
dos en
Mot
o
1. r
ollo
"Id
ader
a
(NC
)
110
ars.
dabl
e
do m
ader
a
Pul
pa
Wa
pape
lra
ras
Pap
ol
mal
.)
OV
OS
sart
or
Tol
dad
CU
OU
CU
UC
UM
CU
MC
UM
CU
0.1M
st11
-M
TrI
SI
Mr
P,I,
E,C
P,I,
E,C
P,I,
E,C
P E
EC
P,I,
E,C
PP
C P
,I,E
C P
,, E
,C P
,I,E
,C P
, I,
P, I
, E,C
P,I,
E,C
P,I,
E,C
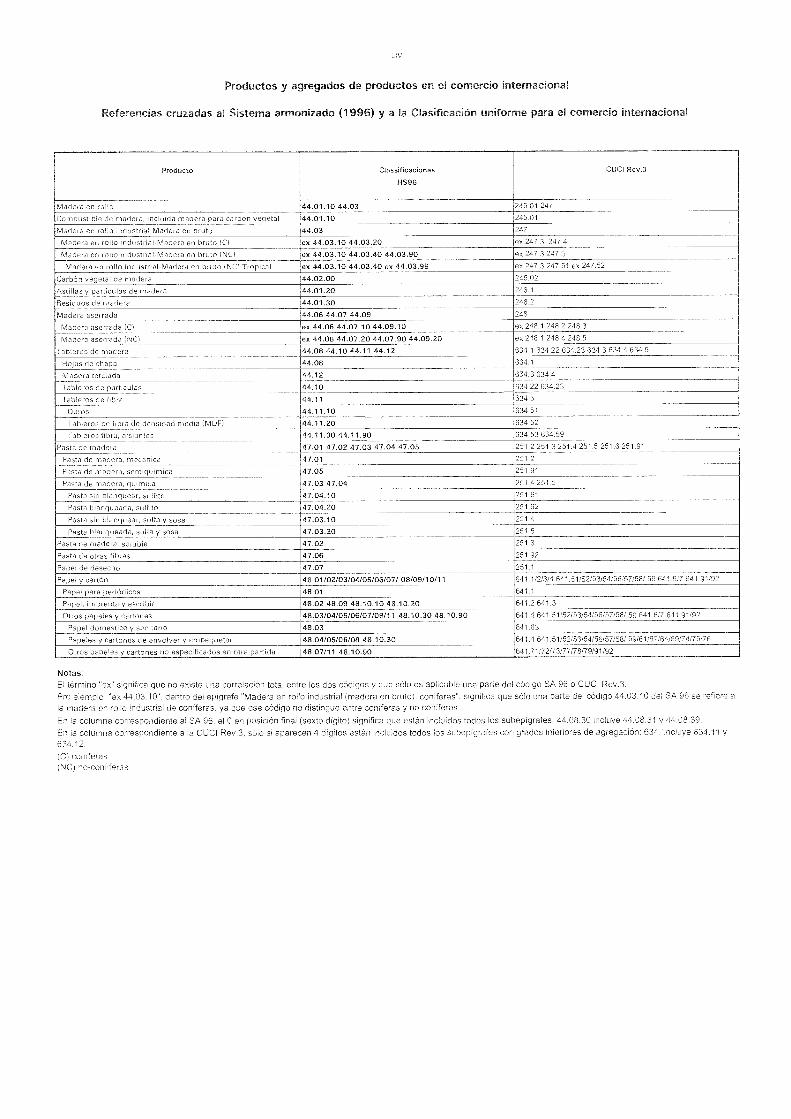
LIV
Productos y agregados de productos en el comercio internacional
Referencias cruzadas al Sistema armonizado (1996) y a la Clasificación uniforme para el comercio internacional
Notas:El término "ex" significa que no existe una correlación total entre los dos códigos y que sólo es aplicable una parte del código SA 96o CUCI Rev.3.Pro ejemplo, "ex 44.03.10", dentro del epígrafe "Madera en rollo industrial (madera en bruto), coníferas", significa que sólo una parte del código 44.03.10 del SA96 se refiere ala madera en rollo industrial de coníferas, ya que ese código no distingue entre coníferas y no coníferas
En la columna correspondiente al SA 96, el O en posición final (sexto dígito) significa que están incluidos todos los subepigrafes: 44.08.30 incluye 44.08.31 y 44.08.39.
En la columna correspondiente a la CUCI Res 3. sólo si aparecen 4 dígitos están incluidos todos los subepígrafes con grados inferiores de agregación: 634:incluye 634.11 y634.12.
(C) coníferas(NC) no-conliferas
Producto Classificaciones
H596
CLJCI Rev.3
lefa es icho 44.01.10 44.03 245.01 247
Combustible de ritbdi A, incluida madera para carbón vegetal 44.01.10 245.01
Madera en rollo in.: il-M .doro en bruto 44.03 247
Madera en rollo inoct a Madera en bruto lC) ex 44.03.10 44.03.20 ex 247.3 247,4
Madera en rollo industrial-Madera en bruto (NCt ex 44.03.10 44.03.40 44.03.90 ex 247. 247
Madero en rollo ard'rnirial-Madera err Eolo lNcì Tropicai ex 44.03.10 44.03.40 ex 44.03 .99 ex 247.3 247.51 ex 247.52
Oarbain vegetal de .: : 44.02.00 245.02
Astillas y particul . mar a 44.0 1.20 246.
Residuos de - r 44.0 1.30 246.2
Madera aserrada 44.06 44.07 44.09 24
Madera aserrada (C) ex 44.06 44.07.10 44.09.10 ex 2481 248.2 248_3
Madera aserrada (NC) ex 44.06 44.07.20 44.07.90 44.09.20 ex 248.1 2 8.4 248.5
Tableros de madera 44.08 44.10 44.11 44.12 634.1 634.22 634.23 634.3 634.4 634.
Hojas de drapa 44.08 634.1
Madera terciada 44.12 634.3 634.4
Tableros de purticolas 44.10 634.22 634,23
Tableros de filtra 44.11 634.5
Duros 44.11.10 634.51
Tableros de bhra de darisidait media IMOFì 44.11.20 u 4.52
Tableros fibra, aislantes 44.11.30 44.11.90 634.53 634.59
Pasta de madera 47.01 47.02 47.03 47.04 47.05 251 2 251.3 251,4 251.5 251.6 251.91
Pasta de madera, nica 47.01 251.2
Pasta de madera, sentiquirnica 47.05 251.91
Pasta de madera, quirnica 47.03 47.04 251.4 251.5
Pasta sin blanquear, sulfito 47.04.10 251.61
Pasta blanqueada, sulfito 47.04.20 251.62
Pasta sis blarrqsear, esita y sosa 47.03.10 251,4
Pasta biarrqseada. solfa esos 47.03.20 251.5
Pasta de madera, soluble 47.02 251.3
Pasta de bras fibras 47.06 251.9
Papel de desecho 47.07 251.1
Papel y carton 48.01/02/03/04/05/06/07/ 08109/10/11 641.1/2/3/4 641.51152/53/54/56/57/58r 59841.6/7 641.91/92
Papel para periddicos 48.01 641.1
Papel irsprerrta y escribir 48.02 48.09 48.10.10 48.10.20 641.2 641.3
Otros papeles y cartarras 48.03/04/05/06/07/08 48.10 30 45.10.90 641 4 641.51/52i53/54/56/57/58:' 59 641.6/7 641.91/92
Papel dorrrestice y sanitario 48.03 641.63
Pa e es y cartones de envoleer y empeqaetar 48.04/05/06/08 48. 0 0 641 4 641.51152/53/54/56/57 58/ 59/6 /62/64769/74175/76
Otras papeias y cartones no especificados en otra partida 48.07/11 48.10.90 641.71/72/73(77/78/79(91/92
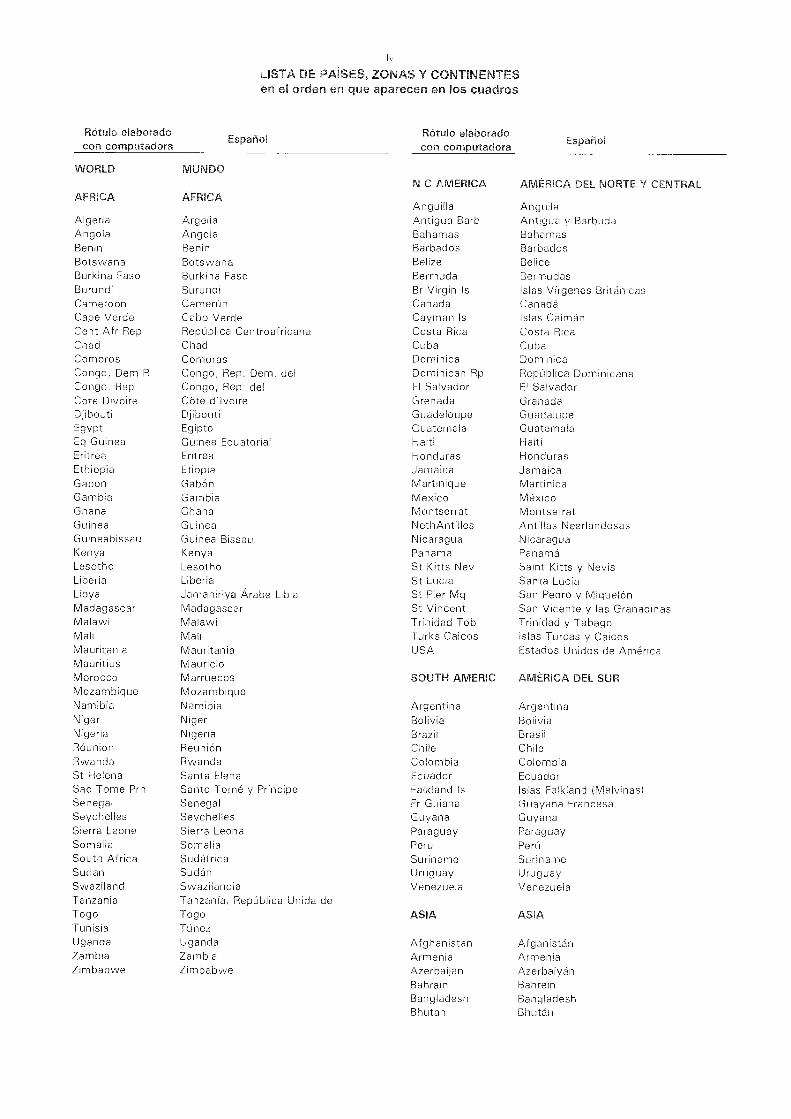
LISTA DE PAÍSES, ZONAS Y CONTINENTESen el orden en que aparecen en los cuadros
Rótulo elaboradocon computadora Espariol
Rótulo elaboradocon computadora Español
WORLD MUNDON C AMERICA P,MEHICA DEL NORTE Y CENTRAL
AFRICA ÁFRICAAnguilla Anguila
Algeria Argelia Antigua Barb Antigua y BarbudaAngola Angola Bahamas BahamasBenin Benin Barbados BarbadosBotswana Botswana Belize BeliceBurkina Faso Burkina Faso Bermuda BermudasBurundi Burundi Br Virgin Is Islas Vírgenes BritánicasCameroon Camerún Canada CanadáCape Verde Cabo Verde Cayman Is Islas CaimánCent Afr Rep República Centroafricana Costa Rica Costa RicaChad Chad Cuba CubaComoros Comoras Dominica DominicaCongo, Dem R Congo, Rep. Dem. del Dominican Rp República DominicanaCongo, Rep Congo, Rep. del El Salvador El SalvadorCote Divoire Côte d'Ivoire Grenada GranadaDjibouti Djibouti Guadeloupe GuadalupeEgypt Egipto Guatemala GuatemalaEq Guinea Guinea Ecuatorial Haiti HaitíEritrea Eritrea Honduras HondurasEthiopia Etiopía Jamaica JamaicaGabon Gabón Martinique MartinicaGambia Gambia Mexico MéxicoGhana Ghana Montserrat MontserratGuinea Guinea NethAntilles Antillas NeerlandesasGuineabissau Guinea Bissau Nicaragua NicaraguaKenya Kenya Panama PanamáLesotho Lesotho St Kitts Nev Saint Kitts y NevisLiberia Liberia St Lucia Santa LucíaLibya Jamahiriya Árabe Libia St Pier Mq San Pedro y MiquelonMadagascar Madagascar St Vincent San Vicente y las Granad nasMalawi Malawi Trinidad Tob Trinidad y TabagoMali Malí Turks Caicos Islas Turcas y CaicosMauritania Mauritania USA Estados Unidos de AméricaMauritius MauricioMorocco Marruecos SOUTH AMERIC AMÉRICA DEL SURMozambique MozambiqueNamibia Namibia Arg en ti na ArgentinaNiger Níger Bolivia BoliviaNigeria Nigeria Brazil BrasilRéunion Reunión Chile ChileRwanda Rwanda Colombia ColombiaSt Helena Santa Elena Ecuador EcuadorSao Tome Pm n Santo Tomé y Príncipe Ealkland Is Islas Falkland (Malvinas)Senegal Senegal Fr Guiana Guayana FrancesaSeychelles Seychelles Guyana GuyanaSierra Leone Sierra Leona Paraguay ParaguaySomalia Somalia Peru PerúSouth Africa Sudáfrica Suriname SurinameSudan Sudán Uruguay UruguaySwaziland Swazilandia Venezuela VenezuelaTanzania Tanzanía, República Unida deTogo Togo ASIA ASIATunisia TúnezUganda Uganda Afghanistan AfganistánZambia Zambia Armenia ArmeniaZimbabwe Zimbabwe Azerbaijan Azerbaiyán
Bahrain BahreinBangladesh BangladeshBhutan Bhután
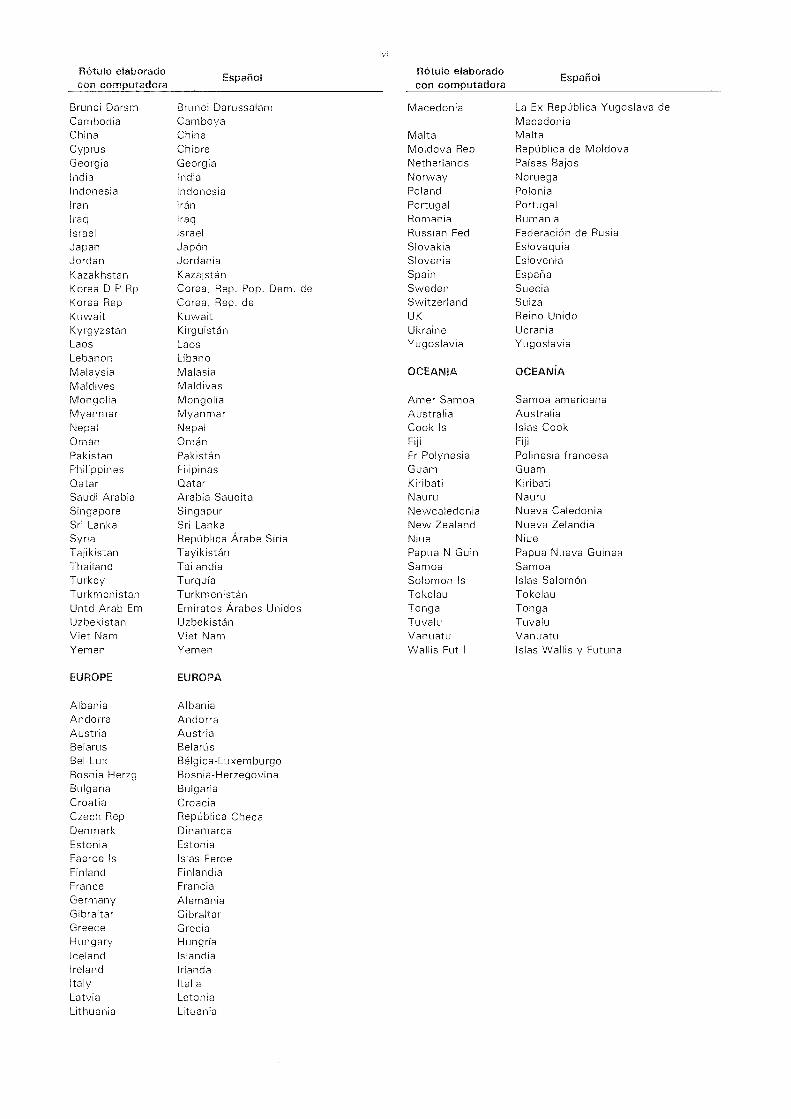
Brunei Darsm Brunei Darussalam Macedonia La Ex República Yugoslava deCambodia Camboya MacedoniaChina China Malta MaltaCyprus Chipre Moldova Rep República de MoldovaGeorgia Georgia Netherlands Países BajosIndia India Norway NoruegaIndonesia Indonesia Poland PoloniaIran Irán Portugal PortugalIraq Iraq Romania RumaniaIsrael Israel Russian Fed Federación de RusiaJapan Japón Slovakia EslovaquiaJordan Jordania Slovenia EsloveniaKazakhstan Kazajstán Spain EspañaKorea D P Rp Corea, Rep. Pop. Dem. de Sweden SueciaKorea Rep Corea, Rep. de Switzerland SuizaKuwait Kuwait UK Reino UnidoKyrgyzstan Kirguistán Ukraine UcraniaLaos Laos Yugoslavia YugoslaviaLebanon LíbanoMalaysia Malasia OCEANIA OCEANÍAMaldives MaldivasMongolia Mongolia Amer Samoa Samoa americanaMyanmar Myanmar Australia AustraliaNepal Nepal Cook Is Islas CookOman Omán Fiji Fiji
Pakistan Pakistán Fr Polynesia Polines a francesaPhilippines Filipinas Guam GuamQatar Qatar Kiribati KiribatiSaudi Arabia Arabia Saudita Nauru NauruSingapore Singapur Newcaledonia Nueva CaledoniaSri Lanka Sri Lanka New Zealand Nueva ZelandiaSyria República Árabe Siria Niue NiueTajikistan Tayikistán Papua N Guin Papua Nueva GuineaThailand Tailandia Samoa SamoaTurkey Turquía Solomon Is Islas SalomonTurkmenistan Turkmenistan Tokelau TokelauUntd Arab Em Emiratos Árabes Unidos Tonga TongaUzbekistan Uzbekistan Tuvalu TuvaluViet Nam Viet Nam Vanuatu VanuatuYemen Yemen Wallis Fut I Islas Wallis y Futuna
EUROPE EUROPA
Albania AlbaniaAndorra AndorraAustria AustriaBelarus BelarusBel-Lux Bélgica-LuxemburgoBosnia Herzg Bosnia-HerzegovinaBulgaria BulgariaCroatia CroaciaCzech Rep República ChecaDenmark DinamarcaEstonia EstoniaFaeroe Is Islas FeroeFinland FinlandiaFrance FranciaGermany AlemaniaGibraltar GibraltarGreece GreciaHungary HungríaIceland IslandiaIreland IrlandaItaly ItaliaLatvia LetoniaLithuania Lituania
Ri
Rótulo elaborado Rótulo elaboradoEspañol Español
con computadora con computadora
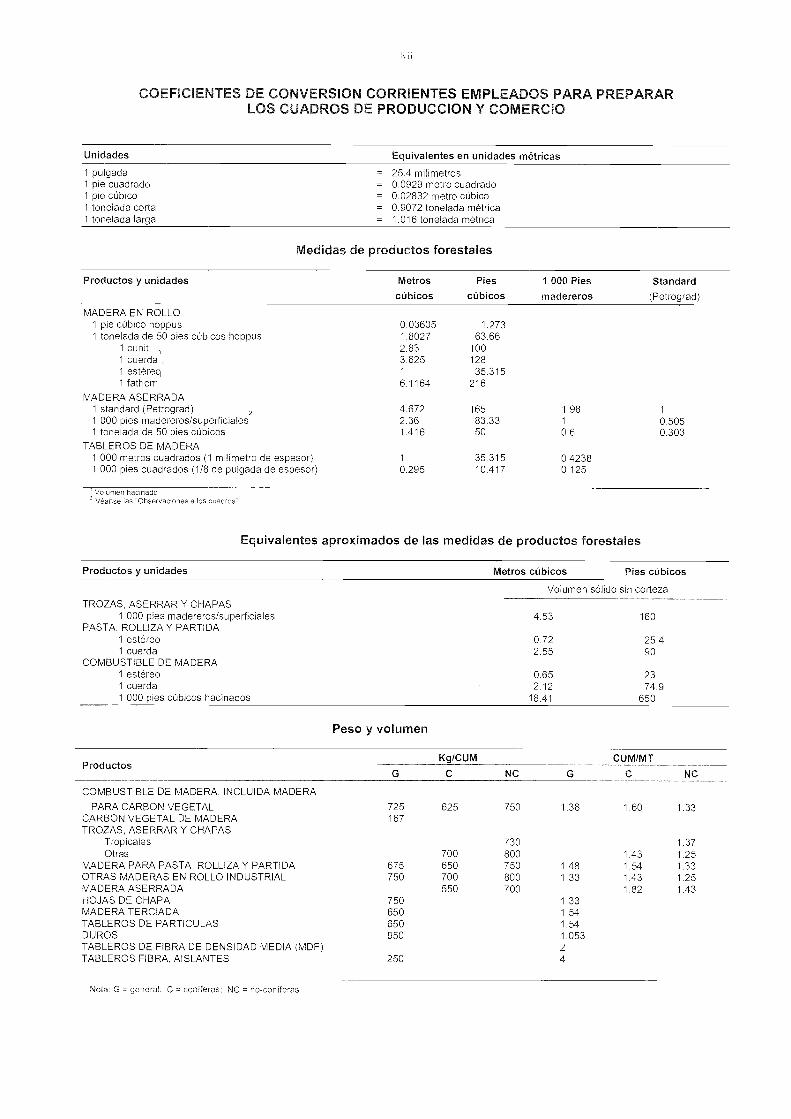
Unidades Equivalentes en unidades métricas
Volumen hacinado2 Véanse las 'Observaciones a los cuadros"
Equivalentes aproximados de las medidas de productos forestales
COEFICIENTES DE CONVERSION CORRIENTES EMPLEADOS PARA PREPARARLOS CUADROS DE PRODUCCION Y COMERCIO
Nota: G = general; C = coníferas; NC = no-coníferas
Medidas de productos forestales
Peso y volumen
Volumen sólido sin corteza
TROZAS, ASERRAR Y CHAPAS1 000 pies madereros/superficiales 4.53 160
PASTA, ROLLIZA Y PARTIDA1 estéreo 0.72 25.41 cuerda 2.55 90
COMBUSTIBLE DE MADERA1 estéreo 0.65 231 cuerda 2.12 74.91 000 pies cúbicos hacinados 18.41 650
Kg/CUM CUM/MTProductos
G C NC G C NC
COMBUSTIBLE DE MADERA, INCLUIDA MADERA
PARA CARBON VEGETAL 725 625 750 1.38 1.60 1.33CARBON VEGETAL DE MADERA 167TROZAS, ASERRAR Y CHAPAS
Tropicales 730 1.37Otras 700 800 1.43 1.25
MADERA PARA PASTA, ROLLIZA Y PARTIDA 675 650 750 1.48 1.54 1.33OTRAS MADERAS EN ROLLO INDUSTRIAL 750 700 800 1.33 1.43 1.25MADERA ASERRADA 550 700 1.82 1.43HOJAS DE CHAPA 750 1.33MADERA TERCIADA 650 1.54TABLEROS DE PARTICULAS 650 1.54DUROS 950 1.053TABLEROS DE FIBRA DE DENSIDAD MEDIA (MDF) 2TABLEROS FIBRA, AISLANTES 250 4
Productos y unidades Metros
cúbicosPies
cúbicos1 000 Pies
madererosStandard
(Petrograd)
MADERA EN ROLLO1 pie cúbico hoppus1 tonelada de 50 pies cúbicos hoppus
0.036051.8027
1.27363.66
1 cunit ,
1 cuerda 12.833.625
100128
1 estéreo 1 35.3151 fathom 6.1164 216
MADERA ASERRADA1 standard (Petrograd)
24.672 165 1.98 1
1 000 pies madereros/superficiales 2.36 83.33 1 0.5051 tonelada de 50 pies cúbicos 1.416 50 0.6 0.303
TABLEROS DE MADERA1 000 metros cuadrados (1 milímetro de espesor) 1 35.315 0.42381 000 pies cuadrados (1/8 de pulgada de espesor) 0.295 10.417 0.125
Productos y unidades Metros cúbicos Pies cúbicos
1 pulgada = 25.4 milímetros1 pie cuadrado = 0.0929 metro cuadrado1 pie cúbico = 0.02832 metro cúbico1 tonelada corta = 0.9072 tonelada métrica1 tonelada larga = 1.016 tonelada métrica

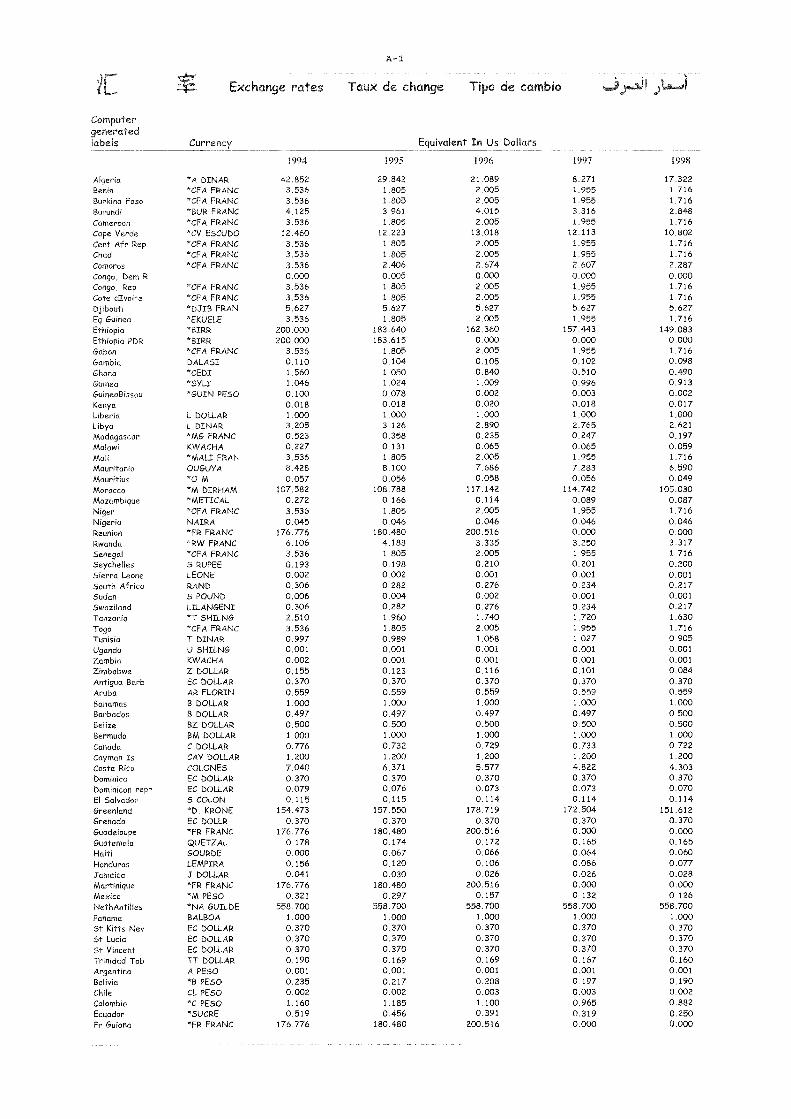
A-1
IC Exchange rates Taux de change Tipo de cambio
Computergeneratedlabels Currency Equivalent In Lis Dollars
1994 1995 1996 1997
Algeria 'A DINAR 42.852 29.842 21.089 8.271 17.322Benin *CFA FRANC 3.536 1.805 2.005 1.955 1,716Burkina Faso *CFA FRANC 3.536 1.805 2.005 1.955 1.716Burundi *BUR FRANC 4.125 3.961 4.015 3.316 2.848Cameroon *CFA FRANC 3.536 1.805 2.005 1.955 1.716Cape Verde *CV ESCUDO 12.460 12.223 13.018 12.113 10.802Cent Afr Rep *CFA FRANC 3.536 1.805 2.005 1.955 1.716Chad *CFA FRANC 3.536 1.805 2.005 1.955 1.716Comoros *CFA FRANC 3.536 2.406 2.674 2.607 2.287Congo, Dem R 0.000 0.005 0.000 0.000 0.000Congo, Rep *CFA FRANC 3.536 1.805 2.005 1.955 1.716Cote dIvoire *CFA FRANC 3.536 1.805 2.005 1.955 1.716Djibouti *DJIB FRAN 5.627 5.627 5.627 5.627 5.627Eq Guinea *EKUELE 3.536 1.805 2.005 1.955 1.716Ethiopia *BIRR 200.000 183.640 162.360 157.443 149.083Ethiopia PDR *BIRR 200.000 183.615 0.000 0.000 0.000Gabon 'CFA FRANC 3.536 1.805 2.005 1.955 1.716Gambia DALASI 0.110 0.104 0.105 0.102 0.098Ghana "CEDI 1.560 1.050 0.840 0.510 0.490Guineo *SYLI 1.046 1.024 1.009 0.996 0.913GuMeaBissau *GUIN PESO 0.100 0.078 0.002 0.003 0.002Kenya 0.018 0.018 0.020 0.018 0.017Liberia L DOLLAR 1.000 1.000 1.000 1.000 1.000Libya L DINAR 3.205 3.126 2.890 2.765 2.621Madagascar *MG FRANC 0.523 0.358 0.235 0.247 0.197Malawi KWACHA 0.227 0.131 0.065 0.065 0.059Mali "MALI FRAN 3.536 1.805 2.005 1.955 1,716Mauritania OUGUY A 8.428 8.100 7.686 7.283 6.590Mauritius *0 M 0.057 0.056 0.058 0.056 0.049Morocco *M DIRHAM 107.582 108.788 117.142 114.742 105.030Mozambique 'METICAL 0.272 0.166 0.114 0.089 0.087Niger *CFA FRANC 3.536 1.805 2.005 1.955 1.716Nigeria NAIRA 0.045 0.046 0.046 0.046 0.046Reunion *FR FRANC 176.776 180.480 200.516 0.000 0.000Rwanda "RW FRANC 6.106 4.183 3.335 3.250 3.317Senegal *CFA FRANC 3.536 1.805 2.005 1.955 1.716Seychelles 5 RUPEE 0.193 0.198 0.210 0.201 0.200Sierra Leone LEONE 0.002 0.002 0.001 0.001 0.001South Africa RAND 0.306 0.282 0.276 0.234 0.217Sudan 5 POUND 0.006 0.004 0.002 0.001 0.001Swaziland LILANGENI 0.306 0.282 0.276 0.234 0.217Tanzania *T SHILNG 2.510 1.960 1.740 1.720 1.630Togo *CFA FRANC 3.536 1.805 2.005 1.955 1.716Tunisia T DINAR 0.997 0.989 1.058 1.027 0.905Uganda U SHILNG 0.001 0.001 0.001 0.001 0.001Zambia KW ACHA 0.002 0.001 0.001 0.001 0.001Zimbabwe Z DOLLAR 0.155 0.123 0.116 0.101 0.084Antigua Barb EC DOLLAR 0.370 0.370 0.370 0.370 0.370Aruba AR FLORIN 0.559 0.559 0.559 0.559 0.559Bahamas B DOLLAR 1.000 1.000 1.000 1.000 1.000Barbados B DOLLAR 0.497 0.497 0.497 0.497 0.500Belize BZ DOLLAR 0.500 0.500 0.500 0.500 0.500Bermuda BM DOLLAR 1.000 1.000 1.000 1.000 1.000Canada C DOLLAR 0.776 0.732 0.729 0.733 0.722Cayman Is CAY DOLLAR 1.200 1.200 1.200 1.200 1.200Costa Rica COLONES 7.040 6.371 5.577 4.822 4.303Dominica EC DOLLAR 0.370 0.370 0.370 0.370 0.370Dominican repr. EC DOLLAR 0.079 0.076 0.073 0.073 0.070El Salvador 5 COLON 0.115 0.115 0.114 0.114 0.114Greenland *D. KRONE 154.473 157.550 178.719 172,504 151.612Grenada EC DOLLR 0.370 0.370 0.370 0.370 0.370Guadeloupe *FR FRANC 176.776 180,480 200.516 0.000 0.000Guatemala QUETZAL 0.178 0.174 0.172 0.165 0.165Haiti GOURDE 0.000 0.067 0.066 0,064 0.060Honduras LEMPIRA 0.156 0.120 0.106 0.086 0.077Jamaica J DOLLAR 0.041 0.030 0.026 0.026 0.028Martinique *FR FRANC 176.776 180.480 200.516 0.000 0.000Mexico CM PESO 0.321 0.297 0.157 0.132 0.126NethAntilles "NA GUILDE 558.700 558.700 558.700 558.700 558.700Panama BALBOA 1.000 1.000 1.000 1.000 1,000St Kitts Nev EC DOLLAR 0.370 0.370 0.370 0.370 0.370St Lucio EC DOLLAR 0.370 0.370 0.370 0.370 0.370St Vincent EC DOLLAR 0.370 0,370 0.370 0.370 0.370Trinidad Tob TT DOLLAR 0.190 0.169 0,169 0,167 0.160Argentina A PESO 0.001 0.001 0.001 0.001 0.001Bolivia *B PESO 0.235 0.217 0.208 0.197 0,190Chile CL PESO 0.002 0.002 0.003 0.003 0.002Colombia "C PESO 1.160 1.185 1.100 0.965 0.882Ecuador *SUCRE 0.519 0.456 0.391 0.319 0.250Fr Guiana "FR FRANC 176.776 180.480 200.516 0.000 0.000
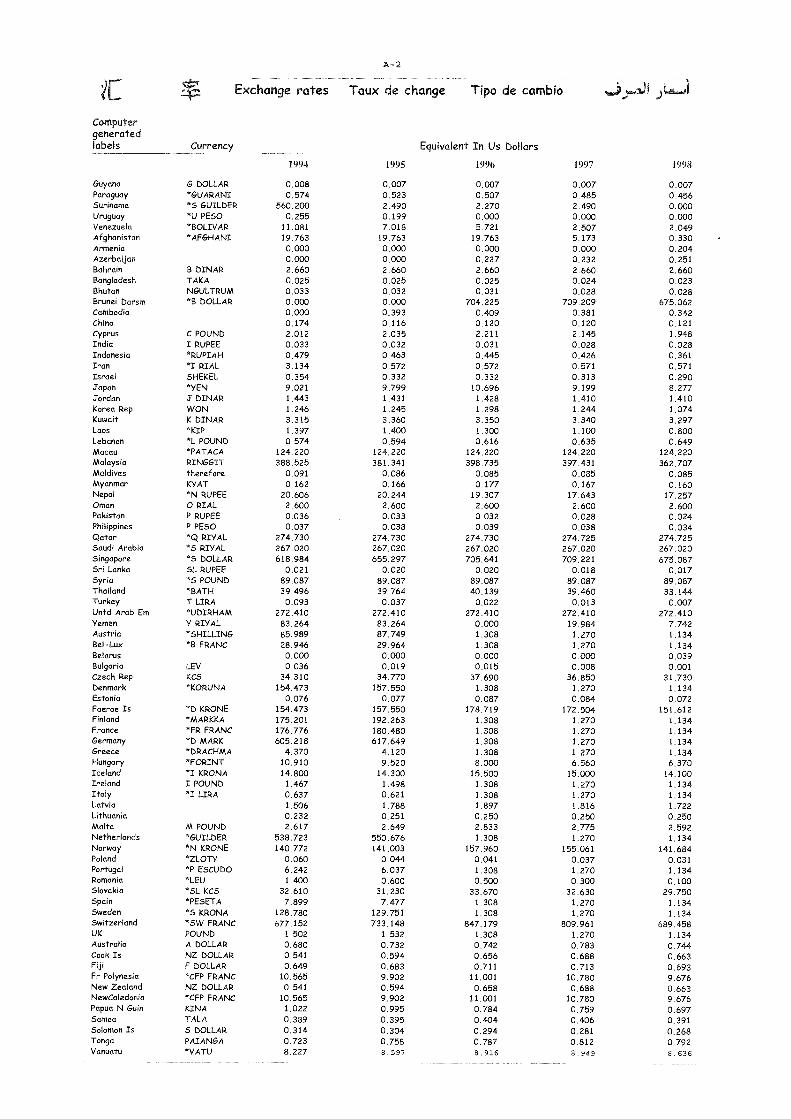
A-2
Computergeneratedlabels Currency Equivalent In Us DoMars
1994 1995 1996 1997 1998
Guyana G DOLLAR 0.008 0.007 0.007 0.007 0.007Paraguay *GUARANI 0.574 0.523 0.507 0.485 0.456Suriname *5 GUILDER 560.200 2.490 2.270 2.490 0.000Uruguay *U PESO 0.255 0.199 0.000 0.000 0.000Venezuela *BOLIVAR 11.081 7.018 5.721 2.507 2.049Afghanistan *AFGHANI 19.763 19.763 19.763 5.173 0.330Armenia 0.000 0.000 0.000 0.000 0.204Azerbaijan 0.000 0.000 0.227 0.232 0.251Bahrain B DINAR 2.660 2.660 2.660 2.660 2.660Bangladesh TAKA 0.025 0.025 0.025 0.024 0.023Bhutan NGULTRUM 0.033 0.032 0.031 0.028 0.025Brunei Darsm *13 DOLLAR 0.000 0.000 704.225 709.209 675.062Cambodia 0.000 0.393 0.409 0.381 0.342China 0.174 0.116 0.120 0.120 0.121Cyprus C POUND 2.012 2.035 2.211 2.145 1.948India I RUPEE 0.033 0.032 0.031 0.028 0.028Indonesia *RUPIAH 0.479 0.463 0.445 0.426 0.361Iran *I RIAL 3.134 0.572 0.572 0.571 0.571Israel SHEKEL 0.354 0.332 0.332 0.313 0.290Japan *YEN 9.021 9.799 10.696 9.199 8.277Jordan J DINAR 1.443 1.431 1.428 1.410 1.410Korea Rep WON 1.246 1.245 1.298 1.244 1.074Kuwait K DINAR 3.315 3.360 3.350 3.340 3.297Laos *KIP 1.397 1.400 1.300 1.100 0.800Lebanon *L POUND 0.574 0.594 0.616 0.635 0.649Macau *PATACA 124.220 124.220 124.220 124.220 124.220Malaysia RINGGIT 388.525 381.341 398.735 397.431 362.707Maldives therefore 0.091 0.086 0.085 0.085 0.085Myanmar KYAT 0.162 0.166 0.177 0.167 0.160Nepal *N RUPEE 20.606 20.244 19.307 17.643 17.257Oman 0 RIAL 2.600 2.600 2.600 2.600 2.600Pakistan P RUPEE 0.036 0.033 0.032 0.028 0.024Philippines P PESO 0.037 0.038 0.039 0.038 0.034Qatar *Q RIVAL 274.730 274.730 274.730 274.725 274.725Saudi Arabia *5 RIVAL 267.020 267.020 267.020 267.020 267.020Singapore *5 DOLLAR 618.984 655.297 705.641 709.221 675.087Sri Lanka SL RUPEE 0.021 0.020 0.020 0.018 0.017SyHa '5 POUND 89.087 89.087 89.087 89.087 89.087Thafland *BATH 39.496 39.764 40.139 39.460 33.144Turkey T LIRA 0.093 0.037 0.022 0.013 0.007Untd Arab Era UDIRHAM 272.410 272.410 272.410 272.410 272.410Yemen Y RIVAL 83.264 83.264 0.000 19.984 7.742Austria *SHILLING 85.989 87.749 1.308 1.270 1.134Bel-Lux *13 FRANC 28.946 29.964 1.308 1.270 1.134Belarus 0.000 0.000 0.000 0.000 0.039Bulgaria LEV 0.036 0.019 0.015 0.008 0.001Czech Rep KCS 34.310 34.770 37.690 36.850 31.730Denmark *KORUNA 154.473 157.550 1.308 1.270 1.134Estonia 0.076 0.077 0.087 0.084 0.072Faeroe Is *D KRONE 154.473 157.550 178.719 172.504 151.612Finland *MARKKA 175.201 192.263 1.308 1.270 1.134France *FR FRANC 176.776 180.480 1.308 1.270 1.134Germany *D MARK 605.218 617.649 1.308 1.270 1.134Greece *DRACHMA 4.370 4.120 1.308 1.270 1.134Hungary *FORINT 10.910 9.520 8.000 6.560 6.370Iceland *I KRONA 14.800 14.300 15.500 15.000 14.100Ireland I POUND 1.467 1.498 1.308 1.270 1.134Italy *I LIRA 0.637 0.621 1.308 1.270 1.134Latvia 1.506 1.788 1.897 1.816 1.722Lithuania 0.232 0.251 0.250 0.250 0.250Malta M POUND 2.617 2.649 2.833 2.775 2.592Netherlands *GUILDER 538.723 550.676 1.308 1.270 1.134Norway *N KRONE 140.772 141.003 157.960 155.061 141.684Poland *ZLOTY 0.060 0.044 0.041 0.037 0.031Portugal *P ESCUDO 6.242 6.037 1.308 1.270 1.134Romania *LEU 1.400 0.600 0.500 0.300 0.100Slovakia *SL KCS 32.610 31.230 33.670 32.630 29.750Spain *PESETA 7.899 7.477 1.308 1.270 1.134Sweden *5 KRONA 128.780 129.751 1.308 1.270 1.134Switzerland "SW FRANC 677.152 733.148 847.179 809.961 689.458UK POUND 1.502 1.532 1.308 1.270 1.134Australia A DOLLAR 0.680 0.732 0.742 0.783 0.744Cook Is NZ DOLLAR 0.541 0.594 0.656 0.688 0.663Fiji F DOLLAR 0.649 0.683 0.711 0.713 0.693Fr Polynesia *CFP FRANC 10.565 9.902 11.001 10.780 9.676New Zealand NZ DOLLAR 0.541 0.594 0.658 0.688 0.663NewCaledonia *CFP FRANC 10.565 9.902 11.001 10.780 9.676Papua N Guin KINA 1.022 0.995 0.784 0.759 0.697Samoa TALA 0.389 0.395 0.404 0.406 0.391Solomon's 5 DOLLAR 0.314 0.304 0.294 0.281 0.268Tonga PAIANGA 0.723 0.758 0.787 0.812 0.792Vanuatu *VATU 8.227 8.597 8.916 8.949 8.636
iC Exchange rates Taux de change Tipo de cambio
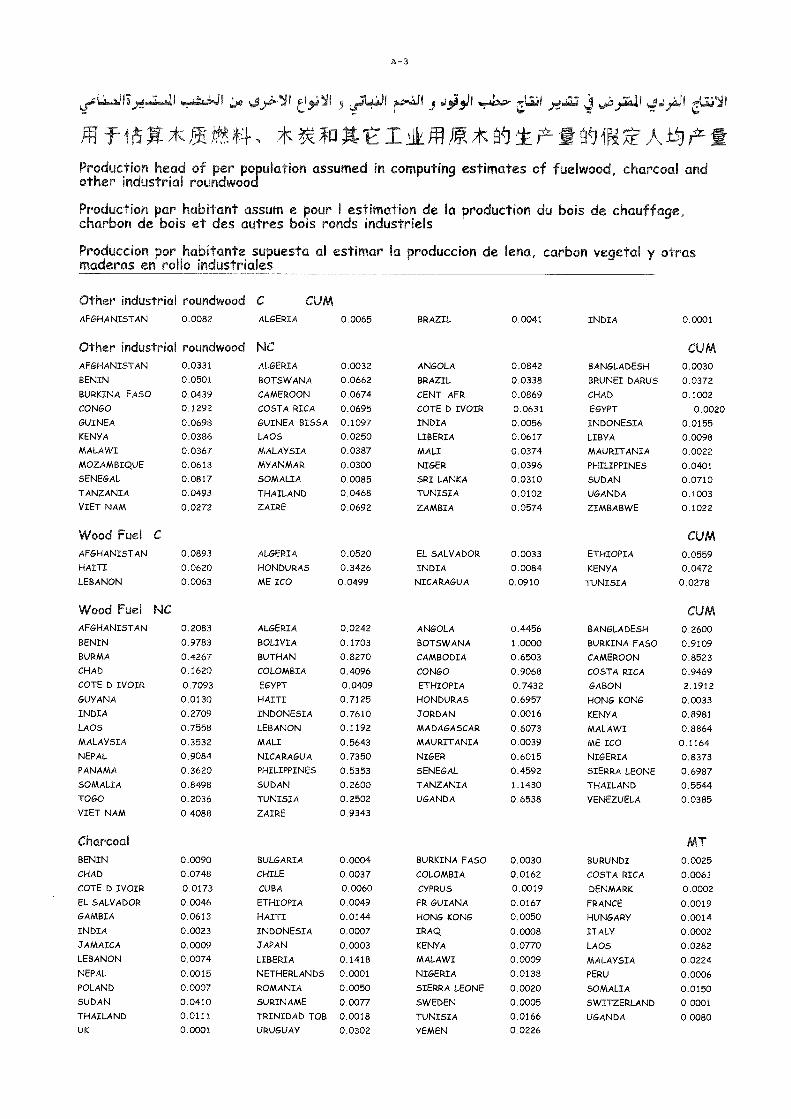
fr).1 '?!? 44
Production head of per population assumed in computing estimates of fuelwood, charcoal andother industrial roundwood
Production par habitant assum e pour I estimation de la production du bois de chauffage,charbon de IDois et des autres bois ronds industriels
Produccion por habitante supuesta al estimar la produccion de lena, carbon vegetal y otrasmaderas en rollo industriales
A-3
bQ ti.0.11 as 3 49.,/1 j , z1.1:61
043 _ "e"-2 047iFi-.)\±-t)/'
Other industrial roundwood CUMAFGHANISTAN 0.0082 ALGERIA
Other industrial roundwood NC
0.0065 BRAZIL 0.0041 INDIA 0.0001
CUMAFGHANISTAN 0.0331 ALGERIA 0.0032 ANGOLA 0.0842 BANGLADESH 0.0030BENIN 0.0501 BOTSWANA 0.0662 BRAZIL 0.0338 BRUNEI DARUS 0.0372BURKINA FASO 0.0439 CAMEROON 0.0674 CENT AFR 0.0869 CHAD 0.1002CONGO 0.1292 COSTA RICA 0.0695 COTE D IVOIR 0.0631 EGYPT 0.0020GUINEA 0.0698 GUINEA BISSA 0.1097 INDIA 0.0056 INDONESIA 0.0155KENYA 0.0386 LAOS 0.0250 LIBERIA 0.0617 LIBYA 0.0098MALAWI 0.0367 MALAYSIA 0.0387 MALI 0.0374 MAURITANIA 0.0022MOZAMBIQUE 0.0618 MYANMAR 0.0300 NIGER 0.0396 PHILIPPINES 0.0401SENEGAL 0.0817 SOMALIA 0.0085 SRI LANKA 0.0310 SUDAN 0.0710TANZANIA 0.0493 THAILAND 0.0468 TUNISIA 0.0102 UGANDA 0.1003VIET NAM 0.0272 ZAIRE 0.0692 ZAMBIA 0.0574 ZIMBABWE 0.1022
Wood Fuel C CUMAFGHANISTAN 0.0893 ALGERIA 0.0520 EL SALVADOR 0.0033 ETHIOPIA 0.0559HAITI 0.0620 HONDURAS 0.3426 INDIA 0.0084 KENYA 0.0472LEBA NON 0.0063 ME ICO 0.0499 NICARAGUA 0.0910 TUNISIA 0.0278
Wood Fuel NC CUMAFGHANISTAN 0.2083 ALGERIA 0.0242 ANGOLA 0.4456 BANGLADESH 0.2600BENIN 0.9783 BOLIVIA 0.1703 BOTSWANA 1.0000 BURKINA FASO 0.9109BURMA 0.4267 BUTHAN 0.8270 CAMBODIA 0.6503 CAMEROON 0.8523CHAD 0.1620 COLOMBIA 0.4096 CONGO 0.9068 COSTA RICA 0.9469COTE D IVOIR 0.7093 EGYPT 0.0409 ETHIOPIA 0.7432 GABON 2.1912GUYANA 0.0130 HAITI 0.7125 HONDURAS 0.6957 HONG KONG 0.0033INDIA 0.2709 INDONESIA 0.7610 JORDAN 0.0016 KENYA 0.8981LAOS 0.7558 LEBANON 0.1192 MADAGASCAR 0.6073 MALAWI 0.8864MALAYSIA 0.3532 MALI 0.5643 MAURITANIA 0.0039 ME ICO 0.1164NEPAL 0.9084 NICARAGUA 0.7350 NIGER 0.6015 NIGERIA 0.8373PANAMA 0.3620 PHILIPPINES 0.5353 SENEGAL 0.4592 SIERRA LEONE 0.6987SOMALIA 0.8498 SUDAN 0.2600 TANZANIA 1.1430 THAILAND 0.5544TOGO 0.2036 TUNISIA 0.2502 UGANDA 0.6538 VENEZUELA 0.0385VIET NAM 0.4088 ZAIRE 0.9343
Charcoal MTBENIN 0.0090 BULGARIA 0.0004 BURKINA FASO 0.0030 BURUNDI 0.0025CHAD 0.0748 CHILE 0.0037 COLOMBIA 0.0162 COSTA RICA 0.0061COTE D IVOIR 0.0173 CUBA 0.0060 CYPRUS 0.0019 DENMARK 0.0002EL SALVADOR 0.0046 ETHIOPIA 0.0049 FR GUIANA 0.0167 FRANCE 0.0019GAMBIA 0.0613 HAITI 0.0144 HONG KONG 0.0050 HUNGARY 0.0014INDIA 0.0023 INDONESIA 0.0007 IRAQ 0.0008 ITALY 0.0002JAMAICA 0.0009 JAPAN 0.0003 KENYA 0.0770 LAOS 0.0282LEBANON 0.0074 LIBERIA 0.1418 MALAWI 0.0009 MALAYSIA 0.0224NEPAL 0.0015 NETHERLANDS 0.0001 NIGERIA 0.0138 PERU 0.0006POLAND 0.0007 ROMANIA 0.0050 SIERRA LEONE 0.0020 SOMALIA 0.0150SUDAN 0.0410 SURINAME 0.0077 SWEDEN 0.0005 SWITZERLAND 0.0001THAILAND 0.0111 TRINIDAD TOB 0.0018 TUNISIA 0.0166 UGANDA 0.0080UK 0.0001 URUGUAY 0.0302 YEMEN 0_0226
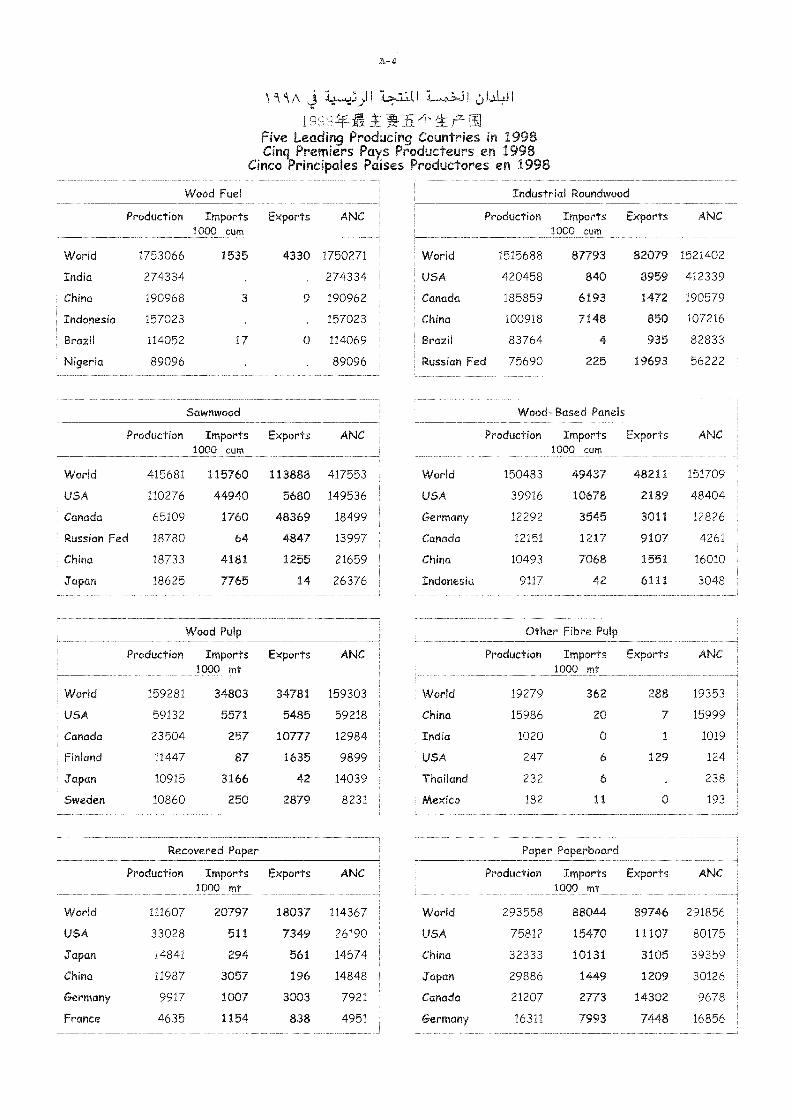
Wood Fuel
Exports ANC
48211
2189
3011
9107
1551
6111
151709
48404
12826
4261
16010
3048
Recovered Paper
Production Imports Exports ANC1000 mt
c't `' A j
15.)(e/f.Z.T-5/.1"4rFive Leading Producing Countries in 1998Cinq Premiers Pays Producteurs en 1998
Cinco Principales Paises Productores en 1998
A- 4.
World
USA
Canada
China
Brazil
Russian
World
USA
China
Japan
Production Imports Exports ANC1000 cum
1515688
420458
185859
100918
83764
Fed 75690
Industrial Roundwood
1521402
412339
190579
107216
82833
56222
Paper Paperboard
Production Imports Exports ANC1000 mt
Production Imports1000 cum
Exports ANC
World 1753066 1535 4330 1750271
India 274334 274334
China 190968 9 190962
Indonesia 157023 157023
Brazil 114052 17 0 114069
Nigeria 89096 89096
Sawnwood
Production Imports Exports ANC1000 cum
World 415681 115760 113888 417553
USA 110276 44940 5680 149536
Canada 65109 1760 48369 18499
Russian Fed 18780 64 4847 13997
China 18733 4181 1255 21659
Japan 18625 7765 14 26376
Wood Pulp
Production Imports Exports ANC1000 mt
World 159281 34803 34781 159303
USA 59132 5571 5485 59218
Canada 23504 257 10777 12984
Finland 11447 87 1635 9899
Japan 10915 3166 42 14039
Sweden 10860 250 2879 8231
World 111607 20797 18037 114367
USA 33028 511 7349 26190
Japan 14841 294 561 14574
China 11987 3057 196 14848
Germany 9917 1007 3003 7921
France 4635 1154 838 4951
Canada 21207 2773 14302 9678
Germany 16311 7993 7448 16856
293558 88044 89746 291856
75812 15470 11107 80175
32333 10131 3105 39359
29886 1449 1209 30126
Other Fibre Pulp
Production Imports1000 mt
World 19279 362
China 15986 20
India 1020 0
USA 247 6
Thailand 232 6
Mexico 182 11
Wood-Based
Production
Panels
Imports000 cum
World 150483 49437
USA 39916 10678
Germany 12292 3545
Canada 12151 1217
China 10493 7068
Indonesia 9117 42
87793
840
6193
7148
82079
8959
1472
850
4 935
225 19693
Exports ANC
288 19353
7 15999
1 1019
129 124
238
0 193
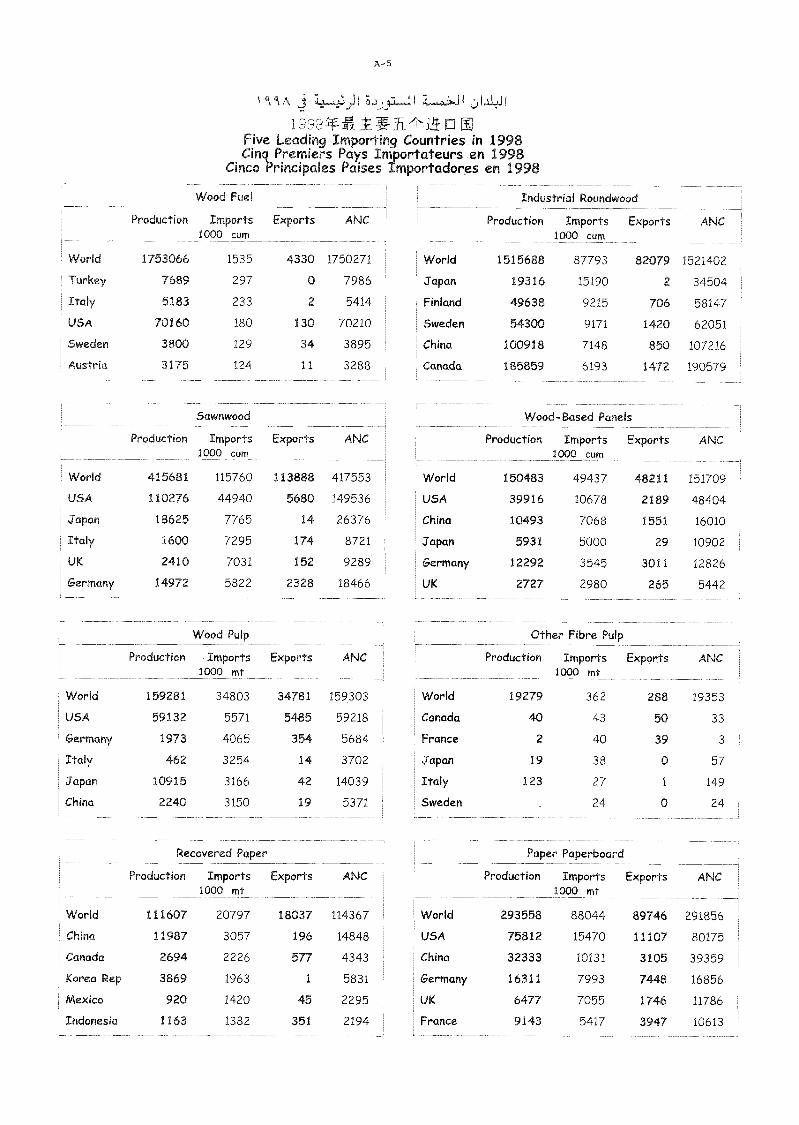
A-5
`\ 9 A j ',JIU 31.4J1
19`,:',.?*Five Leading Importing Countries in 1998Cinq_ Premiers Pays Importateurs en 1998
Cinco Principales Paises Importadores en 1998
Wood Fuel Industrial Roundwood
Production Imports Exports ANC Production Imports Exports ANC1000 cum 1000 cum
World 1753066 1535 4330 1750271 World 1515688 87793 82079 1521402
Turkey 7689 297 0 7986 Japan 19316 15190 2 34504
Italy 5183 233 2 5414 Finland 49638 9215 706 58147
USA 70160 180 130 70210 Sweden 54300 9171 1420 62051
Sweden 3800 129 34 3895 China 100918 7148 850 107216
Austria 3175 124 11 3288 Canada 185859 6193 1472 190579
Sawnwood Wood-Based Panels
Production Imports Exports ANC Production Imports Exports ANC1000 cum 1000 cum
World 415681 115760 113888 417553 World 150483 49437 48211 151709
USA 110276 44940 5680 149536 USA 39916 10678 2189 48404
Japan 18625 7765 14 26376 China 10493 7068 1551 16010
Italy 1600 7295 174 8721 Japan 5931 5000 29 10902
UK 2410 7031 152 9289 Germany 12292 3545 3011 12826
Germany 14972 5822 2328 18466 UK 2727 2980 265 5442
Wood Pulp Other Fibre Pulp
Production Imports Exports ANC Production Imports Exports ANC1000 mt 1000 mt
World 159281 34803 34781 159303 World 19279 362 288 19353
USA 59132 5571 5485 59218 Canada 40 43 50 33
Germany 1973 4065 354 5684 France 2 40 39 3
Italy 462 3254 14 3702 Japan 19 38 o 57
Japan 10915 3166 42 14039 Italy 123 27 1 149
China 2240 3150 19 5371 Sweden 24 o 24
Recovered Paper Paper Paperboard
Production Imports Exports ANC Production Imports Exports ANC1000 mt 1000 mt
World 111607 20797 18037 114367 World 293558 88044 89746 291856
China 11987 3057 196 14848 USA 75812 15470 11107 80175
Canada 2694 2226 577 4343 China 32333 10131 3105 39359
Korea Rep 3869 1963 1 5831 Germany 16311 7993 7448 16856
Mexico 920 1420 45 2295 UK 6477 7055 1746 11786
Indonesia 1163 1382 351 2194 France 9143 5417 3947 10613
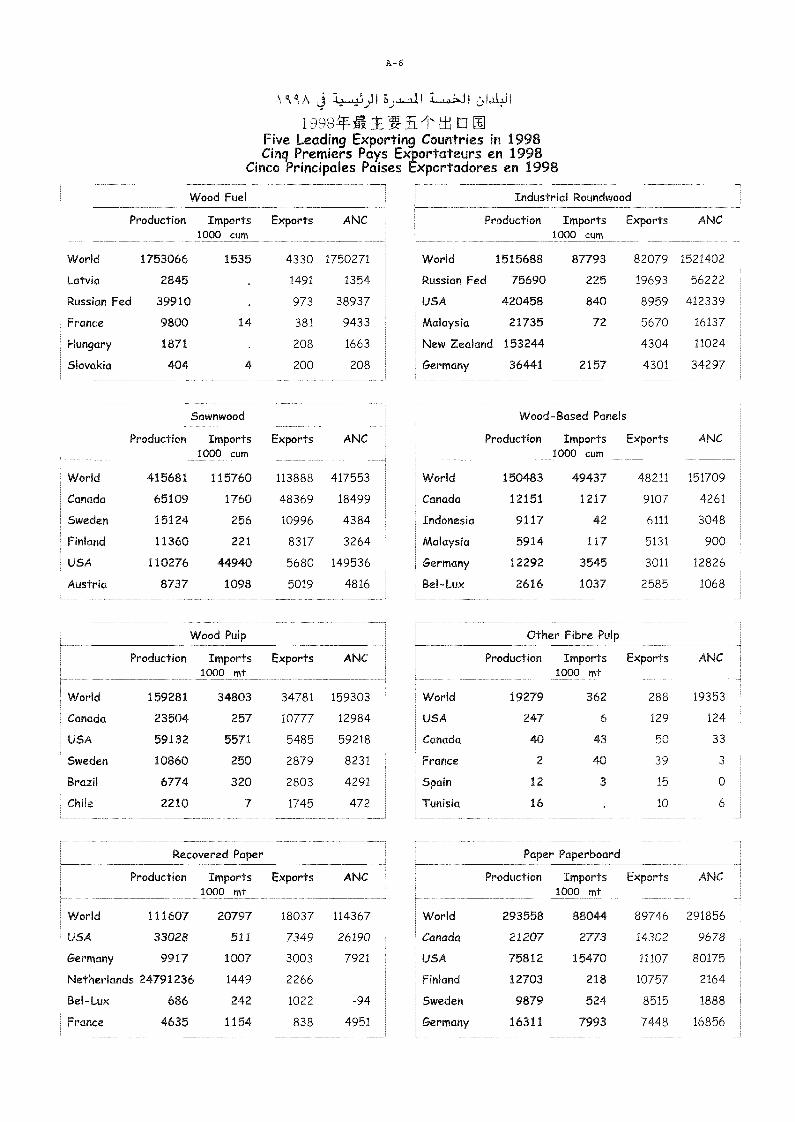
Sawnwood
\0'1 A j I j I 1.11,,J I
1998if in1R1htrFive Leading Exporting Countries in 1998Cinc[ Premiers Pays Exportateurs en 1998
Cinco Principales Paises Exportadores en 1998
A-6
World
Canada
USA
Finland
Sweden
Germany
Industrial Roundwood
Production Imports1000 cum
Wood-Based Panels
Production Imports1000 mt
Paper Paperboard
Exports ANC
World 415681 115760 113888 417553
Canada 65109 1760 48369 18499
Sweden 15124 256 10996 4384
Finland 11360 221 8317 3264
USA 110276 44940 5680 149536
Austria 8737 1098 5019 4816
Wood Pulp
Production Importsmt
Exports ANC
World 159281 34803 34781 159303
Canada 23504 257 10777 12984
USA 59132 5571 5485 59218
Sweden 10860 250 2879 8231
Brazil 6774 320 2803 4291
Chile 2210 7 1745 472
Recovered Paper
Production Imports Exports ANC1000 mt
World 111607 20797 18037 114367
USA 33028 511 7349 26190
Germany 9917 1007 3003 7921
Netherlands 24791236 1449 2266
Bel -Lux 686 242 1022 -94
France 4635 1154 838 4951
World 1753066 1535 4330 1750271
Latvia 2845 1491 1354
Russian Fed 39910 973 38937
France 9800 14 381 9433
Hungary 1871 208 1663
Slovakia 404 4 200 208
293558 88 89746 291856
21207 2773 14302 9678
75812 15470 11107 80175
12703 218 10757 2164
9879 524 8515 1888
16311 7993 7448 16856
World 1515688 87793
Russian Fed 75690 225
USA 420458 840
Malaysia 21735 72
New Zealand 153244
Germany 36441 2157
Production
World 150483
Canada 12151
Indonesia 9117
Malaysia 5914
Germany 12292
Bel-Lux 2616
Exports ANC
82079 1521402
19693 56222
8959 412339
5670 16137
4304 11024
4301 34297
Exports ANC
48211 151709
9107 4261
6111 3048
5131 900
3011 12826
2585 1068
Exports ANC
288 19353
129 124
50 33
39 3
15
10 6
Other Fibre Pulp
Production Imports1000 mt
World 19279 362
USA 247 6
Canada 40 43
France 2 40
Spain 12 3
Tunisia 16
Production Imports Exports ANC1000 cum
Wood Fuel
Production Imports Exports ANC1000 cum
Imports1000 cum
49437
1217
42
117
3545
1037
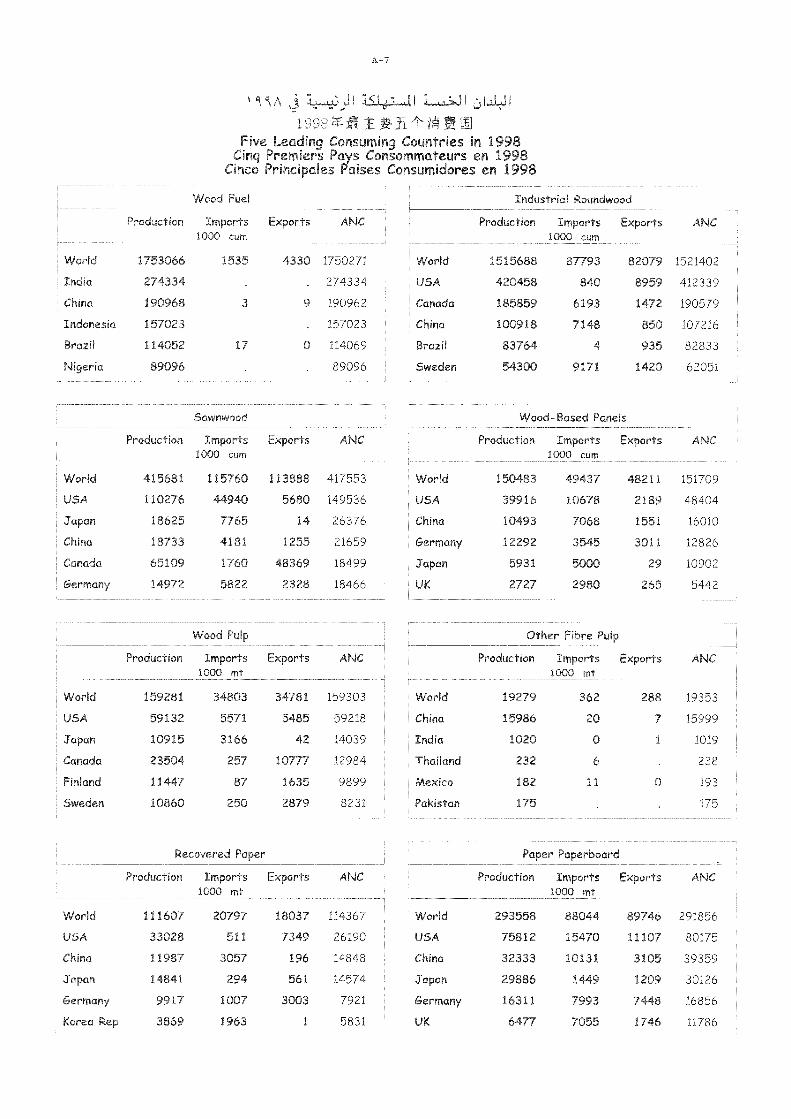
A j d 1LJI 1,..4 I
---.e-tf-E^mTiftEFive Leadirig Consuming Countries in 1998
Cinq PremkTs Pays Consommateurs en 1998Cinco ;'"rincipoles Poises Consumidores en 1998
A - 7
Industrial Roundwood
Wood-Based Panels
Wood Fuel
Production Tmports Exports ANC1000 cum
World 1753066 1535 4330 1750271
India 274334 274334
China 190968 3 9 190962
Indonesia 157023 157023
Brazil 114052 17 0 114069
Nigeria 89096 89096
Sawnwood
Production Imports Exports ANC1000 cum
World 415681 115760 113888 417553
USA 110276 44940 5680 149536
Japan 18625 7765 14 26376
China 18733 4181 1255 21659
Canada 65109 1760 48369 18499
Germany 14972 5822 2328 18466
Wood Pulp
Production imports Exports ANC1000 mt
World 159281 34803 34781 159303
USA 59132 5571 5485 59218
Japan 10915 3166 42 14039
Canada 23504 257 10777 12984
Finland 11447 87 1635 9899
Sweden 10860 250 2879 8231
Recovered Paper
Production Imports E 1.1orts ANC1000 mt
World 111607 20797 18037 114367
USA 33028 511 7349 26190
China 11987 3057 196 14848
Japan 14841 294 561 14574
Germany 9917 1007 3003 7921
Korea Rep 3869 1963 1 5831
Production .7 ports,-- rum
Exports ANC
World 150483 9437 48211 151709
USA 39916 10678 2189 48404
China 10493 7068 1551 16010
Germany 12292 3545 3011 12826
Japan 5931 5000 29 10902
UK 2727 2980 265 5442
Other Fibre Pulp
Production Impor ts Exports ANC1000 mt
World 19279 362 288 19353
China 15986 20 7 15999
India 1020 0 1 1019
Thailand 232 6 238
Mexico 182 11 0 193
Pakistan 175 175
Paper Paperboard
Production Imports Exports APle1000 mt
World 293558 88044 89746 291356
USA 75812 15470 11107 80175
China 32333 10131 3105 39359
Japan 29886 1449 1209 30126
Germany 16311 7993 7448 16856
UK 6477 7055 1746 11786
Production Iinports1000 cum
Exports ANC
World 1515688 87793 82079 1521402
USA 420..i 58 8959 412339
Canada 6193 1472 190579
China 100918 7148 850 107216
Brazil 83764 4 935 82833
Sweden 54300 9171 1420 62051

Idt"
ROUNDWCOD
BOIS RONE)
MADERA EN ROLLO
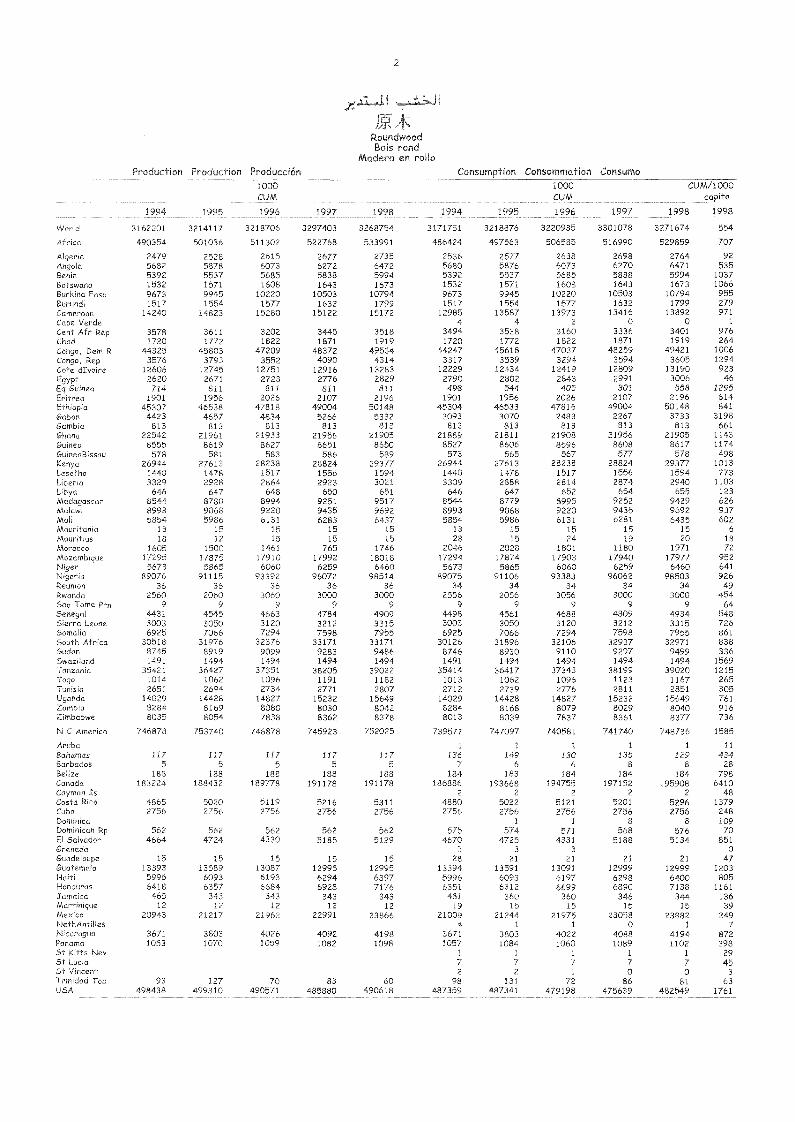
2
RoundwoodBois rond
Madera en rolloProduction Production Producción Consumption Consommation Consumo
1994 1995
1000CUM
1996 1997 1998 1994 1995
1000CUM
1996 1997
CUM/1000capita
1998 1998
VVorld 31u2201 3214117 3218706 3297403 3268754 3171751 3218876 3220935 3301078 3271674 554
Africa 490354 501036 511302 522768 533991 486424 497563 506585 516990 529859 707
Algeria 9 2528 2615 2677 2735 2536 2577 2638 2698 2764 92Angola 5878 6073 6272 6472 5680 5876 6073 6270 6471 535Benin 53ì.2 5537 5685 5838 5994 5392 5537 5685 5838 5994 1037Botswana 2 1571 1608 1643 1673 1532 1571 1608 1643 1673 1066Burkina Faso 9673 9945 10220 10503 10794 9673 9945 10220 10503 10794 955Burundi 1517 1554 1577 1632 1799 1517 1554 1577 1632 1799 279Cameroon 14240 14823 15280 15122 15172 12985 13587 13973 13416 13892 971Cape Verde 4 4 2 0 0 1
Cent Afr Rep 3578 3611 3202 3445 3518 3494 3538 3160 3336 3401 976Chad 170 1772 1822 1871 1919 1720 1772 1822 1871 1919 264Congo, Dem R 44325 45803 47209 48372 49534 44247 45618 47037 48259 49421 1006Congo, Rep 3576 3793 3552 4090 4314 3317 3539 3294 3594 3605 1294Cote dIvoire 12606 12745 12751 12916 13283 12229 12434 12419 12809 13190 923Egypt 2620 2671 2723 2776 2829 2790 2802 2843 2991 3006 46Eq Guinea 714 811 811 811 811 498 544 405 301 558 1295Eritrea 1901 1956 2026 2107 2196 1901 1956 2026 2107 2196 614Ethiopia 45307 46538 47818 49004 50148 45304 46533 47816 49004 50148 841Gabon 4423 4657 4834 5266 5332 3093 3070 2483 2267 3733 3198Gambia 813 813 813 813 813 813 813 813 813 813 661Ghana 22512 21961 21933 21956 21905 21889 21811 21908 21956 21905 1143Guinea 8505 8619 8627 8651 8650 8527 8606 8596 8608 8617 1174GuineaBissau 578 581 583 586 589 573 565 567 577 578 498Kenya 26,214 27613 28238 28824 29377 26944 27613 28238 28824 29377 1013Lesotho 1440 1478 1517 1556 1594 1440 1478 1517 1556 1594 773Liberia 3329 2928 2864 2923 3021 3309 2888 2814 2874 2940 1103Libya 646 647 648 650 651 646 647 652 654 655 123modagascar 8544 8780 8994 9251 9517 8544 8779 8995 9252 9429 626Malawi 8993 9068 9220 9435 9692 8993 9068 9220 9435 9692 937Muh 5854 5986 6131 6283 6437 5854 5986 6131 6281 6435 602bluurltania 13 15 15 15 15 13 15 15 15 15 6
Mauritius 18 12 15 15 15 28 15 24 19 20 18Morocco 1605 1500 1461 765 1746 2046 2028 1801 1180 1971 72Mozambique 17295 17875 17910 17992 18018 17294 17874 17903 17940 17977 952Niger 5b-". 5865 6060 6259 6460 5673 5865 6060 6259 6460 641Nigeria 89078 91115 93392 96072 98514 89075 91106 93383 96062 98503 926Reunion 36 36 36 36 36 34 34 34 34 34 49Rwanda 2560 2060 3060 3000 3000 2556 2056 3056 3000 3000 454Sao Tome Pm n 9 o 9 9 9 9 9 9 9 9 64Senegal 4431 4545 4663 4784 4909 4498 4561 4688 4809 4934 548Sierra Leone 3003 3050 3120 3212 3315 3003 3050 3120 3212 3315 726Somalia 6925 7066 7294 7598 7955 6925 7066 7294 7598 7955 861South Africa 30518 311..176 32376 33171 33171 30126 31896 32106 32937 32971 838Sudan 8745 89]5 9099 9283 9486 8746 8930 9110 9297 9499 336Swaziland 1491 1494 1494 1494 1494 1491 1494 1494 1494 1494 1569Tanzania 35421 36427 37351 38205 39022 35414 36417 37343 38199 39020 1215Togo 1014 i083 1096 1191 1182 1013 1062 1096 1123 1167 265Tunisia 2651 2644 2734 2771 2807 2712 2739 2776 2811 2851 305Uganda 14029 14428 14827 15232 15649 14029 14428 14827 15232 15649 761Zambia 8284 5169 8080 8030 8042 8284 8168 8079 8029 8040 916Zimbabwe 8035 8051 7838 8362 8378 8013 8039 7837 8361 8377 736
N C America 746878 753740 746878 745923 752025 739577 747097 740581 741740 748736 1585
Aruba 1 1 1 1 1 11Bahamas 117 117 117 117 117 136 149 130 135 129 434Barbados 5 5 5 5 5 7 6 6 8 8 28Belize 188 178 188 188 188 184 183 184 184 184 798Canada 183224 188432 189778 191178 191178 186886 193668 194755 197152 195908 6410Cayman Is 2 2 2 2 2 48Costa Rica 4865 5020 5119 5216 5311 4880 5022 5121 5201 5296 1379Cuba 2756 2756 2756 2756 2756 2756 2756 2756 2756 2756 248Dominica 1 1 8 8 109Dominican Rp 562 562 562 562 562 575 574 571 568 576 70El Salvador 4664 4724 4330 5185 5129 4670 4725 4331 5188 5134 851Grenada 3 3 3 0Guadeloupe 15 15 15 15 15 28 21 21 21 21 47Guatemala 13393 13589 13087 12995 12995 13394 13591 13091 12999 12999 1203Haiti 5996 6093 6193 6294 6397 5996 6093 6197 6298 6400 805Honduras 6418 6357 6684 6928 7176 6351 6312 6699 6890 7138 1161Jamaica 465 343 343 343 343 431 360 360 346 344 136Martinique 12 12 12 12 12 19 15 15 15 15 39Mexico 20943 21217 21962 22991 23866 21009 21244 21975 23058 23882 249NethAntilles 4 1 1 0 1 7Nicaragua 3671 3803 4026 4092 4198 30/1 3803 4022 4088 4194 872Panama 1053 1070 1059 1082 1098 1037 1084 1060 1089 1102 398St Kitts Nev 1 1 1 1 1 29St Lucia 7 7 7 7 7 4551 ,..iitr 2 2 1 0 0 3Trmidad Tob 93 127 70 83 60 98 131 72 86 81 631)5 i 498438 499310 490571 485880 490618 487359 487341 479198 475639 482549 1761
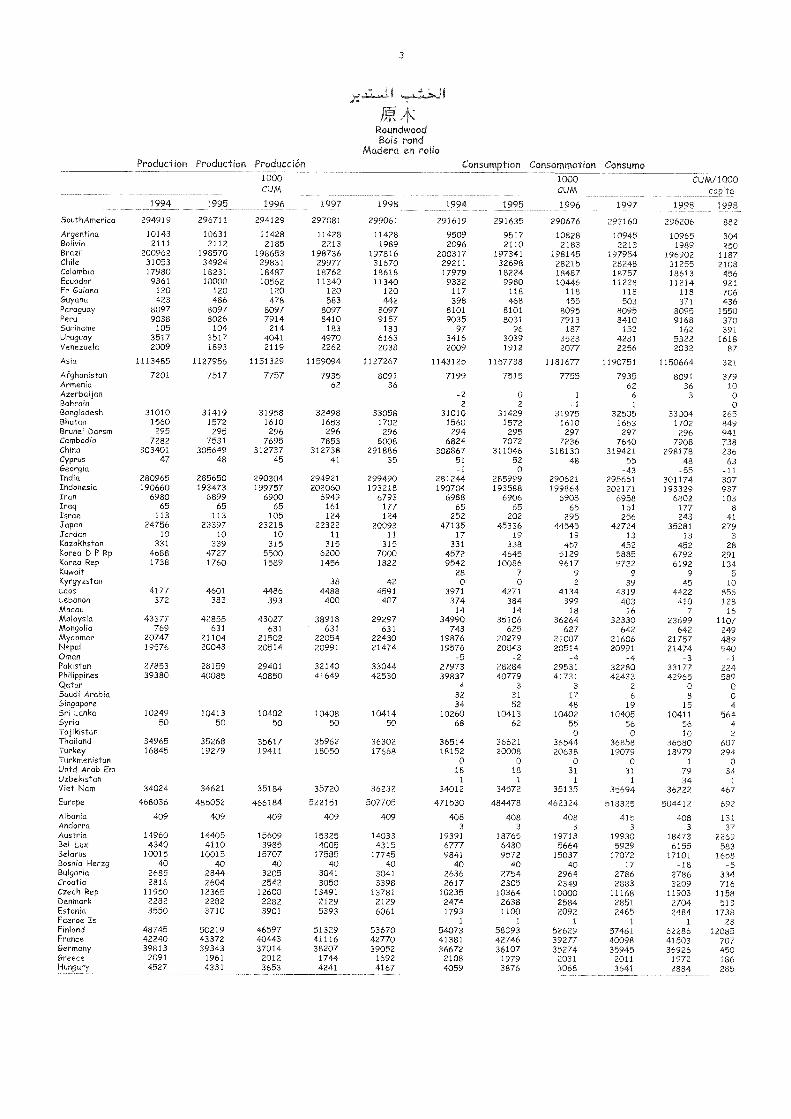
)V*RoundwoodBois rond
Madera en rolloProduction Production Producción Consumption Consommation Consumo
1994 1995
1000CUM
1996 1997 1998 1994 1995
1000CUM
1996 1997
CUAA/1000capita
1998 1998
SouthAmerica 294919 296711 294129 297081 299061 291619 291635 290676 293160 296206 882Argentina 10143 10631 11428 11428 11428 9509 9517 10828 10945 10965 304Bolivia 2111 2112 2185 2213 1989 2096 2110 2183 2213 1989 250Brazil 200962 198570 198653 198736 197816 200317 197341 198145 197954 196902 1187Chile 31053 34924 29831 29977 31670 29211 32698 28215 28248 31255 2108Colombia 17980 18231 18487 18762 18618 17979 18224 18487 18757 18613 456Ecuador 9361 10000 10562 11340 11340 9332 9980 10446 11228 11214 921Fr Guiana 120 120 120 120 120 117 118 118 118 118 706Guyana 423 486 478 583 442 398 468 455 503 371 436Paraguay 8097 8097 8097 8097 8097 8101 8101 8095 8095 8095 1550Peru 9038 8026 7914 8410 9157 9035 8031 7913 8410 9168 370Suriname 105 104 214 183 183 97 96 187 152 162 391Uruguay 3517 3517 4041 4970 6163 3416 3039 3528 4281 5322 1618Venezuela 2009 1893 2119 2262 2038 2009 1912 2077 2256 2032 87
Asia 1113485 1127956 1151329 1159094 1127267 1143125 1157738 1181677 1190751 1150664 321
Afghanistan 7201 7517 7757 7935 8091 7199 7515 7755 7935 8091 379Armenia 62 36 62 36 10Azerbaijan -2 0 1 6 3 0BahraM 2 2 -1 1 0Bangladesh 31010 31419 31958 32498 33058 31010 31429 31975 32505 33004 265Bhutan 1560 1572 1610 1653 1702 1560 1572 1610 1653 1702 849Brunei Darsm 295 295 296 296 296 294 295 297 297 296 941CambodM 7282 7531 7695 7853 8008 6824 7072 7236 7640 7908 738China 303401 305649 312737 312738 291886 308867 311046 318130 319421 298178 236Cyprus 47 48 45 41 35 51 52 48 55 48 63GeorgM -1 0 -43 -55 -11india 280965 285650 290304 294921 299490 281244 285999 290621 295661 301174 307IndonesM 190660 193473 199757 202060 193218 190704 193588 199864 202171 193329 937Iran 6980 6899 6900 6949 6793 6988 6906 6908 6958 6802 103Iraq 65 65 65 161 177 65 65 65 161 177 8Israel 113 113 105 124 124 252 202 295 256 243 41Japan 24756 23397 23218 22322 20093 47135 45336 44545 42724 35281 279Jordan 10 10 10 11 11 17 19 19 13 13 3Kazakhstan 331 339 315 315 315 331 338 457 452 452 28Korea D P Rp 4688 4727 5500 6200 7000 4572 4645 5129 5885 6792 291Korea Rep 1738 1760 1589 1456 1822 9542 10086 9617 9722 6192 134Kuwait 28 7 9 9 9 5Kyrgyzstan 38 42 0 0 2 39 45 10Laos 4177 4601 4486 4488 4591 3971 4271 4134 4319 4422 856Lebanon 372 383 393 400 407 374 384 399 403 410 128Macau 14 14 18 16 7 16MaMysM 43377 42855 43027 38918 29297 34990 35106 36264 32330 23699 1107Mongolia 769 631 631 631 631 743 625 627 642 642 249Myanmar 20747 21104 21502 22054 22430 19876 20279 21007 21606 21757 489Nepal 19576 20043 20514 20991 21474 19576 20043 20514 20991 21474 940Oman -5 -2 -4 -4 -3 -1Pakistan 27853 28159 29401 32140 33044 27973 28284 29531 32280 33177 224PhilippMes 39380 40085 40850 41649 42530 39837 40779 41731 42433 42965 589Qatar 4 3 3 2 0 0Saudi Arabia 32 31 17 6 8 oSingapore 34 52 48 19 15 4Sri Lanka 10249 10413 10402 10408 10414 10260 10413 10402 10405 10411 564SyrM 50 50 50 50 50 68 62 55 56 56 4Tajikistan 0 0 10 2Thailand 34965 35268 35617 35962 36302 36514 36621 36544 36858 36580 607Turkey 16845 19279 19411 18050 17668 18152 20008 20638 19079 18979 294Turkmenistan 0 0 0 0 1 oUntd Arab Em 18 18 31 31 79 34Uzbekistan 1 1 1 1 34 1
Viet Nam 34024 34621 35184 35720 36232 34012 34572 35135 35694 36222 467Europe 468036 485052 466184 522151 507705 471530 484478 462324 518325 504412 692AlbanM 409 409 409 409 409 408 408 408 415 408 131Andorra 3 3 3 3 3 37Austria 14960 14405 15609 15325 14033 19391 18765 19718 19930 18473 2269Bel-Lux 4340 4110 3985 4005 4315 6777 6480 5664 5929 6155 583BeMrus 10015 10015 15707 17585 17745 9841 9572 15037 17072 17101 1658BosnM Herzg 40 40 40 40 40 40 40 40 17 -18 -5Bulgaria 2685 2844 3205 3041 3041 2636 2754 2964 2786 2786 334CroatM 2816 2604 2542 3050 3398 2617 2305 2349 2883 3209 716Czech Rep 11950 12365 12600 13491 13781 10235 10364 10000 11168 11903 1158Denmark 2282 2282 2282 2129 2129 2474 2638 2584 2851 2704 513Estonio 3550 3710 3901 5393 6061 1793 1100 2092 2465 2484 1738Faeroe Is 1 1 1 1 1 28Finland 48745 50219 46597 51329 53670 54073 58393 52629 57461 62286 12085France 42240 43372 40443 41116 42770 41381 42746 39277 40098 41503 707Germany 39813 39343 37014 38207 39052 36672 36107 35274 35945 36926 450Greece 2091 1961 2012 1744 1692 2108 1979 2031 2011 1972 186Hungary 4527 4331 3653 4241 4167 4059 3876 3068 3641 2884 285
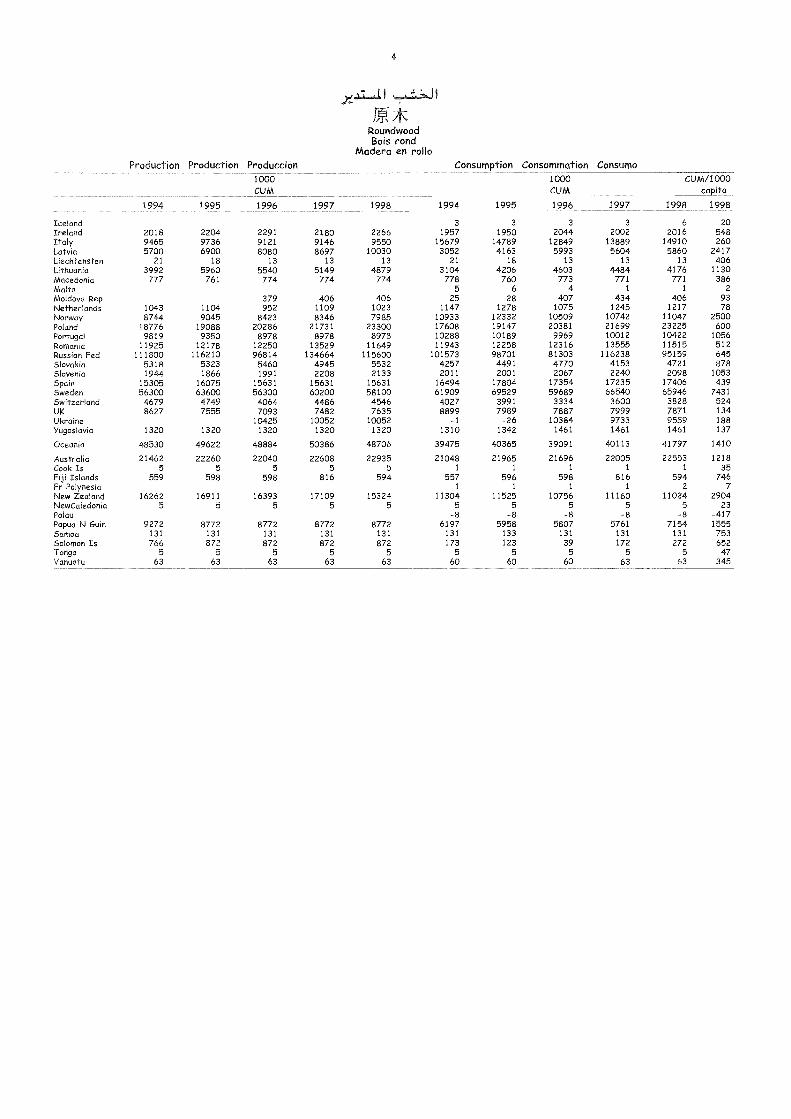
4
I ,
jfcRoundwoodBois rond
Madera en rolloProduction Production Producción Consumption Consommation Consumo
1000 1000 CUM/1000CUM CUM capita
1994 1995 1996 1997 1998 1994 1995 1996 1997 1998 1998
Iceland 3 3 3 3 6 20Ireland 2018 2204 2291 2180 2266 1957 1950 2044 2002 2016 548Italy 9465 9736 9121 9146 9550 15679 14789 12849 13889 14910 260Latvia 5700 6900 8080 8697 10030 3052 4163 5993 5604 5860 2417Liechtensten 21 18 13 13 13 21 18 13 13 13 406Lithuania 3992 5960 5540 5149 4879 3104 4206 4603 4484 4176 1130Macedonia 777 761 774 774 774 778 760 773 771 771 386Malta 5 6 4 1 1 2
Moldova Rep 379 406 406 25 28 407 434 406 93Netherlands 1043 1104 952 1109 1023 1147 1278 1075 1245 1217 78Norway 8744 9045 8423 8346 7985 10933 12332 10509 10742 11047 2500Poland 18776 19088 20286 21731 23300 17608 19147 20381 21699 23225 600Portugal 9819 9350 8978 8978 8978 10288 10189 9969 10012 10422 1056Romania 11925 12178 12250 13529 11649 11943 12258 12316 13555 11515 512Russian Fed 111800 116210 96814 134664 115600 101573 98701 81303 116238 95159 645Slovakia 5318 5323 5460 4945 5532 4257 4491 4770 4153 4721 878Slovenia 194-4 1866 1991 2208 2133 2011 2001 2067 2240 2098 1053Spain 15305 16075 15631 15631 15631 16494 17804 17354 17235 17406 439Sweden 56300 63600 56300 60200 58100 61909 69529 59689 66540 65946 7431Switzerland 4679 4749 4064 4486 4546 4027 3991 3334 3600 3828 524UK 8627 7555 7093 7482 7635 8899 7989 7887 7999 7871 134Ukraine 10425 10052 10052 -1 -26 10384 9733 9559 188Yugoslavia 1320 1320 1320 1320 1320 1310 1342 1461 1461 1461 137
Oceania 48530 49622 48884 50386 48706 39475 40365 39091 40113 41797 1410
Australia 21462 22260 22040 22608 22935 21048 21965 21696 22005 22553 1218Cook Is 5 5 5 5 5 1 1 1 1 1 35Fiji Islands 559 598 598 816 594 557 596 598 816 594 746Fr Polynesia 1 1 1 1 2 7New Zealand 16262 16911 16393 17109 15324 11304 11525 10756 11160 11024 2904NewCaledonia 5 5 5 5 5 5 5 5 5 5 23Palau -8 -8 -8 -8 -8 -417Papua N Guin 9272 8772 8772 8772 8772 6197 5958 5807 5761 7154 1555Samoa 131 131 131 131 131 131 133 131 131 131 753Solomon Es 766 872 872 872 872 173 123 39 172 272 652Tonga 5 5 5 5 5 5 5 5 5 5 47Vanuatu 63 63 63 63 63 60 60 60 63 63 345
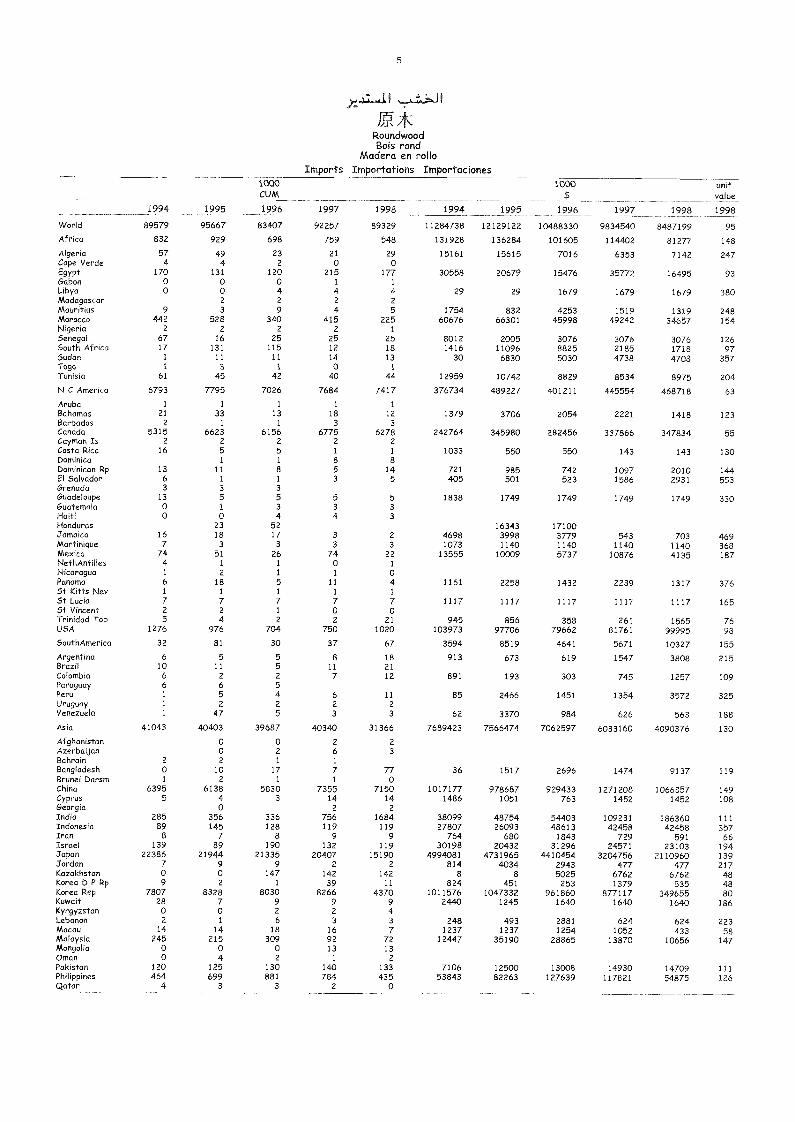
5
RoundwoodBois rond
Madera en rolloImports Importations Importaciones
1994 1995
1000CUM
1996 1997 1998 1994 1995
1000$
1996 1997 1998
unitvalue
1998
World 89579 95667 83407 92257 89329 11284738 12129122 10488330 9834540 8487199 95
Africa 832 929 698 759 548 131928 136284 101605 114402 81277 148
Algeria 57 49 23 21 29 15161 15615 7016 6353 7142 247Cape Verde 4 4 2 0 0Egypt 170 131 120 215 177 30558 20679 15476 35772 16495 93Gabon 0 0 0 1 1
Libya o o 4 4 4 29 29 1679 1679 1679 380Madagascar 2 2 2 2
Mauritius 9 3 9 4 5 1754 832 4253 1519 1319 248Morocco 442 528 340 415 225 60676 66301 45998 49242 34657 154Nigeria 2 2 2 z 1
Senegal 67 16 25 25 25 8012 2005 3076 3076 3076 126South Africa 17 131 115 12 18 1416 11096 8825 2185 1718 97Sudan 1 11 11 14 13 30 6830 5030 4738 4708 357Togo 1. 3 1 o 1
Tunisia 61 45 42 ao 44 12959 10742 8829 8534 8975 204
N C America 6793 7795 7026 7684 7417 376734 489227 401211 445554 468718 63
Aruba 1 1 1 1 1
Bahamas 21 33 13 18 12 1379 3706 2054 2221 1418 123Barbados 2 1 1 3 3Canada 5315 6623 6156 6775 6278 242764 345980 282456 337866 347834 55Cayman Is 2 2 2 2 2
Costa Rica 16 5 5 1 1 1033 550 550 143 143 130Dominica 1 1 a 8Dominican Rp 13 11 8 5 14 721 985 742 1097 2010 144El Salvador 6 1 1 3 5 405 501 523 1586 2931 553Grenada 3 3 3Guadeloupe 13 5 5 5 5 1838 1749 1749 1749 1749 330Guatemala 0 1 3 3 3Haiti 0 o 4 4 3
Honduras 23 52 16343 17100Jamaica 16 18 17 3 2 4698 3998 3779 543 703 469Martinique 7 3 3 3 3 1073 1140 1140 1140 1140 368Mexico 74 51 26 74 22 13555 10009 5737 10876 4135 187NethAntilles 4 1 1 o 1
Nicaragua 1 2 1 1 0Panama 6 18 5 11 4 1161 2258 1432 2239 1317 37651- Kitts Nev 1 1 1 1 1
5t Lucia 7 7 7 7 7 1117 1117 1117 1117 1117 1655t Vincent 2 2 I o 0Trinidad Tob 5 4 2 2 21 945 856 358 261 1565 76U5A 1276 976 704 750 1020 103973 97706 79662 81761 99995 98
5outhAmerica 32 81 30 37 67 3594 8519 4641 5671 10327 155
Argentina 6 5 5 8 18 913 673 619 1547 3808 215Brazil 10 11 5 11 21Colombia 6 2 2 7 12 891 193 303 745 1257 109Paraguay 6 6 5Peru 1 5 4 6 11 85 2466 1451 1354 3572 325Uruguay 1 2 2 2 2
Venezuela 1 47 5 3 3 62 3370 984 626 563 188
Asia 41043 40403 39687 40340 31366 7689423 7566474 7062597 6033160 4090376 130
Afghanistan 0 0 Z 2Azerbaijan o 2 6 3Bahrain 2 2 1 1
Bangladesh o 10 17 7 77 36 1517 2696 1474 9137 119Brunei Darsm 1 2 1 1 0China 6395 6138 5830 7355 7150 1017177 978687 929433 1271208 1066357 149Cyprus 5 4 3 14 14 1486 1051 763 1452 1452 108Georgia 0 2 2India 285 356 336 756 1684 38099 48754 54403 109231 186360 111Indonesia 89 145 128 119 119 27807 26093 48613 42458 42458 357Iran 8 7 8 9 9 764 680 1843 729 591 66Israel 139 89 190 132 119 30198 20432 31296 24571 23103 194Japan 22386 21944 21335 20407 15190 4994081 4731965 4410454 3204756 2110960 139Jordan 7 9 9 2 2 814 4034 2943 477 477 217Kazakhstan o o 147 142 142 8 8 5025 6762 6762 48Korea D P Rp 9 2 1 39 11 824 451 253 1379 535 48Korea Rep 7807 8328 8030 8266 4370 1011576 1047332 961860 877117 349655 80Kuwait 28 7 9 9 9 2440 1245 1640 1640 1640 186Kyrgyzstan 0 0 2 2 4Lebanon 2 1 6 3 3 248 493 2881 624 624 223Macas 14 14 18 16 7 1237 1237 1254 1052 433 58Malaysia 245 215 309 92 72 12447 35190 28865 13870 10656 147Mongolia o o 0 13 13Oman 0 4 2 1 2Pakistan 120 125 130 140 133 7106 12500 13008 14930 14709 111Philippines 464 699 881 784 435 53843 82263 127639 117821 54875 126Qatar 4 3 3 2 0
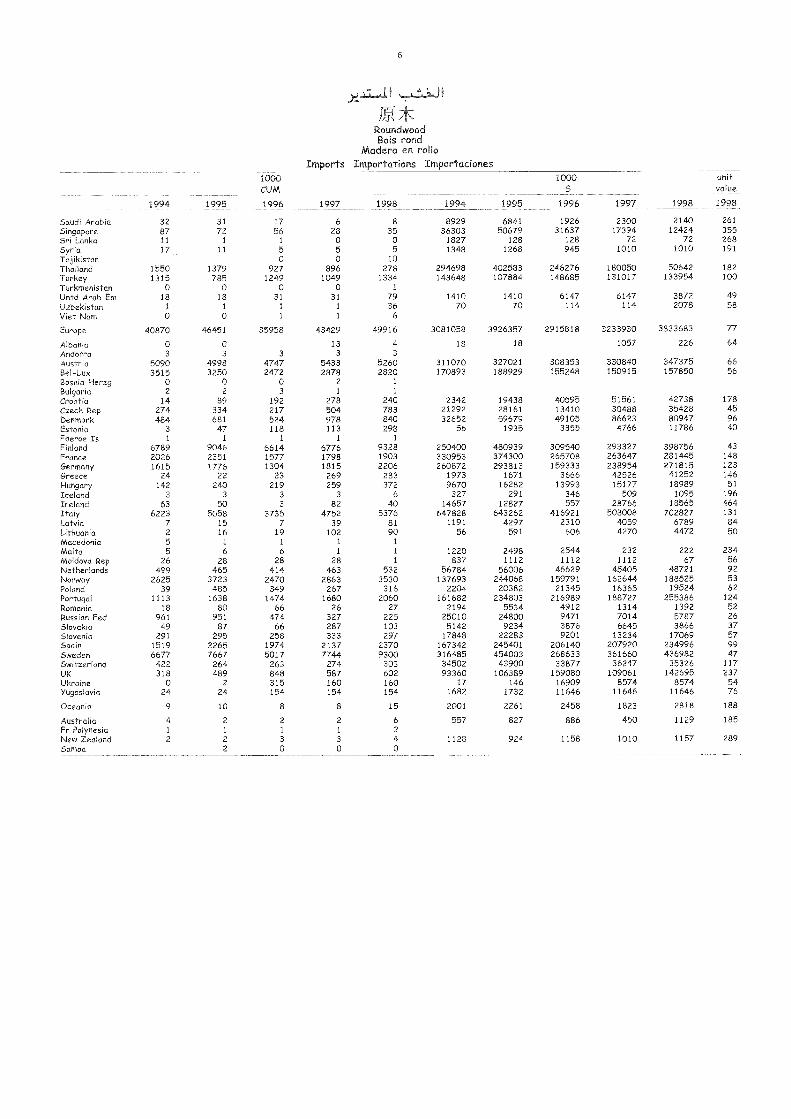
6
RoundwoodBois rond
Madera en rolloImports Importations Importaciones
1994 1995
1000CUM
1996 1997 1998 1994 1995
1000$
1996 1997 1998
unitvalue
1998
Saudi Arabia 32 31 17 6 8 8929 6841 1926 2300 2140 261
Singapore 87 72 56 28 35 36303 50679 31637 17394 12424 355Sri Lanka 11 1 1 0 0 1827 128 128 72 72 268Syria 17 11 5 5 5 1348 1268 945 1010 1010 191
Tajikistan 0 0 10Thailand 1550 1379 927 896 278 294698 402583 246276 180050 50642 182
Turkey 1315 785 1249 1049 1334 143648 107884 148685 131017 133954 100
Turkmenistan 0 0 0 0 1
Untd Arab Em 18 18 31 31 79 1410 1410 6147 6147 3872 49Uzbekistan 1 1 1 1 36 70 70 114 114 2078 58
Viet Nam 0 0 1 1 6
Europe 40870 46451 35958 43429 49916 3081058 3926357 2915818 3233930 3833683 77
Albania 0 0 13 4 18 18 1057 226 64
Andorra 3 3 3 3 3
Austria 5090 4998 4747 5433 5260 311070 327021 308353 330840 347375 66
Bel-Lux 3515 3250 2472 2878 2820 170893 188929 155248 150915 157850 56
Bosnia Herzg 0 0 0 2 1
Bulgaria 2 2 3 1 1
Croatia 14 89 192 278 240 2342 19438 40595 51561 42738 178Czech Rep 274 334 217 504 783 21292 28161 13410 30488 35428 45Denmark 484 681 524 978 840 32652 59679 49105 86623 80947 96Estonia 3 47 118 113 298 56 1935 3355 4766 11786 40Faeroe Is 1 1 1 1 1
Finland 6789 9046 6614 6776 9328 250400 480939 309540 293327 398756 43France 2026 2351 1577 1798 1903 330953 374300 265708 263647 281445 148Germany 1615 1776 1304 1815 2206 260872 293813 159333 238954 271815 123Greece 24 22 23 269 283 1973 1671 3666 42526 41252 146
Hungary 142 240 219 259 372 9670 16282 13993 15177 18989 51
Iceland 3 3 3 3 6 327 291 346 509 1095 196Ireland 63 50 3 82 40 14657 12827 557 28766 18565 464Italy 6223 5058 3735 4752 5376 647828 643262 416921 508008 702827 131Latvia 7 15 7 39 81 1191 4297 2310 4059 6789 84Lithuania 2 16 19 102 90 56 591 606 4270 4472 50Macedonia 5 1 1 1 1
Malta 5 6 6 1 1 1220 2498 2544 232 222 234Moldova Rep 26 28 28 28 1 837 1112 1112 1112 67 56Netherlands 499 465 414 463 532 56784 56006 46629 45405 48721 92Norway 2625 3723 2470 2863 3530 137693 244068 159791 162644 188525 53Poland 39 485 349 267 316 2204 20382 21345 16365 19524 62Portugal 1113 1638 1474 1680 2060 161682 234803 216989 188727 255386 124RomMa 18 80 66 26 27 2194 5534 4912 1314 1392 52Russian Fed 961 951 474 327 225 25010 24800 9471 7014 5787 26Slovakia 49 87 66 287 103 5142 9234 3876 6645 3866 37Slovenia 291 295 258 333 297 17848 22283 9201 13234 17069 57Spain 1519 2265 1974 2137 2370 167342 245401 206140 207920 234996 99Sweden 6677 7667 5017 7744 9300 316485 454003 268633 361660 436982 47Switzerland 422 264 263 274 303 34502 43900 33877 36247 35326 117UK 318 489 848 587 602 93360 106389 159080 109061 142695 237Ukraine 0 2 315 160 160 17 146 16909 8574 8574 54Yugoslavia 24 24 154 154 154 1682 1732 11646 11646 11646 76
Oceania 9 10 8 8 15 2001 2261 2458 1823 2818 188
Australia 4 2 2 2 6 557 827 886 450 1129 185Fr Polynesia 1 1 1 1 2
New Zealand 2 2 3 3 4 1128 924 1158 1010 1157 289Samoa 2 0 0 0
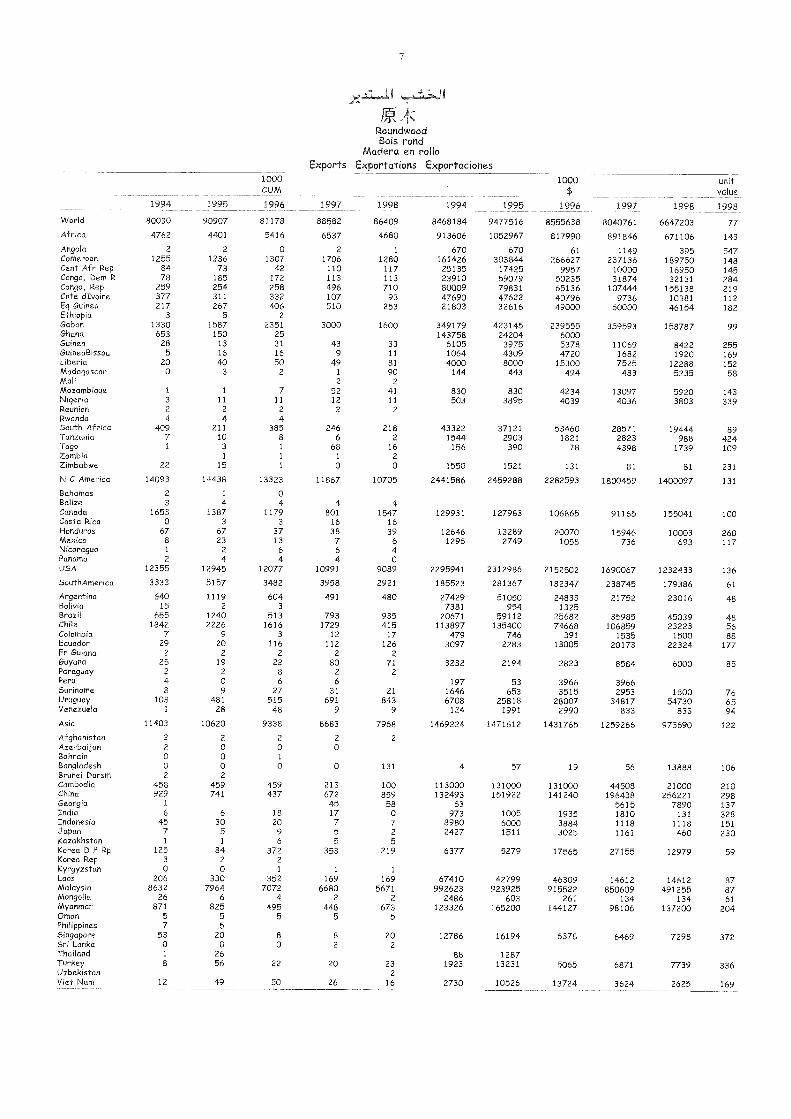
7
RoundwoodBois rond
Madera en rolloExports Exportations Exportaciones
1994 1995
1000CUM
1996 1997 1998 1994 1995
1000$
1996 1997 1998
unitvalue
1998
World 80030 90907 81178 88582 86409 8468184 9477516 8555638 8040761 6647203 77Africa 4762 4401 5416 6537 4680 913606 1052967 817990 891846 671106 143
Angola 2 2 0 2 1 670 670 61 1149 395 547Cameroon 1255 1236 1307 1706 1280 161426 303844 266627 237136 189750 148Cent Afr Rep 84 73 42 110 117 25135 17425 9957 10000 16950 145Con5o, Dem R 78 185 172 113 113 23910 59079 50235 31874 32131 284Con9o, Rep 259 254 258 496 710 80009 79831 65136 107444 155138 219Cote dIvoire 377 311 332 107 93 47690 47622 40796 9736 10381 112Eq Guinea 217 267 406 510 253 21803 32616 49000 60000 46154 182Ethiopia 3 5 2Gabon 1330 1587 2351 3000 1600 349179 423145 239555 359593 158787 99Ghana 653 150 25 143758 24204 6000Guinea 28 13 31 43 33 6105 3975 5378 11069 8422 255GuineaBissau 5 16 16 9 11 1064 4309 4720 1682 1920 169Liberia 20 40 50 49 81 4000 8000 15300 7525 12288 152Madagascar 0 3 2 1 90 144 443 494 483 5235 58Mali 2 2
Mozambique 1 1 7 52 41 830 830 4234 13097 5920 143Nigeria 3 11 11 12 11 503 3895 4039 4036 3803 339Reunion 2 2 2 2 2Rwanda 4 4 4South Afhca 409 211 385 246 218 43322 37121 53460 28571 19444 89Tanzania 7 10 8 6 2 1544 2903 1821 2823 988 424Togo 1 3 1 68 16 156 390 78 4398 1739 109Zambia 1 1 1 2
Zimbabwe 22 15 1 0 0 1550 1521 131 81 81 231
N C America 14093 14438 13323 11867 10705 2441586 2459288 2282593 1800459 1400097 131
Bahamas 2 1 0Belize 3 4 4 4 4Canada 1653 1387 1179 801 1547 129931 127983 106865 91165 155041 100Costa Rica 0 3 3 16 16Honduras 67 67 37 38 39 12646 13289 20070 15946 10003 260Mexico 8 23 13 7 6 1296 2749 1058 736 693 117Nicaragua 1 2 6 6 4Panama 2 4 4 4 0USA 12355 12945 12077 10991 9089 2295941 2312986 2152502 1690067 1232433 136
5oufhAmerica 3333 5157 3482 3958 2921 185523 281367 182347 238745 179386 61
Argentina 640 1119 604 491 480 27429 51050 24833 21752 23016 48Bolivia 15 2 3 7381 954 1325Brazil 655 1240 513 793 935 20671 59112 25682 35985 45039 48Chile 1842 2226 1616 1729 415 113897 135400 74668 106859 23223 56Colombia 7 9 3 12 17 479 746 391 1535 1500 88Ecuador 29 20 116 112 126 3097 2283 13005 20173 22324 177Fr Guiana 2 2 2 2 2Guyana 25 19 22 80 71 3232 2194 2823 8584 6000 85Paraguay 2 2 8 2 2Peru 4 0 6 6 197 53 3966 3966Suriname 8 9 27 31 21 1646 653 3515 2953 1600 76Uruguay 103 481 515 691 843 6708 25818 28007 34817 54730 65Venezuela 1 28 48 9 9 124 1991 2990 833 833 94
Asia 11403 10620 9338 8683 7968 1469224 1471612 1431765 1259266 975690 122
Afghanistan 2 2 2 2 2Azerbaijan 2 0 0 0Bahrain 0 0 1
Bangladesh 0 0 0 0 131 4 57 19 56 13888 106Brunei Darsm 2 2Cambodia 458 459 459 213 100 113000 131000 131000 44508 21000 210China 929 741 437 672 859 132493 151922 141240 196438 256221 298GeorgM 1 45 58 63 5615 7890 137India 6 6 18 17 0 973 1005 1935 1810 131 328Indonesia 45 30 20 7 7 8980 6000 3884 1118 1118 151Japan 7 5 9 5 2 2427 1511 3025 1161 460 230Kazakhstan 1 1 6 5 5Korea D P Rp 125 84 372 353 219 6377 5279 17565 27155 12979 59Korea Rep 3 2 2
Kyrgyzstan 0 0 1 1 1
Laos 206 330 352 169 169 67410 42799 46309 14612 14612 87Malaysia 8632 7964 7072 6680 5671 992623 923925 915522 850609 491255 87Mongolia 26 6 4 2 2 2486 603 261 134 134 61Myanmar 871 825 495 448 673 123326 165200 144127 98106 137200 204Oman 5 5 5 5 5PhilippMes 7 5Singapore 53 20 8 8 20 12786 16194 6378 6469 7298 372Sri Lanka 0 0 0 2 2Thadand 1 26 88 1287Turkey 8 56 22 20 23 1923 13231 5065 6871 7739 336Uzbekistan 2
VMt Nam 12 49 50 26 16 2730 10526 13724 3624 2625 169
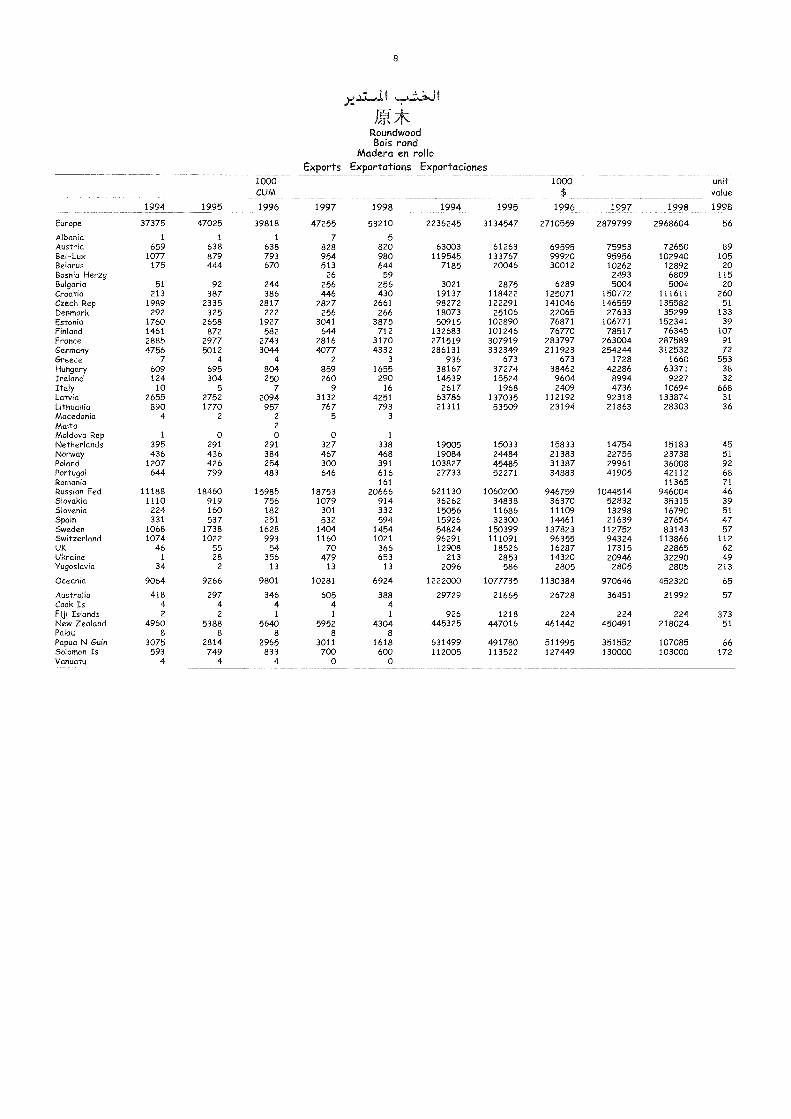
8
K9-,*RoundwoodBois rond
Modero en rolloExports Exportations Exportaciones
1994 1995
1000CUM
1996 1997 1998 1994 1995
1000$
1996 1997 1998
unitvalue
1998
Europe 37375 47025 39818 47255 53210 2236245 3134547 2710559 2879799 2968604 56
Albania 1 1 1 7 5Austria 659 638 638 828 820 63003 61263 69595 75953 72650 89Bel-Lux 1077 879 793 954 980 119545 133767 99920 95956 102940 105Belarus 175 444 670 513 644 7185 20046 30012 10262 12892 20Bosnia Herzg 26 59 2493 6809 115Bulgaria 51 92 244 256 256 3021 2875 6289 5004 5004 20Croatia 213 387 386 446 430 19137 118422 125071 150772 111611 260Czech Rep 1989 2335 2817 2827 2661 98272 122291 141046 146559 135582 51Denmark 292 325 222 256 266 18073 25106 22065 27633 35299 133Estonia 1760 2658 1927 3041 3875 50915 102890 76871 106771 152341 39Finland 1461 872 582 644 712 132683 101246 76770 78517 76345 107France 2885 2977 2743 2816 3170 271519 307919 283797 263004 287589 91Germany 4756 5012 3044 4077 4332 286131 332349 211923 254244 312532 72Greece 7 4 4 2 3 936 673 673 1728 1660 553Hungary 609 695 804 859 1655 38167 37274 38462 42286 63371 38Ireland 124 304 250 260 290 14539 15524 9604 8994 9227 32Italy 10 5 7 9 16 2617 1968 2409 4736 10694 668Latvia 2655 2752 2094 3132 4251 63786 137035 112192 92318 133874 31Lithuania 890 1770 957 767 793 21311 53509 23194 21863 28303 36Macedonia 4 2 2 5 3
Malta 2AAoldova Rep 1 0 0 0 1
Netherlands 395 291 291 327 338 19005 15033 15833 14754 15183 45Norway 436 436 384 467 468 19084 24484 21383 22755 23738 51Poland 1207 426 254 300 391 103827 45485 31387 29961 36008 92Portugal 644 799 483 646 616 27733 52271 34883 41905 42112 68Romania 161 11365 71Russian Fed 11188 18460 15985 18753 20666 621130 1060200 946759 1044514 946004 46Slovakia 1110 919 756 1079 914 36262 34838 36370 52832 35315 39Slovenia 224 160 182 301 332 15056 11686 11109 13298 16790 51Spain 331 537 251 532 594 15926 32300 14461 21639 27654 47Sweden 1068 1738 1628 1404 1454 54824 150399 137823 112752 83143 57Switzerland 1074 1022 993 1160 1021 96291 111091 96355 94324 113866 112UK 46 55 54 70 366 12908 18526 16287 17315 22865 62Ukraine 1 28 356 479 653 213 2853 14320 20946 32290 49Yugoslavia 34 2 13 13 13 2096 586 2805 2805 2805 213
Oceania 9064 9266 9801 10281 6924 1222000 101/135 1130384 970646 452320 65
Australia 418 297 346 605 388 29729 21665 26728 36451 21992 57Cook Is 4 4 4 4 4NiIslands 2 2 1 1 1 926 1218 224 224 224 373New Zealand 4960 5388 5640 5952 4304 445325 447016 461442 450491 218024 51Palau 8 8 8 8 8
Papua N 6klin 3075 2814 2965 3011 1618 631499 491780 511995 351552 107085 66Solomon's 593 749 833 700 600 112005 113522 127449 130000 103000 172Vanuatu 4 4 4 0 0

tt )Roundwood (C)Bois rond (C)
Madero en rollo (C)Production Production Producción
1000CUM
9
1994 1995 1996 1997 1998
VVoHd 1102115 1130889 1095758 1158263 1131867
Africa 18986 20220 20268 20164 20555
Algeria 1691 1724 1784 1826 1866Burundi 21 30 23 35 60Ethiopia 3043 3126 3204 3279 3359Kenya 1958 1990 2020 2048 2075Malawi 113 113 113 113 113Mauritius 12 10 12 12 12Morocco 355 392 468 143 359Mozambique 11 34 34 57 57Reunion 3 3 3 3 3South Africa 9020 10093 10133 9754 9754Sudan 10 10 10 10 10Swaziland 864 864 864 864 864Tanzania 564 564 564 564 564Tunisia 298 302 306 310 313Uganda 50 50 50 50 50Zambia 356 300 250 219 219Zimbabwe 617 617 431 877 877
N C America 464829 467314 458983 473757 477921
Bahamas 115 115 115 115 115Belize 18 18 18 18 18Canada 155263 158310 159656 161056 161056Cuba 113 113 113 113 113El Salvador 73 95 98 19 19Guatemala 9289 8502 8073 8022 8022Haiti 560 568 576 584 593Honduras 2593 2419 2606 2726 2866Jamaica 3 2 2 2 2Mexico 10101 10059 10507 11255 11919Nicaragua 447 478 548 598 610Trinidad Tob 15 10 18 18USA 286255 286621 276662 289232 292571
SouthAmerica 72301 76773 71548 72244 69920
Argentina 2731 4057 350141441
3501 3501Brazil 44723 44432 44450 44458
19437Chile 21189 24470 19930 17962Colombia 1082 1082 1082 1102 846Ecuador 1861 1972 2085 2238 2238Uruguay 298 298 340 416 522Venezuela 417 462 662 607 393
Asia 194756 196331 201272 200677 188125
Afghanistan 2645 2736 2805 2856 2901Armenia 1 1
Bhutan 19 13 13 13 13China 146309 147733 152299 152299 142023Cyprus 44 46 43 39 32India 10478 10618 10756 10895 11031Indonesia 539 539 539 539 206Israel 81 81 85 90 90Japan 19090 18067 17993 17315 15214Kazakhstan 331 339 315 315 315Korea D P Rp 2738 21/1 3450 4000 4600Korea Rep 1129 1251 1219 1101 1313Kyrgyzstan 14 20Laos 230 491 242 209 209Lebanon 25 25 26 26 27Malaysia 211 207 207 207 207Mongolia 731 600 600 600 600Nepal 120 120 120 120 120Pakistan 1626 1462 1728 1595 1540PhilippMes 2
Sri Lanka 26 29 29 29SyrM 25 25 25 25 25Turkey 8211 9002 8606 8216 7437Viet Nam 173 173 173 173 173
Europe 325055 344162 317109 362815 348543
Albania 35 35 35 35 35Austria 12628 12196 13426 13048 11951Bel-Lux 2870 2710 2585 2559 2790Belarus 5336 5336 9337 11243 11343Bulgaria 875 996 1013 913 913CroatM 374 364 354 421 472Czech Rep 11157 11308 11276 11942 12043Denmark 1518 1518 1518 1485 1485Estonia 1788 1854 1945 3135 3764FinMnd 40874 41734 38993 43159 44997
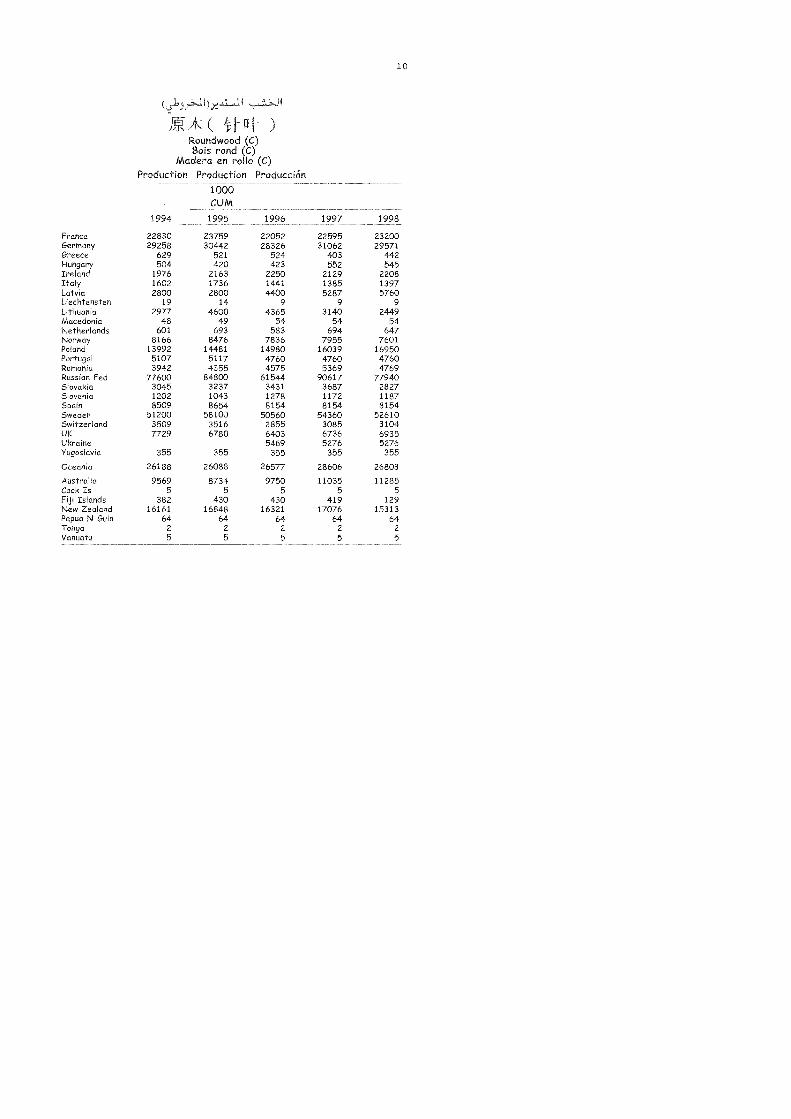
(s151:-'11))7:
Roundwood (C)Bois rand (C)
Madera en rollo (C)Production Production Producción
1000CUM
10
1994 1995 1996 1997 1998
France 22830 23759 22052 22595 23200Germany 29258 30442 28326 31062 29571Greece 629 521 524 403 442Hungary 504 420 423 552 545Ireland 1976 2163 2250 2129 2208Italy 1602 1736 1441 1385 1397Latvia 2800 2800 4400 5287 5760Liechtensten 19 14 9 9 9Lithuania 2977 4600 4365 3140 2449Macedonia 48 49 54 54 54Netherlands 601 693 583 694 647Norway 8166 8476 7836 7955 7601Poland 13992 14481 14980 16039 16950Portugal 5107 5117 4760 4760 4760Romania 3942 4355 4575 5369 4769Russian Fed 77600 84800 61544 90617 77940Slovakia 3045 3237 3431 3687 2827Slovenia 1202 1043 1278 1172 1187Spain 8509 8654 8154 8154 8154Sweden 51200 58100 50560 54360 52610Switzerland 3509 3516 2855 3085 3104UK 7729 6780 6403 6736 6935Ukraine 5469 5276 5276Yugoslavia 355 355 355 355 355
Oceania 26188 26088 26577 28606 26803
Australia 9569 8734 9750 11035 11285Cook Is 5 5 5 5 5
Fiji Islands 382 430 430 419 129New Zealand 16161 16848 16321 17076 15313Papua N Guin 64 64 64 64 64Tonga 2 2 2 2 2
Vanuatu 5 5 5 5 5
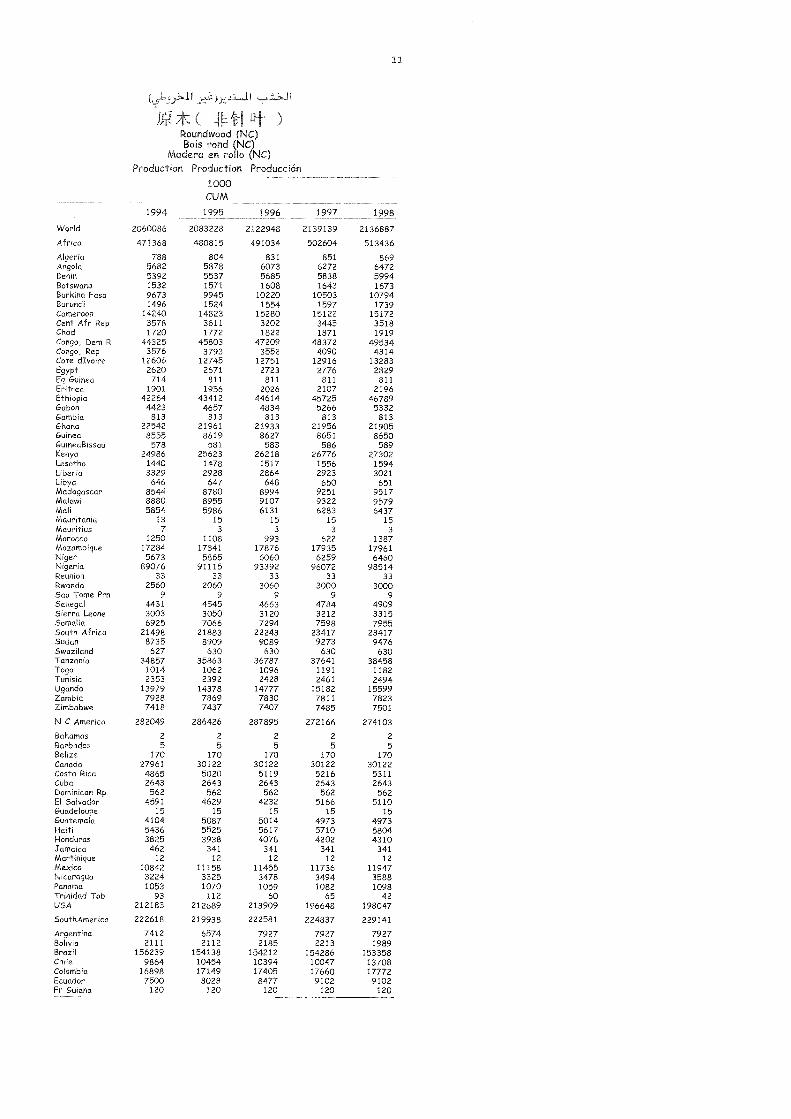
_
ik( )Roundwood (NC)Bois rond (NC)
Madera en rollo (NC)Production Production Producción
1000CUM
11
1994 1995 1996 1997 1998
World 2060086 2083228 2122948 2139139 2136887
Africa 471368 480815 491034 502604 513436
Algeria 788 804 831 851 869Angola 5682 5878 6073 6272 6472Benin 5392 5537 5685 5838 5994Botswana 1532 1571 1608 1643 1673Burkina Faso 9673 9945 10220 10503 10794Burundi 1496 1524 1554 1597 1739Cameroon 14240 14823 15280 15122 15172Cent Afr Rep 3578 3611 3202 3445 3518Chad 1720 1772 1822 1871 1919Congo, Dem R 44325 45803 47209 48372 49534Congo, Rep 3576 3793 3552 4090 4314Cote dIvoire 12606 12745 12751 12916 13283Egypt 2620 2671 2723 2776 2829Eq Guinea 714 811 811 811 811Eritrea 1901 1956 2026 2107 2196Ethiopia 42264 43412 44614 45725 46789Gabon 4423 4657 4834 5266 5332Gambia 813 813 813 813 813Ghana 22542 21961 21933 21956 21905Guinea 8555 8619 8627 8651 8650GuineaBissau 578 581 583 586 589Kenya 24986 25623 26218 26776 27302Lesotho 1440 1478 1517 1556 1594Liberia 3329 2928 2864 2923 3021Libyo 646 647 648 650 651Madagascar 8544 8780 8994 9251 9517Malawi 8880 8955 9107 9322 9579Mali 5854 5986 6131 6283 6437Mauritania 13 15 15 15 15Mauritius 7 3 3 3 3Morocco 1250 1108 993 622 1387Mozambique 17284 17841 17876 17935 17961Niger 5673 5865 6060 6259 6460Nigeria 89076 91115 93392 96072 98514Reunion 33 33 33 33 33Rwanda 2560 2060 3060 3000 3000Sao Tome Pm n 9 9 9 9 9Senegal 4431 4545 4663 4784 4909Sierra Leone 3003 3050 3120 3212 3315Somalia 6925 7066 7294 7598 7955South Africa 21498 21883 22243 23417 23417Sudan 8735 8909 9089 9273 9476Swaziland 627 630 630 630 630Tanzania 34857 35863 36787 37641 38458Togo 1014 1062 1096 1191 1182Tunisia 2353 2392 2428 2461 2494Uganda 13979 14378 14777 15182 15599Zambia 7928 7869 7830 7811 7823Zimbabwe 7418 7437 7407 7485 7501
N C Amer ca 282049 286426 287895 272166 274103
Bahamas 2 2 2 2 2
Barbados 5 5 5 5 5Belize 170 170 170 170 170Canada 27961 30122 30122 30122 30122Costa Rica 4865 5020 5119 5216 5311Cuba 2643 2643 2643 2643 2643Dominican Rp 562 562 562 562 562El Salvador 4591 4629 4232 5166 5110Guadeloupe 15 15 15 15 15Guatemala 4104 5087 5014 4973 4973Haiti 5436 5525 5617 5710 5804Honduras 3825 3938 4078 4202 4310Jamaica 462 341 341 341 341Martinique 12 12 12 12 12Mexico 10842 11158 11455 11736 11947Nicaragua 3224 3325 3478 3494 3588Panama 1053 1070 1059 1082 1098Trinidad Tob 93 112 60 65 42USA 212183 212689 213909 196648 198047
SouthAmerica 222618 219938 222581 224837 229141
Argentina 7412 6574 7927 7927 7927Bolivia 2111 2112 2185 2213 1989Brazil 156239 154138 154212 154286 153358Chile 9864 10454 10394 10047 13708Colombia 16898 17149 17405 17660 17772Ecuador 7500 8028 8477 9102 9102Fr Guiana 120 120 120 120 120
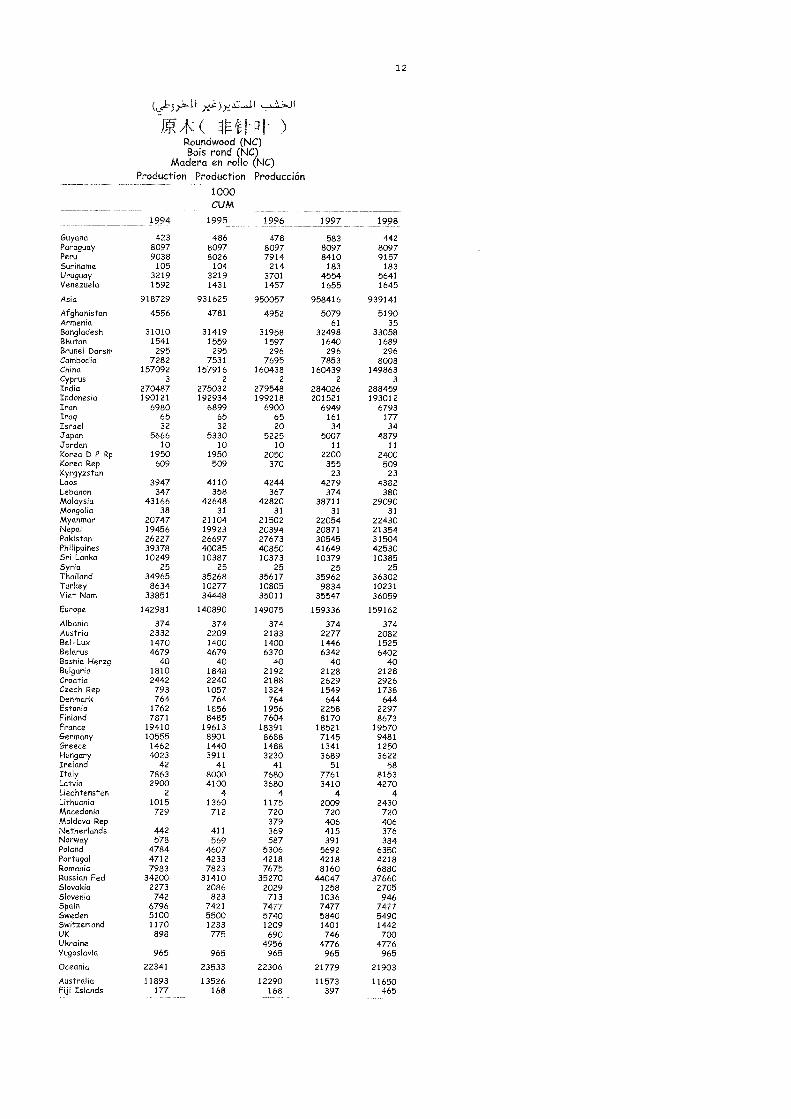
5b"1 ;JP
)Roundwood (NC)Bois rond (NC)
Madera en rollo (NC)Production Production Producción
1000CUM
12
1994 1995 1996 1997 1998
Guyana 423 486 478 583 442Paraguay 8097 8097 8097 8097 8097Peru 9038 8026 7914 8410 9157Suriname 105 104 214 183 183Uruguay 3219 3219 3701 4554 5641Venezuela 1592 1431 1457 1655 1645
Asia 918729 931625 950057 958416 939141
Afghanistan 4556 4781 4952 5079 5190Armenia 61 35Bangladesh 31010 31419 31958 32498 33058Bhutan 1541 1559 1597 1640 1689Brunei Darsm 295 295 296 296 296Cambodia 7282 7531 7695 7853 8008China 157092 157916 160438 160439 149863Cyprus 3 2 2 2 3India 270487 275032 279548 284026 288459Indonesia 190121 192934 199218 201521 193012Iran 6980 6899 6900 6949 6793Iraq 65 65 65 161 177Israel 32 32 20 34 34Japan 5666 5330 5225 5007 4879Jordan 10 10 10 11 11Korea D P Rp 1950 1950 2050 2200 2400Korea Rep 609 509 370 355 509Kyrgyzstan 23 23Laos 3947 4110 4244 4279 4382Lebanon 347 358 367 374 380Malaysia 43166 42648 42820 38711 29090Mongolia 38 31 31 31 31Myanmar 20747 21104 21502 22054 22430Nepal 19456 19923 20394 20871 21354Pakistan 26227 26697 27673 30545 31504Philippines 39378 40085 40850 41649 42530Sri Lanka 10249 10387 10373 10379 10385Syria 25 25 25 25 25Thailand 34965 35268 35617 35962 36302Turkey 8634 10277 10805 9834 10231Viet Nam 33851 34448 35011 35547 36059
Europe 142981 140890 149075 159336 159162
Albania 374 374 374 374 374Austria 2332 2209 2183 2277 2082Bel -Lux 1470 1400 1400 1446 1525Belarus 4679 4679 6370 6342 6402Bosnia Herzg 40 ao 40 40 aoBulgaria 1810 1848 2192 2128 2128Croatia 2442 2240 2188 2629 2926Czech Rep 793 1057 1324 1549 1738Denmark 764 764 764 644 644Estonia 1762 1856 1956 2258 2297Finland 7871 8485 7604 8170 8673France 19410 19613 18391 18521 19570Germany 10555 8901 8688 7145 9481Greece 1462 1440 1488 1341 1250Hungary 4023 3911 3230 3689 3622Ireland 42 41 41 51 58Italy 7863 8000 7680 7761 8153Latvia 2900 4100 3680 3410 4270Liechtensten 2 4 4 4 4Lithuania 1015 1360 1175 2009 2430Macedonia 729 712 720 720 720Moldova Rep 379 406 406Netherlands 442 411 369 415 376Norway 578 569 587 391 384Poland 4784 4607 5306 5692 6350Portugal 4712 4233 4218 4218 4218Romania 7983 7823 7675 8160 6880Russian Fed 34200 31410 35270 44047 37660Slovakia 2273 2086 2029 1258 2705Slovenia 742 823 713 1036 946Spain 6796 7421 7477 7477 7477Sweden 5100 5500 5740 5840 5490Switzerland 1170 1233 1209 1401 1442UK 898 775 690 746 700Ukraine 4956 4776 4776Yugoslavia 965 965 965 965 965
Oceania 22341 23533 22306 21779 21903
Australia 11893 13526 12290 11573 11650Fiji Islands 177 168 168 397 465
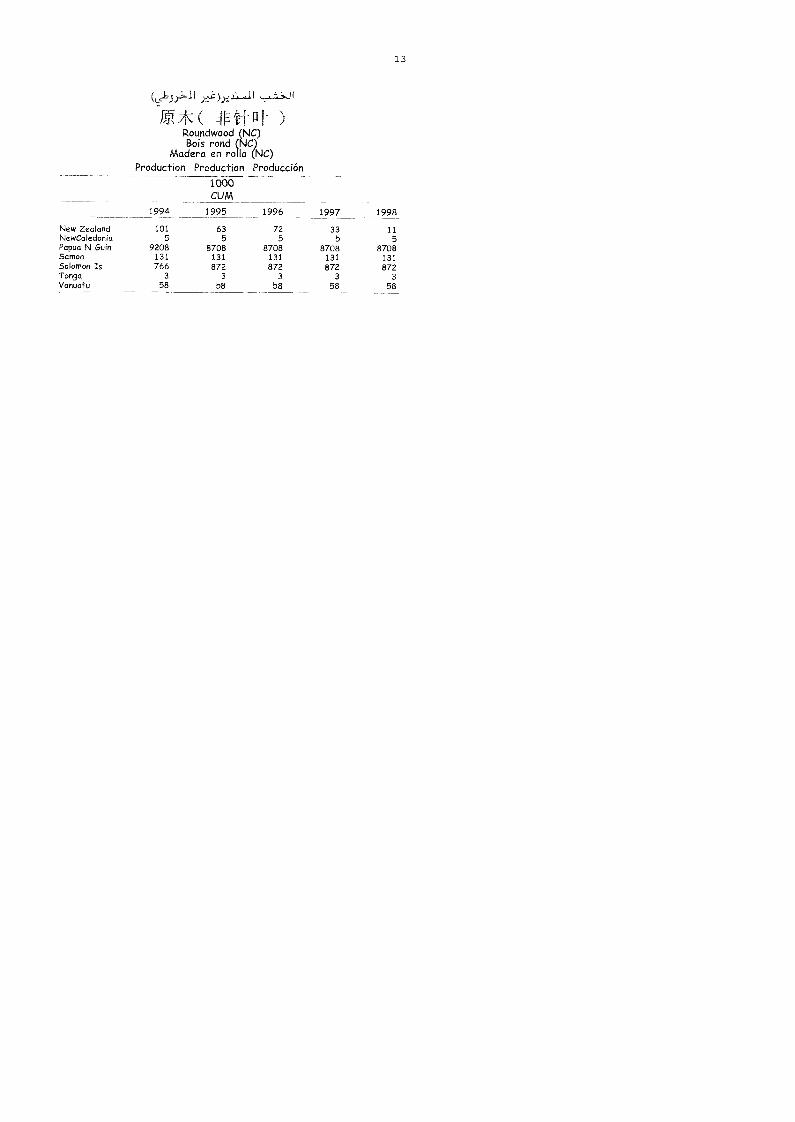
L513;'--11
1#AK(Roundwood (NC)Bois rond (NC)
Madera en rollo (NC)Production Production Producción
1000CUM
13
1994 1995 1996 1997 1998
New Zealand 101 63 72 33 11NewCaledonia 5 5 5 5 5Papua N Guin 9208 8708 8708 8708 8708Samoa 131 131 131 131 131Solomon Is 766 872 872 872 872Tonga 3 3 3 3 3Vanuatu 58 58 58 58 58
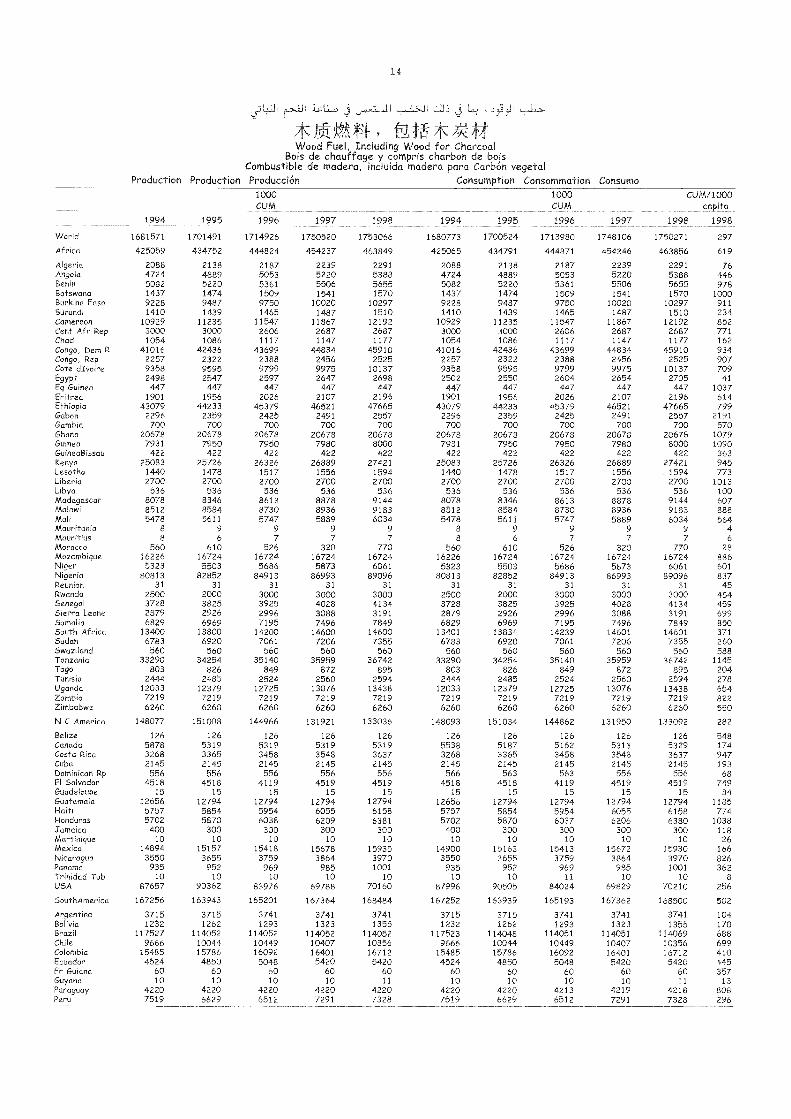
14
Wood Fuel, Including Wood for CharcoalBois de chauff age y compris charbon de bois
Combustible de madera, incluida madera para Carbón vegetalProduction Production Producción Consumption
1995
Consommation Consumo
1994 1995
1000CUM
1996 1997 1998 1994
1000CUM
1996 1997
CUM/1000
1998 1998
VVorld 1681571 1701491 1714926 1750520 1753066 1680773 1700524 1713980 1748106 1750271 297
Africa 425059 434752 444824 454237 463849 425065 434791 444871 454246 463856 619
Algeria 2088 2138 2187 2239 2291 2088 2138 2187 2239 2291 76Angola 4724 4889 5053 5220 5388 4724 4889 5053 5220 5388 446Benin 5082 5220 5361 5506 5655 5082 5220 5361 5506 5655 978Botswana 1437 1474 1509 1541 1570 1437 1474 1509 1541 1570 1000Burkina Faso 9228 9487 9750 10020 10297 9228 9487 9750 10020 10297 911Burundi 1410 1439 1465 1487 1510 1410 1439 1465 1487 1510 234Cameroon 10929 11235 11547 11867 12192 10929 11235 11547 11867 12192 852Cent Afr Rep 3000 3000 2606 2687 2687 3000 3000 2606 2687 2687 771Chad 1054 1086 1117 1147 1177 1054 1086 1117 1147 1177 162Con9o, Dem R 41016 42436 43699 44834 45910 41016 42436 43699 44834 45910 934Congo, Rep 2257 2322 2388 2456 2525 2257 2322 2388 2456 2525 907Cote dIvoire 9358 9595 9799 9975 10137 9358 9595 9799 9975 10137 709Egypt 2498 2547 2597 2647 2698 2502 2550 2604 2654 2705 41Eq Guinea 447 447 447 447 447 447 447 447 447 447 1037Eritrea 1901 1956 2026 2107 2196 1901 1956 2026 2107 2196 614Ethiopia 43079 44233 45379 46521 47665 43079 44233 45379 46521 47665 799Gabon 2296 2359 2425 2491 2557 2296 2359 2425 2491 2557 2191Gambia 700 700 700 700 700 700 700 700 700 700 570Ghana 20678 20678 20678 20678 20678 20678 20678 20678 20678 20678 1079Guinea 7931 7950 7950 7980 8000 7931 7950 7950 7980 8000 1090GuMeaBissau 422 422 422 422 422 422 422 422 422 422 363Kenya 25083 25726 26326 26889 27421 25083 25726 26326 26889 27421 945Lesotho 1440 1478 1517 1556 1594 1440 1478 1517 1556 1594 773Liberia 2700 2700 2700 2700 2700 2700 2700 2700 2700 2700 1013Libya 536 536 536 536 536 536 536 536 536 536 100Madagascar 8078 8346 8613 8878 9144 8078 8346 8613 8878 9144 607Malawi 8512 8584 8730 8936 9183 8512 8584 8730 8936 9183 888Mak 5478 5611 5747 5889 6034 5478 5611 5747 5889 6034 564Mauritania 8 9 9 9 9 8 9 9 9 9 4Mauritius 8 6 7 7 7 8 6 7 7 7 6
Morocco 560 610 526 320 770 560 610 526 320 770 28Mozambique 16226 16724 16724 16724 16724 16226 16724 16724 16724 16724 886Niger 5323 5503 5686 5873 6061 5323 5503 5686 5873 6061 601Nigeria 80813 82852 84913 86993 89096 80813 82852 84913 86993 89096 837Reunion 31 31 31 31 31 31 31 31 31 31 45Rwanda 2500 2000 3000 3000 3000 2500 2000 3000 3000 3000 454Senegal 3728 3825 3925 4028 4134 3728 3825 3925 4028 4134 459Sierra Leone 2879 2926 2996 3088 3191 2879 2926 2996 3088 3191 699Somalia 6829 6969 7195 7496 7849 6829 6969 7195 7496 7849 850South Africa 13400 13800 14200 14600 14600 13401 13834 14239 14601 14601 371Sudan 6783 6920 7061 7206 7355 6783 6920 7061 7206 7355 260Swaziland 560 560 560 560 560 560 560 560 560 560 588Tanzania 33290 34254 35140 35959 36742 33290 34254 35140 35959 36742 1145Togo 803 826 849 872 895 803 826 849 872 895 204Tunisia 2444 2485 2524 2560 2594 2444 2485 2524 2560 2594 278Uganda 12033 12379 12725 13076 13438 12033 12379 12725 13076 13438 654Zambia 7219 7219 7219 7219 7219 7219 7219 7219 7219 7219 822Zimbabwe 6260 6260 6260 6260 6260 6260 6260 6260 6260 6260 550
N C America 148077 151008 144966 131921 133036 148093 151034 144862 131950 133092 282
Belize 126 126 126 126 126 126 126 126 126 126 548Canada 5878 5319 5319 5319 5319 5538 5187 5162 5313 5329 174Costa Rica 3268 3365 3458 3548 3637 3268 3365 3458 3548 3637 947Cuba 2145 2145 2145 2145 2145 2145 2145 2145 2145 2145 193DomMicanRp 556 556 556 556 556 566 563 563 556 556 68El Salvador 4518 4518 4119 4519 4519 4518 4518 4119 4519 4519 749Guadeloupe 15 15 15 15 15 15 15 15 15 15 34Guatemala 12656 12794 12794 12794 12794 12656 12794 12794 12794 12794 1185Haiti 5757 5854 5954 6055 6158 5757 5854 5954 6055 6158 774Honduras 5702 5870 6038 6209 6381 5702 5870 6037 6206 6380 1038Jamaica 400 300 300 300 300 400 300 300 300 300 118MartMique 10 10 10 10 10 10 10 10 10 10 26Mexico 14894 15157 15418 15678 15935 14900 15163 15413 15672 15930 166Nicaragua 3550 3655 3759 3864 3970 3550 3655 3759 3864 3970 826Panama 935 952 969 985 1001 935 952 969 985 1001 362TrMidadTob 10 10 10 10 10 10 10 11 10 10 8USA 87657 90362 83976 69788 70160 87996 90505 84024 69829 70210 256
SouthAmerica 167256 163943 165201 167364 168484 167252 163939 165193 167362 168500 502
Argentina 3715 3715 3741 3741 3741 3715 3715 3741 3741 3741 104Bolivia 1232 1262 1293 1323 1355 1232 1262 1293 1323 1355 170Brazil 117527 114052 114052 114052 114052 117523 114048 114051 114051 114069 688Chile 9666 10044 10449 10407 10356 9666 10044 10449 10407 10356 699Colombia 15485 15786 16092 16401 16712 15485 15786 16092 16401 16712 410Ecuador 4524 4850 5048 5420 5420 4524 4850 5048 5420 5420 445Fr Guiana 60 60 60 60 60 60 60 60 60 60 357Guyana 10 10 10 10 11 10 10 10 10 11 13Paraguay 4220 4220 4220 4220 4220 4220 4220 4213 4219 4218 808Peru 7519 6629 6512 7291 7328 7519 6629 6512 7291 7328 296
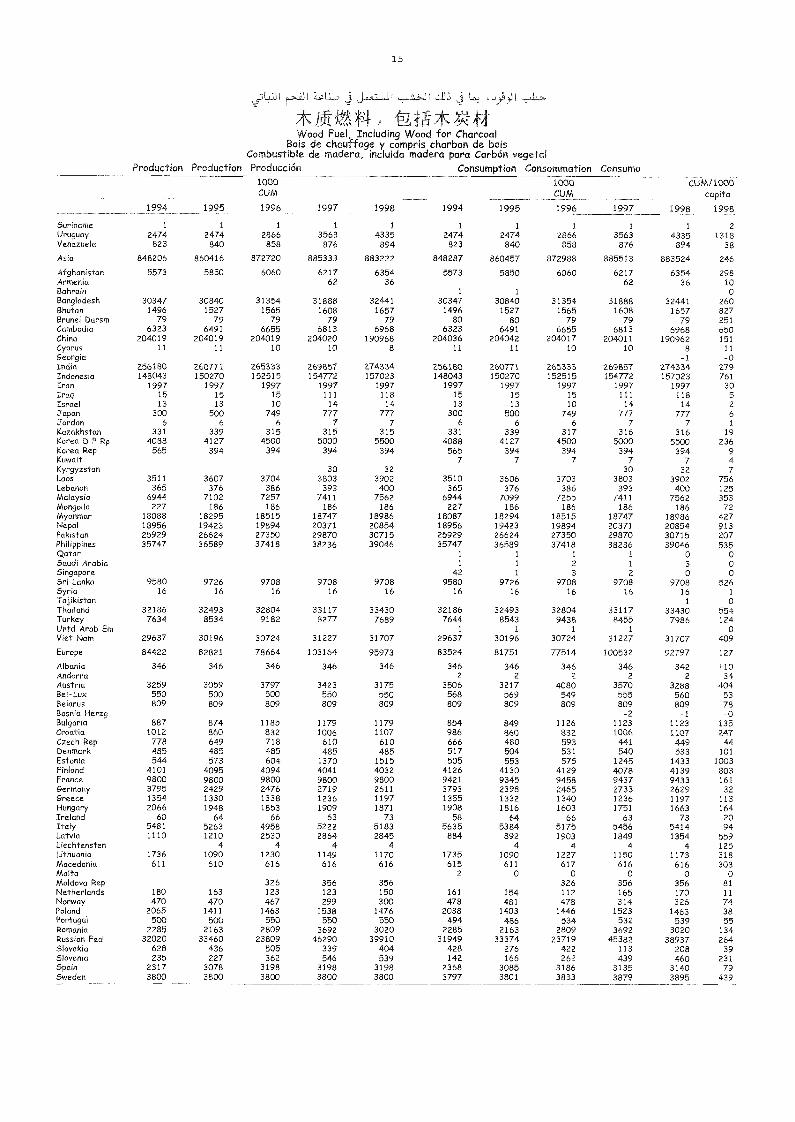
15
:u 11 j j.11
Wood Fuel, Including Wood for CharcoalBois de chauffage y compris charbon de bois
Combustible de madera, incluida madera para Carbón vegetalProduction Production Producción Consumption Consommation Consumo
1994 1995
1000CUM
1996 1997 1998 1994 1995
1000CUM
1996 1997
CUM/1000caOck
1998 1998
Suriname 1 1 1 1 1 1 1 1 1 1 2Uruguay 2474 2474 2866 3563 4335 2474 2474 2866 3563 4335 1318Venezuela 823 840 858 876 894 823 840 858 876 894 38
Asia 848206 860416 872720 885333 883222 848287 860457 872988 885513 883524 246
Afghanistan 5573 5850 6060 6217 6354 5573 5850 6060 6217 6354 298Armenia 62 36 62 36 10BahraM 1 1 oBangladesh 30347 30840 31354 31888 32441 30347 30840 31354 31888 32441 260Bhutan 1496 1527 1565 1608 1657 1496 1527 1565 1608 1657 827Brunei Darsm 79 79 79 79 79 80 80 79 79 79 251Cambodia 6323 6491 6655 6813 6968 6323 6491 6655 6813 6968 650China 204019 204019 204019 204020 190968 204036 204042 204017 204011 190962 151Cyprus 11 11 10 10 8 11 11 10 10 8 11
Georgia -1 -0India 256180 260771 265333 269857 274334 256180 260771 265333 269857 274334 279Indonesia 148043 150270 152515 154772 157023 148043 150270 152515 154772 157023 761Iran 1997 1997 1997 1997 1997 1997 1997 1997 1997 1997 30Iraq 15 15 15 111 118 15 15 15 111 118 5Israel 13 13 10 14 14 13 13 10 14 14 2
Japan 300 500 749 777 /II 300 500 749 777 777 6Jordan 6 6 6 7 7 6 6 6 7 7 1
Kazakhstan 331 339 315 315 315 331 339 317 316 316 19Korea D P Rp 4088 4127 4500 5000 5500 4088 4127 4500 5000 5500 236Korea Rep 565 394 394 394 394 565 394 394 394 394 9Kuwait 7 7 7 7 7 4Kyrgyzstan 30 32 30 32 7Laos 3511 3607 3704 3803 3902 3510 3606 3703 3803 3902 756Lebanon 365 376 386 393 400 365 376 386 393 400 125Malaysia 6944 7102 7257 7411 7562 6944 7099 7255 7411 7562 353Mongolia 227 186 186 186 186 227 186 186 186 186 72Myanmar 18088 18295 18515 18747 18986 18087 18294 18515 18747 18986 427Nepal 18956 19423 19894 20371 20854 18956 19423 19894 20371 20854 913Pakistan 25929 26624 27350 29870 30715 25929 26624 27350 29870 30715 207Philippines 35747 36589 37418 38236 39046 35747 36589 37418 38236 39046 535Qatar 1 1 1 1 o oSaudi Arabia 1 1 2 1 3 oSingapore 42 1 3 2 o oSri Lanka 9580 9726 9708 9708 9708 9580 9726 9708 9708 9708 526SyrM 16 16 16 16 16 16 16 16 16 16 1
Tajikistan 1 oThailand 32186 32493 32804 33117 33430 32186 32493 32804 33117 33430 554Turkey 7634 8534 9182 8277 7689 7644 8543 9438 8455 7986 124Untd Arab Em 1 1 1 1 oViet Nam 29637 30196 30724 31227 31707 29637 30196 30724 31227 31707 409
Europe 84422 82821 78664 103164 95973 83524 81751 77514 100532 92797 127
Albania 346 346 346 346 346 346 346 346 346 342 110Andorra 2 2 2 2 2 34Austria 3259 3059 3797 3423 3175 3506 3217 4080 3570 3288 404Bel-Lux 550 500 500 550 550 568 569 549 555 560 53Belarus 809 809 809 809 809 809 809 809 809 809 78Bosnia Herzg -2 -1 -0Bulgaria 887 874 1185 1179 1179 854 849 1126 1123 1123 135Croatia 1012 860 832 1006 1107 986 860 832 1006 1107 247Czech Rep 778 649 718 610 610 666 480 593 441 449 44Denmark 485 485 485 485 485 517 504 531 540 533 101Estonia 544 573 604 1370 1515 505 553 575 1245 1433 1003FMland 4101 4095 4094 4041 4032 4126 4130 4129 4078 4139 803France 9800 9800 9800 9800 9800 9421 9345 9458 9437 9433 161Germany 3795 2429 2476 2719 2611 3793 2398 2465 2733 2629 32Greece 1354 1330 1338 1236 1197 1355 1332 1340 1236 1197 113Hungary 2066 1948 1853 1909 1871 1908 1816 1603 1751 1663 164Ireland 60 64 66 63 73 58 64 66 63 73 20Italy 5481 5263 4958 5222 5183 5635 5384 5175 5456 5414 94Latvia 1110 1210 2530 2864 2845 884 892 1903 1849 1354 559Liechtensten 4 4 4 4 4 4 4 4 125Lithuania 1736 1090 1230 1149 1170 1735 1090 1227 1150 1173 318Macedonia 611 610 616 616 616 615 611 617 616 616 308Malta 2 0 0 0 0 0Moldova Rep 326 356 356 326 356 356 81Netherlands 180 163 123 123 150 161 154 112 165 170 11Norway 470 470 467 299 300 478 481 478 314 326 74Poland 2065 1411 1463 1538 1476 2038 1403 1446 1523 1463 38Portugal 500 500 550 550 550 494 486 534 532 539 55Romania 2285 2163 2809 3692 3020 2285 2163 2809 3692 3020 134Russian Fed 32020 33460 23809 46290 39910 31949 33374 23719 45382 38937 264Slovakia 628 436 505 339 404 428 276 422 113 208 39SlovenM 235 227 362 546 539 142 166 262 439 460 231SpaM 2317 3078 3198 3198 3198 2368 3085 3186 3135 3140 79Sweden 3800 3800 3800 3800 3800 3797 3801 3833 3879 3895 439
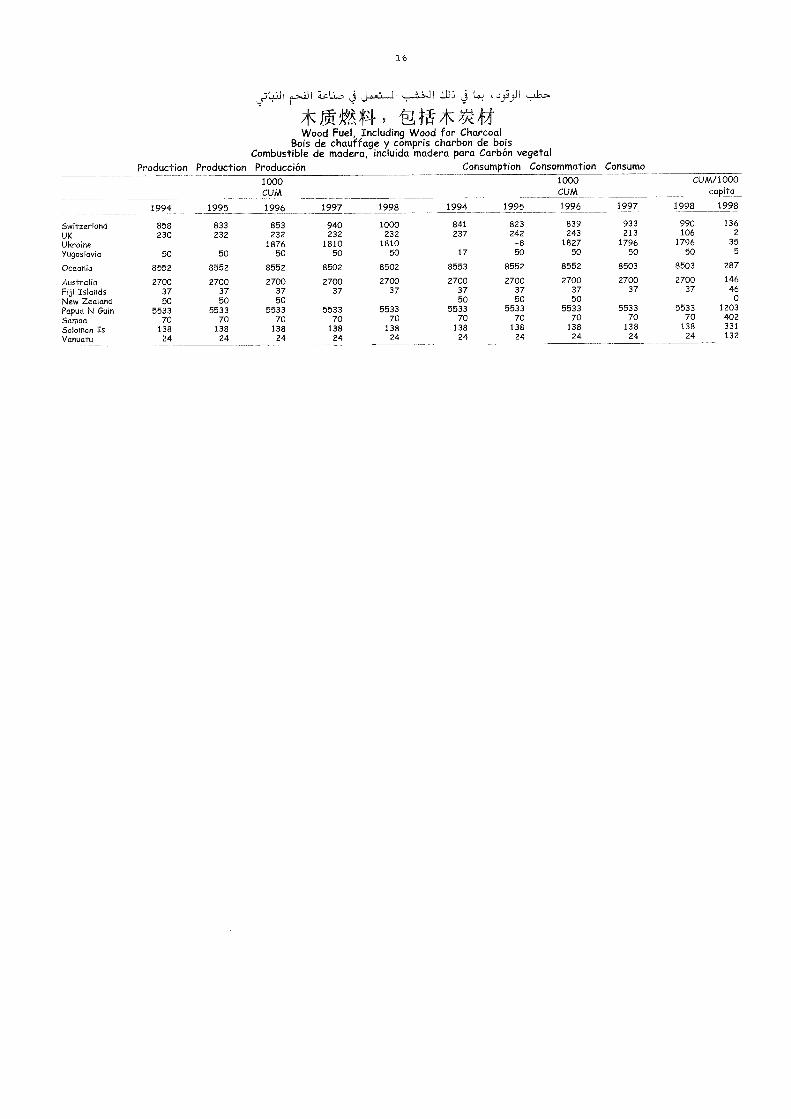
16
*IAWood Fuel, Including Wood for Charcoal
Bois de chauffage y compris charbon de boisCombustible de madera, incluida madera para Carbón vegetal
production Production Producción Consumption Consommation Consumo
1994 1995
1000CUM
1996 1997 1998 1994
1000CUM
1997
CUM/1000capita
1998 19981995 1996
Switzerland 858 833 853 940 1000 841 823 839 933 990 136
UK 230 232 232 232 232 237 242 243 213 106 2
Ukraine 1876 1810 1810 -8 1827 1796 1796 35
Yugoslavia 50 50 50 50 50 17 50 50 50 50 5
Oceania 8552 8552 8552 8502 8502 8553 8552 8552 8503 8503 287
Australia 2700 2700 2700 2700 2700 2700 2700 2700 2700 2700 146
Fiji Islands 37 37 37 37 37 37 37 37 37 37 46
New Zealand 50 50 50 50 50 50 0
Papua N Guin 5533 5533 5533 5533 5533 5533 5533 5533 5533 5533 1203
Samoa 70 70 70 70 70 70 70 70 70 70 402
Solomon Is 138 138 138 138 138 138 138 138 138 138 331
Vanuatu 24 24 24 24 24 24 24 24 24 24 132
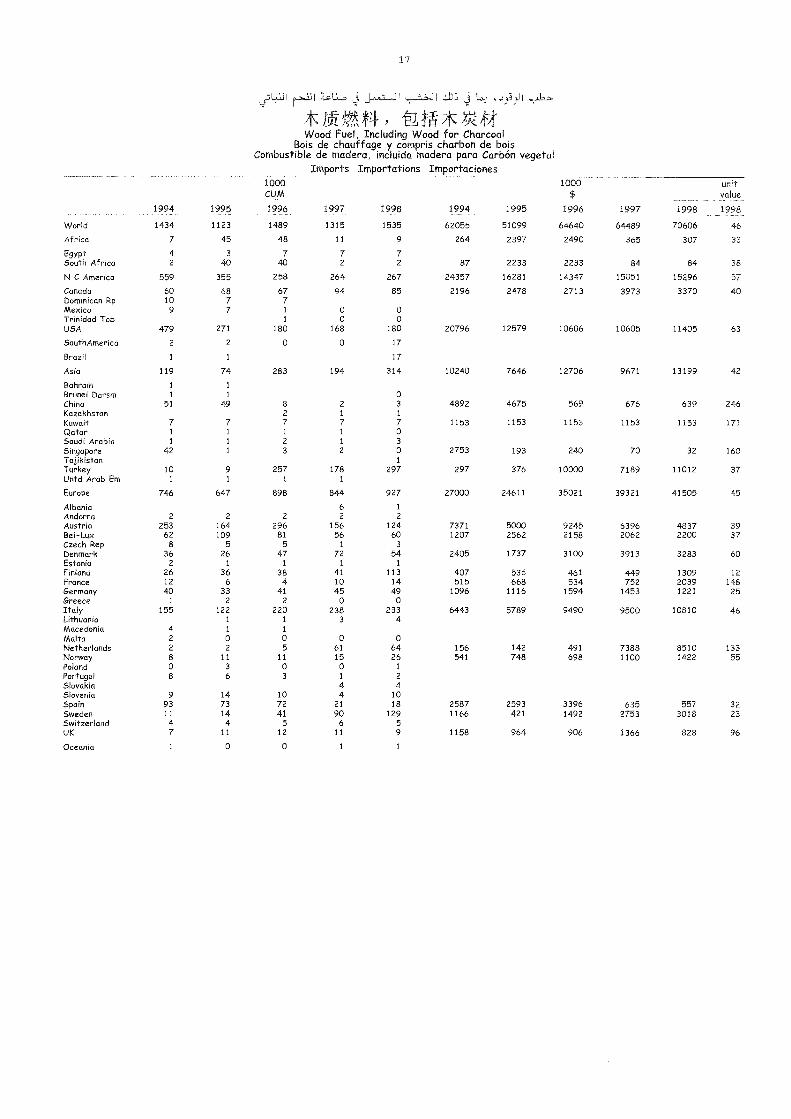
17
' La
70,Ct'Wood Fuel, Including Wood for Charcoal
Bois de chauffage y compris charbon de boisCombustible de madera, incluida madera para Carbón vegetal
Imports Importations Importaciones
1994 1995
1000CUM
1996 1997 1998 1994 1995
1000$
1996 1997 1998
unitvalue
1998
World 1434 1123 1489 1315 1535 62055 51099 64640 64489 70606 46
Africa 7 45 48 11 9 264 2397 2490 365 307 33
Egypt 4 3 7 7 7South Africa 2 40 40 2 2 87 2233 2233 84 84 38
N C America 559 355 258 264 267 24357 16281 14347 15051 15296 57
Canada 60 68 67 94 85 2196 2478 2713 3973 3370 40Dominican Rp 10 7 7Mexico 9 7 1 0 0Trinidad Tob 1 0 0USA 479 271 180 168 180 20796 12579 10606 10605 11405 63
SouthAmerica 2 2 0 0 17
Brazil 1 1 17
Asia 119 74 283 194 314 10240 7646 12706 9671 13199 42
Bahrain 1 1
Brunei Darsm 1 1 0China 51 49 8 2 3 4892 4675 569 676 639 246Kazakhstan 2 I 1
Kuwait 7 7 7 7 7 1153 1153 1153 1153 1153 171Qatar 1 1 1 1 0Saudi Arabia 1 1 2 1 3Singapore 42 1 3 2 0 2753 193 240 70 32 160Tajikistan 1
Turkey 10 9 257 178 297 297 376 10000 7189 11012 37Untd Arab Em I 1 1 1
Europe 746 647 898 844 927 27000 24611 35021 39321 41505 45
Albania 6 1
Andorra 2 2 2 2 2Austria 253 164 296 156 124 7371 5000 9245 6396 4837 39Bel-Lux 62 109 81 56 60 1207 2562 2158 2062 2200 37Czech Rep 8 5 5 1 3
Denmark 36 26 47 72 54 2405 1737 3100 3913 3283 60Estonia 2 1 I 1 1
Finland 26 36 38 41 113 407 536 461 449 1309 12France 12 6 4 10 14 515 668 534 752 2039 148Germany 40 33 41 45 49 1096 1116 1594 1453 1221 25Greece 1 2 2 0 0Italy 155 122 220 238 233 6443 5789 9490 9500 10810 46Lithuania 1 1 3 4Macedonia 4 1 1
Malta 2 0 0 0 0Netherlands 2 2 5 61 64 156 142 491 7388 8510 133Norway 8 11 11 15 26 541 748 698 1100 1422 55Poland 0 3 0 0 1
Portugal 8 6 3 1 2
Slovakia 4 4Slovenia 9 14 10 4 10Spain 93 73 72 21 18 2587 2593 3396 635 557 32Sweden 11 14 41 90 129 1166 421 1492 2753 3018 23Switzerland 4 4 5 6 5UK 7 11 12 11 9 1158 964 906 1366 828 96
Oceania 1 0 0 1 1
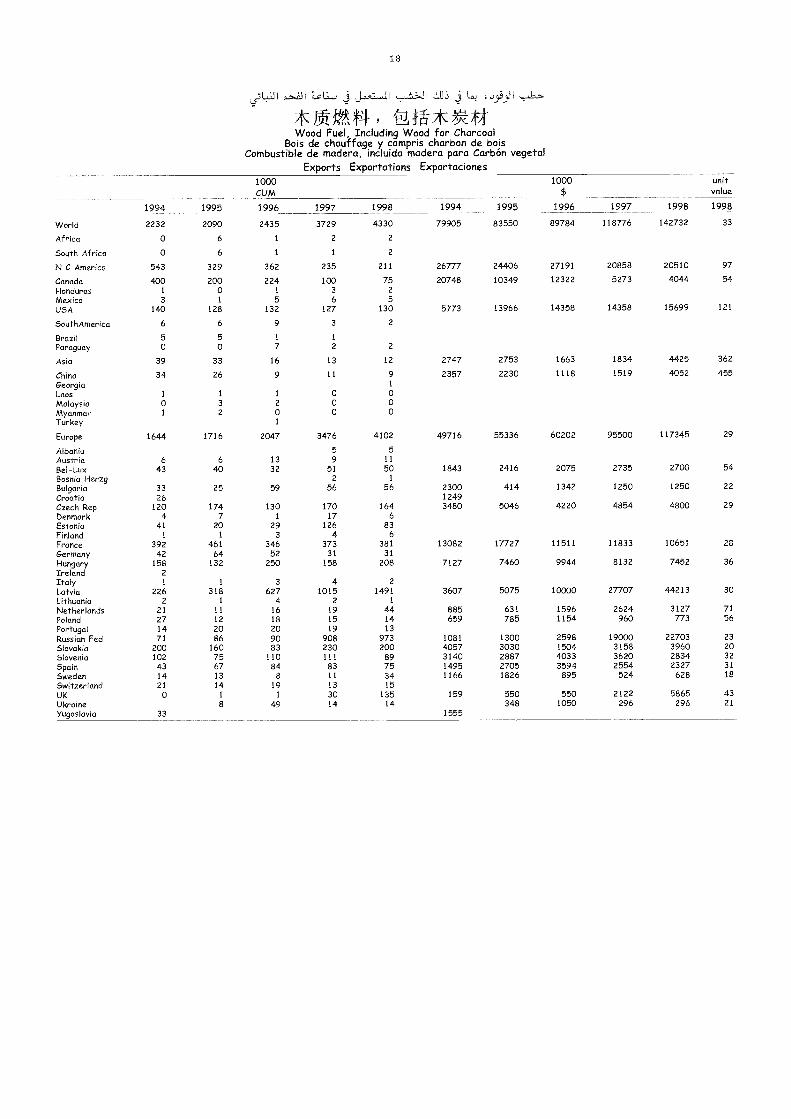
18
Wood Fuel, Including Wood for CharcoalBois de chauffage y compris charbon de bois
Combustible de madera, incluida madera para Carbón vegetalExports Exportations Exportaciones
1000CUM
1000$
1997 1998
unitvalue
1994 1995 1996 1997 1998 1994 1995 1996 1998
VVorld 2232 2090 2435 3729 4330 79905 83550 89784 118776 142732 33
Africa 0 6 1 2 2
South Africa 0 6 1 1 2
N C America 543 329 362 235 211 26/7/ 24406 27191 20858 20510 97
Canada 400 200 224 100 75 20748 10349 12322 5273 4044 54
Honduras 1 0 1 3 2
Mexico 3 1 5 6 5USA 140 128 132 127 130 5773 13966 14358 14358 15699 121
SouthAmerica 6 6 9 3 2
Brazil 5 5 1 1
Paraguay 0 0 7 2 2
Asia 39 33 16 13 12 2747 2753 1663 1834 4425 362
China 34 26 9 11 9 2357 2230 1118 1519 4052 455GeorgM 1
Laos 1 1 1 0 0Malaysia 0 3 2 0 0Myanmar 1 2 0 0 0Turkey 1
Europe 1644 1716 2047 3476 4102 49716 55336 60202 95500 117345 29
Albania 5 5
Austria 6 6 13 9 11
Bel-Lux 43 40 32 51 50 1843 2416 2075 2735 2700 54BosMa Herzg 2 1
Bulgaria 33 25 59 56 56 2300 414 1342 1250 1250 22Croafia 26 1249Czech Rep 120 174 130 170 164 3480 5046 4220 4854 4800 29Denmark 4 7 1 17 6
Estonia 41 20 29 126 83Finland 1 1 3 4 6
France 392 461 346 373 381 13082 17727 11511 11833 10651 28
Germany 42 64 52 31 31
Hungary 158 132 250 158 208 7127 7460 9944 8132 7452 36
IreMnd 2
Italy 1 1 3 4 2
Latvia 226 318 627 1015 1491 3607 5075 10000 27707 44213 30
LithuaMa 2 1 4 2 1
NetherMnds 21 11 16 19 44 885 631 1596 2624 3127 71
PoMnd 27 12 18 15 14 659 785 1154 960 773 56
Portugal 14 20 20 19 13Russian Fed 71 86 90 908 973 1081 1300 2598 19000 22703 23
SlovakM 200 160 83 230 200 4057 3030 1504 3158 3960 20
SMvenM 102 75 110 111 89 3140 2887 4033 3620 2834 32
SpaM 43 67 84 83 75 1495 2705 3594 2554 2327 31
Sweden 14 13 8 11 34 1166 1826 895 524 628 18
SwitzerMnd 21 14 19 13 15UK 0 1 1 30 135 159 550 550 2122 5865 43UkraMe 8 49 14 14 348 1050 296 296 21
Yugoslavia 33 1555
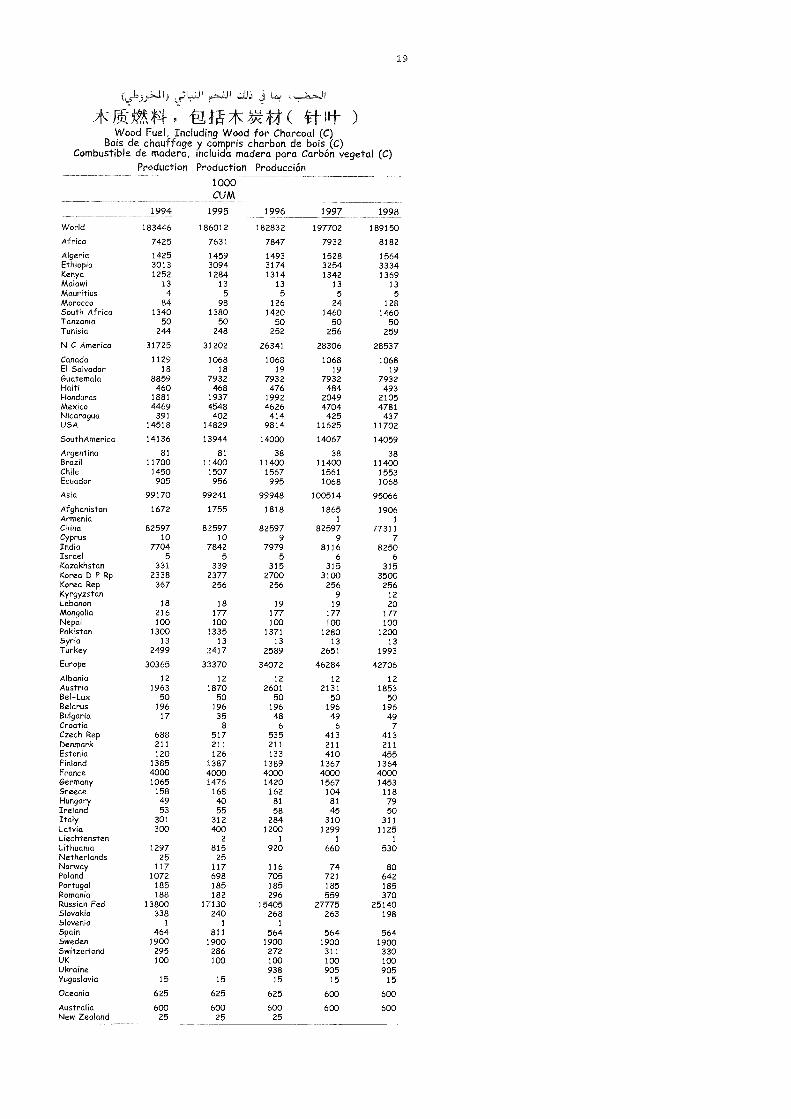
'NIN*V-Kff( )Wood Fuel, Including Wood for Charcoal (C)
Bois de chauffage y compris charbon de bois (C)Combustible de madera, incluida madera para Carbón vegetal (C)
Production Production Producción1000CUM
19
1994 1995 1996 1997 1998
World 183446 186012 182832 197702 189150
Africa 7425 7631 7847 7932 8182
Algeria 1425 1459 1493 1528 1564Ethiopia 3013 3094 3174 3254 3334Kenya 1252 1284 1314 1342 1369Malawi 13 13 13 13 13Mauritius 4 5 5 5 5
Morocco 84 98 126 24 128South Africa 1340 1380 1420 1460 1460Tanzania 50 50 50 50 50Tunisia 244 248 252 256 259
N C America 31725 31202 26341 28306 28537
Canada 1129 1068 1068 1068 1068El Salvador 18 18 19 19 19Guatemala 8859 7932 7932 7932 7932Haiti 460 468 476 484 493Honduras 1881 1937 1992 2049 2105Mexico 4469 4548 4626 4704 4781Nicaragua 391 402 414 425 437USA 14518 14829 9814 11625 11702
SouthAmerica 14136 13944 14000 14067 14059
Argentina 81 81 38 38 38Brazd 11700 11400 11400 11400 11400Chile 1450 1507 1567 1561 1553Ecuador 905 956 995 1068 1068
Asia 99170 99241 99948 100514 95066
Afghanistan 1672 1755 1818 1865 1906Armenia 1 1
China 82597 82597 82597 82597 77311Cyprus 10 10 9 9 7India 7704 7842 7979 8116 8250Israel 5 5 5 6 6Kazakhstan 331 339 315 315 315Korea D P Rp 2338 2377 2700 3100 3500Korea Rep 367 256 256 256 256Kyrgyzstan 9 12Lebanon 18 18 19 19 20Mongolia 216 177 177 177 177Nepal 100 100 100 100 ICCPakistan 1300 1335 1371 1280 1200Syria 13 13 13 13 13Turkey 2499 2417 2589 2651 1993
Europe 30365 33370 34072 46284 42706
Albania 12 12 12 12 12Austria 1963 1870 2601 2131 1853Bel-Lux 50 50 50 50 50Belarus 196 196 196 196 196Bulgaria 17 35 48 49 49Croatia 8 6 6 7Czech Rep 688 517 535 413 413Denmark 211 211 211 211 211Estonia 120 126 133 410 455FMland 1385 1387 1389 1367 1364France 4000 4000 4000 4000 4000Germany 1065 1476 1420 1567 1453Greece 158 168 162 104 118Hungary 49 40 81 81 79Ireland 53 55 58 45 50Italy 301 312 284 310 311Latvia 300 400 1200 1299 1125Liechtensten 2 1 1 1
LithuaMa 1297 815 920 660 530Netherlands 25 25Norway 117 117 116 74 80Poland 1072 698 705 721 642Portugal 185 185 185 185 185RomaMa 188 182 296 559 370Russian Fed 13800 17130 15405 2/1/5 25140Slovakia 338 240 268 263 198Slovenia 1 1 1
Spain 464 811 564 564 564Sweden 1900 1900 1900 1900 1900Switzerland 295 286 272 311 330UK 100 100 100 100 100Ukraine 938 905 905Yugoslavia 15 15 15 15 15
Oceania 625 625 625 600 600
Australia 600 600 600 600 600New Zealand 25 25 25
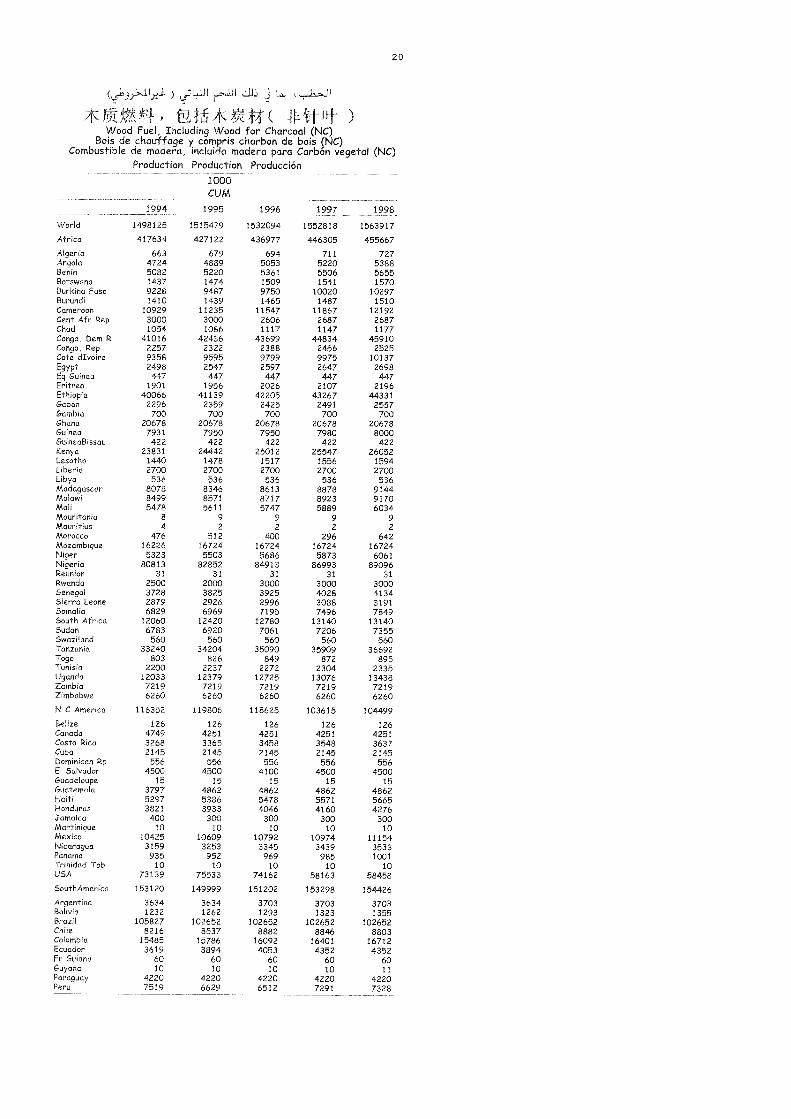
j*0.-Mx4 NIN4NV+4 )
Wood Fuel, Including Wood for Charcoal (NC)Bois de chauffage y compris charbon de bois (NC)
Combustible de madera, incluido madera para Carbon vegetal (NC)Production Production Producción
1000CUM
20
1994 1995 1996 1997 1998
World 1498125 1515479 1532094 1552818 1563917
Africa 417634 427122 436977 446305 455667
Algeria 663 679 694 711 727Angola 4724 4889 5053 5220 5388Benin 5082 5220 5361 5506 5655Botswana 1437 1474 1509 1541 1570Burkina Faso 9228 9487 9750 10020 10297Burundi 1410 1439 1465 1487 1510Cameroon 10929 11235 11547 11867 12192Cent Afr Rep 3000 3000 2606 2687 2687Chad 1054 1086 1117 1147 1177Congo, Dem R 41016 42436 43699 44834 45910Congo, Rep 2257 2322 2388 2456 2525Cote dIvoire 9358 9595 9799 9975 10137Egypt 2498 2547 2597 2647 2698Eq Guinea 447 447 447 447 447Eritrea 1901 1956 2026 2107 2196Ethiopia 40066 41139 42205 43267 44331Gabon 2296 2359 2425 2491 2557Gambia 700 700 700 700 700Ghana 20678 20678 20678 20678 20678Guinea 7931 7950 7950 7980 8000GuineaBissau 422 422 422 422 422Kenya 23831 24442 25012 25547 26052Lesotho 1440 1478 1517 1556 1594Liberia 2700 2700 2700 2700 2700Libya 536 536 536 536 536Madagascar 8078 8346 8613 8878 9144Malawi 8499 8571 8717 8923 9170Mali 5478 5611 5747 5889 6034Mauritania 8 9 9 9 9Mauritius 4 2 2 2 2Morocco 476 512 400 296 642Mozambique 16226 16724 16724 16724 16724Niger 5323 5503 5686 5873 6061Nigeria 80813 82852 84913 86993 89096Reunion 31 31 31 31 31Rwanda 2500 2000 3000 3000 3000Senegal 3728 3825 3925 4028 4134Sierra Leone 2879 2926 2996 3088 3191Somalia 6829 6969 7195 7496 7849South Africa 12060 12420 12780 13140 13140Sudan 6783 6920 7061 7206 7355Swaziland 560 560 560 560 560Tanzania 33240 34204 35090 35909 36692Togo 803 826 849 872 895Tunisia 2200 2237 2272 2304 2335Uganda 12033 12379 12725 13076 13438Zambia 7219 7219 7219 7219 7219Zimbabwe 6260 6260 6260 6260 6260
N C America 116352 119806 118625 103615 104499
Belize 126 126 126 126 126Canada 4749 4251 4251 4251 4251Costa Rica 3268 3365 3458 3548 3637Cuba 2145 2145 2145 2145 2145Dominican Rp 556 556 556 556 556El Salvador 4500 4500 4100 4500 4500Guadeloupe 15 15 15 15 15Guatemala 3797 4862 4862 4862 4862Haiti 5297 5386 5478 5571 5665Honduras 3821 3933 4046 4160 4276Jamaica 400 300 300 300 300Martinique 10 10 10 10 10Mexico 10425 10609 10792 10974 11154Nicaragua 3159 3253 3345 3439 3533Panama 935 952 969 985 1001Trinidad Tob 10 10 10 10 10USA 73139 75533 74162 58163 58458SouthAmerica 153120 149999 151202 153298 154426
Argentina 3634 3634 3703 3703 3703Bolivia 1232 1262 1293 1323 1355Brazil 105827 102652 102652 102652 102652Chile 8216 8537 8882 8846 8803Colombia 15485 15786 16092 16401 16712Ecuador 3619 3894 4053 4352 4352Fr Guiana 60 60 60 60 60Guyana 10 10 10 10 11Paraguay 4220 4220 4220 4220 4220Peru 7519 6629 6512 7291 7328
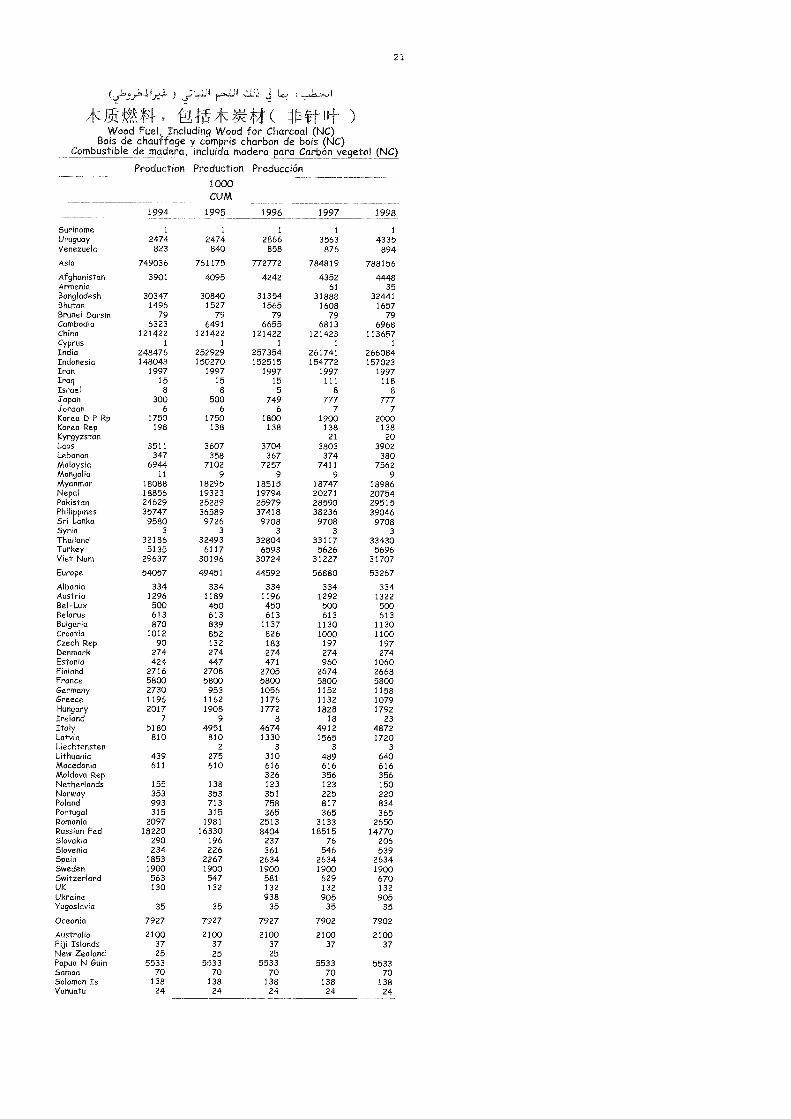
f --t[at )Wood Fuel, Including Wood for Charcoal (NC)
Bois de chauffage y compris charbon de bois (NC)Combustible de madera, incluida madera para Carbon vegetal (NC)
Production Production Producción1000CUM
21
1994 1995 1996 1997 1998
Suriname 1 1 1 1 1
Uruguay 2474 2474 2866 3563 4335Venezuela 823 840 858 876 894
Asia 749036 761175 772772 784819 788156
Afghanistan 3901 4095 4242 4352 4448Armenia 61 35Bangladesh 30347 30840 31354 31888 32441Bhutan 1496 1527 1565 1608 1657Brunei Darsm 79 79 79 79 79Cambodia 6323 6491 6655 6813 6968China 121422 121422 121422 121423 113657Cyprus 1 1 1 1 1
India 248476 252929 257354 261741 266084Indonesia 148043 150270 152515 154772 157023Iran 1997 1997 1997 1997 1997Iraq 15 15 15 111 118Israel 8 8 5 8 8Japan 300 500 749 /Jordan 6 6 6 7 7Korea D P Rp 1750 1750 1800 1900 2000Korea Rep 198 138 138 138 138Kyrgyzstan 21 20Laos 3511 3607 3704 3803 3902Lebanon 347 358 367 374 380Malaysia 6944 7102 7257 7411 7562Mongolia 11 9 9 9 9Myanmar 18088 18295 18515 18747 18986Nepal 18856 19323 19794 20271 20754Pakistan 24629 25289 25979 28590 29515Philippines 35747 36589 37418 38236 39046Sri Lanka 9580 9726 9708 9708 9708Syria 3 3 3 3 3Thailand 32186 32493 32804 33117 33430Turkey 5135 6117 6593 5626 5696Viet Nam 29637 30196 30724 31227 31707
Europe 54057 49451 44592 56880 53267
Albania 334 334 334 334 334Austria 1296 1189 1196 1292 1322Bel-Lux 500 450 450 500 500Belarus 613 613 613 613 613Bulgaria 870 839 1137 1130 1130Croatia 1012 852 826 1000 1100Czech Rep 90 132 183 197 197Denmark 274 274 274 274 274Estonia 424 447 471 960 1060Finland 2716 2708 2705 2674 2668France 5800 5800 5800 5800 5800Germany 2730 953 1056 1152 1158Greece 1196 1162 1176 1132 1079Hungary 2017 1908 1772 1828 1792Ireland 7 9 8 18 23Italy 5180 4951 4674 4912 4872Latvia 810 810 1330 1565 1720Liechtensten 2 3 3 3
Lithuania 439 275 310 489 640Macedonia 611 610 616 616 616Moldova Rep 326 356 356Netherlands 155 138 123 123 150Norway 353 353 351 225 220Poland 993 713 758 817 834Portugal 315 315 365 365 365Romania 2097 1981 2513 3133 2650Russian Fed 18220 16330 8404 18515 14770Slovakia 290 196 237 76 206Slovenia 234 226 361 546 539Spain 1853 2267 2634 2634 2634Sweden 1900 1900 1900 1900 1900Switzerland 563 547 581 629 670UK 130 132 132 132 132Ukraine 938 905 905Yugoslavia 35 35 35 35 35
Oceania 7927 7927 7927 7902 7902
Australia 2100 2100 2100 2100 2100Fiji Islands 37 37 37 37 37New Zealand 25 25 25Papua N Guin 5533 5533 5533 5533 5533Samoa 70 70 70 70 70Solomon Is 138 138 138 138 138Vanuatu 24 24 24 24 24
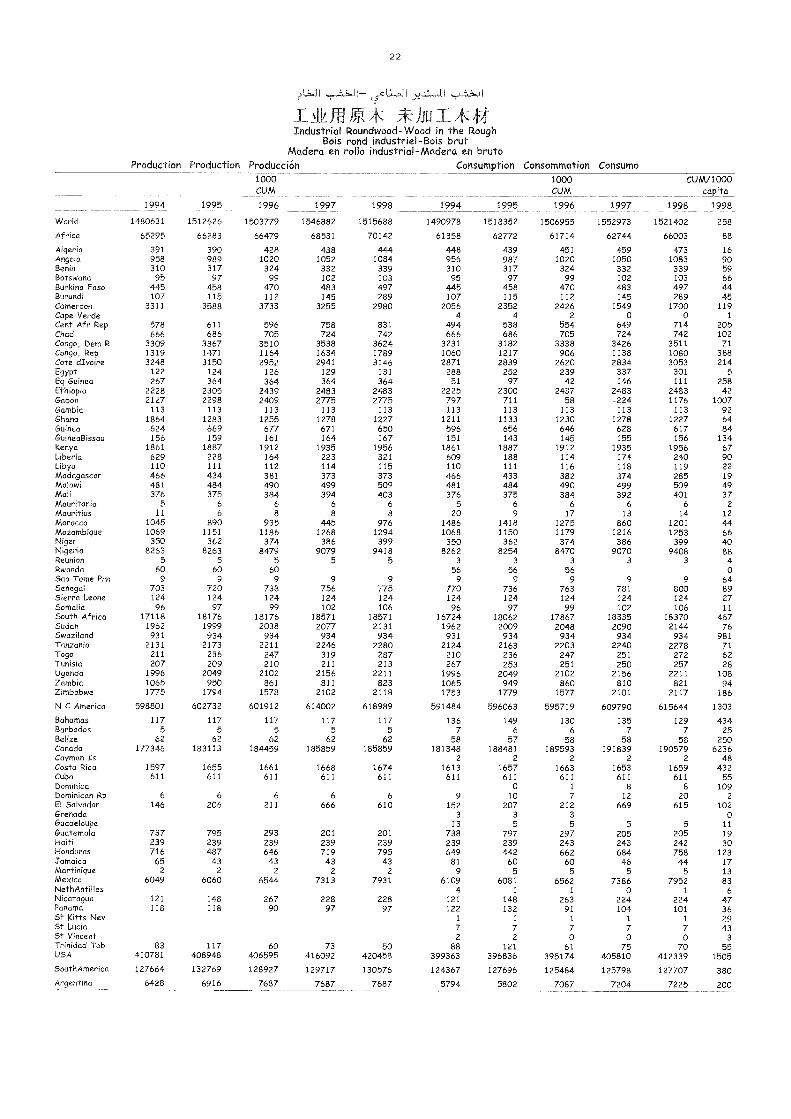
22
I fg*huIfitIndustrial Roundywood-Wood in the Rough
Bois rond industriel-Bois brutMadera en rollo industrial-Madera en bruto
Production Production Producción Consumption Consommation Consumo
1994 1995
1000CUM
1996 1997 1998 1994 1995
1000CUM
1996 1997
CUAA/1000capita
1998 1998
VVorld 1480631 1512626 1503779 1546882 1515688 1490978 1518352 1506955 1552973 1521402 258
Africa 65295 66283 66479 68531 70142 61358 62772 61714 62744 66003 88
Algeria 391 390 428 438 444 448 439 451 459 473 16Angola 958 989 1020 1052 1084 956 987 1020 1050 1083 90Benin 310 317 324 332 339 310 317 324 332 339 59Botswana 95 97 99 102 103 95 97 99 102 103 66Burkina Faso 445 458 470 483 497 445 458 470 483 497 44Burundi 107 115 112 145 289 107 115 112 145 289 45Cameroon 3311 3588 3733 3255 2980 2056 2352 2426 1549 1700 119Cape Verde 4 4 2 0 0 1
Cent Afr Rep 578 611 596 758 831 494 538 554 649 714 205Chad 666 686 705 724 742 666 686 705 724 742 102Congo, Dem R 3309 3367 3510 3538 3624 3231 3182 3338 3426 3511 71Congo, Rep 1319 1471 1164 1634 1789 1060 1217 906 1138 1080 388Cote dIvoire 3248 3150 2952 2941 3146 2871 2839 2620 2834 3053 214Egypt 122 124 126 129 131 288 252 239 337 301 5
Eq Guinea 267 364 364 364 364 51 97 -42 -146 111 258Ethiopia 2228 2305 2439 2483 2483 2225 2300 2437 2483 2483 42Gabon 2127 2298 2409 2775 2775 797 711 58 -224 1176 1007Gambia 113 113 113 113 113 113 113 113 113 113 92Ghana 1864 1283 1255 1278 1227 1211 1133 1230 1278 1227 64Guinea 624 669 677 671 650 596 656 646 628 617 84GuineaBissau 156 159 161 164 167 151 143 145 155 156 134Kenya 1861 1887 1912 1935 1956 1861 1887 1912 1935 1956 67Liberia 629 228 164 223 321 609 188 114 174 240 90Libya 110 111 112 114 115 110 111 116 118 119 22Madagascar 466 434 381 373 373 466 433 382 374 285 19Malawi 481 484 490 499 509 481 484 490 499 509 49Mali 376 375 384 394 403 376 375 384 392 401 37Mauritania 5 6 6 6 6 5 6 6 6 6 2Mauritius 11 6 8 8 8 20 9 17 13 14 12Morocco 1045 890 935 445 976 1486 1418 1275 860 1201 44Mozambique 1069 1151 1186 1268 1294 1068 1150 1179 1216 1253 66Niger 350 362 374 386 399 350 362 374 386 399 40Nigeria 8263 8263 8479 9079 9418 8262 8254 8470 9070 9408 88Reunion 5 5 5 5 5 3 3 3 3 3 4Rwanda 60 60 60 56 56 56 0Sao Tome Prn 9 9 9 9 9 9 9 9 9 9 64Senegal 703 720 738 756 775 770 736 763 781 800 89Sierra Leone 124 124 124 124 124 124 124 124 124 124 27Somalia 96 97 99 102 106 96 97 99 102 106 11South Africa 17118 18176 18176 18571 18571 16724 18062 17867 18335 18370 467Sudan 1962 1999 2038 2077 2131 1962 2009 2048 2090 2144 76Swaziland 931 934 934 934 934 931 934 934 934 934 981Tanzania 2131 2173 2211 2246 2280 2124 2163 2203 2240 2278 71Togo 211 236 247 319 287 210 236 247 251 272 62Tunisia 207 209 210 211 213 267 253 251 250 257 28Uganda 1996 2049 2102 2156 2211 1996 2049 2102 2156 2211 108Zambia 1065 950 861 811 823 1065 949 860 810 821 94Zimbabwe 1775 1794 1578 2102 2118 1753 1779 1577 2101 2117 186
N C America 598801 602732 601912 614002 618989 591484 596063 595719 609790 615644 1303
Bahamas 117 117 117 117 117 136 149 130 135 129 434Barbados 5 5 5 5 5 7 6 6 7 7 25Belize 62 62 62 62 62 58 57 58 58 58 250Canada 177346 183113 184459 185859 185859 181348 188481 189593 191839 190579 6236Cayman Is 2 2 2 2 2 48Costa Rica 1597 1655 1661 1668 1674 1613 1657 1663 1653 1659 432Cuba 611 611 611 611 611 611 611 611 611 611 55Dominica 0 1 8 8 109Dominican Rp 6 6 6 6 6 9 10 7 12 20 2El Salvador 146 206 211 666 610 152 207 212 669 615 102Grenada 3 3 3 0Guadeloupe 13 5 5 5 5 11Guatemala 737 795 293 201 201 738 797 297 205 205 19Hadi 239 239 239 239 239 239 239 243 243 242 30Honduras 716 487 646 719 795 649 442 662 684 758 123Jamaica 65 43 43 43 43 81 60 60 46 44 17Martinique 2 2 2 2 2 9 5 5 5 5 13Mexico 6049 6060 6544 7313 7931 6109 6081 6562 7386 7952 83NethAntMes 4 1 1 0 1 6Nicaragua 121 148 267 228 228 121 148 263 224 224 47Panama 118 118 90 97 97 122 132 91 104 101 36St Kftts Nev 1 1 1 1 1 29St Lucia 7 7 7 7 7 43St Vincent 2 2 0 0 0 3Trinidad Tob 83 117 60 73 50 88 121 61 75 70 55USA 410781 408948 406595 416092 420458 399363 396836 395174 405810 412339 1505
SouthAmerica 127664 132769 128927 129717 130576 124367 127696 125484 125798 127707 380Argentina 6428 6916 7687 7687 7687 5794 5802 7087 7204 7225 200
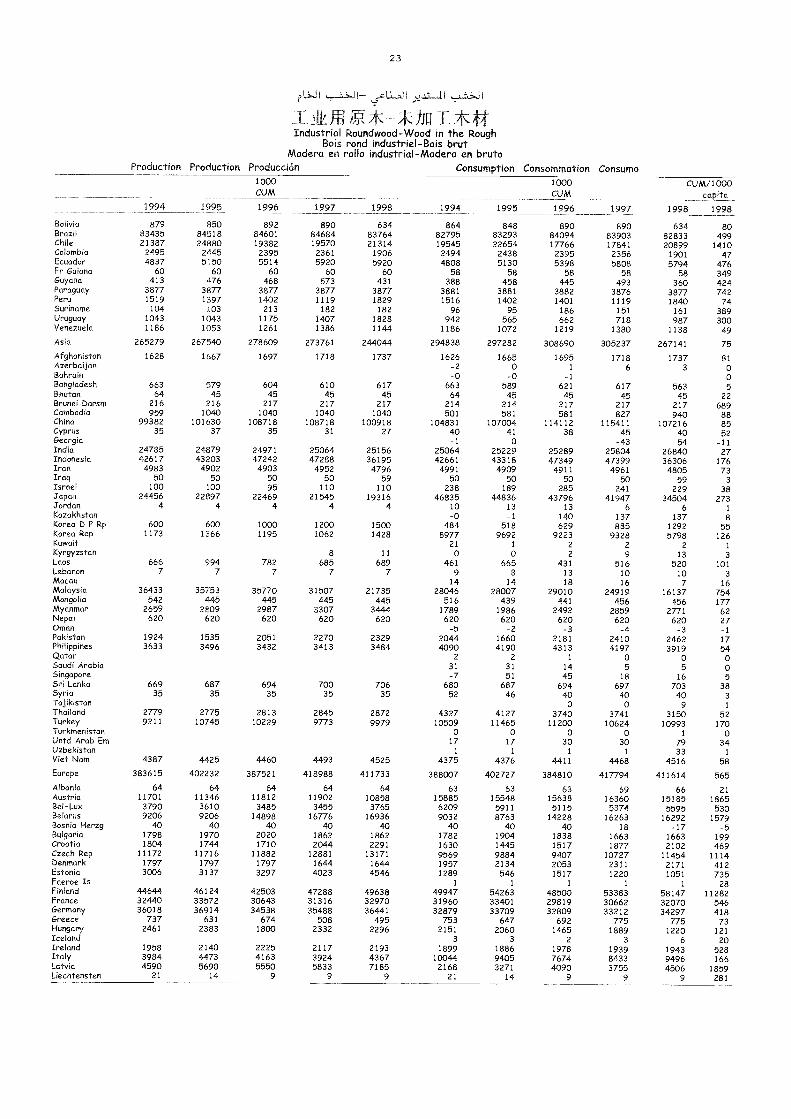
23
,l1
_41% 0JjiIfcffIndustrial Roundwood-Wood in the Rough
Bois rond industriel-Bois brutMadera en rollo industrial-Madera en bruto
Production Production Producción Consumption Consommation Consumo
1994 1995
1000CUM
1996 1997 1998 1994 1995
1000CUM
1996 1997
CUM/1000capita
1998 1998
Bolivia 879 850 892 890 634 864 848 890 890 634 80Brazil 83435 84518 84601 84684 83764 82795 83293 84094 83903 82833 499Chile 21387 24880 19382 19570 21314 19545 22654 17766 17841 20899 1410Colombia 2495 2445 2395 2361 1906 2494 2438 2395 2356 1901 47Ecuador 4837 5150 5514 5920 5920 4808 5130 5398 5808 5794 476Fr Guiana 60 60 60 60 60 58 58 58 58 58 349Guyana 413 476 468 573 431 388 458 445 493 360 424Paraguay 3877 3877 3877 3877 3877 3881 3881 3882 3876 3877 742Peru 1519 1397 1402 1119 1829 1516 1402 1401 1119 1840 74Suriname 104 103 213 182 182 96 95 186 151 161 389Uruguay 1043 1043 1175 1407 1828 942 565 662 718 987 300Venezuela 1186 1053 1261 1386 1144 1186 1072 1219 1380 1138 49Asia 265279 267540 278609 273761 244044 294838 297282 308690 305237 267141 75Afghanistan 1628 1667 1697 1718 1737 1626 1665 1695 1718 1737 81AzerbaijanBahrain
-2-o
o-o
1
-16 3 o
oBangladesh 663 579 604 610 617 663 589 621 617 563 5Bhutan 64 45 45 45 45 64 45 45 45 45 22Brunei Darsrn 216 216 217 217 217 214 214 217 217 217 689Cambodia 959 1040 1040 1040 1040 501 581 581 827 940 88China 99382 101630 108718 108718 100918 104831 107004 114112 115411 107216 85Cyprus 35 37 35 31 27 40 41 38 45 40 52Georgia -1 o -43 -54 -11India 24785 24879 24971 25064 25156 25064 25229 25289 25804 26840 27Indonesia 42617 43203 47242 47288 36195 42661 43318 47349 47399 36306 176Iran 4983 4902 4903 4952 4796 4991 4909 4911 4961 4805 73Iraq 50 50 50 50 59 50 50 50 50 59 3Israel 100 100 95 110 110 238 189 285 241 229 38Japan 24456 22897 22469 21545 19316 46835 44836 43796 41947 34504 273Jordan 4 4 4 4 4 10 13 13 6 6 1
Kazakhstan -o -1 140 137 137 8Korea D P Rp 600 600 1000 1200 1500 484 518 629 885 1292 55Korea Rep 1173 1366 1195 1062 1428 8977 9692 9223 9328 5798 126Kuwait 21 1 2 2 2 1
Kyrgyzstan 8 11 o o 2 9 13 3Laos 666 994 782 685 689 461 665 431 516 520 101Lebanon 7 7 7 7 7 9 8 13 10 10 3Macau 14 14 18 16 7 16Malaysia 36433 35753 35770 31507 21735 28046 28007 29010 24919 16137 754Mongolia 542 445 445 445 445 516 439 441 456 456 177Myanmar 2659 2809 2987 3307 3444 1789 1986 2492 2859 2771 62Nepal 620 620 620 620 620 620 620 620 620 620 27Ornan -5 -2 -3 -4 -3 -1Pakistan 1924 1535 2051 2270 2329 2044 1660 2181 2410 2462 17Philippines 3633 3496 3432 3413 3484 4090 4190 4313 4197 3919 54Qatar 2 2 1 o o oSaudí Arabia 31 31 14 5 5 oSingapore -7 51 45 18 16 5Sri Lanka 669 687 694 700 706 680 687 694 697 703 38Syria 35 35 35 35 35 52 46 ao 40 40 3Tajikistan o o 9 1
Thailand 2779 2775 2813 2845 2872 4327 4127 374-0 3741 3150 52Turkey 9211 10745 10229 9773 9979 10509 11465 11200 10624 10993 170Turkmenistan o o o o 1 oUntd Arab Em 17 17 30 30 79 34Uzbekistan 1 1 1 1 33 1
Viet Nam 4387 4425 4460 4493 4525 4375 4376 4411 4468 4516 58
Europe 383615 402232 387521 418988 411733 388007 402727 384810 417794 411614 565Albania 64 64 64 64 64 63 63 63 69 66 21Austria 11701 11346 11812 11902 10858 15885 15548 15638 16360 15185 1865Bel-Lux 3790 3610 3485 3455 3765 6209 5911 5115 5374 5595 530Belarus 9206 9206 14898 16776 16936 9032 8763 14228 16263 16292 1579Bosnia Herzg 40 40 40 40 40 40 40 40 18 -17 -5Bulgaria 1798 1970 2020 1862 1862 1782 1904 1838 1663 1663 199Croatia 1804 1744 1710 2044 2291 1630 1445 1517 1877 2102 469Czech Rep 11172 11716 11882 12881 13171 9569 9884 9407 10727 11454 1114Denmark 1797 1797 1797 1644 1644 1957 2134 2053 2311 2171 412Estonia 3006 3137 3297 4023 4546 1289 546 1517 1220 1051 735Faeroe Is 1 1 1 1 1 28Finland 44644 46124 42503 47288 49638 49947 54263 48500 53383 58147 11282France 32440 33572 30643 31316 32970 31960 33401 29819 30662 32070 546Germany 36018 36914 34538 35488 36441 32879 33709 32809 33212 34297 418Greece 737 631 674 508 495 753 647 692 775 775 73Hungary 2461 2383 1800 2332 2296 2151 2060 1465 1889 1220 121Iceland 3 3 2 3 6 20Ireland 1958 214,0 2225 2117 2193 1899 1886 1978 1939 1943 528Italy 3984 4473 4163 3924 4367 10044 9405 7674 8433 9496 166Latvia 4590 5690 5550 5833 7185 2168 3271 4090 3755 4506 1859Liechtensten 21 14 9 9 9 21 14 9 9 9 281
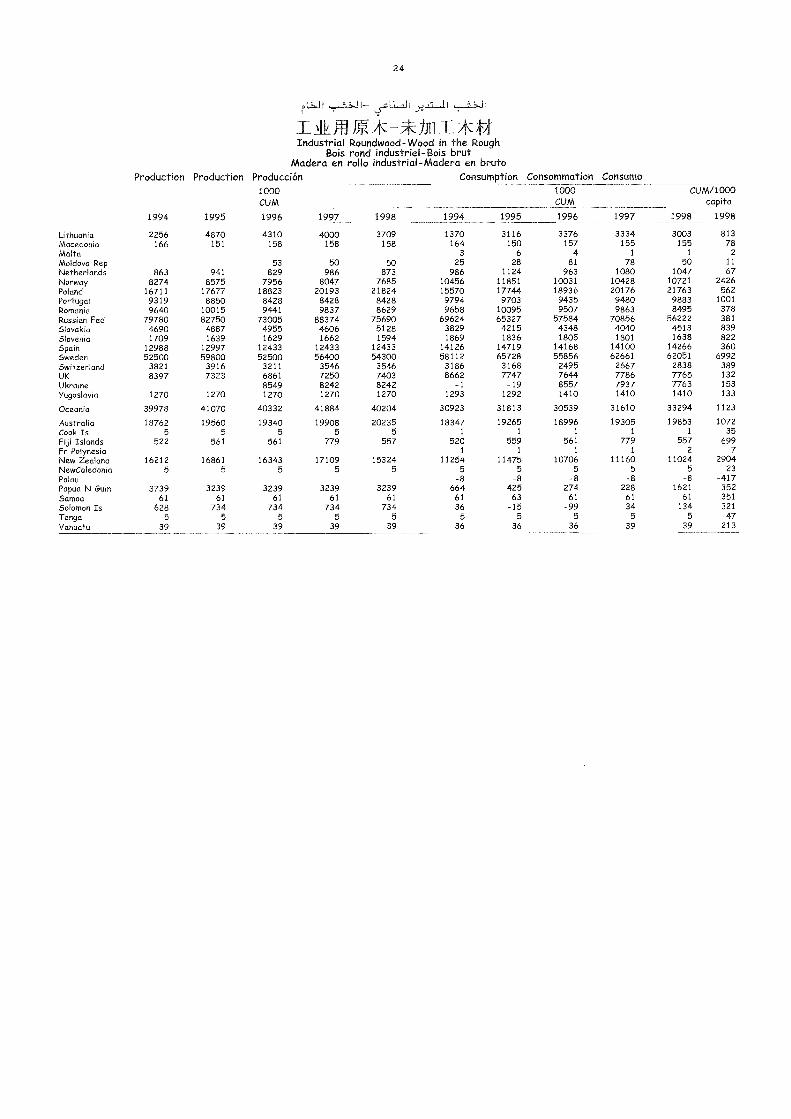
24
,
thuIndustrial Roundwood-Wood in the Rough
Bois rond industriel-Bois brutMadera en rollo industrial-Madera en bruto
Production Production Producción Consumption Consommation Consumo
1994 1995
1000CUM
1996 1997 1998 1994 1995
1000CUM
1996 1997
CUM/1000capita
1998 1998
Lithuania 2256 4870 4310 4000 3709 1370 3116 3376 3334 3003 813Macedonia 166 151 158 158 158 164 150 157 155 155 78Malta 3 6 4 1 1 2
Moldova Rep 53 50 50 25 28 81 78 50 11
Netherlands 863 941 829 986 873 986 1124 963 1080 1047 67Norway 8274 8575 7956 8047 7685 10456 11851 10031 10428 10721 2426Poland 16711 17677 18823 20193 21824 15570 17744 18936 20176 21763 562Portugal 9319 8850 8428 8428 8428 9794 9703 9435 9480 9883 1001Romania 9640 10015 9441 9837 8629 9658 10095 9507 9863 8495 378Russian Fed 79780 82750 73005 88374 75690 69624 65327 57584 70856 56222 381Slovakia 4690 4887 4955 4606 5128 3829 4215 4348 4040 4513 839Slovenia 1709 1639 1629 1662 1594 1869 1836 1805 1801 1638 822Spain 12988 12997 12433 12433 12433 14126 14719 14168 14100 14266 360Sweden 52500 59800 52500 56400 54300 58112 65728 55856 62661 62051 6992Switzerland 3821 3916 3211 3546 3546 3186 3168 2495 2667 2838 389UK 8397 7323 6861 7250 7403 8662 7747 7644 7786 7765 132Ukraine 8549 8242 8242 -1 -19 8557 7937 7763 153Yugoslavia 1270 1270 1270 1270 1270 1293 1292 1410 1410 1410 133
Oceania 39978 41070 40332 41884 40204 30923 31813 30539 31610 33294 1123
Australia 18762 19560 19340 19908 20235 18347 19265 18996 19305 19853 1072Cook Is 5 5 5 5 5 1 1 1 1 1 35Fiji Islands 522 561 561 779 557 520 559 561 779 557 699Fr Polynesia 1 1 1 1 2 7New Zealand 16212 16861 16343 17109 15324 11254 11475 10706 11160 11024 2904NewCaledonia 5 5 5 5 5 5 5 5 5 5 23
Palau -8 -8 -8 -8 -8 -417Papua N Guin 3739 3239 3239 3239 3239 664 425 274 228 1621 352Samoa 61 61 61 61 61 61 63 61 61 61 351Solomon Is 628 734 734 734 734 36 -15 -99 34 134 321
Tonga 5 5 5 5 5 5 5 5 5 5 47Vanuatu 39 39 39 39 39 36 36 36 39 39 213
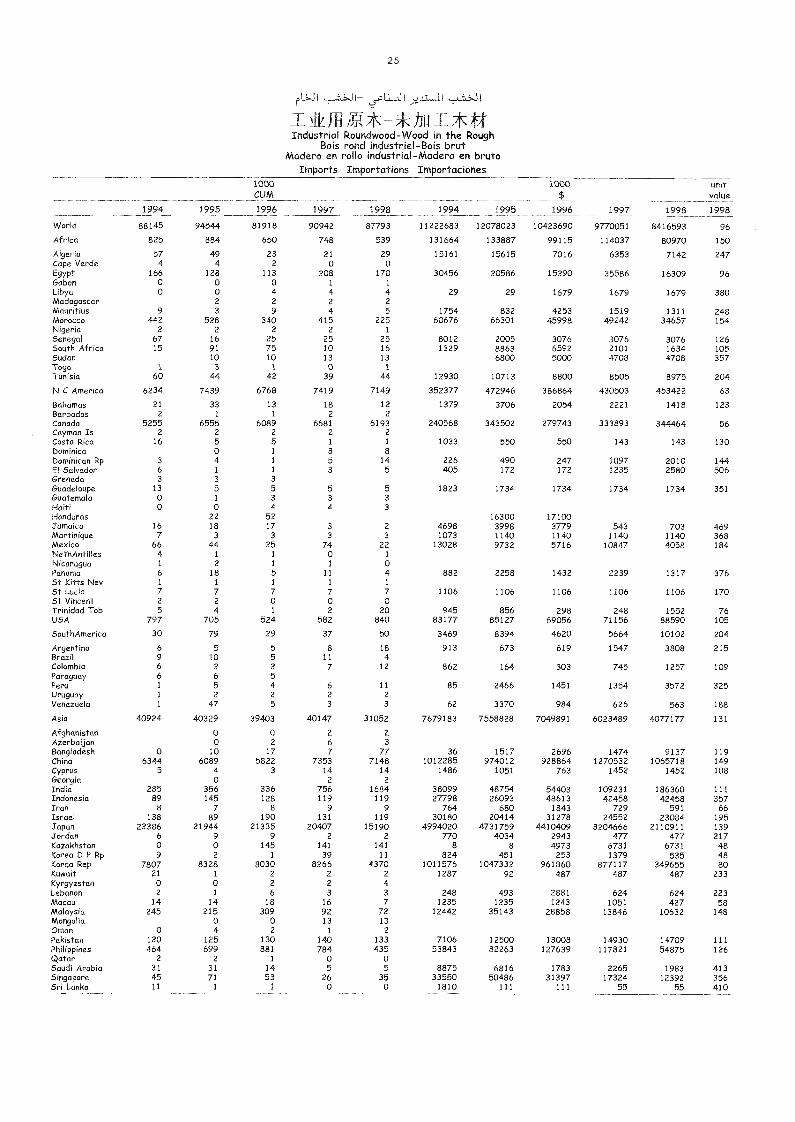
2 5
,.5L3_,J1 .72
R.* - uiffIndustrial Roundwood-Wood in the Rough
Bois rond industriel-Bois brutMadera en rollo industrial-Madera en bruto
Imports Importations Importaciones
1994 1995
1000CUM
1996 1997 1998 1994 1995
1000$
1996 1997 1998
unitvalue
1998
World 88145 94544 81918 90942 87793 11222683 12078023 10423690 9770051 8416593 96
Africa 825 884 650 748 539 131664 133887 99115 114037 80970 150
Algeria 57 49 23 21 29 15161 15615 7016 6353 7142 247Cape Verde 4 4 2 0 oEgypt 166 128 113 208 170 30456 20586 15290 35586 16309 96Gabon o o o 1 1
Libya 0 o 4 4 4 29 29 1679 1679 1679 380Madagascar 2 2 2 2
Mauritius 9 3 9 4 5 1754 832 4253 1519 1311 248Morocco 442 528 340 415 225 60676 66301 45998 49242 34657 154Nigeria 2 2 2 2 1
Senegal 67 16 25 25 25 8012 2005 3076 3076 3076 126South Africa 15 91 75 10 16 1329 8863 6592 2101 1634 105Sudan 10 10 13 13 6800 5000 4708 4708 357Togo 1 3 1 0 1
Tunisia 60 44 42 39 44 12930 10713 8800 8505 8975 204
N C America 6234 7439 6768 7419 7149 352377 472946 386864 430503 453422 63
Bahamas 21 33 13 18 12 1379 3706 2054 2221 1418 123Barbados 2 1 1 2 2Canada 5255 6555 6089 6681 6193 240568 343502 279743 333893 344464 56Cayman Is 2 2 2 2 2Costa coRi 16 5 5 1 1 1033 550 550 143 143 130Dominica 0 1 8 8Dominican Rp 3 4 1 5 14 226 490 247 1097 2010 144El Salvador 6 1 1 3 5 405 172 172 1235 2580 506Grenada 3 3 3
Guadeloupe 13 5 5 5 5 1823 1734 1734 1734 1734 351Guatemala 0 1 3 3 3
Haiti 0 0 4 4 3
Honduras 22 52 16300 17100Jamaica 16 18 17 3 2 4698 3998 3779 543 703 469Martinique 7 3 3 3 3 1073 1140 1140 1140 1140 368Mexico 66 44 25 74 22 13028 9732 5716 10847 4058 184NethAntilles 4 1 1 0 1
Nicaragua 1 2 1 1 0Panama 6 18 5 11 4 882 2258 1432 2239 1317 376St Kitts Nev 1 1 1 1 1
St Lucia 7 7 7 7 7 1106 1106 1106 1106 1106 170St Vincent 2 2 0 0 0Trinidad Tob 5 4 1 2 20 945 856 298 248 1552 76USA 797 705 524 582 840 83177 85127 69056 71156 88590 105
SouthAmerica 30 79 29 37 50 3469 8394 4620 5664 10102 204
Argentina 6 5 5 8 18 913 673 619 1547 3808 215Brazil 9 10 5 11 4Colombia 6 2 2 7 12 862 164 303 745 1257 109Paraguay 6 6 5Peru 1 5 4 6 11 85 2466 1451 1354 3572 325Uruguay 1 2 2 2 2
Venezuela 1 47 5 3 3 62 3370 984 626 563 188
Asia 40924 40329 39403 40147 31052 7679183 7558828 7049891 6023489 4077177 131
Afghanistan 0 0 2 2Azerbaijan o 2 6 3
Bangladesh o 10 17 7 77 36 1517 2696 1474 9137 119China 6344 6089 5822 7353 7148 1012285 974012 928864 1270532 1065718 149Cyprus 5 4 3 14 14 1486 1051 763 1452 1452 108Georgia 0 2 2
India 285 356 336 756 1684 38099 48754 54403 109231 186360 111Indonesia 89 145 128 119 119 27798 26093 48613 42458 42458 357Iran 8 7 8 9 9 764 680 1843 729 591 66Israel 138 89 190 131 119 30180 20414 31278 24552 23084 195Japan 22386 21944 21335 20407 15190 4994.020 4731759 4410409 3204666 2110911 139Jordan 6 9 9 2 2 770 4034 2943 477 477 217Kazakhstan 0 0 145 141 141 8 8 4973 6731 6731 48Korea D P Rp 9 2 1 39 11 824 451 253 1379 535 48Korea Rep 7807 8328 8030 8266 4370 1011576 1047332 961860 877117 349655 80Kuwait 21 1 2 2 2 1287 92 487 487 487 233Kyrgyzstan o o 2 2 4Lebanon 2 1 6 3 3 248 493 2881 624 624 223Macau 14 14 18 16 7 1235 1235 1243 1051 427 58Malaysia 245 215 309 92 72 12442 35143 28858 13846 10632 148Mongolia 0 0 13 13Oman 0 4 2 I 2Pakistan 120 125 130 140 133 7106 12500 13008 14930 14709 111Philippines 464 699 881 784 435 53843 82263 127639 117821 54875 126Qatar 2 2 1 0 oSaudi Arabia 31 31 14 5 5 8875 6816 1783 2265 1983 413Singapore 45 71 53 26 35 33550 50486 31397 17324 12392 356Sri Lanka 11 1 1 0 0 1810 111 111 55 55 410
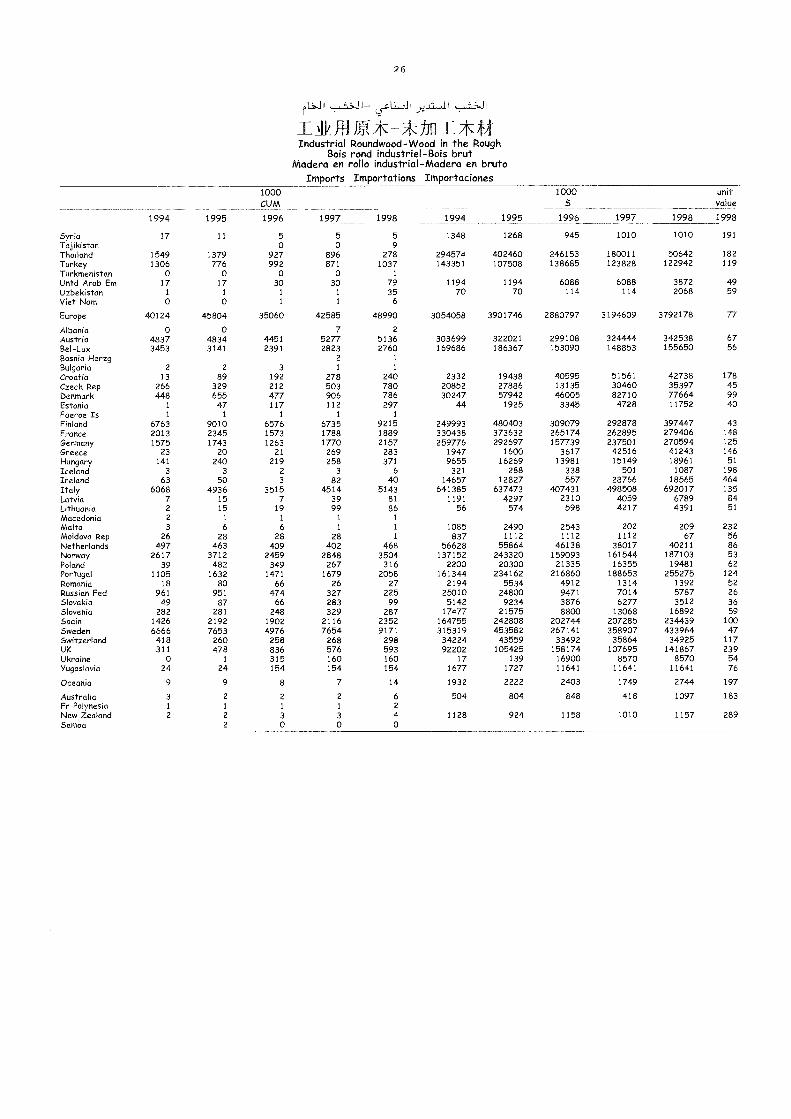
2 6
44,11 ).2. I I
T. ,11/ ffl *- hu 1- *44Industrial Roundwood-Wood in the Rough
Bois rond industriel-Bois brutMadera en rollo industrial-Madera en bruto
Imports Importations Importaciones1000CUM
1000 unitvalue
1994 1995 1996 1997 1998 1994 1995 1996 1997 1998 1998
Syria 17 11 5 5 5 1348 1268 945 1010 1010 191
Tajikistan 0 0 9Thailand 1549 1379 927 896 278 294574 402460 246153 180011 50642 182Turkey 1306 776 992 871 1037 143351 107508 138685 123828 122942 119Turkmenistan 0 0 0 0 1
Untd Arab Em 17 17 30 30 79 1194 1194 6088 6088 3872 49Uzbekistan 1 1 1 1 35 70 70 114 114 2068 59Viet Nam 0 0 1 1 6
Europe 40124 45804 35060 42585 48990 3054058 3901746 2880797 3194609 3792178 77
Albania 0 0 7 2
Austria 4837 4834 4451 5277 5136 303699 322021 299108 324444 342538 67Bel-Lux 3453 3141 2391 2823 2760 169686 186367 153090 148853 155650 56Bosnia Herzg 2 1
Bulgaria 2 2 3 1 1
Croatia 13 89 192 278 240 2332 19438 40595 51561 42738 178Czech Rep 266 329 212 503 780 20852 27886 13135 30460 35397 45Denmark 448 655 477 906 786 30247 57942 46005 82710 77664 99Estonia 1 47 117 112 297 44 1925 3345 4728 11752 40Faeroe Is 1 1 1 1 1
Finland 6763 9010 6576 6735 9215 249993 480403 309079 292878 397447 43France 2013 2345 1573 1788 1889 330438 373632 265174 262895 279406 148Germany 1575 1743 1263 1770 2157 259776 292697 157739 237501 270594 125Greece 23 20 21 269 283 1947 1600 3617 42516 41243 146Hungary 141 240 219 258 371 9655 16269 13981 15149 18961 51
Iceland 3 3 2 3 6 321 288 338 501 1087 198Ireland 63 50 3 82 40 14657 12827 557 28766 18565 464Italy 6068 4936 3515 4514 5143 641385 637473 407431 498508 692017 135Latvia 7 15 7 39 81 1191 4297 2310 4059 6789 84Lithuania 2 15 19 99 86 56 574 598 4217 4391 51Macedonia 2 1 1 1 1
Malta 3 6 6 1 1 1085 2490 2543 202 209 232Moldova Rep 26 28 28 28 1 837 1112 1112 1112 67 56Netherlands 497 463 409 402 468 56628 55864 46138 38017 40211 86Norway 2617 3712 2459 2848 3504 137152 243320 159093 161544 187103 53Poland 39 482 349 267 316 2200 20300 21335 16355 19481 62Portugal 1105 1632 1471 1679 2058 161344 234162 216860 188653 255275 124Romania 18 80 66 26 27 2194 5534 4912 1314 1392 52Russian Fed 961 951 474 327 225 25010 24800 9471 7014 5787 26Slovakia 49 87 66 283 99 5142 9234 3876 6277 3512 36Slovenia 282 281 248 329 287 17477 21575 8800 13068 16892 59Spain 1426 2192 1902 2116 2352 164755 242808 202744 207285 234439 100Sweden 6666 7653 4976 7654 9171 315319 453582 267141 358907 433964 47Switzerland 418 260 258 268 298 34224 43559 33492 35864 34925 117UK 311 478 836 576 593 92202 105425 158174 107695 141867 239Ukraine 0 1 315 160 160 17 139 16900 8570 8570 54Yugoslavia 24 24 154 154 154 1677 1727 11641 11641 11641 76
Oceania 9 9 8 7 14 1932 2222 2403 1749 2744 197
Australia 3 2 2 2 6 504 804 848 418 1097 183Fr Polynesia 1 1 1 1 2
New Zealand 2 2 3 3 4 1128 924 1158 1010 1157 289Samoa 2 0 0 0
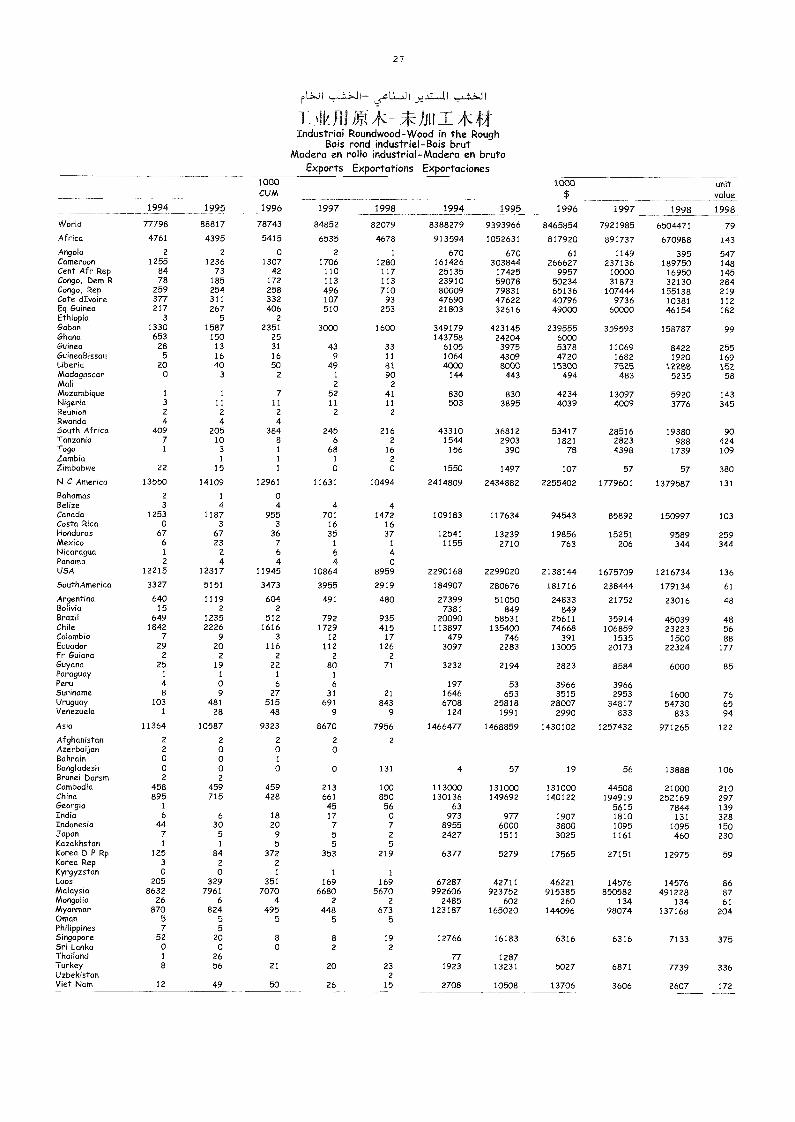
27
-_,11).2 '7lIl
I III/ T *ifIndustrial Roundwood-Wood in the Rough
Bois rond industriel-Bois brutMadera en rollo industrial-Madera en bruto
Exports Exportations Exportaciones1000CUM
1000 unitvalue
1994 1995 1996 1997 1998 1994 1995 1996 1997 1998 1998
VVoNd 11/98 88817 78743 84852 82079 8388279 9393966 8465854 7921985 6504471 79Africa 4761 4395 5415 6535 4678 913594 1052631 817920 891737 670988 143
Angola 2 2 0 2 1 670 670 61 1149 395 547Cameroon 1255 1236 1307 1706 1280 161426 303844 266627 237136 189750 148Cent Afr Rep 84 73 42 110 117 25135 17425 9957 IDDIDO 16950 145Con9o, Dem R 78 185 172 113 113 23910 59078 50234 31873 32130 284Congo, Rep 259 254 258 496 710 80009 79831 65136 107444 155138 219Cote dIvoire 377 311 332 107 93 47690 47622 40796 9736 10381 112Eq Guinea 217 267 406 510 253 21803 32616 49000 60000 46154 182Ethiopia 3 5 2Gabon 1330 1587 2351 3000 1600 349179 423145 239555 359593 158787 99Ghana 653 150 25 143758 24204 6000Guirma 28 13 31 43 33 6105 3975 5378 11069 8422 255GuirmaBissau 5 16 16 9 11 1064 4309 4720 1682 1920 169Liberia 20 40 50 49 81 4000 8000 15300 7525 12288 152Madagascar 0 3 2 1 90 144 443 494 483 5235 58Mali 2 2Mozambique I 1 7 52 41 830 830 4234 13097 5920 143Nigeria 3 11 11 II 11 503 3895 4039 4009 3776 345Reunion 2 2 2 2 2Rwanda 4 4 4South Africa 409 205 384 245 216 43310 36812 53417 28516 19380 90Tanzania 7 10 8 6 2 1544 2903 1821 2823 988 424Togo 1 3 I 68 16 156 390 78 4398 1739 109Zambia 1 1 1 2Zimbabwe 22 15 1 0 0 1550 1497 107 57 57 380N C America 13550 14109 12961 11631 10494 2414809 2434882 2255402 1779601 1379587 131
Bahamas 2 1 0Belize 3 4 4 4 4Canada 1253 1187 955 701 1472 109183 117634 94543 85892 150997 103Costa Rica 0 3 3 16 16Honduras 67 67 36 35 37 12541 13239 19856 15251 9589 259Mexico 6 23 7 1 I 1155 2710 763 206 344 344Nicaragua 1 z 6 6 4Panama 2 4 4 4 0USA 12215 12817 11945 10864 8959 2290168 2299020 2138144 1675709 1216734 136
SouthAmerica 3327 5151 3473 3955 2919 184907 280676 181716 238444 179134 61
Argentina 640 1119 604 491 480 27399 51050 24833 21752 23016 48Bolivia 15 2 2 7381 849 849Brazil 649 1235 512 792 935 20090 58531 25611 35914 45039 48Chile 1842 2226 1616 1729 415 113897 135400 74668 106859 23223 56Colombia 7 9 3 12 17 479 746 391 1535 1500 88Ecuador 29 20 116 112 126 3097 2283 13005 20173 22324 177Fr Guiana 2 2 2 2 2Guyana 25 19 22 80 71 3232 2194 2823 8584 6000 85Paraguay 1 1 1 1
Peru 4 0 6 6 197 53 3966 3966Suriname 8 9 27 31 21 1646 653 3515 2953 1600 76Uruguay 103 481 515 691 843 6708 25818 28007 34817 54730 65Venezuela 1 28 48 9 9 124 1991 2990 833 833 94Asia 11364 10587 9323 8670 7956 1466477 1468859 1430102 1257432 971265 122
Afghanis an 2 2 2 2 2
Azerbaijan 2 0 0 0Bahrain 0 0 1
Bangladesh 0 0 0 0 131 4 57 19 56 13888 106BruneiDarsm 2 2
Cambodia 458 459 459 213 100 113000 131000 131000 44508 21000 210China 895 715 428 661 850 130136 149692 140122 194919 252169 297GeorgM 1 45 56 63 5615 7844 139India 6 6 18 17 0 973 977 1907 1810 131 328Indonesia 44 30 20 7 7 8955 6000 3800 1095 1095 150Japan 7 5 9 5 2 2427 1511 3025 1161 460 230Kazakhstan 1 1 5 5 5Korea 10 P Rp 125 84 372 353 219 6377 5279 17565 27151 12975 59Korea Rep 3 2 2
Kyrgyzstan 0 0 1 1 1
Laos 205 329 351 169 169 67287 42711 46221 14576 14576 86Malaysia 8632 7961 7070 6680 5670 992606 923752 915385 850582 491228 87Mongolia 26 6 4 2 2 2485 602 260 134 134 61Myanmar 870 824 495 448 673 123187 165020 144096 98074 137168 204Owmn 5 5 5 5 5PhMppines 7 5Singapore 52 20 8 8 19 12766 16183 6316 6316 7133 375Sri Lanka 0 0 0 2 2Thailand 1 26 77 1287Turkey 8 56 21 20 23 1923 13231 5027 6871 7739 336Uzbekistan 2VMt Nam 12 49 50 26 15 2708 10508 13706 3606 2607 172
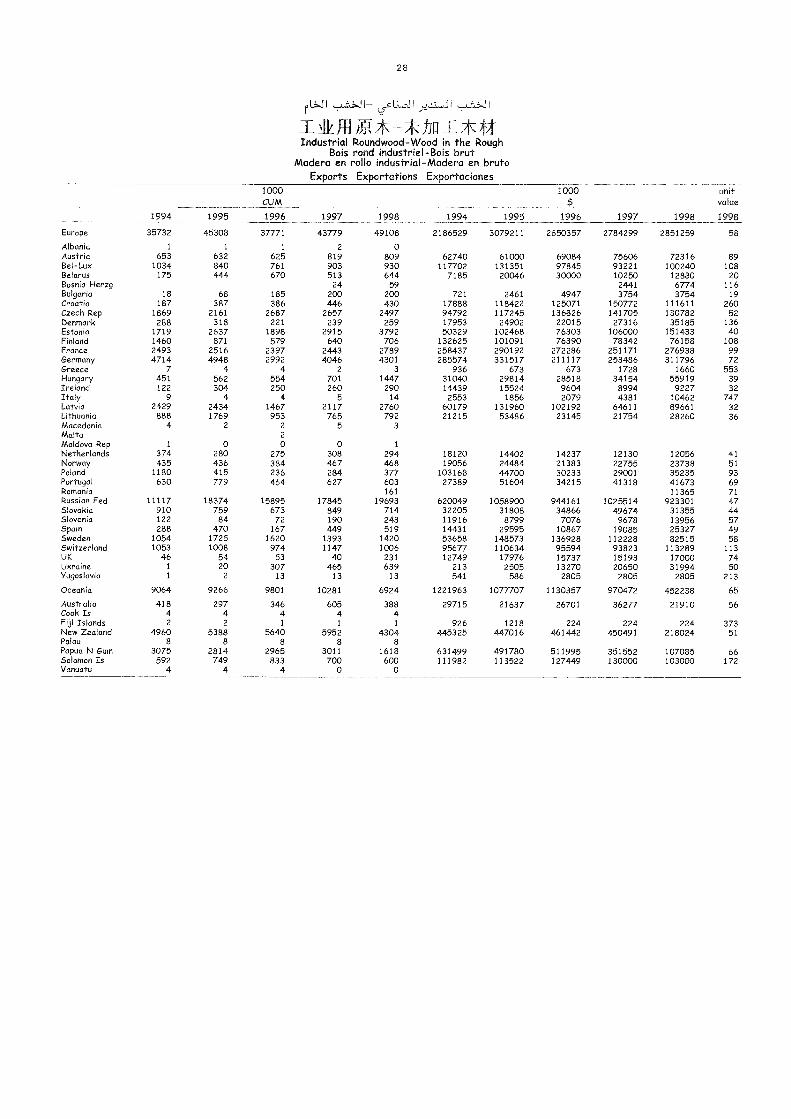
28
fu.J1
'II/ - if_Industrial Roundwood-VVood in the Rough
Bois rond industriel-Bois brutModero en rollo industrial-Modero en bruto
Exports Exportations Exportaciones
1994 1995
1000CUM
1996 1997 1998 1994 1995
1000
$
1996 1997 1998
unitvalue
1998
Europe 35732 45308 37771 43779 49108 2186529 3079211 2650357 2784299 2851259 58
Albania 1 1 1 2 0Austria 653 632 625 819 809 62740 61000 69084 75606 72316 89Bel-Lux 1034 840 761 903 930 117702 131351 97845 93221 100240 108Belarus 175 444 670 513 644 7185 20046 30000 10250 12880 20BosMa Herzg 24 59 2441 6774 116Bulgaria 18 68 185 200 200 721 2461 4947 3754 3754 19Croatia 187 387 386 446 430 17888 118422 125071 150772 111611 260Czech Rep 1869 2161 2687 2657 2497 94792 117245 136826 141705 130782 52Denmark 288 318 221 239 259 17953 24902 22015 27316 35185 136Estonia 1719 2637 1898 2915 3792 50329 102468 76303 106000 151433 40Finland 1460 871 579 640 706 132625 101091 76390 78342 76158 108France 2493 2516 2397 2443 2789 258437 290192 272286 251171 276938 99Germany 4714 4948 2992 4046 4301 285574 331517 211117 253486 311796 72Greece 7 4 4 2 3 936 673 673 1728 1660 553Hungary 451 562 554 701 1447 31040 29814 28518 34154 55919 39Ireland 122 304 250 260 290 14439 15524 9604 8994 9227 32Italy 9 4 4 5 14 2553 1856 2079 4381 10462 747Latvia 2429 2434 1467 2117 2760 60179 131960 102192 64611 89661 32LithuaMa 888 1769 953 765 792 21215 53486 23145 21754 28260 36Macedonia 4 2 2 5 3
Malta 2Moldova Rep 1 0 0 0 1
Netherlands 374 280 275 308 294 18120 14402 14237 12130 12056 41Norway 435 436 384 467 468 19056 24484 21383 22755 23738 51Poland 1180 415 236 284 377 103168 44700 30233 29001 35235 93Portugal 630 779 464 627 603 27389 51604 34215 41318 41673 69Romania 161 11365 71Russian Fed 11117 18374 15895 17845 19693 620049 1058900 944161 1025514 923301 47Slovakia 910 759 673 849 714 32205 31808 34866 49674 31355 44Slovenia 122 84 72 190 243 11916 8799 7076 9678 13956 57SpaM 288 470 167 449 519 14431 29595 10867 19085 25327 49Sweden 1054 1725 1620 1393 1420 53658 148573 136928 112228 82515 58Switzerland 1053 1008 974 1147 1006 95677 110634 95594 93823 113289 113UK 46 54 53 40 231 12749 17976 15737 15193 17000 74UkraMe 1 20 307 465 639 213 2505 13270 20650 31994 50Yugoslavia 1 2 13 13 13 541 586 2805 2805 2805 213
Oceania 9064 9266 9801 10281 6924 1221963 1011/07 1130357 970472 452238 65
Australia 418 297 346 605 388 29715 21637 26701 36277 21910 56Cook Is 4 4 4 4 4FijiIsMnds 2 2 1 1 1 926 1218 224 224 224 373New Zealand 4960 5388 5640 5952 4304 445325 447016 461442 450491 218024 51PaMu 8 8 8 8 8Papua N GuM 3075 2814 2965 3011 1618 631499 491780 511995 351552 107085 66SoMmon Is 592 749 833 700 600 111982 113522 127449 130000 103000 172Vanuatu 4 4 4 0 0
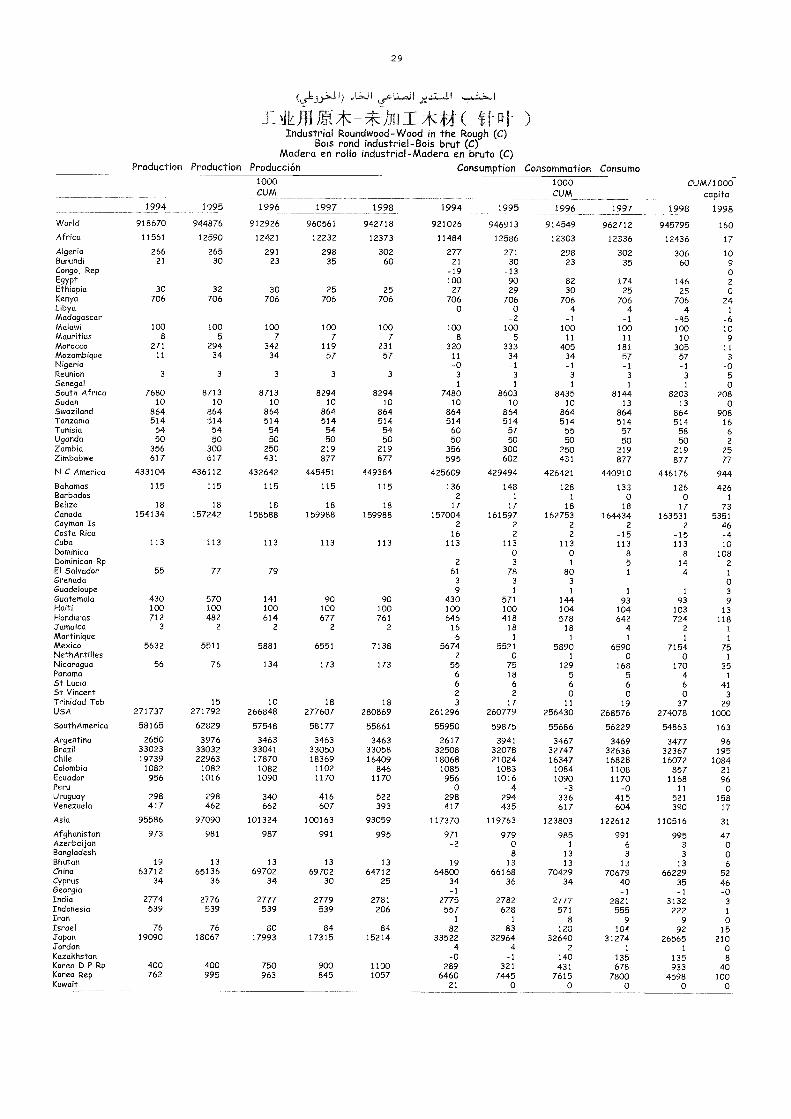
29
Lra %,
fir] ( 4tft)Industrial Roundpmod-Wood in the Rough (C)
Bois rond industriel-Bois brut (C)Modero en rollo industrial-Modero en bruto (C)
Production Production Producción Consumption Consommation Consumo
1994 1995
1000CUM
1996 1997 1998 1994 1995
1000CUM
1996 1997
CUAA/1000capita
1998 1998
World 918670 944876 912926 960561 942718 921026 946913 914549 962712 945795 160Africa 11561 12590 12421 12232 12373 11484 12586 12303 12336 12436 17
Algeria 266 265 291 298 302 277 271 298 302 306 10Burundi 21 30 23 35 60 21 30 23 35 60 9Congo, Rep -19 -13 0Egypt 100 90 82 174 146 2Ethiopia 30 32 30 25 25 27 29 30 25 25 0Kenya 706 706 706 706 706 706 706 706 706 706 24Lbya 0 0 4 4 4 1Madagascar -2 -1 -1 -85 -6Malawi 100 100 100 100 100 100 100 100 100 100 10Mauritius 8 5 7 7 7 8 5 11 11 10 9Morocco 271 294 342 119 231 320 333 405 181 305 11Mozambique 11 34 34 57 57 11 34 34 57 57 3Nigeria -0 -1 -1 -1 -1 -0Reunion 3 3 3 3 3 3 3 3 3 3 5Senegal 1 1 1 1 1 0South Africa 7680 8713 8713 8294 8294 7480 8603 8435 8144 8203 208Sudan 10 10 10 10 10 10 10 10 13 13 0Swaziland 864 864 864 864 864 864 864 864 864 864 908Tanzania 514 514 514 514 514 514 514 514 514 514 16Tunisia 54 54 54 54 54 60 57 55 57 58 6Uganda 50 50 50 50 50 50 50 50 50 50 2Zambia 356 300 250 219 219 356 300 250 219 219 25Zimbabwe 617 617 431 877 877 595 602 431 877 877 77N C America 433104 436112 432642 445451 449384 425609 429494 426421 440910 446176 944Bahamas 115 115 115 115 115 136 148 128 133 126 426Barbados 2 1 1 0 0 1
Belize 18 18 18 18 18 17 17 18 18 17 73Canada 154134 157242 158588 159988 159988 157004 161597 162753 164434 163531 5351Cayman Is 2 2 2 2 2 46Costa Rica 16 2 2 -15 -15 -4Cuba 113 113 113 113 113 113 113 113 113 113 10Dominica 0 0 8 8 108Dominican Rp 2 3 1 5 14 2El Salvador 55 77 79 61 78 80 1 4 1
Grenada 3 3 3 0Guadeloupe 9 1 1 1 1 3Guatemala 430 570 141 90 90 430 571 144 93 93 9Haiti 100 100 100 100 100 100 100 104 104 103 13Honduras 712 482 614 677 761 646 418 578 642 724 118Jamaica 3 2 2 2 2 16 18 18 4 2 1
Marfinique 6 1 1 1 1 1
Mexico 5632 5511 5881 6551 7138 5674 5521 5890 6590 7154 75NethAnfilles 2 0 1 0 0 1
Nicaragua 56 76 134 173 173 55 75 129 168 170 35Panama 6 18 5 5 4 1
St Lucia 6 6 6 6 6 41St Vincent 2 2 0 0 0 3Trinidad Tob 15 10 18 18 3 17 11 19 37 29USA 271737 271792 266848 277607 280869 261296 260779 256430 268576 274078 1000SouthAmerica 58165 62829 57548 58177 55861 55950 59875 55686 56229 54863 163
Argentina 2650 3976 3463 3463 3463 2617 3941 3467 3469 3477 96Brazil 33023 33032 33041 33050 33058 32508 32078 32747 32636 32367 195Chile 19739 22963 17870 18369 16409 18068 21024 16347 16828 16072 1084Colombia 1082 1082 1082 1102 846 1085 1083 1084 1108 857 21Ecuador 956 1016 1090 1170 1170 956 1016 1090 1170 1168 96Peru o 4 -3 -o 11 0Uruguay 298 298 340 416 522 298 294 336 415 521 158Venezuela 417 462 662 607 393 417 435 617 604 390 17
Asia 95586 97090 101324 100163 93059 117370 119763 123803 122612 110516 31
Afghanistan 973 981 987 991 995 971 979 985 991 995 47Azerbaijan -2 0 1 6 3 0Bangladesh 8 13 3 3 0Bhutan 19 13 13 13 13 19 13 13 13 13 6China 63712 65136 69702 69702 64712 64800 66168 70429 70679 66229 52Cyprus 34 36 34 30 25 34 36 34 40 35 46Georgia -1 -1 -1 -0Iridio 2774 2776 21II 2779 2781 2775 2782 211 2821 3132 3Indonesia 539 539 539 539 206 557 628 571 555 222 1
Iran 1 1 8 9 9 0Israel 76 76 80 84 84 82 83 120 104 92 15Japan 19090 18067 17993 17315 15214 33522 32964 32640 31274 26565 210Jordan 4 4 2 1 1 0Kazakhstan -0 -1 140 135 135 8Korea D P Rp 400 400 750 900 1100 289 321 431 678 933 40Korea Rep 762 995 963 845 1057 6460 7445 7615 7800 4598 100Kuwait 21 0 0 0 0 0
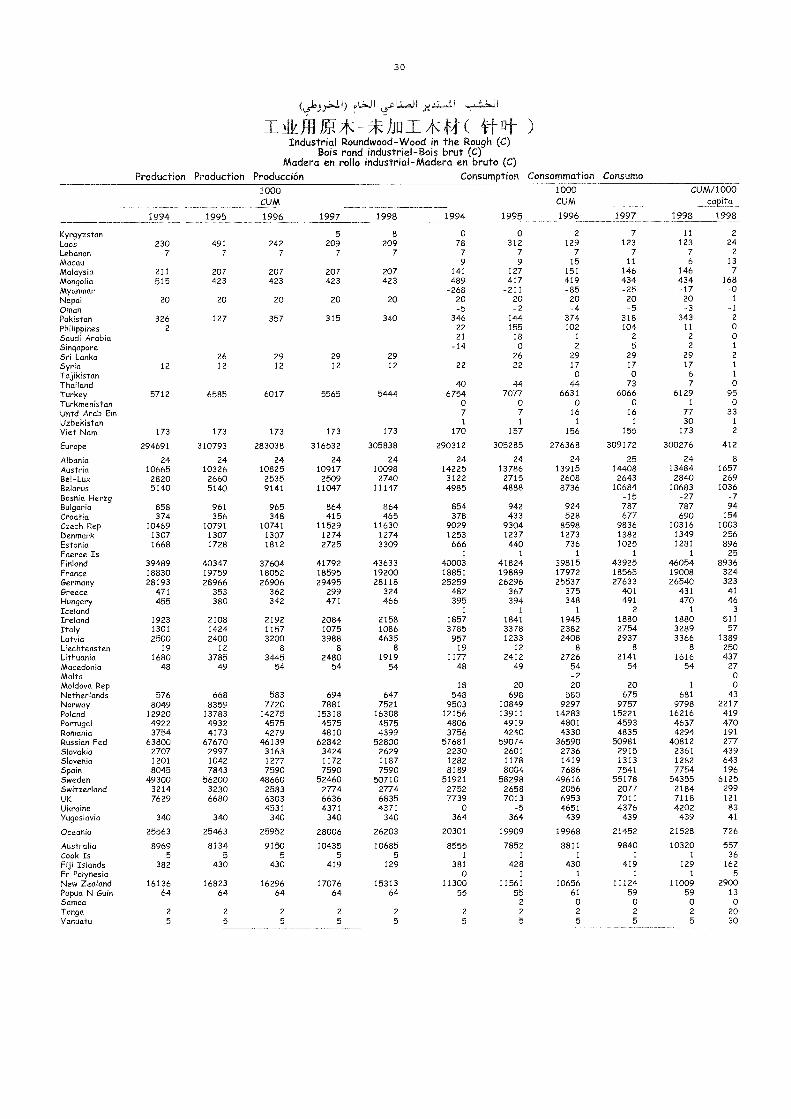
30
LL.JI c: .11
I__41411/P:7K-VNIAcif4-( itut- )Industrial Roundwood-Wood in the Rough (C)
Bois rond industriel-Bois brut (C)Madera en rollo industrial-Madera en bruto (C)
Production Production Producción Consumption Consommation Consumo
1994 1995
1000CUM
1996 1998 1994 1995
1000CUM
1997
CUM/1000capita
1998 19981997 1996
Kyrgyzstan 5 8 0 0 2 7 11 2
Laos 230 491 242 209 209 78 312 129 123 123 24
Lebanon 7 7 7 7 7 7 7 7 7 7 2
Macau 9 9 15 11 6 13
Malaysia 211 207 207 207 207 141 127 151 146 146 7Mongolia 515 423 423 423 423 489 417 419 434 434 168Myanmar -268 -211 -85 -25 -17 -0Nepal 20 20 20 20 20 20 20 20 20 20 1
Oman -5 -2 -4 -5 -3 -1Pakistan 326 127 357 315 340 346 144 374 318 343 2
Philippines 2 22 155 102 104 11 0
Saudi Arabia 21 18 1 2 2 0
Singapore -14 0 2 5 2 1
Sri Lanka 26 29 29 29 26 29 29 29 2
Syria 12 12 12 12 12 22 22 17 17 17 1
Tojikistan 0 0 6 1
Thailand 40 44 44 73 7 0
Turkey 5712 6585 6017 5565 54-44 6754 7077 6631 6066 6129 95Turkmenistan 0 0 0 0 1 0
Untd Arab Em 7 7 16 16 77 33
Uzbekistan 1 1 1 1 30 1
Viet Nam 173 173 173 173 173 170 157 156 155 173 2
Europe 294691 310793 283038 316532 305838 290312 305285 276368 309172 300276 412
Albania 24 24 24 24 24 24 24 24 25 24 8
Austria 10665 10326 10825 10917 10098 14225 13786 13915 14408 13484 1657Bel-Lux 2820 2660 2535 2509 2740 3122 2715 2608 2643 2840 269Belarus 5140 5140 9141 11047 11147 4985 4888 8736 10684 10683 1036Bosnia Herzg -15 -27 -7Bulgaria 858 961 965 864 864 854 942 924 787 787 94Croatia 374 356 348 415 465 378 433 528 677 690 154Czech Rep 10469 10791 10741 11529 11630 9029 9304 8598 9836 10316 1003Denmark 1307 1307 1307 1274 1274 1253 1237 1273 1382 1349 256Estonia 1668 1728 1812 2725 3309 666 440 736 1025 1281 896Faeroe Is 1 1 1 1 1 25Finland 39489 40347 37604 41792 43633 40003 41824 39815 43925 46054 8936France 18830 19759 18052 18595 19200 18851 19889 17972 18565 19008 324Germany 28193 28966 26906 29495 28118 25259 26296 25537 27633 26540 323Greece 471 353 362 299 324 482 367 375 401 431 41
Hungary 455 380 342 471 466 395 394 348 491 470 46Iceland 1 1 1 2 1 3
Ireland 1923 2108 2192 2084 2158 1857 1841 1945 1880 1880 511Italy 1301 1424 1157 1075 1086 3785 3378 2382 2754 3289 57Latvia 2500 2400 3200 3988 4635 957 1233 2408 2937 3366 1389Liechtensten 19 12 8 8 8 19 12 8 8 8 250Lithuania 1680 3785 3445 2480 1919 1177 2412 2726 2141 1616 437Macedonia 48 49 54 54 54 48 49 54 54 54 27Malta -2 0Moldova Rep 18 20 20 20 1 0Netherlands 576 668 583 694 647 548 698 580 675 681 43Norway 8049 8359 7720 7881 7521 9503 10849 9297 9757 9798 2217Poland 12920 13783 14275 15318 16308 12156 13911 14283 15221 16216 419Portugal 4922 4932 4575 4575 4575 4806 4919 4801 4593 4637 470Romania 3754 4173 4279 4810 4399 3756 4240 4330 4835 4294 191Russian Fed 63800 67670 46139 62842 52800 57681 59074 36590 50981 40812 277Slovakia 2707 2997 3163 3424 2629 2230 2601 2736 2915 2361 439Slovenia 1201 1042 1277 1172 1187 1282 1178 1419 1313 1282 643Spain 8045 7843 7590 7590 7590 8189 8004 7686 7541 7754 196Sweden 49300 56200 48660 52460 50710 51921 58298 49616 55178 54355 6125Switzerland 3214 3230 2583 2774 2774 2752 2658 2056 2077 2184 299UK 7629 6680 6303 6636 6835 7739 7013 6953 7011 7118 121Ukraine 4531 4371 4371 0 -5 4651 4376 4202 83Yugoslavia 340 340 340 340 340 364 364 439 439 439 41
Oceania 25563 25463 25952 28006 26203 20301 19909 19968 21452 21528 726
Australia 8969 8134 9150 10435 10685 8555 7852 8811 9840 10320 557Cook Is 5 5 5 5 5 1 1 1 1 1 36Fiji Islands 382 430 430 419 129 381 428 430 419 129 162Fr Polynesia 0 1 1 1 1 5New Zealand 16136 16823 16296 17076 15313 11300 11561 10656 11124 11009 2900Papua N Guin 64 64 64 64 64 55 55 61 59 59 13Samoa 2 0 0 0 0Tonga 2 2 2 2 2 2 2 2 2 2 20Vanuatu 5 5 5 5 5 5 5 5 5 5 30
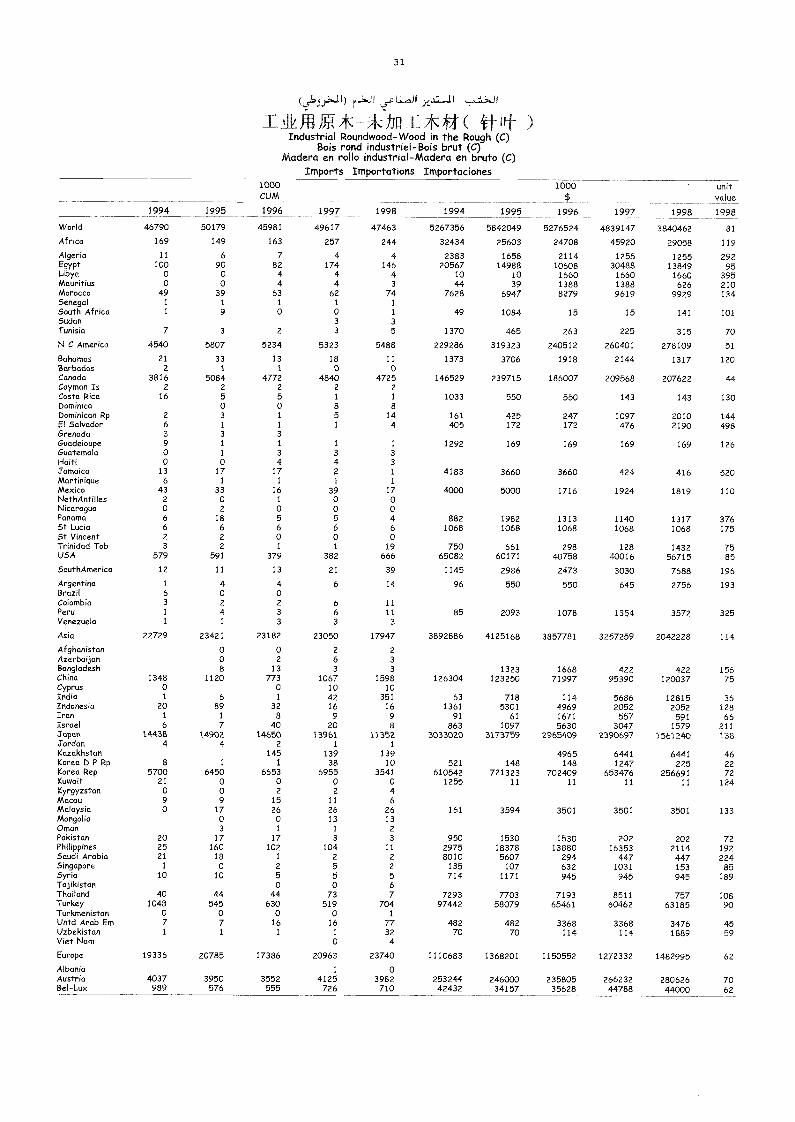
TA/. Ig - T*44 ( )Industrial Roundwood-Wood in the Rough (C)
Bois rond industriel-Bois brut (C)Madera en rollo industrial-Madera en bruto (C)
Imports Importations Importaciones
31
(.5.6.5)..-11) .11
1000CUM
1000 unitvalue
1994 1995 1996 1997 1998 1994 1995 1996 1997 1998 1998
World 46790 50179 45981 49617 47463 5267356 5842049 5276524 4839147 3840462 81
Africa 169 149 163 257 244 32434 25603 24708 45920 29058 119
Algeria 11 6 7 4 4 2383 1658 2114 1255 1255 292Egypt 100 90 82 174 146 20567 14988 10608 30488 13849 95Libya 0 0 4 4 4 10 10 1660 1660 1660 395Mauritius 0 0 4 4 3 44 39 1388 1388 626 210Morocco 49 39 63 62 74 7628 6947 8279 9619 9929 134Senegal 1 1 1 1 1
South Africa 1 9 0 0 1 49 1084 15 15 141 101Sudan 3 3
Tunisia 7 3 2 3 5 1370 465 263 225 315 70
N C America 4540 5807 5234 5323 5488 229286 319323 240512 260401 278109 51
Bahamas 21 33 13 18 11 1373 3706 1918 2144 1317 120Barbados 2 1 1 0 0Canada 3816 5084 4772 4840 4725 146529 239715 186007 209568 207622 44Cayman Is 2 2 2 2 2
Costa Rica 16 5 5 1 1 1033 550 550 143 143 130Dominica 0 0 8 8Dominican Rp 2 3 1 5 14 161 425 247 1097 2010 144El Salvador 6 1 1 1 4 405 172 172 476 2190 498Grenada 3 3 3
Guadeloupe 9 1 1 1 1 1292 169 169 169 169 126Guatemala 0 1 3 3 3Haiti 0 0 4 4 3
Jamaica 13 17 17 2 1 4183 3660 3660 424 416 520Martinique 6 1 1 1 1
Mexico 43 33 16 39 17 4000 5000 1716 1924 1819 110NethAntilles 2 0 1 0 0Nicaragua 0 2 0 0 0Panama 6 18 5 5 4 882 1982 1313 1140 1317 376St Lucia 6 6 6 6 6 1068 1068 1068 1068 1068 175St Vincent 2 2 0 0 0Trinidad Tob 3 2 1 1 19 750 661 298 128 1432 75USA 579 591 379 382 666 65082 60171 40758 40016 56715 85SouthAmerica 12 11 13 21 39 1145 2986 2473 3030 7688 196
Argentina 1 4 4 6 14 96 550 550 645 2756 193Brazil 6 0 0Colombia 3 2 2 6 11Peru 1 4 3 6 11 85 2093 1078 1354 3572 325Venezuela 1 1 3 3 3
Asia 22729 23421 23182 23050 17947 3892886 4125168 3857781 3257259 2042228 114
Afghanistan 0 0 2 2
Azerbaijan 0 2 6 3Bangladesh 8 13 3 3 1323 1668 422 422 156China 1348 1120 773 1067 1598 126304 123250 71997 95390 120037 75Cyprus 0 0 10 10India 1 6 1 42 351 63 718 114 5686 12815 36Indonesia 20 89 32 16 16 1361 5301 4969 2052 2052 128Iran 1 1 8 9 9 91 61 1671 557 591 66Israel 6 7 40 20 8 863 1097 5630 3047 1579 211japan 14438 14902 14650 13961 11352 3033020 3173759 2965409 2390697 1561240 138Jordan 4 4 2 1 1
Kazakhstan 145 139 139 4965 6441 6441 46Korea D P Rp 8 1 1 38 10 521 148 148 1247 225 22Korea Rep 5700 6450 6653 6955 3541 610542 721323 702409 653476 256691 72Kuwait 21 0 0 0 0 1255 11 11 11 11 124Kyrgyzstan 0 0 2 2 4Macau 9 9 15 11 6Malaysia 0 17 26 26 26 161 3594 3501 3501 3501 133Mongolia 0 0 13 13Oman 3 1 1 2Pakistan 20 17 17 3 3 950 1530 1530 202 202 72Philippines 25 160 102 104 11 2975 18378 13880 16353 2114 192Saudi Arabia 21 18 1 2 2 8010 5607 294 447 447 224Singapore 1 0 2 5 2 135 107 632 1031 153 85Syria 10 10 5 5 5 714 1171 945 945 945 189Tajikistan 0 0 6Thailand 40 44 44 73 7 7293 7703 7193 8511 757 108Turkey 1048 545 630 519 704 97442 58079 65461 60462 63185 90Turkmenistan 0 0 0 0 1
Untd Arab Em 7 7 16 16 77 482 482 3368 3368 3476 45Uzbekistan I 1 1 1 32 70 70 114 114 1889 59Viet Nam 0 4
Europe 19336 20785 17386 20963 23740 1110683 1368201 1150552 1272332 1482995 62
Albania 1 0Austria 4037 3950 3552 4125 3982 253244 246000 235805 266232 280626 70Bel-Lux 989 576 555 726 710 42432 34157 35628 44788 44000 62
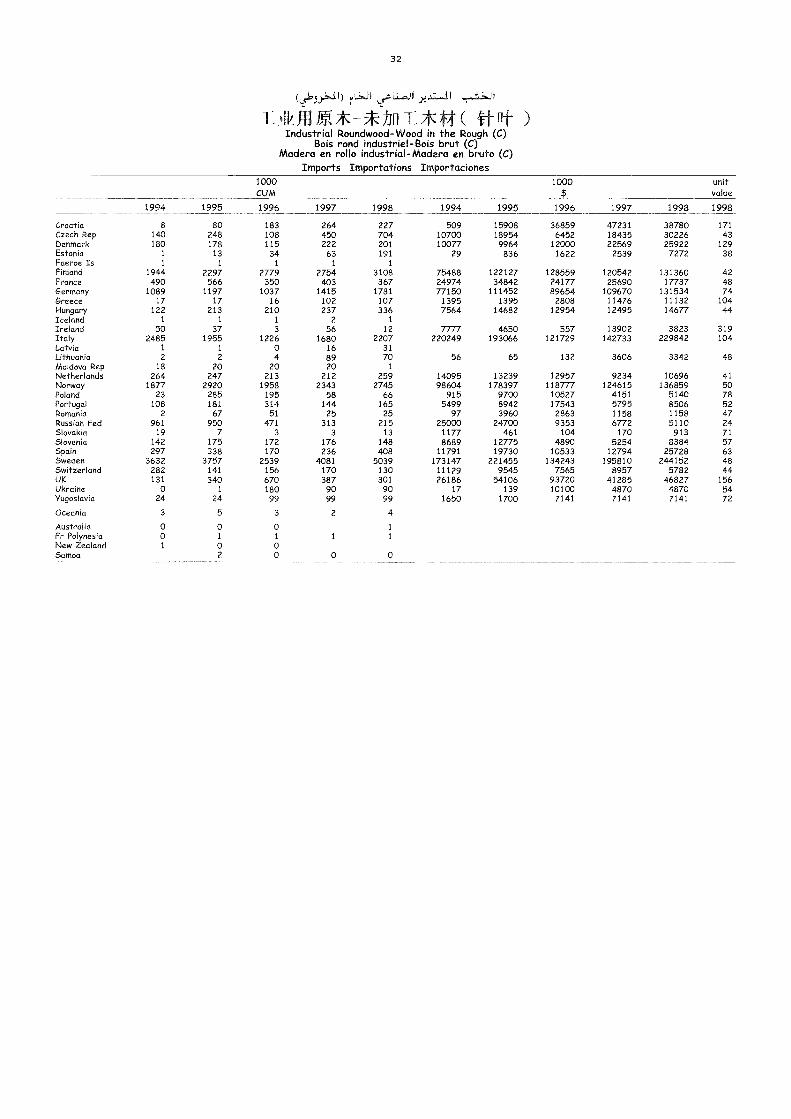
rwl
32
TAPIC*-VJFIT.Acff( rtt )Industrial Roundwood-Wood in the Rough (C)
Bois rond industriel-Bois brut (C)Madera en rollo industrial-Madera en bruto (C)
Imports Importations Importaciones1000CUM
1000 unitvalue
1994 1995 1996 1997 1998 1994 1995 1996 1997 1998 1998
Croatia 8 80 183 264 227 509 15908 36859 47231 38780 171Czech Rep 140 248 108 450 704 10700 18954 6452 18435 30226 43Denmark 180 178 115 222 201 10077 9964 12000 22569 25922 129Estonia 1 13 34 63 191 29 836 1622 2539 7272 38Faeroe Is 1 1 1 1 1
Finland 1944 2297 2779 2754 3108 75488 122127 128559 120542 131360 42France 490 566 350 403 367 24974 34842 24177 25690 17737 48Germany 1089 1197 1037 1415 1781 77150 111452 89654 109670 131534 74Greece 17 17 16 102 107 1395 1395 2808 11476 11132 104Hungary 122 213 210 237 336 7564 14682 12954 12495 14677 44Iceland 1 1 1 2 1
Ireland 50 37 3 56 12 //// 4650 557 13902 3823 319Italy 2485 1955 1226 1680 2207 220249 193066 121729 142733 229842 104Latvia 1 1 0 16 31Lithuania 2 2 4 89 70 56 65 132 3606 3342 48Moldova Rep 18 20 20 20 1
Netherlands 264 247 213 212 259 14095 13239 12957 9234 10696 41Norway 1877 2920 1958 2343 2745 98604 178397 11811/ 124615 136859 50Poland 23 285 195 58 66 915 9700 10527 4151 5140 78Portugal 108 181 314 144 165 5499 8942 17543 5795 8506 52Romania 2 67 51 25 25 97 3960 2863 1158 1158 47Russian Fed 961 950 471 313 215 25000 24700 9353 6772 5110 24Slovakia 19 7 3 3 13 1177 461 104 170 913 71Slovenia 142 175 172 176 148 8689 12775 4890 5254 8384 57Spain 297 338 170 236 408 11791 19730 10533 12794 25728 63Sweden 3632 3757 2539 4081 5039 173147 221455 134243 195810 244152 48Switzerland 282 141 156 170 130 11129 9545 7565 8957 5782 44UK 131 340 670 387 301 26186 54106 93720 41285 46827 156Ukraine 0 1 180 90 90 17 139 10100 4870 4870 54Yugoslavia 24 24 99 99 99 1650 1700 7141 7141 7141 72
Oceania 3 5 3 2 4
Australia 0 0 0 1
Fr Polynesia 0 1 1 1 1
New Zealand 1 0 0Samoa 2 0 0 0
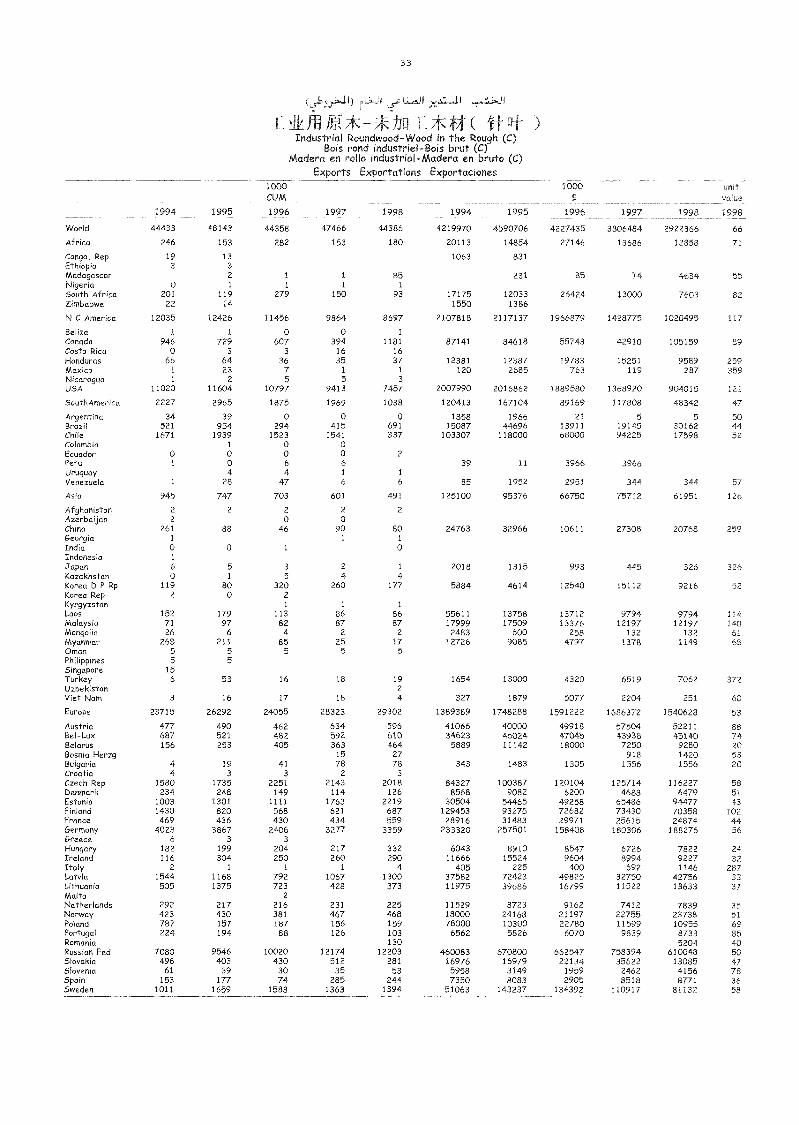
33
I _?lk =.* hri Fit )Industrial Roundwood-Wood in the Rough (C)
Bois rond industriel-Bois brut (C)Madera en rollo industrial-Madera en bruto (C)
Exports Exportations Exportaciones
1994 1995
1000CUM
1996 1997 1998 1994 1995
1000$
1996 1997 1998
unitvalue
1998
World 44433 48143 44358 47466 44386 4219970 4590706 4227435 3806484 2922366 66
Africa 246 153 282 153 180 20113 14854 27146 13686 12858 71
Congo, Rep 19 13 1063 831Ethiopia 3 3Madagascar 2 1 1 85 231 85 74 4634 55Nigeria 0 1 1 1 1
South Africa 201 119 279 150 93 17175 12033 26424 13000 7603 82Zimbabwe 22 14 1550 1386
N C America 12035 12426 11456 9864 8697 2107818 2117137 1966879 1428775 1020495 117
Belize 1 1 0 0 1
Canada 946 729 607 394 1181 87141 84618 55743 42910 105159 89Costa Rica 0 3 3 16 16Honduras 66 64 36 35 37 12381 12387 19783 15251 9589 259Mexico 1 23 7 1 1 120 2685 763 119 287 359Nicaragua 1 2 5 5 3
USA 11020 11604 10797 9413 7457 2007990 2016862 1889580 1368920 904015 121
SouthAmerica 2227 2965 1875 1969 1038 120413 167104 89169 117808 48342 47
Argentina 34 39 0 0 0 1858 1966 21 5 5 50Brazil 521 954 294 415 691 15087 44696 13911 19145 30162 44Chile 1671 1939 1523 1541 337 103307 118000 68000 94225 17598 52Colombia 1 0 0Ecuador 0 0 0 0 2
Peru 1 0 6 6 39 11 3966 3966Uruguay 4 4 1 1
Venezuela 1 28 47 6 6 85 1952 2951 344 344 57
Asia 945 747 703 601 491 125100 95376 66750 75712 61951 126
Afghanistan 2 2 2 2 2
Azerbaijan 2 0 0China 261 88 46 90 80 24763 32966 10611 27308 20768 259Georgia 1 1 1
India 0 0 1 0Indonesia 1
Japan 6 5 3 2 1 2018 1315 993 445 326 326Kazakhstan 0 1 5 4 4Korea D P Rp 119 80 320 260 177 5884 4614 12540 15112 9216 52Korea Rep 2 0 2
Kyrgyzstan 1 1 1
Laos 152 179 113 86 86 55611 13758 13712 9794 9794 114Malaysia 71 97 82 87 87 17999 17509 13376 12197 12197 140Mongolia 26 6 4 2 2 2483 600 258 132 132 61Myanmar 268 211 85 25 17 12726 9085 4797 1378 1149 68Oman 5 5 5 5 5Phdippines 5 5Singapore 15Turkey 6 53 16 18 19 1654 13000 4320 6519 7062 372Uzbekistan 2
Viet Nam 3 16 17 18 4 327 1879 5077 2204 251 60
Europe 23715 26292 24055 28323 29302 1389389 1748288 1591222 1686372 1540628 53
Austria 477 490 462 634 596 41066 40000 49918 57504 52211 88Bel-Lux 687 521 482 592 610 34623 45024 47045 43938 45140 74Belarus 156 253 405 363 464 5889 11142 18000 7250 9280 20Bosnia Herzg 15 27 918 1420 53Bulgaria 4 19 41 78 78 343 1483 1305 1556 1556 20Croatia 4 3 3 2 3
Czech Rep 1580 1735 2251 2143 2018 84327 100387 120104 125714 116227 58Denmark 234 248 149 114 126 8568 9082 6200 4688 6479 51Estonia 1003 1301 1111 1763 2219 30504 54465 49258 65486 94477 43Finland 1430 820 568 621 687 129453 93275 72682 73430 70358 102France 469 436 430 434 559 28916 31483 29971 25615 24874 44Germany 4023 3867 2406 3277 3359 233320 257501 158408 180306 188276 56Greece 6 3 3
Hungary 182 199 204 217 332 6043 8910 8547 6726 7822 24Ireland 116 304 250 260 290 11666 15524 9604 8994 9227 32Italy 2 1 1 1 4 405 225 400 692 1146 287Latvia 1544 1168 792 1067 1300 37582 72423 49825 32750 42756 33Lithuania 505 1375 723 428 373 11975 39686 16799 11522 13633 37Malta 2
Netherlands 292 217 216 231 225 11529 8723 9162 7412 7839 35Norway 423 430 381 467 468 18000 24168 21197 22755 23738 51Poland 787 157 187 156 159 78000 10300 22780 11599 10955 69Portugal 224 194 88 126 103 6562 5826 6070 9839 8733 85Romania 130 5204 40Russian Fed 7080 9546 10020 12174 12203 460083 670800 662547 758394 610048 50Slovakia 496 403 430 512 281 16976 16979 22134 35622 13085 47Slovenia 61 39 30 35 53 5958 3149 1959 2462 4156 78Spain 153 177 74 285 244 7350 8083 2905 8518 8771 36Sweden 1011 1659 1583 1363 1394 51063 143237 134392 110917 81132 58
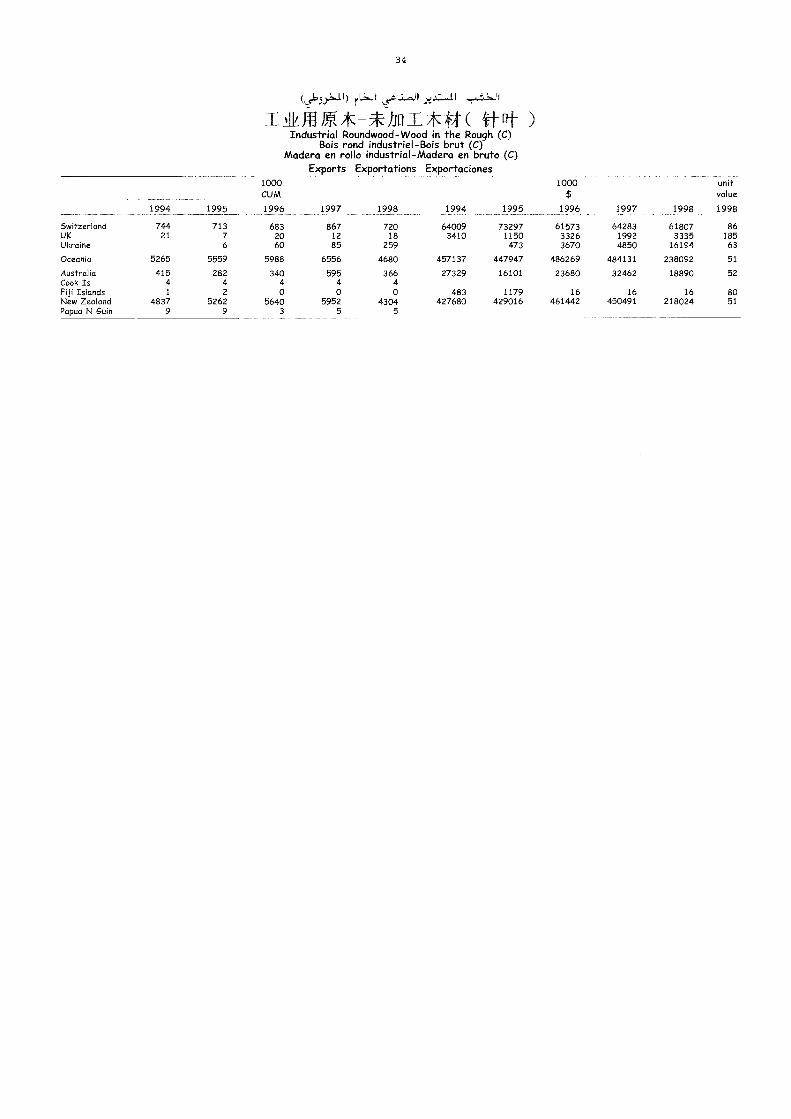
34
(,511)11/ E*-*-hrl T.* ( t[- rF1--
Industrial Roundwood-Wood in the Rough (C)Bois rond industriel-Bois brut (C)
Madera en rollo industrial-Madera en bruto (C)Exports Exportations Exportaciones
1000CUM
1000$
unitvalue
1994 1995 1996 1997 1998 1994 1995 1996 1997 1998 1998
Switzerland 744 713 683 867 720 64009 73297 61573 64283 61807 86UK 21 7 20 12 18 3410 1150 3326 1992 3335 185Ukraine 6 60 85 259 473 3670 4850 16194 63
Oceania 5265 5559 5988 6556 4680 457137 447947 486269 484131 238092 51
Australia 415 282 340 595 366 27329 16101 23680 32462 18890 52Cook Is 4 4 4 4 4Fiji Islands 1 2 0 0 0 483 1179 16 16 16 80New Zealand 4837 5262 5640 5952 4304 427680 429016 461442 450491 218024 51Papua N Guin 9 9 3 5 5
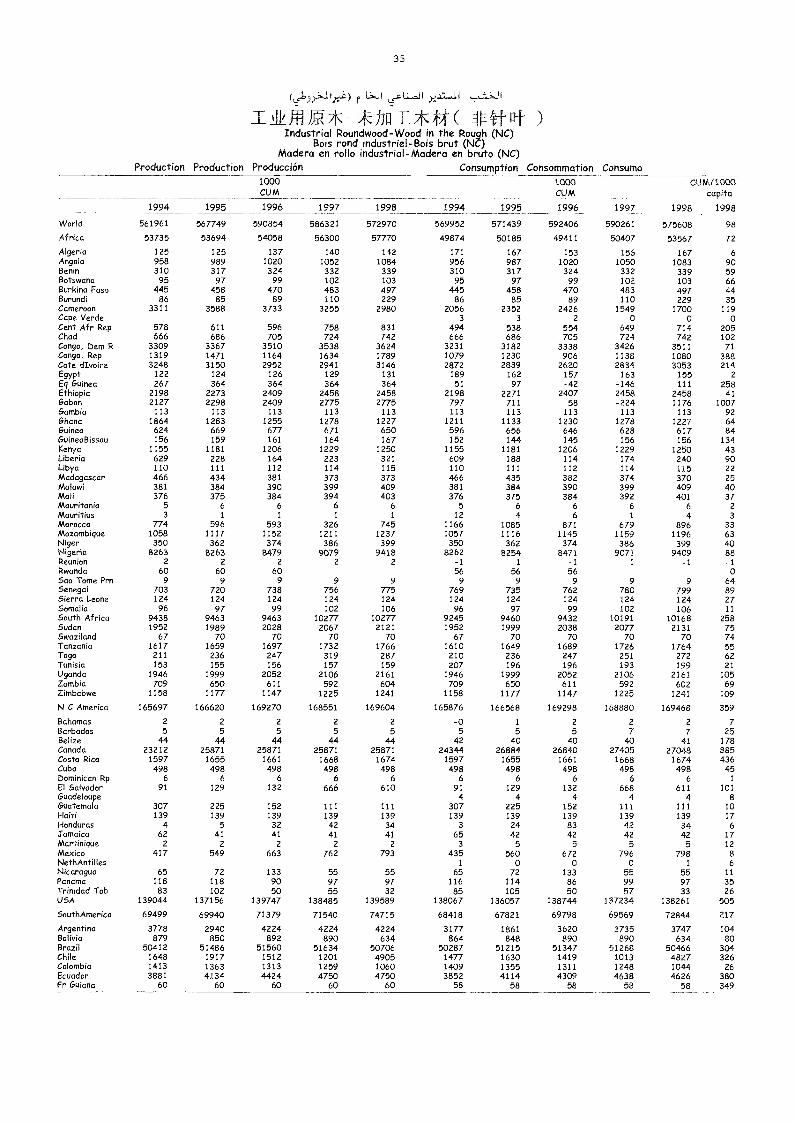
35
r L.5,11...m
TAk EAK*hrli*ft(Industrial Roundwood-Wood in the Rough (NC)
Bois rond industriel-Bois brut (NC)Madera en rollo industrial-Madera en bruto (NC)
Production Production Producción Consumption Consommation Consumo1000CUM
1994 1995
1000CUM
1996 1997
CU M/1000capita
1998 19981994 1995 1996 1997 1998
VVorld 561961 567749 590854 586321 572970 569952 571439 592406 590261 575608 98
Africa 53735 53694 54058 56300 51/1.0 49874 50185 49411 50407 53567 72
Algeria 125 125 137 140 142 171 167 153 156 167 6Angola 958 989 1020 1052 1084 956 987 1020 1050 1083 90Benin 310 317 324 332 339 310 317 324 332 339 59Botswana 95 97 99 102 103 95 97 99 102 103 66BurkMa Faso 445 458 470 483 497 445 458 470 483 497 44Burundi 86 85 89 110 229 86 85 89 110 229 35Cameroon 3311 3588 3733 3255 2980 2056 2352 2426 1549 1700 119Cape Verde 3 3 2 0 0 0Cent Afr Rep 578 611 596 758 831 494 538 554 649 714 205Chad 666 686 705 724 742 666 686 705 724 742 102Congo, Dem R 3309 3367 3510 3538 3624 3231 3182 3338 3426 3511 71Congo, Rep 1319 1471 1164 1634 1789 1079 1230 906 1138 1080 388Cote dIvoire 3248 3150 2952 2941 3146 2872 2839 2620 2834 3053 214Egypt 122 124 126 129 131 189 162 157 163 155 2
EqGuirma 267 364 364 364 364 51 97 -42 -146 111 258EtMoMa 2198 2273 2409 2458 2458 2198 2271 2407 2458 2458 41Gabon 2127 2298 2409 2775 2775 797 711 58 -224 1176 1007Gamba 113 113 113 113 113 113 113 113 113 113 92Ghana 1864 1283 1255 1278 1227 1211 1133 1230 1278 1227 64Guirma 624 669 677 671 650 596 656 646 628 617 84GuMeaRissau 156 159 161 164 167 152 144 145 156 156 134Kenya 1155 1181 1206 1229 1250 1155 1181 1206 1229 1250 43Liberia 629 228 164 223 321 609 188 114 174 240 90Libya 110 111 112 114 115 110 111 112 114 115 22Madagascar 466 434 381 373 373 466 435 382 374 370 25Malawi 381 384 390 399 409 381 384 390 399 409 40Mali 376 375 384 394 403 376 375 384 392 401 37Mauritania 5 6 6 6 6 5 6 6 6 6 2Mauritius 3 1 1 1 1 12 4 6 1 4 3Morocco 774 596 593 326 745 1166 1085 871 679 896 33Mozambique 1058 1117 1152 1211 1237 1057 1116 1145 1159 1196 63Niger 350 362 374 386 399 350 362 374 386 399 40Nigeria 8263 8263 8479 9079 9418 8262 6254 8471 9071 9409 88ReunMn 2 2 2 2 2 -1 -1 -1 -1 -1 -1Rwanda 60 60 60 56 56 56 0Sao Toum Prn 9 9 9 9 9 9 9 9 9 9 64Senegal 703 720 738 756 775 769 735 762 780 799 89Sierra Leone 124 124 124 124 124 124 124 124 124 124 27Somalia 96 97 99 102 106 96 97 99 102 106 11South Africa 9438 9463 9463 10277 10277 9245 9460 9432 10191 10168 258Sudan 1952 1989 2028 2067 2121 1952 1999 2038 2077 2131 75Swaziland 67 70 70 70 70 67 70 70 70 70 74Tanzania 1617 1659 1697 1732 1766 1610 1649 1689 1726 1764 55Togo 211 236 247 319 287 210 236 247 251 272 62Tunisia 153 155 156 157 159 207 196 196 193 199 21Uganda 1946 1999 2052 2106 2161 1946 1999 2052 2106 2161 105Zambia 709 650 611 592 604 709 650 611 592 602 69Zimbabwe 1158 1177 1147 1225 1241 1158 1177 1147 1225 1241 109
N C America 165697 166620 169270 168551 169604 165876 166568 169298 168880 169468 359
Bahamas 2 2 2 2 2 -0 1 2 2 2 7Barbados 5 5 5 5 5 5 5 5 7 7 25Belize 44 44 44 44 44 42 40 40 40 41 178Canada 23212 25871 25871 25871 25871 24344 26884 26840 27405 27048 885Costa Rica 1597 1655 1661 1668 1674 1597 1655 1661 1668 1674 436Cuba 498 498 498 498 498 498 498 498 498 498 45DominMan Rp 6 6 6 6 6 6 6 6 6 6 1
El Salvador 91 129 132 666 610 91 129 132 668 611 101GuadeMupe 4 4 4 4 4 8Guatemala 307 225 152 111 111 307 225 152 111 111 10Haiti 139 139 139 139 139 139 139 139 139 139 17Honduras 4 5 32 42 34 3 24 83 42 34 6Jamaica 62 41 41 41 41 65 42 42 42 42 17MartinMue 2 2 2 2 2 3 5 5 5 5 12Mexico 417 549 663 762 793 435 560 672 796 798 8NethAntilles 1 o o o 1 6Nicaragua 65 72 133 55 55 65 72 133 55 55 11Panama 118 118 90 97 97 116 114 86 99 97 35TriMdadTob 83 102 50 55 32 85 105 50 57 33 26USA 139044 137156 139747 138485 139589 138067 136057 138744 137234 138261 505
SouthAmerica 69499 69940 71379 71540 74715 68418 67821 69798 69569 72844 217
Argentina 3778 2940 4224 4224 4224 3177 1861 3620 3735 3747 104Bolivia 879 850 892 890 634 864 848 890 890 634 80Brazfl 50412 51486 51560 51634 50706 50287 51215 51347 51268 50466 304Chile 1648 1917 1512 1201 4905 1477 1630 1419 1013 4827 326Colombia 1413 1363 1313 1259 1060 1409 1355 1311 1248 1044 26Ecuador 3881 4134 4424 4750 4750 3852 4114 4309 4638 4626 380Fr Guiana 60 60 60 60 60 58 58 58 58 58 349
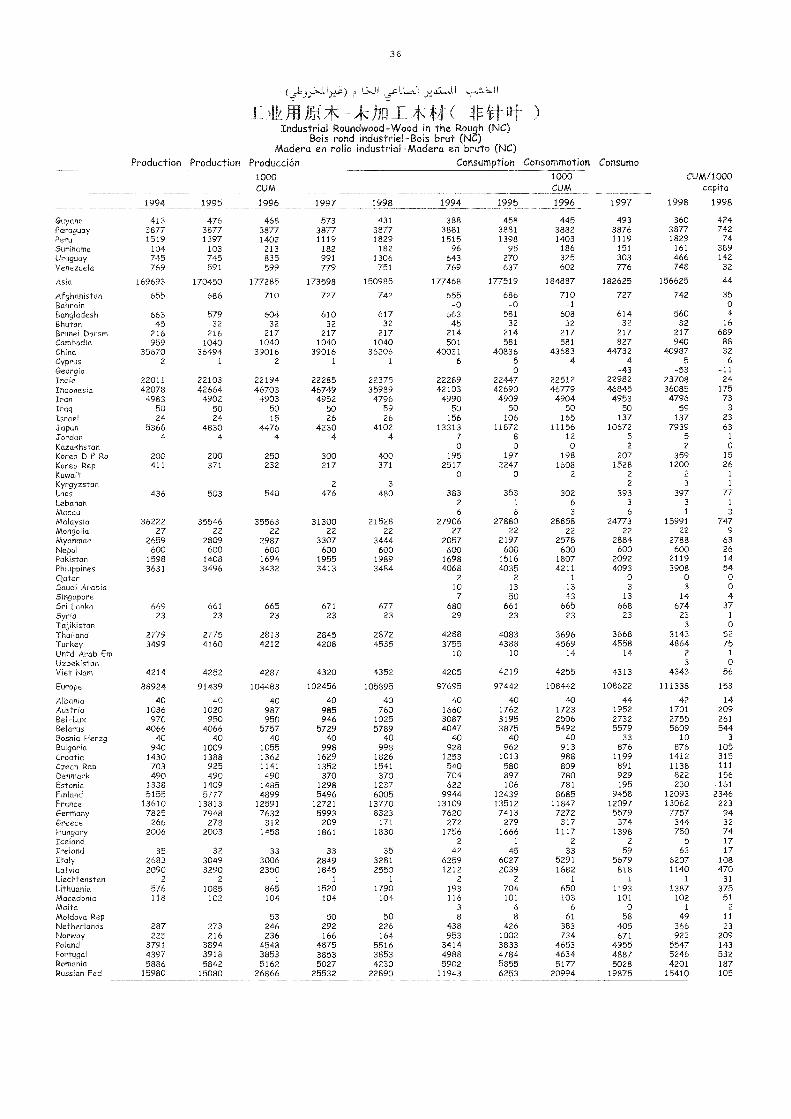
36
I I
TAkill KY: AK )Industrial Roundv000d-Wood in the Rough (NC)
Bois rond industriel-Bois brut (NC)Madero en rollo industrial-Madera en bruto (NC)
Production Production Producción Consumption Consommation Consumo
1994 1995
1000CUM
1996 1997 1998 1994 1995
1000CUM
1996 1997
U
1998 1998
Guyana 413 476 468 573 431 388 458 445 493 360 424Paraguay 3877 3877 3877 3877 3877 3881 3881 3882 3876 3877 742Peru 1519 1397 1402 1119 1829 1515 1398 1403 1119 1829 74Suriname 104 103 213 182 182 96 95 186 151 161 389Uruguay 745 745 835 991 1306 643 270 325 303 466 142Venezuela 769 591 599 779 751 769 637 602 776 748 32
Asia 169693 170450 177285 173598 150985 177468 177519 184887 182625 156625 44
Afghanistan 655 686 710 727 742 655 686 710 727 742 35Bahrain -0 -0 -1 0
Bangladesh 663 579 604 610 617 663 581 608 614 560 4
Bhutan 45 32 32 32 32 45 32 32 32 32 16
Brunei Darsm 216 216 217 217 217 214 214 217 217 217 689Cambodia 959 1040 1040 1040 1040 501 581 581 827 940 88China 35670 36494 39016 39016 36206 40031 40836 43683 44732 40987 32Cyprus 2 1 2 1 1 6 5 4 4 5 6
Georgia 0 -43 -53 -11India 22011 22103 22194 22285 22375 22289 22447 22512 22982 23708 24
Indonesia 42078 42664 46703 46749 35989 42103 42690 46779 46845 36085 175Iran 4983 4902 4903 4952 4796 4990 4909 4904 4953 4796 73Iraq 50 50 50 50 59 50 50 50 50 59 3
Israel 24 24 15 26 26 156 106 165 137 137 23
Japan 5366 4830 4476 4230 4102 13313 11872 11156 10672 7939 63
Jordan 4 4 4 4 4 7 8 12 5 5 1
Kazakhstan 0 0 0 2 2 0
Korea D P Rp 200 200 250 300 400 195 197 198 207 359 15Korea Rep 411 371 232 217 371 2517 2247 1608 1528 1200 26Kuwait 0 0 2 2 2 1
Kyrgyzstan 2 3 2 3 1
Laos 436 503 540 476 480 383 353 302 393 397 77Lebanon 2 1 6 3 3 1
Macau 6 6 3 6 1 3
Malaysia 36222 35546 35563 31300 21528 27906 27880 28858 24773 15991 747Mongolia 27 22 22 22 22 27 22 22 22 22 9Myanmar 2659 2809 2987 3307 3444 2057 2197 2578 2884 2788 63Nepal 600 600 600 600 600 600 600 600 600 600 26Pakistan 1598 1408 1694 1955 1989 1698 1516 1807 2092 2119 14Philippines 3631 3496 3432 3413 3484 4068 4035 4211 4093 3908 54Qatar 2 2 1 0 0 0Saudi Arabia 10 13 13 3 3 0Singapore 7 50 43 13 14 4Sri Lanka 669 661 665 671 677 680 661 665 668 674 37Syria 23 23 23 23 23 29 23 23 23 23 1
TOkistan 3 0Thailand 2779 2775 2813 2845 2872 4288 4083 3696 3668 3143 52Turkey 3499 4160 4212 4208 4535 3755 4388 4569 4558 4864 75Untd Arab Em 10 10 14 14 2 1
Uzbekistan 3 0Viet Naos 4214 4252 4287 4320 4352 4205 4219 4255 4313 4343 56
Europe 88924 91439 104483 102456 105895 97695 97442 108442 108622 111338 153
Albania 40 40 40 40 40 40 40 40 44 42 14Austria 1036 1020 987 985 760 1660 1762 1723 1952 1701 209Bel-Lux 970 950 950 946 1025 3087 3195 2506 2732 2755 261Belarus 4066 4066 5757 5729 5789 4047 3875 5492 5579 5609 544Bosnia Herzg 40 40 40 40 40 40 40 40 33 10 3
Bulgaria 940 1009 1055 998 998 928 962 913 876 876 105Croatia 1430 1388 1362 1629 1826 1253 1013 988 1199 1412 315Czech Rep 703 925 1141 1352 1541 540 580 809 891 1138 111
Denmark 490 490 490 370 370 704 897 780 929 822 156Estonia 1338 1409 1485 1298 1237 622 106 781 195 -230 -161Finland 5155 5777 4899 5496 6005 9944 12439 8685 9458 12093 2346France 13610 13813 12591 12721 13770 13109 13512 11847 12097 13062 223Germany 7825 7948 7632 5993 8323 7620 7413 7272 5579 7757 94Greece 266 278 312 209 171 272 279 317 374 344 32Hungary 2006 2003 1458 1861 1830 1756 1666 1117 1398 750 74Iceland 2 1 2 2 5 17Ireland 35 32 33 33 35 42 45 33 59 63 17Italy 2683 3049 3006 2849 3281 6259 6027 5291 5679 6207 108Latvia 2090 3290 2350 1845 2550 1212 2039 1682 818 1140 470Liechtensten 2 2 1 1 1 2 2 1 1 1 31
Lithuania 576 1085 865 1520 1790 193 704 650 1193 1387 375Macedonia 118 102 104 104 104 116 101 103 101 102 51Malta 3 6 6 0 1 2Moldova Rep 53 50 50 8 8 61 58 49 11Netherlands 287 273 246 292 226 438 426 383 405 366 23Norway 225 216 236 166 164 953 1002 734 671 923 209Poland 3791 3894 4548 4875 5516 3414 3833 4653 4955 5547 143Portugal 4397 3918 3853 3853 3853 4988 4784 4634 4887 5246 532Romania 5886 5842 5162 5027 4230 5902 5855 5177 5028 4201 187Russian Fed 15980 15080 26866 25532 22890 11943 6253 20994 19875 15410 105
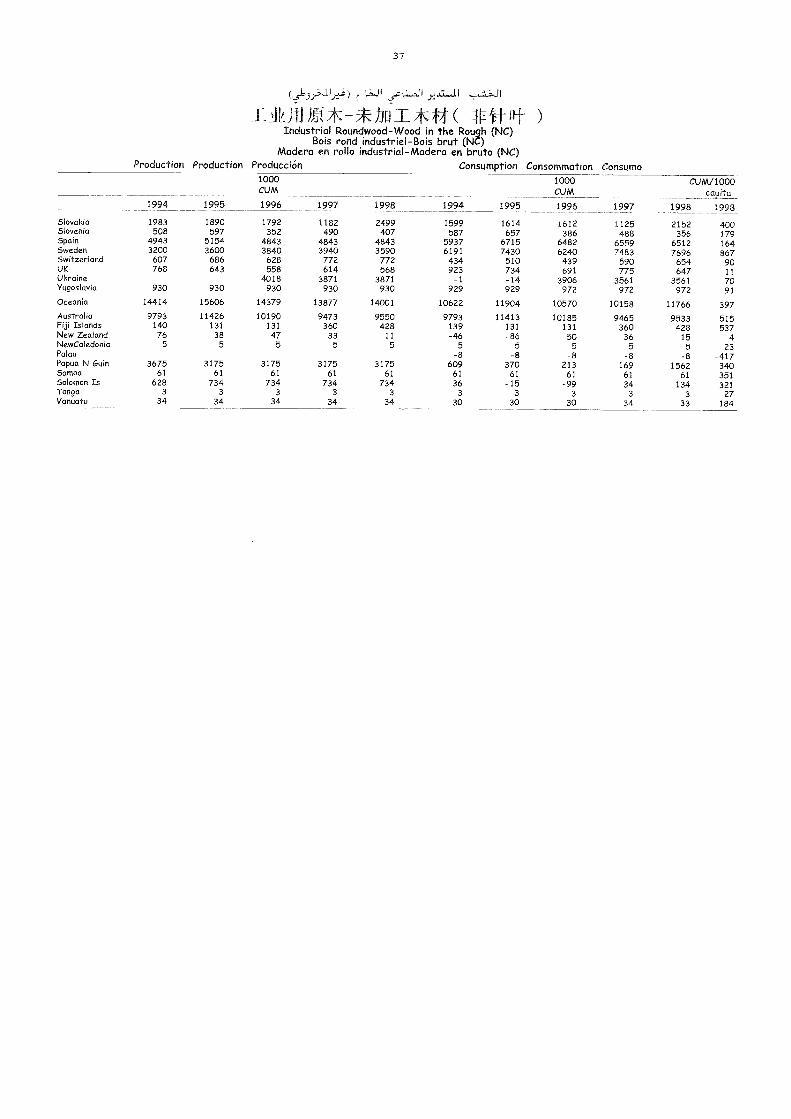
37
r L-J1 ri .L1
T A C71K---*hn 71A-( 14tt)Industrial Roundwood-Wood in the Rough (NC)
Bois rond industriel-Bois brut (NC)Madera en rollo industrial-Madera en bruto (NC)
Production Production Producción Consumption Consommation Consumo
1994 1995
1000CUM
1996 1997 1998 1994 1995
1000CUM
1996 1997
CUM/1000capita
1998 1998
Slovakia 1983 1890 1792 1182 2499 1599 1614 1612 1125 2152 400Slovenia 508 597 352 490 407 587 657 386 488 356 179Spain 4943 5154 4843 4843 4843 5937 6715 6482 6559 6512 164Sweden 3200 3600 3840 3940 3590 6191 7430 6240 7483 7696 867Switzerland 607 686 628 772 772 434 510 439 590 654 90UK 768 643 558 614 568 923 734 691 775 647 11Ukraine 4018 3871 3871 -1 -14 3906 3561 3561 70Yugoslavia 930 930 930 930 930 929 929 972 972 972 91
Oceania 14414 15606 14379 13877 14001 10622 11904 10570 10158 11766 397Australia 9793 11426 10190 9473 9550 9793 11413 10185 9465 9533 515Fiji Islands 140 131 131 360 428 139 131 131 360 428 537New Zealand 76 38 47 33 11 -46 -86 50 36 15 4NewCaledonia 5 5 5 5 5 5 5 5 5 5 23Palau -8 -8 -8 -8 -8 -417Papua N Guin 3675 3175 3175 3175 3175 609 370 213 169 1562 340Samoa 61 61 61 61 61 61 61 61 61 61 351Solomon Is 628 734 734 734 734 36 -15 -99 34 134 321Tonga 3 3 3 3 3 3 3 3 3 3 27Vanuatu 34 34 34 34 34 30 30 30 34 33 184
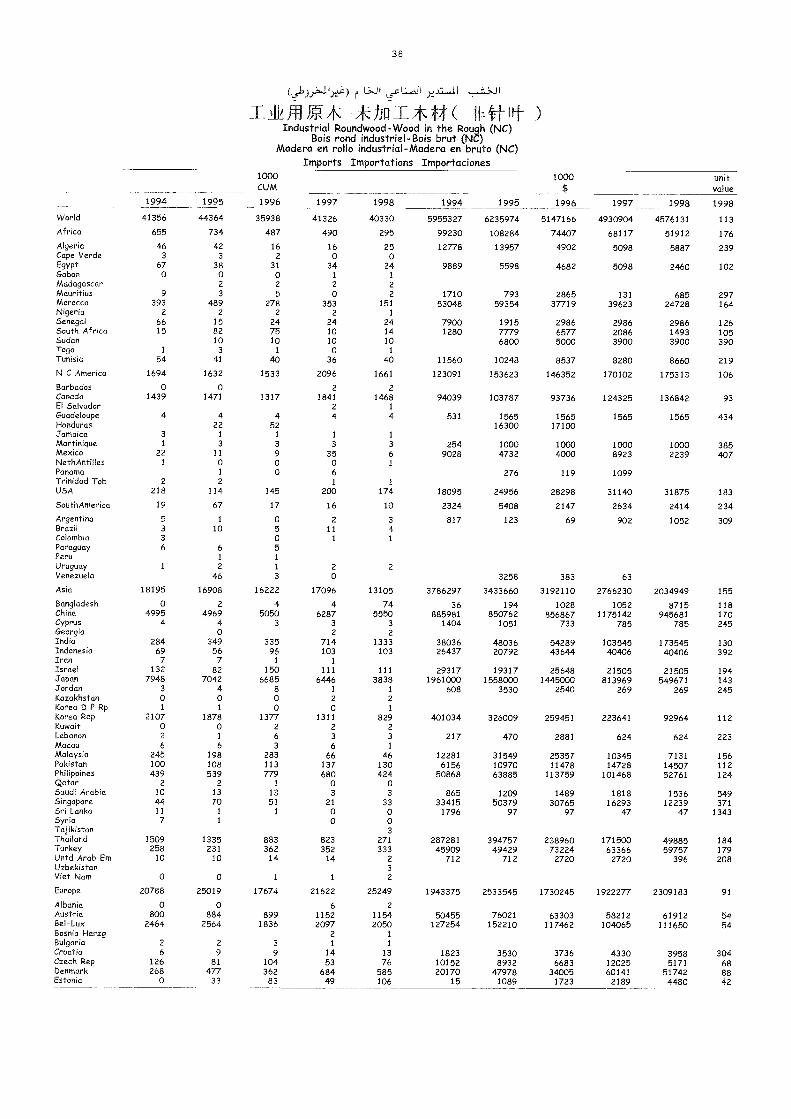
38
IAA Eq*-*in * ( t1ft)Industrial Roundwood-Wood in the Rough (NC)
Bois rond industriel-Bois brut (NC)Madera en rollo industrial-Madera en bruto (NC)
Imports Importations Importaciones
1994 1995
1000CUM
1996
1000$
unitvalue
1997 1998 1994 1995 1996 1997 1998 1998
World 41356 44364 35938 41326 40330 5955327 6235974 5147166 4930904 4576131 113
Africa 655 734 487 490 295 99230 108284 74407 68117 51912 176
Algeria 46 42 16 16 25 12778 13957 4902 5098 5887 239Cape Verde 3 3 2 0 0Egypt 67 38 31 34 24 9889 5598 4682 5098 2460 102Gabon 0 0 0 1 1
Madagascar 2 2 2 2Mauritius 9 3 5 0 2 1710 793 2865 131 685 297Morocco 393 489 278 353 151 53048 59354 37719 39623 24728 164Nigeria 2 2 2 2 1
Senegal 66 15 24 24 24 7900 1915 2986 2986 2986 126South Africa 15 82 75 10 14 1280 /719 6577 2086 1493 105Sudan 10 10 10 10 6800 5000 3900 3900 390Togo 1 3 1 0 1
Tunisia 54 41 40 36 40 11560 10248 8537 8280 8660 219
N C America 1694 1632 1533 2096 1661 123091 153623 146352 170102 175313 106Barbados 0 0 2 2Canada 1439 1471 1317 1841 1468 94039 103787 93736 124325 136842 93El Salvador 2 1
Guadeloupe 4 4 4 4 4 531 1565 1565 1565 1565 434Honduras 22 52 16300 17100Jamaica 3 1 1 1 1
Martinique 1 3 3 3 3 254 1000 1000 1000 1000 385Mexico 22 11 9 35 6 9028 4732 4000 8923 2239 407NethAntilles 1 0 0 0 1
Panama 1 0 6 276 119 1099Trinidad Tob 2 2 1 1
USA 218 114 145 200 174 18095 24956 28298 31140 31875 183
SouthAmerica 19 67 17 16 10 2324 5408 2147 2634 2414 234
Argentina 5 1 0 2 3 817 123 69 902 1052 309Brazil 3 10 5 11 4Colombia 3 0 1 1
Paraguay 6 6 5
Peru 1 1
Uruguay 1 2 1 2 2Venezuela 46 3 0 3258 383 63
Asia 18195 16908 16222 17096 13105 3786297 3433660 3192110 2766230 2034949 155
Bangladesh 0 2 4 4 74 36 194 1028 1052 8715 118China 4995 4969 5050 6287 5550 885981 850762 856867 1175142 945681 170Cyprus 4 4 3 3 3 1404 1051 733 785 785 245Georgia 0 2 2India 284 349 335 714 1333 38036 48036 54289 103545 173545 130Indonesia 69 56 96 103 103 26437 20792 43644 40406 40406 392Iran 7 7 1 1
Israel 132 82 150 111 111 29317 19317 25648 21505 21505 194Japan 7948 7042 6685 6446 3838 1961000 1558000 1445000 813969 549671 143Jordan 3 4 8 1 1 608 3530 2540 269 269 245Kazakhstan 0 0 0 2 2Korea D P Rp 1 1 0 0 1
Korea Rep 2107 1878 1377 1311 829 401034 326009 259451 223641 92964 112Kuwait 0 0 2 2 2
Lebanon 2 1 6 3 3 217 470 2881 624 624 223Macau 6 6 3 6 1
Malaysia 245 198 283 66 46 12281 31549 25357 10345 7131 156Pakistan 100 108 113 137 130 6156 10970 11478 14728 14507 112Philippines 439 539 779 680 424 50868 63885 113759 101468 52761 124Qatar 2 2 1 0 0Saudi Arabia 10 13 13 3 3 865 1209 1489 1818 1536 549Singapore 44 70 51 21 33 33415 50379 30765 16293 12239 371Sri Lanka 11 1 1 0 0 1796 97 97 47 47 1343Syria 7 1 0 0Tajikistan 3Thailand 1509 1335 883 823 271 287281 394757 238960 171500 49885 184Turkey 258 231 362 352 333 45909 49429 73224 63366 59757 179Untd Arab Em 10 10 14 14 2 712 712 2720 2720 396 208Uzbekistan 3Viet Nam 0 0 1 1 2
Europe 20788 25019 17674 21622 25249 1943375 2533545 1730245 1922277 2309183 91
Albania 0 0 6 2Austria 800 884 899 1152 1154 50455 76021 63303 58212 61912 54Bel-Lux 2464 2564 1836 2097 2050 127254 152210 117462 104065 111650 54Bosnia Herzg 2 1
Bulgaria 2 2 3 1 1
Croatia 6 9 9 14 13 1823 3530 3736 4330 3958 304Czech Rep 126 81 104 53 76 10152 8932 6683 12025 5171 68Denmark 268 477 362 684 585 20170 47978 34005 60141 51742 88Estonia 0 33 83 49 106 15 1089 1723 2189 4480 42
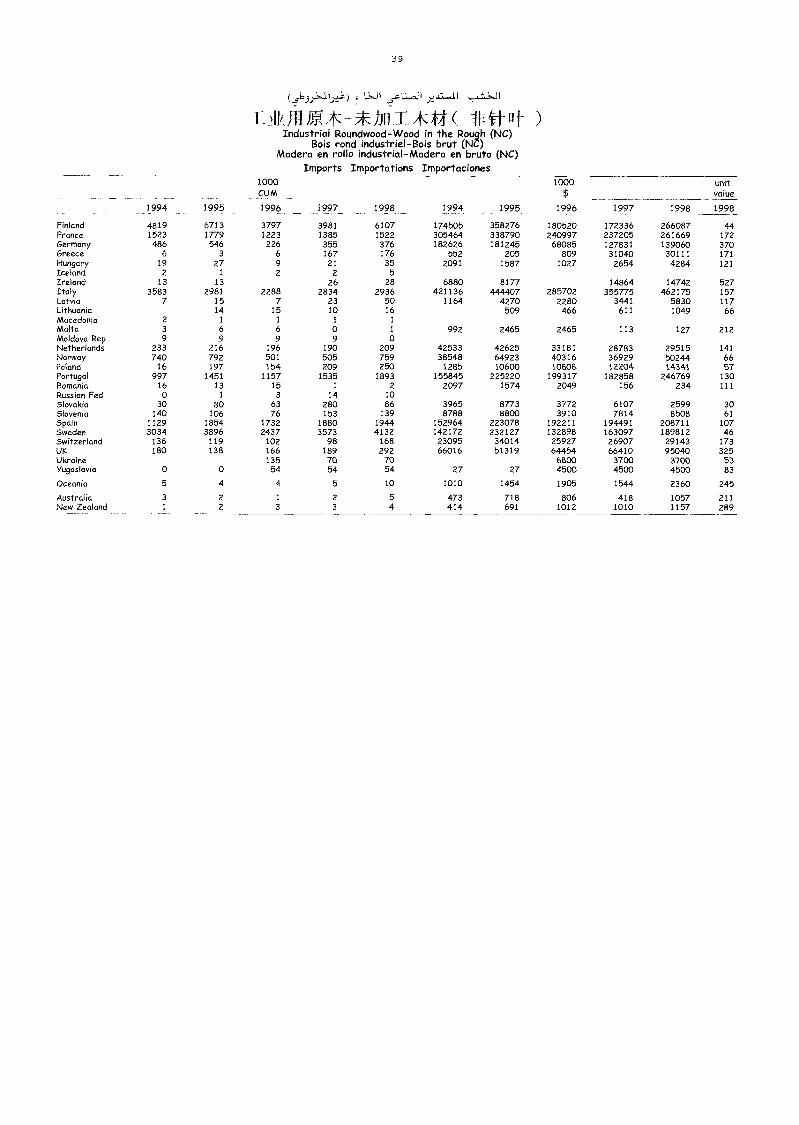
39
(L51.9)-1--07.,=> r
I bg*- hri 11:* 1tt)Industrial Roundwood-Wood in the Rough (NC)
Bois rond industriel-Bois brut (NC)Madera en rollo industrial-Madera en bruto (NC)
Imports Importations Importaciones1000CUM
1000 unitvalue
1994 1995 1996 1997 1998 1994 1995 1996 1997 1998 1998
Finland 4819 6713 3797 3981 6107 174505 358276 180520 172336 266087 44France 1523 1779 1223 1385 1522 305464 338790 240997 237205 261669 172Germany 486 546 226 355 376 182626 181245 68085 127831 139060 370Greece 6 3 6 167 176 552 205 809 31040 30111 171Hungary 19 27 9 21 35 2091 1587 1027 2654 4284 121Iceland 2 1 2 2 5
Ireland 13 13 26 28 6880 8177444407
14864 14742 527Italy 3583 2981 2288 2834 2936 421136 285702 355775 462175 157
4270Latvia 7 15 7 23 50 1164 2280 3441 5830 117Lithuania 14 15 10 16 509 466 611 1049 66Macedonia 2 1 1 1 1
Malta 3 6 6 0 1 992 2465 2465 113 127 212Moldova Rep 9 9 9 9 0Netherlands 233 216 196 190 209 42533 42625 33181 28783 29515 141Norway 740 792 501 505 759 38548 64923 40316 36929 50244 66Poland 16 197 154 209 250 1285 10600 10808 12204 14341 57Portugal 997 1451 1157 1535 1893 155845 225220 199317 182858 246769 130Romania 16 13 15 1 2 2097 1574 2049 156 234 111Russian Fed 0 1 3 14 10Slovakia 30 80 63 280 86 3965 8773 3772 6107 2599 30Slovenia 140 106 76 153 139 8788 8800 3910 7814 8508 61Spain 1129 1854 1732 1880 1944 152964 223078 192211 194491 208711 107Sweden 3034 3896 2437 3573 4132 142172 232127 132898 163097 189812 46Switzerland 136 119 102 98 168 23095 34014 25927 26907 29143 173UK 180 138 166 189 292 66016 51319 64454 66410 95040 325Ukraine 135 70 70 6800 3700 3700 53Yugoslavia 0 0 54 54 54 27 27 4500 4500 4500 83
Oceania 5 4 4 5 10 1010 1454 1905 1544 2360 245
Australia 3 2 1 2 5 473 718 806 418 1057 211New Zealand 1 2 3 3 4 414 691 1012 1010 1157 289
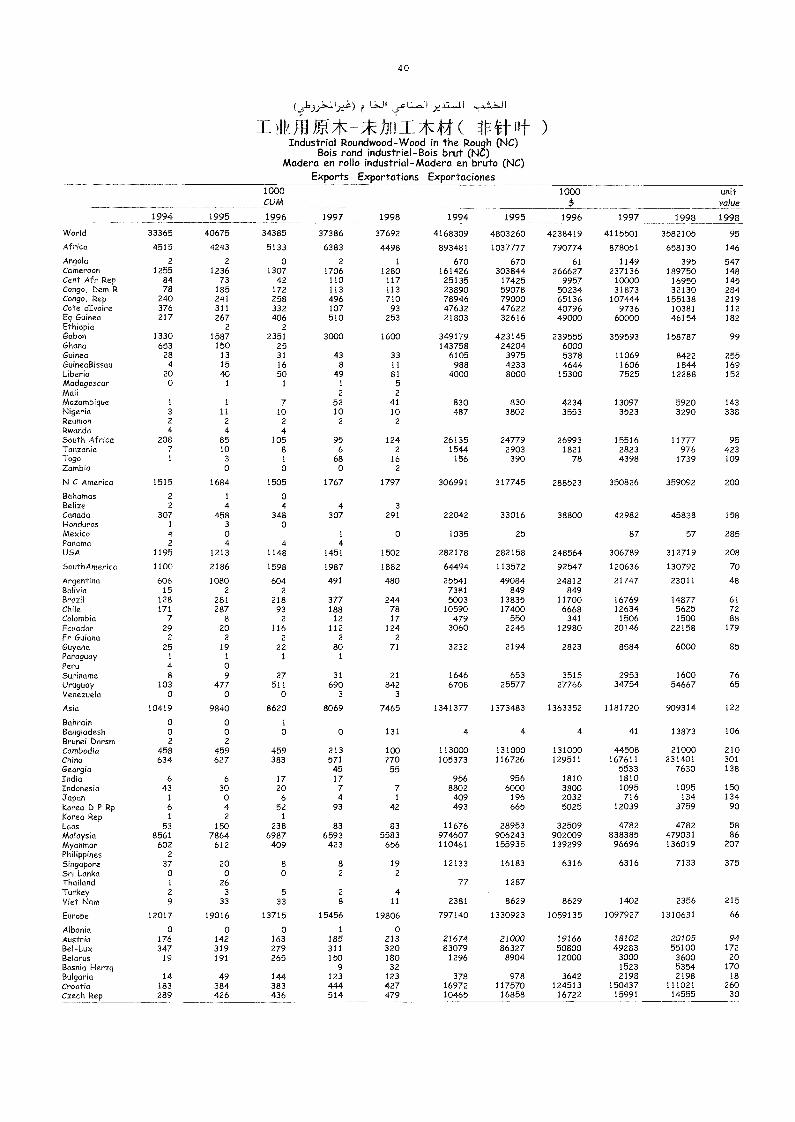
40
r LJfL.ra I II
TAkmEAK-)J[ii-A41( Erwt )Industrial Roundwood-Wood in the Rough (NC)
Bois rond industriel-Bois brut (NC)Madera en rollo industrial-Madera en bruto (NC)
Exports Exportations Exportaciones
1994 1995
1000CUM
1996
1000$
1997 1998
unitvokle
19981997 1998 1994 1995 1996
VVoHd 33365 40675 34385 37386 37692 4168309 4803260 4238419 4115501 3582105 95
Africa 4515 4243 5133 6383 4498 893481 1037777 790774 878051 658130 146
Angola 2 2 0 2 1 670 670 61 1149 395 547Cameroon 1255 1236 1307 1706 1280 161426 303844 266627 237136 189750 148Cent Afr Rep 84 73 42 110 117 25135 17425 9957 10000 16950 145Congo, Dam R 78 185 172 113 113 23890 59078 50234 31873 32130 284Congo, Rep 240 241 258 496 710 78946 79000 65136 107444 155138 219Cote dIvoire 376 311 332 107 93 47632 47622 40796 9736 10381 112Eq Guinea 217 267 406 510 253 21803 32616 49000 60000 46154 182Ethiopia 2 2Gabon 1330 1587 2351 3000 1600 349179 423145 239555 359593 158787 99Ghana 653 150 25 143758 24204 6000Guinea 28 13 31 43 33 6105 3975 5378 11069 8422 255GuMeaBissau 4 15 16 8 11 988 4233 4644 1606 1844 169Liberia 20 40 50 49 81 4000 8000 15300 7525 12288 152Madagascar 0 1 1 1 5
Mali 2 2Mozambique 1 1 7 52 41 830 830 4234 13097 5920 143Nigeria 3 11 10 10 10 487 3802 3553 3523 3290 338Reunion 2 2 2 2 2Rwanda 4 4 4South Africa 208 85 105 95 124 26135 24779 26993 15516 111/7 95Tanzania 7 10 8 6 2 1544 2903 1821 2823 976 423Togo 1 3 1 68 16 156 390 78 4398 1739 109Zambia 0 0 0 2
N C America 1515 1684 1505 1767 1797 306991 317745 288523 350826 359092 200
Bahamas 2 1 0Belize 2 4 4 4 3Cariado 307 458 348 307 291 22042 33016 38800 42982 45838 158Honduras 1 3 0Mexico 4 0 1 0 1035 25 87 57 285Panama 2 4 4 4USA 1195 1213 1148 1451 1502 282178 282158 248564 306789 312719 208
SouthAmerica 1100 2186 1598 1987 1882 64494 113572 92547 120636 130792 70
Argentina 606 1080 604 491 480 25541 49084 24812 21747 23011 48Bolivia 15 2 2 7381 849 849Brazil 128 281 218 377 244 5003 13835 11700 16769 14877 61Chile 171 287 93 188 78 10590 17400 6668 12634 5625 72Colombia 7 8 2 12 17 479 550 341 1506 1500 88Ecuador 29 20 116 112 124 3060 2245 12980 20146 22158 179Fr Guiana 2 2 2 2 2Guyana 25 19 22 80 71 3232 2194 2823 8584 6000 85Paraguay 1 1 1 1
Peru 4 0Suriname 8 9 27 31 21 1646 653 3515 2953 1600 76Uruguay 103 477 511 690 842 6708 25577 27766 34754 54667 65Venezuela 0 0 0 3 3
Asia 10419 9840 8620 8069 7465 1341377 1373483 1363352 1181720 909314 122
Bahrain 0 0 1
Bangladesh 0 0 0 0 131 4 4 4 41 13873 106Brunei barsm 2 2
Cambodia 458 459 459 213 100 113000 131000 131000 44508 21000 210China 634 627 383 571 770 105373 116726 129511 167611 231401 301Georgia 45 55 5533 7630 138India 6 6 17 17 956 956 1810 1810Indonesia 43 30 20 7 7 8802 6000 3800 1095 1095 150Japan 1 0 6 4 1 409 196 2032 716 134 134Korea D P Rp 6 4 52 93 42 493 665 5025 12039 3759 90Korea Rep 1 2 1
Laos 53 150 238 83 83 11676 28953 32509 4782 4782 58Malaysia 8561 7864 6987 6593 5583 974607 906243 902009 838385 479031 86Myanmar 602 612 409 423 656 110461 155935 139299 96696 136019 207Philippines 2
Singapore 37 20 8 8 19 12133 16183 6316 6316 7133 375Sri Lanka 0 0 0 2 2
Thailand 1 26 77 1287Turkey 2 3 5 2 4Viet Nam 9 33 33 8 11 2381 8629 8629 1402 2356 215
Europe 12017 19016 13715 15456 19806 797140 1330923 1059135 1097927 1310631 66
Albania 0 0 0 1 0Austria 176 142 163 185 213 21674 21000 19166 18102 20105 94Bel-Lux 347 319 279 311 320 83079 86327 50800 49283 55100 172Belarus 19 191 265 150 180 1296 8904 12000 3000 3600 20Bosnia Herzg 9 32 1523 5354 170Bulgaria 14 49 144 123 123 378 978 3642 2198 2198 18Croafia 183 384 383 444 427 16972 117570 124513 150437 111021 260Czech Rep 289 426 436 514 479 10465 16858 16722 15991 14555 30
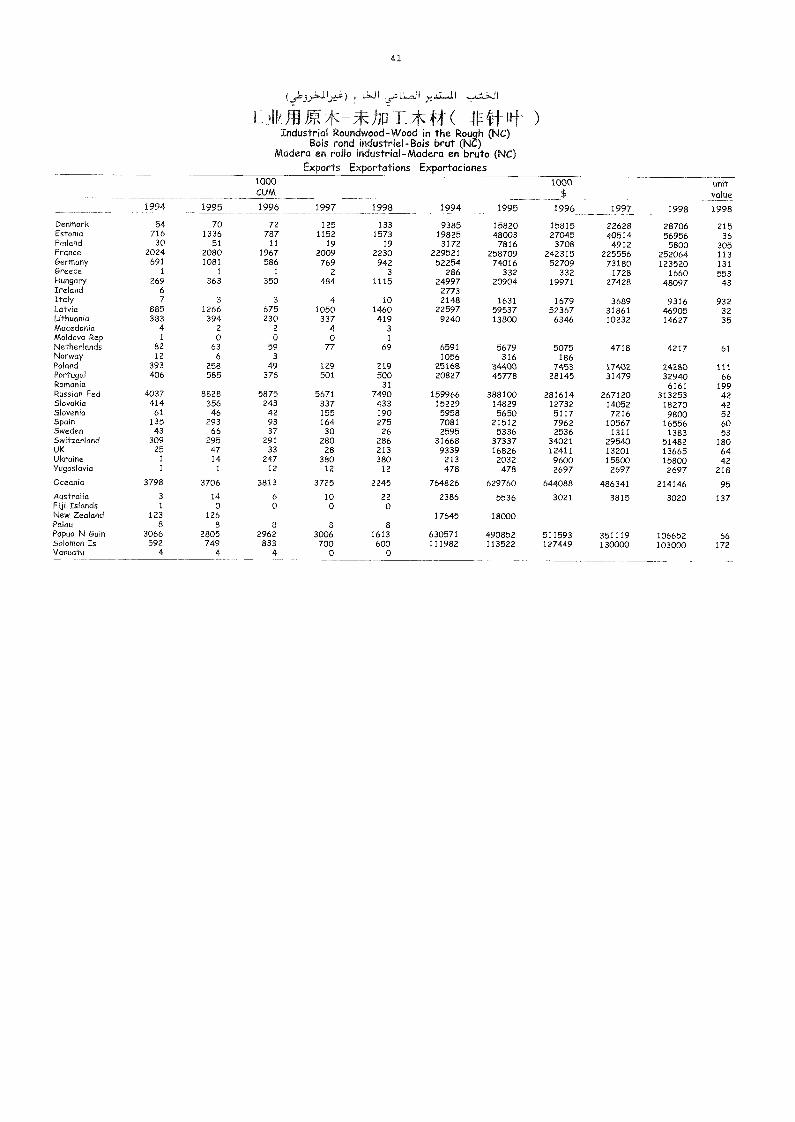
4 1
rLoJl Il
TAffiE*---* nir*f-t(Industrial Roundwood-Wood in the Rough (NC)
Bois rond industriel-Bois brut (NC)Madera en rollo industrial-Madera en bruto (NC)
Exports Exportations Exportaciones
1994 1995
1000CUM
1996 1997 1998 1994 1995
1000$
1996 1997 1998
unitvalue
1998
Denmark 54 70 72 125 133 9385 15820 15815 22628 28706 215Estonia 716 1336 787 1152 1573 19825 48003 27045 40514 56956 36Finland 30 51 II 19 19 3172 7816 3708 4912 5800 305France 2024 2080 1967 2009 2230 229521 258709 242315 225556 252064 113Germany 691 1081 586 769 942 52254 74016 52709 73180 123520 131Greece 1 1 I 2 3 286 332 332 1728 1660 553Hungary 269 363 350 484 1115 24997 20904 19971 27428 48097 43Ireland 6 2773Italy 7 3 3 4 10 2148 1631 1679 3689 9316 932Latvia 885 1266 675 1050 1460 22597 59537 52367 31861 46905 32Lithuania 383 394 230 337 419 9240 13800 6346 10232 14627 35Macedonia 4 2 2 4 3Moldova Rep 1 0 0 0 1
Netherlands 82 63 59 77 69 6591 5679 5075 4718 4217 61Norway 12 6 3 1056 316 186Poland 393 258 49 129 219 25168 34400 7453 17402 24280 111Portugal 406 585 376 501 500 20827 45778 28145 31479 32940 66Romania 31 6161 199Russian Fed 4037 8828 5875 5671 7490 159966 388100 281614 267120 313253 42Slovakia 414 356 243 337 433 15229 14829 12732 14052 18270 42Slovenia 61 46 42 155 190 5958 5650 5117 7216 9800 52Spain 135 293 93 164 275 7081 21512 7962 10567 16556 60Sweden 43 66 37 30 26 2595 5336 2536 1311 1383 53Switzerland 309 295 291 280 286 31668 37337 34021 29540 51482 180UK 25 47 33 28 213 9339 16826 12411 13201 13665 64Ukraine 1 14 247 380 380 213 2032 9600 15800 15800 42Yugoslavia 1 1 12 12 12 478 478 2697 2697 2697 218
Oceania 3798 3706 3813 3725 2245 764826 629760 644088 486341 214146 95
Australia 3 14 6 10 22 2386 5536 3021 3815 3020 137Fiji Islands 1 0 0 0 0New Zealand 123 126 17645 18000Palau 8 8 8 8 8Papua N Guin 3066 2805 2962 3006 1613 630571 490852 511593 351119 106652 66Solomon Is 592 749 833 700 600 111982 113522 127449 130000 103000 172Vanuatu 4 4 4 0 0
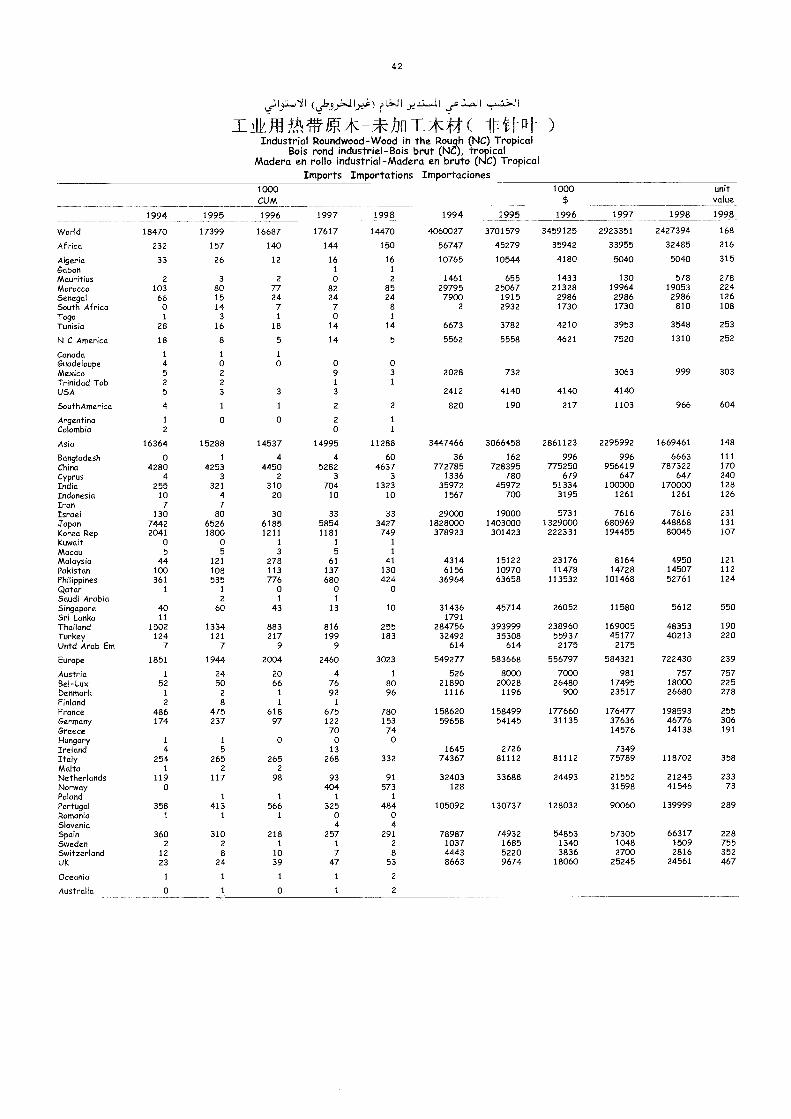
42
,tI
TAIVAIC*-*hul.*44( )Industrial Roundwood-Wood in the Rough (NC) Tropical
Bois rond industriel-Bois brut (NC), tropicalMadera en rollo industrial-Madera en bruto (NC) Tropical
Imports Importations Importaciones
1994 1995
1000CUM
1000$
unitvalue
19981996 1997 1998 1994 1995 1996 1997 1998
World 18470 17399 16687 17617 14470 4060027 3701579 3459125 2923351 2427394 168
Africa 232 157 140 144 150 56747 45279 35942 33955 32485 216
Algeria 33 26 12 16 16 10765 10544 4180 5040 5040 315Gabon 1 1
Mauritius 2 3 2 0 2 1461 655 1433 130 578 278Morocco 103 80 77 82 85 29795 25067 21328 19964 19053 224Senegal 66 15 24 24 24 7900 1915 2986 2986 2986 126South Africa 0 14 7 7 8 2 2932 1730 1730 810 108Togo 1 3 1 0 1
Tunisia 28 16 18 14 14 6673 3782 4210 3953 35-48 253
N C America 18 8 5 14 5 5562 5558 4621 7520 1310 252
Canada I 1 1
Guadeloupe 4 0 o o 0Mexico 5 2 9 3 2028 732 3063 999 303Trinidad Tob 2 2 1 1
USA 5 3 3 3 2412 4140 4140 4140
SouthAmerica 4 1 1 2 2 820 190 217 1103 966 604
Argentina 1 o 0 2 1
Colombia 2 o 1
Asia 16364 15288 14537 14995 11288 3447466 3066458 2861123 2295992 1669461 148
Bangladesh o 1 4 4 60 36 162 996 996 6663 111
China 4280 4253 4450 5282 4637 772785 728395 775250 956419 787322 170Cyprus 4 3 2 3 3 1336 780 679 647 647 240India 255 321 310 704 1323 35972 45972 51334 100000 170000 128Indonesia 10 4 20 10 10 1567 700 3195 1261 1261 126Iran 7 7Israel 130 80 30 33 33 29000 19000 5731 7616 7616 231
japan 7442 6526 6185 5854 3427 1828000 1403000 1329000 680969 448868 131
Korea Rep 2041 1800 1211 1181 749 378923 301423 222331 194455 80045 107Kuwait o o 1 1 1
Macau 5 5 3 5 1
Malaysia 44 121 278 61 41 4314 15122 23176 8164 4950 121
Pakistan 100 108 113 137 130 6156 10970 11478 14728 14507 112Philippines 361 535 776 680 424 36964 63658 113532 101468 52761 124Qatar 1 1 o o 0Saudi Arabia 2 I 1
Singapore 40 60 43 13 10 31436 45714 26052 11580 5612 550Sri Lanka 11 1791Thailand 1502 1334 883 816 255 284756 393999 238960 169005 48353 190Turkey 124 121 217 199 183 32492 35308 55937 45177 40213 220Untd Arab Em 7 7 9 9 614 614 2175 2175
Europe 1851 1944 2004 2460 3023 549277 583668 556797 584321 722430 239
Austria 1 24 20 4 1 526 8000 7000 981 757 757Bel -Lux 52 50 66 76 80 21890 20028 26480 17495 18000 225Denmark 1 2 1 92 96 1116 1196 900 23517 26680 278Finland 2 8 1 1
France 486 475 618 675 780 158620 158499 177660 176477 198593 255Germany 174 237 97 122 153 59658 54145 31135 37636 46776 306Greece 70 74 14576 14138 191
Hungary 1 1 o o 0Ireland 4 5 13 1645 2726 7349Italy 254 265 265 268 332 74367 81112 81112 75789 118702 358Malta 1 2 2
Netherlands 119 117 98 93 91 32403 33688 24493 21552 21245 233Norway o 404 573 128 31598 41546 73Poland 1 1 1 1
Portugal 358 413 566 325 484 105092 130737 128032 90060 139999 289Romania 1 1 1 o oSlovenia 4 4Spain 360 310 218 257 291 78987 74932 54853 57305 66317 228Sweden 2 2 1 1 2 1037 1685 1340 1048 1509 755Switzerland 12 8 10 7 8 4443 5220 3836 2700 2816 352UK 23 24 39 47 53 8663 9674 18060 25245 24561 467
Oceania 1 1 1 1 2
Australia o i 0 1 2
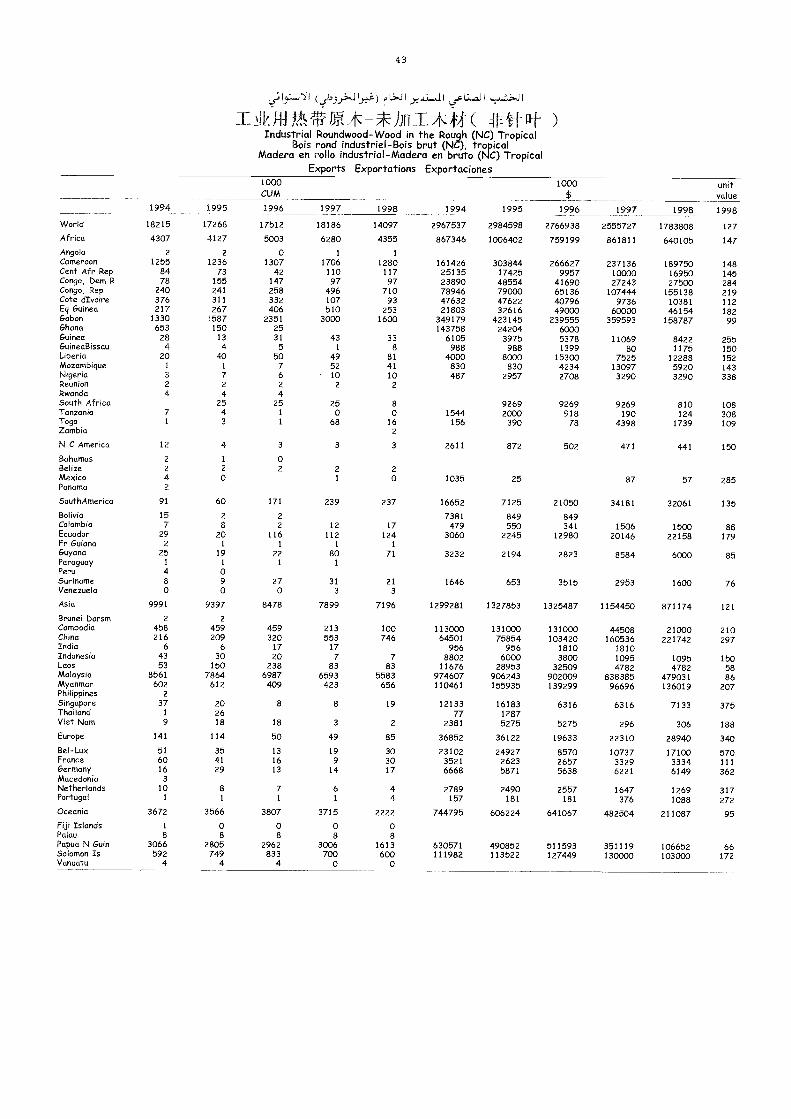
43
I (Çb L11 '2 I a..c.LJI
I YA*P. A ix] T /HA( i4t )Industrial Roundwood-Wood in the Rough (NC) Tropical
Bois rond industriel-Bois brut (NC), tropicalMadera en rollo industrial-Madera en bruto (NC) Tropical
Exports Exportations Exportaciones
1994
1000CUM
1000$
1996 1997 1998
unitvalue
19981995 1996 1997 1998 1994 1995
World 18215 17268 17512 18186 14097 2967537 2984598 2766938 2555727 1783808 127Africa 4307 4127 5003 6280 4355 867346 1006402 759199 861811 640105 147
Angola 2 2 0 1 1
Cameroon 1255 1236 1307 1706 1280 161426 303844 266627 237136 189750 148Cent Afr Rep 84 73 42 110 117 25135 17425 9957 10000 16950 145Congo, Dem R 78 155 147 97 97 23890 48554 41690 27243 27500 284Congo, Rep 240 241 258 496 710 78946 79000 65136 107444 155138 219Cote dIvoMe 376 311 332 107 93 47632 47622 40796 9736 10381 112Eq Guinea 217 267 406 510 253 21803 32616 49000 60000 46154 182Gabon 1330 1587 2351 3000 1600 349179 423145 239555 359593 158787 99Ghana 653 150 25 143758 24204 6000Guinea 28 13 31 43 33 6105 3975 5378 11069 8422 255GuMeaBissau 4 4 5 1 8 988 988 1399 80 1175 150Liberia 20 40 50 49 81 4000 8000 15300 7525 12288 152Mozambique 1 1 7 52 41 830 830 4234 13097 5920 143Nigeria 3 7 6 10 10 487 2957 2708 3290 3290 338Reunion 2 2 2 2 2Rwanda 4 4 4South Africa 25 25 25 8 9269 9269 9269 810 108Tanzania 7 4 1 0 0 1544 2000 918 190 124 308Toga 1 3 1 68 16 156 390 78 4398 1739 109Zambia 2
N CAmerMa 12 4 3 3 3 2611 872 502 471 441 150Bahamas 2 1 0Belize 2 2 2 2 2MexMo 4 0 1 0 1035 25 87 57 285Panama 2
SouthAuverMa 91 60 171 239 237 16652 7125 21050 34181 32061 135Bolivia 15 2 2 7381 849 849Colombia 7 8 2 12 17 479 550 341 1506 1500 88Ecuador 29 20 116 112 124 3060 2245 12980 20146 22158 179Fr GuMma 2 1 1 1 1
Guyana 25 19 22 80 71 3232 2194 2823 8584 6000 85Paraguay 1 1 1 1
Peru 4 0Suriname 8 9 27 31 21 1646 653 3515 2953 1600 76Venezuela 0 0 0 3 3
Asia 9991 9397 8478 7899 7196 1299281 1327853 1325487 1154450 871174 121
Brunei Darsm 2 2
Cambo&a 458 459 459 213 100 113000 131000 131000 44508 21000 210China 216 209 320 553 746 64501 75854 103420 160536 221742 297Inda 6 6 17 17 956 956 1810 1810Indonesia 43 30 20 7 7 8802 6000 3800 1095 1095 150Laos 53 150 238 83 83 11676 28953 32509 4782 4782 58Malaysia 8561 7864 6987 6593 5583 974607 906243 902009 838385 479031 86Myanmar 602 612 409 423 656 110461 155935 139299 96696 136019 207PhilippMes 2
Sirgapore 37 20 8 8 19 12133 16183 6316 6316 7133 375Thafland 1 26 77 1287Viet Nam 9 18 18 3 2 2381 5275 5275 296 306 188Europe 141 114 50 49 85 36852 36122 19633 22310 28940 340Bel-Lux 51 35 13 19 30 23102 24927 8570 10737 17100 570France 60 41 16 9 30 3521 2623 2657 3329 3334 111Germany 16 29 13 14 17 6668 5871 5638 6221 6149 362Macedonia 3
Netherlands 10 8 7 6 4 2789 2490 2557 1647 1269 317Portugal 1 1 1 1 4 157 181 181 376 1088 272CkeaMa 3672 3566 3807 3715 2222 744795 606224 641067 482504 211087 95Fiji Islands 1 0 0 0 0PaMu 8 8 8 8 8Papua N Gain 3066 2805 2962 3006 1613 630571 490852 511593 351119 106652 66SoMmon Is 592 749 833 700 600 111982 113522 127449 130000 103000 172Vanuatu 4 4 4 0 0
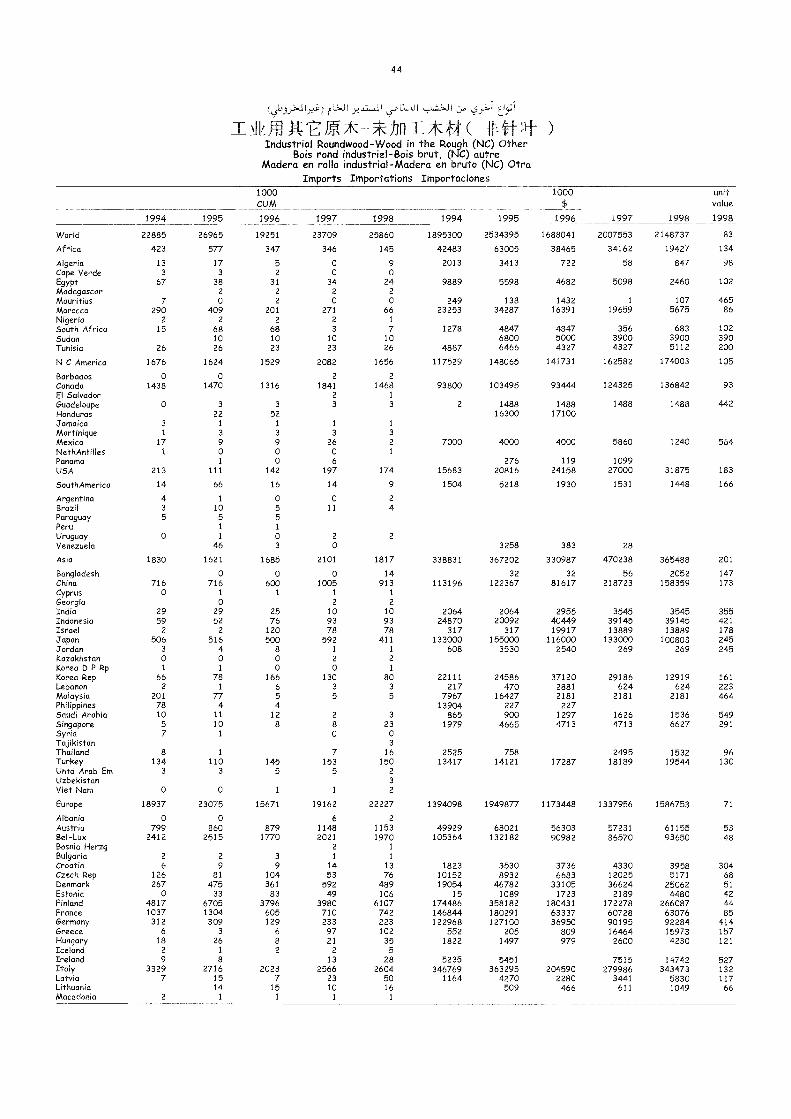
44
(ab.9"41 LL.J I ,5_7"....1 L1,1)
I Ill/AWE/P.* *in TAct4( _11-4Industrial Roundwood-Wood in the Rough (NC) Other
Bois rond industriel-Bois brut, (NC) autreMadera en rollo industrial-Madera en bruto (NC) Otra
Imports Importations Importaciones
1994 1995
1000CUM
1996 1994 1995
1000$
1996 1997 1998
unitvalue
19981997 1998
World 22885 26965 19251 23709 25860 1895300 2534395 1688041 2007553 2148737 83
Africa 423 577 347 346 145 42483 63005 38465 34162 19427 134
Algeria 13 17 5 0 9 2013 3413 722 58 847 98Cape Verde 3 3 2 0 0Egypt 67 38 31 34 24 9889 5598 4682 5098 2460 102Madagascar 2 2 2 2
Mauritius 7 0 2 0 0 249 138 1432 1 107 465Morocco 290 409 201 271 66 23253 34287 16391 19659 5675 86Nigeria 2 2 2 2 1
South Africa 15 68 68 3 7 1278 4847 4847 356 683 102Sudan 10 10 10 10 6800 5000 3900 3900 390Tunisia 26 26 23 23 26 4887 6466 4327 4327 5112 200
N C America 1676 1624 1529 2082 1656 117529 148065 141731 162582 174003 105
Barbados 0 0 2 2
Canada 1438 1470 1316 1841 1468 93800 103495 93444 124325 136842 93El Salvador 2 1
Guadeloupe 0 3 3 3 3 2 1488 1488 1488 1488 442Honduras 22 52 16300 17100Jamaica 3 1 1 1 1
Martinique 1 3 3 3 3
Mexico 17 9 9 26 2 7000 4000 4000 5860 1240 564NethAntilles 1 0 0 0 1
Panama 1 0 6 276 119 1099USA 213 111 142 197 174 15683 20816 24158 27000 31875 183
SouthAmerica 14 66 16 14 9 1504 5218 1930 1531 1448 166
Argentina 4 1 0 0 2
Brazil 3 10 5 11 4Paraguay 5 5 5Peru 1 1
Uruguay 0 1 0 2 2
Venezuela 46 3 0 3258 383 28
Asia 1830 1621 1685 2101 1817 338831 367202 330987 470238 365488 201
Bangladesh 0 0 0 14 32 32 56 2052 147China 716 716 600 1005 913 113196 122367 81617 218723 158359 173Cyprus 0 1 1 1 1
Georgia 0 2 2
India 29 29 25 10 10 2064 2064 2955 3545 3545 355Indonesia 59 52 76 93 93 24870 20092 40449 39145 39145 421Israel 2 2 120 78 78 317 317 19917 13889 13889 178Japan 506 516 500 592 411 133000 155000 116000 133000 100803 245Jordan 3 4 8 1 1 608 3530 2540 269 269 245Kazakhstan 0 0 0 2 2
Korea D P Rp 1 1 0 0 1
Korea Rep 66 78 166 130 80 22111 24586 37120 29186 12919 161Lebanon 2 1 6 3 3 217 470 2881 624 624 223Malaysia 201 77 5 5 5 7967 16427 2181 2181 2181 464Philippines 78 4 4 13904 227 227Saudi Arabia 10 11 12 2 3 865 900 1297 1626 1536 549Singapore 5 10 8 8 23 1979 4665 4713 4713 6627 291Syria 7 1 0 0Tajikistan 3Thailand 8 1 7 16 2525 758 2495 1532 96Turkey 134 110 145 153 150 13417 14121 17287 18189 19544 130Untd Arab Em 3 3 5 5 2
Uzbekistan 3
Viet Nam 0 0 1 1 2
Europe 18937 23075 15671 19162 22227 1394098 1949877 1173448 1337956 1586753 71
Albania 0 0 6 2Austria 799 860 879 1148 1153 49929 68021 56303 57231 61155 53Bel-Lux 2412 2515 1770 2021 1970 105364 132182 90982 86570 93650 48Bosnia Herzg 2 1
Bulgaria 2 2 3 1 1
Croatia 6 9 9 14 13 1823 3530 3736 4330 3958 304Czech Rep 126 81 104 53 76 10152 8932 6683 12025 5171 68Denmark 267 475 361 592 489 19054 46782 33105 36624 25062 51Estonia 0 33 83 49 106 15 1089 1723 2189 4480 42Finland 4817 6705 3796 3980 6107 174486 358182 180431 172278 266087 44France 1037 1304 605 710 742 146844 180291 63337 60728 63076 85Germany 312 309 129 233 223 122968 127100 36950 90195 92284 414Greece 6 3 6 97 102 552 205 809 16464 15973 157Hungary 18 26 8 21 35 1822 1497 979 2600 4230 121Iceland 2 1 2 2 5Ireland 9 8 13 28 5235 5451 7515 14742 527Italy 3329 2716 2023 2566 2604 346769 363295 204590 279986 343473 132Latvia 7 15 7 23 50 1164 4270 2280 3441 5830 117Lithuania 14 15 10 16 509 466 611 1049 66Macedonia 2 1 1 1 1
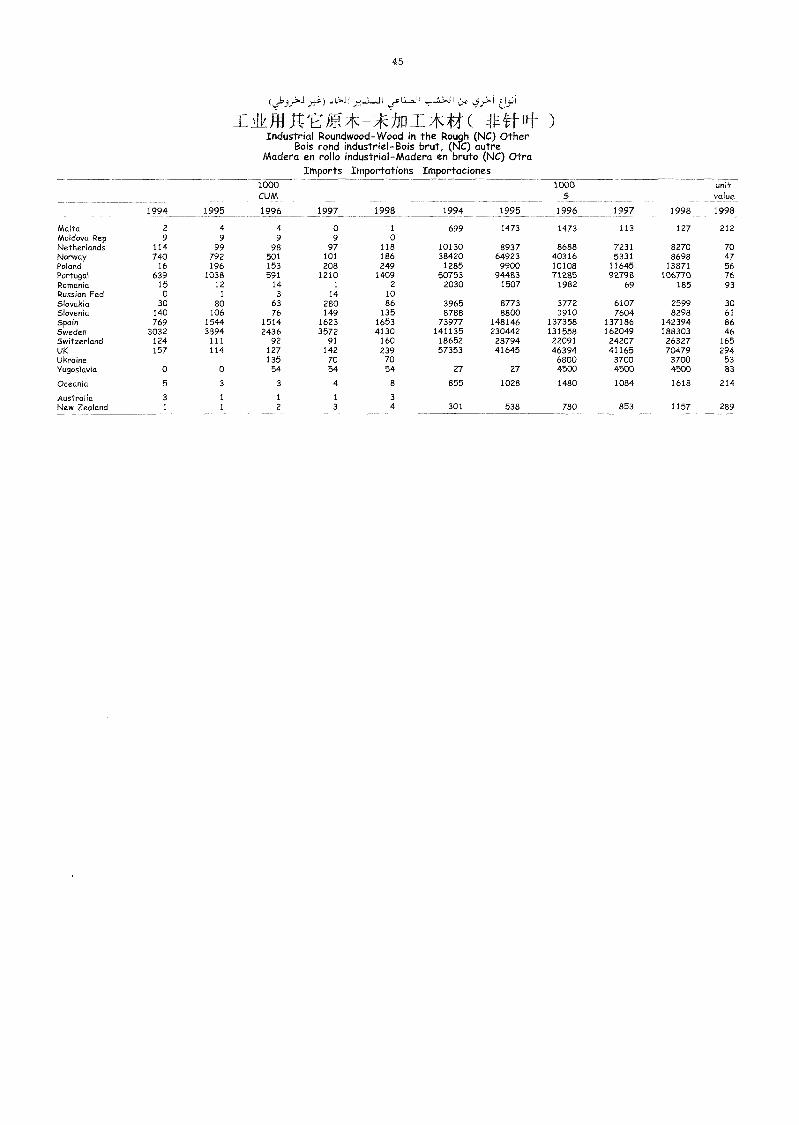
95
*hill_3104( 1t)Industrial Roundwood-Wood in the Rough (NC) Other
Bois rond industriel-Bois brut, (NC) autreMadera en rollo industrial-Madera en bruto (NC) Otra
Imports Importations Importaciones1000CUM
1000 unitvalue
1994 1995 1996 1997 1998 1994 1995 1996 1997 1998 1998
Malta 2 4 4 0 1 699 1473 1473 113 127 212Moldova Rep 9 9 9 9 0Netherlands 114 99 98 97 118 10130 8937 8688 7231 8270 70Norway 740 792 501 101 186 38420 64923 40316 5331 8698 47Poland 16 196 153 208 249 1285 9900 10108 11645 13871 56Portugal 639 1038 591 1210 1409 50753 94483 71285 92798 106770 76Romania 15 12 14 1 2 2030 1507 1982 69 185 93Russian Fed 0 1 3 14 10Slovakia 30 80 63 280 86 3965 8T73 3772 6107 2599 30Slovenia 140 106 76 149 135 8788 8800 3910 7604 8298 61
Spain 769 1544 1514 1623 1653 73977 148146 137358 137186 142394 86Sweden 3032 3894 2436 3572 4130 141135 230442 131558 162049 188303 46Switzerland 124 111 92 91 160 18652 28794 22091 24207 26327 165UK 157 114 127 142 239 57353 41645 46394 41165 70479 294Ukraine 135 70 70 6800 3700 3700 53Yugoslavia 0 0 54 54 54 27 27 4500 4500 4500 83
Oceania 5 3 3 4 8 855 1028 1480 1084 1618 214
Australia 3 1 1 1 3
New Zealand 1 1 2 3 4 301 538 780 853 1157 289
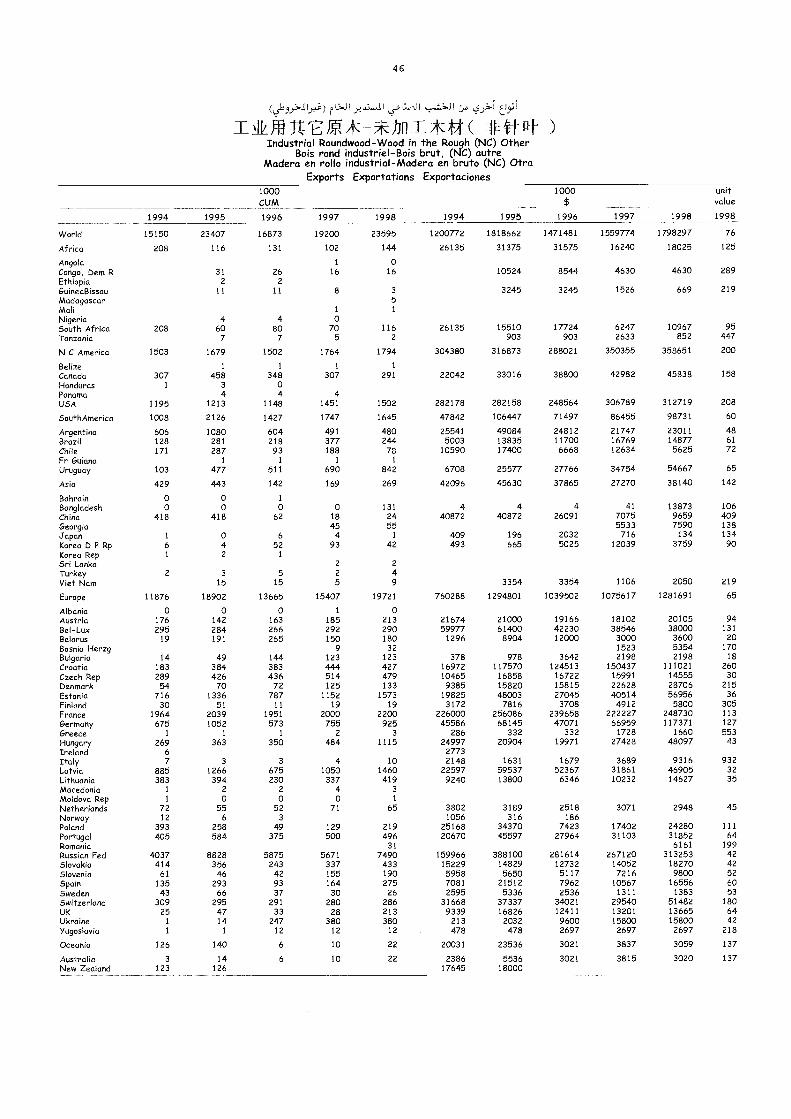
4 6
.72.LILII
I AkTiliVLEA-*hu -F*44( 1M1ftIndustrial Roundwood-Wood in the Rough (NC) Other
Bois rond industriel-Bois brut, (NC) mitreMadera en rollo industrial-Madera en bruto (NC) Otra
Exports Exportations Exportaciones1000CUM
1000$
unitvalue
19981994 1995 1996 1997 1998 1994 1995 1996 1997 1998
World 15150 23407 16873 19200 23595 1200772 1818662 1471481 1559774 1798297 76
Africa 208 116 131 102 144 26135 31375 31575 16240 18025 125
Angola 1 0Congo, Dem R 31 26 16 16 10524 8544 4630 4630 289
Ethiopia 2 2
GuineaBissau 11 11 8 3 3245 3245 1526 669 219Madagascar 5Mali 1 1
Nigeria 4 4 oSouth Africa 208 60 80 70 116 26135 15510 17724 6247 10967 95Tanzania 7 7 5 2 903 903 2633 852 447
N C America 1503 1679 1502 1764 1794 304380 316873 288021 350355 358651 200
Belize 1 1 1 1
Canada 307 458 348 307 291 22042 33016 38800 42982 45838 158
Honduras 1 3 0Panama 4 4 4USA 1195 1213 1148 1451 1502 282178 282158 248564 306789 312719 208
SouthAmerica 1008 2126 1427 1747 1645 47842 106447 71497 86455 98731 60
Argentina 606 1080 604 491 480 255-41 49084 24812 21747 23011 48Brazil 128 281 218 377 244 5003 13835 11700 16769 14877 61
Chile 171 287 93 188 78 10590 17400 6668 12634 5625 72
Fr Guiana 1 1 1 1
Uruguay 103 477 511 690 842 6708 25577 27766 34754 54667 65
Asia 429 443 142 169 269 42096 45630 37865 27270 38140 142
Bahrain 0 0 1
Bangladesh 0 0 0 o 131 4 4 4 41 13873 106China 418 418 62 18 24 40872 40872 26091 7075 9659 409Georgia 45 55 5533 7590 138Japan 1 0 6 4 1 409 196 2032 716 134 134Korea D P Rp 6 4 52 93 42 493 665 5025 12039 3759 90Korea Rep 1 2 ISri Lanka 2 2
Turkey 2 3 5 2 4Viet Nam 15 15 5 9 3354 3354 1106 2050 219
Europe 11876 18902 13665 15407 19721 760288 1294801 1039502 1075617 1281691 65
Albania 0 0 0 1 oAustria 176 142 163 185 213 21674 21000 19166 18102 20105 94Bel-Lux 295 284 266 292 290 59977 61400 42230 38546 38000 131
Belarus 19 191 265 150 180 1296 8904 12000 3000 3600 20Bosnia Herzg 9 32 1523 5354 170
Bulgaria 14 49 144 123 123 378 978 3642 2198 2198 18
Croatia 183 384 383 444 427 16972 117570 124513 150437 111021 260Czech Rep 289 426 436 514 479 10465 16858 16722 15991 14555 30Denmark 5-4 70 72 125 133 9385 15820 15815 22628 28706 215Estonia 716 1336 787 1152 1573 19825 48003 27045 40514 56956 36Finland 30 51 11 19 19 3172 7816 3708 4912 5800 305France 1964 2039 1951 2000 2200 226000 256086 239658 222227 248730 113Germany 675 1052 573 755 925 45586 68145 47071 66959 117371 127Greece 1 i 1 2 3 286 332 332 1728 1660 553Hungary 269 363 350 484 1115 24997 20904 19971 27428 48097 43Ireland 6 2773Italy 7 3 3 4 10 2148 1631 1679 3689 9316 932Latvia 885 1266 675 1050 1460 22597 59537 52367 31861 46905 32
Lithuania 383 394 230 337 419 9240 13800 6346 10232 14627 35Macedonia 1 2 2 4 3
Moldova Rep 1 0 0 0 1
Netherlands 72 55 52 71 65 3802 3189 2518 3071 2948 45Norway 12 6 3 1056 316 186Poland 393 258 49 129 219 25168 34370 7423 17402 24280 111
Portugal 405 584 375 500 496 20670 45597 27964 31103 31852 64Romania 31 6161 199Russian Fed 4037 8828 5875 5671 7490 159966 388100 281614 267120 313253 42Slovakia 414 356 243 337 433 15229 14829 12732 14052 18270 42Slovenia 61 46 42 155 190 5958 5650 5117 7216 9800 52Spain 135 293 93 164 275 7081 21512 7962 10567 16556 60Sweden 43 66 37 30 26 2595 5336 2536 1311 1383 53Switzerland 309 295 291 280 286 31668 37337 34021 29540 51482 180UK 25 47 33 28 213 9339 16826 12411 13201 13665 64Ukraine 1 14 247 380 380 213 2032 9600 15800 15800 42Yugoslavia 1 1 12 12 12 478 478 2697 2697 2697 218
Oceania 126 140 6 10 22 20031 23536 3021 3837 3059 137
Australia 3 14 6 10 22 2386 5536 3021 3815 3020 137New Zealand 123 126 17645 18000
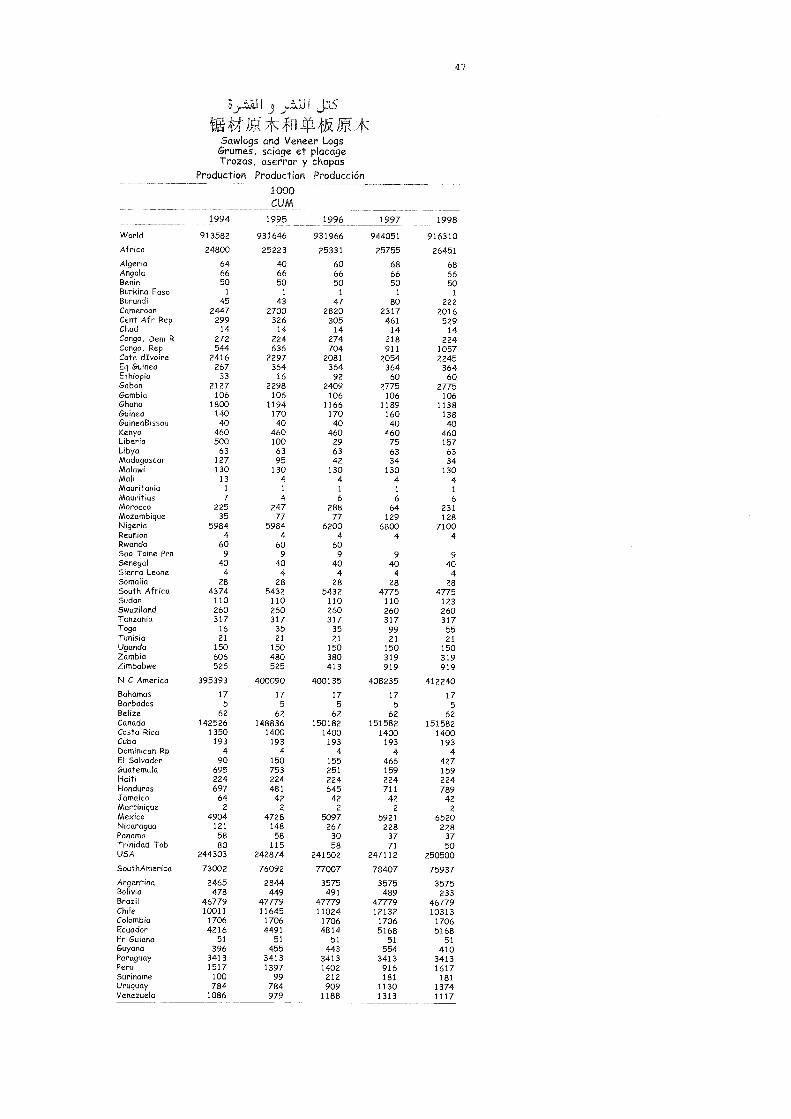
I JLIS
%-#1:9-,*4[1-0WC*Sawlogs and Veneer LogsGrumes, sciage et placageTrozas, aserrar y chapas
Production Production Producción1000CUM
47
1994 1995 1996 1997 1998
World 913582 931646 931966 944051 916310
Africa 24800 25223 25331 25755 26451
Algeria 64 40 60 68 68Angola 66 66 66 66 66Benin 50 50 50 50 50Burkina Faso 1 1 1 1 1
Burundi 45 43 47 80 222Cameroon 2447 2700 2820 2317 2016Cent Afr Rep 299 326 305 461 529Chad 14 14 14 14 14Congo, Dem R 272 224 274 218 224Congo, Rep 544 636 704 911 1057Cote dIvoire 2416 2297 2081 2054 2245Eq Guinea 267 364 364 364 364Ethiopia 33 16 92 60 60Gabon 2127 2298 2409 2775 2775Gambia 106 106 106 106 106Ghana 1800 1194 1166 1189 1138Guinea 140 170 170 160 138GuineaBissou 40 40 40 40 aoKenya 460 460 460 460 460Liberia 500 100 29 75 157Libya 63 63 63 63 63Madagascar 127 95 42 34 34Malawi 130 130 130 130 130Mali 13 4 4 4 4Mauritania 1 1 1 1 1
Mauritius 7 4 6 6 6Morocco 225 247 288 64 231Mozambique 35 77 77 129 128Nigeria 5984 5984 6200 6800 7100Reunion 4 4 4 4 4Rwanda 60 60 60Sao Tome Pm n 9 9 9 9 9Senegal 40 40 40 40 40Sierra Leone 4 4 4 4 4Somalia 28 28 28 28 28South Africa 4374 5432 5432 4775 4775Sudan 110 110 110 110 123Swaziland 260 260 260 260 260Tanzania 317 317 317 317 317Togo 16 35 35 99 55Tunisia 21 21 21 21 21Uganda 150 150 150 150 150Zambia 606 480 380 319 319Zimbabwe 525 525 413 919 919
N C America 395393 400090 400135 408235 412240Bahamas 17 17 17 17 17Barbados 5 5 5 5 5Belize 62 62 62 62 62Canada 142526 148836 150182 151582 151582Costa Rica 1350 1400 1400 1400 1400Cuba 193 193 193 193 193Dominican Rp 4 4 4 4 4El Salvador 90 150 155 466 427Guatemala 695 753 251 159 159Haiti 224 224 224 224 224Honduras 697 481 645 711 789Jamaica 64 42 42 42 42Martinique 2 2 2 2 2Mexico 4904 4728 5097 5921 6520Nicaragua 121 148 267 228 228Panama 58 58 30 37 37Trinidad Tob 80 115 58 71 50USA 244303 242874 241502 247112 250500
SouthAmerica 73002 76092 77007 78407 75937
Argentina 2465 2844 3575 3575 3575Bolivia 478 449 491 489 233Brazil 46779 411/9 47779 4/1/9 46779Chile 10011 11645 11024 12132 10313Colombia 1706 1706 1706 1706 1706Ecuador 4216 4491 4814 5168 5168Fr Guiana 51 51 51 51 51Guyana 396 455 443 554 410Paraguay 3413 3413 3413 3413 3413Peru 1517 1397 1402 916 1617Suriname 100 99 212 181 181Uruguay 784 784 909 1130 1374Venezuela 1086 979 1188 1313 1117
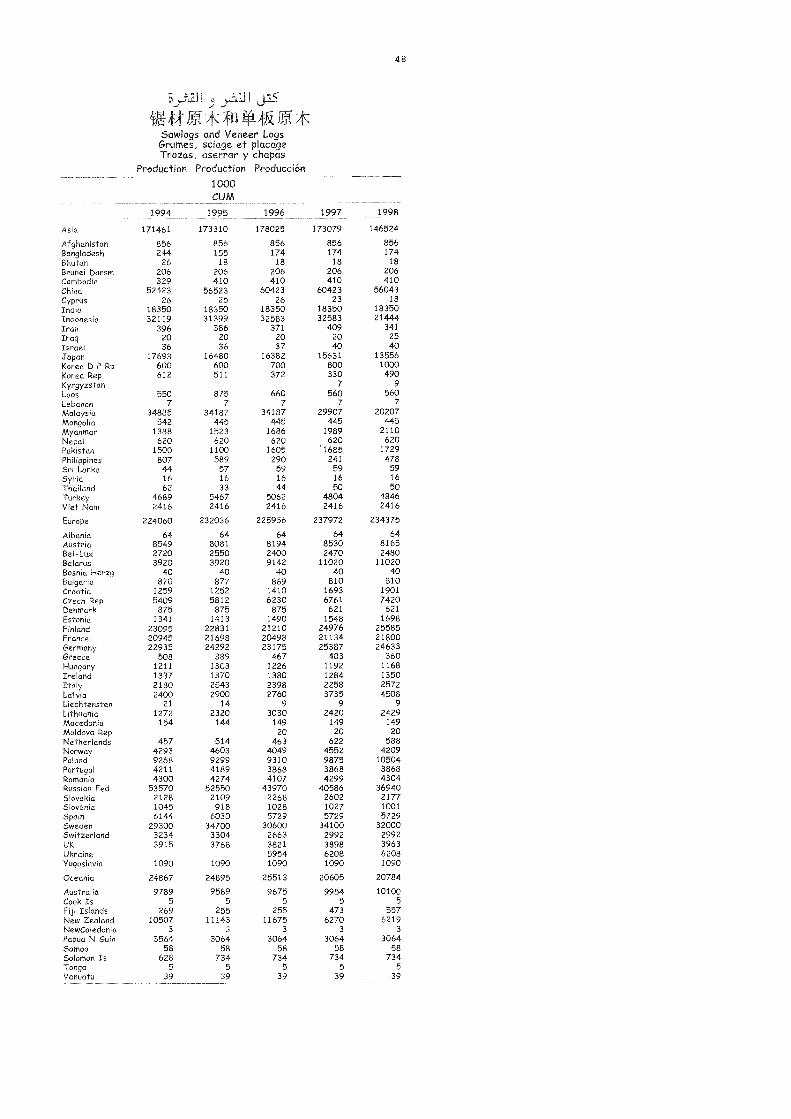
)_±,11 I JaS
nSawlogs and Veneer LogsGrurnes, sciage et placageTrozas, aserrar y chapas
Production Production Producción
1000CUM
48
1994 1995 1996 1997 1998
Asia 171461 173310 178025 173079 146524
Af ghanistan 856 856 856 856 856Bangladesh 244 155 174 174 174Bhutan 26 18 18 18 18Brunei Darsm 206 206 206 206 206Cambodia 329 410 410 410 410China 52423 56523 60423 60423 56043Cyprus 26 25 26 23 18
India 18350 18350 18350 18350 18350Indonesia 32119 31399 32583 32583 21444Iran 396 386 371 409 341
Iraq 20 20 20 20 25
Israel 36 36 37 40 40
Japan 17693 16480 16382 15631 13556Korea D P Rp 600 600 700 800 1000Korea Rep 612 511 372 330 490Kyrgyzstan 7 9
Laos 550 875 660 560 560Lebanon 7 7 7 7 7Malaysia 34885 34187 34187 29907 20207Mongolia 542 445 445 445 445Myanmar 1388 1523 1686 1989 2110Nepal 620 620 620 620 620Pakistan 1500 1100 1605 '1685 1729Philippines 807 589 290 241 478Sri Lanka 44 57 59 59 59Syria 16 16 16 16 16
Thailand 62 33 44 50 50Turkey 4689 5467 5062 4804 4846Viet Nam 2416 2416 2416 2416 2416
Europe 224060 232036 225956 237972 234375
Albania 64 64 64 64 64Austria 8549 8081 8194 8530 8165Bel-Lux 2720 2550 2400 2470 2480Belarus 3920 3920 9142 11020 11020Bosnia Herzg 40 40 40 ao 40Bulgaria 870 877 869 810 810Croatia 1259 1252 1410 1693 1901Czech Rep 5409 5812 6230 6761 7420Denmark 875 875 875 621 621Estonia 1341 1413 1490 1548 1698Finland 23095 22831 21210 24976 25585France 20945 21698 20498 21134 21800Germany 22935 24292 23175 25387 24633Greece 508 389 467 403 360Hungary 1211 1303 1226 1192 1168Ireland 1337 1370 1380 1284 1350Italy 2180 2543 2398 2258 2572Latvia 2400 2900 2760 3735 4508Liechtensten 21 14 9 9 9
Lithuania 1272 2320 3030 2420 2429Macedonia 154 144 149 149 149Moldova Rep 20 20 20Netherlands 457 514 463 622 588Norway 4293 4603 4049 4552 4209Poland 9268 9299 9310 9875 10504Portugal 4211 4189 3868 3868 3868Romania 4300 4274 4107 4299 4304Russian Fed 53570 52550 43970 40586 36940Slovakia 2128 2109 2268 2602 2177Slovenia 1045 918 1028 1027 1001Spain 6144 6030 5729 5729 5729Sweden 29300 34700 30600 34100 32000Switzerland 3234 3304 2663 2992 2992UK 3915 3768 3821 3898 3963Ukraine 5954 6208 6208Yugoslavia 1090 1090 1090 1090 1090
Oceania 24867 24895 25513 20605 20784
Australia 9789 9589 9675 9954 10100Cook Is 5 5 5 5 5Fiji Islands 269 255 255 473 557New Zealand 10507 11143 11675 6270 6219NewCaledonia 3 3 3 3 3
Papua N Guin 3564 3064 3064 3064 3064Samoa 58 58 58 58 58Solomon Is 628 734 734 734 734Tonga 5 5 5 5 5Vanuatu 39 39 39 39 39
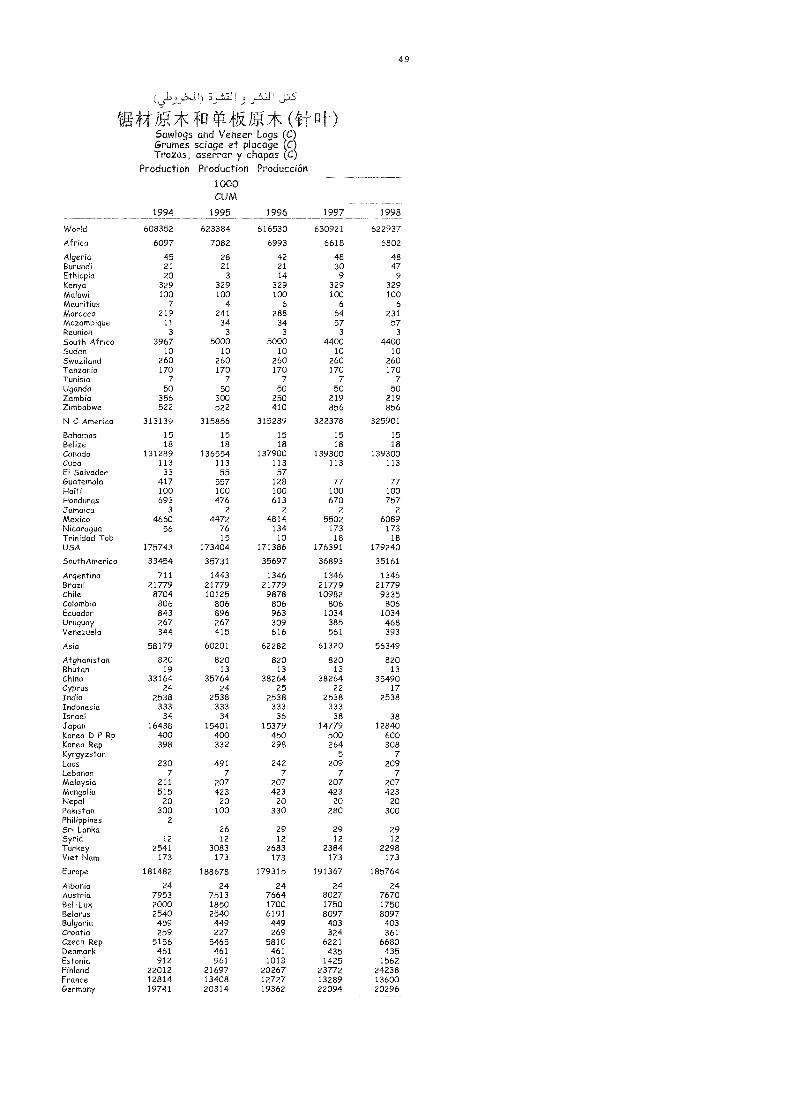
(J12.3)-'"H)uJc (I0* [1±-)Sawlogs and Veneer Logs (CGrumes sciage et placage (CTrozas, aserrar y chapas (C
Production Production Producción1000CUM
49
1994 1995 1996 1997 1998
World 608352 623384 616530 630921 622937
Africa 6097 7082 6993 6618 6802
Algeria 45 28 42 48 48Burundi 21 21 21 30 47Ethiopia 20 3 14 9 9Kenya 329 329 329 329 329Malawi 100 100 100 100 100Mauritius 7 4 6 6 6
Morocco 219 241 288 64 231Mozambique 11 34 34 57 57Reunion 3 3 3 3 3
South Africa 3967 5000 5000 4400 4400Sudan 10 10 10 10 10Swaziland 260 260 260 260 260Tanzania 170 170 170 170 170Tunisia 7 7 7 7 7Uganda 50 50 50 50 50Zambia 356 300 250 219 219Zimbabwe 522 522 410 856 856
N C America 313139 315856 315289 322378 325901
Bahamas 15 15 15 15 15Belize 18 18 18 18 18Canada 131289 136554 137900 139300 139300Cuba 113 113 113 113 113El Salvador 33 55 57Guatemala 417 557 128 77 77Haiti 100 100 100 100 100Honduras 693 476 613 670 757Jamaica 3 2 2 2 2
Mexico 4660 4472 4814 5502 6089Nicaragua 56 76 134 173 173Trinidad Tob 15 10 18 18USA 175743 173404 171386 176391 179240
SouthAmerica 33454 35731 35697 36893 35161
Argentina 711 1443 1346 1346 1346Brazil 21779 21779 21779 21779 21779Chile 8704 10125 9878 10982 9335Colombia 806 806 806 806 806Ecuador 843 896 963 1034 1034Uruguay 267 267 309 385 468Venezuela 344 415 616 561 393
Asia 58179 60201 62282 61320 56349
Afghanistan 820 820 820 820 820Bhutan 19 13 13 13 13China 33164 35764 38264 38264 35490Cyprus 24 24 25 22 17India 2538 2538 2538 2538 2538Indonesia 333 333 333 333Israel 34 34 36 38 38Japan 16438 15401 15379 14779 12840Korea D P Rp 400 400 450 500 600Korea Rep 398 332 298 264 308Kyrgyzstan 5 7Laos 230 491 242 209 209Lebanon 7 7 7 7 7Malaysia 211 207 207 207 207Mongolia 515 423 423 423 423Nepal 20 20 20 20 20Pakistan 300 100 330 280 300Philippines 2
Sri Lanka 26 29 29 29Syria 12 12 12 12 12Turkey 2541 3083 2683 2384 2298Viet Nam 173 173 173 173 173
Europe 181482 188678 179315 191367 185764
Albania 24 24 24 24 24Austria 7953 7513 7664 8027 7670Bel-Lux 2000 1850 1700 1750 1750Belarus 2540 2540 6191 8097 8097Bulgaria 459 449 449 403 403Croatia 259 227 269 324 361Czech Rep 5156 5465 5810 6221 6680Denmark 461 461 461 435 435Estonia 912 961 1013 1425 1562Finland 22012 21697 20267 23772 24238France 12814 13408 12727 13289 13600Germany 19741 20314 19362 22094 20296
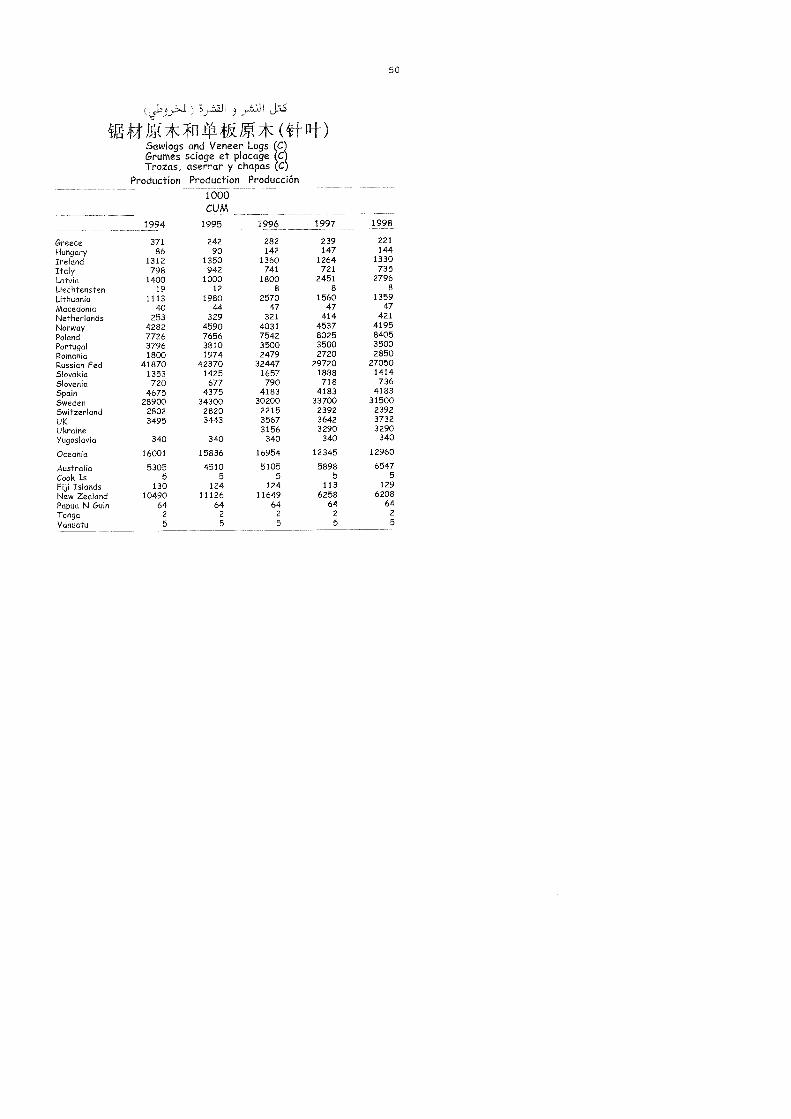
50
3.t.:J 1 j _'.,3.11 j:S
ig W# 7K- -171 IT1 fk f;q, * ( Wilt )Sawlogs and Veneer Logs CGrumes sciage et placageTrozas, aserrar y chapas
Production Production Producción1000CUM
1994 1995 1996 1997 1998
Greece 371 242 282 239 221
Hungary 86 90 142 147 144
Ireland 1312 1350 1360 1264 1330Italy 798 942 741 721 735Latvia 1400 1000 1800 2451 2796Liechtensten 19 12 8 8 8
Lithuania 1113 1980 2570 1560 1359Macedonia 40 44 47 47 47Netherlands 253 329 321 414 421
Norway 4282 4590 4031 4537 4195Poland 7726 7656 7542 8025 8405Portugal 3796 3810 3500 3500 3500Romania 1800 1974 2479 2720 2850Russian Fed 41870 42370 32447 29720 27050Slovakia 1353 1425 1657 1888 1414Slovenia 720 677 790 718 736Spain 4675 4375 4183 4183 4183Sweden 28900 34300 30200 33700 31500Switzerland 2802 2820 2215 2392 2392UK 3495 3443 3567 3642 3732Ukraine 3156 3290 3290Yugoslavia 340 340 340 340 340
Oceania 16001 15836 16954 12345 12960
Australia 5305 4510 5105 5898 6547Cook Is 5 5 5 5 5
Fiji Islands 130 124 124 113 129New Zealand 10490 11126 11649 6258 6208Papua N Guin 64 64 64 64 64Tonga 2 2 2 2 2
Vanuatu 5 5 5 5 5
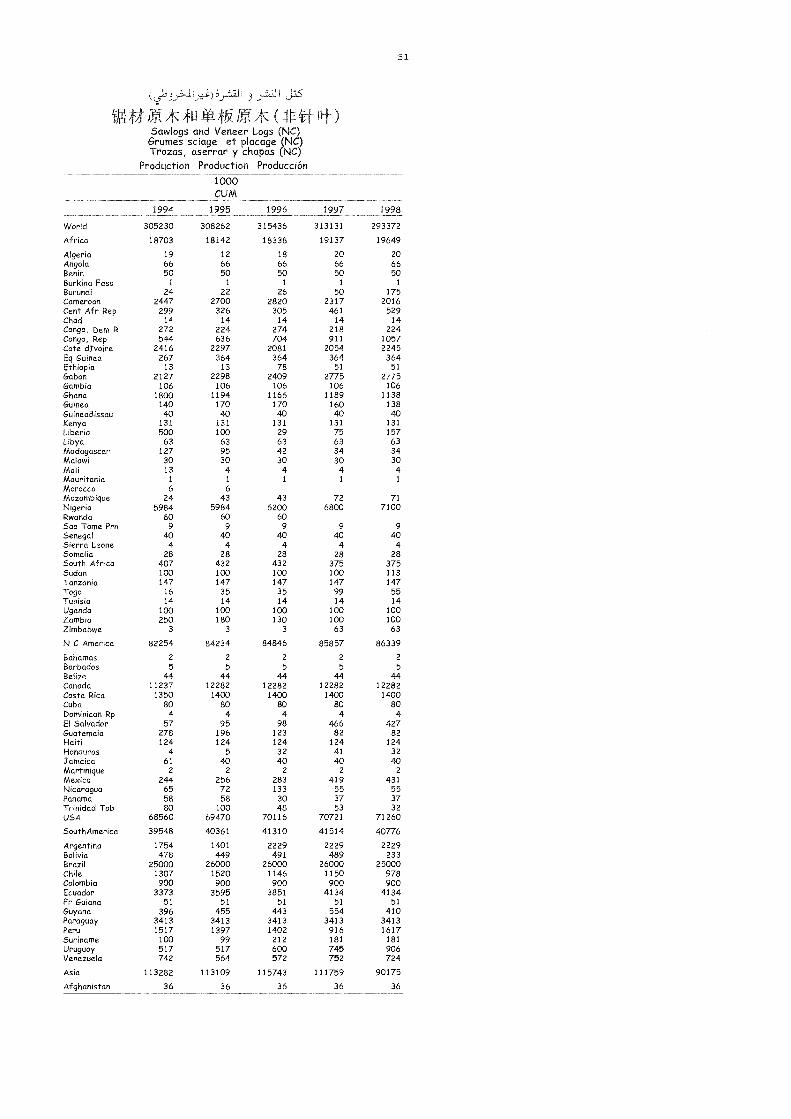
j jas
f)t )41 V-Sawlogs and Veneer Logs (NC)Grumes sciage et placage (NC)Trozas, aserrar y chapas (NC)
Production Production Producción1000CUM
51
1994 1995 1996 1997 1998
World 305230 308262 315436 313131 293372
Africa 18703 18142 18338 19137 19649
Algeria 19 12 18 20 20Angola 66 66 66 66 66Benin 50 50 50 50 50Burkina Faso 1 1 1 1 1
Burundi 24 22 26 50 175Cameroon 2447 2700 2820 2317 2016Cent Afr Rep 299 326 305 461 529Chad 14 14 14 14 14Congo, Dem R 272 224 274 218 224Congo, Rep 544 636 704 911 1057Cote dIvoire 2416 2297 2081 2054 2245Eq Guinea 267 364 364 364 364Ethiopia 13 13 78 51 51Gabon 2127 2298 2409 2775 2775Gambia 106 106 106 106 106Ghana 1800 1194 1166 1189 1138Guinea 140 170 170 160 138GuineaBissau 40 40 40 40 40Kenya 131 131 131 131 131Liberia 500 100 29 75 157Libya 63 63 63 63 63Madagascar 127 95 42 34 34Malawi 30 30 30 30 30Mali 13 4 4 4 4Mauritania 1 1 1 1 1
Morocco 6 6Mozambique 24 43 43 72 71Nigeria 5984 5984 6200 6800 7100Rwanda 60 60 60Sao Tome Pm n 9 9 9 9 9
Senegal 40 40 40 40 40Sierra Leone 4 4 4 4 4Somalia 28 28 28 28 28South Africa 407 432 432 375 375Sudan 100 100 100 100 113Tanzania 147 147 147 147 147Togo 16 35 35 99 55Tunisia 14 14 14 14 14Uganda 100 100 100 100 100Zambia 250 180 130 100 100Zimbabwe 3 3 3 63 63
N C America 82254 84234 84846 85857 86339
Bahamas 2 2 2 2 2
Barbados 5 5 5 5 5
Belize 44 44 44 44 44Canada 11237 12282 12282 12282 12282Costa Rica 1350 1400 1400 1400 1400Cuba 80 80 80 80 80Dominican Rp 4 4 4 4 4El Salvador 57 95 98 466 427Guatemala 278 196 123 82 82Haiti 124 124 124 124 124Honduras 4 5 32 41 32Jamaica 61 40 40 40 40Martinique 2 2 2 2 2
Mexico 244 256 283 419 431Nicaragua 65 72 133 55 55Panama 58 58 30 37 37Trinidad Tob 80 100 48 53 32USA 68560 69470 70116 70721 71260
SouthAmer ca 39548 40361 41310 41514 40776
Argentina 1754 1401 2229 2229 2229Bolivia 478 449 491 489 233Brazil 25000 26000 26000 26000 25000Chile 1307 1520 1146 1150 978Colombia 900 900 900 900 900Ecuador 3373 3595 3851 4134 4134Fr Guiana 51 51 51 51 51Guyana 396 455 443 554 410Paraguay 3413 3413 3413 3413 3413Peru 1517 1397 1402 916 1617Suriname 100 99 212 181 181Uruguay 517 517 600 745 906Venezuela 742 564 572 752 724
Asia 113282 113109 115743 111759 90175
Afghanistan 36 36 36 36 36
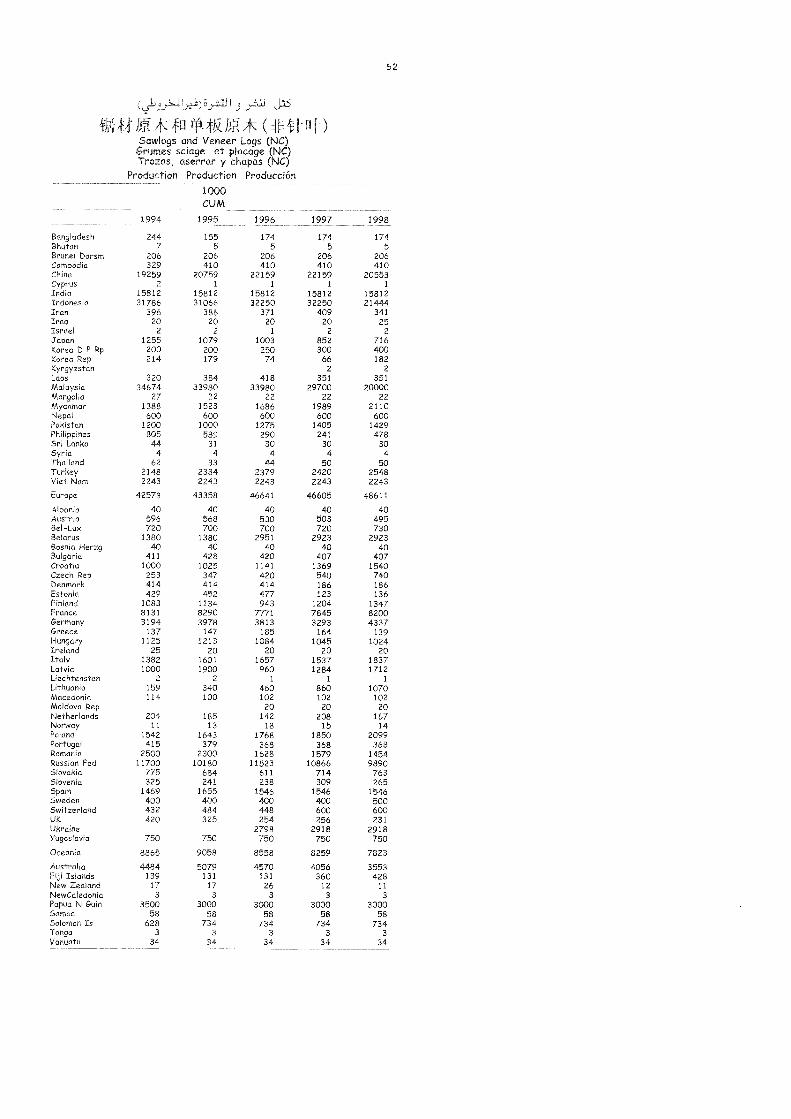
y2...111 j
JP-4k N.* ( F11--)Sawlogs and Veneer L.ogs (NC)
Grumes sciage et placage (NC)Trozas, aserrar y chapas (NC)
Production Production Producción
1000CUM
52
1994 1995 1996 1997 1998
Bangladesh 244 155 174 174 174Bhutan 7 5 5 5 5Brunei Darsm 206 206 206 206 206Cambodia 329 410 410 410 410China 19259 20759 22159 22159 20553Cyprus 2 1 1 1 1
India 15812 15812 15812 15812 15812Indonesia 31786 31066 32250 32250 21444Iran 396 386 371 409 341Iraq 20 20 20 20 25Israel 2 2 1 2 2
Japan 1255 1079 1003 852 716Korea D P Rp 200 200 250 300 400Korea Rep 214 179 74 66 182Kyrgyzstan 2 2
Laos 320 384 418 351 351Malaysia 34674 33980 33980 29700 20000Mongolia 27 22 22 22 22Myanmar 1388 1523 1686 1989 2110Nepal 600 600 600 600 600Pakistan 1200 1000 1275 1405 1429Philippines 805 589 290 241 478Sri Lanka 44 31 30 30 30Syria 4 4 4 4 4Thailand 62 33 44 50 50Turkey 2148 2384 2379 2420 2548Viet Nam 2243 2243 2243 2243 2243
Europe 42578 43358 46641 46605 48611
Albania 40 40 40 40 40Austria 596 568 530 503 495Bel-Lux 720 700 700 720 730Belarus 1380 1380 2951 2923 2923Bosnia Herzg 40 40 40 40 40Bulgaria 411 428 420 407 407Croatia 1000 1025 1141 1369 1540Czech Rep 253 347 420 540 740Denmark 414 414 414 186 186Estonia 429 452 477 123 136Finland 1083 1134 943 1204 1347France 8131 8290 7771 7845 8200Germany 3194 3978 3813 3293 4337Greece 137 147 185 164 139Hungary 1125 1213 1084 1045 1024Ireland 25 20 20 20 20Italy 1382 1601 1657 1537 1837Latvia 1000 1900 960 1284 1712Liechtensten 2 2 1 1 1
Lithuania 159 340 460 860 1070Macedonia 114 100 102 102 102Moldova Rep 20 20 20Netherlands 204 185 142 208 167Norway 11 13 18 15 14Poland 1542 1643 1768 1850 2099Portugal 415 379 368 368 368Romania 2500 2300 1628 1579 1454Russian Fed 11700 10180 11523 10866 9890Slovakia 775 684 611 714 763Slovenia 325 241 238 309 265Spain 1469 1655 1546 1546 1546Sweden 400 400 400 400 500Switzerland 432 484 4-48 600 600UK 420 325 254 256 231Ukraine 2798 2918 2918Yugoslavia 750 750 750 750 750
Oceania 8865 9058 8558 8259 7823
Australia 4484 5079 4570 4056 3553Fiji Islands 139 131 131 360 428New Zealand 17 17 26 12 11NewCaledonia 3 3 3 3 3
Papua N Guin 3500 3000 3000 3000 3000Samoa 58 58 58 58 58Solomon Is 628 734 734 734 734Tonga 3 3 3 3 3Vanuatu 34 34 34 34 34
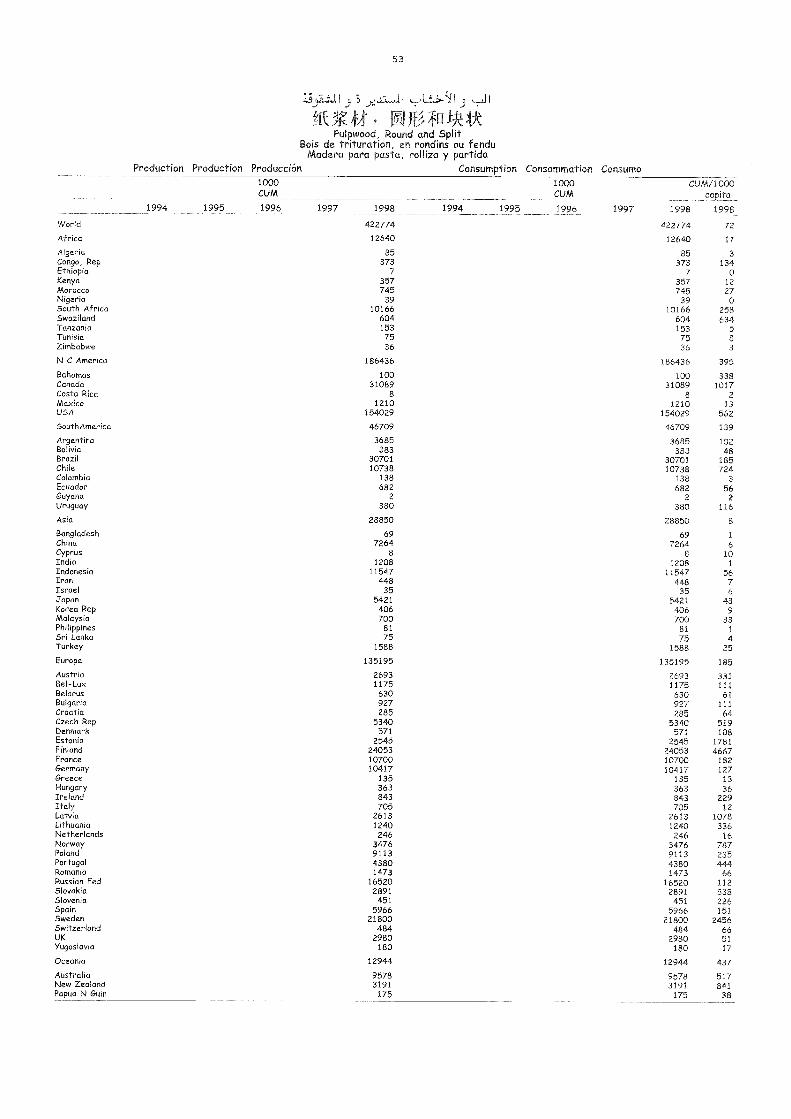
74.3)/..Ll
ffPulpwood, Round and Split
Bois de trituration, en rondins ou fenduMadera para pasta, rolliza y partida
53
Production Production Producción Consumption Consommation Consumo
World
Africa
AlgeriaCongo, RepEthiopiaKenyaMoroccoNigeriaSouth AfricaSwazilandTanzaniaTunisiaZimbabwe
N C America
BahamasCanadaCosta RicaMexicoUSA
SouthAmerica
ArgentinaBoliviaBrazilChileColombiaEcuadorGuyanaUruguay
Asia
BangladeshChinaCyprusIndiaIndonesiaIranIsraeljapanKorea RepMalaysiaPhilippinesSri LankaTurkey
Europe
AustriaBel-LuxBelarusBulgariaCroatiaCzech RepDenmarkEstoniaFinlandFranceGermanyGreeceHungaryIrelandItalyLatviaLithuaniaNetherlandsNorwayPolandPortugalRomaniaRussian FedSlovakiaSloveniaSpainSwedenSwitzerlandUKYugoslavia
Oceania
AustraliaNew ZealandPapua N Guin
1994 1995
1000CUM
1996 1997 1998
422774
12640
85373
7357745
3910166
6041537536
186436
10031089
8
1210154029
46709
3685383
3070110738
138682
2
380
28850
697264
81208
11547448
355421
4067008175
1588
135195
26931175
630927285
5340571
2545240531070010417
135363843705
26131240
2463476911343801473
165202891
4515966
21800484
2980180
12944
95783191
175
1994 1995
1000CUM
1996 1997
C
1998
422774
12640
85373
7357745
3910166
6041537536
186436
10031089
81210
154029
46709
3685383
3070110738
138682
2
380
28850
697264
8
120811547
44835
5421406700
8175
1588
135195
26931175630927285
5340571
2545240531070010417
135363843705
26131240
2463476911343801473
165202891451
596621800
4842980
180
12944
95783191
175
/1000capita
1998
72
17
3
134
1227
258634
58
3
395
3381017
2
13562
139
10248
185724
3
562
116
8
1
610
1
5676
439
331
425
185
331111
61111
64519108
17814667
182127
1336
22912
1078336
16787235444
66112538226151
2456665117
437
517841
38
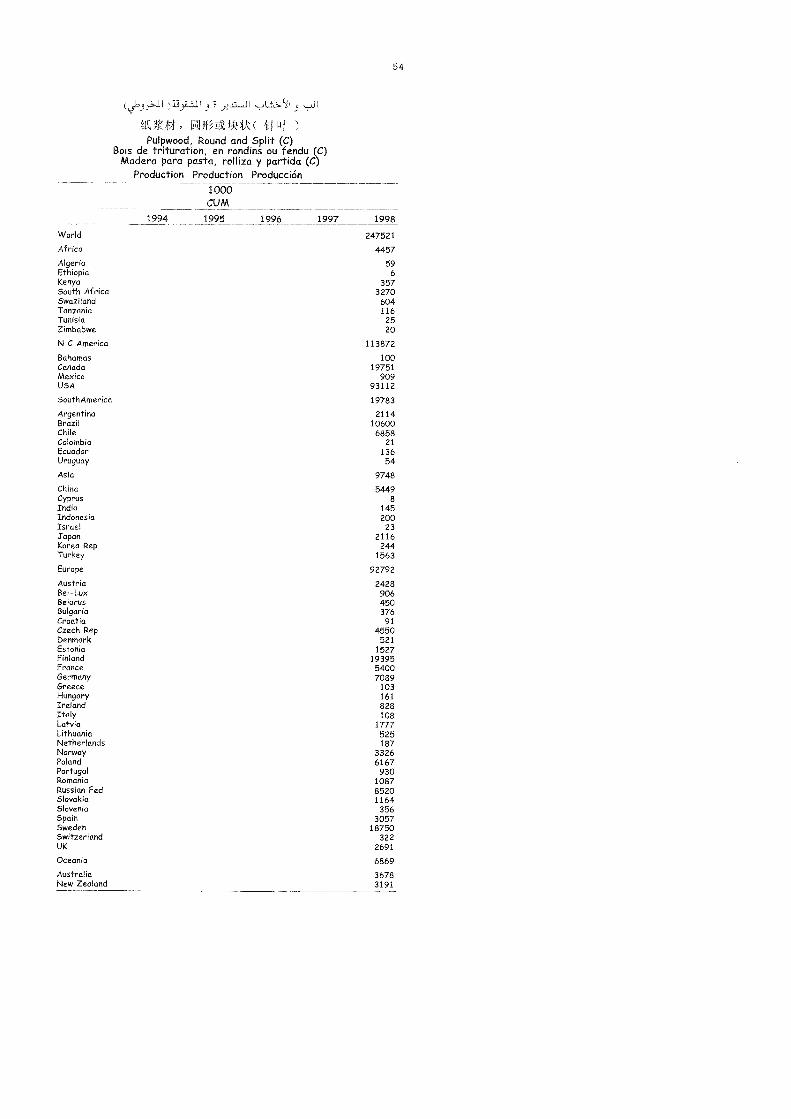
p1 ll U-7.311 pJi
VJtk dftI)Pulpwood, Round and Split (C)
Bois de trituration, en rondins ou fendu (CMadera para pasta, rolliza y partida (C)
Production Production Producción1000CUM
59
World
Africa
AlgeriaEthiopiaKenyaSouth AfricaSwazilandTanzaniaTunisiaZimbabwe
N C America
BahamasCanadaMexicoUSA
SouthAmerica
ArgentinaBrazilChileColombiaEcuadorUruguay
Asia
ChinaCyprusIndiaIndonesiaIsraelJapanKorea RepTurkey
Europe
AustriaBel-LuxBelarusBulgariaCroatiaCzech RepDenmarkEstoniaFinlandFranceGermanyGreeceHungaryIrelandItalyLatviaLithuaniaNetherlandsNorwayPolandPortugalRomaniaRussian FedSlovakiaSloveniaSpainSwedenSwitzerlandUK
Oceania
AustraliaNew Zealand
1994 1995 1996 1997 1998
247521
4457
596
3573270
6041162520
113872
10019751
90993112
19783
2114106006858
2113654
9748
54-498
145200
232116
2441563
92792
2428906450376
914550
5211527
1939554007089
103161828108
1///525187
33266167
930108785201164
3563057
18750322
2691
6869
36783191
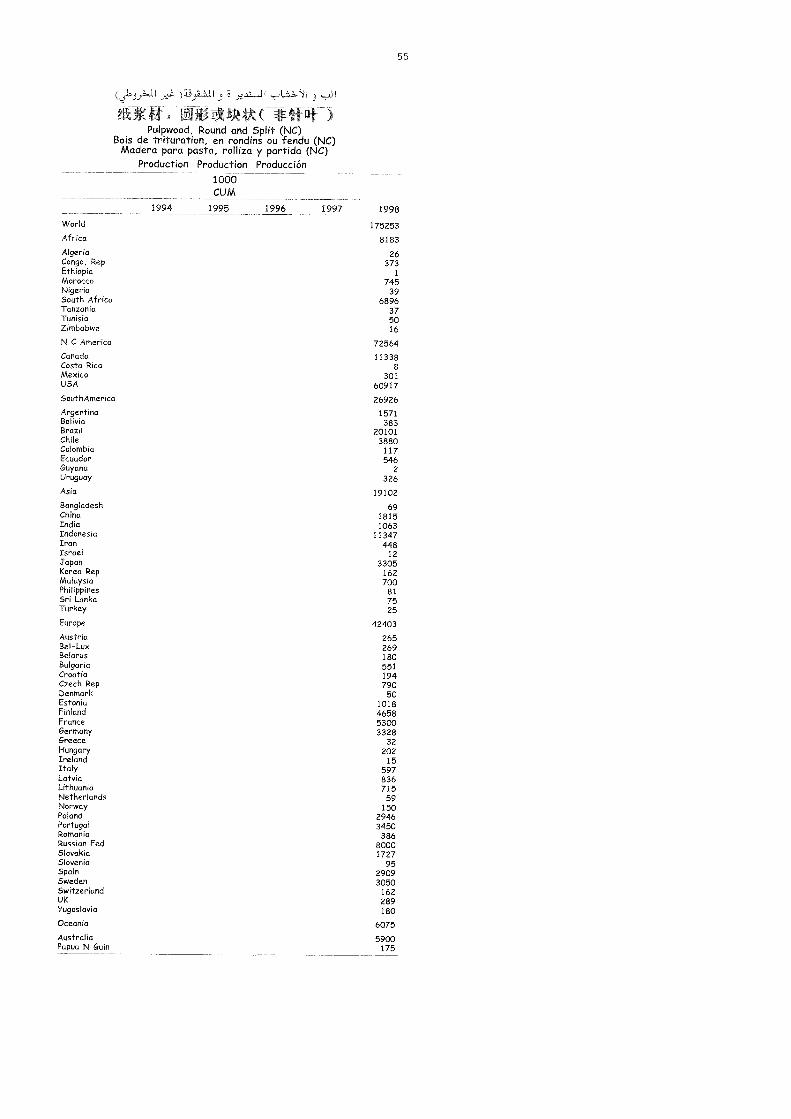
)113:1241 j ).2,1 .11
FI'11
Pulpwood, Round and Split (NC)Bois de trituration, en rondins ou fendu (NC)
Madera para pasta, rolliza y partida (NC)Production Production Producción
1000CUM
55
World
Africa
AlgeriaCongo, RepEthiopiaMoroccoNigeriaSouth AfricaTanzaniaTunisiaZimbabwe
N C America
CanadaCosta RicaMexicoUSA
SouthAmerica
ArgentinaBoliviaBrazilChileColombiaEcuadorGuyanaUruguay
Asia
BangladeshChinaIndiaIndonesiaIranIsraelJapanKorea RepMalaysiaPhilippinesSri LankaTurkey
Europe
AustriaBel-LuxBelarusBulgariaCroatiaCzech RepDenmarkEstoniaFinlandFranceGermanyGreeceHungaryIrelandItalyLatviaLithuaniaNetherlandsNorwayPolandPortugalRomaniaRussian FedSlovakiaSloveniaSpainSwedenSwitzerlandl/KYugoslavia
Oceania
AustraliaPapua N Guin
1994 1995 1996 1997 1998
175253
8183
26373
1
74539
6896375016
72564
113388
30160917
26926
1571383
201013880
117546
2326
19102
6918151063
11347448
123305
162700
817525
42403
265269180551194790
501018465853003328
32202
15597836715
59150
29463450
38680001727
9529093050
162289180
6075
5900175
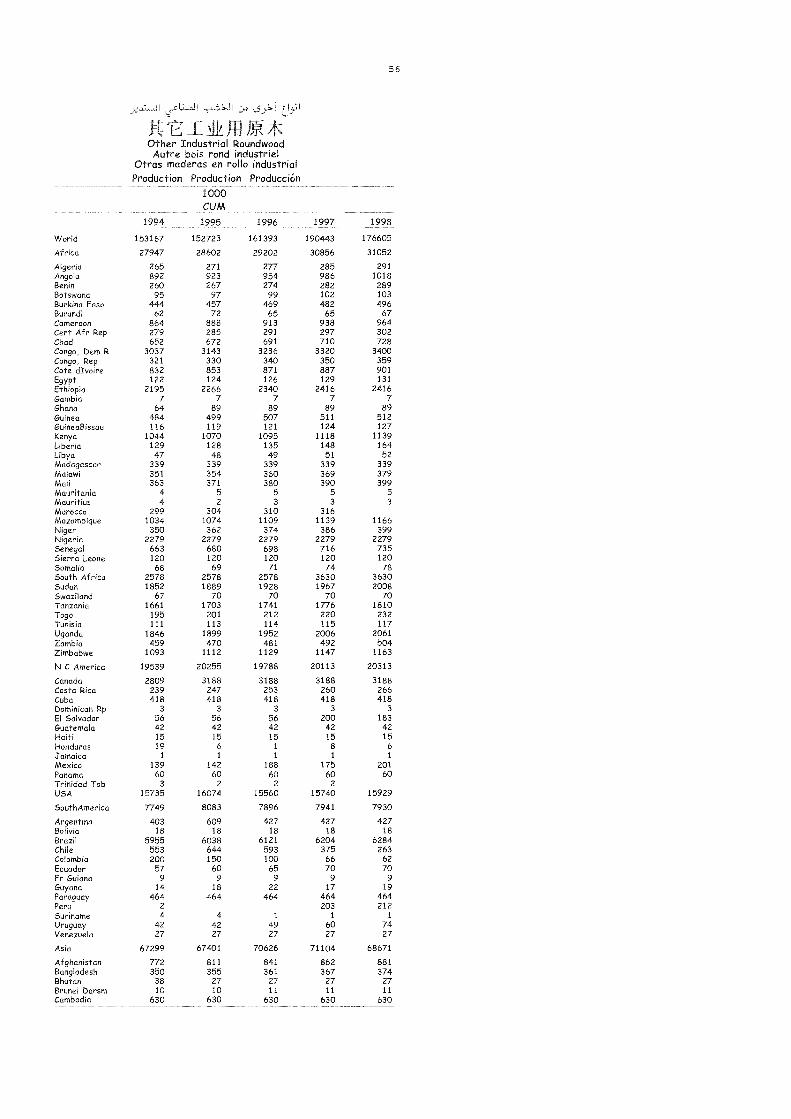
_I_ f;9: *rt,Other Industrial RoundwoodAutre bois rond industriel
Otras maderas en rollo industrialProduction Production Producción
1000CUM
56
1994 1995 1996 1997 1998
World 153167 152723 161393 190443 176605
Africa 27947 28602 29202 30856 31052
Algeria 265 271 277 285 291Angola 892 923 954 986 1018Benin 260 267 274 282 289Botswana 95 97 99 102 103Burkina Faso 444 457 469 482 496Burundi 62 72 65 65 67Cameroon 864 888 913 938 964Cent Afr Rep 279 285 291 297 302Chad 652 672 691 710 728Congo, Dem R 3037 3143 3236 3320 3400Congo, Rep 321 330 340 350 359Cote dIvoire 832 853 871 887 901Egypt 122 124 126 129 131Ethiopia 2195 2266 2340 2416 2416Gambia 7 7 7 7 7Ghana 64 89 89 89 89Guinea 484 499 507 511 512GuineaBissau 116 119 121 124 127Kenya 1044 1070 1095 1118 1139Liberia 129 128 135 148 164Libya 47 48 49 51 52Madagascar 339 339 339 339 339Malawi 351 354 360 369 379Mali 363 371 380 390 399Mauritania 4 5 5 5 5
Mauritius 4 2 3 3 3
Morocco 299 304 310 316Mozambique 1034 1074 1109 1139 1166Niger 350 362 374 386 399Nigeria 2279 2279 2279 2279 2279Senegal 663 680 698 716 735Sierra Leone 120 120 120 120 120Somalia 68 69 71 74 78South Africa 2578 2578 2578 3630 3630Sudan 1852 1889 1928 1967 2008Swaziland 67 70 70 70 70Tanzania 1661 1703 1741 1776 1810Togo 195 201 212 220 232Tunisia 111 113 114 115 117Uganda 1846 1899 1952 2006 2061Zambia 459 470 481 492 504Zimbabwe 1093 1112 1129 1147 1163
N C America 19539 20255 19788 20113 20313
Canada 2809 3188 3188 3188 3188Costa Rica 239 247 253 260 266Cuba 418 418 418 418 418Dominican Rp 3 3 3 3 3
El Salvador 56 56 56 200 183Guatemala 42 42 42 42 42Haiti 15 15 15 15 15Honduras 19 6 1 8 6
Jamaica 1 1 1 1 1
Mexico 139 142 188 175 201Panama 60 60 60 60 60Trinidad Tob 3 2 2 2
USA 15735 16074 15560 15740 15929
SouthAmerica 7749 8083 7896 7941 7930
Argentina 403 609 427 427 427Bolivia 18 18 18 18 18Brazil 5955 6038 6121 6204 6284Chile 553 644 593 375 263Colombia 200 150 100 66 62Ecuador 57 60 65 70 70Fr Guiana 9 9 9 9 9Guyana 14 18 22 17 19Paraguay 464 464 464 464 464Peru 2 203 212Suriname 4 4 1 1 1
Uruguay 42 42 49 60 74Venezuela 27 27 27 27 27
Asia 67299 67401 70626 71104 68671
Afghanistan 772 811 841 862 881Bangladesh 350 355 361 367 374Bhutan 38 27 27 27 27Brunei Darsm 10 10 11 11 11Cambodia 630 630 630 630 630
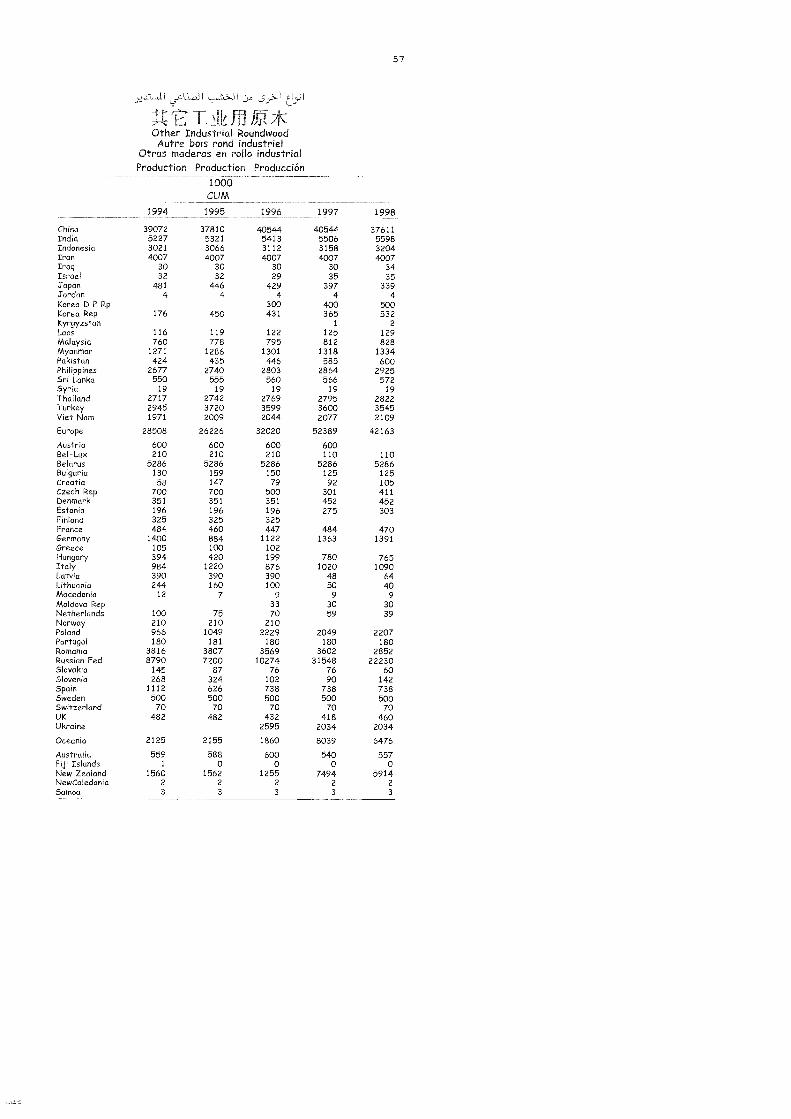
,r5-cIiI
Other Industrial RoundwoodAutre bois rond industriel
Otras maderas en rollo industrialProduction Production Producción
1000CUM
57
1994 1995 1996 1997 1998
China 39072 37810 40544 40544 37611India 5227 5321 5413 5506 5598Indonesia 3021 3066 3112 3158 3204Iran 4007 4007 4007 4007 4007Iraq 30 30 30 30 34Israel 32 32 29 35 35Japan 481 4-46 429 397 339Jordan 4 4 4 4 4Korea D P Rp 300 400 500Korea Rep 176 450 431 365 532Kyrgyzstan 1 2Laos 116 119 122 125 129Malaysia 760 778 795 812 828Myanmar 1271 1286 1301 1318 1334Pakistan 424 435 446 585 600Philippines 2677 2740 2803 2864 2925Sri Lanka 550 555 560 566 572Syria 19 19 19 19 19Thailand 2717 2742 2769 2795 2822Turkey 2945 3720 3599 3600 3545Viet Nam 1971 2009 2044 2077 2109
Europe 28508 26226 32020 52389 42163
Austria 600 600 600 600Bel-Lux 210 210 210 110 110Belarus 5286 5286 5286 5286 5286Bulgaria 130 159 150 125 125Croatia 58 147 79 92 105Czech Rep 700 700 500 301 411Denmark 351 351 351 452 452Estonia 196 196 196 275 303Finland 325 325 325France 484 460 447 484 470Germany 1400 884 1122 1363 1391Greece 105 100 102Hungary 394 420 199 780 765Italy 984 1220 876 1020 1090Latvia 390 390 390 48 64Lithuania 244 160 100 50 40Macedonia 12 7 9 9 9Moldova Rep 33 30 30Netherlands 100 75 70 59 39Norway 210 210 210Poland 966 1049 2229 2049 2207Portugal 180 181 180 180 180Romania 3816 3807 3569 3602 2852Russian Fed 8790 7200 10274 31548 22230Slovakia 145 87 76 76 60Slovenia 268 324 102 90 142Spain 1112 626 738 738 738Sweden 500 500 500 500 500Switzerland 70 70 70 70 70UK 482 482 432 418 460Ukraine 2595 2034 2034
Oceania 2125 2155 1860 8039 6476
Australia 559 588 600 540 557Fiji Islands 1 0 0 0 0New Zealand 1560 1562 1255 7494 5914NewCaledonia 2 2 2 2 2Samoa 3 3 3 3 3

j):"..11) I c,5JLc:L."31
A10.1-141/Rilf,71K( 4f rf-f-Other Industrial Roundwood (C)Autre bois rond industriel (C)
Otras maderas en rollo industrial (C)Production Production Producción
1000CUM
58
1994 1995 1996 1997 1998
World 59722 56952 57253 83551 72259
Africa 955 969 967 1157 1114
Algeria 178 182 186 191 195Burundi 9 2 5 13Ethiopia 10 10 10 10 10Kenya 20 20 20 20 20Mauritius 1 1 1 1 iMorocco 52 53 54 55South Africa 443 443 443 624 624Tanzania 228 228 228 228 228Tunisia 22 22 22 22 22
N C America 10127 9589 9437 9431 9611
Canada 1656 937 937 937 937El Salvador 22 22 22Guatemala 13 13 13 13 13Honduras 19 6 1 7 4Mexico 68 93 118 128 140USA 8349 8518 8346 8346 8517
SouthAmerica 860 956 892 1018 917
Argentina 4 56 3 3 3
Brazil 644 653 662 671 679Chile 212 247 227 324 216Colombia 20 19
Asia 27098 26903 28787 28844 26962
Afghanistan 153 161 167 171 175China 24704 23900 25645 25645 23773India 91 93 94 96 98Indonesia 6 6 6 6 6Israel 21 21 22 23 23Japan 365 339 326 302 258Korea D P Rp 300 400 500Korea Rep 114 400 414 346 505Kyrgyzstan 1 1
Pakistan 26 27 27 35 40Turkey 1618 1956 1786 1820 1583
Europe 18764 16586 15493 35182 27282
Austria 410 410 410 410Bel-Lux 160 160 160 84 84Belarus 2600 2600 2600 2600 2600Bulgaria 80 106 100 85 85Croatia 17 53 6 10 13Czech Rep 650 650 448 286 400Denmark 325 325 325 318 318Estonia 171 171 171 200 220Finland 275 275 275France 277 229 216 197 200Germany 600 500 625 777 733Greece 30 19 20Hungary 29 30 35 164 161Italy 345 331 270 260 243Latvia 200 200 200 47 62Lithuania 195 130 85 40 35Macedonia 8 5 7 7 7Netherlands 100 73 68 57 39Norway 190 190 190Poland 966 1049 1842 1678 1736Portugal 156 157 145 145 145Romania 786 790 556 650 462Russian Fed 8360 6900 3967 24702 17230Slovakia 97 64 48 65 51Slovenia 217 146 95 79 95Spain 826 329 350 350 350Sweden 200 200 460 460 460Switzerland 60 60 60 60 60UK 434 434 384 370 412Ukraine 1375 1081 1081
Oceania 1919 1950 1678 7919 6374
Australia 359 388 423 425 460New Zealand 1560 1562 1255 7494 5914
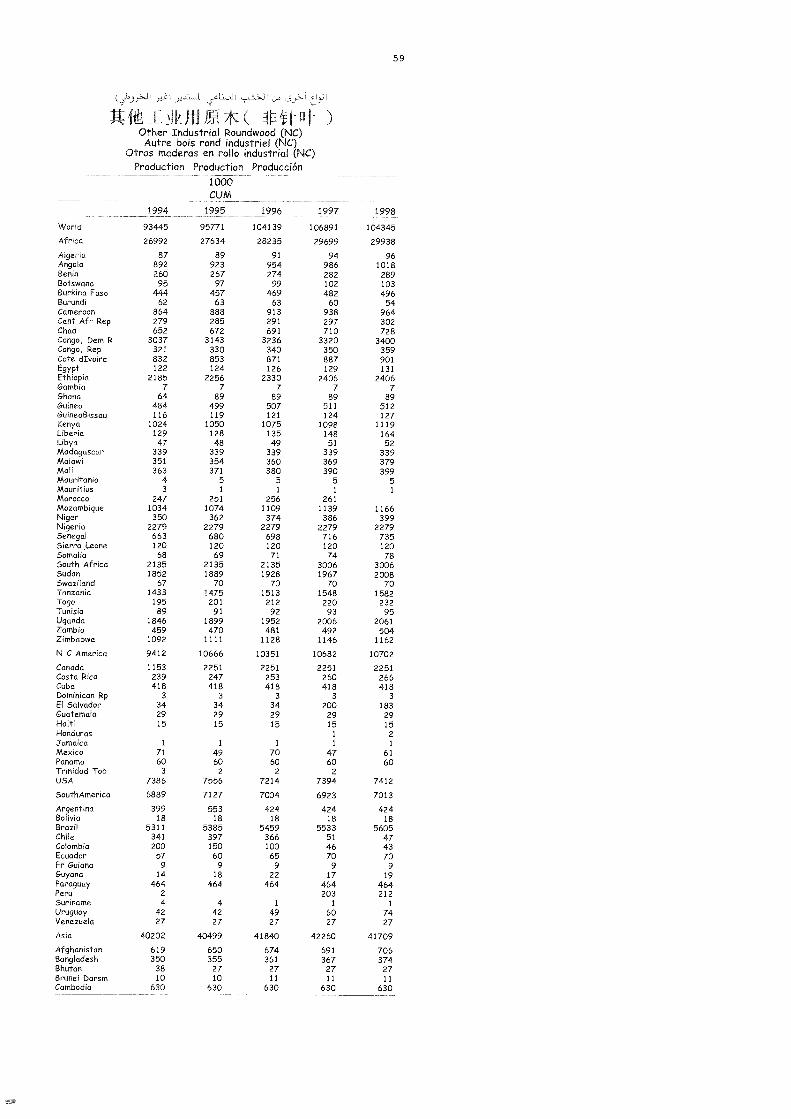
Ij!HJ,4c(( I Fit )Other Industrial Roundwood (NC)Autre bois rond industriel (NC)
Otras maderas en rollo industrial (NC)Production Production Producción
1000CUM
59
1994 1995 1996 1997 1998
World 93445 95771 104139 106891 104345
Africa 26992 27634 28235 29699 29938
Algeria 87 89 91 94 96Angola 892 923 954 986 1018Benin 260 267 274 282 289Botswana 95 97 99 102 103Burkina Faso 444 457 469 482 496Burundi 62 63 63 60 54Cameroon 864 888 913 938 964Cent Afr Rep 279 285 291 297 302Chad 652 672 691 710 728Congo, Dem R 3037 3143 3236 3320 3400Congo, Rep 321 330 340 350 359Cote dIvoire 832 853 871 887 901Egypt 122 124 126 129 131Ethiopia 2185 2256 2330 2406 2406Gambia 7 7 7 7 7Ghana 64 89 89 89 89Guinea 484 499 507 511 512GuineaBissau 116 119 121 124 127Kenya 1024 1050 1075 1098 1119Liberia 129 128 135 148 164Libya 47 48 49 51 52Madagascar 339 339 339 339 339Malawi 351 354 360 369 379Mali 363 371 380 390 399Mauritania 4 5 5 5 5Mauritius 3 1 1 1 1
Morocco 247 251 256 261Mozambique 1034 1074 1109 1139 1166Niger 350 362 374 386 399Nigeria 2279 2279 2279 2279 2279Senegal 663 680 698 716 735Sierra Leone 120 120 120 120 120Somalia 68 69 71 74 78South Africa 2135 2135 2135 3006 3006Sudan 1852 1889 1928 1967 2008Swaziland 67 70 70 70 70Tanzania 1433 1475 1513 1548 1582Togo 195 201 212 220 232Tunisia 89 91 92 93 95Uganda 1846 1899 1952 2006 2061Zambia 459 470 481 492 504Zimbabwe 1092 1111 1128 1146 1162
N C America 9412 10666 10351 10682 10702
Canada 1153 2251 2251 2251 2251Costa Rica 239 247 253 260 266Cuba 418 418 418 418 418Dominican Rp 3 3 3 3 3El Salvador 34 34 34 200 183Guatemala 29 29 29 29 29Haiti 15 15 15 15 15Honduras 1 2Jamaica 1 1 1 1 1
Mexico 71 49 70 47 61Panama 60 60 60 60 60Trinidad Tob 3 2 2 2
USA 7386 7556 7214 7394 7412
SouthAmerica 6889 7127 7004 6923 7013
Argentina 399 553 424 424 424Bolivia 18 18 18 18 18Brazil 5311 5385 5459 5533 5605Chile 341 397 366 51 47Colombia 200 150 100 46 43Ecuador 57 60 65 70 70Fr Guiana 9 9 9 9 9Guyana 14 18 22 17 19Paraguay 464 464 464 464 464Peru 2 203 212Suriname 4 4 1 1 1
Uruguay 42 42 49 60 74Venezuela 27 27 27 27 27
Asia 40202 40499 41840 42260 41709
Afghanistan 619 650 674 691 706Bangladesh 350 355 361 367 374Bhutan 38 27 27 27 27Brunei Darsm 10 10 11 11 11Cambodia 630 630 630 630 630
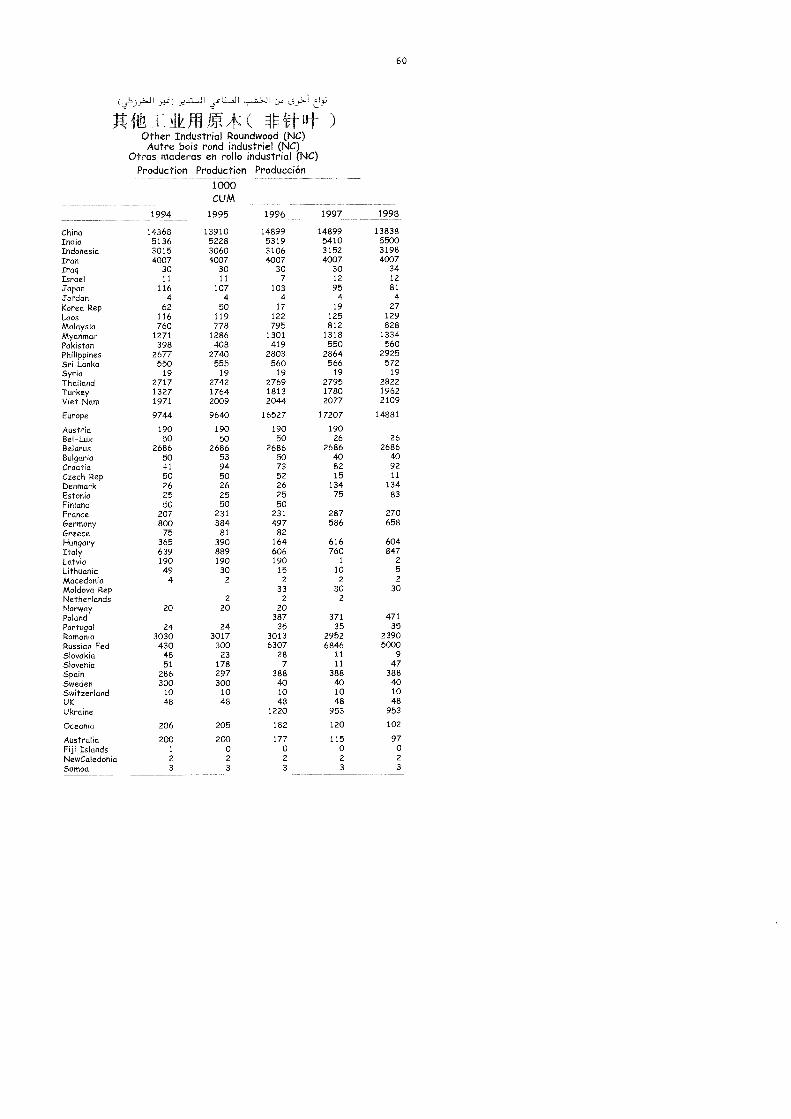
I,11 uir '-.Ji
Ri&TA10111#*( Irtrrit )Other Industrial Roundwood (NC)
Autre bois rond industriel (NC)Otras maderas en rollo industrial (NC)
Production Production Producción000
CUM
60
1994 1995 1996 1997 1998
China 14368 13910 14899 14899 13838India 5136 5228 5319 5410 5500Indonesia 3015 3060 3106 3152 3198Iran 4007 4007 4007 4007 4007Iraq 30 30 30 30 34Israel 11 11 7 12 12
Japan 116 107 103 95 81
Jordan 4 4 4 4 4
Korea Rep 62 50 17 19 27Laos 116 119 122 125 129Malaysia 760 778 795 812 828Myanmar 1271 1286 1301 1318 1334Pakistan 398 408 419 550 560Philippines 2677 2740 2803 2864 2925Sri Lanka 550 555 560 566 572Syria 19 19 19 19 19
Thailand 2717 2742 2769 2795 2822Turkey 1327 1764 1813 1780 1962Viet Nam 1971 2009 2044 2077 2109
Europe 9744 9640 16527 17207 14881
Austria 190 190 190 190Bel-Lux 50 50 50 26 26Belarus 2686 2686 2686 2686 2686Bulgaria 50 53 50 40 40Croatia 41 94 73 82 92Czech Rep 50 50 52 15 11
Denmark 26 26 26 134 134Estonia 25 25 25 75 83Finland 50 50 50France 207 231 231 287 270Germany 800 384 497 586 658Greece 75 81 82Hungary 365 390 164 616 604Italy 639 889 606 760 847Latvia 190 190 190 1 2
Lithuania 49 30 15 10 5
Macedonia 4 2 2 2 2
Moldova Rep 33 30 30Netherlands 2 2 2
Norway 20 20 20Poland 387 371 471Portugal 24 24 35 35 35Romania 3030 3017 3013 2952 2390Russian Fed 430 300 6307 6846 5000Slovakia 48 23 28 11 9Slovenia 51 178 7 11 47Spain 286 297 388 388 388Sweden 300 300 40 40 40Switzerland 10 10 10 10 10UK 48 48 48 48 48Ukraine 1220 953 953
Oceania 206 205 182 120 102
Australia 200 200 177 115 97Fiji Islands 1 O 0 0 0NewCaledonia 2 2 2 2 2
Samoa 3 3 3 3 3
WOOD CL 1
4. 1. J 410 '1111
!COAL, WOC .7ICL._.5 ANL)RESIDUES
.06 !:-ON DE BOY.... PLAQUETTES ET PARTICULESET RESIDUS DE BOIS
CARBÓN V,EGETAL DE MADERA, ASTILLAS,PARTICULAS Y RESIDUOS DE MADERA
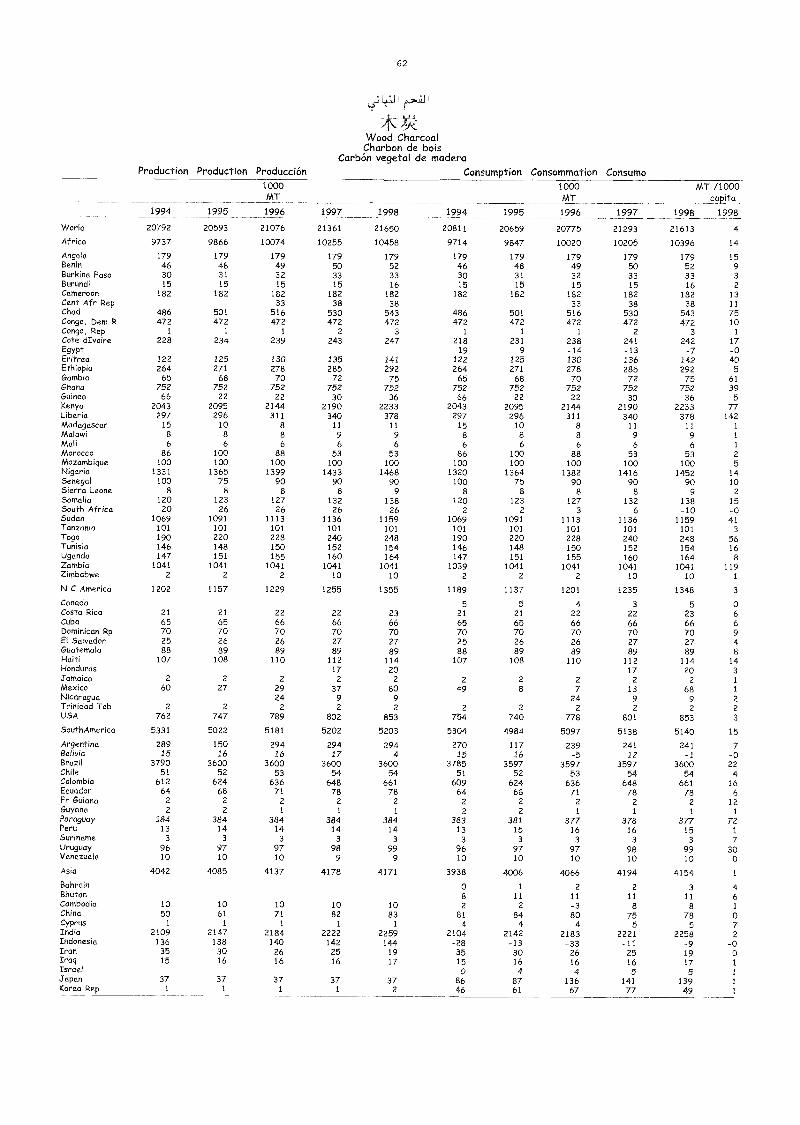
62
*Y-/M/ood CharcoalCharbon de bois
Carbón vegetal de maderaProduction Production Producción Consumption Consommation Consumo
1994 1995
1000MT
1996
1000MT
MT /1000capita
19981997 1998 1994 1995 1996 1997 1998
World 20792 20593 21076 21361 21650 20811 20659 20775 21293 21613 4
Africa 9737 9866 10074 10255 10458 9714 9847 10020 10205 10396 14
Angola 179 179 179 179 179 179 179 179 179 179 15Benin 46 48 49 50 52 46 48 49 50 52 9Burkina Faso 30 31 32 33 33 30 31 32 33 33 3Burundi 15 15 15 15 16 15 15 15 15 16 2Cameroon 182 182 182 182 182 182 182 182 182 182 13Cent Afr Rep 33 38 38 33 38 38 11Chad 486 501 516 530 543 486 501 516 530 543 75Congo, Dem R 472 472 472 472 472 472 472 472 472 472 10Congo, Rep 1 1 1 2 3 1 1 1 2 3 1
Cote dIvoire 228 234 239 243 247 218 231 238 241 242 17Egypt 19 9 -14 -13 -7 -0Eritrea 122 125 130 135 141 122 125 130 136 142 40Ethiopic 264 271 278 285 292 264 271 278 285 292 5Gambia 65 68 70 72 75 65 68 70 72 75 61Ghana 752 752 752 752 752 752 752 752 752 752 39Guinea 66 22 22 30 36 66 22 22 30 36 5Kenya 2043 2095 2144 2190 2233 2043 2095 2144 2190 2233 77Liberia 297 296 311 340 378 297 296 311 340 378 142Madagascar 15 10 8 11 11 15 10 8 n n 1
Malawi 8 8 8 9 9 8 8 8 9 9 1
Mali 6 6 6 6 6 6 6 6 6 6 1
Morocco 86 100 88 53 53 86 100 88 53 53 2Mozambique 100 100 100 100 100 100 100 100 100 100 5Nigeria 1331 1365 1399 1433 1468 1320 1364 1382 1416 1452 14Senegal 100 75 90 90 90 100 75 90 90 90 10Sierra Leone 8 8 8 8 9 8 8 8 8 9 2Somalia 120 123 127 132 138 120 123 127 132 138 15South Africa 20 26 26 26 26 2 2 3 6 -10 -0Sudan 1069 1091 1113 1136 1159 1069 1091 1113 1136 1159 41Tanzania 101 101 101 101 101 101 101 101 101 101 3Togo 190 220 228 240 248 190 220 228 240 248 56Tunisia 146 148 150 152 154 146 148 150 152 154 16Uganda 147 151 155 160 164 147 151 155 160 164 8Zambia 1041 1041 1041 1041 1041 1039 1041 1041 1041 1041 119Zimbabwe 2 2 2 10 10 2 2 2 10 10 1
N C America 1202 1157 1229 1255 1355 1189 1137 1201 1235 1348 3
Canada 5 5 4 3 5 oCosta Rica 21 21 22 22 23 21 21 22 22 23 6Cuba 65 65 66 66 66 65 65 66 66 66 6Dominican Rp 70 70 70 70 70 70 70 70 70 70 9El Salvador 25 26 26 27 27 25 26 26 27 27 4Guatemala 88 89 89 89 89 88 89 89 89 89 8Haiti 107 108 110 112 114 107 108 110 112 114 14Honduras 17 20 17 20 3Jamaica 2 2 2 2 2 2 2 2 2 2 1
Mexico 60 27 29 37 80 49 8 7 13 68 1
Nicaragua 24 9 9 24 9 9 2Trinidad Tob 2 2 2 2 2 2 2 2 2 2 2USA 762 747 789 802 853 754 740 778 801 853 3
SouthAmerica 5331 5022 5181 5202 5203 5304 4984 5097 5138 5140 15
Argentina 289 150 294 294 294 270 117 239 241 241 7Bolivia 15 16 16 17 4 15 16 -5 12 -1 -0Brazil 3790 3600 3600 3600 3600 3785 3597 3597 3597 3600 22Chile Si 52 53 54 54 51 52 53 54 54 4Colombia 612 624 636 648 661 609 624 636 648 661 16Ecuador 64 68 71 78 78 64 68 71 78 78 6Fr Guiana 2 2 2 2 2 2 2 2 2 2 12Guyana 2 2 1 1 1 2 2 1 1 1 1
Paraguay 384 384 384 384 384 383 381 377 378 377 72Peru 13 14 14 14 14 13 15 16 16 15 1
Suriname 3 3 3 3 3 3 3 3 3 3 7Uruguay 96 97 97 98 99 96 97 97 98 99 30Venezuela 10 10 10 9 9 10 10 10 10 10 0
Asia 4042 4085 4137 4178 4171 3938 4006 4066 4194 4154 1
Bahrain 0 1 2 2 3 4Bhutan 8 n n 11 n 6Cambodia 10 10 10 10 10 2 2 -3 8 8 1China 50 61 71 82 83 81 84 80 75 78 oCyprus 1 1 1 1 1 4 4 4 5 5 7India 2109 2147 2184 2222 2259 2104 2142 2183 2221 2258 2Indonesia 136 138 140 142 144 -28 -13 -33 -ii -9 -0Iran 35 30 26 25 19 35 30 26 25 19 0Iraq 15 16 16 16 17 15 16 16 16 17 1
Israel 0 4 4 5 5 1
Japan 37 37 37 37 37 86 87 136 141 139 1
Korea Rep 1 1 1 1 2 46 61 67 77 49 1
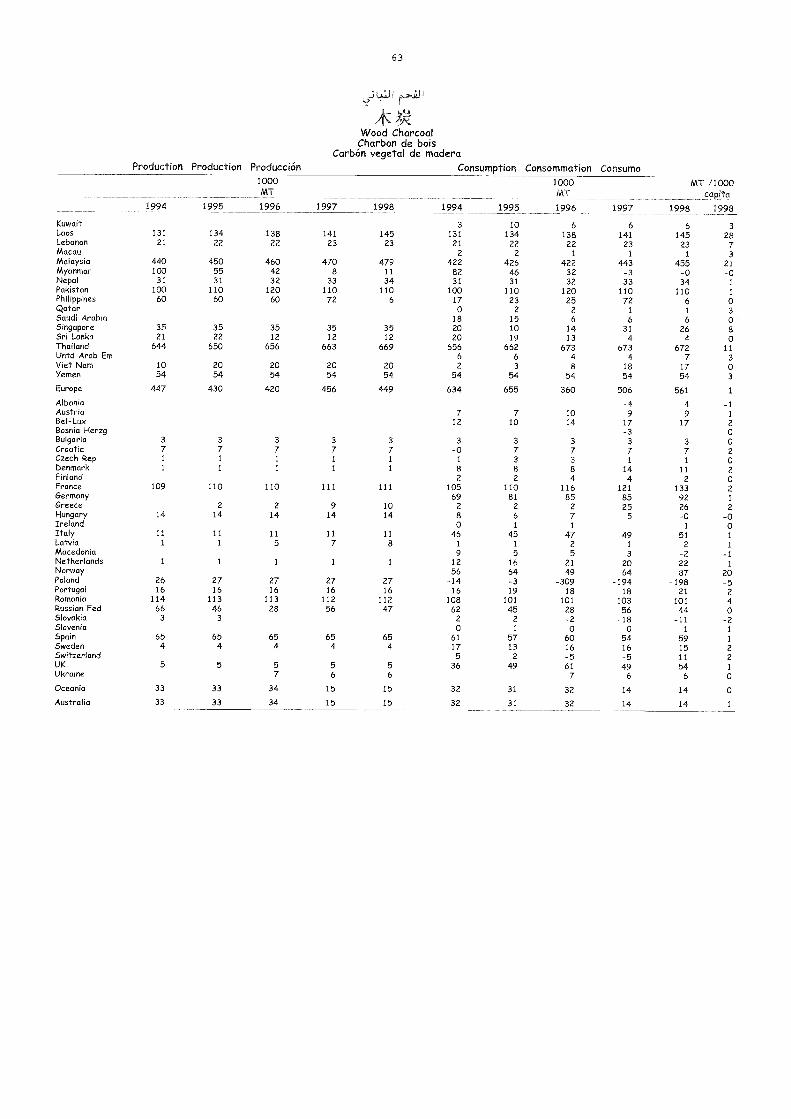
63
I
Wood CharcoalCharbon de bois
Carbón vegetal de maderaProduction Production Producción Consumption Consommation Consumo
1994 1995
1000MT
1996 1997 1998 1994 1995
1000MT
1996 1997
MT /1000capita
1998 1998
Kuwait 3 10 6 6 6 3Laos 131 134 138 141 145 131 134 138 141 145 28Lebanon 21 22 22 23 23 21 22 22 23 23 7Macau 2 2 1 1 1 3Malaysia 440 450 460 470 479 422 426 422 443 455 21Myanmar 100 55 42 8 11 82 46 32 -3 -0 -0Nepal 31 31 32 33 34 31 31 32 33 34 1
Pakistan 100 110 120 110 110 100 110 120 110 110 1
Philippines 60 60 60 72 6 17 23 25 72 6 0Qatar 0 2 2 1 1 3Saudi Arabia 18 15 6 6 6 0Singapore 35 35 35 35 35 20 10 14 31 26 8Sri Lanka 21 22 12 12 12 20 19 13 4 4 0Thailand 64-4 650 656 663 669 656 662 673 673 672 11Untd Arab Em 6 6 4 4 7 3Viet Nam 10 20 20 20 20 2 3 8 18 17 0Yemen 54 54 54 54 54 54 54 54 54 54 3
Europe 447 430 420 456 449 634 655 360 506 561 1
Albania -4 -4 -1Austria 7 7 10 9 9 1
Bel-Lux 12 10 14 17 17 2Bosnia Herzg -3 0Bulgaria 3 3 3 3 3 3 3 3 3 3 0Croatia 7 7 7 7 7 -0 7 7 7 7 2Czech Rep 1 1 1 1 1 1 3 3 1 1 0Denmark 1 1 1 1 1 8 8 8 14 11 2Finland 2 2 4 4 2 0France 109 110 110 111 111 105 110 116 121 133 2Germany 69 81 85 85 92 1
Greece 2 2 9 10 2 2 2 25 26 2Hungary 14 14 14 14 14 8 6 7 5 -0 -0Ireland 0 1 1 1 0Italy 11 11 11 11 11 46 45 47 49 51 1
Latvia 1 1 5 7 8 1 1 2 1 2 1Macedonia 9 5 5 3 -2 -1Netherlands 1 1 1 1 1 12 16 21 20 22 1
Norway 56 64 49 64 87 20Poland 26 27 27 27 27 -14 -3 -309 -194 -198 -5Portugal 16 16 16 16 16 16 19 18 18 21 2Romania 114 113 113 112 112 108 101 101 103 101 4Russian Fed 66 46 28 56 47 62 45 28 56 44 0Slovakia 3 3 2 2 -2 -18 -11 -2Slovenia 0 1 0 0 1 1
Spain 65 65 65 65 65 61 57 60 54 59 1
Sweden 4 4 4 4 4 17 13 16 16 15 2Switzerland 5 2 -5 -5 11 2UK 5 5 5 5 5 36 49 61 49 54 1
Ukraine 7 6 6 7 6 6 0
Oceania 33 33 34 15 15 32 31 32 14 14 0
Australia 33 33 34 15 15 32 31 32 14 14 1
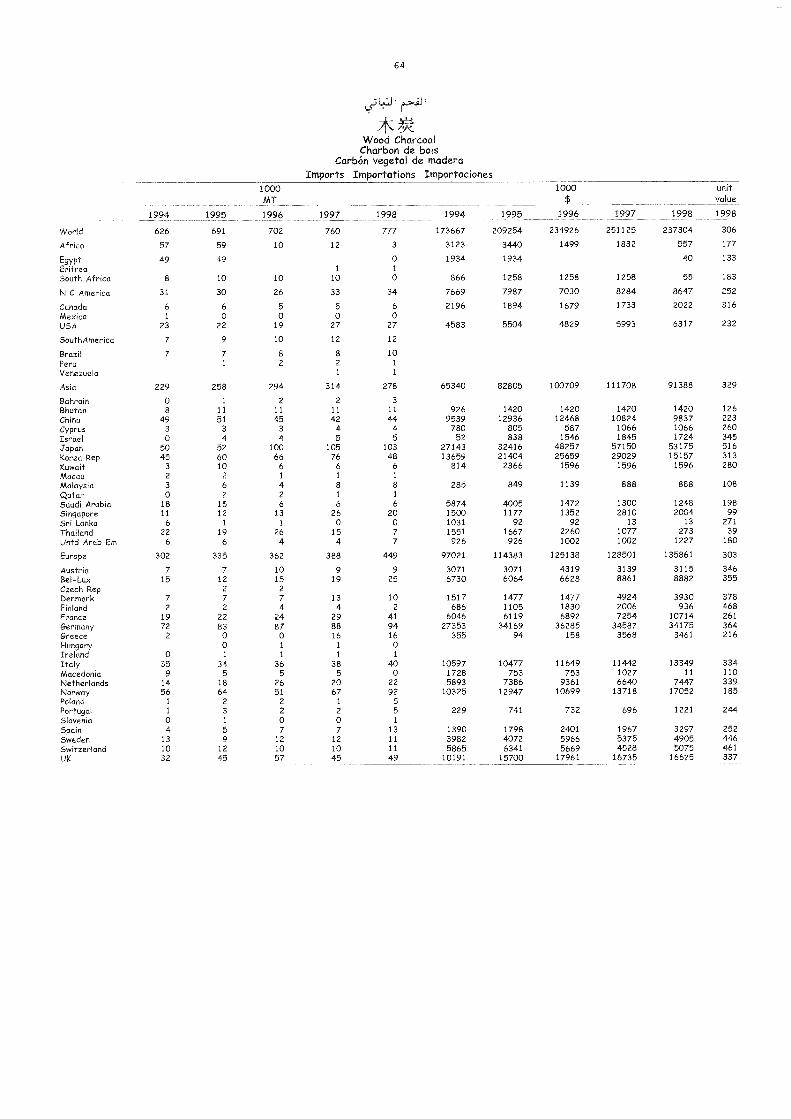
64
* PAWood CharcoalCharbon de bois
Carbón vegetal de maderaImports Importations Importaciones
1994 1995
1000MT
1996 1997 1998 1994 1995
1000$
1996 1997 1998
unitvalue
1998
World 626 691 702 760 ti/ 173667 209254 234926 251125 237304 306
Africa 57 59 10 12 3 3123 3440 1499 1832 557 177
Egypt 49 49 0 1934 1934 40 133Eritrea 1 1
South Africa 8 10 10 10 0 866 1258 1258 1258 55 183
N C America 31 30 26 33 34 7669 7987 7030 8284 8647 252
Canada 6 6 5 5 6 2196 1894 1679 1733 2022 316Mexico 1 o o o o
USA 23 22 19 27 27 4583 5504 4829 5993 6317 232
SouthAmerica 7 9 10 12 12
Brazd 7 7 8 8 10Peru 1 2 2 1
Venezuela 1 1
Asia 229 258 294 314 278 65340 82805 100709 111708 91388 329
Bahrain 0 1 2 2 3
Bhutan 8 11 11 11 11 926 1420 1420 1420 1420 126
China 49 51 45 42 44 9539 12936 12468 10824 9837 223Cyprus 3 3 3 4 4 780 805 587 1066 1066 260Israel 0 4 4 5 5 52 838 1546 1845 1724 345Japan 50 52 100 105 103 27143 32416 48257 57150 53175 516
Korea Rep 45 60 66 76 48 13659 21404 25659 29029 15157 313Kuwait 3 10 6 6 6 814 2366 1596 1596 1596 280Macau 2 2 1 1 1
Malaysia 3 6 4 8 8 285 849 1139 888 888 108
Qatar 0 2 2 1 1
Saudi Arabia 18 15 6 6 6 5874 4005 1472 1300 1248 198Singapore 11 12 13 26 20 1500 1177 1352 2810 2004 99
Sri Lanka 6 1 1 0 0 1031 92 92 13 13 271
Thailand 22 19 26 15 7 1551 1667 2260 1077 273 39Untd Arab Ere 6 6 4 4 7 926 926 1002 1002 1227 180
Europe 302 335 362 388 449 97021 114383 125138 128501 135861 303
Austria 7 7 10 9 9 3071 3071 4319 3139 3115 346Bel-Lux 15 12 15 19 25 6730 6064 6628 8861 8882 355Czech Rep 2 2
Denmark 7 7 7 13 10 1517 1477 1477 4924 3930 378Finland 2 2 4 4 2 686 1105 1830 2006 936 468France 19 22 24 29 41 6046 6119 6892 7254 10714 261
Germany 72 83 87 88 94 27353 34169 36285 34587 34175 364Greece 2 0 0 16 16 355 94 158 3568 3461 216Hungary 0 1 1 0Ireland 0 1 1 1 1
Italy 35 34 36 38 40 10597 10477 11649 11442 13349 334Macedonia 9 5 5 5 0 1728 753 753 1027 11 110Netherlands 14 18 26 20 22 5893 7386 9361 6640 7447 339Norway 56 64 51 67 92 10325 12947 10699 13718 17052 185Poland 1 2 2 1 5Portugal 1 3 2 2 5 229 741 732 696 1221 244Slovenia 0 1 o o 1
SpaM 4 5 7 7 13 1390 1798 2401 1967 3297 252Sweden 13 9 12 12 11 3982 4072 5966 5375 4905 446Switzerland 10 12 10 10 11 5865 6341 5669 4528 5075 461UK 32 45 57 45 49 10191 15700 17961 16735 16625 337
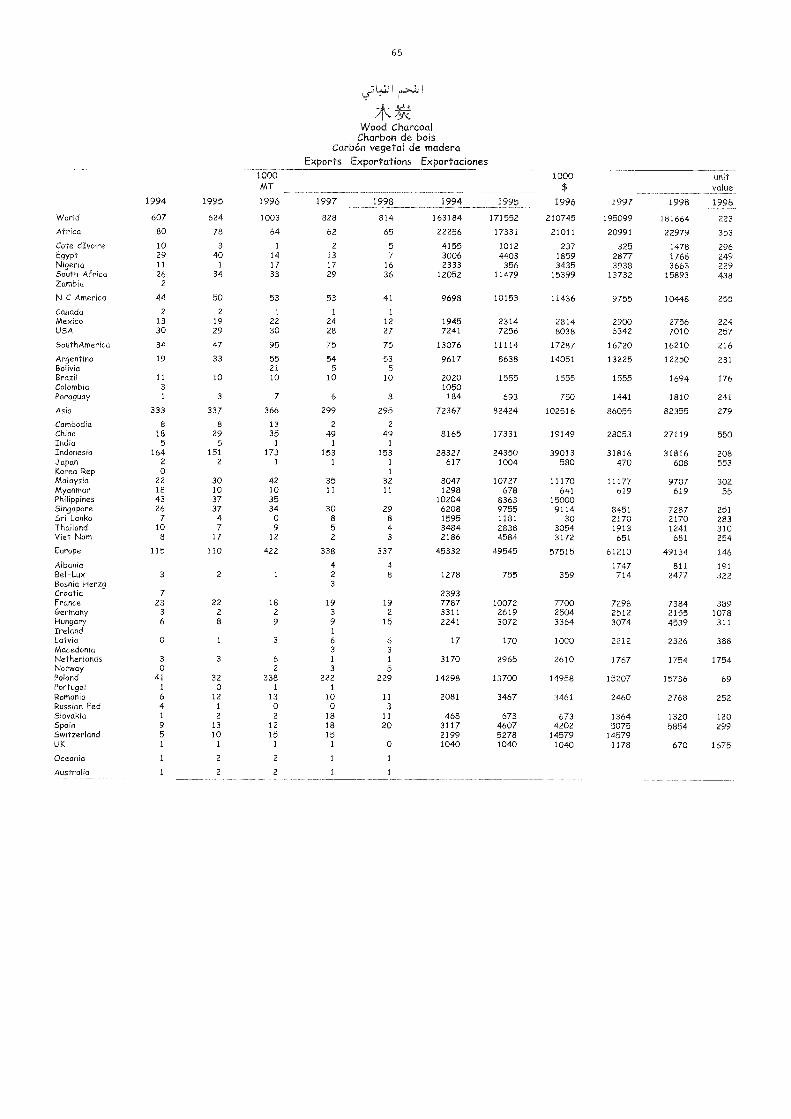
65
Wood CharcoalCharbon de bois
Carbón vegetal de maderaExports Exportations Exportaciones
1000MT
1000 unitvalue
1994 1995 1996 1997 1998 1994 1995 1996 1997 1998 1 '---World 607 624 1003 828 814 163184 171552 210745 195099 181664
Africa 80 78 64 62 65 22256 17331 21011 20991 22979 353
Cote dIvoire 10 3 1 2 5 4155 1012 237 325 1478 296Egypt 29 40 14 13 7 3006 4403 1859 2877 1766 249Nigeria 11 1 17 17 16 2333 356 3435 3938 3663 229South Africa 26 34 33 29 36 12052 11479 15399 13732 15893 438Zambia 2
N C Arnerico 44 50 53 53 41 9698 10153 11436 9755 10448 255
Canada 2 2 1 1 1
Mexico 13 19 22 24 12 1945 2314 2814 2900 2756 224USA 30 29 30 28 27 7241 7256 8038 6342 7010 257
SouthAmerica 34 47 95 75 75 13076 11114 17287 16720 16210 216
Argentina 19 33 55 54 53 9617 8638 14051 13225 12250 231Bolivia 21 5 5Brazil 11 10 10 10 10 2020 1555 1555 1555 1694 176Colombia 3 1050Paraguay 1 3 7 6 8 184 693 750 1441 1810 241
Asia 333 337 366 299 295 72367 82424 102516 86055 82355 279
Cambodia 8 8 13 2 2
China 18 29 35 49 49 8165 17331 19149 28053 27119 550India 5 5 1 1 1
Indonesia 164 151 173 153 153 28327 24350 39013 31816 31816 208Japan 2 2 1 1 1 617 1004 580 470 608 553Korea Rep 0 1
Malaysia 22 30 42 35 32 8047 10727 11170 11177 9707 302Myanmar 18 10 10 11 11 1298 678 641 619 619 55Philippines 43 37 35 10204 8363 15000Singapore 26 37 34 30 29 6208 9755 9114 8451 7287 251Sri Lanka 7 4 0 8 8 1595 1181 30 2170 2170 283Thailand 10 7 9 5 4 3484 2838 3054 1913 1241 310Viet Nam 8 17 12 2 3 2186 4584 3172 651 681 254
Europe 115 110 422 338 337 45332 49545 57515 61210 49134 146
Albania 4 4 1747 811 191Bel-Lux 3 2 1 2 8 1278 755 359 714 2477 322Bosnia Herzg 3
Croatia 7 2393France 23 22 18 19 19 7787 10072 7700 7298 7384 389Germany 3 2 2 3 2 3311 2619 2504 2512 2155 1078Hungary 6 8 9 9 15 2241 3072 3364 3074 4539 311Ireland 1
Latvia 0 1 3 6 6 17 170 1000 2212 2326 388Macedonia 3 3Netherlands 3 3 6 I 1 3170 2965 2610 1767 1754 1754Norway 0 2 3 5Poland 41 32 338 222 229 14298 13700 14958 15207 15736 69Portugal 1 0 1 1
Romania 6 12 13 10 11 2081 3467 3461 2460 2768 252Russian Fed 4 1 0 0 3Slovakia 1 2 2 18 11 468 673 673 1364 1320 120Spain 9 13 12 18 20 3117 4607 4202 5075 5854 299Switzerland 5 10 15 15 2199 5278 14579 14579UK 1 1 1 1 0 1040 1040 1040 1178 670 1675
Oceania 1 2 2 1 1
Australia 1 2 2 1 1
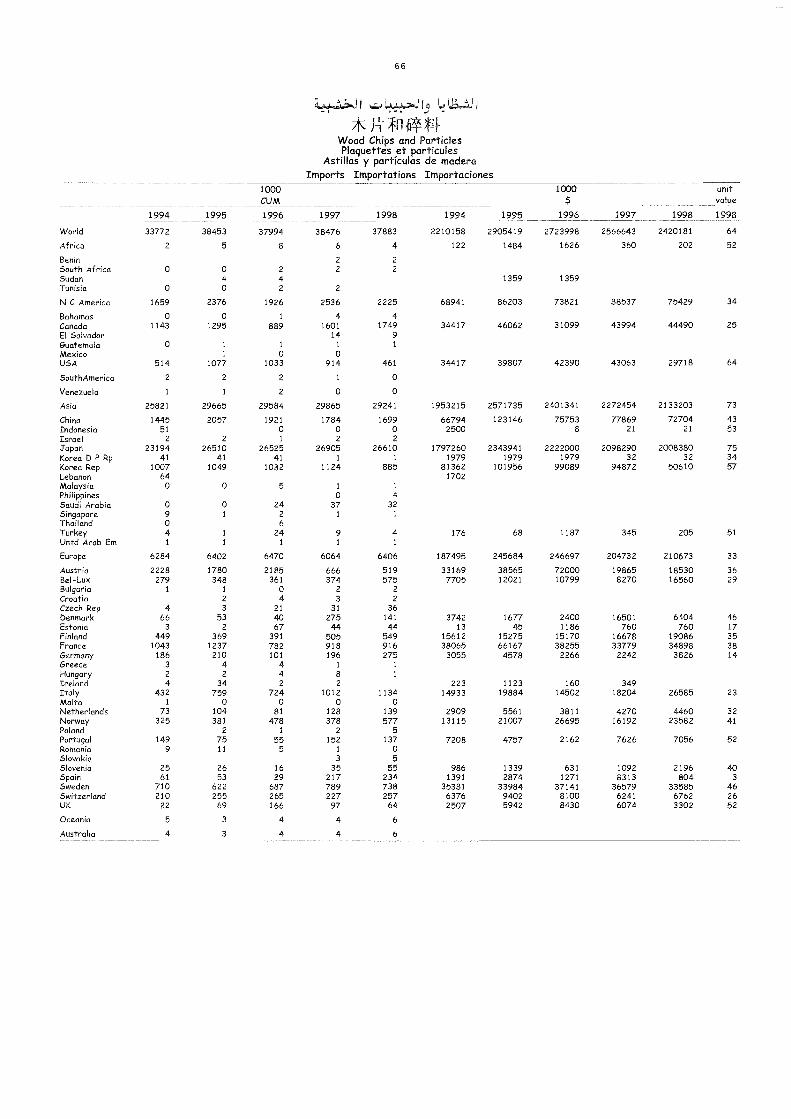
66
13 1-2 I
*n -if II 0-Wood Chips and ParticlesPlaquettes et particules
Astillas y partículas de maderaImports Importations Importaciones
1994 1995
1000CUM
1996 1997 1998 1994 1995
1000
$
1996 1997 1998
unitvalue
1998
World 33772 38453 37994 38476 37883 2210158 2905419 2723998 2566643 2420181 64
Africa 2 5 8 6 4 122 1484 1626 360 202 52
Benin 2 2
South Africa 0 0 2 2 2
Sudan 4 4 1359 1359Tunisia 0 0 2 2
N C America 1659 2376 1926 2536 2225 68941 86203 73821 88537 75429 34
Bahamas 0 0 1 4 4Canada 1143 1295 889 1601 1749 34417 46062 31099 43994 44490 25El Salvador 14 9Guatemala 0 1 1 1 1
Mexico 1 0 0USA 514 1077 1033 914 461 34417 39807 42390 43063 29718 64
SouthAmerica 2 2 2 1 0
Venezuela 1 1 2 0 0
Asia 25821 29665 29584 29865 29241 1953215 2571735 2401341 2272454 2133203 73
China 1445 2057 1921 1784 1699 66794 123146 75753 77869 72704 43Indonesia 51 0 0 0 2500 8 21 21 53Israel 2 2 1 2 2
Japan 23194 26510 26525 26905 26610 1797260 2343941 2222000 2098290 2008380 75Korea D P Rp 41 41 41 1 1 1979 1979 1979 32 32 34Korea Rep 1007 1049 1032 1124 885 81362 101956 99089 94872 50610 57Lebanon 64 1702Malaysia 0 0 5 1 1
Philippines 0 4
Saudi Arabia 0 0 24 37 32Singapore 9 1 2 1 1
Thailand 0 6
Turkey 4 1 24 9 4 176 68 1187 345 205 51Untd Arab Em 1 1 1 1 1
Europe 6284 6402 6470 6064 6406 187495 245684 246697 204732 210673 33
Austria 2228 1780 2185 666 519 33169 38565 72000 19865 18530 36Bel-Lux 279 348 361 374 575 7705 12021 10799 8270 16560 29Bulgaria 1 1 0 2 2
Croatia 2 4 3 2
Czech Rep 4 3 21 31 36Denmark 66 53 40 275 141 3742 1677 2400 16501 6404 46Estonia 3 2 67 44 44 13 45 1186 760 760 17Finland 449 369 391 505 549 15612 15275 15170 16678 19086 35France 1043 1237 782 918 916 38065 66167 38255 33779 34898 38Germany 186 210 101 196 275 3055 4578 2266 2242 3826 14Greece 3 4 4 1 1
Hungary 2 2 4 8 1
Ireland 4 34 2 2 223 1123 160 349Italy 432 759 724 1012 1134 14933 19884 14502 18204 26585 23Malta 1 0 0 0 0Netherlands 73 104 81 128 139 2909 5561 3811 4270 4460 32Norway 325 381 478 378 577 13115 21007 26695 16192 23582 41Poland 2 1 2 5Portugal 149 75 55 152 137 7208 4757 2162 7626 7056 52Romania 9 11 5 1 0Slovakia 3 5Slovenia 25 26 16 35 55 986 1339 631 1092 2196 40Spain 61 53 29 217 234 1391 2874 1271 8313 804 3
Sweden 710 622 687 789 738 35381 33984 37141 36579 33585 46Switzerland 210 255 265 227 257 6376 9402 8100 6241 6762 26UK 22 69 166 97 64 2507 5942 8430 6074 3302 52
Oceania 5 3 4 4 6
Australia 4 3 4 4 6
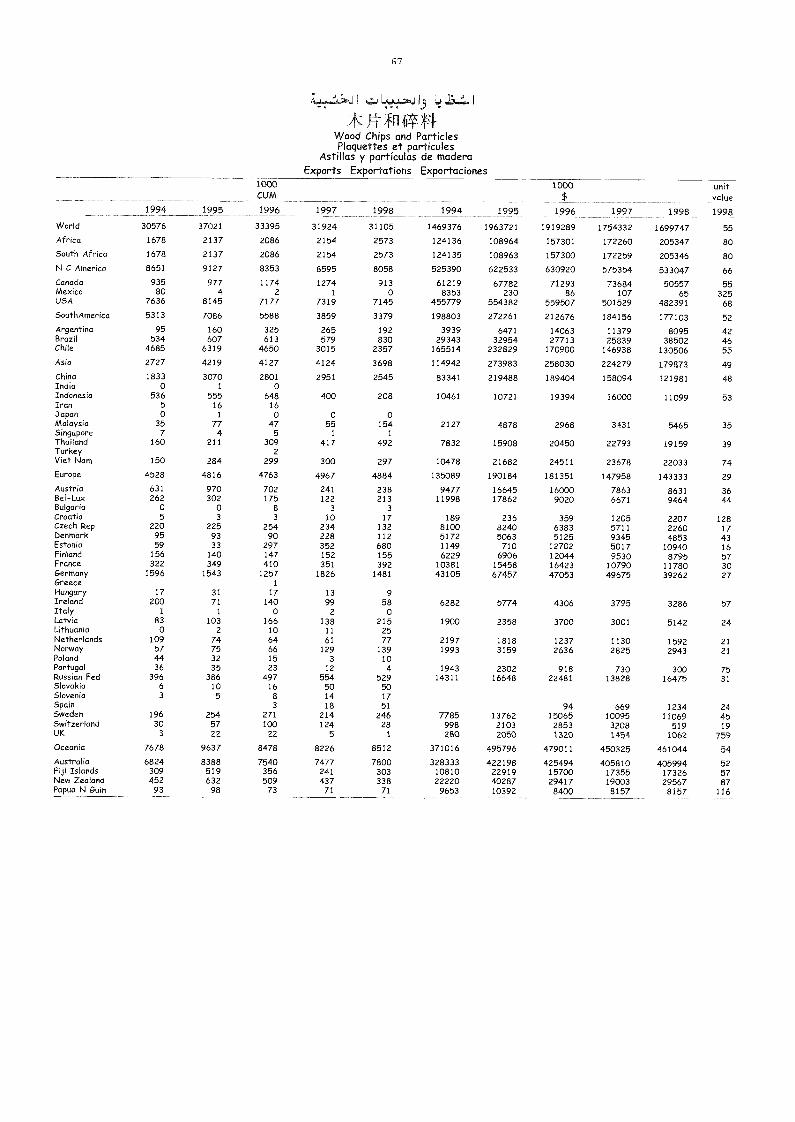
67
1:5\ I
*Pc ff-14xJ'\-Wood Chips and ParticlesPlaquettes et particules
Astillas y partículas de maderaExports Exportations Exportaciones
1994 1995
1000CUM
1996 1997 1998 1994 1995
1000$
1996 1997 1998
unitvalue
1998
World 30576 37021 33395 31924 31105 1469376 1963721 1919289 1754332 1699747 55Africa 1678 2137 2086 2154 2573 124136 108964 157301 172260 205347 80South Africa 1678 2137 2086 2154 2573 124135 108963 157300 172259 205346 80N C America 8651 9127 8353 8595 8058 525390 622533 630920 575354 533047 66Canada 935 977 1174 1274 913 61219 67782 71293 73684 50557 55/Aexico 80 4 2 1 0 8353 230 86 107 65 325USA 7636 8145 7177 7319 7145 455779 554382 559507 501529 482391 68
SouthAmerica 5313 7086 5588 3859 3379 198803 272261 212676 184156 177103 52
Argentina 95 160 325 265 192 3939 6471 14063 11379 8095 42Brazil 534 607 613 579 830 29343 32954 27713 25839 38502 46Chile 4685 6319 4650 3015 2357 165514 232829 170900 146938 130506 55
Asia 2727 4219 4127 4124 3698 114942 273983 258030 224279 179873 49China 1833 3070 2801 2951 2545 83341 219488 189404 158094 121981 48India 0 1 0Indonesia 536 555 648 400 208 10461 10721 19394 16000 11099 53Iran 5 16 16Japan 0 I o o oMalaysia 35 77 47 55 154 2127 4878 2968 3431 5465 35Singapore 7 4 5 1 1
Thailand 160 211 309 417 492 7832 15908 20450 22793 19159 39Turkey 2Viet Nam 150 284 299 300 297 10478 21682 24511 23678 22033 74Europe 4528 4816 4763 4967 4884 135089 190184 181351 147958 143333 29Austria 631 970 702 241 238 9477 16645 16000 7863 8631 36Bel-Lux 262 302 175 122 213 11998 17862 9020 6671 9464 44Bulgaria 0 0 8 3 3Croatia 5 3 3 10 17 189 236 359 1205 2207 128Czech Rep 220 225 254 234 132 8100 8240 6383 5711 2260 17Denmark 95 93 90 228 112 5172 5063 5125 9345 4853 43Estonia 59 33 297 352 680 1149 710 12702 5017 10940 16FiMand 156 140 147 152 155 6229 6906 12044 9530 8795 57France 322 349 410 351 392 10381 15458 16423 10790 11780 30Germany 1596 1543 1257 1826 1481 43105 67457 47053 49675 39262 27Greece 1
Hungary 17 31 17 13 9Ireland 200 71 140 99 58 6282 5774 4306 3795 3286 57Italy 1 1 0 2 0Latvia 83 103 166 138 215 1900 2358 3700 3001 5142 24Lithuania 0 2 10 11 25Netherlands 109 74 64 61 77 2197 1818 1237 1130 1592 21Norway 57 75 66 129 139 1993 3159 2636 2825 2943 21Poland 44 32 15 3 10Portugal 36 35 23 12 4 1943 2302 918 730 300 75Russian Fed 396 386 497 554 529 14311 16648 22481 13828 16475 31Skwakia 6 10 16 50 50Slovenia 3 5 8 14 17Spain 3 18 51 94 669 1234 24Sweden 196 254 271 214 246 7785 13762 15065 10095 11069 45Switzerland 30 57 100 124 28 998 2103 2853 3208 519 19UK 3 ZZ ZZ 5 1 280 2050 1320 1454 1062 759Oceania 7678 9637 8478 8226 8512 371016 495796 479011 450325 461044 54
Australia 6824 8388 7540 7477 7800 328333 422198 425494 405810 405994 52FijiIslands 309 519 356 241 303 10810 22919 15700 17355 17326 57New Zealand 452 632 509 437 338 22220 40287 29417 19003 29567 87Papua N Guin 93 98 73 71 71 9653 10392 8400 8157 8157 116
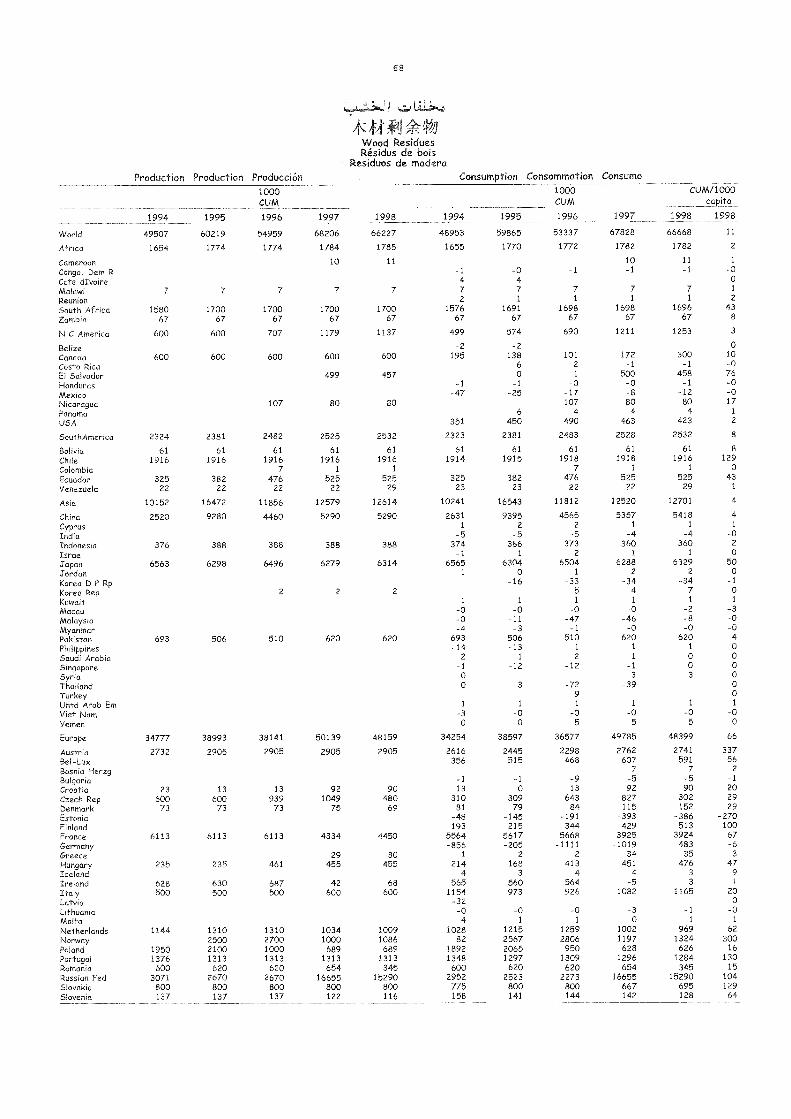
68
Wood ResiduesRésidus de bois
Residuos de modemProduction Production Producción Consunnption Consonmation Consumo
1994 1995
1000CUM
1996 1997 1998 1994 1995
1000CUM
1996 1997
CUAA/1000capita
1998 1998
World 49507 60219 54959 68206 66227 48953 59865 53337 67828 66668 11
Africa 1654 1774 1774 1784 1785 1655 1770 1772 1782 1782 2
Cameroon 10 11 10 11 1
Congo, Dem R -1 -0 -1 -1 -1 -0Cote dIvoire 4 4 0
Malawi 7 7 7 7 7 7 7 7 7 7 1
Reunion 2 1 1 1 1 2
South Africa 1580 1700 1700 1700 1700 1576 1691 1698 1698 1696 43
Zambia 67 67 67 67 67 67 67 67 67 67 8
N C America 600 600 707 1179 1137 499 574 690 1211 1253 3
Belize -2 -2 0
Carrada 600 600 600 600 600 195 138 101 172 300 10
Costa Rica 6 2 -1 -1 -0El Salvador 499 457 0 1 500 458 76
Honduras -1 -1 -0 -0 -1 -0Mexico -47 -25 -17 -8 -12 -0Nicaragua 107 80 80 107 80 80 17
Panama 6 4 4 4 1
USA 351 450 490 463 423 2
SouthAmerica 2324 2381 2482 2525 2532 2323 2381 2483 2528 2532 8
Bolivia 61 61 61 61 61 61 61 61 61 61 8
Chile 1916 1916 1916 1916 1916 1914 1915 1918 1918 1916 129
Colombia 7 1 1 7 1 1 0
Ecuador 325 382 476 525 525 325 382 476 525 525 43
Venezuela 22 22 22 22 29 23 23 22 22 29 1
Asia 10152 16472 11856 12579 12614 10241 16543 11812 12520 12701 4
China 2520 9280 4460 5290 5290 2631 9395 4565 5357 5418 4Cyprus 1 2 2 1 1 1
Indio -5 -5 -5 -4 -4 -0Indonesia 376 388 388 388 388 374 386 373 360 360 2
Israel -1 1 2 1 1 0
Japan 6563 6298 6496 6279 6314 6565 6304 6504 6288 6329 50Jordan 1 0 1 2 2 0
Korea D P Rp -16 -33 -34 -34 -1Korea Rep 2 2 2 5 4 7 0
Kuwait 1 1 1 1 1 1
Macau -0 -0 -0 -0 -2 -3Malaysia -0 -11 -47 -46 -8 -0Myanmar -4 -3 -1 -0 -0 -0Pakistan 693 506 510 620 620 693 506 510 620 620 4
Philippines -14 -13 1 1 1 0Saudi Arabia 2 1 2 1 0 0Singapore -1 -12 -12 -1 0 0
Syria 0 3 3 0
Thailand 0 3 -72 -39 0
Turkey 9 0
Untd Arab Era 1 1 1 1 1 1
Viet Nam -3 -0 -0 -0 -0 -0Yemen 0 0 5 5 5 0
Europe 34777 38993 38141 50139 48159 34254 38597 36577 49785 48399 66
Austria 2732 2905 2905 2905 2905 2616 2445 2298 2762 2741 337Bel-Lux 356 515 468 607 591 56
Bosnia Herzg 7 7 2
Bulgaria -1 -1 -9 -5 -5 -1Croatia 23 13 13 92 90 13 0 13 92 90 20
Czech Rep 600 600 939 1049 480 310 309 643 827 302 29
Denmark 73 73 73 75 69 81 79 84 115 152 29
Estonia -48 -145 -191 -393 -386 -270Finland 193 215 344 429 513 100
France 6113 6113 6113 4334 4450 5564 5617 5668-31(T
3924 67
Germany -856 -205 -1111 -483 -6Greece 29 30 1 2 2 34 35 3
Hungary 235 235 461 455 455 214 168 413 451 476 47
Iceland 4 3 4 4 3 9
Ireland 628 630 687 42 68 565 560 564 -5 3 1
Italy 500 500 500 600 600 1154 973 926 1082 1165 20
Latvia -32 0
Lithuania -0 -0 -0 -3 -1 -0Malta 4 1 1 0 1 1
Netherlands 1144 1310 1310 1034 1009 1028 1215 1259 1002 969 62
Norway 2500 2700 1000 1086 82 2567 2806 1197 1324 300
Poland 1950 2100 1000 689 689 1892 2065 950 628 626 16
Portugal 1376 1313 1313 1313 1313 1348 1297 1309 1296 1284 130Romania 600 620 620 654 345 600 620 620 654 345 15
Russian Fed 3071 2670 2670 16655 15290 2952 2523 2273 16655 15290 104Slovakia 800 800 800 800 800 775 800 800 667 695 129Slovenia 137 137 137 122 116 158 141 144 142 128 64
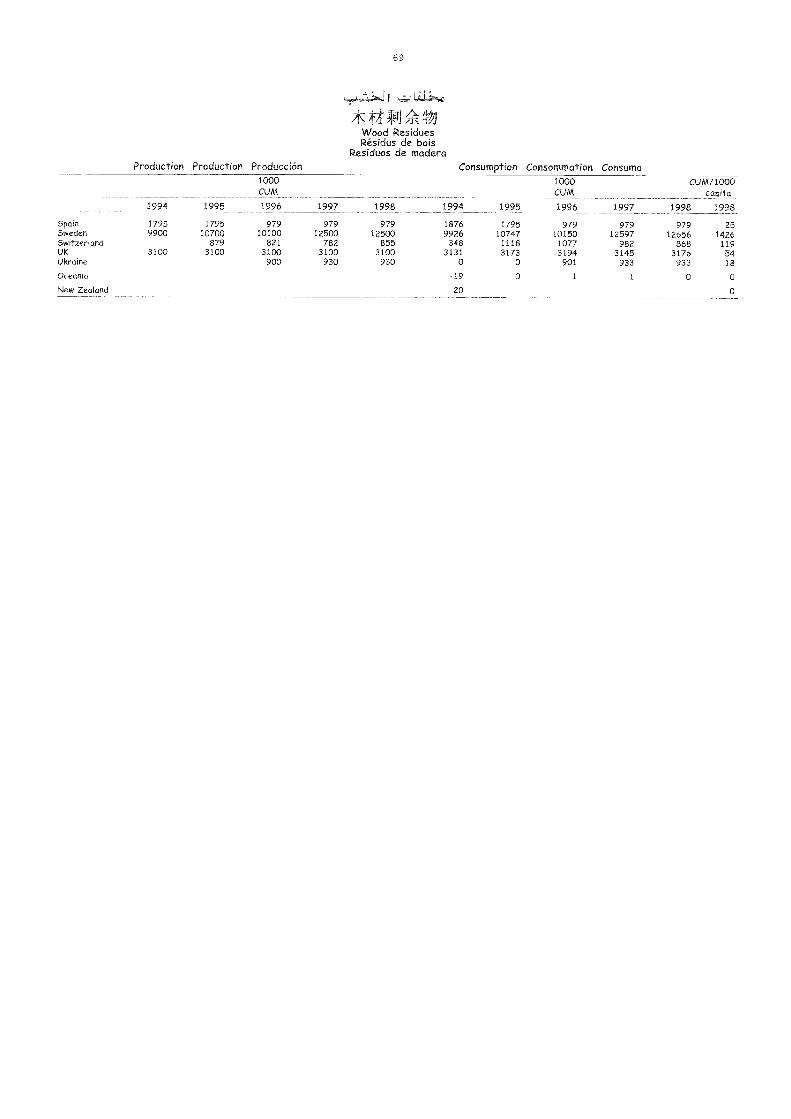
69
Wood ResiduesRésidus de bois
Residuos de maderaProduction Production Producción Consumption Consommation Consumo
1994 1995
1000CUM
1996 1997 1998 1994 1995
1000CUM
1996 1997
CUM/1000capita
1998 1998
Spain 1795 1795 979 979 979 1876 1795 979 979 979 25Sweden 9900 10700 10100 12500 12500 9926 10747 10150 12597 12656 1426Switzerland 879 821 782 855 348 1118 1077 982 868 119UK 3100 3100 3100 3100 3100 3131 3173 3194 3145 3176 54Ukraine 900 930 930 0 0 901 933 933 18
Oceania -19 0 1 1 0 0New Zealand -20 0
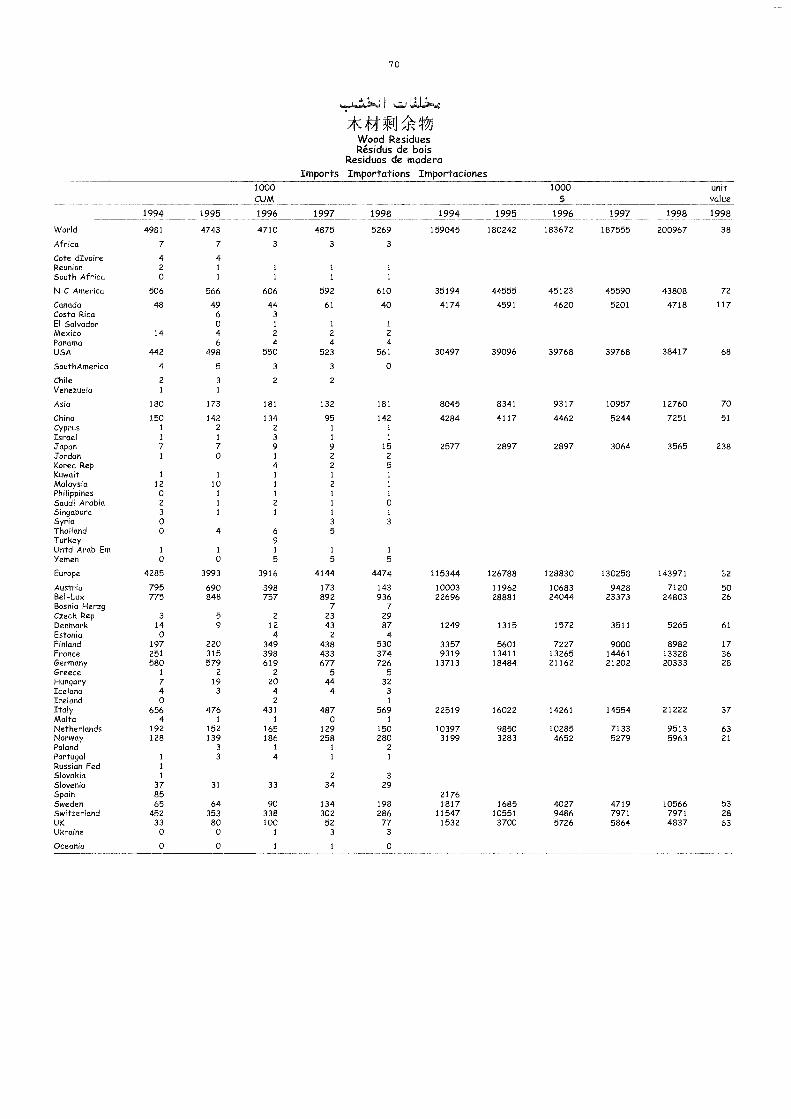
I
Wood ResiduesRésidus de bois
Residuos de maderaImports Importations Importaciones
70
1994 1995
1000CUM
1996 1997 1998 1994 1995
1000$
1996
unitvalue
19981997 1998
World 4981 4743 4710 4875 5269 159045 180242 183672 187555 200967 38
Africa 7 7 3 3 3
Cote dIvoire 4 4Reunion 2 1 1 1 1
South Africa 0 1 1 1 1
N C America 506 566 606 592 610 35194 44555 45123 45590 43808 72
Canada 48 49 44 61 40 4174 4591 4620 5201 4718 117Costa Rica 6 3
El Salvador 0 1 1 1
Mexico 14 4 2 2 2
Panama 6 4 4 4USA 442 498 550 523 561 30497 39096 39768 39768 38417 68
SouthAmerica 4 5 3 3 0
Chile 2 3 2 2
Venezuela 1 1
Asia 180 173 181 132 181 8045 8341 9317 10957 12760 70
China 150 142 134 95 142 4284 4117 4462 5244 7251 51Cyprus 1 2 2 1 1
Israel 1 1 3 1 1
Japan 7 7 9 9 15 2577 2897 2897 3064 3565 238Jordan 1 0 1 2 2Korea Rep 4 2 5Kuwait 1 1 1 1 1
Malaysia 12 10 1 2 1
Philippines 0 1 1 1 1
Saudi Arabia 2 1 2 1 0Singapore 3 1 1 1 1
Syria 0 3 3Thailand 0 4 6 5Turkey 9
Untd Arab Em 1 1 1 1 1
Yemen 0 0 5 5 5
Europe 4285 3993 3916 4144 4474 115344 126788 128830 130258 143971 32
Austria 795 690 398 173 143 10003 11962 10683 9428 7120 50Bel-Lux 775 848 757 892 936 22696 28881 24044 23373 24803 26Bosnia Herzg 7 7Czech Rep 3 5 2 23 29Denmark 14 9 12 43 87 1249 1315 1572 3511 5265 61Estonia 0 4 2 4Finland 197 220 349 438 530 3357 5601 7227 9000 8982 17France 251 315 398 433 374 9319 13411 13265 14461 13328 36Germany 580 579 619 677 726 13713 18484 21162 21202 20333 28Greece 1 2 2 5 5Hungary 7 19 20 44 32Iceland 4 3 4 4 3Ireland 0 2 1
Italy 656 476 431 487 569 22519 16022 14261 14554 21222 37Malta 4 1 1 0 1
Netherlands 192 152 165 129 150 10397 9850 10285 7133 9513 63Norway 128 139 186 258 280 3199 3283 4652 5279 5963 21Poland 3 1 1 2Portugal 1 3 4 1 1
Russian Fed 1
Slovakia 1 2 3Slovenia 37 31 33 34 29Spain 85 2176Sweden 65 64 90 134 198 1817 1685 4027 4719 10566 53Switzerland 452 353 338 302 286 11547 10551 9486 7971 7971 28UK 33 80 100 52 77 1532 3700 5726 5864 4837 63Ukraine 0 0 1 3 3
Oceania O 0 1 1 0
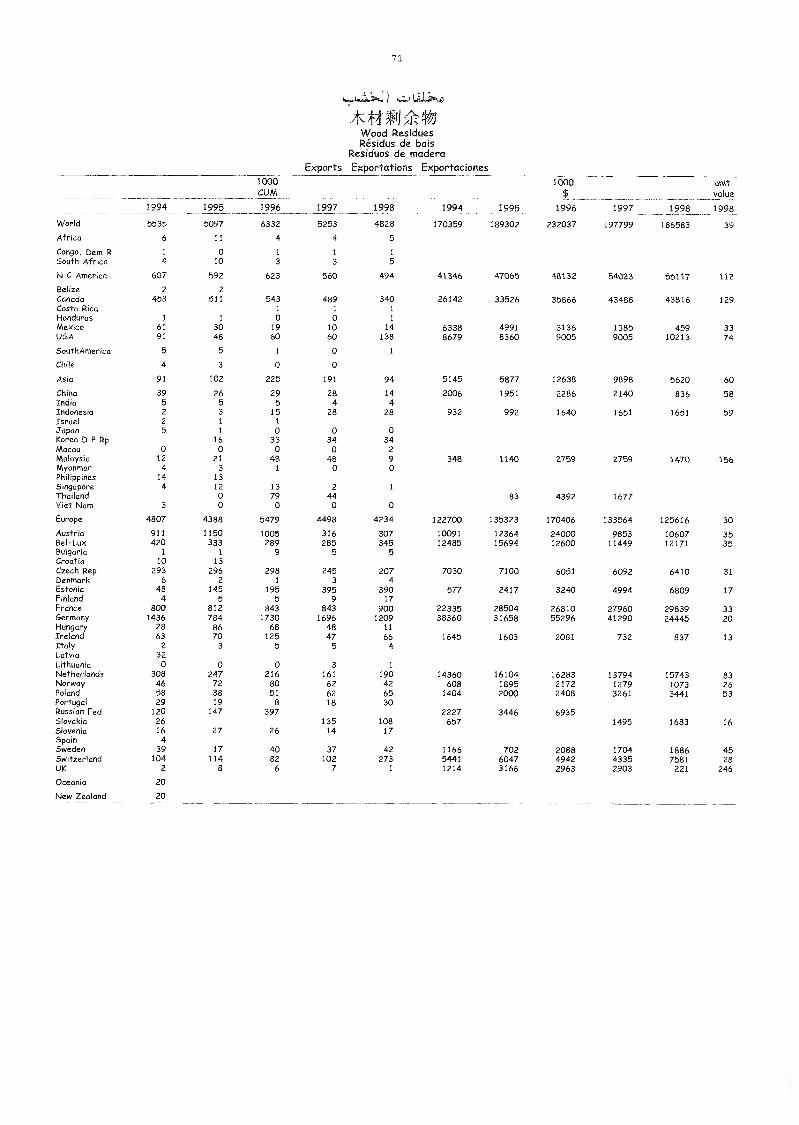
71
*t-4411
LU
fi4Wood ResiduesRésidus de bois
Residuos de maderaExports Exportations Exportaciones
1994 1995
1000CUM
1996 1997 1998 1994 1995
1000$
1996 1997 1998
unitvalue
1998
World 5535 5097 6332 5253 4828 170359 189302 232037 197799 186583 39
Africa 6 11 4 4 5
Congo, Dem R 1 0 1 1 1
South Africa 4 10 3 3 5
N C America 607 592 623 560 494 41346 47065 48132 54023 55117 112
Belize 2 2
Canada 453 511 543 489 340 26142 33526 35866 43488 43816 129Costa Rica 1 1 1
Honduras 1 1 0 0 1
Mexico 61 30 19 10 14 6338 4991 3136 1385 459 33USA 91 48 60 60 138 8679 8360 9005 9005 10213 74
SouthAmerica 5 5 1 0 1
Chile 4 3 0 0
Asia 91 102 225 191 94 5145 5877 12638 9898 5620 60
China 39 26 29 28 14 2006 1951 2286 2140 836 58India 5 5 5 4 4Indonesia 2 3 15 28 28 932 992 1640 1651 1651 59Israel 2 1 1
Japan 5 1 0 0 0Korea D P Rp 16 33 34 34Macau 0 0 0 0 2
Malaysia 12 21 48 48 9 348 1140 2759 2759 1470 156Myanmar 4 3 1 0 0Philippines 14 13Singapore 4 12 13 2 1
Thailand 0 79 44 83 4392 1677Viet Nam 3 0 0 0 0
Europe 4807 4388 5479 4498 4234 122700 135323 170406 133564 125616 30
Austria 911 1150 1005 316 307 10091 12364 24000 9853 10607 35Bel-Lux 420 333 289 285 345 12485 15694 12600 11449 12171 35Bulgaria 1 1 9 5 5Croatia 10 13Czech Rep 293 296 298 245 207 7030 7100 6051 6092 6410 31Denmark 6 2 1 3 4Estonia 48 145 195 395 390 577 2417 3240 4994 6809 17Finland 4 5 5 9 17France 800 812 843 843 900 22335 28504 26810 27960 29839 33Germany 1436 784 1730 1696 1209 38360 31658 55296 41290 24445 20Hungary 28 86 68 48 11Ireland 63 70 125 47 66 1645 1603 2081 732 837 13Italy 2 3 5 5 4Latvia 32Lithuania 0 0 0 3 1
Netherlands 308 247 216 161 190 14360 16104 16283 13794 15743 83Norway 46 72 80 62 42 608 1895 2172 1279 1073 26Poland 58 38 51 62 65 1404 2000 2408 3261 3441 53Portugal 29 19 8 18 30Russian Fed 120 147 397 2227 34-46 6935Slovakia 26 135 108 657 1495 1683 16Slovenia 16 27 26 14 17Spain 4Sweden 39 17 40 37 42 1166 702 2088 1704 1886 45Switzerland 104 114 82 102 273 5441 6047 4942 4335 7581 28UK 2 8 6 7 1 1214 3166 2963 2903 221 246
Oceania 20
New Zealand 20

,.
igIA'sAt. .Atoob
SCIAGES
MADERA ASERRAro
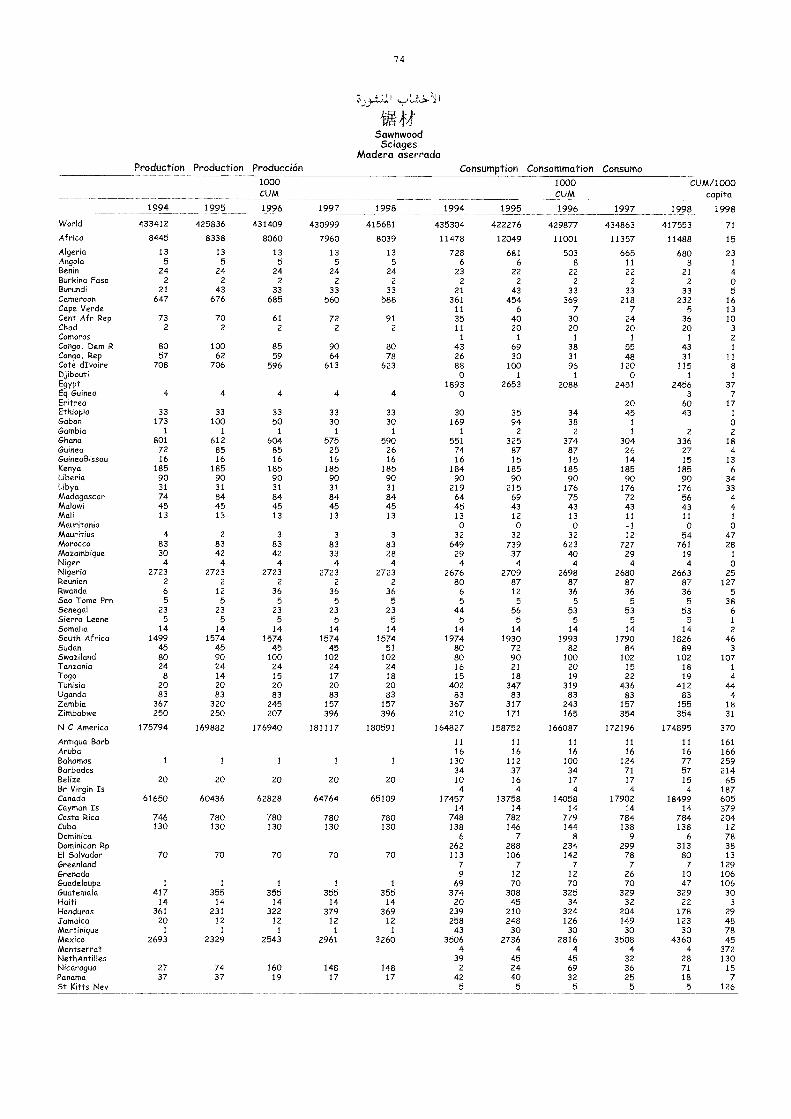
74
Sawnwood5ciages
Madera aserradaProduction Production Producción Consumption Consommation Consumo
1994 1995
1000CUM
1996 1997 1998 1994 1995
1000CUM
1996 1997
CUM/1000capita
1998 1998
World 433412 425836 431409 430999 415681 435304 422276 429877 434863 417553 71
Africa 8445 8338 8060 7960 8039 11478 12049 11001 11357 11488 15
Algeria 13 13 13 13 13 728 681 503 665 680 23Angola 5 5 5 5 5 6 6 8 11 8 1
Benin 24 24 24 24 24 23 22 22 22 21 4Burkina Faso 2 2 2 2 2 2 2 2 2 2 0Burundi 21 43 33 33 33 21 43 33 33 33 5Cameroon 647 676 685 560 588 361 454 369 218 232 16Cape Verde 11 6 7 7 5 13Cent Afr Rep 73 70 61 72 91 35 40 30 24 36 10Chad 2 2 2 2 2 11 20 20 20 20 3
Comoros 1 1 1 1 1 2
Congo, Dam R 80 100 85 90 80 43 69 38 55 43 1
Congo, Rep 57 62 59 64 78 26 30 31 48 31 11Cote dIvoire 708 706 596 613 623 88 100 96 120 115 8Djibouti 0 1 1 0 1 1
Egypt 1893 2653 2088 2451 2456 37Eq Guinea 4 4 4 4 4 0 3 7Eritrea 20 60 17Ethiopia 33 33 33 33 33 30 35 34 45 43 1
Gabon 173 100 50 30 30 169 94 38 1 0Gambia 1 1 1 1 1 1 2 2 1 2 2
Ghana 801 612 604 575 590 551 325 374 304 336 18Guinea 72 85 85 25 26 74 87 87 26 27 4Guinea8issau 16 16 16 16 16 16 15 15 14 15 13Kenya 185 185 185 185 185 184 185 185 185 185 6Liberia 90 90 90 90 90 90 90 90 90 90 34Libya 31 31 31 31 31 219 215 176 176 176 33Madagascar 74 84 84 84 84 64 69 75 72 56 4Malawi 45 45 45 45 45 45 43 43 43 43 4Mali 13 13 13 13 13 13 12 13 11 11 1
Mauritania 0 0 0 -1 0 0Mauritius 4 2 3 3 3 32 32 32 12 54 47Morocco 83 83 83 83 83 649 739 623 727 761 28Mozambique 30 42 42 33 28 29 37 40 29 19 1
Niger 4 4 4 4 4 4 4 4 4 4 0Nigeria 2723 2723 2723 2723 2723 2676 2709 2698 2680 2663 25Reunion 2 2 2 2 2 80 87 87 87 87 127Rwanda 6 12 36 36 36 6 12 36 36 36 5Sao Tome Prn 5 5 5 5 5 5 5 5 5 5 38Senegal 23 23 23 23 23 44 56 53 53 53 6Sierra Leone 5 5 5 5 5 5 5 5 5 5 1
Somalia 14 14 14 14 14 14 14 14 14 14 2South Africa 1499 1574 1574 1574 1574 1974 1930 1993 1790 1826 46Sudan 45 45 45 45 51 80 72 82 84 89 3Swaziland 80 90 100 102 102 80 90 100 102 102 107Tanzania 24 24 24 24 24 16 21 20 15 18 1
Togo 8 14 15 17 18 15 18 19 22 19 4Tunisia 20 20 20 20 20 402 347 319 436 412 44Uganda 83 83 83 83 83 83 83 83 83 83 4Zambia 367 320 245 157 157 367 317 243 157 155 18Zimbabwe 250 250 207 396 396 210 171 165 354 354 31
N C America 175794 169882 176940 181117 180591 164827 158752 166087 172196 174895 370
Antigua Barb 11 11 11 11 11 161Aruba 16 16 16 16 16 166Bahamas 1 1 1 1 1 130 112 100 124 77 259Barbados 34 37 34 71 57 214Belize 20 20 20 20 20 10 16 17 17 15 65Br Virgin Is 4 4 4 4 4 187Canada 61650 60436 62828 64764 65109 17457 13758 14058 17902 18499 605Cayman Is 14 14 14 14 14 379Costa Rica 746 780 780 780 780 748 782 779 784 784 204Cuba 130 130 130 130 130 138 146 144 138 138 12Dominica 6 7 8 9 6 78Dominican Rp 262 288 234 299 313 38El Salvador 70 70 70 70 70 113 106 142 78 80 13Greenland 7 7 7 7 7 129Grenada 9 12 12 26 10 106Guadeloupe 1 1 1 1 1 69 70 70 70 47 106Guatemala 417 355 355 355 355 374 308 325 329 329 30Haiti 14 14 14 14 14 20 45 34 32 22 3
Honduras 361 231 322 379 369 239 210 324 204 178 29Jamaica 20 12 12 12 12 258 248 126 149 123 48Martinique 1 1 1 1 1 43 30 30 30 30 78Mexico 2693 2329 2543 2961 3260 3506 2736 2816 3508 4360 45Montserrat 4 4 4 4 4 372NethAntilles 39 45 45 32 28 130Nicaragua 27 74 160 148 148 2 24 69 36 71 15Panama 37 37 19 17 17 42 40 32 25 18 7St Kitts Nev 5 5 5 5 5 126
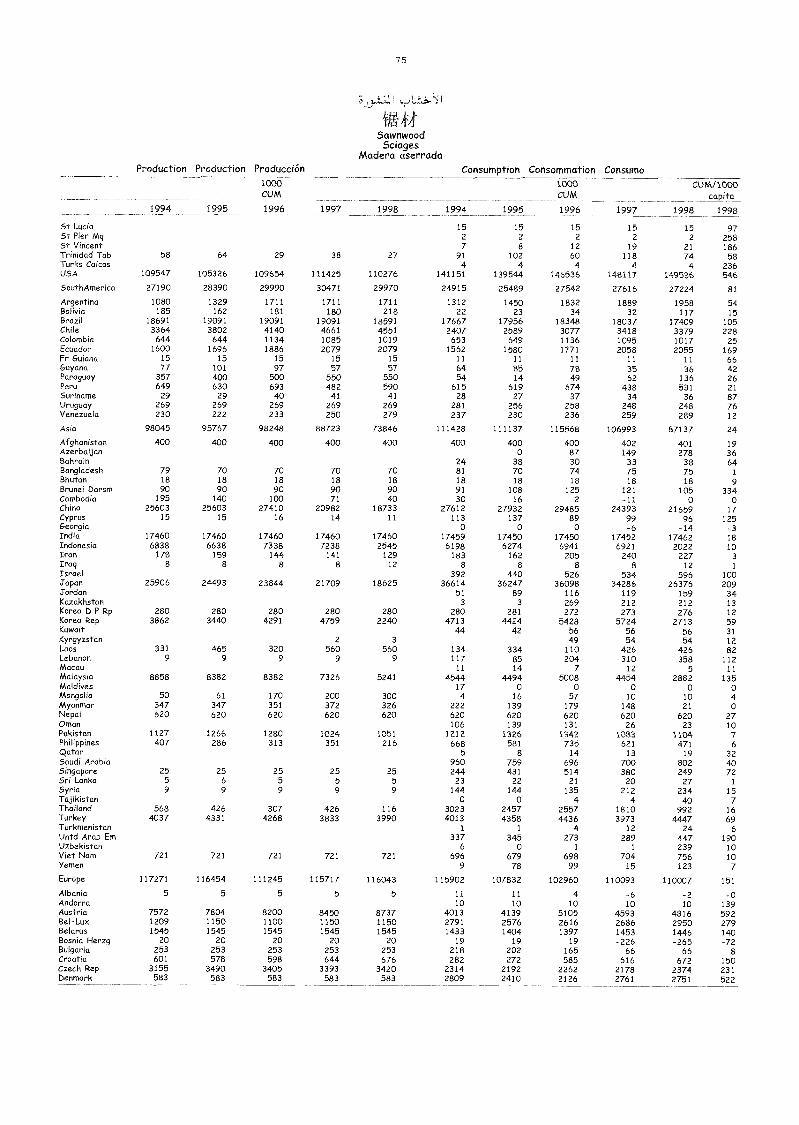
75
5awnwood5ciages
Madera aserradaProduction Production Producción Consumption Consommation Consumo
1000c_
1000 CUM/1000caeita
1994 1995 1996 1997 1998 1994 1995 1996 1997 1998 1998
St Lucia 15 15 15 15 15 97St Pier Mq 2 2 2 2 2 258St Vincent 7 8 12 19 21 186Trinidad lob 58 64 29 38 27 91 102 60 118 74 58Turks Caicos 4 4 4 4 4 236USA 109547 105326 109654 111425 110276 141151 139544 146536 148117 149536 546
SouthAmerica 27190 28390 29990 30471 29970 24915 25489 27542 27616 27224 81
Argentina 1080 1329 1711 1711 1711 1312 1450 1832 1889 1958 54Bolivia 185 162 181 180 218 22 23 34 32 117 15Brazil 18691 19091 19091 19091 18591 17667 17956 18348 18037 17409 105Chile 3364 3802 4140 4661 4551 2407 2589 3077 3418 3379 228Colombia 644 644 1134 1085 1019 653 649 1136 1095 1017 25Ecuador 1600 1696 1886 2079 2079 1562 1580 1771 2058 2055 169Fr Guiana 15 15 15 15 15 11 11 11 11 11 66Guyana 77 101 97 57 57 64 85 78 35 36 42Paraguay 357 400 500 550 550 54 14 49 62 136 26Peru 649 630 693 482 590 615 619 674 438 531 21Suriname 29 29 40 41 41 28 27 37 34 36 87Uruguay 269 269 269 269 269 281 256 258 248 248 76Venezuela 230 222 233 250 279 237 230 236 259 289 12
Asia 98045 95767 98248 88723 73846 111428 111137 115568 106993 87137 24
Afghanistan 400 400 400 400 400 400 400 400 402 401 19Azerbaijan 0 87 149 278 36Bahrain 24 38 30 33 38 64Bangladesh 79 70 70 70 70 81 70 74 75 75 1
Bhutan 18 18 18 18 18 18 18 18 18 18 9Brunei Dorsos 90 90 90 90 90 91 108 125 121 105 334Cambodia 195 140 100 71 40 30 -16 2 -11 0 0China 25603 25603 27410 20982 18733 27612 27932 29485 24393 21659 17Cyprus 15 15 16 14 11 113 137 89 99 96 125Georgia 0 0 0 -6 -14 -3India 17460 17460 17460 17460 17460 17459 17450 17450 17452 17462 18Indonesia 6838 6638 7338 7238 2545 6198 6274 6941 6921 2022 10Iran 178 159 144 141 129 183 162 205 240 227 3Iraq 8 8 8 8 12 8 8 8 8 12 1
Israel 392 440 526 534 596 100Japan 25906 24493 23844 21709 18625 36614 36247 36098 34286 26376 209Jordan 51 89 116 119 159 34Kazakhstan 3 3 269 212 212 13Korea D P Rp 280 280 280 280 280 280 281 272 273 276 12Korea Rep 3862 3440 4291 4759 2240 4713 4424 5428 5724 2713 59Kuwait 44 42 56 56 56 31Kyrgyzstan 2 3 49 54 54 12Laos 331 465 320 560 560 134 334 110 426 426 82Lebanon 9 9 9 9 9 117 85 204 310 358 112Macau II 14 7 12 5 11Malaysia 8858 8382 8382 7326 5241 4544 4494 5008 4454 2882 135Maldives 17 0 0 0 0 0Mongolia 50 61 170 200 300 4 16 57 10 10 4Myanmar 347 347 351 372 326 222 139 179 148 21 0Nepal 620 620 620 620 620 620 620 620 620 620 27Ornan 106 139 131 26 23 10Pakistan 1127 1266 1280 1024 1051 1212 1326 1342 1083 1104 7Philippines 407 286 313 351 216 668 581 735 621 471 6Qatar 5 8 14 13 19 32Saudi Arabia 960 759 696 700 802 40Singapore 25 25 25 25 25 244 431 514 380 249 72Sri Lanka 5 6 5 5 5 23 22 21 20 27 1
Syria 9 9 9 9 9 144 144 135 212 234 15Tajikistan 0 0 4 4 40 7Thailand 568 426 307 426 116 3023 2457 2557 1810 992 16Turkey 4037 4331 4268 3833 3990 4013 4358 4436 3973 4447 69Turkmenistan 1 1 4 12 24 6Untd Arab Em 337 345 273 289 447 190Uzbekistan 6 0 1 1 239 10Viet Nam 721 721 721 721 721 696 679 698 704 756 10Yemen 9 78 99 15 123 7
Europe 117271 116454 111245 115717 116043 115902 107832 102960 110093 110007 151
Albania 5 5 5 5 5 11 11 4 -6 -2 -0Andorra 10 10 10 10 10 139Austria 7572 7804 8200 8450 8737 4013 4139 5105 4593 4816 592Bel-Lux 1209 1150 1100 1150 1150 2791 2576 2616 2686 2950 279Belarus 1545 1545 1545 1545 1545 1433 1404 1397 1453 1446 140Bosnia Herzg 20 20 20 20 20 19 19 19 -226 -265 -72Bulgaria 253 253 253 253 253 218 202 165 66 66 8Croatia 601 578 598 644 676 282 272 585 616 672 150Czech Rep 3155 3490 3405 3393 3420 2314 2192 2262 2178 2374 231Denmark 583 583 583 583 583 2809 2410 2126 2761 2751 522
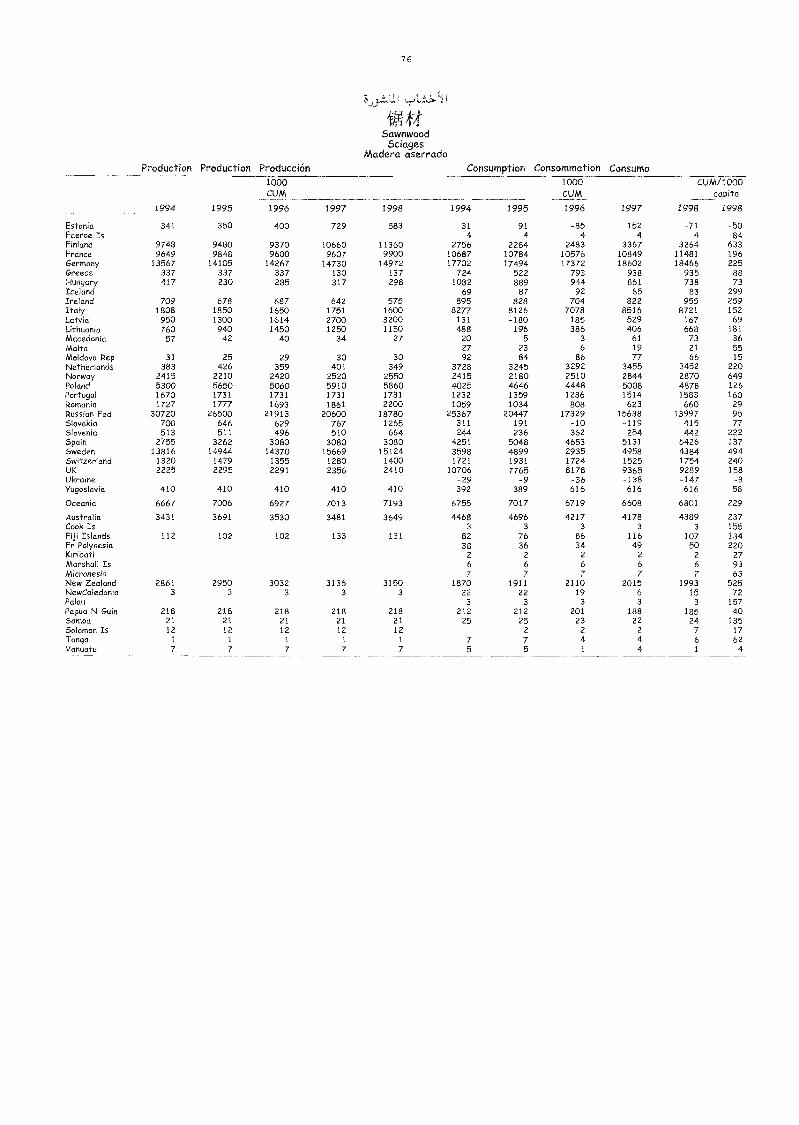
76
ig fit5awnwood
SciagesMadera aserrada
Production Production Produce= Consumption Consommation Consumo
1994 1995
1000CUM
1996 1997 1998 1994 1995
1000CUM
1996 1997
CUM/1000capita
1998 1998
Estonia 341 350 400 729 583 31 91 -85 152 -71 -50Faeroe Is 4 4 4 4 4 84Fland 9748 9480 9370 10660 11360 2756 2284 2483 3367 3264 633France 9649 9848 9600 9607 9900 10687 10784 10576 10849 11481 196Germany 13567 14105 14267 14730 14972 17702 17494 17372 18602 18466 225Greece 337 337 337 130 137 724 522 793 938 935 88Hungary 417 230 285 317 298 1082 889 944 861 738 73Iceland 69 87 92 85 83 299Ireland 709 678 687 642 575 895 828 704 822 955 259Italy 1808 1850 1650 1751 1600 8277 8126 7078 8516 8721 152Latvia 950 1300 1614 2700 3200 131 -180 185 529 167 69Lithuania 760 940 1450 1250 1150 488 196 386 406 668 181Macedonia 57 42 40 34 27 20 5 3 61 73 36Malta 27 23 6 19 21 55Moldova Rep 31 25 29 30 30 92 84 86 77 66 15NetheMands 383 426 359 401 349 3728 3245 3292 3455 3452 220Norway 2415 2210 2420 2520 2550 2415 2180 2510 2844 2870 649Poland 5300 5650 5060 5910 5860 4025 4646 4448 5008 4878 126Portugal 1670 1731 1731 1731 1731 1232 1359 1236 1514 1583 160Romania 1727 1777 1693 1861 2200 1059 1034 808 623 660 29Russian Fed 30720 26500 21913 20600 18780 25367 20447 17329 15638 13997 95Slovakia 700 646 629 767 1265 311 191 -10 -119 415 77Slovea 513 511 496 510 664 244 236 362 254 442 222Spain 2755 3262 3080 3080 3080 4251 5048 4653 5131 5426 137Sweden 13816 14944 14370 15669 15124 3598 4899 2935 4958 4384 494Switzerland 1320 1479 1355 1280 1400 1721 1931 1724 1525 1754 240UK 2225 2295 2291 2356 2410 10706 7765 8178 9365 9289 158Ukraine -29 -9 -36 -138 -147 -3Yugoslavia 410 410 410 410 410 392 389 616 616 616 58
Oceania 6667 7006 6927 7013 7193 6755 7017 6719 6608 6801 229
Australia 3431 3691 3530 3481 3649 4468 4696 4217 4178 4389 237Cook Is 3 3 3 3 3 155FijiIslcmds 112 102 102 133 131 82 76 86 116 107 134Fr Polynesia 38 36 34 49 50 220Kiribati 2 2 2 2 2 27Marshall Is 6 6 6 6 6 93Micronesia 7 7 7 7 7 63New Zealand 2861 2950 3032 3136 3150 1870 1911 2110 2015 1993 525NewCaledonia 3 3 3 3 3 22 22 19 6 15 72Palau 3 3 3 3 3 157Papua N Guin 218 218 218 218 218 212 212 201 188 185 40Samoa 21 21 21 21 21 25 25 23 22 24 135Solomon Is 12 12 12 12 12 2 2 2 7 17Tonga 1 1 1 1 1 7 7 4 4 6 62Vanuatu 7 7 7 7 7 5 5 1 4 1 4
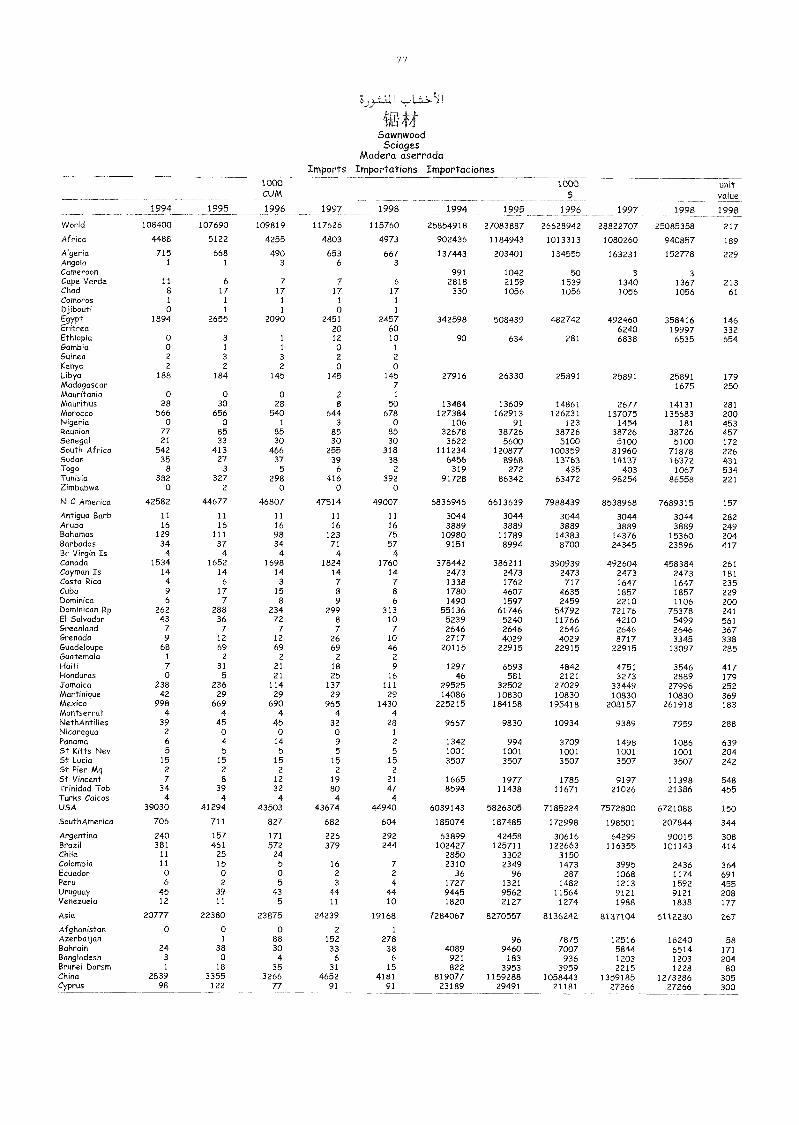
77
VA-fA5awnwoodSciages
Madera aserradaImports Importations Importaciones
1994 1995
1000CUM
1996 1997 1998 1994 1995
1000$
1996 1997 1998
unitvalue
1998
VVorld 108400 107690 109819 117626 115760 25854918 27083887 26628942 28822707 25085358 217Africa 4488 5122 4255 4803 4973 902436 1184943 1013313 1080260 940857 189
AlgeMa 715 668 490 653 667 137443 203401 134555 163231 152778 229Angola 1 1 3 6 3
Cameroon 991 1042 50 3 3Cape Verde 11 6 7 7 6 2818 2159 1539 1340 1367 213Chad 8 17 17 17 17 330 1056 1056 1056 1056 61Comoros 1 1 1 1 1
Djibouti 0 1 1 0 1
Egypt 1894 2655 2090 2451 2457 342598 508439 482742 492460 358416 146Eritrea 20 60 6240 19997 332Ethiopia 0 3 1 12 10 90 634 281 6838 6535 654Gambia 0 1 1 0 1
Guinea 2 3 3 2 2Kenya 2 2 z 0 0Libya 188 184 145 145 145 27916 26330 25891 25891 25891 179Madagascar 7 1675 250Mauritania 0 0 0 2 1
Mauritius 28 30 28 a 50 13484 13609 14861 2677 14131 281Morocco 566 656 540 644 678 127384 162913 126231 137075 135683 200Nigeria 0 0 1 3 0 106 91 123 1454 181 453ReunMn 77 85 85 85 85 32678 38726 38726 38726 38726 457Senegal 21 33 30 30 30 3622 5600 5100 5100 5100 172South AfMca 542 413 466 255 318 111234 120877 100359 81960 71878 226Sudan 35 27 37 39 38 6456 8968 13763 14137 16372 431Togo 8 3 5 6 2 319 272 435 403 1067 534TunisM 382 327 298 416 392 91728 86342 63472 98254 86558 221Zimbabwe 0 2 0 0 0
N C America 42582 44677 46807 47514 49007 6836946 6613639 7988439 8538968 7689315 157
Antigua Barb 11 11 11 11 11 3044 3044 3044 3044 3044 282Aruba 16 16 16 16 16 3889 3889 3889 3889 3889 249Bahamas 129 111 98 123 75 10980 11789 14383 14376 15360 204Barbados 34 37 34 71 57 9151 8994 8700 24345 23896 417Br Vgin Is 4 4 4 4 4Canada 1534 1652 1698 1824 1760 378442 386211 390939 492604 458384 261Cayman Is 14 14 14 14 14 2473 2473 2473 2473 2473 181Costa Rica 4 6 3 7 7 1338 1762 717 1647 1647 235Cuba 9 17 15 8 8 1780 4607 4635 1857 1857 229Dominica 6 7 8 9 6 1490 1597 2459 2210 1106 200DomMManRp 262 288 234 299 313 55136 61746 54792 72176 75378 241El Salvador 43 36 72 8 10 5239 5240 11766 4210 5499 561Greenland 7 7 7 7 7 2646 2646 2646 2646 2646 367Grenada 9 12 12 26 10 2717 4029 4029 8717 3345 338Guadeloupe 68 69 69 69 46 20115 22915 22915 22915 13097 285Guatemala 1 2 2 2 2
Haiti 7 31 21 18 9 1297 6593 4842 4751 3546 417Honduras 0 5 21 25 16 46 581 2121 3273 2889 179Jamaica 238 236 114 137 111 29525 32502 27029 33449 27996 252MartMique 42 29 29 29 29 14086 10830 10830 10830 10830 369MexMo 998 669 690 965 1430 225215 184158 195418 208157 261918 183Montserrat 4 4 4 4 4NethAntiNes 39 45 45 32 28 9667 9830 10934 9389 7959 288Nicaragua 2 0 0 0 1
Panama 6 4 14 9 2 1342 994 3709 1498 1086 639St Kitts Nev 5 5 5 5 5 1001 1001 1001 1001 1001 204St Lucia 15 15 15 15 15 3507 3507 3507 3507 3507 242St Pier Mq 2 2 2 2 2
St Vincent 7 8 12 19 21 1665 1977 1785 9197 11398 548Trinidad Tob 34 39 32 80 47 8594 11438 11671 21026 21386 455Turks Calcos 4 4 4 4 4USA 39030 41294 43503 43674 44940 6039143 5826305 7185224 7572800 6721088 150
SouthAmerica 706 711 827 682 604 185074 187485 172998 198501 207844 344
Argentina 240 157 171 226 292 63899 42458 30616 64299 90015 308Brazd 381 461 572 379 244 102427 125711 122663 116355 101143 414Chile 11 25 24 2850 3302 3150Colombia 11 15 5 16 7 2310 2349 1473 3995 2436 364Ecuador 0 0 0 2 2 36 96 287 1068 1174 691Peru 6 2 5 3 4 1727 1321 1482 1213 1592 455Uruguay 45 39 43 44 44 9445 9562 11564 9121 9121 208Venezuela 12 11 5 11 10 1820 2127 1274 1988 1838 177
Asia 20777 22380 23875 24239 19168 7284067 8270557 8136242 8137104 5112230 267
Afghanistan 0 0 0 2 1
Azerbaijan 1 88 152 278 96 7875 12516 16240 58BahraM 24 38 30 33 38 4089 9460 7007 5844 6514 171Bangladesh 3 0 4 6 6 921 183 936 1203 1203 204Brunei Darsm 1 18 35 31 15 822 3953 3959 2215 1228 80China 2839 3355 3266 4652 4181 819077 1159288 1058443 1359185 1273286 305Cyprus 98 122 77 91 91 23189 29491 21181 27266 27266 300
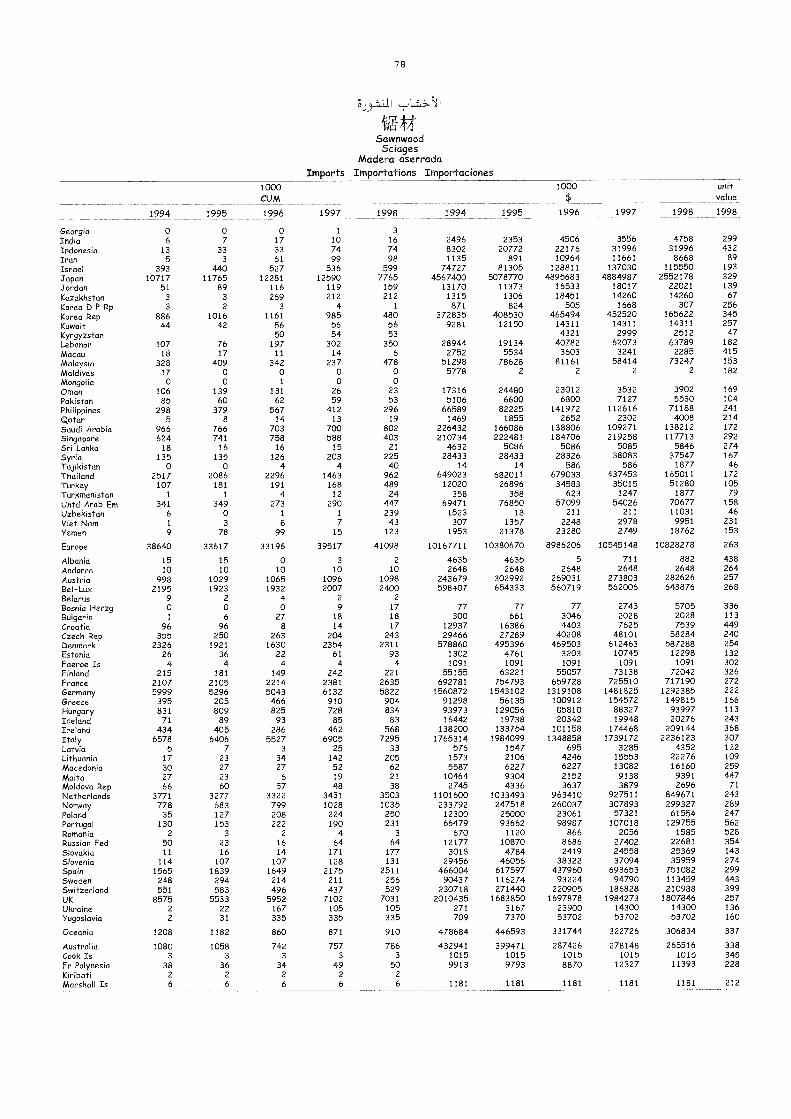
7 8
WiffSawnwood5ciages
Madera aserradaImports Importations Importaciones
1994 1995
1000CUM
1996 1997 1998 1994 1995
1000$
1996 1997 1998
unitvalue
1998
Georgia o o o 1 3
India 6 7 17 10 16 2496 2353 4506 3556 4758 299
Indonesia 13 33 33 74 74 8302 20772 22176 31996 31996 432
Iran 5 3 61 99 98 1135 891 10964 11661 8668 89
Israel 393 440 527 536 599 74727 81305 128811 137030 115550 193
Japan 10717 11765 12281 12590 7765 4567400 5078770 4895683 4884987 2552178 329
Jordan 51 89 116 119 159 13170 11373 16533 18017 22021 139
Kazakhstan 3 3 269 212 212 1315 1306 18451 14260 14260 67Korea D P Rp 3 2 3 4 1 871 824 505 1668 307 256
Korea Rep 886 1016 1161 985 480 372835 408530 465494 452520 165622 345Kuwait 44 42 56 56 56 9281 12150 14311 14311 14311 257Kyrgyzstan 50 54 53 4321 2999 2512 47
Lebanon 107 76 197 302 350 28944 19134 40782 62073 63789 182
Macau 18 17 11 14 6 2752 5534 3603 3241 2285 415
Malaysia 328 409 342 237 478 51298 78628 81161 58414 73247 153
Maldives 17 o o o 0 5778 2 2 2 2 182
Mongolia o o 1 o oOman 106 139 131 26 23 17316 24480 23012 3532 3902 169
Pakistan 85 60 62 59 53 5106 6600 6800 7127 5530 104Philippines 298 379 567 412 296 66589 82225 141972 112616 71188 241
Qatar 5 8 14 13 19 1469 1855 2652 2302 4008 214Saudi Arabia 966 766 703 700 802 226432 166086 138806 109271 138212 172
Singapore 624 741 758 588 403 210734 222481 184706 219258 117713 292
Sri Lanka 18 16 16 15 21 4632 5086 5086 5085 5846 274
Syria 135 135 126 203 225 28433 28433 28326 38083 37547 167
Tajikistan 0 O 4 4 ao 14 14 586 586 1877 46Thailand 2517 2086 2296 1463 962 649023 682011 679033 437453 165011 172
Turkey 107 181 191 168 489 12020 26896 34583 35015 51280 105
Turkmenistan 1 1 4 12 24 358 358 623 1247 1877 79Untd Arab Ern 341 349 273 290 447 69471 76850 57099 54026 70677 158Uzbekistan 6 0 1 1 239 1523 18 211 211 11031 46Viet Nam 1 3 8 7 43 307 1357 2248 2978 9951 231
Yemen 9 78 99 15 123 1953 21378 23280 2749 18762 153
Europe 38640 33617 33196 39517 41098 10167711 10380670 8986206 10545148 10828278 263
Albania 15 15 o 3 2 4635 4635 5 711 882 438Andorra 10 10 10 10 10 2648 2648 2648 2648 2648 264Austria 998 1029 1065 1096 1098 243679 302992 269031 273803 282626 257Bel-Lux 2195 1923 1932 2007 2400 598407 654333 560719 562006 643876 268
Belarus 9 2 4 2 2
Bosnia Herzg o o o 9 17 77 77 77 2743 5705 336
Bulgaria 1 6 27 18 18 300 661 3046 2028 2028 113
Croatia 96 96 8 14 17 12937 16386 4403 7625 7539 449Czech Rep 355 250 263 204 243 29466 27289 40208 48101 58284 240Denmark 2326 1921 1630 2354 2311 578860 495396 469503 612463 587288 254Estonia 26 36 22 61 93 1302 4761 3203 10745 12298 132
Faeroe Is 4 4 4 4 4 1091 1091 1091 1091 1091 302Finland 215 181 149 242 221 55155 63221 55057 73138 72042 326
France 2107 2105 2214 2381 2635 692781 754793 659728 725510 717190 272
Germany 5999 5296 5043 6132 5822 1560872 1543102 1319108 1481825 1292385 222Greece 395 205 466 910 904 91298 56135 100912 154572 149815 166Hungary 831 809 825 728 834 93973 129056 85810 88327 93997 113
Iceland 71 89 93 85 83 16442 19738 20342 19948 20276 243Ireland 434 405 286 462 568 138200 133754 101158 174468 209144 368Italy 6578 6406 5527 6905 7295 1765314 1984099 1348858 1739172 2236123 307Latvia 5 7 3 25 33 576 1547 695 3285 4352 132
Lithuania 17 23 34 142 205 1573 2106 4246 15553 22276 109Macedonia 30 27 27 52 62 5587 6227 6227 13082 16160 259Malta 27 23 6 19 21 10464 9304 2152 9138 9391 447Moldova Rep 66 60 57 48 38 2745 4336 3637 3879 2696 71
Netherlands 3771 3277 3322 3431 3503 1101600 1033493 963410 927511 849671 243Norway 778 683 799 1028 1035 233792 247518 260037 307893 299327 289Poland 35 127 208 224 250 12300 25000 23061 57321 61554 247Portugal 130 153 222 190 231 66479 93662 98987 107018 129755 562Romania 2 3 2 4 3 670 1120 866 2056 1585 528Russian Fed 50 23 16 64 64 12177 10870 8686 27402 22681 354Slovakia 11 16 14 171 177 3018 4784 2419 24558 25369 143Slovenia 114 107 107 128 131 29456 46056 38322 37094 35959 274Spain 1565 1839 1649 2175 2511 466004 617597 437960 693653 751082 299Sweden 248 294 214 211 256 90437 116274 93224 94790 113459 443Switzerland 551 583 496 437 529 230718 271440 220905 186828 210988 399UK 8575 5533 5952 7102 7031 2010435 1683850 1697878 1984273 1807846 257Ukraine 2 22 167 105 105 271 3167 23900 14300 14300 136Yugoslavia 2 31 335 335 335 709 7370 53702 53702 53702 160
Oceania 1208 1182 860 871 910 478684 446593 331744 322726 306834 337
Australia 1080 1058 742 757 786 432941 399471 287426 278148 265516 338Cook Is 3 3 3 3 3 1015 1015 1015 1015 1015 345Fr Polynesia 38 36 34 49 50 9913 9793 8870 12327 11393 228Kiribati 2 2 2 2 2
Marshall Is 6 6 6 6 6 1181 1181 1181 1181 1181 212
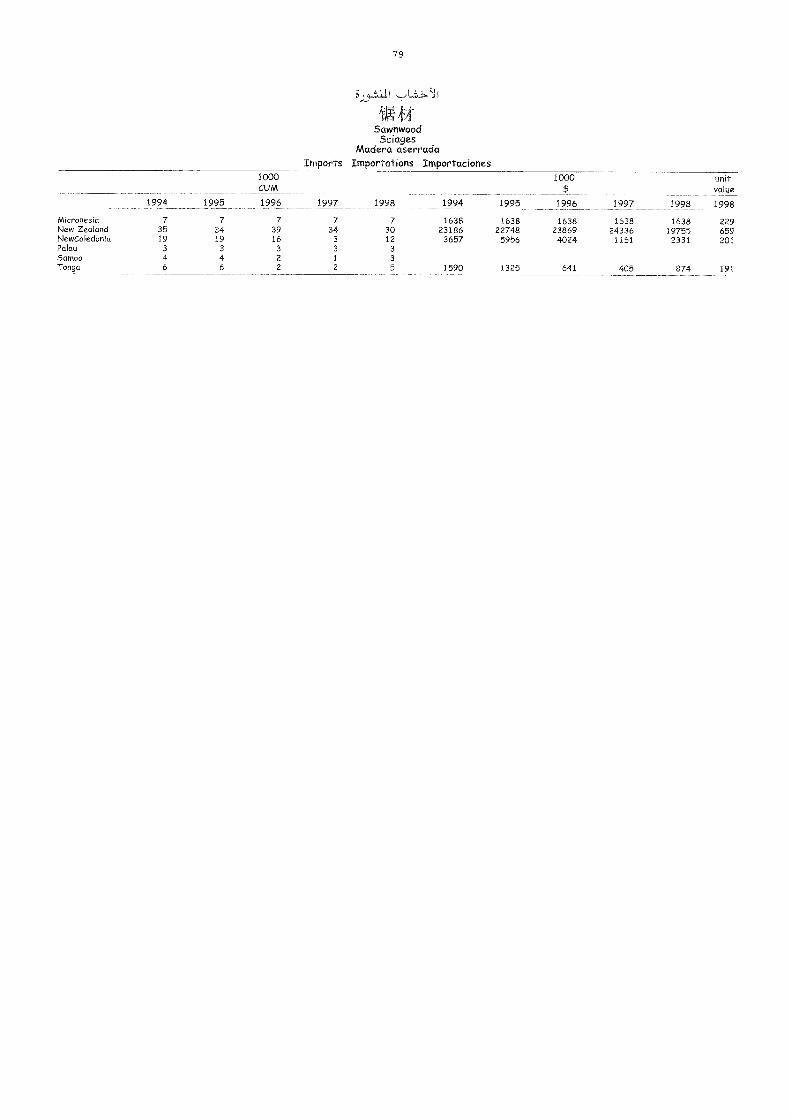
79
5awnwood5ciages
Madera aserradaImports Importations Importaciones
1000CVM
1000 unitvalue
1994 1995 1996 1997 1998 1994 1995 1996 1997 1998 1998
Micronesia 7 7 7 7 7 1638 1638 1638 1638 1638 229New Zealand 35 34 39 34 30 23186 22748 23869 24336 19755 659NewCaledonia 19 19 16 3 12 3657 5956 4024 1151 2331 201Palau 3 3 3 3 3Samoa 4 4 2 1 3Tonga 6 6 2 2 5 1590 1325 641 405 874 191
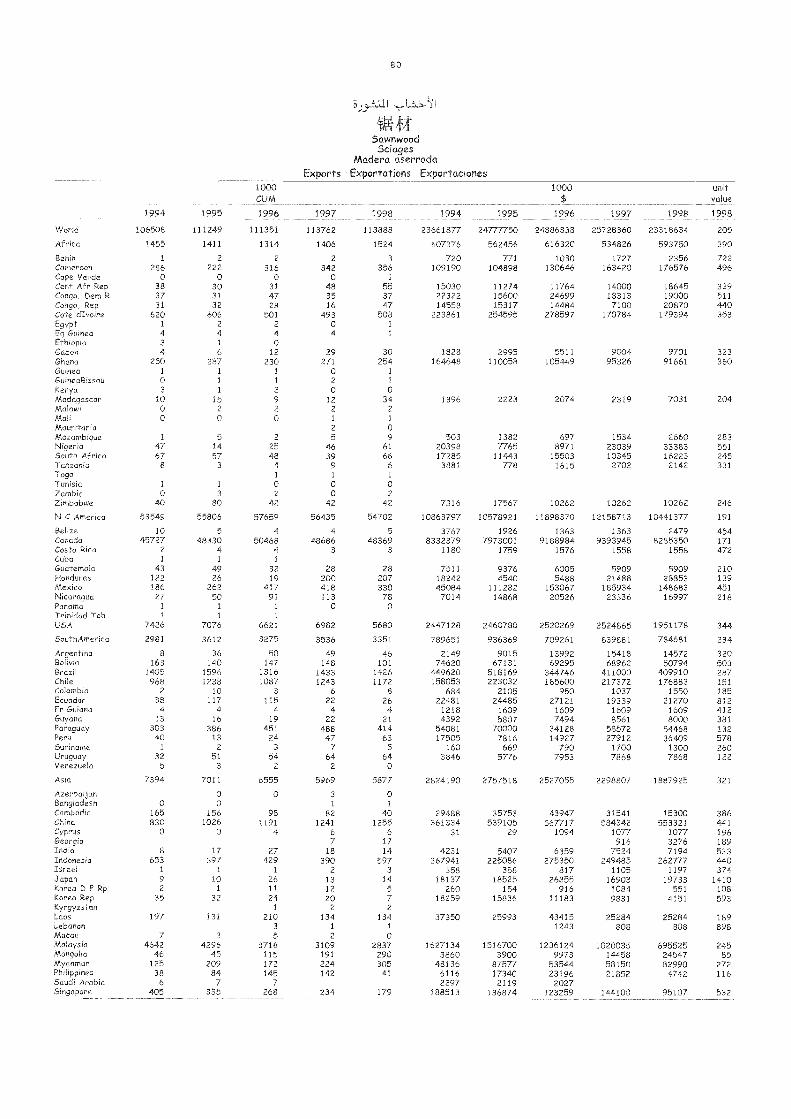
80
isAnwood
ciagcsAAaderu aserrada
Expor s Exportations Exportaciones
1q9-I 1995
1000CUM
1996 1997 1998 1994 1995
1000$
1996 1997 1998
unitvalue
1998
VVorld 106508 111249 111351 113762 113888 23661877 24777750 24886838 25728360 23318634 205
Africa 1455 1411 1314 1406 1524 607376 562456 616320 534826 593750 390
Benin 1 2 2 2 3 720 771 1030 1727 2356 722Cameroon 286 222 316 342 356 109190 104898 130646 163420 176576 496Cape Verde 0 0 0 0 1
Cent Afr Rep 38 30 31 48 55 15030 11274 11764 14000 18645 339Congo, Dem R 37 31 47 35 37 22322 15600 24699 18313 19000 511Congo, Rep 31 32 28 16 47 14558 15317 14484 7100 20870 440Cote dIvoire 620 606 501 493 508 223861 254595 278597 170784 179394 353Egypt 1 2 2 0 1
Eg Guea 4 4 4 4 1
Ethiopia 3 1 0Gabon 4 6 12 29 30 1828 2995 5511 9004 9701 323Ghana 250 287 230 271 254 164648 110058 105449 95326 91661 360Gu:Aec 1 1 1 0 1
C,Ilin_eissau 0 1 1 2 1
;euva 3 1 2 0 0Mcduga:car 10 15 9 12 34 1396 2223 2074 2319 7031 204Malawi 0 2 2 2 2
M4h 0 0 0 1 1
Mauritania 2 0Muoibique 1 5 2 5 9 503 1382 697 1534 2660 283NigLria 47 14 25 46 61 20398 7765 8971 23039 33383 5516Juth Africa 67 57 48 39 66 17285 11443 15503 10345 16223 245Tah,uniu 8 3 4 9 6 3881 778 1615 2702 2142 331Togo 1 1 1
Tunisia 1 1 0 0 0Zambia 0 3 2 0 2
Zimbabwe 40 80 42 42 42 7316 17567 10262 10262 10262 246
N C America 53549 55806 57659 56435 54702 10863797 10578921 11898370 12158713 10441377 191
Belize 10 5 4 4 5 3767 1926 1363 1363 2479 454Canada 45727 48330 50468 48686 48369 8332379 7973001 9188984 9393945 8285350 171Costa Rico 2 4 4 3 3 1180 1759 1576 1558 1558 472Cuba 1 1 1
Guatemala 43 49 32 28 28 7511 9376 6005 5909 5909 210Honduras 122 26 19 200 207 18242 4540 5488 21488 28853 139Mexico 186 262 417 418 330 45084 111282 153067 185934 148683 451Nicaragua 27 50 91 113 78 7014 14868 20526 23336 16997 218Panama 1 1 1 0 0Trinidad Tob 1 1 1
USA 7426 7076 6621 6982 5680 2447128 2460780 2520269 2524865 1951178 344
SouthAmerica 2981 3612 3275 3536 3351 789651 936369 709261 839881 784681 234
Argentina a 36 50 49 46 2149 9015 13992 15418 14572 320Bolivia 163 140 147 148 101 74620 67131 69295 68962 50794 503Brazd 1405 1596 1316 1433 1426 449620 518169 344746 411000 409910 287Chile 968 1238 1087 1243 1172 158053 223032 185600 217372 176883 151Colombia 2 10 3 6 8 684 2105 950 1037 1550 185Ecuador 38 117 115 22 26 22481 24485 27121 19339 21270 812Fr Guiana 4 4 4 4 4 1218 1609 1609 1609 1609 412Guyana 13 16 19 22 21 4392 5807 7494 8561 8000 381Paraguay 303 386 451 488 414 54081 70000 34128 58572 54468 132Peru 40 13 24 47 63 17505 7816 14927 27912 36409 578Suriname 1 2 3 7 5 160 669 790 1700 1300 260Uruguay 32 51 54 64 64 3846 5776 7953 7868 7868 122Venezuela 5 3 2 2 0
Asia 7394 7011 6555 5969 5877 2824190 2757518 2527055 2298807 1887925 321
Azerbaijan 0 0 3 0Bangladesh 0 0 1 1
Cumbodia 165 156 98 82 40 29488 35753 43947 31541 15300 386China 830 1026 1191 1241 1255 361334 539105 567717 584342 553321 441,-; p u,Cc,i'gia
0 0 4 6
76
1731 29 1094 1077
91610773276
196189
lichu 8 17 27 18 14 4231 5407 6359 7524 7194 533Endoncsia 653 397 429 390 597 367941 225086 275350 249485 262777 440Israel 1 1 1 2 3 358 358 817 1105 1197 374Jupuh 9 10 26 13 14 18137 18525 26855 16903 19733 1410Korea O P Rp 2 1 11 12 5 260 154 916 1084 551 108Korea Rep 35 32 24 20 7 18259 15836 11183 9831 4151 593Kyrgyzstan 1 2 2
Laos 197 131 210 134 134 37350 25993 43415 25284 25284 189Lebanon 3 1 1 1243 808 808 898Macau 7 3 5 2 0Malaysia 4642 4296 3716 3109 2837 1627134 1516700 1236124 1020035 695525 245Mongolia 46 45 115 191 290 3860 3900 9973 14458 24547 85Myanmar 125 209 172 224 305 48136 87577 53544 58150 82990 272Philippines 38 84 145 142 41 6116 17340 23196 21852 4742 116Saudi Arabia 6 7 7 2297 2119 2027Singapore 405 335 268 234 179 188513 136874 123259 144100 95107 532
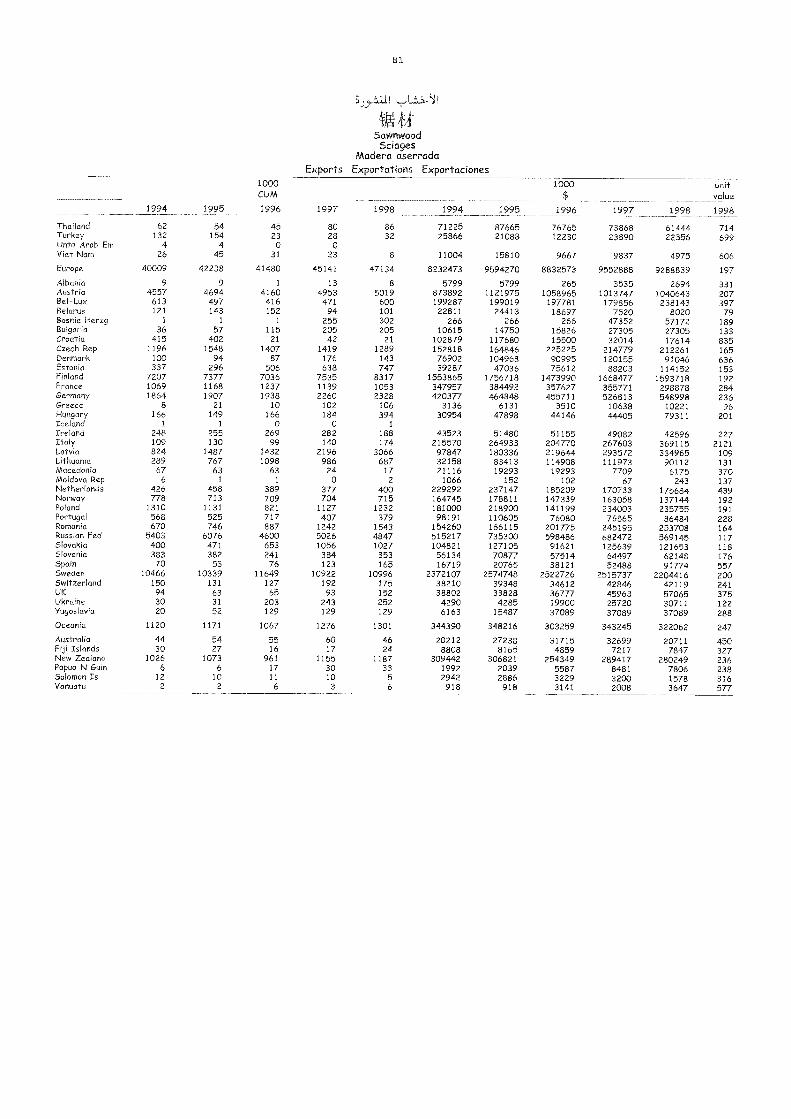
81
Sawnwood5ciages
Madera aserradaExports Exportations Exportaciones
1994 1995
1000CUM
1996 1997 1998 1994 1995
1000
$_
1996 1997 1998
unitvalue
1998
Thailand 62 54 45 80 86 71225 87665 76765 73868 61444 714Turkey 132 154 23 28 32 25866 21088 12230 23890 22356 699Untd Arab Em 4 4 0 0Viet Nam 26 45 31 23 s 11004 15810 9667 9837 4975 606
Europe 40009 42238 41480 45141 47134 8232473 9594270 8832573 9552888 9288839 197
Albania 9 9 1 13 8 5799 5799 265 3535 2694 331Austria 4557 4694 4160 4953 5019 873892 1121975 1058965 1013747 1040643 207Bel-Lux 613 497 416 471 600 199287 199019 197781 179856 238143 397Belarus 121 143 152 94 101 22811 24413 18697 7520 8020 79Bosnia Herzg 1 1 1 255 302 266 266 266 47352 57172 189Bulgaria 36 57 115 205 205 10615 14750 15826 27305 27305 133Croatia 415 402 21 42 21 102879 117680 15500 32014 17614 835Czech Rep 1196 1548 1407 1419 1289 152818 164846 225225 214779 212261 165Denmark 100 94 87 176 143 76902 104968 90995 120155 91046 636Estonia 337 296 506 638 747 39287 47036 75612 88203 114152 153Finland 7207 7377 7036 7535 8317 1553865 1756718 1473990 1668477 1593718 192France 1069 1168 1237 1139 1053 347957 384492 357627 355771 298878 284Germany 1864 1907 1938 2260 2328 420377 464848 455711 526813 548998 236Greece 8 21 10 102 106 3136 6131 3510 10638 10221 96Hungary 166 149 166 184 394 30954 47898 44146 41405 79311 201Iceland 1 1 o o 1
Ireland 248 255 269 282 188 43523 51480 51155 49082 42596 227Italy 109 130 99 140 174 215570 264933 204770 267603 369115 2121Latvia 824 1487 1432 2196 3066 97847 180336 219644 293572 334965 109Lithuania 289 767 1098 986 687 32158 83413 114908 111973 90112 131Macedonia 67 63 63 24 17 21116 19293 19293 7709 6175 370Moldova Rep 6 1 1 0 2 1066 152 102 67 243 137Netherlands 426 458 389 377 400 229292 237147 185209 170733 175684 439Norway 778 713 709 704 715 164745 178811 147339 163058 137144 192Poland 1310 1131 821 1127 1232 181000 218900 141199 234003 235755 191Portugal 568 525 717 407 379 98191 110605 76080 76565 86484 228Romania 670 746 887 1242 1543 154260 166115 201775 245195 253708 164Russian Fed 5403 6076 4600 5026 4847 515217 735300 598486 682472 569145 117Slovakia 400 471 653 1056 1027 104821 127105 91621 125639 121653 118Slovenia 383 382 241 384 353 56134 70877 57514 64497 62148 176Spain 70 53 76 123 165 16719 20765 38121 52488 91774 557Sweden 10466 10339 11649 10922 10996 2372107 2574748 2522726 2515737 2204416 200Switzerland 150 131 127 192 175 38210 39348 34612 42846 42119 241UK 94 63 65 93 152 38802 33828 36777 45963 57065 375Ukraine 30 31 203 243 252 4290 4285 19900 25720 30711 122Yugoslavia 20 52 129 129 129 6163 15487 37089 37089 37089 288
Oceania 1120 1171 1067 1276 1301 344390 348216 303259 343245 322062 247
Australia 4-4 54 55 60 46 20212 27238 31715 32699 20711 450Fiji Islands 30 27 16 17 24 8808 8165 4859 7217 7847 327New Zealand 1026 1073 961 1155 1187 309442 306821 254349 289417 280249 236Papua N Guin 6 6 17 30 33 1992 2039 5587 8481 7806 238Solomon Is 12 10 11 10 5 2942 2886 3229 3200 1578 316Vanuatu 2 2 6 3 6 918 918 3141 2008 3647 577
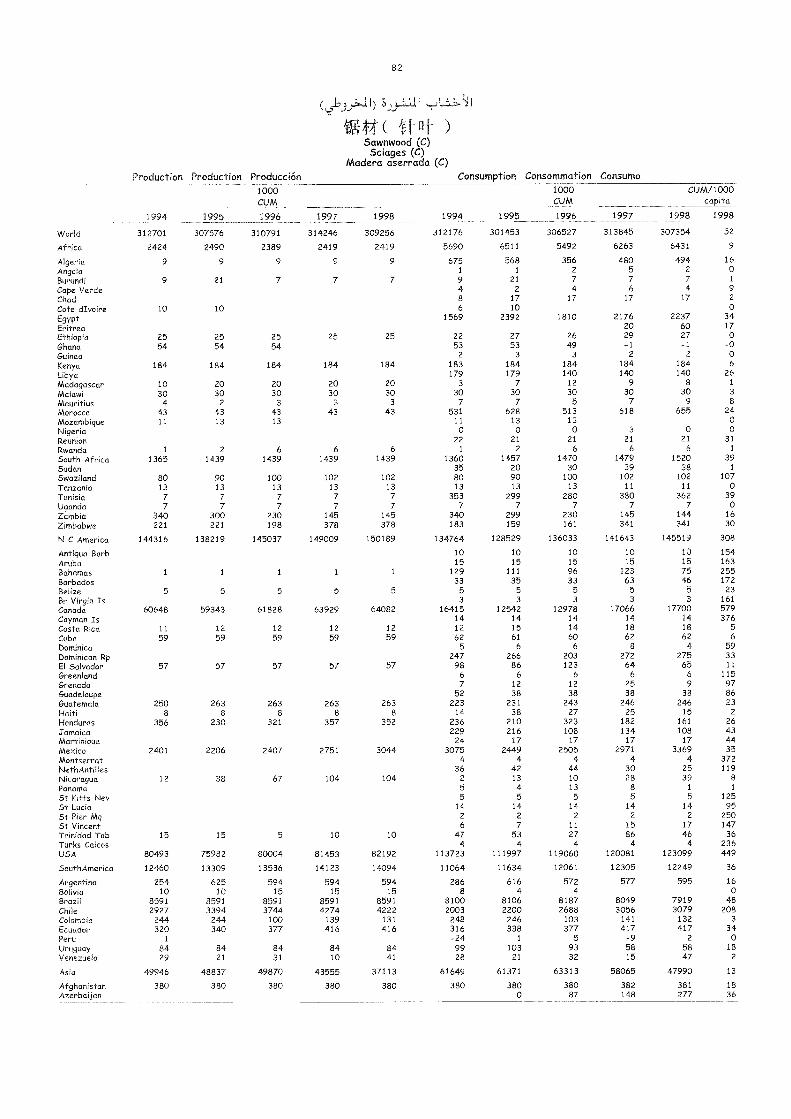
f( )
82
Sawnwood (C)Sciages (C)
Madera aserrada (C)Production Production Producción Consumption Consommation Consumo
1994 1995
1000CUM
1996 1997 1998 1994 1995
1000CUM
1996 1997
CUM/1000capita
1998 1998
World 312701 307576 310791 314246 309256 312176 301453 306527 313845 307354 52
Africa 2424 2490 2389 2419 2419 5690 6511 5492 6263 6431 9
Algeria 9 9 9 9 9 675 568 356 480 494 16
Angola 1 1 2 5 2 0
Burundi 9 21 7 7 7 9 21 7 7 7 1
Cape Verde 4 2 4 6 4 9
Chad 8 17 17 17 17 2
Cote dIvoire 10 10 6 10 0
Egypt 1569 2392 1810 2176 2237 34
Eritrea 20 60 17
Ethiopia 25 25 25 25 25 22 27 26 29 27 0
Ghana 54 54 54 53 53 49 -1 -1 -0Guinea 2 3 3 2 2 0Kenya 184 184 184 184 184 183 184 184 184 184 6
Libya 179 179 140 140 140 26
Madagascar 10 20 20 20 20 3 7 12 9 8 1
Malawi 30 30 30 30 30 30 30 30 30 30 3
Mauritius 4 2 3 3 3 7 7 5 7 9 8
Morocco 43 43 43 43 43 531 628 513 618 655 24Mozambique 11 13 13 11 13 13 0Nigeria 0 0 0 3 0 0Reunion 22 21 21 21 21 31
Rwanda 1 2 6 6 6 1 2 6 6 6 1
South Africa 1365 1439 1439 1439 1439 1360 1457 1470 1479 1520 39Sudan 35 20 30 39 38 1
Swaziland 80 90 100 102 102 80 90 100 102 102 107Tanzania 13 13 13 13 13 13 13 13 11 11 0Tunisia 7 7 7 7 7 353 299 280 380 362 39Uganda 7 7 7 7 7 7 7 7 7 7 0Zambia 340 300 230 145 145 340 299 230 145 144 16
Zimbabwe 221 221 198 378 378 183 159 161 341 341 30
N C America 144316 138219 145037 149009 150189 134764 128529 136033 141643 145519 308
Antigua Barb 10 10 10 10 10 154
Aruba 15 15 15 15 15 163Bahamas 1 i 1 1 1 129 111 96 123 75 255Barbados 33 35 33 63 46 172
Belize 5 5 5 5 5 5 5 5 5 5 23
Br Virgin Is 3 3 3 3 3 161
Canada 60648 59343 61828 63929 64082 16415 12542 12978 17066 17700 579Cayman Is 14 14 14 14 14 376Costa Rica 11 12 12 12 12 12 15 14 18 18 5
Cuba 59 59 59 59 59 62 61 60 62 62 6
Dominica 5 6 6 8 4 59
Dominican Rp 247 266 203 272 275 33
El Salvador 57 57 57 57 57 98 86 123 64 65 11
Greenland 6 6 6 6 6 115
Grenada 7 12 12 25 9 97Guadeloupe 52 38 38 38 38 86
Guatemala 250 263 263 263 263 223 231 243 246 246 23
Haiti 8 8 8 8 8 14 38 27 25 15 2
Honduras 356 230 321 357 352 236 210 323 182 161 26Jamaica 229 216 108 134 108 43Martinique 24 17 17 17 17 44Mexico 2401 2206 2407 2751 3044 3075 2449 2505 2971 3369 35
Montserrat 4 4 4 4 4 372NethAntilles 36 42 44 30 25 119
Nicaragua 12 38 67 104 104 2 13 10 28 39 8
Panama 5 4 13 8 1 1
St Kitts Nev 5 5 5 5 5 125St Lucia 14 14 14 14 14 95St Pier Mq 2 2 2 2 2 250St Vincent 6 7 11 15 17 147Trinidad Tob 15 15 5 10 10 47 53 27 86 46 36Turks Calcos 4 4 4 4 4 236USA 80493 75982 80004 81453 82192 113723 111997 119060 120081 123099 449
SouthArnerica 12460 13309 13536 14123 14094 11064 11634 12061 12305 12249 36
Argentina 254 625 594 594 594 286 616 572 577 595 16Bolivia 10 10 15 15 15 8 4 4 0Brazil 8591 8591 8591 8591 8591 8100 8106 8187 8049 7919 48Chile 2927 3394 3744 4274 4222 2003 2200 2688 3056 3079 208Colombia 244 244 100 139 131 248 246 103 141 132 3
Ecuador 320 340 377 416 416 316 338 377 417 417 34Peru 1 -24 1 5 -9 2 0Uruguay 84 84 84 84 84 99 103 93 58 58 18
Venezuela 29 21 31 10 41 28 21 32 15 47 2
Asia 49946 48837 49870 43555 37113 61649 61371 63313 58065 47990 13
Afghanistan 380 380 380 380 380 380 380 380 382 381 18Azerbaijan 0 87 148 277 36
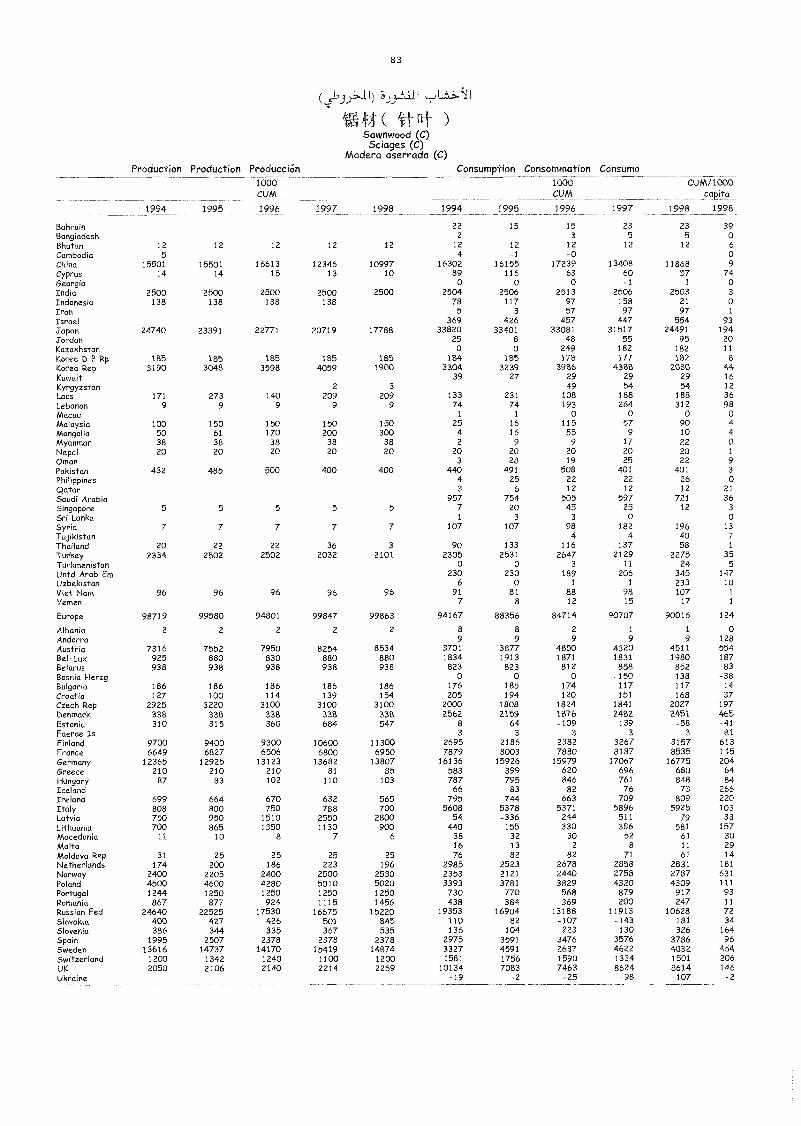
83
)Sawnwood (C)5ciages (C)
Madera aserrada (C)Production Production Producción Consumption Consommation Consumo
1994 1995 1996 1997 1998 1994 1995 1996 1997 1998 1998
1000 1000 CU M/10CY3
CUM CUM capita
Bahrain 22 15 15 23 23 39Bangladesh 2 3 5 5 0Bhutan 12 12 12 12 12 12 12 12 12 12 6
Cambodia 5 4 -1 -0 0China 15501 15501 16613 12346 10997 16302 16155 17239 13408 11868 9
GeorgiaCyprus 14 14 15 13 10 89 116 63 60 57 74
O o o -1 1 oIndia 2500 2500 2500 2500 2500 2504 2506 2513 2506 2503 3
Indonesia 138 138 138 138 78 117 97 158 21 oIran 5 3 57 97 97 1
Israel 369 426 457 447 554 93Japan 24740 23391 22771 20719 17788 33820 33401 33081 31517 24491 194Jordan 25 8 48 55 95 20Kazakhstan 0 o 249 182 182 11
Korea D P Rp 185 185 185 185 185 184 185 178 177 182 8Korea Rep 3190 3048 3598 4059 1900 3304 3239 3986 4368 2030 44Kuwait 39 27 29 29 29 16Kyrgyzstan 2 3 49 54 54 12
Laos 171 273 140 209 209 133 231 108 188 188 36Lebanon 9 9 9 9 9 74 74 193 264 312 98Macau 1 1 o o o oMalaysia 100 150 150 150 150 25 16 115 57 90 4Mongolia 50 61 170 ZOO 300 4 16 55 9 10 4Myanmar 38 38 38 38 38 2 9 9 17 22 oNepal 20 20 20 20 20 20 20 20 20 20 1
Oman 3 28 19 25 22 9
Pakistan 432 485 500 400 400 440 491 508 401 401 3
Philippines 4 25 22 22 26 oQatar 3 6 12 12 12 21
Saudi Arabia 957 754 505 597 721 36Singapore 5 5 5 5 5 7 20 45 25 12 3
Sri Lanka 1 3 3 o 0Syria 7 7 7 7 7 107 107 98 182 196 13Tajikistan 4 4 40 7Thailand 20 22 22 36 3 90 133 116 137 58 1
Turkey 2334 2502 2502 2032 2101 2305 2531 2647 2129 2275 35Turkmenistan o 0 3 11 24 5
Untd Arab Em 230 230 189 206 345 147Uzbekistan 6 0 1 1 233 10Viet Nam 96 96 96 96 96 91 81 88 98 107 1
Yemen 7 8 12 15 17 1
Europe 98719 99580 94801 99847 99863 94167 88356 84714 90707 90016 124
Albania 2 2 2 2 2 8 8 2 1 1 0Andorra 9 9 9 9 9 128Austria 7316 7552 7950 8254 8534 3701 3877 4850 4320 4511 554Bel -Lux 925 880 830 880 880 1834 1913 1871 1831 1980 187Belarus 938 938 938 938 938 823 823 812 858 852 83Bosnia Herzg o o o -150 -138 -38Bulgaria 186 186 186 186 186 176 185 174 117 117 14Croatia 127 100 114 139 154 205 194 120 151 168 37Czech Rep 2925 3220 3100 3100 3100 2000 1808 1824 1841 2027 197Denmark 338 338 338 338 338 2562 2159 1876 2482 2451 455Estonia 310 315 360 684 547 8 64 -109 139 -58 -41Faeroe Is 3 3 3 3 3 atFinland 9700 9400 9300 10600 11300 2695 2186 2382 3267 3157 613France 6649 6827 6506 6800 6950 7879 8003 7880 8187 8535 145Germany 12365 12925 13123 13682 13807 16136 15926 15979 17067 16775 204Greece 210 210 210 81 85 583 399 620 696 680 64Hungary 87 83 102 110 103 787 795 846 761 848 84Iceland 66 83 82 76 73 266Ireland 699 664 670 632 565 795 744 663 709 809 220Italy 808 800 750 788 700 5608 5378 5371 5896 5925 103
Latvia 750 950 1510 2550 2800 54 -336 244 511 79 33Lithuania 700 865 1350 1130 900 440 155 330 386 581 157Macedonia 11 10 8 7 6 38 32 30 52 61 30Malta 16 13 2 8 11 29Moldova Rep 31 25 25 25 25 76 82 82 71 61 14
Netherlands 174 200 186 223 196 2985 2523 2678 2858 2831 181
Norway 2400 2205 2400 2500 2530 2353 2121 2440 2758 2787 631Poland 4500 4600 4280 5010 5020 3393 3781 3829 4320 4309 111
Portugal 1244 1250 1250 1250 1250 730 770 568 879 917 93Romania 867 877 924 1115 1456 438 384 369 200 247 11
Russian Fed 24640 22525 17530 16675 15220 19353 16904 13188 11913 10628 72Slovakia 400 427 426 501 845 110 82 -107 -143 181 34Slovenia 386 344 335 367 535 136 104 223 130 326 164Spain 1995 2507 2378 2378 2378 2975 3591 3476 3576 3786 96Sweden 13616 14737 14170 15419 14874 3327 4591 2637 4622 4032 454Switzerland 1200 1342 1240 1100 1200 1581 1756 1590 1334 1501 206UK 2050 2106 2140 2214 2269 10134 7083 7463 8624 8614 146Ukraine -19 -2 -25 -98 -107 -2
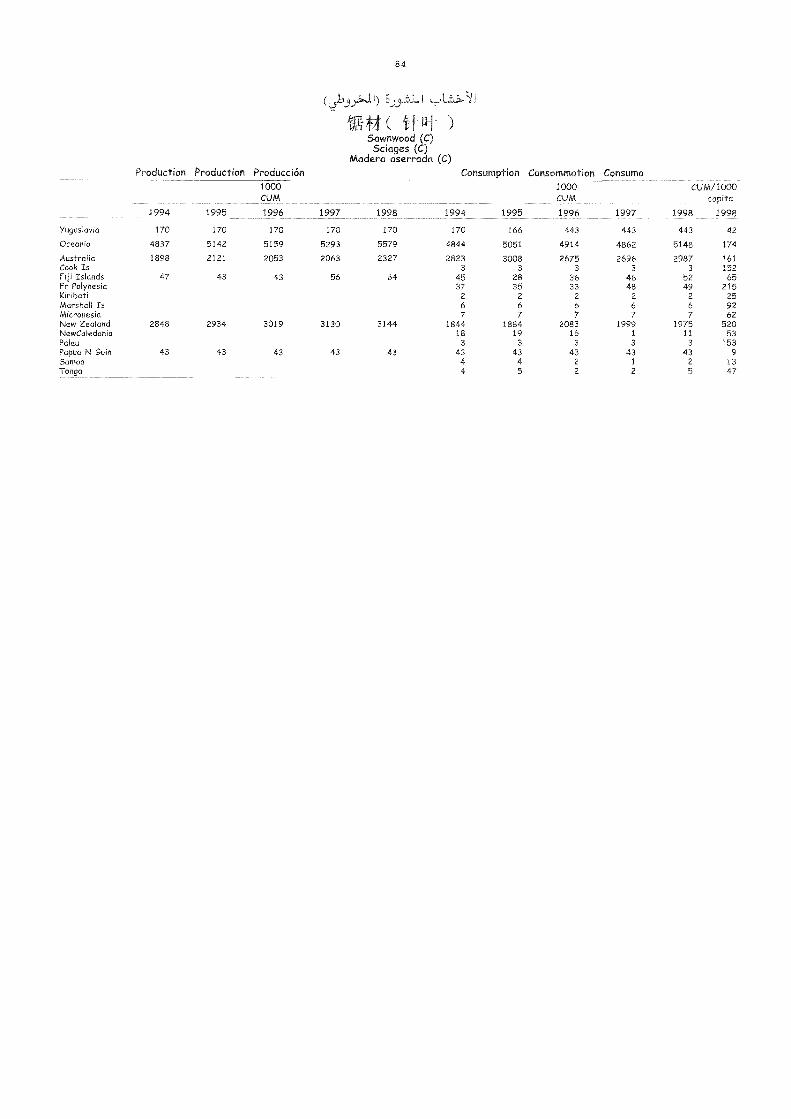
84
(L)0.9:,..:11)
( )5awnwood (C)
5ciages (C)Madera aserrada (C)
Production Production Producción Consumption Consommation Consumo
1994 1995
1000CUM
1996 1997 1998 1994 1995
1000CUM
1996 1997
CUM/1000capita
1998 1998
Yugoslavia 170 170 170 170 170 170 166 443 443 443 42
Oceania 4837 5142 5159 5293 5579 4844 5051 4914 4862 5148 174
Australia 1898 2121 2053 2063 2327 2823 3008 2675 2696 2987 161Cook Is 3 3 3 3 3 152Fiji Islands 47 43 43 56 64 45 28 36 48 52 65Fr Polynesia 37 35 33 48 49 215Kiribati 2 2 2 2 2 25Marshall Is 6 6 6 6 6 92Micronesia 7 7 7 7 7 62New Zealand 2848 2934 3019 3130 3144 1844 1884 2083 1999 1975 520NewCaledonia 18 19 16 1 11 53Palau 3 3 3 3 3 153Papua N Guin 43 43 43 43 43 43 43 43 43 43 9Samoa 4 4 2 1 2 13Tonga 4 5 2 2 5 47
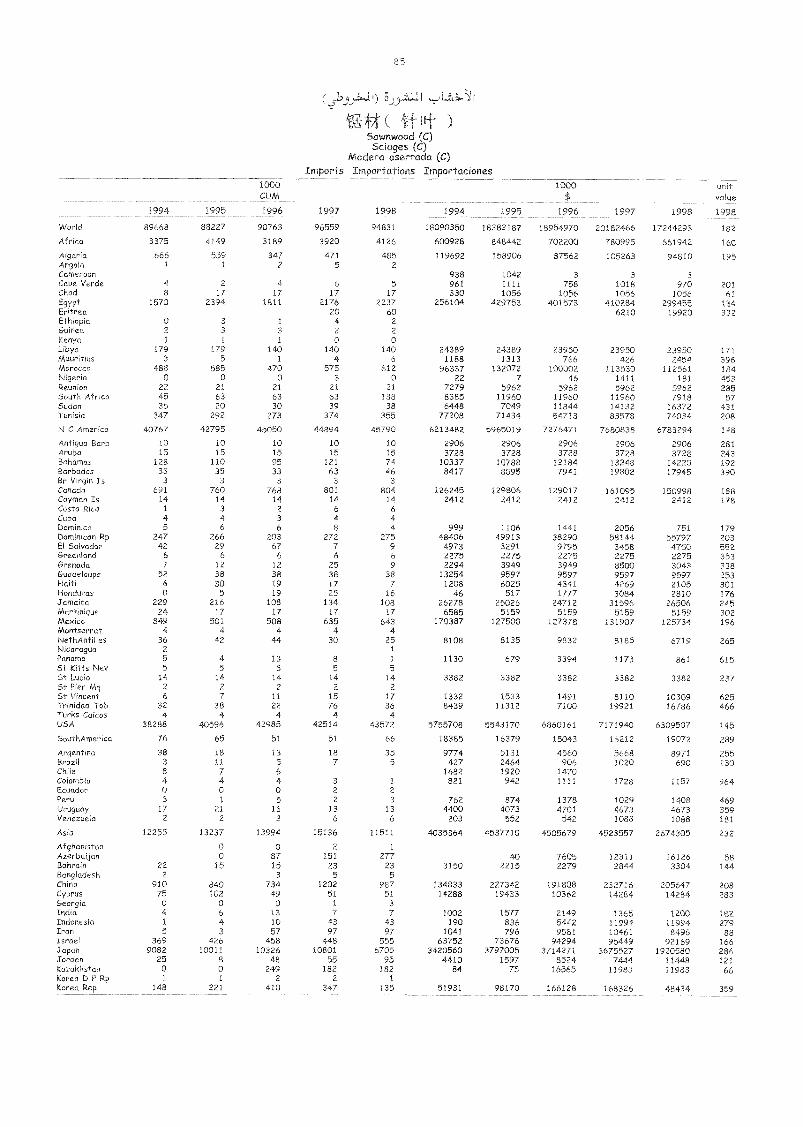
85
,12,,2)21,..11) 3),..°
Ift -)
5atiimmood (C)5cloge.s (C)
Madera oserradn (C)Imports Importarions Importaciones
1994 1995
1000CIJAA
1996 1997 1998 1994
1000$
1996 1997 1998 1998
World 89668 88227 90763 96559 94831 18090350 18382187 18954970 20182466 17244293 182
Africa 3375 4149 3189 3920 4126 600928 8484.- 702200 780995 661942 160
Algeria 666 559 347 471 485 119692 158906 87562 105263 94810 195Angola 1 1 2 5 2Cameroon 938 1042 3 3 3Cope Verde 4 2 4 6 5 961 1111 758 1018 970 201Chad 8 17 17 17 17 330 1056 1056 1056 1056 61Egypt 1570 2394 1811 2176 2237 256104 429753 401573 410284 799155 134Eritrea 20 60 6210 199:0 332Ethiopia 0 3 1 4 2
Guineo 2 3 3 2 2
Kenya 1 1 1 0 0Libya 179 179 140 140 140 24389 24389 23950 23950 23950 171Mauritius 3 5 1 4 6 1188 1313 766 426 2454 396Morocco 488 585 470 575 612 96337 132072 100002 113530 112561 184Nigeria 0 0 0 3 0 22 7 46 1411 61 453Reunion 22 21 21 21 21 7279 5962 5962 5067 5°62 285South Africa 45 63 63 63 138 8385 11960 11960 11960 7918 57Sudan 35 20 30 39 38 6448 7049 11844 14112 10172 431Tunisia 347 292 273 374 355 77208 71434 54713 83573 710:4 208
N C America 40767 42795 45050 44894 45790 6213482 5965019 7276471 7680838 6783294 148
Antigua Barb 10 10 10 10 10 2906 2906 2906 2906 2906 281Aruba 15 15 15 15 15 3728 3728 3728 3728 3728 243Bahamas 128 110 95 121 74 10337 10788 12184 13248 14220 192Barbados 33 35 33 63 46 8417 8095 7941 19802 17945 390Br Virgin Is 3 3 3 3 3
Canada 691 760 768 801 804 126245 129806 129017 161095 150998 188Cayman Is 14 14 14 14 14 2412 2412 2412 2412 2412 178Costa Rica 1 3 2 6 6Cuba 4 4 3 4 4Dominica 5 6 6 8 4 999 1106 1441 2056 751Dominican Rp 247 266 203 272 275 48406 49913 38200 58144 55747El Salvador 42 29 67 7 9 4973 3291 9705 3458 -1750Greenland 6 6 6 6 6 2275 223'3 2775 2275 2275Grenada 7 12 12 25 9 2294 3919 3949 8500 3043Guadeloupe 52 38 38 38 38 13254 9597 9507 959Haiti 6 30 19 17 7 1208 6 . 41A1 420a 2105Honduras 0 5 19 25 16 46 Di/ 1777 3034 :8:0Jamaica 229 216 108 134 108 26278 25026 24712 H5q6 26506Martinique 24 17 17 17 17 6585 515o 5159 5159 5159Mexico 849 501 508 635 643 170387 127 127378 131907 125734Montserrat 4 4 4 4 4NethAntilles 36 42 44 30 25 8108 8135 9832 8185 6719 265Nicaragua 2 1
Panama 5 4 13 8 1 1130 679 3394 1173 861 615St Kitts Nev 5 5 5 5 5St Lucia 14 14 14 14 14 3382 3382 3382 3382 237St Pier Mq 2 2 2 2 2
st Vincent 6 7 11 15 17 1332 1533 1491 8110 625Trinidad Tob 32 38 22 76 36 8439 11312 7100 19921 or 466TurksCaicos 4 4 4 4 4USA 38288 40596 42985 42514 43572 5755708 5543170 6860161 7171940 6305 145
SouthAmerica 76 65 51 51 66 18385 16379 15043 16212 19072 289
Argentina 38 18 13 18 35 9774 5131 4560 5668 8971 255Brazil 3 11 5 7 5 427 2464 906 1020 690 130Chile 8 7 6 1682 1920 1470Colombia 4 4 4 3 1 821 942 1111 1728 1157 964Ecuador 0 0 0 2 2
Peru 3 1 5 2 3 762 874 1378 1029 1408 469Uruguay 17 21 16 13 13 4400 4073 4701 4673 4673 359Venezuela 2 2 2 6 6 203 552 542 1088 1088 181
Asia 12255 13237 13994 15136 11511 4035364 4537710 4505679 4523557 2674305 232
Afghanistan 0 0 2 1
Azerbaijan 0 87 151 277 40 7605 12311 16126 58Bahrain 22 15 15 23 23 3150 :115 2279 3304 144Bangladesh 2 3 5 5
Chino 910 840 734 1202 987 134833 1 191808 27.--' ) 205647 208Cyprus 75 102 49 51 51 14288 1 10362 14284 283Georgia 0 0 0 1 3
India 4 6 13 7 7 1002 1577 21,19 1200 182Indonesia 1 4 10 43 43 190 836 5142 11994 _1901 279Iran 5 3 57 97 97 1041 796 9581 10461 8,196 88Israel 369 426 458 448 555 63752 73676 94294 95449 02169 166Japan 9082 10011 10326 10801 6705 3420560 3797005 3714271 3675527 1420580 286Jordan 25 8 48 55 95 4410 1597 8524 7444 0448 121Kazakhstan 0 0 249 182 182 84 75 10505 11983 t1987 66Korea 0 P Rp 1 1 2 2 1
Korea Rep 148 221 410 347 135 51931 98170 166128 168326 48434 359
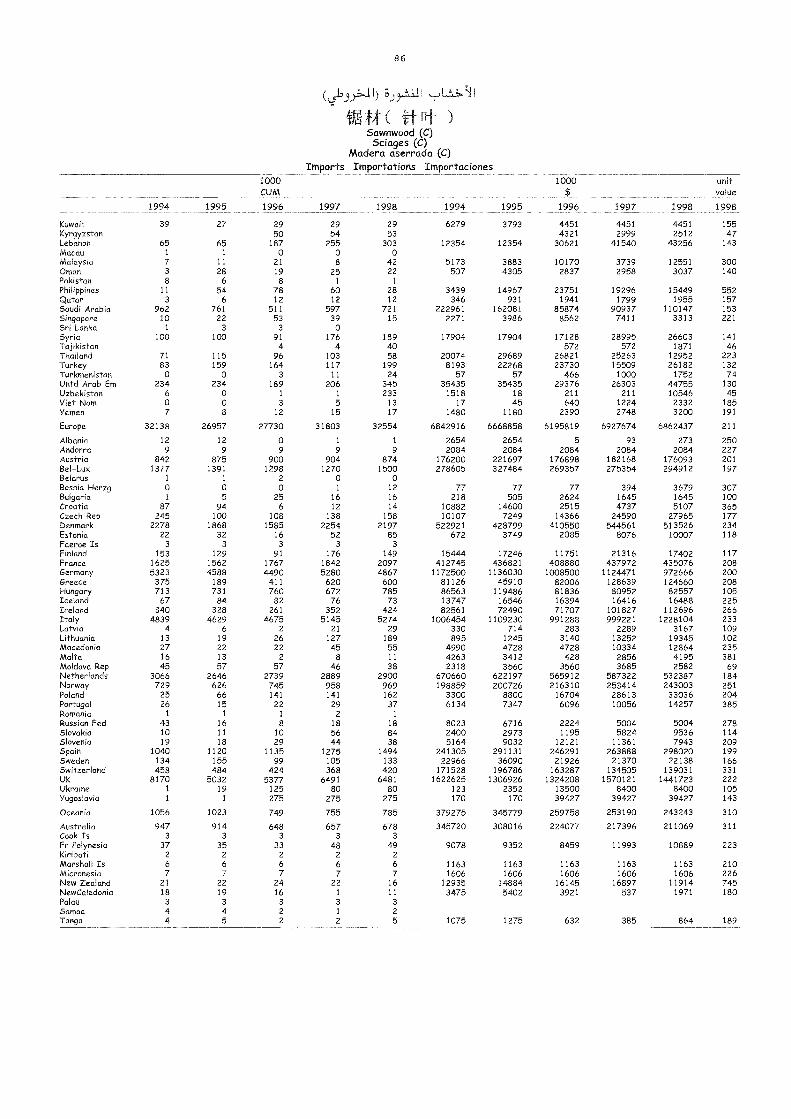
86
) .6».1.111
JIM ( it )5awnwood (C)5ciages (C)
Madera aserrada (C)Imports Importations Importaciones
1994 1995
1000CUM
1996 1997 1998 1994 1995
1000$
1996 1997 1998
unitvalue
1998
Kuwait 39 27 29 29 29 6279 3793 4451 4451 4-451 155Kyrgyzstan 50 54 53 4321 2999 2512 47Lebanon 65 65 187 255 303 12354 12354 30621 41540 43256 143Macau 1 1 o o oMalaysia 7 11 21 8 42 5173 3883 10170 3739 12551 300Oman 3 28 19 25 22 507 4305 2837 2958 3037 140Pakistan 8 6 8 1 1
Philippines 11 54 78 60 28 3439 14967 23751 19296 15449 552Qatar 3 6 12 12 12 346 931 1941 1799 1955 157Saudi Arabia 962 761 511 597 721 222961 162081 85874 90937 110147 153Singapore 10 22 53 39 15 2271 3986 8562 7411 3313 221Sri Lanka 1 3 3 0Syria 100 100 91 176 189 17904 17904 17128 28995 26603 141Tajikistan 4 4 40 572 572 1871 46Thailand 71 115 96 103 58 20074 29689 26821 25263 12952 223Turkey 83 159 164 117 199 8193 22268 23730 15509 26182 132Turkmenistan 0 0 3 11 24 57 57 466 1000 1752 74Untd Arab Em 234 234 189 206 345 35435 35435 29376 26303 44755 130Uzbekistan 6 0 1 1 233 1518 18 211 211 10546 45Viet Nam 0 0 3 5 13 17 45 640 1224 2332 185Yemen 7 8 12 15 17 1480 1180 2390 2748 3200 191
Europe 32138 26957 27730 31803 32554 6842916 6668858 6195819 6927674 6862437 211
Albania 12 12 0 1 1 2654 2654 5 93 273 250Andorra 9 9 9 9 9 2084 2084 2084 2084 2084 227Austria 842 875 900 904 874 176200 221697 176898 182168 176093 201Bel-Lux 1377 1391 1298 1270 1500 278605 327484 269357 275354 294912 197Belarus 1 1 2 0 0Bosnia Herzg 0 0 0 1 12 77 77 77 394 3679 307Bulgaria 1 5 25 16 16 218 505 2624 1645 1645 100Croatia 87 94 6 12 14 10882 14600 2515 4737 5107 365Czech Rep 245 100 108 138 158 10107 7249 14366 24590 27965 177Denmark 2278 1868 1585 2254 2197 522921 428799 410550 544561 513526 234Estonia 22 32 16 52 85 672 3749 2085 8076 10007 118Faeroe Is 3 3 3 3 3
Finland 153 129 91 176 149 15444 17246 11751 21316 17402 117France 1625 1562 1767 1842 2097 412745 436821 408880 437972 435076 208Germany 5323 4588 4490 5280 4867 1172500 1136030 1008500 1124471 972666 200Greece 375 189 411 620 600 81126 45910 82006 128639 124660 208Hungary 713 731 760 672 785 86563 119486 81836 80952 82557 105Iceland 67 84 82 76 73 13747 16546 16394 16416 16488 225Ireland 340 328 261 352 424 82561 72490 71707 101827 112696 266Italy 4839 4629 4675 5145 5274 1006454 1109230 991288 999221 1228104 233Latvia 4 6 2 21 29 330 714 283 2289 3167 109Lithuania 13 19 26 127 189 895 1245 3140 13252 19345 102Macedonia 27 22 22 45 55 4990 4728 4728 10334 12864 235Malta 16 13 2 8 11 4263 3412 428 2856 4195 381Moldova Rep 45 57 57 46 38 2318 3560 3560 3685 2582 69Netherlands 3066 2646 2739 2889 2900 670660 622197 565912 587322 532387 184Norway 729 626 745 958 969 198859 200726 216310 253414 243003 251Poland 25 66 141 141 162 3300 8800 16704 28613 33036 204Portugal 26 15 22 29 37 6134 7347 6096 10056 14257 385Romania 1 1 1 2 1
Russian Fed 43 16 8 18 18 8023 6716 2224 5004 5004 278Slovakia 10 11 10 56 84 2400 2973 1195 5824 9536 114Slovenia 19 18 29 44 38 5164 9032 12121 11361 7943 209Spain 1040 1120 1135 1275 1494 241305 291131 246291 263888 298020 199Sweden 134 155 99 105 133 22966 36090 21926 21370 22138 166Switzerland 458 484 424 368 420 171528 196786 163287 134505 139031 331UK 8170 5032 5377 6491 6481 1622625 1306926 1324208 1570121 1441723 222Ukraine 1 19 125 80 80 123 2352 13500 8400 8400 105Yugoslavia 1 1 275 275 275 170 170 39427 39427 39427 143
Oceania 1056 1023 749 755 785 379275 345779 259758 253190 243243 310
Australia 947 914 648 657 678 345720 308016 224077 217396 211069 311Cook Is 3 3 3 3 3
Fr Polynesia 37 35 33 48 49 9078 9352 8459 11993 10889 223Kiribati 2 2 2 2 2
Marshall Is 6 6 6 6 6 1163 1163 1163 1163 1163 210Micronesia 7 7 7 7 7 1606 1606 1606 1606 1606 226New Zealand 21 22 24 22 16 12935 14884 16145 16897 11914 745NewCaledonia 18 19 16 1 11 3475 5402 3921 537 1971 180Palau 3 3 3 3 3
Samoa 4 4 2 1 2
Tonga 4 5 2 2 5 1075 1275 632 385 864 189
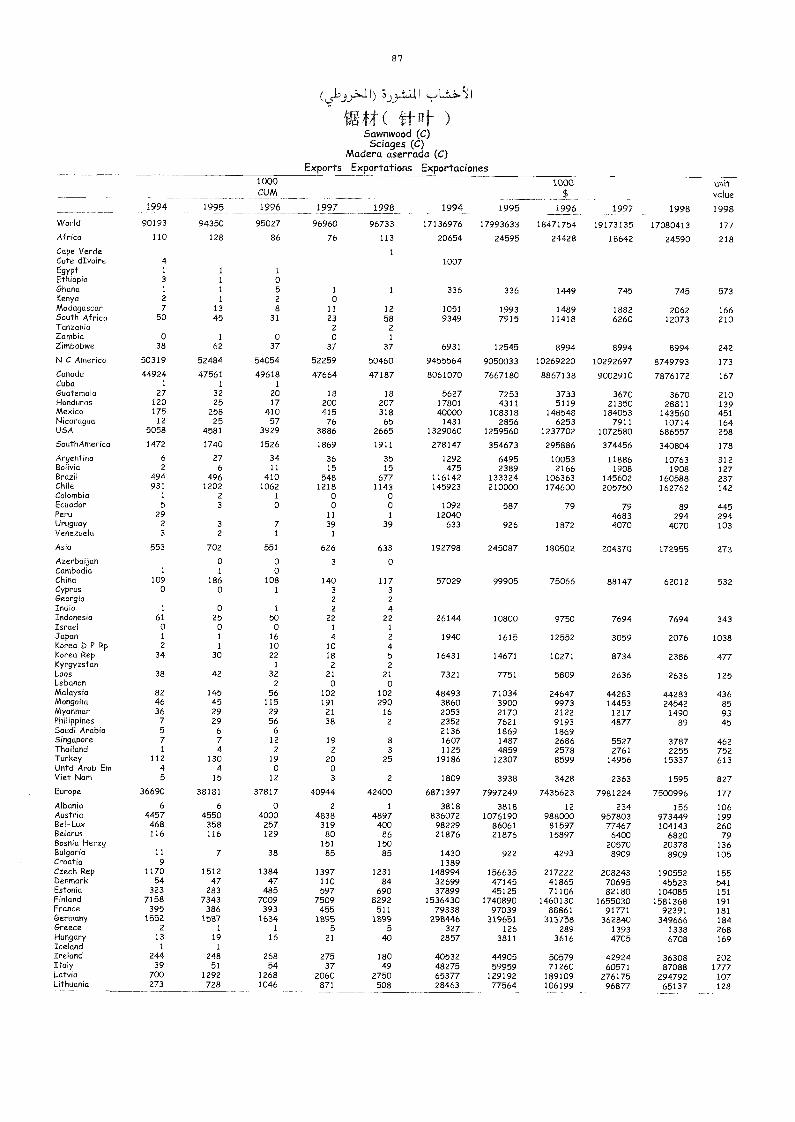
87
(,51,j);-,11) L16.)1
f4- ( [it )Sawnwood (C)Sciages (C)
Madera aserrada (C)Exports Exportations Exportaciones
1994 1995
1000CUM
1996 1997 1998 1994 1995
1000$
1996 1997 1998
unitvalue
1998
V/orld 90193 94350 95027 96960 9,733 17136976 17993633 18471754 19173135 17080413 177Africa 110 128 86 76 113 20654 24595 24428 18642 24590 218
Cape Verde 1
Cote dIvoire 4 1007Egypt 1 1 1
Ethiopia 3 1 0Ghana 1 1 5 1 I 336 336 1449 745 745 573Kenya 2 1 2 0Madagascar 7 13 8 11 12 1051 1993 1489 1882 2062 166South Africa 50 45 31 23 58 9349 7915 11418 6260 12073 210Tanzania 2 2Zambia 0 I 0 0 1
Zimbabwe 38 62 37 37 37 6931 12545 8994 8994 8994 242N C AmeMca 50319 52484 54054 52259 50460 9455564 9050033 10269220 10292697 8749793 173
Canada 44924 47561 49618 47664 47187 8061070 7667180 8867138 9002910 7876172 167Cuba 1 I 1
Guatemala 27 32 20 18 18 5627 7253 3733 3670 3670 210Honduras 120 25 17 200 207 17801 4311 5119 21350 28811 139Mexico 175 258 410 415 318 40000 108318 148548 184053 143560 451Nicaragua 12 25 57 76 65 1431 2856 6253 7911 10714 164USA 5058 4581 3929 3886 2665 1329060 1259560 1237702 1072580 686557 258
SouthAmerca 1472 1740 1526 1869 1911 278147 354673 295886 374456 340804 178
Argentina 6 27 34 36 35 1292 6495 10053 11886 10763 312Bolivia 2 6 11 15 15 475 2389 2166 1908 1908 127Brazil 494 496 410 548 677 116142 133324 106363 145602 160588 237Chile 931 1202 1062 1218 1143 145923 210000 174600 205750 162762 142Colombia 1 2 1 0 0Ecuador 5 3 0 0 0 1092 587 79 79 89 445Peru 29 11 1 12040 4683 294 294Uruguay 2 3 7 39 39 633 926 1872 4070 4070 103Venezuela 3 2 1 1
Asia 553 702 551 626 633 192798 245087 180502 204370 172955 273Azerbaijan 0 0 3 0Cambodia 1 I 0China 109 186 108 140 117 57029 99905 75066 88147 62012 532Cyprus 0 0 I 3 3GeorgM 2 2India 1 0 1 2 4Indonesia 61 25 50 22 22 26144 10800 9750 7694 7694 343Israel 0 0 0 1 IJapan 1 I 16 4 2 1940 1615 12552 3059 2076 1038Korea D P Rp 2 1 10 10 4Korea Rep 34 30 22 18 5 16431 14671 10271 8734 2386 477Kyrgyzstan 1 2 2
Loas 38 42 32 21 21 7321 7751 5809 2636 2636 125Lebanon 2 0 0Malaysia 82 145 56 102 102 48493 71034 24647 44283 44283 436Mongolia 46 45 115 191 290 3860 3900 9973 14453 24542 85Myanmar 36 29 29 21 16 2053 2170 2122 1217 1490 93PhilippMes 7 29 56 38 2 2352 7621 9193 4877 89 45Saudi Arabia 5 6 6 2136 1869 1869Singapore 7 7 12 19 8 1607 1487 2686 5527 3787 462Thailand 1 4 2 2 3 1125 4859 2578 2761 2255 752Turkey 112 130 19 20 25 19186 12307 8599 14956 15337 613Untd Arab Em 4 4 0 0VMt Nam 5 15 12 3 2 1809 3938 3428 2363 1595 827
Europe 36690 38181 37817 40944 42400 6871397 7997249 7435623 7981224 7500996 177
Albania 6 6 0 2 1 3818 3818 12 234 156 106Austria 4457 4550 4000 4838 4897 836072 1076190 988000 957803 973449 199Bel-Lux 468 358 257 319 400 98229 86061 81597 77467 104143 260BeMrus 116 116 129 80 86 21876 21876 15897 6400 6820 79BosnM Herzg 151 150 20570 20378 136Bulgaria 11 7 38 85 85 1430 922 4293 8909 8909 105Croatia 9 1389Czech Rep 1170 1512 1384 1397 1231 148994 156635 217222 208243 190552 155Denmark 54 47 47 110 84 32699 47145 41865 70695 45523 541Estonio 323 283 485 597 690 37899 45125 71106 82180 104085 151FinMnd 7158 7343 7009 7509 8292 1536430 1740890 1460130 1655030 1581368 191France 395 386 393 455 511 79338 97039 88861 91771 92391 181Gernmny 1552 1587 1634 1895 1899 298446 319651 313758 362840 349666 184Greece 2 1 1 5 5 327 126 289 1393 1338 268Hungary 13 19 16 21 40 2857 3811 3616 4705 6708 169IceMnd I 1
IreMnd 244 248 268 275 180 40532 44905 53579 42924 36308 202Italy 39 51 54 37 49 48275 59959 71260 60571 87088 I///Latvia 700 1292 1268 2060 2750 65377 129192 189109 276175 294792 107LfthuanM 273 728 1046 871 508 28463 77564 106199 96877 65137 128
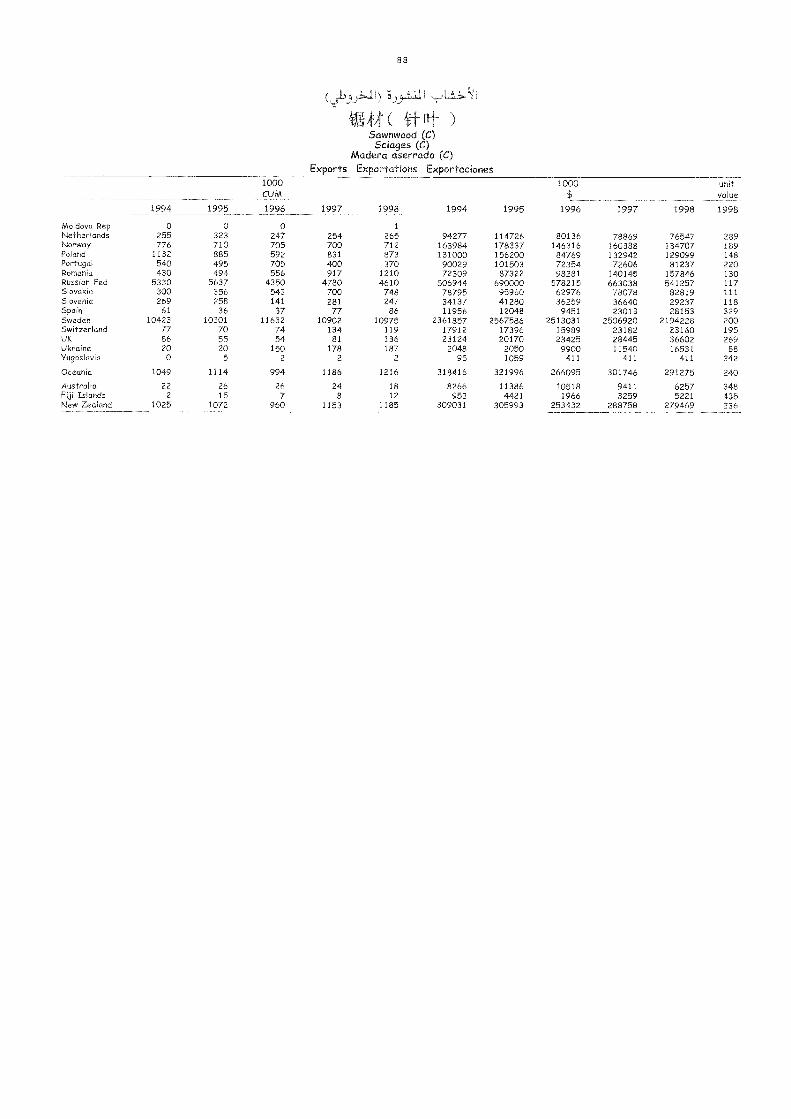
88
I)S..) 4...t.:dH
( Jr-Fr )Sownwood (C)5clages (C)
Madera aserrado (C)Exports Exportations Exportaciones
1994 1995
000cUM
1996 1997 1998 1994 1995
1000$
1996 1997 1998
unitvalue
1998
Moldova Rep 0 0 0 1
Netherlands 255 323 247 254 265 94277 114726 80136 78869 76547 289Norway 776 710 705 700 712 163984 178337 146316 160388 134707 189Poland 1132 885 592 831 873 131000 156200 84769 132942 129099 148Portugal 540 495 705 400 370 90029 101503 72354 72606 81237 220Romania 430 494 556 917 1210 72309 87322 98281 140145 157846 130Russian Fed 5330 5637 4350 4780 4610 506944 690000 578215 663038 541257 117Slovakia 300 356 543 700 748 78795 95960 62976 78078 82819 111Slovenia 269 258 141 281 247 34137 41280 36259 36640 29237 118Spain 61 36 37 77 86 11956 12048 9451 23013 28153 329Sweden 10423 10301 11632 10902 10975 2361857 2567586 2513031 2506920 2194228 200Switzerland 77 70 74 134 119 17912 17396 15989 23182 23160 195UK 86 55 54 81 136 23124 20170 23425 28445 36602 269Ukraine 20 20 150 178 187 2048 2050 9900 11540 16531 88Yugoslavia 0 5 2 2 2 95 1059 411 411 411 242
Oceania 1049 1114 994 1186 1216 318416 321996 266095 301746 291275 240
Australia 22 26 26 24 18 8266 11386 10518 9411 6257 348Fiji Islands 2 15 7 8 12 953 4421 1966 3259 5221 435New Zealand 1025 1072 960 1153 1185 309031 305993 253432 288758 279469 236
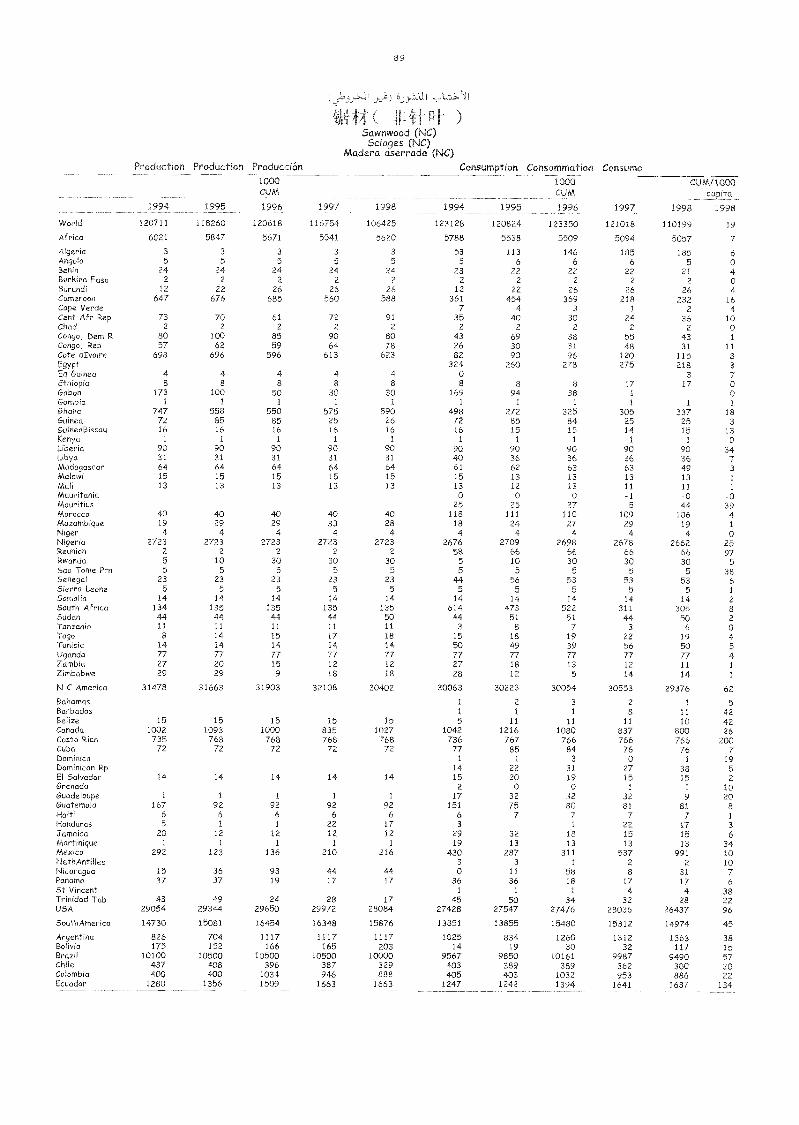
8 9
Sawnwood (NC)Sciages (NC)
Madera aserrada (NC)Production Production :i6n Consumption C Jon Consumo
C10_3 CUM/1000
capita1994 1995 1996 1997 1998 1994 1995 1996 1997 1998 1998
World 120711 118260 120618 116754 106425 123128 120824 123350 121018 110199 19
Africa 6021 5847 5671 5541 5620 5788 5538 5509 5094 5057 7
Algeria 3 3 3 3 3 53 113 146 185 185 6Angola 5 5 5 5 5 5 6 6 6 5 0Benin 24 24 24 24 24 23 22 22 22 21 4Burkina Faso 2 2 2 2 2 2 2 2 2 2 0Burundi 12 22 26 26 26 12 22 26 26 26 4Cameroon 647 676 685 560 588 361 454 369 218 232 16Cape Verde 7 4 3 1 2 4Cent Afr Rep 73 70 61 72 91 35 40 30 24 36 10Chad 2 2 2 2 2 2 2 2 2 2 0Congo, Dem R 80 100 85 90 80 43 69 38 55 43 1
Con9o, Rep 57 62 59 64 78 26 30 31 48 31 11Cote dIvoire 698 696 596 613 623 82 90 96 120 115 8Egypt 324 260 278 275 218 3Eq Guinea 4 4 4 4 4 0 3 7Ethiopia 8 8 8 8 8 8 8 8 17 17 0Gabon 173 100 50 30 30 169 94 38 1 0Gambia 1 1 1 1 1 1 1 1 1 1 1
Ghana 747 558 550 575 590 498 272 325 305 337 18Guinea 72 85 85 25 26 72 85 84 25 25 3
GuineaBissau 16 16 16 16 16 16 15 15 14 15 13Kenya 1 1 1 1 1 1 1 1 1 1 0Liberia 90 90 90 90 90 90 90 90 90 90 34Libya 31 31 31 31 31 40 36 36 36 36 7Madagascar 64 64 64 64 64 61 62 63 63 49 3Malawi 15 15 15 15 15 15 13 13 13 13 1
Mali 13 13 13 13 13 13 12 13 11 11 1
Mauritania 0 0 0 -1 -0 -0Mauritius 25 25 27 5 44 39Morocco 40 40 40 40 40 118 111 110 109 106 4Mozambique 19 29 29 33 28 18 24 27 29 19 1
Níger 4 4 4 4 4 4 4 4 4 4 0Nigeria 2723 2723 2723 2723 2723 2676 2709 2698 2678 2662 25Reunion 2 2 2 2 2 58 66 66 66 66 97Rwanda 5 10 30 30 30 5 10 30 30 30 5Soo Tome Prn 5 5 5 5 5 5 5 5 5 5 38Senegal 23 23 23 23 23 44 56 53 53 53 6Sierra Leone 5 5 5 5 5 5 5 5 5 5 1
Somalia 14 14 14 14 14 14 14 14 14 14 2
South Africa 134 135 135 135 135 614 473 522 311 306 8Sudan 44 44 44 44 50 44 51 51 44 50 2Tanzania 11 11 11 11 11 3 8 7 3 6 0Togo 8 14 15 17 18 15 18 19 22 19 4Tunisia 14 14 14 14 14 50 49 39 56 50 5Uganda 77 77 77 77 77 77 77 77 77 77 4Zambia 27 20 15 12 12 27 18 13 12 11 1
Zimbabwe 29 29 9 18 18 28 12 5 14 14 1
N C America 31478 31663 31903 32108 30402 30063 30223 30054 30553 29376 62
Bahamas 1 2 3 2 1 5Barbados 1 1 1 8 11 42Belize 15 15 15 15 15 5 11 11 11 10 42Canada 1002 1093 1000 835 1027 1042 1216 1080 837 800 26Costa Rica 735 768 768 768 768 736 767 766 766 766 200Cuba 72 72 72 72 72 77 85 64 76 76 7Dominica 1 I 3 0 1 19Dominican Rp 14 22 31 27 38 5El Salvador 14 14 14 14 14 15 20 19 15 15 2Grenada 2 0 0 1 1 10Guadeloupe 1 1 1 1 1 17 32 32 32 9 20Guatemala 167 92 92 92 92 151 75 80 81 81 8Haiti 6 6 6 6 6 6 7 7 7 7 1
Honduras 5 i 1 22 17 3 1 22 17 3Jamaica 20 12 12 12 12 29 32 18 15 15 6Martinique 1 1 1 1 1 19 13 13 13 13 34Mexico 292 123 136 210 216 430 287 311 537 991 10NethAntilles 3 3 1 2 2 10Nicaragua 15 36 93 44 44 0 11 58 8 31 7Panama 37 37 19 17 17 36 36 18 17 17 6St Vincent 1 1 1 4 4 38Trinidad Tob 43 49 24 28 17 45 50 34 32 28 22USA 29054 29344 29650 29972 28084 27428 27547 27476 28036 26437 96
SouthArnerica 14730 15081 16454 16348 15876 13851 13855 15480 15312 14974 45
Argentina 826 704 1117 1117 1117 1025 834 1260 1312 1363 38Bolivia 175 152 166 165 203 14 19 30 32 117 15Brazil 10100 10500 10500 10500 10000 9567 9850 10161 9987 9490 57Chile 437 408 396 387 329 403 389 389 362 300 20Colombia 400 400 1034 946 888 405 403 1032 953 886 22Ecuador 1280 1356 1509 1663 1663 1247 1242 1394 1641 1637 134
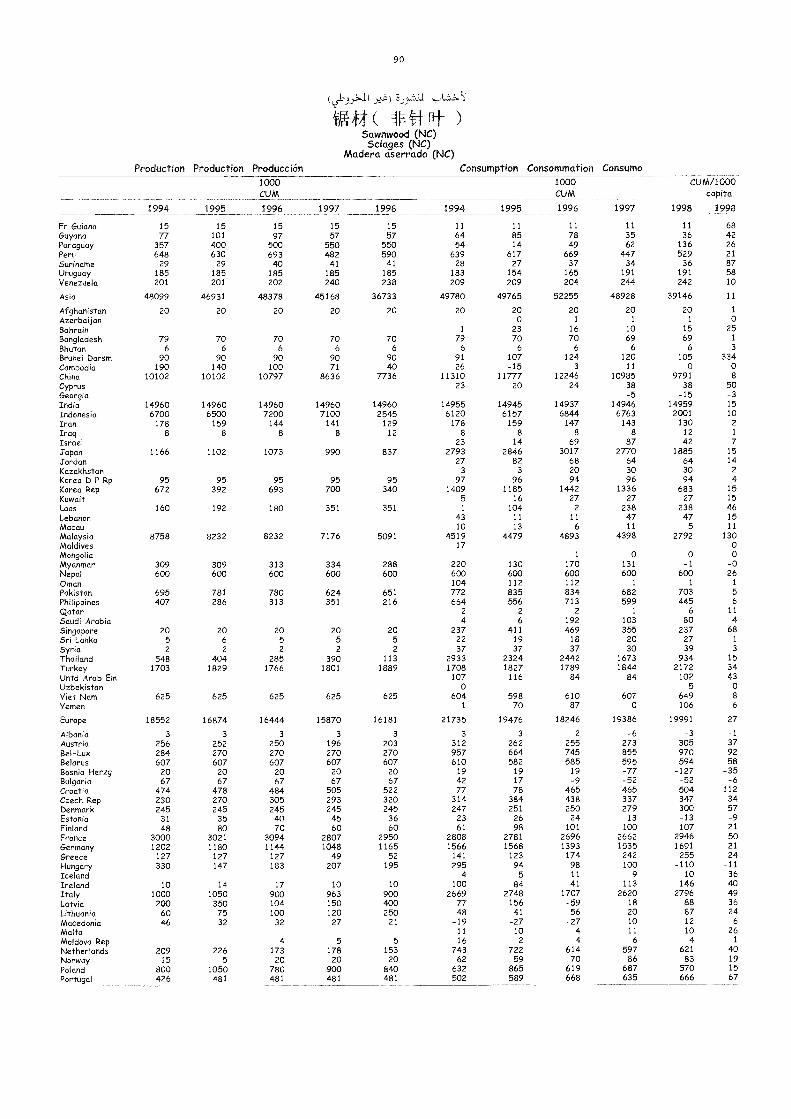
90
frE)ig(itt)Sawnwood (NC)Sciages (NC)
Madera aserrada (NC)Production Production Producción Consumption Consommation Consumo
1000 1000 CUM/1000CUM CUM capita
1994 1995 1996 1997 1998 1994 1995 1996 1997 1998 1998
Fr Guiana 15 15 15 15 15 11 11 11 11 11 68Guyana 77 101 97 57 57 64 85 78 35 36 42Paraguay 357 400 500 550 550 54 14 49 62 136 26Peru 648 630 693 482 590 639 617 669 447 529 21Suriname 29 29 40 41 41 28 27 37 34 36 87Uruguay 185 185 185 185 185 183 154 165 191 191 58Venezuela 201 201 202 240 238 209 209 204 244 242 10
Asia 48099 46931 48378 45168 36733 49780 49765 52255 48928 39146 11
Afghanistan 20 20 20 20 20 20 20 20 20 20 1
Azerbaijan o 1 1 1 oBahrain 1 23 16 10 15 25Bangladesh 79 70 70 70 70 79 70 70 69 69 1
Bhutan 6 6 6 6 6 6 6 6 6 6 3
Brunei Darsm 90 90 90 90 90 91 107 124 120 105 334Cambodia 190 140 100 71 40 26 -15 3 -11 o oChina 10102 10102 10797 8636 7736 11310 11777 12246 10985 9791 8
Cyprus 23 20 24 38 38 50Georgia -5 -15 -3India 14960 14960 14960 14960 14960 14955 14945 14937 14946 14959 15Indonesia 6700 6500 7200 7100 2545 6120 6157 6844 6763 2001 10Iran 178 159 144 141 129 178 159 147 143 130 2
Iraq 8 8 8 8 12 8 8 8 8 12 1
Israel 23 14 69 87 42 7Japan 1166 1102 1073 990 837 2793 2846 3017 2770 1885 15Jordan 27 82 68 64 64 14
Kazakhstan 3 3 20 30 30 2
Korea D P Rp 95 95 95 95 95 97 96 94 96 94 4Korea Rep 672 392 693 700 340 1409 1185 1442 1336 683 15
Kuwait 5 16 27 27 27 15Laos 160 192 180 351 351 1 104 2 238 238 46Lebanon 43 11 11 47 47 15Macau 10 13 6 11 5 11
Malaysia 8758 8232 8232 7176 5091 4519 4479 4893 4398 2792 130Maldives 17 o
Mongolia 1 o o o
Myanmar 309 309 313 334 288 220 130 170 131 -1 -0Nepal 600 600 600 600 600 600 600 600 600 600 26Oman 104 112 112 1 1 1
Pakistan 695 781 780 624 651 772 835 834 682 703 5
Philippines 407 286 313 351 216 664 556 713 599 445 6
Qatar 2 2 2 1 6 11
Saudi Arabia 4 6 192 103 80 4
Singapore 20 20 20 20 20 237 411 469 355 237 68
Sri Lanka 5 6 5 5 5 22 19 18 20 27 1
Syria 2 2 2 2 2 37 37 37 30 39 3
Thailand 548 404 285 390 113 2933 2324 2442 1673 934 15
Turkey 1703 1829 1766 1801 1889 1708 1827 1789 1844 2172 34Untd Arab Em 107 116 84 84 102 43Uzbekistan o 5 oViet Nam 625 625 625 625 625 604 598 610 607 649 8
Yemen 1 70 87 o 106 6
Europe 18552 16874 16444 15870 16181 21735 19476 18246 19386 19991 27
Albania 3 3 3 3 3 3 3 2 -6 -3 -1Austria 256 252 250 196 203 312 262 255 273 305 37Bel-Lux 284 270 270 270 270 957 664 745 855 970 92Belarus 607 607 607 607 607 610 582 585 595 594 58Bosnia Herzg 20 20 20 20 20 19 19 19 -77 -127 -35Bulgaria 67 67 67 67 67 42 17 -9 -52 -52 -6Croatia 474 478 484 505 522 77 78 465 465 504 112Czech Rep 230 270 305 293 320 314 384 438 337 347 34Denmark 245 245 245 245 245 247 251 250 279 300 57Estonia 31 35 40 45 36 23 26 24 13 -13 -9Finland 48 80 70 60 60 61 98 101 100 107 21
France 3000 3021 3094 2807 2950 2808 2781 2696 2662 2946 50Germany 1202 1180 1144 1048 1165 1566 1568 1393 1535 1691 21
Greece 127 127 127 49 52 141 123 174 242 255 24Hungary 330 147 183 207 195 295 94 98 100 -110 -11Iceland 4 5 11 9 10 36Ireland 10 14 17 10 10 100 84 41 113 146 40Italy 1000 1050 900 963 900 2669 2748 1707 2620 2796 49Latvia 200 350 104 150 400 77 156 -59 18 88 36Lithuania 60 75 100 120 250 48 41 56 20 87 24Macedonia 46 32 32 27 21 -19 -27 -27 10 12 6
Malta 11 10 4 11 10 26Moldova Rep 4 5 5 16 2 4 6 4 1
Netherlands 209 226 173 178 153 743 722 614 597 621 40Norway 15 5 20 20 20 62 59 70 86 83 19
Poland 800 1050 780 900 840 632 865 619 687 570 15
Portugal 426 481 481 481 481 502 589 668 635 666 67
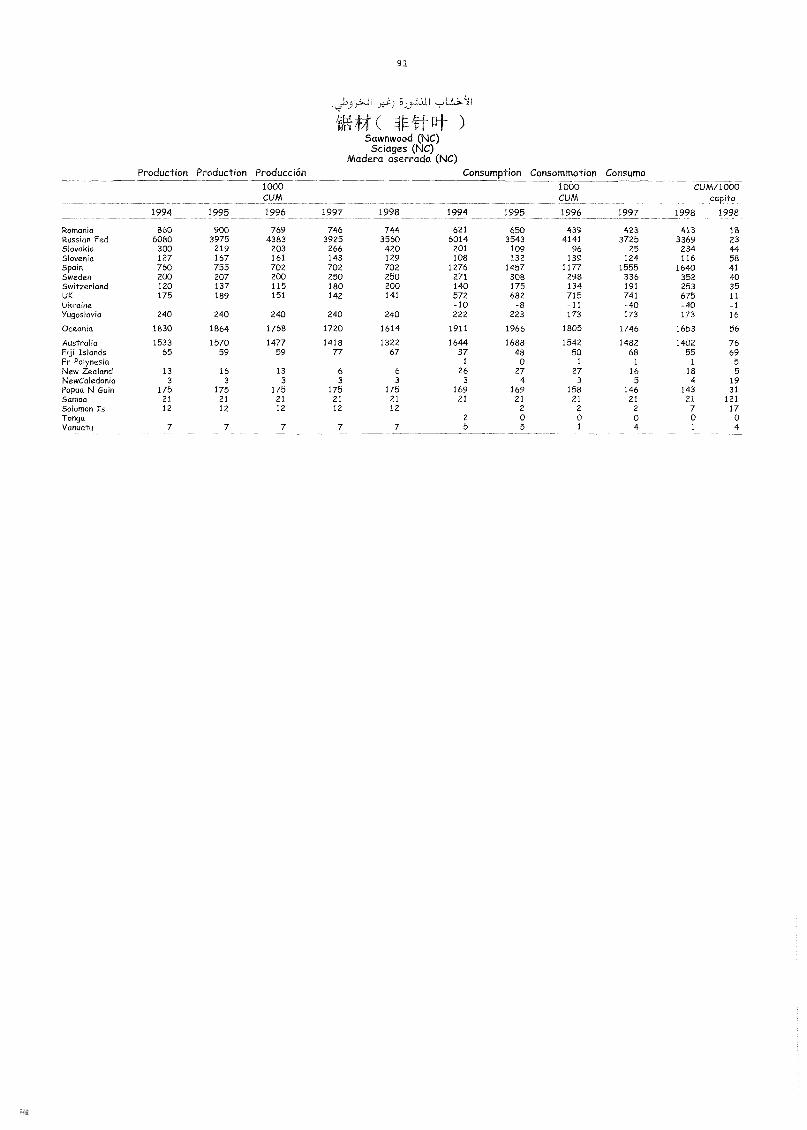
91
t/t( ir v- [it )5awnwood (NC)
5ciages (NC)Madera aserrada (NC)
Production Production Producción Consumption Consommation Consumo
1994 1995
1000CUM
1996 1997 1998 1994 1995
1000CUM
1996 1997
CUM/1000capita
1998 1998
Romania 860 900 769 746 744 621 650 439 423 413 18Russian Fed 6080 3975 4383 3925 3560 6014 3543 4141 3725 3369 23Slovakia 300 219 203 266 420 201 109 96 25 234 44Slovenia 127 167 161 143 129 108 132 139 124 116 58Spain 760 755 702 702 702 1276 1457 1177 1555 1640 41Sweden 200 207 200 250 250 271 308 298 336 352 40Switzerland 120 137 115 180 200 140 175 134 191 253 35UK 175 189 151 142 141 572 682 715 741 675 11Ukraine -10 -8 -11 -40 -40 -1Yugoslavia 240 240 240 240 240 222 223 173 173 173 16
Oceania 1830 1864 1768 1720 1614 1911 1966 1805 1746 1653 56
Australia 1533 1570 1477 1418 1322 1644 1688 1542 1482 1402 76Fiji Islands 65 59 59 77 67 37 48 50 68 55 69Fr Polynesia 1 0 1 1 1 5
New Zealand 13 16 13 6 6 26 27 27 16 18 5NewCaledonia 3 3 3 3 3 3 4 3 5 4 19Papua N Gula 175 175 175 175 175 169 169 158 146 143 31Samoa 21 21 21 21 21 21 21 21 21 21 121Solomon Is 12 12 12 12 12 2 2 2 7 17Tonga 2 0 0 0 0 oVanuatu 7 7 7 7 7 5 5 1 4 1 4
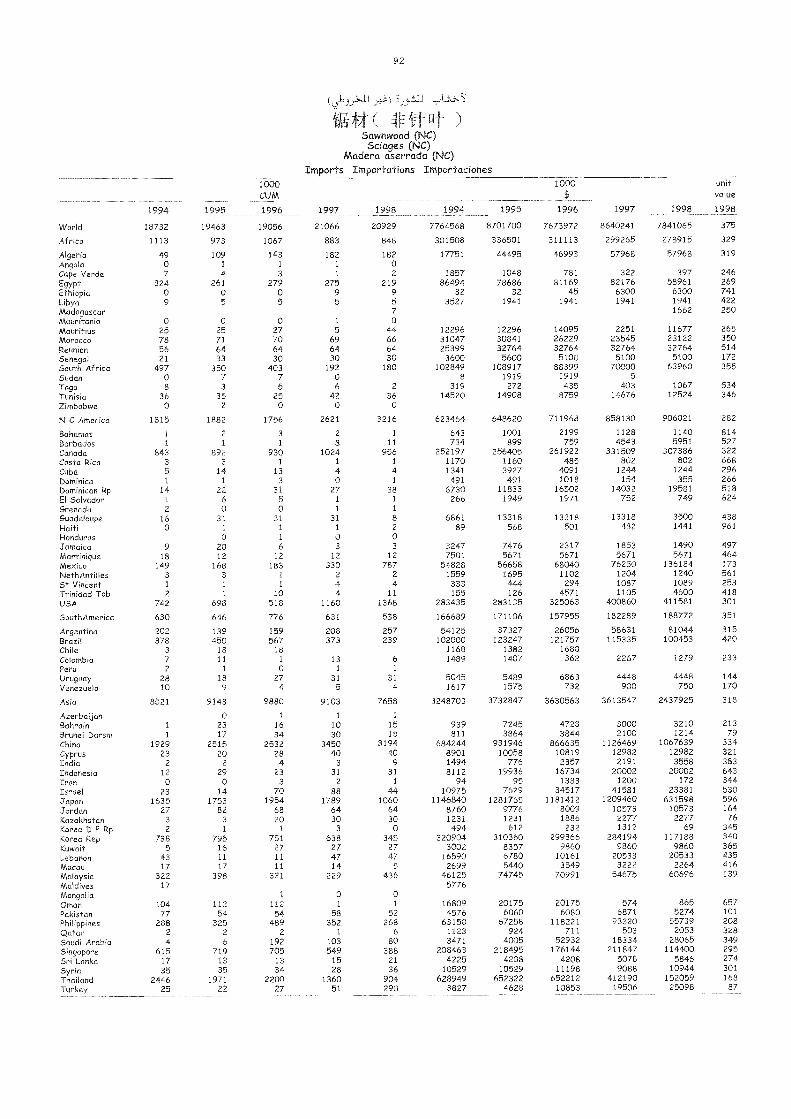
( )Sawnwood (NC)Sciages (NC)
Madera aserrada (NC)Imports Importations Importaciones
92
1000CUM
1000 unitvalue
1994 1995 1996 1997 1998 1994 1995 1996 1997 1998 1998
VVorld 18732 19463 19056 21066 20929 7764568 8701700 7673972 8640241 7841065 375
Africa 1113 973 1067 883 848 301508 336501 311113 299265 278915 329
Algeria 49 109 143 182 182 17751 44495 46993 57968 57968 319Angola 0 I 1 1 0Cape Verde 7 4 3 1 2 1857 1048 781 322 397 246
Egypt 324 261 279 275 219 86494 78686 81169 82176 58961 269
Ethiopia 0 0 0 9 9 32 32 45 6300 6300 741
Libya 9 5 5 5 5 3527 1941 1941 1941 1941 422Madagascar 7 1662 250Mauritania 0 0 0 1 0Mauritius 25 25 27 5 44 12296 12296 14095 2251 11677 265Morocco 78 71 70 69 66 31047 30841 26229 23545 23122 350Reunion 56 64 64 64 64 25399 32764 32764 32764 32764 514
Senegal 21 33 30 30 30 3600 5600 5100 5100 5100 172
South Africa 497 350 403 192 180 102849 108917 88399 70000 63960 355Sudan 0 7 7 0 8 1919 1919 5
Togo 8 3 5 6 2 319 272 435 403 1067 534Tunisia 36 35 25 42 36 14520 14908 8759 14676 12524 346Zimbabwe 0 2 0 0 0
N C America 1815 1882 1756 2621 3216 623464 648620 711968 858130 906021 282
Bahamas 1 2 3 2 1 643 1001 2199 1128 1140 814Barbados 1 1 1 8 11 734 899 759 4543 5951 527Canada 843 892 930 1024 956 252197 256405 261922 331509 307386 322Costa Rica 3 3 1 1 1 1170 1160 485 802 802 668Cuba 5 14 13 4 4 1341 3927 4091 1244 1244 296DomMica 1 1 3 0 1 491 491 1018 154 355 266Dominican Rp 14 22 31 27 38 6730 11833 16502 14032 19581 518El Salvador 1 6 5 1 1 266 1949 1971 752 749 624Grenada 2 0 0 1 1
Guadeloupe 16 31 31 31 8 6861 13318 13318 13318 3500 438Haiti 0 1 1 1 2 89 568 501 482 1441 961
Honduras 0 1 0 0
Jamaica 9 20 6 3 3 3247 7476 2317 1853 1490 497Martinique 18 12 12 12 12 7501 5671 5671 5671 5671 464Mexico 149 168 183 330 787 54828 56658 68040 76250 136184 173
NethAntiHes 3 3 1 2 2 1559 1695 1102 1204 1240 561
St Vincent 1 1 1 4 4 333 444 294 1087 1089 253Trinidad Tob 2 1 10 4 11 155 126 4571 1105 4600 418USA 742 698 518 1160 1368 283435 283135 325063 400860 411581 301
SouthAmerica 630 646 776 631 538 166689 171106 157955 182289 188772 351
Argentina 202 139 159 208 257 54125 37327 26056 58631 81044 315
Brazil 378 450 567 373 239 102000 123247 121757 115335 100453 420Chile 3 18 18 1168 1382 1680Colombia 7 11 1 13 6 1489 1407 362 2267 1279 233
Peru 2 1 0 1 1
Uruguay 28 18 27 31 31 5045 5489 6863 4448 4448 144Venezuela 10 9 4 5 4 1617 1575 732 900 750 170
Asia 8521 9143 9880 9103 7658 3248703 3732847 3630563 3613547 2437925 318
Azerbaijan 0 1 1 1
Bahrain 1 23 16 10 15 939 7245 4728 3000 3210 213
Brunei Darsm 1 17 34 30 15 811 3864 3844 2100 1214 79
Chino 1929 2515 2532 3450 3194 684244 931946 866635 1126469 1067639 334Cyprus 23 20 28 40 40 8901 10058 10819 12982 12982 321
India 2 2 4 3 9 1494 776 2357 2191 3558 383
Indonesia 12 29 23 31 31 8112 19936 16734 20002 20002 643
Iran 0 0 3 2 1 94 95 1383 1200 172 344Israel 23 14 70 88 44 10975 7629 34517 41581 23381 530Japan 1635 1753 1954 1789 1060 1146840 1281765 1181412 1209460 631598 596
Jordan 27 82 68 64 64 8760 9776 8009 10573 10573 164
Kazakhstan 3 3 20 30 30 1231 1231 1886 2277 2277 76
Korea D P Rp 2 1 1 3 0 494 612 232 1312 69 345Korea Rep 738 795 751 638 345 320904 310360 299366 284194 117188 340Kuwait 5 16 27 27 27 3002 8357 9860 9860 9860 365Lebanon 43 11 11 47 47 16590 6780 10161 20533 20533 435Macau 17 17 11 14 5 2699 5440 3549 3222 2264 416Malaysia 322 398 321 229 436 46125 74745 70991 54675 60696 139
Maldives 17 5776Mongolia 1 0 0Oman 104 112 112 1 1 16809 20175 20175 574 865 657
Pakistan 77 54 54 58 52 4576 6060 6080 6871 5274 101
Philippines 288 325 489 352 268 63150 67258 118221 93320 55739 208
Qatar 2 2 2 1 6 1123 924 711 503 2053 328Saudí Arabia 4 6 192 103 80 3471 4005 52932 18334 28065 349Singapore 615 719 705 549 388 208463 218495 176144 211847 114400 295
Sri Lanka 17 13 13 15 21 4225 4208 4208 5078 5846 274
Syria 35 35 34 28 36 10529 10529 11198 9088 10944 301
Thailand 2446 1971 2200 1360 904 628949 652322 652212 412190 152059 168
Turkey 25 22 27 51 290 3827 4628 10853 19506 25098 87
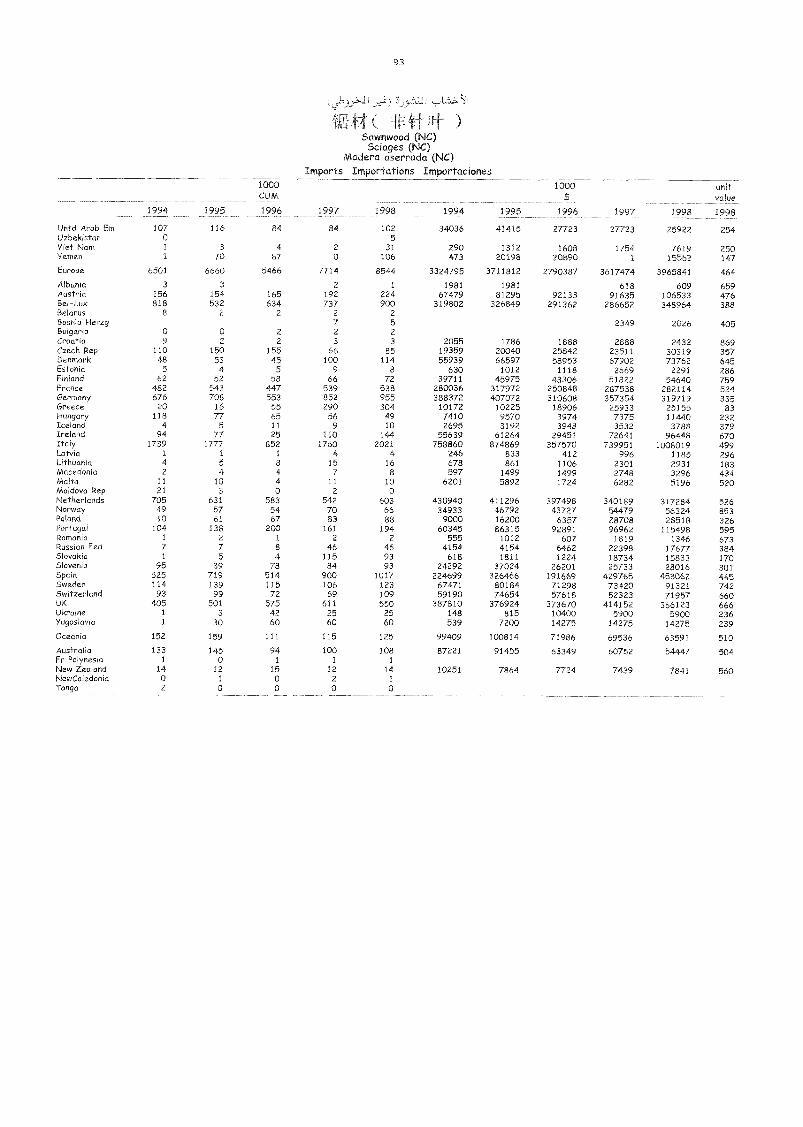
93
I
Wif4Hftft )Sawnwood (NC)Sciages (NC)
Madera aserrada (NC)Imports Importations Importaciones
1000CUM
1000s
unitvalue
1994 1995 1996 1997 1998 1994 1995 1996 1997 1998 1998
Untd Arab Em 107 116 84 84 102 34036 41415 27723 27723 25922 254Uzbekistan 0 5Viet Nam 1 3 4 2 31 290 1312 1608 1754 7619 250Yemen 1 70 87 0 106 473 20198 20890 1 15562 147
Europe 6501 6660 5466 7714 8544 3324795 3711812 2790387 3617474 3965841 464
Albania 3 3 2 1 1981 1981 618 609 659Austria 156 154 165 192 224 67479 81295 92133 91635 106533 476Bel-Lux 818 532 634 737 900 319802 326849 291362 286652 348964 388Belarus 8 2 2 2 2Bosnia Herzg 7 5 2349 2026 405Bulgaria 0 0 2 2 2
Croatia 9 2 2 3 3 2055 1786 1888 2888 2432 869Czech Rep 110 150 155 66 85 19359 20040 25842 23511 30319 357Denmark 48 53 45 100 114 55939 66597 58953 67902 73762 645Estonia 5 4 5 9 8 630 1012 1118 2669 2291 286Finland 62 52 58 66 72 39711 45975 43306 51822 54640 759France 482 543 447 539 538 280036 317972 250848 287538 282114 524Germany 676 708 553 852 955 388372 407072 310608 357354 319719 335Greece 20 16 55 290 304 10172 10225 18906 25933 25155 83Hungary 118 77 65 56 49 7410 9570 3974 7375 11440 232Iceland 4 5 11 9 10 2695 3192 3948 3532 3788 379Ireland 94 77 25 110 144 55639 61264 29451 72641 96448 670Italy 1739 1777 852 1760 2021 758860 874869 357570 739951 1008019 499Latvia 1 1 1 4 4 246 833 412 996 1185 296Lithuania 4 5 8 15 16 678 861 1106 2301 2931 183Macedonia 2 4 4 7 8 597 1499 1499 2748 3296 434Malta 11 10 4 11 10 6201 5892 1724 6282 5196 520Moldova Rep 21 3 0 2 0Netherlands 705 631 583 542 603 430940 411296 397498 340189 317284 526Norway 49 57 54 70 66 34933 46792 43727 54479 56324 853Poland 10 61 67 83 88 9000 16200 6357 28708 28518 326Portugal 104 138 200 161 194 60345 86315 92891 96962 115498 595Romania 1 2 1 2 2 555 1012 607 1819 1346 673Russian Fed 7 7 8 46 46 4154 4154 6462 22398 17677 384Slovakia 1 5 4 115 93 618 1811 1224 18734 15833 170Slovenia 95 89 78 84 93 24292 37024 26201 25733 28016 301Spain 525 719 514 900 1017 224699 326466 191669 429765 453062 445Sweden 114 139 115 106 123 67471 80184 71298 73420 91321 742Switzerland 93 99 72 69 109 59190 74654 57618 52323 71957 660UK 405 501 575 611 550 387810 376924 373670 414152 366123 666Ukraine 1 3 42 25 25 148 815 10400 5900 5900 236Yugoslavia 1 30 60 60 60 539 7200 14275 14275 14275 239Oceania 152 159 111 115 125 99409 100814 71986 69536 63591 510
Australia 133 145 94 100 108 87221 91455 63349 60752 54447 504Fr Polynesia 1 0 1 1 1
New Zealand 14 12 15 12 14 10251 7864 7724 7439 7841 560NewCaledonia 0 1 0 2 1
Tonga 2 0 0 0 0
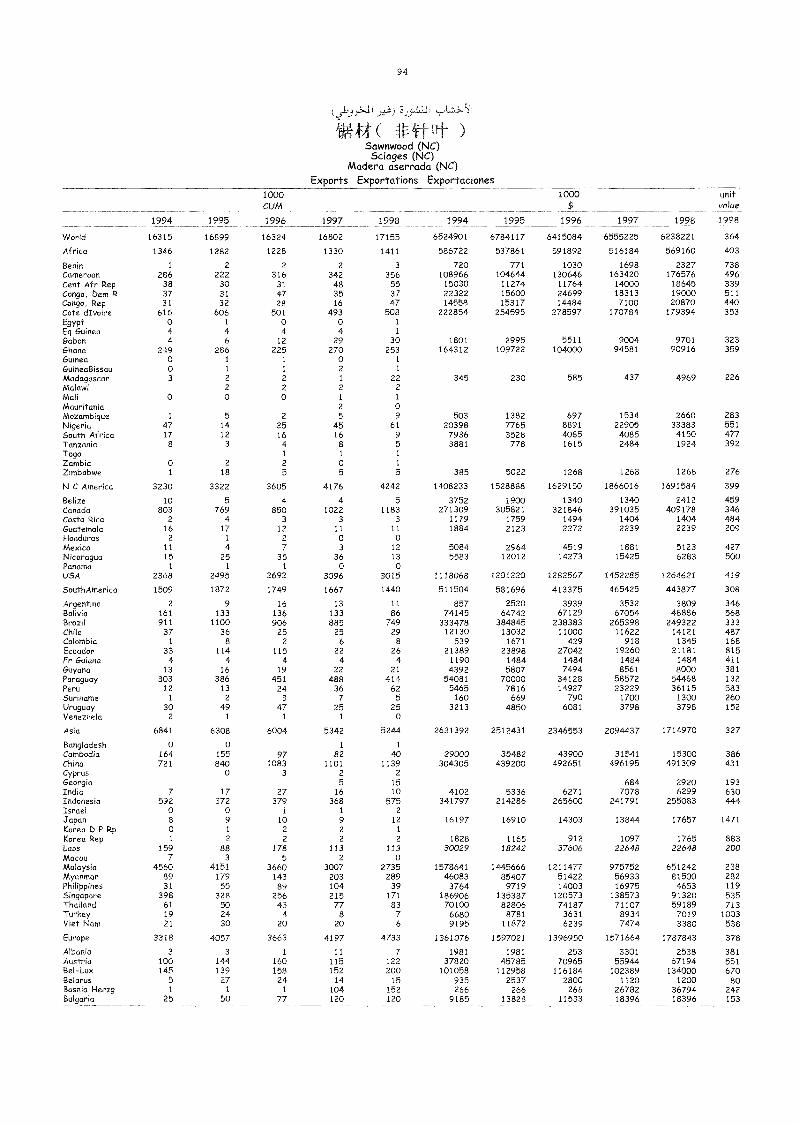
94
jb y.1,11 I
hW(vf-rut )Sawnwood (NC)5ciages (NC)
Madera aserrada (NC)Exports Exportations Exportaciones
1994 1995
1000CUM
1996 1997 1998 1994 1995
1000$
1996 1997 1998
unitvalue
1998
World 16315 16899 16324 16802 17155 6524901 6784117 6415084 6555225 6238221 364
Africa 1346 1282 1228 1330 1411 586722 537861 591892 516184 569160 403
Benin 1 2 2 2 3 720 771 1030 1698 2327 738Cameroon 286 222 316 342 356 108966 104644 130646 163420 176576 496Cent Afr Rep 38 30 31 48 55 15030 11274 11764 14000 18645 339Congo, Dam R 37 31 47 35 37 22322 15600 24699 18313 19000 511Congo, Rep 31 32 28 16 47 14558 15317 14484 7100 20870 440Cote dIvoire 616 606 501 493 508 222854 254595 278597 170784 179394 353Egypt 0 1 0 0 1
Eq Guinea 4 4 4 4 1
Gabon 4 6 12 29 30 1801 2995 5511 9004 9701 323Ghana 249 286 225 270 253 164312 109722 104000 94581 90916 359Guinea 0 1 1 o 1
GuMeaBissau 0 1 1 2 1
Madagascar 3 2 2 1 22 345 230 585 437 4969 226Malawi 2 2 2 2
Mah 0 0 0 1 1
Mauritania 2 0Mozambique 1 5 2 5 9 503 1382 697 1534 2660 283Nigeria 47 14 25 45 61 20398 7765 8891 22905 33383 551South Africa 17 12 16 16 9 7936 3528 4085 4085 4150 477Tanzania 8 3 4 8 5 3881 778 1615 2484 1924 392Togo 1 1 1
Zambia o 2 2 o 1
Zimbabwe 1 18 5 5 5 385 5022 1268 1268 1268 276
N C America 3230 3322 3605 4176 4242 1408233 1528888 1629150 1866016 1691584 399
Belize 10 5 4 4 5 3752 1900 1340 1340 2412 459Canada 803 769 850 1022 1183 271309 305821 321846 391035 409178 346Costa Rica 2 4 3 3 3 1179 1759 1494 1404 1404 484Guatemala 16 17 12 11 11 1884 2123 2272 2239 2239 209Honduras 2 1 2 o oMexico 11 4 7 3 12 5084 2964 4519 1881 5123 427Nicaragua 15 25 35 36 13 5583 12012 14273 15425 6283 500Panama 1 1 1 o oUSA 2368 2495 2692 3096 3015 1118068 1201220 1282567 1452285 1264621 419
SouthAmerica 1509 1872 1749 1667 1440 511504 581696 413375 465425 443877 308
Argentina 2 9 16 13 11 857 2520 3939 3532 3809 346Bolivia 161 133 136 133 86 74145 64742 67129 67054 48886 568Brazil 911 1100 906 885 749 333478 384845 238383 265398 249322 333Chile 37 36 25 25 29 12130 13032 11000 11622 14121 487Colombia 1 8 2 6 8 539 1671 429 918 1345 168Ecuador 33 114 115 22 26 21389 23898 27042 19260 21181 815Fr GuMna 4 4 4 4 4 1190 1484 1484 1484 1484 411Guyana 13 16 19 22 21 4392 5807 7494 8561 8000 381Paraguay 303 386 451 488 414 54081 70000 34128 58572 54468 132Peru 12 13 24 36 62 5465 7816 14927 23229 36115 583Suriname 1 2 3 7 5 160 669 790 1700 1300 260Uruguay 30 49 47 25 25 3213 4850 6081 3798 3798 152Venezuela 2 1 1 1 0
Asia 6841 6308 6004 5342 5244 2631392 2512431 2346553 2094437 1714970 327
Bangladesh 0 0 1 1
CambodM 164 155 97 82 40 29000 35482 43900 31541 15300 386China 721 840 1083 1101 1139 304305 439200 492651 496195 491309 431Cyprus 0 3 2 2
GeorgM 5 15 684 2920 193India 7 17 27 16 10 4102 5336 6271 7078 6299 630Indonesia 592 372 379 368 575 341797 214286 265600 241791 255083 444Israel 0 0 1 1 2
Japan 8 9 10 9 12 16197 16910 14303 13844 17657 1471Korea D P Rp 0 1 2 2 1
Korea Rep 1 2 2 2 2 1828 1165 912 1097 1765 883Laos 159 88 178 113 113 30029 18242 37606 22648 22648 200Macau 7 3 5 2 0Malaysia 4560 4151 3660 3007 2735 1578641 1445666 1211477 975752 651242 238Myanmar 89 179 143 203 289 46083 85407 51422 56933 81500 282PhilippMes 31 55 89 104 39 3764 9719 14003 16975 4653 119Singapore 398 328 256 215 171 186906 135387 120573 138573 91320 535Thailand 61 50 43 77 83 70100 82806 74187 71107 59189 713Turkey 19 24 4 8 7 6680 8781 3631 8934 7019 1003VMt Nam 21 30 20 20 6 9195 11872 6239 7474 3380 538
Europe 3318 4057 3663 4197 4733 1361076 1597021 1396950 1571664 1787843 378
Albania 3 3 1 11 7 1981 1981 253 3301 2538 381Austria 100 144 160 115 122 37820 45785 70965 55944 67194 551Bel-Lux 145 139 158 152 200 101058 112958 116184 102389 134000 670Manus 5 27 24 14 15 935 2537 2800 1120 1200 80BosnM Herzg 1 1 1 104 152 266 266 266 26782 36794 242Bulgaria 25 50 77 120 120 9185 13828 11533 18396 18396 153
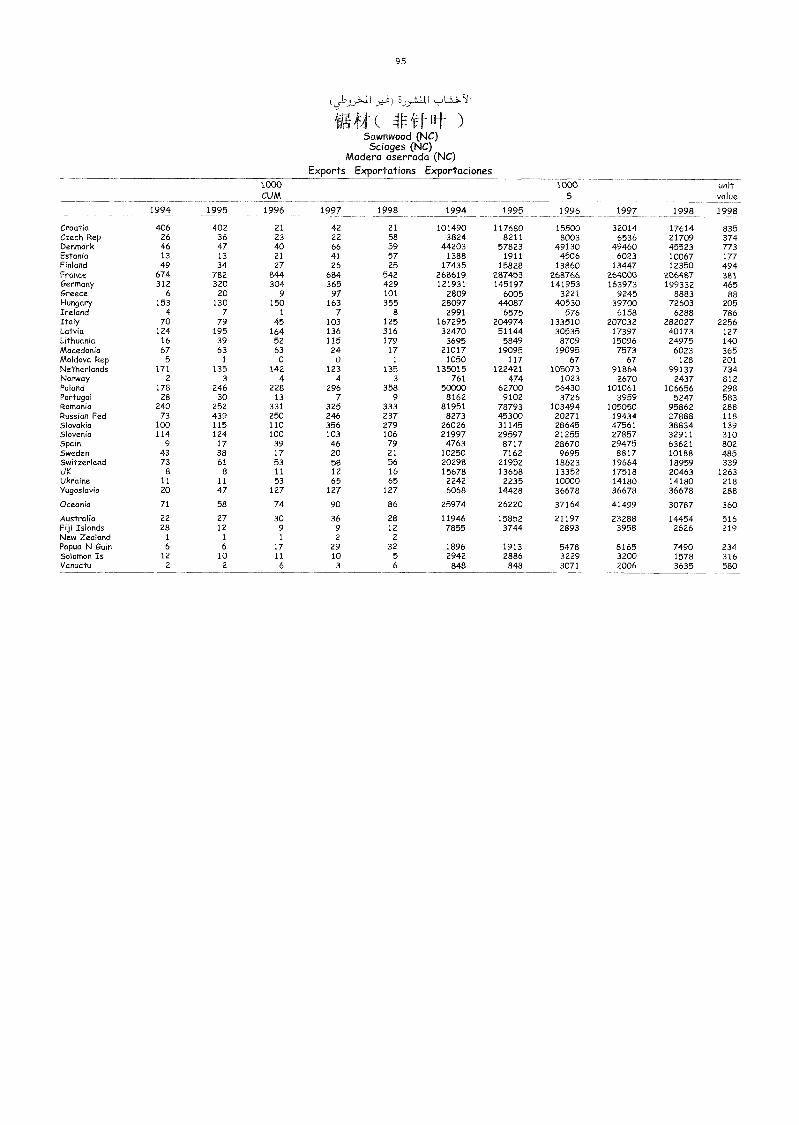
95
W( tf- FFt5awnwood (NC)Sciages (NC)
Madera aserrada (NC)Exports Exportations Exportaciones
1000CUM
1000 unitvalue
994 1995 1996 1997 1998 1994 1995 1996 1997 1998 1998
Croatia 406 402 21 42 21 101490 117680 15500 32014 17614 835Czech Rep 26 36 23 22 58 3824 8211 8003 6536 21709 374Denmark 46 47 40 66 59 44203 57823 49130 49460 45523 773Estonia 13 13 21 41 57 1388 1911 4506 6023 10067 177Finland 49 34 27 26 25 17435 15828 13860 13447 12350 494France 674 782 844 684 542 268619 287453 268766 264000 206487 381Germany 312 320 304 365 429 121931 145197 141953 163973 199332 465Greece 6 20 9 97 101 2809 6005 3221 9245 8883 88Hungary 153 130 150 163 355 28097 4-4087 40530 39700 72603 205Ireland 4 7 1 7 8 2991 6575 576 6158 6288 786Italy 70 79 45 103 125 167295 204974 133510 207032 282027 2256Latvia 124 195 164 136 316 32470 51144 30535 17397 40173 127Lithuania 16 39 52 115 179 3695 5849 8709 15096 24975 140Macedonia 67 63 63 24 17 21017 19095 19095 7573 6023 365Moldova Rep 5 1 0 0 1 1050 117 67 67 128 201Netherlands 171 135 142 123 135 135015 122421 105073 91864 99137 734Norway 2 3 4 4 3 761 474 1023 2670 2437 812Poland 178 246 228 296 358 50000 62700 56430 101061 106656 298Portugal 28 30 13 7 9 8162 9102 3726 3959 5247 583Romania 240 252 331 325 333 81951 78793 103494 105050 95862 288Russian Fed 73 439 250 246 237 8273 45300 20271 19434 27888 118Slovakia 100 115 110 356 279 26026 31145 28645 47561 38834 139Slovenia 114 124 100 103 106 21997 29597 21255 27857 32911 310Spain 9 17 39 46 79 4763 8717 28670 29475 63621 802Sweden 43 38 17 20 21 10250 7162 9695 8817 10188 485Switzerland 73 61 53 58 56 20298 21952 18623 19664 18959 339UK 8 8 11 12 16 15678 13658 13352 17518 20463 1263Ukraine 11 11 53 65 65 2242 2235 10000 14180 14180 218Yugoslavia 20 47 127 127 127 6068 14428 36678 36678 36678 288
Oceania 71 58 74 90 86 25974 26220 37164 41499 30787 360
Australia 22 27 30 36 28 11946 15852 21197 23288 14454 516Fiji Islands 28 12 9 9 12 7855 3744 2893 3958 2626 219New Zealand 1 1 1 2 2
Papua N Guin 6 6 17 29 32 1896 1913 5478 8165 7490 234Solomon Is 12 10 11 10 5 2942 2886 3229 3200 1578 316Vanuatu 2 2 6 3 6 848 848 3071 2006 3635 580

:1,J1`11
A ikWOOD-BASED PANELS
PANNEAUX ,41 BASE DE BOIS
TABLEROS DE A',47:Eli^.
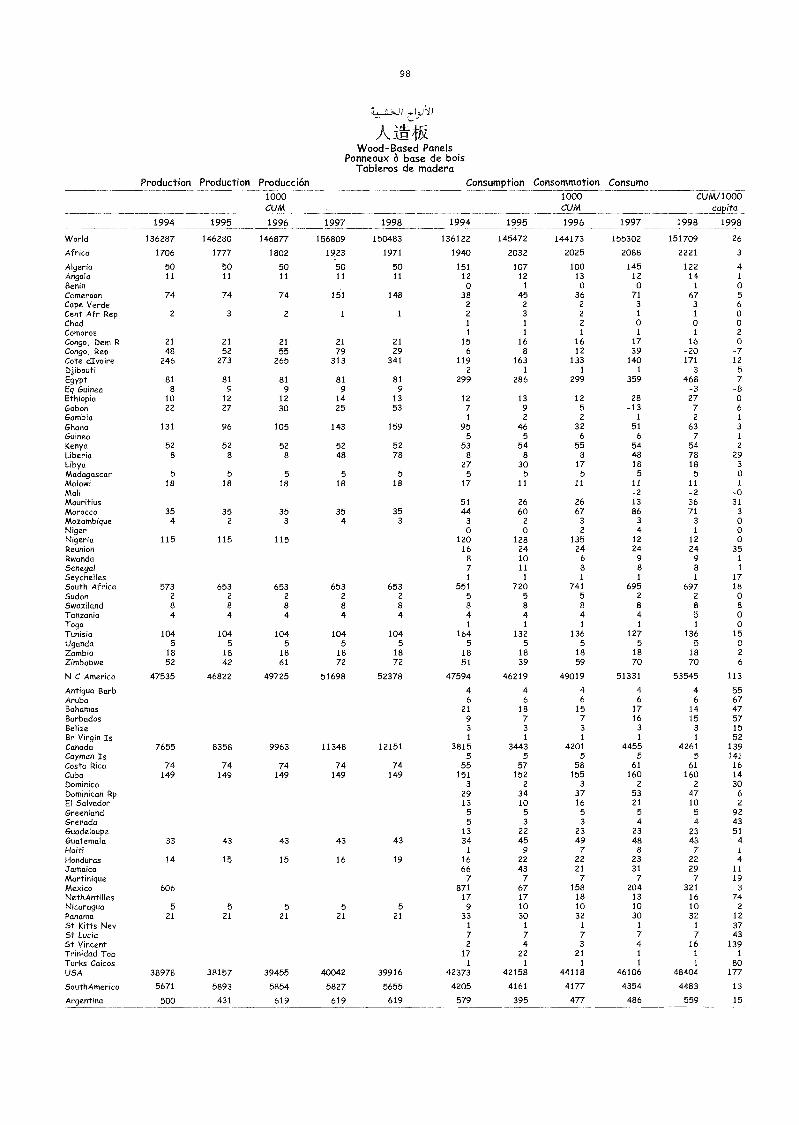
98
_01
I-JAWood-Based Panels
Panneaux base de boisTableros de madera
Production Production Producción Consumption Consommation Consumo
1994 1995
1000CUM
1996
1000CUM
1996 1997 1998
CUM/1000capita
19981997 1998 1994 1995
World 136287 146280 146877 156809 150483 136122 145472 144173 155302 151709 26
Africa 1706 1777 1802 1923 1971 1940 2032 2025 2088 2221 3
Algeria 50 50 50 50 50 151 107 100 145 122 4Angola 11 11 11 11 11 12 12 13 12 14 1
Benin 0 1 0 0 1 oCameroon 74 74 74 151 148 38 45 36 71 67 5Cape Verde 2 2 2 3 3 6Cent Afr Rep 2 3 2 1 1 2 3 2 1 1 0Chad 1 1 2 0 0 0Comoros 1 1 1 1 1 2
Congo, Dem R 21 21 21 21 21 15 16 16 17 16 oCongo, Rep 48 52 55 79 29 6 8 12 39 -20 -7Cote dIvoire 246 273 265 313 341 119 163 133 140 171 12
Djibouti 2 1 1 1 3 5
Egypt 81 81 81 81 81 299 286 299 359 468 7Eq Guinea 8 9 9 9 9 -3 -8Ethiopia 10 12 12 14 13 12 13 12 28 27 oGabon 22 27 30 25 53 7 9 5 -13 7 6
Gambia 1 2 2 1 2 1
Ghana 131 96 105 143 159 95 46 32 51 63 3
Guinea 5 5 6 6 7 1
Kenya 52 52 52 52 52 53 54 55 54 54 2
Liberia 8 8 8 48 78 8 8 8 48 78 29Libya 27 30 17 18 18 3
Madagascar 5 5 5 5 5 5 5 5 5 5 0Malawi 18 18 18 18 18 17 11 11 II 11 1
Mali -2 -2 -oMauritius 51 26 26 13 36 31Morocco 35 35 35 35 35 44 60 67 86 71 3
Mozambique 4 2 3 4 3 3 2 3 3 3 0Niger 0 0 2 4 1 oNigeria 115 115 115 120 128 135 12 12 0Reunion 16 24 24 24 24 35Rwanda 8 10 6 9 9 1
Senegal 7 11 8 8 8 1
Seychelles 1 1 1 1 1 17South Africa 573 653 653 653 653 551 720 741 695 697 18Sudan 2 2 2 2 2 5 5 5 2 2 oSwaziland 8 8 8 8 8 8 8 8 8 8 8
Tanzania 4 4 4 4 4 4 4 4 4 5 0Togo 1 1 1 1 1 oTunisia 104 104 104 104 104 164 132 136 127 136 15Uganda 5 5 5 5 5 5 5 5 5 5 oZambia 18 18 18 18 18 18 18 18 18 18 2
Zimbabwe 52 42 61 72 72 51 39 59 70 70 6
N C America 47535 46822 49725 51698 52378 47594 46219 49019 51331 53545 113
Antigua Barb 4 4 4 4 4 55Aruba 6 6 6 6 6 67Bahamas 21 18 15 17 14 47Barbados 9 7 7 16 15 57Belize 3 3 3 3 3 15Br Virgin Is 1 1 1 1 1 52Canada 7655 8358 9963 11348 12151 3815 3443 4201 4455 4261 139Cayman Is 5 5 5 5 5 141Costa Rica 74 74 74 74 74 55 57 58 61 61 16Cuba 149 149 149 149 149 151 152 155 160 160 14Dominica 3 2 3 2 2 30Dominican Rp 29 34 37 53 47 6El Salvador 13 10 16 21 10 2
Greenland 5 5 5 5 5 92Grenada 5 3 3 4 4 43Guadeloupe 13 22 23 23 23 51Guatemala 33 43 43 43 43 34 45 49 48 48 4Haiti 1 9 7 8 7 1
Honduras 14 15 15 16 19 16 22 22 23 22 4Jamaica 66 43 21 31 29 11Martinique 7 7 7 7 7 19Mexico 606 871 67 158 204 321 3
NethAntilles 17 17 18 13 16 74Nicaragua 5 5 5 5 5 9 10 10 10 10 2Panama 21 21 21 21 21 33 30 32 30 32 12St Kitts Nev 1 1 1 1 1 37St Lucia 7 7 7 7 7 43St Vincent 2 4 3 4 16 139Trinidad Tob 17 22 21 1 1 1
Turks Caicos 1 1 1 1 1 80USA 38978 38157 39455 40042 39916 42373 42158 44118 46106 48404 177
SouthAmerica 5671 5893 5854 5827 5655 4205 4161 4177 4354 4483 13
Argentina 500 431 619 619 619 579 395 477 486 559 15
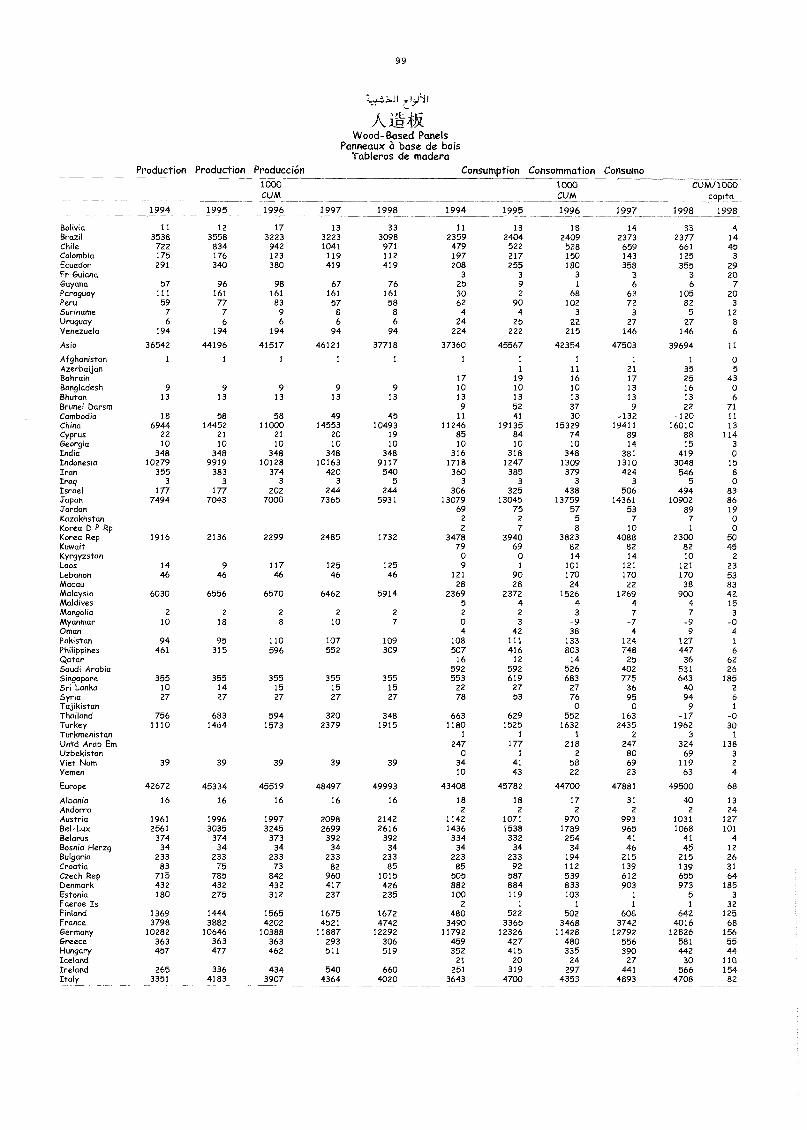
99
JolsWood-Based Panels
Panneaux 21 base de boisTableros de madera
Production Production Producción Consumption Consommation Consumo1000CUM
1997 1998 1994 1995
1000CUM
1996 1997
CUM/1000çqpito
1998 19981994 1995 1996
Bolivia 11 12 17 13 33 11 13 18 14 33 4Brazil 3538 3558 3223 3223 3098 2359 2404 2409 2373 2377 14Chile 722 834 942 1041 971 479 522 528 659 661 45Colombia 175 176 123 119 112 197 217 150 143 125 3
Ecuador 291 340 380 419 419 208 255 180 358 355 29Fr Guiana 3 3 3 3 3 20Guyana 57 96 98 67 76 25 9 1 6 6 7Paraguay 111 161 161 161 161 30 2 68 63 105 20Peru 59 77 83 57 58 62 90 102 72 82 3Suriname 7 7 9 8 8 4 4 3 3 5 12Uruguay 6 6 6 6 6 24 25 22 27 27 8Venezuela 194 194 194 94 94 224 222 215 146 146 6
Asia 36542 44196 41517 46121 37718 37360 45567 42354 47503 39694 11
Afghanistan 1 1 1 1 1 1 1 1 1 1 0Azerbaijan I 11 21 35 5Bahrain 17 19 16 17 25 43Bangladesh 9 9 9 9 9 10 10 10 13 16 0Bhutan 13 13 13 13 13 13 13 13 13 13 6Brunei Darsm 9 52 37 9 22 71Cambodia 18 58 58 49 45 11 41 30 -132 -120 -11China 6944 14452 11000 14553 10493 11246 19135 15329 19411 16010 13Cyprus 22 21 21 20 19 85 84 74 89 88 114Georgia 10 10 10 10 10 10 10 10 14 15 3India 348 348 348 348 348 316 318 348 381 419 0Indonesia 10279 9919 10128 10163 9117 1718 1247 1309 1310 3048 15Iran 355 383 374 420 540 360 385 379 424 546 8Iraq 3 3 3 3 5 3 3 3 3 5 0Israel 177 177 202 244 244 306 325 438 506 494 83Japan 7494 7043 7000 7365 5931 13079 13045 13759 14361 10902 86Jordan 69 75 57 53 89 19Kazakhstan 2 2 5 7 7 0Korea D P Rp 2 7 8 10 1 0Korea Rep 1916 2136 2299 2485 1732 3478 3940 3823 4088 2300 50Kuwait 79 69 82 82 82 45Kyrgyzstan 0 0 14 14 10 2
Laos 14 9 117 125 125 9 1 101 121 121 23Lebanon 46 46 46 46 46 121 90 170 170 170 53Macau 28 28 24 22 38 83Malaysia 6030 6556 6570 6462 5914 2369 2372 1526 1269 900 42Maldives 5 4 4 4 4 15Mongolia 2 2 2 2 2 2 2 3 7 7 3Myanmar 10 18 8 10 7 0 3 -9 -7 -9 -0Oman 4 42 38 4 9 4Pakistan 94 95 110 107 109 108 111 133 124 127 IPhilippines 461 315 596 552 309 507 416 803 748 447 6Qatar 16 12 14 25 36 62Saudi Arabia 592 592 526 402 531 26Singapore 355 355 355 355 355 553 619 683 775 643 185Sri Lanka 10 14 15 15 15 22 27 27 36 40 2Syria 27 27 27 27 27 78 53 76 95 94 6Tajikistan 0 0 9 1
Thailand 756 683 594 320 348 663 629 552 163 -17 -0Turkey 1110 1464 1573 2379 1915 1180 1525 1632 2435 1962 30Turkmenistan 1 1 I 2 3 IUntd Arab Em 247 177 218 247 324 138Uzbekistan 0 1 2 80 69 3Viet Nam 39 39 39 39 39 34 41 58 69 119 2
Yemen 10 43 22 23 63 4
Europe 42672 45334 45519 48497 49993 43408 45782 44700 47881 49500 68
Albania 16 16 16 16 16 18 18 17 31 40 13Andorra 2 2 2 2 2 24Austria 1961 1996 1997 2098 2142 1142 1071 970 993 1031 127Bel-Lux 2561 3035 3245 2699 2616 1436 1538 1789 965 1068 101Belarus 374 374 373 392 392 334 332 254 41 41 4Bosnia Herzg 34 34 34 34 34 34 34 34 46 45 12Bulgaria 233 233 233 233 233 223 233 194 215 215 26Croatia 83 75 73 82 85 85 92 112 139 139 31Czech Rep 715 785 842 960 1015 505 587 539 612 655 64Denmark 432 432 432 417 426 882 884 833 903 973 185Estonia 180 275 312 237 235 100 119 103 1 5 3
Faeroe Is 2 1 1 1 1 32Finland 1369 1444 1565 1675 1672 480 522 502 608 642 125France 3798 3882 4202 4521 4742 3490 3365 3468 3742 4016 68Germany 10282 10646 10388 11887 12292 11792 12326 11428 12792 12826 156Greece 363 363 363 293 306 459 427 480 556 581 55Hungary 457 477 462 511 519 352 415 335 390 442 44Iceland 21 20 24 27 30 110Ireland 265 336 434 540 660 251 319 297 441 566 154Italy 3351 4183 3907 4364 4020 3643 4700 4353 4893 4708 82
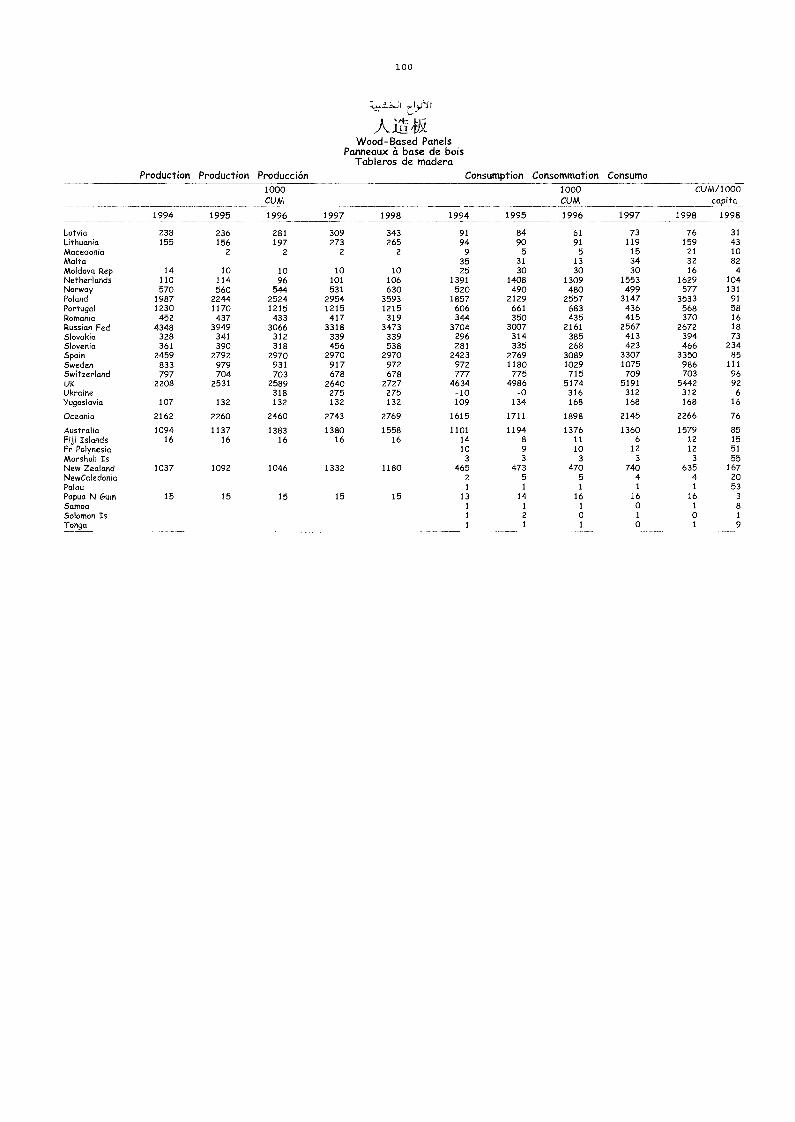
10 0
L-
AWood-Based Panels
Panneaux a base de boisTableros de madera
Production Production Producción Consumption Consommation Consumo1000CUM
1997 1998 1994 1995
1000CUM
1996 1997 1998
CUM/1000capita
19981994 1995 1996
Latvia 238 236 281 309 343 91 84 61 73 76 31Lithuania 155 156 197 273 265 94 90 91 119 159 43Macedonia 2 2 2 2 9 5 5 15 21 10Malta 35 31 13 34 32 82Moldova Rep 14 10 10 10 10 25 30 30 30 16 4Netherlands 110 114 96 101 106 1391 1408 1309 1553 1629 104Norway 570 560 544 531 630 520 490 480 499 577 131Poland 1987 2244 2524 2954 3593 1857 2129 2557 3147 3533 91Portugal 1230 1170 1215 1215 1215 606 661 683 436 568 58Romania 452 437 433 417 319 344 350 435 415 370 16Russian Fed 4348 3949 3066 3318 3473 3704 3007 2161 2567 2672 18Slovakia 328 341 312 339 339 296 314 385 413 394 73Slovenia 361 390 318 456 538 281 335 268 423 466 234Spain 2459 2792 2970 2970 2970 2423 2769 3089 3307 3350 85Sweden 833 979 931 917 972 972 1180 1029 1075 986 111Switzerland 797 704 703 678 678 If/ 775 715 709 703 96UK 2208 2531 2589 2640 2727 4634 4986 5174 5191 5442 92Ukraine 318 275 275 -10 -0 316 312 312 6
Yugoslavia 107 132 132 132 132 109 134 168 168 168 16
Oceania 2162 2260 2460 2743 2769 1615 1711 1898 2145 2266 76
Australia 1094 1137 1383 1380 1558 1101 1194 1376 1360 1579 85Fiji Islands 16 16 16 16 16 14 8 11 6 12 15Fr Polynesia 10 9 10 12 12 51Marshall Is 3 3 3 3 3 55New Zealand 1037 1092 1046 1332 1180 465 473 470 740 635 167NewCaledonia 2 5 5 4 4 20Palau 1 1 1 1 1 53Papua N Guin 15 15 15 15 15 13 14 16 16 16 3Samoa 1 1 1 0 1 8Solomon Is 1 2 0 1 0 1
Tonga 1 1 1 0 1 9
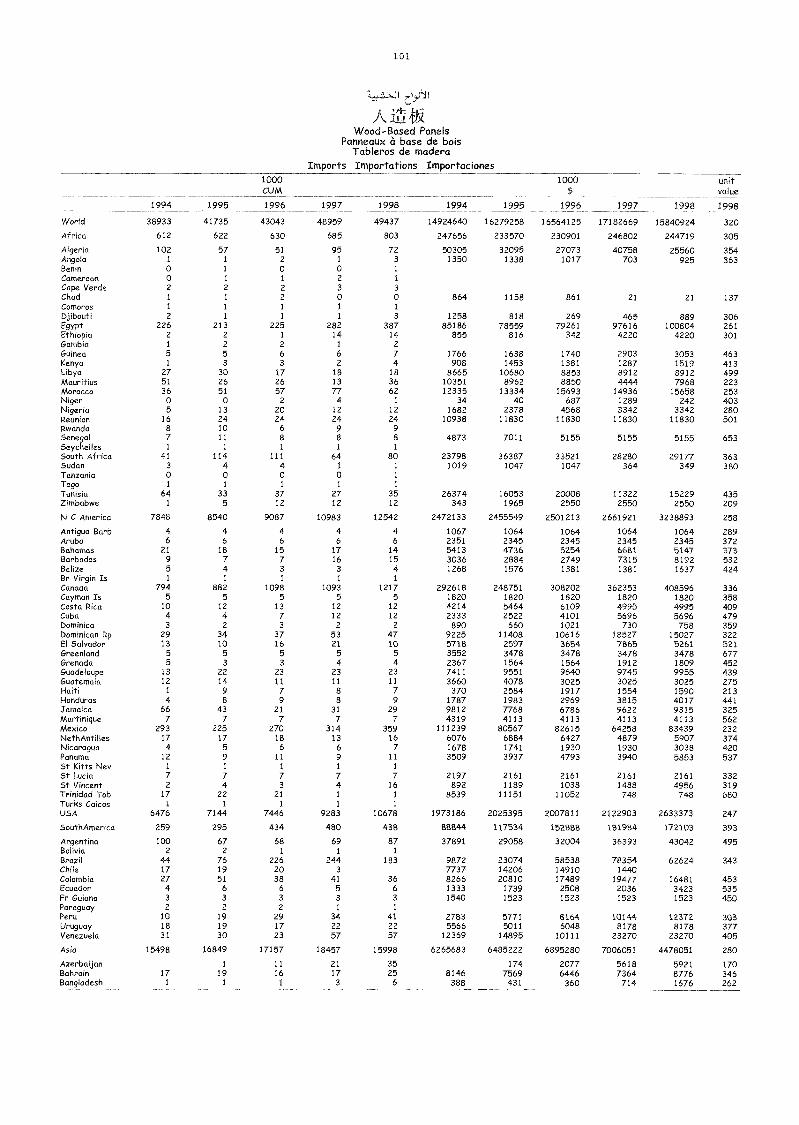
101
Wood-Based PanelsPanneaux à base de bois
Tableros de maderaImports Importations Importaciones
1994 1995
1000CUM
1996 1997 1998 1994 1995
1000$
1996 1997 1998
unitvalue
1998
World 38933 41735 43043 48959 49437 14924640 16279258 16564125 17182669 15840924 320
Africa 612 622 630 685 803 247656 233570 230901 246802 244719 305
Algeria 102 57 51 95 72 50305 32095 27073 40758 25560 354Angola 1 1 2 1 3 1350 1338 1017 703 925 363Benin 0 1 0 0 1
Cameroon 0 1 1 2 1
Cape Verde 2 2 2 3 3
Chad 1 1 2 0 0 864 1158 861 21 21 137Comoros 1 1 1 1 1
Djibouti 2 1 1 1 3 1258 818 269 465 889 306Egypt 226 213 225 282 387 85186 78559 79261 97616 100804 261Ethiopia 2 2 1 14 14 855 816 342 4220 4220 301Gambia 1 2 2 1 2Guinea 5 5 6 6 7 1766 1638 1740 2903 3053 463Kenya 1 3 3 2 4 908 1453 1381 1287 1519 413Libya 27 30 17 18 18 8665 10680 8853 8912
44448912 499
Mauritius 51 26 26 13 36 10351 8962 8850 7968 22314936Morocco 36 51 57 77 62 12335 13334 15693 15658 253
Niger 0 0 2 4 1 34 40 687 1289 242 403Nigeria 5 13 20 12 12 1682 2378 4568 3342 3342 280Reunion 16 24 24 24 24 10938 11830 11830 11830 11830 501Rwanda 8 10 6 9 9Senegal 7 11 8 8 8 4873 7011 5155 5155 5155 653Seychelles 1 1 1 1 1
South Africa 41 114 111 64 80 23798 36387 33521 28280 29177 363Sudan 3 4 4 1 1 1019 1047 1047 364 349 380Tanzania 0 0 0 0 1
Togo 1 1 1 1 1
Tunisia 64 33 37 27 35 26374 16053 20008 11322 15229 435Zimbabwe 1 5 12 12 12 343 1965 2550 2550 2550 209
N C America 7848 8540 9087 10983 12542 2472133 2455549 2501213 2661921 3238893 258
Antigua Barb 4 4 4 4 4 1067 1064 1064 1064 1064 289Aruba 6 6 6 6 6 2351 2345 2345 2345 2345 372Bahamas 21 16 15 17 14 5413 4736 5254 6681 5147 373Barbados 9 7 7 16 15 3036 2884 2749 7315 8192 532Belize 5 4 3 3 4 1268 1576 1381 1381 1637 424Br Virgin Is 1 1 1 1 1
Canada 794 882 1098 1093 1217 292618 248751 308202 362353 408596 336Cayman Is 5 5 5 5 5 1820 1820 1820 1820 1820 358Costa Rica 10 12 13 12 12 4214 5464 6109 4995 4995 409Cuba 4 4 7 12 12 2333 2522 4101 5696 5696 479Dominica 3 2 3 2 2 890 660 1021 730 758 359Dominican Rp 29 34 37 53 47 9225 11408 10616 18527 15027 322El Salvador 13 10 16 21 10 5718 2597 3654 7865 5261 521Greenland 5 5 5 5 5 3552 3478 3478 3478 3478 677Grenada 5 3 3 4 4 2367 1564 1564 1912 1809 452Guadeloupe 13 22 23 23 23 7411 9551 9640 9745 9955 439Guatemala 12 14 11 11 11 3660 4078 3025 3025 3025 275Haiti 1 9 7 8 7 370 2584 1917 1554 1590 213Honduras 4 8 9 8 9 1787 1983 2969 3815 4017 441Jamaica 66 43 21 31 29 9812 7768 6786 9622 9315 325Martinique 7 7 7 7 7 4319 4113 4113 4113 4113 562Mexico 293 225 270 314 359 111239 80567 82615 64258 83439 232NethAntilles 17 17 18 13 16 6076 6884 6427 4879 5907 374Nicaragua 4 5 6 6 7 1678 1741 1930 1930 3038 420Panama 12 9 11 9 11 3509 3937 4793 3940 5853 537St Kitts Nev 1 1 1 1 1
St Lucia 7 7 7 7 7 2197 2161 2161 2161 2161 332St Vincent 2 4 3 4 16 892 1189 1038 1488 4956 319Trinidad Tob 17 22 21 1 1 8539 11151 11052 748 748 680Turks Caicos 1 1 1 1 1
USA 6476 7144 7446 9283 10678 1973186 2025395 2007811 2122903 2633373 247
SouthAmerica 259 295 434 480 438 88844 117534 152888 181984 172103 393
Argentina 100 67 68 69 87 37891 29058 32004 36393 43042 495Bolivia 2 2 I 1 1
Brazil 44 76 226 244 183 9872 23074 58538 78354 62624 343Chile 17 19 20 3 7737 14206 14910 1440Colombia 27 51 38 41 36 8266 20810 17489 19477 16481 453Ecuador 4 6 6 5 6 1333 1739 2508 2036 3423 535Fr Guiana 3 3 3 3 3 1540 1523 1523 1523 1523 450Paraguay 2 2 2 1 1
Peru 10 19 29 34 41 2783 5771 8164 10144 12372 303Uruguay 18 19 17 22 22 5566 5011 6048 8178 8178 377Venezuela 31 30 23 57 57 12369 14895 10111 23270 23270 405
Asia 15498 16849 17157 18457 15998 6265683 6485222 6895280 7006051 4478051 280
Azerbaijan 1 11 21 35 174 2077 5618 5921 170Bahrain 17 19 16 17 25 8146 7569 6446 7364 8776 346Bangladesh 1 1 1 3 6 388 431 360 714 1676 262
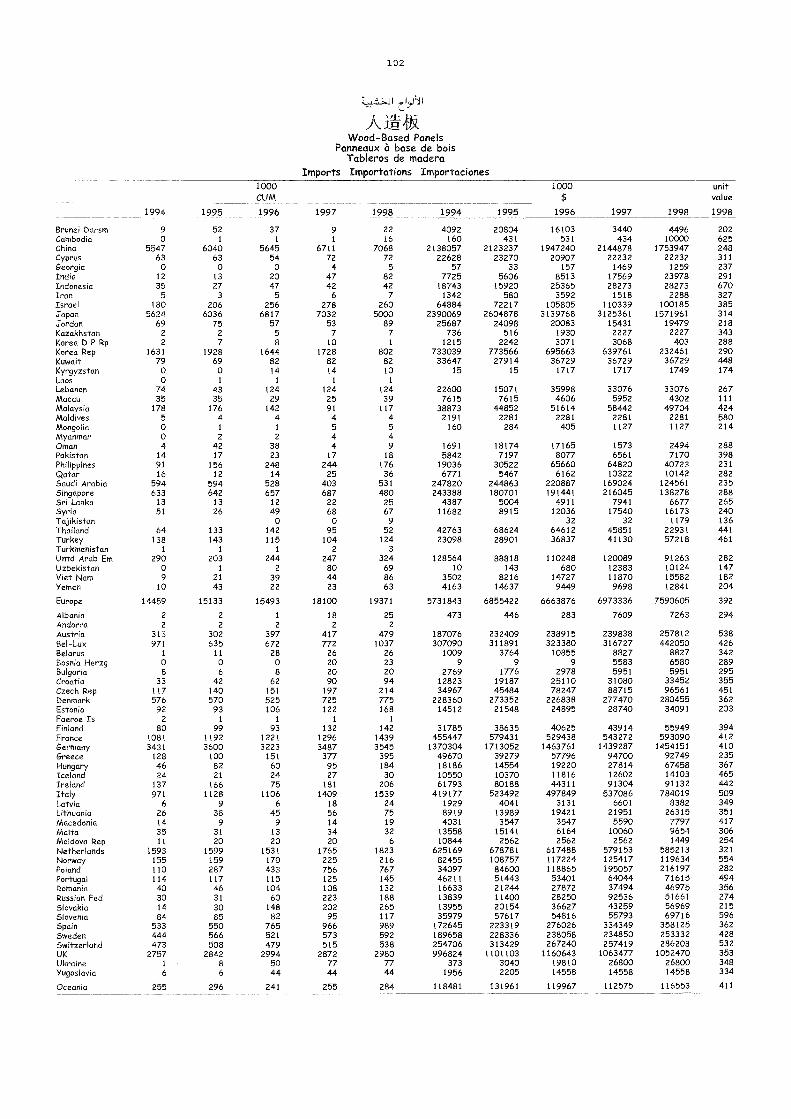
102
Wood-Based PanelsPanneaux à base de bois
Tableros de maderaImports Importations Importaciones
1994 1995
1000CUM
1996 1997 1998 1994 1995
1000$
unitvalue
19981996 1997 1998
Brunei Darsm 9 52 37 9 22 4092 20804 16103 3440 4496 202Cambodia 0 1 1 1 16 160 431 531 434 10000 625China 5547 6040 5645 6711 7068 2138057 2123237 1947240 2144878 1753947 248Cyprus 63 63 54 72 72 22628 23270 20907 22232 22232 311Georgia 0 0 0 4 5 57 33 157 1469 1259 237India 12 13 20 47 82 7725 5606 8513 17569 23978 291Indonesia 35 27 47 42 42 18743 15920 25365 28273 28273 670Iran 5 3 5 6 7 1342 580 3592 1518 2288 327Israel 180 206 256 278 260 64884 72217 105805 110339 100185 385Japan 5624 6036 6817 7032 5000 2390069 2604878 3139768 3125361 1571961 314Jordan 69 75 57 53 89 25687 24098 20083 15431 19479 218Kazakhstan 2 2 5 7 7 736 516 1930 2227 2227 343Korea D P Rp 2 7 8 10 1 1215 2242 3071 3068 403 288Korea Rep 1631 1928 1644 1728 802 733039 773566 695663 639761 232461 290Kuwait 79 69 82 82 82 33647 27914 36729 36729 36729 448Kyrgyzstan 0 0 14 14 10 15 15 1717 1717 1749 174Laos 0 1 1 1 1
Lebanon 74 43 124 124 124 22600 15071 35998 33076 33076 267Macau 35 35 29 25 39 7615 7615 4606 5952 4302 111Malaysia 178 176 142 91 117 38873 44852 51614 58442 49704 424Maldives 5 4 4 4 4 2191 2281 2281 2281 2281 580Mongolia 0 1 1 5 5 160 284 405 1127 1127 214Myanmar 0 2 2 4 4Ornan 4 42 38 4 9 1691 18174 17165 1573 2494 288Pakistan 14 17 23 17 18 5842 7197 8077 6561 7170 398Philippines 91 156 248 244 176 19036 30522 65660 64820 40723 231Qatar 16 12 14 25 36 6771 5467 6162 10322 10142 282Saudi Arabia 594 594 528 403 531 247820 244863 220887 169024 124561 235Singapore 633 642 657 687 480 243388 180701 191441 216045 138278 288Sri Lanka 13 13 12 22 25 4387 5004 4911 7941 6677 265Syria 51 26 49 68 67 11682 8915 12036 17540 16173 240Tajikistan 0 0 9 32 32 1179 136Thailand 64 133 142 95 52 42763 68624 64612 45851 22931 441Turkey 138 143 115 104 124 23098 28901 36837 41130 57218 461Turkmenistan 1 1 1 2 3
Untd Arab Em 290 203 244 247 324 128564 88818 110248 120089 91263 282Uzbekistan 0 1 2 80 69 10 143 680 12383 10124 147Viet Nam 9 21 39 44 86 3502 8216 14727 11870 15582 182Yemen 10 43 22 23 63 4163 14637 9449 9698 12841 204
Europe 14459 15133 15493 18100 19371 5731843 6855422 6663876 6973336 7590605 392
Albania 2 2 1 18 25 473 446 283 7609 7263 294Andorra 2 2 2 2 2
Austria 313 302 397 417 479 187076 232409 238915 239838 257812 538Bel -Lux 971 635 672 772 1037 307090 311891 323380 316727 442050 426Belarus 1 11 28 26 26 1009 3764 10855 8827 8827 342Bosnia Herzg 0 0 0 20 23 9 9 9 5583 6580 289Bulgaria 8 6 8 20 20 2769 1776 2978 5951 5951 295Croatia 33 42 62 90 94 12823 19187 25110 31080 33452 355Czech Rep 117 140 151 197 214 34967 45484 78247 88715 96561 451Denmark 576 570 525 725 775 228360 273352 226838 277470 280455 362Estonia 92 93 106 122 168 14512 21548 24895 28740 34091 203Faeroe Is 2 1 1 1 1
Finland 80 99 93 132 142 31785 38635 40625 43914 55949 394France 1081 1192 1221 1296 1439 455447 579431 529438 543272 593090 412Germany 3431 3600 3223 3487 3545 1370304 1713052 1463761 1439287 1454151 410Greece 128 100 151 377 395 49670 39279 57796 94700 92749 235Hungary 46 82 60 95 184 18186 14554 19220 27814 67458 367Iceland 24 21 24 27 30 10550 10370 11816 12602 14103 465Ireland 137 166 75 181 206 61793 80188 44311 91304 91132 442Italy 971 1128 1106 1409 1539 419177 523492 497849 537086 784019 509Latvia 6 9 6 18 24 1929 4041 3131 6601 8382 349Lithuania 26 38 45 56 75 8919 13989 19421 21951 26315 351Macedonia 14 9 9 14 19 4031 3547 3547 5590 7797 417Malta 35 31 13 34 32 13558 15141 6164 10060 9654 306Moldova Rep 11 20 20 20 6 10844 2562 2562 2562 1449 254Netherlands 1593 1599 1531 1765 1823 625169 678781 617488 579153 585213 321Norway 155 159 170 225 216 82455 108757 117224 125417 119634 554Poland 110 287 433 756 767 34097 84600 118865 195057 216197 282Portugal 114 117 115 125 145 46211 51443 53401 64044 71615 494Romania 40 46 104 108 132 16633 21244 27872 37494 46975 356Russian Fed 30 31 60 223 188 13839 11400 28250 92536 51661 274Slovakia 14 30 148 202 265 13955 20154 36627 43259 56969 215Slovenia 84 85 82 95 117 35979 57617 54816 55793 69716 596Spain 533 550 765 966 989 172645 223319 276026 334349 358125 362Sweden 444 566 521 573 592 189658 228336 238058 234850 253332 428Switzerland 473 508 479 515 538 254706 313429 267240 257419 286203 532UK 2757 2842 2994 2872 2980 996824 1101103 1160643 1063477 1052470 353Ukraine 1 8 50 77 77 373 3040 19810 26800 26800 348Yugoslavia 6 6 44 4-4 44 1956 2205 14558 14558 14558 334
Oceania 255 296 241 255 284 118481 131961 119967 112575 116553 411
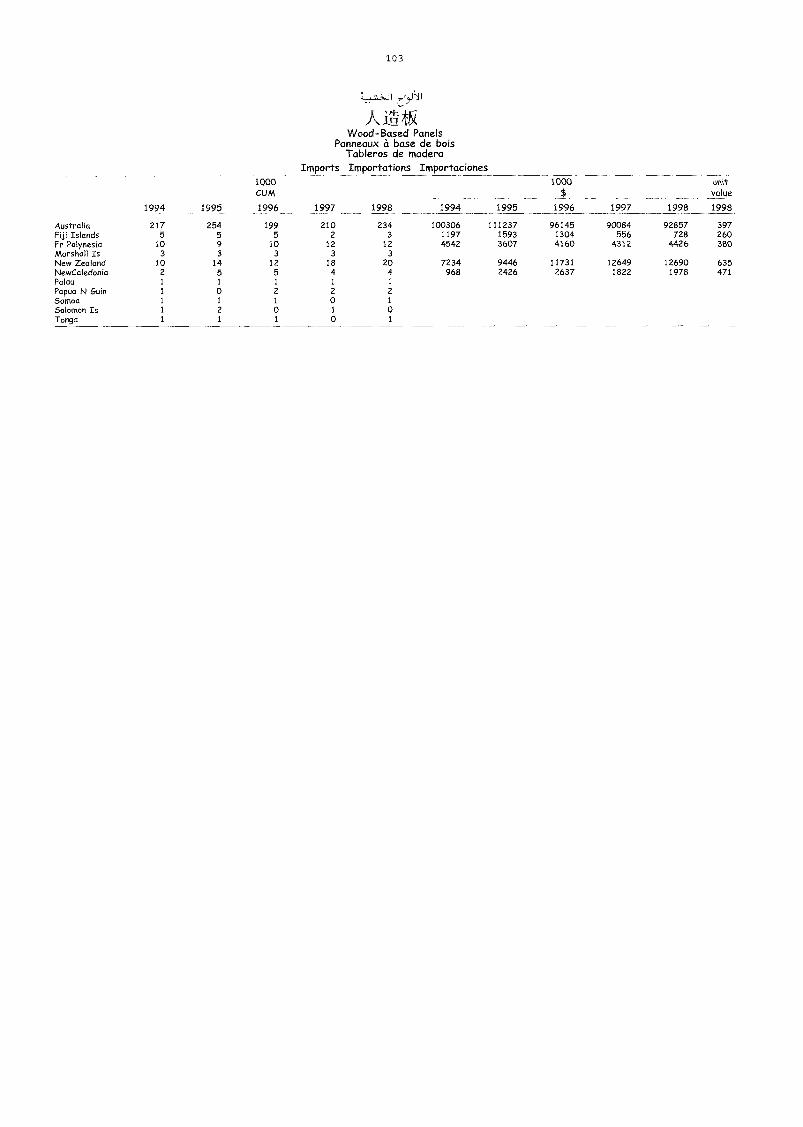
103
Wood-Based PanelsPanneaux a base de bois
Tableros de maderaImports Importations Importaciones
1994 1995
1000CUM
1996 1997 1998 1994 1995
1000$
1996 1997 1998
unitvalue
1998
Australia 217 254 199 210 234 100306 111237 96145 90084 92857 397Fiji Islands 5 5 5 2 3 1197 1593 1304 556 728 260Fr Polynesia 10 9 10 12 12 4542 3607 4160 4312 4426 380Marshall Is 3 3 3 3 3
New Zealand 10 14 12 18 20 7234 9446 11731 12649 12690 635NewCaledonia 2 5 5 4 4 968 2426 2637 1822 1978 471Palau 1 1 1 1 1
Papua N Guin 1 0 2 2 2
Samoa 1 1 1 0 1
Solomon Is 1 2 0 1 0Tonga 1 1 1 0 1
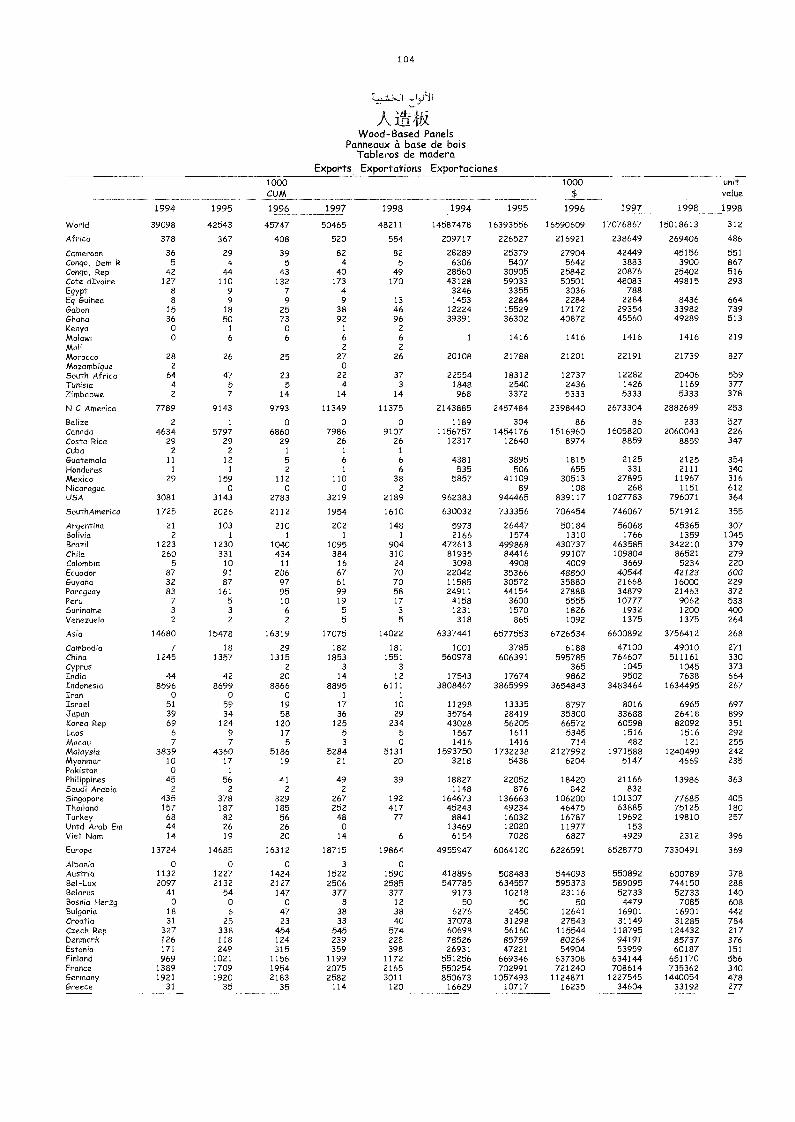
1 0 4
VVood- Based PanelsPanneaux 6 base de bois
Tableros de maderaExports Exportations Exportaciones
1994 1995
1000CUM
1996 1997 1998 1994 1995
1000$
1996 1997 1998
unitvalue
1998
VVorld 39098 42543 45747 50465 48211 14587478 16393556 16590609 17076867 15018613 312
Africa 378 367 408 520 554 209717 226527 216921 238649 269406 486
Cameroon 36 29 39 82 82 28289 25379 27904 42449 45156 551Congo, Dem R 5 4 5 4 5 6306 5407 5642 3883 3900 867Congo, Rep 42 44 43 40 49 28560 30905 25842 20876 25402 516Cote dIvoire 127 110 132 173 170 43128 59033 50501 48083 49815 293Egypt 8 9 7 4 3246 3355 3036 788Eq Guineo 8 9 9 9 13 1453 2284 2284 2284 8436 664Gabon 15 18 25 38 46 12224 15529 17172 29354 33982 739Ghana 36 50 73 92 96 39391 36302 40872 45560 49289 513Kenya 0 1 0 1 2
Malawi 0 6 6 6 6 1 1416 1416 1416 1416 219Mali 2 2
Morocco 28 26 25 27 26 20108 21788 21201 22191 21739 827Mozambique 2 0South Africa 64 47 23 22 37 22554 18312 12737 12282 20406 559Tunisia 4 5 5 4 3 1848 2540 2436 1426 1169 377Zimbabwe 2 7 14 14 14 968 3372 5333 5333 5333 378
N C America 7789 9143 9793 11349 11375 2143885 2457484 2398440 2673304 2882689 253
Belize 2 1 0 0 0 1189 304 86 86 233 527Canada 4634 5797 6860 7986 9107 1156757 1454176 1516960 1605820 2060043 226Costa Rica 29 29 29 26 26 12317 12640 8974 8859 8859 347Cuba 2 2 1 1 1
Guatemala 11 12 5 6 6 4381 3895 1815 2125 2125 354Honduras 1 1 2 1 6 535 506 655 331 2111 340Mexico 29 159 112 110 38 5857 41109 30513 27895 11967 316Nicaragua 0 0 0 2 89 108 268 1151 612USA 3081 3143 2783 3219 2189 962383 944465 839117 1027783 796071 364
SouthAmerica 1725 2026 2112 1954 1610 630032 733356 706454 746067 571912 355
Argentina 21 103 210 202 148 5973 26447 50184 56068 45365 307Bolivia 2 1 1 1 1 2166 1574 1310 1766 1359 1045Brazil 1223 1230 1040 1095 904 472613 499868 430737 463585 342210 379Chile 260 331 434 384 310 81935 84416 99107 109804 86521 279Colombia 5 10 11 16 24 3098 4908 4009 3669 5234 220Ecuador 87 91 206 67 70 22042 35366 48850 40544 42123 600Guyana 32 87 97 61 70 11585 30572 35880 21668 16000 229Paraguay 83 161 95 99 58 24911 44154 27888 34879 21463 372Peru 7 5 10 19 17 4158 3600 5555 101// 9062 533Suriname 3 3 6 5 3 1231 1570 1826 1932 1200 400Venezuela 2 2 2 5 5 318 865 1092 1375 1375 264
Asia 14680 15478 16319 17075 14022 6337441 6577553 6726534 6600892 3756412 268
Cambodia 7 18 29 182 181 1001 3785 6188 47100 49010 271China 1245 1357 1315 1853 1551 560978 606391 595785 764607 511161 330Cyprus 2 3 3 365 1045 1045 373India 44 42 20 14 12 17543 17674 9862 9502 7638 664Indonesia 8596 8699 8866 8895 6111 3808467 3865999 3654843 3483464 1634495 267Iran 0 0 0 1 1
Israel 51 59 19 17 10 11298 13335 8797 8016 6965 697Japan 39 34 58 36 29 35764 28419 35300 33688 26418 899Korea Rep 69 124 120 125 234 43028 56205 66572 60598 82092 351Laos 6 9 17 5 5 1567 1611 5345 1516 1516 292Macau 7 7 5 3 0 1416 1416 714 482 121 255Malaysia 3839 4360 5186 5284 5131 1593750 1732238 2127992 1971588 1240499 242Myanmar 10 17 19 21 20 3218 5438 6204 5147 4669 235Pakistan 0 1
PhilippMes 45 56 41 49 39 18827 22052 18420 21166 13986 363SaudiArabM 2 2 2 2 1148 876 842 832SMgapore 435 378 329 267 192 164673 136663 106200 101307 77685 405Thailand 157 187 185 252 417 45243 49234 46475 63885 75125 180Turkey 68 82 56 48 77 8841 16032 16787 19692 19810 257Untd Arab Em 44 26 26 0 13469 12020 11977 153VMt Nam 14 19 20 14 6 6154 7028 6827 4929 2312 396
Europe 13724 14685 16312 18715 19864 4955947 6064120 6226591 6528770 7330491 369
Albania 0 0 0 3 0Austria 1132 1227 1424 1522 1590 418896 508483 544093 550892 600789 378Bel-Lux 2097 2132 2127 2506 2585 547785 634557 595373 589095 744150 288BeMrus 41 54 147 377 377 9173 10218 23116 52733 52733 140BosnM Herzg 0 0 0 8 12 50 50 50 4479 7085 608Bulgaria 18 6 47 38 38 6276 2450 12641 16901 16901 442Croatia 31 25 23 33 40 37078 31298 27543 31149 31285 784Czech Rep 327 338 454 545 574 60698 56160 115544 118795 124432 217Denmark 126 118 124 239 228 78526 85759 80264 94191 85737 376Estonia 171 249 315 359 398 26931 47221 54904 53959 60187 151FMMnd 969 1021 1156 1199 1172 551256 669346 637308 634144 651170 556France 1389 1709 1954 2075 2165 550254 702991 721240 708614 735362 340Germany 1921 1920 2183 2582 3011 850673 1057493 1124871 1227545 1440054 478Greece 31 35 35 114 120 16629 10717 16235 34604 33192 277
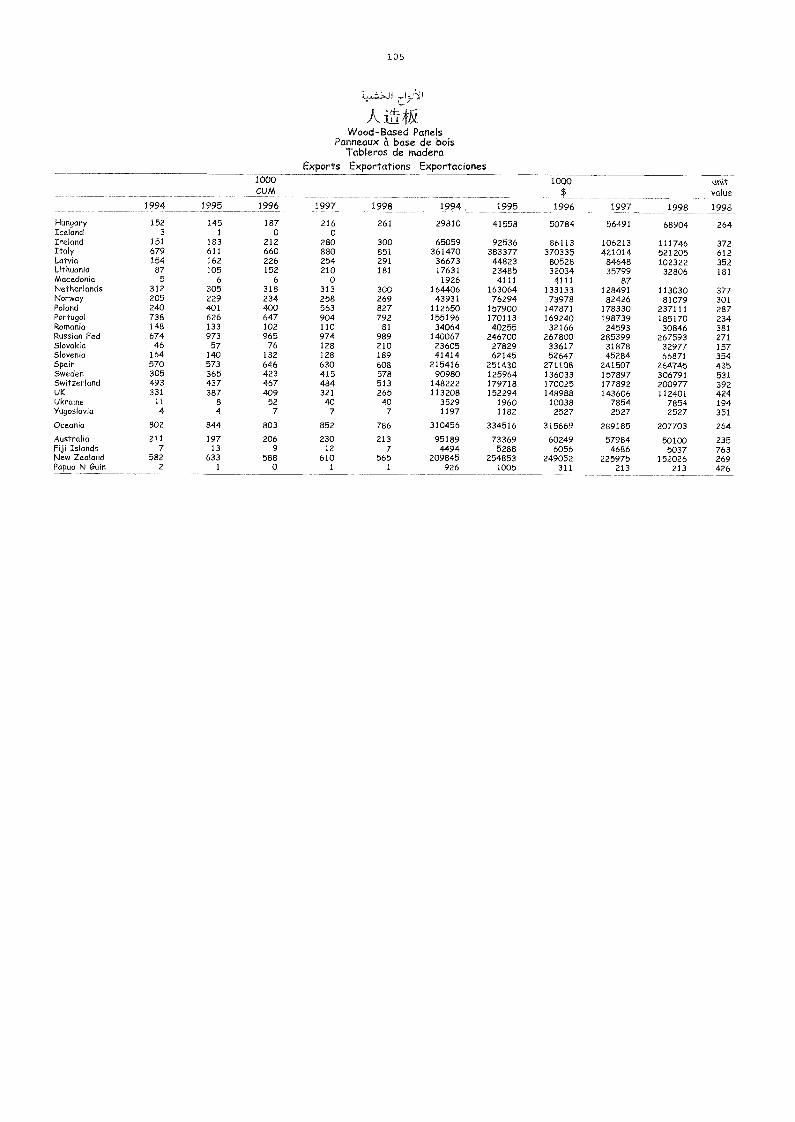
105
)1 JLtiWood-Based Panels
Panneaux à base de boisTableros de madera
Exports Exportations Exportaciones
994 1995
1000CUM
1996 1997 1998 1994 1995
1000$
1996 1997 1998
.ss%it
value
1998
Hungary 152 145 187 216 261 29810 41558 50784 56491 68904 264Iceland 3 1 o oIreland 151 183 212 280 300 65059 92536 86113 106213 111746 372Italy 679 611 660 880 851 361470 383377 370335 421014 521205 612Latvia 154 162 226 254 291 36673 44823 80528 84648 102322 352Lithuania 87 105 152 210 181 17631 23485 32034 35799 32806 181Macedonia 5 6 6 0 1926 4111 4111 87Netherlands 312 305 318 313 300 164406 163064 133133 128491 113030 377Norway 205 229 234 258 269 43931 76294 73978 82426 81079 301Poland 240 401 400 563 827 112650 157900 147871 178330 237111 287Portugal 738 626 647 904 792 155196 170113 169240 198739 185170 234Romania 148 133 102 110 81 34064 40255 32166 24593 30846 381Russian Fed 674 973 965 974 989 140067 246700 267800 285399 267593 271Slovakia 46 57 76 128 210 23605 27829 33617 31878 32977 157Slovenia 164 140 132 128 189 41414 62145 52647 45284 66871 354Spain 570 573 646 630 608 215416 251430 271108 241507 264745 435Sweden 305 365 423 415 578 90980 125964 136033 157897 306791 531Switzerland 493 437 467 484 513 148222 179718 170025 177892 200977 392UK 331 387 409 321 265 113208 152294 148988 143606 112401 424Ukraine 11 8 52 ao 40 3529 1960 10038 7854 7854 194Yugoslavia 4 4 7 7 7 1197 1182 2527 2527 2527 351
Oceania 802 844 803 852 786 310456 334516 315669 289185 207703 264
Australia 211 197 206 230 213 95189 73369 60249 57984 50100 235Fiji Islands 7 13 9 12 7 4494 5288 6056 4686 5037 763New Zealand 582 633 588 610 565 209845 254853 249052 225975 152026 269Papua N Guin 2 1 0 1 1 926 1005 311 213 213 426
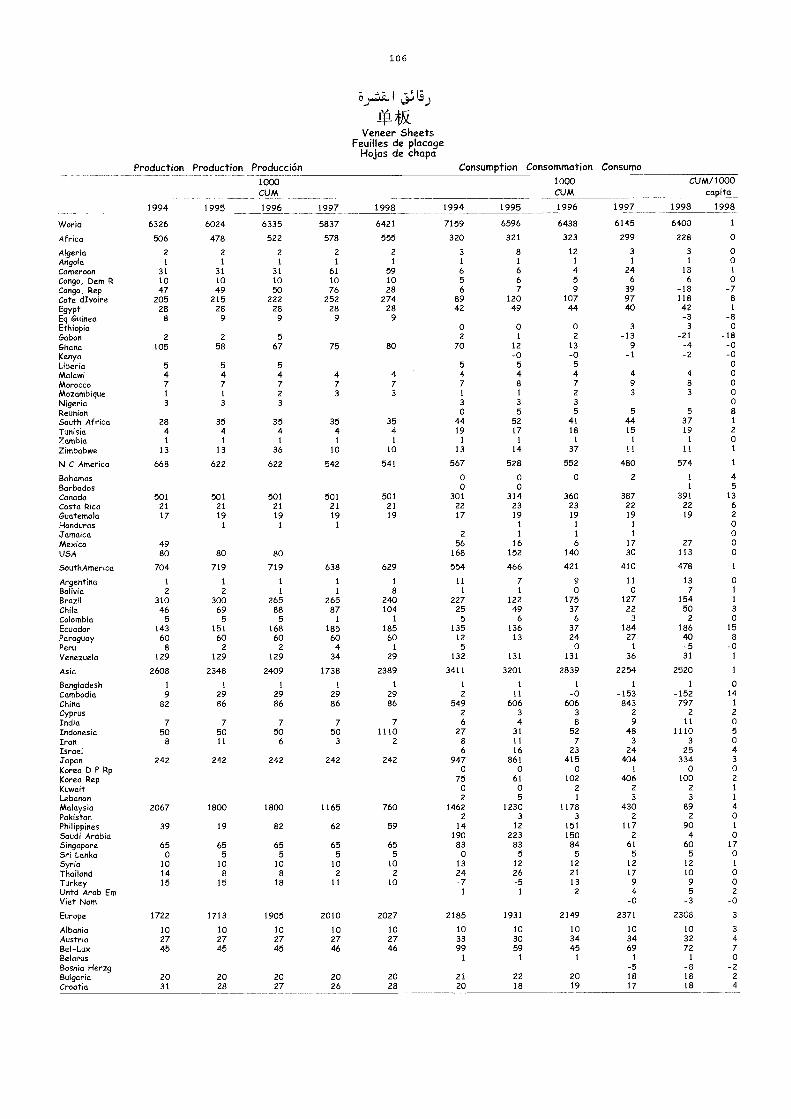
1 0 6
-3)..-LaJ
Veneer SheetsFeuilles de placage
Hojas de chapaProduction Production Producción Consumption Consommation Consumo
1000CUM
1998
1000CUM
CUM/1000capita
19981994 1995 1996 1997 1994 1995 1996 1997 1998
World 6326 6024 6335 5837 6421 7159 6596 6438 6145 6400 1
Africa 506 478 522 578 555 320 321 323 299 228 0
Algeria 2 2 2 2 2 3 8 12 3 3 0Angola 1 1 1 1 1 1 1 1 1 1 0Cameroon 31 31 31 61 59 6 6 4 24 18 1
Congo, Dem R 10 10 10 10 10 5 6 5 6 6 0
Congo, Rep 47 49 50 76 28 6 7 9 39 -18 -7Cote dIvoire 205 215 222 252 274 89 120 107 97 118 8
Egypt 28 28 28 28 28 42 49 44 40 42 1
Eq Guinea 8 9 9 9 9 -3 -8Ethiopia 0 0 0 3 3 0
Gabon 2 2 5 2 1 2 -13 -21 -18Ghana 105 58 67 75 80 70 12 13 9 -4 -0Kenya -0 -0 -1 -2 -0Liberia 5 5 5 5 5 5 0
Malawi 4 4 4 4 4 4 4 4 4 4 0Morocco 7 7 7 7 7 7 8 7 9 8 0Mozambique 1 1 2 3 3 1 1 2 3 3 0Nigeria 3 3 3 3 3 3 0Reunion 0 5 5 5 5 8
South Africa 28 35 35 35 35 44 52 41 44 37 1
Tunisia 4 4 4 4 4 19 17 18 15 19 2
Zambia 1 1 1 1 1 1 1 1 1 1 0Zimbabwe 13 13 36 10 10 13 14 37 11 11 1
N C America 668 622 622 542 541 567 528 552 480 574 1
Bahamas 0 0 0 2 1 4Barbados 0 0 1 5Canada 501 501 501 501 501 301 314 360 387 391 13Costa Rica 21 21 21 21 21 22 23 23 22 22 6Guatemala 17 19 19 19 19 17 19 19 19 19 2
Honduras 1 1 1 1 1 1 0Jamaica 2 1 1 1 0Mexico 49 56 16 6 17 27 0USA 80 80 80 168 152 140 30 113 0
SouthAmerica 704 719 719 638 629 554 466 421 410 478 1
Argentina 1 1 1 1 1 11 7 9 11 13 0Bolivia 2 2 1 1 8 1 1 0 0 7 1
Brazil 310 300 265 265 240 227 122 175 127 154 1
Chile 46 69 88 87 104 25 49 37 22 50 3
Colombia 5 5 5 1 1 5 6 6 3 2 0Ecuador 143 151 168 185 185 135 136 37 184 186 15
Paraguay 60 60 60 60 60 12 13 24 27 40 8Peru 8 2 2 4 1 5 0 1 -5 -0Venezuela 129 129 129 34 29 132 131 131 36 31 1
Asia 2608 2348 2409 1738 2389 3411 3201 2839 2254 2520 1
Bangladesh 1 1 1 1 1 1 1 1 1 1 0Cambodia 9 29 29 29 29 2 11 -0 -153 -152 -14China 82 86 86 86 86 549 606 606 843 797 1
Cyprus 2 3 3 2 2 2
India 7 7 7 7 7 6 4 8 9 11 0Indonesia 50 50 50 50 1110 27 31 52 48 1110 5
Iran 8 11 6 3 2 8 11 7 3 3 0
Israel 6 16 23 24 25 4Japan 242 242 242 242 242 947 861 415 404 334 3
Korea 0 P Rp 0 0 0 1 o 0
Korea Rep 75 61 102 406 100 2
Kuwait 0 0 2 2 2 1
Lebanon 2 5 1 3 3 1
Malaysia 2067 1800 1800 1165 760 1462 1230 1178 430 89 4
Pakistan 2 3 3 2 2 0
Philippines 39 19 82 62 59 14 12 151 117 90 1
Saudi Arabia 190 223 150 2 4 0Singapore 65 65 65 65 65 83 83 84 61 60 17Sri Lanka 0 5 5 5 5 0 5 5 5 5 0Syria 10 10 10 10 10 13 12 12 12 12 1
Thailand 14 8 8 2 2 24 26 21 17 10 0
Turkey 15 15 18 11 10 -7 -5 13 9 9 0
Untd Arab Em 1 1 2 4 5 2
Viet Nam -0 -3 -0
Europe 1722 1713 1905 2010 2027 2185 1931 2149 2371 2308 3
Albania 10 10 10 10 10 10 10 10 10 10 3
Austria 27 27 27 27 27 33 30 34 34 32 4Bel-Lux 45 45 45 46 46 99 59 45 69 72 7Belarus 1 1 1 1 1 0Bosnia Herzg -5 -8 -2Bulgaria 20 20 20 20 20 21 22 20 18 18 2
Croatia 31 28 27 26 28 20 18 19 17 18 4
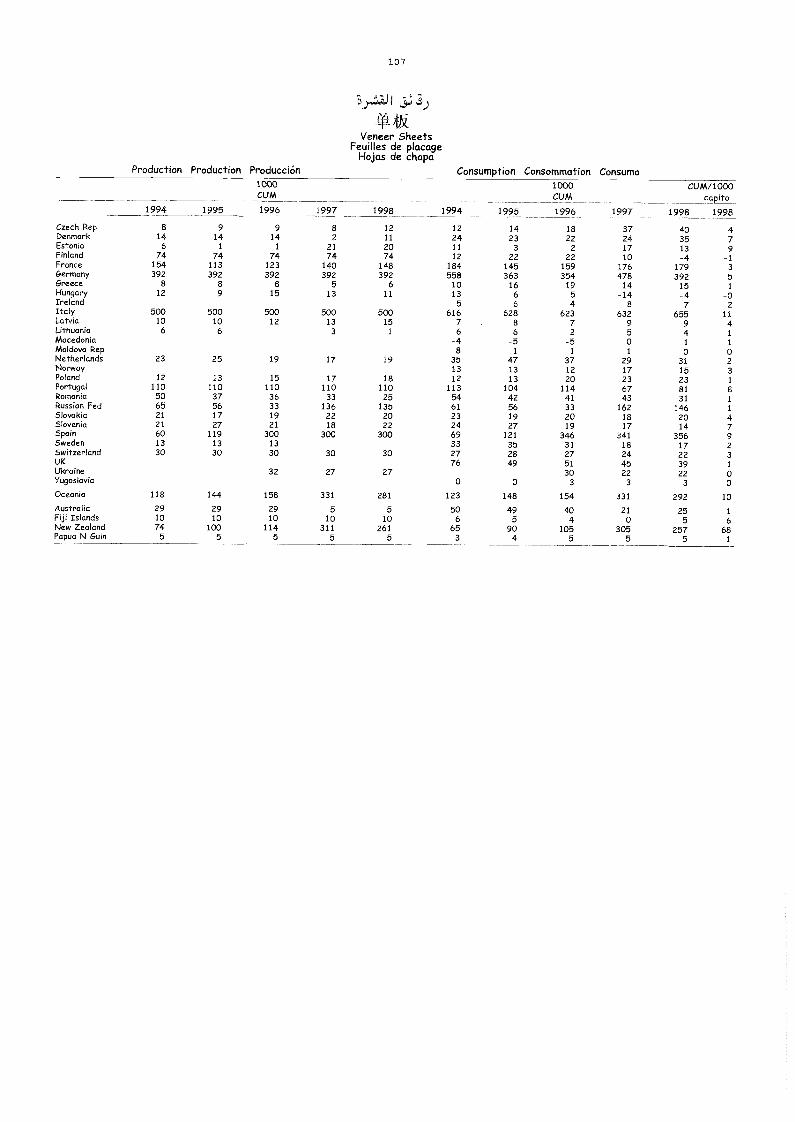
107
*Veneer Sheets
Feuilles de placageHojas de chapa
Production Production Producción Consumption Consommation Consumo1000CUM
1000CUM
1996 1997
CUM/1000capita
1998 19981994 1995 1996 1997 1998 1994 1995
Czech Rep 8 9 9 8 12 12 14 18 37 40 4Denmark 14 14 14 2 11 24 23 22 24 35 7Estonia 6 1 1 21 20 11 3 2 17 13 9Finland 74 74 74 74 74 12 22 22 10 -4 -1France 154 113 123 140 148 184 145 159 176 179 3Germany 392 392 392 392 392 558 363 354 478 392 5Greece 8 8 8 5 6 10 16 19 14 15 1
Hungary 12 9 15 13 11 13 6 5 -14 -4 -0Ireland 5 6 4 8 7 2Italy 500 500 500 500 500 616 628 623 632 655 11Latvia 10 10 12 13 15 7 8 7 9 9 4Lithuania 6 6 3 1 6 6 2 5 4 1
Macedonia -4 -5 -5 0 1 1
Moldova Rep 8 1 1 1 0 0Netherlands 23 25 19 17 19 35 47 37 29 31 2Norway 13 13 12 17 15 3Poland 12 13 15 17 18 12 13 20 23 23 1
Portugal 110 110 110 110 110 113 104 114 67 81 8Romania 50 37 36 33 25 54 42 41 43 31 1Russian Fed 65 56 33 136 135 61 56 33 162 146 1Slovakia 21 17 19 22 20 23 19 20 18 20 4Slovenia 21 27 21 18 22 24 27 19 17 14 7Spain 60 119 300 300 300 69 121 346 341 356 9Sweden 13 13 13 33 35 31 18 17 2Switzerland 30 30 30 30 30 27 28 27 24 22 3UK 76 49 51 45 39 1
Ukraine 32 27 27 30 22 22 0Yugoslavia 0 0 3 3 3 0Oceania 118 144 158 331 281 123 148 154 331 292 10
Australia 29 29 29 5 5 50 49 4-0 21 25 1
Fiji Islands 10 10 10 10 10 6 5 4 0 5 6New Zealand 74 100 114 311 261 65 90 105 305 257 68Papua N Guin 5 5 5 5 5 3 4 5 5 5 1
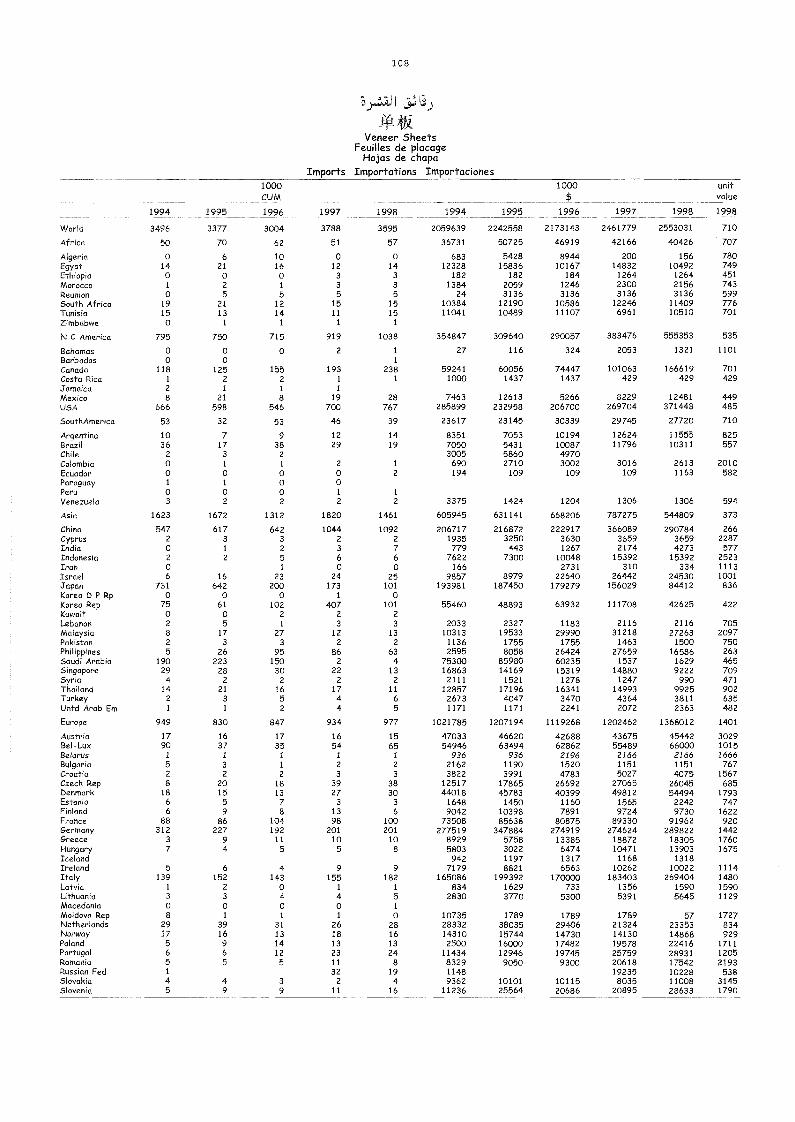
108
4R.Veneer Sheets
Feuilles de placageHojas de chapa
Imports Importations Importaciones1000CUM
1000 unitvalue
1994 1995 1996 1997 1998 1994 1995 1996 1997 1998 1998
World 3496 3377 3004 3788 3595 2059639 2242558 2173143 2461779 2553031 710
Africa 50 70 62 51 57 36731 50725 46919 42166 40426 707
Algeria 0 6 10 0 0 683 5428 8944 200 156 780Egypt 14 21 16 12 14 12328 15836 10167 14832 10492 749Ethiopia 0 0 0 3 3 182 182 184 1264 1264 451Morocco 1 2 1 3 3 1384 2059 1246 2300 2156 743Reunion 0 5 5 5 5 24 3136 3136 3136 3136 599South Africa 19 21 12 15 15 10384 12190 10586 12246 11409 776Tunisia 15 13 14 11 15 11041 10489 11107 6961 10510 701Zimbabwe 0 1 1 1 1
N C America 795 750 715 919 1038 354847 309640 290057 383476 555353 535
Bahamas 0 0 0 2 1 27 116 324 2053 1321 1101Barbados 0 0 1
Canada 118 125 155 193 238 59241 60056 74447 101063 166619 701Costa Rica 1 2 2 1 1 1000 1437 1437 429 429 429Jamaica 2 1 1 1
Mexico 8 21 8 19 28 7463 12613 5266 8229 12481 449USA 666 598 546 700 767 285899 232958 206700 269704 371448 485
SouthAmerica 53 32 53 46 39 23617 23145 30339 29745 27720 710
Argentina 10 7 9 12 14 8351 7053 10194 12624 11555 825Brazil 36 17 38 29 19 7050 5431 10087 11796 10311 557Chile 2 3 2 3005 5860 4970Colombia 0 1 1 2 1 690 2710 3002 3016 2613 2010Ecuador 0 0 0 0 2 194 109 109 109 1163 582Paraguay 1 1 0 0Peru 0 0 0 1 1
Venezuela 3 2 2 2 2 3375 1424 1204 1306 1306 594
Asia 1623 1672 1312 1820 1461 605945 631141 668206 787275 544809 373
China 547 617 642 1044 1092 206717 216872 222917 366089 290784 266Cyprus 2 3 3 2 2 1935 3250 3630 3659 3659 2287India 0 1 2 3 7 779 443 1267 2174 4273 577Indonesia 2 2 5 6 6 7622 7300 10048 15392 15392 2523Iran 0 1 0 0 166 2731 310 334 1113Israel 6 16 23 24 25 9857 8979 22640 26442 24530 1001Japan 731 642 200 173 101 193981 187450 179279 156029 84412 836Korea D P Rp 0 0 0 1 0Korea Rep 75 61 102 407 101 55460 48893 63932 111708 42625 422Kuwait 0 0 2 2 2Lebanon 2 5 1 3 3 2033 2327 1183 2116 2116 705Malaysia 8 17 27 12 13 10313 19533 29990 31218 27263 2097Pakistan 2 3 3 2 2 1136 1755 1755 1463 1500 750Philippines 5 26 95 86 63 2595 8058 26424 27659 16586 263Saudi Arabia 190 223 150 2 4 75300 85980 60235 1537 1629 465Singapore 29 28 30 22 13 16863 14169 15319 14880 9222 709Syria 4 2 2 2 2 2111 1521 1278 1247 990 471Thailand 14 21 16 17 11 12857 17196 16341 14993 9925 902Turkey 2 3 5 4 6 2673 4047 3470 4364 3811 635Untd Arab Em 1 1 2 4 5 1171 1171 2241 2072 2363 482
Europe 949 830 847 934 977 1021785 1207194 1119268 1202462 1368012 1401
Austria 17 16 17 16 15 47033 46620 42688 43675 45442 3029Bel -Lux 90 37 35 54 65 54946 63494 62862 55489 66000 1015Belarus 1 1 1 1 1 936 936 2196 2166 2166 1666Bulgaria 5 3 1 2 2 2162 1190 1520 1151 1151 767Croatia 2 2 2 3 3 3822 3991 4783 5027 4075 1567Czech Rep 8 20 18 39 38 12517 17865 26692 27065 26045 685Denmark 18 15 13 27 30 44018 45783 40399 49812 54494 1793Estonia 6 5 7 3 3 1648 1450 1160 1565 2242 747Finland 6 9 8 13 6 9042 10398 7891 9724 9730 1622France 88 86 104 98 100 73508 85638 80875 89330 91962 920Germany 312 227 192 201 201 277519 347884 274919 274624 289822 1442Greece 3 9 11 10 10 8929 5758 13385 18872 18305 1760Hungary 7 4 5 5 8 5803 3022 6474 10471 13903 1675Iceland 942 1197 1317 1168 1318Ireland 5 6 4 9 9 7179 8821 6563 10262 10022 1114Italy 139 152 143 155 182 165086 199392 170000 183403 269404 1480Latvia 1 2 0 1 1 834 1629 733 1356 1590 1590Lithuania 3 3 4 4 5 2830 3770 5300 5391 5645 1129Macedonia 0 0 0 0 1
Moldova Rep 8 1 1 1 o 10735 1789 1789 1789 57 1727Netherlands 29 39 31 26 28 28332 38035 29406 21324 23353 834Norway 17 16 13 18 16 14310 15744 14730 14130 14868 929Poland 5 9 14 13 13 2500 16000 17482 19578 22416 1711Portugal 6 6 12 23 24 11434 12946 19745 25759 28931 1205Romania 5 5 5 11 8 8329 9050 9300 20618 17542 2193Russian Fed 1 32 19 1148 19235 10228 538Slovakia 4 4 3 2 4 9362 10101 10115 8035 11008 3145Slovenia 5 9 9 11 16 11236 25564 20686 20895 28633 1790
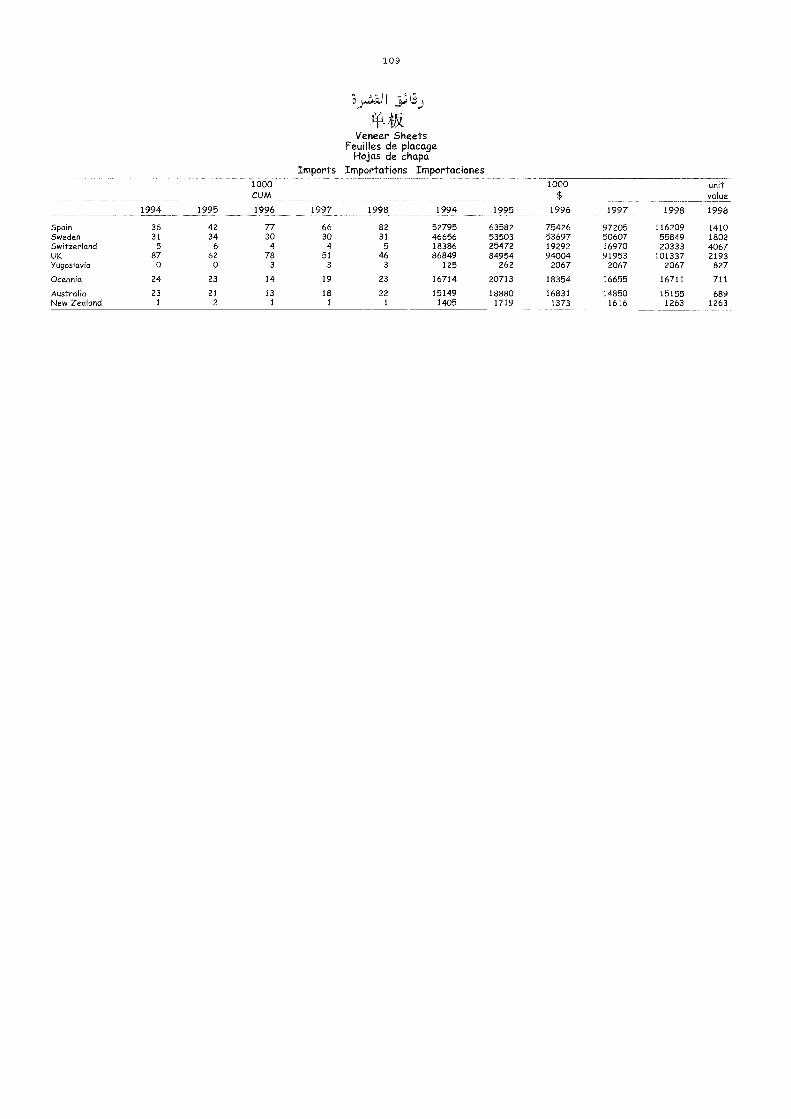
109
Veneer SheetsFeuilles de placage
Hojas de chapaImports Importations Importaciones
994 1995
1000CUM
1996 1997 1998 1994 1995
1000$
1996 1997 1998
unitvalue
1998
Spain 36 42 77 66 82 52795 63582 75426 97205 116209 1410Sweden 31 34 30 30 31 46656 53503 53697 50607 55849 1802Switzerland 5 6 4 4 5 18386 25472 19292 16970 20333 4067UK 87 62 78 51 46 86849 84954 94004 91953 101337 2193Yugoslavia 0 0 3 3 3 125 262 2067 2067 2067 827
Oceania 24 23 14 19 23 16714 20713 18354 16655 16711 711
Australia 23 21 13 18 22 15149 18880 16831 14850 15155 689New Zealand 1 2 1 1 1 1405 1719 1373 1616 1263 1263
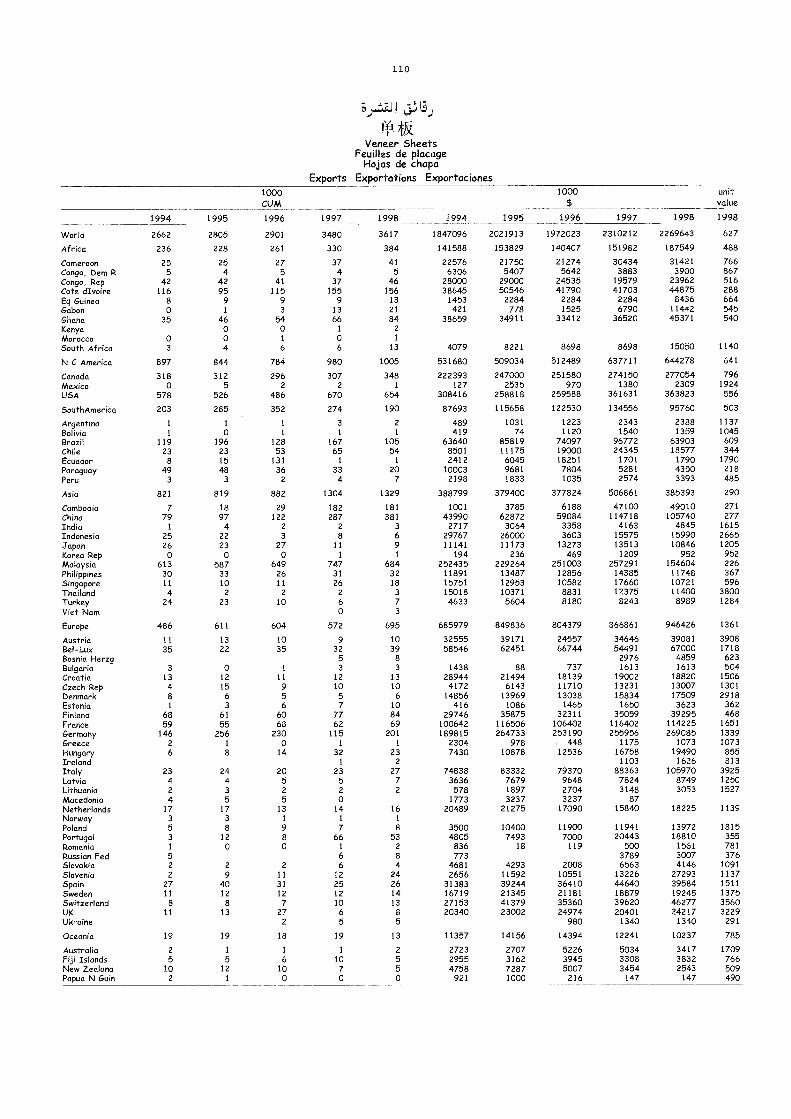
110
jo:di)
Veneer SheetsFeuilles de placage
Hojas de chapaExports Exportations Exportaciones
1000CUM
1000 unitvalue
1994 1995 1996 1997 1998 1994 1995 1996 1997 1998 1998
VVorld 2662 2805 2901 3480 3617 1847096 2021913 1972023 2310212 2269643 627
Africa 236 228 261 330 384 141588 153829 140407 151982 187549 488
Cammroon 25 25 27 37 41 22576 21750 21274 30434 31421 766Congo, Dem R 5 4 5 4 5 6306 5407 5642 3883 3900 867Congo, Rep 42 42 41 37 46 28000 29000 24535 19579 23962 516Cote dIvoire 116 95 115 155 156 38645 50546 41790 41703 44875 288Eg Guinea 8 9 9 9 13 1453 2284 2284 2284 8436 664Gabon o 1 3 13 21 421 778 1525 6790 11442 545Ghana 35 46 54 66 84 38659 34911 33412 36520 45371 540Kenya 0 0 1 2
Morocco 0 0 1 0 1
South Africa 3 4 6 6 13 4079 8221 8698 8698 15050 1140
NC America 897 844 784 980 1005 531680 509034 512489 637711 644278 641
Canada 318 312 296 307 348 222393 247000 251580 274150 277054 796Mexico 0 5 2 2 1 127 2535 970 1380 2309 1924USA 578 526 486 670 654 308416 258818 259588 361631 363823 556
SouthAmerica 203 285 352 274 190 87693 115658 122530 134556 95760 503
Argentino 1 1 1 3 2 489 1031 1223 2343 2388 1137Bolivia 1 0 1 1 1 419 74 1120 1540 1359 1045Brazil 119 196 128 167 105 63640 85819 74097 96772 63903 609Chile 23 23 53 65 54 8501 11175 19000 24345 18577 344Ecuador 8 15 131 1 1 2412 6045 18251 1701 1790 1790Paraguay 49 48 36 33 20 10003 9681 7804 5281 4350 218Peru 3 3 2 4 7 2198 1833 1035 2574 3393 485
AsM 821 819 882 1304 1329 388799 379400 377824 506861 385393 290
CambodM 7 18 29 182 181 1001 3785 6188 47100 49010 271
Chino 79 97 122 287 381 43990 62872 59084 114718 105740 277India 1 4 2 2 3 2717 3064 3358 4163 4845 1615Indonesia 25 22 3 8 6 29767 26000 3603 15575 15990 2665Japan 26 23 27 11 9 11141 11173 13273 13513 10846 1205Korea Rep o o o 1 1 194 236 469 1209 952 952Malaysia 613 587 649 747 684 252435 229264 251003 257291 154604 226PhMppMes 30 33 26 31 32 11891 13487 12856 14385 11748 367Singapore 11 10 11 26 18 15751 12953 10582 17660 10721 596Thafland 4 2 2 2 3 15018 10371 8831 12375 11400 3800Turkey 24 23 10 6 7 4633 5604 8180 8243 8989 1284VMtNMm 0 3
Europe 486 611 604 572 695 685979 849836 804379 866861 946426 1361
Austria 11 13 10 9 10 32555 39171 24557 34646 39081 3908Bel-Lux 35 22 35 32 39 58546 62451 66744 54491 67000 1718BosnM Herzg 5 8 2976 4859 623Bulgaria 3 0 1 3 3 1438 88 737 1613 1613 504Croafia 13 12 11 12 13 28944 21494 18139 19002 18820 1506Czech Rep 4 15 9 10 10 4172 6143 11710 13231 13007 1301Denmark 8 6 5 5 6 14856 13969 13038 15834 17509 2918Estonia 1 3 6 7 10 416 1086 1465 1650 3623 362Finland 68 61 60 77 84 29746 35875 32311 35059 39295 468France 59 55 68 62 69 100642 116506 106402 116402 114225 1651Gemnany 146 256 230 115 201 189815 264733 253190 255956 269085 1339Greece 2 1 0 1 1 2304 978 . 448 1175 1073 1073Hungary 6 8 14 32 23 7430 10878 12536 16758 19490 855Ireland 1 2 1103 1626 813Italy 23 24 20 23 27 74838 83332 79370 88363 105970 3925LatvM 4 4 5 5 7 3636 7679 9648 7824 8749 1250LithuaMa 2 3 2 2 2 578 1897 2704 3148 3053 1527Macedonia 4 5 5 0 1773 3237 3237 87Netherkmds 17 17 13 14 16 20489 21275 17090 15840 18225 1139Norway 3 3 1 1 1
PMand 5 8 9 7 8 3500 10400 11900 11941 13972 1815Portugal 3 12 8 66 53 4805 7493 7000 20443 18810 355RomaMa 1 o o 1 2 836 18 119 500 1561 781Russian Fed 5 6 8 773 3789 3007 376Skwakia 2 2 2 6 4 4681 4293 2008 6563 4146 1091SMveMa 2 9 11 12 24 2656 11592 10551 13226 27293 1137SpMn 27 40 31 25 26 31383 39244 36410 44640 39584 1511Sweden 11 12 12 12 14 16719 21345 21181 18879 19245 1375SwitzeMand 8 8 7 10 13 27153 41379 35360 39620 46277 3560UK 11 13 27 6 8 20340 23002 24974 20401 24217 3229Ukrairm 2 5 5 980 1340 1340 291
OceaMa 19 19 18 19 13 11357 14156 14394 12241 10237 785
Australia 2 1 1 1 2 2723 2707 5226 5034 3417 1709Fiji Islands 5 5 6 10 5 2955 3162 3945 3308 3832 766NMw Zeakmd 10 12 10 7 5 4758 7287 5007 3454 2543 509Papua N GuM 2 1 0 0 o 921 1000 216 147 147 490
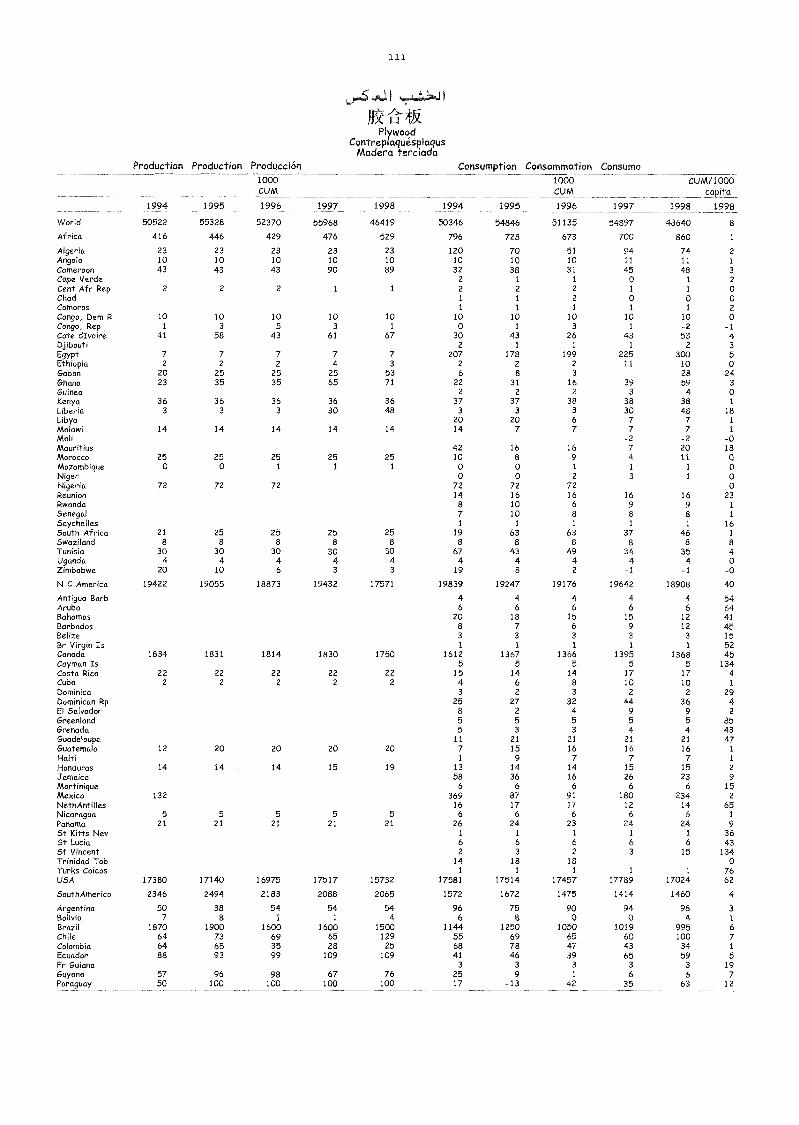
1 1 1
I
PlywoodContreplaquesplaqus
Madera terciadaProduction Production Producción Consumption Consommation Consumo
1994 1995
1000CUM
1995
1000CUM
1996 1997
CUM/1000capita
1998 19981996 1997 1998 1994
World 50522 55328 52370 55968 46419 50346 54846 51135 54897 48640 8
Africa 416 446 429 476 529 796 728 673 700 860 1
Algeria 23 23 23 23 23 120 70 51 94 74 2
Angola 10 10 10 10 10 10 10 10 11 11 1
Cameroon 43 43 43 90 89 32 38 31 45 48 3
Cope Verde 2 1 1 0 1 2Cent Afr Rep 2 2 2 1 1 2 2 2 1 1 0Chad 1 1 2 o o oComoros 1 1 1 1 1 2Congo, Dem R 10 10 10 10 10 10 10 10 10 10 oCongo, Rep 1 3 5 3 1 o 1 3 1 -2 -1Cote dIvoire 41 58 43 61 67 30 43 26 43 53 4Djibouti 2 1 1 1 2 3
Egypt 7 7 7 7 7 207 178 199 225 300 5
Ethiopia 2 2 2 4 3 2 2 2 11 10 oGabon 20 25 25 25 53 6 8 3 28 24Ghana 23 35 35 65 71 22 31 16 39 59 3
Guinea 2 2 2 3 4 oKenya 36 36 36 36 36 37 37 38 38 38 1
Liberia 3 3 3 30 48 3 3 3 30 48 18Libya 20 20 6 7 7 1
Malawi 14 14 14 14 14 14 7 7 7 7 1
Mali -2 -2 -0Mauritius 42 16 16 7 20 18Morocco 25 25 25 25 25 10 8 9 4 11 Q
Mozambique 0 0 1 1 1 0 o 1 1 1 0Niger 0 o 2 3 1 0Nigeria 72 72 72 72 72 72 oReunion 14 16 16 16 16 23Rwanda 8 10 6 9 9 1
Senegal 7 10 8 8 8 1
Seychelles 1 1 1 1 1 16South Africa 21 25 25 25 25 19 63 63 37 46 1
Swaziland 8 8 8 8 8 8 8 8 8 8 8Tunisia 30 30 30 30 30 67 43 49 34 35 4Uganda 4 4 4 4 4 4 4 4 4 4 0Zimbabwe 20 10 6 3 3 19 8 2 -1 -1 -oN C America 19422 19055 18873 19432 17571 19839 19247 19176 19642 18908 40
Antigua Barb 4 4 4 4 4 54Aruba 6 6 6 6 6 64Bahamas 20 18 15 15 12 41Barbados 8 7 6 9 12 45Belize 3 3 3 3 3 15Br Virgin Is 1 1 1 1 1 52Canada 1834 1831 1814 1830 1750 1612 1367 1366 1395 1368 45Cayman Is 5 5 5 5 5 134Costa Rica 22 22 22 22 22 15 14 14 17 17 4Cuba 2 2 2 2 2 4 6 8 10 10 1
Dominica 3 2 3 2 2 29Dominican Rp 25 27 32 44 36 4El Salvador 8 2 4 9 9 2
Greenland 5 5 5 5 5 85Grenada 5 3 3 4 4 43Guadeloupe 11 21 21 21 21 47Guatemala 12 20 20 20 20 7 15 16 16 16 1
Haiti 1 9 7 7 7 1
Honduras 14 14 14 15 19 13 14 14 15 15 2
Jamaica 58 36 16 26 23 9Martinique 6 6 6 6 6 15Mexico 132 369 87 91 180 234 2
NethAntilles 16 17 17 12 14 65Nicaragua 5 5 5 5 5 6 6 6 6 6 1
Panama 21 21 21 21 21 26 24 23 24 24 9St Kitts Nev 1 1 1 1 1 36St Lucia 6 6 6 6 6 43St Vincent 2 3 2 3 15 134Trinidad Tob 14 18 18 0Turks Caicos 1 1 1 1 1 76USA 17380 17140 16975 17517 15732 17581 17514 17457 17789 17024 62
SouthAmerica 2346 2494 2183 2088 2065 1572 1672 1475 1414 1460 4
Argentina 50 38 54 54 54 96 75 90 94 96 3
Bolivia 7 8 1 1 4 6 a 0 o 4. 1
Brazil 1870 1900 1600 1600 1500 1144 1250 1050 1019 995 6Chile 64 73 69 65 129 55 69 65 60 100 7Colombia 64 65 35 28 25 68 78 47 43 34 1
Ecuador 88 93 99 109 109 41 46 39 65 59 5
Fr Guiana 3 3 3 3 3 19Guyana 57 96 98 67 76 25 9 1 6 6 7Paraguay 50 100 100 100 100 17 -13 42 35 63 12
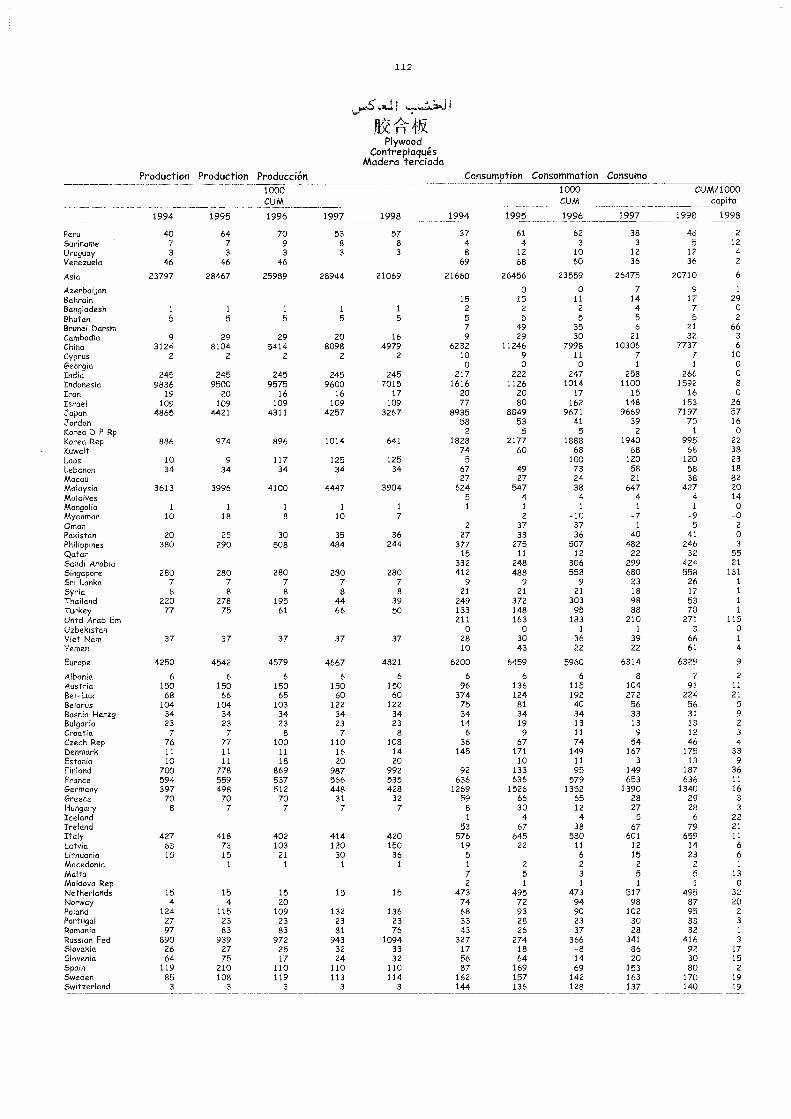
112
JI LJJI
PlywoodContreplaqués
Madera terciadaProduction Production Producción Consumption Consommation Consumo
1994 1995
1000CUM
1996 1997 1998 1994 1995
1000CUM
1997
CUM/1000capita
1998 19981996
Peru 40 64 70 53 57 37 61 62 38 48 2
Suriname 7 7 9 8 8 4 4 3 3 5 12
Uruguay 3 3 3 3 3 8 12 10 12 12 4
Venezuela 46 46 46 69 68 60 36 36 2
Asia 23797 28467 25989 28944 21069 21660 26456 23559 26475 20710 6
Azerbaijan 0 0 7 9 1
Bahrain 15 15 11 14 17 29
Bangladesh 1 1 1 1 1 2 2 2 4 7 oBhutan 5 5 5 5 5 5 5 5 5 5 2
Brunei Dorm 7 49 35 6 21 66Cambodia 9 29 29 20 16 9 29 30 21 32 3
China 3124 8104 5414 8098 4979 6232 11246 7998 10306 7737 6
Cyprus 2 2 2 2 2 10 9 11 7 7 10
Georgia 0 0 0 1 1 0
India 245 245 245 245 245 217 222 247 258 266 0
Indonesia 9836 9500 9575 9600 7015 1616 1126 1014 1100 1592 8
Iran 19 20 16 16 17 20 20 17 15 16 0
Israel 109 109 109 109 109 77 80 162 148 153 26Japan 4865 4421 4311 4257 3267 8935 8849 9671 9669 7197 57Jordan 58 53 41 39 75 16Korea D P Rp 2 5 5 2 1 oKorea Rep 886 974 896 1014 641 1828 2177 1888 1940 995 22Kuwait 74 60 68 68 68 38Laos 10 9 117 125 125 5 100 120 120 23Lebanon 34 34 34 34 34 67 49 73 58 58 18Macau 27 27 24 21 38 82Malaysia 3613 3996 4100 4447 3904 624 547 38 647 427 20Maldives 5 4 4 4 4 14
Mongolia 1 1 1 1 1 1 1 1 1 1 0Myanmar 10 18 8 10 7 2 -10 -7 -9 -oOman 2 37 37 1 5 2
Pakistan 20 25 30 35 36 27 33 36 40 41 oPhilippines 380 290 508 484 244 377 275 507 482 246 3
Qatar 15 11 12 22 32 55Saudi Arabia 332 248 306 299 424 21
Singapore 280 280 280 280 280 412 488 558 680 558 161
Sri Lanka 7 7 7 7 7 9 9 9 23 26 1
Syria 8 8 8 8 8 21 21 21 18 17 1
Thailand 220 278 195 44 39 249 372 303 98 53 1
Turkey 77 75 61 66 50 133 148 95 88 70 1
Untd Arab Em 211 163 183 210 271 115Uzbekistan 0 0 1 1 3 0Viet Nam 37 37 37 37 37 28 30 36 39 66 1
Yemen 10 43 22 22 61 4
Europe 4250 4542 4579 4667 4821 6200 6459 5960 6314 6329 9
Albania 6 6 6 6 6 6 6 6 8 7 2
Austria 150 150 150 150 150 96 136 115 104 91 11
Bel -Lux 68 66 65 60 60 374 124 192 272 224 21Belarus 104 104 103 122 122 75 81 40 56 56 5Bosnia Herzg 34 34 34 34 34 34 34 34 33 31 9Bulgaria 23 23 23 23 23 14 19 13 13 13 2
Croatia 7 7 8 7 8 6 9 11 9 12 3
Czech Rep 76 77 100 110 108 36 67 74 54 46 4Denmark 11 11 11 16 14 145 171 149 167 175 33Estonia 10 11 18 20 20 10 11 3 13 9Finland 700 778 869 987 992 92 133 95 149 187 36France 594 559 537 566 535 636 636 579 653 636 11
Germany 397 498 512 448 428 1269 1526 1352 1390 1340 16Greece 70 70 70 31 32 59 66 65 28 29 3
Hungary 8 7 7 7 7 8 30 12 27 28 3
Iceland 1 4 4 5 6 22Ireland 53 67 38 67 79 21
Italy 427 418 402 414 420 576 645 580 601 659 11
Latvia 63 73 103 120 150 19 22 11 12 14 6
Lithuania 15 15 21 30 36 5 6 15 23 6Macedonia 1 1 1 1 1 2 2 2 2 1
Malta 7 5 3 5 5 13Moldova Rep 2 1 1 1 1 0Netherlands 15 15 15 15 15 473 495 473 517 495 32Norway 4 4 20 74 72 94 98 87 20Poland 124 115 109 132 136 68 93 90 102 95 2
Portugal 27 23 23 23 23 33 28 23 30 33 3
Romania 97 83 83 81 76 43 26 37 28 32 1
Russian Fed 890 939 972 943 1094 327 274 366 341 416 3
Slovakia 26 27 25 32 33 17 18 -8 86 92 17Slovenia 64 75 17 24 32 56 64 14 20 30 15Spain 119 210 110 110 110 87 169 69 153 80 2Sweden 85 108 119 113 114 162 157 142 163 170 19Switzerland 3 3 3 3 3 144 136 128 137 140 19
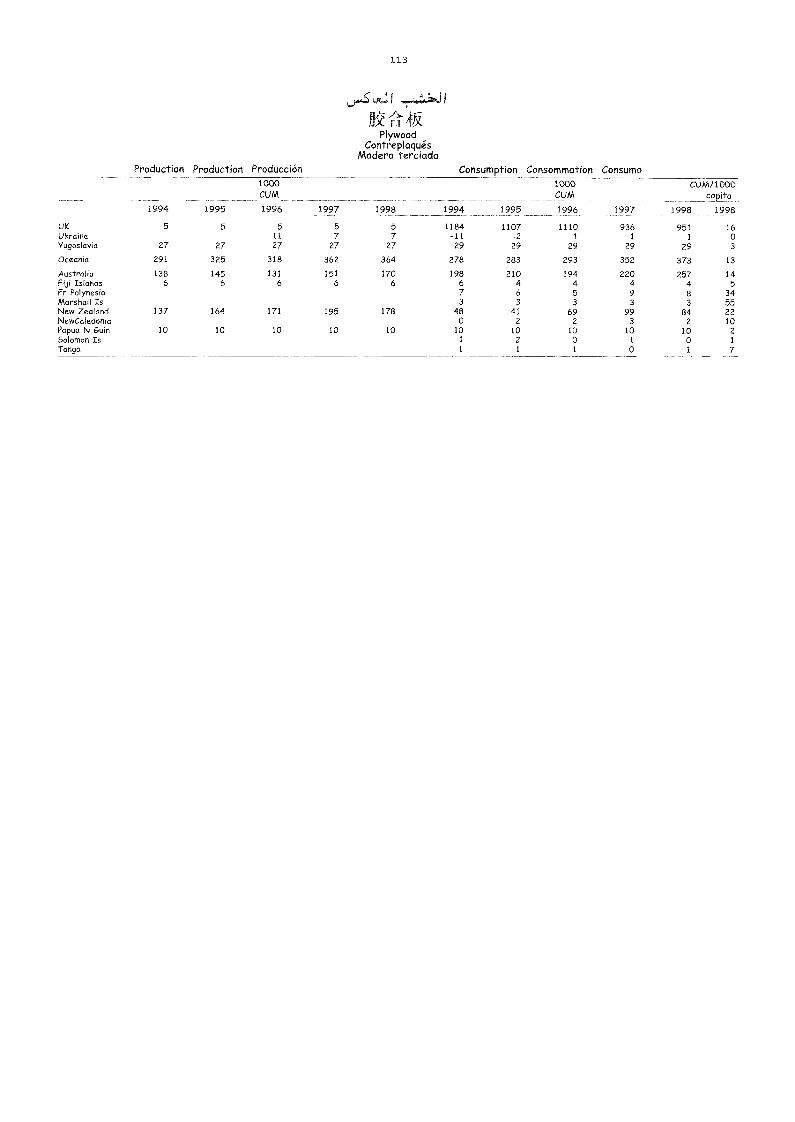
113
.AS J1.1, I
PlywoodContreplaqués
Madera terciadaProduction Production Producción Consumption Consommation Consumo
1994 1995
1000CUM
1996 1997 1998 1994 1995
1000CUM
1996 1997
CUM/1000capita
1998 1998
UK 5 5 5 5 5 1184 1107 1110 936 951 16Ukraine 11 7 7 -11 -2 1 1 1 0Yugoslavia 27 27 27 27 27 29 29 29 29 29 3
Oceania 291 325 318 362 364 278 283 293 352 373 13
Australia 138 145 131 151 170 198 210 194 220 257 14Fiji Islands 6 6 6 6 6 6 4 4 4 4 5Fr Polynesia 7 6 5 9 8 34Marshall Is 3 3 3 3 3 55New Zealand 137 164 171 195 178 48 41 69 99 84 22NewCaledonia 0 2 2 3 2 10Papua N Guin 10 10 10 10 10 10 10 10 10 10 2
Solomon Is 1 2 0 1 0 1
Tonga 1 1 1 0 1 7
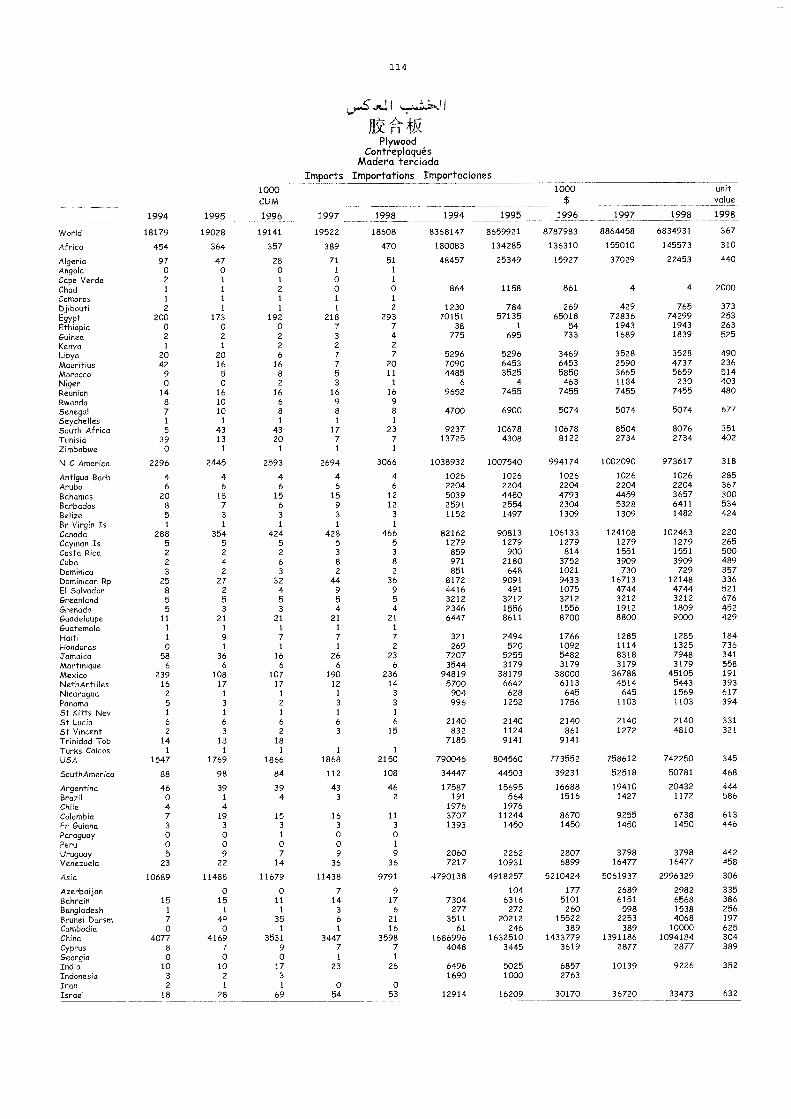
119
Jfk'Plywood
ContreplaquésMadera terciada
Imports Importations Importaciones
1994 1995
1000CUM
1996 1997 1998 1994 1995
1000$
1996 1997 1998
unitvalue
1998
World 18179 19028 19141 19522 18608 8368147 8659921 8787983 8864458 6834931 367
Africa 454 364 357 389 470 180083 134285 136310 155010 145573 310
Algeria 97 47 28 71 51 48457 25349 15927 37029 22453 440Angola 0 0 0 I 1
Cape Verde 2 1 1 0 1
Chad 1 1 2 0 0 864 1158 861 4 4 2000Cameros 1 1 1 1 1
Djibouti 2 1 1 1 2 1230 784 269 429 765 373
Egypt 200 173 192 218 293 70151 57135 65018 72836 74299 253
Ethiopia 0 0 0 7 7 38 1 54 1943 1943 263
Guinea 2 2 2 3 4 775 695 733 1689 1839 525
Kenya 1 1 2 2 2
Libya 20 20 6 7 7 5296 5296 3469 3528 3528 490Mauritius 42 16 16 7 20 7090 6453 6453 2590 4737 236
Morocco 9 5 8 5 11 4485 3525 5850 3665 5659 514Niger 0 0 2 3 1 6 4 463 1184 230 403Reunion 14 16 16 16 16 9652 7455 7455 7455 7455 480Rwanda 8 10 6 9 9Senegal 7 10 8 8 8 4700 6900 5074 5074 5074 677Seychelles 1 1 1 1 1
South Africa 5 43 43 17 23 9237 10678 10678 8504 8076 351
Tunisia 39 13 20 7 7 13725 4308 8122 2734 2734 402Zimbabwe 0 1 1 1 1
N C America 2296 2445 2593 2694 3066 1038932 1007540 994174 1002090 973617 318
Antigua Barb 4 4 4 4 4 1026 1026 1026 1026 1026 285Aruba 6 6 6 6 6 2204 2204 2204 2204 2204 367Bahamas 20 18 15 15 12 5039 4480 4793 4459 3657 300Barbados 8 7 6 9 12 2591 2554 2304 5328 6411 534Behze 5 3 3 3 3 1152 1497 1309 1309 1482 424Br VirgM Is 1 1 1 1 1
Canada 288 354 424 428 466 82162 90813 106133 124108 102463 220Cayman Is 5 5 5 5 5 1279 1279 1279 1279 1279 265Costa Rica 2 2 2 3 3 859 900 814 1551 1551 500Cuba 2 4 6 8 8 971 2180 3752 3909 3909 489Dominica 3 2 3 2 2 851 648 1021 730 729 357DomMicanRp 25 27 32 44 36 8172 9091 9433 16713 12148 336El Salvador 8 2 4 9 9 4416 491 1075 4744 4744 521
Greenland 5 5 5 5 5 3212 3212 3212 3212 3212 676Grenada 5 3 3 4 4 2346 1556 1556 1912 1809 452Guadeloupe 11 21 21 21 21 6447 8611 8700 8800 9000 429Guatemala 1 1 1 1 1
Haiti 1 9 7 7 7 321 2494 1766 1285 1285 184
Honduras 0 1 1 1 2 269 520 1092 1114 1325 736Jamaica 58 36 16 26 23 7207 5255 5482 8318 7948 341
Martinique 6 6 6 6 6 3544 3179 3179 3179 3179 558Mexico 239 108 107 190 236 94819 38179 38000 36788 45105 191
NethAntilles 16 17 17 12 14 5700 6642 6113 4514 5443 393Nicaragua 2 1 1 1 3 904 628 645 645 1569 617Panama 5 3 2 3 3 996 1252 1756 1103 1103 394St Kitts Nev 1 1 1 1 1
St Lucia 6 6 6 6 6 2140 2140 2140 2140 2140 331
St Vincent 2 3 2 3 15 832 1124 861 1272 4810 321
Trinidad Tob 14 18 18 7185 9141 9141Turks Caicos 1 1 1 1 1
USA 1547 1769 1866 1868 2150 790046 804560 773552 758612 742250 345
SouthAmerica 88 98 84 112 108 34447 44503 39231 52518 50781 468
Argentina 46 39 39 43 46 17587 15695 16688 19410 20432 444Brazd 0 1 4 3 2 191 564 1516 1427 1172 586Chile 4 4 1976 1976Colombia 7 19 15 16 11 3707 11244 8670 9255 6738 613Fr GuMna 3 3 3 3 3 1393 1450 1450 1450 1450 446Paraguay 0 0 1 0 0Peru 0 0 0 0 1
Uruguay 5 9 7 9 9 2060 2262 2807 3798 3798 442Venezuela 23 22 14 36 36 7217 10931 6899 16477 16477 458
Asia 10689 11488 11679 11438 9791 4790138 4918257 5210424 5061937 2996329 306
Azerbaijan 0 0 7 9 104 177 2689 2982 335BahraM 15 15 11 14 17 7304 6316 5101 6151 6568 386Bangladesh 1 1 1 3 6 277 272 260 598 1538 256Brunei Darsm 7 49 35 6 21 3511 20212 15522 2253 4068 197CambodM 0 0 1 1 16 61 246 389 389 10000 625China 4077 4169 3531 3447 3598 1686996 1632510 1433779 1391186 1094184 304Cyprus 8 7 9 7 7 4048 3445 3619 2877 2877 389GeorgM 0 0 0 1 1
India 10 10 17 23 26 6496 5025 6857 10139 9226 352Indonesia 3 2 3 1690 1000 2763Iran 2 1 1 0 0Israel 18 28 69 54 53 12914 16209 30170 36720 33473 632
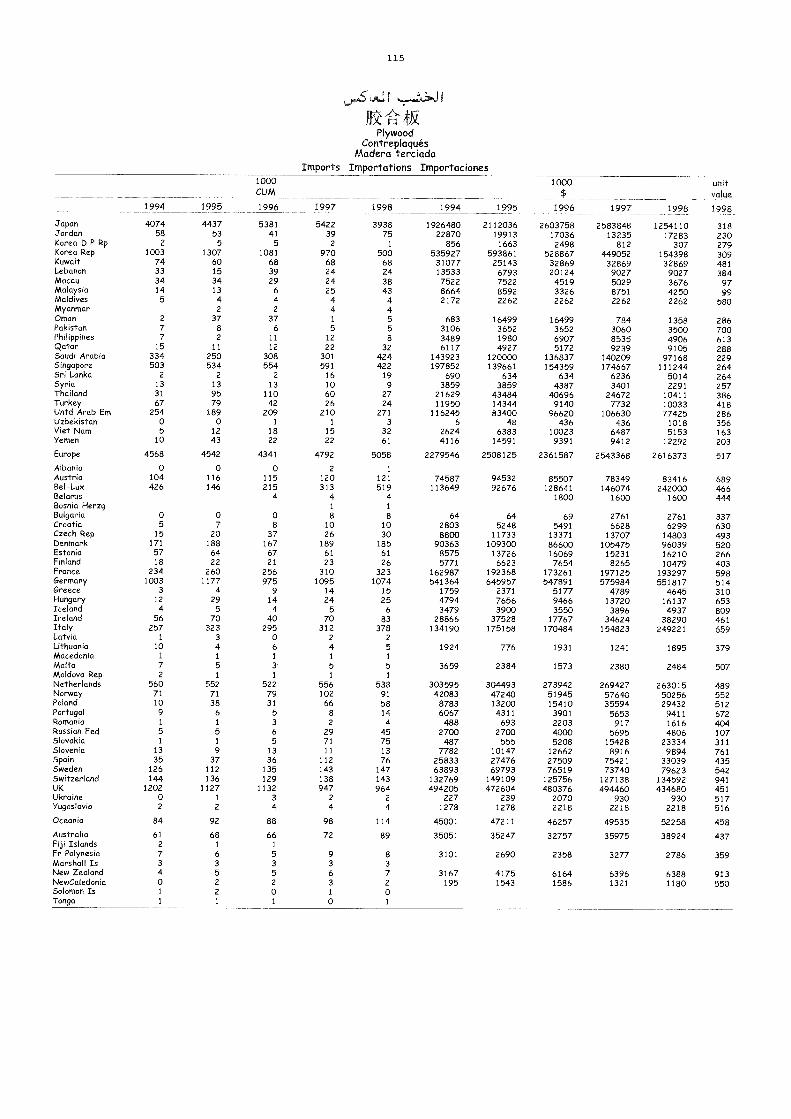
115
PlywoodContreplaqués
Madera terciadaImports Importations Importaciones
1000CUM
1000s
unitvalue
1994 1995 1996 1997 1998 1994 1995 1996 1997 1998 1998
Japan 4074 4437 5381 5422 3938 1926480 2112036 2603758 2583848 1254110 318Jordan 58 53 41 39 75 22870 19913 17036 13235 17283 230Korea D P Rp 2 5 5 2 1 856 1663 2498 812 307 279Korea Rep 1003 1307 1081 970 500 535927 593861 528867 449052 154398 309Kuwait 74 60 68 68 68 31077 25143 32869 32869 32869 481Lebanon 33 15 39 24 24 13533 6793 20124 9027 9027 384Macau 34 34 29 24 38 7522 7522 4519 5029 3676 97Malaysia 14 13 6 25 43 8664 8592 3326 8751 4250 99Maldives 5 4 4 4 4 2172 2262 2262 2262 2262 580Myanmar 2 2 4 4Ornan 2 37 37 1 5 683 16499 16499 784 1358 286Pakistan 7 8 6 5 5 3106 3652 3652 3060 3500 700Philippines 7 2 11 12 8 3489 1980 6907 8535 4906 613Qatar 15 11 12 22 32 6117 4927 5172 9239 9105 288Saudi Arabia 334 250 308 301 424 143923 120000 136837 140209 97168 229Singapore 503 534 554 591 422 197852 139661 154359 174667 111244 264Sri Lanka 2 2 2 16 19 690 634 634 6236 5014 264Syria 13 13 13 10 9 3859 3859 4387 3401 2291 257Thailand 31 95 110 60 27 21629 43484 40696 24672 10411 386Turkey 67 79 42 26 24 11950 14344 9140 7732 10033 418Untd Arab Em 254 189 209 210 271 116245 83400 96620 106630 77425 286Uzbekistan 0 0 1 1 3 6 48 436 436 1018 356Viet Nam 5 12 18 15 32 2624 6383 10023 6487 5153 163Yemen 10 43 22 22 61 4116 14591 9391 9412 12292 203
Europe 4568 4542 4341 4792 5058 2279546 2508125 2361587 2543368 2616373 517Albania 0 0 0 2 1
Austria 104 116 115 120 121 74587 94532 85507 78349 83416 689Bel-Lux 426 146 215 313 519 113649 92676 128641 146074 242000 466Belarus 4 4 4 1800 1600 1600 444Bosnia Herzg 1 1
Bulgaria 0 0 0 8 8 64 64 69 2761 2761 337Croatia 5 7 8 10 10 2803 5248 5491 6628 6299 630Czech Rep 15 20 37 26 30 8800 11733 13371 13707 14803 493Denmark 171 188 167 189 185 90363 109300 86600 105475 96039 520Estonia 57 64 67 61 61 8575 13726 16069 15231 16210 266Finland 18 22 21 23 26 5771 6623 7654 8265 10479 403France 234 260 256 310 323 162987 192368 173261 197125 193297 598Germany 1003 1177 975 1095 1074 541364 645957 547891 575984 551817 514Greece 3 4 9 14 15 1759 2371 5177 4789 4645 310Hungary 12 29 14 24 25 4794 7656 9466 13720 16137 653Iceland 4 5 4 5 6 3479 3900 3550 3896 4937 809Ireland 56 70 40 70 83 28866 37528 17767 34624 38290 461Italy 257 323 295 312 378 134190 175158 170484 154823 249221 659Latvia 1 3 0 2 2Lithuania 10 4 6 4 5 1924 776 1931 1241 1895 379Macedonia 1 1 1 1 1
Malta 7 5 3 5 5 3659 2384 1573 2380 2484 507Moldova Rep 2 1 1 1 1
Netherlands 560 552 522 556 538 303595 304493 273942 269427 263015 489Norway 71 71 79 102 91 42083 47240 51945 57640 50256 552Poland 10 38 31 66 58 8783 13200 15410 35594 29432 512Portugal 9 6 5 8 14 6067 4311 3901 5653 9411 672Romania 1 1 3 2 4 488 693 2203 917 1616 404Russian Fed 5 5 6 29 45 2700 2700 4000 5695 4806 107Slovakia 1 1 5 71 75 487 555 5208 15428 23334 311Slovenia 13 9 13 11 13 7782 10147 12662 8916 9894 761Spain 35 37 36 112 76 25833 27476 27509 75421 33039 435Sweden 126 112 135 143 147 63893 69793 76519 73740 79623 542Switzerland 144 136 129 138 143 132769 149109 125756 127138 134592 941UK 1202 1127 1132 947 964 494205 472604 480376 494460 434680 451Ukraine 0 1 3 2 2 227 239 2070 930 930 517Yugoslavia 2 2 4 4 4 1278 1278 2218 2218 2218 516
Oceania 84 92 83 98 114 45001 47211 46257 49535 52258 458
Australia 61 68 66 72 89 35051 35247 32757 35975 38924 437Fiji Islands 2 1 1
Fr Polynesia 7 6 5 9 8 3101 2690 2358 3277 2786 359Marshall Is 3 3 3 3 3New Zealand 4 5 5 6 7 3167 4175 6164 6396 6388 913NewCaledonia 0 2 2 3 2 195 1543 1586 1321 1180 550Solomon Is 1 2 0 1 0Tonga 1 1 1 0 1
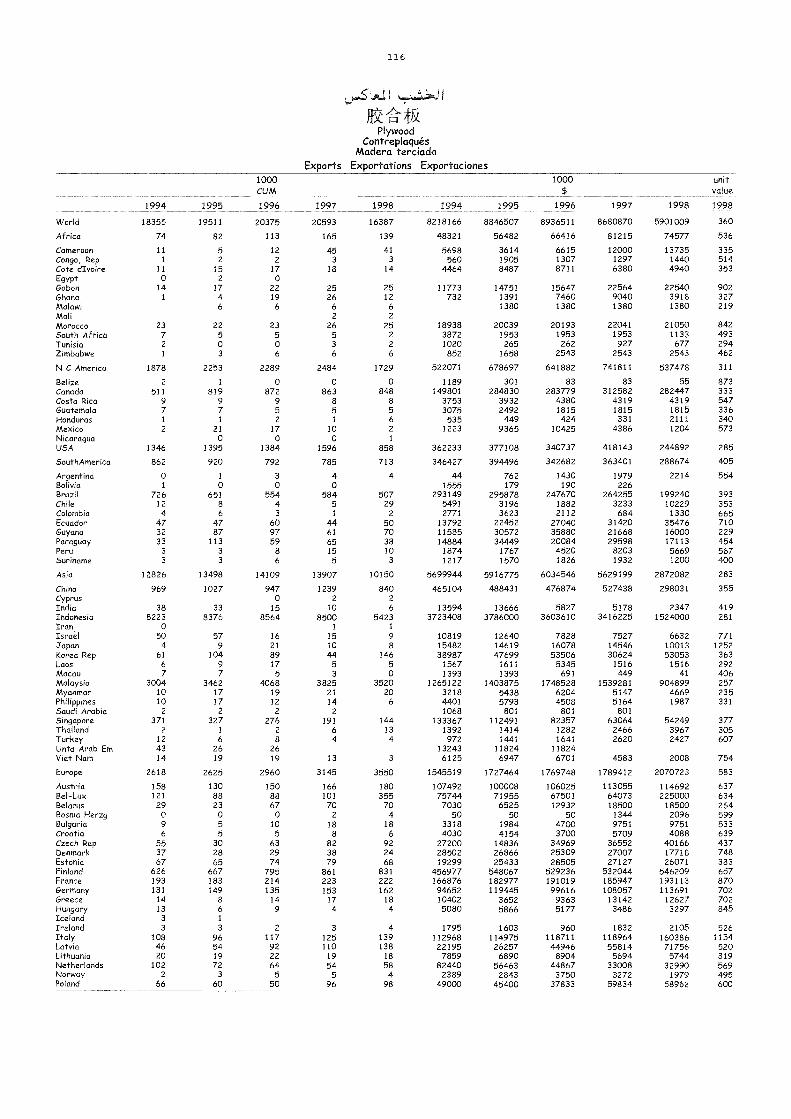
116
W-Iv. FAPlywood
ContreplaquésMadera terciada
Exports Exportations Exportaciones
1994 1995
1000CUM
1996 1997 1998 1994 1995
1000$
1996 1997 1998
unitvalue
1998
World 18355 19511 20375 20593 16387 8218166 8846507 8936511 8680870 5901009 360
Africa 74 82 113 165 139 48321 56482 66416 81215 74577 536
Cameroon 11 5 12 45 41 5698 3614 6615 12000 13735 335Congo, Rep 1 2 2 3 3 560 1905 1307 1297 1440 514Cote dIvoire 11 15 17 18 14 4464 8487 8711 6380 4940 353Egypt 0 2 0Gabon 14 17 22 25 25 11773 14751 15647 22564 22540 902Ghana 1 4 19 26 12 732 1391 7460 9040 3918 327Malawi 6 6 6 6 1380 1380 1380 1380 219Mali 2 2
Morocco 23 22 23 26 25 18938 20039 20193 22041 21050 842South Africa 7 5 5 5 2 3872 1953 1953 1953 1133 493Tunisia 2 0 0 3 2 1020 265 262 927 677 294Zimbabwe 1 3 6 6 6 852 1658 2543 2543 2543 462
N C America 1878 2253 2289 2484 1729 522071 678697 641882 741811 537478 311
Belize 2 1 0 0 0 1189 301 83 83 55 873Canada 511 819 872 863 848 149801 284830 283779 312582 282447 333Costa Rica 9 9 9 8 8 3753 3932 4380 4319 4319 547Guatemala 7 7 5 5 5 3075 2492 1815 1815 1815 336Honduras 1 1 2 1 6 535 449 424 331 2111 340Mexico 2 21 17 10 2 1223 9365 10425 4386 1204 573Nicaragua 0 0 0 1
USA 1346 1395 1384 1596 858 362233 377108 340737 418143 244892 285
SouthAmerica 862 920 792 785 713 346427 394496 342682 363401 288674 405
Argentina 0 1 3 4 4 44 762 1430 1979 2214 554Bolivia 1 0 0 0 1555 179 190 226Brazd 726 651 554 584 507 293149 295878 247670 264255 199240 393Chile 12 8 4 5 29 5491 3196 1882 3233 10229 353Colombia 4 6 3 1 2 2771 3623 2112 684 1330 665Ecuador 47 47 60 44 50 13792 22452 27040 31420 35476 710Guyana 32 87 97 61 70 11585 30572 35880 21668 16000 229Paraguay 33 113 59 65 38 14884 34449 20084 29598 17113 454Peru 3 3 8 15 10 1874 1767 4520 8203 5669 567Suriname 3 3 6 5 3 1217 1570 1826 1932 1200 400
Asia 12826 13498 14109 13907 10150 5699944 5916775 6034546 5629199 2872082 283
China 969 1027 947 1239 840 465104 488431 476874 527438 298031 355Cyprus 0 2 2
India 38 33 15 10 6 13594 13666 5827 5178 2347 419Indonesia 8223 8376 8564 8500 5423 3723408 3786000 3603610 3416225 1524000 281Iran 0 1 1
Israel 50 57 16 15 9 10819 12640 7828 7527 6632 771Japan 4 9 21 10 8 15482 14619 16078 14546 10013 1252Korea Rep 61 104 89 44 146 38987 47699 53506 30624 53053 363Laos 6 9 17 5 5 1567 1611 5345 1516 1516 292Macau 7 7 5 3 0 1393 1393 691 449 41 406Malaysia 3004 3462 4068 3825 3520 1265122 1403875 1748528 1539281 904899 257Myanmar 10 17 19 21 20 3218 5438 6204 5147 4669 235PhilippMes 10 17 12 14 6 4401 5793 4508 5164 1987 331Saudi Arabia 2 2 2 2 1068 801 801 801Singapore 371 327 276 191 144 133367 112491 82357 63064 54249 377Thailand 2 1 2 6 13 1392 1414 1282 2466 3967 305Turkey 12 6 8 4 4 972 1441 1641 2620 2427 607lintel Arab Em 43 26 26 13243 11824 11824Viet Nam 14 19 19 13 3 6125 6947 6701 4583 2008 754
Europe 2618 2625 2960 3145 3550 1545519 1727464 1769748 1789412 2070723 583
Austria 158 130 150 166 180 107492 100008 106025 113055 114692 637Bel-Lux 121 88 88 101 355 75744 71955 67501 64073 225000 634Belarus 29 23 67 70 70 7030 6525 12932 18500 18500 264Bosnia Herzg 0 0 0 2 4 50 50 50 1344 2096 599Bulgaria 9 5 10 18 18 3318 1984 4700 9751 9751 533Croafia 6 5 5 8 6 4030 4154 3700 5709 4088 639Czech Rep 55 30 63 82 92 27200 14836 34969 36552 40166 437Denmark 37 28 29 38 24 28502 26866 25309 27007 17718 748Estonia 67 65 74 79 68 19299 25433 28505 27127 26071 383FMMnd 626 667 795 861 831 456977 548067 529236 532044 546209 657France 193 183 214 223 222 166876 182977 191019 185947 193113 870Germany 131 149 135 153 162 94652 119445 99616 108057 113691 702Greece 14 8 14 17 18 10402 3652 9363 13142 12627 702Hungary 13 6 9 4 4 5080 5866 5177 3486 3297 845Iceland 3 1
Ireland 3 3 2 3 4 1795 1603 960 1832 2105 526Italy 108 96 117 125 139 112968 114975 118711 118964 160386 1154Latvia 46 54 92 110 138 22195 26257 44946 55814 71756 520Lithuania 20 19 22 19 18 7859 6890 8904 5694 5744 319Netherlands 102 72 64 54 58 82440 56463 44867 33008 32990 569Norway 2 3 5 5 4 2389 2843 3750 3272 1979 495Poland 66 60 50 96 98 49000 45400 37833 59834 58962 600
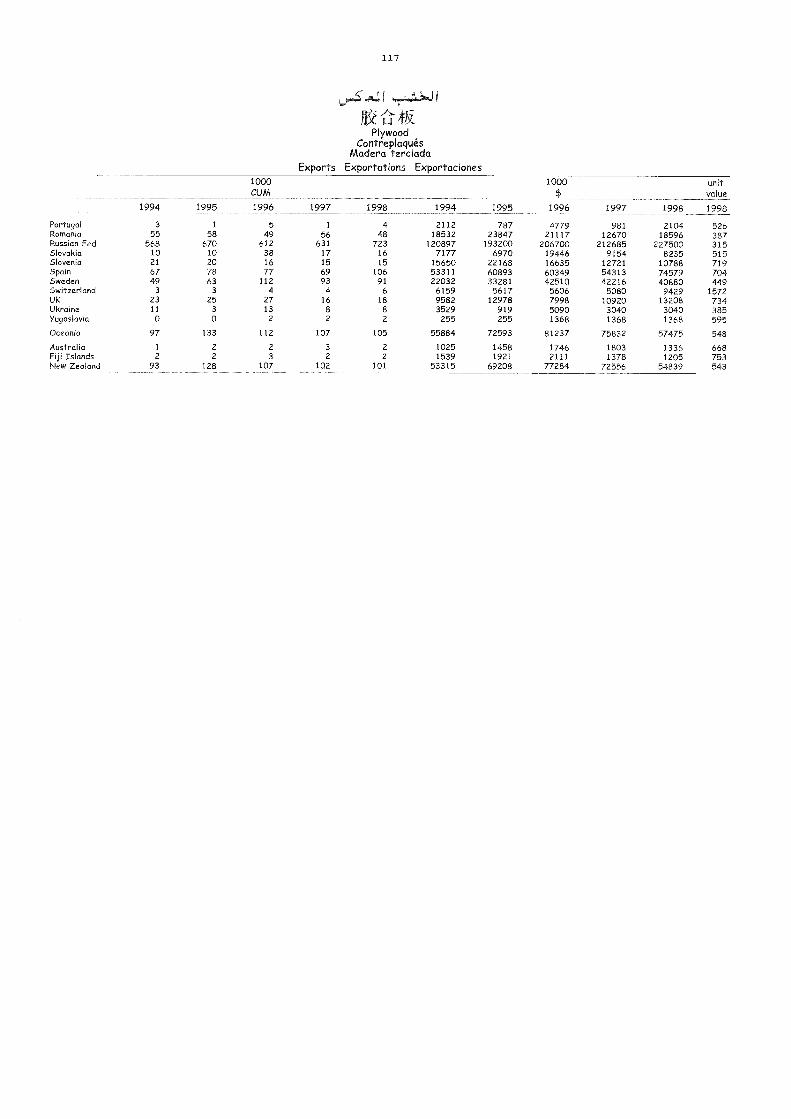
117
... .06.0
PlywoodContreplaqués
Madera terciadaExports Exportations Exportaciones
1994 1995
1000CUM
1996 1997 1998 1994 1995
1000$
1996 1997 1998
unitvalue
1998
Portugal 3 1 5 1 4 2112 787 4779 981 2104 526Romania 55 58 49 56 48 18532 23847 21117 12670 18596 387Russian Fed 568 670 612 631 723 120897 193200 206700 212685 227500 315Slovakia 10 10 38 17 16 7177 6970 19446 9154 8235 515Slovenia 21 20 16 15 15 15650 22168 16635 12721 10788 719Spain 67 78 77 69 106 53311 60893 60349 54313 74579 704Sweden 49 63 112 93 91 22032 33281 42510 42216 40880 449Switzerland 3 3 4 4 6 6159 5617 5606 5080 9429 1572UK 23 25 27 16 18 9582 12978 7998 10920 13208 734Ukraine 11 3 13 8 8 3529 919 5090 3040 3040 385Yugoslavia 0 0 2 2 2 255 255 1368 1368 1368 595
Oceania 97 133 112 107 105 55884 72593 81237 75832 57475 548
Australia 1 2 2 3 2 1025 1458 1746 1803 1336 668Fiji Islands 2 2 3 2 2 1539 1921 2111 1378 1205 753New Zealand 93 128 107 102 101 53315 69208 77284 72556 54839 543
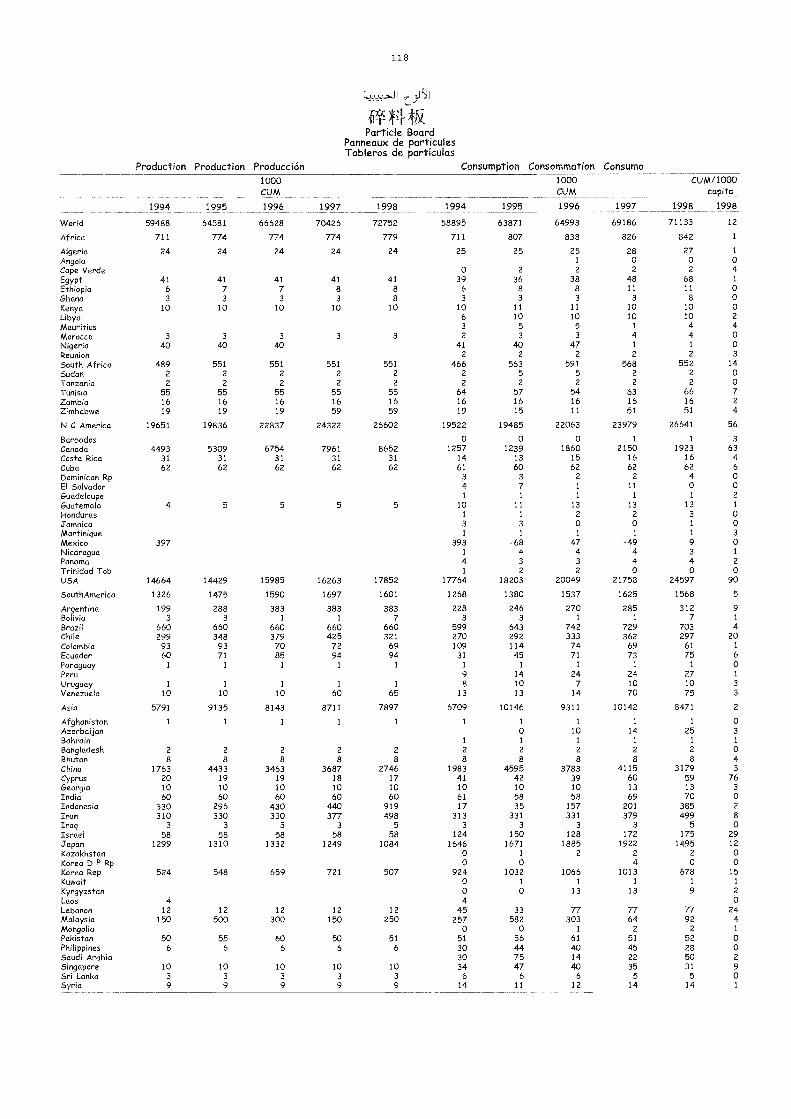
118
05- 14Particle Board
Panneaux de particulesTableros de partículas
Production Production Producción Consumption Consommation Consumo
1994 1995
1000CUM
1996 1997 1998 1994 1995
1000CUM
1996 1997
CUM/1000capita
1998 1998
World 59488 64581 66628 70426 72752 58895 63871 64993 69186 71133 12
Africa 711 774 774 774 779 711 807 838 826 842 1
Algeria 24 24 24 24 24 25 25 25 28 27 1
Angola 1 0 0 0
Cape Verde 0 2 2 2 2 4
Egypt 41 41 41 41 41 39 36 38 48 68 1
Ethiopia 6 7 7 8 8 6 8 8 11 11 0
Ghana 3 3 3 3 8 3 3 3 3 8 0Kenya 10 10 10 10 10 10 11 11 10 10 0Libya 6 10 10 10 10 2
Mauritius 3 5 5 1 4 4Morocco 3 3 3 3 3 2 3 3 4 4 0Nigeria 40 40 40 41 40 47 1 1 0Reunion 2 2 2 2 2 3
South Africa 489 551 551 551 551 466 563 591 568 552 14Sudan 2 2 2 2 2 2 5 5 2 2 0Tanzania 2 2 2 2 2 2 2 2 2 2 0
Tunisia 55 55 55 55 55 64 57 54 63 66 7
Zambia 16 16 16 16 16 16 16 16 16 16 2
Zimbabwe 19 19 19 59 59 19 15 11 51 51 4
N C America 19651 19836 22837 24322 26602 19522 19485 22063 23979 26641 56
Barbados 0 0 0 1 1 3Canada 4493 5309 6754 7961 8652 1257 1239 1860 2150 1923 63Costa Rica 31 31 31 31 31 14 13 15 16 16 4Cuba 62 62 62 62 62 61 60 62 62 62 6Dominican Rp 3 3 2 2 4 0El Salvador 4 7 1 11 0 0Guadeloupe 1 1 1 1 1 2
Guatemala 4 5 5 5 5 10 11 13 13 13 1
Honduras 1 1 2 2 3 0Jamaica 3 3 0 0 1 0Martinique 1 1 1 1 1 3Mexico 397 393 -68 47 -49 9 0Nicaragua 1 4 4 4 3 1
Panama 4 3 3 4 4 2
Trinidad Tob 1 2 2 0 0 0USA 14664 14429 15985 16263 17852 17764 18203 20049 21758 24597 90
SouthAmer ca 1326 1475 1590 1697 1601 1268 1380 1537 1625 1568 5
Argentina 199 288 383 383 383 228 246 270 285 312 9Bolivia 3 3 1 1 7 3 3 1 1 7 1
Brazil 660 660 660 660 660 599 643 742 729 703 4Chile 299 348 379 425 321 270 292 333 362 297 20Colombia 93 93 70 72 69 109 114 74 69 61 1
Ecuador 60 71 85 94 94 31 45 71 73 75 6
Paraguay 1 1 1 1 1 1 1 1 1 1 0Peru 9 14 24 24 27 1
Uruguay 1 1 1 1 1 8 10 7 10 10 3
Venezuela 10 10 10 60 65 13 13 14 70 75 3
Asia 5791 9135 8143 8711 7897 6709 10146 9311 10142 8471 2
Afghanistan 1 1 1 1 1 1 1 1 1 1 0Azerbaijan 0 10 14 25 3
Bahrain 1 1 1 1 1 1
Bangladesh 2 2 2 2 2 2 2 2 2 2 0Bhutan 8 8 8 8 8 8 8 8 8 8 4China 1763 4433 3463 3687 2746 1983 4595 3783 4115 3179 3Cyprus 20 19 19 18 17 41 42 39 60 59 76Georgia 10 10 10 10 10 10 10 10 13 13 3
India 60 60 60 60 60 61 58 58 69 70 0Indonesia 330 296 430 440 919 17 35 157 201 385 2
Iran 310 330 330 377 498 313 331 331 379 499 8Iraq 3 3 3 3 5 3 3 3 3 5 0Israel 58 58 58 58 58 124 150 128 172 175 29Japan 1299 1310 1332 1249 1084 1646 1671 1885 1922 1495 12
Kazakhstan 0 1 2 2 2 0Korea D P Rp 0 0 4 0 0Korea Rep 524 548 659 721 507 924 1032 1066 1013 678 15Kuwait 0 1 1 1 1 1
Kyrgyzstan 0 0 13 13 9 2
Laos 4 4 0Lebanon 12 12 12 12 12 45 33 77 77 77 24Malaysia 150 500 300 150 250 257 582 303 64 92 4Mongolia 0 0 1 2 2 1
Pakistan 50 55 60 50 51 51 56 61 51 52 0Philippines 6 6 6 6 6 30 4-4 40 45 28 0
Saudi Arabia 30 75 14 22 50 2
Singapore 10 10 10 10 10 34 47 40 35 31 9Sri Lanka 3 3 3 3 3 6 6 6 5 5 0Syria 9 9 9 9 9 14 11 12 14 14 1
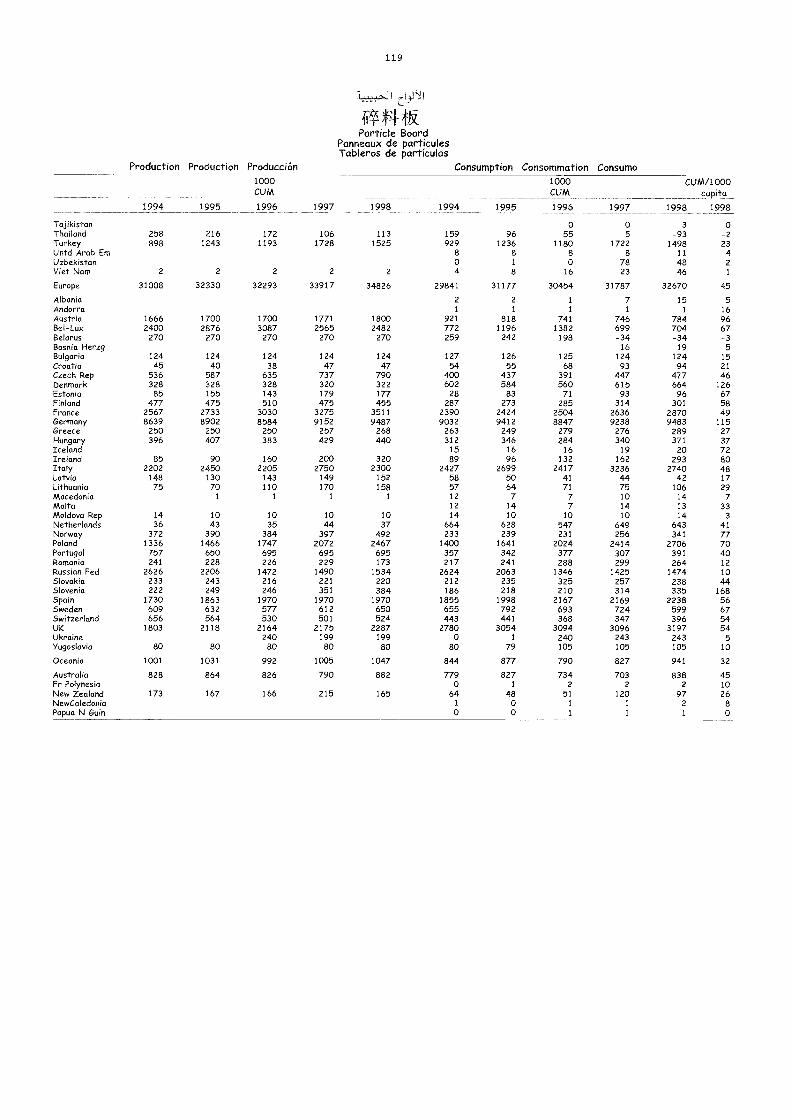
119
1A1
{11414Particle Board
Panneaux de particulesTableros de partículas
Production Production Producción Consumption Consommation Consumo
1994 1995
1000CUM
1997 1998 1994 1995
1000CUM
1996 1997
CUM/1000capita
1998 19981996
Tajikistan 0 0 3 oThailand 258 216 172 106 113 159 96 55 5 -93 -2Turkey 898 1243 1193 1728 1525 929 1236 1180 1722 1498 23Untd Arab Em 8 5 8 8 11 4Uzbekistan 0 1 0 78 48 2
Viet Nora 2 2 2 2 2 4 8 16 23 46 1
Europe 31008 32330 32293 33917 34826 29841 31177 30454 31787 32670 45
Albania 2 2 1 7 15 5
Andorra 1 1 1 1 1 16Austria 1666 1700 1700 1771 1800 921 818 741 746 784 96Bel-Lux 2400 2876 3087 2565 2482 772 1196 1382 699 704 67Belarus 270 270 270 270 270 259 242 198 -34 -34 -3Bosnia Herzg 16 19 5Bulgaria 124 124 124 124 124 127 126 125 124 124 15Croatia 45 40 38 47 47 54 55 68 93 94 21Czech Rep 536 587 635 737 790 400 437 391 447 477 46Denmark 328 328 328 320 322 602 584 560 615 664 126Estonia 85 155 143 179 177 28 83 71 93 96 67Finland 477 475 510 475 455 287 273 285 314 301 58France 2567 2733 3030 3275 3511 2390 2424 2504 2636 2870 49Germany 8639 8902 8584 9152 9487 9032 9412 8847 9238 9483 115Greece 250 250 250 257 268 263 249 279 276 289 27Hungary 396 407 383 429 440 312 346 284 340 371 37Iceland 15 16 16 19 20 72Ireland 85 90 160 200 320 89 96 132 162 293 80Italy 2202 2450 2205 2750 2300 2427 2699 2417 3236 2740 48Latvia 148 130 143 149 152 58 50 41 44 42 17Lithuania 75 70 110 170 158 57 64 71 75 106 29Macedonia 1 1 1 1 12 7 7 10 14 7Malta 12 14 7 14 13 33Moldova Rep 14 10 10 10 10 14 10 10 10 14 3
Netherlands 36 43 35 44 37 664 628 547 649 643 41Norway 372 390 384 397 492 233 239 231 256 341 77Poland 1336 1466 1747 2072 2467 1400 1641 2024 2414 2706 70Portugal 757 650 695 695 695 357 342 377 307 391 40Romania 241 228 226 229 173 217 241 288 299 264 12Russian Fed 2626 2206 1472 1490 1534 2624 2063 1346 1425 1474 10Slovakia 233 243 216 221 220 212 235 325 257 238 44Slovenia 222 249 246 351 384 186 218 210 314 335 168Spain 1730 1863 1970 1970 1970 1855 1998 2167 2169 2238 56Sweden 609 632 577 612 650 655 792 693 724 599 67Switzerland 656 564 530 501 524 443 441 368 347 396 54UK 1803 2118 2164 2175 2287 2780 3054 3094 3096 3197 54Ukraine 240 199 199 0 1 240 243 243 5Yugoslavia 80 80 80 80 80 80 79 105 105 105 10
Oceania 1001 1031 992 1005 1047 844 877 790 827 941 32
Australia 828 864 826 790 882 779 827 734 703 838 45Fr Polynesia o 1 2 2 2 10New Zealand 173 167 166 215 165 64 48 51 120 97 26NewCaledonia 1 0 1 1 2 8Papua N Guin 0 0 1 1 1 o
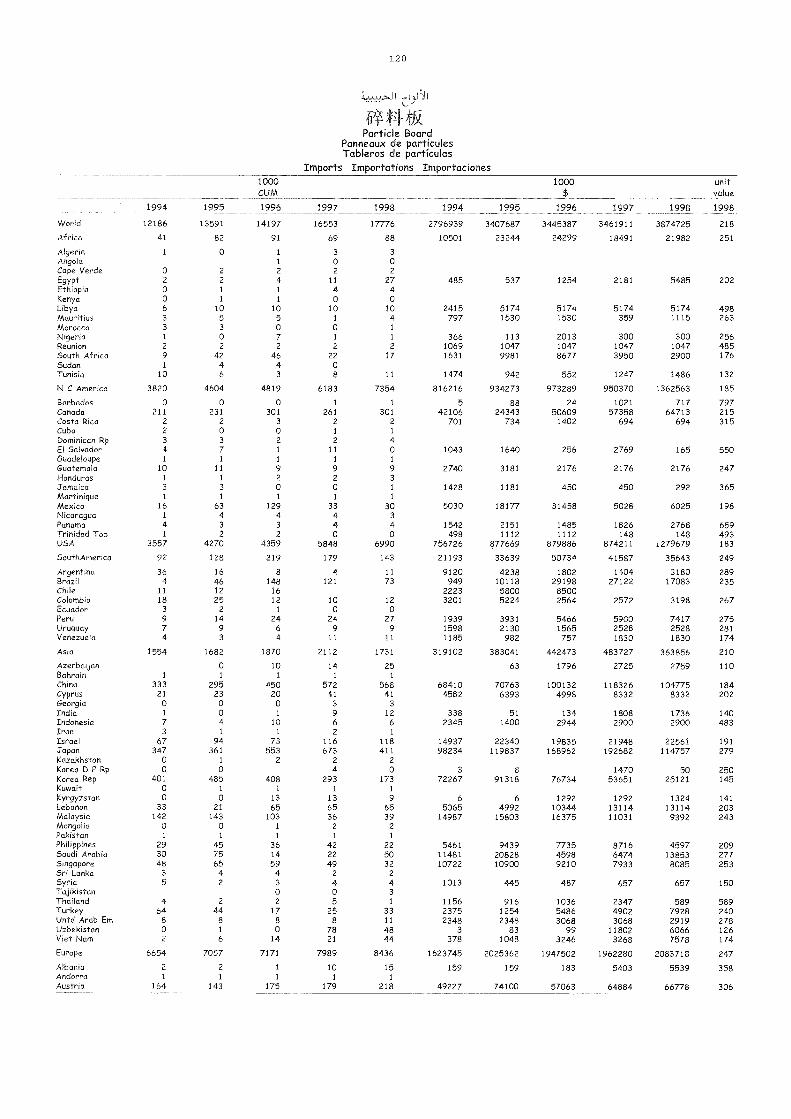
Particle BoardPanneaux de particulesTableros de partículas
Imports Importations Importaciones
120
wri-*
1994 1995
1000CUM
1996 1997 1998 1994 1995
1000$
1996 1997 1998
unitvalue
1998
World 12186 13591 14197 16553 1 // 6 2796939 3407687 3445387 3461911 3874725 218
Africa 41 82 91 69 88 10501 23244 24299 18491 21982 251
Algeria 1 0 1 3 3Angola 1 0 0Cape Verde 0 2 2 2 2Egypt 2 2 4 11 27 485 537 1254 2181 5485 202Ethiopia 0 1 1 4 4Kenya 0 1 1 0 0Libya 6 10 10 10 10 2415 5174 5174 5174 5174 498Mauritius 3 5 5 1 4 797 1530 1530 359 1115 263Morocco 3 3 0 0 1
Nigeria 1 0 7 1 1 366 113 2013 300 300 256Reunion 2 2 2 2 2 1069 1047 1047 1047 1047 485South Africa 9 42 46 22 17 1631 9981 8677 3950 2900 176Sudan 1 4 4 0Tunisia 10 6 3 8 11 1474 942 552 1247 1486 132
N C America 3820 4604 4819 6183 7354 816216 934273 973289 950370 1362563 185
Barbados 0 0 0 1 1 5 88 24 1021 717 797Canada 211 231 301 261 301 42106 24343 50609 57358 64713 215Costa Rica 2 2 3 2 2 701 734 1402 694 694 315Cuba 2 0 0 1 1
Dominican Rp 3 3 2 2 4El Salvador 4 7 1 11 0 1043 1640 256 2769 165 550Guadeloupe 1 1 1 I 1
Guatemala 10 11 9 9 9 2740 3181 2176 2176 2176 247Honduras 1 1 2 2 3
Jamaica 3 3 0 0 1 1428 1181 450 450 292 365Martinique 1 1 1 1 1
Mexico 16 63 129 33 30 5030 18177 31458 5028 6025 198Nicaragua 1 4 4 4 3
Panama 4 3 3 4 4 1542 2151 1485 1826 2768 659Trinidad Tob 1 2 2 0 0 498 1112 1112 148 148 493USA 3557 4270 4359 5848 6990 756726 877669 879886 874211 1279679 183
SouthAmerica 92 128 219 179 143 21193 33639 50734 41587 35643 249
Argentina 36 16 8 4 11 9120 4238 1802 1404 3180 289Brazil 4 46 148 121 73 949 10118 29198 27122 17083 235Chile 11 12 16 2223 5800 8500Colombia 18 25 12 10 12 3201 5224 2564 2572 3198 267Ecuador 3 2 1 0 0Peru 9 14 24 24 27 1939 3931 5466 5900 7417 275Uruguay 7 9 6 9 9 1598 2130 1565 2528 2528 281Venezuela 4 3 4 II 11 1185 982 757 1830 1830 174
Asia 1554 1682 1870 2112 1731 319102 383041 442473 483727 363856 210
Azerbaijan 0 10 14 25 63 1796 2725 2759 110Bahrain 1 1 1 1 1
China 333 295 450 572 568 68410 70763 100132 118326 104775 184Cyprus 21 23 20 41 41 4582 6393 4998 8332 8332 202Georgia 0 0 0 3 3
India 1 0 1 9 12 338 51 134 1808 1736 140Indonesia 7 4 10 6 6 2345 1400 2944 2900 2900 483Iran 3 1 1 2 1
Israel 67 94 73 116 118 14937 22340 19835 21948 22561 191Japan 347 361 553 673 411 98234 119837 168962 192682 114757 279Kazakhstan 0 1 2 2 2
Korea D P Rp 0 0 4 0 3 8 1470 50 250Korea Rep 401 485 408 293 173 72267 91318 76734 53651 25121 145Kuwait 0 1 I 1 1
Kyrgyzstan 0 0 13 13 9 6 6 1292 1292 1324 141Lebanon 33 21 65 65 65 5065 4992 10344 13114 13114 203Malaysia 142 143 103 36 39 14987 15803 16375 11031 9392 243Mongolia 0 0 1 2 2
Pakistan 1 1 1 1 1
Philippines 29 45 36 42 22 5461 9439 7735 8716 4597 209Saudi Arabia 30 75 14 22 50 11481 20828 4598 6474 13853 277Singapore 48 65 59 49 32 10722 10900 9210 7933 8085 253Sri Lanka 3 4 4 2 2
Syria 5 2 3 4 4 1013 445 487 657 657 150Tajikistan 0 0 3Thailand 4 2 2 5 1 1156 916 1036 2347 589 589Turkey 64 44 17 25 33 2375 1254 5486 4902 7928 240Untd Arab Em 8 8 8 8 11 2348 2348 3068 3068 2919 278Uzbekistan 0 1 0 78 48 3 83 99 11802 6066 126Viet Nato 2 6 14 21 44 378 1048 3246 3268 7578 174
Europe 6654 7057 7171 7989 8436 1623745 2025362 1947502 1962280 2083718 247
Albania 2 2 1 10 15 159 159 183 5403 5539 358Andorra 1 1 1 1 1
Austria 164 143 175 179 218 49227 74100 57063 64884 66778 306
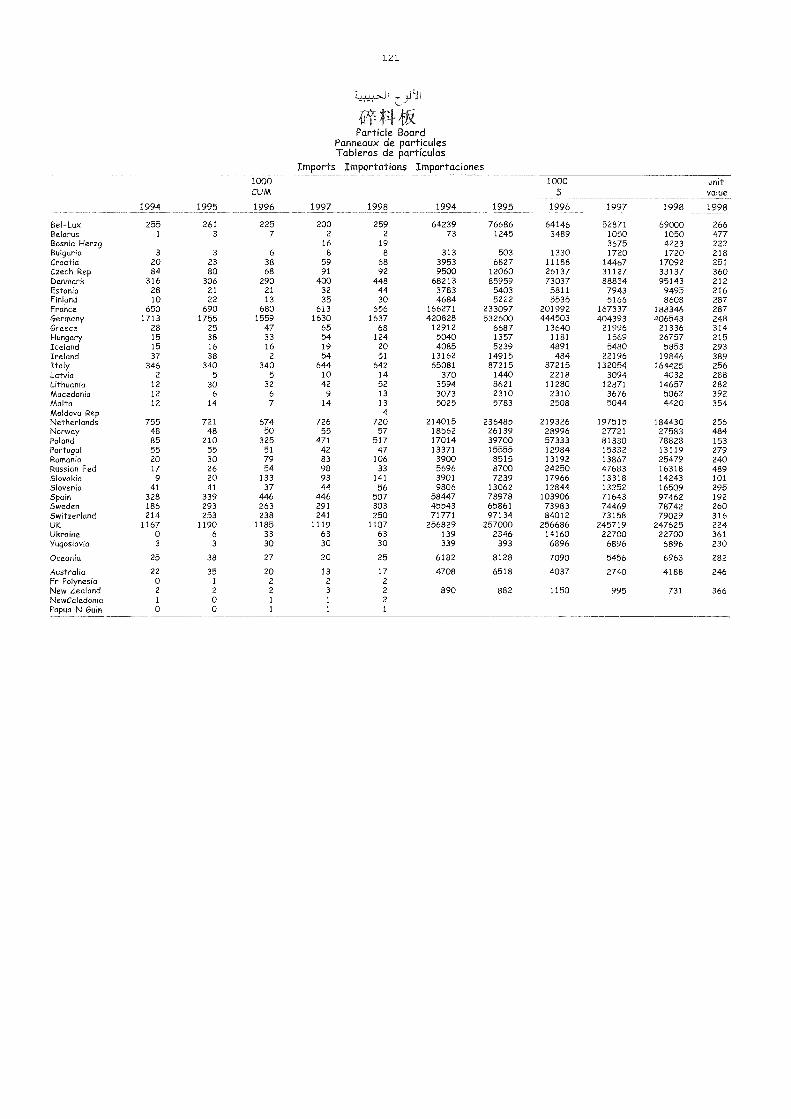
121
0'411kParticle Board
Panneaux de particulesTableros de partículas
Imports Importations Importaciones1000CUM
1000 unitvalue
1994 1995 1996 1997 1998 1994 1995 1996 1997 1998 1998
Bel-Lux 255 261 225 200 259 64239 76686 64146 52871 69000 266Bela rus 1 3 7 2 2 73 1245 3489 1050 1050 477Bosnia Herzg 16 19 3675 4223 222Bulgaria 3 3 6 8 8 313 503 1330 1720 1720 218Croatia 20 23 38 59 68 3953 6827 11188 14467 17092 251Czech Rep 84 80 68 91 92 9500 12060 26137 31127 33137 360Denmark 316 306 290 400 448 68213 85959 73037 88834 95143 212Estonia 28 21 21 32 44 3783 5403 5811 7943 9495 216Finland 10 22 13 35 30 4684 5222 5535 5166 8608 287France 650 690 680 613 656 166271 233097 201992 167337 188346 287Germany 1713 1755 1559 1630 1637 420828 532600 444503 404393 406543 248Greece 28 25 47 65 68 12912 6687 13640 21996 21336 314Hungary 15 38 33 54 124 5040 1357 1181 1569 26757 215Iceland 15 16 16 19 20 4085 5239 4891 5480 5853 293Ireland 37 38 2 54 51 13162 14915 484 22196 19846 389Italy 346 340 340 644 642 65081 87215 87215 132054 164425 256Latvia 2 5 5 10 14 370 1440 2218 3094 4032 288Lithuania 12 30 32 42 52 3594 8621 11280 12871 14657 282Macedonia 12 6 6 9 13 3073 2310 2310 3676 5062 392Malta 12 14 7 14 13 5025 5783 2508 5044 4420 354Moldova Rep 4
Netherlands 755 721 674 726 720 214015 236485 219326 197515 184430 256Norway 48 48 50 55 57 18562 26139 28996 27721 27583 484Poland 85 210 325 471 517 17014 39700 57333 81330 78828 153Portugal 55 55 51 42 47 13371 15555 12984 15332 13119 279Romania 20 30 79 83 106 3900 8515 13192 13867 25479 240Russian Fed 17 26 54 98 33 5696 8700 24250 47683 16318 489Slovakia 9 20 133 93 141 3901 7239 17966 13318 14243 101Slovenia 41 41 37 44 56 9806 13062 12844 13252 16509 295Spain 328 339 446 446 507 58447 78978 103906 71643 97462 192Sweden 186 293 263 291 303 45543 65861 73983 74469 78742 260Switzerland 214 253 238 241 250 71771 97134 84012 73158 79029 316UK 1167 1190 1185 1119 1107 256829 257000 256686 245719 247625 224Ukraine 0 6 33 63 63 139 2346 14160 22700 22700 361Yugoslavia 3 3 30 30 30 339 393 6896 6896 6896 230
Oceania 25 38 27 20 25 6182 8128 7090 5456 6963 282
Australia 22 35 20 13 17 4708 6518 4037 2740 4188 246Fr Polynesia 0 1 2 2 2
New Zealand 2 2 2 3 2 890 882 1150 995 731 366NewCaledonia 1 0 1 1 2Papua N Guin 0 0 1 1 1
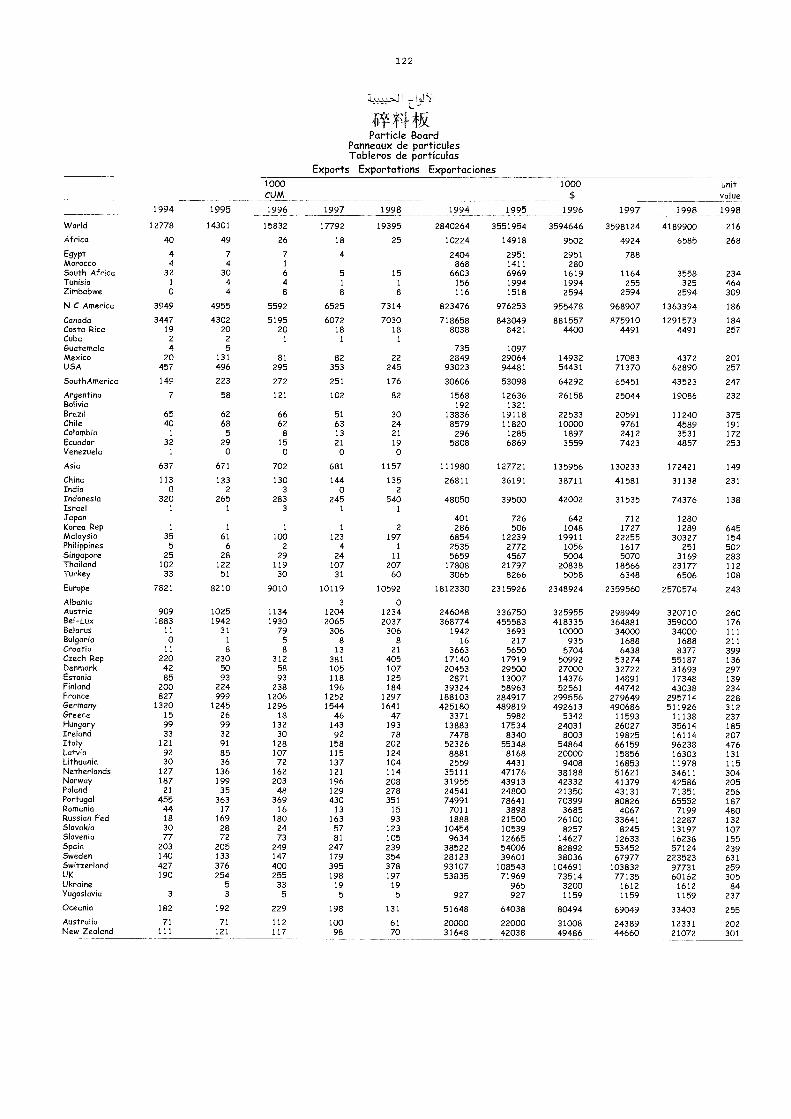
122
Wrs4Particle Board
Panneaux de particulesTableros de partículas
Expor s Exportations Exportaciones
1994 1995
1000CUM
1996 1997 1998 1994 1995
1000$
1996 1997 1998
unitvalue
1998
VVorld 12778 14301 15832 17792 19395 2840264 3551954 3594646 3598124 4189900 216
Africa 40 49 26 18 25 10224 14918 9502 4924 6585 268
Egypt 4 7 7 4 2404 2951 2951 788Morocco 4 4 1 868 1411 280South AfHca 32 30 6 5 15 6603 6969 1619 1164 3558 234TuMsia 1 4 4 1 1 156 1994 1994 255 325 464Zimbabwe 0 4 8 8 8 116 1518 2594 2594 2594 309
N C America 3949 4955 5592 6525 7314 823476 976253 955478 968907 1363394 186
Cenado 3447 4302 5195 6072 7030 718658 843049 881557 875910 1291573 184Costa Rica 19 20 20 18 18 8038 8421 4400 4491 4491 257Cuba 2 2 1 1 1
Guatemala 4 5 735 1097Mexico 20 131 81 82 22 2849 29064 14932 17083 4372 201USA 457 496 295 353 245 93023 94481 54431 71370 62890 257
SouthAmeHca 149 223 272 251 176 30606 53098 64292 65451 43523 247
Argentina 7 58 121 102 82 1568 12636 26158 25044 19086 232Bolivia 192 1321Brazfl 65 62 66 51 30 13836 19118 22533 20591 11240 375Chile 40 68 62 63 24 8579 11820 10000 9761 4589 191Colombia I 5 8 13 21 296 1285 1897 2412 3531 172Ecuador 32 29 15 21 19 5808 6869 3559 7423 4857 253Venezuela 1 o 0 0 0
Asia 637 671 702 681 1157 111980 127721 135956 130233 172421 149
Chino 113 133 130 144 135 26811 36191 38711 41581 31138 231India 0 2 3 0 2Indonesia 320 265 283 245 540 48050 39500 42002 31535 74376 138Israel 1 1 3 1 1
Japan 401 726 642 712 1280Korea Rep 1 1 1 1 2 286 506 1048 1727 1289 645Malaysia 35 61 100 123 197 6854 12239 19911 22255 30327 154PhilippMes 5 6 2 4 1 2535 2772 1056 1617 251 502Singapore 25 28 29 24 11 5659 4567 5004 5070 3169 283Thafland 102 122 119 107 207 17808 21797 20838 18566 23177 112Turkey 33 51 30 31 60 3065 8266 5058 6348 6506 108
Europe 7821 8210 9010 10119 10592 1812330 2315926 2348924 2359560 2570574 243
Albania 3 0Austria 909 1025 1134 1204 1234 246048 336750 325955 298949 320710 260Bel-Lux 1883 1942 1930 2065 2037 368774 455583 418335 364881 359000 176Mamas 11 31 79 306 306 1942 3693 10000 34000 34000 111Bulgaria o 1 5 8 8 16 217 935 1688 1688 211Croatia 11 8 8 13 21 3663 5650 5704 6438 8377 399Czech Rep 220 230 312 381 405 17140 17919 50992 53274 55187 136Denmark 42 50 58 105 107 20453 29500 27000 32722 31693 297Estonia 85 93 93 118 125 2871 13007 14376 14891 17348 139Finland 200 224 238 196 184 39324 58963 52561 44742 43038 234France 827 999 1206 1252 1297 188103 284917 299556 279649 295714 228Germany 1320 1245 1296 1544 1641 425180 489819 492613 490686 511926 312Greece 15 26 18 46 47 3371 5982 5342 11593 11138 237Hungary 99 99 132 143 193 13883 17534 24031 26027 35614 185Ireland 33 32 30 92 78 7478 8340 8003 19825 16114 207Italy 121 91 128 158 202 52326 55348 54864 66159 96238 476Latvia 92 85 107 115 124 8881 8168 20000 15856 16303 131Lithuania 30 36 72 137 104 2559 4431 9408 16853 11978 115NetheHands 127 136 162 121 114 35111 47176 38188 51621 34611 304Norway 187 199 203 196 208 31955 43913 42332 41379 42586 205Poland 21 35 48 129 278 24541 24800 21350 43131 71351 256Portugal 455 363 369 430 351 74991 78641 70399 80826 65552 187RomaMa 44 17 16 13 15 7011 3898 3685 4067 7199 480Russian Fed 18 169 180 163 93 1888 21500 26100 33641 12287 132Skwaa 30 28 24 57 123 10454 10539 8257 8245 13197 107,SvenM 77 72 73 81 105 9634 12665 14627 12633 16238 155SpaM 203 205 249 247 239 38522 54006 82892 53452 57124 239Sweden 140 133 147 179 354 28123 39601 38036 67977 223523 631Switzerland 427 376 400 395 378 93107 108543 104691 103832 97731 259UK 190 254 255 198 197 53835 71969 73514 77135 60162 305UkraMe 5 33 19 19 965 3200 1612 1612 84Yugoslavia 3 3 5 5 5 927 927 1159 1159 1159 237OceaMa 182 192 229 198 131 51648 64038 80494 69049 33403 255Australia 71 71 112 100 61 20000 22000 31008 24389 12331 202New ZeaMnd 111 121 117 98 70 31648 42038 49486 44660 21072 301
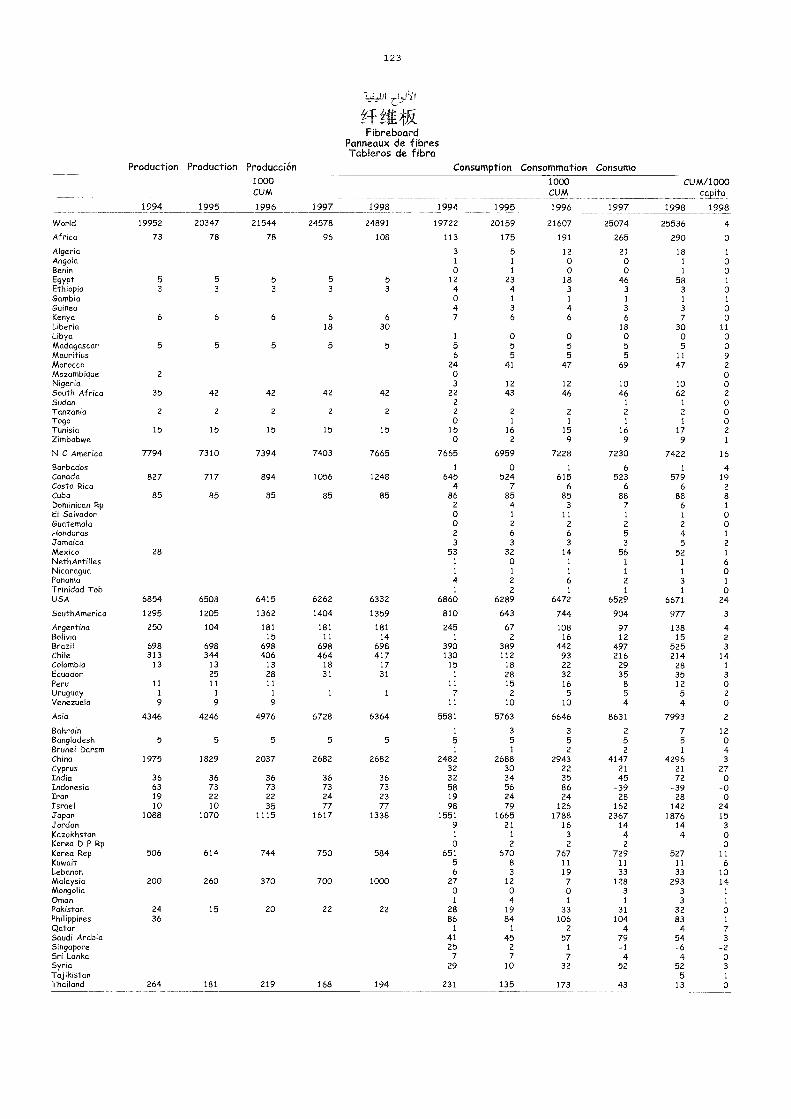
123
.ff It*Fibreboard
Panneaux de fibresTableros de fibra
Production Production Producción Consumption Consommation Consumo
1994 1995
1000CUM
1996 1997 1998 1994 1995
1000CUM
1996 1997 1998
CUM/1000capita
1998
World 19952 20347 21544 24578 24891 19722 20159 21607 25074 25536 4
Africa 73 78 78 96 108 113 175 191 265 290 0
Algeria 3 5 12 21 18 1
Angola 1 1 0 0 1 0Benin 0 1 0 0 1 0Egypt 5 5 5 5 5 12 23 18 46 58 1
Ethiopia 3 3 3 3 3 4 4 3 3 3 0Gambia 0 1 1 1 1 1
Guinea 4 3 4 3 3 0Kenya 6 6 6 6 6 7 6 6 6 7 0Liberia 18 30 18 30 11Libya 1 0 0 0 0 0Madagascar 5 5 5 5 5 5 5 5 5 5 0Mauritius 6 5 5 5 11 9Morocco 24 41 47 69 47 2
Mozambique 2 0 0Nigeria 3 12 12 10 10 0South Africa 35 42 42 42 42 22 43 46 46 62 2
Sudan 2 1 1 0Tanzania 2 2 2 2 2 2 2 2 2 2 0Togo 0 1 1 1 1 oTunisia 15 15 15 15 15 15 16 15 16 17 2Zimbabwe 0 2 9 9 9 1
N C America 7794 7310 7394 7403 7665 7665 6959 7228 7230 7422 16
Barbados 1 0 1 6 1 4Canada 827 717 894 1056 1248 645 524 615 523 579 19Costa Rica 4 7 6 6 6 2Cuba 85 85 85 85 85 86 85 85 88 88 8Dominican Rp 2 4 3 7 6 1
El Salvador 0 1 11 1 1 0Guatemala 0 2 2 2 2 0Honduras 2 6 6 5 4 1
Jamaica 3 3 3 3 5 2
Mexico 28 53 32 14 56 52 1
NethAntilles 1 0 1 1 1 6Nicaragua 1 1 1 1 1 0Panama 4 2 6 2 3 1
Trinidad Tob 1 2 1 1 1 0USA 6854 6508 6415 6262 6332 6860 6289 6472 6529 6671 24
SouthAmerica 1295 1205 1362 1404 1359 810 643 744 904 977 3
Argentina 250 104 181 181 181 245 67 108 97 138 4Bolivia 15 11 14 1 2 16 12 15 2Brazil 698 698 698 698 698 390 389 442 497 525 3Chile 313 344 406 464 417 130 112 93 216 214 14Colombia 13 13 13 18 17 15 18 22 29 28 1
Ecuador 25 28 31 31 1 28 32 35 35 3Pera 11 11 11 11 15 16 8 12 0Uruguay 1 1 1 1 1 7 2 5 5 5 2Venezuela 9 9 9 11 10 10 4 4 0
Asia 4346 4246 4976 6728 6364 5581 5763 6646 8631 7993 2
Bahrain 1 3 3 2 7 12Bangladesh 5 5 5 5 5 5 5 5 5 5 0Brunei Darsm 1 1 2 2 1 4China 1975 1829 2037 2682 2682 2482 2688 2943 4147 4296 3Cyprus 32 30 22 21 21 27India 36 36 36 36 36 32 34 35 45 72 0Indonesia 63 73 73 73 73 58 56 86 -39 -39 -0Iran 19 22 22 24 23 19 24 24 28 28 0Israel 10 10 35 77 77 98 79 126 162 142 24japan 1088 1070 1115 1617 1338 1551 1665 1788 2367 1876 15Jordan 9 21 16 14 14 3Kazakhstan 1 1 3 4 4 0Korea D P Rp 0 2 2 2 0Korea Rep 506 614 744 750 584 651 670 767 729 527 11Kuwait 5 8 II 11 11 6Lebanon 6 3 19 33 33 10Malaysia 200 260 370 700 1000 27 12 7 128 293 14Mongolia 0 0 0 3 3 1
Oman 1 4 1 1 3 1
Pakistan 24 15 20 22 22 28 19 33 31 32 0Philippines 36 86 84 106 104 83 1
Qatar 1 1 2 4 4 7Saudi Arabia 41 45 57 79 54 3Singapore 25 2 1 -1 -6 -2Sri Lanka 7 7 7 4 4 0Syria 29 10 32 52 52 3Tajikistan 5 1
Thailand 264 181 219 168 194 231 135 173 43 13 0
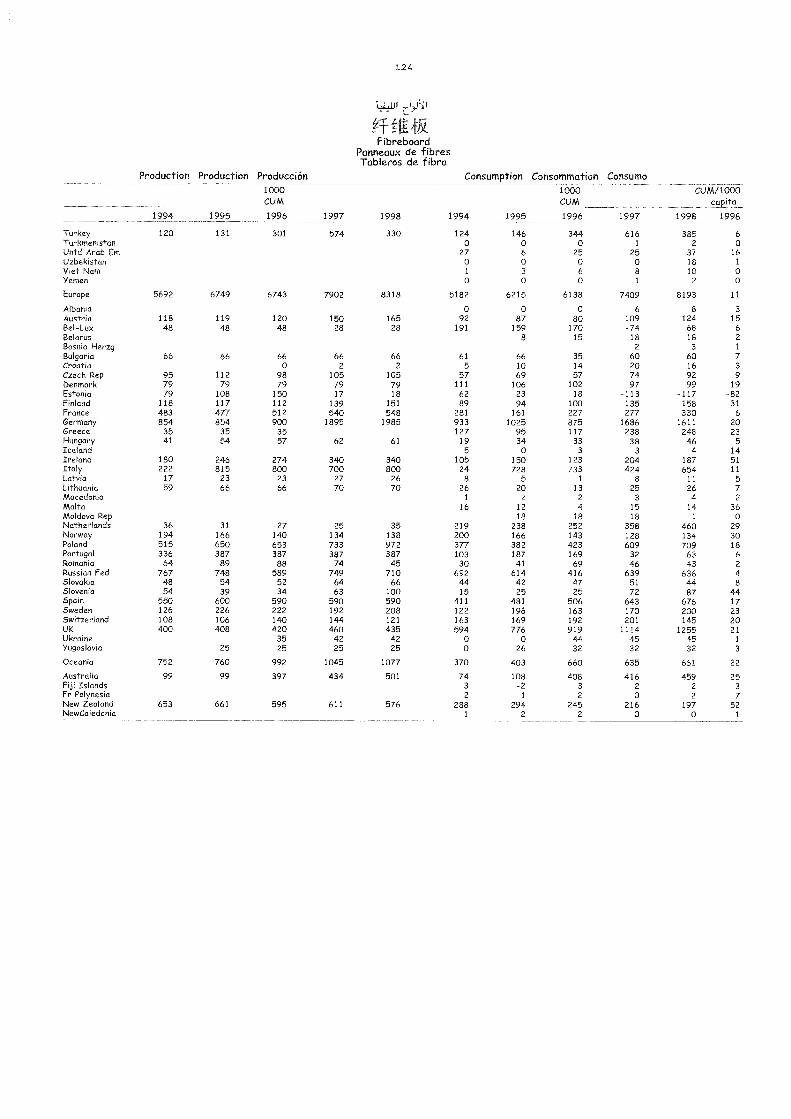
129
FibreboardPanneaux de f ibresTableros de fibra
Production Production Producción Consumption Consommation Consumo1000CUM
CUM/1000capita
1995 1996 1997 1998 1998
146 344 616 385 6
0 0 1 2 06 25 25 37 160 0 0 18 1
3 6 8 10 o0 0 1 2 0
6215 6138 7409 8193 11
0 0 6 8 3
87 80 109 124 15159 170 -74 68 6
8 15 18 18 2
2 3 1
66 35 60 60 710 14 20 16 3
69 57 74 92 9
106 102 97 99 1923 18 -113 -117 -8294 100 135 158 31
161 227 277 330 6
1025 875 1686 1611 2095 117 238 248 2334 33 38 46 5
0 3 3 4 14150 123 204 187 51728 733 424 654 11
5 1 8 11 5
20 13 25 26 72 2 3 4 2
12 4 15 14 3618 18 18 1 0
238 252 358 460 29166 143 128 134 30382 423 609 709 18187 169 32 63 6
41 69 46 43 2
614 416 639 636 442 47 51 44 8
25 25 72 87 4-4481 506 643 676 17196 163 170 200 23169 192 201 145 20776 919 1114 1255 21
0 44 45 45 1
26 32 32 32 3
403 660 635 661 22
108 408 416 459 25-2 3 2 2 3
1 2 0 2 7294 245 216 197 52
2 2 0 0 1
1994 1995
1000CUM
1996 1997
Turkey 120 131 301 574TurkmenistanUntd Arab EmUzbekistanViet NamYemen
Europe 5692 6749 6743 7902
AlbaniaAustria 118 119 120 150Bel-Lux 48 48 48 28BelarusBosnia HerzgBulgaria 66 66 66 66Croatia 0 2Czech Rep 95 112 98 105Denmark 79 79 79 79Estonia 79 108 150 17Finland 118 117 112 139France 483 477 512 540Germany 854 854 900 1895Greece 35 35 35Hungary 41 54 57 62IcelandIreland 180 246 274 340Italy 222 815 800 700Latvia 17 23 23 27Lithuania 59 66 66 70MacedoniaMaltaMoldova RepNetherlands 36 31 27 25Norway 194 166 140 134Poland 515 650 653 733Portugal 336 387 387 387Romania 64 89 88 74Russian Fed 767 748 589 749Slovakia 48 54 52 64Slovenia 54 39 34 63Spain 550 600 590 590Sweden 126 226 222 192Switzerland 108 106 140 144UK 400 408 420 460Ukraine 35 42Yugoslavia 25 25 25
Oceania 752 760 992 1045
Australia 99 99 397 434Fiji IslandsFr PolynesiaNew Zealand 653 661 595 611NewCaledonia
1998 1994
330 1240
2701
0
8318 5182
0165 9228 191
66 612 5
105 5779 11118 62
151 89548 281
1985 933127
61 195
340 105800 24
26 8
70 261
16
35 219138 200972 377387 10345 30
710 69266 44
100 15590 411208 122121 163435 594
42 025 0
1077 370
501 7432
576 2881
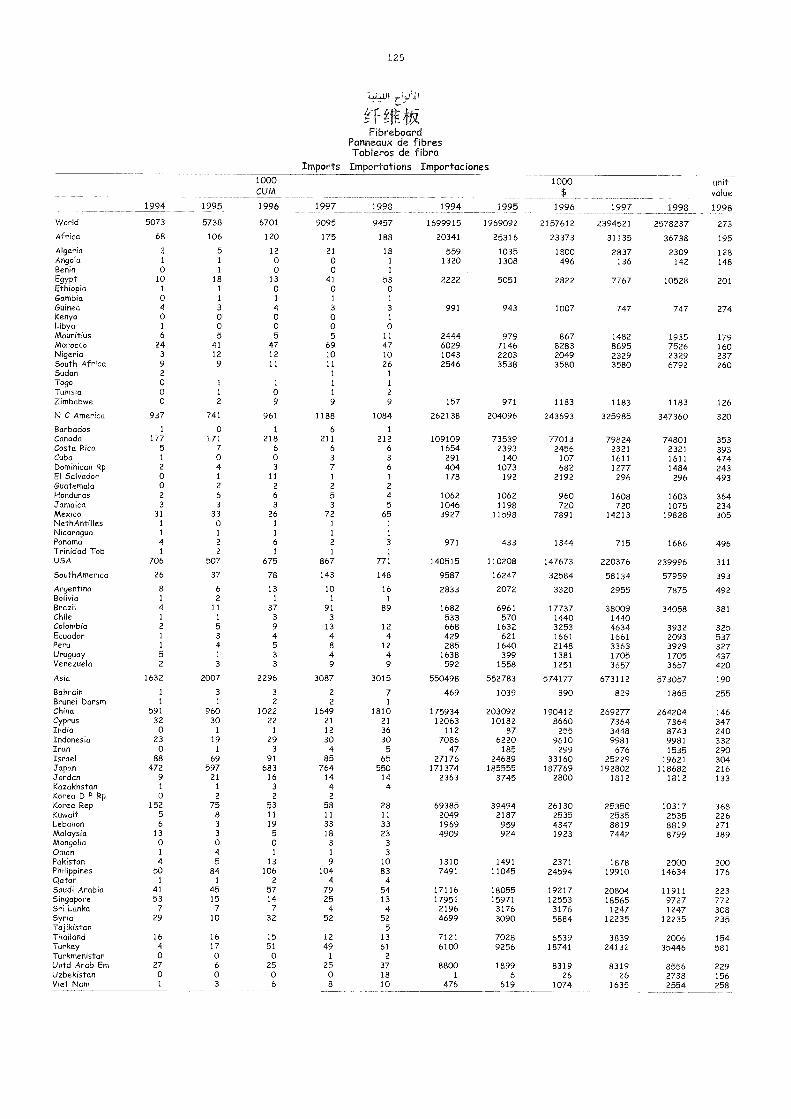
12 5
411
.qt*Fibreboard
Panneaux de fibresTableros de fibra
Imports Importations Importaciones
1994 1995
1000CUM
1996 1997 1998 1994 1995
1000$
1996 1997 1998
unitvalue
1998
World 5073 5738 6701 9095 9457 1699915 1969092 2157612 2394521 2578237 273
Africa 68 106 120 175 188 20341 25316 23373 31135 36738 195
Algeria 3 5 12 21 18 559 1035 1800 2837 2309 128Angola 1 1 0 0 1 1320 1308 496 136 142 148Benin 0 1 0 0 1
Egypt 10 18 13 41 53 2222 5051 2822 7767 10528 201Ethiopia 1 1 0 0 0Gambia 0 1 1 1 1
Guinea 4 3 4 3 3 991 943 1007 747 747 274Kenya 0 0 0 0 1
Libya 1 0 0 0 0Mauritius 6 5 5 5 11 2444 979 867 1482 1935 179Morocco 24 41 47 69 47 6029 7146 8283 8895 7526 160Nigeria 3 12 12 10 10 1043 2203 2049 2329 2329 237South Africa 9 9 11 11 26 2546 3538 3580 3580 6792 260Sudan 2 1 1
Togo 0 1 1 1 1
Tunisia 0 1 0 1 2Zimbabwe 0 2 9 9 9 157 971 1183 1183 1183 126
N C Amer ca 937 741 961 1188 1084 262138 204096 243693 325985 347360 320
Barbados 1 0 1 6 1
Canada 177 171 218 211 212 109109 73539 77013 79824 74801 353Costa Rica 5 7 6 6 6 1654 2393 2456 2321 2321 393Cuba 1 0 0 3 3 291 140 107 1611 1611 474Dominican Rp 2 4 3 7 6 404 1073 682 1277 1484 243El Salvador 0 1 11 1 1 178 192 2192 296 296 493Guatemala 0 2 2 2 2Honduras 2 6 6 5 4 1062 1062 960 1608 1603 364Jamaica 3 3 3 3 5 1046 1198 720 720 1075 234Mexico 31 33 26 72 65 3927 11598 7891 14213 19828 305NethAntilles 1 0 1 1 1
Nicaragua 1 1 1 1 1
Panama 4 2 6 2 3 971 433 1344 715 1686 496Trinidad Tob 1 2 1 1 1
USA 706 507 675 867 771 140515 110208 147673 220376 239996 311
SouthAmerica 26 37 78 143 148 9587 16247 32584 58134 57959 393
Argentina 8 6 13 10 16 2833 2072 3320 2955 7875 492Bolivia 1 2 1 1 1
Brazil 4 11 37 91 89 1682 6961 17737 38009 34058 381Chile 1 1 3 3 533 570 1440 1440Colombia 2 5 9 13 12 668 1632 3253 4634 3932 325Ecuador 1 3 4 4 4 429 621 1661 1661 2093 537Peru 1 4 5 8 12 285 1640 2148 3363 3929 327Uruguay 5 1 3 4 4 1638 399 1381 1705 1705 437Venezuela 2 3 3 9 9 592 1558 1251 3657 3657 420
Asia 1632 2007 2296 3087 3015 550498 552783 574177 673112 573057 190
Bahrain 1 3 3 2 7 469 1039 890 829 1865 255Brunei Darsm 1 1 2 2 1
China 591 960 1022 1649 1810 175934 203092 190412 269277 264204 146Cyprus 32 30 22 21 21 12063 10182 8660 7364 7364 347India 0 1 1 12 36 112 87 255 3448 8743 240Indonesia 23 19 29 30 30 7086 6220 9610 9981 9981 332Iran 0 1 3 4 5 47 185 299 676 1535 290Israel 88 69 91 85 65 27176 24689 33160 25229 19621 304Japan 472 597 683 764 550 171374 185555 187769 192802 118682 216Jordan 9 21 16 14 14 2363 3745 2800 1812 1812 133Kazakhstan 1 1 3 4 4Korea D P Rp 0 2 2 2
Korea Rep 152 75 53 58 28 69385 39494 26130 25350 10317 368Kuwait 5 8 11 11 11 2049 2187 2535 2535 2535 226Lebanon 6 3 19 33 33 1969 959 4347 8819 8819 271Malaysia 13 3 5 18 23 4909 924 1923 7442 8799 389Mongolia 0 0 0 3 3
Oman 1 4 1 1 3
Pakistan 4 5 13 9 10 1310 1491 2371 1878 2000 200Philippines 50 84 106 104 83 7491 11045 24594 19910 14634 176Qatar 1 1 2 4 4Saudi Arabia 41 45 57 79 54 17116 18055 19217 20804 11911 223Singapore 53 15 14 25 13 17951 15971 12553 18565 9727 772Sri Lanka 7 7 7 4 4 2196 3176 3176 1247 1247 308Syria 29 10 32 52 52 4699 3090 5884 12235 12235 235Tajikistan 5Thailand 16 16 15 12 13 7121 7028 6539 3839 2006 154Turkey 4 17 51 49 61 6100 9256 18741 24132 35446 581Turkmenistan 0 0 0 1 2Untd Arab Em 27 6 25 25 37 8800 1899 8319 8319 8556 229Uzbekistan 0 0 0 0 18 1 6 26 26 2738 156Viet Nam 1 3 6 8 10 476 619 1074 1635 2554 258
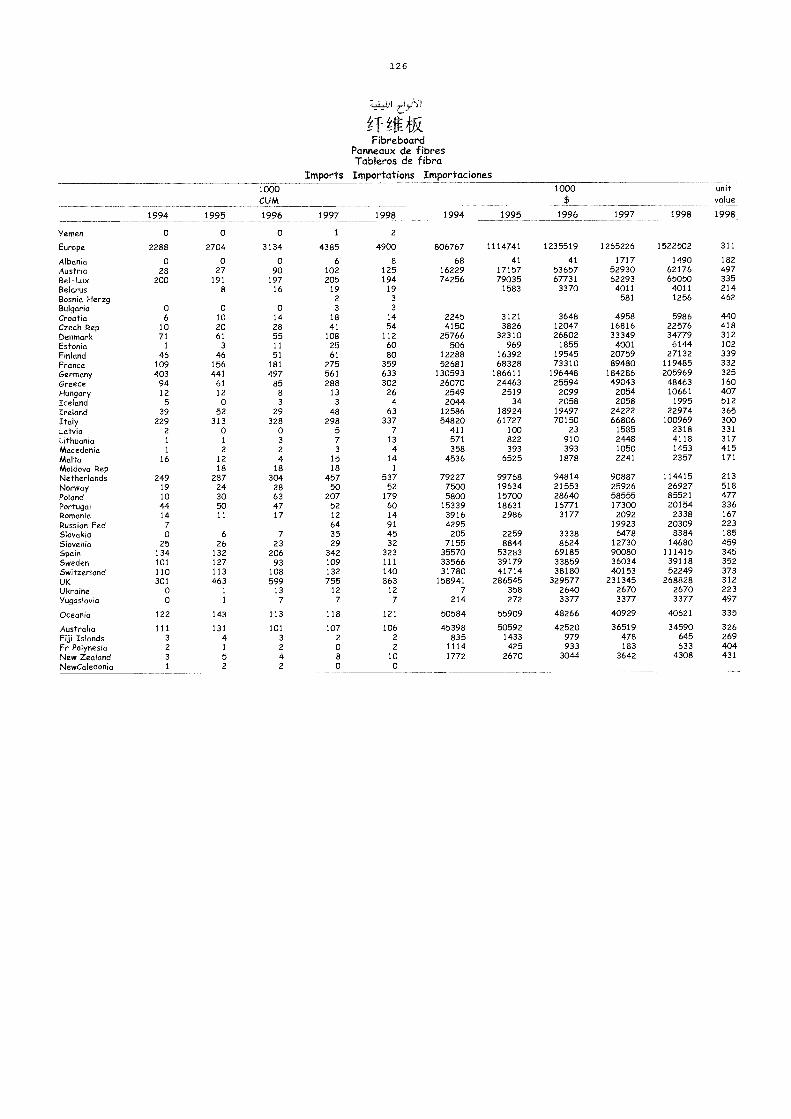
12 6
.ffFibreboard
Panneaux de fibresTableros de fibra
Imports Importations Importaciones1000
$unitvalue
1994 1995 1996 1997 1998 1998
806767 1114741 1235519 1265226 1522502 311
68 41 41 1717 1490 18216229 17157 53657 52930 62176 49774256 79035 67731 62293 65050 335
1583 3370 4011 4011 214581 1256 462
2245 3121 3648 4958 5986 4404150 3826 12047 16816 22576 418
25766 32310 26802 33349 34779 312506 969 1855 4001 6144 102
12288 16392 19545 20759 27132 33952681 68328 73310 89480 119485 332
130593 186611 196448 184286 205969 32526070 24463 25594 49043 48463 160
2549 2519 2099 2054 10661 4072044 34 2058 2058 1995 512
12586 18924 19497 24222 22974 36554820 61727 70150 66806 100969 300
411 100 23 1585 2318 331571 822 910 2448 4118 317358 393 393 1050 1453 415
4536 6525 1878 2241 2357 171
79227 99768 94814 90887 114415 2137500 19634 21553 25926 26927 5185800 15700 28640 58555 85521 477
15339 18631 16771 17300 20154 3363916 2986 3177 2092 2338 1674295 19923 20309 223
205 2259 3338 6478 8384 1857155 8844 8624 12730 14680 459
35570 53283 69185 90080 111415 34533566 39179 33859 36034 39118 35231780 41714 38180 40153 52249 373
158941 286545 329577 231345 268828 3127 358 2640 2670 2670 223
214 272 3377 3377 3377 497
50584 55909 48266 40929 40621 335
45398 50592 42520 36519 34590 326835 1433 979 478 645 269
1114 425 933 183 633 4041772 2670 3044 3642 4308 431
1994 1995
1000CUM
1996 1997
Yemen 0 0 0 1
Europe 2288 2704 3134 4385
Albania 0 0 0 6Austria 28 27 90 102Bel-Lux 200 191 197 205Belarus 8 16 19Bosnia Herzg 2
Bulgaria 0 0 0 3
Croatia 6 10 14 18Czech Rep 10 20 28 41Denmark 71 61 55 108Estonia 1 3 11 25Finland 46 46 51 61France 109 156 181 275Germany 403 441 497 561Greece 94 61 85 288Hungary 12 12 8 13Iceland 5 0 3 3
Ireland 39 52 29 48Italy 229 313 328 298Latvia 2 0 0 5
Lithuania 1 1 3 7Macedonia 1 2 2 3
Malta 16 12 4 15Moldova Rep 18 18 18Netherlands 249 287 304 457Norway 19 24 28 50Poland 10 30 63 207Portugal 4-4 50 47 52Romania 14 11 17 12Russian Fed 7 64Slovakia 0 6 7 35Slovenia 25 26 23 29Spain 134 132 206 342Sweden 101 127 93 109Switzerland 110 113 108 132UK 301 463 599 755Ukraine 0 1 13 12Yugoslavia 0 1 7 7
Oceania 122 143 113 118
Australia 111 131 101 107Fiji Islands 3 4 3 2
Fr Polynesia 2 1 2 0New Zealand 3 5 4 8NewCaledonia 1 2 2 0
1998
2
4900
8125194
1933
1454
1126080
359633302
264
63337
7134
141
53752
1796014914532
323111140863
127
121
1062
2
100
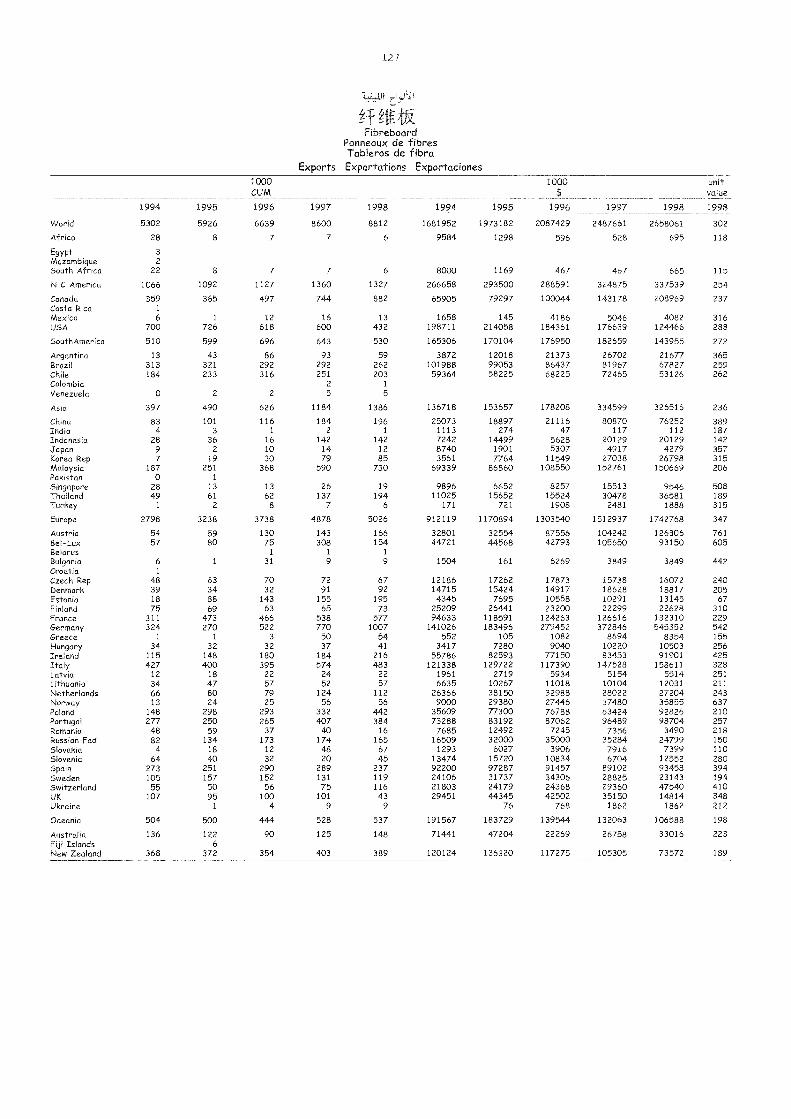
127
FibreboardPanneaux de fibresTableros de fibra
Exports Exportations Exportaciones1000CUM
1000s
unitvalue
1994 1995 1996 1997 1998 1994 1995 1996 1997 1998 1998
World 5302 5926 6639 8600 8812 1681952 1973182 2087429 2487661 2658061 302
Africa 28 8 7 7 6 9584 1298 596 528 695 118
Egypt 3
Mozambique 2
South Africa 22 8 7 7 6 8000 1169 467 467 665 115
N C America 1066 1092 1127 1360 1327 266658 293500 288591 324875 337539 254
Cariado 359 365 497 744 882 65905 79297 100044 143178 208969 237Costa Rica 1
Mexico 6 1 12 16 13 1658 145 4186 5046 4082 316USA 700 726 618 600 432 198711 214058 184361 176639 124466 288
SouthAmerica 510 599 696 643 530 165306 170104 176950 182659 143955 272
Argentina 13 43 86 93 59 3872 12018 21373 26702 21677 365Brazil 313 321 292 292 262 101988 99053 86437 81967 67827 259Chile 184 233 316 251 203 59364 58225 68225 72465 53126 262Colombia 2 1
Venezuela 0 2 2 5 5
Asia 397 490 626 1184 1386 136718 153657 178208 334599 326516 236
China 83 101 116 184 196 25073 18897 21116 80870 76252 389India 4 3 1 2 1 1113 274 47 117 112 187Indonesia 28 36 16 142 142 7242 14499 5628 20129 20129 142Japan 9 2 10 14 12 8740 1901 5307 4917 4279 357Korea Rep 7 19 30 79 85 3561 7764 11549 27038 26798 315Malaysia 187 251 368 590 730 69339 86860 108550 152761 150669 206Pakistan 0 1
Singapore 28 13 13 26 19 9896 6652 8257 15513 9546 508Thailand 49 61 62 137 194 11025 15652 15524 30478 36581 189Turkey 1 2 8 7 6 171 721 1908 2481 1888 315
Europe 2798 3238 3738 4878 5026 912119 1170894 1303540 1512937 1742768 347
Austria 54 59 130 143 166 32801 32554 87556 104242 126306 761Bel-Lux 57 80 75 308 154 44721 44568 42793 105650 93150 605Belarus 1 1 1
Bulgaria 6 1 31 9 9 1504 161 6269 3849 3849 442Croatia 1
Czech Rep 48 63 70 72 67 12186 17262 17873 15738 16072 240Denmark 39 34 32 91 92 14715 15424 14917 18628 18817 205Estonia 18 88 143 155 195 4345 7695 10558 10291 13145 67Finland 75 69 63 65 73 25209 26441 23200 22299 22628 310France 311 473 466 538 577 94633 118591 124263 126616 132310 229Germany 324 270 522 770 1007 141026 183496 279452 372846 545352 542Greece 1 1 3 50 54 552 105 1082 8694 8354 155Hungary 34 32 32 37 41 3417 7280 9040 10220 10503 256Ireland 115 148 180 184 216 55786 82593 77150 83453 91901 425Italy 427 400 395 574 483 121338 129722 117390 147528 158611 328Latvia 12 18 22 24 22 1961 2719 5934 5154 5514 251L.ithuania 34 47 57 52 57 6635 10267 11018 10104 12031 211Netherlands 66 80 79 124 112 26366 38150 32988 28022 27204 243Norway 13 24 25 56 56 9000 29380 27446 37480 35855 637Poland 148 298 293 332 442 35609 77300 76788 63424 92826 210Portugal 277 250 265 407 384 73288 83192 87062 96489 98704 257Romania 48 59 37 40 16 7685 12492 7245 7356 3490 218Russian Fed 82 134 173 174 165 16509 32000 35000 35284 24799 150Slovakia 4 18 12 48 67 1293 6027 3906 7916 7399 110Slovenia 64 40 32 20 45 13474 15720 10834 6704 12552 280Spain 273 251 290 289 237 92200 97287 91457 89102 93458 394Sweden 105 157 152 131 119 24106 31737 34306 28825 23143 194Switzerland 55 50 56 75 116 21803 24179 24368 29360 47540 410UK 107 95 100 101 43 29451 44345 42502 35150 14814 348Ukraine 1 4 9 9 76 768 1862 1862 212
Oceania 504 500 444 528 537 191567 183729 139544 132063 106588 198
Australia 136 122 90 125 148 71441 47204 22269 26758 33016 223Fiji Islands 6
New Zealand 368 372 354 403 389 120124 136320 117275 105305 73572 189
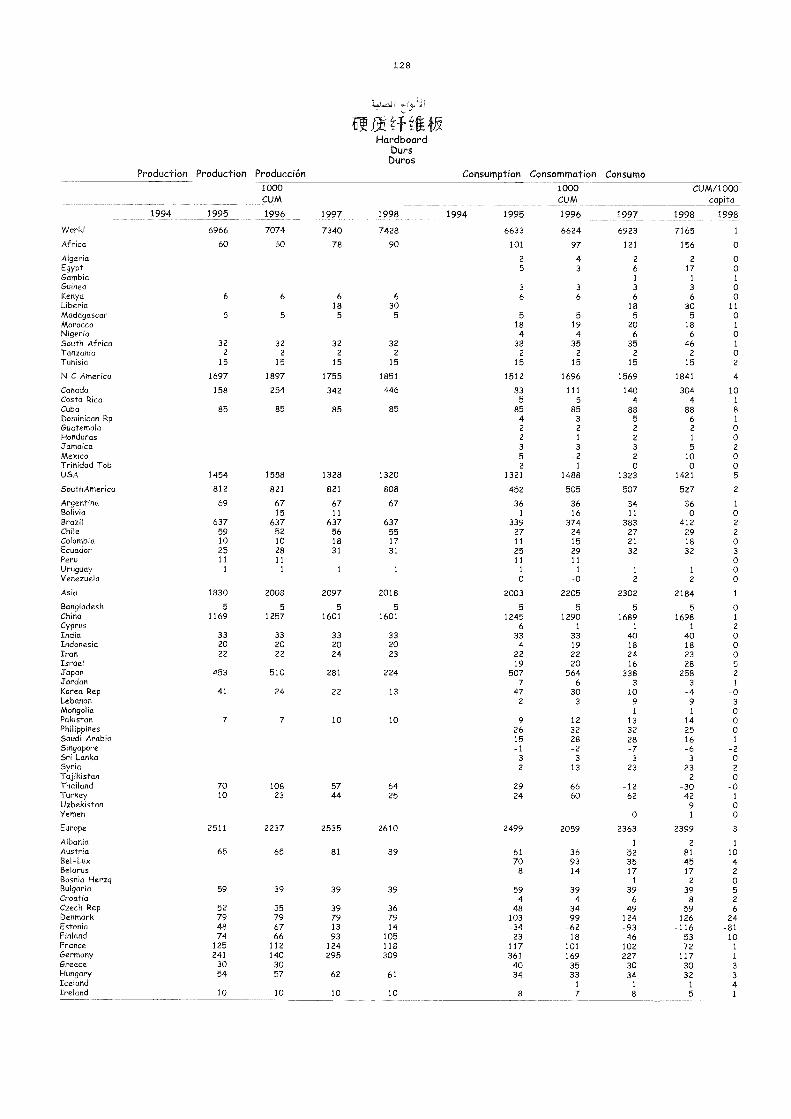
12G
uatz,:tiNHardboard
OursDuros
Production Production Producción Consumption Consommation Consumo
World
Africa
AlgeriaEgyptGambiaGuineaKenyaLiberiaMadagascarMoroccoNigeriaSouth AfricaTanzaniaTunisia
N C America
CanadaCosta RicaCubaDominican RpGuatemalaHondurasJamaicaMexicoTrinidad TobUSA
SouthAmerica
ArgentinaBoliviaBrazilChileColombiaEcuadorPeruUruguayVenezuela
Asia
BangladeshChinaCyprusIndiaIndonesiaIranIsraelJapanJordanKorea RepLebanonMongoliaPakistanPhilippinesSaudi ArabiaSingaporeSri LankaSyriaTajikistanThailandTurkeyUzbekistanYemen
Europe
AlbaniaAustriaBel-LuxBelarusBosnia HerzgBulgariaCroatiaCzech RepDenmarkEstoniaFinlandFranceGermanyGreeceHungaryIcelandIreland
1994 1995
6966
60
6
5
322
15
1697
158
85
1454
812
69
63759102511
1
1830
51169
332022
453
41
7
7010
2511
65
59
52794874
125241
3054
10
1000CUM
1996
7074
60
6
5
322
15
1897
254
85
1558
821
6715
63752102811
1
2008
51257
332022
510
24
7
10823
2237
65
39
35796766
1121403057
10
1997
7340
78
618
5
322
15
1755
342
85
1328
821
6711
637561831
1
2097
5
1601
332024
281
22
10
5744
2535
81
39
39791393
124295
62
10
1998
7428
90
6
305
322
15
1851
446
85
1320
808
67
637551731
1
2018
51601
332023
224
13
10
6425
2610
89
39
367914
105118309
61
10
1994 1995
6633
101
25
36
5184
382
15
1512
835
85422
3
52
1321
452
361
33927112511
1
0
2003
51245
6
334
2219
5077
472
92615-1
3
2
2924
2499
6170
8
594
48103-3423
117361
ao34
8
1000CUM
1996
6624
97
43
3
6
5
194
352
15
1696
1115
853
2
1
3
-21
1488
505
3616
37424152911
1
-0
2205
5
12901
33192220
5646
303
123228-2
3
13
6660
2059
369314
394
3499
-6218
101169
3533
1
7
CUM/1000capita
1998
1
0
001
00
11
01
01
02
4
101
81
002
005
2
1
02
2
03
00
-0
1
01
2
000521
-03oo01
-2020
-o1
o0
3
1
1042
052
6
24-8110
1
1
3
3
41
1997
6923
121
2
61
3
618
520
635
2
15
1569
14-04
8852
2
32
o1323
507
3411
383272132
1
-2
2302
51689
1
40182416
3383
1091
133228-7
3
23
-1262
o
2363
1
523517
1
396
49124-9346
102227
3034
1
8
1998
7165
156
217
1
3
630
518
646
2
15
1841
3044
8862
1
510
o1421
527
360
412291832
1
-2
2184
5
16981
40182328
2583
-491
142516-6
3
232
-3042
91
2399
2
814517
2
398
59126
-1165372
1173032
1
5
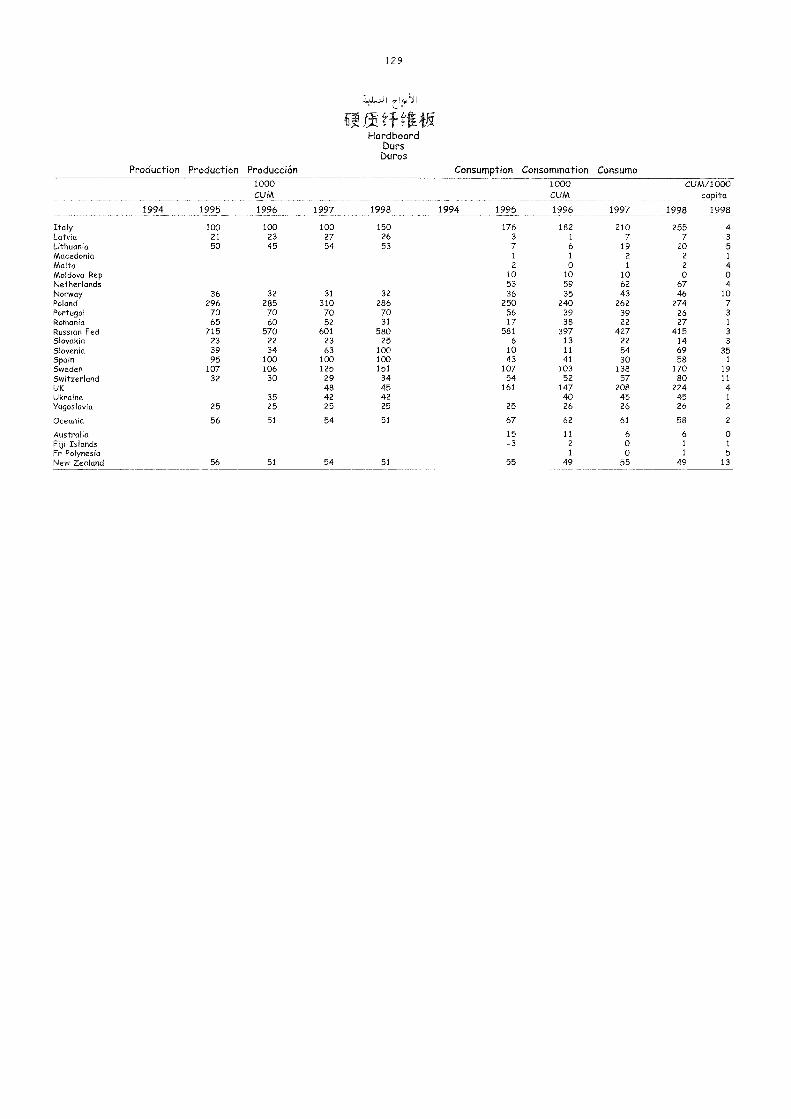
129
ETa t-fHardboard
DunsDuros
Production Production Producción Consumption Consommation Consumo
ItalyLatviaLithuaniaMacedoniaMaltaMoldova RepNetherlandsNorwayPolandPortugalRomaniaRussian FedSlovakiaSloveniaSpainSwedenSwitzerlandUKUkraineYugoslavia
Oceania
AustraliaFiji IslandsFr PolynesiaNew Zealand
1994 1995
1002150
36296
7065
715233995
10732
25
56
56
1000CUM
1996
1002345
32285
7060
5702234
10010630
3525
51
51
1997
1002754
31310
7052
6012363
10012529484225
54
54
1998
1502653
32286
7031
58025
10010015134454225
51
51
1994 1995
1763
71
2
105336
2505617
5816
1043
10754
161
25
67
15-3
55
1000CUM
1996
1821
6
1
0105935
2403938
397131141
10352
1474026
62
112
1
49
1997
2107
192
1
106243
2623922
427225430
13857
2084526
61
60o
55
CUM/1000capita
1998 1998
255 47 3
20 5
2 1
2 40 0
67 446 10
274 726 3
27 1
415 3
14 3
69 3558 1
170 1980 11
224 445 1
26 2
58 2
6 01 1
1 549 13
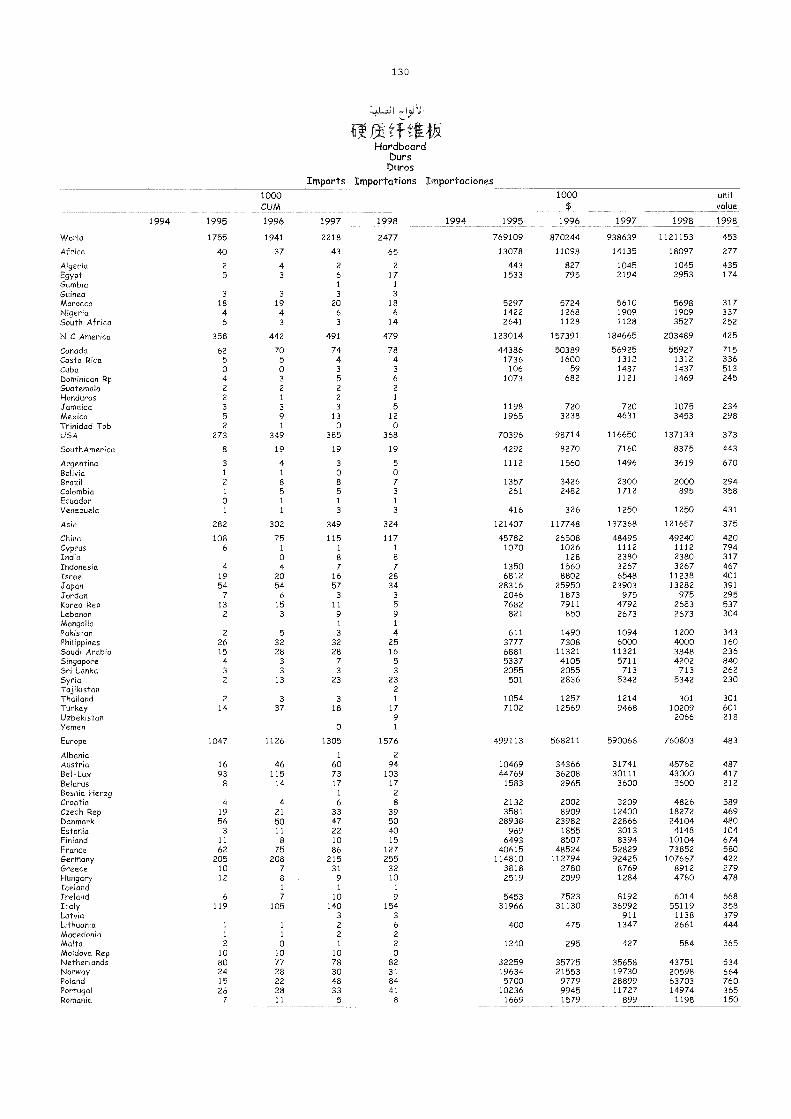
130
HardboardbursDuros
Imports Importations Importaciones
World
Africa
AlgeriaEgyptGambiaGuineaMoroccoNigeriaSouth Africa
N C America
CanadaCosta RicaCubaDominican RpGuatemalaHondurasJamaicaMexicoTrinidad TobUSA
SouthAmerica
ArgentinaBoliviaBrazilColombiaEcuadorVenezuela
Asia
ChinaCyprusIndiaIndonesiaIsraelJapanJordanKorea RepLebanonMongoliaPakistanPhilippinesSaudi ArabiaSingaporeSri LankaSyriaTajikistanThailandTurkeyUzbekistanYemen
Europe
AlbaniaAustriaBel-LuxBelarusBosnia HerzgCroatiaCzech RepDenmarkEstoniaFinlandFranceGermanyGreeceHungaryIcelandIrelandItalyLatviaLithuaniaMacedoniaMaltaMoldova RepNetherlandsNorwayPolandPortugalRomania
1994 1995
1755
40
2
5
3
1846
358
6250422352
273
8
31
21
01
282
1086
419547
132
2
261543
2
2
14
1047
16938
41956
3
11
62205
1012
6119
1
1
2
10802415267
1000CUM
1996
1941
37
43
3
1943
442
705
03
2
1
3
91
349
19
41
8
5
1
1
302
751
04
2054
6
153
53228
3
3
13
3
37
1126
46115
14
42150118
75208
781
7105
1
1
0107728222811
1997
2218
43
2
61
3
2063
491
7443
5223
130
385
19
3
0851
3
349
1151
8
71657
3
1191
3
322873
23
3
18
0
1305
1
607317
1
63347221086
21531
9
1
10140
3
2
2
1
1078304833
5
1998
2477
65
217
1
3186
14
479
7843621
512
0368
19
50731
3
324
1171
87
2834
3
591
4251653
232
1
1791
1576
2
94103
172
8
39504015
1272553210
1
9154
3
62
2
082318441
8
1994 1995
769109
13078
4431533
529714222641
123014
443861736
1061073
11981965
70396
4292
1112
1357261
416
121407
457821070
13506812
2831620467682
821
6113777688153372055
501
10547102
499113
1046944769
1583
21323581
28938969
649340615
11481038182519
545331966
400
1240
32259196345700
102361669
1000$
1996
87024-4
11098
827795
572412681128
157391
503891600
59682
7203238
98714
8270
1560
34262482
326
117748
265081026
12815608802
2595018737911850
14907308
11321410520552836
125712569
568211
3436636208
2965
20028909
2398218558507
48524112794
27802099
752331130
475
295
3577521553
977999451579
1997
938639
14135
10452194
561019091128
184665
56925131214371121
7204631
116650
7160
1496
23001712
1250
137368
484951112238032676548
23903975
47922673
10946000
113215711
7135342
12149468
590066
3174130111
3600
32091240022866
30138394
528299242587691284
819236992
9111347
427
35658197302889911727
899
1998
1121153
18097
10452953
569819093527
203489
55927131214371469
10753453
137133
8375
3619
2000895
1250
121657
49240111223803267
1123813282
97526832673
1200400038484202
7135342
301102092066
760803
4576243000
3600
48261827224104
41481010473852
10766789124780
601455119
11382661
584
43751205986370314974
1198
unitvalue
1998
453
277
435174
317337252
425
715336513245
234298
373
443
670
294358
431
375
420794317467401391295537304
343160236840262230
301601218
483
487417212
589469480104674580422279478
668358379444
365
534664760365150
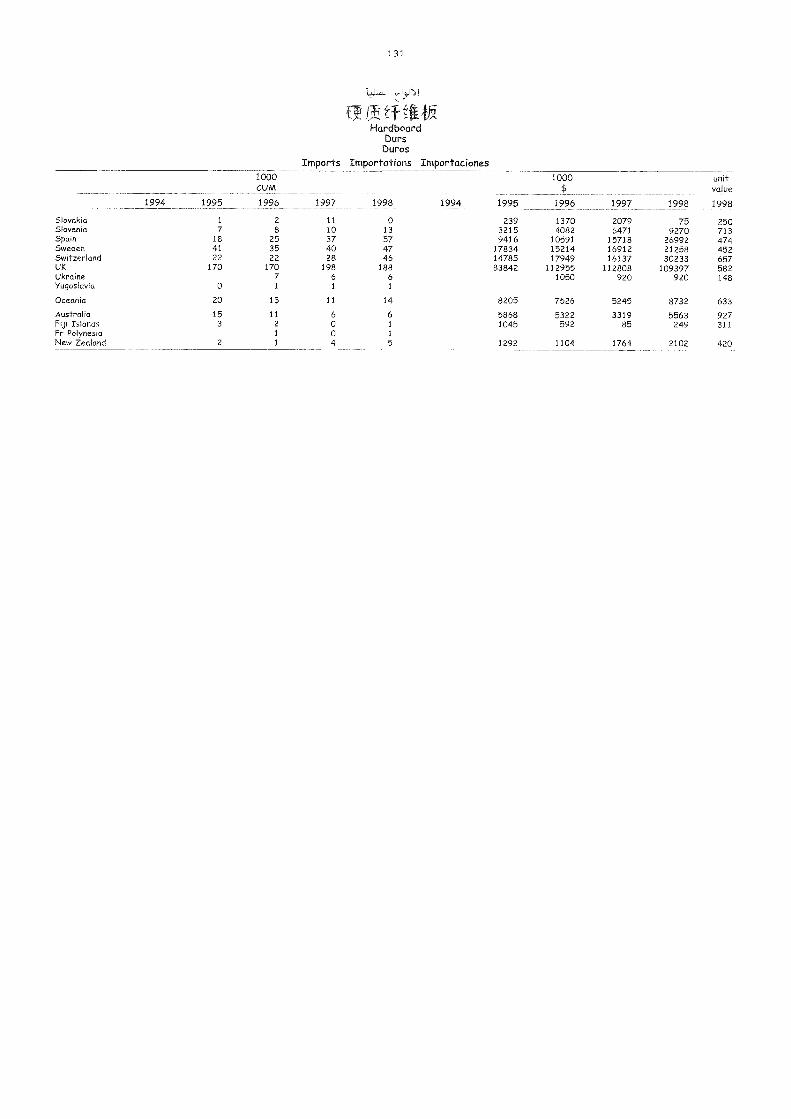
131
f t-fltHardboard
bursDuros
Imports Importations Importaciones
SlovakiaSloveniaSpainSwedenSwitzerlandUKUkraineYugoslavia
Oceania
AustraliaFiji IslandsFr PolynesiaNew Zealand
1994 1995
1
7184122
170
0
20
153
2
1000CUM
1996
2
8
253522
17071
15
112
1
1
1997
11
10374028
19861
11
6004
1998
013574746
18861
14
6
1
1
5
1994 1995
23932159416
178341478583842
8205
58681045
1292
1000$
1996
13704082
105911521417949
1129551050
7526
5322592
1104
1997
20796471
157181691216137
112808920
5245
331985
1764
1998
759270
269922125830233
109397920
8732
5563249
2102
unitvalue
1998
250713474452657582148
633
927311
420
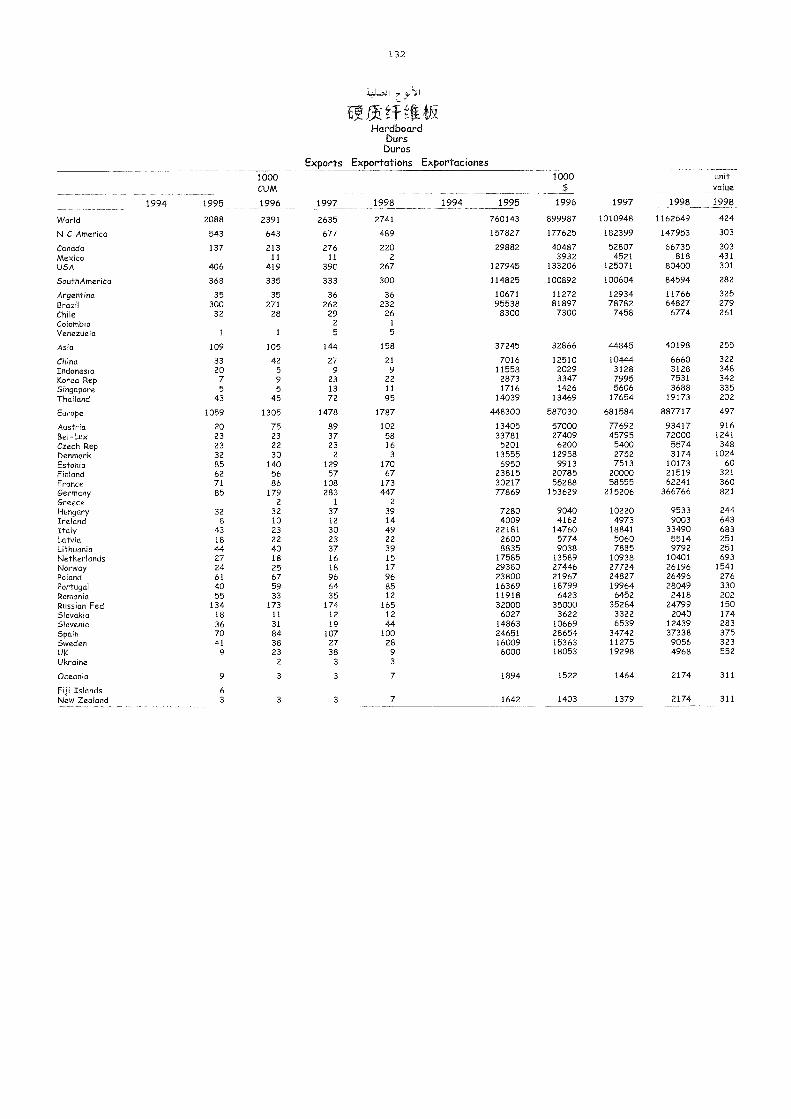
132
uattivHardboard
bursburos
Exports Exportations Exportaciones
World
N C America
CanadaMexicoUSA
SouthAmerica
ArgentinaBrazilChileColombiaVenezuela
Asia
ChinaIndonesiaKorea RepSingaporeThailand
Europe
AustriaBel-LuxCzech RepDenmarkEstoniaFinlandFranceGermanyGreeceHungaryIrelandItalyLatviaLithuaniaNetherlandsNorwayPolandPortugalRomaniaRussian FedSlovakiaSloveniaSpainSwedenUKUkraine
Oceania
Fiji IslandsNew Zealand
1994 1995
2088
543
137
406
368
3530032
1
109
3320
75
43
1059
2023233285627185
328
4318442724614055
13418367041
9
9
63
1000CUM
1996
2391
643
21311
419
335
35271
28
1
105
425
95
45
1305
75232230
1405686
1792
32102322401825675933
1731131843823
2
3
3
1997
2635
677
27611
390
333
36262
292
5
144
279
231372
1478
893723
2
12957
108283
1
37123023371618966435
1741219
1072738
3
3
3
1998
2741
489
2202
267
300
36232
261
5
158
219
2211
95
1787
1025816
317067
173447
2
39144922391517968512
1651244
10028
93
7
7
1994 1995
760143
157827
29882
127945
114825
1067195538
8300
37245
70161155828731716
14039
448300
13405337815201
135556950
238153021777869
72804009
2218126008835
175852938023800163691191832000
6027148632465116009
6000
1894
1642
1000$
1996
899987
177625
404873932
133206
100892
1127281897
7300
32866
12510202933471426
13469
587030
57000274096200
129589913
2078555288
153629
90404162
1476057749038
135892744621967187996423
350003622
10669286541536318053
1522
1403
1997
1010948
182399
528074521
125071
100604
12934787827458
44845
10444312879955606
17654
681584
7769245795
540027527513
2000058555
215206
102204973
1884150607885
109382772424827199646452
3528433226539
347421127519298
1464
1379
1998
1162649
147953
66735818
80400
84594
11766648276774
40198
6660312875313688
19173
887717
9341772000
55743174
101732151962241
366766
95339003
3349055149792
10401261962649628049
241824799
20401243937338
90564968
2174
2174
unitvalue
1998
424
303
303431301
282
325279261
255
322348342335202
497
9161241348
102460
321360821
244643683251251693
1541276330202150174283375323552
311
311
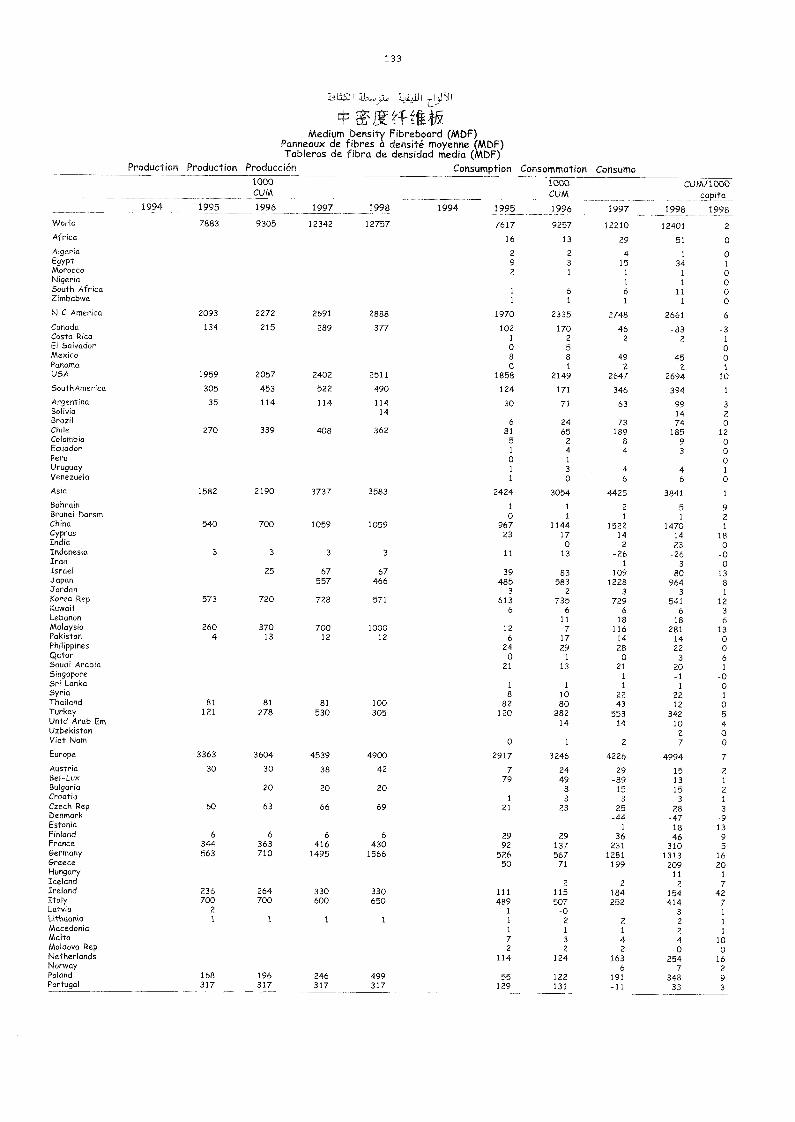
133
".t. WSJ -4_24.11
Medium Density Fibreboard (MDF)Panneaux de f ibres a densité moyenne (MDF)Tableros de fibra de densidad media (MDF)
Production Production Producción Consumption Consommation Consumo
World
Africa
AlgeriaEgyptMoroccoNigeriaSouth AfricaZimbabwe
N C America
CanadaCosta RicaEl SalvadorMexicoPanamaUSA
SouthAmerica
ArgentinaBoliviaBrazilChileColombiaEcuadorPeruUruguayVenezuela
Asia
BahrainBrunei DarsmChinaCyprusIndiaIndonesiaIranIsraelJapanJordanKorea RepKuwaitLebanonMalaysiaPakistanPhilippinesQatarSaudi ArabiaSingaporeSri LankaSyriaThailandTurkeyUntd Arab EmUzbekistanViet Nam
Europe
AustriaBel-LuxBulgariaCroatiaCzech RepDenmarkEstoniaFinlandFranceGermanyGreeceHungaryIcelandIrelandItalyLatviaLithuaniaMacedoniaMaltaMoldova RepNetherlandsNorwayPolandPortugal
1994 1995
7883
2093
134
1959
305
35
270
1582
540
3
573
2604
81121
3363
30
60
6344563
236700
2
1
168317
1000CUM
1996
9305
2272
215
2057
453
114
339
2190
700
3
25
720
37013
81278
3604
30
20
63
6
363710
264700
1
196317
1997
12342
2691
289
2402
522
114
408
3737
1059
3
67557
728
70012
81530
4539
38
20
66
6416
1495
330600
1
246317
1998
12757
2888
377
2511
490
11414
362
3583
1059
3
67466
571
100012
100305
4900
42
20
69
6
4301566
330650
1
499317
1994 1995
7617
16
292
1
1
1970
1021
08
01858
124
30
6
815
1
01
1
2424
1
o96723
11
39485
3
6136
126
240
21
1
8
82120
0
2917
779
1
21
2992
52650
111489
1
1
1
72
114
55129
1000CUM
1996
9257
13
2
31
61
2335
1702
581
2149
171
71
2465
2
41
30
3054
1
1
114417o
13
83583
2
7356
11
71729
1
13
1
1080
28214
1
3246
2449
83
23
29137567
71
2
115507
-02
1
3
2
124
122131
1997
12210
29
415
1
1
6
1
2748
462
49z
2647
346
63
73189
84
46
4425
2
1
152214
2
-261
1091228
3
7296
1811614280
211
1
2243
55314
2
4226
29-89
153
25-44
1
36231
1281199
2
184252
2
1
42
1636
191-11
CU M/10C)0capita
1998 1998
12401 2
51 0
1 o34 1
1 01 0
11 01 o
2661 6
-83 -32 1
045 0z 1
2694 10
394 1
99 3
14 2
74 0185 12
9 o3 0
04 1
6 0
3841 1
5 91 2
1470 1
14 1823 0
-26 -03 0
80 13964 8
3 1
541 126 3
18 6281 13
14 022 0
3 6
20 1
-1 -01 0
22 1
12 0342 5
10 42 07 0
4994 7
15 213 1
15 23 1
28 3
-47 -918 1346 9
310 5
1313 16209 20
11 1
2 7154 42414 7
3 1
2 1
2 1
4 100 0
254 167 2
348 933 3
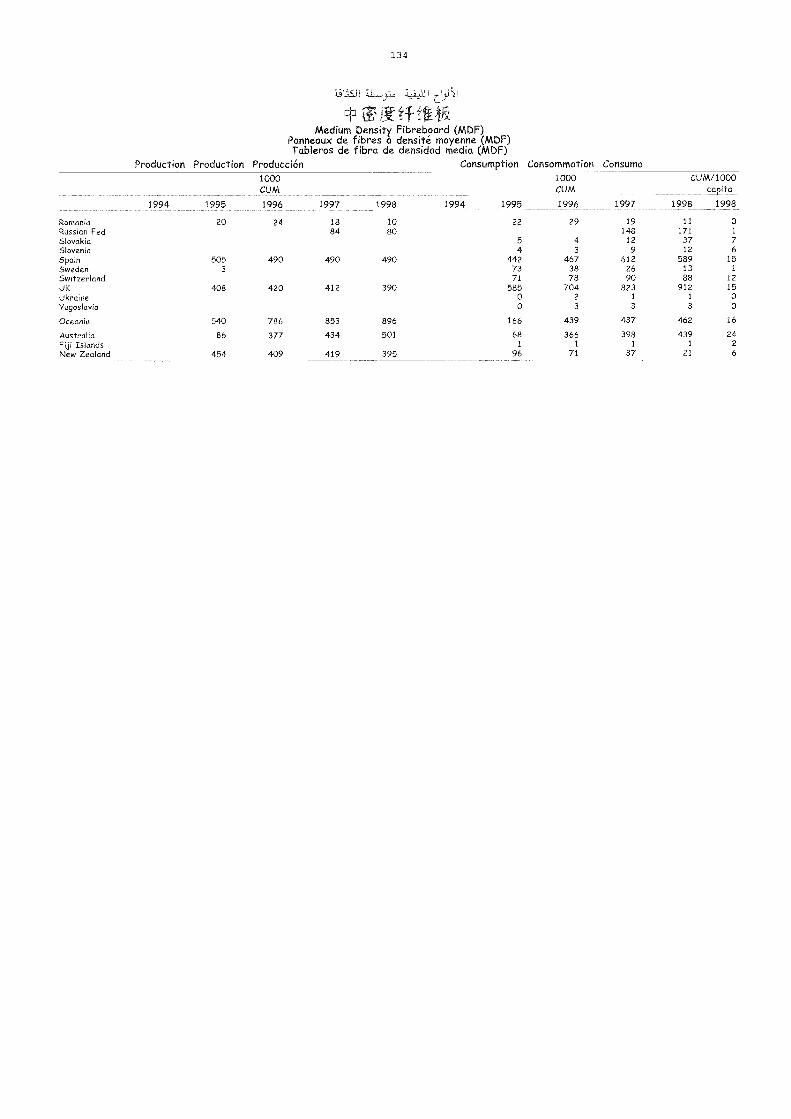
134
bt.S.11
cln&IJI0Medium Density Fibreboard (MDF)
Panneaux de fibres a densité moyenne (MDF)Tableros de fibra de densidad media (MDF)
Production Production Producción Consumption Consommation Consumo
RomaniaRussian FedSlovakiaSloveniaSpainSwedenSwitzerlandUKUkraineYugoslavia
Oceania
AustraliaFiji IslandsNew Zealand
1994 1995
20
5053
408
540
86
454
1000CUM
1996
24
490
420
786
377
409
1997
1884
490
412
853
434
419
1998
1080
490
390
896
501
395
1994 1995
22
5
4442
7371
58500
166
681
96
1000CUM
1996
29
43
4673878
7042
3
439
3661
71
1997
19148
129
6122690
8231
3
437
3981
37
CUM/1000capita
1998 1998
11 0171 1
37 712 6
589 1513 1
88 12912 15
1 03 0
462 16
439 241 2
21 6
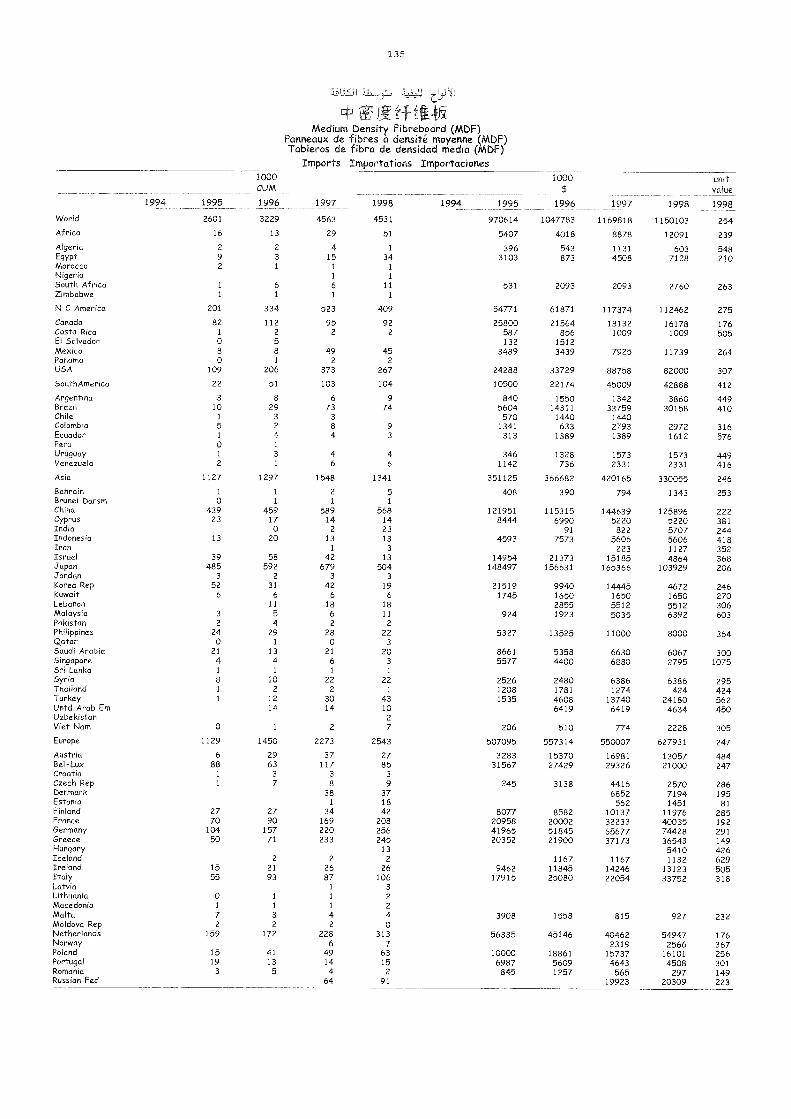
135
.1u.jl 7.2).1
=0 4'; tt ffEMedium Density Fibreboard (MDF)
Panneaux de fibres a densité moyenne (MDF)Tableros de fibra de densidad media (MDF)
Imports Importations Importaciones
World
Af rica
AlgeriaEgyptMoroccoNigeriaSouth AfricaZimbabwe
N C America
CanadaCosta RicaEl SalvadorMexicoPanamaUSA
SouthAmerica
ArgentinaBrazilChileColombiaEcuadorPeruUruguayVenezuela
Asia
BahrainBrunei DarsmChinaCyprusIndiaIndonesiaIranIsraelJapanJordanKorea RepKuwaitLebanonMalaysiaPakistanPhilippinesQatarSaudi ArabiaSingaporeSri LankaSyriaThailandTurkeyUntd Arab EmUzbekistanViet Nam
Europe
AustriaBel-LuxCroatiaCzech RepDenmarkEstoniaFinlandFranceGermanyGreeceHungaryIcelandIrelandItalyLatviaLithuaniaMacedoniaMaltaMoldova RepNetherlandsNorwayPolandPortugalRomaniaRussian Fed
1994 1995
2601
16
2
92
1
1
201
821
o8
o109
22
3
101
5
1
o1
2
1127
1
o439
23
13
39485
352
6
32
24o
2141
a1
1
o
1129
6
881
1
2770
10450
1555
o1
72
159
1519
3
1000CUM
1996
3229
13
2
3
1
6
1
334
1122
5
81
206
51
8
293
241
31
1297
1
1
45917
o20
58592
231
611
5
429
1
1341
102
1214
1
1450
2963
37
2790
15771
22193
1
1
32
172
41135
1997
4563
29
415
1
1
61
523
952
492
373
103
673
3
8
4
46
1548
2
1
58914
2
131
42679
3
426
1862
28o
2161
222
3014
2
2273
37117
38
381
34169220233
2
2687
1
1
1
42
2286
4914
464
1998
4531
51
1
341
1
111
409
922
452
267
104
974
93
46
1341
51
568142313
3
13504
3196
1811
222
320
3
1
221
4310
27
2543
2785
3
9
371842
208256245
132
26106
32
2
4o
3137
6315
2
91
1994 1995
970614
5407
3963103
531
54771
25800587132
3489
24288
10500
8405604570
1341313
3461142
351125
408
1219518444
4593
14954148497
215191745
924
5327
86615577
252612081535
206
507095
328331567
245
8077209584196520352
946217915
3908
56335
100006987
845
1000$
1996
1047783
4018
543873
2093
61871
21564856
15123439
33729
22174
155014311
1440633
1389
1328736
366682
390
1153156990
917573
21373156631
9940165028551923
13525
53584400
2480178146086419
510
557314
1537027429
3138
8582200025184521900
11671184525080
1558
45146
1886156091257
1997
1169818
8878
11314508
2093
117374
181321009
7925
88758
45009
134233759
144027931389
15732331
420165
794
1446395220
8225606
22315185
165366
14445165055125035
11000
66306880
63861274
137406419
774
550007
1698129326
44166852
56210137322336567737173
11671424622054
815
404622319
157374643
56519923
1998
1150103
12091
6037128
2760
112462
161781009
11739
82000
42888
386030158
29721612
15732331
330055
1343
12589652205707560611274864
103929
4672165055126392
8000
60672795
6386424
241804634
2228
627931
1305721000
257071941451
11976400357442836543
54101132
1312333752
927
549472566
161014508
29720309
unitvalue
1998
254
239
548210
263
275
176505
264
307
412
449410
316576
449416
246
253
222381244418352368206
246270306603
364
3001075
295424562450
305
247
484247
286195
81285192291149426629505318
232
176367256301149223
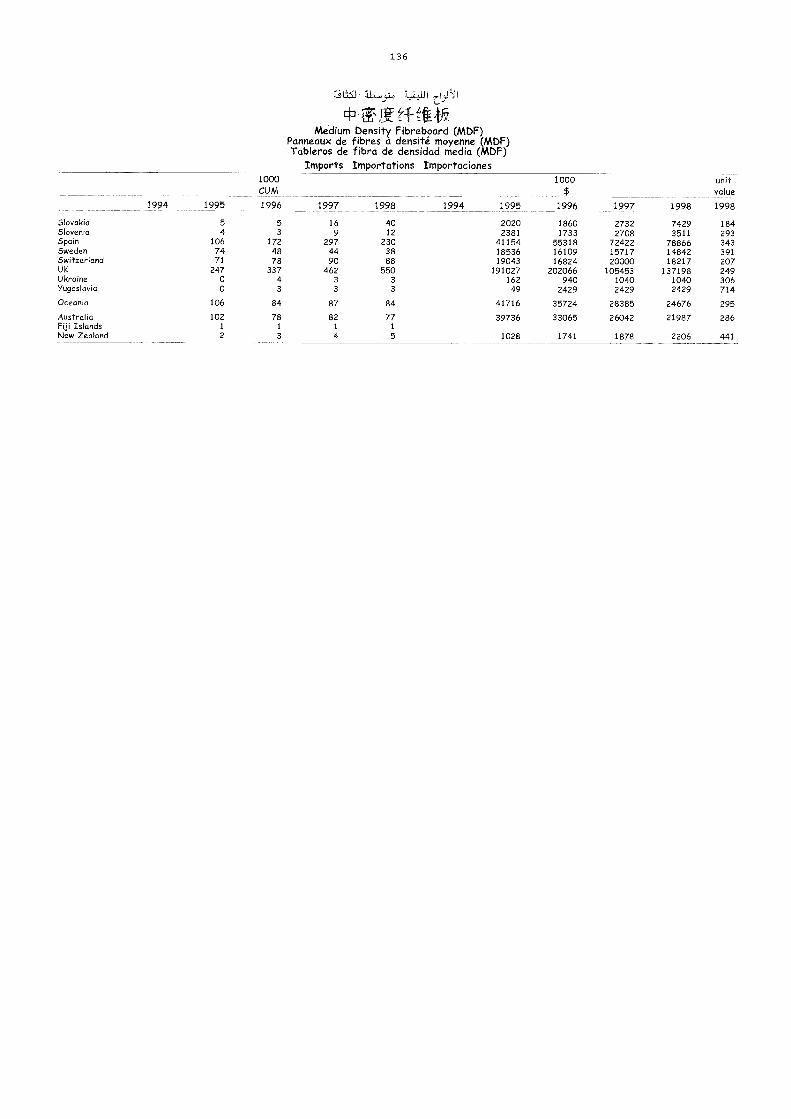
136
1.;ILV 71-, -4;_2111
Medium Density Fibreboard (MDF)Panneaux de fibres a densité moyenne (MDF)Tableros de fibra de densidad media (MDF)
Imports Importations Importaciones
SlovakiaSloveniaSpainSwedenSwitzerlandUKUkraineYugoslavia
Oceania
AustraliaFiji IslandsNew Zealand
1994 1995
54
1067471
24700
106
1021
2
1000CUM
1996
53
1724878
33743
84
781
3
1997
169
2974490
4623
3
87
821
4
1998
4012
2303888
5503
3
84
771
5
1994
1000$
1998
74293511
788661484218217
13719810402429
24676
21987
2206
unitvalue
1998
184293343391207249306714
295
286
441
1995
20202381
411541853619043
19102716249
41716
39736
1028
1996
18601733
553181610916824
202066940
2429
35724
33065
1741
1997
27322708
724221571720000
10545310402429
28385
26042
1878
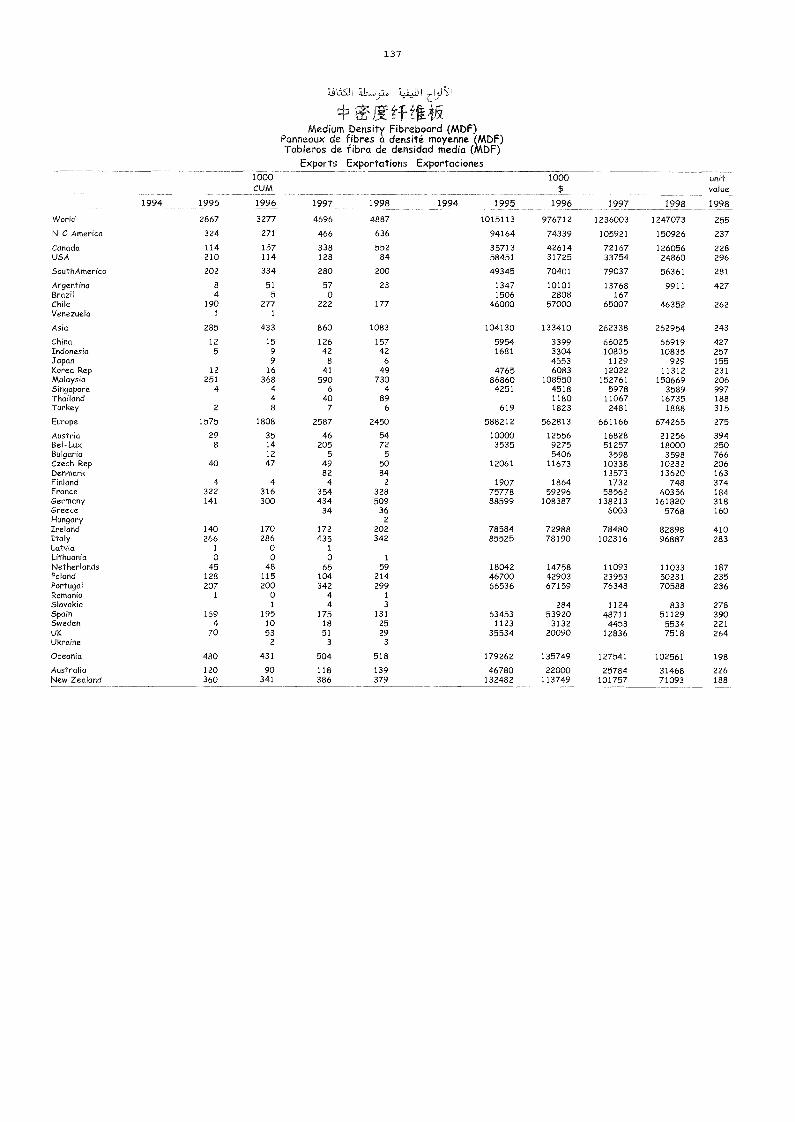
137
-4_13S.1] '4,411
Medium Density Fibreboard (MDF)Panneaux de fibres a densité moyenne (MDF)Tableros de fibra de densidad media (MDF)
Exports Exportations Exportaciones
World
N C America
CanadaUSA
SouthAmerica
ArgentinaBrazilChileVenezuela
Asia
ChinaIndonesiaJapanKorea RepMalaysiaSingaporeThailandTurkey
Europe
AustriaBel-LuxBulgariaCzech RepDenmarkFinlandFranceGermanyGreeceHungaryIrelandItalyLatviaLithuaniaNetherlandsPolandPortugalRomaniaSlovakiaSpainSwedenuKUkraine
Oceania
AustraliaNew Zealand
1994 1995
2867
324
114210
202
84
1901
285
125
12251
4
2
1575
298
40
4322141
140266
1
045
128207
1
1694
70
480
120360
1000CUM
1996
3277
271
157114
334
515
2771
433
1599
16368
448
1808
35141247
4316300
170286
00
48115200
01
1951053
2
431
90341
1997
4696
466
338128
280
570
222
860
12642
8
41590
6407
2587
46205
549824
354434
34
172435
1
065
104342
44
1751851
3
504
118386
1998
4887
636
55284
200
23
177
1083
15742
6
49730
489
6
2450
5472
5
5084
2
328509
362
202342
1
59214299
1
31312529
3
518
139379
1994 1995
1015113
94164
3571358451
49345
13471506
46000
104130
59541681
4765868604251
619
588212
100003535
12061
19077577888599
7858485525
180424670066536
634531123
35534
179262
46780132482
1000$
1996
976712
74339
4261431725
70401
101012808
57000
133410
3399330445536083
108550451811801823
562813
1255692755406
11673
186459296
108387
7298878190
147584290367159
284539203132
20090
135749
22000113749
1997
1236003
105921
7216733754
79037
13768167
65007
262338
6602510835
112912022
1527615978
110672481
661166
1682851257
35981033813573
173258562
1382136003
78480102316
110932395376348
1124487114453
12836
127541
25784101757
1998
1247073
150926
12605624860
56361
9911
46352
262954
6691910835
92911312
1506693589
167351888
674265
2125618000
35981028213620
74860356
1618205768
8289896887
110335023170588
8335112955347518
102561
3146871093
unitvalue
1998
255
237
228296
281
427
262
243
427257155231206997188315
275
394250766206163374184318160
410283
187235236
278390221264
198
226188
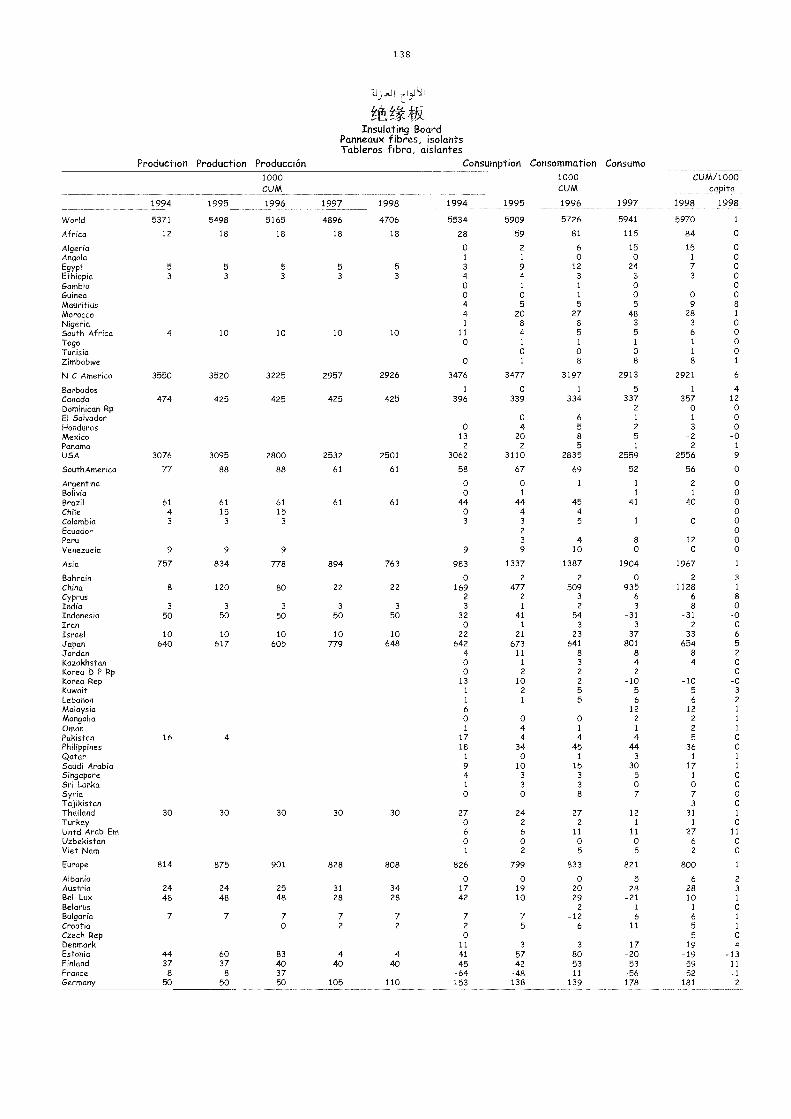
138
Insulating BoardPanneaux f ibres, isolantsTableros fibra, aislantes
Production Production Producción Consumption Consommation Consumo
1994 1995 1996 1997 1998 1994 1995 1996 1997 1998 1998
1000 1000 CUM/1000CUM CUM capita
World 5371 5498 5165 4896 4706 5534 5909 5726 5941 5970 1
Africa 12 18 18 18 18 28 59 81 115 84 0
Algeria 0 2 6 15 15 0
Angola 1 1 0 0 1 0
Egypt 5 5 5 5 5 3 9 12 24 7 0
Ethiopia 3 3 3 3 3 4 4 3 3 3 0Gambia 0 1 1 0 0
Guinea 0 0 1 0 0 0
Mauritius 4 5 5 5 9 8
Morocco 4 20 27 48 28 1
Nigeria 1 8 8 3 3 0
South Africa 4 10 10 10 10 11 4 5 5 6 0Togo 0 1 1 1 1 0Tunisia 0 0 0 1 0Zimbabwe 0 1 8 8 8 1
N C America 3550 3520 3225 2957 2926 3476 3477 3197 2913 2921 6
Barbados 1 0 1 5 1 4Canada 474 425 425 425 425 396 339 334 337 357 12
Dominican Rp 2 0 0El Salvador 0 6 1 1 0Honduras 0 4 5 2 3 0Mexico 13 20 8 5 -2 -0Panama 2 2 5 1 2 1
USA 3076 3095 2800 2532 2501 3062 3110 2835 2559 2556 9
5outhAmerica 77 88 88 61 61 58 67 69 52 56 0
Argentina 0 0 1 1 2 0Bolivia 0 1 1 1 0Brazil 61 61 61 61 61 44 44 45 41 40 0Chile 4 15 15 0 4 4 0Colombia 3 3 3 3 3 5 1 0 0Ecuador 2 0Peru 3 4 8 12 0Venezuela 9 9 9 9 9 10 0 0 o
Asia 757 834 778 894 763 983 1337 1387 1904 1967 1
Bahrain 0 2 2 0 2 3
China 8 120 80 22 22 169 477 509 935 1128 1
Cyprus 2 2 3 6 6 8India 3 3 3 3 3 3 1 2 3 8 0Indonesia 50 50 50 50 50 32 41 54 -31 -31 -0Iran 0 1 3 3 2 0Israel 10 10 10 10 10 22 21 23 37 33 6Japan 640 617 605 779 648 642 673 641 801 654 5Jordan 4 11 8 8 8 2Kazakhstan 0 1 3 4 4 0Korea D P Rp 0 2 2 2 0Korea Rep 13 10 2 -10 -10 -0Kuwait 1 2 5 5 5 3
Lebanon 1 1 5 6 6 2
Malaysia 6 12 12 1
Mongolia 0 0 0 2 2 1
Ornan 1 4 1 1 2 1
Pakistan 16 4 17 4 4 4 5 0Philippines 18 34 45 44 36 0Qatar 1 0 1 3 1 1
Saudi Arabia 9 10 15 30 17 1
Singapore 4 3 3 5 1 0Sri Lanka 1 3 3 0 0 0Syria 0 0 8 7 7 0Tajikistan 3 0Thailand 30 30 30 30 30 27 24 27 12 31 1
Turkey 0 2 2 1 1 0Untd Arab Em 6 6 11 11 27 11
Uzbekistan 0 0 0 0 6 0Viet Nam 1 2 5 5 2 0
Europe 814 875 901 828 808 826 799 833 821 800 1
Albania 0 0 0 5 6 2
Austria 24 24 25 31 34 17 19 20 28 28 3
Bel -Lux 48 48 48 28 28 42 10 29 -21 10 1
Belarus 2 1 1 0Bulgaria 7 7 7 7 7 7 7 -12 6 6 1
Croatia 0 2 2 2 5 6 11 5 1
Czech Rep 0 5 0Denmark 11 3 3 17 19 4Estonia 44 60 83 4 4 41 57 80 -20 -19 -13Finland 37 37 40 40 40 45 42 53 53 59 11France 8 8 37 -64 -48 -11 -56 -52 -1Germany 50 50 50 105 110 153 138 139 178 181 2
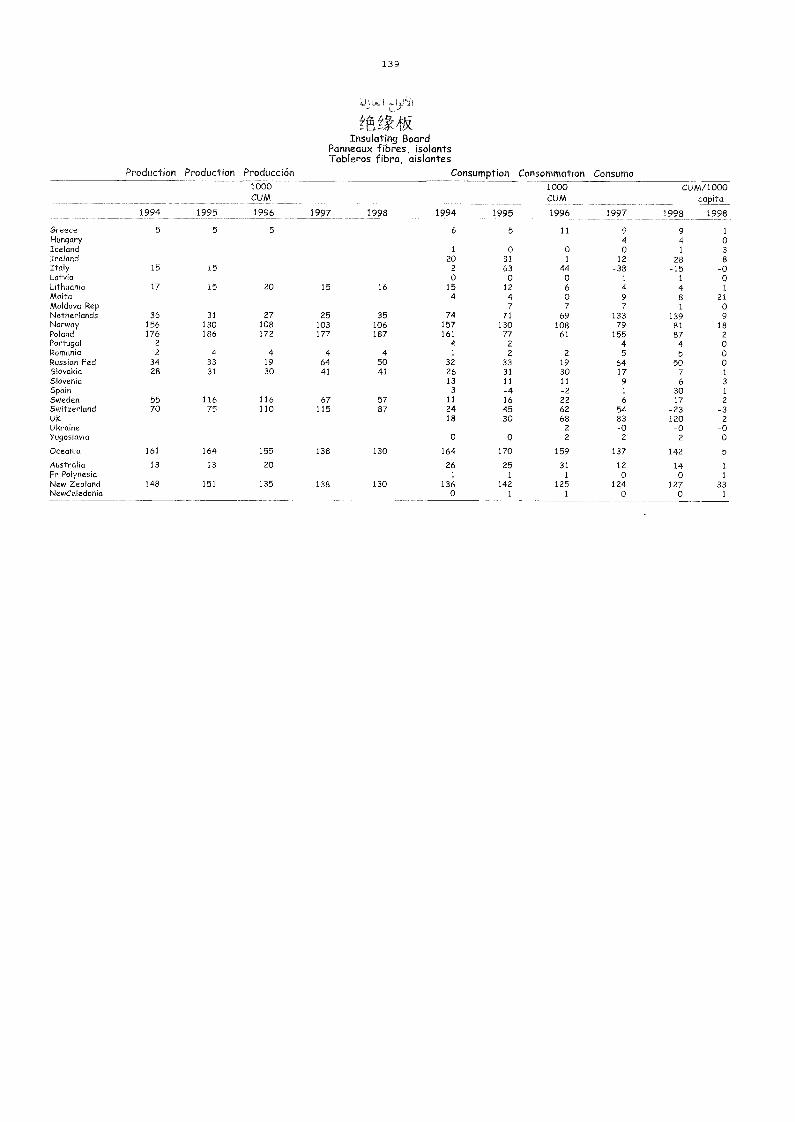
139
JJI- 5"
t0,1Insulating Board
Panneaux fibres, isolantsTableros fibra, aislantes
Production Production Producción Consumption Consommation Consumo
1994 1995
1000CUM
1996 1997 1998 1994 1995
1000CUM
1996 1997
CUM/1000capita
1998 1998
Greece 5 5 5 6 5 11 9 9 1
Hungary 4 4 0Iceland 1 0 0 0 1 3
Ireland 20 31 1 12 28 8Italy 15 15 2 63 44 -38 -15 -0Latvia 0 0 0 1 1 0Lithuania 17 15 20 15 16 15 12 6 4 4 1
Malta 4 4 0 9 8 21Moldova Rep 7 7 7 1 0Netherlands 36 31 27 25 35 74 71 69 133 139 9Norway 156 130 108 103 106 157 130 108 79 81 18Poland 176 186 172 177 187 161 77 61 155 87 2Portugal 2 4 2 4 4 0Romania 2 4 4 4 4 1 2 2 5 5 0Russian Fed 34 33 19 64 50 32 33 19 64 50 0Slovakia 28 31 30 41 41 26 31 30 17 -7 -1Slovenia 13 11 11 9 6 3Spain 3 -4 -2 1 30 1
Sweden 55 116 116 67 57 11 16 22 6 17 2
Switzerland 70 75 110 115 87 24 45 62 54 -23 -3UK 18 30 68 83 120 2Ukraine 2 -0 -0 -0Yugoslavia 0 0 2 2 2 0
Oceania 161 164 155 138 130 164 170 159 137 142 5
Australia 13 13 20 26 25 31 12 14 1
Fr Polynesia 1 1 1 0 0 1
New Zealand 148 151 135 138 130 136 142 125 124 127 33NewCaledonia 0 1 1 0 0 1
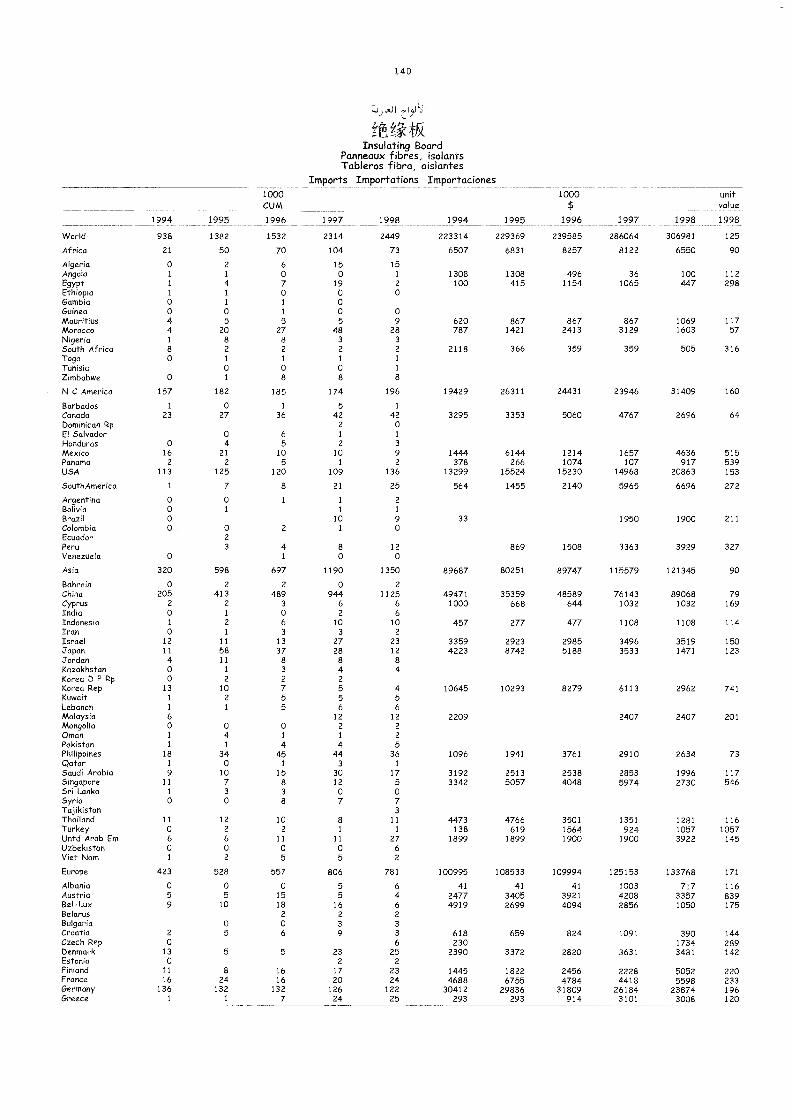
140
L.J I I-I I
7
Insulating BoardPanneaux fibres, isolantsTableros fibra, aislantes
Imports Importations Importaciones
1994 1995
1000CUM
1996 1997 1998 1994 1995
1000$
1996 1997 1998
unitvalue
1998
World 938 1382 1532 2314 2449 223314 229369 239585 286064 306981 125
Africa 21 50 70 104 73 6507 6831 8257 8122 6550 90
Algeria 0 2 6 15 15Angola 1 1 0 0 1 1308 1308 496 36 100 112Egypt 1 4 7 19 2 100 415 1154 1065 447 298Ethiopia 1 1 0 0 0Gambia 0 1 1 0Guinea 0 0 1 0 0Mauritius 4 5 5 5 9 620 867 867 867 1069 117Morocco 4 20 27 48 28 787 1421 2413 3129 1603 57Nigeria 1 8 8 3 3
South Africa 8 2 2 2 2 2118 366 359 359 505 316Togo 0 1 1 1 1
Tunisia 0 0 0 1
Zimbabwe 0 1 8 8 8
N C America 157 182 185 174 196 19429 26311 24431 23946 31409 160
Barbados 1 0 1 5 1
Canada 23 27 36 42 42 3295 3353 5060 4767 2696 64Dominican Rp 2 0El Salvador 0 6 1 1
Honduras 0 4 5 2 3
Mexico 16 21 10 10 9 14-44 6144 1214 1657 4636 515Panama 2 2 5 1 2 378 266 1074 107 917 539USA 113 125 120 109 136 13299 15524 15230 14968 20863 153
SouthAmerica 1 7 8 21 25 564 1455 2140 5965 6696 272
Argentina 0 0 1 1 2
Bolivia 0 1 1 1
Brazil 0 10 9 33 1950 1900 211Colombia 0 0 2 1 0Ecuador 2
Peru 3 4 8 12 869 1508 3363 3929 327Venezuela 0 1 0 0
Asia 320 598 697 1190 1350 89687 80251 89747 115579 121345 90
Bahrain 0 2 2 0 2
China 205 413 489 944 1125 49471 35359 48589 76143 89068 79Cyprus 2 2 3 6 6 1000 668 644 1032 1032 169India 0 1 0 2 6Indonesia 1 2 6 10 10 457 277 477 1108 1108 114Iran 0 1 3 3 2
Israel 12 11 13 27 23 3359 2923 2985 3496 3519 150Japan 11 58 37 28 12 4223 8742 5188 3533 1471 123Jordan 4 11 8 8 8Kazakhstan 0 1 3 4 4Korea D P Rp 0 2 2 2
Korea Rep 13 10 7 5 4 10645 10293 8279 6113 2962 741Kuwait 1 2 5 5 5Lebanon 1 1 5 6 6Malaysia 6 12 12 2209 2407 2407 201Mongolia 0 0 0 2 2Oman 1 4 1 1 2Pakistan 1 1 4 4 5Philippines 18 34 45 44 36 1096 1941 3761 2910 2634 73Qatar 1 0 1 3 1
Saudi Arabia 9 10 15 30 17 3192 2513 2538 2853 1996 117Singapore 11 7 8 12 5 3342 5057 4048 5974 2730 546Sri Lanka 1 3 3 0 0Syria 0 o 8 7 7Tajikistan 3Thailand 11 12 10 8 11 4473 4766 3501 1351 1281 116Turkey 0 2 2 1 1 138 619 1564 924 1057 1057Untd Arab Em 6 6 11 11 27 1899 1899 1900 1900 3922 145Uzbekistan 0 0 0 0 6Viet Nam 1 2 5 5 2
Europe 423 528 557 806 781 100995 108533 109994 125153 133768 171
Albania 0 0 0 5 6 41 41 41 1003 717 116Austria 5 5 15 5 4 2477 3405 3921 4208 3357 839Bel-Lux 9 10 18 16 6 4919 2699 4094 2856 1050 175Belarus 2 2 2Bulgaria 0 0 3 3Croatia 2 5 6 9 3 618 659 824 1091 390 144Czech Rep 0 6 230 1734 289Denmark 13 5 5 23 25 2390 3372 2820 3631 3481 142Estonia 0 2 2
Finland 11 8 16 17 23 1445 1822 2456 2228 5052 220France 16 24 16 20 24 4688 6755 4784 4418 5598 233Germany 136 132 132 126 122 30412 29836 31809 26184 23874 196Greece 1 1 7 24 25 293 293 914 3101 3008 120
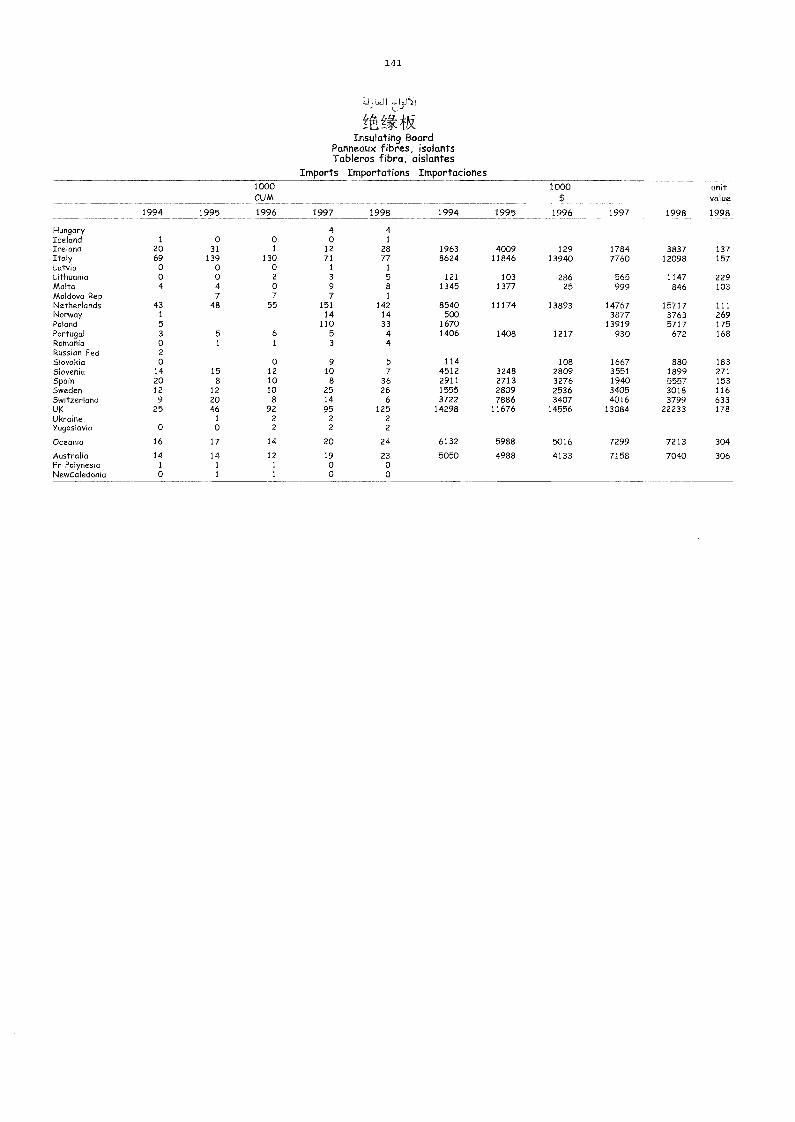
141
Insulating BoardPanneaux fibres, isolantsTableros fibra, aislantes
Imports Importations Importaciones1000CUM
1000 unitvalue
1994 1995 1996 1997 1998 1994 1995 1996 1997 1998 1998
Hungary 4 4Iceland 1 0 0 0 1
Ireland 20 31 1 12 28 1963 4009 129 1784 3837 137Italy 69 139 130 71 T7 8624 11846 13940 7760 12098 157Latvia 0 0 0 1 1
Lithuania 0 0 2 3 5 121 103 286 565 1147 229Malta 4 4 0 9 8 1345 1377 25 999 846 103Moldova Rep 7 7 7 1
Netherlands 43 48 55 151 142 8540 11174 13893 14767 15717 111Norway 1 14 14 500 3877 3763 269Poland 5 110 33 1670 13919 5717 175Portugal 3 5 6 5 4 1406 1408 1217 930 672 168Romania 0 1 1 3 4Russian Fed 2
Slovakia 0 0 9 5 114 108 1667 880 183Slovenia 14 15 12 10 7 4512 3248 2809 3551 1899 271Spain 20 8 10 8 36 2911 2713 3276 1940 5557 153Sweden 12 12 10 25 26 1555 2809 2536 3405 3018 116Switzerland 9 20 8 14 6 3722 7886 3407 4016 3799 633UK 25 46 92 95 125 14298 11676 14556 13084 22233 178Ukraine 1 2 2 2Yugoslavia 0 0 2 2 2
Oceania 16 17 14 20 24 6132 5988 5016 7299 7213 304
Australia 14 14 12 19 23 5050 4988 4133 7158 7040 306Fr Polynesia 1 1 1 0 0NewCaledonia 0 1 1 0 0
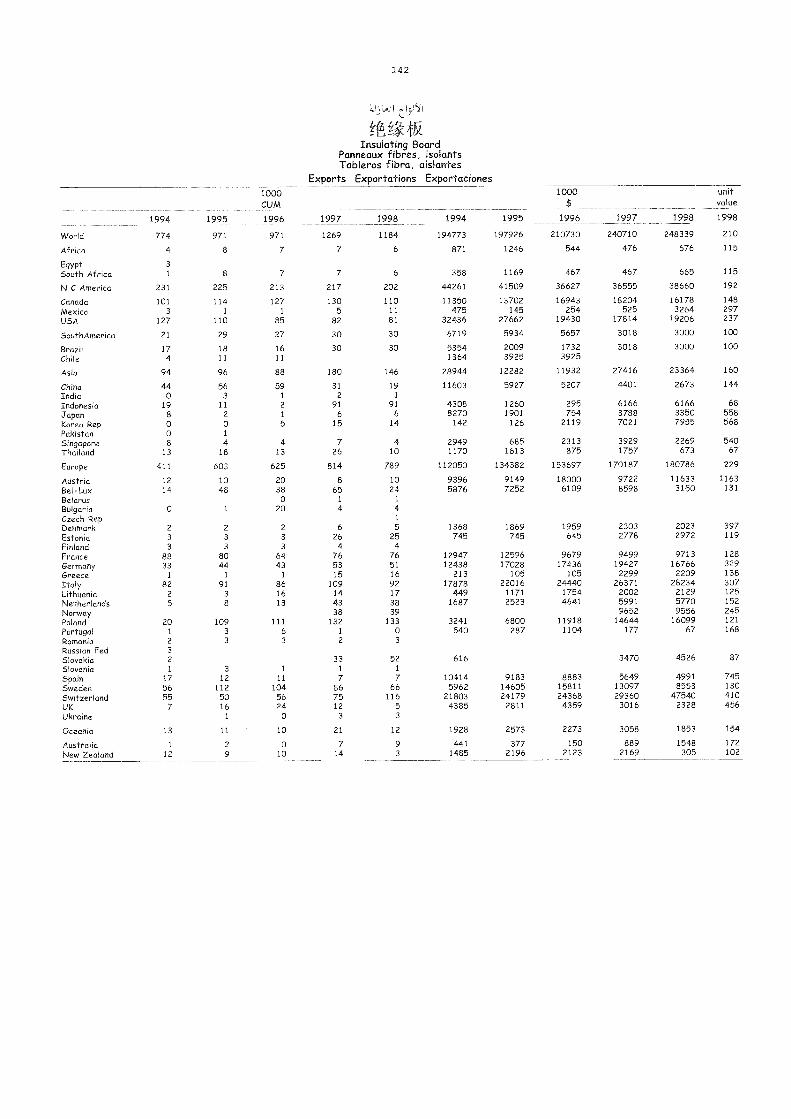
192
MInsulating Board
Panneaux fibres, isolantsTableros fibra, aislantes
Exports Exportations Exportaciones
1994 1995
1000CUM
1996 1997 1998 1994 1995
1000
$
1996 1997 1998
unitvalue
1998
World 774 971 971 1269 1184 194773 197926 210730 240710 248339 210
Af rica 4 8 7 7 6 871 1246 544 476 676 115
Egypt 3
South Africa 1 8 7 7 6 358 1169 467 467 665 115
N C America 231 225 213 217 202 44261 41509 36627 36555 38660 192
Canada 101 114 127 130 110 11350 13702 16943 18204 16178 148
Mexico 3 1 1 5 11 475 145 254 525 3264 297USA 127 110 85 82 81 32436 27662 19430 17814 19206 237
SouthAmerica 21 29 27 30 30 6719 5934 5657 3018 3000 100
Brazd 17 18 16 30 30 5354 2009 1732 3018 3000 100
Chile 4 11 11 1364 3925 3925
Asia 94 96 88 180 146 28944 12282 11932 27416 23364 160
Cha 44 56 59 31 19 11603 5927 5207 4401 2673 144
India 0 3 1 2 1
Indonesia 19 11 2 91 91 4308 1260 295 6166 6166 68
Japan 8 2 1 6 6 8270 1901 754 3788 3350 558
Korea Rep 0 0 5 15 14 142 126 2119 7021 7955 568Pakistan 0 1
Singapore 8 4 4 7 4 2949 685 2313 3929 2269 540Thailand 13 18 13 26 10 1170 1613 875 1757 673 67
Europe 411 603 625 814 789 112050 134382 153697 170187 180786 229
Austria 12 10 20 8 10 9396 9149 18000 9722 11633 1163
Bel-Lux 14 48 38 65 24 5876 7252 6109 8598 3150 131
Belarus 0 1 1
Bulgaria 0 1 20 4 4
Czech Rep 1
Denmark 2 2 2 6 5 1368 1869 1959 2303 2023 397Estonia 3 3 3 26 25 745 745 645 2778 2972 119
Finland 3 3 3 4 4
France 88 80 64 76 76 12947 12596 9679 9499 9713 128
Germany 33 44 43 53 51 12438 17028 17436 19427 16766 329Greece 1 1 1 15 16 213 105 105 2299 2209 138
Italy 82 91 86 109 92 17878 22016 24440 26371 28234 307Lithuania 2 3 16 14 17 449 1171 1754 2002 2129 125
Netherlands 5 8 13 43 38 1687 2523 4641 5991 5770 152
Norway 38 39 9652 9556 245
Poland 20 109 111 132 133 3241 6800 11918 14644 16099 121
Portugal 1 3 6 1 0 540 287 1104 177 67 168
RomaMa 2 3 3 2 3
Russian Fed 3
Slovakia 2 33 52 616 3470 4526 87Slovenia 1 3 1 1 1
Spain 17 12 11 7 7 10414 9183 8883 5649 4991 745Sweden 56 112 104 86 66 5962 14605 15811 13097 8553 130
Switzerland 55 50 56 75 116 21803 24179 24368 29360 47540 410UK 7 16 24 12 5 4385 2811 4359 3016 2328 456Ukraine 1 0 3 3
Oceania 13 11 10 21 12 1928 2573 2273 3058 1853 154
Australia 1 2 0 7 9 441 377 150 889 1548 172
New Zealand 12 9 10 14 3 1485 2196 2123 2169 305 102

kt
PULP AND RECOVEREO PAPER
PATE ET '.'IEUX PAPIERS
PASTA Y PAPEL RECUP7-1..NI
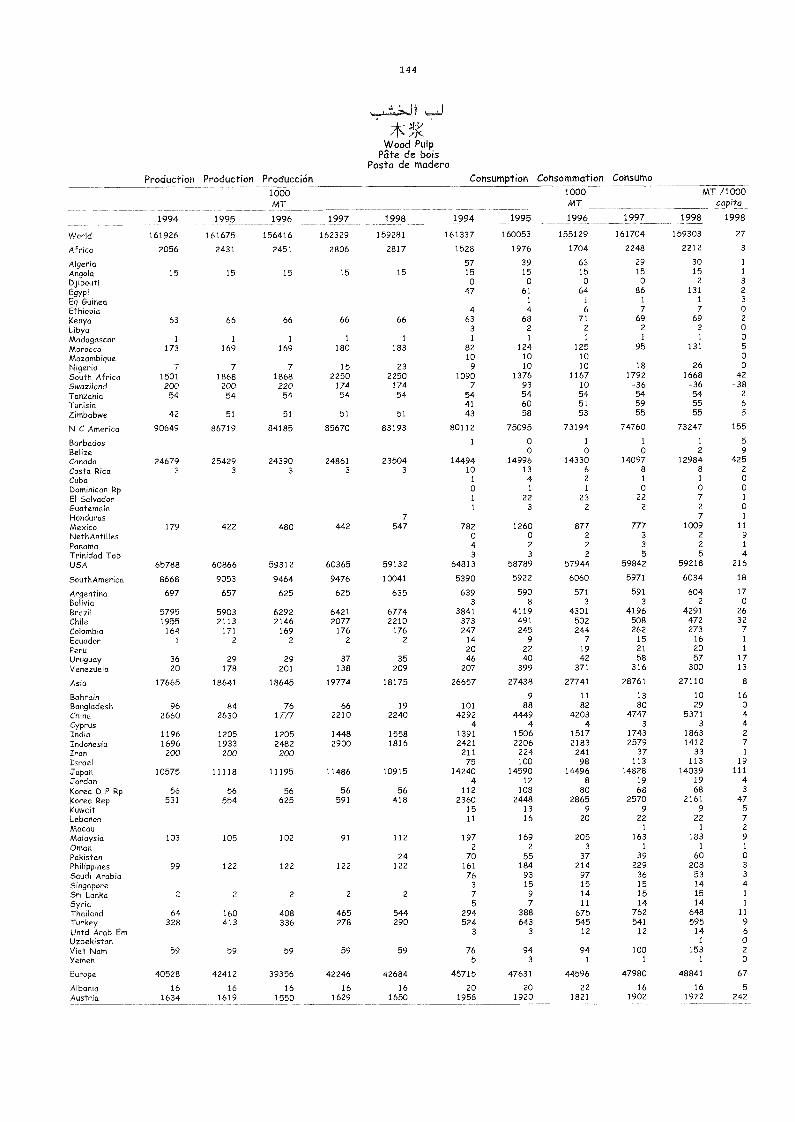
199
4. >J1
VVood PulpPate de bois
Pasta de moderoProduction Production Producción Consunnption Consonimation Consumo
1994 1995
1000MT
1996 1997 1998 1994 1995
1000MT
1996 1997
MT /1000capita
1998 1998
World 161926 161675 156416 162329 159281 161337 160053 155129 161704 159303 27
Africa 2056 2431 2451 2806 2817 1528 1976 1704 2248 2212 3
Algeria 57 39 63 29 30 1
Angola 15 15 15 15 15 15 15 15 15 15 1
Djibouti 0 0 0 0 2 3
Egypt 47 61 64 86 131 2
Eq Guinea 1 1 1 1 3
Ethiopia 4 4 6 7 7 0
Kenya 63 66 66 66 66 63 68 71 69 69 2
Libya 3 2 2 2 2 0
Madagascar 1 1 1 1 1 1 1 1 1 1 0
Morocco 173 169 169 180 183 82 124 125 95 131 5
Mozambique 10 10 10 0
Nigeria 7 7 7 15 23 9 10 10 18 26 0
South Africa 1501 1868 1868 2250 2250 1090 1376 1167 1792 1668 42Swaziland 200 200 220 174 174 7 93 10 -36 -36 -38Tanzania 54 54 54 54 54 54 54 54 54 54 2
Tunisia 41 60 51 59 55 6
Zimbabwe 42 51 51 51 51 43 58 53 55 55 5
N C America 90649 86719 84185 85670 83193 80112 75095 73194 74760 73247 155
Barbados 1 0 1 1 1 5
Belize 0 0 0 2 9
Canada 24679 25429 24390 24861 23504 14494 14996 14330 14097 12984 425Costa Rica 3 3 3 3 3 10 13 6 8 8 2
Cuba 1 4 2 1 1 0
Dominican Rp 0 1 1 0 0 0
El Salvador 1 22 23 22 7 1
Guatemala 1 3 2 2 2 0Honduras 7 7 1
Mexico 179 422 480 442 547 782 1260 877 //7 1009 11
NethAntilles 0 0 2 3 2 9
Panama 4 2 2 3 2 1
Trinidad Tob 3 3 2 5 5 4
USA 65788 60866 59312 60365 59132 64813 58789 57944 59842 59218 216
SouthAmerica 8668 9053 9464 9476 10041 5390 5922 6060 5971 6034 18
Argentina 697 657 625 625 635 639 590 571 591 604 17Bolivia 3 8 3 3 2 0Brazil 5795 5903 6292 6421 6774 3841 4119 4301 4196 4291 26
Chile 1955 2113 2146 2077 2210 373 491 502 508 472 32
Colombia 164 171 169 176 176 247 245 244 262 273 7
Ecuador 1 2 2 2 2 14 9 7 15 16 1
Peru 20 22 19 21 20 1
Uruguay 36 29 29 37 35 46 40 42 58 57 17Venezuela 20 178 201 138 209 207 399 371 316 300 13
Asia 17665 18641 18645 19774 18175 26657 27438 27741 28761 27110 8
Bahrain 9 11 13 10 16
Bangladesh 96 84 76 66 19 101 88 82 80 29 0China 2660 2630 1f// 2210 2240 4292 4449 4203 4747 5371 4Cyprus 4 4 4 3 3 4India 1196 1205 1205 1448 1558 1391 1506 1517 1743 1863 2
Indonesia 1696 1933 2482 2900 1816 2421 2206 2183 2579 1412 7Iran 200 200 200 211 224 241 37 33 1
Israel 75 100 98 113 113 19
Japan 10575 11118 11195 11486 10915 14240 14590 14496 14828 14039 111
Jordan 4 12 8 19 19 4Korea D P Rp 56 56 56 56 56 112 108 80 68 68 3
Korea Rep 531 554 625 591 418 2360 2448 2865 2570 2161 47Kuwait 15 13 9 9 9 5
Lebanon 11 16 20 22 22 7Macau -1 -1 -2Malaysia 103 105 102 91 112 197 169 205 163 183 9
Oman 2 2 3 1 1 1
Pakistan 24 70 55 37 39 60 0Philippines 99 122 122 122 122 161 184 214 229 208 3
Saudi Arabia 76 93 97 36 53 3
Singapore 3 15 15 15 14 4Sri Lanka 2 2 2 2 2 7 9 14 15 15 1
Syria 5 7 11 14 14 1
Thailand 64 160 408 465 544 294 388 675 762 648 11
Turkey 328 413 336 278 290 524 643 545 541 595 9
Untd Arab Em 3 3 12 12 14 6
Uzbekistan 1 0Viet Nam 59 59 59 59 59 76 94 94 100 153 2
Yemen 5 3 1 1 1 0
Europe 40528 42412 39356 42246 42684 45715 47631 44596 47980 48841 67
Albania 16 16 16 16 16 20 20 22 16 16 5
Austria 1634 1619 1550 1629 1650 1958 1920 1821 1902 1972 242
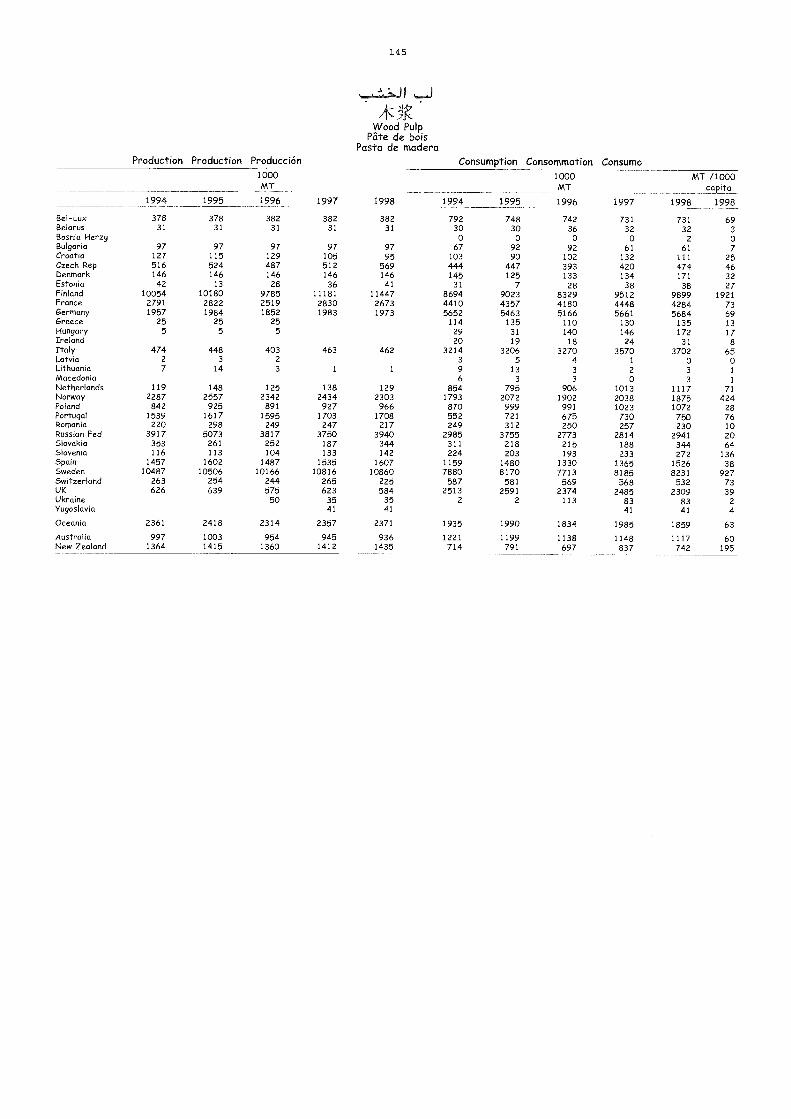
145
I
* VWood Pulp
Pate de boisPasta de madera
Production Production Producción Consumption Consommation Consumo
1994 1995
1000MT
1996 1997 1998 1994 1995
1000MT
1996 1997
MT /1000c a tcl
1998 1998
Bel-Lux 378 378 382 382 382 792 748 742 731 731 69Belarus 31 31 31 31 31 30 30 36 32 32 3Bosnia Herzg 0 0 0 0 2 0Bulgaria 97 97 97 97 97 67 92 92 61 61 7Croatia 127 115 129 105 95 103 90 102 132 111 25Czech Rep 516 524 487 512 569 444 447 393 420 474 46Denmark 146 146 146 146 146 145 125 133 134 171 32Estonia 42 13 28 36 41 31 7 28 38 38 27Finland 10054 10180 9785 11181 11447 8694 9023 8329 9512 9899 1921France 2791 2822 2519 2830 2673 4410 4357 4180 4448 4284 73Germany 1957 1984 1852 1983 1973 5652 5463 5166 5661 5684 69Greece 25 25 25 114 135 110 130 135 13Hungary 5 5 5 29 31 140 146 172 17Ireland 20 19 18 24 31 8Italy 474 448 403 463 462 3214 3206 3270 3570 3702 65Latvia 2 3 2 3 5 4 1 0 0Lithuania 7 14 3 1 1 9 13 3 2 3 1
Macedonia 6 3 3 0 3 1
Netherlands 119 148 125 138 129 854 795 906 1013 1117 71Norway 2287 2557 2342 2434 2303 1793 2072 1902 2038 1875 424Poland 842 925 891 927 966 870 999 991 1023 1072 28Portugal 1539 1617 1595 1703 1708 552 721 675 730 750 76Romania 220 298 249 247 217 249 312 250 257 230 10Russian Fed 3917 5073 3817 3750 3940 2985 3755 2773 2814 2941 20Slovakia 353 261 252 187 344 311 218 215 188 344 64Slovenia 116 113 104 133 142 224 203 193 233 272 136Spain 1457 1602 1487 1535 1607 1159 1480 1330 1365 1526 38Sweden 10487 10506 10166 10816 10860 7880 8170 7713 8185 8231 927Switzerland 263 254 244 265 225 587 581 569 568 532 73UK 626 639 575 623 584 2513 2591 2374 2485 2309 39Ukraine 50 35 35 2 2 113 83 83 2Yugoslavia 41 41 41 41 4
Oceania 2361 2418 2314 2357 2371 1935 1990 1834 1985 1859 63
Australia 997 1003 954 945 936 1221 1199 1138 1148 1117 60New Zealand 1364 1415 1360 1412 1435 714 791 697 837 742 195
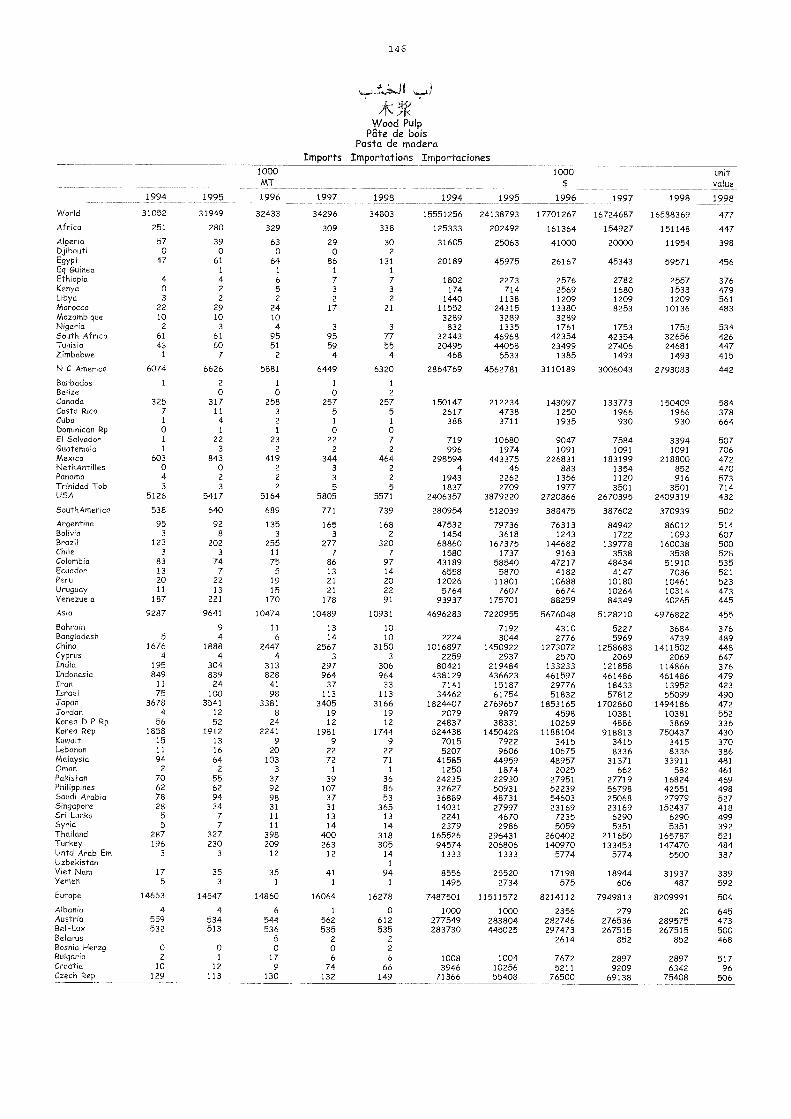
196
I
Wood PulpPate de bois
Pasta de maderaInnports Importations Importaciones
1994 1995
1000MT
1996 1997 1998 1994 1995
1000$
1996 1997 1998
unitvalue
1998
VVoHd 31052 31949 32433 34296 34803 15551256 24138793 17701267 16724687 16588369 477
AfrMa 251 280 329 309 338 125333 202492 161364 154927 151148 447
Algeria 57 39 63 29 30 31605 25063 41000 20000 11954 398Djibouti 0 0 0 0 2
Egypt 47 61 64 86 131 20189 45975 26167 45343 59571 456EqGuMea 1 1 1 1
Ethiopia 4 4 6 7 7 1802 2273 2576 2782 2557 376Kenya 0 2 5 3 3 174 714 2569 1680 1533 479Libya 3 2 2 2 2 1440 1138 1209 1209 1209 561Morocco 22 29 24 17 21 11552 24315 13380 8253 10136 483Mozambique 10 10 10 3289 3289 3289Nigeria 2 3 4 3 3 832 1335 1761 1753 1753 534South Africa 61 61 95 95 77 32443 46968 42354 42354 32656 426TunisM 43 60 51 59 55 20495 44058 23499 27406 24681 447Zimbabwe 1 7 2 4 4 468 5533 1385 1493 1493 415
N C AmerMa 6074 6626 5881 6449 6320 2864769 4562781 3110189 3006043 2793083 442
Barbados 1 2 1 1 1
Belize 0 0 0 2Canada 325 317 258 257 257 150147 212234 143097 133773 150409 584Costa Rica 7 11 3 5 5 2617 4738 1250 1966 1966 378Cuba 1 4 2 1 1 388 3711 1935 930 930 664DomMMan Rp 0 1 1 0 0El Salvador 1 22 23 22 7 719 10680 9047 7584 3394 507GuatemaM 1 3 2 2 2 996 1974 1091 1091 1091 706MexMo 603 843 419 344 464 298594 443375 226831 183199 218800 472NethAntilles 0 0 2 3 2 4 46 883 1354 852 470Panama 4 2 2 3 2 1943 2262 1356 1120 916 573Trinidad Tob 3 3 2 5 5 1837 2709 1977 3501 3501 714USA 5126 5417 5164 5805 5571 2406357 3879220 2720866 2670395 2409319 432
SouthAmerMa 538 640 689 771 739 280954 512039 388475 387602 370939 502
Argentina 95 92 135 165 168 47532 79736 76313 84942 86012 514BolivM 3 8 3 3 2 1454 3618 1243 1722 1093 607Brazd 123 202 255 277 320 68860 167375 144682 139778 160038 500Chile 3 3 11 7 7 1580 1737 9163 3538 3538 528Colombia 83 74 75 86 97 43189 58540 47217 48434 51910 535Ecuador 13 7 5 13 14 6558 5870 4182 4147 7036 521Peru 20 22 19 21 20 12026 11801 10688 10180 10461 523Uruguay 11 13 15 21 22 5764 7607 6674 10264 10314 473Venezuela 187 221 170 178 91 93937 175701 88259 84349 40265 445Asia 9287 9641 10474 10489 10931 4696283 7220955 5676048 5128210 4976822 455Bahrain 9 11 13 10 7192 4310 5227 3684 376Bangladesh 5 4 6 14 10 2224 3044 2776 5969 4739 489China 1676 1888 2447 2567 3150 1016897 1450922 1273072 1258683 1411502 448Cyprus 4 4 4 3 3 2259 2937 2570 2069 2069 647India 195 304 313 297 306 80421 219484 133233 121858 114866 376Indonesia 849 839 828 964 964 438129 436623 461597 461486 461486 479Iran 11 24 41 37 33 7141 15187 29776 18433 13952 423Israel 75 100 98 113 113 34462 61754 51832 57812 55099 490Japan 3678 3541 3381 3405 3166 1824407 2769657 1853165 1702860 1494186 472Jordan 4 12 8 19 19 2079 9879 4598 10381 10381 552Korea D P Rp 56 52 24 12 12 24837 38331 10269 4886 3869 336Korea Rep 1858 1912 2241 1981 1744 824438 1450428 1188104 918813 750437 430Kuwait 15 13 9 9 9 7015 7922 3415 3415 3415 370Lebanon 11 16 20 22 22 5207 9606 10675 8336 8336 386Malaysia 94 64 103 72 71 41585 44959 48957 31371 33911 481Ornan 2 2 3 1 1 1250 1874 2025 662 582 461Pakistan 70 55 37 39 36 24235 22930 27951 27719 16824 469PhilippMes 62 62 92 107 86 32627 50931 52239 56798 42551 498Saudi Arabio 78 94 98 37 53 36889 48731 54603 25068 27979 527Singapore 28 34 31 31 365 14031 27997 23169 23169 152437 418Sri Lanka 5 7 11 13 13 2241 4670 7235 6290 6290 499SyrM 5 7 11 14 14 2379 2986 5059 5351 5351 392Thailand 287 327 398 400 318 165526 296431 260402 211650 165787 521Turkey 196 230 209 263 305 94574 206806 140970 133453 147470 484Untd Arab Em 3 3 12 12 14 1333 1333 5774 5774 5500 387Uzbekistan 1
VMt Nam 17 35 35 41 94 8556 25520 17198 18944 31937 339Yemen 5 3 1 1 1 1495 2734 575 606 487 592
Europe 14663 14547 14860 16064 16278 7487501 11511572 8214112 7949813 8209991 504
Albania 4 4 6 1 0 1000 1000 2356 279 20 645Austria 559 534 544 562 612 277549 283804 282746 276536 289575 473Bel-Lux 532 513 536 535 535 283730 445025 297473 267515 267515 500BeMrus 5 2 2 2614 852 852 468BosnM Herzg 0 0 0 0 2Bulgaria 2 1 17 6 6 1008 1004 7672 2897 2897 517CroatM 10 12 9 74 66 3946 10256 5211 9209 6342 96Czech Rep 129 113 130 132 149 71366 55408 76500 69138 75408 506
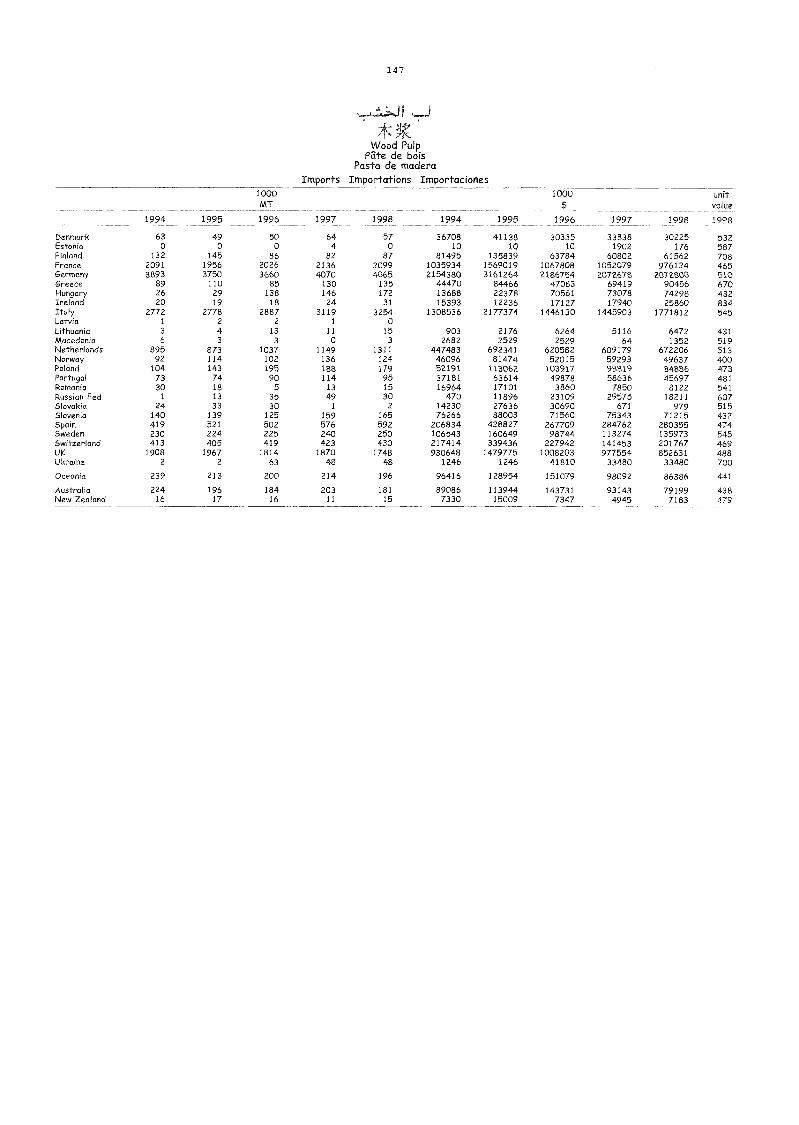
1 4 7
Wood PulpPate de bois
Pasta de maderaImports Importations Importaciones
1994 1995
1000MT
1996 1997 1998 1994 1995
1000$
1996 1997 1998
unitvalue
1998
Denmark 63 49 50 64 57 36708 41138 30335 33838 30225 532Estonia 0 0 0 4 0 10 10 10 1902 176 587Finland 132 145 86 82 87 81495 135839 63784 60802 61562 708France 2091 1956 2026 2136 2099 1035934 1569019 1067808 1052079 976124 465Germany 3893 3750 3660 4070 4065 2154380 3161264 2186754 2072678 2072800 510Greece 89 110 85 130 135 44470 84466 47083 69419 90456 670Hungary 26 29 138 146 172 13688 22378 70561 73078 74298 432Ireland 20 19 18 24 31 15393 12236 17127 17940 25860 834Italy 2772 2778 2887 3119 3254 1308536 2177374 1446130 1445903 1771812 545Latvia 1 2 2 1 0Lithuania 3 4 13 11 15 903 2176 6264 5116 6472 431Macedonia 6 3 3 0 3 2682 2529 2529 64 1352 519Netherlands 895 873 1037 1149 1311 447483 692341 620582 609179 672206 513Norway 92 114 102 136 124 46096 81474 52015 59293 49637 400Poland 104 143 195 188 179 52191 113062 103917 98819 84886 473Portugal 73 74 90 114 95 37181 63614 49878 58636 45697 481Romania 30 18 5 13 15 16964 17101 3860 7850 8122 541Russian Fed 1 13 35 49 30 470 11896 23109 29575 18211 607Slovakia 24 33 30 1 2 14230 27636 30690 671 979 515Slovenia 140 139 125 159 165 76266 88003 71560 75343 71215 432Spain 419 521 502 576 592 206834 428827 267709 284762 280355 474Sweden 230 224 225 240 250 106543 160649 98744 113274 135973 545Switzerland 413 405 419 423 430 217414 339436 227942 141453 201767 469UK 1908 1967 1814 1870 1748 930648 1479775 1008203 977554 852631 488Ukraine 2 2 63 48 48 1246 1246 41810 33480 33480 700
Oceania 239 213 200 214 196 96416 128954 151079 98092 86386 441
Australia 224 196 184 203 181 89086 113944 143731 93143 79199 438New Zealand 16 17 16 11 15 7330 15009 7347 4945 7183 479
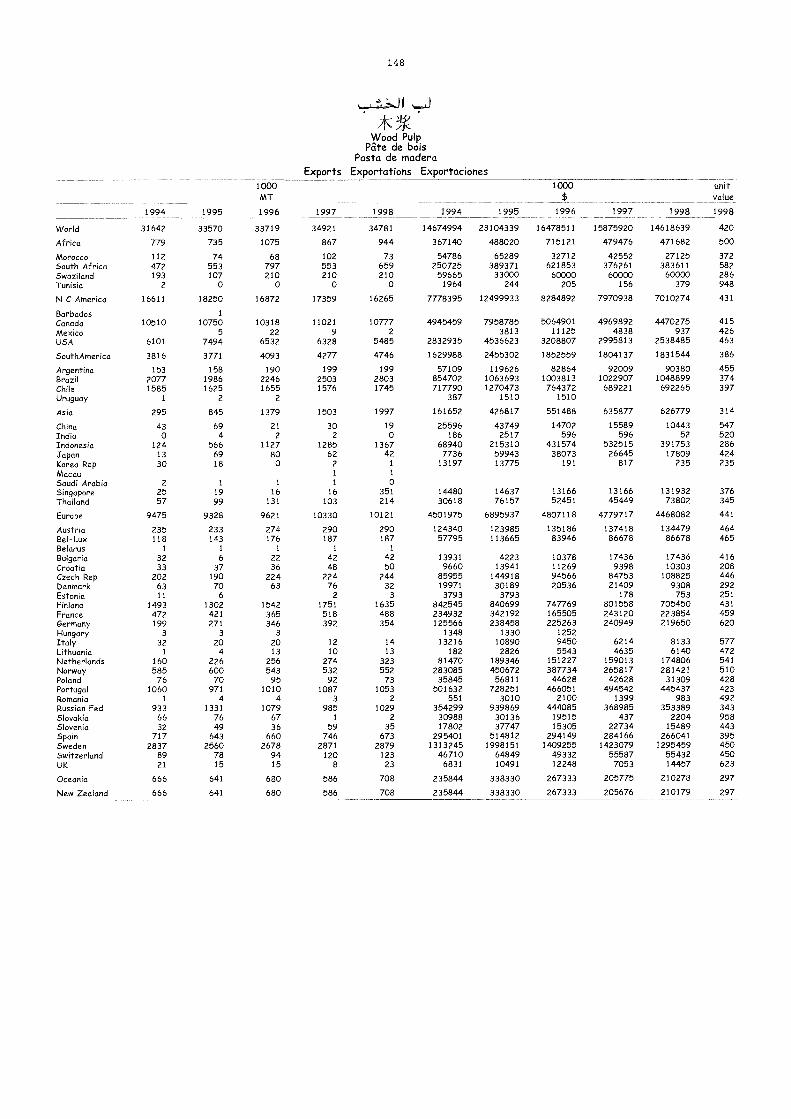
198
2K '74KWood Pulp
Pate de boisPasta de madera
Exports Exportations Exportaciones
1994 1995
1000MT
1996 1997 1998 1994 1995
1000$
1996 1997 1998
unitvalue
1998
VVorld 31642 33570 33719 34921 34781 14674994 23104339 16478511 15875920 14618639 420
Africa 779 735 1075 867 944 367140 488020 715121 479476 471682 500
Morocco 112 74 68 102 73 54786 65289 32712 42552 27125 372South Africa 472 553 797 553 659 250725 389371 621853 376261 383611 582Swaziland 193 107 210 210 210 59665 33000 60000 60000 60000 286Tunisia 2 0 0 0 0 1964 244 205 156 379 948
N C America 16611 18250 16872 17359 16265 11/8395 12499933 8284892 7970938 7010274 431
Barbados 1
Canada 10510 10750 10318 11021 10777 4945459 7958785 5064901 4969892 4470275 415Mexico 5 22 9 2 3813 11125 4838 937 426USA 6101 7494 6532 6328 5485 2832935 4536623 3208807 2995813 2538485 463
SouthAmerma 3816 3771 4093 4277 4746 1629988 2455302 1852559 1804137 1831544 386
Argentina 153 158 190 199 199 57109 119626 82864 92009 90380 455Brazil 2077 1986 2246 2503 2803 854702 1063693 1003813 1022907 1048899 374Chile 1585 1625 1655 1576 1745 717790 1270473 764372 689221 692265 397Uruguay 1 2 2 387 1510 1510
Asia 295 845 1379 1503 1997 161652 426817 551488 635877 626779 314
China 43 69 21 30 19 25596 43749 14702 15589 10443 547India 0 4 2 2 0 186 2517 596 596 52 520Indonesia 124 566 1127 1285 1367 68940 215310 431574 532515 391753 286Japan 13 69 80 62 42 7736 59943 38073 26645 17809 424Korea Rep 30 18 0 2 1 13197 13775 191 817 235 235Macau 1 1
Saudi Arabia 2 1 1 1 0Singapore 25 19 16 16 351 14480 14637 13166 13166 131932 376Thailand 57 99 131 103 214 30618 76157 52451 45449 73802 345
Europe 9475 9328 9621 10330 10121 4501975 6895937 4807118 4779717 4468082 441
Austria 235 233 274 290 290 124340 123985 135186 137418 134479 464Bel-Lux 118 143 176 187 187 57795 113665 83946 86678 86678 465BeMrus 1 1 1 1 1
Bulgaria 32 6 22 42 42 13931 4223 10378 17436 17436 416CroatM 33 37 36 48 50 9660 13941 11269 9398 10303 208Czech Rep 202 190 224 224 244 85955 144918 94566 84753 108825 446Denmark 63 70 63 76 32 19971 30189 20536 21409 9308 292Estonia 11 6 2 3 3793 3793 178 753 251
Finland 1493 1302 1542 1751 1635 842545 840699 747769 801558 705450 431
France 472 421 365 518 488 234932 342192 165505 243120 223854 459Germany 199 271 346 392 354 125566 238458 225263 240949 219650 620Hungary 3 3 3 1348 1330 1252Italy 32 20 20 12 14 13216 10890 9450 6214 8133 577LithuaMa 1 4 13 10 13 182 2826 5543 4635 6140 472Netherlands 160 226 256 274 323 81470 189346 151227 159013 174806 541Norway 585 600 543 532 552 283085 450672 387734 265817 281421 510PoMnd 76 70 95 92 73 35845 56811 44628 42628 31309 428Portugal 1060 971 1010 1087 1053 501632 728251 466051 494542 445437 423RomanM 1 4 4 3 2 551 3010 2100 1399 983 492Russian Fed 933 1331 1079 985 1029 354299 939869 444085 368985 353389 343SlovakM 66 76 67 1 2 30988 30136 19515 437 2204 958SlovenM 32 49 36 59 35 17802 37747 15305 22734 15489 443SpaM 717 643 660 746 673 295401 514812 294149 284166 266041 395Sweden 2837 2560 2678 2871 2879 1313245 1998151 1409255 1423079 1295459 450Switzerland 89 78 94 120 123 46710 64849 49332 55587 55432 450UK 21 15 15 8 23 6831 10491 12248 7053 14457 623
CteanM 666 641 680 586 708 235844 338330 267333 205775 210278 297
New Zealand 666 641 680 586 708 235844 338330 267333 205676 210179 297
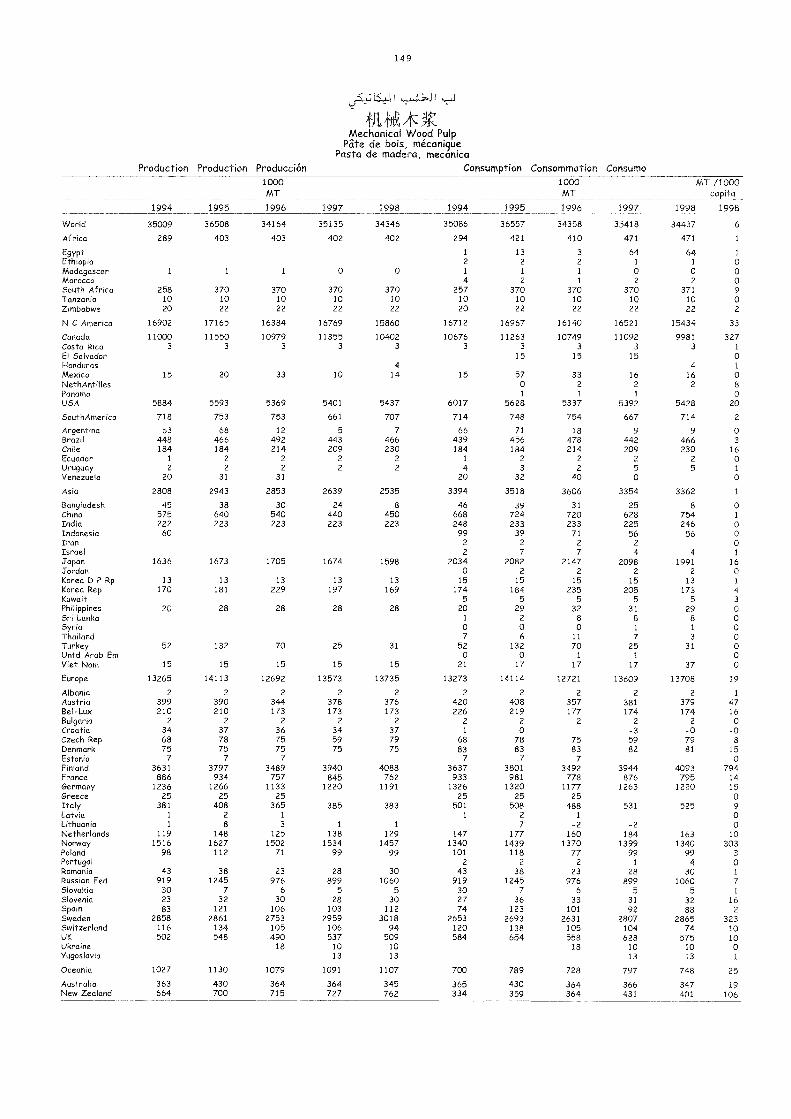
1 9 9
Mechanical Wood PulpPate de bois, mécanique
Pasta de madera, mecanicaProduction Production Producción Consumption Consommation Consumo
1994 1995
1000MT
1996 1997 1998 1994 1995
1000MT
1996 1997
MT /1000capita
1998 1998
World 35009 36508 34164 35135 34346 35086 36557 34358 35418 34437 6
Africa 289 403 403 402 402 294 421 410 471 471 1
Egypt 1 13 3 64 64 1
Ethiopia 2 2 2 1 1 0Madagascar 1 1 1 0 0 1 1 1 0 0 0Morocco 4 2 1 2 2 0South Africa 258 370 370 370 370 257 370 370 370 371 9Tanzania 10 10 10 10 10 10 10 10 10 10 0Zimbabwe 20 22 22 22 22 20 22 22 22 22 2
N C America 16902 17165 16384 16769 15860 16712 16967 16140 16521 15434 33
Canada 11000 11550 10979 11355 10402 10676 11263 10749 11092 9981 327Costa Rica 3 3 3 3 3 3 3 3 3 3 1
El Salvador 15 15 15 0Honduras 4 4 1
Mexico 15 20 33 10 14 15 57 33 16 16 0NethAntilles 0 2 2 2 8Panama 1 1 1 0USA 5884 5593 5369 5401 5437 6017 5628 5337 5392 5428 20
SouthAmerica 718 753 753 661 707 714 748 754 667 714 2
Argentina 63 68 12 5 7 66 71 18 9 9 0Brazil 448 466 492 443 466 439 456 478 442 466 3Chile 184 184 214 209 230 184 184 214 209 230 16Ecuador 1 2 2 2 2 1 2 2 2 2 0Uruguay 2 2 2 2 2 4 3 2 5 5 1
Venezuela 20 31 31 20 32 40 0 0
Asia 2808 2943 2853 2639 2535 3394 3518 3606 3354 3362 1
Bangladesh 45 38 30 24 8 46 39 31 25 8 0China 575 640 540 440 450 668 724 720 628 754 1
India 222 223 223 223 223 248 233 233 225 246 0Indonesia 60 99 39 71 56 56 0Iran 2 2 2 2 0Israel 2 7 7 4 4 1
Japan 1636 1673 1705 1674 1598 2034 2082 2147 2098 1991 16Jordan 0 2 2 2 2 0Korea D P Rp 13 13 13 13 13 15 15 15 15 13 1
Korea Rep 170 181 229 197 169 174 184 235 205 173 4Kuwait 5 5 5 5 5 3
Philippines 20 28 28 28 28 20 29 32 31 29 0Sri Lanka 1 2 8 8 8 0Syria 0 0 0 1 1 0Thailand 7 6 11 7 3 0Turkey 52 132 70 25 31 52 132 70 25 31 0Untd Arab Em 0 0 1 1 0Viet Nam 15 15 15 15 15 21 17 17 17 37 0
Europe 13265 14113 12692 13573 13735 13273 14114 12721 13609 13708 19
Albania 2 2 2 2 2 2 2 2 2 2 1
Austria 399 390 344 378 376 420 408 357 381 379 47Bel-Lux 210 210 173 173 173 226 219 177 174 174 16Bulgaria 2 2 2 2 2 2 2 2 2 2 0Croatia 34 37 36 34 37 1 0 -3 -0 -0Czech Rep 68 78 75 59 79 68 78 75 59 79 8Denmark 75 75 75 75 75 83 83 83 82 81 15Estonia 7 7 7 7 7 7 0Finland 3631 3797 3489 3940 4088 3637 3801 3492 3944 4093 794France 886 934 757 845 762 933 981 778 876 795 14Germany 1236 1266 1133 1220 1191 1326 1320 1177 1263 1220 15Greece 25 25 25 25 25 25 0Italy 381 408 365 385 383 501 508 488 531 525 9Latvia 1 2 1 1 2 1 0Lithuania 1 8 3 1 1 7 -2 -2 0Netherlands 119 148 125 138 129 147 177 160 184 163 10Norway 1516 1627 1502 1534 1457 1340 1439 1370 1399 1340 303Poland 98 112 71 99 99 101 118 77 99 99 3Portugal 2 2 2 1 4 0Romania 43 38 23 28 30 43 38 23 28 30 1
Russian Fed 919 1245 976 899 1060 919 1245 976 899 1060 7Slovakia 30 7 6 5 5 30 7 6 5 5 1
Slovenia 23 32 30 28 30 27 36 33 31 32 16Spain 83 121 106 103 112 74 123 101 92 88 2Sweden 2858 2861 2753 2959 3018 2653 2693 2631 2807 2865 323Switzerland 116 134 105 106 94 120 138 105 104 74 10UK 502 548 490 537 509 584 654 558 628 575 10Ukraine 18 10 10 18 10 10 0Yugoslavia 13 13 13 13 1
Oceania 1027 1130 1079 1091 1107 700 789 728 797 748 25
Australia 363 430 364 364 345 365 430 364 366 347 19New Zealand 664 700 715 727 762 334 359 364 431 401 106
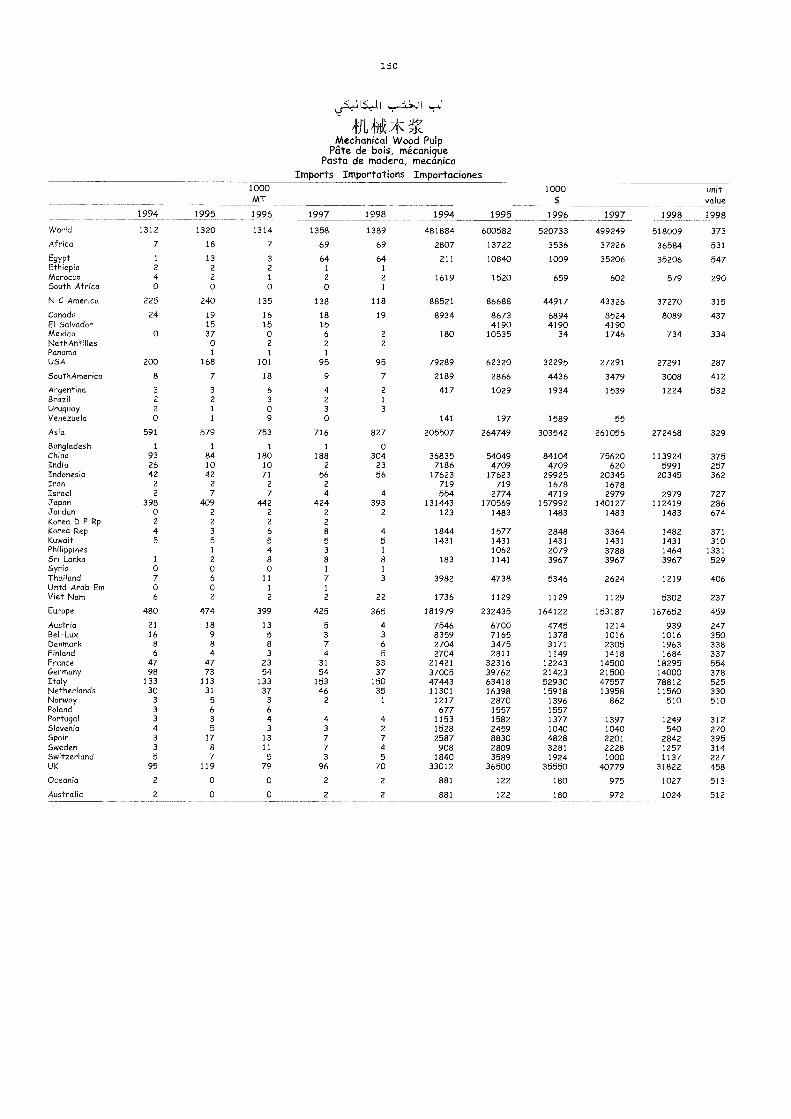
150
Mechanical Wood PulpPate de bois, mécani9ue
Pasta de madera, mecanicaImports Importations Importaciones
1000MT
1000 unitvalue
1994 1995 1996 1997 1998 1994 1995 1996 1997 1998 1998
World 1312 1320 1314 1358 1389 481884 600582 520733 499249 518009 373
Africa 7 18 7 69 69 2807 13722 3536 37226 36584 531
Egypt 1 13 3 64 64 211 10840 1009 35206 35206 547Ethiopia 2 2 2 1 1
Morocco 4 2 1 2 2 1619 1520 659 602 579 290South Africa 0 0 0 0 1
N C America 225 240 135 138 118 88521 86688 44917 43326 37270 315
Canada 24 19 16 18 19 8934 8673 6894 8524 8089 437El Salvador 15 15 15 4190 4190 4190Mexico 0 37 0 6 2 180 10535 34 1746 734 334NethAntilles 0 2 2 2
Panama 1 1 1
USA 200 168 101 95 95 79289 62320 32295 27291 27291 287
SouthAmerica 8 7 18 9 7 2189 2866 4436 3479 3008 412
Argentina 3 3 6 4 2 417 1029 1934 1539 1224 532Brazil 2 2 3 2 1
Uruguay 2 1 0 3 3Venezuela 0 1 9 0 141 197 1589 55
Asia 591 579 753 716 827 205507 264749 303542 261056 272468 329
Bangladesh 1 1 1 1 0China 93 84 180 188 304 36835 54049 84104 75620 113924 375India 26 10 10 2 23 7186 4709 4709 620 5991 257Indonesia 42 42 71 56 56 17623 17623 29925 20345 20345 362Iran 2 2 2 2 719 719 1678 1678Israel 2 7 7 4 4 554 2774 4719 2979 2979 727Japan 398 409 442 424 393 131443 170569 157992 140127 112419 286Jordan 0 2 2 2 2 123 1483 1483 1483 1483 674Korea D P Rp 2 2 2 2
Korea Rep 4 3 6 8 4 1844 1577 2848 3364 1482 371Kuwait 5 5 5 5 5 1431 1431 1431 1431 1431 310Philippines 1 4 3 1 1062 2079 3788 1464 1331Sri Lanka 1 2 8 8 8 183 1141 3967 3967 3967 529Syria 0 0 0 1 1
Thailand 7 6 11 7 3 3982 4738 5346 2624 1219 406Untd Arab Em o o 1 1
Viet Nam 6 2 2 2 22 1736 1129 1129 1129 5302 237
Europe 480 474 399 425 365 181979 232435 164122 153187 167652 459
Austria 21 18 13 5 4 7546 6700 4745 1214 939 247Bel-Lux 16 9 5 3 3 8359 7165 1378 1016 1016 350Denmark 8 8 8 7 6 2704 3475 3171 2305 1963 338Finland 6 4 3 4 5 2704 2811 1149 1418 1684 337France 47 47 23 31 33 21421 32316 12243 14500 18295 554Germany 98 73 54 54 37 37005 39762 21423 21500 14000 378Italy 133 113 133 153 150 47443 63418 52930 47557 78812 525Netherlands 30 31 37 46 35 11301 16398 15918 13958 11560 330Norway 3 5 3 2 1 1217 2870 1396 862 510 510Poland 3 6 6 677 1557 1557Portugal 3 3 4 4 4 1153 1582 1377 1397 1249 312Slovenia 4 5 3 3 2 1528 2459 1040 1040 540 270Spain 3 17 13 7 7 2587 8830 4828 2201 2842 395Sweden 3 8 11 7 4 908 2809 3281 2228 1257 314Switzerland 5 7 5 3 5 1840 3589 1924 1000 1137 227UK 95 119 79 96 70 33012 36500 35550 40779 31822 458
Oceania 2 0 0 2 2 881 122 180 975 1027 513
Australia 2 0 0 2 2 881 122 180 972 1024 512
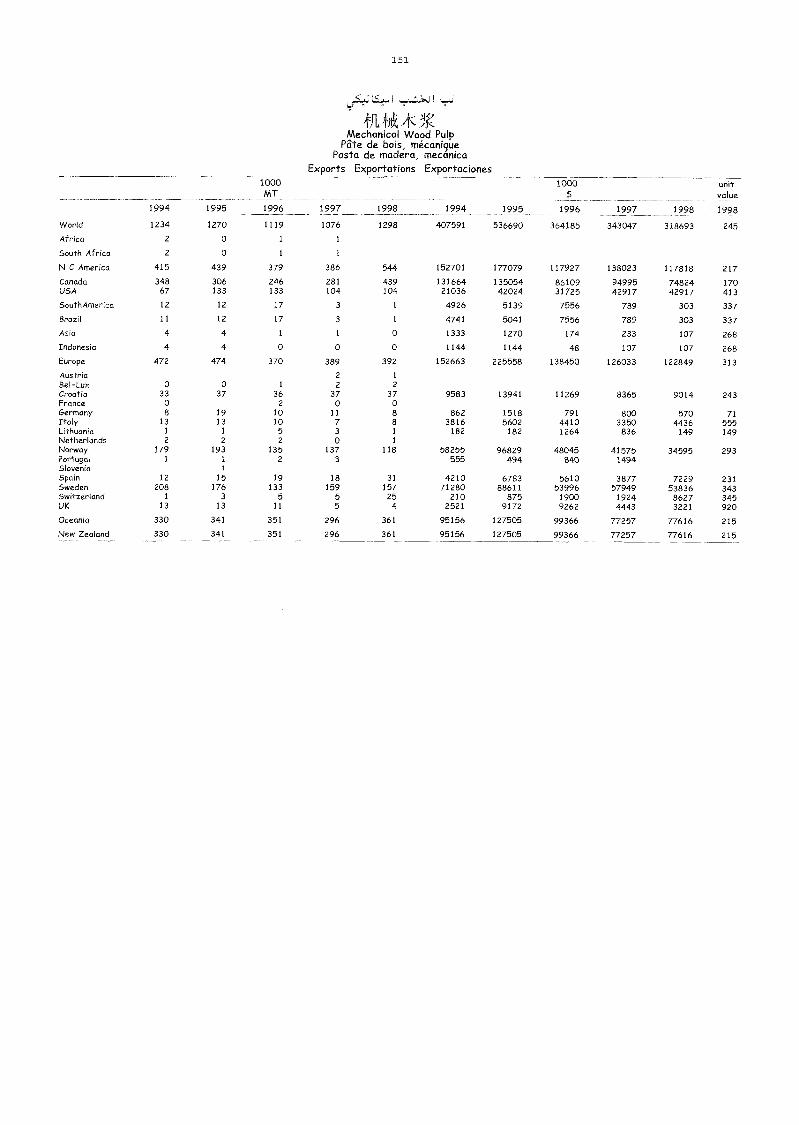
1 5 1
;MA .)1Mechanical Wood Pulp
Pate de bois, mécaniquePasta de madera, mecanica
Exports Exportations Exportaciones
1994 1995
1000MT
1996 1997 1998 1994 1995
1000$
1996 1997 1998
unitvalue
1998
World 1234 1270 1119 1076 1298 407591 536690 364185 343047 318693 245
Africa 2 0 1 1
South Africa 2 0 1 1
N C America 415 439 379 386 544 152701 177079 117927 138023 117818 217
Canada 348 306 246 281 439 131664 135054 86109 94995 74824 170USA 67 133 133 104 104 21036 42024 31725 42917 42917 413
SouthAmerica 12 12 17 3 1 4926 5139 7556 789 303 337
Brazil 11 12 17 3 1 4741 5041 7556 789 303 337
Asia 4 4 1 1 0 1333 1270 174 233 107 268
Indonesia 4 4 0 0 0 1144 1144 48 107 107 268
Europe 472 474 370 389 392 152663 225558 138450 126033 122849 313
Austria 2 1
Bel-Lux 0 0 1 2 2
Croatia 33 37 36 37 37 9583 13941 11269 8365 9014 243France 0 2 0 0Germany 8 19 10 11 8 862 1518 791 800 570 71Italy 13 13 10 7 8 3816 5602 4410 3350 4436 555Lithuania 1 1 5 3 1 182 182 1264 836 149 149Netherlands 2 2 2 0 1
Norway 179 193 135 137 118 58255 96829 48045 41575 34595 293Portugal 1 1 2 3 555 494 840 1494Slovenia 1
Spain 12 15 19 18 31 4210 6783 5610 3877 7229 231Sweden 208 176 133 159 157 71280 88611 53996 57949 53836 343Switzerland 1 3 5 5 25 210 875 1900 1924 8627 345UK 13 13 11 5 4 2521 9172 9262 4443 3221 920Oceania 330 341 351 296 361 95156 127505 99366 77257 77616 215
New Zealand 330 341 351 296 361 95156 127505 99366 77257 77616 215
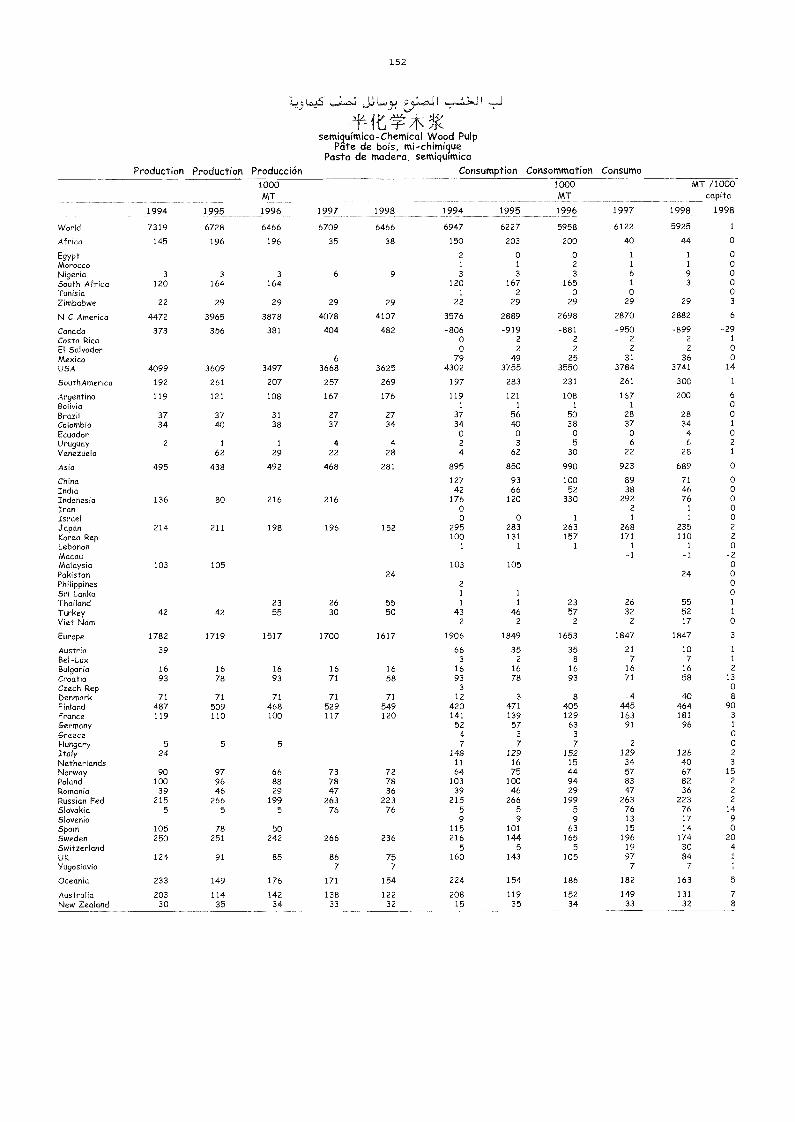
152
12- it *Y-semiquímica-Chemical Wood Pulp
Pote de bois, mi-chimiquePasta de madera, semiquimica
Production Production Producción Consumption Consommation Consumo
1994 1995
1000MT
1996 1997 1998 1994 1995
1000MT
1996 1997
MT /1000
1998 1998
World 7319 6728 6466 6709 6466 6947 6227 5958 6122 5925 1
Africa 145 196 196 35 38 150 203 200 40 44 0
Egypt 2 0 0 1 1 oMorocco 1 1 2 1 1 0Nigeria 3 3 3 6 9 3 3 3 6 9 0South Africa 120 164 164 120 167 165 1 3 0Tunisia 1 2 0 0 0Zimbabwe 22 29 29 29 29 22 29 29 29 29 3
N C America 4472 3965 3878 4078 4107 3576 2889 2698 2870 2882 6
Canada 373 356 381 404 482 -806 -919 -881 -950 -899 -29Costa Rica 0 2 2 2 2 1
El Salvador 0 2 2 2 2 0Mexico 6 79 49 25 31 36 0
USA 4099 3609 3497 3668 3625 4302 3755 3550 3784 3741 14
SouthAmerica 192 261 207 257 269 197 283 231 261 300 1
Argentina 119 121 108 167 176 119 121 108 167 200 6
Bolivia 1 1 1 1 0Brazil 37 37 31 27 27 37 56 50 28 28 0
Colombia 34 40 38 37 34 34 40 38 37 34 1
Ecuador 0 0 0 0 4 0Uruguay 2 1 1 4 4 2 3 5 6 6 2
Venezuela 62 29 22 28 4 62 30 22 28 1
Asia 495 438 492 468 281 895 850 990 923 689 0
China 127 93 100 89 71 0
India 42 66 52 38 46 0
Indonesia 136 80 216 216 176 120 330 292 76 0
Iran 0 2 1 0
Israel 0 0 1 1 1 o
Japan 214 211 198 196 152 295 283 263 268 235 2
Korea Rep 100 131 157 171 110 2
Lebanon 1 1 1 1 1 0Macau -1 -1 -2Malaysia 103 105 103 105 0Pakistan 24 24 0Philippines 2 0
Sri Lanka 1 1 0Thailand 23 26 55 1 1 23 26 55 1
Turkey 42 42 55 30 50 43 46 57 32 52 1
Viet Nam 2 2 2 2 17 0
Europe 1782 1719 1517 1700 1617 1906 1849 1653 1847 1847 3
Austria 39 66 35 35 21 10 1
Bel-Lux 3 2 8 7 7 1
Bulgaria 16 16 16 16 16 16 16 16 16 16 2
Croatia 93 78 93 71 58 93 78 93 71 58 13
Czech Rep 3 0
Denmark 71 71 71 71 71 12 3 8 -4 40 8
Finland 487 509 468 529 549 420 471 405 445 464 90France 119 110 100 117 120 141 139 129 163 181 3
Germany 52 57 63 91 96 1
Greece 4 3 3 0Hungary 5 5 5 7 7 7 2 0Italy 24 148 129 152 129 126 2
Netherlands 11 16 15 34 40 3
Norway 90 97 66 73 72 64 75 44 57 67 15Poland 100 96 88 78 78 103 100 94 83 82 2
Romania 39 46 29 47 36 39 46 29 47 36 2
Russian Fed 215 266 199 263 223 215 266 199 263 223 2
Slovakia 5 5 5 76 76 5 5 5 76 76 14
Slovenia 9 9 9 13 17 9
Spain 105 78 50 115 101 63 15 14 0
Sweden 250 251 242 266 236 216 144 165 196 174 20
Switzerland 5 5 5 19 30 4
UK 124 91 85 86 75 160 143 105 97 84 1
Yugoslavia 7 7 7 7 1
Oceania 233 149 176 171 154 224 154 186 182 163 5
Australia 203 114 142 138 122 208 119 152 149 131 7New Zealand 30 35 34 33 32 15 35 34 33 32 8
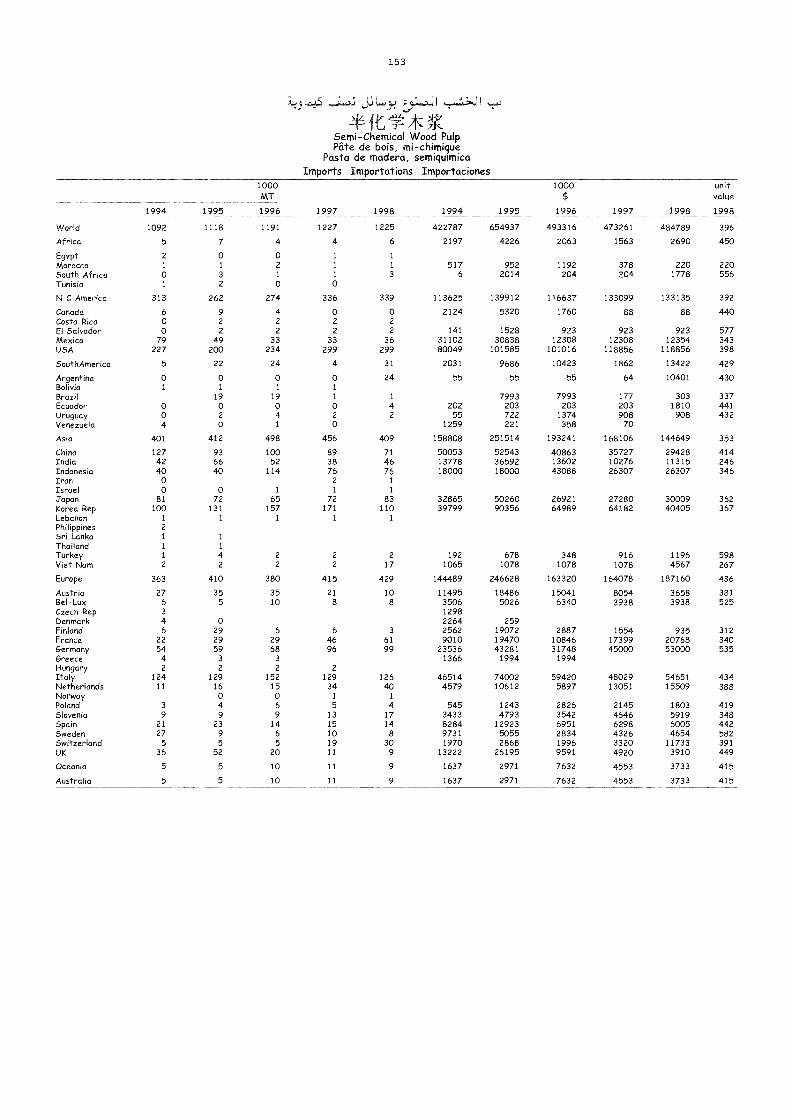
153
I
Semi-Chemical Wood PulpPate de bois, mi-chimique
Pasta de madera, semiquimicaImports Importations Importaciones
1994 1995
1000MT
1996 1997 1998 1994 1995
1000$
1996 1997 1998
unitvalue
1998
World 1092 1118 1191 1227 1225 422787 654937 493316 473261 484789 396
Africa 5 7 4 4 6 2197 4226 2063 1563 2690 450
Egypt 2 0 0 1 1
Morocco 1 1 2 1 1 517 952 1192 378 220 220South Afr ca o 3 1 1 3 6 2014 204 204 1778 556Tunisia 1 2 0 0
N C America 313 262 274 336 339 113625 139912 116637 133099 133135 392
Canada 6 9 4 o o 2124 5320 1760 88 88 440Costa Rica 0 2 2 2 2
El Salvador 0 2 2 2 2 141 1528 923 923 923 577Mexico 79 49 33 33 36 31102 30838 12308 12308 12354 343USA 227 200 234 299 299 80049 101585 101016 118856 118856 398
SouthAmerica 5 22 24 4 31 2031 9686 10423 1862 13422 429
Argentina 0 0 0 0 24 55 55 55 64 10401 430Bolivia 1 1 1 1
Brazil 19 19 1 1 7993 7993 177 303 337Ecuador 0 0 0 0 4 202 203 203 203 1810 441Uruguay 0 2 4 2 2 55 722 1374 908 908 432Venezuela 4 0 1 0 1259 221 358 70
Asia 401 412 498 456 409 158808 251514 193241 168106 144649 353
China 127 93 100 89 71 50053 52543 40863 35727 29428 414India 42 66 52 38 46 13778 36592 13602 10276 11315 246Indonesia 40 40 114 76 76 18000 18000 43088 26307 26307 346Iran 0 2 IIsrael 0 0 1 1 1
Japan 81 72 65 72 83 32865 50260 26921 27280 30009 362Korea Rep 100 131 157 171 110 39799 90356 64989 64182 40405 367Lebanon 1 1 1 1 1
Philippines 2
Sri Lanka 1 1
Thailand 1 1
Turkey 1 4 2 2 2 192 678 348 916 1196 598Viet Nam 2 2 2 2 17 1065 1078 1078 1078 4567 267
Europe 363 410 380 415 429 144489 246628 163320 164078 187160 436
Austria 27 35 35 21 10 11495 18486 15041 8054 3658 381Bel-Lux 6 5 10 8 8 3506 5026 6340 3938 3938 525Czech Rep 3 1298Denmark 4 0 2264 259Finland 6 29 6 6 3 2562 19072 2887 1554 935 312France 22 29 29 46 61 9010 19470 10846 17399 20768 340Germany 54 59 68 96 99 23536 43281 31748 45000 53000 535Greece 4 3 3 1366 1994 1994Hungary 2 2 2 2
Italy 124 129 152 129 126 46514 74002 59420 48029 54651 434Netherlands 11 16 15 34 40 4579 10612 5897 13051 15509 388Norway 0 0 1 1
Poland 3 4 6 5 4 545 1243 2826 2145 1803 419Slovenia 9 9 9 13 17 3433 4793 3542 4646 5919 348Spain 21 23 14 15 14 8284 12923 6951 6298 6005 442Sweden 27 9 6 10 8 9731 5055 2834 4326 4654 582Switzerland 5 5 5 19 30 1970 2868 1996 3320 11733 391UK 36 52 20 II 9 13222 26195 9591 4920 3910 449
Oceania 5 5 10 11 9 1637 2971 7632 4553 3733 415
Australia 5 5 10 11 9 1637 2971 7632 4553 3733 415
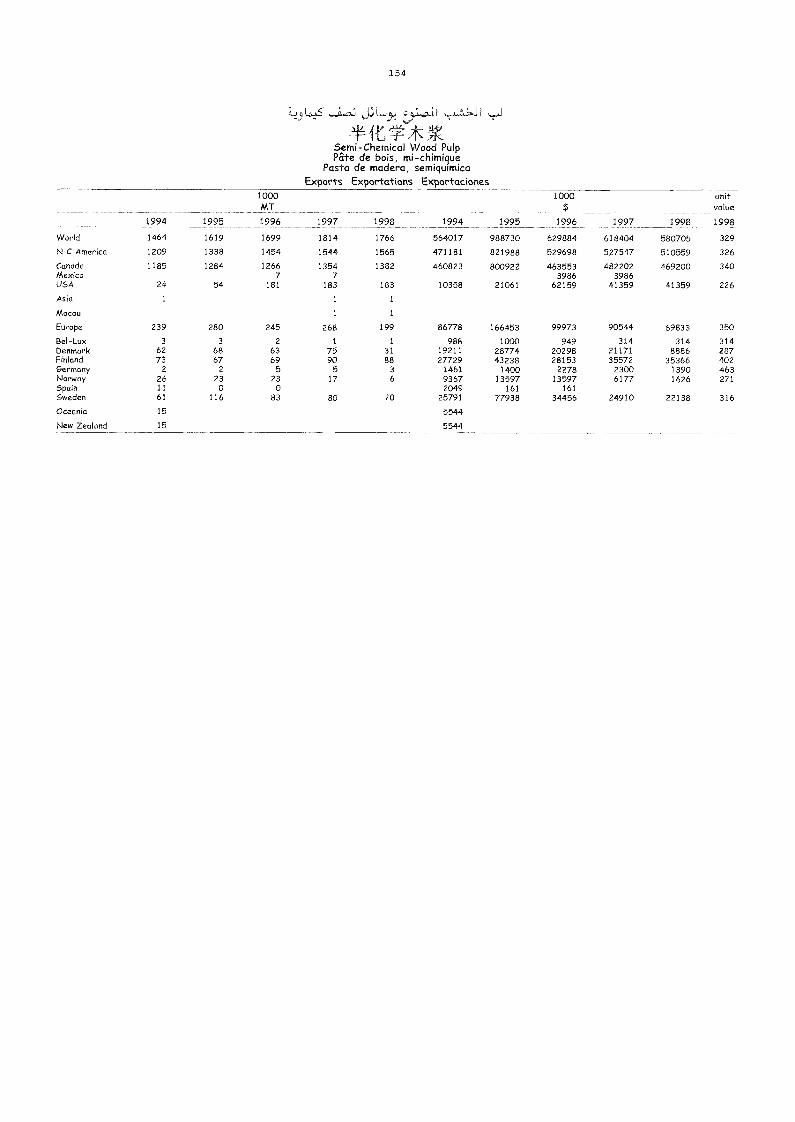
154
Semi-Chemical Wood PulpPate de bois, mi-chimique
Pasta de madera, semiquimicaExports Exportations Exportaciones
1994 1995
1000MT
1996 1997 1998 1994 1995
1000$
1996 1997 1998
unitvalue
1998
World 1464 1619 1699 1814 1766 564017 988730 629884 618404 580705 329
N C America 1209 1338 1454 1544 1565 471181 821988 529698 527547 510559 326
Canada 1185 1284 1266 1354 1382 460823 800922 463553 482202 469200 340Mexico 7 7 3986 3986USA 24 54 181 183 183 10358 21061 62159 41359 41359 226
Asia 1 1 1
Macau 1 1
Europe 239 280 245 268 199 86778 166453 99973 90544 69833 350
Bel-Lux 3 3 2 1 1 988 1000 949 314 314 314Denmark 62 68 63 75 31 19211 28774 20298 21171 8886 287Finland 73 67 69 90 88 27729 43238 28153 35572 35366 402Germany 2 2 5 5 3 1461 1400 2278 2300 1390 463Norway 26 23 23 17 6 9367 13597 13597 6177 1626 271Spain 11 0 o 2049 161 161Sweden 61 116 83 80 70 25791 77938 34456 24910 22138 316
Oceania 15 5544
New Zealand 15 5544
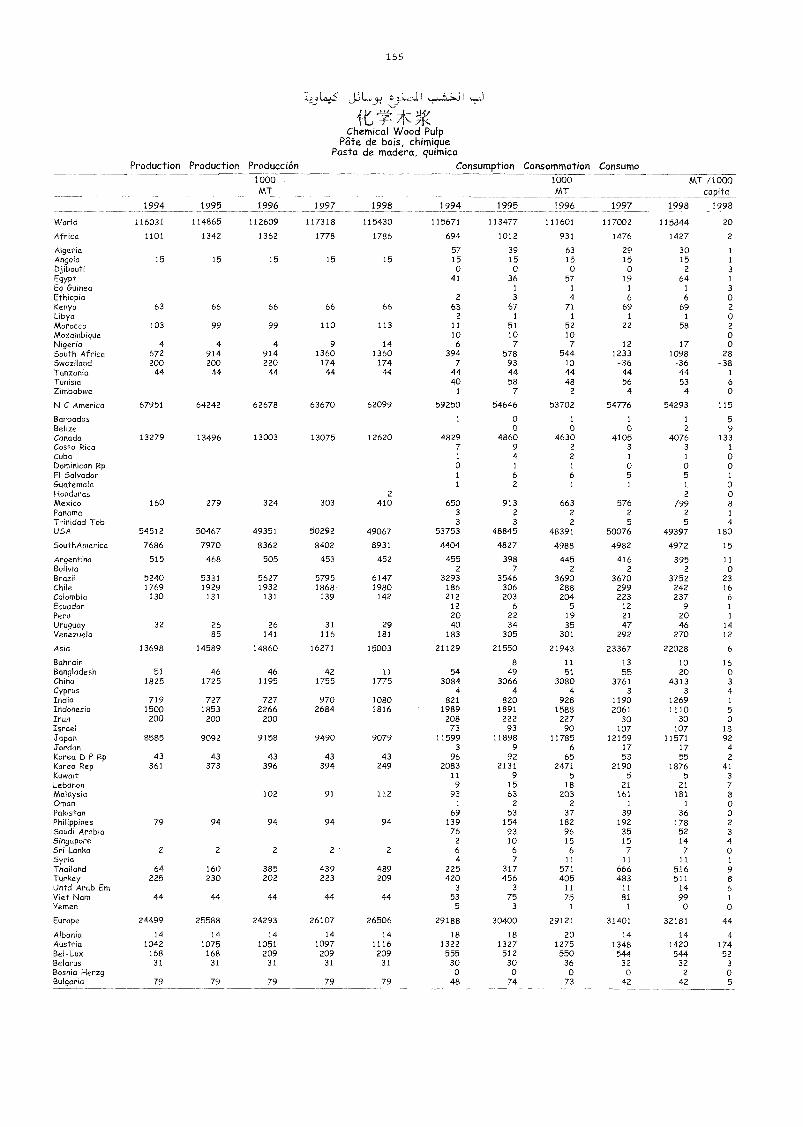
155
y4KChemical Wood Pulp
Pate de 'Dols, chimiquePasta de madera, quimica
Production Production Producción Consumption Consommation Consumo
1994 1995
1000MT
1996 1997 1998 1994 1995
1000MT
1996 1997
MT /1000capita
1998 1998
World 116031 114865 112609 117318 115430 115671 113477 111601 117002 115844 20
Africa 1101 1342 1362 1778 1786 694 1012 931 1476 1427 2
Algeria 57 39 63 29 30 1
Angola 15 15 15 15 15 15 15 15 15 15 1
Djibouti 0 0 0 0 2 3
Egypt 41 36 57 19 64 1
Eq Guinea 1 1 1 1 3
Ethiopia 2 3 4 6 6 0Kenya 63 66 66 66 66 63 67 71 69 69 2Libya 2 1 1 1 1 0Morocco 103 99 99 110 113 11 51 52 22 58 2
Mozambique 10 10 10 0Nigeria 4 4 4 9 14 6 7 7 12 17 0South Africa 672 914 914 1360 1360 394 578 544 1233 1098 28Swaziland 200 200 220 174 174 7 93 10 -36 -36 -38Tanzania 44 44 44 44 44 44 44 44 44 44 1
Tunisia 40 58 48 56 53 6
Zimbabwe 1 7 2 4 4 o
N C America 67951 64242 62678 63670 62099 59250 54646 53702 54776 54293 115
Barbados 1 0 1 1 1 5Belize 0 o o 2 9Canada 13279 13496 13003 13075 12620 4829 4860 4630 4105 4076 133Costa Rica 7 9 2 3 3 1
Cuba 1 4 2 1 1 oDominican Rp 0 1 1 0 0 0El Salvador 1 6 6 5 5 1
Guatemala 1 2 1 1 1 0Honduras 2 2 0Mexico 160 279 324 303 410 650 913 663 576 799 8Panama 3 2 2 2 2 1
Trinidad Tob 3 3 2 5 5 4USA 54512 50467 49351 50292 49067 53753 48845 48391 50076 49397 180
5outhAmerica 7686 7970 8362 8402 8931 4404 4827 4988 4982 4972 15
Argentina 515 468 505 453 452 455 398 445 416 395 11Bolivia 2 7 2 2 2 0Brazil 5240 5331 5627 5795 6147 3293 3546 3690 3670 3752 23Chile 1769 1929 1932 1868. 1980 186 306 288 299 242 16Colombia 130 131 131 139 142 212 203 204 223 237 6Ecuador 12 6 5 12 9 1
Peru 20 22 19 21 20 1
Uruguay 32 26 26 31 29 40 34 35 47 46 14Venezuela 85 141 116 181 183 305 301 292 270 12
Asia 13698 14589 14860 16271 15003 21129 21550 21943 23367 22028 6
Bahrain 8 11 13 10 16Bangladesh 51 46 46 42 11 54 49 51 55 20 0China 1825 1725 1195 1755 1775 3084 3066 3080 3761 4313 3
Cyprus 4 4 4 3 3 4India 719 727 727 970 1080 821 820 928 1190 1269 1
Indonesia 1500 1853 2266 2684 1816 1989 1891 1588 2061 1110 5Iran 200 200 200 208 222 227 30 30 0Israel 73 93 90 107 107 18Japan 8585 9092 9158 9490 9079 11599 11898 11785 12159 11571 92Jordon 3 9 6 17 17 4Korea D P Rp 43 43 43 43 43 96 92 65 53 55 2
Korea Rep 361 373 396 394 249 2083 2131 2471 2190 1876 41Kuwait 11 9 5 5 5 3
Lebanon 9 15 18 21 21 7Malaysia 102 91 112 93 63 203 161 181 8Oman 1 2 2 1 1 0Pakistan 69 53 37 39 36 0Philippines 79 94 94 94 94 139 154 182 192 178 2
Saudi Arabia 76 93 96 35 52 3
Singapore 2 10 15 15 14 4Sri Lanka 2 2 2 2 2 6 6 6 7 7 0Syria 4 7 11 11 11 1
Thailand 64 160 385 439 489 225 317 571 666 516 9Turkey 225 230 202 223 209 420 456 405 483 511 8Untd Arab Em 3 3 11 11 14 6Viet Nam 44 44 44 44 44 53 75 75 81 99 1
Yemen 5 3 1 1 0 0
Europe 24499 25588 24293 26107 26506 29188 30400 29121 31401 32181 44
Albania 14 14 14 14 14 18 18 20 14 14 4Austria 1042 1075 1051 1097 1116 1322 1327 1275 1348 1420 174Bel-Lux 168 168 209 209 209 555 512 550 544 54-4 52Belarus 31 31 31 31 31 30 30 36 32 32 3
Bosnia Herzg 0 0 0 0 2 0Bulgaria 79 79 79 79 79 48 74 73 42 42 5
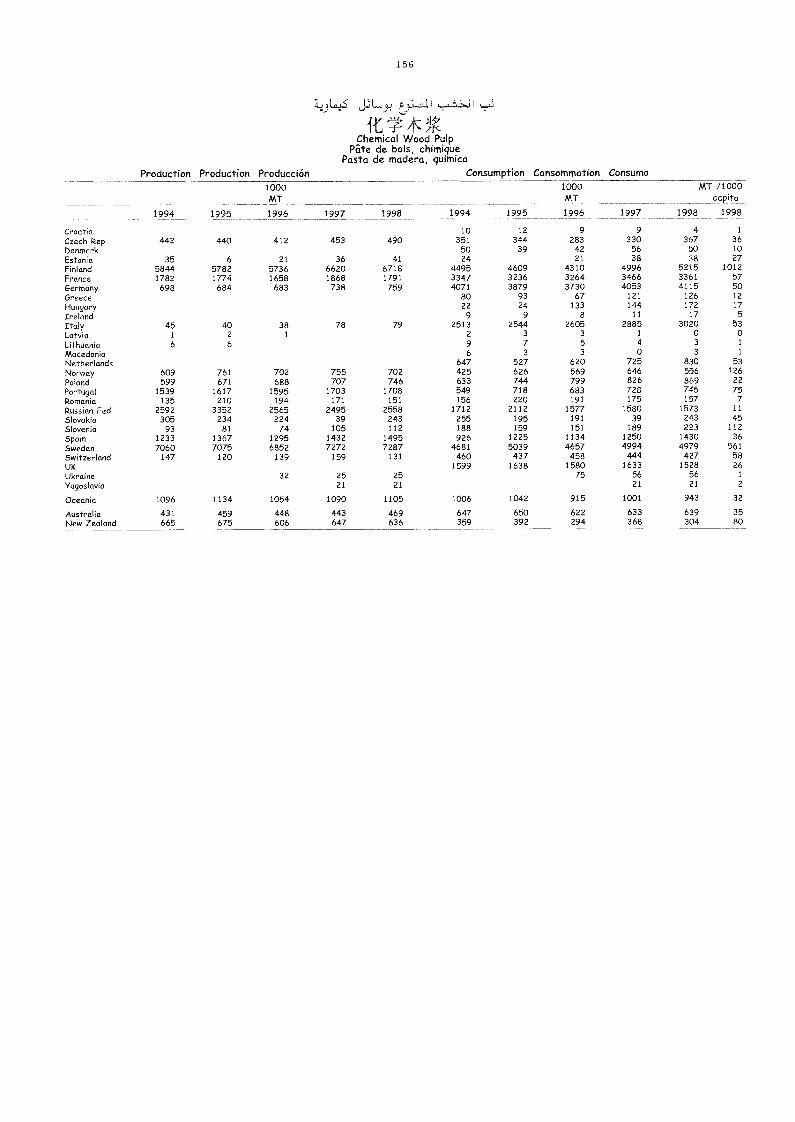
1 5 6
jL 0.2.5jLJilJI
`1: *Chemical Wood Pulp
Pate de bois, chimiquePasta de madera, quimica
Production Production Producción Consumption Consommation Consumo
1994 1995
1000MT
1996 1997 1998 1994 1995
1000MT
1996 1997
MT /1000capita
1998 1998
Croatia 10 12 9 9 4 1
Czech Rep 442 440 412 453 490 351 344 283 330 367 36
Denmark 50 39 42 56 50 10
Estonia 35 6 21 36 41 24 21 38 38 27Finland 5844 5782 5736 6620 6718 4495 4609 4310 4996 5215 1012France 1782 1774 1658 1868 1791 3347 3236 3264 3466 3361 57Germany 698 684 683 738 759 4071 3879 3730 4053 4115 50Greece 80 93 67 121 126 12
Hungary 22 24 133 144 172 17
Ireland 9 9 8 11 17 5Italy 45 40 38 78 79 2513 2544 2605 2885 3020 53Latvia 1 2 1 2 3 3 1 0 0
Lithuania 6 6 9 7 5 4 3 1
Macedonia 6 3 3 0 3 1
Netherlands 647 527 620 725 830 53Norway 609 761 702 755 702 425 626 569 646 556 126Poland 599 671 688 707 746 633 744 799 826 869 22
Portugal 1539 1617 1595 1703 1708 549 718 683 728 745 75Romania 135 210 194 171 151 156 220 191 175 157 7
Russian Fed 2592 3352 2565 2495 2558 1712 2112 1577 1580 1573 11
Slovakia 305 234 224 39 243 255 195 191 39 243 45Slovenia 93 81 74 105 112 188 159 151 189 223 112
Spain 1233 1367 1295 1432 1495 926 1225 1134 1250 1430 36Sweden 7060 7075 6852 7272 7287 4681 5039 4657 4994 4979 561
Switzerland 147 120 139 159 131 460 437 458 444 427 58UK 1599 1638 1580 1633 1528 26Ukraine 32 25 25 75 56 56 1
Yugoslavia 21 21 21 21 2
Oceania 1096 1134 1054 1090 1105 1006 1042 915 1001 943 32
Australia 431 459 448 443 469 647 650 622 633 639 35
New Zealand 665 675 606 647 636 359 392 294 368 304 80
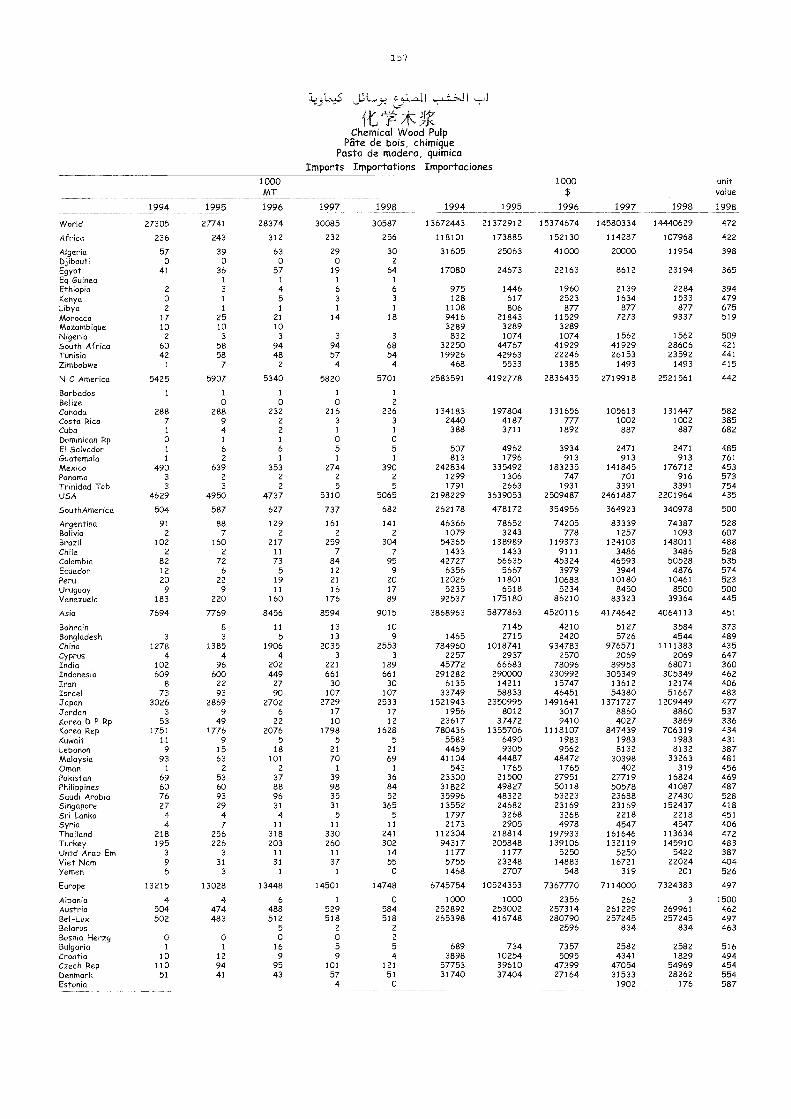
157
I
?44.- *Chemical Wood Pulp
Pate de bois, chimiquePasta de madera, quimica
Imports Importations Importaciones
1994 1995
1000MT
1996 1997 1998 1994 1995
1000$
1996 1997 1998
unitvalue
1998
World 27305 27741 28374 30085 30587 13672443 21372912 15374674 14580334 14440629 472
Africa 236 243 312 232 256 118101 173885 152130 114287 107968 422
Algeria 57 39 63 29 30 31605 25063 41000 20000 11954 398Djibouti 0 0 0 0 2
Egypt 41 36 57 19 64 17080 24673 22163 8612 23194 365Eq Guinea 1 1 1 1
Ethiopia 2 3 4 6 6 975 1446 1960 2139 2284 394Kenya 0 1 5 3 3 128 617 2523 1634 1533 479Libya 2 1 1 1 1 1108 806 877 877 877 675Morocco 17 25 21 14 18 9416 21843 11529 7273 9337 519Mozambique 10 10 10 3289 3289 3289Nigeria 2 3 3 3 3 832 1074 1074 1562 1562 509South Africa 60 58 94 94 68 32250 44767 41929 41929 28606 421Tunisia 42 58 48 57 54 19926 42963 22246 26153 23592 441Zimbabwe 1 7 2 4 4 468 5533 1385 1493 1493 415
N C America 5425 5907 5340 5820 5701 2583591 4192778 2836435 2719918 2521561 442
Barbados 1 1 1 1 1
Belize 0 0 o 2
Canada 288 288 232 216 226 134183 197804 131656 105613 131447 582Costa Rica 7 9 2 3 3 2440 4187 (fI 1002 1002 385Cuba I 4 2 1 1 388 3711 1892 887 887 682Dominican Rp 0 1 1 0 0El Salvador 1 6 6 5 5 507 4962 3934 2471 2471 485Guatemala 1 2 1 1 1 813 1796 913 913 913 761Mexico 490 639 353 274 390 242834 335492 183235 141845 176712 453Panama 3 2 2 2 2 1299 1306 747 701 916 573Trinidad Tob 3 3 2 5 5 1791 2663 1931 3391 3391 754USA 4629 4950 4737 5310 5065 2198229 3639053 2509487 2461487 2201964 435
SouthAmer ca 504 587 627 737 682 262178 478172 354956 364923 340978 500
Argentina 91 88 129 161 141 46366 78652 74205 83339 74387 528Bolivia 2 7 2 2 2 1079 3243 T78 1257 1093 607Brazil 102 160 217 259 304 54365 138989 119373 124103 148011 488Chile 2 2 11 7 7 1433 1433 9111 3486 3486 528Colombia 82 72 73 84 95 42727 56635 45324 46593 50528 535Ecuador 12 6 5 12 9 6356 5667 3979 3944 4876 574Peru 20 22 19 21 20 12026 11801 10688 10180 10461 523Uruguay 9 9 11 16 17 5235 6518 5234 8450 8500 500Venezuela 183 220 160 176 89 92537 175180 86210 83323 39364 445
Asia 7694 7769 8456 8594 9015 3868963 5877863 4520116 4174642 4064113 451
Bahrain 8 11 13 10 7145 4210 5127 3584 373Bangladesh 3 3 5 13 9 1465 2715 2420 5726 4544 489China 1278 1385 1906 2035 2553 784960 1018741 934783 976571 1111383 435Cyprus 4 4 4 3 3 2257 2937 2570 2069 2069 647India 102 96 202 221 189 45772 66683 78096 89953 68071 360Indonesia 609 600 449 661 661 291282 290000 230992 305349 305349 462Iran 8 22 27 30 30 6135 14211 15747 13612 12174 406Israel 73 93 90 107 107 33749 58833 46451 54380 51667 483Japan 3026 2869 2702 2729 2533 1521943 2350995 1491641 1371727 1209449 477Jordan 3 9 6 17 17 1956 8012 3017 8860 8860 537Korea D P Rp 53 49 22 10 12 23617 37472 9410 4027 3869 336Korea Rep 1751 1776 2076 1798 1628 780436 1355706 1118107 847439 706319 434Kuwait 11 9 5 5 5 5583 6490 1983 1983 1983 431Lebanon 9 15 18 21 21 4469 9305 9562 8132 8132 387Malaysia 93 63 101 70 69 41104 44487 48472 30398 33263 481Oman 1 2 2 1 1 543 1765 1765 402 319 456Pakistan 69 53 37 39 36 23300 21500 27951 27719 16824 469Philippines 60 60 88 98 84 31822 49827 50118 50578 41087 487Saudi Arabia 76 93 96 35 52 35996 48322 53223 23688 27430 528Singapore 27 29 31 31 365 13552 24682 23169 23169 152437 418Sri Lanka 4 4 4 5 5 1797 3268 3268 2218 2218 451Syria 4 7 11 11 11 2173 2905 4978 4547 4547 406Thailand 218 256 318 330 241 112304 218814 197933 161646 113634 472Turkey 195 226 203 260 302 94317 205848 139106 132119 145910 483Untd Arab Em 3 3 11 11 14 1177 1177 5250 5250 5422 387Viet Nam 9 31 31 37 55 5755 23248 14883 16721 22024 404Yemen 5 3 1 1 0 1468 2707 548 319 201 526
Europe 13215 13028 13448 14501 14748 6745754 10524353 7367770 7114000 7324383 497
Albania 4 4 6 1 0 1000 1000 2356 262 3 1500Austria 504 474 488 529 584 252892 253002 257314 261229 269961 462Bel -Lux 502 483 512 518 518 265398 416748 280790 257245 257245 497Belarus 5 2 2 2596 834 834 463Bosnia Herzg 0 0 0 0 2
Bulgaria 1 1 16 5 5 689 734 7357 2582 2582 516Croatia 10 12 9 9 4 3898 10254 5095 4341 1829 494Czech Rep 110 94 95 101 121 57753 39610 47399 47054 54969 454Denmark 51 41 43 57 51 31740 37404 27164 31533 28262 554Estonia 4 0 1902 176 587
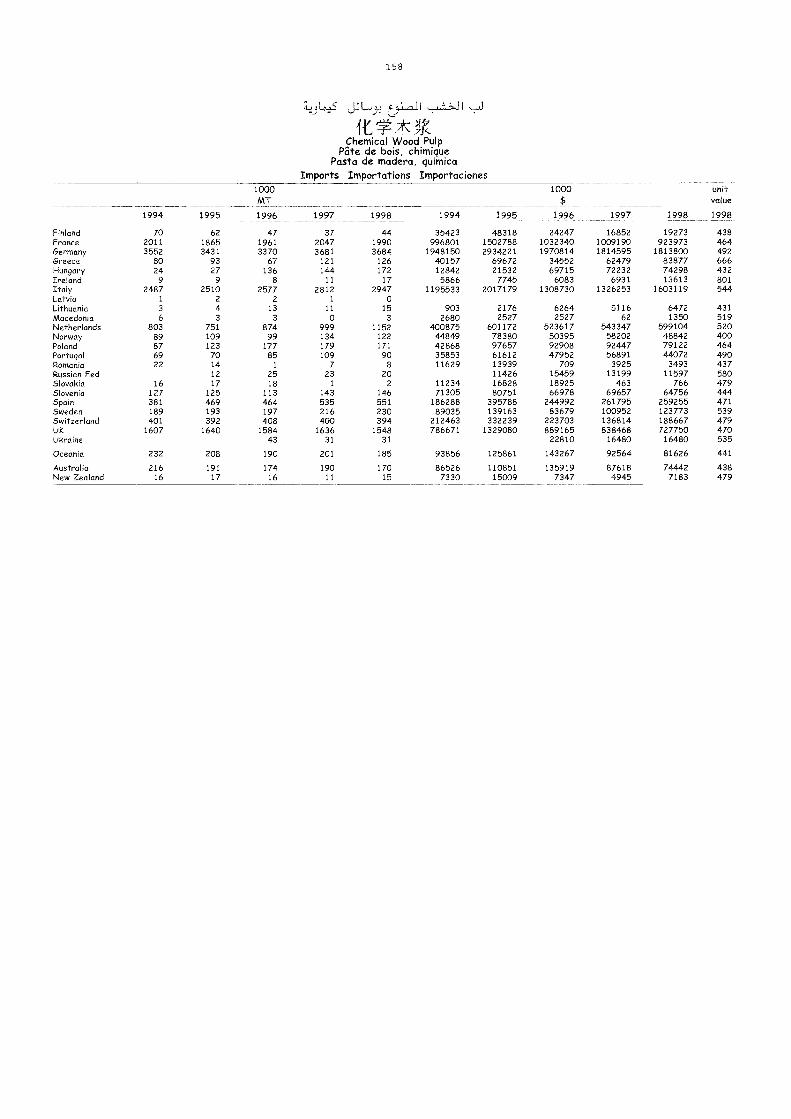
158
LLYYPL-JChemical Wood Pulp
Pate de bois, chimiquePasta de madera, quimica
Imports Importations Importaciones
994 1995
1000MT
1996 1997 1998 1994 1995
1000$
1996 1997 1998
unitvalue
1998
Finland 70 62 47 37 44 35423 48318 24247 16852 19273 438France 2011 1865 1961 2047 1990 996801 1502788 1032340 1009190 923973 464Germany 3552 3431 3370 3681 3684 1948150 2934221 1970814 1814595 1813800 492Greece 80 93 67 121 126 40157 69672 34552 62479 83877 666Hungary 24 27 136 144 172 12842 21532 69715 72232 74298 432Ireland 9 9 8 11 17 5866 7745 6083 6931 13613 801Italy 2487 2510 2577 2812 2947 1195533 2017179 1308730 1326253 1603119 544Latvia 1 2 2 1 oLithuania 3 4 13 11 15 903 2176 6264 5116 6472 431Macedonia 6 3 3 o 3 2680 2527 2527 62 1350 519Netherlands 803 751 874 999 1152 400875 601172 523617 543347 599104 520Norway 89 109 99 134 122 44849 78380 50395 58202 48842 400Poland 87 123 177 179 171 42868 97657 92908 92447 79122 464Portugal 69 70 85 109 90 35853 61612 47952 56891 44072 490Romania 22 14 1 7 8 11629 13939 709 3925 3493 437Russian Fed 12 25 23 20 11426 15459 13199 11597 580Slovakia 16 17 18 1 2 11234 16828 18925 463 766 479Slovenia 127 125 113 143 146 71305 80751 66978 69657 64756 444Spain 381 469 464 535 551 186288 395788 244992 261795 259255 471Sweden 189 193 197 216 230 89035 139163 83679 100952 123773 539Switzerland 401 392 408 400 394 212463 332239 223703 136814 188667 479UK 1607 1640 1584 1636 1548 786671 1329080 889165 838468 727750 470Ukraine 43 31 31 22810 16480 16480 535
Oceania 232 208 190 201 185 93856 125861 143267 92564 81626 441
Australia 216 191 174 190 170 86526 110851 135919 87618 74442 438New Zealand 16 17 16 11 15 7330 15009 7347 4945 7183 479
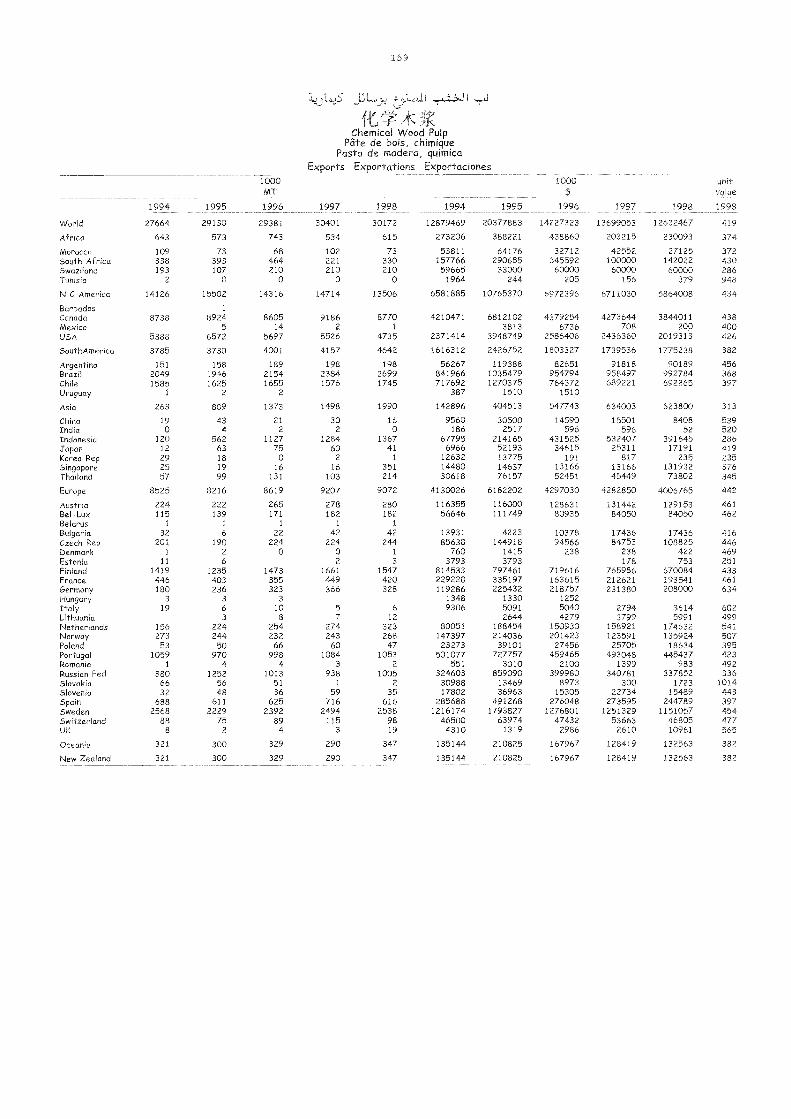
159
i
itChemical VVood Pulp
Pâte de bois, chimiquePasta de madera, quimica
Exports Exportations Exportaciones
1994 1995
000MT
1996 1997 1998 1994 1995
1000$
1996 1997 1998
unitvalue
1998
VVorld 27664 29130 29381 30401 30172 12879469 20377883 14227323 13699053 12632467 419
Africa 643 573 743 534 615 273206 388221 438860 203215 230093 374
Morocco 109 73 68 102 73 53811 64176 32712 42552 27125 372South Africa 338 393 464 221 330 157766 290685 345592 100000 142022 430Swazdand 193 107 210 210 210 59665 33000 60000 60000 60000 286Tunisia 2 0 0 0 0 1964 244 205 156 379 948
N C America 14126 15502 14316 14714 13506 6581885 10765370 6972396 6711030 5864008 434
Barbados 1
Canada 8738 8924 8605 9186 8770 4210471 6812102 4379254 4273644 3844011 438Mexico 5 14 2 1 3813 6736 708 200 400USA 5388 6572 5697 5526 4735 2371414 3948749 2586406 2436360 2019313 426
SouthAmerica 3785 3730 4001 4157 4642 1616312 2426752 1803327 1739536 1775238 382
Argentina 151 158 189 198 198 56267 119388 82651 91818 90189 456Brazil 2049 1946 2154 2384 2699 841966 1035479 954794 958497 992784 368Chile 1585 1625 1655 1576 1745 717692 1270375 764372 689221 692265 397Uruguay 1 2 2 387 1510 1510
Asia 263 809 1373 1498 1990 142896 404513 547743 634003 623800 313
Chino 19 43 21 30 16 9560 30500 14590 15501 8408 539India 0 4 2 2 0 186 2517 596 596 52 520Indonesia 120 562 1127 1284 1367 67795 214165 431525 532407 391645 286Japan 12 63 75 60 41 6966 52193 34615 25311 17191 419Korea Rep 29 18 0 2 1 12632 13775 191 817 235 235Singapore 25 19 16 16 351 14480 14637 13166 13166 131932 376Thadand 57 99 131 103 214 30618 76157 52451 45449 73802 345
Europe 8525 8216 8619 9207 9072 4130026 6182202 4297030 4282850 4006765 442
Austria 224 222 265 278 280 116355 116000 128631 131442 129153 461Bel-Lux 115 139 171 182 182 56646 111749 80935 84050 84050 462Belarus 1 1 1 1 1
Bulgaria 32 6 22 42 42 13931 4223 10378 17436 17436 416Czech Rep 201 190 224 224 244 85638 144918 94566 84753 108825 446Denmark 1 2 0 0 1 760 1415 238 238 422 469Estonia 11 6 2 3 3793 3793 178 753 251Finland 1419 1235 1473 1661 1547 814533 797461 719616 765986 670084 433France 446 403 355 449 420 229220 335197 163615 212621 193541 461Germany 180 236 323 366 328 119286 225432 218757 231380 208000 634Hungary 3 3 3 1348 1330 1252Italy 19 6 10 5 6 9306 5091 5040 2794 3614 602LithuanM 3 8 7 12 2644 4279 3799 5991 499Netherlands 156 224 254 274 323 80051 188454 150930 158921 174632 541Norway 273 244 232 243 268 147397 214036 201423 123591 135924 507Poland 53 50 66 60 47 23273 39101 27456 25705 18634 395Portugal 1059 970 998 1084 1053 501077 727757 459465 493048 445437 423Rumania 1 4 4 3 2 551 3010 2100 1399 983 492Russian Fed 880 1252 1013 938 1005 324603 859090 399980 340781 337852 336Slovakia 66 56 51 1 2 30988 13469 8973 300 1723 1014Slovenia 32 48 36 59 35 17802 36963 15305 22734 15489 443Spain 688 611 625 716 616 285688 491268 276048 273595 244789 397Sweden 2568 2229 2392 2494 2538 1216174 1793827 1276801 1251329 1151057 454Switzerland 88 75 89 115 98 46500 63974 47432 53663 46805 477UK 8 2 4 3 19 4310 1319 2986 2610 10961 565
Oceania 321 300 329 290 347 135144 210825 167967 128419 132563 382
New Zealand 321 300 329 290 347 135144 210825 167967 128419 132563 382
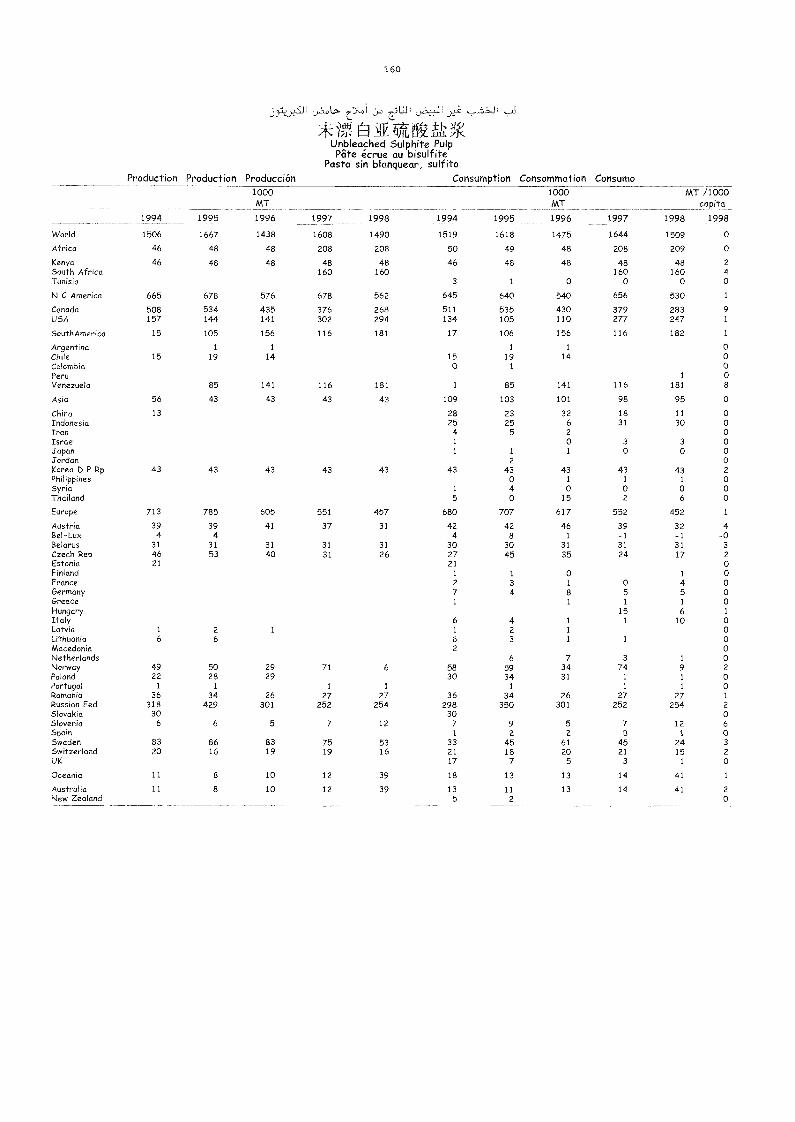
Production Production Producción
160
Li.1 I u.Z.,+.1 I .),:c I
AVUnbleached Sulphite PulpPate écrue au bisulfite
Pasta sin blanquear, sulfitoConsumption Consommation Consumo
1994 1995
1000MT
1996 1997 1998 1994 1995
1000MT
1996 1997
MT /1000capita
1998 1998
World 1506 1667 1438 1608 1490 1519 1618 1475 164-4 1509 0
Africa 46 48 48 208 208 50 49 48 208 209 0
Kenya 46 48 48 48 48 46 48 48 48 48 2
South Africa 160 160 160 160 4Tunisia 3 1 0 0 0 0
N C America 665 678 576 678 562 645 640 540 656 530 1
Canada 508 534 435 376 268 511 535 430 379 283 9USA 157 144 141 302 294 134 105 110 277 247 1
SouthAmerica 15 105 156 116 181 17 106 156 116 182 1
Argentina 1 1 1 1 0Chile 15 19 14 15 19 14 0Colombia 0 1 0Peru 1 0Venezuela 85 141 116 181 1 85 141 116 181 8
Asia 56 43 43 43 43 109 103 101 98 95 0
China 13 28 23 32 18 11 0Indonesia 25 25 6 31 30 0Iran 4 5 2 0Israel 1 0 3 3 0Japan 1 1 1 0 0 0Jordan 2 0Korea D P Rp 43 43 43 43 43 43 43 43 43 43 2
Philippines 0 1 1 1 0Syria 1 4 0 0 0 0Thailand 5 0 15 2 6 0
Europe 713 785 605 551 457 680 707 617 552 452 1
Austria 39 39 41 37 31 42 42 46 39 32 4Bel-Lux 4 4 4 8 1 -1 -1 -0Belarus 31 31 31 31 31 30 30 31 31 31 3Czech Rep 46 53 40 31 26 27 45 35 24 17 2
Estonia 21 21 0Finland 1 1 0 1 0France 2 3 1 0 4 0Germany 7 4 8 5 5 0Greece 1 1 1 1 0Hungary 15 6 1
Italy 6 4 1 1 10 0Latvia 1 2 1 1 2 1 0Lithuania 6 6 6 3 1 1 0Macedonia 2 0Netherlands 6 7 3 1 0Norway 49 50 29 71 6 58 59 34 74 9 2
Poland 22 28 29 30 34 31 1 1 0Portugal 1 1 1 1 1 1 1 0Romania 36 34 26 27 27 36 34 26 27 27 1
Russian Fed 318 429 301 252 254 298 350 301 252 254 2Slovakia 30 30 0Slovenia 6 6 5 7 12 7 9 5 7 12 6Spain 1 2 2 0 1 0Sweden 83 86 83 75 53 33 45 61 45 24 3Switzerland 20 16 19 19 16 21 18 20 21 15 2UK 17 7 5 3 1 0
Oceania 11 8 10 12 39 18 13 13 14 41 1
Australia 11 8 10 12 39 13 11 13 14 41 2
New Zealand 5 2 0
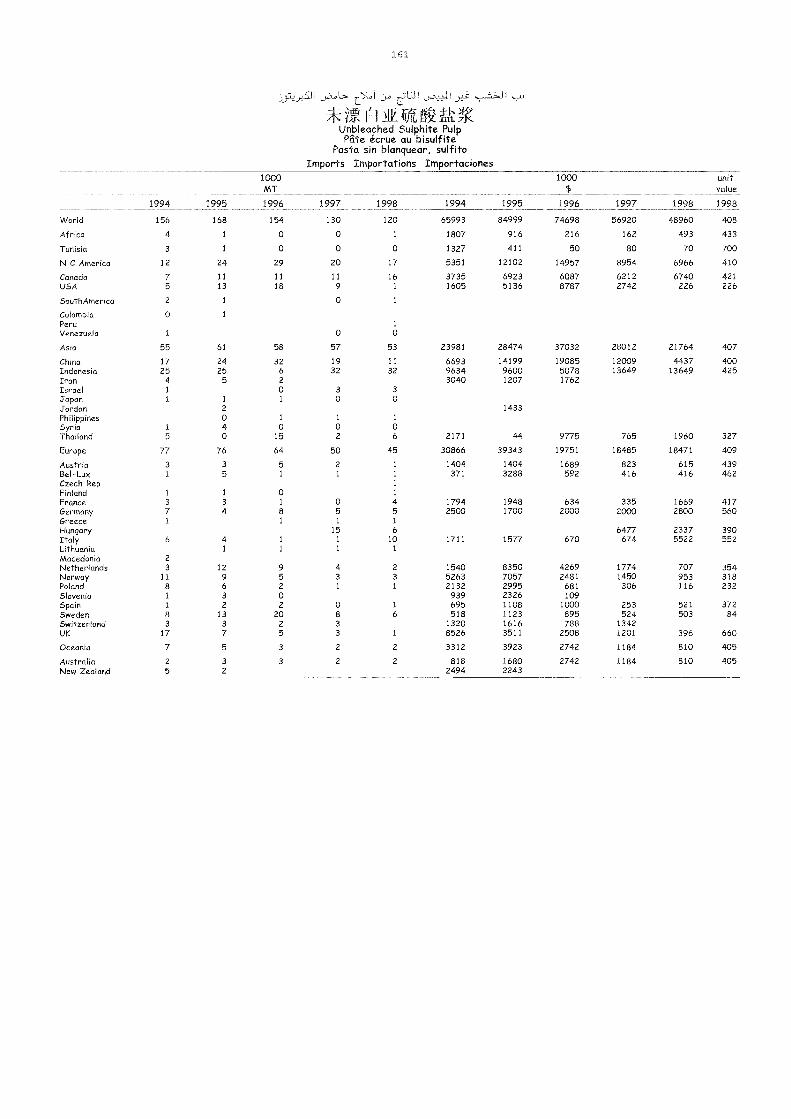
1 6 1
eLJ,,,,1
*-ti: iiitiKUnbleached Sulphite PulpPate écrue au bisulfite
Pasta sin blanquear, sulfitoImports Importations Importaciones
1994 1995
1000MT
1996 1997 1998 1994 1995
1000$
1996 1997 1998
unitvalue
1998
World 156 168 154 130 120 65993 84999 74698 56920 48960 408
Africa 4 1 o o 1 1807 916 216 162 493 433
Tunisia 3 1 0 o o 1327 411 50 80 70 700
N C America 12 24 29 20 17 5351 12102 14957 8954 6966 410
Canada 7 11 11 11 16 3735 6923 6087 6212 6740 421USA 5 13 18 9 1 1605 5136 8787 2742 226 226
SouthAmerica 2 1 o 1
Colombia o 1
Peru 1
Venezuela 1 o o
Asia 55 61 58 57 53 23981 28474 37032 28012 21764 407
China 17 24 32 19 11 6693 14199 19085 12009 4437 400Indonesia 25 25 6 32 32 9634 9600 5078 13649 13649 425Iran 4 5 2 3040 1207 1762Israel 1 o 3 3
Japan 1 1 1 o oJordan 2 1433Philippines o 1 1 1
Syria 1 4 o o oThailand 5 o 15 2 6 2171 44 9775 765 1960 327
Europe 77 76 64 50 45 30866 39343 19751 18485 18471 409
Austria 3 3 5 2 1 1404 1404 1689 823 615 439Bel-Lux 1 5 1 1 1 371 3288 592 416 416 462Czech Rep 1
Finland 1 1 o 1
France 3 3 1 o 4 1794 1948 634 335 1669 417Germany 7 4 8 5 5 2500 1700 2000 2000 2800 560Greece 1 1 1 1
Hungary 15 6 6477 2337 390Italy 6 4 1 1 10 1711 1577 670 674 5522 552Lithuania 1 1 1 1
Macedonia 2Netherlands 3 12 9 4 2 1540 8350 4269 1774 707 354Norway 11 9 5 3 3 5263 7057 2481 1450 953 318Poland 8 6 2 1 1 2132 2995 681 306 116 232Slovenia 1 3 o 939 2326 109Spain 1 2 2 o 1 695 1108 1000 253 521 372Sweden 8 13 20 8 6 518 1123 895 524 503 84Switzerland 3 3 2 3 1320 1616 788 1342UK 17 7 5 3 1 8526 3511 2508 1201 396 660
Oceania 7 5 3 2 2 3312 3923 2742 1184 810 405
Australia 2 3 3 2 2 818 1680 2742 1184 810 405New Zealand 5 2 2494 2243
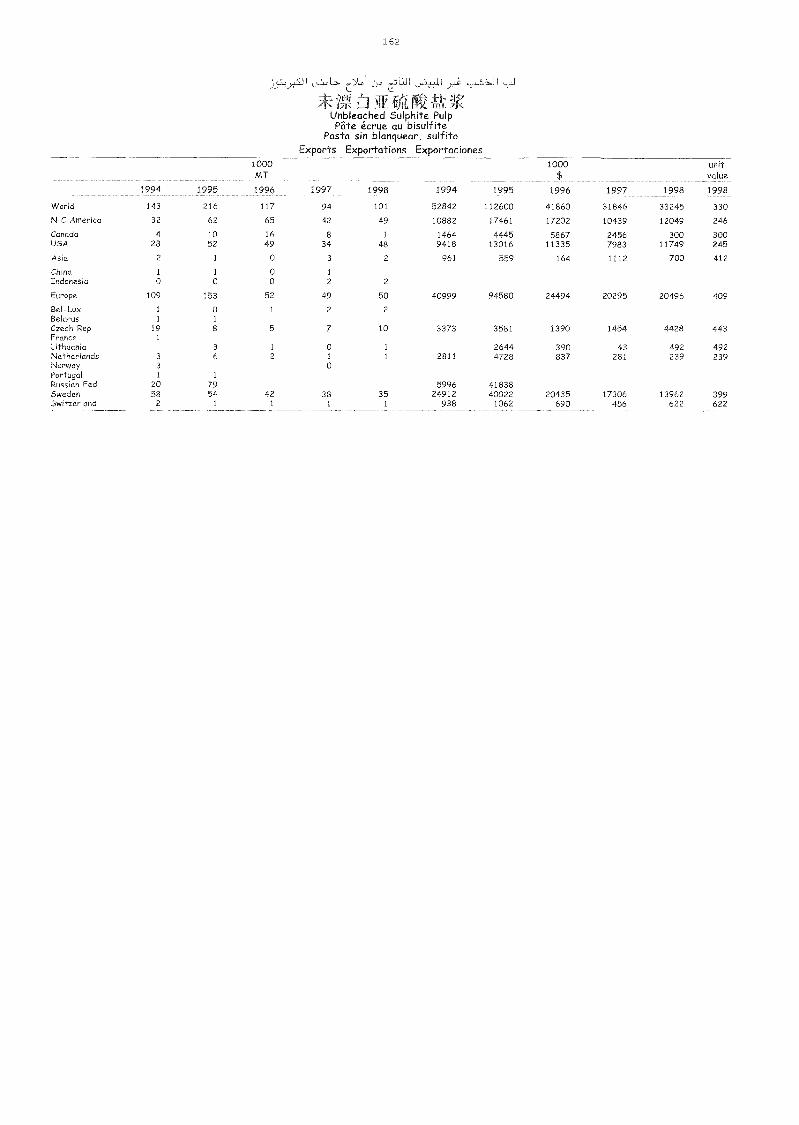
1 62
[t] gV &_4,-Unbleached Sulphite PulpPate écrue au bisulfite
Pasta sin blanquear, sulfitoExports Exportations Exportaciones
1994 1995
1000AAT
1996 1997 1998 1994 1995
1000$
1996 1997 1998
unitvalue
1998
World 143 216 117 94 101 52842 112600 41860 31846 33245 330
N C America 32 62 65 42 49 10882 17461 17202 10439 12049 246
Cariado 4 10 16 8 1 1464 4445 5867 2456 300 300USA 28 52 49 34 48 9418 13016 11335 7983 11749 245
Asia 2 1 0 3 2 961 559 164 1112 700 412
China 1 1 o 1
Indonesia 0 o o 2 2
Europe 109 153 52 49 50 40999 94580 24494 20295 20496 409
Bel-Lux 1 o 1 2 2
Belarus 1 1
Czech Rep 19 8 5 7 10 3373 3581 1390 1454 4428 443France 1
Lithuania 3 1 o 1 2644 390 43 492 492Netherlands 3 6 2 1 1 2811 4728 837 281 239 239Norway 3 0Portugal 1 1
Russian Fed 20 79 5996 41838Sweden 58 54 42 38 35 24912 40022 20435 17306 13962 399Switzerland 2 1 1 1 1 938 1062 690 456 622 622
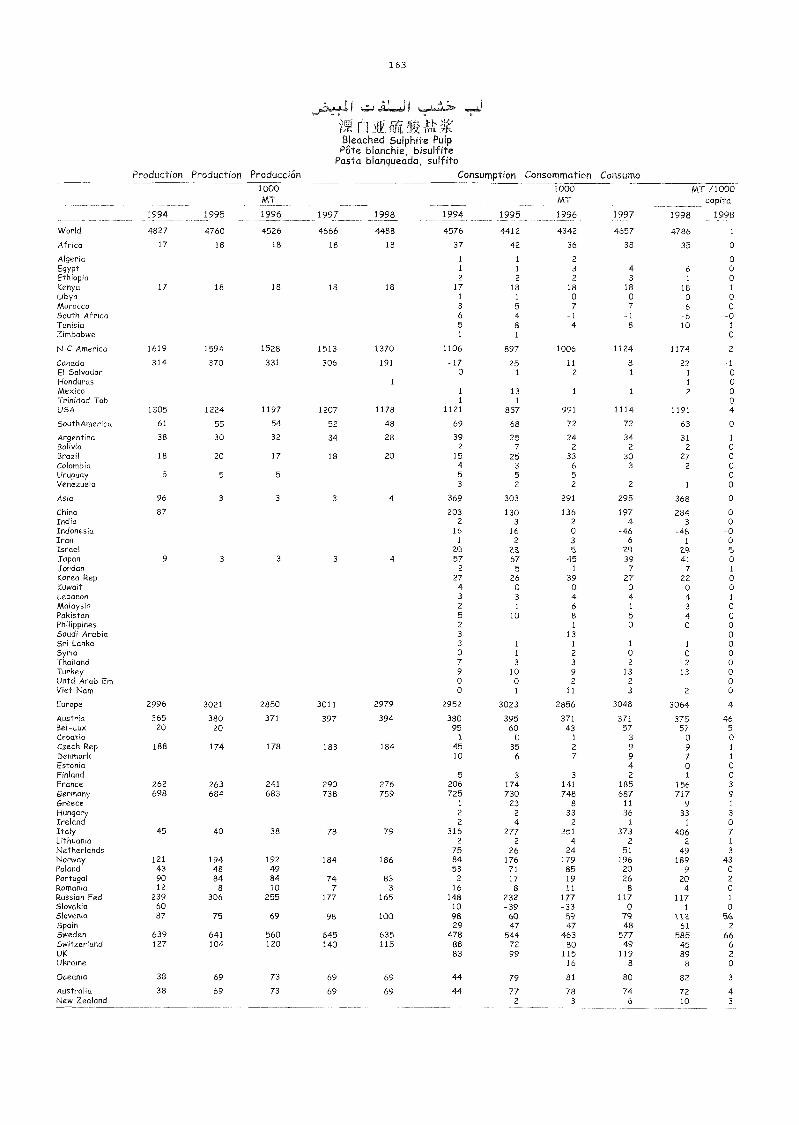
163
h....J
r'l F-4-7F. - /ILBleached Sulphite PulpPate
blanchie'bisulfite
Pasta blanqueada, sulfitoProduction Production Producción Consumption Consommation Consumo
1994 1995 1996 1997 1998 1994 1995 1996 1997 1998 1998
1000 1000 MT /1000MT MT capita
World 4827 4760 4526 4666 4488 4576 4412 4342 4657 4786 1
Africa 17 18 18 18 18 37 42 36 38 35 0
Algeria 1 1 2 0E9YPt 1 1 3 4 6 0Ethiopia 2 2 2 3 1 0Kenya 17 18 18 18 18 17 18 18 18 18 1
Libya 1 1 0 0 0 0Morocco 3 5 7 7 6 0South Africa 6 4 -1 -1 -6 -0Tunisia 5 8 4 8 10 1
Zimbabwe 1 1 0
N C America 1619 1594 1528 1513 1370 1106 897 1006 1124 1174 2
Canada 314 370 331 306 191 -17 25 11 8 -22 -1El Salvador 0 1 2 1 1 0Honduras 1 1 0Mexico 1 13 1 1 2 0Trinidad Tob 1 1 0USA 1305 1224 1197 1207 1178 1121 857 991 1114 1191 4
SouthAmerica 61 55 54 52 48 69 68 72 72 63 o
Argentina 38 30 32 34 28 39 25 24 34 31 1
Bolivia 2 7 2 2 2 0Brazil 18 20 17 18 20 15 25 33 30 27 0Colombia 4 3 6 3 2 0Uruguay 5 5 5 5 5 5 0Venezuela 3 2 2 2 1 0
Asia 96 3 3 3 4 369 303 291 295 368 o
China 87 203 130 136 197 284 oIndia 2 3 2 4 3 0Indonesia 16 16 0 -46 -48 -0Iran 1 2 3 6 1 oIsrael 20 23 5 ?_9 29 5Japan 9 3 3 3 4 57 67 45 39 41 0Jordan 2 5 1 7 7 1
Korea Rep 27 26 39 27 22 0Kuwait 4 0 0 o o 0Lebanon 3 3 4 4 4 1
Malaysia 2 1 6 1 3 oPakistan 5 10 8 5 4 0Philippines 2 1 o 0 0Saudi Arabia 3 13 0Sri Lanka 3 1 1 1 1 0Syria 0 1 2 o o 0Thailand 7 3 3 2 2 oTurkey 9 10 9 13 13 0Untd Arab Em 0 0 2 2 0Viet Nam 0 1 11 3 2 o
Europe 2996 3021 2850 3011 2979 2952 3023 2856 3048 3064 4
Austria 365 380 371 397 394 380 395 371 371 375 46Bel-Lux 20 20 95 60 43 57 57 5Croatia 1 0 1 3 0 oCzech Rep 188 174 178 183 184 45 35 2 9 9 1
Denmark 10 6 7 9 7 1
Estonia 4 o oFinland 5 3 3 2 1 0France 262 263 241 290 276 206 174 141 185 156 3
Germany 698 684 683 738 759 725 730 748 687 717 9
Greece 1 23 8 11 9 1
Hungary 2 2 33 36 33 3
Ireland 2 4 2 1 1 0Italy 45 40 38 78 79 316 277 251 373 406 7Lithuania 2 2 4 2 2 1
Netherlands 75 26 24 51 49 3
Norway 121 194 192 184 186 84 176 179 196 189 43Poland 43 48 49 53 71 85 20 9 0Portugal 90 84 84 74 83 2 17 19 26 20 2Romania 12 8 10 7 3 16 8 11 8 4 0Russian Fed 239 306 255 177 165 148 232 177 117 117 1
Slovakia 60 10 -39 -33 0 1 0Slovenia 87 75 69 98 100 98 60 59 79 11.2 56.1
Spain 29 47 47 48 61 2
Sweden 639 641 560 645 635 478 544 463 577 585 66Switzerland 127 104 120 140 115 88 72 80 49 45 6a 83 99 115 119 89 2
Ukraine 16 8 8 0
Oceania 38 69 73 69 69 44 79 81 80 82 3
Australia 38 69 73 69 69 44 77 78 74 72 4New Zealand 2 3 6 10 3
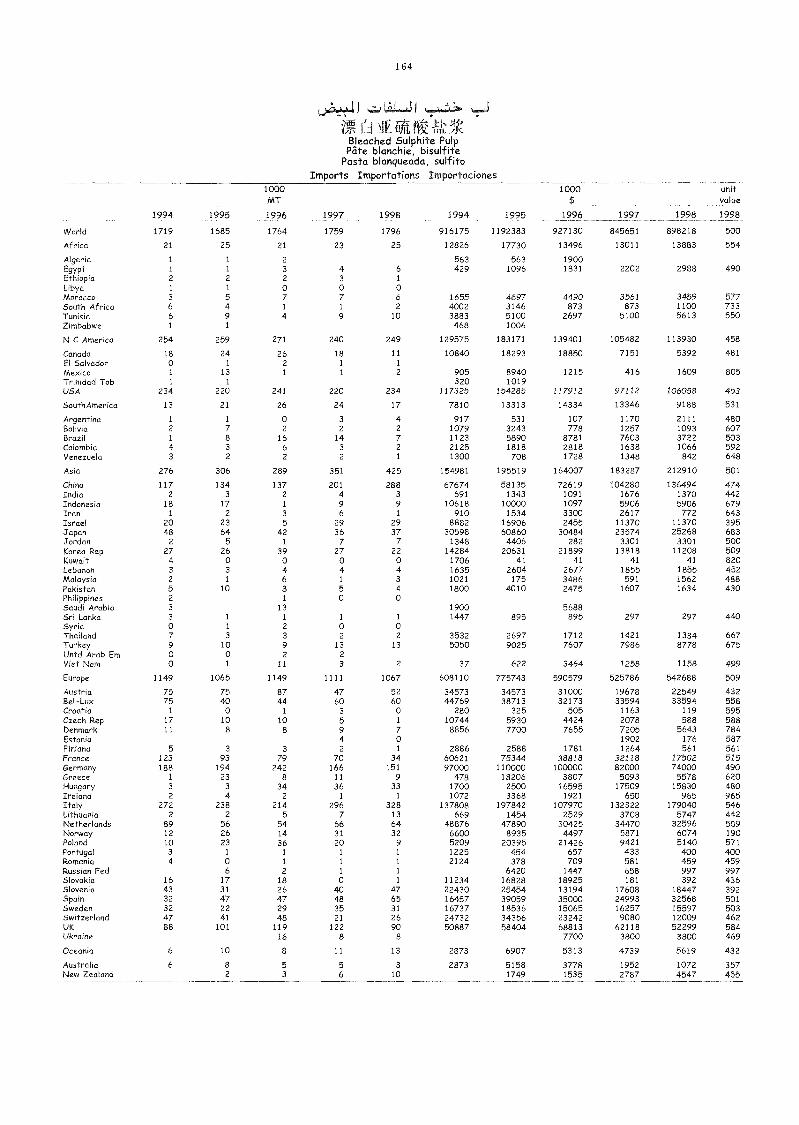
164
- Lafl
Bleached Sulphite PulpPate blanchie, bisulfite
Pasta blanqueada, sulfitoImports Importations Importaciones
1994 1995
1000MT
1996 1997 1998 1994 1995
1000$
1996 1997 1998
unitvalue
1998
VVorld 1719 1685 1764 1759 1796 916175 1192383 927130 845651 898218 500
Africa 21 25 21 23 25 12826 17730 13496 13011 13883 554
Algeria 1 1 2 563 563 1900Egypt 1 1 3 4 6 429 1096 1831 2202 2988 490Ethiopia 2 2 2 3 1
Libya 1 1 0 0 0Morocco 3 5 7 7 6 1655 4697 4490 3561 3459 577South Africa 6 4 1 1 2 4002 3146 873 873 1100 733Tunisia 6 9 4 9 10 3883 5100 2697 5100 5613 550Zimbabwe 1 1 468 1006
N C America 254 259 271 240 249 129575 183171 139401 105482 113930 458
Canada 18 24 26 18 11 10840 18293 18850 7151 5392 481El Salvador 0 1 2 1 1
Mexico 1 13 1 1 2 905 8940 1215 416 1609 805Trinidad Tob 1 1 320 1019USA 234 220 241 220 234 117325 154285 117912 97112 106058 453
SouthAmerica 13 21 26 24 17 7810 13313 14334 13346 9188 531
Argentina 1 1 0 3 4 917 531 107 1170 2111 480Bolivia 2 7 2 2 2 1079 3243 778 1257 1093 607Brazd 1 8 16 14 7 1123 5890 8781 7603 3722 503Colombia 4 3 6 3 2 2125 1818 2818 1638 1066 592Venezuela 3 2 2 2 1 1300 708 1728 1348 842 648
Asia 276 306 289 351 425 154981 195519 164007 183287 212910 501
China 117 134 137 201 288 67674 58135 72619 104280 136494 474India 2 3 2 4 3 691 1343 1091 1676 1370 442Indonesia 18 17 1 9 9 10618 10000 1097 5906 5906 679Iran 1 2 3 6 1 910 1534 3300 2617 772 643Israel 20 23 5 29 29 8882 16906 2455 11370 11370 395Japan 48 64 42 36 37 30598 60860 30484 23574 25268 683Jordan 2 5 1 7 7 1348 4406 282 3301 3301 500Korea Rep 27 26 39 27 22 14284 20631 21899 13818 11208 509Kuwait 4 0 0 0 0 1706 41 41 41 41 820Lebanon 3 3 4 4 4 1635 2604 2677 1855 1855 452Malaysia 2 1 6 1 3 1021 175 3486 591 1562 488Pakistan 5 10 8 5 4 1800 4010 2475 1607 1634 430Philippines 2 1 0 0Saudi Arabia 3 13 1900 5688Sri Lanka 3 1 1 1 1 1447 895 895 297 297 440Syria 0 1 2 0 0Thailand 7 3 3 2 2 3532 2697 1712 1421 1334 667Turkey 9 10 9 13 13 5050 9025 7607 7986 8778 675Untd Arab Em 0 0 2 2Viet Nam 0 1 11 3 2 37 622 3464 1258 1158 499
Europe 1149 1065 1149 1111 1067 608110 775743 590579 525786 542688 509
Austria 75 75 87 47 52 34573 34573 31000 19678 22549 432Bel-Lux 75 40 44 60 60 44769 38713 32173 33594 33594 558Croatia 1 0 1 3 0 280 325 505 1163 119 595Czech Rep 17 10 10 5 1 10744 5930 4424 2078 588 588Denmark 11 8 8 9 7 8856 7700 7655 7205 5643 784Estonia 4 0 1902 176 587Finland 5 3 3 2 1 2886 2588 1781 1264 561 561France 123 93 79 70 34 60621 75344 38818 32118 17502 515Germany 188 194 242 166 151 97000 110000 100000 82000 74000 490Greece 1 23 8 11 9 478 18206 3807 5093 5578 620Hungary 3 3 34 36 33 1700 2500 16595 17509 15830 480Ireland 2 4 2 1 1 1072 3368 1921 650 965 965Italy 272 238 214 296 328 137808 197842 107970 132322 179040 546Lithuania 2 2 5 7 13 669 1454 2529 3708 5747 442Netherlands 89 56 54 66 64 48876 47890 30425 34470 32596 509Norway 12 26 14 31 32 6600 8935 4497 5871 6074 190Poland 10 23 36 20 9 5209 20395 21426 9421 5140 571Portugal 3 1 1 1 1 1225 454 657 433 400 400Romania 4 0 1 1 1 2124 378 709 581 459 459Russian Fed 6 2 1 1 6420 1447 658 997 997Slovakia 16 17 18 0 1 11234 16828 18925 181 392 436Slovenia 43 31 26 40 47 22430 25454 13194 17608 18447 392SpaM 32 47 47 48 65 16457 39059 35000 24993 32568 501Sweden 32 22 29 35 31 16737 18536 15065 16257 15597 503Switzerland 47 41 48 21 26 24732 34356 23242 9080 12009 462UK 88 101 119 122 90 50887 58404 68813 62118 52299 584UkraMe 16 8 8 7700 3800 3800 469
Oceania 6 10 8 11 13 2873 6907 5313 4739 5619 432
Australia 6 8 5 5 3 2873 5158 3778 1952 1072 357New Zealand 2 3 6 10 1749 1535 2787 4547 455
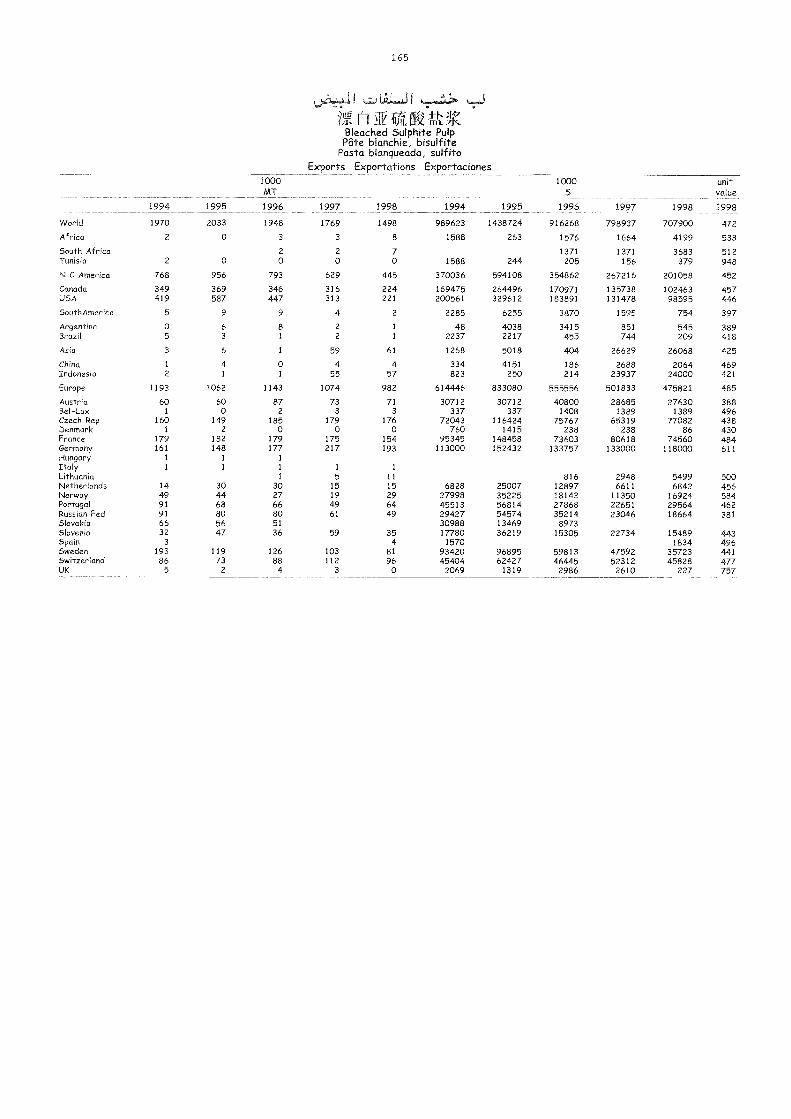
165
ri ft Or' Yzr /IL rat YBleached Sulphite PulpPate blanchie, bisulfite
Pasta blanqueada, sulfitoExports Exportations Exportaciones
1994 1995
1000MT
1996 1997 1998 1994 1995
1000$
1996 1997 1998
unitvalue
1998
World 1970 2033 1948 1769 1498 989623 1438724 916268 798937 707900 472
Africa 2 0 3 3 8 1588 263 1576 1664 4199 533
South Africa 2 2 7 1371 1371 3683 512Tunisia 2 0 0 0 0 1588 244 205 156 379 948
N C America 768 956 793 629 445 370036 594108 354862 267216 201058 452
Canada 349 369 346 316 224 169475 264496 170971 135738 102463 457USA 419 587 447 313 221 200561 329612 183891 131478 98595 446
SouthAmerica 5 9 9 4 2 2285 6255 3870 1595 754 397
Argentina 0 6 8 2 1 48 4038 3415 851 545 389Brazil 5 3 1 2 1 2237 2217 455 744 209 418
Asia 3 6 1 59 61 1268 5018 404 26629 26068 425
China 1 4 0 4 4 334 4151 186 2688 2064 469Indonesia 2 1 1 55 57 823 250 214 23937 24000 421
Europe 1193 1062 1143 1074 982 614446 833080 555556 501833 475821 485
Austria 60 60 87 73 71 30712 30712 40800 28685 27630 388Bel-Lux 1 0 2 3 3 337 337 1408 1389 1389 496Czech Rep 160 149 185 179 176 72043 116424 75767 65319 77082 438Denmark 1 2 0 0 0 760 1415 238 238 86 430France 179 182 179 175 154 95345 148458 73603 80618 74560 484Germany 161 148 177 217 193 113000 152432 133757 133000 118000 611Hungary 1 1 1
Italy 1 1 1 1 1
Lithuania 1 5 11 816 2948 5499 500Netherlands 14 30 30 15 15 6828 25007 12897 6611 6842 456Norway 49 44 27 19 29 27998 35225 18142 11350 16924 584Portugal 91 68 66 49 64 45513 56814 27868 22651 29564 462Russian Fed 91 80 80 61 49 29427 54574 35214 23046 18664 381Slovakia 66 56 51 30988 13469 8973Slovenia 32 47 36 59 35 17780 36219 15305 22734 15489 443Spain 3 4 1570 1834 496Sweden 193 119 126 103 81 93420 96895 59813 47592 35723 441Switzerland 86 73 88 112 96 45404 62427 46445 52312 45828 477UK 5 2 4 3 0 2069 1319 2986 2610 227 757
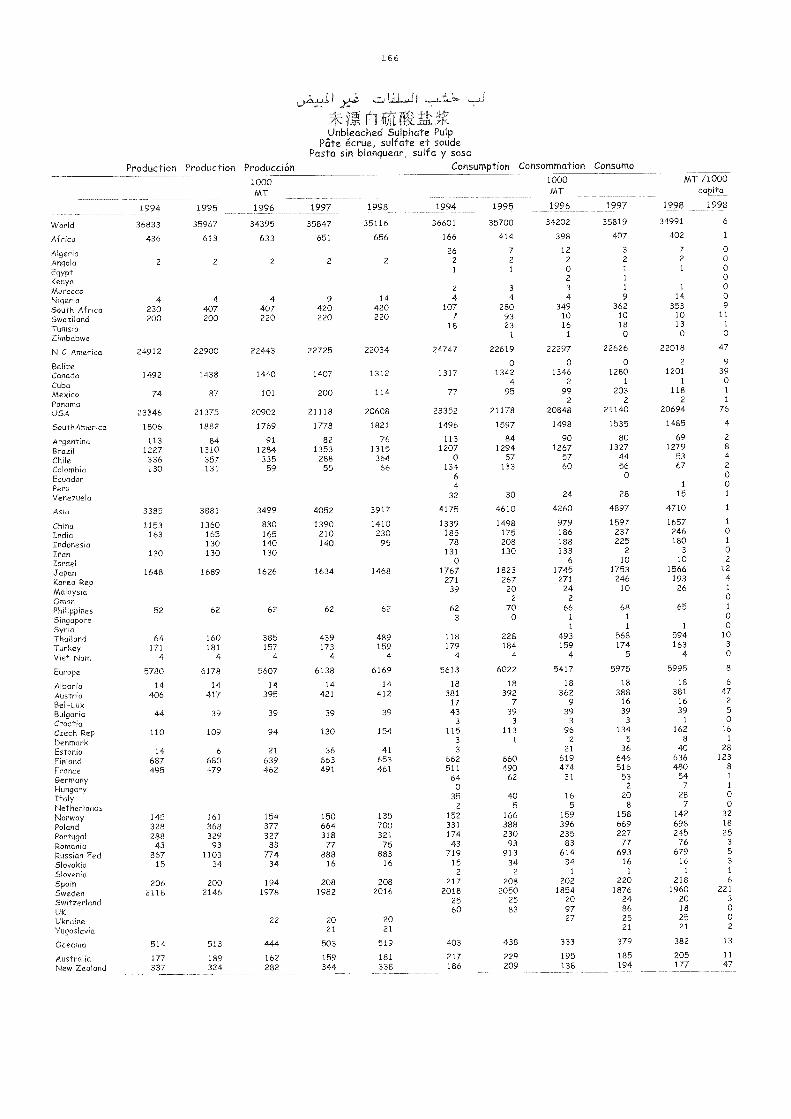
166
ri 01 0,v, rik. dV
Unbleached Sulphate PulpPate écrue sulfate et soude
Pasta sin blanquear, sulfa y sosaProduction Production Producción Consumption Consommation Consumo
1994 1995
1000MT
1996 1997 1998 1994 1995
1000MT
1996 1997
MT /1000capita
1998 1998
World 36833 35967 34395 35847 35116 36601 35700 34202 35819 34991 6
Africa 436 613 633 651 656 166 414 398 407 402 1
Algeria 26 7 12 3 7 0
Angola 2 2 2 2 2 2 2 2 2 2 0
EgyptKenya
1 1 02
1
1
1 00
Morocco 2 3 3 1 1 0
Nigeria 4 4 4 9 14 4 4 4 9 14 0
South Africa 230 407 407 420 420 107 280 349 362 353 9
Swaziland 200 200 220 220 220 7 93 10 10 10 11
Tunisia 18 23 16 18 13 1
Zimbabwe 1 1 0 0 0
N C America 24912 22900 22443 22725 22034 24747 22619 22297 22626 22018 47
Belize 0 0 0 2 9
Canada 1492 1438 1440 1407 1312 1317 1342 1346 1280 1201 39
Cuba 4 2 1 1 0
Mexico 74 87 101 200 114 77 95 99 203 118 1
Panama 2 2 2 1
USA 23346 21375 20902 21118 20608 23352 21178 20848 21140 20694 76
SouthAmerica 1806 1882 1769 1778 1821 1496 1597 1498 1535 1485 4
Argentina 113 84 91 82 76 113 84 90 80 69 2
Brazil 1227 1310 1284 1353 1315 1207 1294 1267 1327 1279 8
Chile 336 357 335 288 364 0 57 57 44 53 4
Colombia 130 131 59 55 66 134 133 60 56 67 2
Ecuador 6 0 0
Peru 4 1 0
Venezuela 32 30 24 28 15 1
Asia 3385 3881 3499 4052 3917 4175 4610 4260 4897 4710 1
China 1153 1360 830 1390 1410 1339 1498 979 1597 1657 1
India 163 165 165 210 230 185 175 186 237 246 0
Indonesia 130 140 140 95 78 208 188 225 180 1
Iran 130 130 130 131 130 133 2 3 0
Israel 0 6 10 10 2
Japan 1648 1689 1626 1634 1468 1767 1823 1745 1753 1566 12
Korea Rep 271 267 271 246 193 4
Malaysia 39 20 24 10 26 1
Oman 2 2 0
Philippines 52 62 62 62 62 62 70 66 68 65 1
Singapore 3 0 1 1 0
Syria 1 1 1 0
Thailand 64 160 385 439 489 118 228 493 568 594 10
Turkey 171 181 157 173 159 179 184 159 174 163 3
Viet Nam 4 4 4 4 4 4 4 4 5 4 0
Europe 5780 6178 5607 6138 6169 5613 6022 5417 5975 5995 8
Albania 14 14 14 14 14 18 18 18 18 18 6
Austria 406 417 395 421 412 381 392 362 388 381 47
Bel-Lux 17 7 9 16 16 2
Bulgaria 44 39 39 39 39 43 39 39 39 39 5
Croatia 3 3 3 3 1 0
Czech Rep 110 109 94 130 154 115 113 96 134 162 16
Denmark 3 1 2 5 8 1
Estonia 14 6 21 36 41 3 21 36 40 28
Finland 687 680 639 663 653 662 660 619 646 636 123
France 495 479 462 491 461 511 490 474 516 480 8
Germany 64 62 31 53 54 1
Hungary 0 2 7 1
Italy 35 40 16 20 28 0
Netherlands 2 5 5 8 7 0
Norway 145 161 154 150 135 152 166 159 158 142 32
Poland 328 368 377 664 700 331 388 396 669 698 18
Portugal 288 329 327 318 321 174 230 235 227 245 25
Romania 43 93 83 77 75 43 93 83 77 76 3
Russian Fed 867 1103 774 888 883 719 913 614 693 679 5
Slovakia 15 34 34 16 16 15 34 34 16 16 3
Slovenia 2 2 1 1 1 1
Spain 206 200 194 208 208 217 208 202 220 218 6
Sweden 2118 2146 1978 1982 2016 2018 2050 1854 1876 1960 221
Switzerland 25 25 20 24 20 3
UK 60 83 97 86 18 0
Ukraine 22 20 20 27 25 25 0
Yugoslavia 21 21 21 21 2
Oceania 514 513 444 503 519 403 438 333 379 382 13
Austral ia 177 189 162 159 181 217 229 195 185 205 11
New Zealand 337 324 282 344 338 186 209 138 194 177 47
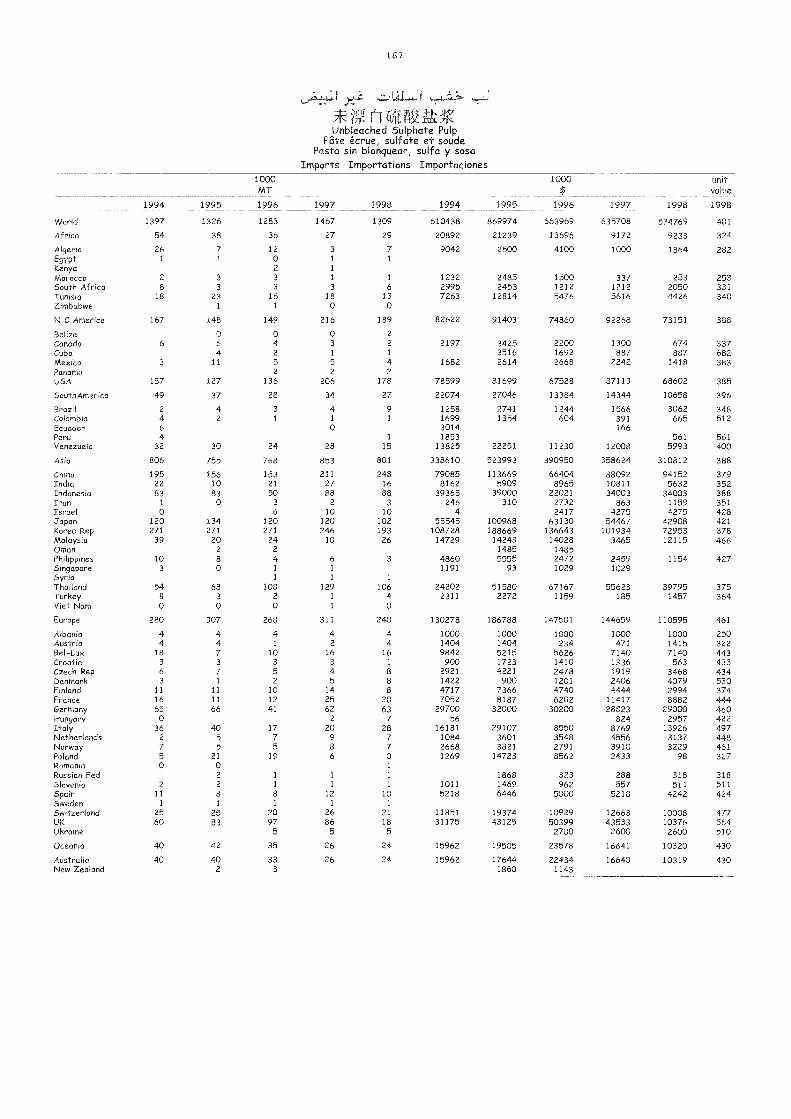
167
n M,Unbleached Sulphate Pulp
Pate écrue, sulfate et soudePasta sin blanquear, sulfa y sosa
Imports Importations Importaciones
1994 1995
1000MT
1996 1997 1998 1994 1995
1000$
1996 1997 1998
unitvalue
1998
WoHd 1397 1326 1283 1467 1309 610438 869974 663969 635708 524769 401
Africa 54 38 36 27 29 20892 21239 13696 9172 9233 324
Algeria 26 7 12 3 7 9042 2500 4100 1000 1864 282Egypt 1 1 0 1 1
Kenya 2 1
Morocco 2 3 3 1 1 1232 2485 1500 337 253 253South Africa 8 3 3 3 6 2995 2453 1212 1212 2050 331Tunisia 18 23 16 18 13 7263 12814 5476 5616 4426 340Zimbabwe 1 1 0 0
N C America 167 148 149 216 189 82622 91403 74860 92268 73151 388
Belize 0 0 0 2
Canada 6 6 4 3 2 2197 3425 2200 1300 674 337Cuba 4 2 1 1 3516 1692 887 887 682Mexico 3 11 5 5 4 1682 2614 2668 2242 1418 383Panama 2 2 2
USA 157 127 136 206 178 78599 81699 67528 87113 68602 385
Soot hAmerica 49 37 28 34 27 22074 27046 13384 14344 10658 396
Brazil 2 4 3 4 9 1258 2741 1244 1566 3062 348Colombia 4 2 1 1 1 1699 1354 604 391 665 512Ecuador 6 0 3014 166Peru 4 1 1853 561 561Venezuela 32 30 24 28 15 13825 22251 11230 12008 5993 400
Asia 806 755 768 853 801 338610 523993 390950 358624 310812 388
China 195 156 153 211 248 79085 113669 66404 88092 94152 379India 22 10 21 27 16 8162 5909 8965 10811 5632 352Indonesia 83 83 50 88 88 39365 39000 22021 34003 34003 388Iran 1 0 3 2 3 246 310 2732 863 1159 351Israel 0 6 10 10 4 2417 4275 4275 428Japan 120 134 120 120 102 55545 100968 63130 54467 42908 421Korea Rep 271 271 271 246 193 108728 188669 136643 101934 72953 378Malaysia 39 20 24 10 26 14729 14243 14028 3465 12115 466Oman 2 2 1485 1485Philippines 10 8 4 6 3 4860 5555 2472 2459 1154 427Singapore 3 0 1 1 1191 93 1029 1029Syria 1 1 1
Thadand 54 68 108 129 106 24202 51580 67167 55623 39795 375Turkey 8 3 2 1 4 2311 2272 1159 185 1457 364Viet Nam 0 0 0 1 0
Europe 280 307 268 311 240 130278 186788 147501 144659 110595 461
Albania 4 4 4 4 4 1000 IODO 1000 1000 1000 250Austria 4 4 1 2 4 1404 1404 234 471 1415 322Bel-Lux 18 7 10 16 16 9842 5215 5626 7140 7140 443Croatia 3 3 3 3 1 900 1723 1410 1336 563 433Czech Rep 6 7 5 4 8 2921 4221 2478 1919 3468 434Denmark 3 1 2 5 8 1422 900 1201 2406 4079 530Finland 11 11 10 14 8 4717 7366 4740 4444 2994 374France 16 11 12 25 20 7052 8187 6202 11417 8882 444Germany 65 66 41 62 63 29700 32000 30200 28823 29000 460Hungary 0 2 7 56 824 2957 422Italy 36 40 17 20 28 16181 29107 8550 8769 13926 497Netherlands 2 5 7 9 7 1084 3601 3548 4556 3137 448Norway 7 5 5 8 7 2668 3821 2791 3910 3229 461Poland 5 21 19 6 0 1269 14723 8562 2433 98 327Romania 0 0 IRussian Fed 2 1 1 1 1868 323 288 318 318Slovenia 2 2 1 1 1 1011 1469 962 557 511 511SpaM II 8 8 12 10 5218 6446 5000 5218 4242 424Sweden 1 I 1 1 ISwitzerland 25 25 20 26 21 11851 19374 10929 12663 10008 477UK 60 83 97 86 18 31175 43125 50399 43533 10376 564UkraMe 5 5 5 2700 2600 2600 510
Oceania 40 42 35 26 24 15962 19505 23578 16641 10320 430
Australia 40 40 33 26 24 15962 17644 22434 16640 10319 430New ZeaMnd 2 3 1860 1143
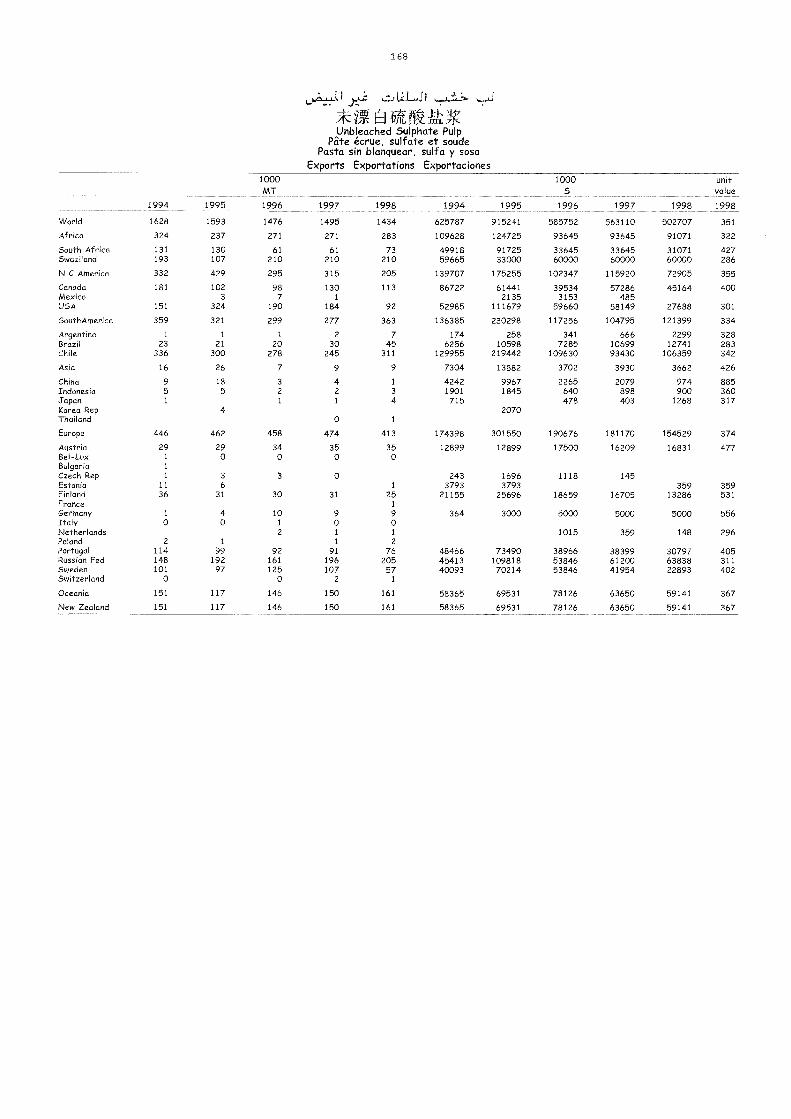
168
[ti (iQUnbleached Sulphate Pulp
Pate écrue, sulfate et soudePasta sin blanquear, sulfa y sosa
Exports Exportations Exportaciones
1994 1995
1000MT
1996 1997 1998 1994 1995
1000$
1996 1997 1998
unitvalue
1998
World 1628 1593 1476 1495 1434 625787 915241 585752 563110 502707 351
Africa 324 237 271 271 283 109628 124725 93645 93645 91071 322
South Africa 131 130 61 61 73 49918 91725 33645 33645 31071 427Swaziland 193 107 210 210 210 59665 33000 60000 60000 60000 286
N C America 332 429 295 315 205 139707 175255 102347 115920 72905 355
Canada 181 102 98 130 113 86722 61441 39534 57286 45164 400Mexico 3 7 1 2135 3153 485USA 151 324 190 184 92 52985 111679 59660 58149 27688 301
SouthAmerica 359 321 299 277 363 136385 230298 117256 104795 121399 334
Argentina 1 1 1 2 7 174 258 341 666 2299 328Brazil 23 21 20 30 45 6256 10598 7285 10699 12741 283Chile 336 300 278 245 311 129955 219442 109630 93430 106359 342
Asia 16 26 7 9 9 7304 13882 3702 3930 3662 426
China 9 18 3 4 1 4242 9967 2265 2079 974 885Indonesia 5 5 2 2 3 1901 1845 640 898 900 360Japan 1 1 1 4 715 478 403 1268 317Korea Rep 4 2070Thailand 0 1
Europe 446 462 458 474 413 174398 301550 190676 181170 154529 374
Austria 29 29 34 35 35 12899 12899 17500 16209 16831 477Bel-Lux 1 0 0 0 0Bulgaria 1
Czech Rep 1 3 3 0 243 1696 1118 145Estonia 11 6 1 3793 3793 359 359Finland 36 31 30 31 25 21155 25696 18659 16705 13286 531France 1
Germany 1 4 10 9 9 364 3000 5000 5000 5000 556Italy 0 0 1 0 0Netherlands 2 1 1 1015 359 148 296Poland 2 1 1 2
Portugal 114 99 92 91 76 48466 73490 38966 38399 30797 405Russian Fed 148 192 161 196 205 45413 109818 53846 61200 63838 311Sweden 101 97 125 107 57 40093 70214 53846 41954 22893 402Switzerland 0 0 2 1
Oceania 151 117 146 150 161 58365 69531 78126 63650 59141 367
New Zealand 151 117 146 150 161 58365 69531 78126 63650 59141 367
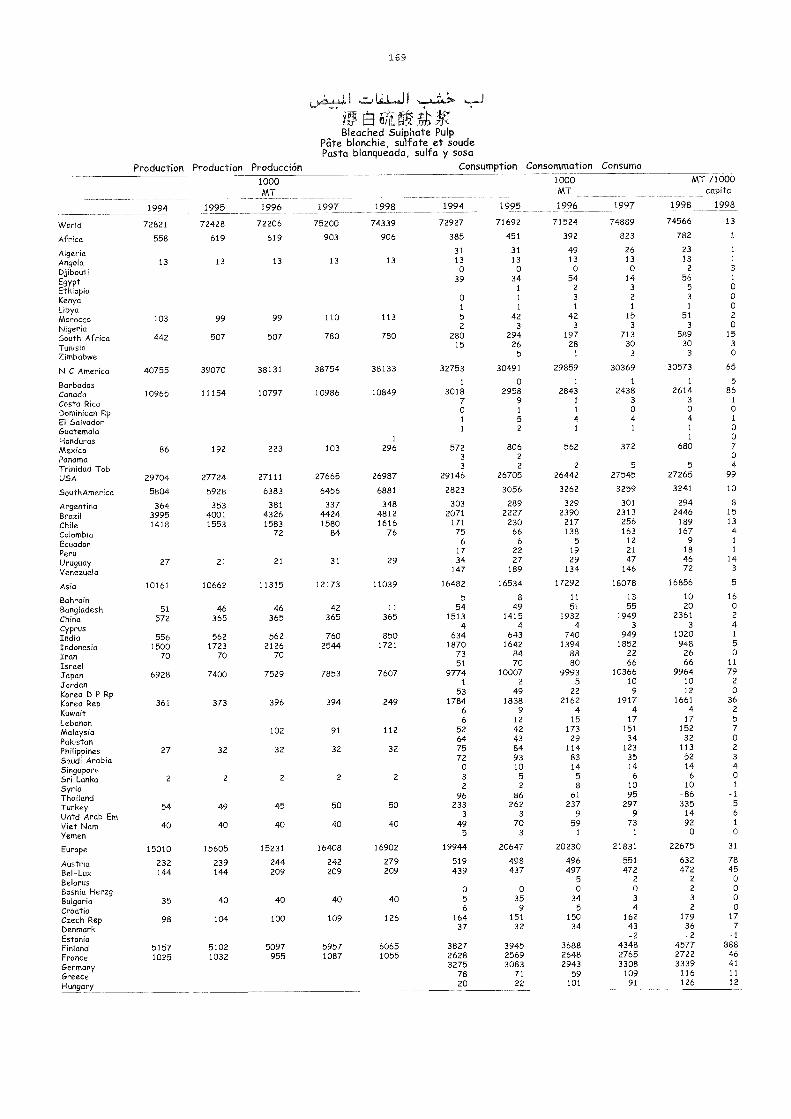
1 69
-I .11 , 6.
Bleached Sulphate PulpPate blanchie, sulfate et soudePasta blanqueada, sulfa y sosa
Production Production Producción Consumption Consommation Consumo
1994 1995
1000MT
1996 1997 1998 1994 1995
1000MT
1996 1997
MT /1000capita
1998 1998
World 72821 72428 72206 75200 74339 72927 71692 71524 74889 74566
Africa 558 619 619 903 906 385 451 392 823 782 1
Algeria 31 31 49 26 23 1
Angola 13 13 13 13 13 13 13 13 13 13 1
Djibouti 0 0 0 0 2 3
EgyptEthiopia
39 341
542
143
565
1
0
Kenya 0 1 3 2 3 0
Libya 1 1 1 1 1 0
Morocco 103 99 99 110 113 5 42 42 15 51 2
Nigeria 2 3 3 3 3 0
South Africa 442 507 507 780 780 280 294 197 713 589 15
Tunisia 15 26 28 30 30 3
Zimbabwe 5 1 3 3 0
N C America 40755 39070 38131 38754 38133 32753 30491 29859 30369 30573 65
Barbados 1 0 1 1 1 5
Canada 10965 11154 10797 10986 10849 3018 2958 2843 2438 2614 86
Costa Rica 7 9 1 3 3 1
Dominican Rp 0 1 1 0 0 0
El Salvador 1 5 4 4 4 1
Guatemala 1 2 1 1 1 0
Honduras 1 1 0
Mexico 86 192 223 103 296 572 806 562 372 680 7
Panama 3 2 0
Trinidad Tob 3 2 2 5 5 4
USA 29704 27724 27111 27665 26987 29146 26705 26442 27545 27265 99
SouthAmerica 5804 5928 6383 6456 6881 2823 3056 3262 3259 3241 10
Argentina 364 353 381 337 348 303 289 329 301 294 8
Brazil 3995 4001 4326 4424 4812 2071 2227 2390 2313 24-46 15
Chile 1418 1553 1583 1580 1616 171 230 217 256 189 13
Colombia 72 84 76 75 66 138 163 167 4
Ecuador 6 6 5 12 9 1
Pera 17 22 19 21 18 1
Uruguay 27 21 21 31 29 34 27 29 47 46 14
Venezuela 147 189 134 146 72 3
Asia 10161 10662 11315 12173 11039 16482 16534 17292 18078 16856 5
Bahrain 5 8 11 13 10 16
Bangladesh 51 46 46 42 11 54 49 51 55 20 0
China 572 365 365 365 365 1513 1415 1932 1949 2361 2
Cyprus 4 4 4 3 3 4
India 556 562 562 760 850 634 643 740 949 1020 1
Indonesia 1500 1723 2126 2544 1721 1870 1642 1394 1852 948 5
Iran 70 70 70 73 84 88 22 26 0
Israel 51 70 80 66 66 11
Japan 6928 7400 7529 7853 7607 9774 10007 9993 10366 9964 79
Jordan 1 2 5 10 10 2
Korea D P Rp 53 49 22 9 12 0
Korea Rep 361 373 396 394 249 1784 1838 2162 1917 1661 36
Kuwait 6 9 4 4 4 2
Lebanon 6 12 15 17 17 5
Malaysia 102 91 112 52 42 173 151 152 7
Pakistan 64 43 29 34 32 0
Philippines 27 32 32 32 32 75 84 114 123 113 2
Saudi Arabia 72 93 83 35 52 3
Singapore 0 10 14 14 14 4
Sri Lanka 2 2 2 2 2 3 5 5 6 6 0
Syria 2 2 8 10 10 1
Thailand 96 86 61 95 -86 -1
Turkey 54 49 45 50 50 233 262 237 297 335 5
Untd Arab Em 3 3 9 9 14 6
Viet Nam 40 40 40 40 40 49 70 59 73 92 1
Yemen 5 3 1 1 0 0
Europe 15010 15605 15231 16408 16902 19944 20647 20230 21831 22675 31
Austria 232 239 244 242 279 519 498 496 551 632 78
Bel-Lux 144 144 209 209 209 439 437 497 472 472 45
Belarus 5 2 2 0
Bosnia Herzg 0 0 0 o 2 0
Bulgaria 35 40 40 40 40 5 35 34 3 3 0
Croatia 6 9 5 4 2 0
Czech Rep 98 104 100 109 126 164 151 150 162 179 17
Denmark 37 32 34 43 36 7
Estonia -2 -2 -1
Finland 5157 5102 5097 5957 6065 3827 3945 3688 4348 4577 888
France 1025 1032 955 1087 1055 2628 2569 2648 2765 2722 46
Germany 3275 3083 2943 3308 3339 41
Greece 78 71 59 109 116 11
Hungary 20 22 101 91 126 12
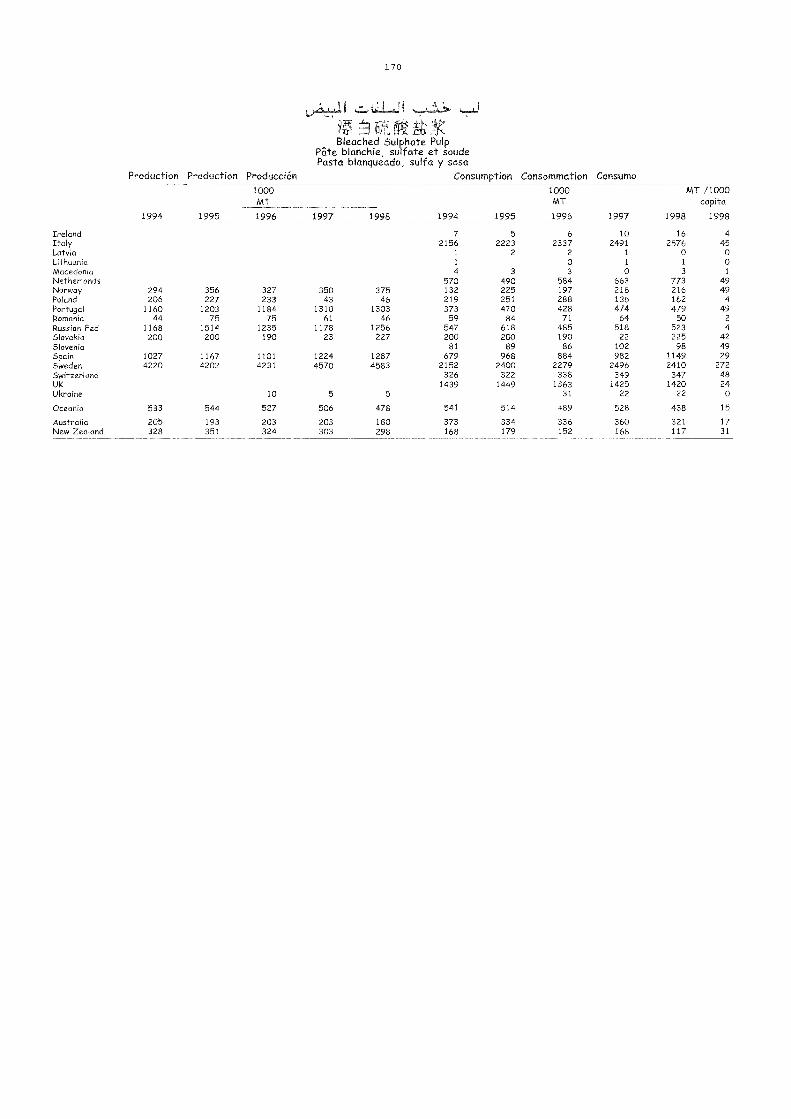
170
r9Bleached Sulphate Pulp
Pate blanchie, sulfate et soudePasta blanqueada, sulfa y sosa
Production Production Producción Consumption Consommation Consumo
1994 1995
1000MT
1996 1997 1998 1994 1995
1000MT
1996 1997
MT /1000capita
1998 1998
Ireland 7 5 6 10 16 4Italy 2156 2223 2337 2491 2576 45Latvia 1 2 2 1 0 0Lithuania 1 0 1 1 0Macedonia 4 3 3 0 3 1
Netherlands 570 490 584 663 773 49Norway 294 356 327 350 375 132 225 197 218 216 49Poland 206 227 233 43 46 219 251 288 136 162 4Portugal 1160 1203 1184 1310 1303 373 470 428 474 479 49Romania 44 75 75 61 46 59 84 71 64 50 2
Russian Fed 1168 1514 1235 1178 1256 547 618 485 518 523 4Slovakia 200 200 190 23 227 200 200 190 22 225 42Slovenia 81 89 86 102 98 49Spain 1027 1167 1101 1224 1287 679 968 884 982 1149 29Sweden 4220 4202 4231 4570 4583 2152 2400 2279 2496 2410 272Switzerland 326 322 338 349 347 48UK 1439 1449 1363 1425 1420 24Ukraine 10 5 5 31 22 22
Oceania 533 54-4 527 506 478 541 514 489 528 438 15
Australia 205 193 203 203 180 373 334 336 360 321 17New Zealand 328 351 324 303 298 168 179 152 168 117 31
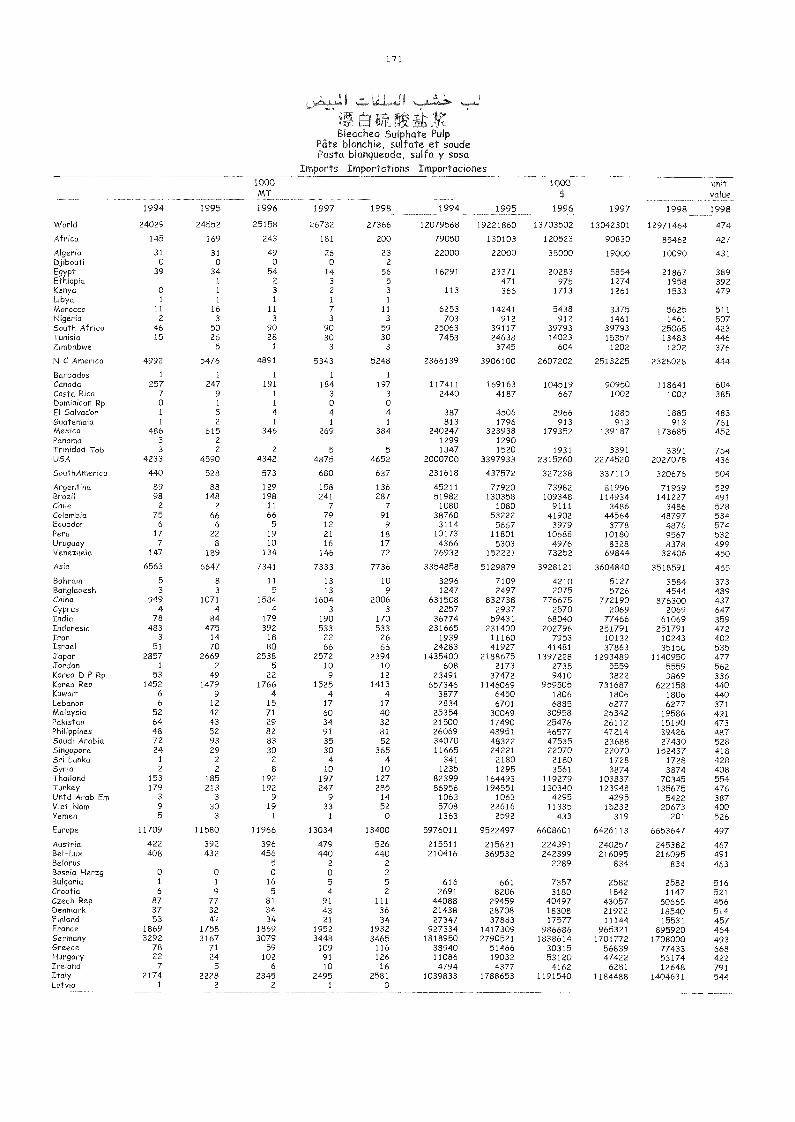
171
P2 g)KBleached Sulphate Pulp
Pate blanchie, sulfate et soudePasta blanqueada, sulfa y sosa
Imports Innportations Importaciones
1994 1995
1000MT
1996 1997 1998 1994 1995
1000$
1996 1997 1998
un
value
1998
VVorld 24029 24552 25158 26732 27366 12079568 19221860 13703502 13042301 12971464 474
Africa 145 169 243 181 200 79050 130103 120523 90830 85462 427
AlgerM 31 31 49 26 23 22000 22000 35000 19000 10090 431Djibouti 0 0 0 0 2
Egypt 39 34 54 14 56 16291 23371 20283 5854 21867 389Ethiopia 1 2 3 5 471 975 1274 1958 392Kenya 0 1 3 2 3 113 366 1713 1261 1533 479Libya 1 1 1 1 1
Morocco 11 16 11 7 11 6253 14241 5438 3375 5625 511Nigerio 2 3 3 3 3 703 912 912 1461 1461 507South Africa 46 50 90 90 59 25063 39117 39793 39793 25065 423Tunisia 15 26 28 30 30 7453 24638 14023 15357 13483 446Zimbabwe 5 1 3 3 3745 604 1202 1202 376
N C America 4992 5476 4891 5343 5248 2366139 3906100 2607202 2513225 2328028 444
Barbados 1 1 1 1 1
Cariado 257 247 191 184 197 117411 169163 104519 90950 118641 604Costa Rica 7 9 1 3 3 2440 4187 667 1002 1002 385Dominican Rp 0 1 1 0 0El Salvador 1 5 4 4 4 387 4506 2966 1885 1885 483Guatemala 1 2 1 1 1 813 1796 913 913 913 761Mexico 486 615 346 269 384 240247 323938 179352 139187 173685 452Panama 3 2 1299 1290TrMidadTob 3 2 2 5 5 1347 1520 1931 3391 3391 754USA 4233 4590 4342 4875 4652 2000700 3397933 2315260 2274520 2027078 436
SouthAmerica 440 528 573 680 637 231618 437572 327238 337110 320676 504
Argentina 89 88 129 158 136 45211 77920 73982 81996 71939 529Brazd 98 148 198 241 287 51982 130358 109348 114934 141227 491Chile 2 2 11 7 7 1080 1080 9111 3486 3486 528Colombia 75 66 66 79 91 38760 53222 41902 44564 48797 534Ecuador 6 6 5 12 9 3114 5667 3979 3778 4876 574Peru 17 22 19 21 18 10173 11801 10688 10180 9567 532Uruguay 7 8 10 16 17 4366 5303 4976 8328 8378 499Venezuela 147 189 134 146 72 76932 152221 73252 69844 32406 450
Asia 6563 6647 7341 7333 7736 3354858 5129879 3928121 3604840 3518591 455
BahraM 5 8 11 13 10 3296 7109 4210 5127 3584 373Bangladesh 3 3 5 13 9 1247 2497 2075 5726 4544 489China 949 1071 1584 1604 2006 631508 832738 776675 772190 876300 437Cyprus 4 4 4 3 3 2257 2937 2570 2069 2069 647India 78 84 179 190 170 36774 59431 68040 77466 61069 359Indonesia 483 475 392 533 533 231665 231400 202796 251791 251791 472Iran 3 14 18 22 26 1939 11160 7953 10132 10243 402Israel 51 70 80 66 66 24283 41927 41481 37863 35150 535Japan 2857 2669 2538 2572 2394 1435400 2188675 1397228 1293489 1140950 477Jordan 1 2 5 10 10 608 2173 2735 5559 5559 562Korea 0 P Rp 53 49 22 9 12 23491 37472 9410 3822 3869 336Korea Rep 1452 1479 1766 1525 1413 657346 1146069 959505 731687 622158 440Kuwait 6 9 4 4 4 3877 6450 1806 1806 1806 440Lebanon 6 12 15 17 17 2834 6701 6885 6277 6277 371Malaysia 52 42 71 60 40 25354 30069 30958 26342 19586 491Pakistan 64 43 29 34 32 21500 17490 25476 26112 15190 473PhilippMes 48 52 82 91 81 26069 43951 46577 47214 39426 487Saudi Arabia 72 93 83 35 52 34070 48322 47535 23688 27430 528Singapore 24 29 30 30 365 11665 24221 22070 22070 152437 418Sri Lanka 1 2 2 4 4 341 2180 2180 1728 1728 428SyrM 2 2 8 10 10 1235 1295 3561 3874 3874 408Thailand 153 185 192 197 127 82399 164493 119279 103837 70345 554Turkey 179 213 192 247 285 86956 194551 130340 123948 135675 476Untd Arab Ern 3 3 9 9 14 1063 1063 4295 4295 5422 387Viet Nam 9 30 19 33 52 5708 22616 11335 15232 20673 400Yemen 5 3 1 1 0 1363 2592 433 319 201 526
Europe 11709 11580 11966 13034 13400 5976011 9522497 6608601 6426113 6653647 497
Austria 422 392 396 479 526 215511 215621 224391 240257 245382 467Bel-Lux 408 432 456 440 440 210416 369532 242399 216095 216095 491Belarus 5 2 2 2289 834 834 463BosnM Herzg 0 0 0 0 2
Bulgaria 1 1 16 5 5 616 661 7357 2582 2582 516Croafia 6 9 5 4 2 2691 8206 3180 1842 1147 521Czech Rep 87 77 81 91 111 44088 29459 40497 43057 50665 456Denmark 37 32 34 43 36 21438 28708 18308 21922 18540 514Finland 53 47 34 21 34 27347 37883 17577 11144 15531 457France 1869 1758 1869 1952 1932 927334 1417309 986686 965321 895920 464Germany 3292 3167 3079 3448 3465 1818950 2790521 1838614 1701772 1708000 493Greece 78 71 59 109 116 38940 51466 30315 56839 77433 668Hungary 22 24 102 91 126 11086 19032 53120 47422 53174 422IreMnd 7 5 6 10 16 4794 4377 4162 6281 12648 791Italy 2174 2228 2345 2495 2581 1039833 1788653 1191540 1184488 1404631 544LatyM 1 2 2 1 0
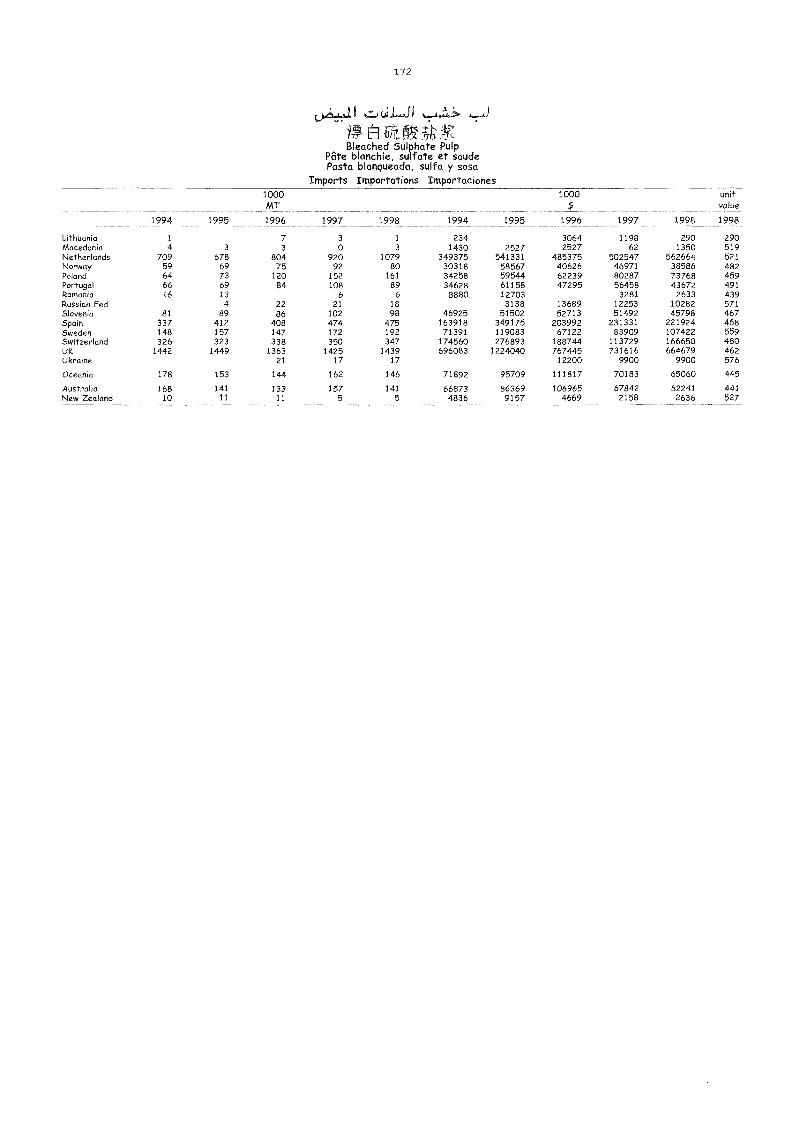
172
Bleached Sulphate PulpPate blanchie, sulfate et soudePasta blanqueada, sulfa y sosa
Imports Importations Importaciones
1994 1995
1000MT
1996 1997 1998 1994 1995
1000$
1996 1997 1998
unitvalue
1998
Lithuania 1 7 3 1 234 3064 1198 290 290Macedonia 4 3 3 0 3 1430 2527 2527 62 1350 519Netherlands 709 678 804 920 1079 349375 541331 485375 502547 562664 521Norway 59 69 75 92 80 30318 58567 40626 46971 38586 482Poland 64 73 120 152 161 34258 59544 62239 80287 73768 459Portugal 66 69 84 108 89 34628 61158 47295 56458 43672 491Romania 16 13 6 6 8880 12703 3281 2633 439Russian Fed 4 22 21 18 3138 13689 12253 10282 571Slovenia 81 89 86 102 98 46925 51502 52713 51492 45798 467Spain 337 412 408 474 475 163918 349175 203992 231331 221924 468Sweden 148 157 147 172 192 71391 119083 67122 83909 107422 559Switzerland 326 323 338 350 347 174560 276893 188744 113729 166650 480UK 1442 1449 1363 1425 1439 696083 1224040 767445 731616 664679 462Ukraine 21 17 17 12200 9900 9900 576
Oceania 178 153 144 162 146 71892 95709 111817 70183 65060 445
Australia 168 141 133 157 141 66873 86369 106965 67842 62241 441New Zealand 10 11 11 5 5 4836 9157 4669 2158 2636 527
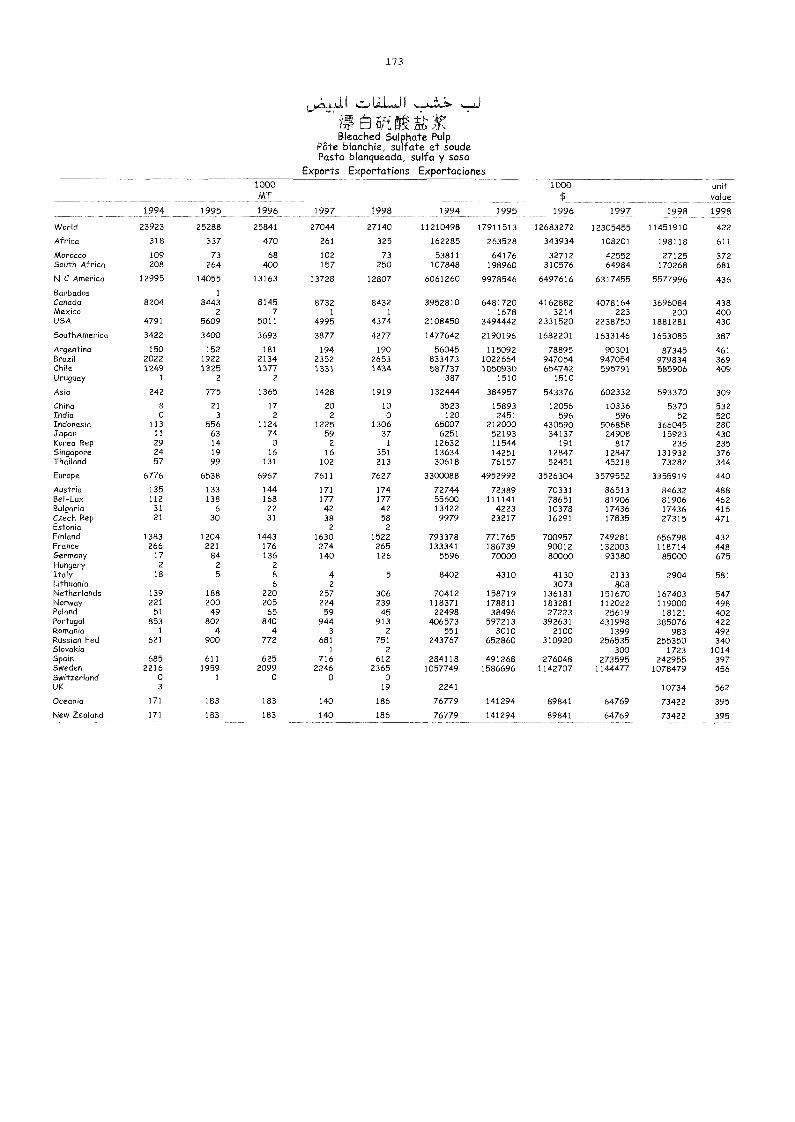
173
ILL...1 I
Bleached Sulphate PulpPate blanchie, sulfate et soudePasta blanqueada, sulfa y sosa
Exports Exportations Exportaciones1000
AAT
1000s
unitvalue
1994 1995 1996 1997 1998 1994 1995 1996 1997 1998 1998
VVorld 23923 25288 25841 27044 27140 11210498 17911513 12683272 12305455 11451910 422
Africa 318 337 470 261 325 162285 263528 343934 108201 198118 611
Morocco 109 73 68 102 73 53811 64176 32712 42552 27125 372South AfHca 208 264 400 157 250 107848 198960 310576 64984 170268 681
N C America 12995 14055 13163 13728 12807 6061260 9978546 6497616 6317455 5577996 436
Barbados 1
Canada 8204 8443 8145 8732 8432 3952810 6481720 4162882 4078164 3696084 438Mexico 2 7 1 1 1678 3214 223 200 400USA 4791 5609 5011 4995 4374 2108450 3494442 2331520 2238750 1881281 430
SouthArnerica 3422 3400 3693 3877 4277 1477642 2190196 1682201 1633146 1653085 387
Argentina 150 152 181 194 190 56045 115092 78895 90301 87345 461Brazil 2022 1922 2134 2352 2653 833473 1022664 947054 947054 979834 369Chile 1249 1325 1377 1331 1434 587737 1050930 654742 595791 585906 409Uruguay 1 2 2 387 1510 1510
Asia 242 775 1365 1428 1919 132444 384957 543376 602332 593370 309
China 8 21 17 20 10 3523 15893 12056 10336 5370 532India 0 3 2 2 0 120 2451 596 596 52 520Indonesia 113 556 1124 1225 1306 65007 212000 430590 506858 366045 280Japan 11 63 74 59 37 6251 52193 34137 24908 15923 430Korea Rep 29 14 0 2 1 12632 11544 191 817 235 235Singapore 24 19 16 16 351 13634 14251 12847 12847 131932 376Thailand 57 99 131 102 213 30618 76157 52451 45218 73282 344
Europe 6776 6538 6967 7611 7627 3300088 4952992 3526304 3579552 3355919 440
Austria 135 133 144 171 174 72744 72389 70331 86513 84632 488Bel-Lux 112 138 168 177 177 55600 111141 78651 81906 81906 462Bulgaria 31 6 22 42 42 13422 4223 10378 17436 17436 416Czech Rep 21 30 31 38 58 9979 23217 16291 17835 27315 471Estonia 2 2
Finland 1383 1204 1443 1630 1522 793378 771765 700957 749281 656798 432France 266 221 176 274 265 133341 186739 90012 132003 118714 448Germany 17 84 136 140 126 5596 70000 80000 93380 85000 675Hungary 2 2 2
Italy 18 5 8 4 5 8402 4310 4130 2133 2904 581Lrthuania 6 2 3073 808NetheHands 139 188 220 257 306 70412 158719 136181 151670 167403 547Norway 221 200 205 224 239 118371 178811 183281 112022 119000 498Poland 51 49 65 59 45 22498 38496 27223 25619 18121 402Portugal 853 802 840 944 913 406573 597213 392631 431998 385076 422Romania 1 4 4 3 2 551 3010 2100 1399 983 492Russian Fed 621 900 772 681 751 243767 652860 310920 256535 255350 340Slovakia 1 2 300 1723 1014Spain 685 611 625 716 612 284118 491268 276048 273595 242955 397Sweden 2216 1959 2099 2246 2365 1057749 1586696 1142707 1144477 1078479 456SwitzeHand 0 1 0 0 0UK 3 19 2241 10734 562
Oceania 171 183 183 140 186 76779 141294 89841 64769 73422 395
New Zealand 171 183 183 140 186 76779 141294 89841 64769 73422 395
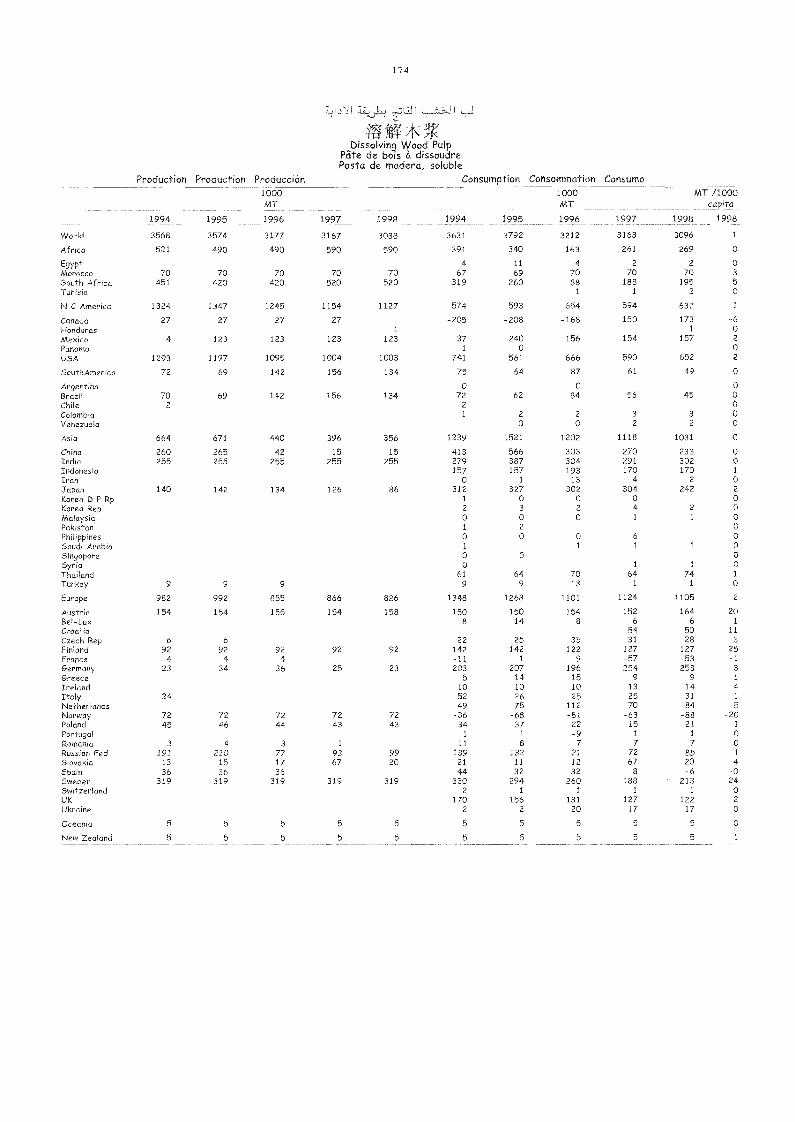
174
UJi
Dissolving Wood PulpPate de bois à dissoudrePasta de madera, soluble
Production Production Producción Consumption Consommation Consumo
1994 1995
1000MT
1996 1997 1998 1994 1995
1000MT
1996 1997
MT /1000capita
1998 1998
World 3568 3574 3177 3167 3038 3631 3792 3212 3163 3096 1
Africa 521 490 490 590 590 391 340 163 261 269 0
Egypt 4 11 4 2 2 0Morocco 70 70 70 70 70 67 69 70 70 70 3
South Africa 451 420 420 520 520 319 260 88 188 195 5Tunisia 1 1 2 0
N C America 1324 1347 1245 1154 1127 574 593 654 594 637 1
Canada 27 27 27 27 -205 -208 -168 -150 -173 -6Honduras 1 1 0Mexico 4 123 123 123 123 37 240 156 154 157 2
Panama 1 0 0USA 1293 1197 1095 1004 1003 741 561 666 590 652 2
SouthAmerica 72 69 142 156 134 75 64 87 61 49 0
Argentina 0 0 0Brazil 70 69 142 156 134 72 62 84 56 45 0Chile 2 2 0Colombia 1 2 2 3 3 0Venezuela 0 0 2 2 0
Asia 664 671 440 396 356 1239 1521 1202 1118 1031 0
China 260 265 42 15 15 413 566 303 270 233 0India 255 255 255 255 255 279 387 304 291 302 0Indonesia 157 157 193 170 170 1
Iran o 1 13 4 2 0Japan 140 142 134 126 86 312 327 302 304 242 2
Korea i) P Rp 1 o o o 0Korea Rep 2 3 2 4 2 0Malaysia 0 0 0 1 1 0
Pakistan 1 2 o
Philippines 0 0 0 6 0
Saudi Arabia 1 1 1 1 0Singapore 0 5 o
Syria 0 1 1 0Thailand 61 64 70 64 74 1
Turkey 9 9 9 9 9 13 1 1 0
Europe 982 992 855 866 826 1348 1268 1101 1124 1105 2
Austria 154 154 155 154 158 150 150 154 152 164 20Bel-Lux 8 14 8 6 6 1
Croatia 54 50 11
Czech Rep 6 6 22 25 35 31 28 3
Finland 92 92 92 92 92 142 142 122 127 127 25France 4 4 4 -11 1 9 -57 -53 -1Germany 23 34 36 25 23 203 207 196 254 253 3
Greece 5 14 15 9 9 1
Ireland 10 10 10 13 14 4
Italy 24 52 26 25 25 31 1
Netherlands 49 75 112 70 84 5
Norway 72 72 72 72 72 -36 -68 -81 -63 -88 -20Poland 45 46 44 43 43 34 37 22 15 21 1
Portugal 1 1 -9 1 1 0
Romania 3 4 3 1 11 8 7 7 7 0
Russian Fed 191 210 77 93 99 139 132 21 72 85 1
Slovakia 13 15 17 67 20 21 11 12 67 20 4
Spain 36 36 36 44 32 32 8 -6 -0Sweden 319 319 319 319 319 330 294 260 188 213 24Switzerland 2 1 1 1 1 oUK 170 156 131 127 122 2
Ukraine 2 2 20 17 17 o
Oceania 5 5 5 5 5 5 5 5 5 5 0
New Zealand 5 5 5 5 5 5 1
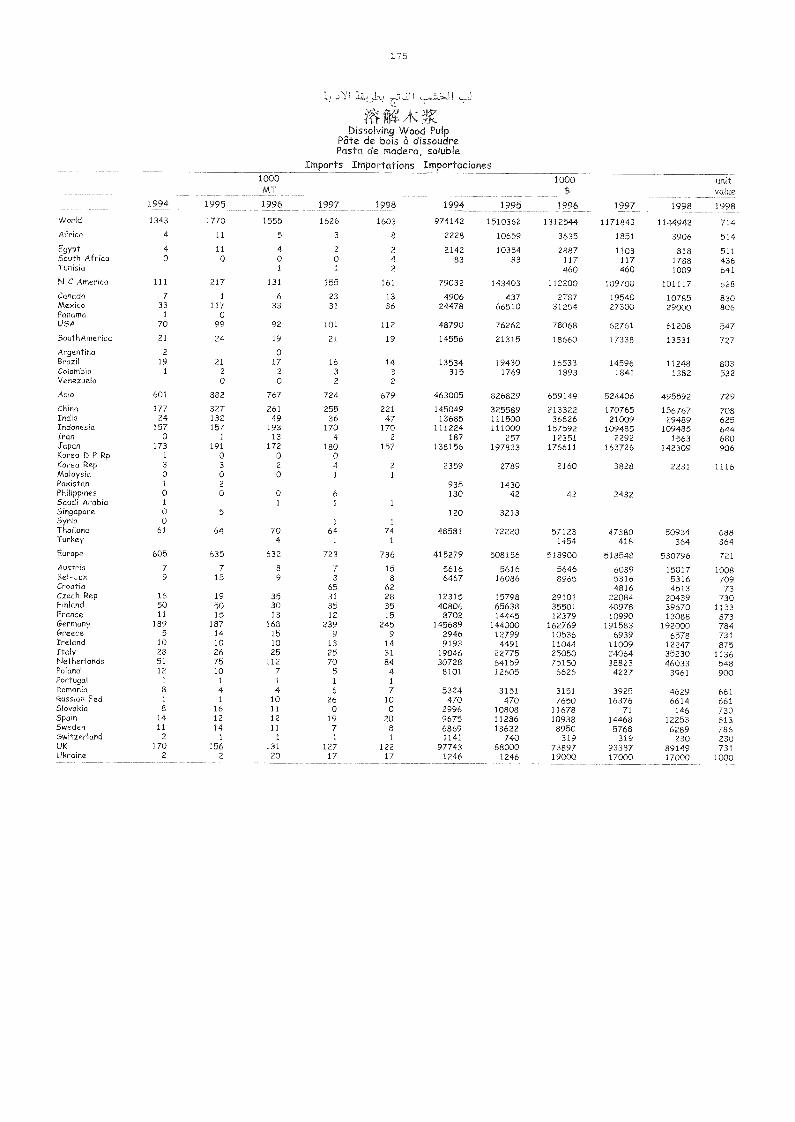
1 7 5
Dissolvrng Wood PulpPate de bors a dissoudrePasta de madera, soluble
Imports Importations Importaciones
1994 1995
1000MT
1996 1997 1998 1994 1995
1000$
1996 1997 1998 paqWorld 1343 1770 1555 1626 1603 974142 1510362 1312544 1171843 1144942 714Africa 4 11 5 3 8 2228 10659 3635 1851 3906 514
Egypt 4 11 4 2 2 2142 10354 2887 1103 818 511South Africa 0 0 0 0 4 83 83 117 117 1788 436Tunisia 1 1 2 460 460 1089 641
N C America 111 217 131 155 161 79032 143403 112200 109700 101117 628Canada 7 1 6 23 13 4906 437 2787 19548 10785 830Mexico 33 117 33 31 36 24478 66510 31254 27300 29000 806Panama 1 0USA 70 99 92 101 112 48790 76262 78068 52761 61208 547SouthAmerica 21 24 19 21 19 14556 21315 18660 17338 13531 727Argentina 2 0Brazil 19 21 17 16 14 13534 19430 16533 14596 11248 803Colombia 1 2 2 3 3 315 1769 1893 1841 1382 532Venezuela 0 0 2 2
Asia 601 882 767 724 679 463005 826829 659149 524406 495592 729China 177 327 261 255 221 145049 325589 213322 170765 156767 708India 24 132 49 36 47 13685 111500 36826 21009 29489 625Indonesia 157 157 193 170 170 111224 111000 157592 109485 109485 644Iran 0 1 13 4 2 187 257 12351 2292 1563 680Japan 173 191 172 180 157 138156 197833 176611 163726 142309 906Korea 0 P Rp 1 0 0 0Korea Rep 3 3 2 4 2 2359 2789 2160 3828 2231 1116Malaysia 0 0 0 1 1
Pakistan 1 2 935 1430Philippines 0 0 0 6 180 42 42 2432SaudiArabin 1 1 1 1
Singapore 0 5 120 3213Syria 0 1 1
Thailand 61 64 70 64 74 48581 72220 57123 47380 50934 688Turkey 4 1 1 1454 418 364 364
Europe 605 635 632 723 736 415279 508156 518900 518548 530796 721
Austria 7 7 8 7 15 5616 5616 5646 6039 15017 10088el-Lux 9 15 9 8 8 6467 16086 8965 5316 5316 709Croatia 65 62 4816 4513 73Czech Rep 16 19 35 31 28 12315 15798 29101 22084 20439 730Finland 50 50 30 35 35 40806 65638 35501 40978 39670 1133France 11 15 13 12 15 8702 14445 12379 10990 13088 873Germany 189 187 168 239 245 145689 144000 162769 191583 192000 784Greece 5 14 15 9 9 2946 12799 10536 6939 6578 731Ireland 10 10 10 13 14 9193 4491 11044 11009 12247 875Italy 28 26 25 25 31 19046 22775 25050 24064 35230 1136Netherlands 51 75 112 70 84 30728 64159 75150 38823 46033 548Poland 12 10 7 5 4 8101 12605 6626 4227 3961 900Portugal 1 1 1 1 1
Romania 8 4 4 6 7 5324 3151 3151 3925 4629 661Russian Fed 1 1 10 26 10 470 470 7650 16376 6614 661Slovakia 8 16 11 0 0 2996 10808 11678 71 146 730Spain 14 12 12 19 20 9675 11286 10938 14468 12253 613Sweden II 14 11 7 8 6869 13622 8950 5768 6289 786Switzerland 2 1 1 1 1 1141 740 319 319 230 230UK 170 156 131 127 122 97743 88000 73897 93387 89149 731Ukraine 2 2 20 17 17 1246 1246 19000 17000 17000 1000
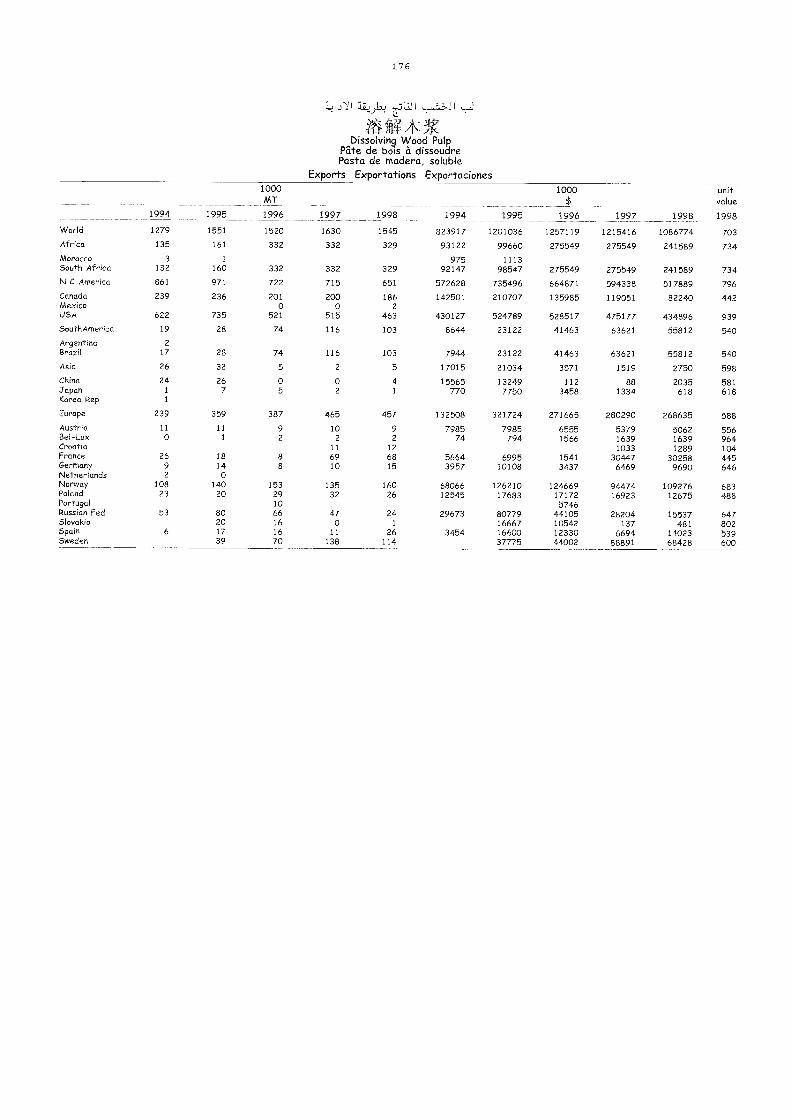
176
gr7fg?Kbissolvinq Wood Pulp
Pate de tools à dissoudrePasta de madera, soluble
Exports Exportations Exportaciones
1994 1995
1000MT
1996 1997 1998 1994 1995
1000$
1996 1997 1998
unitvalue
1998
World 1279 1551 1520 1630 1545 823917 1201036 1257119 1215416 1086774 703Africa 135 161 332 332 329 93122 99660 275549 275549 241589 734Morocco 3 1 975 1113South Africa 132 160 332 332 329 92147 98547 275549 275549 241589 734N C America 861 971 722 715 651 572628 735496 664871 594338 517889 796Canada 239 236 201 200 186 142501 210707 135985 119051 82240 442Mexico 0 0 2USA 622 735 521 515 463 430127 524789 528517 475177 434896 939SouthAmerica 19 28 74 116 103 8644 23122 41463 63621 55812 540Argentina 2
Brazil 17 28 74 116 103 7944 23122 41463 63621 55812 540Asia 26 32 5 2 5 17015 21034 3571 1519 2750 598China 24 26 0 0 4 15565 13249 112 88 2035 581Japan 1 7 5 2 1 770 7750 3458 1334 618 618Korea Rep 1
Europe 239 359 387 465 457 132508 321724 271665 280290 268635 588Austria 11 11 9 10 9 7985 7985 6555 5379 5062 556Bel-Lux 0 1 2 2 2 74 794 1566 1639 1639 964Croatia 11 12 1033 1289 104France 26 18 8 69 68 5664 6995 1541 30447 30258 445Germany 9 14 8 10 15 3957 10108 3437 6469 9690 646Netherlands 2 0Norway 108 140 153 135 160 68066 126210 124669 94474 109276 683Poland 23 20 29 32 26 12545 17683 17172 16923 12675 488Portugal 10 5746Russian Fed 53 80 66 47 24 29673 80779 44105 28204 15537 647Slovakia 20 16 0 1 16667 10542 137 481 802Spain 6 17 16 11 26 3454 16600 12330 6694 14023 539Sweden 39 70 138 114 3/7/5 44002 88891 68428 600
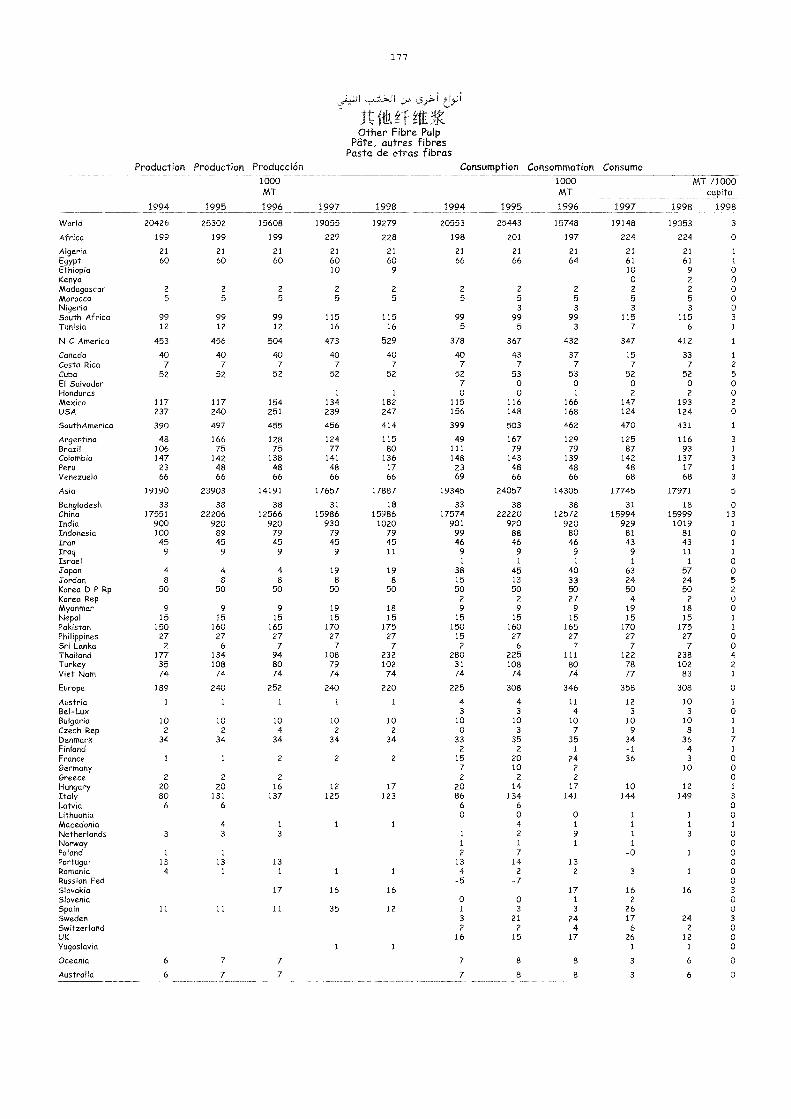
177
J-t it kf kit '7'gOther Fibre Pulp
Pate, autres fibresPasta de otras fibras
Production Production Producción Consumption Consommation Consumo
1994 1995
1000MT
1996 1997 1998 1994 1995
1000MT
1996 1997
MT /1000capita
1998 1998
World 20426 25302 15608 19055 19279 20553 25443 15748 19148 19353 3
Africa 199 199 199 229 228 198 201 197 224 224 0
Algeria 21 21 21 21 21 21 21 21 21 21 1
Egypt 60 60 60 60 60 66 66 64 61 61 1
Ethiopia 10 9 10 9 0Kenya 0 2 0Madagascar 2 2 2 2 2 2 2 2 2 2 0Morocco 5 5 5 5 5 5 5 5 5 5 0Nigeria 3 3 3 3 0South Africa 99 99 99 115 115 99 99 99 115 115 3
Tunisia 12 12 12 16 16 5 5 3 7 6 1
N C America 453 456 504 473 529 378 367 432 347 412 1
Canada 40 40 40 40 40 40 43 37 15 33 1
Costa Rica 7 7 7 7 7 7 7 7 7 7 2
Cuba 52 52 52 52 52 52 53 53 52 52 5El Salvador 7 0 0 0 0 0Honduras 1 1 0 o 1 2 2 0Mexico 117 117 154 134 182 115 116 166 147 193 2
USA 237 240 251 239 247 156 148 168 124 124 0
SouthAmerica 390 497 455 456 414 399 503 462 470 431 1
Argentina 48 166 128 124 115 49 167 129 125 116 3
Brazil 106 75 75 77 80 111 79 79 87 93 1
Colombia 147 142 138 141 136 148 143 139 142 137 3
Peru 23 48 48 48 17 23 48 48 48 17 1
Venezuela 66 66 66 66 66 69 66 66 68 68 3
Asia 19190 23903 14191 17657 17887 19345 24057 14305 17745 17971 5
Bangladesh 33 38 38 31 18 33 38 38 31 18 0China 17551 22206 12566 15986 15986 17574 22220 12572 15994 15999 13India 900 920 920 930 1020 901 920 920 929 1019 1
Indonesia 100 89 79 79 79 99 88 80 81 81 0Iran 45 45 45 45 45 46 46 46 43 43 1
Iraq 9 9 9 9 11 9 9 9 9 11 1
Israel 1 1 1 1 1 oJapan 4 4 4 19 19 38 45 40 63 57 0Jordan 8 8 8 8 8 15 13 33 24 24 5
Korea D P Rp 50 50 50 50 50 50 50 50 50 50 2
Korea Rep 2 2 27 4 2 0Myanmar 9 9 9 19 18 9 9 9 19 18 0Nepal 15 15 15 15 15 15 15 15 15 15 1
Pakistan 150 160 165 170 175 150 160 165 170 175 1
Philippines 27 27 27 27 27 15 27 27 27 27 0Sri Lanka 2 6 7 7 7 2 6 7 7 7 0Thailand 177 134 94 108 232 280 225 111 122 238 4Turkey 35 108 BO 79 102 31 108 80 78 102 2
Viet Nam 74 74 74 74 74 74 74 74 77 83 I
Europe 189 240 252 240 220 225 308 346 358 308 0
Austria 1 1 1 1 1 4 4 11 12 10 1
Bel-Lux 3 3 4 3 3 0Bulgaria 10 10 10 10 10 10 10 10 10 10 1
Czech Rep 2 2 4 2 2 0 3 7 9 8 1
Denmark 34 34 34 34 34 33 35 35 34 36 7Finland 2 2 I -1 4 1
France 1 1 2 2 2 15 20 24 36 3 0Germany 7 10 2 10 0Greece 2 2 2 2 2 2 0Hungary 20 20 16 12 17 20 14 17 10 12 1
Italy 80 131 137 125 123 86 134 141 144 149 3
Latvia 6 6 6 6 0Lithuania 0 0 0 1 1 0Macedonia 4 1 1 1 4 1 1 1 1
Netherlands 3 3 3 1 2 9 1 3 0Norway 1 1 1 1 0Poland 1 1 2 7 -0 1 0Portugal 13 13 13 13 14 13 0Romania 4 1 1 1 1 4 2 2 3 I 0Russian Fed -5 -7 0Slovakia 17 16 16 17 16 16 3
Slovenia 0 0 I 2 0Spain 11 11 11 35 12 1 3 3 26 0Sweden 3 21 24 17 24 3
Switzerland 2 2 4 6 2 0UK 16 15 17 26 12 0Yugoslavia 1 1 1 1 0
Oceania 6 7 7 7 8 8 3 6 0
Australia 6 7 7 7 8 8 3 6 0
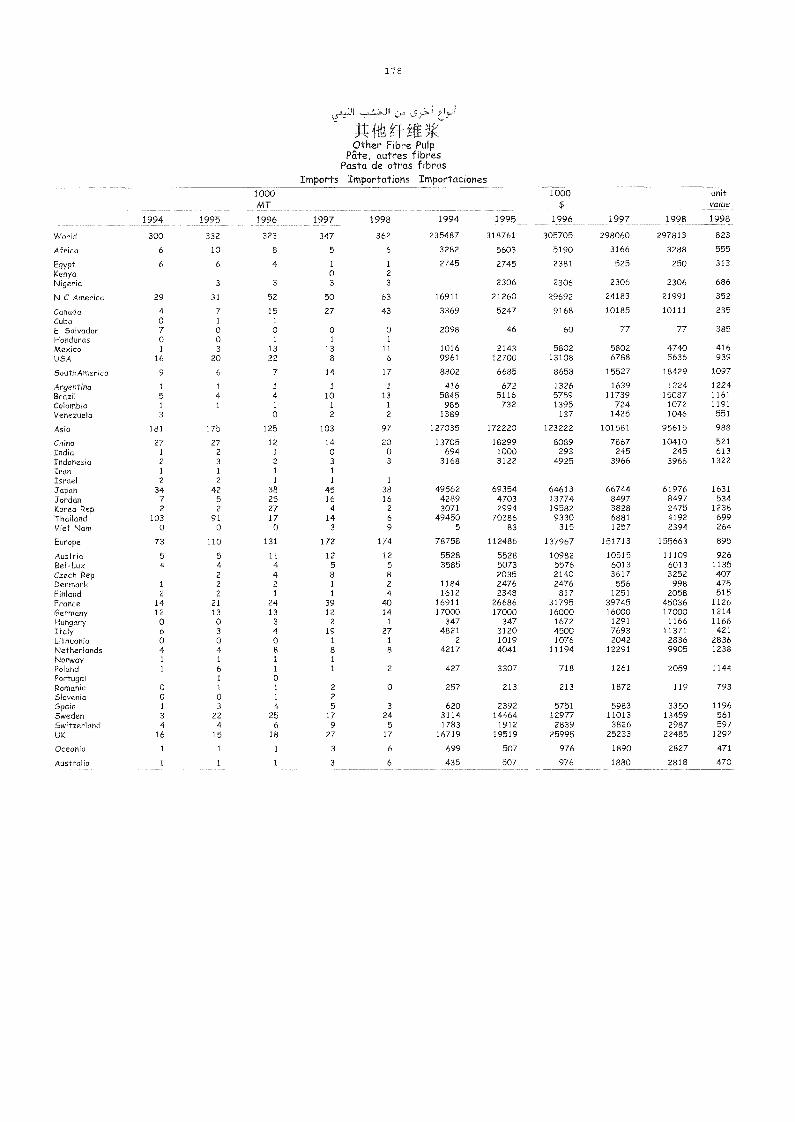
178
:57.1
J4:C)ther Fibre Pulp
Pâte, autres fibresPasta de otras fibras
Imports Innportations Importaciones
1994 1995
1000MT
1996 1997 1998 1994 1995
1000$
1996 1997 1998
unitvalue
1998
World 300 332 323 347 362 235487 318761 305705 298060 297813 823
Africa 6 10 8 5 6 3282 5603 5190 3166 3288 555
Egypt 6 6 4 1 1 2745 2745 2381 525 250 313Kenya 0 2
Nigeria 3 3 3 3 2306 2306 2306 2306 686
N C America 29 31 52 50 63 16911 21260 29692 24183 21991 352
Canada 4 7 15 27 43 3369 5247 9168 10185 10111 235
Cuba 0 1 1
El Salvador 7 0 0 0 0 2098 46 60 77 77 385Honduras 0 0 1 1 1
Mexico 1 3 13 13 11 1016 2143 5802 5802 4740 416USA 16 20 22 8 6 9961 12700 13108 6788 5636 939
SouthAmerica 9 6 7 14 17 8802 6685 8658 15527 18429 1097
Argentina 1 1 1 1 1 416 672 1326 1639 1224 1224Brazil 5 4 4 10 13 5845 5116 5759 11739 15087 1161Colombia 1 1 1 1 1 985 732 1395 724 1072 1191
Venezuela 3 0 2 2 1389 137 1425 1046 551
Asia 181 175 125 103 97 127035 172220 123222 101581 95615 988
China 27 27 12 14 20 13705 18299 8089 7867 10410 521India 1 2 1 0 0 694 1000 293 245 245 613Indonesia 2 3 2 3 3 3168 3122 4925 3966 3966 1322Iran 1 1 1 1
Israel 2 2 1 1 1
Japan 34 42 38 45 38 49562 69354 64613 66744 61976 1631Jordan 7 5 25 16 16 4289 4703 13774 8497 8497 534Korea Rep 2 2 27 4 2 3071 2994 19582 3828 2475 1238Thadand 103 91 17 14 6 49450 70386 9330 6881 4192 699Viet Nam 0 0 0 3 9 5 83 315 1257 2394 264
Europe 73 110 131 172 174 78758 112486 137967 151713 155663 895
Austria 5 5 11 12 12 5528 5528 10982 10515 11109 926Bel-Lux 4 4 4 5 5 3585 5073 5576 6013 6013 1135Czech Rep 2 4 8 8 2035 2140 3617 3252 407Denmark 1 2 2 1 2 1184 2476 2476 556 998 475FMland 2 2 1 1 4 1612 2348 817 1251 2058 515France 14 21 24 39 40 16911 26686 31795 39745 45036 1126Germany 12 13 13 12 14 17000 17000 16000 16000 17000 1214Hungary 0 0 3 2 1 347 347 1672 1291 1166 1166Italy 6 3 4 19 27 4821 3120 4500 7693 11371 421Lithuania 0 0 0 1 1 2 1019 1076 2042 2836 2836Netherlands 4 4 8 8 8 4217 4041 11194 12291 9905 1238Norway 1 1 1 1
Poland 1 6 1 1 2 427 3307 718 1261 2059 1144Portugal 1 0Romania 0 1 1 2 0 257 213 213 1872 119 793Slovenia 0 0 1 2
SpaM 1 3 4 5 3 620 2392 5751 5983 3350 1196Sweden 3 22 25 17 24 3114 14464 12977 11013 13459 561Switzerland 4 4 6 9 5 1783 1912 2839 3826 2987 597UK 16 15 18 27 17 16719 19519 25995 25233 22485 1292
Oceania 1 1 1 3 6 699 507 976 1890 2827 471
Australia 1 1 1 3 6 435 507 976 1880 2818 470
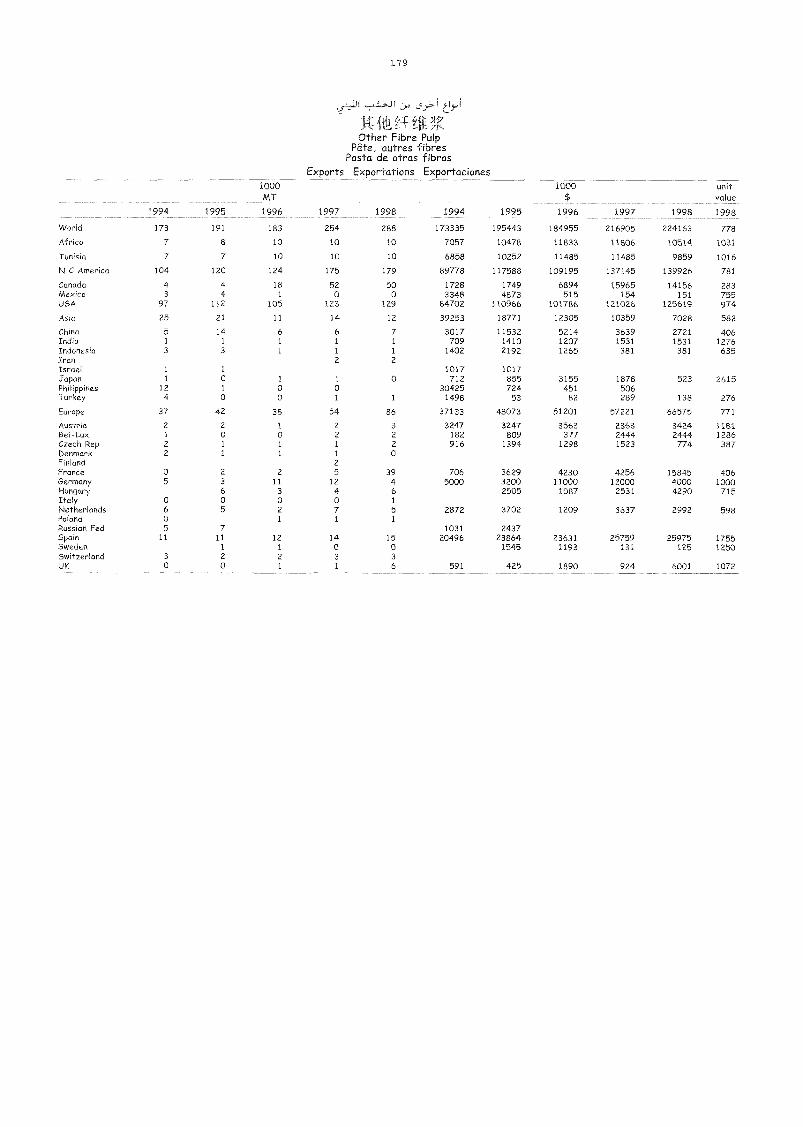
179
Other Fibre PulpPate, autres fibres
Pasta de otras fibrasExports Exportations Exportaciones
1994 1995
1000MT
1996 1997 1998 1994 1995
1000$
1996 1997 1998
unitvalue
1998
VVorld 173 191 183 254 288 173335 195443 184955 216905 224163 778
Africa 7 8 10 10 10 7057 10478 11833 11806 10514 1031
Tunisia 7 7 10 10 10 6858 10252 11485 11485 9859 1016
N C America 104 120 124 175 179 89778 117588 109195 137145 139926 781
Canada 4 4 18 52 50 1728 1749 6894 15965 14156 283Mexico 3 4 1 0 0 3348 4873 515 154 151 755USA 97 112 105 123 129 84702 110966 101786 121026 125619 974Asia 25 21 11 14 12 39253 18771 12305 10359 7028 582
China 5 14 6 6 7 3017 11532 5214 3639 2721 406India 1 1 1 1 1 709 1410 1207 1531 1531 1276Indonesia 3 3 1 1 1 1402 2192 1265 381 381 635Iran 2 2
Israel 1 1 1017 1017Japan 1 0 1 1 0 712 855 3155 1878 523 2615PhilippMes 12 1 0 0 30425 724 451 506Turkey 4 0 0 1 1 1498 53 82 289 138 276
Europe 37 42 38 54 86 37133 48073 51201 57221 66575 771
Austria 2 2 1 2 3 3247 3247 3563 2363 3424 1181Bel-Lux 1 0 0 2 2 182 809 377 2444 2444 1286Czech Rep 2 1 1 1 2 916 1394 1298 1523 774 387Denmark 2 1 1 1 0Finland 2France 0 2 2 5 39 706 3629 4230 4256 15845 406Germany 5 3 11 12 4 5000 3200 11000 12000 4000 1000Hungary 6 3 4 6 2505 1087 2531 4290 715Italy 0 0 0 0 1
NetherMnds 6 5 2 7 5 2872 3702 1209 3637 2992 598PoMnd 0 1 1 1
RussMn Fed 5 7 1031 2437SpaM 11 11 12 14 15 20496 23864 23631 25759 25975 1755Sweden 1 1 0 0 1545 1193 131 125 1250SwitzerMnd 3 2 2 3 3
UK 0 0 1 1 6 591 425 1890 924 6001 1072
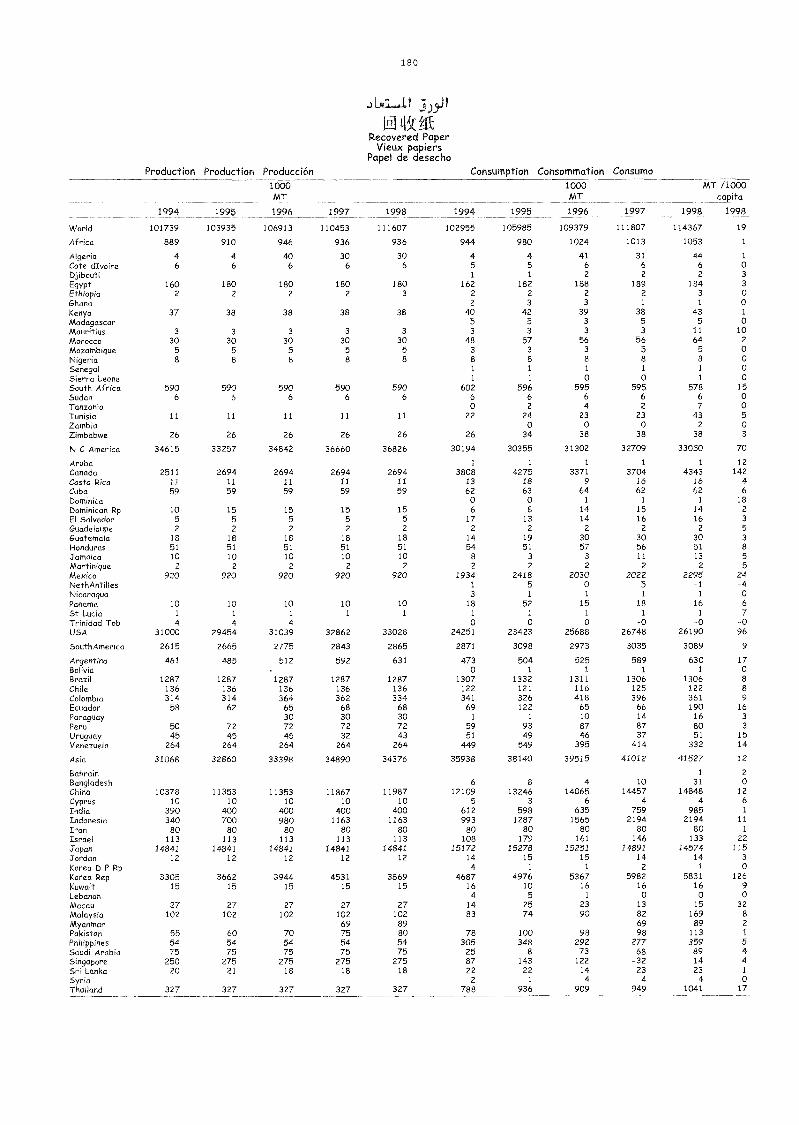
1 8 0
J 5)J,11
Recovered PaperVieux papiers
Papel de desechoProduction Production Producción Consumption Consommation Consumo
1994 1995
1000MT
1996 1997 1998 1994 1995
1000MT
1996 1997
MT /1000capita
1998 1998
World 101739 103935 106913 110453 111607 102955 105985 109379 111807 114367 19
Africa 889 910 946 936 936 944 980 1024 1013 1053 1
Algeria 4 4 40 30 30 4 4 41 31 44 1
Cote dIvoire 6 6 6 6 6 5 5 6 6 6 oDjibouti 1 1 2 2 2 3
Egypt 160 180 180 180 180 162 182 188 189 184 3
Ethiopia 2 2 2 2 3 2 2 2 2 3 oGhana 2 3 3 1 1 oKenya 37 38 38 38 38 40 42 39 38 43 1
Madagascar 5 5 3 5 5 oMauritius 3 3 3 3 3 3 3 3 3 11 10
Morocco 30 30 30 30 30 48 57 56 56 64 2
Mozambique 5 5 5 5 5 3 3 3 5 5 0
Nigeria 8 8 8 8 8 8 8 8 8 8 o
Senegal 1 1 1 1 1 0
Sierra Leone 1 1 o o 1 0
South Africa 590 590 590 590 590 602 596 595 595 578 15
Sudan 6 6 6 6 6 6 6 6 6 6 oTanzania o 2 4 2 7 o
Tunisia 11 11 11 11 11 22 24 23 23 43 5
Zambia o o 0 2 oZimbabwe 26 26 26 26 26 26 34 38 38 38 3
N C America 34615 33257 34842 36660 36826 30194 30355 31302 32709 33050 70
Aruba 1 1 1 1 1 12Canada 2511 2694 2694 2694 2694 3808 4275 3371 3704 4343 142Costa Rica 11 11 11 11 11 13 18 9 16 16 4Cuba 59 59 59 59 59 62 63 64 62 62 6
Dominica o o 1 1 1 18Dominican Rp 10 15 15 15 15 6 8 14 15 14 2
El Salvador 5 5 5 5 5 17 13 14 16 16 3
Guadeloupe 2 2 2 2 2 2 2 2 2 2 5
Guatemala 18 18 18 18 18 14 19 30 30 30 3
Honduras 51 51 51 51 51 54 51 57 56 51 8
Jamaica 10 10 10 10 10 8 3 3 11 13 5Martinique 2 2 2 2 2 2 2 2 2 2 5Mexico 920 920 920 920 920 1934 2418 2030 2022 2295 24NethAntilles 1 5 o 5 -1 -4Nicaragua 3 1 1 1 1 0
Panama 10 10 10 10 10 18 52 15 18 16 6
St Lucia 1 1 1 1 1 1 1 1 1 1 7Trinidad Tob 4 4 4 o 0 o -o -o -0USA 31000 29454 31039 32862 33028 24251 23423 25688 26748 26190 96
SouthAmerica 2615 2665 2775 2843 2865 2871 3098 2973 3035 3089 9
Argentina 461 485 512 592 631 473 504 525 589 630 17Bolivia o 1 1 1 1 0Brazil 1287 1287 1287 1287 1287 1307 1332 1311 1306 1306 8
Chile 136 136 136 136 136 122 121 116 125 122 8
Colombia 314 314 364 362 334 341 326 418 396 361 9
Ecuador 58 62 65 68 68 69 122 65 66 190 16Paraguay 30 30 30 1 1 10 14 16 3
Peru 50 72 72 72 72 59 93 87 87 80 3
Uruguay 45 45 45 32 43 51 49 46 37 51 15Venezuela 264 264 264 264 264 449 549 395 414 332 14
Asia 31068 32860 33398 34890 34376 35938 38140 39515 41012 41527 12
Bahrain 1 2
Bangladesh 6 8 4 10 31 oChina 10378 11353 11353 11867 11987 12109 13246 14065 14457 14848 12
Cyprus 10 10 10 10 10 5 3 6 4 4 6
India 390 400 400 400 400 612 598 635 759 985 1
Indonesia 340 700 980 1163 1163 993 1287 1565 2194 2194 11
Iran BO 80 80 80 80 80 80 80 80 80 1
Israel 113 113 113 113 113 108 179 161 146 133 22Japan 14841 14841 14841 14841 14841 15172 15278 15251 14891 14574 115jordan 12 12 12 12 12 14 15 15 14 14 3
Korea D P Rp 4 1 1 2 1 oKorea Rep 3305 3662 3944 4531 3869 4687 4976 5367 5982 5831 126Kuwait 15 15 15 15 15 16 10 16 16 16 9
Lebanon 4 5 1 o o o
Macau 27 27 27 27 27 14 25 23 13 15 32
Malaysia 102 102 102 102 102 83 74 90 82 169 8
Myanmar 69 89 69 89 2
Pakistan 55 60 70 75 80 78 100 98 98 113 1
Philippines 54 54 54 54 54 305 348 292 277 359 5Saudi Arabia 75 75 75 75 75 25 8 73 68 89 4
Singapore 250 275 275 275 275 87 143 122 -32 14 4
Sri Lanka 20 21 18 18 18 22 22 14 23 23 1
Syria 2 1 4 4 4 0Thailand 327 327 327 327 327 788 936 909 949 1041 17
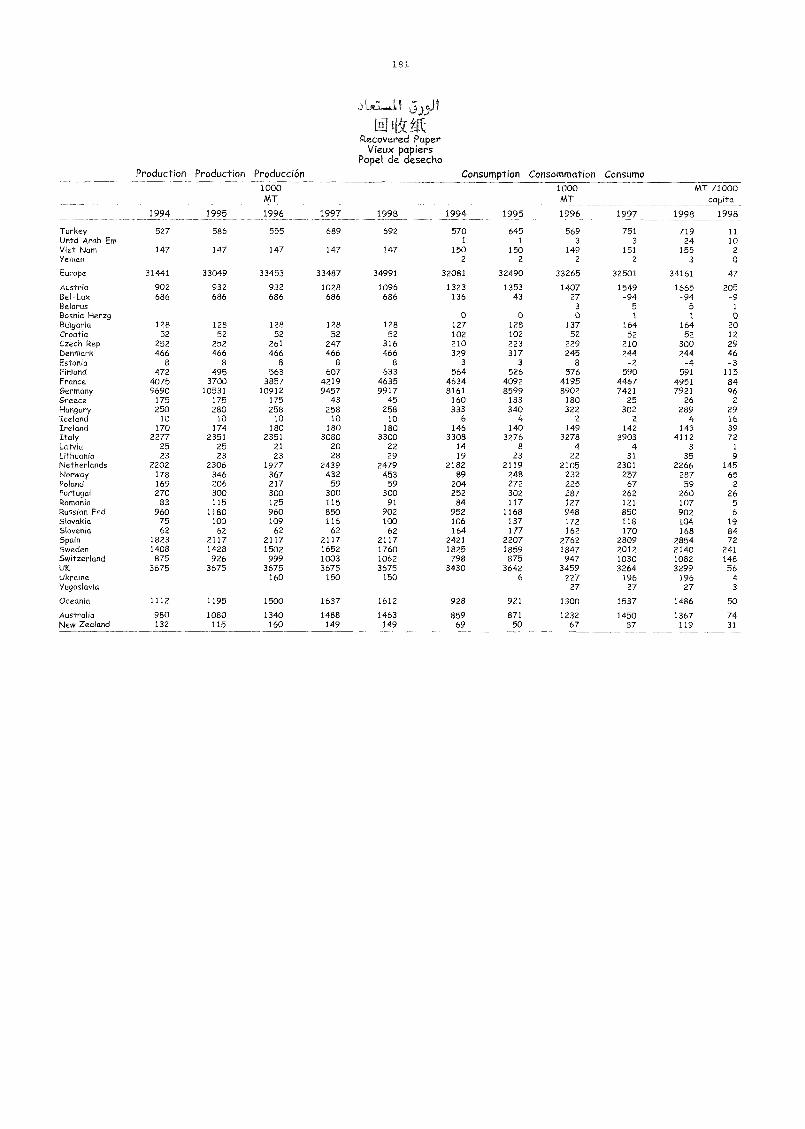
181
5,5J1
1-60-ikRecovered Paper
Vieux papiersPapel de desecho
Production Production Producción Consumption Consommation Consumo
1994 1995
1000MT
1996 1997 1998 1994 1995
1000MT
1996 1997
MT /1000capita
1998 1998
Turkey 527 586 555 689 692 570 645 569 751 719 11Unid Arab Em 1 1 3 3 24 10Viet Nam 147 147 147 147 147 150 150 149 151 155 2
Yemen 2 2 2 2 3 0
Europe 31441 33049 33453 33487 34991 32081 32490 33265 32501 34161 47
Austria 902 932 932 1028 1096 1323 1353 1407 1549 1665 205Bel -Lux 686 686 686 686 686 136 43 27 -94 -94 -9Belarus 3 5 5 1
Bosnia Herzg 0 0 0 1 1 0Bulgaria 128 128 128 128 128 127 128 137 164 164 20Croatia 52 52 52 52 52 102 102 52 52 52 12Czech Rep 252 252 261 247 316 210 223 229 210 300 29Denmark 466 466 466 466 466 329 317 245 244 244 46Estonia 8 8 8 8 8 3 3 8 -2 -4 -3Finland 472 495 563 607 633 564 526 576 590 591 115France 4075 3700 3857 4219 4635 4634 4092 4195 4467 4951 84Germany 9690 10531 10912 9457 9917 8161 8599 8902 7421 7921 96Greece 175 175 175 43 45 160 183 180 25 26 2
Hungary 250 280 258 258 258 333 340 322 302 289 29Iceland 10 10 10 10 10 6 4 2 2 4 16Ireland 170 174 180 180 180 146 140 149 142 143 39Italy 2277 2351 2351 3080 3300 3308 3276 3278 3903 4112 72Latvia 25 25 21 20 22 14 8 4 4 3 1
Lithuania 23 23 23 28 29 19 23 22 31 35 9Netherlands 2202 2306 1977 2439 2479 2182 2119 2105 2301 2266 145Norway 178 346 367 432 453 89 248 232 257 287 65Poland 169 206 217 59 59 204 272 225 67 59 2
Portugal 270 300 300 300 300 252 302 287 262 260 26Romania 83 115 125 115 91 84 117 127 121 107 5Russian Fed 960 1180 960 850 902 952 1168 948 850 902 6Slovakia 75 100 109 116 100 106 137 172 118 104 1.9
Slovenia 62 62 62 62 62 164 177 162 170 168 84Spain 1823 2117 2117 2117 2117 2421 2207 2762 2809 2854 72Sweden 1408 1428 1502 1652 1760 1825 1859 1847 2012 2140 241Switzerland 875 926 999 1003 1062 798 875 947 1030 1082 148UK 3675 3675 3675 3675 3675 3430 3642 3459 3264 3299 56Ukraine 160 150 150 6 227 196 196 4Yugoslavia 27 27 27 3
Oceania 1112 1195 1500 1637 1612 928 921 1300 1537 1486 50
Australia 980 1080 1340 1488 1463 859 871 1232 1450 1367 74New Zealand 132 115 160 149 149 69 50 67 87 119 31
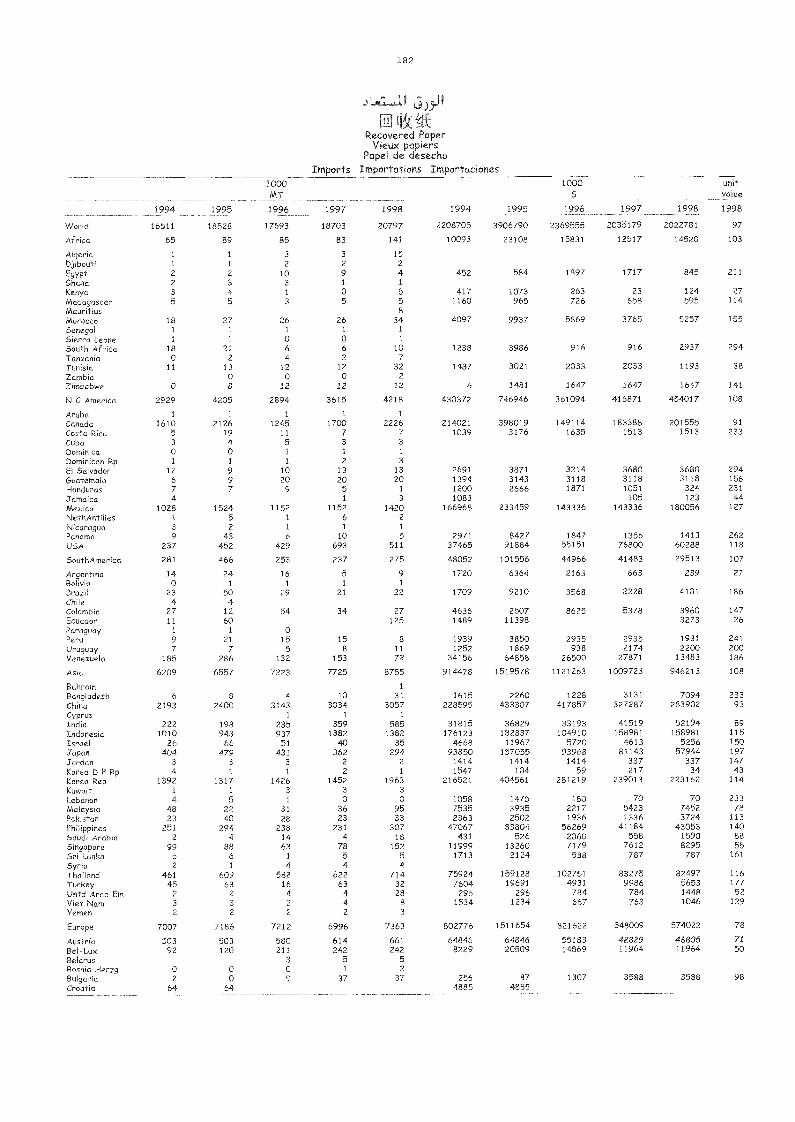
182
( .1,Recovered Paper
Vieux papiersPapel de desecho
Imports Importations Importaciones
1994 1995
1000MT
1996 1997 1998 1994 1995
1000$
1996 1997 1998
unitvalue
1998
VVoHd 16511 18528 17693 18703 20797 2208705 3906790 2369555 2035179 2022781 97
Africa 65 89 85 83 141 10093 23108 15831 12517 14520 103
Algeria 1 1 3 3 15Djibouti 1 1 2 2 2
Egypt 2 2 10 9 4 452 584 1897 1717 845 211
Ghana 2 3 3 1 1
Kenya 3 4 1 0 5 417 1073 263 23 124 27Madagascar 5 5 3 5 5 1160 965 726 658 595 114Mauritius 8
Morocco 18 27 26 26 34 4097 9937 5869 3765 5257 155
Senegal 1 1 1 1 1
Sierra Leone 1 1 0 0 1
South Africa 18 21 6 6 10 1238 3986 916 916 2937 294Tanzania 0 2 4 2 7
Tunisia 11 13 12 12 32 1487 3021 2033 2033 1193 38
Zambia 0 0 0 2
Zimbabwe 0 8 12 12 12 6 1481 1647 1647 1647 141
N C America 2929 4205 2894 3615 4218 430372 746946 361094 416871 454017 108
Aruba 1 1 1 1 1
Canada 1610 2126 1245 1700 2226 214021 398019 149114 183388 201555 91
Costa Pica 5 19 11 7 7 1039 3176 1635 1513 1513 233Cuba 3 4 5 3 3
Dominica 0 0 1 1 1
Dominican Rp 1 1 1 2 3
El Salvador 12 9 10 13 13 2691 3871 3214 3680 3680 294Guatemala 6 9 20 20 20 1394 3143 3118 3118 3118 156Honduras 7 7 9 5 1 1200 2666 1871 1051 324 231Jamaica 4 1 3 1083 105 123 44Mexico 1028 1524 1152 1152 1420 166968 233459 143336 143336 180056 127NethAntilles 1 5 1 6 2
Nicaragua 3 2 1 1 1
Panama 9 43 6 10 5 2971 8427 1847 1356 1413 262USA 237 452 429 693 511 37465 91884 55151 76800 60288 118
5outhAmerica 281 466 253 237 275 48052 101556 44966 41483 29513 107
Argentina 14 24 16 5 9 1720 6364 2163 663 239 27Bohyia 0 1 1 1 1
Brazil 23 50 29 21 22 1709 9210 3568 2228 4101 186Chile 4 4Colombia 27 12 54 34 27 4636 2507 8625 5378 3960 147Ecuador 11 60 125 1489 11398 3273 26
Paraguay 1 1 0Peru 9 21 15 15 8 1939 3850 2935 2935 1931 241
Uruguay 7 7 5 8 11 1252 1869 938 2174 2200 200Venezuela 185 286 132 153 72 34156 64858 26500 27871 13483 186
Asia 6209 6557 7223 7725 8755 914478 1519578 1121263 1009723 946213 108
BahraM 1
Bangladesh 6 8 4 10 31 1615 2260 1228 3131 7094 233China 2193 2400 3143 3034 3057 228595 433307 417857 327287 283902 93Cyprus 1 1 1
India 222 198 235 359 585 31815 36829 33193 41519 52194 89Indonesia 1010 943 937 1382 1382 176123 182837 104910 158981 158981 115Israel 26 66 51 40 35 4668 11967 5720 4613 5256 150Japan 404 479 431 362 294 93850 157055 93968 81143 57944 197Jordan 3 3 3 2 2 1414 1414 1414 337 337 147Korea D P Rip 4 1 1 2 1 1547 104 59 217 34 43
Korea Rep 1392 1317 1426 1452 1963 216521 404561 281219 239013 223162 114Kuwait 1 1 3 3 3
Lebanon 4 5 1 0 0 1058 1475 180 70 70 233Malaysia 48 22 31 36 95 7535 3935 2217 5423 7452 78Pakistan 23 40 28 23 33 2363 2502 1936 1336 3724 113PhilippMes 251 294 238 231 307 47067 83804 56269 41184 43053 140Saudi Arabia 2 4 14 4 18 431 526 2060 558 1590 88Singapore 99 88 63 78 152 11999 13260 7179 7612 8295 55Sri Lanka 6 6 1 5 5 1713 2124 538 787 787 161
Syria 2 1 4 4 4Thailand 461 609 582 622 714 75924 159128 102751 83275 82497 116Turkey 45 63 16 63 32 7604 19691 4931 9986 5653 177
Untd Arab Em 2 2 4 4 28 296 296 784 784 1448 52Viet Nam 3 3 2 4 8 1534 1234 667 763 1046 129
Yemen 2 2 2 2 3
Europe 7007 7186 7212 6996 7363 802776 1511654 821622 548009 574022 78
Austria 503 503 580 614 661 64846 64846 55183 42829 46805 71
Bel-Lux 92 120 211 242 242 8229 20509 14869 11964 11964 50Pelaras 3 5 5
Bosnia Herzg o o 0 1 2
Bulgaria 2 o 9 37 37 256 87 1307 3588 3588 98Croatia 64 64 4885 4885
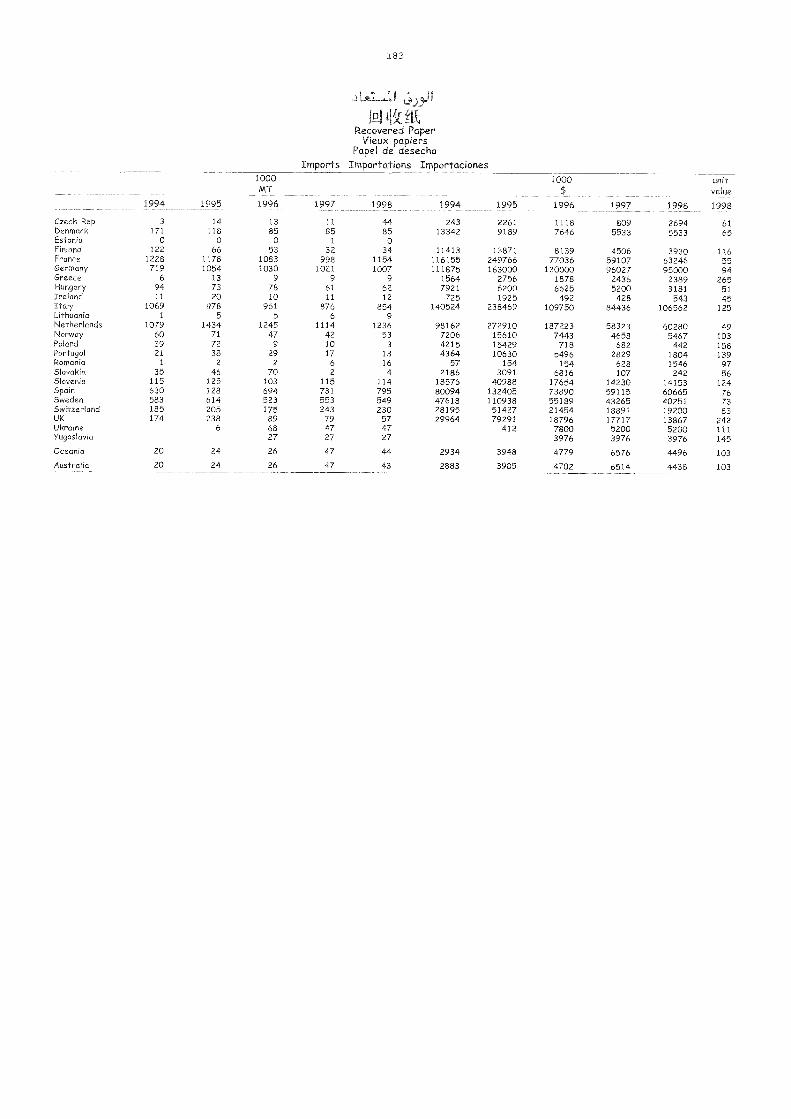
183
LAL-1. I
Recovered PaperVieux papiers
Papel de desechoImports Importations Importaciones
1000MT
1000 unitvalue
1994 1995 1996 1997 1998 1994 1995 1996 1997 1998 1998
Czech Rep 3 14 13 11 44 243 2261 1118 809 2694 61Denmark 171 118 85 85 85 13342 9189 7646 5533 5533 65Estonia 0 0 0 1 0Finland 122 66 53 32 34 11413 13871 8139 4506 3930 116France 1228 1178 1083 998 1154 116155 249766 77036 59107 63246 55Germany 719 1054 1030 1021 1007 111875 163000 130000 96027 95000 94Greece 6 13 9 9 9 1564 2756 1878 2436 2389 265Hungary 94 73 78 61 62 7921 6200 6625 5200 3181 51Ireland 11 20 10 11 12 725 1925 492 428 543 45Italy 1069 978 961 876 854 140524 238469 109750 84436 106562 125Lithuania 1 5 5 6 9Netherlands 1079 1434 1245 1114 1236 98162 272910 187223 58323 60280 49Norway 60 71 47 42 53 7206 15610 7443 4658 5467 103Poland 39 72 9 10 3 4215 15429 718 682 442 158Portugal 21 38 29 17 13 4364 10630 5496 2829 1804 139Romania 1 2 2 6 16 57 154 154 628 1546 97Slovakia 35 46 70 2 4 2186 3091 6816 107 242 56Slovenia 115 125 103 115 114 18576 40988 17654 14230 14153 124Spain 630 128 694 731 795 80094 132405 73890 59115 60665 76Sweden 583 614 523 553 549 47618 110938 55189 43265 40251 73Switzerland 185 205 175 243 230 28195 51427 21454 18891 19200 83UK 174 238 89 79 57 29964 79291 18796 17717 13867 242Ukraine 6 68 47 47 412 7800 5200 5200 111Yugoslavia 27 27 27 3976 3976 3976 145Oceania 20 24 26 47 44 2934 3948 4779 6576 4496 103
Australia 20 24 25 47 43 2883 3905 4702 6514 4438 103
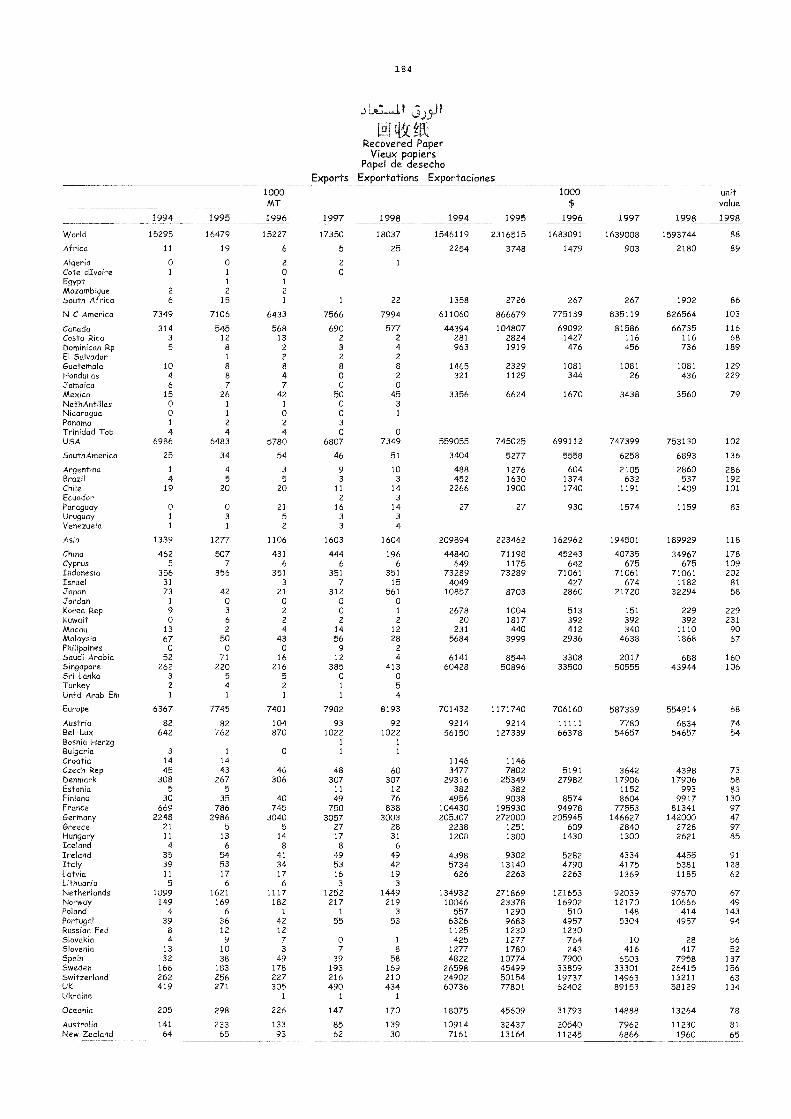
184
J LAL-1.1
Recovered PaperVieux papiers
Papel de desechoExports Exportations Exportaciones
1994 1995
1000MT
1996 1997 1998 1994 1995
1000$
1996 1997 1998
unitvalue
1998
World 15295 16479 15227 17350 18037 1546119 2316515 1683091 1639008 1593744 88
Africa 11 19 6 5 25 2254 3748 1479 903 2180 89
Algeria 0 0 2 2 1
Cote dIvoire 1 1 0 0Egypt 1 1
Mozambique 2 2 2
South Africa 6 15 1 1 22 1358 2726 267 267 1902 86
N C America 7349 7106 6433 7566 7994 611060 866679 775139 835119 826564 103
Canada 314 545 568 690 577 44394 104807 69092 81586 66735 116Costa Rica 3 12 13 2 2 281 2824 1427 116 116 68Dominican Rp 5 8 2 3 4 963 1919 476 456 736 189El Salvador 1 2 2 2
Guatemala 10 8 8 8 8 1465 2329 1081 1081 1081 129Honduras 4 8 4 0 2 321 1129 344 26 436 229Jamaica 6 7 7 0 0Mexico 15 26 42 50 45 3356 6624 1670 3438 3560 79NethAntilles 0 1 1 0 3
Nicaragua 0 1 0 0 1
Panama 1 2 2 3Trinidad Tob 4 4 4 0 0USA 6986 6483 5780 6807 7349 559055 745025 699112 747399 753130 102
SouthAmerica 25 34 54 46 51 3404 5277 5558 6258 6893 136
Argentina 1 4 3 9 10 488 1276 604 2105 2860 286Brazil 4 5 5 3 3 452 1630 1374 632 537 192Chile 19 20 20 11 14 2266 1900 1740 1191 1409 101Ecuador 2 3
Paraguay 0 0 21 16 14 27 27 930 1574 1159 83Uruguay 1 3 5 3 3
Venezuela 1 1 2 3 4
Asia 1339 1 277 1106 1603 1604 209894 223462 162962 194501 189929 118
China 462 507 431 444 196 44840 71198 45243 40735 34967 178Cyprus 5 7 6 6 6 649 1175 642 675 675 109Indonesia 356 356 351 351 351 73289 73289 71061 71061 71061 202Israel 31 3 7 15 4049 427 674 1182 81Japan 73 42 21 312 561 10857 8703 2860 21720 32294 58Jordan 1 0 0 0 0Korea Rep 9 3 2 0 1 2678 1004 513 151 229 229Kuwait 0 6 2 2 2 20 1817 392 392 392 231Macau 13 2 4 14 12 231 440 412 340 1110 90Malaysia 67 50 43 56 28 5684 3999 2936 4638 1868 67Philippines 0 0 0 9 2
Saudi Arabia 52 71 16 12 4 6141 8544 3308 2017 688 160Singapore 262 220 216 385 413 60428 50896 33500 50555 43944 106Sri Lanka 3 5 5 0 0Turkey 2 4 2 1 5
Untd Arab Em 1 1 1 1 4
Europe 6367 7745 7401 7982 8193 701432 1171740 706160 587339 554914 68
Austria 82 82 104 93 92 9214 9214 11111 7780 6834 74Bel-Lux 642 762 870 1022 1022 56150 127339 66378 54657 54657 54Bosnia Herzg 1 1
Bulgaria 3 1 0 1 1
Croatia 14 14 1146 1146Czech Rep 45 43 46 48 60 3477 7802 5191 3642 4398 73Denmark 308 267 306 307 307 29316 25349 27982 17906 17906 58Estonia 5 5 11 12 382 382 1152 993 83Finland 30 35 49 49 76 4956 9038 8574 8604 9917 130France 669 786 745 750 838 104430 195930 94978 77553 81341 97Germany 2248 2986 3040 3057 3003 205307 272000 205945 146627 142000 47Greece 21 5 5 27 28 2238 1251 609 2840 2728 97Hungary 11 13 14 17 31 1200 1300 1430 1300 2621 85Iceland 4 6 8 8 6Ireland 35 54 41 49 49 4398 9302 5282 4334 4455 91Italy 39 53 34 53 42 5734 13140 4790 4175 5381 128Latvia 11 17 17 16 19 626 2263 2263 1369 1185 62Lithuania 5 6 6 3 3
Netherlands 1099 1621 1117 1252 1449 134932 271869 121653 92039 97670 67Norway 149 169 182 217 219 10046 23378 16902 12170 10666 49Poland 4 6 1 1 3 557 1290 510 148 414 143Portugal 39 36 42 55 53 6326 9683 4957 5304 4957 94Russian Fed 8 12 12 1125 1230 1230Slovakia 4 9 7 0 1 425 1277 764 10 28 56Slovenia 13 10 3 7 8 1277 1780 243 416 417 52Spain 32 38 49 39 58 4822 10774 7900 6503 7958 137Sweden 166 183 178 193 169 26598 45499 33859 33301 26415 156Switzerland 262 256 227 216 210 24902 50154 19737 14963 13211 63UK 419 271 305 490 434 60736 77801 62402 89153 58129 134Ukraine 1 1 1
Oceania 205 298 226 147 170 18075 45609 31793 14888 13264 78
Australia 141 233 133 85 139 10914 32437 20540 7962 11230 81New Zealand 64 65 93 62 30 7161 13164 11245 6866 1960 65

Ls.;:1* y-115
4t, ,;11 tkPAPER AND PAPERBOARD
PAPIER ET CARTON
PAPEL Y CARTÓN
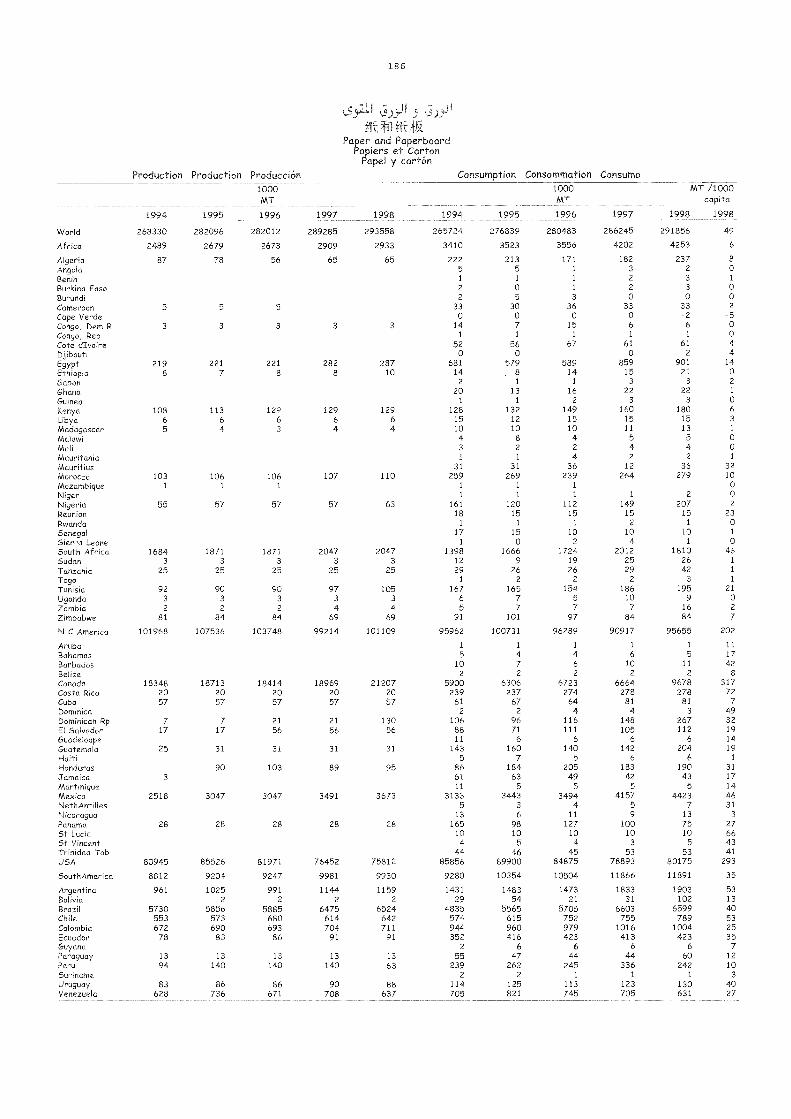
186
LS 9»-I1 5 ,:;).!..-11
fu 4(:,NPaper and Paperboard
Pa iers et CartonPapel y cartón
Production Production Producción Consumption Consommation Consumo
1994 1995
1000MT
1996 1997 1998 1994 1995
1000MT
1996 1997
MT /1000
1998 1998
World 268330 282096 282012 289285 293558 265724 276839 280483 286245 291856 49
Africa 2489 2679 2673 2909 2933 3410 3523 3556 4202 4253 6
Algeria 87 78 56 65 65 222 213 171 182 237 8
Angola 5 5 1 3 2 0
Benin 1 1 1 2 3 1
Burkina Faso 2 0 1 2 3 0
Burundi 2 5 3 0 0 0
Cameroon 5 5 5 33 30 36 33 33 2
Cape Verde 0 0 0 0 -2 -5Congo, Dem R 3 3 3 3 3 14 7 15 6 6 0
Congo, Rep 1 1 1 1 1 0
Cote dIvoire 52 56 67 61 61 4
Djibouti 0 0 0 2 4
Egypt 219 221 221 282 287 681 579 589 859 901 14
Ethiopia 8 7 8 8 10 14 , 8 14 15 21 0
Gabon 2 1 1 3 3 2
Ghana 20 13 16 22 22 1
Guinea 1 1 2 3 3 0
Kenya 108 113 129 129 129 128 132 149 160 180 6
Libya 6 6 6 6 6 15 12 15 15 15 3
Madagascar 5 4 3 4 4 10 10 10 11 13 1
Malawi 4 8 4 5 5 0Mali 3 2 2 4 4 0Mauritania 1 1 4 2 2 1
Mauritius 31 31 36 12 36 32Morocco 103 106 106 107 110 259 269 239 264 279 10
Mozambique 1 1 1 1 1 1 0Niger 1 1 1 1 2 0Nigeria 55 57 57 57 63 161 120 112 149 207 2
Reunion 18 15 15 15 15 23
Rwanda 1 1 1 2 i o
Senegal 17 15 10 10 10 1
Sierra Leone 1 0 2 4 1 0South Africa 1684 1871 1871 2047 2047 1398 1666 1724 2012 1810 46Sudan 3 3 3 3 3 12 9 19 25 26 1
Tanzania 25 25 25 25 25 29 26 26 29 42 1
Togo 1 2 2 2 3 1
Tunisia 92 90 90 97 105 167 165 154 186 195 21
Uganda 3 3 3 3 3 6 7 5 10 9 0
Zambia 2 2 2 4 4 5 7 7 7 16 2
Zimbabwe 81 84 84 69 69 91 101 97 84 84 7
N C America 101968 107536 103748 99214 101109 95962 100731 96289 90917 95655 202
Aruba 1 1 1 1 1 11
Bahamas 5 4 4 6 5 17Barbados 10 7 6 10 11 42Belize 2 2 2 2 2 8
Canada 18348 18713 18414 18969 21207 5900 6306 6723 6664 9678 317Costa Rica 20 20 20 20 20 239 237 274 278 278 72Cuba 57 57 57 57 57 61 67 64 81 81 7
Dominica 2 2 4 4 3 49Dominican Rp 7 7 21 21 130 106 96 116 148 267 32El Salvador 17 17 56 56 56 88 71 111 105 112 19Guadeloupe 11 6 6 6 6 14Guatemala 25 31 31 31 31 143 160 140 142 204 19Haiti 5 7 5 6 6 1
Honduras 90 103 89 95 86 184 205 183 190 31
Jamaica 3 61 63 49 42 43 17
Martinique 11 5 5 5 5 14
Mexico 2518 3047 3047 3491 3673 3133 3443 3494 4157 4423 46NethAntilles 5 3 4 5 7 31Nicaragua 13 6 11 9 13 3
Panama 28 28 28 28 28 165 98 127 100 75 27St Lucia 10 10 10 10 10 66St Vincent 4 5 4 3 5 43Trinidad Tob 44 46 45 53 53 41USA 80945 85526 81971 76452 75812 85856 89900 84875 78893 80175 293
SouthAmerica 8812 9204 9247 9981 9930 9280 10354 10504 11866 11891 35
Argentina 961 1025 991 1144 1159 1431 1483 1473 1833 1903 53Bolivia 2 2 2 2 29 54 21 31 102 13Brazil 5730 5856 5885 6475 6524 4835 5565 5705 6603 6599 40Chile 553 573 680 614 642 574 615 752 755 789 53Colombia 672 690 693 704 711 944 960 979 1016 1004 25Ecuador 78 83 86 91 91 352 416 423 413 423 35Guyana 2 6 6 6 6 7Paraguay 13 13 13 13 13 55 47 44 44 60 12Peru 94 140 140 140 63 239 262 245 336 242 10Suriname 2 2 1 1 1 3
Uruguay 83 86 86 90 88 114 125 113 123 130 40Venezuela 628 736 671 708 637 705 821 745 705 631 27
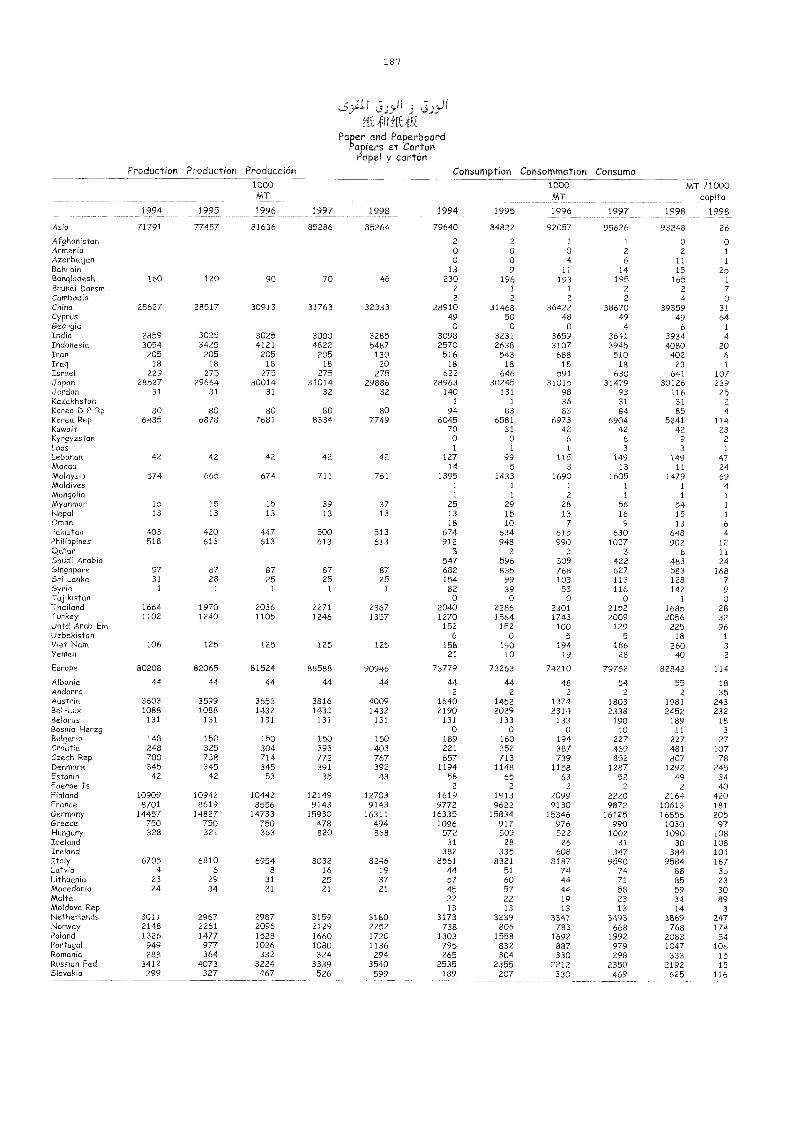
187
Pa per and Paperboarders et Cartonpel y cartón
Production Production Producción Consumption Consommation Consumo
1994 1995
1000MT
1996 1997 1998 1994 1995
1000MT
1996 1997
MT /1000
1998 1998
Asia 71791 77457 81636 85286 85264 79640 84822 92057 95626 93248 26
A f ghanistan 2 2 1 1 0 0A rmeMa 0 0 0 2 2 1
Azerbai jan 0 o 4 6 11 1
Bahrain 13 9 11 14 15 25Bangladesh 160 120 90 70 46 230 196 193 195 165 1
Brunei Darsm 2 1 1 2 2 7Cambodia 2 2 2 2 4 0China 25627 28517 30913 31763 32333 28910 31468 36422 38670 39359 31Cyprus 49 50 48 49 49 64Georg M 0 0 0 4 6 1
India 2859 3025 3025 3000 3285 3098 3231 3659 3641 3934 4Indonesia 3054 3425 4121 4822 5487 2570 2638 3107 3945 4080 20Iran 205 205 205 205 130 516 543 688 510 402 6Iraq 18 18 18 18 20 18 18 18 18 23 1
Israel 229 275 275 275 275 622 646 591 630 641 107Japan 28527 29664 30014 31014 29886 28963 30245 31015 31479 30126 239Jordan 31 31 31 32 32 140 131 98 93 116 25Kazakhstan 1 1 36 31 31 2Korea D P Rp 80 80 80 80 80 94 83 83 84 85 4Korea Rep 6435 6878 7681 8334 7749 6045 6581 6973 6904 5241 114Kuwait 70 31 42 42 42 23Kyrgyzstan 0 0 6 6 9 2Laos 1 1 1 3 3 1
Lebanon 42 42 42 42 42 127 99 115 149 149 47MCICall 14 5 3 13 11 24Malaysia 574 665 674 711 761 1395 1433 1690 1605 1479 69Maldives 1 1 1 1 1 4Mongolia 1 1 2 1 1 1
Myanmar 15 15 15 39 37 25 29 28 56 54 1
Nepal 13 13 13 13 13 13 15 13 16 15 1
Ornan 18 10 7 9 13 6Pakistan 403 420 447 500 513 674 634 615 630 648 4Phil ippMe s 518 613 613 613 613 912 948 990 1027 902 12Qatar 3 2 2 3 6 11Saudi Arabia 547 596 309 422 483 245 Mga pore 97 87 87 87 87 682 835 768 627 583 168Sri Lanka 31 28 25 25 25 154 99 103 113 128 75 yr M 1 1 1 1 1 82 39 53 116 142 9Ta jikistan 0 0 0 0 1 0Thailand 1664 1970 2036 2271 2367 2040 2286 2301 2152 1685 28Turkey 1102 1240 1105 1246 1357 1270 1564 1743 2009 2056 32Unid Arab Em 152 152 100 129 225 96Uzbekistan 6 0 5 5 18 1
VMt Nam 106 125 125 125 125 158 190 194 186 260 3
Yemen 21 10 19 28 40 2
Europe 80208 82065 81524 88588 90946 73779 73263 74210 79752 82842 114
Albania 44 44 44 44 44 44 44 46 54 55 18Andorra 2 2 2 2 2 35Austria 3603 3599 3653 3816 4009 1640 1452 1374 1803 1981 243Bel-Lux 1088 1088 1432 1432 1432 2190 2029 2314 2338 2452 232Be Mrus 131 131 131 131 131 131 133 133 190 189 18BosMa Herzg 0 0 0 10 11 3Bulgaria 148 150 150 150 150 189 160 194 227 227 27Croat M 248 325 304 393 403 221 352 387 469 481 107Czech Rep 700 738 714 772 767 657 713 739 852 807 78Denmark 345 345 345 391 392 1194 1148 1158 1287 1292 245Estonia 42 42 53 35 43 58 65 63 52 49 34Faeroe Is 2 2 2 2 2 40FMMnd 10909 10942 10442 12149 12703 1619 1913 2099 2220 2164 420France 8701 8619 8556 9143 9143 9772 9622 9130 9872 10613 181Germany 14457 14827 14733 15930 16311 16335 15834 15346 16125 16856 205Greece 750 750 750 478 494 1096 917 976 990 1030 97Hungary 328 321 363 820 868 572 509 522 1002 1090 108IceMnd 31 28 26 31 30 108IreMnd 382 335 608 347 384 104Italy 6705 6810 6954 8032 8246 8561 8321 8187 9590 9584 167LatyM 4 6 8 16 19 44 51 74 74 88 36LithuaMa 23 29 31 25 37 57 60 44 71 85 23Macedonia 24 34 21 21 21 45 57 44 58 59 30Malta 22 22 19 23 34 89Moldova Rep 13 13 13 13 14 3
Netherlands 3011 2967 2987 3159 3180 3173 3239 3347 3493 3869 247Norway 2148 2261 2096 2129 2252 738 806 783 668 768 174PoMnd 1326 1477 1528 1660 1720 1303 1558 1692 1992 2083 54Portugal 949 977 1026 1080 1136 795 832 887 979 1047 106RomaMa 288 364 332 324 294 265 304 330 298 333 15Russian Fed 3412 4073 3224 3339 3540 2535 2355 2212 2350 2192 155MvakM 299 327 467 526 599 189 207 330 469 625 116
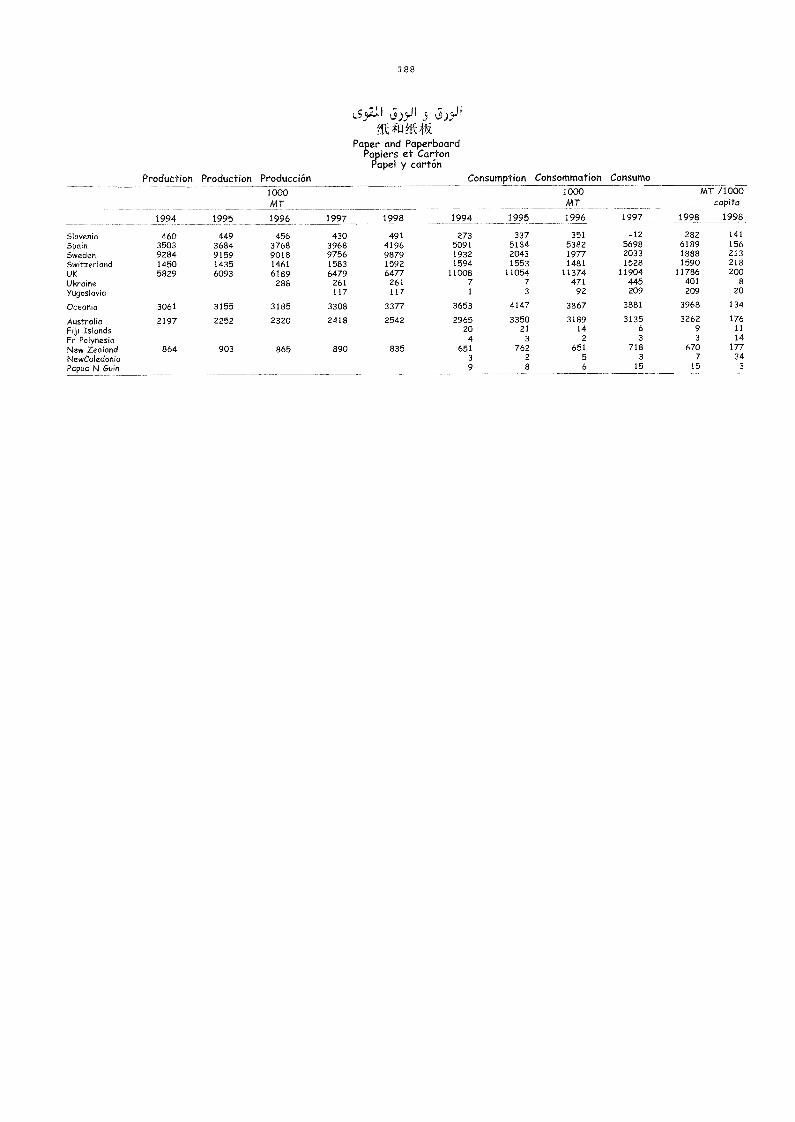
188
j)5J1 5 Ci).9-11
fnPaper and Paperboard
Pa iers et CartonPapel y cartón
Production Production Producción Consumption Consommation Consumo
1994 1995
1000MT
1996 1997 1998 1994 1995
1000MT
1996 1997
MT /1000capita
1998 1998
Slovenia 460 449 456 430 491 273 337 351 -12 282 141
Spain 3503 3684 3768 3968 4196 5091 5184 5382 5698 6189 156Sweden 9284 9159 9018 9756 9879 1932 2043 1977 2033 1888 213
Switzerland 1450 1435 1461 1583 1592 1594 1553 1481 1528 1590 218UK 5829 6093 6189 6479 6477 11008 11054 11374 11904 11786 200Ukraine 288 261 261 7 7 471 445 401 8
Yugoslavia 117 117 1 3 92 209 209 20
Oceania 3061 3155 3185 3308 3377 3653 4147 3867 3881 3968 134
Australia 2197 2252 2320 2418 2542 2965 3350 3189 3135 3262 176Fiji Islands 20 21 14 6 9 11
Fr Polynesia 4 3 2 3 3 14
New Zealand 864 903 865 890 835 651 762 651 718 670 177
NewCaledonia 3 2 5 3 7 34Papua N Guin 9 8 6 15 15 3
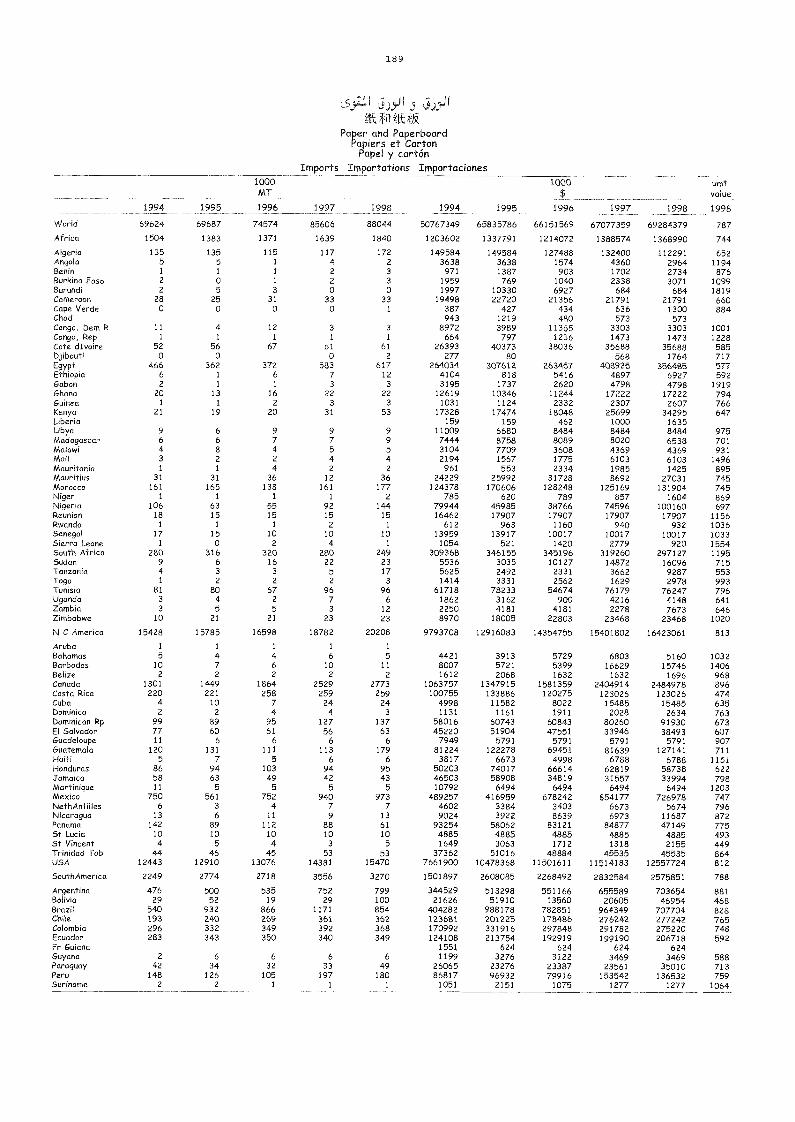
189
L55.:11 j),JI 5 jj5m#1fl. N
Paper and PaperboardPápiers et Carton
Papel y cartónImports Importations Importaciones
1994 1995
1000MT
1996 1997 1998 1994 1995
1000$
1996 1997 1998
unitvalue
1998
VVoHd 69624 69687 74574 85606 88044 50767349 65835786 66151569 67077359 69284379 787
Africa 1504 1383 1371 1639 1840 1203602 1337791 1214072 1388574 1368990 744
Algeria 135 135 115 117 172 149584 149584 127488 132400 112291 652Angola 5 5 1 4 2 3638 3638 1574 4360 2964 1194Benin 1 1 1 2 3 971 1387 903 1702 2734 876BurkMa Faso 2 0 1 2 3 1959 769 1040 2338 3071 1099Burundi 2 5 3 0 0 1997 10330 6927 684 684 1819Cameroon 28 25 31 33 33 19498 22720 21356 21791 21791 660Cape Verde 0 0 0 0 1 387 427 434 636 1300 884Chad 943 1219 480 573 573Congo, Dem R 11 4 12 3 3 8972 3989 11365 3303 3303 1001Congo, Rep 1 1 1 1 1 664 797 1236 1473 1473 1228Cote dIvoMe 52 56 67 61 61 26393 40373 38036 35688 35688 585Djibouti 0 0 O 2 277 80 568 1764 717Egypt 466 362 372 583 617 264034 307612 263457 408925 356485 577Ethiopia 6 1 6 7 12 4104 818 5416 4897 6927 592Gabon 2 1 1 3 3 3195 1737 2620 4798 4798 1919Ghana 20 13 16 22 22 12619 10346 11244 17222 17222 794Guinea 1 1 2 3 3 1031 1124 2332 2307 2607 766Kenya 21 19 20 31 53 17328 17474 18048 25699 34295 647LiberM 159 159 462 1000 1635Libya 9 6 9 9 9 11009 6680 8484 8484 8484 975Madagascar 6 6 7 7 9 7444 8758 8089 8020 6538 701Malawi 4 8 4 5 5 3104 7709 3608 4369 4369 931Mali 3 2 2 4 4 2194 1567 1775 6103 6103 1496Mauritania 1 1 4 2 2 961 553 2334 1985 1425 895Mauritius 31 31 36 12 36 24229 25992 31728 8692 27031 745Morocco 161 165 138 161 177 124378 170606 128248 125169 131904 745Niger 1 1 1 1 2 785 620 789 857 1604 869Nigerio 106 63 55 92 144 79944 45985 38766 74596 100160 697ReunMn 18 15 15 15 15 16462 17907 17907 17907 17907 1156Rwanda 1 1 1 2 1 612 963 1160 940 932 1036Senegal 17 15 10 10 10 13959 13917 10017 10017 10017 1033Sierra Leone 1 0 2 4 1 1054 521 1420 2779 920 1554South Africa 280 316 320 280 249 309368 346155 345196 319260 297127 1195Sudan 9 6 16 22 23 5536 3035 10127 14872 16096 715Tanzania 4 3 3 5 17 5625 2492 2331 3662 9287 553Togo 1 2 2 2 3 1414 3331 2562 1629 2978 993TunisM 81 80 67 96 96 61718 78233 54674 76179 76247 796Uganda 3 4 2 7 6 1862 3162 900 4216 4148 641Zambia 3 5 5 3 12 2250 4181 4181 2278 7673 646Zimbabwe 10 21 21 23 23 8970 18005 22803 23468 23468 1020
N C America 15428 15785 16598 18782 20208 9793708 12916083 14354755 15401802 16423061 813
Aruba 1 1 1 1 1
Bahamas 5 4 4 6 5 4421 3913 5729 6803 5160 1032Barbados 10 7 6 10 11 8007 5721 5399 16629 15746 1406Belize 2 2 2 2 2 1612 2068 1632 1632 1696 968Canada 1301 1449 1864 2529 2773 1063757 1347915 1581359 2404914 2484978 896Costa RMa 220 221 258 259 259 100755 133886 120275 123026 123026 474Cuba 4 10 7 24 24 4998 11582 8022 15485 15485 635Dominica 2 2 4 4 3 1131 1161 1911 2028 2634 763DomMMan Rp 99 89 95 127 137 58016 60743 60843 80260 91930 673El Salvador 77 60 61 56 63 45220 51904 47551 33946 38493 607Guadeloupe 11 6 6 6 6 7949 5791 5791 5791 5791 907Guatemala 120 131 111 113 179 81224 122278 69451 81639 127141 711HMti 5 7 5 6 6 3817 6673 4998 6788 6788 1151Honduras 86 94 103 94 95 50203 74017 66614 62819 58738 622Jamaica 58 63 49 42 43 46503 58908 34819 31557 33994 798MartMMue 11 5 5 5 5 10792 6494 6494 6494 6494 1203MexMo 750 561 752 940 973 489257 416959 678242 854177 726978 747NethAntilles 6 3 4 7 7 4602 3384 3403 6673 5674 796Nicaragua 13 6 11 9 13 9024 3922 8639 6973 11687 872Panama 142 89 112 88 61 93254 58062 83121 84877 47149 775St Lucia 10 10 10 10 10 4885 4885 4885 4885 4885 493St VMcent 4 5 4 3 5 1649 3063 1712 1318 2155 449TrMMadTob 44 46 45 53 53 37362 51016 48884 45535 45535 864USA 12443 12910 13076 14381 15470 7661900 10478368 11501611 11514183 12557724 812
SouthAmerica 2249 2774 2718 3556 3270 1501897 2608085 2268492 2832584 2575851 788
Argentina 476 500 535 752 799 344529 513298 551166 655589 703654 881Bolivia 29 52 19 29 100 21626 51910 13560 20605 46954 468Brazil 540 932 866 1171 854 404282 988178 782851 964349 707704 828Chile 193 240 269 361 362 123681 201225 178486 276242 277242 765Colombia 296 332 349 392 368 170992 331916 297848 291782 275220 748Ecuador 283 343 350 340 349 124108 213754 192919 199190 206718 592Fr &Mona 1551 624 624 624 624Guyana 2 6 6 6 6 1199 3276 3122 3469 3469 588Paraguay 42 34 32 33 49 26065 23276 23387 23561 35010 713Peru 148 126 105 197 180 86817 96932 79916 153542 136532 759Suriname 2 2 1 1 1 1051 2151 1075 1277 1277 1064
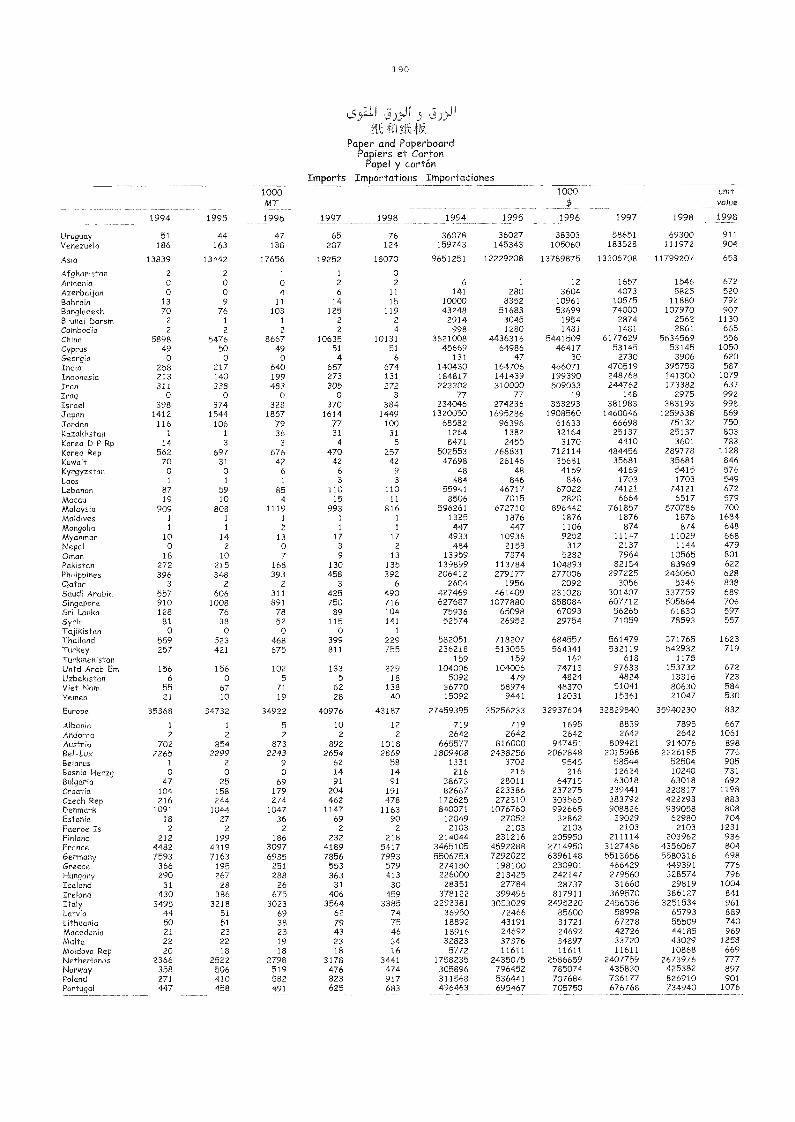
190
5 j5").9-ii
11
Pa per and Paperboardpiers et Carton
Papel y cartónImports Importations Importaciones
1994 1995
1000MT
1996 1997 1998 1994 1995
1000$
1996 1997 1998
unitvalue
1998
Uruguay 51 44 47 65 76 36078 36027 38303 58651 69300 911Venezuela 186 163 138 207 124 159743 145343 105060 183528 111972 904
Asia 13839 13442 17656 19252 18070 9651251 12229208 13789875 13306708 11799207 653
Afghanistan 2 2 1 1 oArmenia o o o 2 2 6 1 12 1657 1546 672Azerbaijan o o 4 6 11 141 280 3604 4073 5825 520Bahrain 13 9 11 14 15 10000 8352 10961 10575 11880 792Bangladesh 70 76 103 125 119 43248 51683 53699 74000 107970 907Brunei Darsm 2 1 1 2 2 2914 3045 1954 2874 2562 1130Cambodia 2 2 2 2 4 998 1280 1481 1481 2861 665China 5898 5476 8667 10635 10131 3621008 4436316 5441509 6177629 5634569 556Cyprus 49 50 49 51 51 45669 64986 46417 53145 53145 1050Georgia o o o 4 6 131 47 30 2730 3906 620India 258 217 640 657 674 140430 164706 466071 470519 395758 587Indonesia 213 140 199 273 131 184817 141439 199390 248768 141300 1079Iran 311 338 483 305 272 223302 310000 509033 244762 173382 637Iraq o o o o 3 77 77 19 148 2975 992Israel 398 374 328 370 384 234046 274236 353293 381983 383193 998Japan 1412 1544 1857 1614 1449 1320050 1695286 1908560 1460046 1259338 869Jordan 116 106 79 77 100 68582 96396 61633 66698 75132 750Kazakhstan 1 1 36 31 31 1264 1382 32164 25137 25137 803Korea D P Rp 14 3 3 4 5 8471 2455 3170 4410 3601 783Korea Rep 562 697 676 470 257 502553 768831 712114 484456 289778 1128Kuwait 70 31 42 42 42 47698 26146 35681 35681 35681 846Kyrgyzstan o o 6 6 9 48 48 4169 4169 5415 576Laos 1 1 1 3 3 484 846 846 1703 1703 549Lebanon 87 59 85 110 110 55941 46717 67022 74121 74121 672
Macau 19 10 4 15 11 8506 7015 2820 6664 6517 579Malaysia 909 808 1119 993 816 596261 672710 896442 761857 570786 700Maldices 1 1 1 1 1 1325 1876 1876 1876 1876 1684Mongolia 1 1 2 1 1 447 447 1106 874 874 648Myanmar 10 14 13 17 17 4933 10936 9252 11147 11029 668Nepal o 2 o 3 2 484 2153 312 2137 1144 479Ornan 18 10 7 9 13 13959 7874 5282 7964 10565 801Pakistan 272 215 168 130 135 139899 113784 104893 82154 83969 622Philippines 396 348 393 458 392 206412 279177 277006 297225 246060 628Qatar 3 2 2 3 6 2604 1956 2092 3056 5346 838Saudi Arabia 557 606 311 425 490 427469 461409 231028 301407 337759 689Singapore 910 1008 891 750 716 627687 1077880 858084 607712 505864 706Sri Lanka 128 76 78 89 104 75936 65098 67093 56265 61830 597Syria 81 38 52 115 141 52574 26952 29754 71059 78593 557Tajikistan 0 o o o 1
Thailand 559 523 468 399 229 582051 718207 684557 561479 371765 1623Turkey 257 421 675 811 755 236218 513055 564341 532119 542932 719Turkmenistan 159 159 162 618 1175Untd Arab Em 156 156 102 133 229 104006 104006 74713 97633 153732 672Uzbekistan 6 o 5 5 18 5092 479 4824 4824 13316 723Viet Nam 55 67 71 62 138 36770 58974 48370 51041 80630 584Yemen 21 10 19 28 40 15092 9441 12031 15361 21047 530
Europe 35368 34732 34922 40976 43187 27459395 35256233 32937604 32829840 35940230 832
Albania 1 1 5 10 12 719 719 1695 8839 7895 667Andorra 2 2 2 2 2 2642 2642 2642 2642 2642 1061
Austria 702 854 873 892 1018 665577 816000 947451 809421 914076 898Bel-Lux 2265 2299 2243 2654 2869 1809408 2438256 2062848 2015988 2226195 776Belarus 1 2 9 62 58 1331 3702 9545 58544 52504 905Bosnia Herzg o o 0 14 14 216 216 216 12624 10240 731Bulgaria 47 25 69 91 91 38673 28011 64715 63018 63018 692Croatia 104 158 179 204 191 82667 223386 237275 239441 228817 1198Czech Rep 216 244 274 462 478 172625 272310 303565 383792 422293 883Denmark 1091 1044 1047 1147 1163 840071 1076760 992665 908826 939058 808Estonia 18 27 36 69 90 12049 27052 32862 39029 62980 704Faeroe Is 2 2 2 2 2 2103 2103 2103 2103 2103 1231
Finland 212 199 186 232 218 214044 231216 205950 211114 203962 936France 4482 4319 3097 4189 5417 3465105 4592288 2714950 3127436 4356067 804Germany 7593 7163 6935 7856 7993 5506753 7292022 6396148 5513656 5580316 698Greece 366 195 251 553 579 274150 198100 230901 466429 449391 776Hungary 290 267 288 363 413 226000 213425 242147 279560 328574 796Iceland 31 28 26 31 30 28351 27784 28737 31660 29819 1004Ireland 430 386 675 406 459 378122 399496 817911 369570 386127 841
Italy 3495 3218 3023 3564 3385 2292381 3053029 2495220 2456536 3251534 961Latvia 44 51 69 62 74 36950 72466 85600 58998 65793 889Lithuania 50 51 38 79 75 18892 43191 31721 67278 55509 740Macedonia 21 23 23 43 46 18916 24692 24692 42726 44185 969Malta 22 22 19 23 34 32823 37376 34897 33720 43029 1258Moldova Rep 20 18 18 18 16 5772 11611 11611 11611 10868 669Netherlands 2366 2522 2798 3178 3441 1758235 2435075 2586659 2407759 2673976 777Norway 358 506 519 476 474 305896 796452 785074 435830 425362 897Poland 271 410 582 823 917 311568 536441 707684 736177 826910 901Portugal 447 458 491 625 683 496463 695467 705750 676768 734940 1076
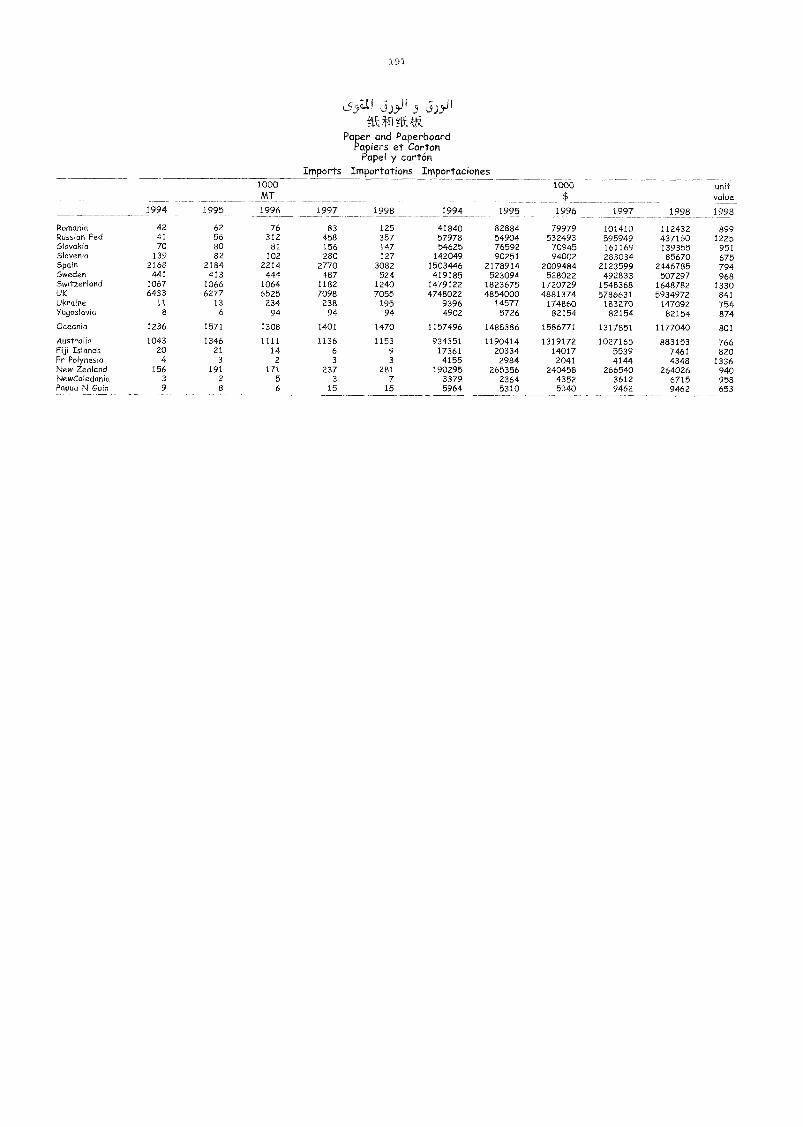
1 9 1
LS-C1 3).0 5 j).,-11ffk.ki
Paper and PaperboardPapiers et Carton
Papel y cartónImports Importations Importaciones
1994 1995
1000MT
1996 1997 1998 1994 1995
1000$
1996 1997 1998
unitvalue
1998
Romania 42 62 76 83 125 41840 82884 79979 101410 112432 899Russian Fed 41 56 312 458 357 57978 54904 532493 595949 437160 1225Slovakia 70 80 81 156 147 54625 76592 70945 161169 139355 951Slovenia 139 82 102 280 127 142049 90251 94002 283034 85670 675Spain 2168 2184 2214 2770 3082 1503446 2178914 2009484 2123599 2446785 794Sweden 441 413 444 487 524 419185 523094 528022 492833 507297 968Switzerland 1067 1066 1064 1182 1240 1479122 1823675 1720729 1548368 1648782 1330UK 6433 6277 6525 7098 7055 4748022 4854000 4881374 5786631 5934972 841Ukraine 11 13 234 238 195 9396 14577 174860 183270 147092 754YU90S10,141 8 6 94 94 94 4902 5726 82154 82154 82154 874Oceania 1236 1571 1308 1401 1470 1157496 1488386 1586771 1317851 1177040 801
Australia 1043 1346 1111 1136 1153 934351 1190414 1319172 1027165 883153 766Fiji Islands 20 21 14 6 9 17361 20334 14017 5539 7461 820Fr Polynesia 4 3 2 3 3 4155 2984 2041 4144 4348 1336New Zealand 156 191 171 237 281 190295 265356 240458 266540 264026 940NewCaledonia 3 2 5 3 7 3379 2364 4352 3612 6715 958Papua N Guin 9 8 6 15 15 5964 5310 5340 9462 9462 653
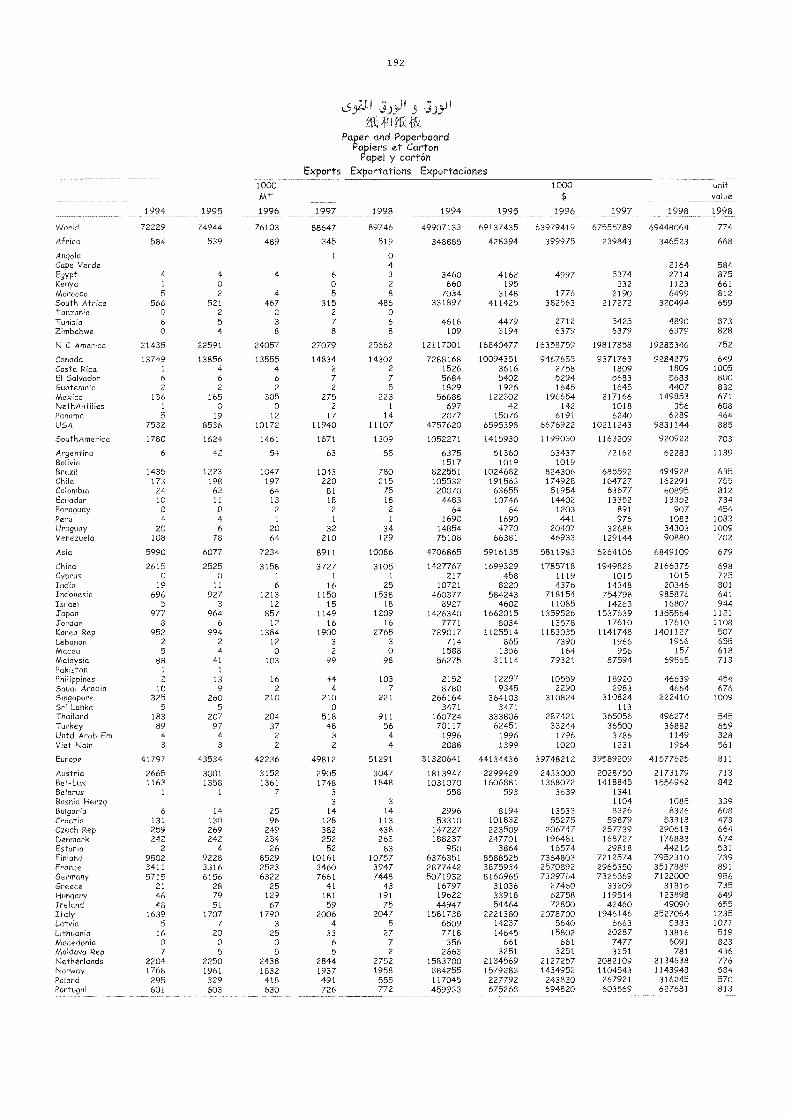
192
,J)5J1
friPa per and Paperboard
apiers et CartonPapel y cartón
Exports Exportations Exportaciones
1994 1995
1000AAT
1996 1997 1998 1994 1995
1000$
1996 1997 1998
unitvalue
1998
World 72229 74944 76103 88647 89746 49907133 69137435 63979419 67555789 69448064 774
Africa 584 539 489 345 519 348885 428394 399975 239843 346523 668
Angola 1 0Cape Verde 4 2164 584Egypt 4 4 4 6 3 3460 4162 4997 5374 2714 875Kenya 1 0 0 2 660 195 332 1123 661Morocco 5 2 4 5 8 7034 3148 1776 2190 6499 812South Africa 566 521 467 315 486 331897 411425 382563 217272 320494 659Tanzania 0 2 2 2 0Tunisia 6 5 3 7 6 4616 4479 2712 5425 4890 873Zimbabwe 0 4 8 8 8 109 3194 6379 6379 6379 828
N C America 21435 22591 24057 27079 25662 12117001 16840477 16358759 19817858 19285346 752
Canada 13749 13856 13555 14834 14302 7288168 10094351 9467655 9371763 9284279 649Costa Rica 1 4 4 2 2 1526 3616 2758 1809 1809 1005El Salvador 6 6 6 7 7 5684 5402 5294 5683 5683 BOO
Guatemala 2 2 2 2 5 1829 1926 1645 1645 4407 832Mexico 136 165 305 275 223 56688 122302 196654 217166 149853 671NethAntMes 1 0 0 2 1 697 42 142 1018 356 608Panama 5 19 12 17 14 2077 15076 6191 6240 6289 464USA 7532 8536 10172 11940 11107 4757620 6595398 6676922 10211243 9831144 885
SouthAmerica 1780 1624 1461 1671 1309 1052271 1415930 1199030 1163209 920922 703
Argentina 6 42 54 63 55 6375 51360 63437 72162 62283 1139Bolivia 1517 1019 1019Brazd 1435 1223 1047 1043 780 822551 1024682 824306 685592 494928 635Chile 173 198 197 220 215 105532 191563 174928 164727 162291 755Colombia 24 62 64 81 75 20070 63655 51954 63677 60895 812Ecuador 10 11 13 18 18 4483 10746 14402 13352 13352 734Paraguay 0 0 2 2 2 64 64 1203 891 907 454Peru 4 4 1 1 1 1690 1690 441 976 1083 1083Uruguay 20 6 20 32 34 14854 4770 20407 32688 34303 1009Venezuela 108 78 64 210 129 75108 66381 46933 129144 90880 702
Asia 5990 6077 7234 8911 10086 4706865 5916135 5811983 6264106 6849109 679
Chino 2615 2525 3158 3727 3105 1427767 1699329 1785718 1949826 2166375 698Cyprus 0 0 1 1 1 217 458 1119 1015 1015 725Indio 19 11 6 16 25 10721 8220 4376 14348 20346 801Indonesia 696 927 1213 1150 1538 460377 584243 718154 754798 985876 641Israel 5 3 12 15 18 8927 4602 11085 14263 16807 944Japan 977 964 857 1149 1209 1426340 1662015 1359526 1537639 1355564 1121Jordan 8 6 12 16 16 7771 8034 13578 17610 17610 1108Korea Rep 952 994 1384 1900 2765 789017 1125514 1183035 1141748 1401127 507Lebanon 2 2 12 3 3 714 865 7390 1966 1966 655Macau 5 4 0 2 0 1588 1356 164 956 157 618Malaysia 88 41 103 99 98 56275 31114 79321 87594 69565 713Pakistan 1 1
Philippines 2 13 16 44 103 2152 12297 10559 18920 46639 454Saudi Arabia 10 9 2 4 7 8780 9345 2290 2983 4664 676Singapore 325 260 210 210 221 266164 364103 310824 310824 222410 1009Sri Lanka 5 5 0 3471 3471 113Thailand 183 207 204 518 911 160724 333806 287421 365056 496274 545Turkey 89 97 37 48 56 70117 62451 33244 36500 36882 659Untd Arab Em 4 4 2 3 4 1996 1996 1796 3786 1149 328Viet Nam 3 3 2 2 4 2088 1399 1020 1231 1964 561
Europe 41797 43534 42236 49812 51291 31320641 44134436 39748212 39589209 41577625 811
Austria 2665 3001 3152 2905 3047 1813947 2299429 2433000 2028750 2173179 713Bel-Lux 1163 1358 1361 1748 1848 1031070 1606881 1388072 1418845 1556962 842Belarus 1 1 7 3 558 593 3639 1341Bosnia Herzg 3 3 1104 1085 339Bulgaria 6 14 25 14 14 2996 8194 13533 8326 8326 608Croatia 131 130 96 128 113 53310 101832 55275 59879 53318 473Czech Rep 259 269 249 382 438 147227 223509 206747 257739 290613 664Denmark 242 242 234 252 263 188237 247701 196481 168727 176888 674Estonia 2 4 26 52 83 950 3864 16574 29818 44215 531Finland 9502 9228 8529 10161 10757 6376351 8588525 7364803 7212574 7952310 739France 3411 3316 2523 3460 3947 2877442 3875934 2570892 2965350 3517889 891Germany 5715 6156 6322 7661 7448 5071932 8166965 7329764 7326569 7122000 956Greece 21 28 25 41 43 16797 31036 27460 33209 31815 735Hungary 46 79 129 181 191 19622 33918 62758 119514 123898 649Ireland 48 51 67 59 75 44947 54464 72800 42460 49090 655Italy 1639 1707 1790 2006 2047 1581738 2221380 2078700 1946146 2527064 1235Latvia 5 7 3 4 5 6509 14237 5640 6663 5383 1077Lithuania 16 20 25 33 27 7718 14645 15802 20287 13816 519Macedonia 0 0 0 6 7 356 661 661 7477 6091 823Moldova Rep 7 5 5 5 2 2663 3251 3251 3251 781 436Netherlands 2204 2250 2438 2844 2752 1583700 2134569 2127257 2082109 2134638 776Norway 1768 1961 1832 1937 1958 884255 1579283 1434952 1104543 1143943 584Poland 295 329 418 491 555 117045 227792 243820 267921 316245 570Portugal 601 603 630 726 772 459933 675268 694820 603569 627681 813
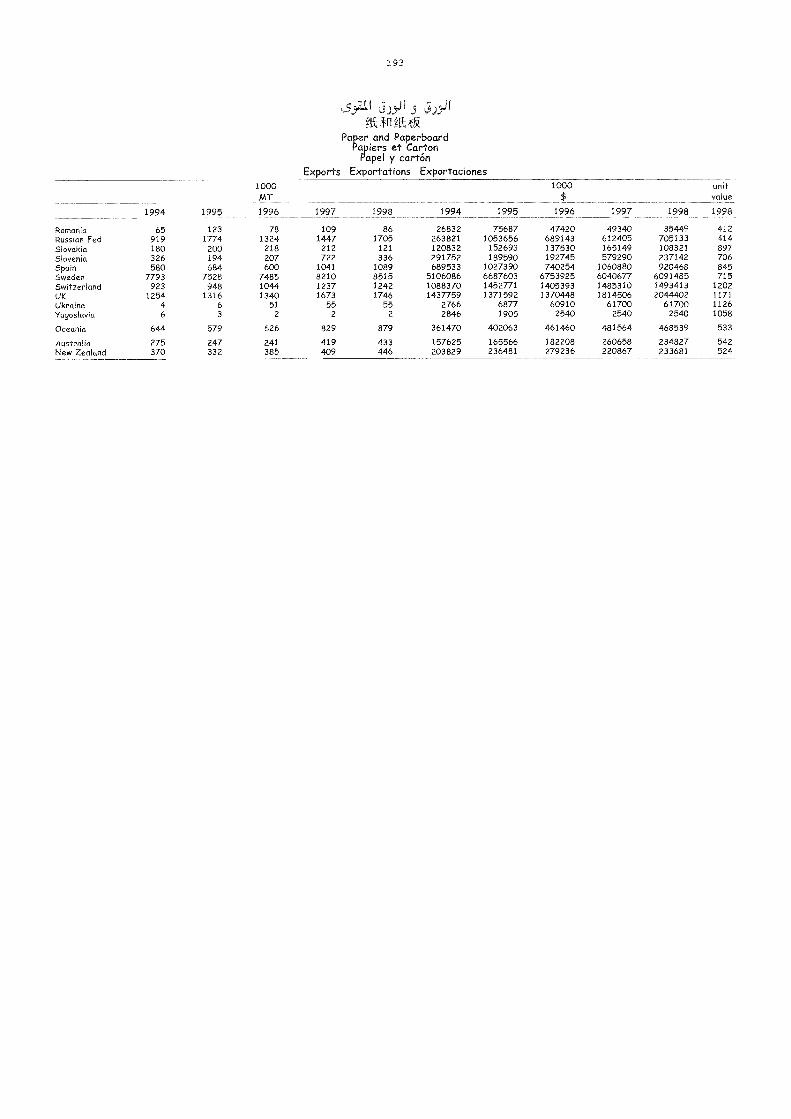
1 9 3
Paper and PaperboardPqpiers et Carton
Papel y cartónExports Exportations Exportaciones
1994 1995
1000MT
1996 1997 1998 1994 1995
1000
$
1996 1997 1998
unitvalue
1998
Romania 65 123 78 109 86 26832 75687 47420 49340 35449 412Russian Fed 919 1774 1324 1447 1705 263821 1053656 689143 612405 705133 414Slovakia 180 200 218 212 121 120832 152693 137530 165149 108321 897Slovenia 326 194 207 722 336 291752 189590 192745 579290 237142 706Spain 580 684 600 1041 1089 689533 1027390 740254 1060880 920468 845Sweden 7793 7528 7485 8210 8515 5106086 6687603 6753925 6040677 6091485 715Switzerland 923 948 1044 1237 1242 1088370 1452771 1405393 1485310 1493413 1202UK 1254 1316 1340 1673 1746 1437759 1371592 1370448 1814506 2044402 1171Ukraine 4 6 51 55 55 2766 6877 60910 61700 61700 1126Yugoslavia 6 3 2 2 2 2846 1905 2540 2540 2540 1058
Oceania 644 579 626 829 879 361470 402063 461460 481564 468539 533
Australia 275 247 241 419 433 157625 165566 182208 260658 234827 542New Zealand 370 332 385 409 446 203829 236481 279236 220867 233681 524
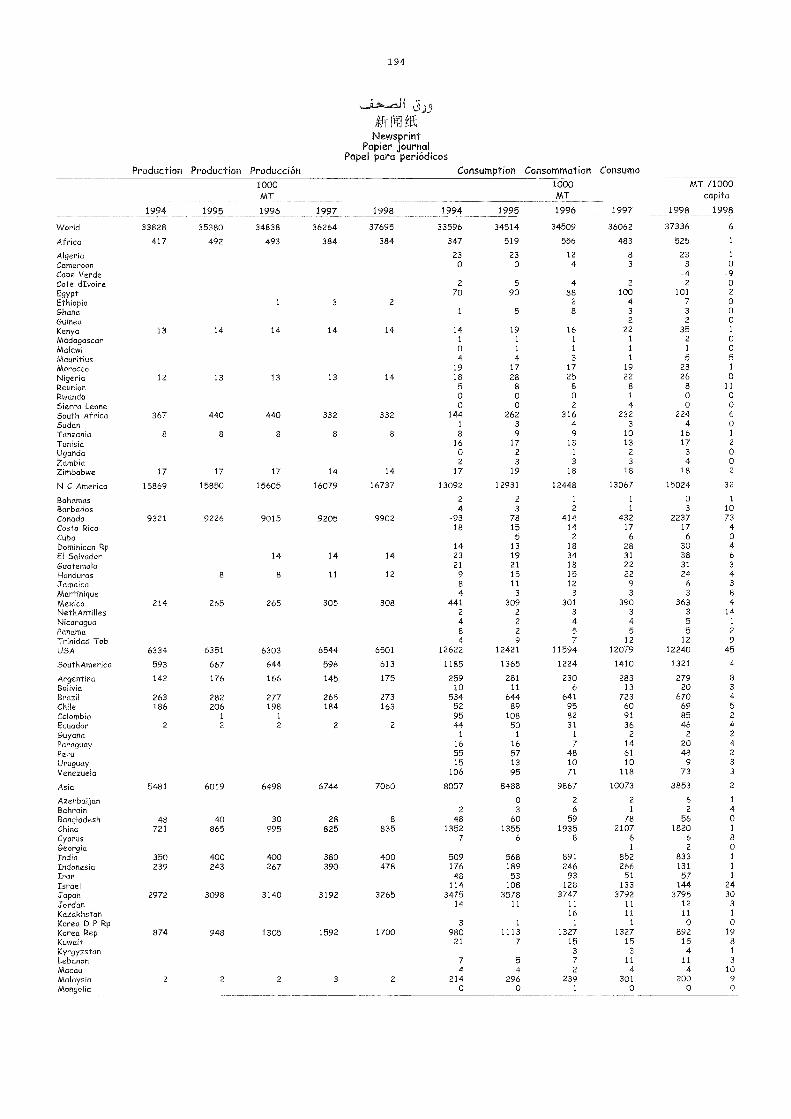
194
j9))
4fi 141Newsprint
Papier journalPapel para periódicos
Production Production Producción Consumption Consommation Consumo
1994 1995
1000MT
1996 1997 1998 1994 1995
1000MT
1996 1997
MT /1000capita
1998 1998
World 33828 35380 34838 36264 37695 33596 34514 34509 36062 37336 6
Africa 417 492 493 384 384 347 519 556 483 525 1
Algeria 23 23 12 8 23 1
Cameroon 0 0 4 3 3 0Cape Verde -4 -9Cote dIvoire 2 5 4 2 2 0Egypt 70 90 88 100 101 2
Ethiopia 1 3 2 2 4 7 0Ghana 1 5 8 3 3 0Guinea 2 2 0Kenya 13 14 14 14 14 14 19 16 22 35 1
MadagascarMalawi
1
o1
1
1
1
1
1
21
0o
Mauritius 4 4 3 1 5 5
Morocco 19 17 17 19 23 1
Nigeria 12 13 13 13 14 18 28 25 22 26 0
Reunion 5 8 8 8 a 11
Rwanda 0 0 0 1 0 0Sierra Leone 0 0 2 4 0 0
South Africa 367 440 440 332 332 144 262 316 232 224 6
Sudan 1 3 4 3 4 0
Tanzania 8 8 8 8 8 8 9 9 10 16 1
Tunisia 16 17 13 13 17 2
Uganda 0 2 1 2 3 0
Zambia 2 3 3 3 4 0
Zimbabwe 17 17 17 14 14 17 19 18 18 18 2
N C America 15869 15850 15605 16079 16737 13092 12931 12448 13067 15024 32
Bahamas 2 2 1 1 0 1
Barbados 4 3 2 1 3 10Canada 9321 9226 9015 9205 9902 -93 78 414 432 2237 73Costa Rica 18 15 14 17 17 4
Cuba 5 2 6 6 0Dominican Rp 14 13 18 28 30 4El Salvador 14 14 14 23 19 34 31 38 6
Guatemala 21 21 18 22 31 3
Honduras 8 8 11 12 9 15 15 22 24 4
Jamaica 8 11 12 9 6 3
Martinique 4 3 3 3 3 8
Mexico 214 265 265 305 308 441 309 301 390 363 4
NethAntilles 2 2 3 3 3 14
Nicaragua 4 2 4 4 5 1
Panama 8 2 5 5 5 2
Trinidad Tob 4 9 7 12 12 9USA 6334 6351 6303 6544 6501 12622 12421 11594 12079 12240 45
SouthAmerica 593 667 644 596 613 1185 1365 1224 1410 1321 4
Argentina 142 176 166 145 175 259 281 230 283 279 8Bolivia 10 11 6 13 20 3
Brazil 263 282 277 265 273 534 644 641 723 670 4
Chile 186 206 198 184 163 52 89 95 60 69 5Colombia 1 1 95 108 82 91 85 2
Ecuador 2 2 2 2 2 44 50 31 36 46 4Guyana 1 1 1 2 2 2
Paraguay 16 16 7 14 20 4Peru 55 57 48 61 48 2
Uruguay 15 13 10 10 9 3
Venezuela 106 95 71 118 73 3
Asia 5481 6019 6498 6744 7060 8057 8488 9867 10073 8853 2
Azerbaijan 0 2 2 6 1
Bahrain 2 3 6 1 2 4Bangladesh 48 40 30 28 8 48 60 59 78 56 0China 721 865 995 825 835 1352 1355 1935 2107 1820 1
Cyprus 7 6 8 6 6 8Georgia 1 2 0India 350 400 400 380 400 509 568 891 852 833 1
Indonesia 239 243 267 390 478 176 189 246 266 131 1
Iran 48 53 93 51 57 1
Israel 114 108 128 133 144 24Japan 2972 3098 3140 3192 3265 3475 3578 3747 3792 3795 30Jordan 14 11 11 11 12 3
Kazakhstan 16 11 11 1
Korea D P Rp 3 1 1 1 0 0Korea Rep 874 948 1305 1592 1700 980 1113 1327 1327 892 19Kuwait 21 7 15 15 15 8Kyrgyzstan 3 3 4 1
Lebanon 7 5 7 11 11 3
Macau 4 4 2 4 4 10
Malaysia 2 2 2 3 2 214 296 239 301 200 9Mongolia 0 0 1 0 0 0
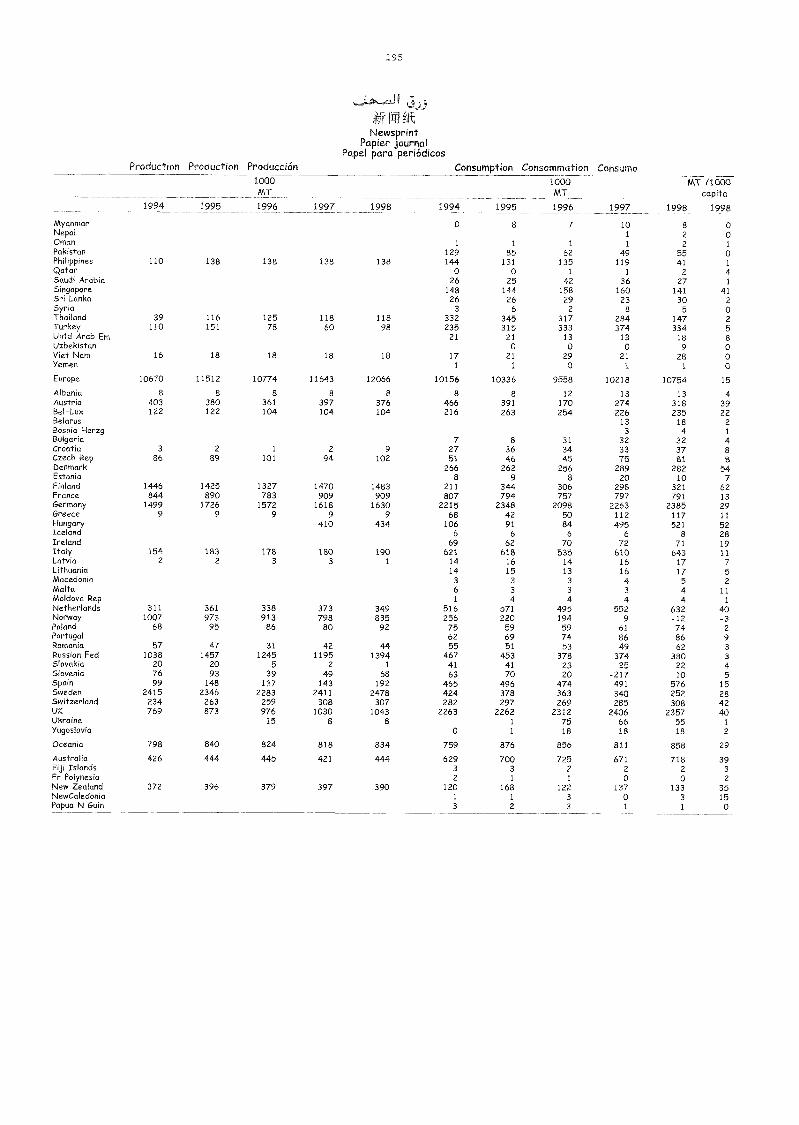
195
-11 j)..9Iì kft
NewsprintPapier journal
Papel para periódicosProduction Production Producción Consumption Consommation Consumo
1994 1995
1000MT
1996 1997 1998 1994 1995
1000MT
1996 1997
MT /1000capita
1998 1998
Myanmar 0 8 7 10 8 0Nepal 1 2 0Ornan 1 1 1 1 2 1
Pakistan 129 85 62 49 55 0Philippines 110 138 138 138 138 144 131 135 119 41 1
Qatar o 0 1 1 2 4Saudi Arabia 26 25 42 36 27 1
Singapore 148 144 158 160 141 41Sri Lanka 26 26 29 23 30 2Syria 3 6 2 8 5 0Thailand 39 116 125 118 118 332 345 317 284 147 2Turkey 110 151 78 60 98 235 315 333 374 334 5Untd Arab Em 21 21 13 13 18 8Uzbekistan 0 0 0 9 0Viet Nam 16 18 18 18 18 17 21 29 21 28 0Yemen 1 1 0 1 1 0
Europe 10670 11512 10774 11643 12066 10156 10336 9558 10218 10754 15
Albania 8 8 8 8 8 8 s 12 13 13 4Austria 403 380 361 397 376 466 391 170 274 318 39Bel-Lux 122 122 104 104 104 216 263 254 226 235 22Belarus 13 18 2Bosnia Herzg 3 4 1
Bulgaria 7 8 31 32 32 4Croatia 3 2 1 2 9 27 36 34 33 37 8Czech Rep 86 89 101 94 102 51 46 45 75 81 5Denmark 266 262 256 289 282 54Estonia 8 9 8 20 10 7Finland 1446 1425 1327 1470 1483 211 344 306 298 321 62France 844 890 783 909 909 807 794 757 797 791 13Germany 1499 1726 1572 1618 1630 2215 2348 2098 2263 2385 29Greece 9 9 9 9 9 68 42 50 112 117 11Hungary 410 434 106 91 84 495 521 52Iceland 6 6 6 6 8 28Ireland 69 62 70 72 71 19Italy 154 183 178 180 190 621 618 535 610 643 11Latvia 2 2 3 3 1 14 16 14 16 17 7Lithuania 14 15 13 16 17 5Macedonia 3 3 3 4 5 2Malta 6 3 3 3 4 11Moldova Rep 1 4 4 4 4 1
Netherlands 311 361 338 373 349 516 571 495 552 632 40Norway 1007 973 913 798 835 256 220 194 9 -12 -3Poland 68 95 86 80 92 75 59 59 61 74 2Portugal 62 69 74 86 86 9Romania 57 47 31 42 44 55 51 53 49 62 3Russian Fed 1038 1457 1245 1195 1394 467 453 378 374 380 3Slovakia 20 20 5 2 1 41 41 23 25 22 4Slovenia 76 93 39 49 68 63 70 20 -217 10 5Spain 99 148 137 143 192 465 496 474 491 576 15Sweden 2415 2346 2283 2411 2478 424 378 363 340 252 28Switzerland 234 263 259 308 307 282 297 269 285 308 42UK 769 873 976 1030 1043 2263 2262 2312 2406 2357 40Ukraine 15 8 8 1 75 66 55 1
Yugoslavia 0 1 18 18 18 2
Oceania 798 840 824 818 834 759 876 856 811 858 29
Australia 426 444 445 421 444 629 700 725 671 718 39Fiji Islands 3 3 2 2 2 3Fr Polynesia 2 1 1 0 0 2New Zealand 372 396 379 397 390 120 168 122 137 133 35NewCaledonia 1 1 3 0 3 15Papua N Guin 3 2 3 1 1 0
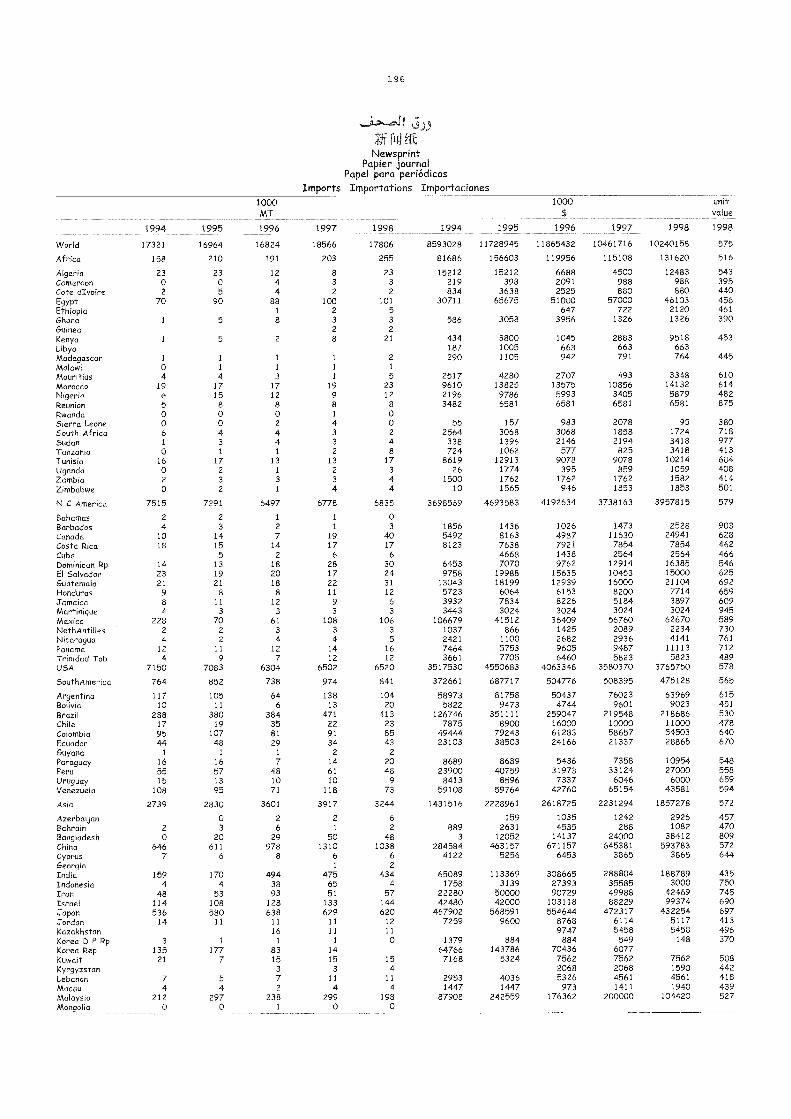
196
I j9).9
kr rf0 ftNewsprint
Papier journalPapel para periódicos
Imports Importations Importaciones
1994 1995
1000MT
1996 1997 1998 1994 1995
1000$
1996 1997 1998
unitvalue
1998
VVoHd 17321 16964 16824 18566 17806 8593028 11728945 11865432 10461716 10240158 575
Africa 158 210 191 203 255 81686 156603 119956 115108 131620 516
Algeria 23 23 12 8 23 15212 15212 6688 4500 12483 543Cameroon 0 0 4 3 3 219 398 2091 988 988 395Cote dIvoire 2 5 4 2 2 834 3638 2525 880 880 440Egypt 70 90 88 100 101 30711 65675 51000 57000 46103 456Ethiopia 1 2 5 647 722 2120 461Ghana 1 5 8 3 3 586 3058 3956 1326 1326 390Guinea 2 2
Kenya 1 5 2 8 21 434 3800 1045 2883 9518 453Libya 187 1005 663 663 663Madagascar 1 1 1 1 2 290 1105 942 791 764 445Malawi 0 1 1 1 1
Mauritius 4 4 3 1 5 2517 4280 2707 493 3348 610Morocco 19 17 17 19 23 9610 13825 13575 10856 14132 614Nigeria 6 15 12 9 12 2196 9786 5993 3405 5879 482Reunion 5 8 8 8 8 3482 6581 6581 6581 6581 875Rwanda 0 0 0 1 o
Sierra Leone 0 0 2 4 0 55 157 983 2078 95 380South Africa 6 4 4 3 2 2564 3068 3068 1858 1724 718Sudan 1 3 4 3 4 338 1396 2146 2194 3418 977Tanzania 0 1 1 2 8 724 1062 577 825 3418 413Tunisia 16 17 13 13 17 8619 12913 9078 9078 10214 604Uganda 0 2 1 2 3 26 1774 395 859 1059 408Zambia 2 3 3 3 4 1500 1762 1762 1762 1582 414Zimbabwe 0 2 1 4 4 10 1565 946 1853 1853 501
N C America 7515 7291 6497 6778 6835 3698569 4693583 4192634 3738163 3957815 579
Bahamas 2 2 i 1 oBarbados 4 3 2 1 3 1856 1436 1026 1473 2528 903Canada 10 14 7 19 40 5492 8163 4987 11630 24941 628Costa Rica 18 15 14 17 17 8123 7638 7921 7854 7854 462Cuba 5 2 6 6 4668 1438 2564 2564 466Dominican Rp 14 13 18 28 30 6453 7070 9762 12914 16385 546El Salvador 23 19 20 17 24 9758 19988 15635 10453 15000 625Guatemala 21 21 18 22 31 13043 18199 12939 16000 21104 692Honduras 9 8 8 11 12 5723 6064 6153 8200 7714 659Jamaica 8 11 12 9 6 3932 7834 8226 5184 3897 609Martinique 4 3 3 3 3 3443 3024 3024 3024 3024 945Mexico 228 70 61 108 106 106679 41512 36409 56760 62670 589NethAntilles 2 2 3 3 3 1037 866 1425 2089 2234 730Nicaragua 4 2 4 4 5 2421 1100 2682 2936 4141 761Panama 12 11 12 14 16 7464 5753 9605 9487 11113 712TrMidadTob 4 9 7 12 12 3661 7705 6460 5823 5823 489USA 7150 7083 6304 6502 6520 3517530 4550683 4063348 3580370 3765750 578
SouthAmerica 764 852 738 974 841 372661 687717 504776 508395 475128 565
Argentina 117 105 64 138 104 58973 81758 50437 76023 63969 615Bolivia 10 11 6 13 20 5822 9473 4744 9601 9023 451Brazd 288 380 384 471 413 126746 351111 259047 219548 218686 530Chile 17 19 35 22 23 7875 8900 16000 10000 11000 478Colombia 95 107 81 91 85 49444 79243 61283 58657 54503 640Ecuador 44 48 29 34 43 23103 38503 24166 21337 28865 670Guyana 1 1 1 2 2
Paraguay 16 16 7 14 20 8689 8689 5436 7358 10954 548Peru 55 57 48 61 48 23900 40759 31973 33124 27000 558Uruguay 15 13 10 10 9 8413 8596 7337 6046 6000 659Venezuela 108 95 71 118 73 59108 59764 42760 65154 43581 594
Asia 2739 2830 3601 3917 3244 1431516 2228961 2618725 2231294 1857278 572
Azerbaijan 0 2 2 6 159 1035 1242 2926 457Bahrain 2 3 6 1 2 889 2631 4535 288 1082 470Bangladesh 0 20 29 50 48 3 12052 14137 24000 38412 809Chino 646 611 978 1310 1038 284584 463157 671157 645381 593783 572Cyprus 7 6 8 6 6 4122 5256 6453 3865 3865 644Georgia 1 2
India 159 170 494 475 434 65089 113369 308665 288804 188789 435Indonesia 4 4 38 65 4 1758 3139 27393 35585 3000 750Iran 48 53 93 51 57 22280 50000 90729 49988 42469 745Israel 114 108 128 133 144 42480 42000 103118 88229 99374 690Japan 536 580 638 629 620 467902 568591 554644 472317 432254 697Jordan 14 11 11 11 12 7259 9600 8768 6114 5117 413Kazakhstan 16 11 11 9747 5458 5458 496Korea D P Rp 3 1 1 1 o 1379 884 884 549 148 370Korea Rep 135 177 83 14 64766 143786 70436 6077Kuwait 21 7 15 15 15 7168 5324 7562 7562 7562 508Kyrgyzstan 3 3 4 2068 2068 1590 442Lebanon 7 5 7 11 11 2953 4036 5326 4561 4561 418Macau 4 4 2 4 4 1447 1447 973 1411 1940 439Malaysia 212 297 238 299 198 87908 242559 176362 200000 104420 527Mongolia 0 0 1 0 0
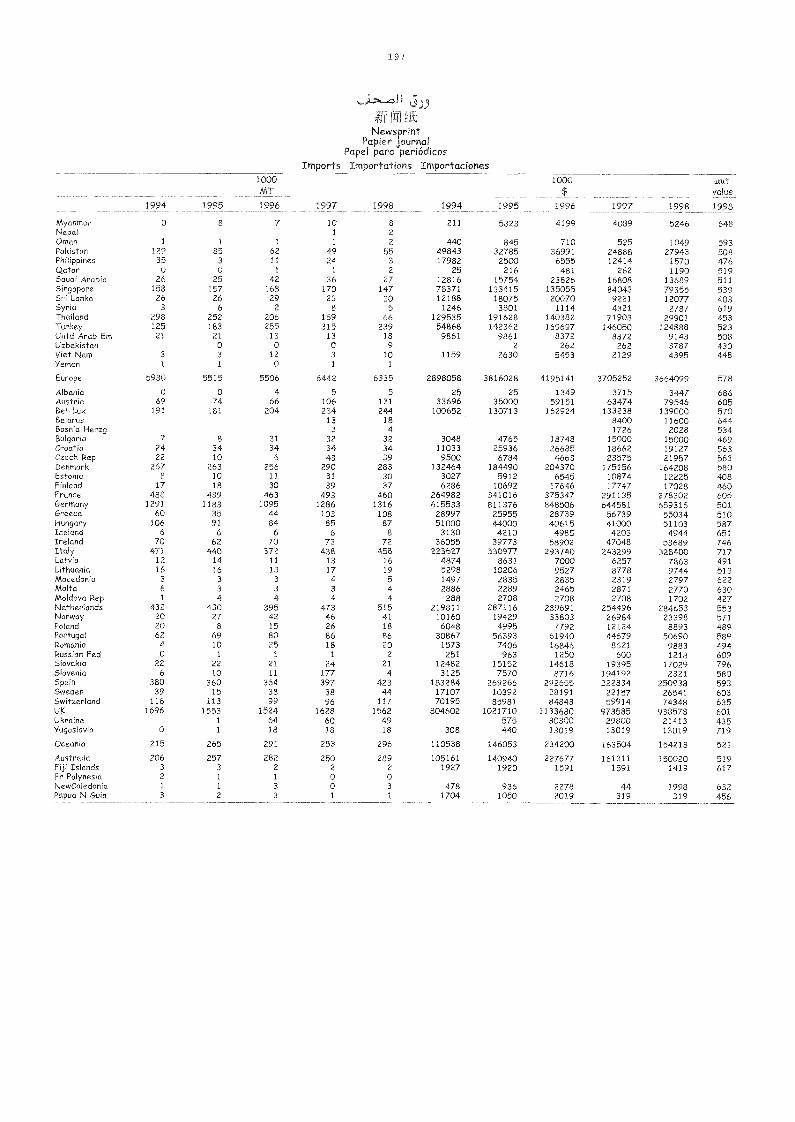
197
9 o
111-1. ft
NewsprintPapier journal
Papel para periódicosImports Importations Importaciones
1994 1995
1000MT
1996 1997 1998 1994 1995
1000$
1996 1997 1998
unitvalue
1998
Myanmar 0 8 7 10 8 211 5823 4199 4089 5246 648Nepal 1 2Ornan 1 1 1 1 2 440 845 710 525 1049 593Pakistan 129 85 62 49 55 49843 32785 36991 24888 27943 508PhdippMes 35 3 11 24 3 17982 2500 6555 12414 1570 476Qatar 0 0 1 1 2 25 216 481 262 1190 519Saudi Arabia 26 25 42 36 27 12816 15754 23826 16808 13689 511Singapore 158 157 168 170 147 78371 133415 135055 84043 79355 539Sri Lanka 26 26 29 23 30 12188 18075 20070 9221 12077 403Syria 3 6 2 8 5 1246 3801 1114 4321 2787 619Thafland 298 252 206 169 66 129535 191628 140382 71903 29901 453Turkey 125 183 255 315 239 54868 142362 169697 146050 124888 523Untd Arab Era 21 21 13 13 18 9861 9861 8372 8372 9143 508Uzbekistan 0 0 0 9 2 262 262 3787 430Viet Nam 3 3 12 3 10 1159 2630 5453 2129 4395 448Yemen 1 1 0 1 1
Europe 5930 5515 5506 6442 6335 2898058 3816028 4195141 3705252 3664099 578
Albania 0 0 4 5 5 25 25 1349 3715 3447 686Austria 69 74 66 106 131 33696 35000 59151 63474 79546 6058el-Lux 191 181 204 234 244 100652 130713 162924 133238 139000 570Belorus 13 18 8400 11600 644BosnM Herzg 3 4 1726 2028 534Bulgaria 7 8 31 32 32 3048 4765 18748 15000 15000 469CroatM 24 34 34 34 34 11033 25936 26685 18662 19127 563Czech Rep 22 10 6 43 39 9500 6784 4663 23575 21957 563Denmark 267 263 256 290 283 132464 184490 204370 175156 164208 580Estonia 8 10 11 31 30 3027 5912 6545 10874 12225 408FMMnd 17 18 30 39 37 6286 10692 17646 17747 17028 460France 488 439 463 493 460 264982 341016 375347 291135 278302 605Germany 1291 1183 1095 1286 1316 615533 811376 848506 644581 659316 501Greece 60 35 44 103 108 28997 25955 28739 56739 55034 510Hungary 106 91 84 85 87 51000 44000 40615 41000 51103 587IceMnd 6 6 6 6 8 3130 4210 4985 4203 4944 651IreMnd 70 62 70 73 72 36055 39773 58902 47048 53689 746Italy 471 440 372 438 458 223627 330977 293740 243299 328400 717LatvM 12 14 11 13 16 4874 8631 7000 6257 7863 491LithuanM 16 16 13 17 19 5298 10206 9527 8778 9744 513MacedonM 3 3 3 4 5 1497 2835 2835 2319 2797 622Malta 6 3 3 3 4 2886 2289 2465 2871 2770 630MoMova Rep 1 4 4 4 4 288 2708 2708 2708 1702 427NetherMnds 432 430 395 473 515 219811 287116 289691 254496 284653 553Norway 20 27 42 46 41 10160 19429 33803 26984 23398 571PoMnd 20 8 15 26 18 6048 4995 7792 12124 8893 489Portugal 62 69 80 86 86 30867 56393 61940 44679 50690 589Romania 4 10 25 18 20 1573 7406 16846 8621 9883 494Russian Fed 0 1 1 1 2 251 963 1250 600 1218 609SMvakM 22 22 21 24 21 12482 15152 14618 19395 17029 796SloveMa 6 10 11 177 4 3125 7570 8716 194192 2321 580SpaM 380 360 364 397 423 183284 269266 292655 222834 250938 593Sweden 39 15 38 38 44 17107 10392 28191 22157 26541 603SwitzerMnd 116 113 99 96 117 70195 85981 84843 59914 74348 635UK 1696 1553 1524 1628 1562 804602 1021710 1133680 973585 938578 601UkraMe 1 64 60 49 575 30300 29800 21413 435Yugoslavia 0 1 18 18 18 308 440 13019 13019 13019 719
C)ceania 215 265 291 253 296 110538 146053 234200 163504 154218 521
Australia 206 257 282 250 289 105161 140940 227677 161311 150020 519Fiji Islands 3 3 2 2 2 1927 1920 1591 1591 1419 617Fr Polynesia 2 1 1 0 0NewCaledonia 1 1 3 0 3 478 936 2278 44 1998 632Papua N GuM 3 2 3 1 1 1704 1050 2019 319 319 456
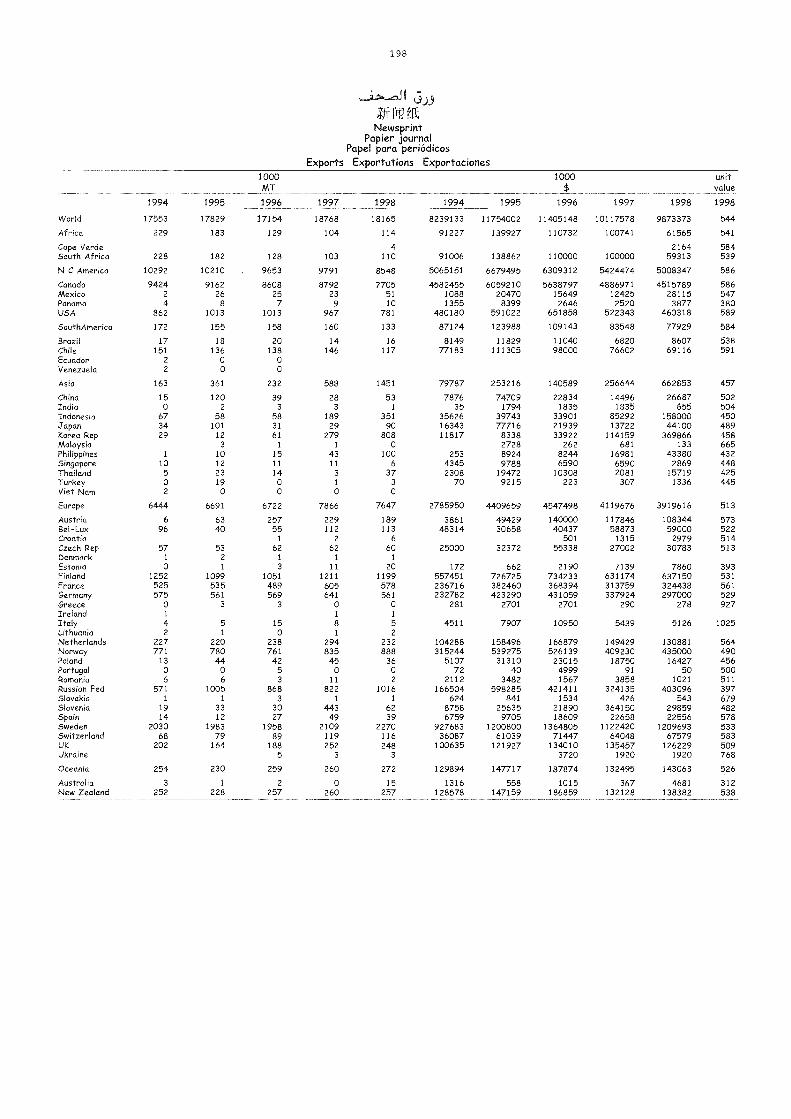
198
C9).9
rrflftNewsprint
Papier journalPapel para periódicos
Exports Exportations Exportaciones
1994 1995
1000MT
1996 1997 1998 1994 1995
1000$
1996 1997 1998
unitvalue
1998
World 17553 17829 17154 18768 18165 8239133 11754002 11405148 10117578 9873373 544
Africa 229 183 129 104 114 91227 139927 110732 100741 61565 541
Cape Verde 4 2164 584South Africa 228 182 128 103 110 91006 138862 110000 100000 59313 539
N C America 10292 10210 9653 9791 8548 5065151 6679495 6309312 5424474 5008347 586
Canada 9424 9162 8608 8792 7705 4582455 6059210 5638797 4886971 4515789 586Mexico 2 26 25 23 51 1088 20470 15649 12425 28115 547Panama 4 8 7 9 10 1355 8399 2646 2520 3877 380USA 862 1013 1013 967 781 480180 591022 651858 522343 460318 589
SouthAmerica 172 155 158 160 133 87124 123988 109143 83548 77929 584
Brazil 17 18 20 14 16 8149 11829 11040 6820 8607 538Chile 151 136 138 146 117 77183 111305 98000 76602 69116 591Ecuador 2 0 0Venezuela 2 0 0
Asia 163 361 232 588 1451 79787 253216 140589 256644 662853 457
China 15 120 39 28 53 7876 74709 22834 14496 26687 502India 0 2 3 3 1 35 1794 1835 1835 655 504Indonesia 67 58 58 189 351 35626 39743 33901 85292 158000 450Japan 34 101 31 29 90 16343 // 16 21939 13722 44100 489Korea Rep 29 12 61 279 808 11817 8338 33922 114159 369866 458Malaysia 3 1 1 0 2728 262 681 133 665Philippines 1 10 15 43 100 253 8924 8244 16981 43380 432Singapore 10 12 11 11 6 4345 9788 6590 6590 2869 448Thailand 5 23 14 3 37 2308 19472 10308 2081 15719 425Turkey 0 19 0 1 3 70 9215 223 307 1336 445Viet Nam 2 0 0 0 0
Europe 6444 6691 6722 7866 7647 2785950 4409659 4547498 4119676 3919616 513
Austria 6 63 257 229 189 3861 49429 140000 117846 108344 573Bel-Lux 96 40 55 112 113 48314 30658 40437 58873 59000 522Croatia 1 2 6 501 1315 2979 514Czech Rep 57 53 62 62 60 25000 32372 55338 27002 30783 513Denmark 1 2 1 1 1
Estonia 0 1 3 11 20 172 662 2190 7139 7860 393Finland 1252 1099 1051 1211 1199 557451 726725 734233 631174 637150 531France 525 535 489 605 578 236716 382460 368394 313759 324438 561Germany 575 561 569 641 561 232782 423290 431059 337924 297000 529Greece 0 3 3 0 0 281 2701 2701 290 278 927Ireland 1 1 1
Italy 4 5 15 8 5 4511 7907 10950 5439 5126 1025Lithuania 2 1 0 1 2
Netherlands 227 220 238 294 232 104288 158496 166879 149429 130881 564Norway 771 780 761 835 888 315244 539275 526139 409230 435000 490Poland 13 44 42 45 36 5107 31310 23015 18750 16427 456Portugal 0 0 5 0 0 72 40 4999 91 50 500Romania 6 6 3 11 2 2112 3482 1567 3858 1021 511Russian Fed 571 1005 868 822 1016 166504 598285 421411 324135 403096 397Slovakia 1 1 3 1 1 624 841 1534 426 543 679Slovenia 19 33 30 443 62 8758 25635 21890 364150 29859 482Spain 14 12 27 49 39 6759 9705 18609 22658 22556 578Sweden 2030 1983 1958 2109 2270 927683 1200800 1364805 1122420 1209693 533Switzerland 68 79 89 119 116 36087 61039 71447 64048 67579 583UK 202 164 188 252 248 100635 121927 134010 135457 126229 509Ukraine 5 3 3 3720 1920 1920 768
Oceania 254 230 259 260 272 129894 147717 187874 132495 143063 526
Australia 3 1 2 0 15 1316 558 1015 367 4681 312New Zealand 252 228 257 260 257 128578 147159 186859 132128 138382 538
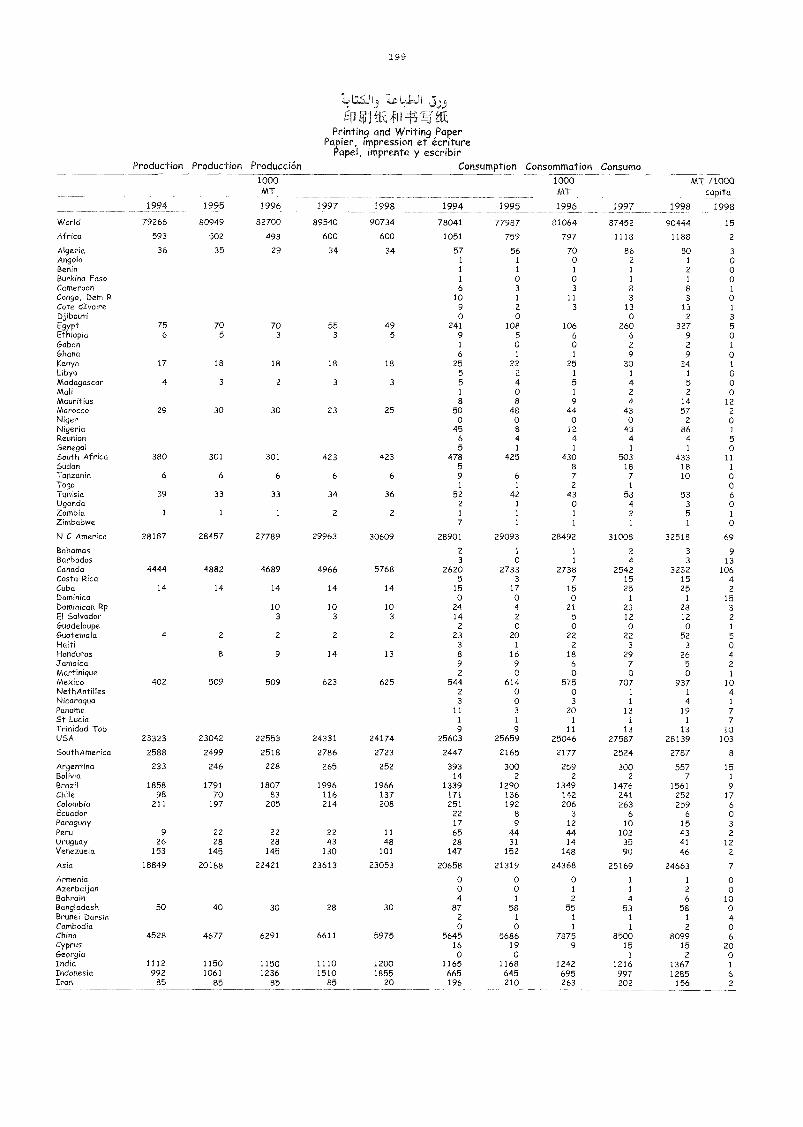
199
î L1.4:15 - 1
ifIJ ftf(i+;
Production Production Producción
Printing and Writing PaperPa ier, impression et écriture
Papel, imprenta y escribirConsump ion Consommation Consumo
1994 1995
1000MT
1996 1997 1998 1994 1995
1000MT
1996 1997
MT /1000capita
1998 1998
World 79266 80949 82700 89540 90734 78041 77987 81064 87452 90444 15
Africa 593 502 493 600 600 1051 759 797 1118 1188 2
Algeria 36 35 29 34 34 57 56 70 86 80 3Angola 1 1 o 2 1 oBenin 1 1 1 I 2 oBurkina Faso 1 o o 1 1 oCameroon 6 3 3 8 8 1
Congo, Dem 12 lo 1 11 3 3 oCote dIvoire 9 2 3 13 13 1
Djibouti o o o 2 3
Egypt 75 70 70 55 49 241 108 106 260 327 5Ethiopia 6 5 3 3 5 9 5 6 6 9 oGabon 1 o o 2 2 1
Ghana 6 1 1 9 9 oKenya 17 18 18 18 18 25 22 25 30 34 1
Libya 5 2 1 1 1 oMadagascar 4 3 2 3 3 5 4 5 4 5 oMali 1 o 1 2 2 oMauritius 8 8 9 4 14 12Morocco 29 30 30 23 25 50 48 44 43 57 2
Niger o o o o 2 oNigeria 45 8 12 43 86 1
Reunion 6 4 4 4 4 5Senegal 5 1 1 1 1 oSouth Africa 380 301 301 423 423 478 425 430 503 433 11Sudan 5 8 18 18 1
Tanzania 6 6 6 6 6 9 6 7 7 10 oTogo 1 1 2 1 oTunisia 39 33 33 34 36 52 42 43 58 53 6Uganda 2 1 o 4 3 oZambia 1 1 1 2 2 1 1 1 2 5 1
Zimbabwe 7 1 1 1 1 o
N C America 28187 28457 27789 29963 30609 28901 29093 28492 31008 32518 69
Bahamas 2 1 1 2 3 9Barbados 3 o 1 4 3 13Canada 4444 4882 4689 4966 5768 2620 2733 2738 2542 3232 106Costa Rica 5 3 7 15 15 4Cuba 14 14 14 14 14 15 17 15 25 25 2Dominica o o o 1 1 15Dominican Rp 10 10 10 24 4 21 23 28 3
El Salvador 3 3 3 14 2 5 12 12 2
Guadeloupe 2 o o o o 1
Guatemala 4 2 2 2 2 23 20 22 22 52 5Haiti 3 1 2 3 3 oHonduras 8 9 14 13 8 16 18 29 26 4Jamaica 9 9 6 7 5 2Martinique 2 o o o o 1
Mexico 402 509 509 623 625 544 614 575 707 937 10NethAntilles 2 o o 1 1 4Nicaragua 3 o 3 1 4 1
Panama 11 3 20 13 19 7St Lucia 1 1 1 1 1 7Trinidad Tob 9 9 11 13 13 10USA 23323 23042 22553 24331 24174 25603 25659 25046 27587 28139 103
SouthAmerica 2588 2499 2518 2786 2723 2447 2165 2177 2524 2787 8
Argentina 233 246 228 265 252 393 300 259 300 557 15Bolivia 14 2 2 2 7 1
Brazil 1858 1791 1807 1996 1966 1339 1290 1349 1476 1561 9Chile 98 70 83 116 137 171 136 142 241 252 17Colombia 211 197 205 214 208 251 192 206 263 259 6Ecuador 22 8 3 6 6 oParaguay 17 9 12 10 15 3Peru 9 22 22 22 11 65 44 44 102 43 2Uruguay 26 28 28 43 48 28 31 14 35 41 12Venezuela 153 145 145 130 101 147 152 148 90 46 2
Asia 18849 20188 22421 23613 23053 20658 21319 24368 25169 24663 7
Armenia o o o i 1 oAzerbaijan o o 1 1 2 oBahrain 4 1 2 4 6 10Bangladesh 50 40 30 28 30 87 58 55 53 58 oBrunei Darsm 2 1 1 1 1 4Cambodia O o 1 1 2 oChina 4528 4677 6291 6611 5975 5645 5686 7875 8500 8099 6CyprusGeorgia
16O
19o
9 151
152
20o
India 1112 1150 1150 1110 1200 1165 1168 1242 1216 1367 1
Indonesia 992 1061 1236 1510 1855 665 645 695 997 1285 6Iran 85 85 85 85 20 196 210 263 202 156 2
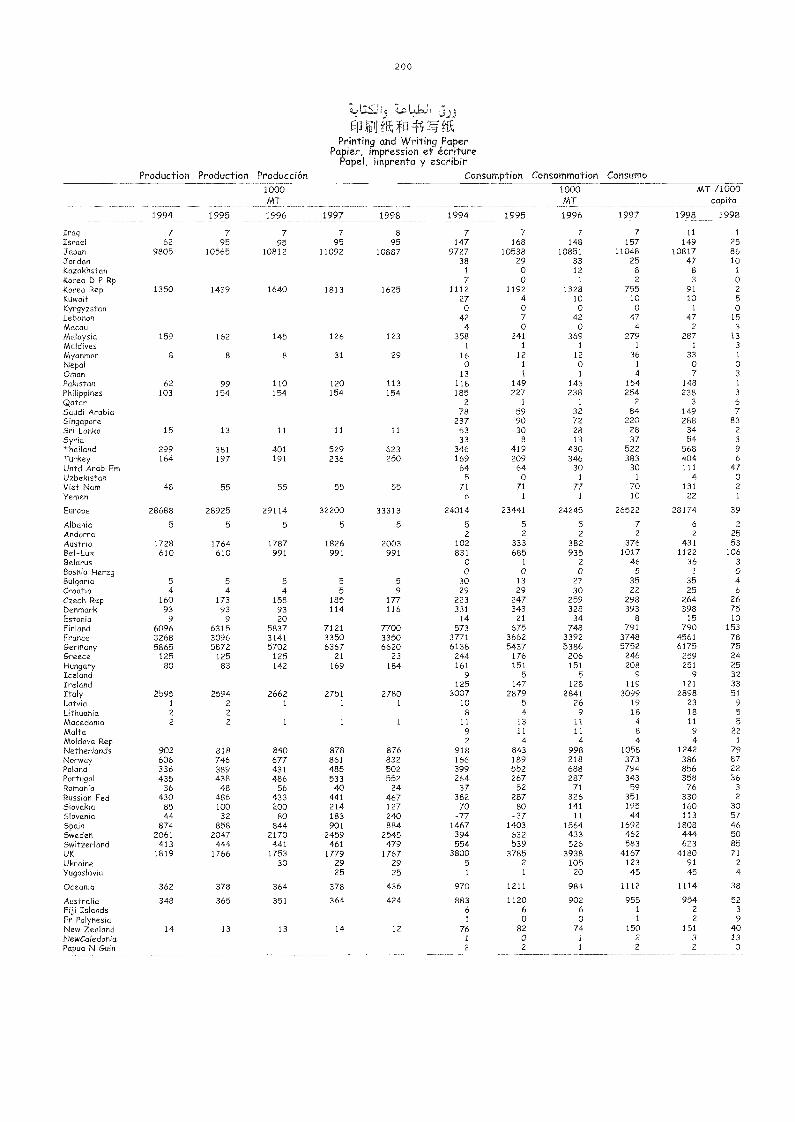
200
fuLJ-11J
Printing and Writing PaperPa ier, impression et écriture
apel, imprenta y escribirProduction Production Producción Consumption Consommation Consumo
1994 1995
1000MT
1996 1997 1998 1994 1995
1000MT
1996 1997
MT /1000capita
1998 1998
Iraq 7 7 7 7 8 7 7 7 7 11 1
Israel 62 95 95 95 95 147 168 148 157 149 25Japan 9805 10565 10812 11092 10887 9727 10538 10851 11048 10817 86Jordan 38 29 33 25 47 10Kazakhstan 1 0 12 8 8 1
Korea D P Rp 7 0 1 2 3 0Korea Rep 1350 1439 1640 1813 1625 1112 1192 1328 755 91 2
Kuwait 27 4 10 10 10 5
Kyrgyzstan 0 0 0 0 1 0Lebanon 42 7 42 47 47 15Macau 4 0 0 4 2 3
Malaysia 159 162 145 126 123 358 241 369 279 287 13
Maldives 1 1 1 1 1 3
Myanmar 8 8 8 31 29 16 12 12 36 33 1
Nepal 0 1 0 1 0 0Oman 13 1 1 4 7 3
Pakistan 62 99 110 120 113 118 149 143 154 148 1
Philippines 103 154 154 154 154 185 227 238 254 238 3
Qatar 2 1 1 2 3 6
Saudi Arabia 78 59 32 84 149 7
Singapore 237 90 72 220 288 83Sri Lanka 15 13 11 11 11 63 30 28 28 34 2
Syria 33 8 13 37 54 3
Thailand 299 381 401 529 623 346 419 430 522 568 9
Turkey 164 197 191 236 250 169 209 346 383 404 6
Untd Arab Em 64 64 30 30 111 47Uzbekistan 5 0 1 1 4 0
Viet Nam 48 55 55 55 55 71 71 77 70 131 2
Yemen 6 1 1 10 22 1
Europe 28688 28925 29114 32200 33313 24014 23441 24245 26522 28174 39
Albania 5 5 5 5 5 5 5 5 7 6 2
Andorra 2 2 2 2 2 25Austria 1728 1764 1787 1826 2003 102 333 382 376 431 53Bel-Lux 610 610 991 991 991 831 685 935 1017 1122 106Belarus 0 1 2 46 36 3
Bosnia Herzg 0 0 0 5 / 0Bulgaria 5 5 5 5 5 30 13 27 35 35 4Croatia 4 4 4 5 9 29 29 30 22 25 6
Czech Rep 160 173 158 185 177 223 247 259 298 264 26Denmark 93 93 93 114 116 331 343 328 393 398 75Estonia 9 9 20 14 21 34 8 15 10Finland 6096 6315 5837 7121 7700 573 675 748 791 790 153France 3268 3096 3141 3350 3350 3771 3662 3392 3748 4561 78Germany 5865 5872 5702 6367 6620 6138 5437 5386 5752 6175 75Greece 125 125 125 21 23 244 176 206 246 259 24Hungary 80 83 142 169 184 161 151 151 208 251 25Iceland 9 5 5 9 9 32Ireland 125 147 128 119 121 33Italy 2595 2594 2662 2751 2780 3007 2879 2841 3099 2898 51Latvia 1 2 1 1 1 10 5 26 19 23 9Lithuania 2 2 8 4 9 18 18 5
Macedonia 2 2 1 1 1 11 13 11 4 11 5
Malta 9 11 11 8 9 22Moldova Rep 2 4 4 4 4 1
Netherlands 902 818 840 878 876 918 843 998 1058 1242 79Norway 606 746 677 861 832 166 189 218 373 386 87Poland 336 389 431 485 502 399 552 688 794 856 22
Portugal 435 438 486 533 552 264 267 287 343 358 36Romania 36 48 56 40 24 37 52 71 59 76 3
Russian Fed 430 486 433 441 467 382 287 326 351 330 2
Slovakia 85 100 200 214 127 70 80 141 195 160 30Slovenia 44 32 80 183 240 -77 -37 11 44 113 57Spain 874 858 844 901 884 1467 1403 1564 1692 1808 46Sweden 2061 2047 2170 2459 2545 394 632 433 462 444 50Switzerland 413 444 441 461 479 554 539 526 583 623 85UK 1819 1766 1753 1779 1767 3800 3785 3938 4167 4180 71
Ukraine 30 29 29 5 2 105 123 91 2
Yugoslavia 25 25 1 1 20 45 45 4
Oceania 362 378 364 378 436 970 1211 984 1112 1114 38
Australia 348 365 351 364 424 883 1120 902 955 954 52Fiji Islands 6 6 6 1 2 3
Fr Polynesia 1 0 0 1 2 9New Zealand 14 13 13 14 12 76 82 74 150 151 40NewCaledonia 1 0 1 2 3 13Papua N Guin 2 2 1 2 2 0
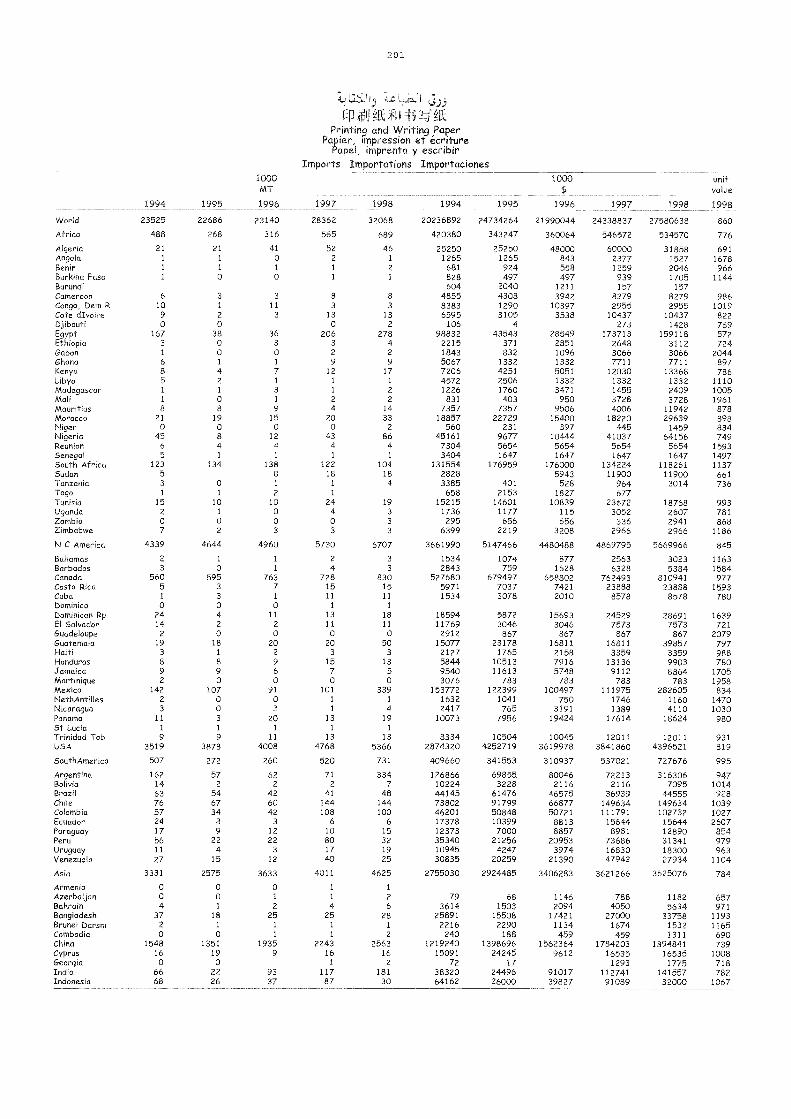
201
I
1P1 41; "-q11Printing and Writing Paper
Pa ier, impression et écriturePapel, imprenta y escribir
Imports Importations Importaciones
1994 1995
1000MT
1996 1997 1998 1994 1995 1996 1997 1998
unitvalue
1998
World 23525 22686 23140 28362 32068 20236892 24734264 21990044 24338837 27580638 860
Africa 488 268 316 565 689 420380 343247 360064 546572 534570 776
Algeria 21 21 41 52 46 25250 25250 48000 60000 31858 691Angola 1 1 o 2 1 1265 1265 843 2377 1527 1678Benin 1 1 1 1 2 681 924 558 1259 2046 966BurkMa Faso 1 o o 1 1 828 497 497 939 1705 1144Burundi 604 2040 1211 157 157Cameroon 6 3 3 8 8 4855 4308 3942 8279 8279 986Congo, Dem R 10 1 11 3 3 8383 1290 10397 2955 2955 1019Cote dIvoMe 9 2 3 13 13 6595 3105 3538 10437 10437 822Djibouti 0 0 0 2 106 4 273 1428 769Egypt 167 38 36 206 278 98832 43543 28549 173713 159118 572Ethiopia 3 0 3 3 4 2215 371 2851 2648 3112 724Gabon 1 o o 2 2 1843 832 1096 3066 3066 2044Ghana 6 1 1 9 9 5067 1332 1332 7711 7711 897Kenya 8 4 7 12 17 7206 4251 5051 12030 13368 786Libya 5 2 1 1 1 4572 2506 1332 1332 1332 1110Madagascar 1 1 3 1 2 1226 1760 3471 1455 2409 1005Mali 1 0 1 2 2 831 403 950 3728 3728 1961Mauritius 8 8 9 4 14 7357 7357 9506 4006 11942 878Morocco 21 19 15 20 33 18857 22729 15400 18220 29639 898Niger 0 0 0 0 2 560 231 397 445 1459 834Nigeria 45 8 12 43 86 45161 9677 10444 41037 64156 749Reunion 6 4 4 4 4 7304 5654 5654 5654 5654 1593Senegal 5 1 1 1 1 3404 1647 1647 1647 1647 1497South Africa 123 134 138 122 104 131554 176959 176000 134224 118261 1137Sudan 5 8 18 18 2828 5943 11900 11900 661Tanzania 3 0 1 1 4 3385 401 528 964 3014 736Togo 1 1 2 1 658 2153 1827 677TunisM 15 10 10 24 19 15215 14601 10839 23672 18768 993Uganda 2 1 o 4 3 1736 1177 115 3052 2607 781Zambia 0 0 0 0 3 295 656 656 336 2941 868Zimbabwe 7 2 3 3 3 6399 2219 3208 2966 2966 1186
N C America 4339 4644 4960 5730 6707 3661990 5147466 4480488 4869795 5669966 845
Bahamas 2 1 1 2 3 1534 1074 877 2563 3023 1163Barbados 3 o 1 4 3 2843 759 1628 6328 5384 1584Cariado 560 595 763 728 830 527680 679497 658802 762493 810941 977Costa Rica 5 3 7 15 15 5971 7037 7421 23888 23888 1593Cuba 1 3 1 11 11 1534 3078 2010 8578 8578 780Dominica o o o 1 1
DomMicanRp 24 4 11 13 18 18594 5872 15693 24529 28691 1639El Salvador 14 2 2 11 11 11769 3046 3046 7573 7573 721Guadeloupe 2 0 0 0 0 2912 867 867 867 867 2079Guatemala 19 18 20 20 50 15077 23178 16811 16811 39857 797Haiti 3 1 2 3 3 2127 1765 2158 3359 3359 988Honduras 8 8 9 15 13 5844 10513 7916 13136 9903 780Jamaica 9 9 6 7 5 9540 11613 5748 9112 8864 1705Martinique 2 0 o o o 3076 783 783 783 783 1958Mexico 142 107 91 101 339 153772 122399 100497 111975 282605 834NethAntilles 2 0 0 1 1 1632 1041 750 1746 1160 1470Nicaragua 3 0 3 1 4 2417 765 3191 1389 4110 1030Panama 11 3 20 13 19 10073 7956 19424 17614 18624 980St Lucia 1 1 1 1 1
Trinidad Tob 9 9 11 13 13 8334 10504 10045 12011 12011 931USA 3519 3878 4008 4768 5366 2874320 4252719 3619978 3841860 4396521 819
SouthAmerica 507 272 260 520 731 409660 341553 310937 537021 727676 995
Argentina 162 57 62 71 334 126866 69855 80046 72213 316306 947Bolivia 14 2 2 2 7 10224 3228 2116 2116 7095 1014Brazd 63 54 42 41 48 44145 61476 46575 36939 44555 928Chile 76 67 60 144 144 73802 91799 66877 149634 149634 1039Colombia 57 34 42 108 100 46201 50848 50721 111791 102732 1027Ecuador 24 8 3 6 6 17378 10399 8813 15644 15644 2607Paraguay 17 9 12 10 15 12373 7000 8857 8981 12890 854Peru 56 22 22 80 32 35340 21256 20953 73686 31341 979Uruguay 11 4 3 17 19 10945 4247 3974 16830 18300 963Venezuela 27 15 12 40 25 30835 20259 21390 47942 27934 1104
Asia 3331 2575 3633 4011 4625 2755030 2924485 3406283 3621266 3625076 784
Armenia 0 0 0 1 1
Azerbaijan 0 0 1 1 2 79 68 1146 788 1182 657BahraM 4 1 2 4 6 3614 1503 2094 4050 5634 971Bangladesh 37 18 25 25 28 25891 15508 17421 27000 33758 1193Brunei Darsm 2 1 1 1 1 2216 2290 1134 1674 1532 1165CambodM 0 0 1 1 2 240 188 459 459 1311 690China 1548 1351 1935 2243 2563 1219240 1398696 1562364 1784203 1894841 739Cyprus 16 19 9 16 16 15091 24245 9612 16535 16535 1008GeorgM 0 0 1 2 72 17 1293 1775 718India 66 22 93 117 181 38320 24496 91017 112741 141557 782Indonesia 68 26 37 87 30 64162 26000 39827 91089 32000 1067
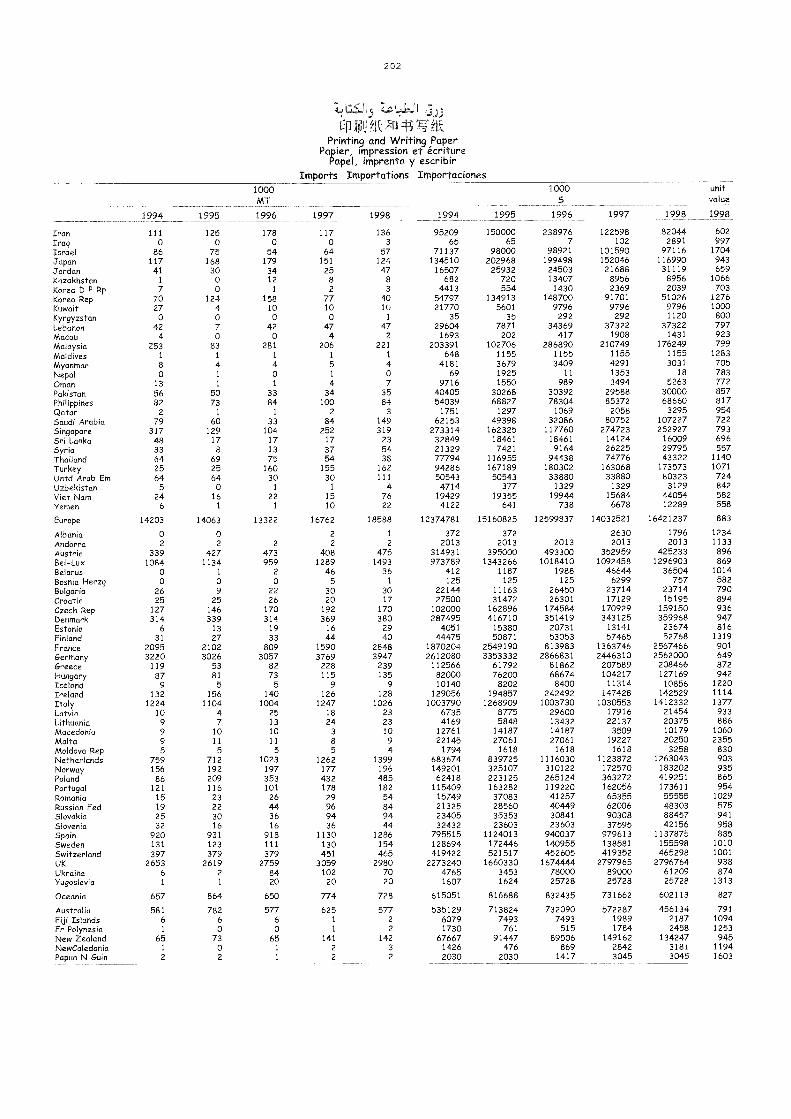
202
CP gik111Printing and Writing Paper
Papier, impression et écriturePapel, imprenta y escribir
Innports Importations Importaciones
1994 1995
1000hAT
1996 1997 1998 1994 1995
1000$
1996 1997 1998
unitvalue
1998
Iran 111 125 178 117 136 95209 150000 238976 122598 82044 602Iraq o o o o 3 65 65 7 102 2891 997Israel 86 75 54 64 57 71137 98000 98921 101590 97116 1704Japan 117 168 179 151 124 134510 202968 199498 152046 116990 943Jordan 41 30 34 25 47 16507 25932 24503 21688 31119 659Kazakhstan 1 0 12 8 8 682 720 13407 8956 8956 1066Korea D P Rp 7 0 1 2 3 4413 554 1430 2369 2039 703Korea Rep 70 124 158 77 40 54797 134913 148700 91701 51026 1276
Kuwait 27 4 10 10 10 21770 5601 9796 9796 9796 1000Kyrgyzstan o o o o 1 35 35 292 292 1120 800Lebanon 42 7 42 47 47 29604 7871 34369 37322 37322 797Macau 4 o o 4 2 1693 202 417 1908 1431 923
Malaysia 253 83 281 206 221 203391 102706 286890 210749 176249 799Maldives 1 1 1 1 1 648 1155 1155 1155 1155 1283
Myanmar 8 4 4 5 4 4181 3679 3409 4291 3031 705Nepal o 1 o 1 o 69 1925 11 1353 18 783
Ornan 13 1 1 4 7 9716 1550 989 3494 5263 772Pakistan 56 50 33 34 35 40405 30268 30392 29588 30000 857PhilippMes 82 73 84 100 84 54039 68827 78304 85372 68660 817Qatar 2 1 1 2 3 1751 1297 1069 2058 3295 954Saudi Arabia 79 60 33 84 149 62153 49398 32086 80752 107227 722Singapore 317 129 104 252 319 273314 162325 117760 274723 252927 793Sri Lanka 48 17 17 17 23 32849 18461 18461 14124 16009 696Syria 33 8 13 37 54 21329 7421 9164 26225 29795 557Thafland 64 69 75 54 38 ff194 116955 94438 74776 43322 1140Turkey 25 25 160 155 162 94286 167189 180302 163068 173573 1071
Untd Arab Em 64 64 30 30 111 50543 50543 33880 33880 80323 724Uzbekistan 5 0 1 1 4 4714 377 1329 1329 3129 842
Viet Nam 24 16 22 15 76 19429 19355 19944 15684 44054 582Yemen 6 1 1 10 22 4122 641 738 6678 12289 558
Europe 14203 14063 13322 16762 18588 12374781 15160825 12599837 14032521 16421237 883
Albania o 0 2 1 372 372 2630 1796 1234Andorra 2 2 2 2 2 2013 2013 2013 2013 2013 1133
Austria 339 427 473 408 475 314931 395000 493300 352959 425233 896Bel-Lux 1084 1134 959 1289 1493 973789 1343266 1018410 1092458 1296903 869Belarus 0 1 2 46 36 412 1187 1988 46644 36504 1014BosMa Herzg 0 o o 5 1 125 125 125 6299 757 582Bulgaria 26 9 22 30 30 22144 11163 26450 23714 23714 790Croatia 25 25 26 20 17 27500 31472 26301 17129 15195 894Czech Rep 127 146 170 192 170 102000 162896 174584 170929 159150 936Denmark 314 339 314 369 380 287495 416710 351419 343125 359968 947Estonia 6 13 19 16 29 4051 15380 20731 13141 23674 816Finland 31 27 33 44 40 44475 50871 53053 57465 52768 1319France 2095 2102 809 1590 2848 1870204 2549190 813983 1363746 2567466 901
Germany 3220 3026 3057 3769 3947 2612080 3353332 2866831 2446310 2562000 649Greece 119 53 82 228 239 112566 61792 81862 207589 208466 872Hungary 87 81 73 115 135 82000 76200 68674 104217 127169 942Iceland 9 5 5 9 9 10140 8202 8400 11314 10856 1220Ireland 132 156 140 126 128 129056 194857 242492 147428 142529 1114Italy 1224 1104 1004 1247 1026 1003790 1268909 1003730 1030553 1412332 1377Latvia 10 4 25 18 23 6735 8775 29600 17916 21454 933Lithuania 9 7 13 24 23 4169 5848 13432 22137 20375 886Macedonia 9 10 10 3 10 12761 14187 14187 3509 10179 1060Malta 9 11 11 8 9 22145 27061 27061 19227 20250 2355Moldova Rep 5 5 5 5 4 1794 1618 1618 1618 3258 830Netherlands 759 712 1023 1262 1399 683674 839725 1116030 1123872 1263043 903Norway 156 192 197 177 196 149201 325107 310122 172570 183202 935Pokmd 86 209 353 432 485 62418 223125 265124 363272 419251 865Portugal 121 116 101 178 182 115409 163282 119220 162056 173611 954Romania 15 23 26 29 54 15749 37083 41257 65355 55555 1029Russian Fed 19 22 44 96 84 21325 28560 40449 62006 48303 575SlovakM 25 30 36 94 94 23405 35353 30841 90308 88457 941
SloveMa 32 16 16 36 44 32432 23603 23603 37595 42156 958Spain 920 931 918 1130 1286 795515 1124013 940037 979613 1137875 885
Sweden 131 123 111 130 154 128694 172446 140955 138581 155598 1010SwitzerMnd 397 379 379 451 465 419422 521517 452605 419352 465298 1001
UK 2653 2619 2759 3059 2980 2273240 1660330 1674444 2797965 2796764 938UkraMe 6 2 84 102 70 4765 3453 78000 89000 61209 874Yugoslavia 1 1 20 20 20 1607 1624 25728 25728 25728 1313
OceanM 657 864 650 774 728 615051 816688 832435 731662 602113 827
Australia 581 782 577 625 577 535129 713824 732090 572287 456134 791Fiji Islands 6 6 6 1 2 6079 7493 7493 1989 2187 1094Fr Polynesia 1 o o 1 2 1730 761 515 1784 2458 1253New Zealand 65 73 65 141 142 67667 91447 89506 149162 134247 945NewCaledonia 1 o 1 2 3 1426 476 869 2842 3181 1194Papua N Guin 2 2 1 2 2 2030 2030 1417 3045 3045 1603
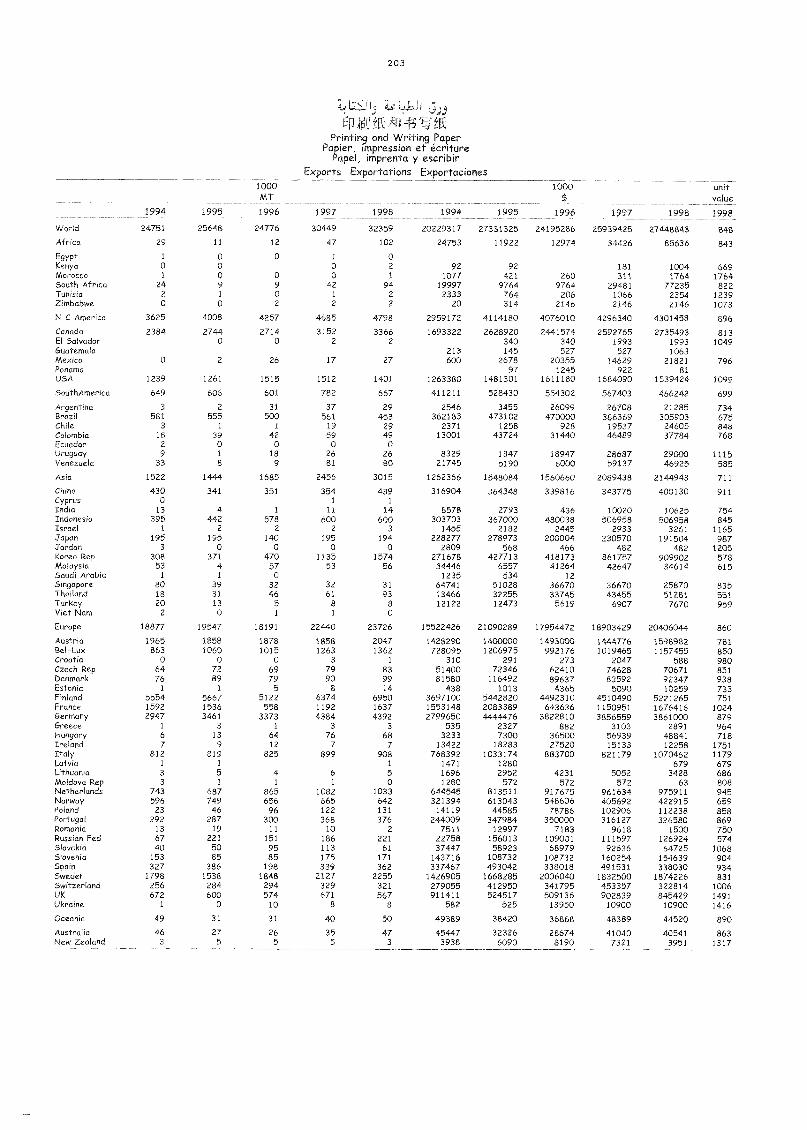
203
,
,0.1 =13'i ffkPrinting and VVriting Paper
Papier, impression et écriturePapel, imprenta y escribir
Exports Exportations Exportaciones1000MT
1000s
unitvalue
1994 1995 1996 1997 1998 1994 1995 1996 1997 1998 1998
World 24751 25648 24776 30449 32359 20229317 27331325 24195286 25939425 274413843 848
Africa 29 11 12 47 102 24753 11922 12974 34426 85636 843
Egypt 1 0 0 1 0Kenya 0 0 0 2 92 92 181 1004 669Morocco 1 0 0 0 1 1077 421 260 311 1764 1764South Africa 24 9 9 42 94 19997 9764 9764 29481 77235 822Tunisia 2 1 0 1 2 2333 764 206 1066 2354 1239Zimbabwe 0 0 2 2 2 20 314 2146 2146 2146 1073
N C America 3625 4008 4257 4685 4798 2959172 4114180 4076010 4296340 4301458 896
Ganada 2384 2744 2714 3152 3366 1693322 2628920 2441574 2592765 2735493 813El Salvador 0 0 2 2 340 340 1993 1993 1049Guatemala 213 145 527 527 1063Mexico 0 2 26 17 27 600 2678 20355 14629 21821 796Panama 97 1245 922 81USA 1239 1261 1515 1512 1401 1263380 1481301 1611180 1684090 1539424 1099
5outFiAmorico 649 606 601 782 667 411211 528430 554302 567403 466242 699
Argentina 3 2 31 37 29 2546 3455 26099 26708 21285 734Brazd 581 555 500 561 453 362183 473102 470000 386369 305903 675Chile 3 1 1 19 29 2371 1258 928 19537 24605 848Colombia 18 39 42 59 49 13001 43724 31440 46489 37784 768Ecuador 2 0 0 0 0Uruguay 9 1 18 26 26 8329 1347 18947 28687 29000 1115Venezuela 33 8 9 81 80 21745 5190 6000 59137 46925 585
Asia 1522 1444 1685 2456 3015 1262366 1548084 1560660 2089438 2144943 711
China 430 341 351 354 439 316904 364348 339816 343775 400130 911Cyprus 0 1 1
India 13 4 1 11 14 8578 2793 436 10020 10625 754Indonesia 395 442 578 600 600 303703 367000 480038 506958 506958 845Israel 1 2 2 2 3 1455 2182 2445 2933 3261 1165Japan 195 195 140 195 194 228277 278973 200004 230570 191504 987Jordan 3 0 0 0 0 2809 568 466 482 482 1205Korea Rep 308 371 470 1135 1574 271678 427713 418173 861757 909902 578Malaysia 53 4 57 53 56 34446 6557 41264 42647 34614 615Saudi Arabia 1 1 0 1235 534 12Singapore 80 39 32 32 31 64741 51028 36670 36670 25870 835Thailand 18 31 46 61 93 13466 32255 33745 43455 51281 551Turkey 20 13 5 8 8 12122 12473 5619 6907 7670 959VMt Nam 2 0 1 1 0
Europe 18877 19547 18191 22440 23726 15522426 21090289 17954472 18903429 20406044 860
Austria 1965 1858 1878 1858 2047 1428290 1400000 1493000 1444776 1598982 781Bel-Lux 863 1060 1015 1263 1362 728095 1206975 992176 1019465 1157455 850Croatia 0 0 0 3 1 310 291 273 2047 588 980Czech Rep 64 72 69 79 83 51400 72346 62410 74628 70671 851Denmark 76 89 79 90 99 81580 116492 89637 83592 92347 938Estonia 1 1 5 8 14 438 1013 4365 5090 10259 733FMMnd 5554 5667 5122 6374 6950 3697100 5442820 4492310 4510490 5221265 751France 1592 1536 558 1192 1637 1553148 2083389 643636 1150951 1676416 1024Germany 2947 3461 3373 4384 4392 2799650 4444476 3822810 3856559 3861000 879Greece 1 3 1 3 3 535 2327 882 3103 2891 964Hungary 6 13 64 76 68 3233 7300 36500 56939 48841 718IreMnd 7 9 12 7 7 13422 18283 27520 15133 12258 1751Italy 812 819 825 899 908 768392 1033174 883700 821179 1070462 1179Latvia 1 1 1 1471 1280 679 679Lithuania 3 5 4 6 5 1696 2952 4231 5052 3428 686Moldova Rep 3 1 1 1 0 1280 572 572 572 63 808NetherMnds 743 687 865 1082 1033 644545 813511 917675 961634 975911 945Norway 596 749 656 665 642 321394 613043 548606 405692 422915 659Poland 23 46 96 122 131 14119 44585 78786 102906 112238 858Portugal 292 287 300 368 376 244009 347984 350000 316127 326580 869RomanM 13 19 11 10 2 7511 12997 7183 9618 1500 750Russian Fed 67 221 151 186 221 22758 156013 109001 111597 126924 574SMvakM 40 50 95 113 61 37447 58923 68979 92636 64725 1068SMvenM 153 85 85 175 171 143716 108732 108732 160254 154639 904SpaM 327 386 198 339 362 337467 493042 338018 491531 338030 934Sweden 1798 1538 1848 2127 2255 1426905 1668285 2006040 1832500 1874226 831SwitzerMnd 256 284 294 329 321 279055 412950 341795 453357 322814 1006UK 672 600 574 671 567 911411 524517 509136 902839 845429 1491UkraMe 1 0 10 8 8 582 525 13950 10900 10900 1416
OceanM 49 31 31 40 50 49389 38420 36868 48389 44520 890
Australia 46 27 26 35 47 45447 32326 28674 41040 40541 863New ZeaMnd 3 5 5 5 3 3938 6090 8190 7321 3951 1317
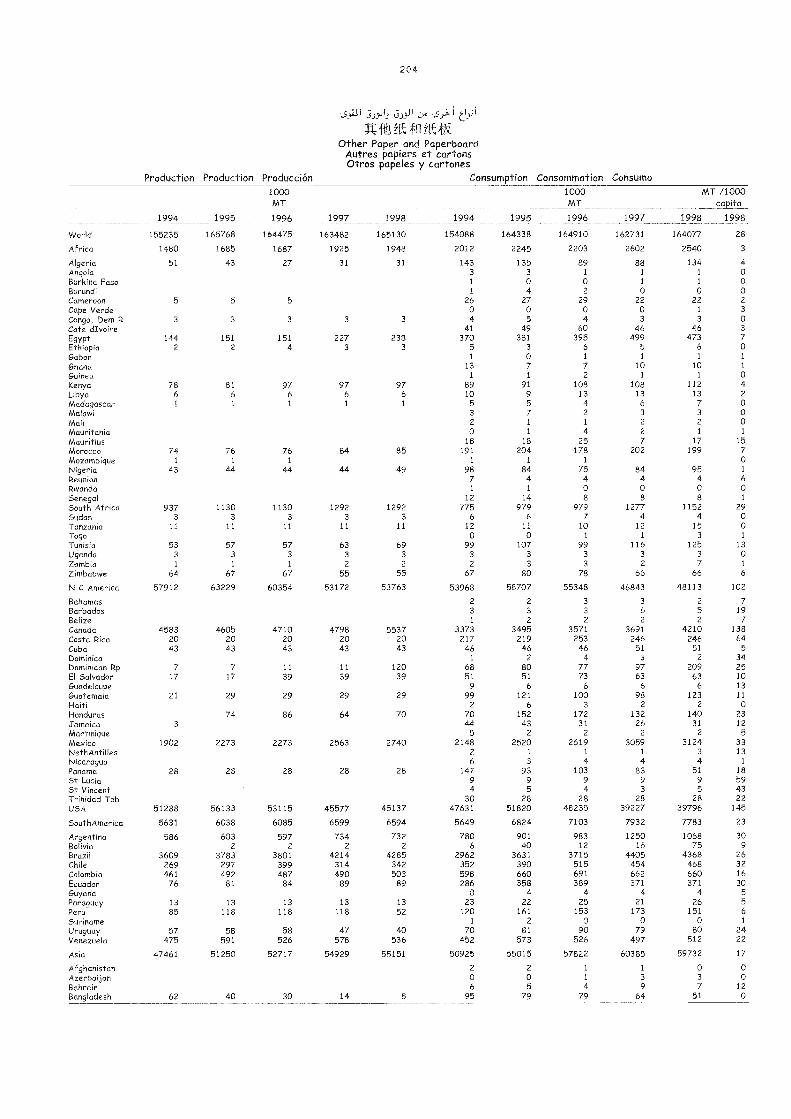
209
3.).9-11 t15,-;
J1, it NkOther Paper and Paperboard
Autres papiers et cartonsOtros papeles y cartones
Production Production Producción Consumption Consommation Consumo
1994 1995
1000MT
1996 1997 1998 1994 1995
1000MT
1996 1997
MT /1000capita
1998 1998
World 155235 165768 164475 163482 165130 154088 164338 164910 162731 164077 28
Africa 1480 1685 1687 1925 1948 2012 2245 2203 2602 2540 3
Algeria 51 43 27 31 31 143 135 89 88 134 4Angola 3 3 1 1 1 0Burkina Faso 1 0 0 1 1 0Burundi 1 4 2 0 0 0Cameroon 5 5 5 26 27 29 22 22 2
Cape Verde 0 0 0 0 1 3
Congo, Dem R 3 3 3 3 3 4 5 4 3 3 0Cote dIvoire 41 49 60 46 46 3
Egypt 144 151 151 227 238 370 381 395 499 473 7
Ethiopia 2 2 4 3 3 5 3 6 5 6 0
Gabon 1 0 1 1 1 1
Ghana 13 7 7 10 10 1
Guinea 1 1 2 1 1 0Kenya 78 81 97 97 97 89 91 108 108 112 4
Libya 6 6 6 6 6 10 9 13 13 13 2
Madagascar 1 1 1 1 1 5 5 4 6 7 0Malawi 3 7 2 3 3 0
Mali 2 1 1 2 2 0Mauritania 0 1 4 2 1 1
Mauritius 18 18 25 7 17 15
Morocco 74 76 76 84 85 191 204 178 202 199 7Mozambique 1 1 1 1 1 1 0Nigeria 43 44 4-4 44 49 98 84 75 84 95 1
Reunion 7 4 4 4 4 6Rwanda 1 1 0 0 0 0Senegal 12 14 8 8 8 1
South Africa 937 1130 1130 1292 1292 775 979 979 1277 1152 29Sudan 3 3 3 3 3 6 6 7 4 4 0Tanzania 11 11 11 11 11 12 11 10 12 15 0Togo 0 0 1 1 3 1
Tunisia 53 57 57 63 69 99 107 99 116 125 13
Uganda 3 3 3 3 3 3 3 3 3 3 0Zambia 1 1 1 2 2 2 3 3 2 7 1
Zimbabwe 64 67 67 55 55 67 80 78 66 66 6
N C America 57912 63229 60354 53172 53763 53968 58707 55348 46843 48113 102
Bahamas 2 2 3 3 2 7Barbados 3 3 3 6 5 19
Belize 1 2 2 2 2 7Canada 4583 4605 4710 4798 5537 3373 3495 3571 3691 4210 138Costa Rica 20 20 20 20 20 217 219 253 246 246 64Cuba 43 43 43 43 43 46 46 46 51 51 5Dominica 1 2 4 3 2 34Dominican Rp 7 7 11 11 120 68 80 77 97 209 25El Salvador 17 17 39 39 39 51 51 73 63 63 10Guadeloupe 9 6 6 6 6 13
Guatemala 21 29 29 29 29 99 121 100 98 123 11
Haiti 2 6 3 2 2 0Honduras 74 86 64 70 70 152 172 132 140 23Jamaica 3 44 43 31 26 31 12
Martinique 5 2 2 2 2 5Mexico 1902 2273 2273 2563 2740 2148 2520 2619 3059 3124 33NethAntilles 2 1 1 1 3 13Nicaragua 6 3 4 4 4 1
Panama 28 28 28 28 28 147 93 103 83 51 18
St Lucia 9 9 9 9 9 59St Vincent 4 5 4 3 5 43Trinidad Tob 30 28 28 28 28 22USA 51288 56133 53115 45577 45137 47631 51820 48235 39227 39796 145
SouthAmerica 5631 6038 6085 6599 6594 5649 6824 7103 7932 7783 23
Argentina 586 603 597 734 732 780 901 983 1250 1068 30Bolivia 2 2 2 2 6 40 12 16 75 9Brazil 3609 3783 3801 4214 4285 2962 3631 3715 4405 4368 26Chile 269 297 399 314 342 352 390 515 454 468 32Colombia 461 492 487 490 503 598 660 691 662 660 16
Ecuador 76 81 84 89 89 286 358 389 371 371 30Guyana 0 4 4 4 4 5Paraguay 13 13 13 13 13 23 22 25 21 26 5Peru 85 118 118 118 52 120 161 153 173 151 6Suriname 1 2 0 0 0 1
Uruguay 57 58 58 47 40 70 81 90 79 80 24Venezuela 475 591 526 578 536 452 573 526 497 512 22
Asia 47461 51250 52717 54929 55151 50925 55015 57822 60385 59732 17
Afghanistan 2 2 1 1 0 0Azerbaijan 0 0 1 3 3 0Bahrain 6 5 4 9 7 12Bangladesh 62 40 30 14 8 95 79 79 64 51 0
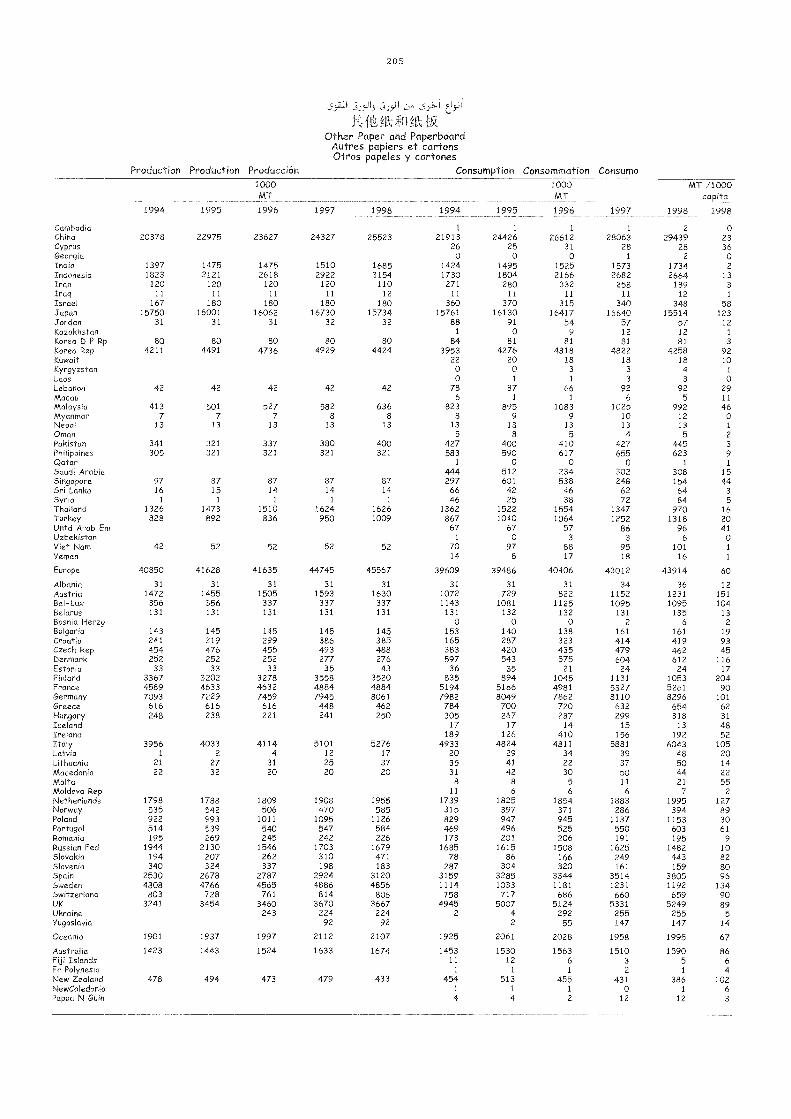
205
-J,J15 )1tik
Other Paper and PaperboardAutres papiers et cartonsOtros papeles y cartones
Production Production Producción Gansu ption Consommation Consumo
1994 1995
1000MT
1996 1997 1998 1994 1995
1000MT
1996 1997
MT /1000capita
1998 1998
Cambodia 1 1 1 1 2 0China 20378 22975 23627 24327 25523 21913 24426 26612 28063 29439 23Cyprus 26 25 31 28 28 36Georgia 0 0 0 1 2 0India 1397 1475 1475 1510 1685 1424 1495 1525 1573 1734 2Indonesia 1823 2121 2618 2922 3154 1730 1804 2166 2682 2664 13Iran 120 120 120 120 110 271 280 332 258 189 3Iraq 11 11 11 11 12 11 11 11 11 12 1
Israel 167 180 180 180 180 360 370 315 340 348 58Japan 15750 16001 16062 16730 15734 15761 16130 16417 16640 15514 123Jordan 31 31 31 32 32 88 91 54 57 57 12Kazakhstan 1 0 9 12 12 1
Korea D P Rp 80 80 80 80 80 84 81 81 81 81 3Korea Rep 4211 4491 4736 4929 4424 3953 4276 4318 4822 4258 92Kuwait 22 20 18 18 18 10Kyrgyzstan 0 0 3 3 4 1
Laos 0 1 1 3 3 0Lebanon 42 42 42 42 42 78 87 66 92 92 29Macau 6 1 1 6 5 11
Malaysia 413 501 527 582 636 823 895 1083 1025 992 46Myanmar 7 7 7 8 8 8 9 9 10 12 0Nepal 13 13 13 13 13 13 13 13 13 13 1
Oman 5 8 5 4 5 2
Pakistan 341 321 337 380 400 427 400 410 427 445 3
Philippines 305 321 321 321 321 583 590 617 655 623 9Qatar 1 0 0 0 1 1
Saudi Arabia 444 512 234 302 308 15Singapore 97 87 87 87 87 297 601 538 248 154 44Sri Lanka 16 15 14 14 14 66 42 46 62 64 3
Syria 1 1 1 1 1 46 25 38 72 84 5
Thailand 1326 1473 1510 1624 1626 1362 1522 1554 1347 970 16Turkey 828 892 836 950 1009 867 1040 1064 1252 1318 20Untd Arab Em 67 67 57 86 96 41Uzbekistan 1 0 3 3 6 0Viet Nam 42 52 52 52 52 70 97 88 95 101 1
Yemen 14 8 17 18 16 1
Europe 40850 41628 41635 44745 45567 39609 39486 40406 43012 43914 60
Albania 31 31 31 31 31 31 31 31 34 36 12Austria 1472 1455 1505 1593 1630 1072 729 822 1152 1231 151Bel-Lux 356 356 337 337 337 1143 1081 1125 1095 1095 104Belarus 131 131 131 131 131 131 132 132 131 135 13Bosnia Herzg 0 0 0 2 6 2Bulgaria 143 145 145 145 145 153 140 138 161 161 19Croatia 241 319 299 386 385 165 287 323 414 419 93Czech Rep 454 476 455 493 488 383 420 435 479 462 45Denmark 252 252 252 277 276 597 543 575 604 612 116Estonia 33 33 33 35 43 36 35 21 24 24 17Finland 3367 3202 3278 3558 3520 835 894 1045 1131 1053 204France 4589 4633 4632 4884 4884 5194 5166 4981 5327 5261 90Germany 7093 7229 7459 7945 8061 7982 8049 7862 8110 8296 101Greece 616 616 616 448 462 784 700 720 632 654 62Hungary 248 238 221 241 250 305 267 287 299 318 31Iceland 17 17 14 15 13 48Ireland 189 126 410 156 192 52Italy 3956 4033 4114 5101 5276 4933 4824 4811 5881 6043 105Latvia 1 2 4 12 17 20 29 34 39 48 20Lithuania 21 27 31 25 37 35 41 22 37 50 14Macedonia 22 32 20 20 20 31 42 30 50 4-4 22Malta 8 8 5 11 21 55Moldova Rep 11 6 6 6 7 2Netherlands 1798 1788 1809 1908 1955 1739 1825 1854 1883 1995 127Norway 535 542 506 470 585 315 397 371 286 394 89Poland 922 993 1011 1095 1126 829 947 945 1137 1153 30Portugal 514 539 540 547 584 469 496 525 550 603 61Romanic, 195 269 245 242 226 173 201 206 191 195 9Russian Fed 1944 2130 1546 1703 1679 1685 1615 1508 1625 1482 10Slovakia 194 207 262 310 471 78 86 166 249 443 82Slovenia 340 324 337 198 183 287 304 320 161 159 80Spain 2530 2678 2787 2924 3120 3159 3285 3344 3514 3805 96Sweden 4808 4766 4565 4886 4856 1114 1033 1181 1231 1192 134Switzerland 803 728 761 814 806 758 717 686 660 659 90UK 3241 3454 3460 3670 3667 4945 5007 5124 5331 5249 89Ukraine 243 224 224 2 4 292 255 255 5Yugoslavia 92 92 2 55 147 147 14
Oceania 1901 1937 1997 2112 2107 1925 2061 2028 1958 1995 67
Australia 1423 1443 1524 1633 1674 1453 1530 1563 1510 1590 86Fiji Islands 11 12 6 3 5 6Fr Polynesia 1 1 1 2 1 4New Zealand 478 494 473 479 433 454 513 455 431 386 102NewCaledonia 1 1 1 0 1 6Papua N Guin 4 4 2 12 12 3
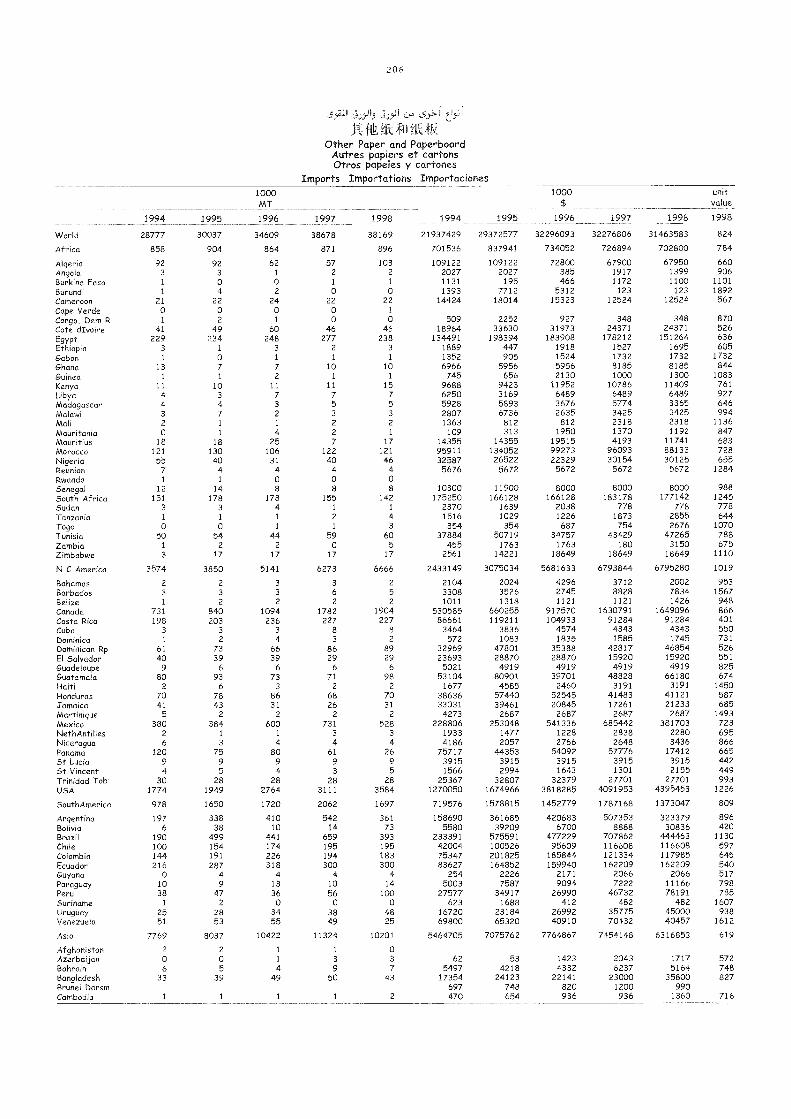
2 0 6
55"-L1 3.1.3'115 Jj.5»
Jt:Other Paper and Paperboard
Autres papiers et cartonsOtros papeles y cartones
Imports Importations Importaciones
1994 1995
1000MT
1996 1997 1998 1994 1995
1000$
1996 1997 1998
unitvalue
1998
World 28777 30037 34609 38678 38169 21937429 29372577 32296093 32276806 31463583 824
Africa 858 904 864 871 896 701536 837941 734052 726894 702800 784
Algeria 92 92 62 57 103 109122 109122 72800 67900 67950 660Angola 3 3 1 2 2 2027 2027 385 1917 1399 906Burkina Faso 1 0 0 1 1 1131 195 466 1172 1100 1101Burundi 1 4 2 0 0 1393 7712 5312 123 123 1892Cameroon 21 22 24 22 22 14424 18014 15323 12524 12524 567Cape Verde 0 0 0 0 1
Congo, Dem R 1 2 1 0 0 509 2252 927 348 348 870Cote dIvoire 41 49 60 46 46 18964 33630 31973 24371 24371 526
Egypt 229 234 248 277 238 134491 198394 183908 178212 151264 636Ethiopia 3 1 3 2 3 1889 447 1918 1527 1695 605Gabon 1 0 1 1 1 1352 905 1524 1732 1732 1732Ghana 13 7 7 10 10 6966 5956 5956 8185 8185 844Guinea 1 1 2 1 1 745 656 2130 1000 1300 1083Kenya 11 10 11 11 15 9688 9423 11952 10786 11409 761Libya 4 3 7 7 7 6250 3169 6489 6489 6489 927Madagascar 4 4 3 5 5 5928 5893 3676 5774 3365 646Malawi 3 7 2 3 3 2807 6736 2635 3425 3425 994Mali 2 1 1 2 2 1363 812 812 2318 2318 1136Mauritania 0 1 4 2 1 109 313 1950 1370 1192 847Mauritius 18 18 25 7 17 14355 14355 19515 4193 11741 683Morocco 121 130 106 122 121 95911 134052 99273 96093 88133 728Nigeria 55 40 31 40 46 32587 26522 22329 30154 30125 655Reunion 7 4 4 4 4 5676 5672 5672 5672 5672 1284Rwanda 1 1 0 0 0Senegal 12 14 8 8 8 10300 11900 8000 8000 8000 988South Africa 151 178 178 155 142 175250 166128 166128 183178 177142 1245Sudan 3 3 4 1 1 2370 1639 2038 778 778 778Tanzania 1 1 1 2 4 1516 1029 1226 1873 2855 644Togo 0 0 1 1 3 354 354 687 754 2676 1070Tunisia 50 54 44 59 60 37884 50719 34757 43429 47265 788Zambia 1 2 2 0 5 455 1763 1763 180 3150 675Zimbabwe 3 17 17 17 17 2561 14221 18649 18649 18649 1110
N C America 3574 3850 5141 6273 6666 2433149 3075034 5681633 6793844 6795280 1019
Bahamas 2 2 3 3 2 2104 2024 4296 3712 2002 953Barbados 3 3 3 6 5 3308 3526 2745 8828 7834 1567Belize 1 2 2 2 2 1011 1318 1121 1121 1426 948Canada 731 840 1094 1782 1904 530585 660255 917570 1630791 1649096 866Costa Rica 198 203 236 227 227 86661 119211 104933 91284 91284 401
Cuba 3 3 3 8 8 3464 3836 4574 4343 4343 550Dominica 1 2 4 3 2 572 1083 1835 1585 1745 731Dominican Rp 61 73 66 86 89 32969 47801 35388 42817 46854 526El Salvador 40 39 39 29 29 23693 28870 28870 15920 15920 551Guadeloupe 9 6 6 6 6 5021 4919 4919 4919 4919 825Guatemala 80 93 73 71 98 53104 80901 39701 48828 66180 674Haiti 2 6 3 2 2 1677 4585 2460 3191 3191 1450Honduras 70 78 86 68 70 38636 57440 52545 41483 41121 587Jamaica 41 43 31 26 31 33031 39461 20845 17261 21233 685Martinique 5 2 2 2 2 4273 2687 2687 2687 2687 1493Mexico 380 384 600 731 528 228806 253048 541336 685442 381703 723NethAntilles 2 1 1 3 3 1933 1477 1228 2838 2280 695Nicaragua 6 3 4 4 4 4186 2057 2766 2648 3436 866Panama 120 75 80 61 26 75717 44353 54092 57776 17412 665St Lucia 9 9 9 9 9 3915 3915 3915 3915 3915 442St Vincent 4 5 4 3 5 1566 2994 1643 1301 2155 449Trinidad Tob 30 28 28 28 28 25367 32807 32379 27701 27701 993USA 1774 1949 2764 3111 3584 1270050 1674966 3818285 4091953 4395453 1226
SouthAmerica 978 1650 1720 2062 1697 719576 1578815 1452779 1787168 1373047 809
Argentina 197 338 410 542 361 158690 361685 420683 507353 323379 896Bolivia 6 38 10 14 73 5580 39209 6700 8888 30836 420Brazil 190 499 441 659 393 233391 575591 477229 707862 444463 1130Chile 100 154 174 195 195 42004 100526 95609 116608 116608 597Colombia 144 191 226 194 183 75347 201825 185844 121334 117985 645Ecuador 216 287 318 300 300 83627 164852 159940 162209 162209 540Guyana 0 4 4 4 4 254 2226 2171 2066 2066 517Paraguay 10 9 13 10 14 5003 7587 9094 7222 11166 798Peru 38 47 36 56 100 27577 34917 26990 46732 78191 785Suriname 1 2 0 0 0 623 1688 412 482 482 1607Uruguay 25 28 34 38 48 16720 23184 26992 35775 45000 938Venezuela 51 53 55 49 25 69800 65320 40910 70432 40457 1612
Asia 7769 8037 10422 11324 10201 5464705 7075762 7764867 7454148 6316853 619
Afghanistan 2 2 1 1 0Azerbaijan 0 0 1 3 3 62 53 1423 2043 1717 572Bahrain 6 5 4 9 7 5497 4218 4332 6237 5164 748Bangladesh 33 39 49 50 43 17354 24123 22141 23000 35800 827Brunei Darsm 697 748 820 1200 990Cambodia 1 1 1 1 2 470 654 936 936 1360 716
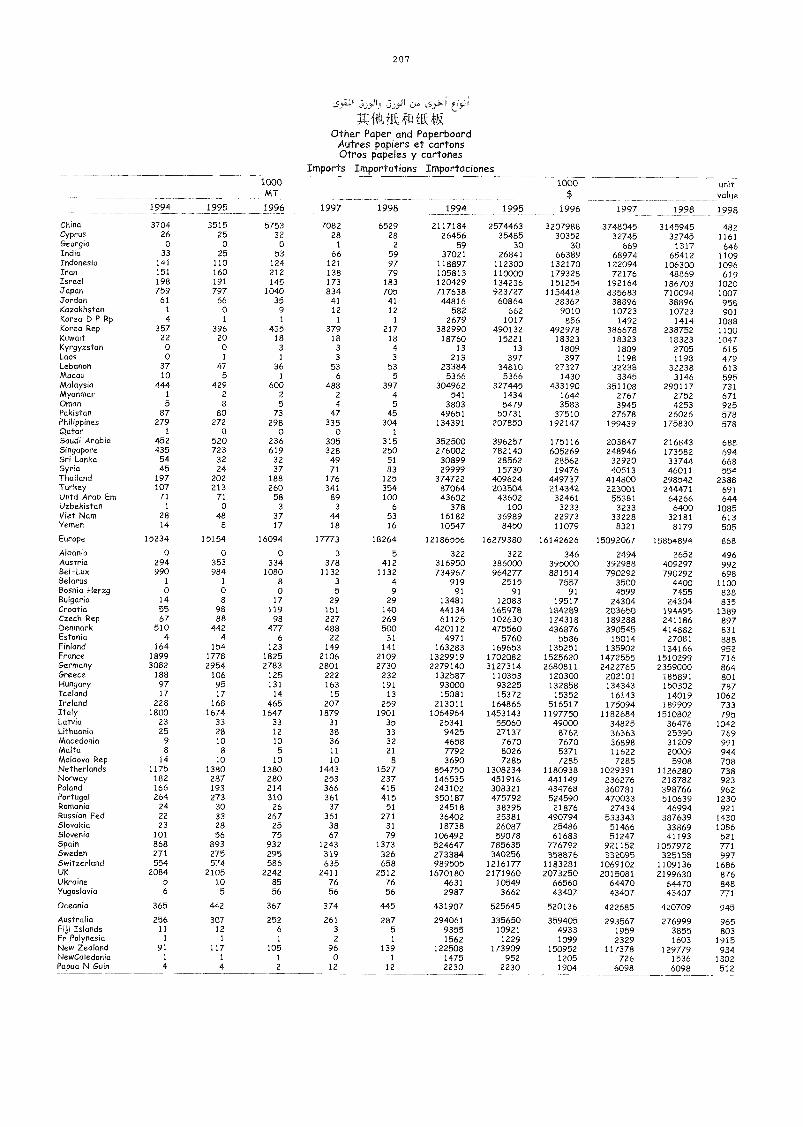
207
-5,1L1 .:9)5") ) 3)5P
n ikOther Paper and Paperboard
Autres papiers et cartonsOtros papeles y cartones
Imports Importations Importaciones
1994 1995
1000MT
1996 1997 1998 1994 1995
1000$
1996 1997 1998
unitvalue
1998
China 3704 3515 5753 7082 6529 2117184 2574463 3207988 3748045 3145945 482Cyprus 26 25 32 28 28 26456 35485 30352 32745 32745 1161Georgia 0 0 0 1 2 59 30 30 669 1317 646India 33 25 53 66 59 37021 26841 66389 68974 65412 1109Indonesia 141 110 124 121 97 118897 112300 132170 122094 106300 1096Iran 151 160 212 138 79 105813 110000 179328 72176 48869 619Israel 198 191 145 173 183 120429 134236 151254 192164 186703 1020Japan 759 797 1040 834 705 717638 923727 1154418 835683 710094 1007Jordan 61 66 35 41 41 44816 60864 28362 38896 38896 958Kazakhstan 1 o 9 12 12 582 662 9010 10723 10723 901Korea D P Rp 4 1 1 1 1 2679 1017 856 1492 1414 1088Korea Rep 357 396 435 379 217 382990 490132 492978 386678 238752 1100Kuwait 22 20 18 18 18 18760 15221 18323 18323 18323 1047Kyrgyzstan 0 0 3 3 4 13 13 1809 1809 2705 615Laos 0 I 1 3 3 213 397 397 1198 1198 479Lebanon 37 47 36 53 53 23384 34810 27327 32238 32238 613Macau 10 5 1 6 5 5366 5366 1430 3345 3146 595Malaysia 444 429 600 488 397 304962 327445 433190 351108 290117 731Myanmar 1 2 2 2 4 541 1434 1644 2767 2752 671Oman 5 8 5 4 5 3803 5479 3583 3945 4253 925Pakistan 87 80 73 47 45 49651 50731 37510 27678 26026 578Philippines 279 272 298 335 304 134391 207850 192147 199439 175830 578Qatar 1 0 0 0 1
Saudi Arabia 452 520 236 305 315 352500 396257 175116 203847 216843 688Singapore 435 723 619 328 250 276002 782140 605269 248946 173582 694Sri Lanka 54 32 32 49 51 30899 28562 28562 32920 33744 668Syria 45 24 37 71 83 29999 15730 19476 40513 46011 554Thailand 197 202 188 176 125 374722 409624 449737 414800 298542 2388Turkey 107 213 260 341 354 87064 203504 214342 223001 244471 691Untd Arab Em 71 71 58 89 100 43602 43602 32461 55381 64266 644Uzbekistan 1 0 3 3 6 378 100 3233 3233 6400 1085Viet Nam 28 48 37 44 53 16182 36989 22973 33228 32181 613Yemen 14 8 17 18 16 10547 8450 11079 8321 8179 505Europe 15234 15154 16094 1/1/3 18264 12186556 16279380 16142626 15092067 15854894 868Albania 0 0 0 3 5 322 322 346 2494 2652 496Austria 294 353 334 378 412 316950 386000 395000 392988 409297 992Bel-Lux 990 984 1080 1132 1132 734967 964277 881514 790292 790292 698Belarus 1 1 8 3 4 919 2515 7557 3500 4400 1100Bosnia Herzg 0 0 0 5 9 91 91 91 4599 7455 838Bulgaria 14 8 17 29 29 13481 12083 19517 24304 24304 835Croatia 55 98 119 151 140 44134 165978 184289 203650 194495 1389Czech Rep 67 88 98 227 269 61125 102630 124318 189288 241186 897Denmark 510 442 477 488 500 420112 475560 436876 390545 414882 831Estonia 4 4 6 22 31 4971 5760 5586 15014 27081 888Finland 164 154 123 149 141 163283 169653 135251 135902 134166 952France 1899 1778 1825 2106 2109 1329919 1702082 1525620 1472555 1510299 716Germany 3082 2954 2783 2801 2730 2279140 3127314 2680811 2422765 2359000 864Greece 188 106 125 222 232 132587 110353 120300 202101 185891 801Hungary 97 95 131 163 191 93000 93225 132858 134343 150302 787Iceland 17 17 14 15 13 15081 15372 15352 16143 14019 1062Ireland 228 168 465 207 259 213011 164866 516517 175094 189909 733Italy 1800 1674 1647 1879 1901 1064964 1453143 1197750 1182684 1510802 795Latvia 23 33 33 31 35 25341 55060 49000 34825 36476 1042Lithuania 25 28 12 38 33 9425 27137 8762 36363 25390 769Macedonia 9 10 10 36 32 4658 7670 7670 36898 31209 991Malta 8 8 5 11 21 7792 8026 5371 11622 20009 944Moldova Rep 14 10 10 10 8 3690 7285 7285 7285 5908 708Netherlands 1175 1380 1380 1443 1527 854750 1308234 1180938 1029391 1126280 738Norway 182 287 280 253 237 146535 451916 441149 236276 218782 923Poland 166 193 214 366 415 243102 308321 434768 360781 398766 962Portugal 264 273 310 361 415 350187 475792 524590 470033 510639 1230Romania 24 30 26 37 51 24518 38395 21876 27434 46994 921Russian Fed 22 33 267 361 271 36402 25381 490794 533343 387639 1430Slovakia 23 28 25 38 31 18738 26087 25486 51466 33869 1086Slovenia 101 56 75 67 79 106492 59078 61683 51247 41193 521Spain 868 893 932 1243 1373 524647 785635 776792 921152 1057972 771Sweden 271 275 295 319 326 273384 340256 358876 332095 325158 997Switzerland 554 574 586 635 658 989505 1216177 1183281 1069102 1109136 1686UK 2084 2105 2242 2411 2512 1670180 2171960 2073250 2015081 2199630 876Ukraine 5 10 85 76 76 4631 10549 66560 64470 64470 848Yugoslavia 6 5 56 56 56 2987 3662 43407 43407 43407 771
Oceania 365 442 367 374 445 431907 525645 520136 422685 420709 945Australia 256 307 252 261 287 294061 335650 359405 293567 276999 965Fiji Islands 11 12 6 3 5 9355 10921 4933 1959 3855 803Fr Polynesia 1 1 1 2 1 1562 1229 1099 2329 1603 1915New Zealand 91 117 105 96 139 122508 173909 150952 117378 129779 934NewCaledonia 1 1 1 0 1 1475 952 1205 726 1536 1302Papua N Guin 4 4 2 12 12 2230 2230 1904 6098 6098 512
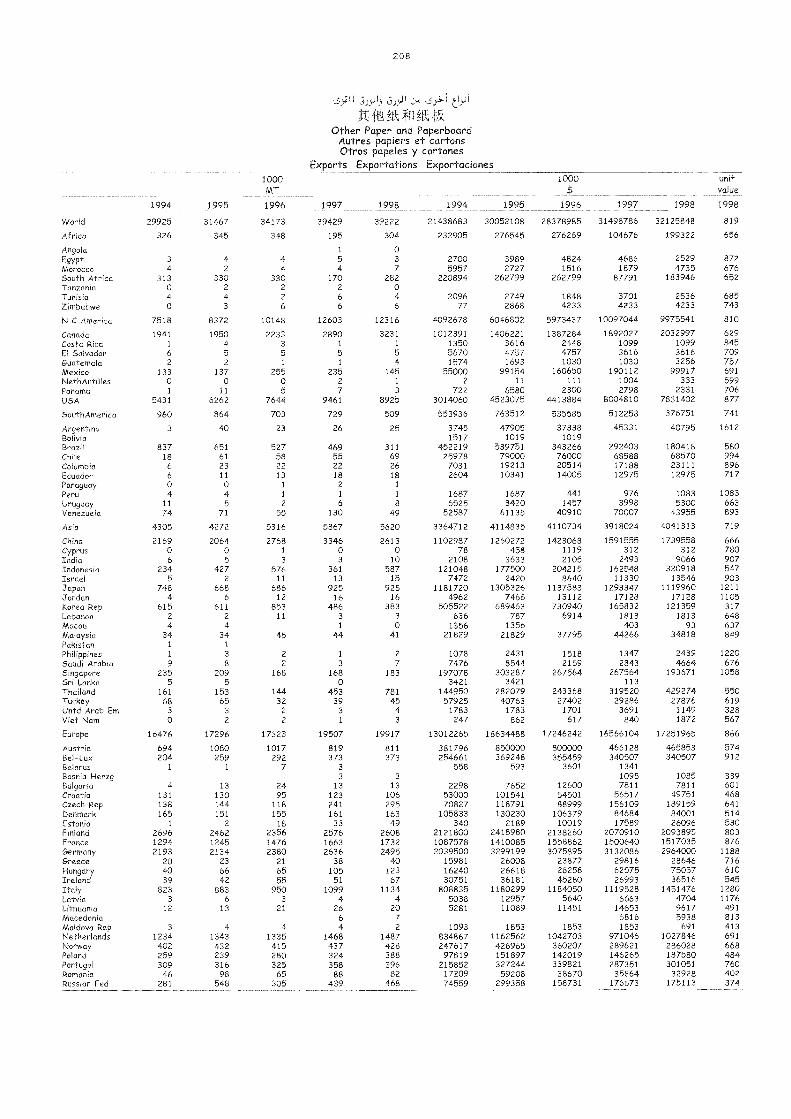
208
Li-
f1iftfnC)ther Paper and Paperboard
Autres papiers et cartonsOtros papeles y cartones
Exports Exportations Exportaciones
1994 1995
1000MT
1996 1997 1998 1994 1995
1000$
1996 1997 1998
unitvalue
1998
VVor Id 29925 31467 34173 39429 39222 21438683 30052108 28378985 31498786 32125848 819
A f r Ica 326 345 348 195 304 232905 276545 276269 104676 199322 656
Angola 1 0Egypt 3 4 4 5 3 2700 3989 4824 4686 2529 872Morocco 4 2 4 4 7 5957 2727 1516 1879 4735 676South At r lea 313 330 330 170 282 220894 262799 262799 87791 183946 652Tanzania 0 2 2 2 0Tunisia 4 4 2 6 4 2096 2749 1848 3701 2536 685Zimbabwe 0 3 6 6 6 77 2868 4233 4233 4233 743
N C Amer ica 7518 8372 10148 12603 12316 4092678 6046802 5973437 10097044 9975541 810
Cenada 1941 1950 2233 2890 3231 1012391 1406221 1387284 1892027 2032997 629Costa Rica 1 4 3 1 1 1350 3616 2448 1099 1099 845El Salvador 6 5 5 5 5 5670 4757 4757 3616 3616 709Guatemala 2 2 1 1 4 1574 1693 1030 1030 3256 757Mexico 133 137 255 235 145 55000 99154 160650 190112 99917 691Net h AntMes 0 0 0 2 1 2 11 111 1004 333 599Panama 1 11 5 7 3 722 6580 2300 2798 2331 706USA 5431 6262 7644 9461 8925 3014060 4523075 4413884 8004810 7831402 877
South Amer ica 960 864 703 729 509 553936 763512 535585 512258 376751 741
A rgent Ma 3 40 23 26 25 3745 47905 37338 45331 40795 1612BoW a 1517 1019 1019Bra z il 837 651 527 469 311 452219 539751 343266 292403 180418 580Chde 18 61 58 55 69 25978 79000 76000 68588 68570 994Colombia 6 23 22 22 26 7031 19213 20514 17188 23111 896Ecuador 6 11 13 18 18 2604 10341 14005 12975 12975 717Paraguay 0 0 1 2 1
Peru 4 4 1 1 1 1687 1687 441 976 1083 1083Uruguay 11 5 2 6 8 6525 3420 1457 3998 5300 663Venezuela 74 71 55 130 49 52587 61135 40910 70007 43955 893
Asia 4305 4272 5316 5867 5620 3364712 4114835 4110734 3918024 4041313 719
China 2169 2064 2768 3346 2613 1102987 1260272 1423068 1591555 1739558 666Cyprus 0 0 1 0 0 78 458 1119 312 312 780India 6 5 3 3 10 2108 3633 2105 2493 9066 907Indonesia 234 427 576 361 587 121048 177500 204215 162548 320918 547Israel 5 2 11 13 15 7472 2420 8640 11330 13546 903Japan 748 668 686 925 925 1181720 1305326 1137583 1293347 1119960 1211Jordon 4 6 12 16 16 4962 7466 13112 17128 17128 1105Korea Rep 615 611 853 486 383 505522 689463 730940 165832 121359 317Lebanon 2 2 11 3 3 636 787 6914 1813 1813 648Macau 4 4 1 0 1356 1356 403 93 637Malaysia 34 34 45 44 41 21829 21829 37795 44266 34818 849Pakistan 1 1
Philipp Mes 1 3 2 1 2 1078 2431 1518 1347 2439 1220Saudi Arabia 9 8 2 3 7 7476 8544 2159 2843 4664 676Singapore 235 209 168 168 183 197078 303287 267564 267564 193671 1058Sri Lanka 5 5 0 3421 3421 113T ha dand 161 153 144 453 781 144950 282079 243368 319520 429274 550Turkey 68 65 32 39 45 57925 40763 27402 29286 27876 619Unid Arab Ere 3 3 2 3 4 1783 1783 1701 3691 1149 328V iet Nam 0 2 2 1 3 247 862 617 840 1872 567
Europe 16476 17296 17323 19507 19917 13012265 18634488 17246242 16566104 17251965 866
Austria 694 1080 1017 819 811 381796 850000 800000 466128 465853 574Bel-Lux 204 259 292 373 373 254661 369248 355459 340507 340507 912Be larus 1 1 7 3 558 593 3601 1341Bosnia Herzg 3 3 1095 1085 339Bulgaria 4 13 24 13 13 2298 7652 12600 7811 7811 601Croatia 131 130 95 123 106 53000 101541 54501 56517 49751 468Czech Rep 138 144 118 241 295 70827 118791 88999 156109 189159 641Denmark 165 151 155 161 163 105833 130230 106379 84684 84001 514Estonia 1 2 18 33 49 340 2189 10019 17589 26096 530Finland 2696 2462 2356 2576 2608 2121800 2418980 2138260 2070910 2093895 803France 1294 1245 1476 1663 1732 1087578 1410085 1558862 1500640 1517035 876Germany 2193 2134 2380 2636 2495 2039500 3299199 3075895 3132086 2964000 1188Greece 20 23 21 38 40 15981 26008 23877 29816 28646 716Hungary 40 66 65 105 123 16240 26618 26258 62575 75057 610Ireland 39 42 55 51 67 30751 36181 45280 26993 36516 545Italy 823 883 950 1099 1134 808835 1180299 1184050 1119528 1451476 1280Latvia 3 6 3 4 4 5038 12957 5640 6663 4704 1176Lithuania 12 13 21 26 20 5281 11089 11451 14653 9617 491Macedonia 6 7 6816 5938 813Moldova Rep 3 4 4 4 2 1093 1853 1853 1853 691 413Netherlands 1234 1343 1335 1468 1487 834867 1162562 1042703 971046 1027846 691Norway 402 432 415 437 428 247617 426965 360207 289621 286028 668Poland 259 239 280 324 388 97819 151897 142019 146265 187580 484Portugal 309 316 325 358 396 215852 327244 339821 287351 301051 760Romania 46 98 65 88 82 17209 59208 38670 35864 32928 402Russian Fed 281 548 305 439 468 74559 299358 158731 176673 175113 374
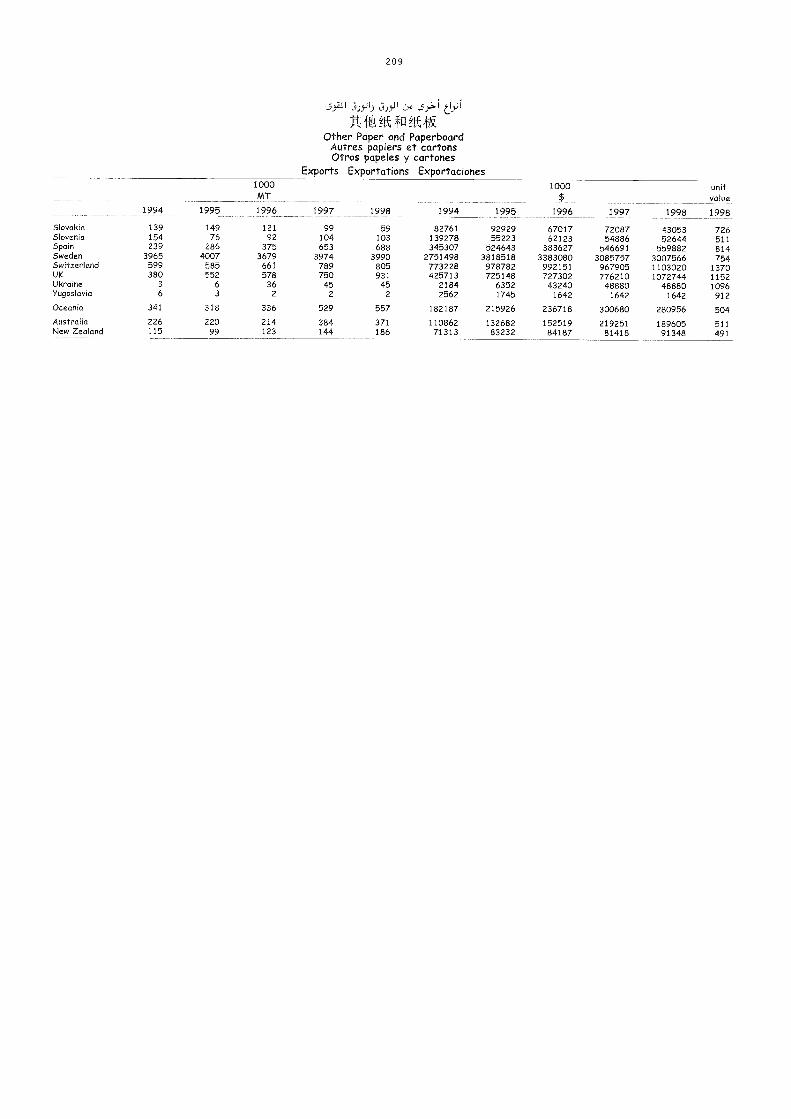
20 9
3))» 5)"' I LI
ftfftOther Paper and Paperboard
Autres papiers el- cartonsOtros papeles y cartones
Exports Exportations Exportaciones
1994 1995
1000MT
1996 1997 1998 1994 1995
1000$
1996 1997 1998
unitvalue
1998
Slovakia 139 149 121 99 59 82761 92929 67017 72087 43053 726Slovenia 154 76 92 104 103 139278 55223 62123 54886 52644 511Spain 239 286 375 653 688 345307 524643 383627 546691 559882 814Sweden 3965 4007 3679 3974 3990 2751498 3818518 3383080 3085757 3007566 754Switzerland 599 585 661 789 805 773228 978782 992151 967905 1103020 1370UK 380 552 578 750 931 425713 725148 727302 776210 1072744 1152Ukraine 3 6 36 45 45 2184 6352 43240 48880 48880 1096Yugoslavia 6 3 2 2 2 2562 1745 1642 1642 1642 912Oceania 341 318 336 529 557 182187 215926 236718 300680 280956 504Australia 226 220 214 384 371 110862 132682 152519 219251 189605 511New Zealand 115 99 123 144 186 71313 83232 84187 81418 91348 491
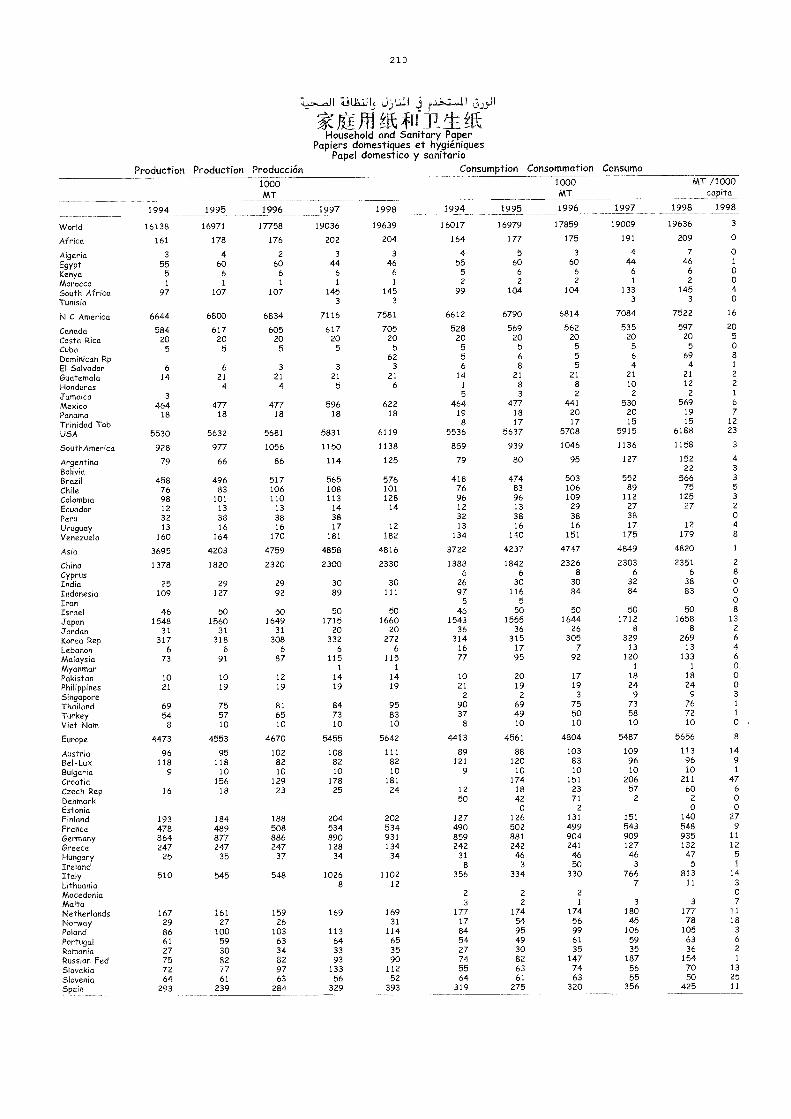
210
-4311,1115 J1111
tf _4k 1 .ffkHousehold and Sanitary Paper
Papiers domestiques et hygiéniquesPapel domestico y sanitario
Production Production Producción Consumption Consommation Consumo
1994 1995
1000MT
1996 1997 1998 1994 1995
1000MT
1996 1997
MT /1000capita
1998 1998
World 16138 16971 17758 19036 19639 16017 16979 17859 19009 19636 3
Africa 161 178 176 202 204 164 177 175 191 209 0
Algeria 3 4 2 3 3 4 5 3 4 7 0
Egypt 55 60 60 44 46 55 60 60 44 46 1
Kenya 5 6 6 6 6 5 6 6 6 6 0
Morocco 1 1 1 1 1 2 2 2 1 2 0
South Africa 97 107 107 145 145 99 104 104 133 145 4
Tunisia 3 3 3 3 0
N C America 6644 6800 6834 7116 7581 6612 6790 6814 7084 7522 16
Canada 584 617 605 617 705 528 569 562 535 597 20
Costa Rica 20 20 20 20 20 20 20 20 20 20 5
Cuba 5 5 5 5 5 5 5 5 5 5 0
Dominican Rp 62 5 6 5 6 69 8
El Salvador 6 6 3 3 3 6 8 5 4 4 1
Guatemala 14 21 21 21 21 14 21 21 21 21 2
Honduras 4 4 5 6 1 8 8 10 12 2
Jamaica 3 5 3 2 2 2 1
Mexico 464 477 477 596 622 464 477 441 530 569 6
Panama 18 18 18 18 18 19 18 20 20 19 7
Trinidad Tob 8 17 17 15 15 12
USA 5530 5632 5681 5831 6119 5536 5637 5708 5915 6188 23
SouthAmerica 928 977 1056 1150 1138 859 939 1046 1136 1158 3
Argentina 79 66 86 114 125 79 80 95 127 152 4
Bolivia 22 3
Brazil 458 496 517 565 576 418 474 503 552 566 3
Chile 76 83 106 108 101 76 83 106 89 75 5
Colombia 98 101 110 113 128 96 96 109 112 125 3
Ecuador 12 13 13 14 14 12 13 29 27 27 2
Peru 32 38 38 38 32 38 38 38 0
Uruguay 13 16 16 17 12 13 16 16 17 12 4
Venezuela 160 164 170 181 182 134 140 151 175 179 8
Asia 3695 4203 4759 4858 4816 3722 4237 4747 4849 4820 1
China 1378 1820 2320 2300 2330 1388 1842 2326 2303 2351 2
Cyprus 6 6 8 6 6 8
India 25 29 29 30 30 26 30 30 32 38 0
Indonesia 109 127 92 89 111 97 116 84 84 83 0
Iran 5 5 0
Israel 46 50 50 50 50 46 50 50 50 50 8
Japan 1548 1560 1649 1715 1660 1543 1555 1644 1712 1658 13
Jordan 31 31 31 20 20 36 36 26 8 8 2
Korea Rep 317 318 308 332 272 314 315 305 329 269 6
Lebanon 6 6 6 6 6 16 17 7 13 13 4
Malaysia 73 91 87 115 115 77 95 92 120 133 6
Myanmar 1 1 1 1 0
Pakistan 10 10 12 14 14 10 20 17 18 18 0
Philippines 21 19 19 19 19 21 19 19 24 24 0
Singapore 2 2 3 9 9 3
Thailand 69 75 81 84 95 90 69 75 73 76 1
Turkey 54 57 65 73 83 37 49 50 58 72 1
Viet Nam 8 10 10 10 10 8 10 10 10 10 0
Europe 4473 4553 4670 5455 5642 4413 4561 4804 5487 5656 8
Austria 96 95 102 108 111 89 88 103 109 113 14
Bel-Lux 118 118 82 82 82 121 120 83 96 96 9
Bulgaria 9 10 10 10 10 9 10 10 10 10 1
Croatia 156 129 178 181 174 151 206 211 47
Czech Rep 16 18 23 25 24 12 18 23 57 60 6
Denmark 50 42 71 2 2 0
Estonia 0 2 0 0
Finland 193 184 188 204 202 127 126 131 151 140 27
France 478 489 508 534 534 490 502 499 543 548 9
Germany 864 877 886 890 931 859 881 904 909 935 11
Greece 247 247 247 128 134 242 242 241 127 132 12
Hungary 25 35 37 34 34 31 46 46 46 47 5
Ireland 8 3 50 3 5 1
Italy 510 545 548 1026 1102 356 334 330 766 813 14
Lithuania 8 12 7 11 3
Macedonia 2 2 2 0
Malta 3 2 1 3 3 7
Netherlands 167 161 159 169 169 177 174 174 180 177 11
Norway 29 27 26 31 17 54 56 45 78 18
Poland 86 100 103 113 114 84 95 99 106 105 3
Portugal 61 59 63 64 65 54 49 61 59 63 6
Romania 27 30 34 33 35 27 30 35 35 36 2
Russian Fed 75 82 82 93 90 74 82 147 187 154 1
Slovakia 72 77 97 133 112 55 63 74 56 70 13
Slovenia 64 61 63 56 52 64 61 63 55 50 25
Spain 293 239 284 329 393 319 275 320 356 425 11
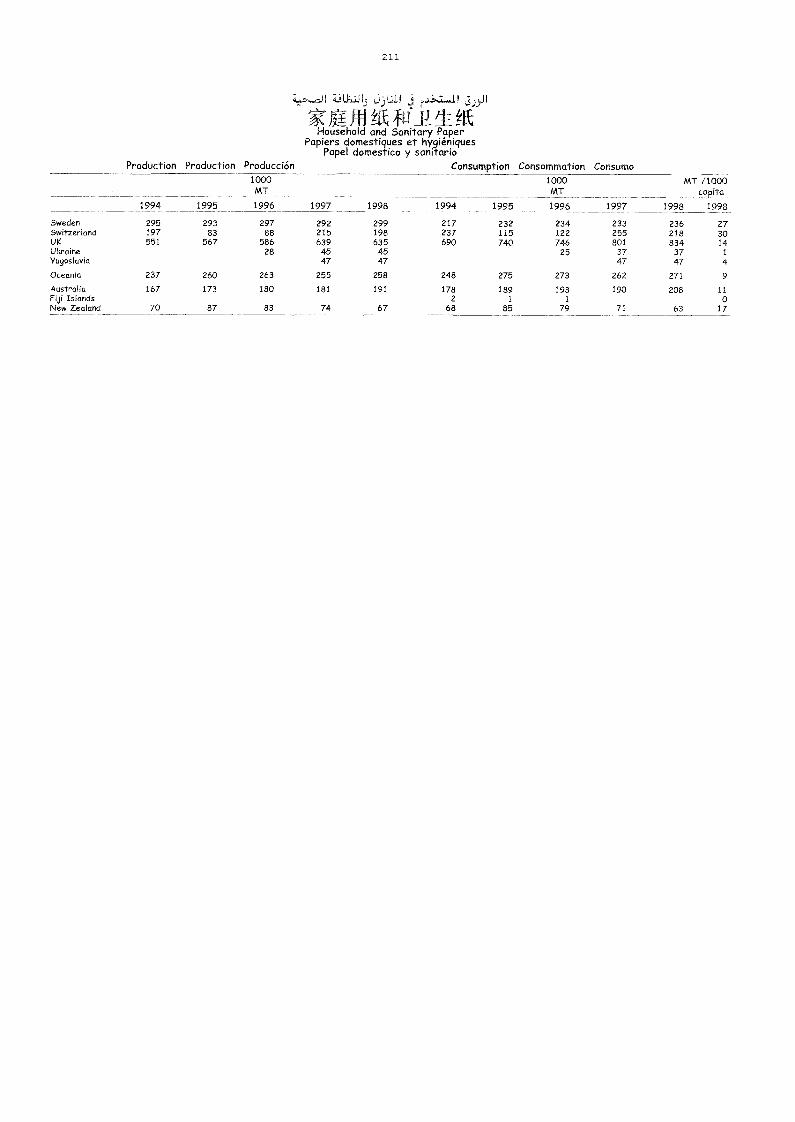
211
rt_ilL:J15 J.j1.111 j 11 jj.9.11
TflHousehold and Sanitary Paper
Papiers domestiques et hygiéniquesPapel domestico y sanitario
Production Production Producción Consumption Consommation Consumo
1994 1995
1000MT
1996 1997 1998 1994 1995
1000MT
1996 1997
MT /1000capa
1998 1998
Sweden 295 293 297 292 299 217 232 234 233 236 27Switzerland 197 83 88 215 198 237 115 122 255 218 30UK 551 567 586 639 635 690 740 746 801 834 14Ukraine 28 45 45 25 37 37 1
Yugoslavia 47 47 47 47 4
Oceania 237 260 263 255 258 248 275 273 262 271 9
Australia 167 173 180 181 191 178 189 193 190 208 11Fiji Islands 2 1 1 oNew Zealand 70 87 83 74 67 68 85 79 71 63 17
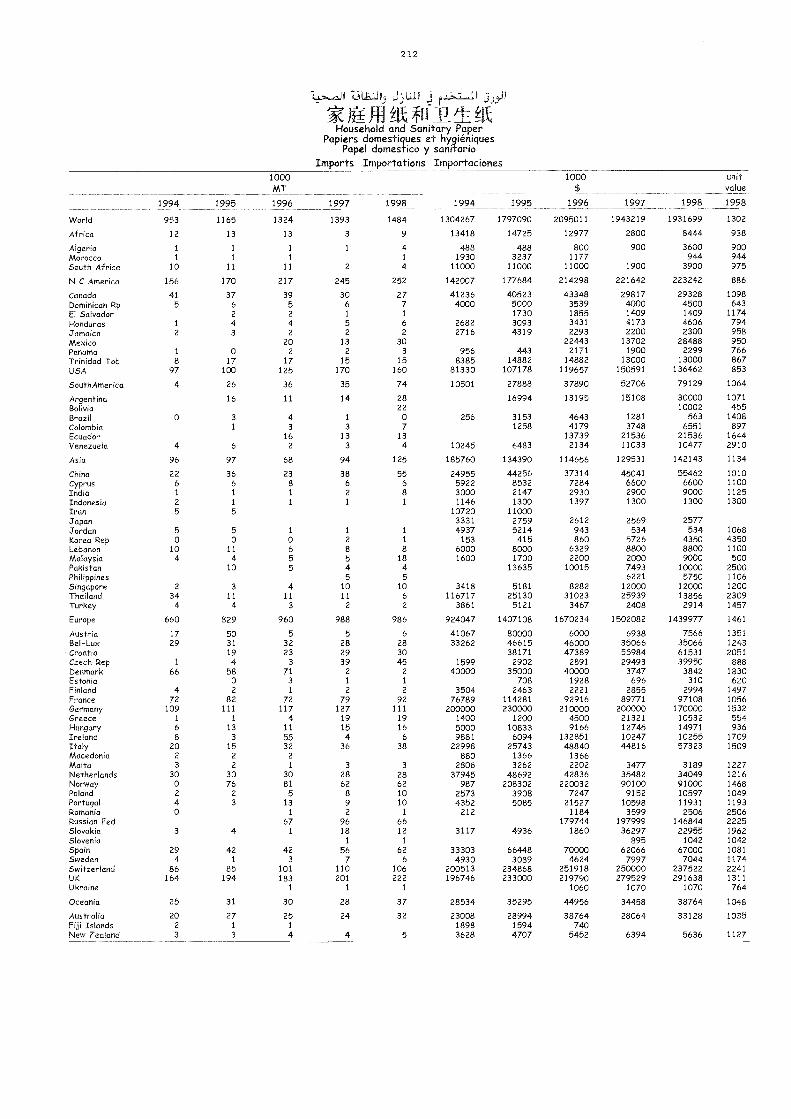
212
JluLlii5 Ju.Il 12-'7 LI 5j5-II
JI1_fft II 17_ I ffkHousehold and Sanitary Paper
Papiers domestiques et hygiéniquesPapel domestico y sanitario
Imports Importations Importaciones
1994 1995
1000MT
1996 1997 1998 1994 1995
1000$
1996 1997 1998
unitvalue
1998
World 953 1165 1324 1393 1484 1304267 1797090 2095011 1943219 1931699 1302
Africa 12 13 13 3 9 13418 14725 12977 2800 8444 938
Algeria 1 1 1 1 4 488 488 800 900 3600 900Morocco 1 1 1 1 1930 3237 1177 944 944South Africa 10 11 11 2 4 11000 11000 11000 1900 3900 975
N C America 156 170 217 245 252 142007 177684 214298 221642 223242 886
Canada 41 37 39 30 27 41236 40523 43348 29817 29328 1098Dominican Rp 5 6 5 6 7 4000 5000 3539 4000 4500 643El Salvador 2 2 1 1 1730 1855 1409 1409 1174Honduras 1 4 4 5 6 2682 3093 3431 4173 4606 794Jamaica 2 3 2 2 2 2716 4319 2293 2200 2300 958Mexico 20 13 30 22443 13702 28488 950Panama 1 o 2 2 3 956 443 2171 1900 2299 766Trinidad Tob 8 17 17 15 15 8385 14882 14882 13000 13000 867USA 97 100 125 170 160 81330 107178 119657 150591 136462 853
SouthAmerica 4 26 36 35 74 10501 27888 37890 52706 79129 1064
Argentina 16 11 14 28 16994 13195 15108 30000 1071Bolivia 22 10002 455Brazil 0 3 4 1 0 256 3153 4643 1281 563 1408Colombia 1 3 3 7 1258 4179 3748 6551 897Ecuador 16 13 13 13739 21536 21536 1644Venezuela 4 6 2 3 4 10245 6483 2134 11033 10477 2910
Asia 96 97 68 94 125 185760 134390 114656 129531 142143 1134
China 22 36 23 38 55 24955 44256 37314 45041 55462 1010Cyprus 6 6 8 6 6 5922 8532 7284 6600 6600 1100India 1 1 1 2 8 3000 2147 2930 2900 9000 1125Indonesia 2 1 1 1 1 1146 1300 1397 1300 1300 1300Iran 5 5 10720 11000Japan 3331 2759 2612 2569 2577Jordan 5 5 1 I 1 4937 5214 943 534 534 1068Korea Rep 0 0 0 2 1 153 415 860 5726 4350 4350Lebanon 10 11 6 8 8 6000 8000 6329 8800 8800 1100Malaysia 4 4 5 5 18 1600 1700 2200 2000 9000 500Pakistan 10 5 4 4 13635 10015 7493 10000 2500Philippines 5 5 6221 5750 1106Singapore 2 3 4 10 10 3418 5181 8282 12000 12000 1200Thailand 34 11 11 11 6 116717 25130 31023 25939 13856 2309Turkey 4 4 3 2 2 3861 5121 3467 2408 2914 1457
Europe 660 829 960 988 986 924047 1407108 1670234 1502082 1439977 1461
Austria 17 50 5 5 6 41067 80000 6000 6938 7566 1351Bel -Lux 29 31 32 28 28 33262 46615 46000 35066 35066 1243Croatia 19 23 29 30 38171 47389 55984 61531 2051Czech Rep I 4 3 39 45 1599 2902 2891 29493 39950 888Denmark 66 58 71 2 2 40000 35000 40000 3747 3842 1830Estonia 0 3 1 1 708 1928 696 310 620Finland 4 2 1 2 2 3504 2463 2221 2855 2994 1497France 72 82 72 79 92 76789 114281 92916 89771 97108 1056Germany 109 111 117 127 111 200000 230000 210000 200000 170000 1532Greece 1 1 4 19 19 1400 1200 4500 21321 10532 554Hungary 6 13 11 15 16 5000 10833 9166 12745 14971 936Ireland 8 3 55 4 6 9881 6094 132851 10247 10255 1709Italy 20 15 32 36 38 22998 25743 48840 44816 57323 1509Macedonia 2 2 2 880 1366 1366Malta 3 2 1 3 3 2806 3262 2202 3477 3189 1227Netherlands 30 30 30 28 28 37945 48692 42836 35482 34049 1216Norway 0 76 81 62 62 987 208302 220032 90100 91000 1468Poland 2 2 5 8 10 2573 3908 7247 9152 10597 1049Portugal 4 3 13 9 10 4352 5085 21527 10598 11931 1193Romania 0 1 2 1 212 1184 3599 2506 2506Russian Fed 67 96 66 179744 197999 146844 2225Slovakia 3 4 1 18 12 3117 4936 1860 36297 22955 1962Slovenia 1 1 895 1042 1042Spain 29 42 42 56 62 33303 66448 70000 62066 67000 1081Sweden 4 1 3 7 6 4930 3089 4624 7997 7044 1174Switzerland 86 85 101 110 106 200513 234868 251918 250000 237522 2241UK 164 194 183 201 222 196746 233000 219790 279529 291638 1311Ukraine 1 1 1 1060 1070 1070 764
Oceania 25 31 30 28 37 28534 35295 44956 34458 38764 1048
Australia 20 27 25 24 32 23008 28994 38764 28064 33128 1035Fiji Islands 2 1 1 1898 1594 740New Zealand 3 3 4 4 5 3628 4707 5452 6394 5636 1127
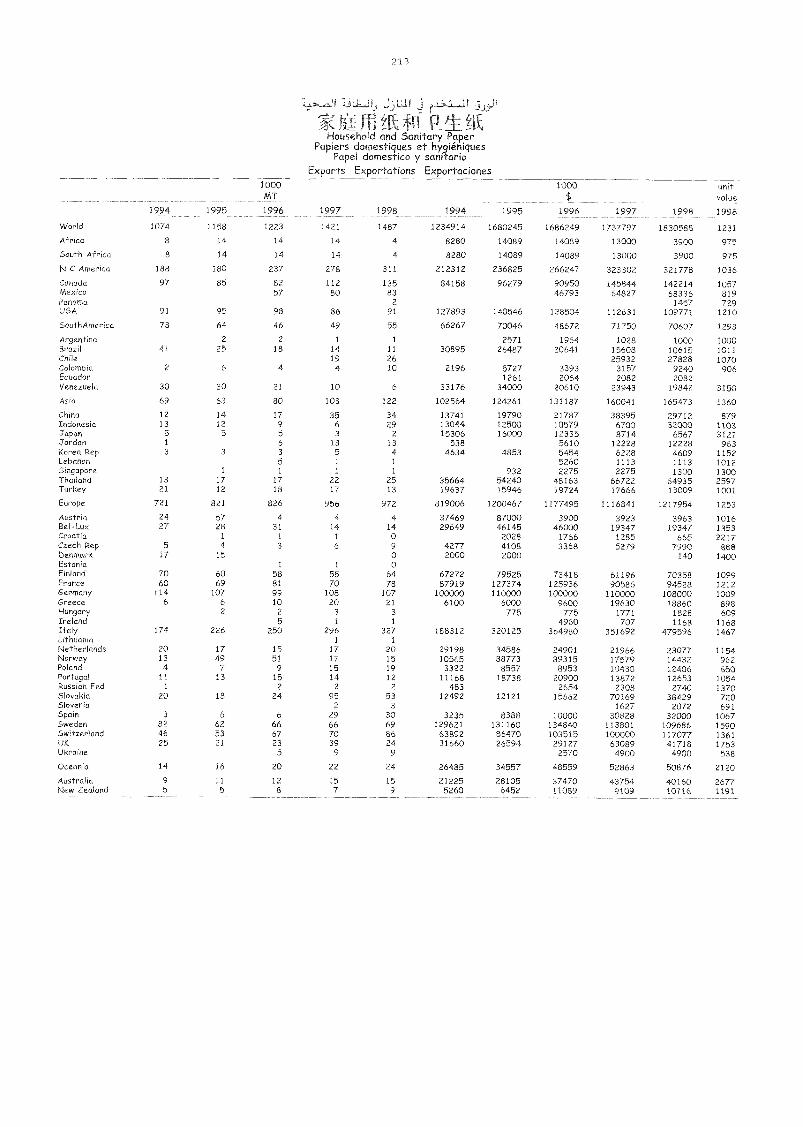
213
ijI JWJI iP-
ffkHousehold and Sanitary Paper
Papiers domestiques et hygiéniquesPapel domestico y sanitario
Exports Exportations Exportaciones
1994 1995
1000MT
1996 1997 1998 1994 1995
1000$
1996 1997 1998
unit
World 1074 1158 1223 1421 1487 1234914 1680245 1686249 1737797 1830588 1231
Africa 8 14 14 14 4 8280 14089 14089 13000 3900 9, iSouth Africa 8 14 14 14 4 8280 14089 14089 13000 3900 975
N C America 188 180 237 278 311 212312 236825 266247 323302 321778 1036
Canada 97 85 82 112 135 84158 96279 90950 145844 142214 1057Mexico 57 80 83 46793 64827 68336 819Panama 2 1457 729USA 91 95 98 86 91 127893 140546 128504 112631 109771 1210
SouthAmerica 73 64 46 49 55 66267 70046 48672 71750 70607 1293
Argentina 2 2 1 1 2571 1964 1028 1000 1000Brazil 41 25 18 14 11 30895 26487 20641 15608 10615 1011Chile 19 26 25932 27828 1070Colombia 2 6 4 4 10 2196 5727 3393 3157 9240 906Ecuador 1261 2064 2082 2082Venezuela 30 30 21 10 6 33176 34000 20610 23943 19842 3150
Asia 69 63 80 103 122 102564 124261 131187 160041 165473 1360
China 12 14 17 35 34 13741 19790 21787 38395 29712 879Indonesia 13 12 9 6 29 13044 12500 10579 6700 32000 1103Japan 5 5 5 3 2 15306 16000 12335 8714 6567 3127Jordan 1 6 13 13 538 5610 12228 12228 963Korea Rep 3 3 3 5 4 4634 4853 5454 6228 4609 1152Lebanon 5 1 1 5260 1113 1113 1012Singapore 1 1 1 1 932 2275 2275 1300 1300Thailand 13 17 17 22 25 35664 54240 48163 66722 64935 2597Turkey 21 12 18 17 13 19637 15946 19724 17666 13009 1001
Europe 721 821 826 956 972 819006 1200467 1177495 1116841 1217954 1253
Austria 24 57 4 4 4 37469 87000 3900 3923 3963 1016Bel-Lux 27 28 31 14 14 29649 46145 46000 19347 19347 1353Croatia 1 1 1 0 2028 1766 1285 665 2217Czech Rep 5 4 3 6 9 4277 4108 3368 5279 7990 888Denmark 17 15 0 2000 2000 140 1400Estonia 1 1 0Finland 70 60 58 55 64 67272 79525 73418 61196 70358 1099Frunce 60 69 81 70 78 87919 127374 125936 90586 94528 1212Germany 114 107 99 108 107 100000 110000 100000 110000 108000 1009Greece 6 6 10 20 21 6100 6000 9600 19630 18860 898Hungary 2 2 3 3 775 775 1771 1828 609Ireland 5 1 1 4960 707 1168 1168Italy 174 226 250 296 327 188312 320125 364980 351692 479596 1467Lithuania 1 1
Netherlands 20 17 15 17 20 29198 34586 24901 21966 23077 1154Norway 13 49 51 17 15 10565 88773 89315 17579 14432 962Poland 4 7 9 15 19 3322 8557 8953 10430 12406 650Portugal 11 13 15 14 12 11168 18738 20900 13872 12653 1054Russian Fed 1 2 2 2 483 2654 2308 2740 1370Slovakia 20 18 24 95 53 12492 12121 15662 70169 38429 720Slovenia 2 3 1627 2072 691Spain 3 6 6 29 30 3235 8388 10000 30828 32000 1067Sweden 82 62 66 66 69 129621 131160 134840 113801 109686 1590Switzerland 46 53 67 70 86 63892 86470 103515 100000 117077 1361UK 25 21 23 39 24 31660 26594 29127 63089 41718 1753Ukraine 5 9 9 2570 4900 4900 538Oceania 14 16 20 22 24 26485 34557 48559 52863 50876 2120Australia 9 11 12 15 15 21225 28105 37470 43754 40160 2677New Zealand 5 5 8 7 9 5260 6452 11089 9109 30716 1391
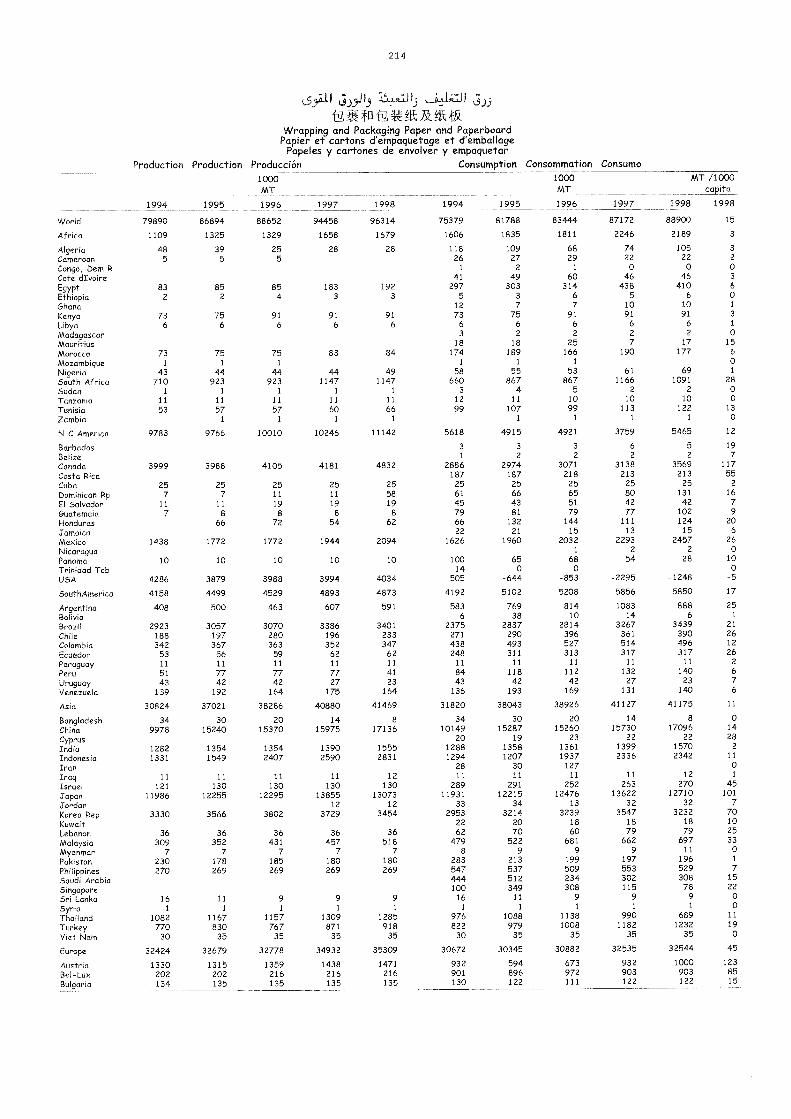
2 1 9
I 13 13 I C9).9
'erfrrN,IMAlaktRWrapping and Packaging Paper and PaperboardPapier et cartons d'empaquetage et d'emballage
Papeles y cartones de envolver y empaquetarProduction Production Producción Consumption Consommation Consumo
1994 1995
1000MT
1996 1997 1998 1994 1995
1000MT
1996 1997
MT /1000cápita
1998 1998
World 79890 86894 88652 94458 96314 75379 81788 83444 87172 88900 15
Africa 1109 1325 1329 1658 1679 1606 1835 1811 2246 2189 3
Algeria 48 39 25 28 28 118 109 68 74 105 3
Cameroon 5 5 5 26 27 29 22 22 2
Congo, Dem R 1 2 1 0 0 0Cote dIvoire 41 49 60 46 46 3
Egypt 83 85 85 183 192 297 303 314 438 410 6
Ethiopia 2 2 4 3 3 5 3 6 5 6 0Ghana 12 7 7 10 10 1
Kenya 73 75 91 91 91 73 75 91 91 91 3
Libya 6 6 6 6 6 6 6 6 6 6 1
Madagascar 3 2 2 2 2 0
Mauritius 18 18 25 7 17 15
Morocco 73 75 75 83 84 174 189 166 190 177 6
Mozambique 1 1 1 1 1 1 o
Nigeria 43 44 44 44 49 58 55 53 61 69 1
South Africa 710 923 923 1147 1147 660 867 867 1166 1091 28
Sudan 1 1 1 1 1 3 4 5 2 2 0
Tanzania 11 11 11 11 11 12 11 10 10 10 0
Tunisia 53 57 57 60 66 99 107 99 113 122 13
Zambia 1 1 1 1 1 1 1 1 0
N C America 9783 9766 10010 10246 11142 5618 4915 4921 3759 5465 12
Barbados 3 3 3 6 5 19
Belize 1 2 2 2 2 7
Canada 3999 3988 4105 4181 4832 2886 2974 3071 3138 3569 117
Costa Rica 187 187 218 213 213 55
Cuba 25 25 25 25 25 25 25 25 25 25 2
Dominican Rp 7 7 11 11 58 61 66 65 80 131 16
El Salvador 11 11 19 19 19 45 43 51 42 42 7
Guatemala 7 8 8 8 8 79 81 79 77 102 9
Honduras 66 72 54 62 66 132 144 111 124 20
Jamaica 22 21 15 13 15 6
Mexico 1438 1772 1772 1944 2094 1626 1960 2032 2293 2457 26
Nicaragua 1 2 2 0
Panama 10 10 10 10 10 100 65 68 54 28 10Trinidad Tob 14 0 0 0
USA 4286 3879 3988 3994 4034 505 -644 -853 -2295 -1248 -5
SouthAmerica 4158 4499 4529 4893 4873 4192 5102 5208 5856 5850 17
Argentina 408 500 463 607 591 583 769 814 1083 888 25Bolivia 6 38 10 14 6 1
Brazil 2923 3057 3070 3386 3401 2375 2837 2814 3267 3439 21
Chile 188 197 280 196 233 271 290 396 361 390 26Colombia 342 367 363 352 347 438 493 527 514 496 12
Ecuador 53 56 59 62 62 248 311 313 317 317 26
Paraguay 11 11 11 11 11 11 11 11 11 11 2
Peru 51 77 77 77 41 84 118 112 132 140 6
Uruguay 43 42 42 27 23 43 42 42 27 23 7
Venezuela 139 192 164 175 164 136 193 169 131 140 6
Asia 30824 37021 38286 40880 41469 31820 38043 38926 41127 41175 11
Bangladesh 34 30 20 14 8 34 30 20 14 8 0
China 9978 15240 15370 15975 17136 10149 15287 15260 15730 17096 14
Cyprus 20 19 23 22 22 28
India 1282 1354 1354 1390 1555 1288 1358 1361 1399 1570 2
Indonesia 1331 1549 2407 2590 2831 1294 1207 1937 2336 2342 11
Iran 28 30 127 0
Iraq 11 11 11 11 12 11 11 11 11 12 1
Israel 121 130 130 130 130 289 291 252 263 270 45
Japan 11986 12255 12295 13855 13073 11931 12215 12476 13622 12710 101
Jordan 12 12 33 34 13 32 32 7
Korea Rep 3330 3566 3802 3729 3454 2953 3214 3239 3547 3232 70
Kuwait 22 20 18 18 18 10
Lebanon 36 36 36 36 36 62 70 60 79 79 25
Malaysia 309 352 431 457 518 479 522 681 662 697 33
Myanmar 7 7 7 7 7 8 9 9 9 11 0
Pakistan 230 178 185 180 180 283 213 199 197 196 1
Philippines 270 269 269 269 269 547 537 509 553 529 7
Saudi Arabia 444 512 234 302 308 15
Singapore 100 349 308 115 78 22
Sri Lanka 16 11 9 9 9 16 11 9 9 9 0
Syria 1 1 1 1 1 1 1 1 1 1 0
Thailand 1082 1167 1157 1309 1285 976 1088 1138 990 689 11
Turkey 770 830 767 871 918 822 979 1008 1182 1232 19
Viet Nam 30 35 35 35 35 30 35 35 35 35 0
Europe 32424 32679 32778 34932 35309 30672 30345 30882 32535 32544 45
Austria 1330 1315 1359 1438 1471 932 594 673 932 1000 123
Bel -Lux 202 202 216 216 216 901 896 972 903 903 85
Bulgaria 134 135 135 135 135 130 122 111 122 122 15_ ,_
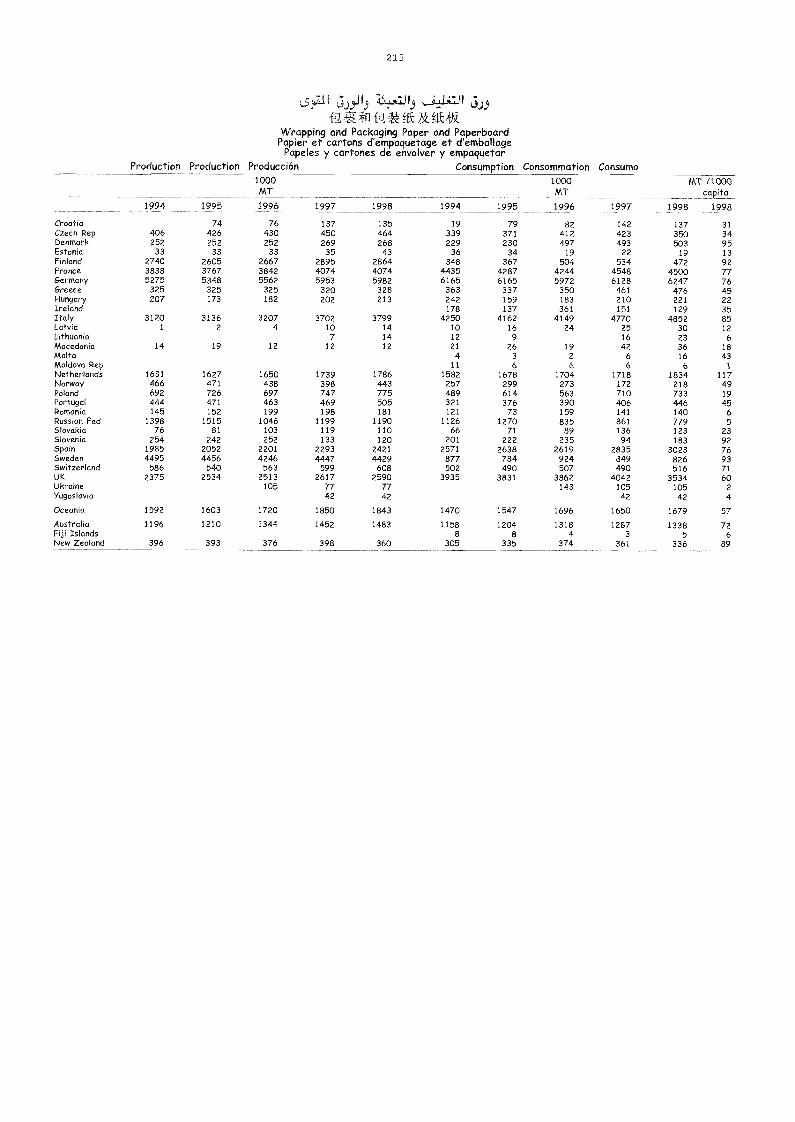
215
L5.9.2-1 5)5-1 1.9 "4'1113 `---°--Wai I 5).9nNX-ffWVW
Wrapping and Packaging Paper and PaperboardPapier et cartons d'empaquetage et d'emballage
Papeles y cartones de envolver y empaquetarProduction Production Producción Consumption Consommation Consumo
1994 1995
1000MT
1996 1997 1998 1994 1995
1000MT
1996 1997
MT /1000capita
1998 1998
Croatia 74 76 137 135 19 79 82 142 137 31Czech Rep 406 426 430 450 464 339 371 412 423 350 34Denmark 252 252 252 269 268 229 230 497 493 503 95Estonia 33 33 33 35 43 36 34 19 22 19 13Finland 2740 2605 2667 2895 2864 348 367 504 534 472 92France 3838 3767 3842 4074 4074 4435 4287 4244 4548 4500 77Germany 5275 5348 5562 5953 5982 6165 6165 5972 6128 6247 76Greece 325 325 325 320 328 363 337 350 461 476 45Hungary 207 173 182 202 213 242 159 183 210 221 22Ireland 178 137 361 151 129 35Italy 3120 3136 3207 3702 3799 4250 4162 4149 4770 4852 85Latvia 1 2 4 10 14 10 16 24 25 30 12Lithuania 7 14 12 9 16 23 6Macedonia 14 19 12 12 12 21 26 19 42 36 18Malta 4 3 2 6 16 43Moldova Rep 11 6 6 6 6 1
Netherlands 1631 1627 1650 1739 1786 1582 1678 1704 1718 1834 117Norway 466 471 438 398 443 257 299 273 172 218 49Poland 692 726 697 747 775 489 614 563 710 733 19Portugal 444 471 463 469 505 321 376 390 406 446 45Romania 145 152 199 198 181 121 73 159 141 140 6Russian Fed 1398 1515 1046 1199 1190 1126 1270 835 861 779 5Slovakia 76 81 103 119 110 66 71 89 136 123 23Slovenia 254 242 252 133 120 201 222 235 94 183 92Spain 1985 2052 2201 2293 2421 2571 2638 2619 2835 3023 76Sweden 4495 4456 4246 4447 4429 877 784 924 849 826 93Switzerland 586 540 563 599 608 502 490 507 490 516 71UK 2375 2534 2513 2617 2590 3935 3831 3862 4042 3534 60Ukraine 105 77 77 143 105 105 2Yugoslavia 42 42 42 42 4
Oceania 1592 1603 1720 1850 1843 1470 1547 1696 1650 1679 57
Australia 1196 1210 1344 1452 1483 1158 1204 1318 1287 1338 72Fiji Islands 8 8 4 3 5 6New Zealand 396 393 376 398 360 305 335 374 361 336 89
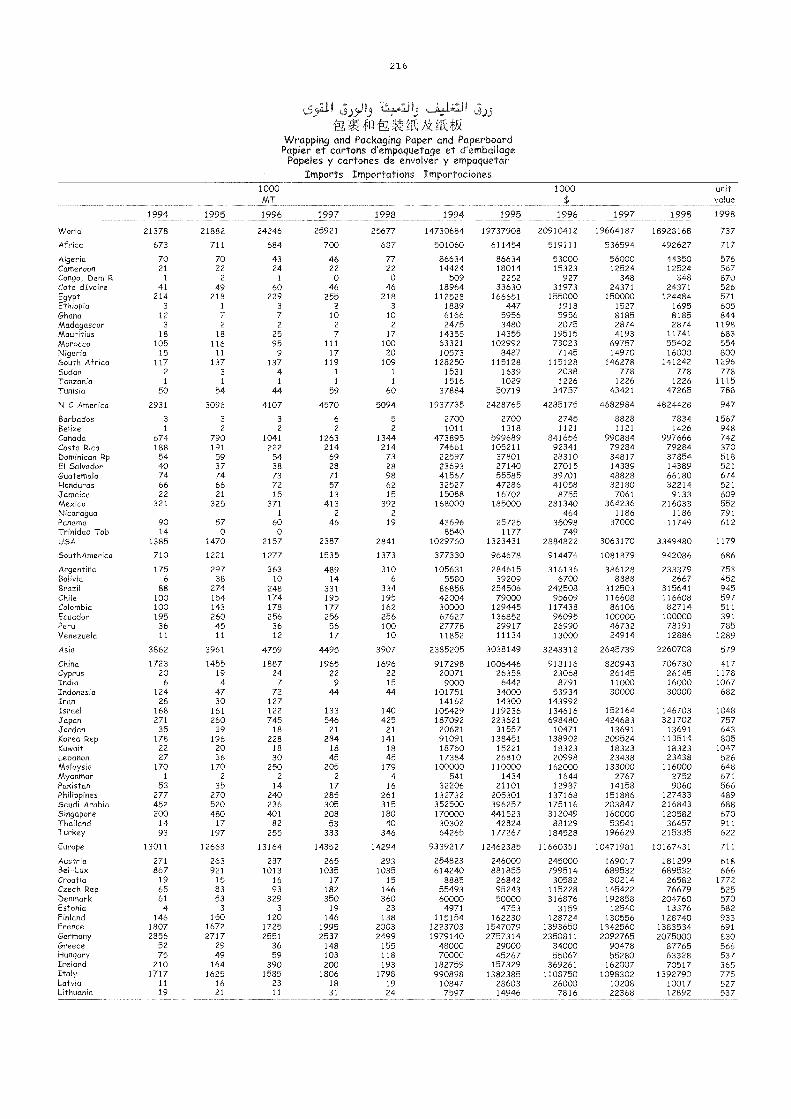
21 6
k-5,11 Z9.1.9.M5 ïLJlN .qk X it&
Wrapping and Packaging Paper and PaperboardPapier et cartons d'empaquetage et d'emballagePapeles y cartones de envolver y empaquetar
Imports Importations Importaciones1000MT
1000 unitvalue
1994 1995 1996 1997 1998 1994 1995 1996 1997 1998 1998
World 21378 21882 24246 25921 25677 14730684 19737908 20910412 19664187 18928168 737
Africa 673 711 684 700 687 501060 611454 519111 536594 492627 717
Algeria 70 70 43 46 77 86634 86634 53000 56000 44350 576Cameroon 21 22 24 22 22 14424 18014 15323 12524 12524 567Congo, Dem R 1 2 1 0 0 509 2252 927 348 348 870Cote dIvoire 41 49 60 46 46 18964 33630 31973 24371 24371 526Egypt 214 218 229 255 218 112528 166651 155000 150000 124484 571Ethiopia 3 1 3 2 3 1889 447 1918 1527 1695 605Ghana 12 7 7 10 10 6166 5956 5956 8185 8185 844Madagascar 3 2 2 2 2 2475 3480 2075 2874 2874 1198Mauritius 18 18 25 7 17 14355 14355 19515 4193 11741 683Morocco 105 116 95 111 100 63321 102992 73023 69757 55402 554Nigeria 15 11 9 17 20 10573 8487 7145 14970 16000 800South Africa 117 137 137 119 109 128250 115128 115128 146278 141242 1296Sudan 2 3 4 1 1 1531 1639 2038 778 778 778Tanzania 1 1 1 1 1 1516 1029 1226 1226 1226 1115Tunisia 50 54 44 59 60 37884 50719 34757 43421 47265 788
N C America 2931 3096 4107 4570 5094 1937735 2428765 4285175 4682984 4824428 947
Barbados 3 3 3 6 5 2700 2700 2745 8828 7834 1567Belize 1 2 2 2 2 1011 1318 1121 1121 1426 948Canada 674 790 1041 1263 1344 473895 599689 841656 990884 997666 742Costa Rica 188 191 222 214 214 74661 105211 92341 79284 79284 370Dominican Rp 54 59 54 69 73 22597 37801 28310 34817 37854 518El Salvador 40 37 38 28 28 23693 27140 27015 14389 14389 521Guatemala 74 74 73 71 98 41567 55585 39701 48828 66180 674Honduras 66 66 72 57 62 32527 47286 41058 32180 32214 521Jamaica 22 21 15 13 15 15088 16702 8755 7061 9133 609Mexico 321 325 371 413 392 168000 185000 281340 364236 216033 552Nicaragua 1 2 2 464 1186 1186 791Panama 90 57 60 46 19 43696 25725 35098 37000 11749 612Trinidad Tab 14 0 0 8540 1177 749USA 1385 1470 2157 2387 2841 1029760 1323431 2884822 3063170 3349480 1179
SouthAmerica 710 1221 1277 1535 1373 377330 964678 914476 1081879 942086 686
Argentina 175 297 363 489 310 105631 284615 316136 386128 233379 753Bol ivia 6 38 10 14 6 5580 39209 6700 8888 2667 452Brazil 88 274 248 331 334 86858 254506 242508 312503 315641 945Chile 100 154 174 195 195 42004 79000 95609 116608 116608 597Colombia 100 143 178 177 162 30000 129445 117438 86106 82714 511Ecuador 195 260 256 256 256 67627 136852 96095 100000 100000 391Peru 36 45 36 56 100 27778 29917 26990 46732 78191 785Venezuela 11 11 12 17 10 11852 11134 13000 24914 12886 1289
Asia 3862 3961 4759 4495 3907 2385205 3038149 3243312 2645739 2260708 579
China 1723 1455 1887 1965 1696 917298 1006446 918116 820943 706730 417Cyprus 20 19 24 22 22 20071 26358 23068 26145 26145 1178India 6 4 7 9 15 9000 6442 8791 11000 16000 1067Indonesia 124 47 72 44 4-4 101751 34000 53934 30000 30000 682Iran 28 30 127 14162 14300 143992Israel 168 161 122 133 140 105429 119236 134616 152164 146703 1048japan 271 260 745 546 425 187092 223621 698480 424683 321702 757Jordan 35 39 18 21 21 20621 31557 10471 13691 13691 643Korea Rep 178 196 228 284 141 91091 138451 138902 209524 113514 805Kuwait 22 20 18 18 18 18760 15221 18323 18323 18323 1047Lebanon 27 36 30 45 45 17384 26810 20998 23438 23438 526Malaysia 170 170 250 205 179 100000 110000 162000 133000 116000 648Myanmar 1 2 2 2 4 541 1434 1644 2767 2752 671Pakistan 53 35 14 17 16 32206 21101 12987 14158 9060 566Philippines 277 270 240 285 261 132732 205301 137168 151886 127433 489Saudi Arabia 452 520 236 305 315 352500 396257 175116 203847 216843 688Singapore 200 480 401 208 180 170000 441523 312049 160000 120582 670Thailand 14 17 82 53 40 30302 42824 88129 53541 36457 911Turkey 93 197 255 333 346 64265 177267 184528 196629 215335 622
Europe 13011 12663 13164 14352 14294 9339217 12462385 11660351 10471981 10167431 711
Austria 271 263 237 265 293 254823 246000 245000 169017 181299 618Bel -Lux 867 921 1013 1035 1035 614240 881855 799514 689532 689532 666Croatia 19 15 16 17 15 8885 26842 30582 30214 26582 1772Czech Rep 65 83 93 182 146 55493 95243 115228 145422 76679 525Denmark 61 53 329 350 360 60000 50000 316876 192858 204760 570Estonia 4 3 3 19 23 4971 4753 3159 12540 13376 582Finland 146 150 120 146 138 115154 162230 128724 130556 128740 933France 1807 1672 1725 1995 2003 1223703 1547079 1393650 1342560 1383534 691Germany 2856 2717 2551 2537 2499 1979140 2757314 2350811 2092765 2075000 830Greece 52 29 36 148 155 48000 29000 34000 90478 87765 566Hungary 75 49 59 103 118 70000 45267 55067 55280 63328 537Ireland 210 164 390 200 193 182759 157329 369261 162007 70517 365Italy 1717 1625 1585 1806 1798 990898 1382385 1108750 1098302 1392790 775Latvia 11 16 23 18 19 10847 28603 26000 10208 10017 527Lithuania 19 21 11 31 24 7597 14946 7816 22368 12892 537
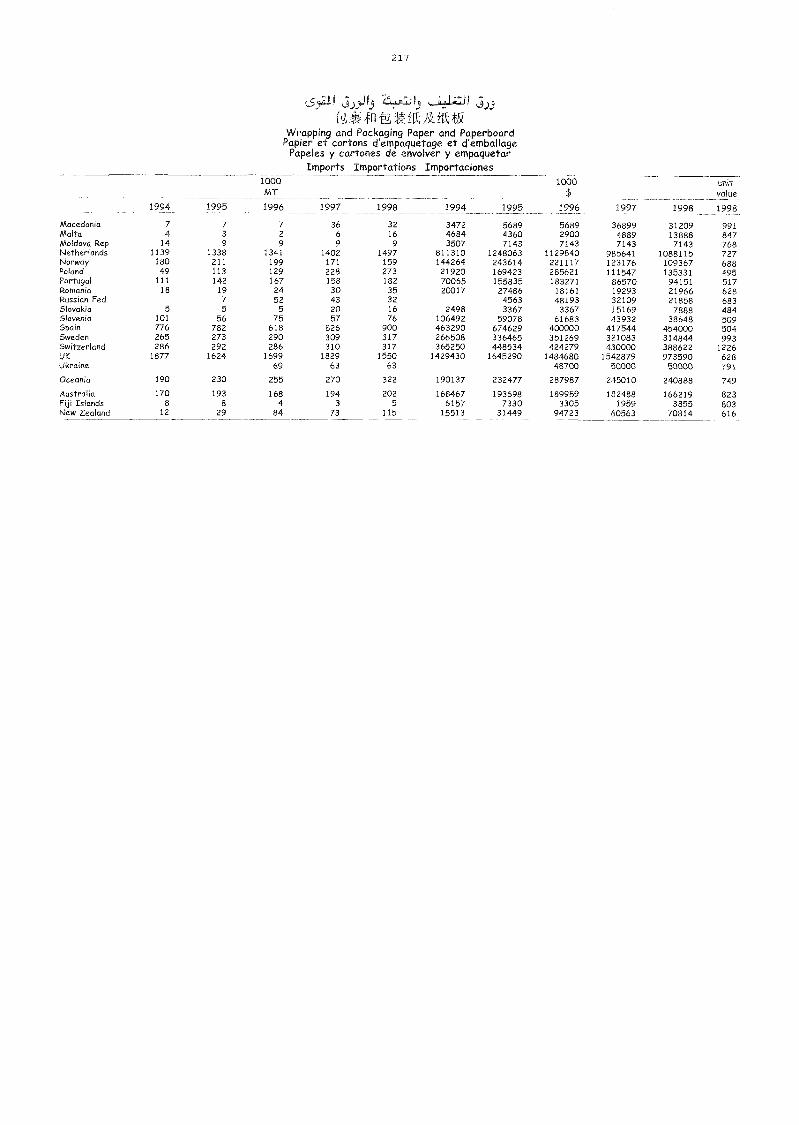
2 1 7
L$,4-Z11 I 3).9
Wrapping and Packaging Paper and PaperboardPapier et cartons d'empaquetage et d'emballage
Papeles y cartones de envolver y empaquetarImports Importations Importaciones
1994 1995
1000MT
1996 1997 1998 1994 1995
1000$
1996 1997 1998
unitvalue
1998
Macedonia 7 7 7 36 32 3472 5689 5689 36899 31209 991Malta 4 3 2 6 16 4684 4360 2900 4889 13888 847Moldova Rep 14 9 9 9 9 3507 7143 7143 7143 7143 768Netherlands 1139 1338 1341 1402 1497 811310 1248063 1129840 985641 1088115 727Norway 180 211 199 171 159 144264 243614 221117 123176 109367 688Poland 49 113 129 228 273 21920 169423 285621 111547 135331 495Portugal 111 142 167 158 182 70065 155835 183271 86570 94151 517Romania 18 19 24 30 35 20017 27486 18161 19293 21966 628Russian Fed 7 52 43 32 4563 48193 32109 21858 683Slovakia 5 5 5 20 16 2498 3367 3367 15169 7888 484Slovenia 101 56 75 57 76 106492 59078 61683 43932 38648 509Spain 776 782 618 826 900 463290 674629 400000 417544 454000 504Sweden 265 273 290 309 317 266508 336465 351269 321083 314844 993Switzerland 286 292 286 310 317 365250 448534 424279 430000 388622 1226UK 1877 1624 1699 1829 1550 1429430 1645290 1484680 1542879 973590 628Ukraine 69 63 63 48700 50000 50000 791
Oceania 190 230 255 270 322 190137 232477 287987 245010 240888 749
Australia 170 193 168 194 202 168467 193698 189959 182488 166219 823Fiji Islands 8 8 4 3 5 6157 7330 3305 1959 3855 803New Zealand 12 29 84 73 115 15513 31449 94723 60563 70814 616
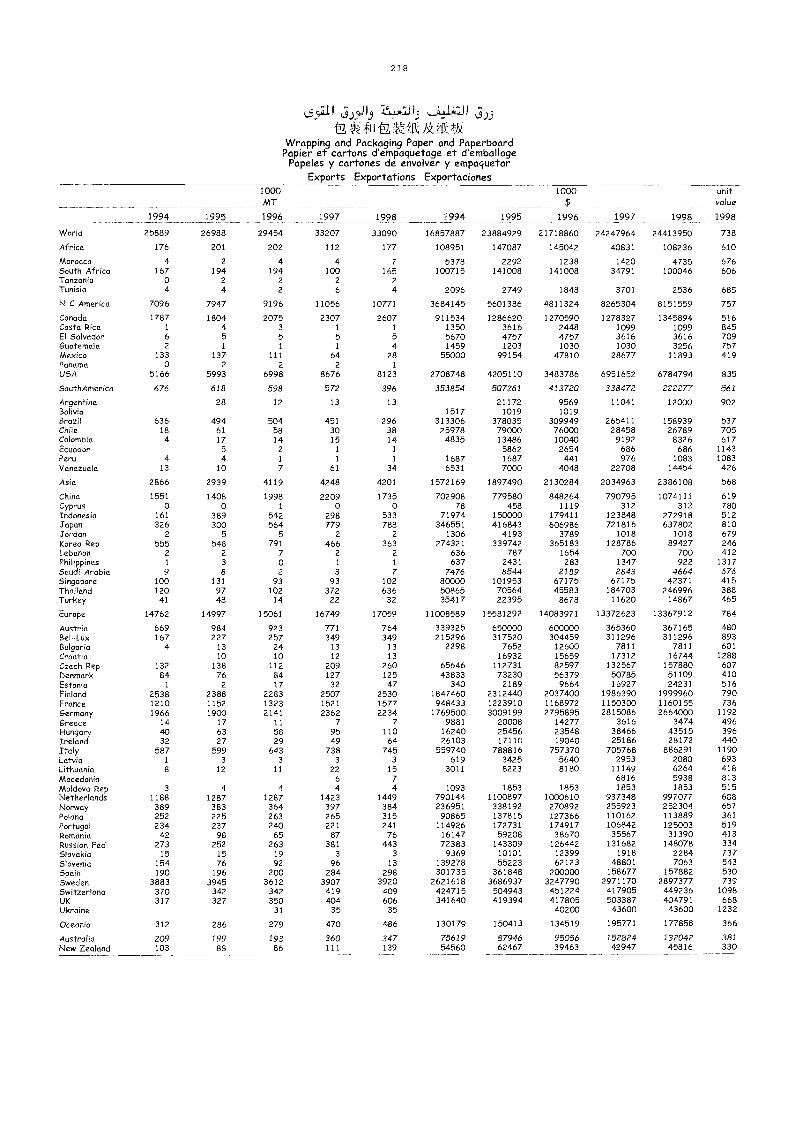
218
,55.7.11 P I5)3VVrapping and Packaging Paper and PaperboardPapier et cartons d'ennpaquetage et d'eniballage
Papeles y cartones de envolver y empaquetarExports Exportations Exportaciones
1994 1995
1000MT
1996 1997 1998 1994 1995
1000$
1996 1997 1998
unitvalue
1998
VVorld 25889 26988 29454 33207 33090 16857887 23884929 21718860 24247964 24413950 738
AfMca 176 201 202 112 177 108951 147087 145042 40831 108236 610
Morocco 4 2 4 4 7 5378 2292 1238 1420 4735 676South Africa 167 194 194 100 165 100715 141008 141008 34791 100046 606Tanzania o 2 2 2 2Tunisia 4 4 2 6 4 2096 2749 1848 3701 2536 685
N C America 7096 7947 9196 11056 10771 3684145 5601386 4811324 8265304 8151559 757
Canada 1787 1804 2075 2307 2607 911534 1286620 1270590 1278327 1345894 516Costa Rica 1 4 3 1 1 1350 3616 2448 1099 1099 845El Salvador 6 5 5 5 5 5670 4757 4757 3616 3616 709Guatemala 2 1 1 1 4 1459 1203 1030 1030 3256 757Mexico 133 137 111 64 28 55000 99154 47810 28677 11893 419Panama o 2 2 2 1
USA 5166 5993 6998 8676 8123 2708748 4205110 3483786 6951652 6784794 835
SouthAmerica 676 618 598 572 396 353854 507261 413720 338472 222277 561
Argentina 28 12 13 13 21172 9569 11041 12000 902Bolivia 1517 1019 1019Brazil 636 494 504 451 296 313306 378035 309949 265411 158939 537Chile 18 61 58 30 38 25978 79000 76000 28458 26789 705Colombia 4 17 14 15 14 4835 13486 10040 9192 8326 617Ecuador 5 2 1 1 5862 2654 686 686 1143Peru 4 4 1 1 1 1687 1687 441 976 1083 1083Venezuela 13 10 7 61 34 6531 7000 4048 22708 14454 426
Asia 2866 2939 4119 4248 4201 1572169 1897490 2130284 2034963 2386108 568
China 1551 1408 1998 2209 1735 702908 779580 848264 790795 1074111 619Cyprus 0 0 1 0 o 78 458 1119 312 312 780Indonesia 161 389 542 298 533 71974 150000 179411 123848 272918 512Japan 326 300 564 779 788 346551 416843 606986 721816 637802 810Jordan 2 5 5 2 2 1306 4193 3789 1018 1018 679Korea Rep 555 548 791 466 363 274321 339742 365183 128786 89427 246Lebanon 2 2 7 2 2 636 787 1654 700 700 412Philippines 1 3 o 1 1 637 2431 283 1347 922 1317SaudiArabia 9 8 2 3 7 7476 8544 2159 2843 4664 676SMgapore 100 131 93 93 102 80000 101953 67175 67175 42371 415Thadand 120 97 102 372 636 50865 70564 45583 184703 246996 388Turkey 41 48 14 22 32 35417 22395 8678 11620 14867 465
Europe 14762 14997 15061 16749 17059 11008589 15581292 14083971 13372623 13367912 784
Austria 669 984 923 771 764 339325 650000 600000 365360 367165 480Bel-Lux 167 227 257 349 349 215296 317520 304459 311296 311296 893Bulgaria 4 13 24 13 13 2298 7652 12600 7811 7811 601Croatia 10 10 12 13 16932 15659 17312 16744 1288Czech Rep 132 138 112 209 260 65646 112731 82597 132567 157880 607Denmark 84 76 84 127 125 43833 73230 56379 50785 51109 410Estonia 1 2 17 32 47 340 2189 9664 16927 24231 516FMland 2538 2388 2283 2507 2530 1847460 2312440 2037400 1986390 1999960 790France 1210 1152 1323 1521 1577 948433 1223910 1168972 1150300 1160155 736Germany 1966 1900 2141 2362 2234 1769500 3009199 2795895 2815086 2664000 1192Greece 14 17 11 7 7 9881 20008 14277 3616 3474 496Hungary 40 63 58 95 110 16240 25456 23548 38466 43515 396Ireland 32 27 29 49 64 26103 17110 19040 25186 28172 440Italy 587 599 643 738 745 559740 788816 757370 705768 886291 1190Latvia 1 3 3 3 3 619 3425 5640 2953 2080 693LithuaMa 8 12 11 22 15 3011 8223 8180 11149 6264 418Macedonia 6 7 6816 5938 813Maldova Rep 3 4 4 4 4 1093 1853 1853 1853 1853 515NetherMnds 1188 1287 1287 1423 1449 790144 1100897 1000610 937348 997077 688Norway 389 383 364 397 384 236951 338192 270892 255923 252304 657PoMnd 252 225 263 265 315 90865 137815 127366 110162 113889 361Portugal 234 237 240 221 241 114926 172731 174917 106842 125003 519RomanM 42 98 65 87 76 16147 59208 38670 35567 31390 413RussMn Fed 273 252 263 381 443 72383 143309 126442 131682 148078 334SlovakM 15 15 19 3 3 9369 10101 12399 1918 2284 737SMvenM 154 76 92 96 13 139278 55223 62123 48801 7063 543SpaM 190 196 200 284 298 301735 361848 200000 158677 157882 530Sweden 3883 3945 3612 3907 3920 2621618 3686937 3247790 2971170 2897377 739SwitzerMnd 370 342 342 419 409 424715 504943 451224 417905 449236 1098UK 317 327 350 404 606 341640 419394 417805 503387 404791 668UkraMe 31 35 35 40200 43600 43600 1232
OceanM 312 286 279 470 486 130179 150413 134519 195771 177858 366
Australia 209 199 193 360 347 75619 87946 95056 152824 132042 381New ZeaMnd 103 88 86 111 139 54560 62467 39463 42947 45816 330
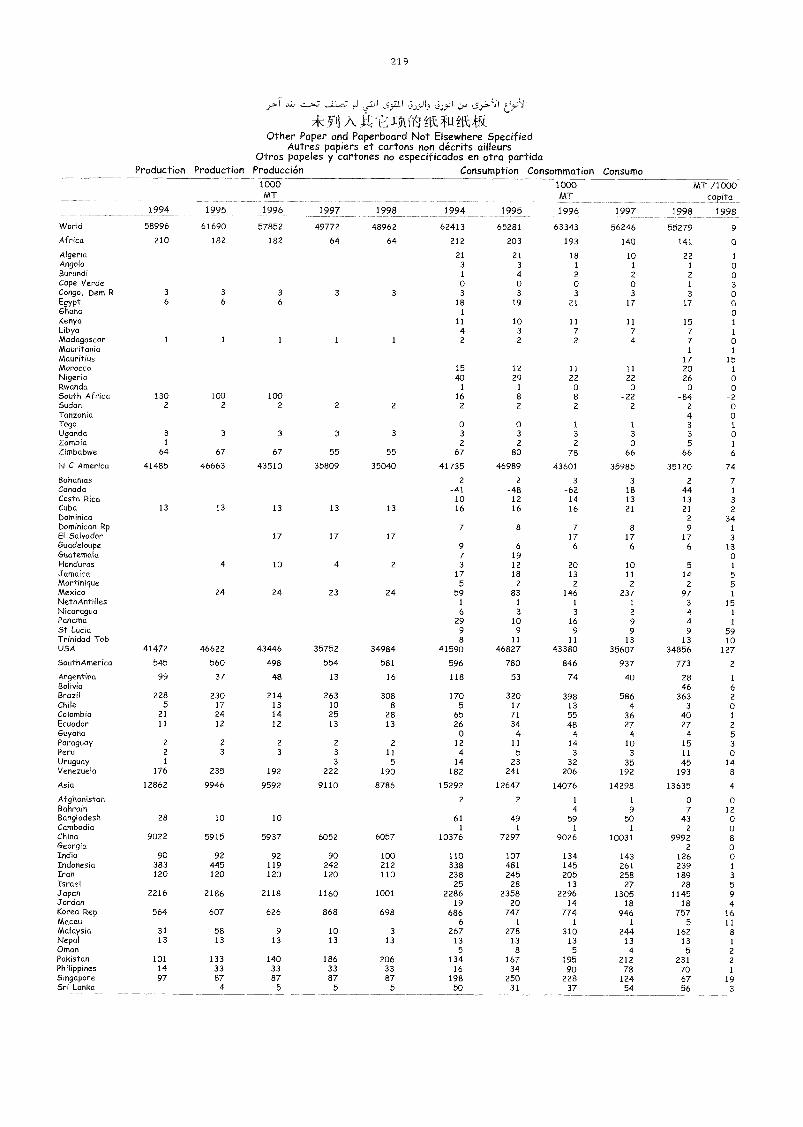
21 9
:9):,11) JI lJiI5rn.tY1 .fft kg.
Other Paper and Paperboard Not Elsewhere SpecifiedAutres papiers et cartons non décrits ailleurs
Otros papeles y cartones no especificados en otra partidaProduction Production Producción Consumption Consommation Consumo
World
Africa
1994
58996
210
1995
61690
182
1000MT
1996
57852
182
1997
49772
64
1998
48962
64
1994
62413
212
1995
65281
203
1000MT
1996
63343
193
1997
56246
140
MT 11000capita
1998 1998
55279 9
141 0
Algeria 21 21 18 10 22 1
Angola 3 3 1 1 1 0Burundi 1 4 2 2 2 0Cape Verde 0 0 0 0 1 3Congo, Dem R 3 3 3 3 3 3 3 3 3 3 0Egypt 6 6 6 18 19 21 17 17 0Ghana 1 0Kenya 11 10 11 11 15 1
Libya 4 3 7 7 7 1
Madagascar 1 1 1 1 1 2 2 2 4 7 0Mauritania 1 1
Mauritius 17 15Morocco 15 12 11 11 20 1
Nigeria 40 29 22 22 26 0Rwanda 1 1 o o o oSouth Africa 130 100 100 16 8 8 -22 -84 -2Sudan 2 2 2 2 2 2 2 2 2 2 0Tanzania 4 0Togo o o 1 1 3 1Uganda 3 3 3 3 3 3 3 3 3 3 0Zambia 1 2 2 2 0 5 1
Zimbabwe 64 67 67 55 55 67 80 78 66 66 6
N C America 41485 46663 43510 35809 35040 41735 46989 43601 35985 35120 74
Bahamas 2 2 3 3 2 7Canada -41 -48 -62 18 44 1
Costa Rico 10 12 14 13 13 3
Cuba 13 13 13 13 13 16 16 16 21 21 2Dominica 2 34Dominican Rp 7 8 7 8 9 1
El Salvador 17 17 17 17 17 17 3Guadeloupe 9 6 6 6 6 13Guatemala 7 19 0Honduras 4 10 4 2 3 12 20 10 5 1
Jamaica 17 18 13 11 14 5Martinique 5 2 2 2 2 5Mexico 24 24 23 24 59 83 146 237 97 1
NethAntilles 1 1 1 1 3 15Nicaragua 6 3 3 2 4 1
Panama 29 10 16 9 4 1
St Lucia 9 9 9 9 9 59Trinidad Tob 8 11 11 13 13 10USA 41472 46622 43446 35752 34984 41590 46827 43380 35607 34856 127
SouthAmerica 545 560 498 554 581 596 780 846 937 773 2
Argentina 99 37 48 13 16 118 53 74 40 28 1
Bolivia 46 6Brazil 228 230 214 263 308 170 320 398 586 363 2Chile 5 17 13 10 8 5 17 13 4 3 0Colombia 21 24 14 25 28 65 71 55 36 40 1
Ecuador 11 12 12 13 13 26 34 48 27 27 2Guyana 0 4 4 4 4 5Paraguay 2 2 2 2 2 12 11 14 10 15 3Peru 2 3 3 3 11 4 5 3 3 11 0Uruguay 1 3 5 14 23 32 35 45 14Venezuela 176 235 192 222 190 182 241 206 192 193 8
Asia 12862 9946 9592 9110 8786 15292 12647 14076 14298 13635 4
Afghanistan 2 2 1 1 0 0Bahrain 4 9 7 12Bangladesh 28 10 10 61 49 59 50 43 0Cambodia 1 1 1 1 2 0China 9022 5915 5937 6052 6057 10376 7297 9026 10031 9992 8Georgia 2 0India 90 92 92 90 100 110 107 134 143 126 0Indonesia 383 4-45 119 242 212 338 481 145 261 239 1
Iran 120 120 120 120 110 238 245 205 258 189 3Israel 25 28 13 27 28 5Japan 2216 2186 2118 1160 1001 2286 2358 2296 1305 1145 9Jordan 19 20 14 18 18 4Korea Rep 564 607 626 868 698 686 747 774 946 757 16Macau 6 1 1 1 5 11Malaysia 31 58 9 10 3 267 278 310 244 162 8Nepal 13 13 13 13 13 13 13 13 13 13 1
Oman 5 8 5 4 5 2Pakistan 101 133 140 186 206 134 167 195 212 231 2Philippines 14 33 33 33 33 16 34 90 78 70 1
Singapore 97 87 87 87 87 198 250 228 124 67 19Sri Lanka 4 5 5 5 50 31 37 54 56 3
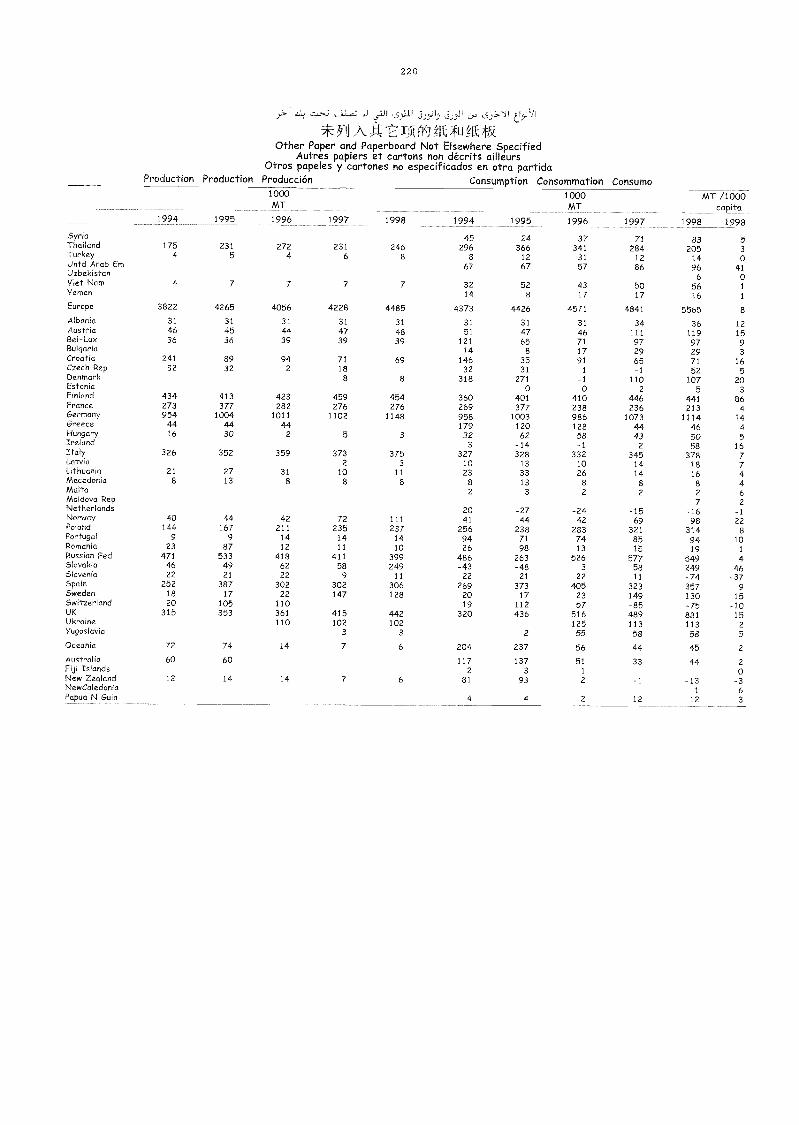
22 0
7Ïc
;. J iI .5,5_83
J-1,1"--: n [k2KOther Paper and Paperboard Not Elsewhere Specified
Autres papiers et cartons non décrits ailleursOtros papeles y cartones no especificados en otra partida
Production Production Producción Consumption Consommation Consumo
1994 1995
1000MT
1996 1997 1998 1994 1995
1000MT
1996 1997
MT /1000capita
1998 1998
Syria 45 24 37 71 83 5Thailand 175 231 272 231 246 296 366 341 284 205 3Turkey 4 5 4 6 8 8 12 31 12 14 0Untd Arab Em 67 67 57 86 96 41Uzbekistan 6 0Viet Nam 4 7 7 7 7 32 52 43 50 56 1Yemen 14 8 17 17 16 1
Europe 3822 4265 4056 4228 4-485 4373 4426 4571 4841 5565 8
Albania 31 31 31 31 31 31 31 31 34 36 12Austria 46 45 44 47 48 51 47 46 111 119 15Bel-Lux 36 36 39 39 39 121 65 71 97 97 9Bulgaria 14 8 17 29 29 3Croatia 241 89 94 71 69 146 35 91 65 71 16Czech Rep 32 32 2 18 32 31 1 -1 52 5Denmark 8 8 318 271 -1 110 107 20Estonia 0 0 2 5 3Finland 434 413 423 459 454 360 401 410 446 441 86France 273 377 282 276 276 269 377 238 236 213 4Germany 954 1004 1011 1102 1148 958 1003 986 1073 1114 14Greece 44 44 44 179 120 128 44 46 4Hungary 16 30 2 5 3 32 62 58 43 50 5Ireland 3 -14 -1 2 58 16Italy 326 352 359 373 375 327 328 332 345 378 7Latvia 2 3 10 13 10 14 18 7Lithuania 21 27 31 10 11 23 33 26 14 16 4Macedonia 8 13 8 8 8 8 13 8 8 8 4Malta 2 3 2 2 2 6Moldova Rep 7 2Netherlands -20 -27 -24 -15 -16 -1Norway 40 44 42 72 111 41 44 42 69 98 22Poland 144 167 211 235 237 256 238 283 321 314 8Portugal 9 9 14 14 14 94 71 74 85 94 10Romania 23 87 12 11 10 26 98 13 15 19 IRussian Fed 471 533 418 411 399 486 263 526 577 549 4Slovakia 46 49 62 58 249 -43 -48 3 58 249 46Slovenia 22 21 22 9 11 22 21 22 11 -74 -37Spain 252 387 302 302 306 269 373 405 323 357 9Sweden 18 17 22 147 128 20 17 23 149 130 15Switzerland 20 105 110 19 112 57 -85 -75 -10UK 315 353 361 415 442 320 436 516 489 881 15Ukraine 110 102 102 125 113 113 2Yugoslavia 3 3 2 55 58 58 5Oceania 72 74 14 7 6 204 237 56 44 45 2
Austral ia 60 60 117 137 51 33 44 2Fiji Islands 2 3 1 0New Zealand 12 14 14 7 6 81 93 2 -1 -13 -3NewCaledonia 1 6Papua N Guin 4 4 2 12 12 3
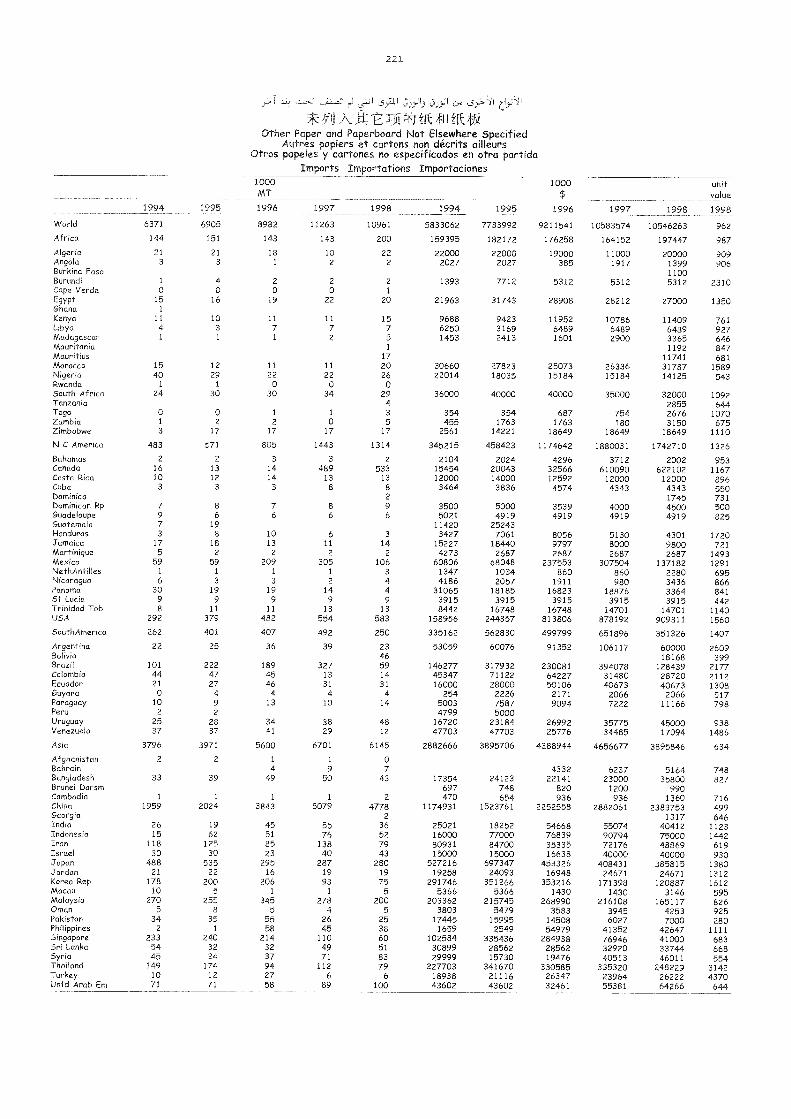
221
sili JJI j;)-1'
4:!iq A. jvcE:fiItr/v 4;j1_1400C)ther Paper and Paperboard Not Elsewhere Specified
Autres papiers et cartons non décrits aiHeursOtros papeles y cartones no especificados en otra partida
Innports Importations Importacioneso
MT1000 unit
value
1994 1995 1996 1997 1998 1994 1995 1996 1997 1998 1998
VVorld 6371 6905 8982 11263 10961 5833062 7733992 9211541 10583574 10546263 962
Afhca 144 151 143 143 200 159395 182172 176258 164152 197447 987Algeria 21 21 18 10 22 22000 22000 19000 1 1000 20000 909Angola 3 3 1 2 2 2027 2027 385 1917 1399 906BurkMa Faso 1100Burundi 1 4 2 2 2 1393 7712 5312 5312 5312 2310Cape Verde 0 0 0 0 1
Egypt 15 16 19 22 20 21963 31743 28908 28212 27000 1350Ghana 1
Kenya 11 10 11 11 15 9688 9423 11952 10786 11409 761Libya 4 3 7 7 7 6250 3169 6489 6489 6489 927Madagascar 1 1 1 2 5 1453 2413 1601 2900 3365 646MauritanM 1 1192 847Mauritius 17 11741 681Morocco 15 12 11 11 20 30660 27823 25073 26336 31787 1589Nigeria 40 29 22 22 26 22014 18035 15184 15184 14125 543Rwanda 1 1 0 0 0South Africa 24 30 30 34 29 36000 40000 40000 35000 32000 1092Tanzania 4 2855 644Togo 0 0 1 1 3 354 354 687 754 2676 1070Zambia 1 2 2 0 5 455 1763 1763 180 3150 675Zimbabwe 3 17 17 17 17 2561 14221 18649 18649 18649 1110
N C America 483 571 805 1443 1314 345215 458423 1174642 1880031 1742710 1326Bahamas 2 2 3 3 2 2104 2024 4296 3712 2002 953Canada 16 13 14 489 533 15454 20043 32566 610090 622102 1167Costa Rica 10 12 14 13 13 12000 14000 12592 12000 12000 896Cuba 3 3 3 8 8 3464 3836 4574 4343 4343 550Dominico 2 1745 731Dominican Rp 7 8 7 8 9 3500 5000 3539 4000 4500 500Guadeloupe 9 6 6 6 6 5021 4919 4919 4919 4919 825Guatemala 7 19 11420 25243Honduras 3 8 10 6 3 3427 7061 8056 5130 4301 1720Jamaica 17 18 13 11 14 15227 18440 9797 8000 9800 721AAartinique 5 2 2 2 2 4273 2687 2687 2687 2687 1493AAexico 59 59 209 305 106 60806 68048 237553 307504 137182 1291NethAngles 1 1 1 1 3 1347 1034 860 860 2280 695Nicaragua 6 3 3 2 4 4186 2057 1911 980 3436 866Panama 30 19 19 14 4 31065 18185 16823 18876 3364 841St Lucia 9 9 9 9 9 3915 3915 3915 3915 3915 442Trinidad Tob 8 11 11 13 13 8442 16748 16748 14701 14701 1140USA 292 379 482 554 583 158956 244357 813806 878192 909311 1560
SouthAmerica 262 401 407 492 250 335162 562830 499799 651896 351326 1407Argentina 22 25 36 39 23 53059 60076 91352 106117 60000 2609Bolivia 46 18168 399Brazil 101 222 189 327 59 146277 317932 230081 394078 128439 2177Colombia 44 47 45 13 14 45347 71122 64227 31480 28720 2112Ecuador 21 27 46 31 31 16000 28000 50106 40673 40673 1308Guyana 0 4 4 4 4 254 2226 2171 2066 2066 517Paraguay 10 9 13 10 14 5003 7587 9094 7222 11166 798Peru 2 2 4799 5000Uruguay 25 28 34 38 48 16720 23184 26992 35775 45000 938Venezuela 37 37 41 29 12 47703 47703 25776 34485 17094 1486
Asia 3796 3971 5600 6701 6145 2882666 3895706 4388944 4656677 3895846 634Afghanistan 2 2 1 1 0BahraM 4 9 7 4332 6237 5164 748Bangladesh 33 39 49 50 43 17354 24123 22141 23000 35800 827Brunei Darsm 697 748 820 1200 990Cambodia 1 1 1 1 2 470 654 936 936 1360 716China 1959 2024 3843 5079 4778 1174931 1523761 2252558 2882061 2383753 499Georgia 2 1317 646India 26 19 45 55 36 25021 18252 54668 55074 40412 1123Indonesia 15 62 51 76 52 16000 77000 76839 90794 75000 1442Iran 118 125 85 138 79 80931 84700 35335 72176 48869 619Israel 30 30 23 40 43 15000 15000 16638 40000 40000 930Japan 488 535 295 287 280 527216 697347 453326 408431 385815 1380Jordan 21 22 16 19 19 19258 24093 16948 24671 24671 1312Korea Rep 178 200 206 93 75 291746 351266 353216 171398 120887 1612Macau 10 5 1 1 5 5366 5366 1430 1430 3146 595Malaysia 270 255 345 278 200 203362 215745 268990 216108 165117 826Oman 5 8 5 4 5 3803 5479 3583 3945 4253 925Pakistan 34 35 55 26 25 17445 15995 14508 6027 7000 280PhilippMes 2 1 58 45 38 1659 2549 54979 41352 42647 1111Singapore 233 240 214 110 60 102584 335436 284938 76946 41000 683Sri Lanka 54 32 32 49 51 30899 28562 28562 32920 33744 668Syha 45 24 37 71 83 29999 15730 19476 40513 46011 554Thailand 149 174 94 112 79 227703 341670 330585 335320 248229 3142Turkey 10 12 27 6 6 18938 21116 26347 23964 26222 4370Untd Arab Em 71 71 58 89 100 43602 43602 32461 55381 64266 644
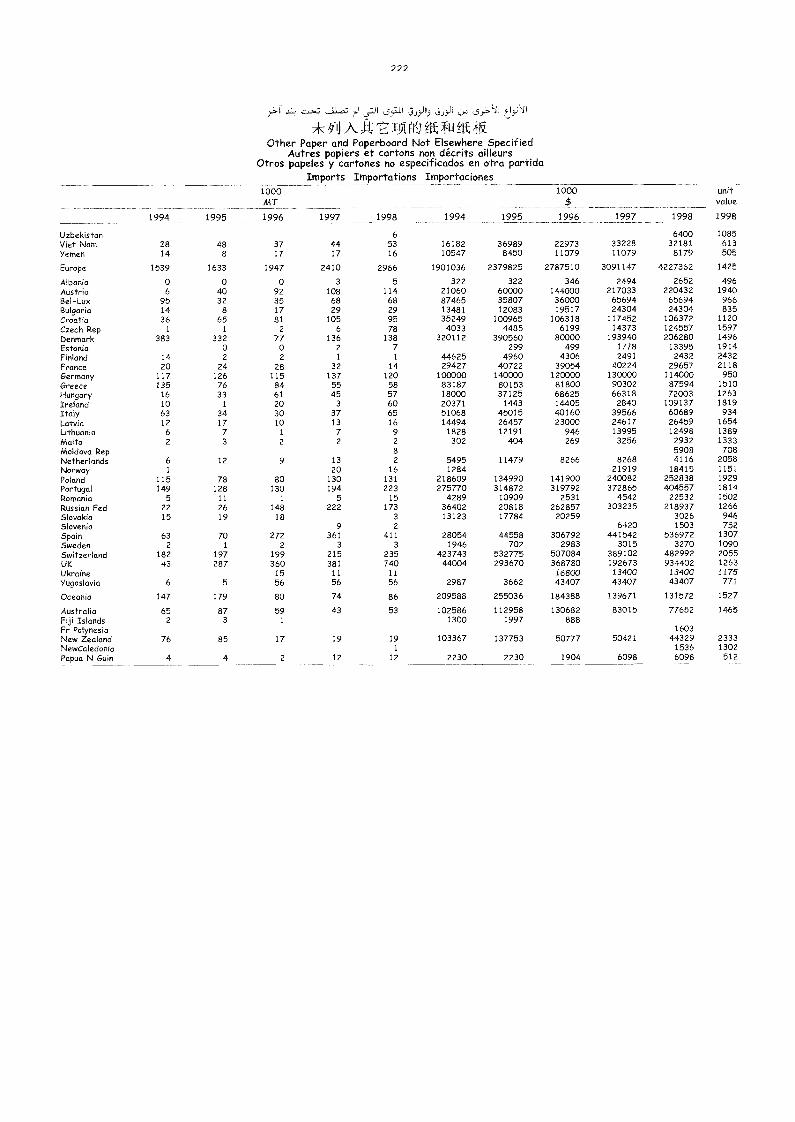
222
).1 a11 ,35.:11 3)3.11)
-1.1 A 'E. JP. rr,.] .ffk*Other Paper and Paperboard Not Elsewhere Specif ied
Autres papiers et cartons non décrits ailleursOtros papeles y cartones no especificados en otra partida
Imports Importations Importaciones
1994 1995
1000MT
1996 1997 1998 1994 1995
1000
$1996 1997 1998
unitvalue
1998
Uzbekistan 6 6400 1085Viet Nam 28 48 37 44 53 16182 36989 22973 33228 32181 613Yemen 14 8 17 17 16 10547 8450 11079 11079 8179 505
Europe 1539 1633 1947 2410 2966 1901036 2379825 2787510 3091147 4227362 1425
Albania 0 0 0 3 5 322 322 346 2494 2652 496Austria 6 40 92 108 114 21060 60000 144000 217033 220432 1940Bel-Lux 95 32 35 68 68 87465 35807 36000 65694 65694 966Bulgaria 14 8 17 29 29 13481 12083 19517 24304 24304 835Croatia 36 65 81 105 95 35249 100965 106318 117452 106372 1120Czech Rep 1 1 2 6 78 4033 4485 6199 14373 124557 1597Denmark 383 332 77 136 138 320112 390560 80000 193940 206280 1496
Estonia 0 0 2 7 299 499 1778 13395 1914Finland 14 2 2 1 1 44625 4960 4306 2491 2432 2432France 20 24 28 32 14 29427 40722 39054 40224 29657 2118Germany 117 126 115 137 120 100000 140000 120000 130000 114000 950Greece 135 76 84 55 58 83187 80153 81800 90302 87594 1510Hungary 16 33 61 45 57 18000 37125 68625 66318 72003 1263Ireland 10 1 20 3 60 20371 1443 14405 2840 109137 1819Italy 63 34 30 37 65 51068 45015 40160 39566 60689 934Latvia 12 17 10 13 16 14494 26457 23000 24617 26459 1654Lithuania 6 7 1 7 9 1828 12191 946 13995 12498 1389Malta 2 3 2 2 2 302 404 269 3256 2932 1333Moldova Rep 8 5908 708Netherlands 6 12 9 13 2 5495 11479 8266 8268 4116 2058Norway 1 20 16 1284 21919 18415 1151Poland 115 78 80 130 131 218609 134990 141900 240082 252838 1929Portugal 149 128 130 194 223 275770 314872 319792 372865 404557 1814Romania 5 11 1 5 15 4289 10909 2531 4542 22532 1502Russian Fed 22 26 148 222 173 36402 20818 262857 303235 218937 1266Slovakia 15 19 18 3 13123 17784 20259 3026 946Slovenia 9 2 6420 1503 752Spain 63 70 272 361 411 28054 44558 306792 441542 536972 1307Sweden 2 1 2 3 3 1946 702 2983 3015 3270 1090Switzerland 182 197 199 215 235 423743 532775 507084 389102 482992 2055UK 43 287 360 381 740 44004 293670 368780 192673 934402 1263Ukraine 15 11 11 16800 13400 13400 1175Yugoslavia 6 5 56 56 56 2987 3662 43407 43407 43407 771
Oceania 147 179 80 74 86 209588 255036 184388 139671 131572 1527
Australia 65 87 59 43 53 102586 112958 130682 83015 77652 1465Fiji Islands 2 3 1 1300 1997 888Fr Polynesia 1603New Zealand 76 85 17 19 19 103367 137753 50777 50421 44329 2333NewCaledonia 1 1536 1302Papua N Guin 4 4 2 12 12 2230 2230 1904 6098 6098 512
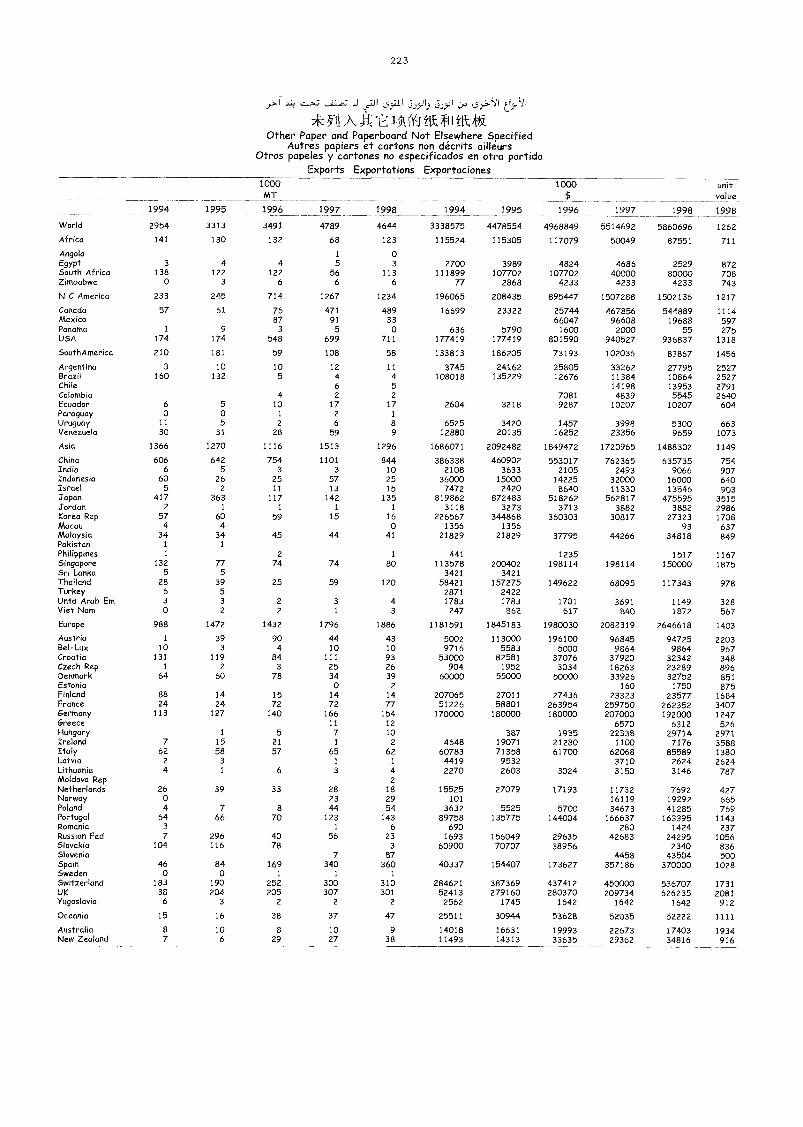
223
.1 ,35..111j).5.11) C9).).11
.1.1ÀJJU.MOther Paper and Paperboard Not Elsewhere Specified
Autres papiers et cartons non décrits ailleursOtros papeles y cartones no especificados en otra partida
Exports Exportations Exportaciones1000MT
1000 unitvalue
1994 1995 1996 1997 1998 1994 1995 1996 1997 1998 1998
World 2954 3313 3491 4789 4644 3338575 4478554 4968849 5514692 5860696 1262
Africa 141 130 132 68 123 115524 115305 117079 50049 87551 711
Angola 1 oEgypt 3 4 4 5 3 2700 3989 4824 4686 2529 872South Afr ca 138 122 122 56 113 111899 107702 107702 40000 80000 708Zimbabwe 0 3 6 6 6 77 2868 4233 4233 4233 743
N C America 233 245 714 1267 1234 196065 208435 895447 1507288 1502136 1217
Canada 57 61 76 471 489 16699 23322 25744 467856 544889 1114Mexico 87 91 33 66047 96608 19688 597Panama 1 9 3 5 o 636 5790 1600 2000 55 275USA 174 174 548 699 711 177419 177419 801590 940527 936837 1318
SouthAmerica 210 181 59 108 58 133813 186205 73193 102036 83867 1456
Argentina 3 10 10 12 11 3745 24162 25805 33262 27795 2527Brazil 160 132 5 4 4 108018 135229 12676 11384 10864 2527Chile 6 5 14198 13953 2791Colombia 4 2 2 7081 4839 5545 2640Ecuador 6 5 10 17 17 2604 3218 9287 10207 10207 604Paraguay 0 o 1 2 1
Uruguay 11 5 2 6 8 6525 3420 1457 3998 5300 663Venezuela 30 31 28 59 9 12880 20135 16252 23356 9659 1073
Asia 1366 1270 1116 1513 1296 1686071 2092482 1849472 1720965 1488302 1149
China 606 642 754 1101 844 386338 460902 553017 762365 635735 754India 6 5 3 3 10 2108 3633 2105 2493 9066 907Indonesia 60 26 25 57 25 36000 15000 14225 32000 16000 640Israel 5 2 11 13 15 7472 2420 8640 11330 13546 903Japan 417 363 117 142 135 819862 872483 518262 562817 475595 3515Jordan 2 1 1 1 1 3118 3273 3713 3882 3882 2986Korea Rep 57 60 59 15 16 226567 344868 360303 30817 27323 1708Macau 4 4 0 1356 1356 93 637Malaysia 34 34 45 44 41 21829 21829 37795 44266 34818 849Pakistan 1 1
Philippines 1 2 1 441 1235 1517 1167Singapore 132 77 74 74 80 113578 200402 198114 198114 150000 1875Sri Lanka 5 5 3421 3421Thailand 28 39 25 59 120 58421 157275 149622 68095 117343 978Turkey 6 5 2871 2422Untd Arab Em 3 3 2 3 4 1783 1783 1701 3691 1149 328Viet Nam o 2 2 1 3 247 862 617 840 1872 567
Europe 988 1472 1432 1796 1886 1181591 1845183 1980030 2082319 2646618 1403
Austria 1 39 90 44 43 5002 113000 196100 96845 94725 2203Bel-Lux 10 3 4 10 10 9716 5583 5000 9864 9864 967Croatia 131 119 84 111 93 53000 82581 37076 37920 32342 348Czech Rep 1 2 3 25 26 904 1952 3034 18263 23289 896Denmark 64 60 78 34 39 60000 55000 50000 33926 32752 851Estonia o 2 160 1750 875Finland 88 14 15 14 14 207065 27011 27436 23323 23577 1684France 24 24 72 72 77 51226 58801 263954 259750 262352 3407Germany 113 127 140 166 154 170000 180000 180000 207000 192000 1247Greece 11 12 6570 6312 526Hungary 1 5 7 10 387 1935 22338 29714 2971Ireland 7 15 21 1 2 4648 19071 21280 1100 7176 3588Italy 62 58 57 65 62 60783 71358 61700 62068 85589 1380Latvia 2 3 1 1 4419 9532 3710 2624 2624Lithuania 4 I 6 3 4 2270 2603 3024 3150 3146 787Moldova Rep 2Netherlands 26 39 33 28 18 15525 27079 17193 11732 7692 427Norway 0 23 29 101 16119 19292 665Poland 4 7 a 44 54 3632 5525 5700 34673 41285 769Portugal 64 66 70 123 143 89758 135775 144004 166637 163395 1143Romania 3 1 6 690 280 1424 237Russian Fed 7 296 40 56 23 1693 156049 29635 42683 24295 1056Slovakia 104 116 78 3 60900 70707 38956 2340 836Slovenia 7 87 4458 43504 500Spain 46 84 169 340 360 40337 154407 173627 357186 370000 1028Sweden o o 1 1 1
Switzerland 183 190 252 300 310 284621 387369 437412 450000 536707 1731UK 38 204 205 307 301 52413 279160 280370 209734 626235 2081Yugoslavia 6 3 2 2 2 2562 1745 1642 1642 1642 912
Oceania 15 16 38 37 47 25511 30944 53628 52035 52222 1111
Australia 8 10 a 10 9 14018 16631 19993 22673 17403 1934New Zealand 7 6 29 27 38 11493 14313 33635 29362 34816 916

1i) 1111
FOREST PRObUCTE
PROQUITS FORESTIERS
PP,ODUCTOS FORESTALES
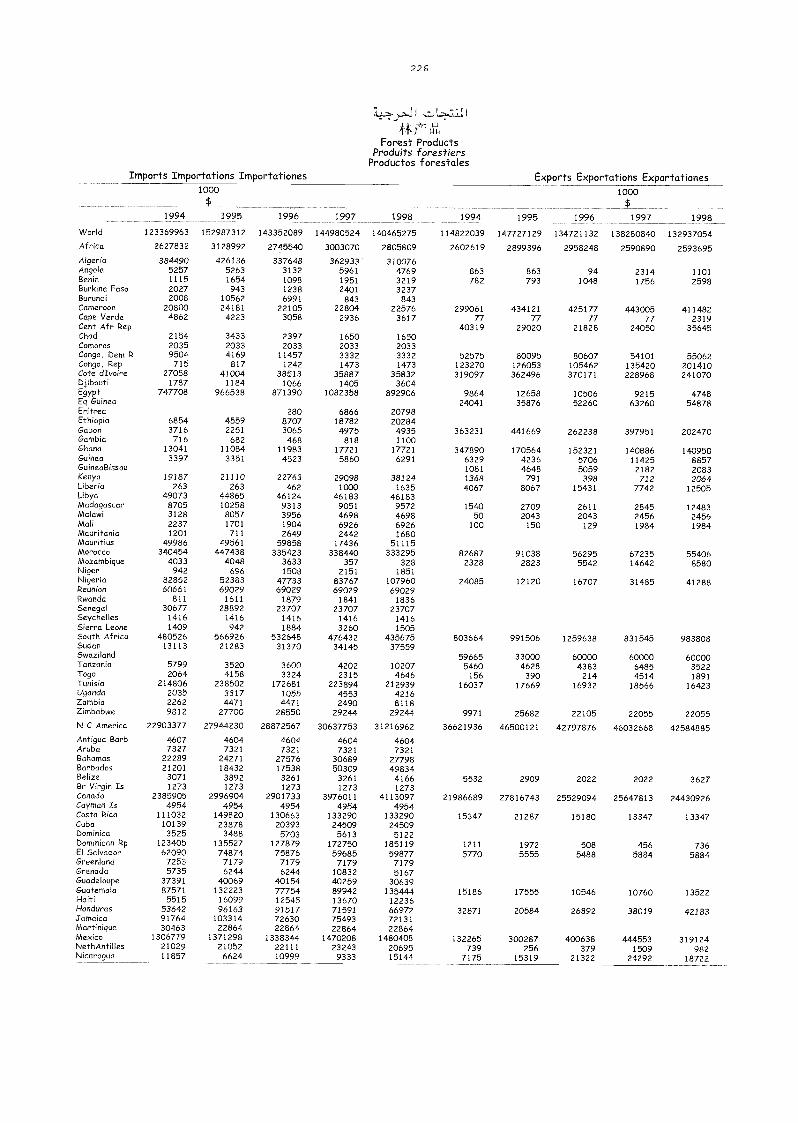
226
1
Forest ProductsProduits forestiers
Productos forestalesImports Importations Importationes Exports Exportations Exportationes
1994
1000$
1995 1996 1997 1998 1994 1995 1996
1000$
1997 1998
VVorld 123369963 152987312 143352089 144980524 140465275 114822039 147727129 134721132 138280840 132937054Africa 2627832 3128992 2745540 3003070 2805809 2602619 2899396 2958248 2590890 2593695Algeria 384490 426136 337648 362933 310076Angola 5257 5263 3132 5961 4769 863 863 94 2314 1101Benin 1115 1654 1098 1951 3219 782 793 1048 1756 2598BurkMa Faso 2027 943 1238 2401 3237Burundi 2008 10562 6991 843 843Cameroon 20800 24181 22105 22804 22576 299061 434121 425177 443005 411482Cape Verde 4862 4223 3058 2936 3617 77 77 77 77 2319Cent Afr Rep 40319 29020 21828 24050 35645Chad 2154 3433 2397 1650 1650Comoros 2035 2033 2033 2033 2033Congo, Dem R 9504 4169 11457 3332 3332 52575 80095 80607 54101 55062Con9o, Rep 715 817 1242 1473 1473 123270 126053 105462 135420 201410Cote dIvoire 27058 41004 38513 35887 35832 319097 362496 370171 228968 241070Djibouti 1787 1184 1066 1405 3604Egypt 747708 966538 871390 1082358 892906 9864 12658 10506 9215 4748Eq Guinea 24041 35876 52260 63260 54878Eritrea 280 6866 20798Ethiopia 6854 4559 8707 18782 20284Gabon 3716 2251 3065 4975 4935 363231 441669 262238 397951 202470Gambia 716 682 468 818 1100Ghana 13041 11084 11983 17721 17721 347890 170564 152321 140886 140950Guinea 3397 3351 4523 5860 6291 6329 4236 5706 11425 8857GueaBissau 1081 4648 5059 2182 2083Kenya 19187 21110 22763 29098 38124 1368 791 398 712 2064Liberia 263 263 462 1000 1635 4067 8067 15431 7742 12505Libya 49073 44865 46124 46183 46183Madagascar 8705 10258 9313 9051 9572 1540 2709 2611 2845 12483Malawi 3128 8057 3956 4698 4698 50 2043 2043 2456 2456Mali 2237 1701 1904 6926 6926 100 150 129 1984 1984Mauritania 1201 711 2649 2442 1680Mauritius 49986 49561 59858 17436 51115Morocco 340454 447438 335423 338440 333295 82687 91038 56295 67235 55406Mozambique 4033 4048 3633 357 328 2328 2823 5542 14642 8580Niger 942 696 1508 2151 1851Nigeria 82852 52383 47733 83767 107960 24085 12120 16707 31485 41288Reunion 60661 69029 69029 69029 69029Rwanda 811 1611 1879 1841 1836Senegal 30677 28892 23707 23707 23707Seychelles 1416 1416 1416 1416 1416Sierra Leone 1409 942 1884 3260 1505South Africa 480526 566926 532648 476432 435675 803664 991506 1259638 831545 983808Sudan 13113 21283 31370 34145 37559Swaziland 59665 33000 60000 60000 60000Tanzania 5799 3520 3600 4202 10207 5460 4628 4383 6485 3522Togo 2064 4158 3324 2315 4646 156 390 214 4514 1891Tunisia 214806 238502 172681 223894 212939 16037 17669 16932 18566 16423Uganda 2035 3317 1055 4553 4216Zambia 2262 4471 4471 2490 8118Zimbabwe 9812 27700 28550 29244 29244 9971 25682 22105 22055 22055N C America 22903377 27944230 28872567 30637753 31216962 36621936 46500121 42797876 46032668 42584885Antigua Barb 4607 4604 4604 4604 4604Aruba 7327 7321 7321 7321 7321Bahamas 22289 24271 27576 30689 27798Barbados 21201 18432 17538 50309 49834Belize 3071 3892 3261 3261 4166 5532 2909 2022 2022 3627Br Virgin Is 1273 1273 1273 1273 1273Canada 2385905 2996904 2901733 3976011 4113097 21986689 27816743 25529094 25647813 24430926Cayman Is 4954 4954 4954 4954 4954Costa Rica 111032 149820 130663 133290 133290 15347 21287 15180 13347 13347Cuba 10139 23878 20393 24509 24509Dominica 3525 3488 5703 5613 5122Dominican Rp 123405 135527 127879 172750 185119 1211 1972 508 456 736El Salvador 62090 74874 75876 59685 59877 5770 5555 5488 5884 5884Greenland 7253 7179 7179 7179 7179Grenada 5735 6244 6244 10832 5167Guadeloupe 37391 40069 40154 40259 30639Guatemala 87571 132223 /1/54 89942 135444 15186 17555 10546 10760 13522Haiti 5515 16099 12545 13670 12236Honduras 53642 96163 91517 71591 66972 32871 20584 26892 38019 42183Jamaica 91764 103314 72630 75493 72131Martinique 30463 22864 22864 22864 22864AAexico 1306779 1371298 1338344 1470208 1480408 132265 300287 400638 444553 319124NethAntifles 21029 21052 22111 23243 20695 739 256 379 1509 982Nicaragua 11857 6624 10999 9333 15144 7175 15319 21322 24292 18722

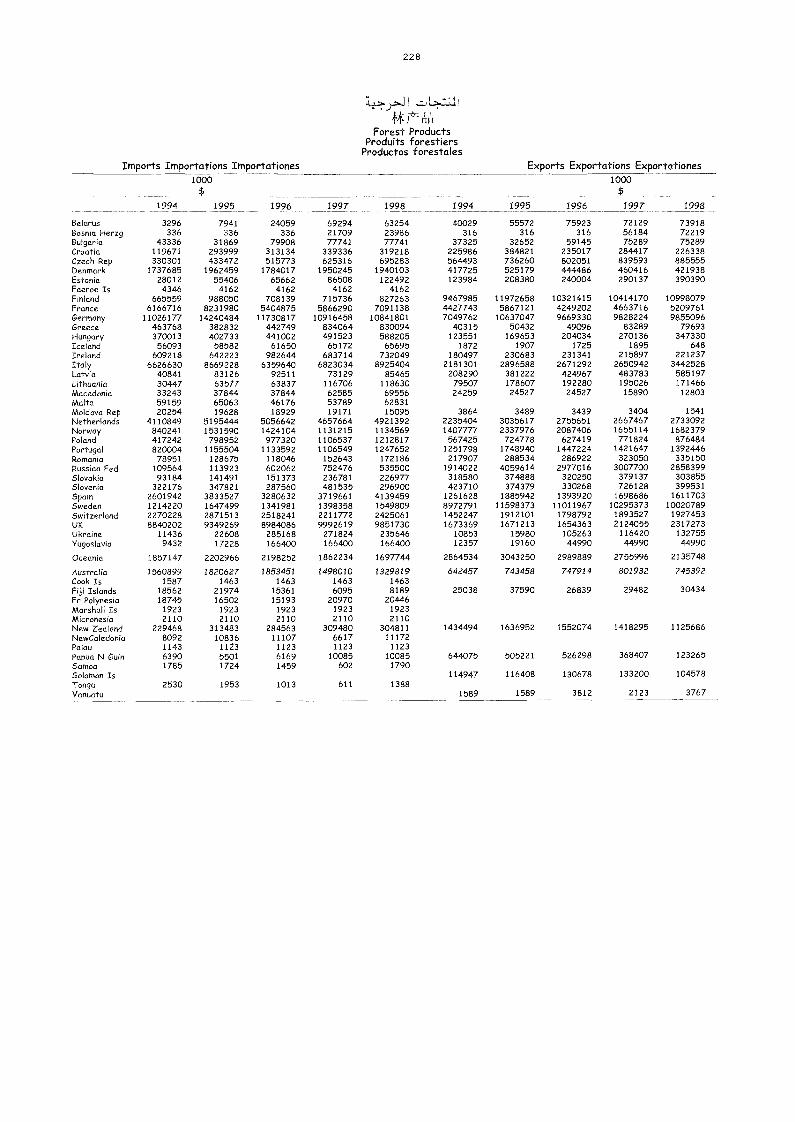
228
14 111iTf nnForest Products
Produits forestiersProductos forestales
Imports Importations Importationes Exports Exportations Exportationes
1994
1000
1995 1996 1997 1998 1994 1995 1996
1000
1997 1998
Belarus 3296 7941 24059 69294 63254 40029 55572 75923 72129 73918Bosnia Herzg 336 336 336 21709 23986 316 316 316 56184 72219Bulgaria 43336 31869 79908 77741 77741 37325 32652 59145 75289 75289Croatia 119671 293999 313134 339336 319218 225986 384821 235017 284417 226338Czech Rep 330301 433472 515773 625316 695283 564493 736260 802051 839593 885555Denmark 1737685 1962459 1784017 1950245 1940103 417725 525179 444486 460416 421938Estonia 28012 55406 65662 86508 122492 123984 208380 240004 290137 390390Faeroe Is 4346 4162 4162 4162 4162Finland 665559 988050 708139 715736 827263 9467985 11972658 10321415 10414170 10998079France 6166716 8231980 5404875 5866290 7091138 4427743 5867121 4249202 4663716 5209761Germany 11026177 14240484 11730817 10916458 10841801 7049762 10637047 9669330 9828224 9855096Greece 463768 382832 442749 834064 830094 40315 50432 49096 83289 79693Hungary 370013 402733 441002 491523 588205 123551 169653 204034 270136 347330Iceland 56093 58582 61650 65172 65695 1872 1907 1725 1895 648Ireland 609218 642223 982644 683714 732049 180497 230683 231341 215897 221237Italy 6626630 8669228 6359640 6823034 8925404 2181301 2896588 2671292 2650942 3442528Latvia 40841 83126 92511 73129 85465 208290 381222 424967 483783 585197Lithuania 30447 63577 63837 116706 118630 79507 178607 192280 195026 171466Macedonia 33243 37844 37844 62585 69556 24259 24527 24527 15890 12803Malta 59159 65063 46176 53789 62831Moldova Rep 20254 19628 18929 19171 15095 3864 3489 3439 3404 1541Netherlands 4110849 5195444 5056642 4657664 4921392 2235404 3035617 2755651 2667467 2733092Norway 840241 1531590 1424104 1131215 1134569 140//// 2337976 2087406 1655114 1682379Poland 417242 798952 977320 1106537 1212817 567425 724778 627419 771824 876484Portugal 820004 1155504 1133592 1106549 1247652 1251798 1748940 1447224 1421647 1392446Romania 78951 128675 118046 152643 172186 217907 288534 286922 323050 335150Russian Fed 109564 113923 602062 752476 535500 1914022 4059614 2977016 3007700 2858399Slovakia 93184 141491 151373 236781 226977 318580 374888 320250 379137 303855Slovenia 322176 347821 287560 481535 296900 423710 374379 330268 726128 399531Spain 2601942 3833527 3280632 3719661 4139459 1261628 1885942 1393920 1698686 1611703Sweden 1214220 1647499 1341981 1398358 1549809 8972791 11598373 11011967 10295373 10020789Switzerland 2270228 2871513 2518241 2211772 2425061 1452247 1912101 1798792 1893527 1927453UK 8840202 9349269 8984086 9992619 9851730 1673369 1671213 1654363 2124055 2317273Ukrae 11436 22608 285168 271824 235646 10853 15980 105263 116420 132755Yugoslavia 9432 17228 166400 166400 166400 12357 19160 44990 44990 44990
Oceania 1857147 2202966 2198252 1862234 1697744 2864534 3043250 2989889 2755996 2135748
Australia 1560899 1820627 1853451 1498010 1329819 642457 743458 747914 801932 745392Cook's 1587 1463 1463 1463 1463Fiji Islands 18562 21974 15361 6095 8189 25038 37590 26839 29482 30434Fr Polynesia 18745 16502 15193 20970 20446Marshall Is 1923 1923 1923 1923 1923AAicronesia 2110 2110 2110 2110 2110New Zealand 229468 313483 284563 309480 304811 1434494 1636952 1552074 1418295 1125686NewCaledoMa 8092 10836 11107 6617 11172Palau 1143 1123 1123 1123 1123Papua N Guiri 6390 5501 6169 10085 10085 644075 505221 526298 368407 123265Samoa 1785 1724 1459 602 1790Solomon's 114947 116408 130678 133200 104578Tonga 2530 1953 1013 611 1388Vanuatu 1589 1589 3812 2123 3767

L °DIRECTION OF TRADE
DIRECTION DU COMMERCE
DIRECCIÓN DEL COMERCIO
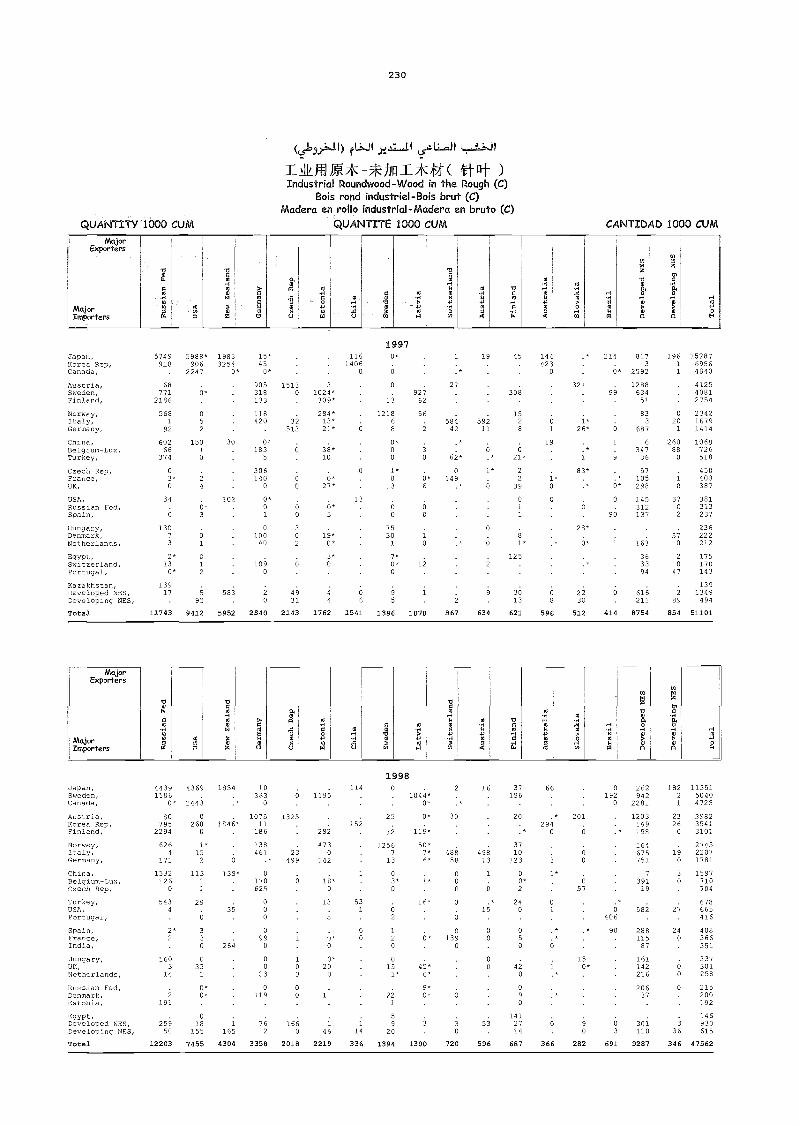
QUANTITY 1000 CUM
230
).12.L.11 JoaLL4J1
A1411 ( Wit )Industrial Roundwood-Wood in the Rough (C)
Bois rond industriel-Bois brut (C)Madera en rollo industrial-Madera en bruto (C)
QUANTITE 1000 CUM CANTIDAD 1000 CUM
817 196 152873 1 6956
2592 1 4840
1288 4125634 4081
51 2754
83 0 23423 20 1679
687 1 1414
6 260 1068347 88 726
36 0 518
145 87 381312 0 313137 2 237
23657 222
163 0 212
139616 2 1349211 89 494
8754 854 51101
1998
MajorExporters
NkijorImporters
o44 B
m
Z B 0 W 0
maa.w0
a
0
m0,
aH
a.
N
m
B
ta
oao
al
Major
MajorImporters
me
mg,MalN
1z
>1 kil
u
0
u
0IS'
'1)m
Exporters
M
o
V0M
m.,M
-1,o,g
m
m
mmzoaH
.
Japan,Sweden,Canada,
Austria,Korea Rep,
Norway,
44391106
0*
80795
2294
626
4369
2443
269
1*
Finland,1854
.
1846*
10363
0
107511
186
138
.6
1325
1195
292
473
114
152
0
25
12
1256
1044*0*
0*
119*
50*
2
30
16 37196
20
.*
37
66
.*294
0
201
0
0192
0
262942
2281
1203149198
164
18221
2326
0
1135150404725
398235413101
2745Italy,
China,Belgium-Lux,Czech Rep,
Turkey,
171
1332126
0
543
152
113
1
29
6
139*
.*
461
0
170625
0
Germany,23499
6
(14
1;8*
13 5
7
13
03*0
7*6*
16*
48858
000
5
1049813
1
0
123
00*2
24
3
1*
0
59
675751
7
39119
190
30
22071781
1597710704
678USA, 4 35 0 0 15 0 1 665
Spain,France,
2*2
0
33
0
099
8Portugal,00
2
1
2 139 005
2i
*406
90 288115
240
416
408366
India,Hungary,UK,
160
3
033
264 0
00
10
0*20
0
0
15 45*
0
00
0
4215
0*
87
161142 6
351
337301
Russian Fed,Denmark,Estonia,Egypt,Developed NES,
NEO,
1 4
2191
259 950
1
0*0*
018
1551
165
23
0119
762
Netherlands,3
00
1660
0
li
46 19 Developing
1*
221
5
20
0*
9*0*
30
53
0
090
1412714
9
0 3
216
20637
307110
0
0
3
36
258
215200192
146930615
Total 12203 7455 4304 3358 2018 2219 336 1394 1300 721 596 687 366 282 691 9287 346 47562
144 .* 214423
o 6*
32199
.
0 1*a 26* 0
19 1
1
1406
1997116 0* 1 19 45
0 6 :*0 . 27
927 3086 62
1218 56 . 156 584 592 2
6 8 2 42 11 8
0* .*0 3 5 6
0 0 62* 21.1* 1* 20 0* 149 2
13 6 .* 5 39
13 00 1
o 1
7530 8
1 1*
7* 1250* 12 2
0 9. i 9 306 5 13
1541 1386 1070 867 634 621
Japan,Korea Rep,Canada,
5749 5988* 1983 15.918 906 3254 45
2247 0* 0*
Russian Fed,
Finland, 2186 133
Norway, 568 0 118
China, 602 150 30 0*
Turkey, 374 5 5
Czech Rep, S 306
2*
Austria, 68 905 1513Sweden, 771 0* 318 0
Italy, 1 5 420 32Germany, 92 2 . 513
Belgium-Lux, 66 1 183 6
France, 3* 140 6
UK, 0 4 0 0
USA, 34 102 0* .
Spain, 01 o
Hungary, 130 0 3Denmark, 7 100 0Netherlands, 3 40 2
0 0
Kazakhstan, 139
Portugal, 0* 2 0=erland, 13 1 109 0
.
Developed NES, 17 583 2 49Developing NES, 95 0 31
Total 11743 9412 5952 2840 2143
83*1*
0:
0 0
90
28*
0* 1
6 08 30
596 512 414
57 450105 1 403298 0 387
36 2 17533 0 17094 47 143
31024*309*
284*13*21*
38*10
0*27*
3"
19*0*
5
44
1762
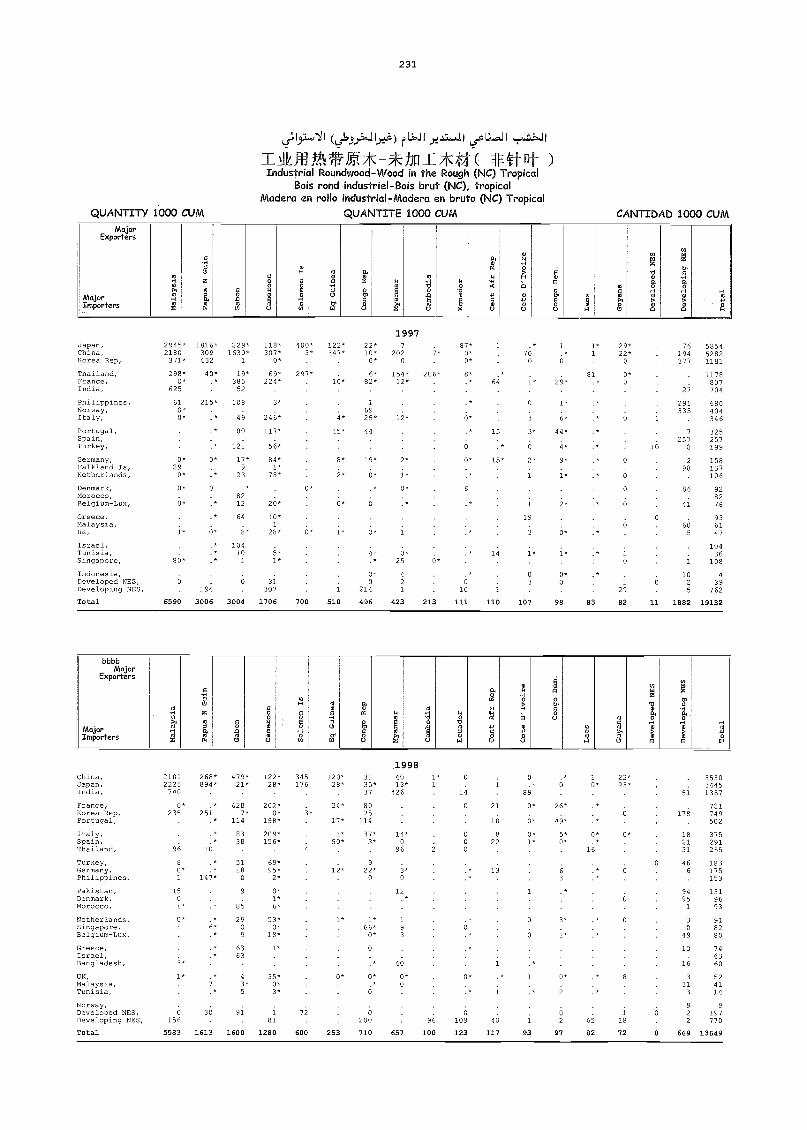
QUANTITY 1000 CUM
ri...11.J.2.15-41 6,14,11
1ritnt )Industrial Roundwood-Wood in the Rough (NC) Tropical
Bois rond inclustriel-Bois brut (NC), tropicalMadera en rollo industrial-Madera en bruto (NC) Tropical
QUANTITE 1000 CUM
231
CANTIDAD 1000 CUMMajor
Exporters
T
ea
RwZo
00
0H 0
o04 1:1 0
--te z o0
o 0H
á m6*
M
e
87.
-a
8 '
MajorImporters
WiM-te
M00.
O0g
No 1
o
O0o-,
aoo
-8m
O
.00 .2i
o
Oog
', ,',6
O
r>,o
H
E
He
t.-10"t3T a u u w ,,, u w 8 U U 4 0 n n E-,
bbbbMejor
Exporten0H0 e
aO
1.,Q
O
u) l'O
M.e
0z
H
o
00oH
k e:8 Q
M0oU M
Idog'
O-.-t
S'
MajarImporters
1.0011a
O0
1o,P,ow
OU
ww
001oou
0
1u ow
00Wu
8ou
eo
00>,oo
H
eln
He
(1)n
H
41ot-,
1998China,Japan,India,France,Korea Rep,Portugal,Italy,Spain,Thailand,Turkey,Germany,Philippines,Pakistan,Denmark,MOTOCCO,
Netherlands,Singapore,Belgium-Lux,
Greece,Israel,Bangladesh,UK,Malaysia,Tunisia,Norway,
21012225740
O*235
96
8O*1
15O
1*
0*1
3*
1*
268*894*
.*251
.*
.*
.*10
147*
479*21*
4287*
114
8338
5118
0
9
85
2g
9
6363
1*
5
122*28*
202*0*
198*
209*156*
69*95*
2*
0*1*6*
53*0*
18*
1*
35*0*3*
345176
3*
120*28*
24*
17*
1*50*
12*
0*
3135*37
8075
114
37*3*
23*O
1*66*
0*
0
4013*
426
14*0
96
3*
12
1
9
3
40
0*O
1*1
0
19
0
000
.*O
.*
0*
21
10
23
13
89
0*
O*
0*1*
6
O
26*
49*
5*O'
3*
0*
10*
0*
16
22*23*
0*
6
51
178
182131
466
9495
1
30
49
10
16
331
3
9
353034451357
781749502
375291255
183175153
1319693
918280
746360
524114
9Developed NEO,Developing NEO,Total
0156
5583
30
1613
91
1600
7281
1280
O
600 253
O
200
710 657
96
100
O
109
123
40
117
1
93
2
97
65
82
A72
6
0
22
669
197770
13649
1997Japan,China,Korea Rep,
Thailand,France,India,Philippines,Norway,
2945*2180371*
298*O*
625
610*
1816*309432
40*
215*
229*1630*
1
19*385
52
108
118*307*
0*
69*224*
3*
400*3*
297*
122*347*
22*10*
0*
6*82*
169
7202
O
154*12*
206*
87*0*0*
8*
.*
69
76O
0
1
0
29*
1*
1*1
81
Italy,Portugal,Spain,Turkey,Germany,Falkland Is,Netherlands,Denmark,Morocco,Belgium-Lux,
Greece,Malaysia,UK,
Israel,Tunisia,Singapore,Indonesia,Developed NES,Developing NEO,Total
0*
0*29
0*
0*
O*
80*
6
6590
.*
0*
.*
199
3006
49
80
121
17*
23
8212
64
8*
10410
1
6
3004
246*
117*
56*
84°1*
78*
20*
10*1
28*
5*1*
31307
1706
0*
O*
700
15*
8*
2*
1
510
4* 25*44
19*
O*
0*
0214
496
12*
2*
0*
25
4
21
423 213
6,,
.*
6
0*
6
010
111
15
15*
14
110
3*
6
2*
1
19
O
3
107
44*
21*
9*
2'
6*
0*0
98 83
29* 76 585422* 194 5282
O 377 1181
0* . 1178O 807
27 704
291 680
O
335 404. 346
7 325257 257
16 8 199
2 15898 137
106
86 9282
41 76
9360 61
5 47
10436
108
10 142 39
29 5 762
82 11 1882 19132
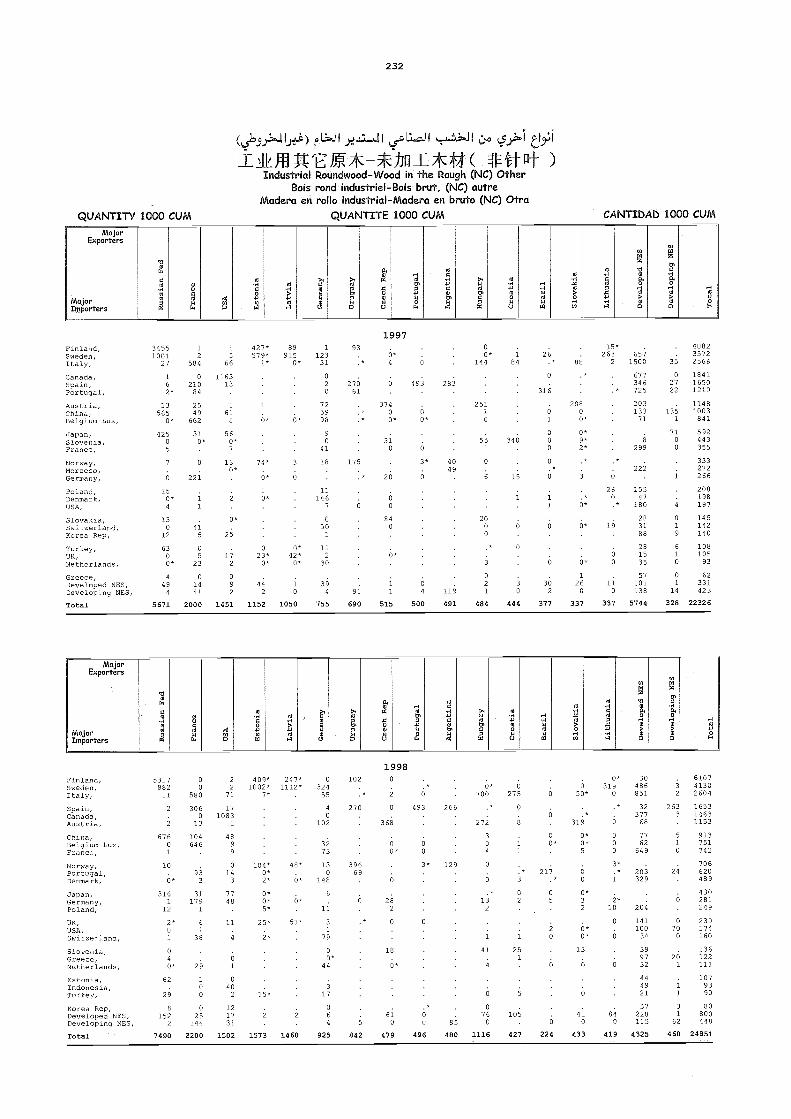
QUANTITY 1000 C(JM
O
o
232
) LJI y! i
41/ WEE**-firli*ff1Itnt )Industrial Roundwood-Wood in the Rough (NC) Other
Bois rond industriel-Bois brut, (NC) nutreMadera en rollo industrial-Madera en bruto (NC) Otra
QUANTITE 1000 CUM
1997
*
6
374
°O *
319
26
2080
7), 0*
0 0*O 9*o 2*
0 3
84
O*
i
515 377 337
O
26
o
316
CANTIDAD 1000 CUM
88
0* 30 6107319 486 3 4130
0 851 2 2604
.* 32 263 1653
. 377 3 14630 68 . 1153
0 77 5 9130 62 1 7510 649 0 742
3* . 706.* 203 29 6201 329 489
4302* 6 281
10 204 249
141 0 239. 100 70 1740 34 0 160
39 . 136
O
97 20 12232 1 111
44 . 10749 1 9321 1 90
57 3 80829 228 1 800
115 62 448
419 4325 460 24851
MejorExporters
m i11
g .Rv m
4
Ocd O
O-,t
>1O
oa HOM
O
V r4,O
.r1 . OHAd O
O
Ó.Ó
Mejorimportoro
.Om
g
UOmaN
11*0. 1o
gOuo
ÚONU
B0á
00b'
m.0UO
a-'m
2U
--f0
'0,,
pl:1,m
-B ,-f'1
on
HO
,1,naa
NktjorExporters
Mejor
'og
gO. ú
gu m
1Úo
.moBa
m
mm4 a
m
-am
V
m
1m0
-.0
i1Jo
5:.á.,
ioo-a
óH>o
Importers a w a 6 g . u m ro a n n
1998Finland,Sweden,Italy,Spain,Canada,Austria,China,Belgium-Lux,France,Norway,Portugal,Denmark,
Japan,Germany,Poland,
UK,USA,Switzerland,Slovenia,Greece,Netherlands,Estonia,Indonesia,Turkey,
Korea Rep,Developed NOS,Developing NOS,Total
5317882
11
2
67601
10
6*
3161
12
2*O
1
O
4
0*
62
29
8152
2
7490
0O
580
3060
13
104646
933
31179
1
6
38
29
1
00
025
144
2208
22
71
171083
1
48
9
014
3
7748
11
4
9
040
2
121731
1502
2*
409*1002*
7*
104*0*2*
0*0*5*
25*
15*
1573
247*1112*
.
48*
O*
51*
1460
0324
55
4o
102
3273
130
148
6
11
3
79
O
0*44
317
O
64
925
102
270
39669
.
5
842
0
368
00*
0
282
O
18
60
610
479
O
493
.
60
3*
0
*
60
496
266
.
129
85
480
O*700
272
3o4
0
1
41
4
6
°760
1116
27°5
O
8
1
1
3
1
251
4
105
427
6
0o'
217*
05
20
.
O
224
50*
. ,319
0*o*5
60
0*32
6*0*
13
0
410
433
Finland,Sweden,Italy,Canada,Spain,Portugal,Austria,China,Belgium-Lux,
Japan,Slovenia,France,Norway,Morocco,Germany,
Poland,Denmark,
34551001
27
1
6
2*
13565
0*
42505
7
6
150*
12
584
0210
84
2549
662
310*.
0
221
15
66
116313
1
618
560*7
130*
427*579*
1*
1
74*
6*
9 *
89915
0*
3
0
1
12331
o20
725998
90
41
18.
.
11146
93
.*
27061
175
:'
USA,
Slovakia,Switzerland,Korea Rep,
Turkey,UK,Netherlands,
4
130
12
6300*
1
415
O
523
0*
25
170
23*0*
0*42*
0*
7
0
501
112
30
6
Greece,Developed NOS,Developing NOS,Total
449
4
5671
01441
2000
092
1451
41
1152
1
0
1050
394
755
91
690
60*
144 84
493 283
25110
655
1340
3* 40 0
649
6 15
200 60
.*
3
06 2 34 119 1 0
500 491 484 444
15* 4082263 657 3572
2 1500 35 2566
677 0 1841346 27 1650725 22 1210
203 1148133 139 1003
71 1 841
. 7] ) 5928 443
299 0 355
.* 3331 222 2720 1 266
26 155 2080 17 198.* 180 4 197
28 0 14514 31 1 142
88 140
286
10815 1 105
0 35 0 93
57 0 6211 101 1 331
0 138 14 423
337 5744 328 22326
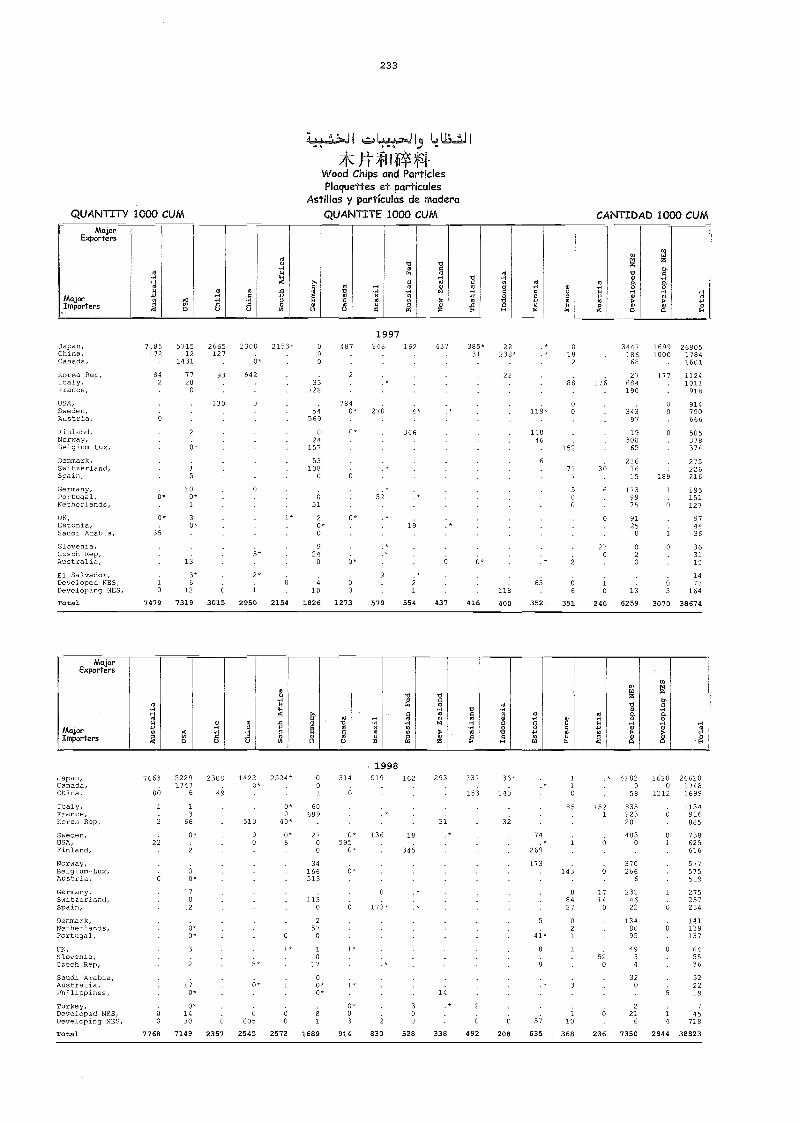
1997
233
I L.JI3 LU_J In 4n 4444
Wood Chips and ParticlesPlaquettes et particules
Astillas y partículas de maderaQUANIIIY 1000 CUM QUANTITE 1000 CUM CANTIDAD 1000 CUM
1998
MajorExporters
o
O vg
yoO o
O)Dlzy
mmzmo
A0 '01
'00
H H
MajorImorters
,p
0ljo
0H--o4U
.*5
gN
oU
o01
0H00
g
0N
1
MHH.4E.
0gvroH
.W
?.o
ÓH
I,'o
H3.5
o&,.
MajorExporters
MajorImporters
m.lioá 4
U
mu
o0W
, J.
2W
CD
4ggMU
m
m
mgo0
-,1o.á
mo1m
3
m0mHHm4H
o
oo
ilH030w
oog2w
o11
m
ma)
ó
.n
imo,fóHW
o
Japan,China,Canada,
Korea Rep,Italy,France,USA,Sweden,Austria,Finland,Norway,Belgium-Lux,
Denmark,Switzerland,Spain,
Germany,Portugal,Netherlands,UK,Estonia,Saudi Arabia,Slovenia,
7185172
8,j
6
6-
0*
35
571512
1431
7728
0
2
6*
1
5
100*1
3
2665127
93
130
2300
9*
642
0
0
2153*
1e
g0
.33
728
54569
024
157
53108
0
651
20*0
9
487
2
7840*
0*
0*
298
270
*52
162
366
19
437 385*31
22238*
22
119''
11846
6
lg2
88
00
152
717
500
176
39
6
27
3447186168
27684190
34397
19308
65
2161615
1739975
9125
0
16991000
.
177
0
0
0
189
1
1
0
2690517841601
11241011
918
914790666
505378374
275226216
195151127
974436
36Czech Rep,Australia,El Salvador,Developed NEO,Developing NES,Total
1
0
7479
13
3*
47319
.
6
3015
5*
2*
i2950 2154
4
0
.
ló1826
0*
6S
1273
9
579
*21
554 437 416
118
400
63
352
.06
351 240
20
13
6259
63
3070
3115
1477
169
38674
Japan,Canada,China,Italy,
7663
89
1
52291747
6
1
2308
49
14220*
2524*
0*
001
60
314
0
519
149
162 293 337
153
36* 110
85
.*
152
4182
5g
835
16200
1212
.
2661017481699
1134France,Korea Rep,
Sweden,USA,Finland,Norway,Belgium-Lux,Austria,Germany,Switzerland,Spain,
022
0
366
0*
2
0*
17
lg
513
00
040*
0*6
689
27
0
34166513
1130
0*595
0*
6-
136
0
173'
18
349
31 32
74*
269
173143
88427
6
1714
0
223201
4%
.
370266
6
2324622
0
01
1
6
916885
738625616
577575519
275257234
Denmark,Netherlands,Portugal,UK,Slovenia,Czech Rep,
Saudi Arabia,Australia,Philippines,Turkey,Developed NEO,Developing NEO,
Total
60
7768
0*0*
3
2
170*
0*1430
7149
6
2357
*
6*
605
2545
1*
0
2572
257
0
10
17
00*0*
8
1
1689
ó*3
914
2
830
3o0
528
19
338
2
6
492
5
208
5
41*
57
635
021
110
368 236
1348095
493
32
2i6
7350
0
14
2844
141139137
645536
322219
745
718
38823
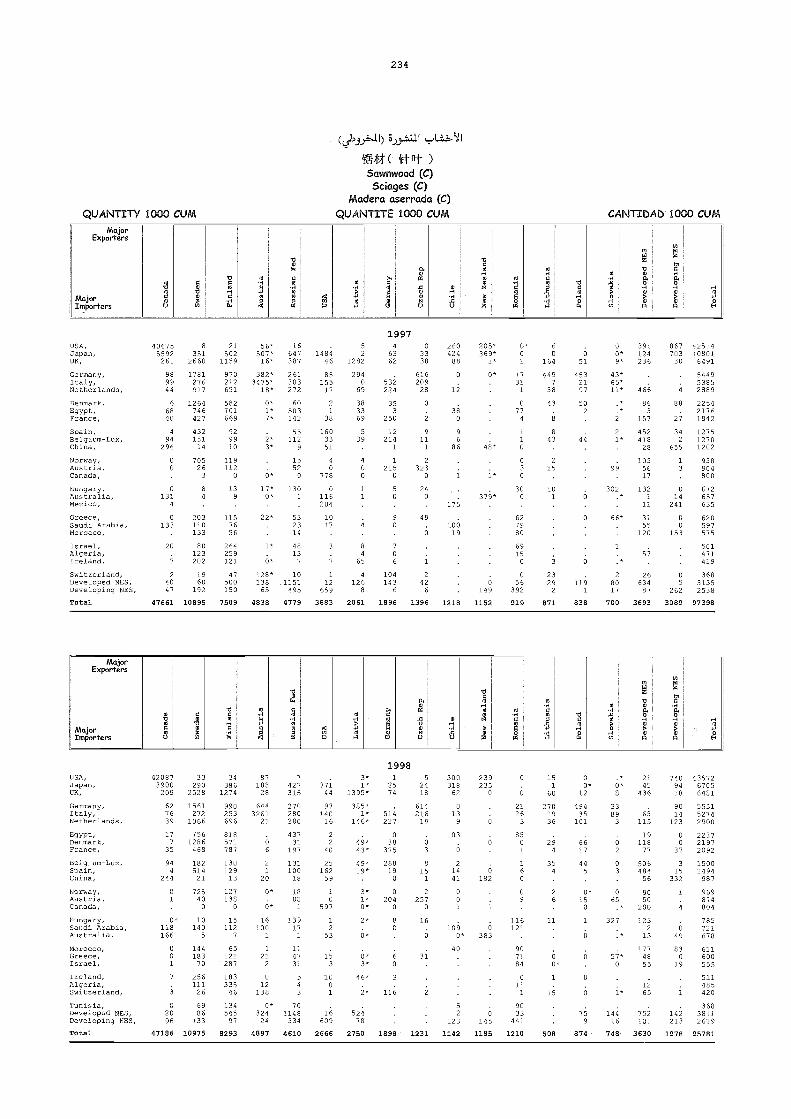
234
1997
52418
614216
19
3
13
? )250
16
6
31
2
1231
MajorExporters
MajorImporters
0T4c,,u
0V5M
H0
s
XS
Vg00
.r1M0g Sr
M
5
rs
54
SitÚSiNU
0
4U
V00
H00N
0az
a
O
sV0MH0a
M.X
EH.
mWZV0Ó
>00
iM0.ÓH
En
HM
4-'oc.
MajorExporters
Si .v..
-o
g50, 0,
,o
oc,oWN
m-15
o.rtc00
'00
.
RIr,
..0
i'0a,
Yi
imc
..1
óH
NIajorImporters
0cou
21
2
H...w
000
g Os> -04M
0 100NU U
a0z
0
rq
4.0
45
ea81
5. oO Ó
ME
M,' '01E.
USA,Japan,
406755592
8351
21502
56*507*
16647 1484
52
4
630
33260424
205*369*
0*0
6
06
00*
391124
867703
4251410801
UK,
Germany,Italy,Netherlands,Denmark,Egypt,France,Spain,Belgium-Lux,China,
Norway,Austria,Canada,
Hungary,Australia,Mexico,
Greece,Saudi Arabia,Morocco,
Israel,Algeria,Ireland,Switzerland,Developed NES,Developing NES,Total
261
989994
66840
494
296
00
13(14
0133
20
i2
4047
47661
2660
1781276917
1264746427
432151
14
70526
3
84
203110133
80123202
1960
192
10895
1159
970212651
582701669
929910
119112
0
139
1157656
264259121
97500150
7509
16*
382*3475*
18*
0*1*7*
2*3*
17*0*
22*
1*
0*
128*13865
4838
387
261303272
60503142
55112
9
1552
0
1301
532314
4813
7
101151495
4779
46
8515517
21
38
1603351
40
778
0116204
1017
3
7
112
659
3883
1282
2940
69
383369
539
400
11
84
65
9
1268
2061
62
532229
353
251
12214
1
1215.0
706
104143
6
1896
38
616209
28
0
1!1
320
2(1
49
0
24
6
1396
88
0
12
380
96
86
178
10019
1218
1*
0*.
49*
379*
6149
1152
1
1731
1
077
4
1
10
030
300
627980
6915
056
392
919
164
449
75 8
43
8
43
13
10
3
2329
2
871
51
4532197
502.
99
6
5
1191
838
9*
43*65*11*
*2
21*
99
302.*
66*
1
*
28017
700
236
466
863
157
452918
28
1055617
1321
11
3155
120
57
26634
87
3693
30
9
88
27
342
655
13
014
211
0
153
05
262
3089
6491
544953852889
225421761842
127512701202
958904800
672657635
620597575
501471419
36831352538
97398
300 239 0 15 0 21 740 43572318 235 1 0* 6: 45 94 6705
62 0 O 60 12 8 436 18 6481
0 21 270 494 33 . 90 553113 26 19 35 89 65 14 5274
9 D 3 36 101 3 115 123 2900
103 85 19 0 2237
65
1294 66
1762
11877
037
21972092
214 0
1
6354 94
503
506484
315
15001494
41 182 0 56 332 987
o o 2 0* 0 90 1 9690 9 6 15 65 50 8741 1 0 200 4 809
. 116 11 1 327 123 785109 0 121 2 6 721
0* 383 0 .* 13 49 678
40 90 177 83 61171 6 6 57* 48 60084 0* 0 55 19 555
0 1 0 51111 12 485
1 18 6 65 1 420
52 6
9033 75
.
14 4.
752.
142368
3811123 145 441 9 16 101 213 2619
1142 1185 1210 508 874 748 3630 1978 95781
1998USA, 42087 33 34 87 7 . 3* 1
Japan, 3900 290 386 188 427 771 1* 25UK, 209 2528 1274 28 315 44 1395* 74
Germany,Italy,Netherlands,Egypt,Denmark,France,Belgium-Lux,Spain,China,
Norway,
627639
177
35
944
244
0
1561272
1066
7561286468
18251421
725
990253696
818571787
13012913
127
6443261
21
0
2
20 1
0*
270280280
43731
197
131100
18
18
97140
16
22
40
25162
59
1
385*1*
146*
49*43*
49*19*
.
3*
.
51 4227
038
375
28819
o
0Austria,Canada,
Hungary,Saudi Arabia,Australia,Mor0000,Greece,
1
-
0*118166
00
400
10140
5
144183
1380
15112
7
65121
0*
16100
1
121
881
13917
1
1147
0597
12
53
15
1*0*
2*
6*
6-
2040
80
O
Israel, 1 70 287 2 31 3 3* 0
Ireland,Algeria,Switzerland,Tunisia,Developed NES,Developing NEO,Total
7
3
02096
47186
25611126
6986
133
10975
183335
46
134545
97
8293
012
138
0*324
24
4897
54
3
701148
534
4610
1001
16609
2666
46*
2*
52978
2750
3
116
1898
(4b.D.,11)
tt Fit )Sawnwood (C)
Sciages (C)Madera aserrada (C)
QUANTITY 1000 CUM QUANTITE 1000 CUM CANTIDAD 1000 CUM
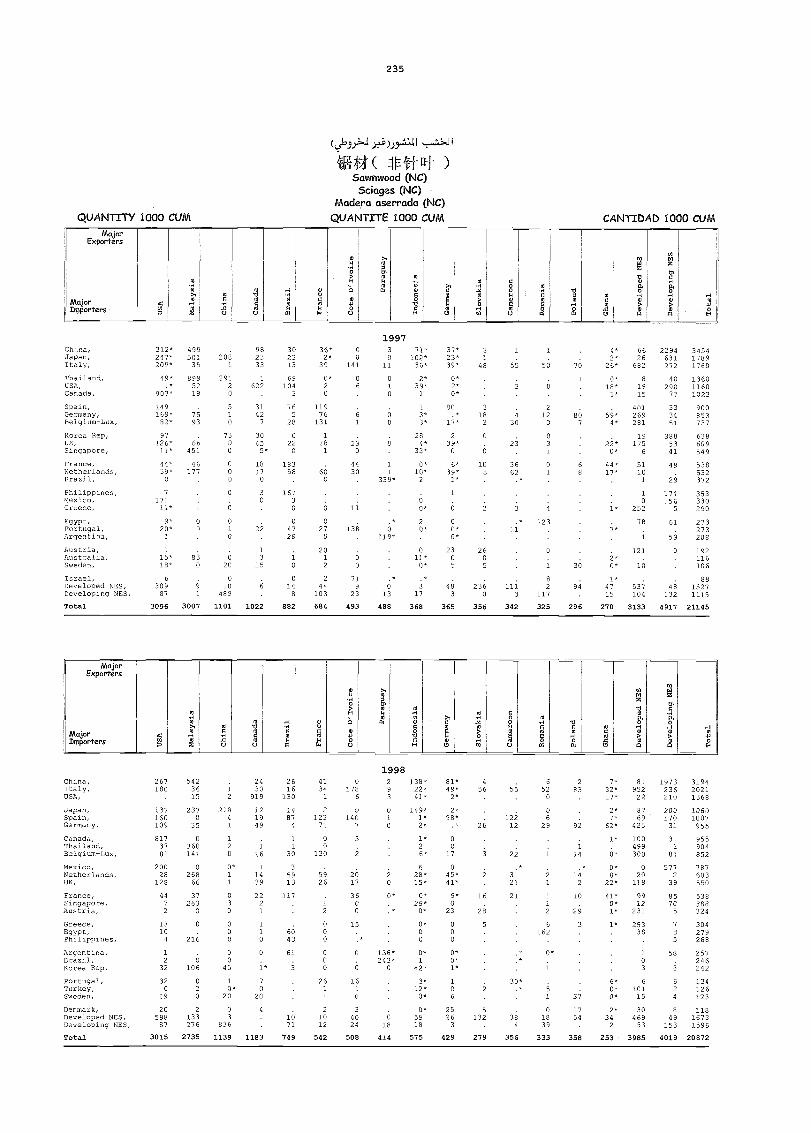
235
Vhf-4( llEÇJftI)Sawnwood (NC)Sciages (NC)
Madera aserrada (NC)QUANTITY 1000 CUM QUANTITE 1000 CUM CANTIDAD 1000 CUM
1997
1998
NlajorExporters
o
ow.o>H
mow
m. 46 44
m
'oW
mmzmo
*4
MajorImporters
O,g 4u
olo0ooL)
.0-aI!wa
'a
ou.119á o
oo
oH
>,oo
fi
e0
o
0
ooPIogU
oo -o
Oo-4
(5, )
Oo040
'51'Hoga
óH
MejorExporters
oA-1
> , eo1
H-1 8
o
oH
m
W0
A.;eoo
,o
o.em
Oo6
.orio
17o o
m
Voa,o
i0oAl
84H
Ma jorImortersp
o
Il
O-.44U
ooU
N
2M
1uW
15oU
olooH
iO0 11
00
o ;
U
asE0M
0H0
W
oo40
e
ta Ea'11O14
China,Japan,Italy,Thailand,USA,Canada,
Spain,Germany,Belgium-Lux,
Korea Rep,UK,Singapore,France,Netherlands,Brazil,Philippines,
312*247*209*
49*
907*
149169*
82*
97126*
11*
44*39*
O
7
499501
35
8995219
.
7593
.
66451
46177
2081
29125
51
O
73O
0
0O
0
O
982333
1
622
3142
7
3045
5*
1817
0
3
302313
69104
3
76
A
AO
18358
167
36*2*
39
0825
11976
131
1
281
60O
00
141
06
61
130
4430
3 71*0 102*
11 36*
S 2*1 39,0 1
1O 3*0 3*
286 4*
33*
1 0*1 10*
339* 2
37*23*39*
0*2*0*
80*
1'7*
239*
o
6*39*
1*
2
48
318
2
O
6
103
1
55
430
23
3662
1
50 70
13O
80
31
61 8
4*2*
26*
0*18*
1*
59*4*
22*0*
44*17*
6626
682
8
1915
401269281
19275
6
5110
I
1
2294631272
40290
77
333451
3885341
49
29
171
345417891760
136011601023
900853737
638609549
538532372
353Mexico,Greece,
Egypt,Portugal,Argentina,Austria,Australia,Sweden,
Israel,
17111*
9*20*
1
1
15*18*
6
1
O
O
830
6
01
O
O
20
O
O
22
1
315
3
S 6
O O
47 2728 0
20
1 2
21'21
11
138
60
71
.*O
119*
00*
0 *
011-
0*
00*0*
23o5
26o5
3
11
' 4
123
.
S 30
8
i'.
2*0*
1*
0252
78
1
121
10
.
1565
61
59
0
.
330290
273273208
192116106
88Developed NOS,Developing NOS,Total
30987
3096
91
3007
10489
1101
6
1022
8
882
44103
684
923
493
O
13
488
1?7
368
48
365
2360
356
1113
342
99 2117
325 296
4715
270
537104
3133
48132
4917
15271115
21145
China,Italy,USA,
Japan,Spain,Germany,
Canada,Thailand,Belgium-Lux,Mexico,
267180
137160109
8173781
200
5423615
237
535
0360141
0
.
12
21841
12O
0*
2430
919
121949
1
16
1
2616
130
1487
4
1
31)-
3
4134
1
212371
0O
130
0178
6
5140
7
3
2 3
293
01
138*22*41*
249*1*2*
1*26*
6
81*49*
2*
2*98*
0
19/
0
456
.
26
55
12212
22
.*
652
O
O
83
92
114
.
7*32*17*
2*7*
62*
1*.
8*
0*
81952
22
8769
425
100499300
0
1973236210
200170
31
311
81
577
319420211368
10601007
955
955904852
787Netherlands,UK,
France,Singapore,Austria,Greece,Egypt,Philippines,Argentina,Brazil,Korea Rep,
Portugal,Turkey,Sweden,
Denmark,Developed NES,Developing NOS,
Total
28128
447
2
1310
A
1
3
32
1(9)
20598
87
3015
26866
37263
0
0
216
.106
20
0
2133276
2735
11
030
000
00
45
10*
20
03
836
1139
1439
2221
1
10
0
1*8
70
20
4
1183
5913
117
6043
61
3
1071
749
5926
5
O
00
0O
0
2.6
1
21012
542
2017
3600
15
.*
0
O
1610
34024
508
28*20
0*
136*243*
0
018
414
15*
0*29*
0*
O*0O
0*
42*
3*12*
0*
0*5918
575
45*41*
9*
A00O
0*0*1*
106
2526
3
429
2
16
28
5
2
5132
279
3121
21
30*
384
356
242
1
i1
2
16
0*
.
5I
01839
333
1.,
2
10
29
3
.
1i
1754
358
8*22*
41*0*1*
1*
.
.
6*0*O*
2*34
2
253
126
20119
9912
231
25338
1
O
3
6101
15
30469
53
3985
239
8570
5
78
5
58
624
849
153
4019
603550
538368324
304279268
257246
134
123
11816731596
20872
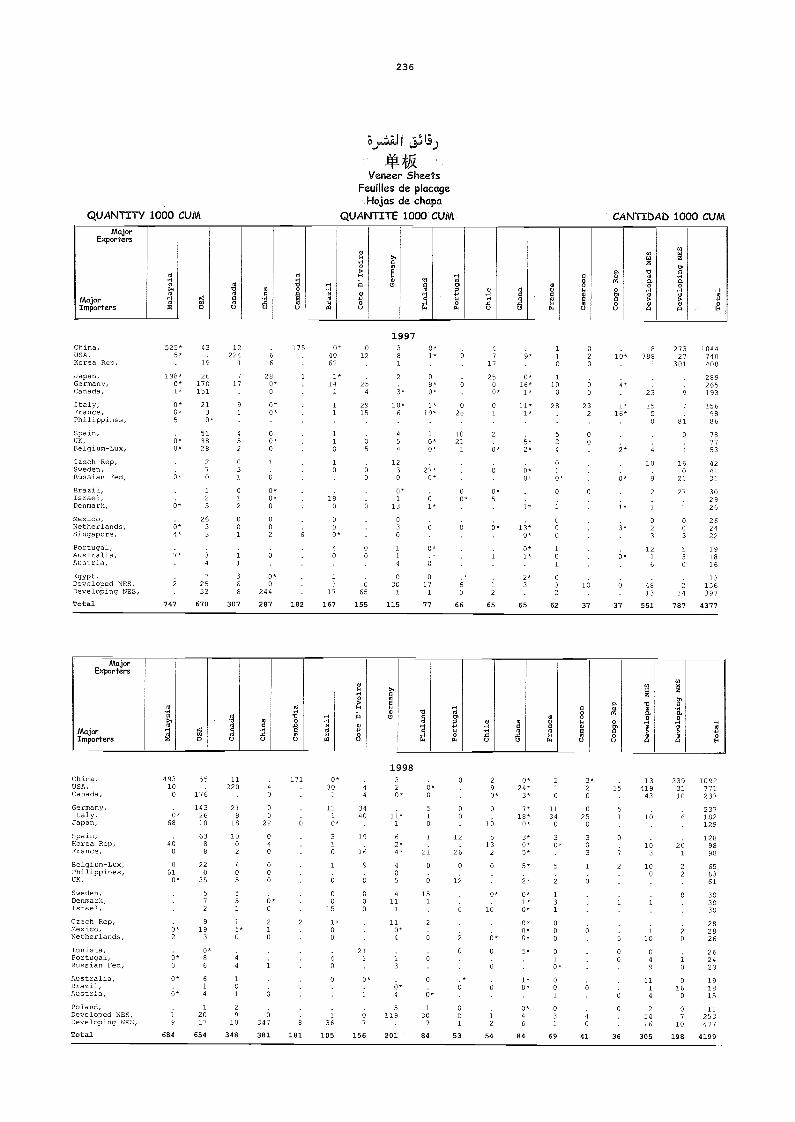
236
1997
1998
MajorExporters
MejorImporters
.-e.> ,o
1 ;
omu
eo-1.0u
'-i-a
m
44
-fiOu
,,.E'o
wo 71o
.ii,
.,?,N
á
wHH.0u
ea
Ao 5.
.oo1.1
eEu
0,á11,00u
(-0wzlióHO
,ta
R.o
.,1
óHw>.n
H0
-NoN
MajorExporters
2-a
?
>,..fi
i-.
m51zm.
MejorImporters
0..-1
l'..0, A
M0.u
00.ri4U
H H
N.Na
H
Ì=I
EoU
e0
V00H.
...1[4
,MM
.1.á U
OO4.4.Eu
ri0M.oU
wP.OH'1w o
-1
g.H
Ea
H11o
4-.
China,USA,Canada,
Germany,Italy,Japan,Spain,Korea Rep,France,Belgium-Lux,Philippines,UK,
Sweden,Denmark,Israel,Czech Rep,Mexico,Netherlands,Tunisia,Portugal,Russian Fed,Australia,Brazil,Austria,Poland,Developed NEO,Developing NEO,
Total
49310
O
0*68
40o
061
0*
0*0
0*
0*
19
684
55
176
1432610
638o
220
35
572
919
3
0*86
61
4
1
2017
654
11220
.
21
lglg
2
405
55
15*
44
1
1
2
lg348
.
4o
00
22
040
000
g'
1
6
6347
381
171
2
181
0*30
1
111
0*
310
1
0
00
15
1*00
40
0
1
36
105
.
44
3440
19
16
9
0
000
211
0*
1
o7
156
320*
li*
62*4*
405
111.
1
11O*4
13
4
1.].
201
0*0
510
1
21
0
6
151
2
6
6
0
6*
130
7
84
0
00
12
26
0
12
0
0
001
53
2
g *
0
10
112
0*
16
6*
0
6
j2
54
0*24*
3*
7*18*
0*
3*0*5*
5*.
2*
0*1*o-
0*0*o*
5*
1*o*
r6
84
21O
1134
O
30*.
5.
2
131
00o
01
O*
0o1
031
69
3*2O
025
O
303
1
6
0
4
0
41
1.
5
7
2
0o
6
0
36
13419
43
10
103
100
ló0
4
9
111
4
2
5416
305
3393110
6
201
22.
0
2o
10
016
o
07
10
198
1092771237
237182129
1289898
656361
303030
282826
262423
191815
11253477
4199
China,USA,Korea Rep,
Japan,Germany,Canada,
Italy,France,Philipp nes,Spain,UK,Belgium-Lux,
Czech Rep,Sweden,Russian Fed,Brazil,Israel,Denmark,
Mexico,Netherlands,Singapore,Portugal,Australia,Austria,Egypt,Developed NEO,Developing NEO,Total
525*5*
198*0*1*
0*0*5
0*
2
747
43
19
26170151
2130*
513828
27
125
26
3
4
72532
670
12224
1
7
17
91
452
031
012
001
366
307
6
280*0
0*0*
00*0
1
6
0*0*0
002
O'0
244
287
175
182
0*4062
1*14
1
1
110
10
10
0
g*
4o
1
167
O
12
254
2915
05
0o
0
0o
065
155
38
1
2
3*
10*6
4
54
123o
0*1
13
030
114
301
115
0*1*
09*0*
1*19*
10*0*
27*o*
O
1*
6
0*.*0
171
77
0
2g
1021
1
g*
0
66
47
17
2500*
01
2
0*
5
0*5
0*
1
12
65
0*16*
1*
11*1*
6-0-
13*0*
0*1*
2*3
65
o
110
5
28
524
01
o*
01
1
000
1
01
032
62
2
60
2;
10
37
4*
1*16*
2*
6*
3*
6*
37
8388
1
23
155O
9
10
9
2
i.
023
121
6
4813
551
27327
301
9
7
81
0
1
16o
21
27
1
003
130
214
787
1044740408
289265193
1569886
787753
424131
302926
262422
191816
13156397
4377
eo).:..Z.J I
ikVeneer Sheets
Feuilles de placageHojas de chapa
QUANTITY 1000 CUM QUANTITE 1000 CUM CANTIDAD 1000 CUM
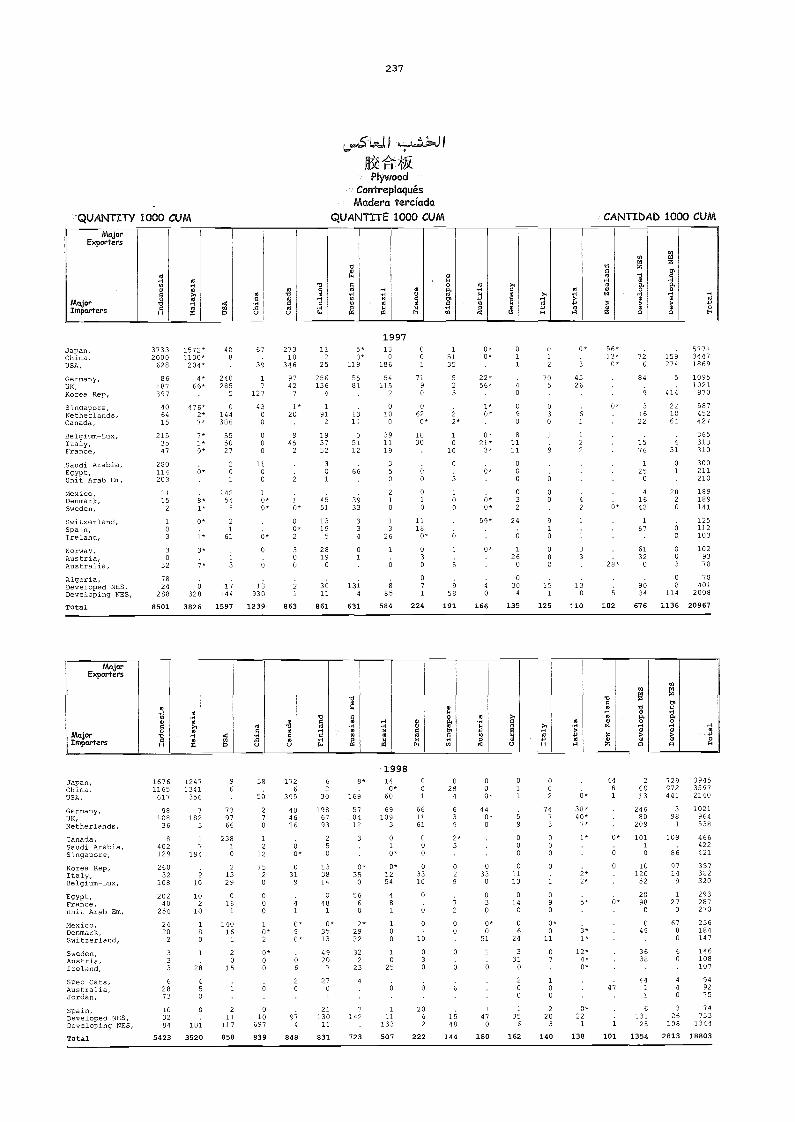
237
57711 159 3447274 1869
84 5 10951021
9 414 970
3 22 58716 10 45222 61 427
3651531376 A. 310
3002t 1 211
o 210
4 28 18916189O42 1411125
67 6 1120 103
61 0 10232 o
o 3 78
o 7890 8 40134 114 2008
676 1136 20967
1998
MajorExporters
mHN0
aae a'On
g0
k H
m
150
m
0
MajorImporters
gTH
i0,-
a ti
u
a
..-1
.
e .H
o
oo
o
,0
NlajorExporters
o.,-1oo a
roo
Tg
gE
ouo. g
o,o
TIoo'ilo
ivoó
imU.aao
MajarImporters
g
79oH
.oz
0oAu
v.2u
m.0,
-a*9
11 11.0a 1.1
w
0g,. i
wo
5,H2H
. N
wz
-ceá,o
-I
>'oo
"f i
-.Eo
Japan,China,USA,
Germany,UK,Netherlands,Canada,Saudi Arabia,Singapore,Korea Rep,Italy,Belgium-Lux,
Egypt,France,Unit Arab Em,
Mexico,Denmark,Switzerland,Sweden,Austria,
16761165617
98108
36
8402129
26032
108
20240
254
2420
2
33
12471341356
7182
3
17
194
210
102
10
1ao
1
96
739766
23810
21529
'ls1
14016
1
2
38
s6
27o
1
13
1520
ooo
1
0*2
0*o
1726
395
404626
O
O*
o31
9
.
4
5
0*90*
* o
30
62
1986793
25o
133814
o48
1
0*3513
4920
8*
119
57104
12
3
0*35
o
5:
o
2*2932
32
140*
60
69109
3
o1
0*
0*1254
4
e
1oo
1o
oo1
661161
ooo
o3310
o
' o
o1
10
o3
o28
4
639
2*3.
o29
72
oo
o
o00*
440*o
o
o
o30
0*
5?
0
V
9
ooo
o1113
o14
o
o
624
331
oo2
747
3
ooo
o.1
o
9o
0*o
11
o7
0*
38*40*
7*
1*
2*2*
V
12*4*
44a1
V
0*
' o
oV
V
V
V
26813
24680
209
101
1012052
2098
o
46
3638
729972441
398
1
109
86
9714
9
127
0
6780
60
394535972140
1021964538
466422421
397382320
293287270
236184147
146108
Ireland,Spec Cats,Australia,Jordan,Spain,Developed 9ES,Developing NES,Total
3
62873
103284
5423
29
45o
O
101
3520
16
211
117
858
o
' o
V
010
697
839
11
23 62o
V
V
974
848
7
27o1
21130
831
4
14'2
723
25
O
V
111
133
507
o
6V
2042
222
0
V
1848
144
0
4?-7
o
180
o
2oo
1
356
162
1oo
220
3
140
0*
0*22
0
138
4)
101
49
1
6131
28
1354
4
4o
326
108
2813
107
949275
74733
1344
18803
1997Japan,China,USA,
Germany,UK,Korea Rep,
Singapore,Netherlands,Canada,
Belgium-Lux,Italy,France,
Saudi Arabia,Egypt,Unit Arab Em,
Mexico,Denmark,Sweden,
Switzerland,Spain,Ireland,Norway,
37332000
628
86187397
406415
2153547
280114203
1115
2
1
O
3
3
1572*1130*
204*
4*66*
.
476.2*7*
7*1*9*
0*
9*1*
0*
1*5
3*
40a
240285
5
o144306
555027
2o1
14254
a
21
61
1
67
39
0
7127
4800
ooo
11oo
1
0*0*
V
0*
o
27310
346
9742
7
1*20
.
945
2
2
.
10*
00*2
3
112
25
256136
4
1
912
193752
3o1
.
4551
1319
28
5*0*
119
5581
.
1311
o5112
666
3933
334
o
13
186
54115
2
o10
o
391119
35o
21o
1
26
1
o01
719o
o62
O*
1030
o
o1
o
11180*
o
5
5135
525
.
22*
1o
10
o.
3
10o
V
0
1
0*0*
22*56*
1*0*
0*21*
3*
6*
0*0*
59*
V
0*
o
4
a1111
ooo
o32
24
0
26
O
1
2
705
3
4
0
9
0
O*
4526
61
122
4
2
1
i0
56*13*
0*
V
0*
0*
V
Austria, o 1 o 19 1 3 3
Australia,Algeria,Developed NES,Developing 9ES,Total
32
7824
288
8501
)*5
' o
328
3826
3
.
17144
1597
13930
1239
o
7 2
1
863
o
.
3011
861
.
13
631
O
B
85
584
o
o
1
224
9
58
191
4
0
166
o
C)304
135
q125
13o
110
28*
' 5
102
Pc*Plywood
ContreplaquésMadera terciada
QUANTITY 1000 CUM QUANTITE 1000 CUM CANTIDAD 1000 CUM
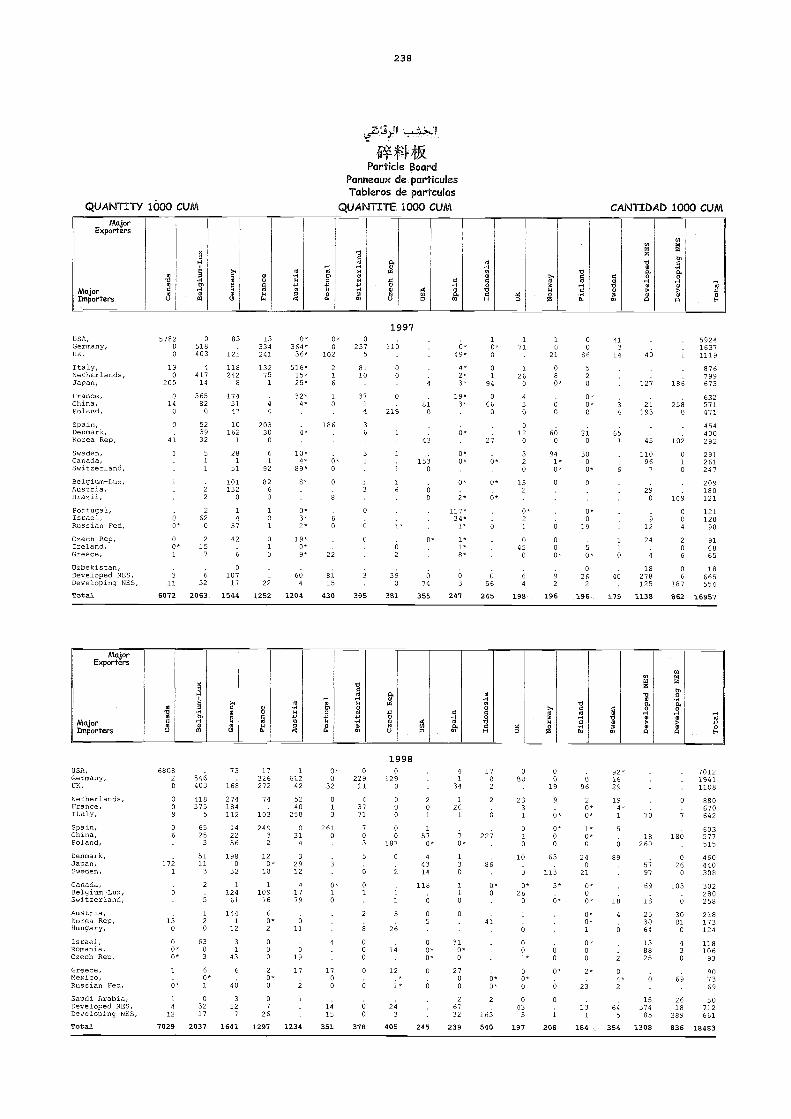
238
1997
1998
MajorExporters
ccO
TiS
mwzv
m
oo
MajorImporters
m
lil0mu m
,am
0u0mH
i..9mOa
0»'41.1
NP.4
g0NU
g y0H
.m
$A
Q
yom
,-1
..9W
04WM
a,
ó»-4
4)0
..,
óH. ,
MajorExporters
xoa
1 og-o
m
o0
MojorImporters
0Ts470re
u
11.10m
a,u.,,0á
Hoo.5m
á
m
t.r
kAoeNu
.. e0
00I,0H
a...0
0Z
laCC
Ho4
04i
0O.
.'4
'' 'aln
.4
.i.0
án
USA, 6808 73 17 1 0* 0129
. 4 17 0 . 92* 7012Germany,UK,
Netherlands,France,Italy,Spain,China,Poland,Denmark,Japan,Sweden,
Canada,Belgium-Lux,Switzerland,Austria,Korea Rep,
20
009
06
1721
6
13
546403
418375
5
6525
3
5111
3
2
5
12
168
274184112
142256
1981032
1124
61
144
12
326272
74
103
243
2
120*
10
110976
9 *
61242
5240
258
031
4
32912
41779
0
032
013
2610.
3
0*1o
22911
4
3771
703
5
9
01
2
0
0
189
0
2
1
1
5
.
.
201
1
570*
4
4314
118
6
05
89 134
1
261
-70*
1
3o
11
o
0.
02
2
6
227
86
0*o
41
2331
01
0
10
3
0*26
o
019
9
9*
0*o0
63
113
3*
9*
096
20*0*
1*0*0
240
21
0*00*
0*0*
1629
194*1
5
6
89
18
4
79
18260
.
5797
69
18
2530
0
i
189
026
0
103
6
3081
19411108
880670642
603577515
460440308
302280258
218173
Hungary,
Israel,Romania,Czech Rep,
Greece,Mexico,Russian Fed,Saudi Arabia,
0
00*0*
1
9*
1
0
6303
60*1
o
31
6
49
3
2
9 *0
0
11
019
17
3
1
A
170o
8
000
0
6
26
111
12
00*0*
0
ó
.
310*0
270o
2
9*0*
2
6
0
3*
9 *5
0
0*
6
0
1
0*00
2*.
23
6
2
04*2
64
138825
6
15
0
4
30
69
26
124
118106
93
907369
50Developed NES,Developing NES,Total
412
7029
3217
2037
527
1641
26
1297
.
1234
1415
351
00
378
2i
405 245
6732
239163
540
435
197
1
208
64 131
184
5
354
37485
1308
18289
836
712661
18483
USA,Germany,UK,
Italy,Netherlands,Japan,France,China,Poland,Spain,Denmark,Korea Rep,
Sweden,Canada,Switzerland,Belgium-Lux,Austria,Brazil,Portugal,Israel,Russian Fed,Czech Rep,Ireland,Greece,Uzbekistan,Developed NES,Developing NOS,Total
578200
130
205
014
0
0
41
1
1
00*
00*1
3
11
6072
0518403
4417
14
36582
0
523932
5
22
63o
2
157
.
33
2063
83
121
118242
8
1743147
10162
1
28
51
101132
0
1
516
42
6
0
10717
1544
15334241
13275
1
.4
4
20330
o
61
92
8260
1
01
010
1
22
1252
0*364*
36*
516*15*25*
32*4*.
.4*
10*4*
89*
8*
0*3*2*
19*0*9*
604
1204
0*
109
2
6
01
186
0*0
0
9
22
8115
430
2395
8110
37
4
36
3
1
6
395
119
00
0
219
i
1
1
16
°2
3,9
381
;I
810
43
1530
6o
0*
o74
355
0*49*
4*2*3*
19*3*
0*0*
0*.
2*
117*34*
1*
1*1*8*
63
247
*95
0
194
690
27
9*
0*
656
245
71
260
4
9
012
o
320
13
3*1
430
.
64
198
10
21
080*
00
69o
991*0*
0
.
000*
92
196
00
86
520
0*0*0
21o
300O
0
.
0*0
19
50*
026
2
196
41
14
4
q
6
1
1
0
49
179
49
127
21193
.45
11096
7
2.3
.
13
24
4
18278125
1138
1
186
2580
102
01
0
.
109
004
2o6
06
187
862
592416371119
876799673
632571471
454400292
291261247
209180121
121120
98
916865
18665554
16957
fli-ts4*Particle Board
Panneaux de particulesTableros de partculas
QUANTITY 1000 CUM QUANIIIE 1000 CUM CANTIDAD 1000 CUM
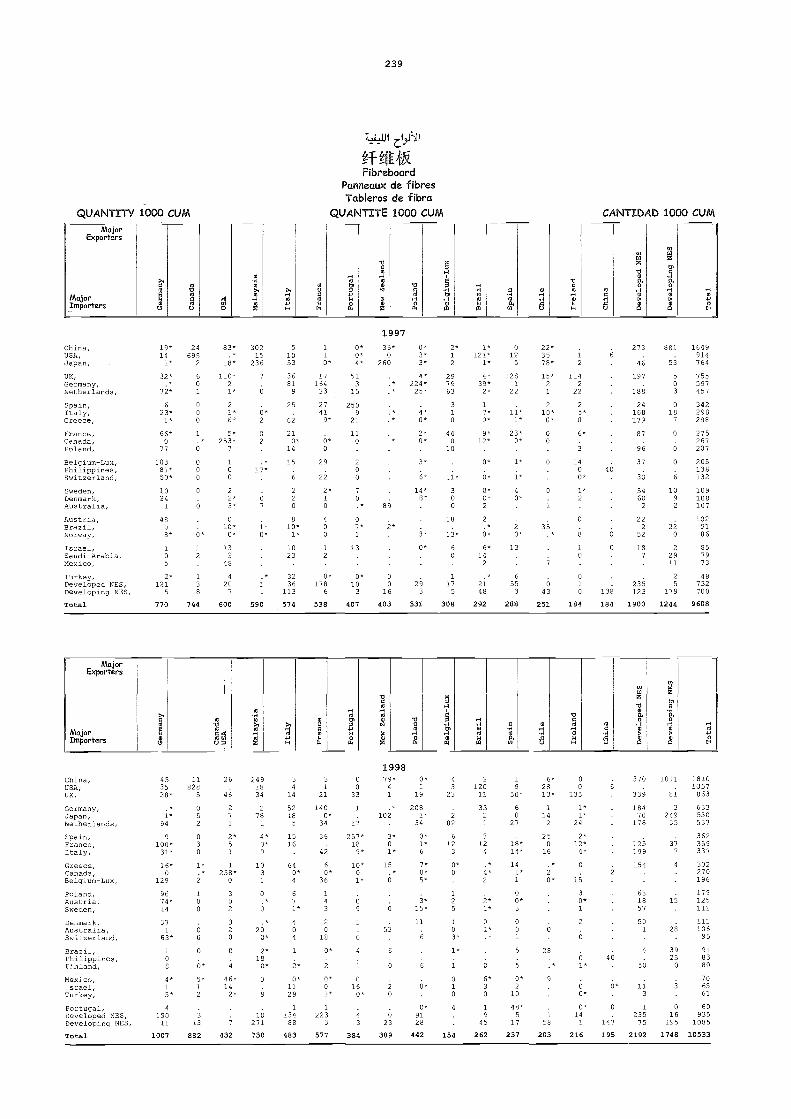
239
1997
1998
MajorExporters
o 1
y ro
V
E,o,
m.z.,...
MajorImporlers o0
.8oC
8
>.:
li
8
il
m,-PN0a
10
g,g
H-1
N0mm u
00,2H
00
:gO
04,80n
ÓH8wn
e .i0, 0,
E-.
MajorExporters
yCm
xoa
m
yio,o
MH
0
H00,
10 V HVg
0C.
Hg.
?IM
>1H
UC 8 N 0
0.11N
0H
0 H0
MajorImporlexs
H
g0
4-,H
NW
N
g grg 0
M
MHM O
2H U
:,,n 0n
China,USA,
4535
11828
26 24918
34
31
00
79*4
0* 4
32
1201
96*
280
S6
370 1011 18101057
UK, 38* 5 46 34 14 21 33 1 19 1123 50* 13* 135 339 81 863
Germany,Japan, 1*
05
27
278
5218
1400*
1 *
102208
1* 233
260 114
1*1*
18470
3
249633550
Netherlands,Spain,France,Italy,
94
9100*
31*
2
030
1
2*5I
1
4*0*0
5
1516
34
36
42
17
257*18
9*
3*
11 *
34
0*1*6
82
612
3
1
312
4
27
18*14*
2
25
16
29
2*12*
178
125199
35
3°,7
537
362359337
Greece,Canada,
Poland,Austria,
Denmark,Australia,
16*0
129
9674*14
37
63 *
1*.*2
1
00
00
1258*
0
3
02
320
10
1
0
.*20
0*
640*4
6
7 1*
9
04
Belgium-Lux,60*
36
1
43
20
18
10*01*
09
1
0
Sweden,Switzerland,15
0
53
7*0*5*
3*15*
11
6
0*0
1
25
103*
4*2
2*1*
0
141*
1
00*3
001
6
0
16
30'1
2
0
2159
681857
501
4
15
28
302270196
179125111
111106
95
Brazil,Philippines,Finland,Menino,Israel,Turkey,Portugal,Developed NEO,Developing NEO,Total
1
08
4*
3 *
4190
11
1007
0
6*
5*12
313
882
0.
9
46*14
2*
i432
2*18
0*
0
9
10271
730
1
0*1129
113488
483
0*
0*01*
1223
3
577
4
0
160*
4
3
384
6
0123
389
0*9128
442
1*
1
010
4
154
0
6*30
19
45
262
5
5
0*2
10
48*
11
237
28
53
203
01*
60*
0*14
1
216
40
0
14i
195
4
50
113
1
23575
2192
3925
0
6
016
195
1748
918380
706561
60935
1085
10533
China,USA,Japan,UK,Germany,Netherlands,Spain,Italy,Greece,
France,Canada,Poland,
Belgium-Lux,Philippines,Switzerland,Sweden,DenmarkAustralia,
19*14
1*
32*
*72*
6
23*1*
66*
97 7
10381*50*
1024
1
24695
2
601
0
00
1
.*0
000
0
83*.*
18*
110*2
1*
21*6*
5*253*
7
1
00
22*3*
30215
236
7
6
6-2
02.
..17*
07
51053
3681
9
25
62
210*
14
15
6
220
1
1
0*
17164
33
2741
9*
6*0
29
22
2*1
o
0*0*4*
513
15
2509
21
11o
200
7
0n
36.0
260
u
89
0*3*3*
4*224*25*
4*0*
2*0*
3*
,14*
8*
2*12
297963
70
44
16
.
11*
300
1'121*
1*
4*39*
2*
17*0*
9*12*
0*
6*
0*0*2
012
5
1281
22
11*1*
23*0*
1*
i*40*
22*3578*
15*21
210*
0'00
.
12
119
2
6*
3
14
ó *
22*
40
273
46
197
188
24168179
87
96
37
30
5460
2
881
53
503
018
7
0
6
0
6
10
3
1649914764
755597457
342298288
275267207
205138132
109108107
Austria,Brazil,Norway,
Israel,Saudi Arabia,Mexico,
Turkey,Developed NES,Developing NES,Total
48
6 *
105
2*121
s
770
0*
12
138
744
0
10*0*
132
48
420
7
600
1*0*
.*1
590
810*
1*
1023
3236
113
574
400
12
0*178
6
538
07*1
13
0*10
3
407
2*
00
16
403
3*
0*
29
331
18
13*
60
117
5
308
2.*0*
6*14
2
.*2148
292
20*
13
655
3
288
35
7
643
251
15
0
3
184
6
0
138
184
222
52
187
235123
1900
220
22911
2
141244
1029186
857973
48732700
9608
cy.,11
gitifRFibreboard
Panneaux de fibresTableros de fibra
QUAN ir/ 1000 CUM QUANTITE 1000 CUM CANTIDAD 1000 CUM
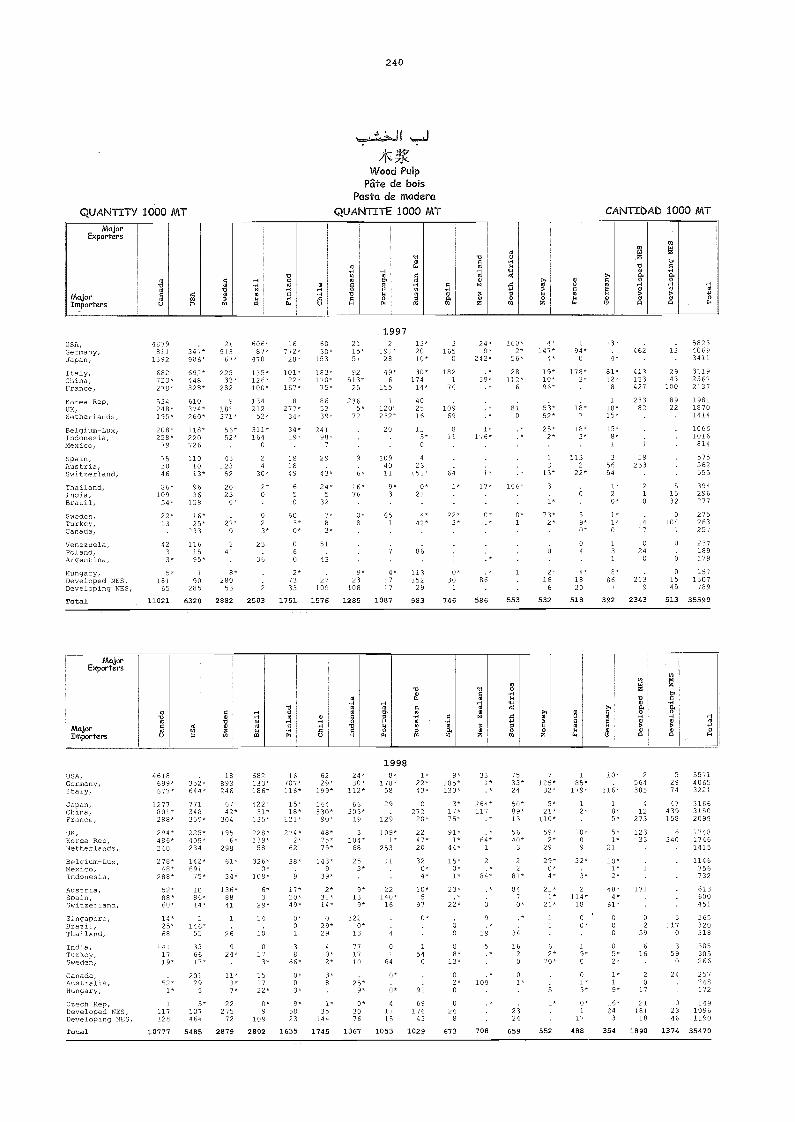
240
Wood PulpPate de bois
Pasta de madera
QUANTITY 1000 MT QUANTITE 1000 MT CANTIDAD 1000 MT
1997
1998
MajorExporters
'O
,g .
*0
o51Z0
Rm.
MV0. 0
-a0
,00,
00.. rT.0.
HM0N
SrWI
M 8W.M
(1)
C
H
H
M aorj00O
H0H
HH.0
1C 0
25
104 g 0
C
FIE0 F.,
0,T ,
00
Importers u w u N N R W z W z W 0 Q n E-1
MajorExporters
o0'O
yao
o
a
co
zenC
CH0
O H' SO 0
'g0
HHo
0MH00
0HM
g .W4
8. R0
H H2Maorj
Importers0,o a 14e o g g i 0z 4, rs
, .,
n0n o
04
USA,Germany,Italy,
4618699'677*
352*644*
18893246
682133*186*
16707*116*
6229'
199*
24'30*
112*
8*178*
58
1*22*43*
9*185*130*
331*.*
7533*24
7125*
32*
185*
179*
10*
116*
2564385
52974
557140653221
Japan,China,France,0K,
1277801*288*
294'
771348359'225*
6742*
304
195
422-131*135*
228,
15*18*
121*
274*
144530*
90*
48*
66303*
19
3
29
129
109*
o272
20*
22
3*17*75'91*
264*117
.*
.*
50*89*13
56
5*21'
110*
59*
12*
10*
1
8*5*
5*
412
273
123
47439158
6
316631502099
1748Korea Rep, 486* 405* 6* 139* 2" 75* 104* l' 47* 1* 64* 40* 2* o 1* 33 340 1746Netherlands,Belgium-Lux,Mexico,Indonesia,Austria,Spain,Switzerland,Singapore,Brazil,Thailand,India,
240
278*48*
288*
52*88*60'14*25*68
141
234
142*691
75*
1086*14*
1
146*55
33
298
61*
34'136*
8841
1
26
9
58
326*0*
108*
6*3
2*14
10
o
62
38*
9
17*20*49*
0*o1
3
39*
75*
143*9
2*31*14*
029*29
4
68
253*
9*13
9*
3220*
13
77
253
11
22140'
16
o
20
320*4'
10*s
97
0*
1
44*
15*0*1*
23**
22*
Io
o
1
2'84*
6
a
19
5
3
2
87.*
84
70-
39
1
29
29*0*4*
21*1*
21*
11
6
9
32*
3*
2114*
18
o0*
1
21
10*1*2*
48-4*
61*
ooo
o
171
o
59
6
3117
0
3
1415
1146756732
613600451
365320318
305Turkey,Seden,Canada,Australia,
1719*
52*
6617*
20129
24*
11*3*
173*
1517
a66'0'o
0*2*
3'a
1710
25*
614
0*2*54o
8*13*
o
,109
o
'13.*
2*70*
9*o
o1*
5*2*
1*1
16
20
590
24
305266
257248
Hungary,
Czech Rep,Developed 0ES,Developing 5ES,Total
1*
1117128
10777
5
5*107464
5485
7*
22275
72
2879
22*
0*
142802
3*
9*5823
1635
1*35
144
1745
9*
0*3076
1367
6*
4
15
1053
91
69176
43
1029
o
o26
a
673 708
2324
659
5
1*
552
3*
0"1
17
488
9*
16*24
3
354
17
21181
18
1890
02346
1374
172
14910961190
35470
USA,Germany,Japan,
4879811
1392
.
347*906*
21913
67*
606,87*
470
16772*28*
6030*
153
2115*51
2191*28
13*2010*
3165
0
24*0*
242*
160*2*
56*
4'147*
4*
1
94*0
13*
9*
.
462.
.
13.
582340693411
Italy,China,France,Korea Rep,UK,Netherlands,Belgium-Lux,Indonesia,Mexico,
Spain,Austria,Switzerland,Thailand,India,Brazil,Sweden,Turkey,Canada,
Venezuela,Poland,Argentina,Hungary,Developed NES,
682723*278*
534248'195*
208'258*79
753046
86*109
54*
22*13
4233'5'
181
692*448328*
610374'260*
118*220726
1101013*
9636
158
16*25*
233
1161595*
1
90
22533*
282
9181371"
56'52"
43123
52
2023
0*
27'o
241
8*280
135'126*100*
134212
52*
311*164
o
2
4*
9'
o
3*
25
36
101*22*
167*
a277*
34*
34*19,
.
181849
65o
603*0*
o6
o
2*73
183*170*75*
865339'
24198'
7
29
43*
24"5
32
7*a3*
51
43
.
27
92513'25
2365*
72
9
6*
16*76
0*8
9*23
49*6
1120232'
20
.
1094011
9*3
6
7
4"17
30*174
14*
402516
115*o
423
151*
0*21
4'42*
86
113152
182
76
.
10969
a11
.
69
1*
22"3'
0*30
.*39-
1*176'
17*
0*
86
28112*
6
816
106*
19*10-96-
53*52*
25*2*.
1
11*
3
1*
73*2*
2*16
178*2*
18*7
18*3*
1132
22'
6
59*0'
04
4*18
81*12*
8
110*15*
15*8*1
3
5654
1*20*
1*1*o
1
31
8*86
913133427
23382
.
1
59253
.
2
1 0
.1417
024
0
21:3
2943
100
8922
.
.
5
1532
0104
1
6
015
311925672137
198118701414
10661016
814
575562555
394296277
275263257
237189179
1571307
Developing NES,Total
65
11021
285
6328
53
2882
2
2503
10933
1751 1576
108
1285
17
1087
29
983
1
746 586 553
6
532
20
518
7
392 2343
95
513
789
35599
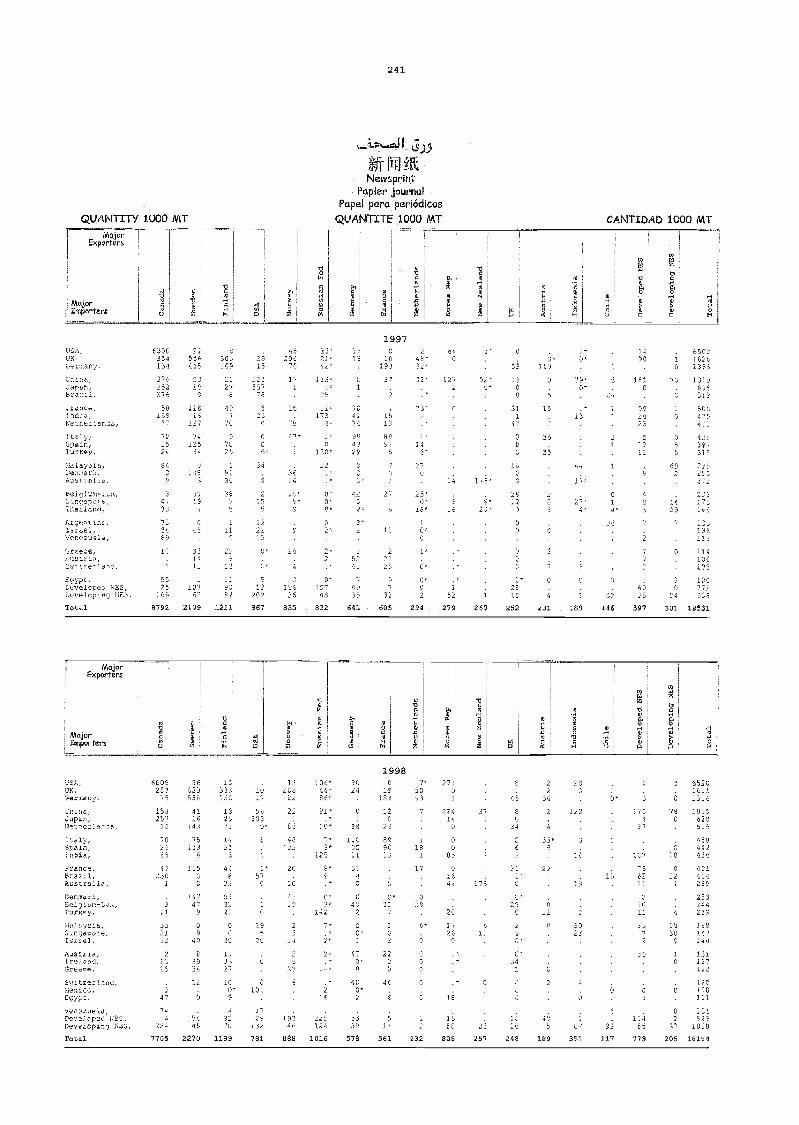
241
4'
o
, 189
Major FExportem
o
I
Ca ''g0
1
St
VC
.4 g
.M
1 0N '.-id
Vma
O,0-1a
CM
140 etl
0N
..-IW
4.0 0 OH
0H H
. Mor1 Importers
4..,,
t!,
T2ji .t.,
,t 2g 8
5.g
'm :q'' ;
le"
k-
...4
Au
w
ii'lo
w
ó
.0
. - -. _i_
Ahajorexporters
ad
o , ,
:
41
AII0jOrImporters
43AI.mU
4
'31
T00
V.MH0.r(W
.t
. ..
.-.
P4 ,
M
4
z'?
W
P, L,a
SI0al
M00
00..W
W
6)T0
'M
.I O 0
A4,fJA
2..M
1H
TI'4",M0
24
6Z N
ni
.11N
rd.1.-1
17000
V0H
.
. .
0 iHet I
..0U 1
W !
4 :
Vi0 .
04 :
,2 , !
?W
1=1
A
inCulal(,--I0
ft''.-Ñ
0
I
.,
1998USO,UK,Sermany,
600528775
25133538
15333131
1018
21882
106'44'86,
3024
C
:9183
7'5093
27101
E
42
2
54
24
0' 3.
0
652010112316
C511oa,apan,
Netnerlanoe,1,a13,Sp01n,
159257
16
702645
4116
143
75133
A
132571
1491
3
56102
0"
8
22
SC
48J2
21,
/0'7'
3"125
0
38
1112511
12C
23
899012
7
1
181
22414
0
00
85
37 e
24
2
8
23"5
123
2 1
111
117
'151537C 620. 115
458112
1° 435
t06111e,8raz31,
47230
1755
448
1'57
20 5' 51 17 016
5112
6362
012
431414
Acstralia7 32 0 IC ." 46 1 7i 13 11 259
Denmark,Beloium-L2A,
8Turcy,i..er'..74216,2-naapoic,0201.411,,
Auettia,
3021
2115
140449
09
40
839
833221
00
21
1133
O
196
21
5
4349
23
25
0'8'
14 2
7'
s :2'
2,L
041
2
00"1
449'
0"31
7
221
"?..,,
6'
0
0
2U,
1520
0
5
1'21
C
25:-_.
51
012
0 5322
1010
2372
4
/430
2e3244281
150107:44
121127
Greece,
Ovitierland,8iekico,LUYPI:,
Venezuela,Deve:opc,1 12111,Devaloptng 0040,
15
947
744
224
34
12
0
15445
27
100'9
4
92
70
C
101
1729
132
6
1924,
L2
15
222124
400'2
2250
46
6
11
G
0
1
2
.-
1
1C5E
0
2315LC
2
4.5
4.
if,
6
5
92
2
1C466
6
02
37
122
121108111
1114,24
1098
Total 7705 2270 1139 781 888 1016 078 561 232 806 257 248 189 351 517 779 205 18154
1997USA,03,Geimany,
0o.126,Japan,Hratil,Trance,lod:a,Netnetianee,11o10,Spaln,1217174v.
Naleytia,eicnmark,/4 41,114:4,
6200$54124
376352378
56159
37-,2
_524
84
",'
22856465
5215
1
11816
127/4
12534
o.48
i ,
91
8
30G169
2127
E
497
71
7029
1973C
98
.
2815
125557
70.
823
c
1
-1'"
34
!! '
452067(
1"1
.
16
-,E.
1
3114
15'
22'21'42'
153'
14173
2'.
1'
130,
127"
L
1713
L
:-
714174
491324
' ,.
51'
42
010
193
37
' 2
1513
8991
5
-,
1
27
24E'92'
22'
23'
146'
37
25'
540
1272
1
-4
8'
51"J'
1,.2,'
0
51
190O
31
.4,58
1100
28
119
0
15
85
31
11not6Lme, 4033
194 5
1;5 5
()
8' 2' 69'
18' 76:"
27'2
0 9
AtuFint7no,:trae:,Venezuela,Greece,Auetria,16..ttetT,6d,Sgypt,Develop:2 WES,Developing 111272,
7334
89
10
1
5121
165
045
32141.
-107
67
111
245.,
12920.4
122215
0'
513
202
24
4
7134
36
02'
2'2
9'19748
3'2
95241
.1
4135
!I i
2
2225
9
13
10'O
l'G-
0'C
2
."
1'42
.
1
00
.00
(.''2010
5
3
.4
0.4
Total 8792 2109 1211 967 835 822 641 605 294 279 260 252 231
lA . 65021 90 1 11921.1 0 1359
6 181 70 1970o . 651
f.) 51.5
99 50024 8 17123 4;:
2 5 0 4261 11 5 347
11 5 915
1 60 945-7. 2 35
272
0 4 2281 14 /784A 1 29 169
24 o 138nh118
7 0 1147 . 104
0
,
9
105
10062 0 171
02 25 94 534
146 597 301 1.8531
6).9
ifi- IYANewsprini-
Papier journalPapel para periódicos
QUANTITY 1000 MT QUANTITE 1000 MT CANTIDAD 1000 MT
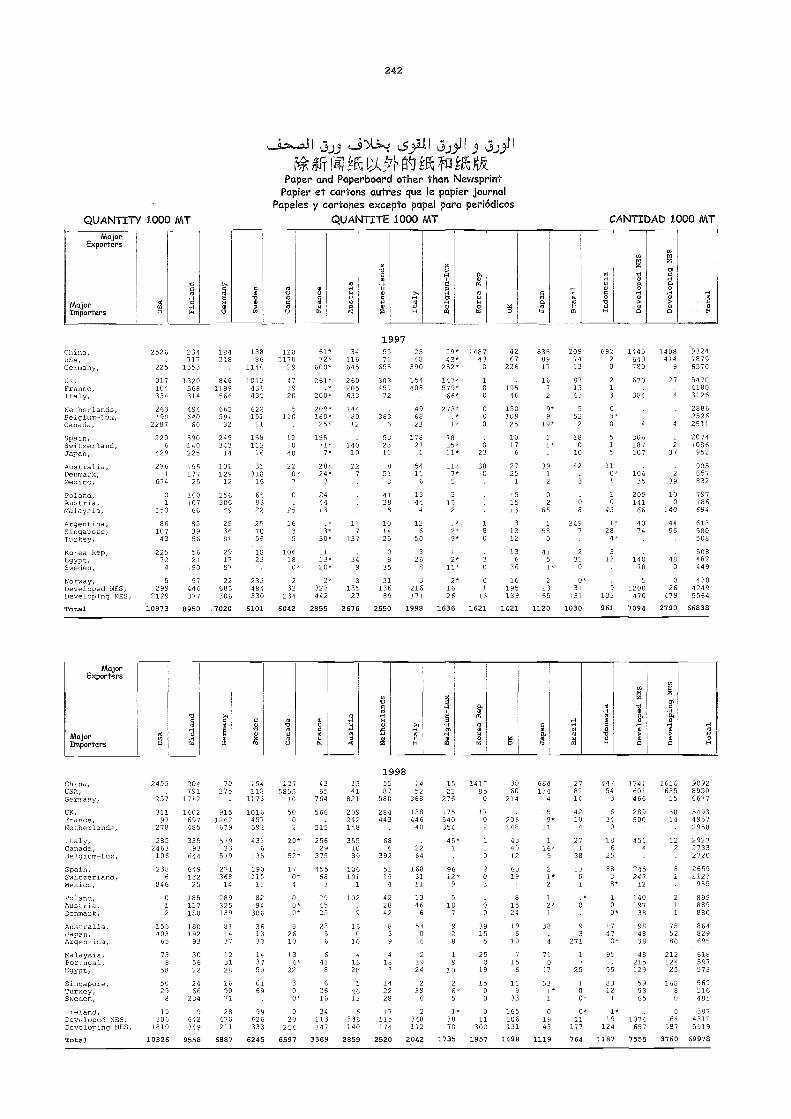
QUANTITY 1000 MT
242
3)3 j)k-:-,e L5.3211 J.»1( JJ3-1
Cli0A1V,M' )1
Paper and Paperboard other than NewsprintPapier et cartons autres que le papier journal
Papeles y cartones excepto papel para periódicosQUANTITE 1000 MT CANTIDAD 1000 MT
1997
1998
MajorExporters
MajorItilporters
11ogHo.5,
ou
úO
25,
o-w9-1,(0
g
0
-00z
>4H1 1H
14
oH0M
E
B 50
0
0
H
0
o..ig.
Bwzro
04
E0
Bwzoo--r04
1n
MajarExporters
MejorImporters
'O0o-0
-ao
w
9,0ofi
ou
ioou
oulau5,
oV,4.
.roCoV,o
:19
g
,,o
.1,
H
xo,
9
oo
-,1oHm
iofi
g
oo
44
H-aNg1.4
al
o.gOo
79O.
B
qio
10Il0
B
oo.ó,?on
H.0O
E.,
China,USA,Germany,
UK,France,Netherlands,Italy,Canada,Belgium-Lux,
Spain,Switzerland,Mexico,
Poland,Austria,Denmark,
Australia,Japan,Argentina,
2455
257
31197
278
2852463
106
2386
846
012
156403
65
204791
1712
1402697485
33593
644
64913225
185117180
180192
93
70275
.
9151262
679
57933
579
271368
14
289325139
811437
151112
1173
1016457592
4316
135
190115
11
8291
306
361333
1275855
10
50
2
20*
152*
170*4
00*0*
82610
4365
764
566
215
25629
375
45568
3
294525
2356
1341
821
209242148
3551089
106101
1
102.
9
150
10
5587
580
284443
.
686
392
5119
4
422842
839
1452
368
138416
40
2264
1683111
1346
6
53
16
1521
276
175540354
45*1.
9612*
9
518
7
92
8
141785
0
1702
11
0
203
0o
3915
s
3060
214
206148
4340
112
6019
1
81524
19
16
664134
4
159*
11
16 *9
2
2
1
38
4
278214
4210
4
27
38
1301
93
271
44754
3
634
0
186
25
8838*
100*
1747
0*
1741601466
289500
.
4514
245247
12
140197138
984838
1616 9092635 895015 6677
58 549314 4957
. 2958
12 29272 2733. 2720
8 26591 1123
. 955
2 899S 8891 880
75 86452 82980 695
Malaysia,Portugal,Egypt,
Singapore,Turkey,Sweden,
738
58
5029
8
305622
2466
234
123128
169071
113750
6169
.
131*
22
3
6 *
641
8
62616
41328
14613
418
7
142228
21924
39
1
910
26*5
250
19
1500
7156
11
33
71
1.-C7'
531*1
1
725
1
0
0*
95
95
8312
1
48215129
599365
21212425
16880
618597573
569516481
Ireland,Developed NES,
15306
19642
28470
99626
020
34113
6336
17115
2348
1*38
011
165106
019
0*11
1*19 1074
064
3874318
Developing NES, 1810 349 211 333 254 147 140 174 112 70 300 131 43 177 124 657 587 5619
Total 10326 9558 6887 6245 6597 3369 2889 2520 2042 1735 1957 1498 1119 764 1187 7555 3760 69978
China,USA,Germany,
2526
225
231717
1553
184218
.
13886
1146
1205170
29
61*72*
600*
34116645
5571
655
2548
390
29*43*
282*
148743
0
4267
226
6358917
2097413
692, 2
0
1445649780
1408414
9
932478796570
0K,France,Italy,Netherlands,Belgium-Lux,Canada,
Spain,Switzerland,Japan,Australia,Denmark,Mexico,
Poland,Austria,Malaysia,Argentina,
317104334
263190
2287
2206
429
2761
674
01
150
86
1320568314
494640
60
590140225
19517725
160107
66
85
8461199
566
663591
32
249343
14
101129
12
256306
49
29
1012431439
622151
11
158113
16
31318
16
658322
25
471920
5
110
12
4g
220*7
0
25
261*
200*
209*160*
25*
19571*
7*
28*24*
3
244413
260205633
1448012
14610
227
11
303451
72
3636
532311
8
513
4128
8
10
154408
.
496823
17827
1
5411
6
1344
4
12
147*579*
66*
273*.
7815*11*
11*7*5
315
2
100
000
623
380
1
.19546
15010925
1017
6
2725
1
151513
3
1672
9*
19*
1 1*
391
2
0
Eg
871343
.02
18
16
42
3
68
249
21
3
03*0
51
5
110*1
10
43
1*
670.
384
.
.
4
306187107
.
10435
209141
66
40
27.
4
.
9
1
237
239
100
140
44
547041803126
288625262511
20741086
952
905857832
797786694
613Singapore, 107 39 36 70
113* 7 14 8 12 58 28 74 580
Turkey,
Korea Rep,Egypt,Sweden,
43
22572
4
56
5621
190
81
291757
56
1825
.
5
10618
0*
30*
1113*20*
137
.34
9
25
08
35
5g
268
9*
1
2*11*
0
3
0
12
136
36
0
41
7 *
231
0
4*
313
.
14078
.
480
508
508482449
Norway,Developed 8ES,
5299
97444
22685
235489
232
2*327
8135
31136
3216
2*16
0
1
16195
213
0*31 9
51200
026
4304249
Developing NES, 2129 377 306 330 234 442 27 89 171 26 16 139 65 131 133 470 479 5564
Total 10973 8950 7020 6101 6042 2855 2676 2550 1998 1636 1621 1421 1120 1030 961 7094 2790 66838
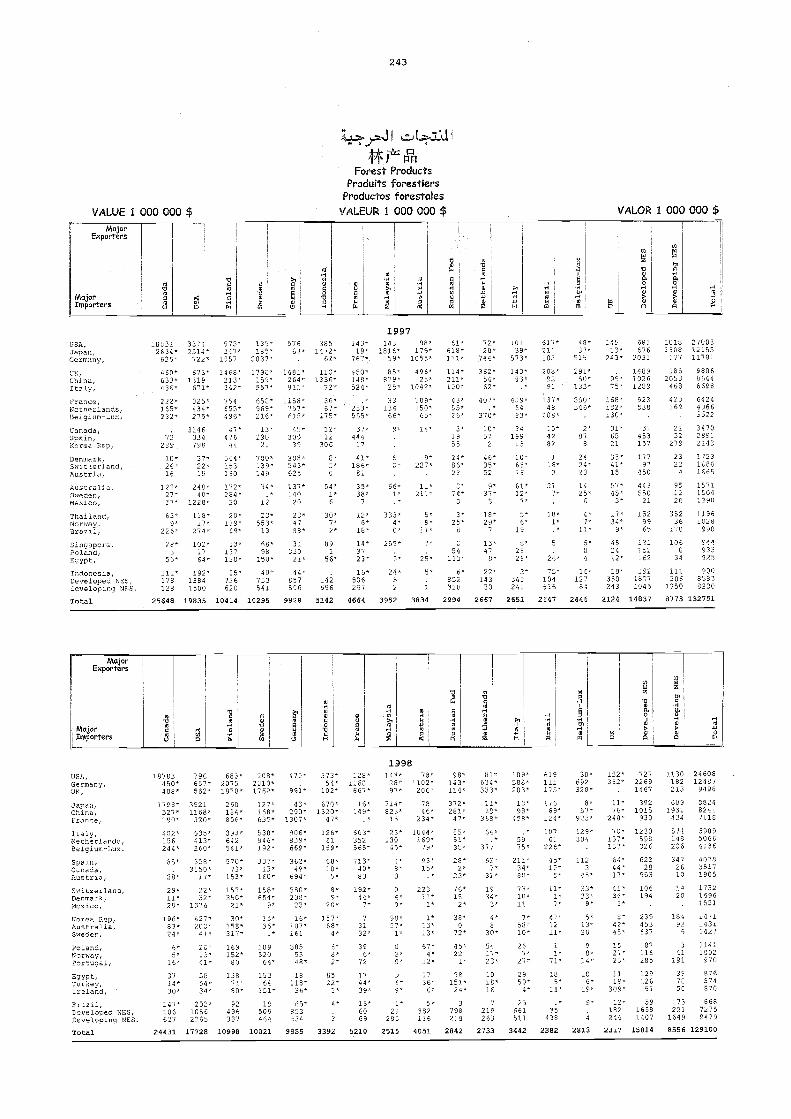
VALUE 1 000 000 $
ticForest Products
Produits forestiersProductos forestales
VALEUR 1 000 000 $
243
1997
1998
VALOR 1 000 000 $
AAejorExporters
MojarIMporters
nivm0mo
v..g
gw
V4
t%
>,.
2
Vr
8
g.g4ClC
V.-'8
EW
...C
.,1'i.na
g
g
'E.4H,oEw
p,, ,...I
-o
an."1
?a0
mN.,me
104H
in,0P
NkijorExporters
o se
. 5,o
,q
aAmog
ouce
a,%.,H
gg4..q
. m
n-0.
,?1,
N
.9Eo'-I
zm
1
'1E
'4.11Major
IMporters d . 0 ..:, g
.. . g
USA,Germany,UK,
Japan,China,France,
Italy,Netherlands,Belgium-Lux,
Spain,Canada,Auotria,
18783450*408.
1798'527'190'402'156244'85*
.
28'
796657*562'
35211168*320*
635"413'260*
378'3150'
17"
683'20751870.
260184'856*
393'642541'570'73,
153,
208*2210*1762"
127*158,635"
538'915'192'333713,
160'
170'
991'43,
200"1307'
906'839'669'362'49'
694*
373'54,
102.
670"1320'
47,126"
61159*
38'10*
5"
12E"1163
667'16'
149,
663'352565,713'40'83
043'28,97'
714,023'
15
23'13045'
0
78'1102'206'
7846'
234'1044'
169*79,
93,15'.'
98'143.114'372'281'47'
07'51"
28'2*
23,
Al,634*333'
11*30"
369'64'.'
377
62,7*
32.
109'588'203'
19'98'
959*
5975'
211'31'80'
619111195'
17569*
124,
10741
225*
45'1E"
5'
30*692329'
8'57/-
923'
129'304
1123
45'
152"332*
76"240"
70'177'137'
64'44"17'
72522691467
3921015
930
1230598326
62228
553
1130182213
6091931
124
514118206
3472610
24608124879496
882482417118
598950664136
407935171905
Switzerland,Denmark,Mexico,
Korea Rep,Australia,Sweden,
29'11'29*
196'83*24.
22'32*
1375
427'205*41,
157.350'21*
30'158'317'
158'-654*
9*
15"i
580'238'23.16'
161
8"9'
20'357'69*4'
192'44'7''
3132'
04'0
50'57'
1"
22311'1'1.
13,13'
76'152'
38*0
72.
1934'
4'8.
73"10'11
7'58"10'
11'l'7'
47'1211'
32*9'5'
13'20
2i''61'36'3'g"
42.15"
106194
.
239453637
1420
.
19992
9
173215961521
147111311427
Poland,Norway,Portugal,Egypt,
6'5'
16'
37
2.1*13'41'58
169152*
80
138
10952454.
153
3855348'18
8'2,
65
396*
72
17
02"
9
67.4'
12*
7
45.22
1.98
5417'23'10
267'
27,29
i1,
71'18
90.
14*
10
1527*23'
11
187116235
129
191
39
11411002
970
976Turkey, IA' 54, 71' 64 118* 22' 44* 51" 36, 151" 19, 50' 5, 6' 19' 126 70 274Ireland, 30' 34' 80, 151. 36* 1* 39' 9. 6, 24' 16 4, 11' 19, 309' 51 50 870
Brazil,Developed NOS,Developing NES,Total
147'106627
24431
232"10562265
17728
92496287
18996
19509464
10021
63'953534
9555
4*
3392
15"6069
5219
1*2 3
282
2511
5'382116
4051
3796216
2842
7219263
2733
25661511
3442
.'37
438
2382
9'4
2813
12'182214
2317
3916581407
15814
173221
1649
8556
86672759479
129100
USA,Japan,Germany,
JO,
196312634,
625.450"
3374251A*722*
673'
575,347"
1957
1468"
1351185*
2037*
1790'
37663'
1491'
3851472'
62.
113'
143.19'
767'450'
1815"59'85'
99.179'
1055'
495'
61'618'111'114'
29'744,362*
10139'
573'193-
617*211203
208'
48'33.
115
291"
14512'
243..
581576
2031
1499
10181308177
186
270031215511781
9806China,Italy,00a20e,Netherlands,
633'436'222'105-
1319671'325'434'
213"242'759055'
i557'653*969"
264'313,"
1158'757'
1335"73,
30.67.
148'524'
233*
879'25'33
134
25,1042,
189'150"
211,100'
43"55'
54*62'
407'
83*
929*64
9291
137"48
50'133'750"346'
95'75'
169"182*
10261289
923538
2053468
422169
86446698
64244966
0elgium-2.oz,
Canada,Spain,Korea Rep,
Denmark,Switzerland,Austria,Aostralia,Sweden,Mexico,
Thailand,Norway,Brazil,Singapore,Poland,Egypt,
Indonesia,Eevelopeo 00,1,2eveloping 140G,
Total
232'.
72299
10'26.16
122'27,37'
63'9'
225'
28*3
55"
111,173128
25648
275*
3116334798
37'22,15
240'40'
1226*
118.17,
279,
102"1764*
192'13841500
19835
496,
47*476
44
354,153130
172'284'20
20*1139"
19"
33'137138'25'
736620
10414
216'13'
29021
700'139,149
34'.'12
553-13
69'98
150'40'
753541
10295
615*
45'309
39
208*S42,625
137'14020
23*4788'31
33021'44'
85759.5
9828
175'12,12
306
0"50
54'1'6
30'7'2.
891
56*
142696
5142
565,37*
49917
41'186*
81
35*38*
7
12'6'
18'14*3723*
16'535297
4664
66"
.
.
6
66'l'.'333'
4'0,
255'
5'24'
3952
65.
14'
9'227'
11'211,
.
5'9'
11"
7'
25,
5'i
3834
25'3'
1955
24,86'23
254
113'
6'852310
2994
370*
10*57
2
45,25'52
9'37'
3
19*29'
7
13*479'
22'14330
2667
93,
34199
15
10'63'76
61'12,
7"
5'6'
19
8'2525'
"342241
2651
208'25'4202
1
16,3
21
1
5
2.75,
104516
2E47
2"07
8
2424.23
1425'
6
4'7'
IT'
4
15'127
84
2446
.136'31,6521
33"41*18
57.45'3'
17*34*
9"
482412'18.
350243
2124
.
3:453157
17797
450
943750
21
1529965
131152162
19219371045
14837
.
2132
279
2323
4
951220
35236
170
1060
34
111306
1350
8773
3522
347029912113
172310061665
157115011390
11961528
990
941933923
90685938230
132751
171Sales and Marketing Group, Information Division, FAOViale delleTerme di Caracalla,00100 RomeMalyTel.: +39 06 57051 -Fax: +39 06 5705 3360E-mail: [email protected]
'::/ihi.ERE T.1) PURCHASE FAO PUBLICATIONS LOCALLYPOINTS JOE VENTE DES PUBLICATIONS DE LA FAO
PUNTOS DE VENTA DE PUBLICACIONES DE LA FAO
ANGOLA CHINA Mundi Prensa Libros S.A. HUNGARY
Empresa Nacional do Disco e de China National Publications Castellò 37.28001 Madrid Librotrade Kft.
Publicapbes, ENDIPU-U.E.E. Import & Export Corporation Tel.: +34 91 436 37 00 PO Box 126, H-1656 BudapestRua Cirilo da Conceicâo Silva, N°7 16 Gongti East Road, Beijing 100020 Fax:-i-3491 575 39 98 Tel.: +36 1 256 1672
C.F. IV° 1314-C, Luanda Tel.: +8610 6506 3070 SitioWeb:www.mundiprensa.com Fax: +36 1 256 8727Fax: +86 10 6506 3101 Correo electrónico:
ARGENTINA E-mail: [email protected] libreria@ mundiprensa.es INDIA
Librería Agropecuaria Mundi Prensa - Barcelona Allied Publisher Ltd
Pasteur 743, 1028 Buenos Aires COLOMBIA Consejo de Ciento 391 751 Mount Road
World Publications S.A. INFOENLACE LTDA 08009 Barcelona Chennai 600 002
Av Córdoba 1877, 1120 Buenos Aires Calle 72 NI 13-23 Piso 3 Tel.: +34 93 488 34 92 Tel.: +91 44 8523938/8523984
Tel./Fax: +54 11 48158156 Edificio Nueva Granada Fax:+34 93 487 76 59 Fax: +91 44 8520649
Correo eléctronico: Santafé de Bogotá E-mail:
[email protected] Tel.: +57 1 2558783-2557969 FINLAND [email protected]: +571 2480808-2176435 Akateeminen Kirjakauppa Subscription EWP Affiliated East-West
AUSTRALIA Correo electrónico: Services Press PVT, Ltd
Hunter Publications [email protected] PO Box 23, FIN-00371 Helsinki G-I/16, Ansari Road, Darya Gany
PO Box 404, Abbotstord, Vio. 3067Tel.: 61 3 9417 5361 CONGO
Tel.: +358 9 121 4416Fax: +358 9 121 4450
New Delhi 110 002Tel.: +91 11 3264 180
Fax: 61 3 9419 7154E-mail:[email protected]
Office national des librairiespopulaires FRANCE
Fax: +91 11 3260 358E-mail: affiliat@ nda.vsnl.net.in
B.P. 577, Brazzaville Editions A. Pedone Oxford Book and Stationery Co.
AUSTRIAGerold !Such & Co.Weihburggasse 26, 1010 Vienna
COSTA RICALibrería Lehmann S.A.Av. Central, Apartado 10011
3, rue Soutflot, 75005 FansLavoisier Tec & Doc14, rue de Provigny94236 Cachan Cedex
Scindia HouseNew Delhi 110001Tel.:+91 11 3315310Fax: +91 11 3713275
BANGLADESHAssociation of DevelopmentAgencies in BangladeshHouse No, 1/3, Block FLalmatia, Dhaka 1207
1000 San JosèCINDECoalición Costarricense de Iniciativasde DesarrolloApartado 7170, 1000 San JoséCorreo electrónico:
Mél.: [email protected] Web: www.lavoisier.frLibrairie du commerce international10, avenue diéna75783 Paris Cedex 16Mél.: [email protected]
E-mail: oxford @vsnl.comPeriodical Expert Book AgencyG-56, 2nd Floor, Laxmi NegarVikas Marg, Delhi 110092Tel:+91 11 2215045/2150534Fax: +91 11 2418599
BELGIQUE [email protected] Site Web: www.cfce.fr E-mail: oriental @ nde.vsnl.net.in
M.J. De Lannoy202, avenue du Roi, B-1060 BruxellesCCP: 000-0808993-13Mél.: [email protected]
CÖTE D'IVOIRECEDA04 B.F. 541, Abidjan 04Tél.: +225 22 20 55
WORLD DATA10, rue Nicolas Flamand75004 ParisTél.:+33 1 4278 0 578Télécopie: +33 1 4278 1472
Bookwel IHead Office:2172, Nirankari Colony, New Delhi- 110009Tel.: +91 11 725 1283Fax: +91 11 328 13 15
BOLIVIALos Amigos del LibroAv. Heroinas 311, Casilla 450Cochabamba;Mercado 1315, La Paz
Télécopie: +22521 72 62
CUBAEdiciones CubanasEmpresa de Comercio Exteriorde Publicaciones
GERMANYAlexander Horn InternationaleBuchhandlungFriedrichstrasse 34D-65185 Wiesbaden
Sales Office:24/4800, Ansari RoadDarya Ganj, New Delhi -110002Tel.: +91113266786E-mail: [email protected]
BOTSWANABotsalo Books (Pty) LtdPO Box 1532, Gaborone
Obispo 461, Apartado 605, La Habana
CZECH REPUBLICArtie Pegas Press Ltd
Tel.: +49611 9923540/9923541Fax: +49611 9923543E-mail: alexhorn1 6i aol.comS.Toeche-Mittler GmbH
IRA/VThe FAO Bureau, Internationaland Regional SpecializedOrganizations Affairs
BRAZILFundacao Getúlio VargasPraia do Botafogo 190, C.P. 9052Rio de JaneiroNúcleo Editora da UniversidadeFederal FluminenseRua Miguel de Frias 9Icarai-Niteroi 24220-000 Rio de JaneiroFundac5o da UniversidadeFederal do Paraná - FUNPARRua Alfredo Buf rem 140, 30'andar80020-240 Curitiba
mport of PeriodicalsPalac Metro, PO Box 825Národnf 25, 111 21 Praha 1
DENMARKMunksgaard, DirectOstergate 26 A- Postbox 173DK- 1005 Copenhagen K.Tel.: +45 77 33 33 33Fax:+45 77 33 33 77E-mail: direct @ munksgaarddirect.dkURL:www.munksgaardirect.dk
ECUADOR
VersandbuchhandlungHindenburgstrasse 33D-64295 DarmstadtTel.: +49 6151 336 65Fax:+49 6151 314 043E-mail: [email protected]:www.booksell.com/triopsUno VerlagPoppelsdorfer Allee 55D-53115 Bonn 1Tel.: +49 228 94 90 20Fax:+49 228 21 74 92E-mail: unovedag @aol.comWebsite: www.uno-verlag.de
Ministry of Agriculture of the IslamicRepublic of IranKeshavarz Bld, M.O.A., 17th floorTeheran
ISRAELR.O.Y. InternationalPO Box 13056, Tel Aviv 61130E-mail: [email protected]
ITALYFAO BookshopViale delleTerme di Caracalla00100 Roma
CAMEROUNCADDESCentre Africain de Diffusion etDéveloppement SocialB.P.7317, Douala BasasTél.:+237 43 37 83Télécopie; +237 42 77 03
ibri Mundi, Librería InternacionalJuan León Mera 851Apartado Postal 3029, QuitoCorreo electrónico:librimul @ librimundi.com.ecUniversidad Agraria del EcuadorCentro de Información AgrariaAv. 23 de julio, Apartado 09-01-1248
GHANASEDCO Publishing LtdSedco House, Tabon StreetOff Ring Road Central, North RidgePO Box 2051, AccraReadwide Bookshop LtdPO Box 0600 Osu, Accra
Tel.: +39 06 5705 2313Fax: +39 06 5705 3360E-mail: publications-sales @fao.orgLibreria Commissionaria SansoniS.pA. - LicosaVia Duca di Calabria 1/150125 FirenzeTel.: +395564831
CANADARenouf Publishing5369 chemin Canotek Road, Unit 1
GuayaquilLibrería EspañolaMurgeón 364 y Ulloa, Quito
Tel.: +233 21 22 1387Fax: +233 21 66 3347E-mail: readwide 16 africaonline.cpm.gh
Fax: +39 55 64 12 57E-mail: [email protected] Scientifica Dott. Lucio de Biasio"Aeiou"
Ottawa, Ontario K1J 9J3Tel.: +1 613 745 2665 EGYPT GREECE Via Coronelli 6, 20146 Milano
Fax:+1 613 745 7660E-mail: renouf @fox.nstn.caWebsite: www.renoufbooks.com
MERICThe Middle East Readers' InformationCentre
Papasotiriou S.A.35 Stournara Str., 10682 AthensTel.: +30 1 3302 980
JAPANFar Eastern Booksellers
2 Baghal Aly Street, Appt. 24 Fax: +3013648254 (Kyokuto Shoten Ltd)
CHILELibrería - Oficina Regional, FAOclo FAO, Oficina Regional para AméricaLatina y el Caribe (RLC)Avda. Dag Hammarskjold, 3241
El MasryTower DCairo/ZamalekTel.:+202 3413824/34038818Fax: +2023419355E-mail: [email protected]
GUYANAGuyana NationalTradingCorporation Ltd45-47 Water Street, PO Box 308
12 Kanda-Jimbocho 2 chomeChiyoda-ku - PO 80x72Tokyo 101-91Tel.: +81 3 3265 7531Fax: +81 3 3265 4656
Vitacura, SantiagoTel.: +56 2 33 72 314Correo electrónico:[email protected] Textolibros Ltda.Avda. L. Bernardo O'Higgins 1050
ESPAÑALibi aria AgricolaFernando VI 2,28004 MadridLibrería de la Generalitatde Catalunya
Georgetown
HONDURASEscuela Agricola PanamericanaLibrería RTACEl Zamorano, Apartado 93,Tegucigalpa
aruzen Company LtdPO Box 5050Tokyo International 100-31Tel.: +81 3 3275 8585Fax: +81 3 3275 0656E-mail: [email protected]
Santiago Rambla deis Estudis 118 (Palau Moja) Oficina de la Escuela Agricola08002 Barcelona Panamericana enTegucigalpaTel.: +34 93 302 6462 Blvd. Morazán, Apts. GlapsonFax: +34 93 302 1299 Apartado 93, Tegucigalpa
WHERIT TO PLAVC:4ASE FAO PUBLICATIONS LOCALLYPO INTS DE VENTE DES PUIL,!C: ',Kt7r,f niVi6T ,T,E LA FAO
PUNTOS DE N TA DE PUB 1.3 O A IO4E5 OE LA FA O
. KENYA NICARAGUA SUISSE UNITED STATESText Book Centre Ltd Librería HISPAMER UN Bookshcp PublicationsKijabe Street Costado Este Univ.Centroamericana Palais des Nations BERNAN Associates (ex UNIPUB)PO Box 47540, Nairobi Apartado Postal A-221, Managua OH-1211 Genève 1 4011/E Assembly DriveTel.: +254 2 330 342 Site Web:www.un.org Lanham, MD20706-4391Fax: +254 2 22 57 79 NIGERIA Van Diermen Editions Technigues Toll-free: +1800 274 4447Inter Africa Book Distribution University Bookshop (Nigeria) Ltd ADECO Fax: +1 800 865 3450Kencom House, Moi Avenue University of lbadan, lbadan 41 Lacuez, CH-1807 Blonzy E-mail: [email protected] Box 73580, Nairobi Websie:www.bernan.comTel.: +2542211 184 PAKISTAN SURINAME United Nations PublicationsFax: +2542223570 Mirza Book Agency Vaco n.v. in Suriname Two UN Plaza, Room DC2-853Legacy Books 65 Shahrah-e-Quaid-e-Azam Domineestraat 26, RO Box 1841 New York, NY 10017Mezzanine 1, Loita House, Loita Street PO Box 729, Lahore 3 Paramaribo Tel.: +1 212 963 8302/800 253 9646Nairobi, PO Box 68077 Fax: +1 212 963 3489Tel.: +254 2 303853 PARAGUAY SWEDEN E-mail: publications @ un.orgFax: +254 2 330854 Librarla Intercontinental Wennergren Williams AB Website:www.unog.ch
Editora e Impresora S.R.L. PO Box 1305, S-17125 Solna UN Bookshop (direct sales)LUXEMBOURG Caballero 270 c/Mcal Estigarribia Tel.: +4687059750 The United Nations Bookshop
M.J. De Lannoy Asunción Fax:+46 8 27 00 71 General Assembly Building Room 32202, avenue du Roi E-mail: [email protected] NewYork, NY 100178-1060, Bruxelles (Belgique) . PERÚ Bokdistributören Tal:: +1 212 963 7680Mél.: [email protected] INDEAR c/o Longus Books Import Fax:+1 212 9634910
Jiron Apurtmac 375, Casilla 4937 PO 80x610, S-151 27 Södertalje E-mail: bookshop@ un.orgMADAGASCAR Lima 1 Tel.: +46 8 55 09 49 70 Website www un org
Centre d'Information et de Universidad Nacional ,,Pedro Ruiz Gallo Fax: +46 8 55 01 76 10; E-mail:Documentation Scientifigue et Facultad de Agronomía, A.P.795 [email protected] Ebsco Subscription ServicesTechnique ambayeque (Chiclayo) PO Box 1943Ministere de la recherche appliquée THAILAND Birmingham, AL 35201-1943au developpement PHILIPPINES Suksapan Panit Tel.: +1 205 991 6600B.P.6224,Tsimbazaza, Antananarivo International Booksource C,enter, Inc.
127-A Antipolo St,BarangayValenzuelaMansion 9, RajdamnernAvenue,Bangkok
Fax: +1 205 991 1449The Faxon Company Inc.
MALAYSIA Makati City 15 Southwest ParkSouthbound Tel.: +63 2 8966501/8966505/8966507 TOGO Westwood, MA 02090Suite 20F Northam House Fax: +632 8966497 Librairie du Bon Pasteur Tel.: +1 617 329 335055 Jalan Sultan Ahmad Shah E-mail: ibcdina webquest.com B.P.1164, Lorné Telex: 95 198010050 Penang Cable: FW Faxon WoodTel.:+60 4 2282169 POLAND TURKEYFax: +604 2281758 Ars Polona DUNYA INFOTEL URUGUAYE-mail: chin @south.pc.my Krakowskie Przedmiescie 7 100.Yil Mahallesi Librería Agropecuaria S.R.L.Website:www.southbound.com.my 00-950 Warsaw 34440 Bagcilar, Istanbul Buenos Aires 335, Casilla 1755
Tel.: +90 212 629 0808 Montevideo C.P. 11000MALI PORTUGAL Fax:+90 212 629 4689
Librairie Traore Livraria Portugal, Dias e Andrade E-mail:[email protected] VENEZUELARue Soundiata Keita X 115 Ltda. Website:www.dunya.com Fundacion La Era AgrícolaB.P. 3243, Bamako Rua do Carmo, 70-74 Calle 31 Junin Ola Coromoto 5-49
Apartado 2681, 1200 Lisboa Codex UGANDA Apartado 456, MéridaMAROC Fountain Publishers Ltd Fudeco, Librería
La Librairie Internationale REPÚBLICA DOMINICANA PO Box 488, Kampala Avenida Libertador-Este70, me T'ssoule CUESTA - Centro del libro Tal.: +256 41 259 163 Ed. Fudeco, Apartado 254B.P. 302 (RP). Rabat Av. 27 de Febrer A. Lincoln Fax: +256 41 251 160 Barquisimeto C.P. 3002, Ed. LaraTél./Télécopie: +21277501 83 Centro Comercial Nacîbal Tel.: +5851 538 022
Apartado 1241, Eanto D mingo UNITED ARAB EMIRATES Fax: +58 51 544 394MÉXICO CEDAF-Centugpara el Desarrollo Al Rawdha Bookshop Librería FAGRO
Librería, Universidad Autónoma de Agropecuario y Forestal, Inc. PO Box 5027, Sharjah Universidad Central de Venezuela (UCV)C0xLrno Calle José Amado Soler, 50 -Urban. Tel.:-i-971 6 734687 Maracay56230 Chapingo Paraíso Fax: +971 6 384473 Librería Universitaria, C.A.Libros y Editoriales S.A. Apartado Postal, 567-2, Santo Domingo E-mail: alrawdha@ hotmail.com Av. 3, entre Calles 29 y 30Av.Progreso N° 202-1° Piso A Tel.: +001 809 544-0616/544-0634/ N°29-25 Edif. EVA, MéridaApartado Postal 18922 565-5603 UNITED KINGDOM Fax: +58 74 52 0956Col. Escandón, 11800 México D.F. Fax: +001 809 544-4727/567-6989 The Stationery Office Tamanaco LibrosTecnicos S.R.L.Mundi Prensa Mexico, S.A. Correo electrónico: Ida @Codetel.net.do Si Nine Elms Lane Centro Comercial Ciudad TamanacoRío Pánico, 141 Col. Cuauhtémoc London SV\18 5DR Nivel C-2, CasacasC.P. 06500, México, DF SINGAPORE Tel.: +44 20 7873 9090 (orders) Tel.: +58 2 261 3344/261 3335Tel.: +5255335658 Select Books Pie Ltd +44 20 7873 0011 (inquiries) Tecni-Ciencia Libros S.A.Fax: +52 5 514 67 99 03-15 Tanglin Shopping Centre Fax:+44 20 7873 8463 Torre Phelps-MezzaninaCorreo electrónico: 19Tanglin Road, Singapore 1024 and throughThe Stationery Office Plaza [email protected] Tel.: +65 732 1515 Bookshops Apartado Postal: 20.315, 1020
Fax:+65 736 0855 E-mail:[email protected] CaracasNETHERL4NDS Website:www.the-stationery- Tel.: +58 2 782 8698/781 9945
Rcodveldt Import b.v. SLOVAK REPUBLIC office.co.uk Correo electrónico: tchlibros @ibm.netBrouwersgracht 288 Institute of Scientific andTechnical Electronic products only:1013 HG Amsterdam nformation for Agricufture Microinfo Ltd ZIMBABWETel.: +31 20 622 80 35 Samova 9, 950 10 Nitra PO Box 3, Omega Road Grassroots BooksFax: +31 20 625 54 93 Tel.: +421 87 522 185 Alton, Hampshire GU34 2PG The Book CateE-mail: [email protected] Fax:+421 87 525 275 Tel.: +44 1420 86 848 Fife Avenare, Harare;Swets & Zeitlinger b.v. E-mail: uvtip .4) nr.sanet.sk Fax:+44 1420 89 889 61a Fort Street, BulawayoPO Box 830, 2160 Lisse E-mail: [email protected] Tel.: +263 4 79 31 82Heereweg 347 8, 2161 CA Lisse SOMALIA Website: www.microinfo.co.uk Fax: +2634726243E-mail: [email protected] Samater IntermediateTechnology BookshopWebsite: www.swets.n1 PO Box 936, Mogad)shu 103-105 Southampton Row
LondonWC1B4HHNEW ZEALAND SOUTH AFRICA Tel.: +44 20 7436 9761
Legislation Services David Philip Publishers (Pty) Ltd Fax:+44 20 7436 2013PO Box 12418 PO Box 23408, Claremont 7735 E-mail: orders at itpubs.org.ukThorndon, VVellington Tel.:Cape Town +27 21 64 4136 Website:www.oneworld.org/ildg/E-mail: [email protected] Fax:Cape Town +27 21 64 3358 publications.htmlOasis Official E-mail: [email protected] Box 3627, Wellington Website: www.twisted.co.zaTel.: +6444991551Fax: +6444991972 SRI LANKAE-mail: [email protected] M.D. Gunasena & Co. LtdWebsite: www.oasisbooks.co.nzl 217 Olcott Mawatha, PO Box 246
Colombo 11
JSL...t.11 Ls..4 a
Société tunisienne de diffusion5, avenue de Carthage, Tunis
SamaterP.O. Box 936
Mogadishu
The Middle East ObserveröyaLi'l I 1
Tel.: +202393972Fax: +2023606804
E-mail:[email protected]:www.meobserver.com.eg
La Librairie Internationale70 Rue T'ssoule
P. 0. Box 302 (RP)Rabat
Tél./Télécopie:2127750183
01So 1 04 I-3 1-.L11
6,1A
Sales and Marketing GroupInformation Division, FAO
Viale delle Terne di Caracalla,00100 Rome, ItalyTel.: +39 06 57051
Fax: +39 06 5705 3360E-mail: [email protected]
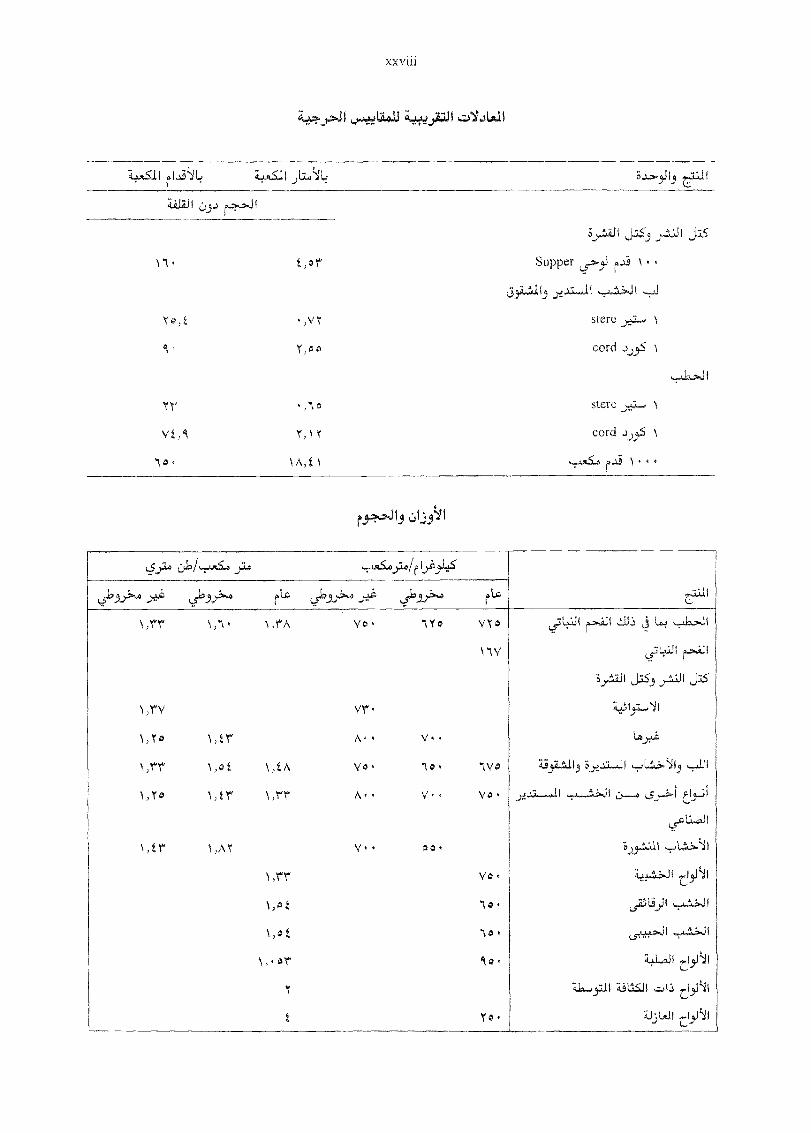
Il
11,-)Vols-11
,rr yo.
\,0t
,0t
.5.)1°
1,r1'
1,y0
,rr
1,Y
N,tr
\,tr\,0t
1,tr
1,AY
),rn
1,tA
,rr
y°.
yr.
vo.
,/.
1To
"10.
V»
00.
VYo
111/
Vo. ,11
LI j'LL0')IL I
S.y.:1;i11
t,or Supper r
To,t .,VT stere
'f,00 cord
I
Tr stere
Vt,9 Y,1 cord
o 1A,f1 004
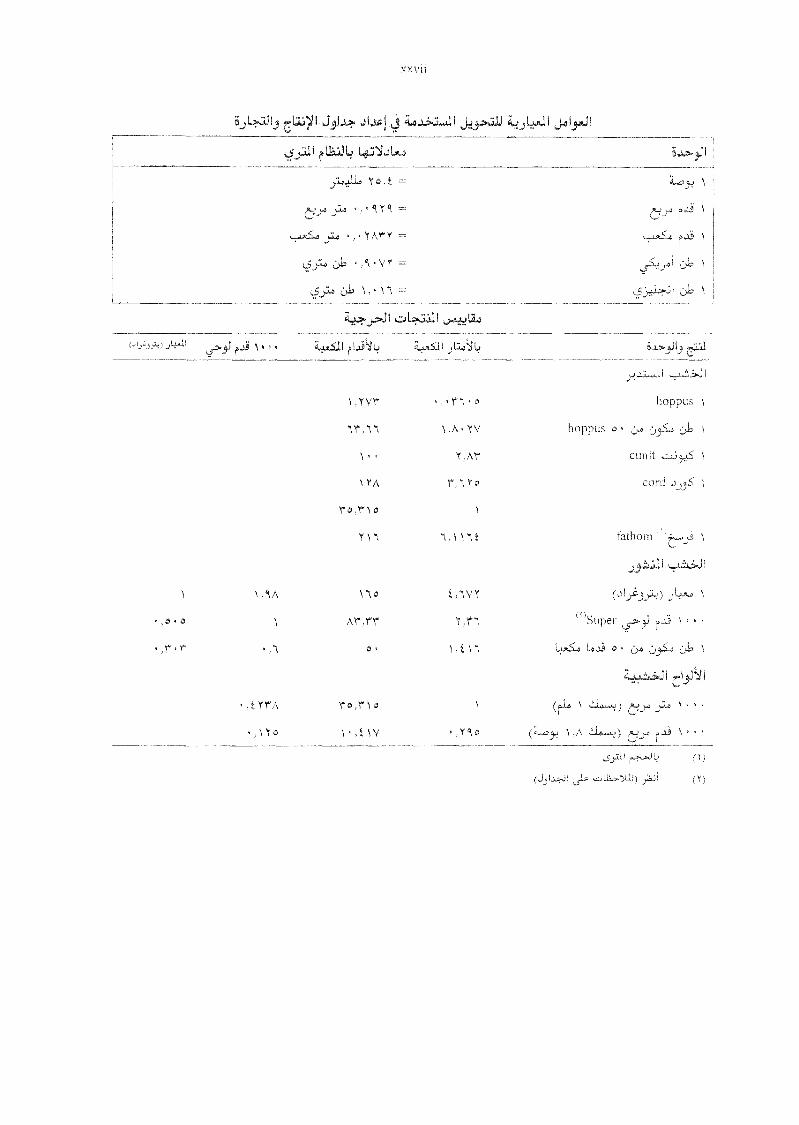
1 AA
xxvii
.7.11 ,:.,L?a111UL
fathom
(1)
Ar.rr
0.
t,r.L.L.4., L. o
.,trrA
o
r0,r)0
A
1,YVY' o hoppus
1,A YV hoppus a
cunit
1 YA r.1r0 cord
ro,r10
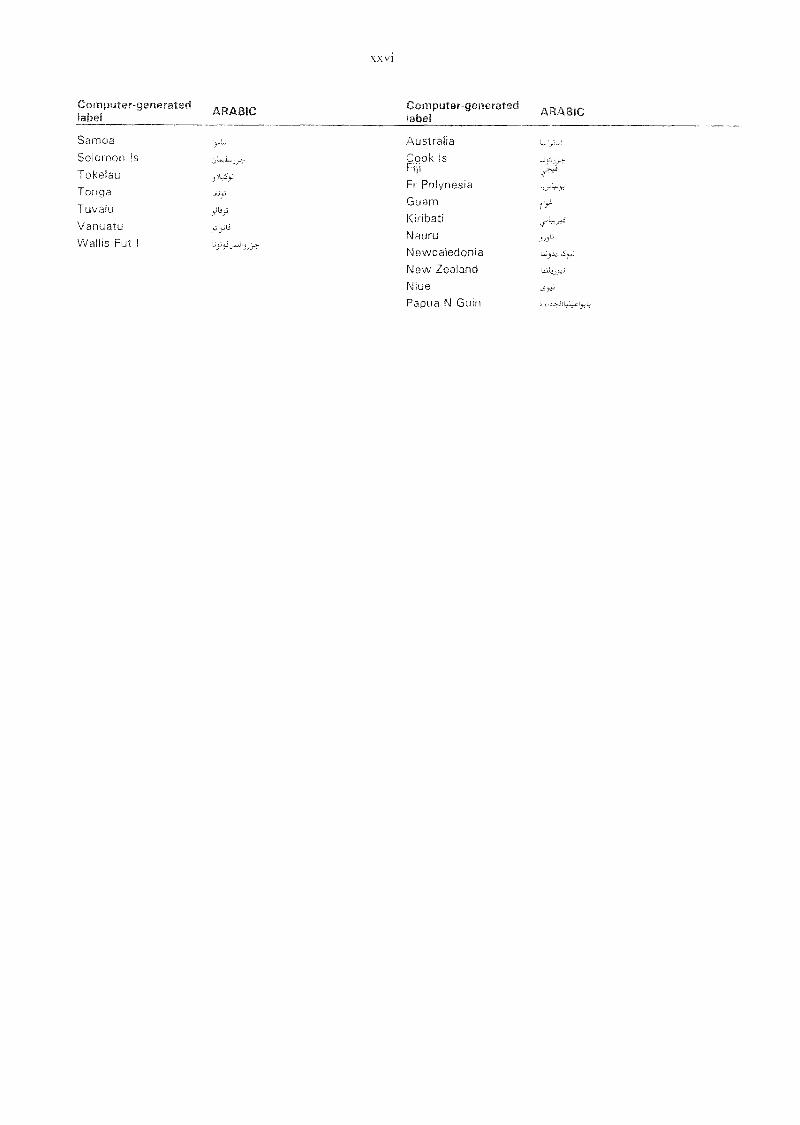
Computer-generatedlabel
Samoa
Solomon IsTokelauTonga
TuvaluVanuatuWallis Fut I
ARABIC
xxvi
Computer-generatedlabel
AustraliaCook Is
Fr Polynesia
Guam
KiribatiNauru
Nevvcaledonia
New ZealandNiue
Papua N Guin
ARABIC
:
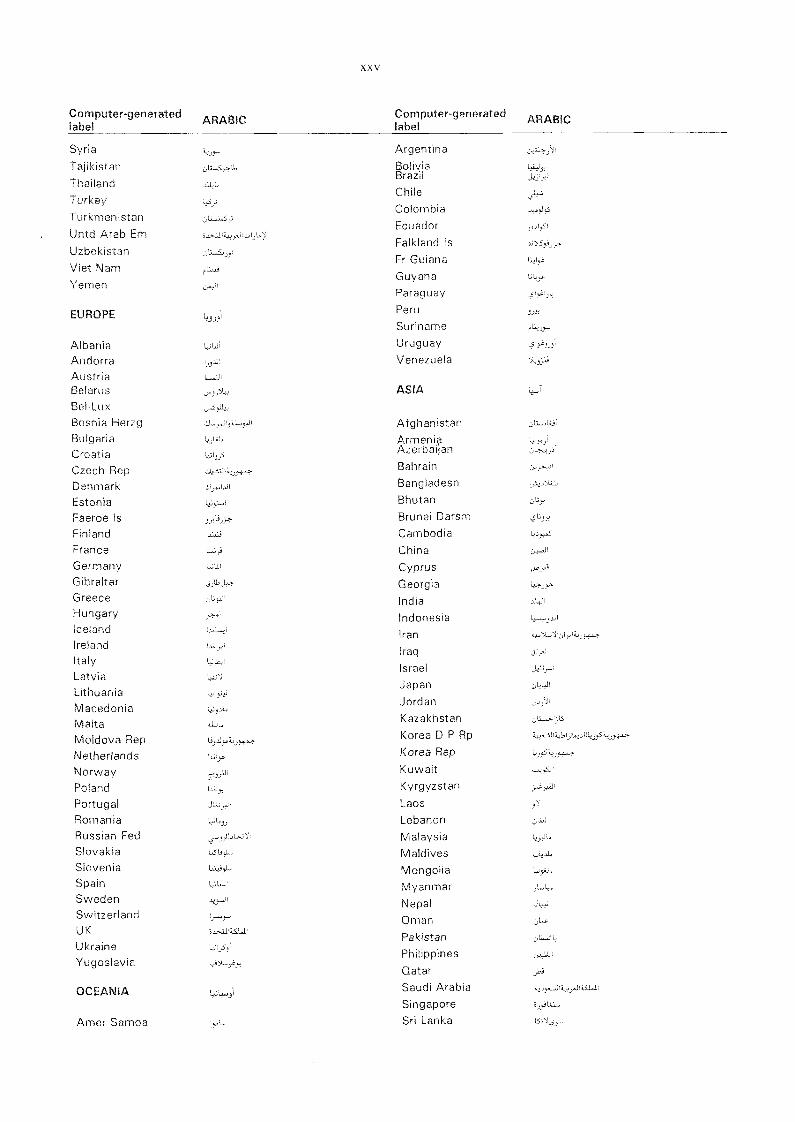
Computer-generatedlabel
Syria
Taji kist an
ThailandTurkeyTurkmenistanUntd Arab EmUzbekistanViet NamYemen
EUROPE
AlbaniaAndorraAustriaBelarus
Bel-LuxBosnia HerzgBulgariaCroatiaCzech RepDenmarkEstoniaFaeroe IsFinlandFrance
GermanyGibraltarGreeceHungaryIcelandIrelandItalyLatviaLithuaniaMacedoniaMaltaMoldova RepNetherlandsNorvvay
Poland
PortugalRomaniaRussian FedSlovakiaSloveniaSpain
SwedenSvvitzerlandUK
UkraineYugoslavia
OCEANIA
Amer Samoa
ARABIC
14,j
t
lq..)1;-1?
XX V
Computer-generatedlabel
ArgentinaBoliviaBrazil
Chile
ColombiaEcuador
Falkland Is
Fr Guiana
GuyanaParaguay
Peru
Suriname
UruguayVenezuela
ASIA
AfghanistanArmeniaAzerbaijanBah rain
Bangladesh
Bhutan
Brunei DarsmCambodia
China
CyprusGeorgia
India
Indonesia
Iran
Iraq
Israel
Japan
JordanKazakhstan
Korea D P Rp
Korea Rep
KuwaitKyrgyzstan
Laos
Lebanon
MalaysiaMaldivesMongoliaMyanmarNepal
Oman
PakistanPhilippines
QatarSaudi ArabiaSingaporeSri Lanka
ARABIC
'241
1.1Lt
JL;1,,
J
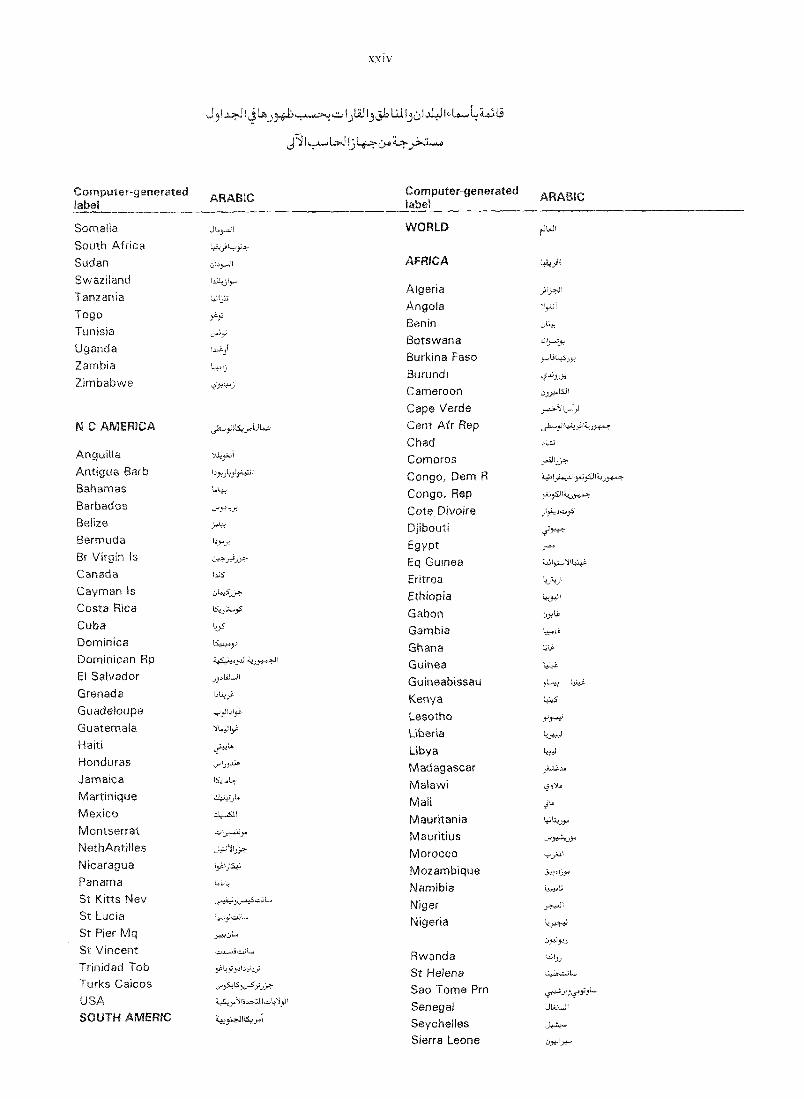
Computer-generatedlabel
xxiv
-
;"31LLil,Lt.
ARABIC
". ^
Computer-generatedlabel
ARABIC
Somalia Ji.y.....1! WORLD 1,J6J1
South AfricaSudan .:1.5y,j1 AFRICA
Swaziland 1 ;,;431.,...,
AlgeriaTanzania 411:>:,:,
AngolaTogo .)k..:,
BeninTunisia .....i.,:i
BotswanaUganda
Burkina Faso ,-.ALi..p.7.,..Zambia
BurundiZimbabwe
Cameroon,:,..5.1"-S.J' ICape Verde
1J C AMERICA ,.6.4iLs,,,,U4...:, Cent Afr Rep ,J.-"Jr.L..,,i,,,,Jr,--,0-4--,
ChadAnguilla -Ai..i..:,:,1 Comoros ya rity.
Antigua Barb ''ff.:1 _,1,-4-.5-'i Congo, Dern RBallaniF LI-4,, Congo, Rep
Cote DivoireBelize:, ;4! DjiboutiBerrriuci 3 1.,..,,,,, Egypt 7.--Br Viroii I 7. ,:».-",-ALi?" Eq GuineaCanada !,115 EritreaCayman Is z;.,-,,5):, EthiopiaCosta Rica Isii.»-.5.5 GabonCuba 1-.,..0 Gambia i.47-1-i
Dominica is.4.1,4.,-, Ghana ULe
Dominican Rp "--4,'1/4-J-,'I',&.0-1-1 Guinea 1,4
El Salvador ,,,,Lii..Ji GuineabissauGrenada 1,L.,.,,,:a Kenya ..1.45
Guadeloupe -,-.1j1,1.i-i LesothoGuatemala '11.....;i3 Liberia i.4,i,H)
Haiti i.."÷''' Libya 1÷e.-I
Honduras ,,,'_,J-,1,. MadagascarJamaica 1s-Lu4 Malawi o....))1-
Martinique =4:4.-_,L. Mali t36Mexico Li,--s-Li MauritaniaMontserrat ,,I, ..1.,, Mauritius ...,-..h,-:..e.».
NethAntilles..i,:i,-Y.,:,..7- Morocco ..741
Nicaragua 13-1.,I.s4.; MozambiquePanama L,ILL; NamibiaSt Kitts Nev,,i;-_,:,), ....,--457,-Z'L, Niger .,---.4 I
St Lucia NigeriaSt Pier Mq ,ytt.-...C.,L,
St Vincent ,i .iii4_. Rwanda I.6 ..,.;
Trinidad Tob.5 1-.',;3'/-','-4). St Helena L..L,-,;L,
Turks Caicos ,-.0-i.,4,:i.):,--- Sao Tome PrnUSA Z,S..0.'Iro....41,0,1!
Senegal JWliSOUTH AMERICJii4.47.i Seychelles
Sierra Leone
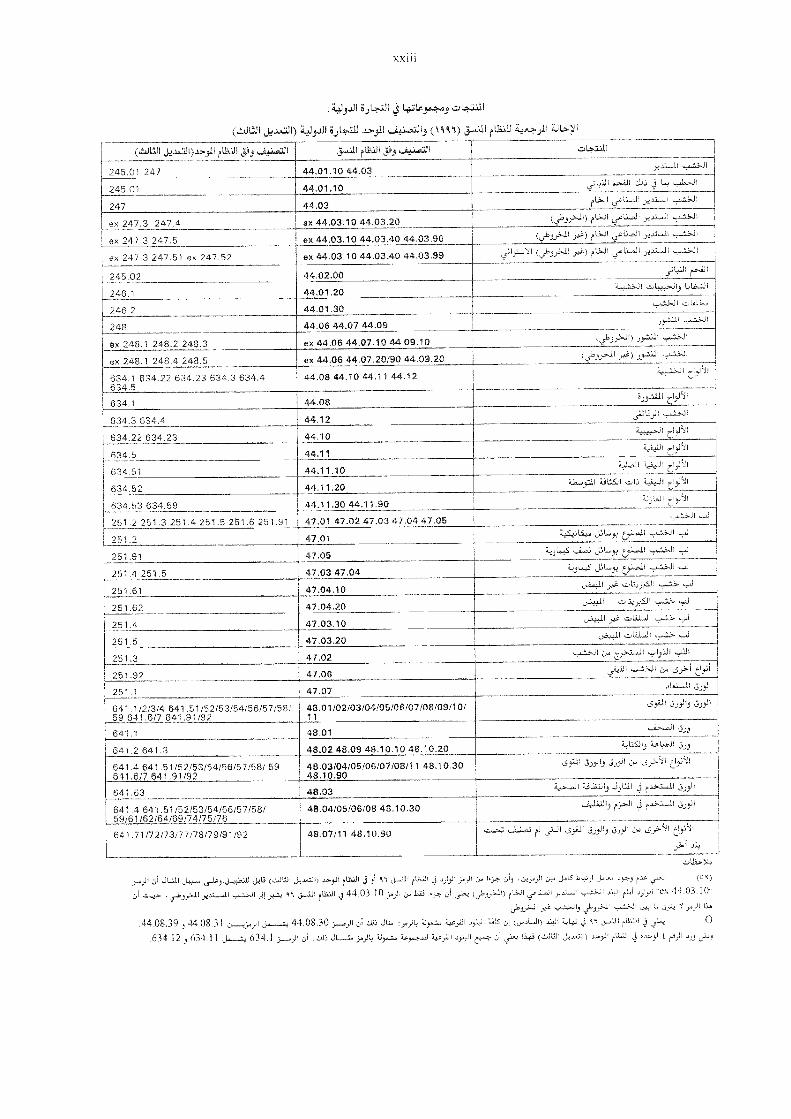
JjJI.JI j L4LLa.9.0..143
( (1941) 3 Iruai ZJL.,ye
lc, e 1,2d J.0 (..LJL:11 r11:J1iI Ji J.21.,J= J. (ex)
44 03 10 -ex 44 03 10
, 112
44 08 31 j 44 08 303.__.)1 j J-,L11rit.i11,3 0
j 634 11 j. 634 - JI 2. (...tA2.11 r=1 ri.p
(Z.X.JIJ.,..3..:.4.1-1)..0.,11 WWI ' ;.,!'. -.III, 3...,;.111.1.111:03 , ;2:.---,11
245,01 247 44.01.10 44.03 ..,.:-...ii +.11
245.01 44.01.10 I
247 44.03C.,..11 ,- i 1..,U.....H ,r y
ex 247 2.47 .4 ex 44.03.10 44.03.20 L51,..;,...11) i.L.:-..11,,,..JI ,.6.--.LI ..-t.......li
ex ' 7 :.r:/. 7. ex 44.03.10 44.03A0 4q 0-.+ -.:(.; (1,---11,,,...)
ex 247.3 247.51 ex 247.52 ex 44.03.10 44.03A0 44.03,U ,,5L1,,..."P (4.,,ii j.,.C.) r1245.02 44 02.00
,.,,,.:,L....L.,31 HJi
246.1 44 01.20 .I246.2 44.01.30
........:........)1 .ULL.;,,
248 44.06 44.07 44.09
ex 248.1 248 2 248 3 x 44.06 44.07.10 44.09. 10
ex 248.1 248 i ex 44.06 44.07.20/90 44.09.20i, ;....i., .4) ..4..'1.1
634.1 634.22 (:-./4.23 634.3 634.4634.5
44.08 44.10 44.11 44.12 _ - ...-
634.1 44.08i. q...:..i.li 1iJ. ',
634.3 634,4 44.12ZI.5,.11 _.... ..,...11
634.22 634.23 44.10i ,..111
..
634.5 44.11 ,
634.51 44.11.10 - - ' -._
634,52 44.11.20,,,:ai U5JI.,...1, .....,......ul ,.1..)-:[
...
634.53 634.59 44.11.30 44.11.90:..13L,1 1 7-1,,.11
251.2 251.3 251.4 251.5 251.6 251.91 47,01 47.02 47.03 47.04 47,05,,',ii ,,..2.
'-' 47.01., JLI...d.y c,).1..all ,,
251.'..,1 47.05
251.4 251.5 47.03 47.04 i.t...,5
251.61 47.04.10 - L.:,.,,,,,z.ii.,.,4 . ....,...1:., ,...;
251,62 47.04.20,,,;,.11 ,..1:, ....L.>. ..,...J
251.4 47.03,10!,di
251.5 47.03.20 .....-.-1., ---,/iL2. °-- .-,J
251.3 47.02II ,..»j:JI,n1 , :4-7 ,dil
251.92 47.06' ,:... L.5,:,...
251.1 47.07
641.1/2/3/4 641.51/:52:23/54/5 7/58i59641.6/7 641.91/92
48.01/02/03/04/05/06/07/08/09/10/ ,-5,--1, :wili 3)...i,
641.1 48,01-.........,J I 4.,t
641.2 641,3 48.02 48.09 48.10.10 4P [0 ^1 ..;LLSJI) 4l...1,Ji
641.4 641.51/52/53/54/56/57158/ 59641.6/7 641.91/92
43.03/04/05/06/07/08/11 45, 10.3048.10.90
,5;:12.1 J,i.n.,5,,,,)1,:..,Lil
641.63 48.03:,t.,......1I :i.i=i) J3L11,1 j r,,,...-...1.1 3),JI
641.4 54 'I 51:52/53/54/56/57/58/0 ... ' /74,175.776
46.04/05/06/08 48.10.30 -44.1' ii (.3_,J1 j ,,,..°, ,Il
641.? 1. 72/...,,:7/78/79/91/92 48.07/11 48.10.90 ,-, ,., , -.2 ;.: 3_0.11 :t1,0iail L...5.4.21 ,j),11., ,:,,, ,5..;-(11
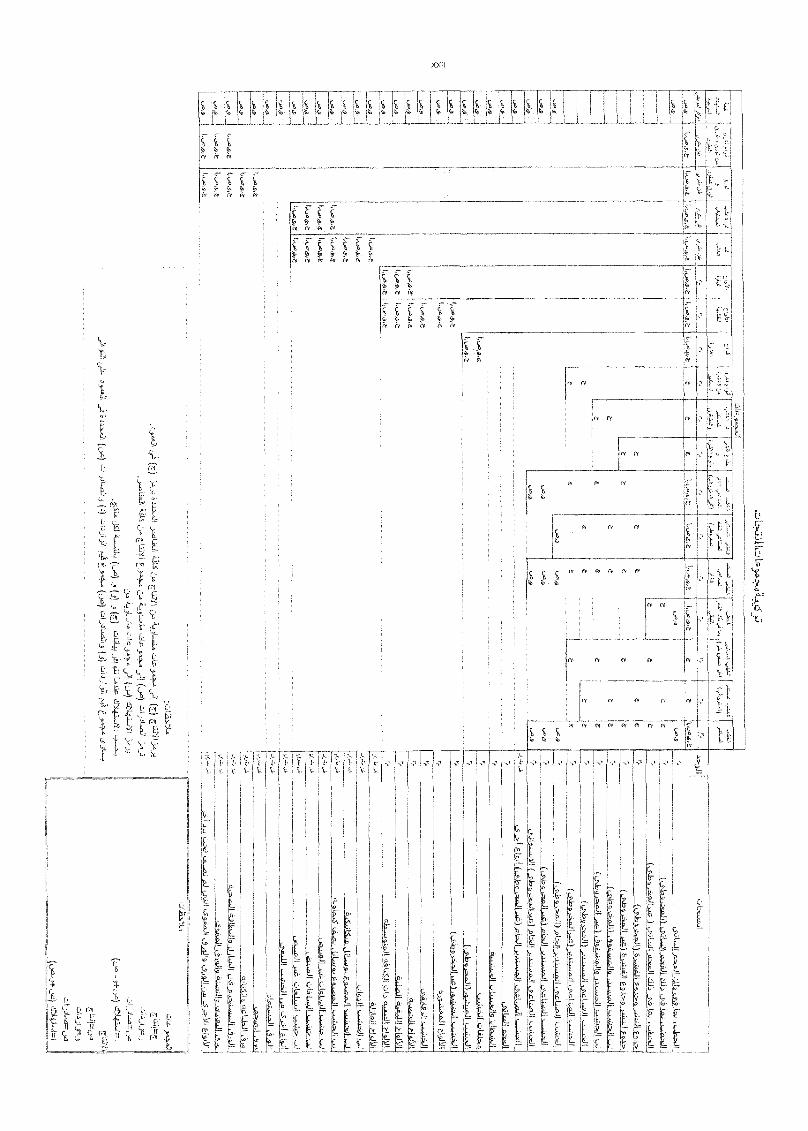
(7.1);
4-5jLi
I!(_)
;itsL
f11
jai.24"1-aru,
's)
.7)J.:.
L
,44
3.2241
t'l:-.42=A
,2NP41
n.11
AQ
J
L.a11
,.542,)
zILA
J.%
-
-_
,à,11t {9.A.1
7.7u-11=',71
-
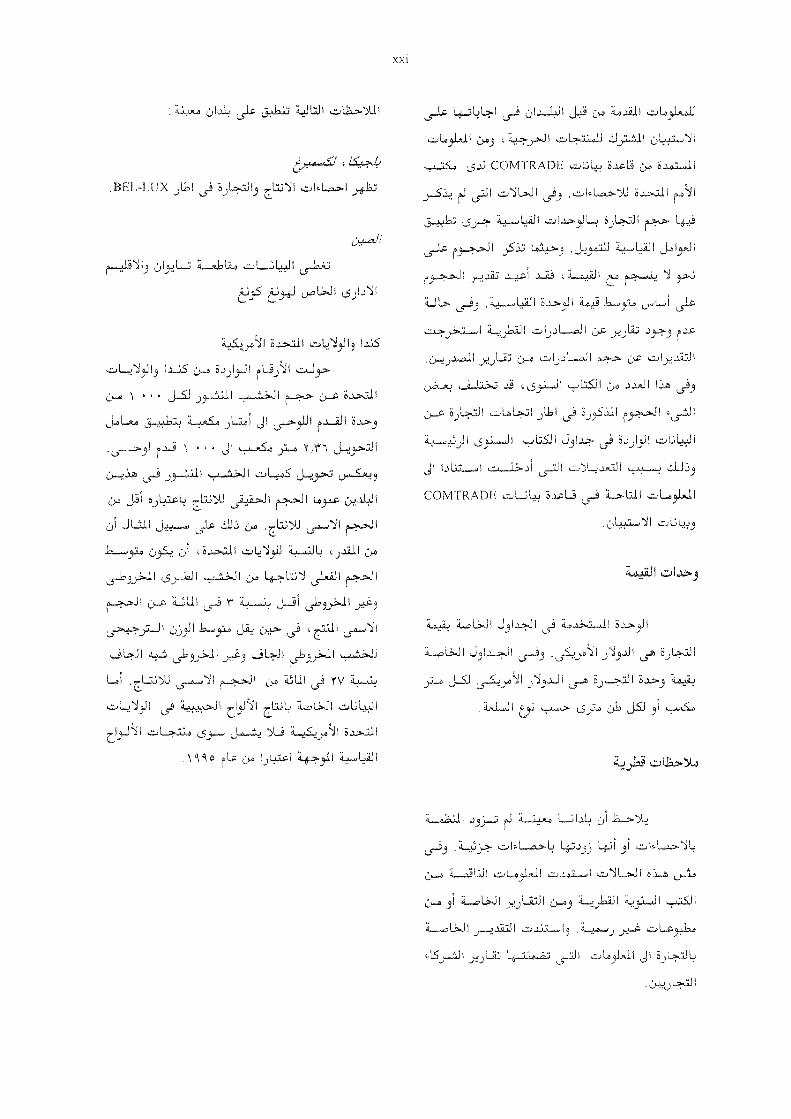
7t4A-0
_L-LUX jUvl
ù 1 LL2
S.) )13_11 r-'
..)2-1,l1 1 1,1 1 K2,-,31
Lî JI L&,_2JJ 1 riiJl
\
11
c).2 L.13 j ')U J 1 JI L JJI
cL, I J Liii J.0...ts. al 1Ii 1Ji1- ._912 Ùys., - 4.0 Leiii
1 Ls 2..1.1 1 Jl L1:nr Ls.L.LiJ I
L.:9 r 2,4,9
1 4.1 1 lo....,214 Si? 0.3 cf,.1 I "J 1
2,42 ,43LJ i,51,17.1,s1I 1LJiJI 1.1 Lsè y v ,;
1.1I L:L; 12.2.J 1 L.UJi
1 3 1
4 r La (:).2 1 jl,cLa 4÷..1-211 L.21j
xxi
L5J-a L> 1 Lri ù1 .2-1.s./ 1 J+3
- L221,11 ,:23 1 Lii J1ICOMTRADE cy.2
JI L,NJ I ,533 . - La.>. )L1 .6 ,L;,1 1
4111--!3
L$_J_ JI)53.5 ,Likh L.1,2 lyJ 1
, -
lJ" 1 Lb,- JI 12.-,212
1 -ILJI ,:).a 2,,.)115
ijLJI 1.."?. l I
0L-A-2ÇjJ19 1. LS2).1.-J I LSJi cy,4 J1R..1 I 13-Z L5:49
ù.- s,LJI -LLi j 1 Lsi )5521 1q. s.:441.
11 y 1 L52:4.1 LLSJ 1 J31.3.> 'oJI 1,JIJ.J32COMTRADE LL S.2.aLli L5_9 bil 1 L-1 1
1 1.;
"
:i +1;111
b 1+5.223 Lei 31 -
n7é). 1.11 I L1.A.1 L)...1 I
21 L;.j 1 j4eLiJI - 1 Ji 1
L.!2-.1 I LJi 12 jL. Lc3.42.2
Ji 2.e2 Li; 1 Ji L-J L22., !RI 1 Ji SJLJU
ùtu..) 1
tJ 1 J3 1 .23N1.- 1 S J...N.2.1 1
LJI Ji 1 j'J .L1 1 Ls...t j1_J 1
.L.11
Lt,-; , jEJ u-R.S4
L 1 ï._:iJ I - LS
1..13H L9 1
JI I ...14,J I J IJL-,) 11IJ 611 _11
J I ILJI J LJI iïJiI L...15 LJbit
i2 I. t:L.5
LI Ji JILs_71+2. I
L5I k
L5315-11
JI ÇIî]»'4,J1;..11
LiI- J -
3IUJI
1 S.Lï,Jae L51.1_141 L.,a_..,÷1
J5 LJ Ji111 I
I - - I
I
I .*)I Lr_le .4J I
JI LJ1 J.î ,i L. I
j).7.*..1 I ,1)., -4__..1..JJ1
J ..to Ji :;.-44...111
X X
11 JI1-a.,1.7! - UbJi
1 -4 : I L.,
J I L.;
r:.,-)LJ 1
.11
1 1 J5L I
.51)61 j_S Ls.0LJ I .11 I
I L.; I
Ck AA Lsij .3)1-.?,7611..9 z:_1-1.'1 kLiQ
,:).3 L...;.1 I 3 c LL.5.7J I (:)1..4.11
I ; 1 ä 41. '.1.1)
i i 41,Li LsiI L5le 1 I - 4 I LJ
r
I iL».9
L.,
II JI JL- JiL5.s. I 1 i
3.) JI JI I
.11 I 9 .
.:JJ
J..LSJ1 e .,
.11 .. L:41
I ..1.41 >LI
;L.:. I
L,.115 lI LJI
Ji J3 JJI LL.J 1 L5:9
jj3-.11 1La ) (.1_1J 3 13
J13.1.1
01.11 J1.3_11j-9 ,.13J1)113 L-3)1 , L.13 ,j)3J1
,Lu
.3_13 j_23,).11
3; 1iL'531-a,4-1 1 3; LL5--.!2d-L JI J
- ti3.;1
, 3i 1 JLJL.»
4-7,-áJ 1 Ji 13..t L1.3A1 ;
1 . L ïJ13
.
,.11 J.3),_1 13SJi
L.,513 JUJ1L, I 3)33 1 L-3_233
LL5 r..1 -1 1 Lq.i.11 j,3JI3( L.t.1 1
L.5.3) -,L.21: 1 Lyi,)
.11 iL1 Ùjá_:;).SJ 1) J 1
1 -A-C 1 j:)_,J 13
33.)9.1 I C31 1 I J4L,,
J1,13.11 LL,, 'Li! ',5.3,111
7`, c)_, .91 1
31 :L411 LL.5_ 4.4 31
y57 1 3i L.5.1;1_,..,4_4.11
1 L.)L16
XIX
Li 15L41W-6
J.)) '0) L,s___11 3)33 31
L., J131 31 3LS
633)LJ 1 L>J13 jLJi L5j
j»Ji J Jij J.3113
':)2 j..).9 L,L5 L3)33 (
,
1 31S.1_,-14J1 t10'21,11
Liz...2Z)) *,,...a.÷lit:J 11 3)3 1
111J 1 J tI j2.4..:ZJ 13 r.:7,.11 L31 j3 t1_,4
3) I c_,33).SJ L43'J 1 J.1
LiJ I ;_,3;_yS..11 :Lc LL:5itl ,3.)3J
33-/ (*J.'
1L,.SJ 33-Z 1, 1
Ji 53.il 1 j37 j3J 13 Li jJ 1 j LSJI I3; &I
.11 ..
L53.ii 1 3)5-113 j3-11
rJ L5.5.115 I3 L.,+11
431J 13 ()L.!.
L.J1-1.1 1 31 JJi3 -, 13 13 .7- 1-11 Li;
t3 ,11 jJI Lj á °,71L.45 .LJ (.7._ 1 13
L.5_:1.1 13 je.SJ 1 1,0
1=1->i I J 671
1 1 j J3.113 j:J 3 LJ1 j33
c53a1 1 jJI3 ,L11 j,,!:c.) j..9.3...cd 1
,11 jr3.11 3.),11 JJ i Lz,) ;.1.411 11
,,77)
:f)'')
r)_71r")
r")-)")
_"-)),.-)
")
,3;
'")
3-1*
')r")
2'r
7) )
''',,r),)
3'J
.'s---,-;)
r;
\,),
_.1.-7.1
_--..'
A
'
-dr)
,
WI
.7.4_1»
j )51 3 Lc. L.'
3i L'9I, I, L..._aJ
c....L2J' I
,_..JJ I
ù4JI --.11 I 1-2
)L I J L.>,J
(;/, '
L59111 j_)5-41 I
I :Lc LI-, ,} Ji LII S.) '
1J I I, L,J I j4.....4.Z d I
1I LJI (4.1...1:1 Lid I
L5.3-"Ll ji.),-1 15 3_)5-1
)1s.
ä-...?:_LSJ 'LcLJI JI,juji
.11 &LLD
. (7,
L3),J1
»JIjJ5J- c4-01:3
I I Lj J.91.j)
( - A.9 r ; A -vj_)I
xvii
-
DIJ* JI 31 itl
-41ja.J1 ;141 Ji 13.:a-
I ..1J2 *
.L.Lt I -
4j LJi
L51.c;di LDL,.1,1..! i
LLJiJ)) ' I LLJl j.)3_3-11
I
1:21-J1 _J
.IC
I LLL i- I
I
2?
I
1.1A
L,4_0.5
3,[!.1
I J i (215ti LU L5:9
I JLU :91 n
°
33--14-Jj J
y I
L5YLLIJ..),J I ,s Li; I j (7, ';) JL.Ji JI
;Li IL5-9.
t_9-2L1 L2-2 1 L)"
3J I
jW jJIj)
7;;L:JH JI
'7-494,9
J I L, 1.5 3J I 7_,,J
L., j_l_c _5111 L..) L.:Up -
-
,
: JJ I I
I L3- LJ I J
LLItoJ I 5 .! I
JI
Ls1c.
XVI
II/ I IiLLt
II._.L.7 `- ) j1::W .111 :a'3I :44u1 ;i L5:0,id jjp
J-14,13 .4-6,-L.r.JJI
JL L4 _a Ls1...JL
I
La, Le.
I
c'k
: '11
LA.11 L.A..)L I
I J.4...ty.
iLii L-LoS
4-2
Li-I
I ù J.L.,, ( I
%J)LJJ.Ij.).3.113
L__1, 1 ,32 <.;-, ,1-- I
I 1 .!! 3_1; 1
-11 "1
4 , 4_, ,'
..1 .,31-1,1__, t L> -...j1 4 ,..l ü'D ,:..-)L4',1_,__.,1 'a t
. ..) - ..:., ,,,s .- + 0 + 4
li ,,;.,11 -,-1,J-"JI, 1
:11
lt'6 --J. 1
,
, /
LJt H,:P3
I 21.:,-,ITL?
'
,44-5.-4,42>j '5 43-4-5 4
' I
, LK.,1
,:77 ,,-14.4j&S.1 4,A,0
-;TO 1' :91411;
>14.) ,3,477,»4'
-
La,..-6,,1 -i,,,i, ' .., , , ) "Lk." i ',.... .-' -
,
L...-
I
sLiIa
34t
/L.-
1,j1 2 41 ,
4..
II ,
1 2 i- 2.. a,,11
I
.
;II ( 1 1LL)
I 2 ,14 1
d',.6! J j
ÇLJ 'i
.0Ljl
1 3 '1;1" : 1
-
< I ¡
1
;Pail)
) i I(lJI,d14
, ,
4.7 S 7s
sj 1 , ,li , 1
15: 7-LII 4?-4,7-47,77.j1 I Ia
J
17,. A
-1\
ITT
"1)fl)
-71
_T
elN.7"
sr)
);
s
73
.3
)/s))
'_D
)
sr;
-4,
-11"..))
s-74)
t
r,
,
f") -);
1-
)
)')
-,3
4')
_3)).)
-0
..1-:;')-N
g')td,
-"1
""'N
7,)
_3
111
"--;)1,1
7-4V
7-4
2"'A
11)
,t)
3
,
-')
79;
1'
NC
..... .F
j_j_c LiJ1
,sal 0')II
MT )5.0 , . _ C U M
W I R
. . ...... N ES
5)I
I i L Lo ,DLio I
.19AV ig
I g .1I ILs_LcJI zLU I I 14.0
¡41J1 I
L:SJ I Lri ;La I
U3.3 L6-:
-14.0
LJ _)J.1-41
I 3.51.9
)
I I) I
. I I
1.10 L S..)La "IL_41J1
3i lJ 3) 3
,11
oLz
0-1-
L51..c
Ls-Lc Já
cot...11 41;111 JI
Pi . : I J I
FAO, Forestry Department, Viale
dì Caracalla, 00100, Rome, Italy
++39-06-5705.5137 ji +39-06-5705.5514
tAi I I I .y.).,....;123
'..,rnichael-friartinC(i.Jao.org
ao.org
-JLU [email protected] access
ix
Z*9L
(*)
.'1
L,LJI
L.53.3
!,1
I
L_41
J311 Ld
_y=s1 ji j
Lo.,) i rLi....»1
J.S.! L5yUJI.2J3
.L9 '314.1i;U.
(tws--ii
a_iLJ I L3)2_21_,
2?.
"0" _9i .);L:Lii
JI o
. L5-11.An
.L.5)L3-11
-
; L.., '-';';'[.; I jts
I c,
I ,-)4Ui[_3`» L
LJI i'4-2i, 12.61
,-, I _LJ ; -
V ...V.> V V '4,-r-
S
. I
L.53 L3-;11; 1.1.1,2J;
;
'
I
V I 1
1-7>L, ')L:9
"
..1JI iI
j LJI 3 3.-Z
FAOS TAT
; ;` --;47
_iL JI
L5); ji
" ; -,:421,11 J..)3421
;2:2' ;,
I . p3j1 L.;
; 4 L24,-41...L424
,...444,44.144;
; ;) ;32.; .43"
- :L1 I-4,4a.:.11 ,;
l'4.4!4[ LAi ,..., !..;_?.» I .241.2
. ;
I i 1.5.2
;.......7;,14211 [4421-4 ...41.,[...",421
LiL 'SJJ::jj iI-LLL 7 )- 4 I FAOSTAT a,
.;'1
,
LS L.74.1 1 ,56';;;;; Jai.[;na
; '20; ,;, L., 3.'$G ;;; ;44,2.42i;,. 3-7 1,,41 4 I
; COM FRA
L.
I
' .À L.0;;La2L;.`k I ; [-'-; ; ';;;da L4....4.! I .4-3' .[IL- Ai' 44 L I 1 ",
[
IWÀ 7I ,2):[
23224a Q
4_ HLJ LdI 1 42,4, LAÀLII; *)1_,.11
,244; L.4,41.2.2,4 I i[.,-,,[,[4, sI ,
.1..,;v:J I - ';:d441.44' J I
-
I Lau- I -
L.5L'il . 1 9 9 A r
4_J1
4___,L661- I I J I o_ls.
-4 . 9 °1 \ t I
II Da,t,
I la L5 Ij I
JI L I _.,1.>J2,
I -.S., 13_,1
I I I
LS.j ä 1 9 A j 'Yk y
)99A99t.
'1
o
(FAOSTAT PC) 0,
, (FAOSTAT CD)
23.1_9 'i.orcstry
II J I
Ai publicatioils-iiiii.-;
JI
il)roducts.httri
US»
-JLiI JIL;',111
11-ot Jiz-
J.511 I,jLJI IJ)11A LsI LJJJ ;41! 2L,L:1J I 3,
is, SI-,-, I I .J1
S LJI3,! -.._i_AJJ1 J."1,11 JI c Lc¿L.LJ
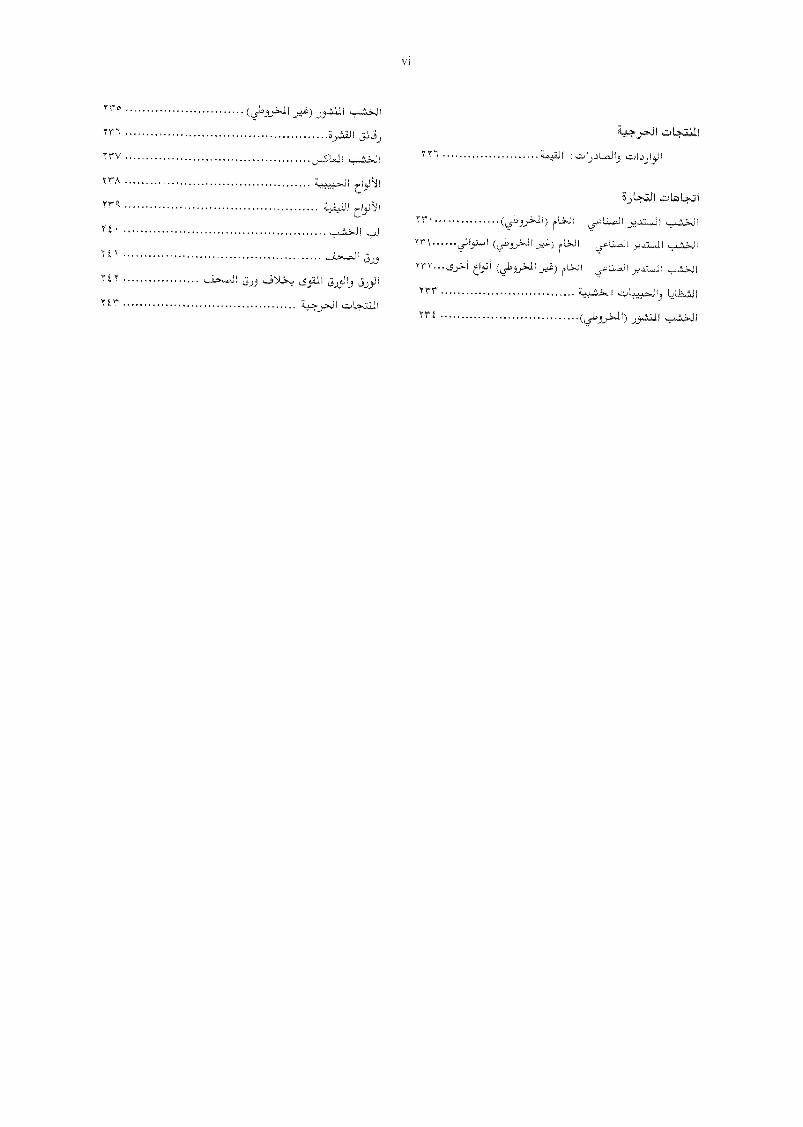
Tro ......... .,
Trv ...... ..... . ..
rrn ................
t ,..5)4. 1 j..).,/
vi
Tr J.LJI.72..4-11 °L..-Ji
rL.J I0..a
,t1.5,f1
rr t....... ............ (L56,9_7:--,11)
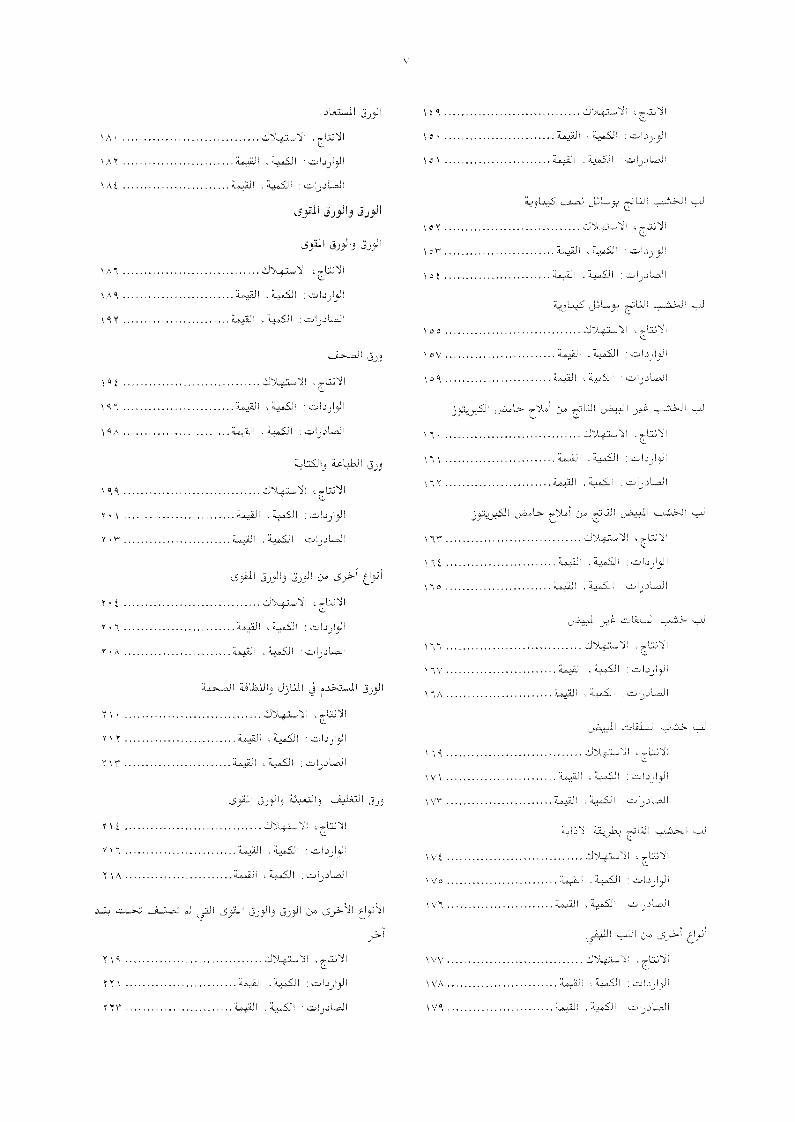
L53-111 JJ,11:9 jj.9J1
,s,111 jj.)3-11J 3.).51
-"'"""--------...-J;,11
: I
t113:-J
iJi J_,)2
Y
LJJ z,1.4).14J1
yy :iLJ7612.J1 II
\'A
.....
ILJ
LiW .......
\
,' 44111 ft,.i14
'I ,3
Zji=
YY \ .
Tyr .....íiJLJJ
7-:;UJl
" " " .."" I
7,1!
Y A . H.:.-dj.)L0J1
.1.1 jLUY 1 - - - - I
-r1
1 I 7 [..:n I
11
1 1 A - )14.1- 1
'T ;
rl - 1 JL,j1
:61,1SJI
\rr .... ........
IJI
rA ... , ..I 1.:6 i 1
..... ,0.5.,11
tt
1
($6,9) LI-4J!JI
ULI
..... :
......
s)34,:al
vv iii1) 3,),_..11
A 'TI
f,. I,J1
AV
-6 -`1
hifI7t
.9J'PIq lzJ)'1
V........ ,
V\ JI
t t ...., ........iI ,-143"Js
1A ...... ...1tA
\ . . . , . . ,5.1 I
:7'11
t ....-.L2.3.SJI
y v x......X
r\ ....
I: .... ... .....
UJJ ¡JHiii ruJ1 .H XXIII.....
rcsxxv ............ J1.41 L3....,L,
rA ... ..435...11
A-1
(r_L:',;11 (J-1 11,4)
....
L5
3.Y.111
... .. ......... .....
or...... ... .... .....(L.
33' 34)
Al
... .. .........L.
vii
A-4 ........ .....
....
............. .
\ ...... ............ - .....
11)
.... ......... . ..............
s..................
Lij j
.
v...... .......
. . .. d
.........
yo..........
ISBN 92-5-004407-0
ISSN 0084-3768
4.] Zsiu- .1-11, I It 1 11Lta: ; 321'1 1iLLL, 4_5Ì) L51
jijl J3lji 4 L5-'LfJ 1 I:t; 1" -:ji Li31
I la ö..1)1.9J I1.317,7,11 I I
I 611 j_11 I
:il 4Z U LS L2.e.11 L.5:11
Chief, Publishing and Multimedia Service,Information Division, FAO, Viale delle Terme di Caracalla,
00100 Rome, Italy.
RIMET'
1j3.1 .41 L.az_iY I LLJl J3, " L;44.2
: 2_4E4
www.fao.org
I (.5-1Lnili'i I I, I I 1.±.9.4
:JIt.,37dzai IJ JiJI(.5.3.1=aiForestry Planning and Statistics BranchForestry Policy and Planning DivisionFAO, Viale delle Terme di Caracalla00100 Rome, Italy
E-mail: [email protected]: +39 06 57055137
© FAO 2000
lViA- Mt,
LiJ I I. t.
rr
ISBN 92-5-004407-0 ISSN 0084-3768
Ill 1 1111 1111 Ill II7,8 9.2 5 O b4 40 71
X4455M918/116.00/3700
LI-9-43 C:3171"" 5.9""
4.5.4 jiztit.1,3 I
3.1...9.16,1.11 as LA .1÷t11 tj.c (s11.6,611 4.73"LW' 1143
44?..1.3 ,3J4"11 EU:dij4.111 L44:1* I Jl Jï LAS
. I oas.,?...a loss: .6.44.14.9
LuLuiLÇ,1C.4)13.11 LJItL41Zc.1 jj.11,9JI .1461.3 C)1.14.11
c.ses
UL ..03
49.LLU J .11 141...Cus.'

44'5!
4p4 4- 4 4,
,
hr, e
4
A-
-
.646 ,60,e4" -4'fer
7 7
ffg 5# - -ff gtt,i 1,
.4,
f41. tg
tl ,,, 4. '-'4, , ...
- , f,
'
f'ff , 5
ffff'
7
5- ft
, /0-
40,7,
4. -
k,p,
Lt-o;
7 J."
1 1,
rir,."; :;
t-tt-ttAtktVet,'"»55- 9.494
9 '47 A9179';'1-9
1
t.
Ls1 j3J1j
'
499;4:
,
-_-",:gg, f .-..,
4.44 404.. !
'ji
t,
A ,AP77,,