x-sense: sensing in extreme environments
TRANSCRIPT
X-SENSE: Sensing in Extreme EnvironmentsJan Beutel, Bernhard Buchli, Federico Ferrari, Matthias Keller, Lothar Thiele, Marco Zimmerling
Computer Engineering and Networks LaboratoryETH Zurich, 8092 Zurich, Switzerland
Email: {beutel,bbuchli,ferrari,kellmatt,thiele,zimmerling}@tik.ee.ethz.ch
Abstract—The field of Wireless Sensor Networks (WSNs)is now in a stage where serious applications of societal andeconomical importance are in reach. For example, it is well-known that the global climate change dramatically influencesthe visual appearance of mountain areas like the European Alps.Very destructive geological processes are triggered or intensified,affecting the stability of slopes and possibly inducing landslides.Up to now, however, the interactions between these complexprocesses are poorly understood. To significantly advance theknowledge of these interactions, we advocate the use of wirelesssensing technology as a new scientific instrument for environmen-tal monitoring under extreme conditions. Large spatio-temporalvariations in temperature and humidity, mechanical forces, snowand ice coverage, and unattended operation play a crucial rolein long-term, high-altitude deployments. Despite these challenges,we argue that in order to reach the set out goals it is inevitablethat WSNs be created as a high-quality scientific instrument withknown and predictable properties, rather than as a research toydelivering average observations at best. In this paper, we presentkey techniques for achieving highly reliable, yet resource-efficientWSNs based on our longstanding experience with productiveWSNs measuring permafrost processes in the Swiss Alps.
I. INTRODUCTION
X-SENSE (successor to PERMASENSE [2]) is a joint, inter-disciplinary project that has the ambitious goal of developingwireless sensing technology as a new scientific instrument forenvironmental monitoring under extreme conditions in termsof temperature variations, humidity, mechanical forces, snowcoverage as well as unattended operation that are needed forlong-term deployments.
In 2008 we started to deploy Wireless Sensor Networks(WSNs) to collect environmental data related to permafrost atthe Matterhorn and Jungfraujoch. Each deployment consists ofaround 20 sensor nodes, a base station, and extra equipmentsuch as weather stations and video cameras to remotelymonitor on-site operation. To this date, after more than twoyears of continuous operation, we have collected about 100million data samples. The extensive experience gained withall aspects of operating these WSNs provides the X-SENSEproject with the background necessary to extend the workperformed, and develop a set of environmental sensors for theobservation of ground-based terrain movement in high-alpineregions. Further leveraging familiarity with ultra low-powersensors used for monitoring steep bedrock permafrost [5], weare currently designing a set of more capable sensors. Withrespect to rather simple sensors developed for PERMASENSE,
978-3-9810801-7-9/DATE11/ c© 2011 EDAA
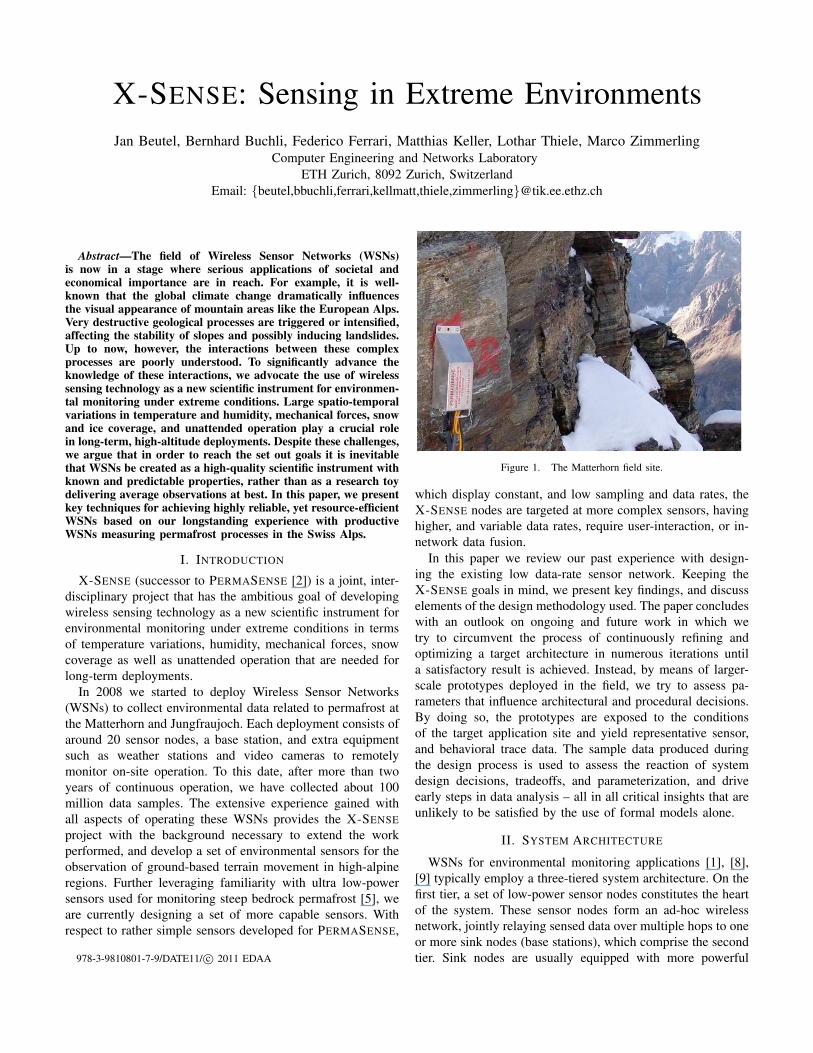
Figure 1. The Matterhorn field site.
which display constant, and low sampling and data rates, theX-SENSE nodes are targeted at more complex sensors, havinghigher, and variable data rates, require user-interaction, or in-network data fusion.
In this paper we review our past experience with design-ing the existing low data-rate sensor network. Keeping theX-SENSE goals in mind, we present key findings, and discusselements of the design methodology used. The paper concludeswith an outlook on ongoing and future work in which wetry to circumvent the process of continuously refining andoptimizing a target architecture in numerous iterations untila satisfactory result is achieved. Instead, by means of larger-scale prototypes deployed in the field, we try to assess pa-rameters that influence architectural and procedural decisions.By doing so, the prototypes are exposed to the conditionsof the target application site and yield representative sensor,and behavioral trace data. The sample data produced duringthe design process is used to assess the reaction of systemdesign decisions, tradeoffs, and parameterization, and driveearly steps in data analysis – all in all critical insights that areunlikely to be satisfied by the use of formal models alone.
II. SYSTEM ARCHITECTURE
WSNs for environmental monitoring applications [1], [8],[9] typically employ a three-tiered system architecture. On thefirst tier, a set of low-power sensor nodes constitutes the heartof the system. These sensor nodes form an ad-hoc wirelessnetwork, jointly relaying sensed data over multiple hops to oneor more sink nodes (base stations), which comprise the secondtier. Sink nodes are usually equipped with more powerful
InSAR Satellite Imaging
Temperature
Wireless SensorsBase Station
Solar Power
High Resolution Imaging Crack Dilatation
GPS Sensor
Non-moving position
Moving slope (rock glacier, debris)
Host Stationfusion, processing, storage
GPS Reference
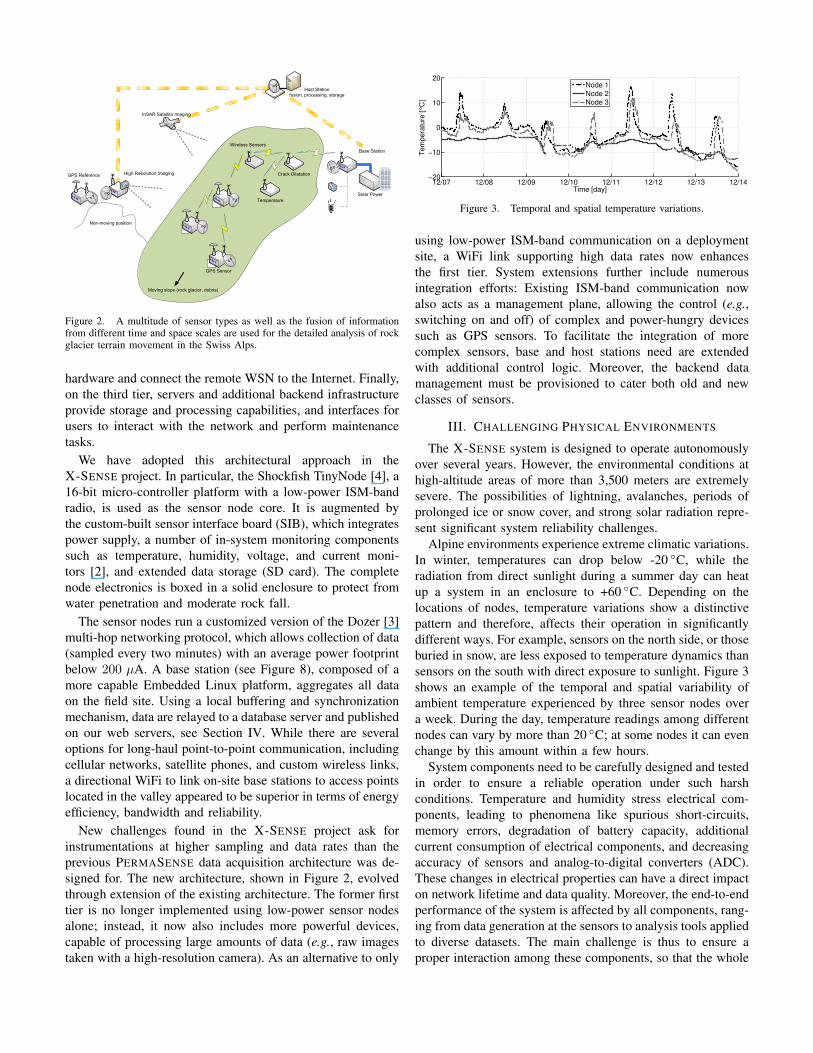
Figure 2. A multitude of sensor types as well as the fusion of informationfrom different time and space scales are used for the detailed analysis of rockglacier terrain movement in the Swiss Alps.
hardware and connect the remote WSN to the Internet. Finally,on the third tier, servers and additional backend infrastructureprovide storage and processing capabilities, and interfaces forusers to interact with the network and perform maintenancetasks.
We have adopted this architectural approach in theX-SENSE project. In particular, the Shockfish TinyNode [4], a16-bit micro-controller platform with a low-power ISM-bandradio, is used as the sensor node core. It is augmented bythe custom-built sensor interface board (SIB), which integratespower supply, a number of in-system monitoring componentssuch as temperature, humidity, voltage, and current moni-tors [2], and extended data storage (SD card). The completenode electronics is boxed in a solid enclosure to protect fromwater penetration and moderate rock fall.
The sensor nodes run a customized version of the Dozer [3]multi-hop networking protocol, which allows collection of data(sampled every two minutes) with an average power footprintbelow 200 µA. A base station (see Figure 8), composed of amore capable Embedded Linux platform, aggregates all dataon the field site. Using a local buffering and synchronizationmechanism, data are relayed to a database server and publishedon our web servers, see Section IV. While there are severaloptions for long-haul point-to-point communication, includingcellular networks, satellite phones, and custom wireless links,a directional WiFi to link on-site base stations to access pointslocated in the valley appeared to be superior in terms of energyefficiency, bandwidth and reliability.
New challenges found in the X-SENSE project ask forinstrumentations at higher sampling and data rates than theprevious PERMASENSE data acquisition architecture was de-signed for. The new architecture, shown in Figure 2, evolvedthrough extension of the existing architecture. The former firsttier is no longer implemented using low-power sensor nodesalone; instead, it now also includes more powerful devices,capable of processing large amounts of data (e.g., raw imagestaken with a high-resolution camera). As an alternative to only
12/07 12/08 12/09 12/10 12/11 12/12 12/13 12/14−20
−10
0
10
20
Time [day]
Tem
pera
ture
[ °C
]
Node 1
Node 2
Node 3
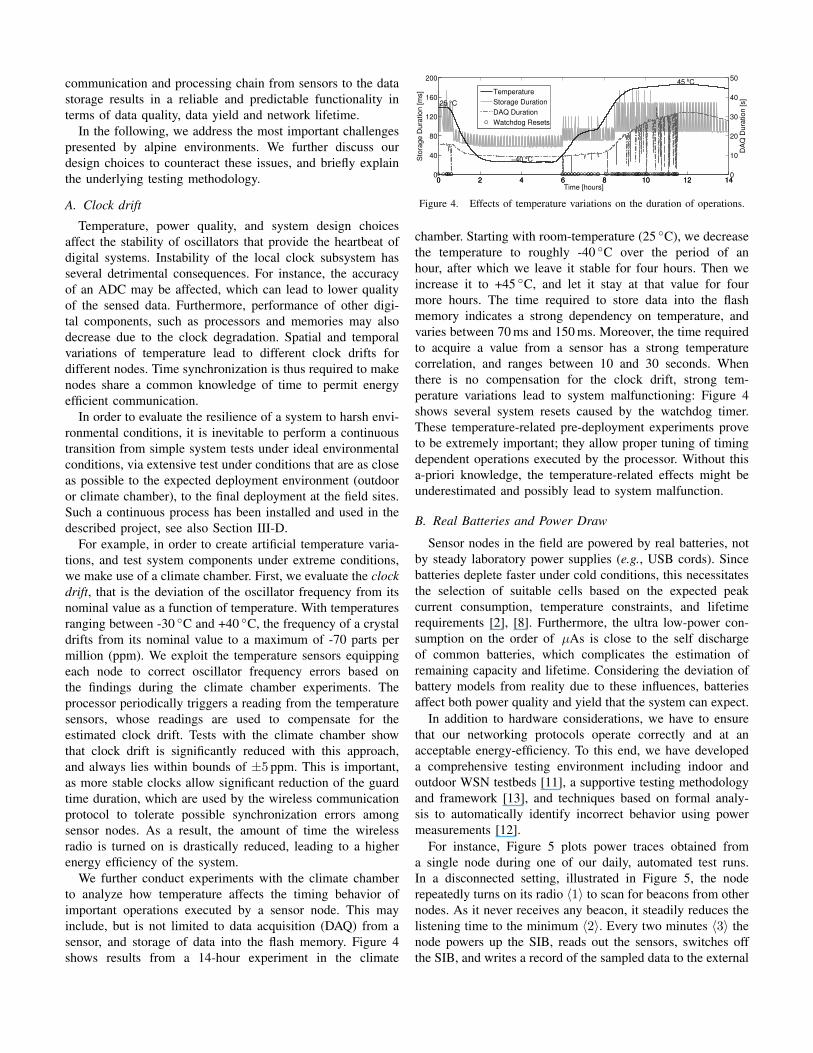
Figure 3. Temporal and spatial temperature variations.
using low-power ISM-band communication on a deploymentsite, a WiFi link supporting high data rates now enhancesthe first tier. System extensions further include numerousintegration efforts: Existing ISM-band communication nowalso acts as a management plane, allowing the control (e.g.,switching on and off) of complex and power-hungry devicessuch as GPS sensors. To facilitate the integration of morecomplex sensors, base and host stations need are extendedwith additional control logic. Moreover, the backend datamanagement must be provisioned to cater both old and newclasses of sensors.
III. CHALLENGING PHYSICAL ENVIRONMENTS
The X-SENSE system is designed to operate autonomouslyover several years. However, the environmental conditions athigh-altitude areas of more than 3,500 meters are extremelysevere. The possibilities of lightning, avalanches, periods ofprolonged ice or snow cover, and strong solar radiation repre-sent significant system reliability challenges.
Alpine environments experience extreme climatic variations.In winter, temperatures can drop below -20 ◦C, while theradiation from direct sunlight during a summer day can heatup a system in an enclosure to +60 ◦C. Depending on thelocations of nodes, temperature variations show a distinctivepattern and therefore, affects their operation in significantlydifferent ways. For example, sensors on the north side, or thoseburied in snow, are less exposed to temperature dynamics thansensors on the south with direct exposure to sunlight. Figure 3shows an example of the temporal and spatial variability ofambient temperature experienced by three sensor nodes overa week. During the day, temperature readings among differentnodes can vary by more than 20 ◦C; at some nodes it can evenchange by this amount within a few hours.
System components need to be carefully designed and testedin order to ensure a reliable operation under such harshconditions. Temperature and humidity stress electrical com-ponents, leading to phenomena like spurious short-circuits,memory errors, degradation of battery capacity, additionalcurrent consumption of electrical components, and decreasingaccuracy of sensors and analog-to-digital converters (ADC).These changes in electrical properties can have a direct impacton network lifetime and data quality. Moreover, the end-to-endperformance of the system is affected by all components, rang-ing from data generation at the sensors to analysis tools appliedto diverse datasets. The main challenge is thus to ensure aproper interaction among these components, so that the whole
communication and processing chain from sensors to the datastorage results in a reliable and predictable functionality interms of data quality, data yield and network lifetime.
In the following, we address the most important challengespresented by alpine environments. We further discuss ourdesign choices to counteract these issues, and briefly explainthe underlying testing methodology.
A. Clock drift
Temperature, power quality, and system design choicesaffect the stability of oscillators that provide the heartbeat ofdigital systems. Instability of the local clock subsystem hasseveral detrimental consequences. For instance, the accuracyof an ADC may be affected, which can lead to lower qualityof the sensed data. Furthermore, performance of other digi-tal components, such as processors and memories may alsodecrease due to the clock degradation. Spatial and temporalvariations of temperature lead to different clock drifts fordifferent nodes. Time synchronization is thus required to makenodes share a common knowledge of time to permit energyefficient communication.
In order to evaluate the resilience of a system to harsh envi-ronmental conditions, it is inevitable to perform a continuoustransition from simple system tests under ideal environmentalconditions, via extensive test under conditions that are as closeas possible to the expected deployment environment (outdooror climate chamber), to the final deployment at the field sites.Such a continuous process has been installed and used in thedescribed project, see also Section III-D.
For example, in order to create artificial temperature varia-tions, and test system components under extreme conditions,we make use of a climate chamber. First, we evaluate the clockdrift, that is the deviation of the oscillator frequency from itsnominal value as a function of temperature. With temperaturesranging between -30 ◦C and +40 ◦C, the frequency of a crystaldrifts from its nominal value to a maximum of -70 parts permillion (ppm). We exploit the temperature sensors equippingeach node to correct oscillator frequency errors based onthe findings during the climate chamber experiments. Theprocessor periodically triggers a reading from the temperaturesensors, whose readings are used to compensate for theestimated clock drift. Tests with the climate chamber showthat clock drift is significantly reduced with this approach,and always lies within bounds of ±5 ppm. This is important,as more stable clocks allow significant reduction of the guardtime duration, which are used by the wireless communicationprotocol to tolerate possible synchronization errors amongsensor nodes. As a result, the amount of time the wirelessradio is turned on is drastically reduced, leading to a higherenergy efficiency of the system.
We further conduct experiments with the climate chamberto analyze how temperature affects the timing behavior ofimportant operations executed by a sensor node. This mayinclude, but is not limited to data acquisition (DAQ) from asensor, and storage of data into the flash memory. Figure 4shows results from a 14-hour experiment in the climate
0 2 4 6 8 10 12 140
40
80
120
160
200
Sto
rag
e D
ura
tio
n [
ms]
0 2 4 6 8 10 12 140
10
20
30
40
50
Time [hours]
DA
Q D
ura
tio
n [
s]
25 °C
−40 °C
45 °C
Temperature
Storage Duration
DAQ Duration
Watchdog Resets
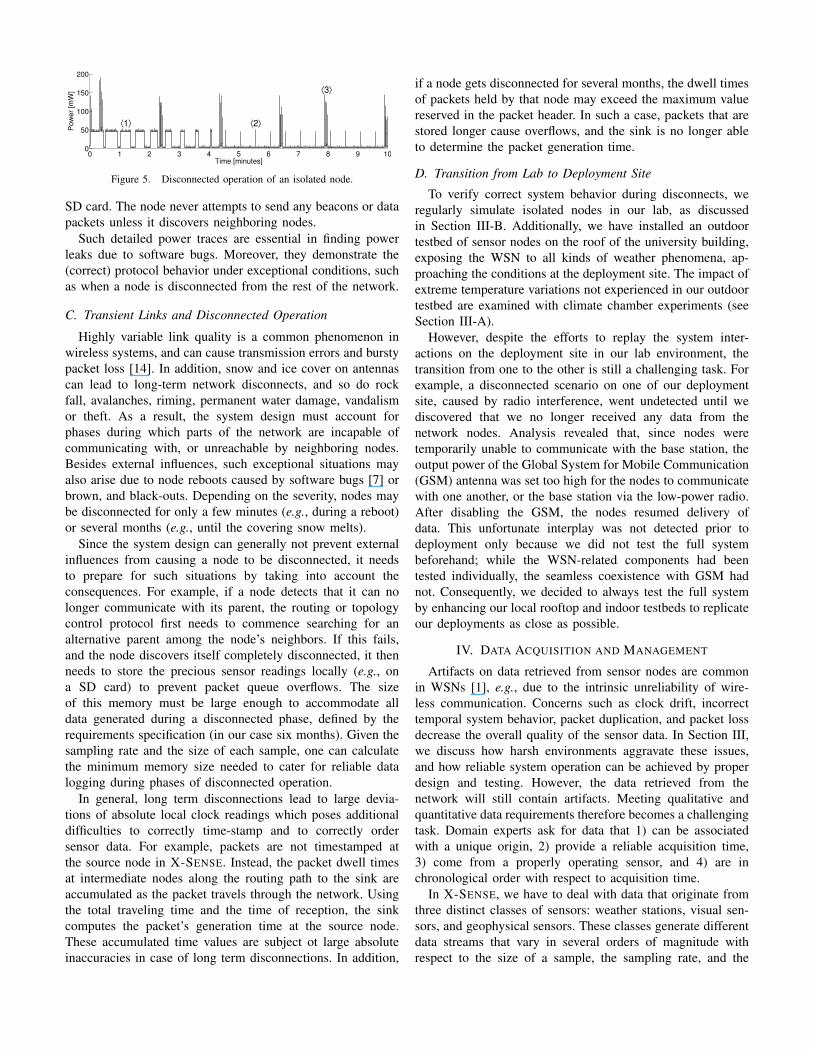
Figure 4. Effects of temperature variations on the duration of operations.
chamber. Starting with room-temperature (25 ◦C), we decreasethe temperature to roughly -40 ◦C over the period of anhour, after which we leave it stable for four hours. Then weincrease it to +45 ◦C, and let it stay at that value for fourmore hours. The time required to store data into the flashmemory indicates a strong dependency on temperature, andvaries between 70 ms and 150 ms. Moreover, the time requiredto acquire a value from a sensor has a strong temperaturecorrelation, and ranges between 10 and 30 seconds. Whenthere is no compensation for the clock drift, strong tem-perature variations lead to system malfunctioning: Figure 4shows several system resets caused by the watchdog timer.These temperature-related pre-deployment experiments proveto be extremely important; they allow proper tuning of timingdependent operations executed by the processor. Without thisa-priori knowledge, the temperature-related effects might beunderestimated and possibly lead to system malfunction.
B. Real Batteries and Power Draw
Sensor nodes in the field are powered by real batteries, notby steady laboratory power supplies (e.g., USB cords). Sincebatteries deplete faster under cold conditions, this necessitatesthe selection of suitable cells based on the expected peakcurrent consumption, temperature constraints, and lifetimerequirements [2], [8]. Furthermore, the ultra low-power con-sumption on the order of µAs is close to the self dischargeof common batteries, which complicates the estimation ofremaining capacity and lifetime. Considering the deviation ofbattery models from reality due to these influences, batteriesaffect both power quality and yield that the system can expect.
In addition to hardware considerations, we have to ensurethat our networking protocols operate correctly and at anacceptable energy-efficiency. To this end, we have developeda comprehensive testing environment including indoor andoutdoor WSN testbeds [11], a supportive testing methodologyand framework [13], and techniques based on formal analy-sis to automatically identify incorrect behavior using powermeasurements [12].
For instance, Figure 5 plots power traces obtained froma single node during one of our daily, automated test runs.In a disconnected setting, illustrated in Figure 5, the noderepeatedly turns on its radio 〈1〉 to scan for beacons from othernodes. As it never receives any beacon, it steadily reduces thelistening time to the minimum 〈2〉. Every two minutes 〈3〉 thenode powers up the SIB, reads out the sensors, switches offthe SIB, and writes a record of the sampled data to the external
0 1 2 3 4 5 6 7 8 9 100
50
100
150
200
Time [minutes]
Po
we
r [m
W]
⟨1⟩ ⟨2⟩
⟨3⟩
Figure 5. Disconnected operation of an isolated node.
SD card. The node never attempts to send any beacons or datapackets unless it discovers neighboring nodes.
Such detailed power traces are essential in finding powerleaks due to software bugs. Moreover, they demonstrate the(correct) protocol behavior under exceptional conditions, suchas when a node is disconnected from the rest of the network.
C. Transient Links and Disconnected Operation
Highly variable link quality is a common phenomenon inwireless systems, and can cause transmission errors and burstypacket loss [14]. In addition, snow and ice cover on antennascan lead to long-term network disconnects, and so do rockfall, avalanches, riming, permanent water damage, vandalismor theft. As a result, the system design must account forphases during which parts of the network are incapable ofcommunicating with, or unreachable by neighboring nodes.Besides external influences, such exceptional situations mayalso arise due to node reboots caused by software bugs [7] orbrown, and black-outs. Depending on the severity, nodes maybe disconnected for only a few minutes (e.g., during a reboot)or several months (e.g., until the covering snow melts).
Since the system design can generally not prevent externalinfluences from causing a node to be disconnected, it needsto prepare for such situations by taking into account theconsequences. For example, if a node detects that it can nolonger communicate with its parent, the routing or topologycontrol protocol first needs to commence searching for analternative parent among the node’s neighbors. If this fails,and the node discovers itself completely disconnected, it thenneeds to store the precious sensor readings locally (e.g., ona SD card) to prevent packet queue overflows. The sizeof this memory must be large enough to accommodate alldata generated during a disconnected phase, defined by therequirements specification (in our case six months). Given thesampling rate and the size of each sample, one can calculatethe minimum memory size needed to cater for reliable datalogging during phases of disconnected operation.
In general, long term disconnections lead to large devia-tions of absolute local clock readings which poses additionaldifficulties to correctly time-stamp and to correctly ordersensor data. For example, packets are not timestamped atthe source node in X-SENSE. Instead, the packet dwell timesat intermediate nodes along the routing path to the sink areaccumulated as the packet travels through the network. Usingthe total traveling time and the time of reception, the sinkcomputes the packet’s generation time at the source node.These accumulated time values are subject ot large absoluteinaccuracies in case of long term disconnections. In addition,
if a node gets disconnected for several months, the dwell timesof packets held by that node may exceed the maximum valuereserved in the packet header. In such a case, packets that arestored longer cause overflows, and the sink is no longer ableto determine the packet generation time.
D. Transition from Lab to Deployment Site
To verify correct system behavior during disconnects, weregularly simulate isolated nodes in our lab, as discussedin Section III-B. Additionally, we have installed an outdoortestbed of sensor nodes on the roof of the university building,exposing the WSN to all kinds of weather phenomena, ap-proaching the conditions at the deployment site. The impact ofextreme temperature variations not experienced in our outdoortestbed are examined with climate chamber experiments (seeSection III-A).
However, despite the efforts to replay the system inter-actions on the deployment site in our lab environment, thetransition from one to the other is still a challenging task. Forexample, a disconnected scenario on one of our deploymentsite, caused by radio interference, went undetected until wediscovered that we no longer received any data from thenetwork nodes. Analysis revealed that, since nodes weretemporarily unable to communicate with the base station, theoutput power of the Global System for Mobile Communication(GSM) antenna was set too high for the nodes to communicatewith one another, or the base station via the low-power radio.After disabling the GSM, the nodes resumed delivery ofdata. This unfortunate interplay was not detected prior todeployment only because we did not test the full systembeforehand; while the WSN-related components had beentested individually, the seamless coexistence with GSM hadnot. Consequently, we decided to always test the full systemby enhancing our local rooftop and indoor testbeds to replicateour deployments as close as possible.
IV. DATA ACQUISITION AND MANAGEMENT
Artifacts on data retrieved from sensor nodes are commonin WSNs [1], e.g., due to the intrinsic unreliability of wire-less communication. Concerns such as clock drift, incorrecttemporal system behavior, packet duplication, and packet lossdecrease the overall quality of the sensor data. In Section III,we discuss how harsh environments aggravate these issues,and how reliable system operation can be achieved by properdesign and testing. However, the data retrieved from thenetwork will still contain artifacts. Meeting qualitative andquantitative data requirements therefore becomes a challengingtask. Domain experts ask for data that 1) can be associatedwith a unique origin, 2) provide a reliable acquisition time,3) come from a properly operating sensor, and 4) are inchronological order with respect to acquisition time.
In X-SENSE, we have to deal with data that originate fromthree distinct classes of sensors: weather stations, visual sen-sors, and geophysical sensors. These classes generate differentdata streams that vary in several orders of magnitude withrespect to the size of a sample, the sampling rate, and the
Data Conversion
Raw Data
Data Cleaning
Non-conforming data,i.e., packet duplicates
System Model Meta-data
DataPublication
Domain userprocessing
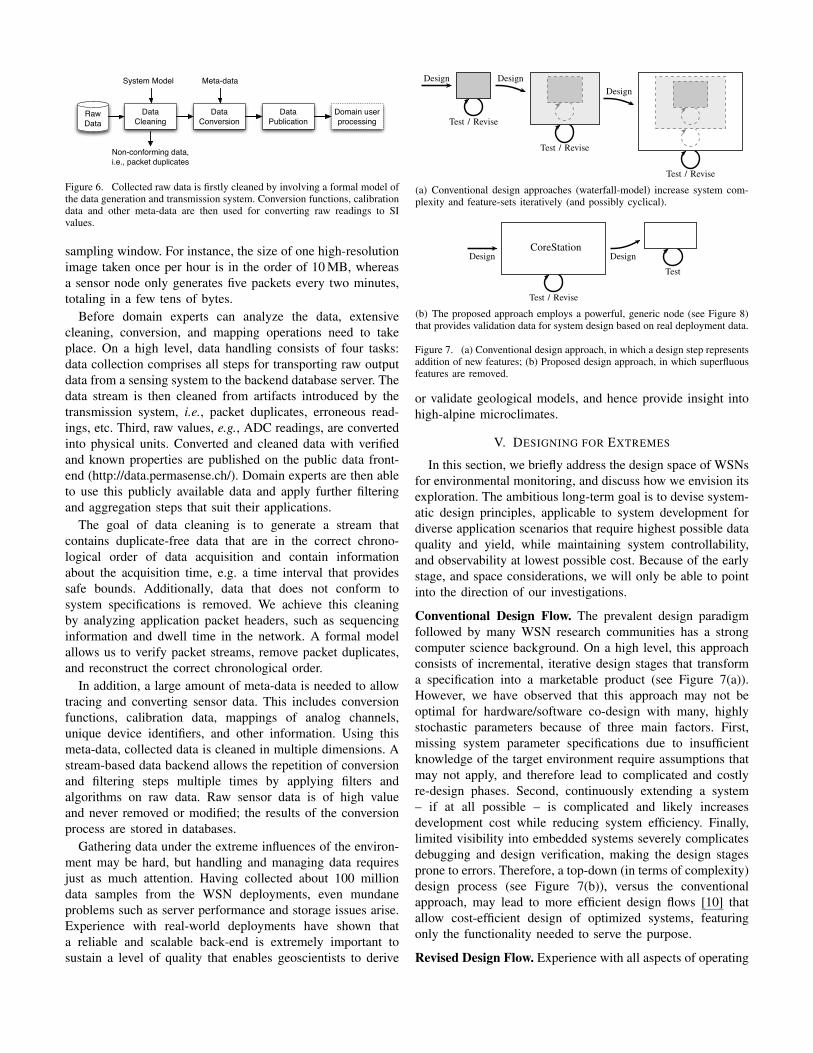
Figure 6. Collected raw data is firstly cleaned by involving a formal model ofthe data generation and transmission system. Conversion functions, calibrationdata and other meta-data are then used for converting raw readings to SIvalues.
sampling window. For instance, the size of one high-resolutionimage taken once per hour is in the order of 10 MB, whereasa sensor node only generates five packets every two minutes,totaling in a few tens of bytes.
Before domain experts can analyze the data, extensivecleaning, conversion, and mapping operations need to takeplace. On a high level, data handling consists of four tasks:data collection comprises all steps for transporting raw outputdata from a sensing system to the backend database server. Thedata stream is then cleaned from artifacts introduced by thetransmission system, i.e., packet duplicates, erroneous read-ings, etc. Third, raw values, e.g., ADC readings, are convertedinto physical units. Converted and cleaned data with verifiedand known properties are published on the public data front-end (http://data.permasense.ch/). Domain experts are then ableto use this publicly available data and apply further filteringand aggregation steps that suit their applications.
The goal of data cleaning is to generate a stream thatcontains duplicate-free data that are in the correct chrono-logical order of data acquisition and contain informationabout the acquisition time, e.g. a time interval that providessafe bounds. Additionally, data that does not conform tosystem specifications is removed. We achieve this cleaningby analyzing application packet headers, such as sequencinginformation and dwell time in the network. A formal modelallows us to verify packet streams, remove packet duplicates,and reconstruct the correct chronological order.
In addition, a large amount of meta-data is needed to allowtracing and converting sensor data. This includes conversionfunctions, calibration data, mappings of analog channels,unique device identifiers, and other information. Using thismeta-data, collected data is cleaned in multiple dimensions. Astream-based data backend allows the repetition of conversionand filtering steps multiple times by applying filters andalgorithms on raw data. Raw sensor data is of high valueand never removed or modified; the results of the conversionprocess are stored in databases.
Gathering data under the extreme influences of the environ-ment may be hard, but handling and managing data requiresjust as much attention. Having collected about 100 milliondata samples from the WSN deployments, even mundaneproblems such as server performance and storage issues arise.Experience with real-world deployments have shown thata reliable and scalable back-end is extremely important tosustain a level of quality that enables geoscientists to derive
DesignDesign
Test / Revise
Test / Revise
Test / Revise
Design
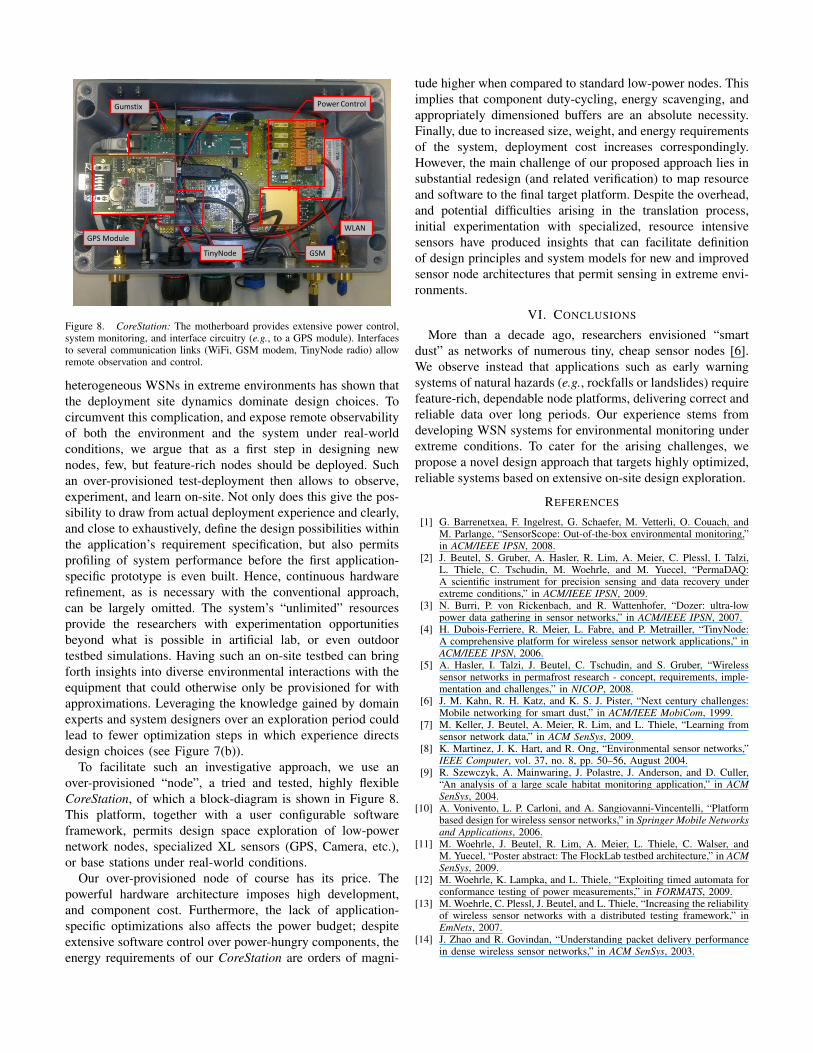
(a) Conventional design approaches (waterfall-model) increase system com-plexity and feature-sets iteratively (and possibly cyclical).
Test
Test / Revise
CoreStationDesign Design
(b) The proposed approach employs a powerful, generic node (see Figure 8)that provides validation data for system design based on real deployment data.
Figure 7. (a) Conventional design approach, in which a design step representsaddition of new features; (b) Proposed design approach, in which superfluousfeatures are removed.
or validate geological models, and hence provide insight intohigh-alpine microclimates.
V. DESIGNING FOR EXTREMES
In this section, we briefly address the design space of WSNsfor environmental monitoring, and discuss how we envision itsexploration. The ambitious long-term goal is to devise system-atic design principles, applicable to system development fordiverse application scenarios that require highest possible dataquality and yield, while maintaining system controllability,and observability at lowest possible cost. Because of the earlystage, and space considerations, we will only be able to pointinto the direction of our investigations.
Conventional Design Flow. The prevalent design paradigmfollowed by many WSN research communities has a strongcomputer science background. On a high level, this approachconsists of incremental, iterative design stages that transforma specification into a marketable product (see Figure 7(a)).However, we have observed that this approach may not beoptimal for hardware/software co-design with many, highlystochastic parameters because of three main factors. First,missing system parameter specifications due to insufficientknowledge of the target environment require assumptions thatmay not apply, and therefore lead to complicated and costlyre-design phases. Second, continuously extending a system– if at all possible – is complicated and likely increasesdevelopment cost while reducing system efficiency. Finally,limited visibility into embedded systems severely complicatesdebugging and design verification, making the design stagesprone to errors. Therefore, a top-down (in terms of complexity)design process (see Figure 7(b)), versus the conventionalapproach, may lead to more efficient design flows [10] thatallow cost-efficient design of optimized systems, featuringonly the functionality needed to serve the purpose.
Revised Design Flow. Experience with all aspects of operating
û
û
���û������û
�� ���û ���û
�����û�������û������û
��� û
Figure 8. CoreStation: The motherboard provides extensive power control,system monitoring, and interface circuitry (e.g., to a GPS module). Interfacesto several communication links (WiFi, GSM modem, TinyNode radio) allowremote observation and control.
heterogeneous WSNs in extreme environments has shown thatthe deployment site dynamics dominate design choices. Tocircumvent this complication, and expose remote observabilityof both the environment and the system under real-worldconditions, we argue that as a first step in designing newnodes, few, but feature-rich nodes should be deployed. Suchan over-provisioned test-deployment then allows to observe,experiment, and learn on-site. Not only does this give the pos-sibility to draw from actual deployment experience and clearly,and close to exhaustively, define the design possibilities withinthe application’s requirement specification, but also permitsprofiling of system performance before the first application-specific prototype is even built. Hence, continuous hardwarerefinement, as is necessary with the conventional approach,can be largely omitted. The system’s “unlimited” resourcesprovide the researchers with experimentation opportunitiesbeyond what is possible in artificial lab, or even outdoortestbed simulations. Having such an on-site testbed can bringforth insights into diverse environmental interactions with theequipment that could otherwise only be provisioned for withapproximations. Leveraging the knowledge gained by domainexperts and system designers over an exploration period couldlead to fewer optimization steps in which experience directsdesign choices (see Figure 7(b)).
To facilitate such an investigative approach, we use anover-provisioned “node”, a tried and tested, highly flexibleCoreStation, of which a block-diagram is shown in Figure 8.This platform, together with a user configurable softwareframework, permits design space exploration of low-powernetwork nodes, specialized XL sensors (GPS, Camera, etc.),or base stations under real-world conditions.
Our over-provisioned node of course has its price. Thepowerful hardware architecture imposes high development,and component cost. Furthermore, the lack of application-specific optimizations also affects the power budget; despiteextensive software control over power-hungry components, theenergy requirements of our CoreStation are orders of magni-
tude higher when compared to standard low-power nodes. Thisimplies that component duty-cycling, energy scavenging, andappropriately dimensioned buffers are an absolute necessity.Finally, due to increased size, weight, and energy requirementsof the system, deployment cost increases correspondingly.However, the main challenge of our proposed approach lies insubstantial redesign (and related verification) to map resourceand software to the final target platform. Despite the overhead,and potential difficulties arising in the translation process,initial experimentation with specialized, resource intensivesensors have produced insights that can facilitate definitionof design principles and system models for new and improvedsensor node architectures that permit sensing in extreme envi-ronments.
VI. CONCLUSIONS
More than a decade ago, researchers envisioned “smartdust” as networks of numerous tiny, cheap sensor nodes [6].We observe instead that applications such as early warningsystems of natural hazards (e.g., rockfalls or landslides) requirefeature-rich, dependable node platforms, delivering correct andreliable data over long periods. Our experience stems fromdeveloping WSN systems for environmental monitoring underextreme conditions. To cater for the arising challenges, wepropose a novel design approach that targets highly optimized,reliable systems based on extensive on-site design exploration.
REFERENCES
[1] G. Barrenetxea, F. Ingelrest, G. Schaefer, M. Vetterli, O. Couach, andM. Parlange, “SensorScope: Out-of-the-box environmental monitoring,”in ACM/IEEE IPSN, 2008.
[2] J. Beutel, S. Gruber, A. Hasler, R. Lim, A. Meier, C. Plessl, I. Talzi,L. Thiele, C. Tschudin, M. Woehrle, and M. Yuecel, “PermaDAQ:A scientific instrument for precision sensing and data recovery underextreme conditions,” in ACM/IEEE IPSN, 2009.
[3] N. Burri, P. von Rickenbach, and R. Wattenhofer, “Dozer: ultra-lowpower data gathering in sensor networks,” in ACM/IEEE IPSN, 2007.
[4] H. Dubois-Ferriere, R. Meier, L. Fabre, and P. Metrailler, “TinyNode:A comprehensive platform for wireless sensor network applications,” inACM/IEEE IPSN, 2006.
[5] A. Hasler, I. Talzi, J. Beutel, C. Tschudin, and S. Gruber, “Wirelesssensor networks in permafrost research - concept, requirements, imple-mentation and challenges,” in NICOP, 2008.
[6] J. M. Kahn, R. H. Katz, and K. S. J. Pister, “Next century challenges:Mobile networking for smart dust,” in ACM/IEEE MobiCom, 1999.
[7] M. Keller, J. Beutel, A. Meier, R. Lim, and L. Thiele, “Learning fromsensor network data,” in ACM SenSys, 2009.
[8] K. Martinez, J. K. Hart, and R. Ong, “Environmental sensor networks,”IEEE Computer, vol. 37, no. 8, pp. 50–56, August 2004.
[9] R. Szewczyk, A. Mainwaring, J. Polastre, J. Anderson, and D. Culler,“An analysis of a large scale habitat monitoring application,” in ACMSenSys, 2004.
[10] A. Vonivento, L. P. Carloni, and A. Sangiovanni-Vincentelli, “Platformbased design for wireless sensor networks,” in Springer Mobile Networksand Applications, 2006.
[11] M. Woehrle, J. Beutel, R. Lim, A. Meier, L. Thiele, C. Walser, andM. Yuecel, “Poster abstract: The FlockLab testbed architecture,” in ACMSenSys, 2009.
[12] M. Woehrle, K. Lampka, and L. Thiele, “Exploiting timed automata forconformance testing of power measurements,” in FORMATS, 2009.
[13] M. Woehrle, C. Plessl, J. Beutel, and L. Thiele, “Increasing the reliabilityof wireless sensor networks with a distributed testing framework,” inEmNets, 2007.
[14] J. Zhao and R. Govindan, “Understanding packet delivery performancein dense wireless sensor networks,” in ACM SenSys, 2003.