wps4402.pdf - world bank document
TRANSCRIPT

Policy ReseaRch WoRking PaPeR 4402
Product Market Regulation in Romania:
A Comparison with OECD Countries
Marianne FayDonato De Rosa Catalin Pauna
The World BankEurope and Central Asia RegionChief Economist OfficeNovember 2007
WPS4402P
ublic
Dis
clos
ure
Aut
horiz
edP
ublic
Dis
clos
ure
Aut
horiz
edP
ublic
Dis
clos
ure
Aut
horiz
edP
ublic
Dis
clos
ure
Aut
horiz
ed

Produced by the Research Support Team
Abstract
The Policy Research Working Paper Series disseminates the findings of work in progress to encourage the exchange of ideas about development issues. An objective of the series is to get the findings out quickly, even if the presentations are less than fully polished. The papers carry the names of the authors and should be cited accordingly. The findings, interpretations, and conclusions expressed in this paper are entirely those of the authors. They do not necessarily represent the views of the International Bank for Reconstruction and Development/World Bank and its affiliated organizations, or those of the Executive Directors of the World Bank or the governments they represent.
Policy ReseaRch WoRking PaPeR 4402
Less restrictive product market policies are crucial in promoting convergence to higher levels of GDP per capita. This paper benchmarks product market policies in Romania to those of OECD countries by estimating OECD indicators of Product Market Regulation (PMR). The PMR indicators allow a comprehensive mapping of policies affecting competition in product markets. Comparison with OECD countries reveals that Romania’s product market policies are less restrictive
This paper—a product of the Chief Economist Office of the Europe and Central Asia Region—is part of a larger effort to benchmark ECA countries against OECD countries in various dimensions of policy reform. Policy Research Working Papers are also posted on the Web at http://econ.worldbank.org. The author may be contacted at [email protected].
of competition than most direct comparators from the region and not far from the OECD average. Nonetheless, this achievement should be interpreted in light of the fact that PMR approach measures officially adopted policies. It does not capture implementation and enforcement, the area where future reform efforts should be directed if less restrictive policies are to have an effective impact on long-term growth prospects.

Product Market Regulation in Romania: A Comparison with OECD Countries
Marianne Fay, Donato De Rosa and Catalin Pauna Europe and Central Asia Region, The World Bank

TABLE OF CONTENTS
Acknowledgments ....................................................................................................................... i
Introduction..................................................................................................................................1
The PMR Methodology ...............................................................................................................2
Choosing Benchmarks .................................................................................................................6
The Romanian Context ................................................................................................................7
Benchmarking Production Market Policies in Romania..............................................................8
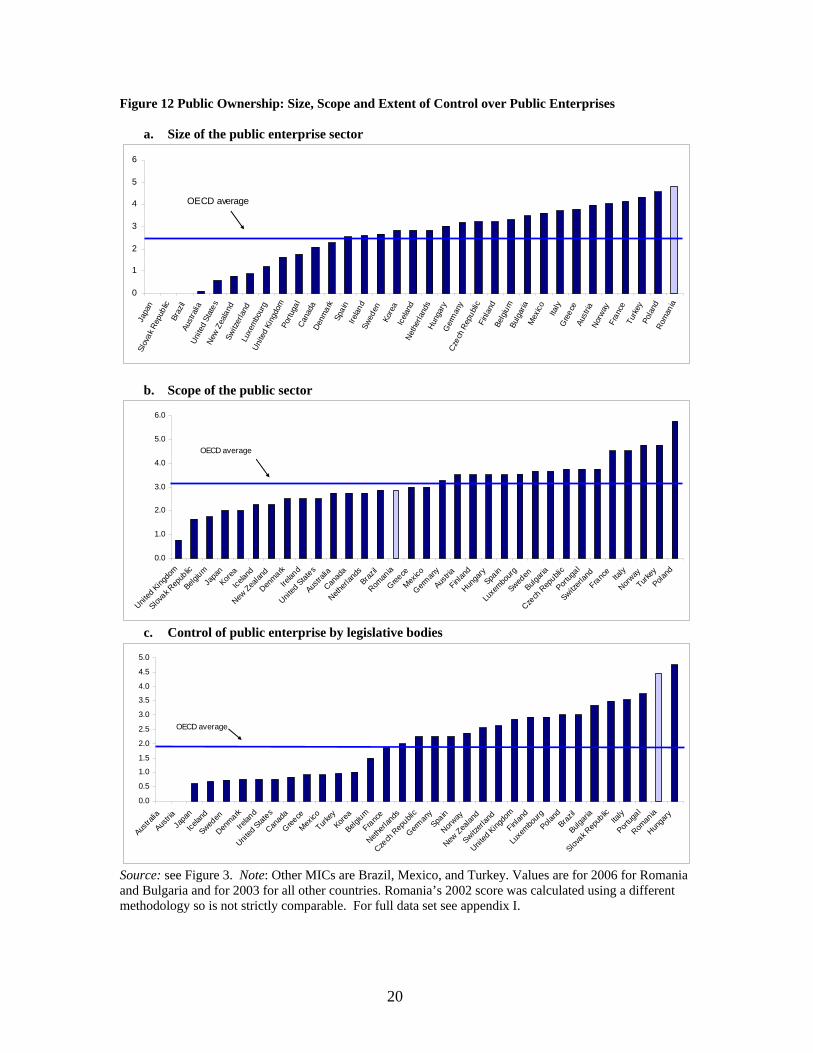
Inward Oriented Policies....................................................................................................12 Outward Oriented Policies.................................................................................................22
Conclusion: The Need to Focus on Implementation, Compliance and Enforcement................27
References..................................................................................................................................31
ANNEXES Annex I. Comparisons with Full Sample.......................................................................................33 Annex II. Detailed Results of PMR Survey for Romania..............................................................41

i
ACKNOWLEDGMENTS The team particularly wants to thank the OECD Economics Department, notably Paul Conway and Giuseppe Nicoletti, for sharing the PMR methodology and for their guidance in applying it. Detailed information about the PMR methodology is available, along with country specific data, at www.oecd.org/eco/pmr. The data collection effort that underlies the present report took place in the spring of 2006. We gratefully acknowledge the respondents from the following institutions for their diligent work in answering the detailed questionnaires: DMA, GSG, Ministry of Public Finance, Ministry of Economy and Commerce, Ministry of Transportation, the Competition Council, the Trade Registry, AVAS and CNVM. The present report is a product of an initiative funded by the Chief Economist Office of the ECA region and initiated by Ali Mansoor (ECAVP) on benchmarking ECA countries with OECD ones.

1
INTRODUCTION 1. On January 1, 2007, Romania became a member of the European Union. This achievement was in part made possible by a substantial reform effort that has allowed Romania to make impressive progress towards long-term stability and sustained growth in the last six years. 2. Nonetheless, the income gap with the new member states of the EU remains large. In order to sustain growth and improve competitiveness, a second generation of reforms has been put in place to help the country’s successful integration in EU and global markets. A cornerstone of this reform agenda is the implementation of less restrictive product market policies that enable firms to put resources, both capital and labor, to their most efficient use. 3. This paper presents a comparative analysis of Romania’s performance in product market regulation (PMR). The approach used relies on a methodology developed by the OECD (Conway, Janod and Nicoletti 2005), that measures the degree to which domestic policies inhibit or promote competition. The data – which are derived from a self-reported survey – is policy-focused as opposed to perception based (or based on market outcomes). It is available for OECD members and Brazil. Data for Romania were first collected in 2002 in the context of an OECD country study on Romania (OECD 2002a) and then again in early 2006. 4. The key finding is that Romania’s product market policies appear to be less restrictive of competition than most direct comparators from the region and not far from the OECD average (as estimated on the basis of data collected in 2003). This result is particularly impressive when compared to its earlier score: OECD (2002a), employing an earlier version of the PMR methodology, found that product market policies in Romania were among the most restrictive compared to OECD countries. This implies that over the past few years Romania has engaged in a comprehensive reform effort across a wide array of product market policies. Such striking improvement is in line with the findings of other surveys such as Doing Business, which shows Romania to have improved its ranking from 71 out of 155 countries in 2005 to 49 out of 175 in 2006. 5. There are, however, two important caveats to this otherwise impressive achievement. The first is that the PMR approach measures officially adopted policies. It does not capture implementation and enforcement. In fact, interviews with business association suggest a significant gap between officially adopted policies, on the one hand, and implementation and enforcement, on the other. While Romania has achieved impressive results in terms of having laws that are more conducive to private sector development, the lack of a greater effort in terms of implementation and enforcement would substantially reduce the impact of the policies adopted in recent years that could hurt the competitiveness of the Romanian economy in the longer run. 6. The second is that the analysis compared Romania in 2006 with OECD countries in 2003 (the latest year in which a PMR survey was conducted). This does not detract

2
from the remarkable progress Romania has made and certainly allows for a relevant comparison between Romania and other countries of the region just prior to their joining the EU. However, it does imply that Romania’s excellent performance leaves no room for complacency. Most OECD countries have actively continued to improve their product markets over the last three or four years. As such, the present paper overestimates how Romania ranks relative to competitors today. 7. The present paper provides a detailed look at the various components of product market regulation and suggests areas in which further progress could be made, at least with respect to official policies. Some steps to improve implementation are also proposed. These include (i) greater political commitment at the highest level to take the lead in application and enforcement of rules and regulations; (ii) changes in the institutional architecture of the government to improve oversight and coordination; and (iii) implementation of measures to enhance the capacity of the public administration, especially its lower echelons, to support the reform agenda. 8. We now turn to a presentation of the PMR methodology and a discussion of the choice of benchmarks, before presenting the results of the benchmarking exercise, looking first at inward oriented policies before briefly discussing outward oriented policies (which, as of January 1, 2007, are largely governed by EU rules and agreements). The last section concludes with some suggestions for next steps.
THE PMR METHODOLOGY 9. A regulatory environment propitious to competition in product markets is widely believed to have positive repercussions on long run economic performance (Nicoletti and Scarpetta 2003) and productivity convergence (Conway et al. 2006a and 2007). This may occur by promoting a more efficient allocation of resources both across and within sectors (Nickel 1996). A more competitive environment may also stimulate innovation and technological diffusion, thus enhancing dynamic efficiency (Aghion et al., 2001). 10. Product market regulation (PMR) is measurable through a methodology developed at the OECD relying on the OECD Regulatory indicators questionnaire. The methodology and key findings of the PMR for OECD countries are presented in Nicoletti et al. (1999) and Conway et al. (2005). The PMR indicators summarize information on economy-wide and industry-specific regulatory provisions. 11. The PMR indicators are designed to reflect regulations that have the potential to restrict competition in areas where competition is viable. By construction, they have a number of features which make them useful not only for analysis, but, more importantly, for policy advice, since they allow to pinpoint specific policies that hamper competition in product markets. First, PMR indicators are focused on enacted policies and not on outcomes, implying that they are ‘objective’, in that they are not based on opinion surveys. Second, since the summary PMR indicator is constructed as the average of well defined components, PMR scores can be related to specific underlying policies, thus providing precise inputs in the phase of policy recommendation. Finally, PMR indicators

3
focus on regulatory measures that affect the economy at large and can therefore be considered as comprehensive measures of regulatory restrictiveness. Their advantages notwithstanding, PMR indicators are not designed to capture informal regulatory practices nor the effective enforcement of regulations, since they are only concerned with formal compliance with a number of criteria. 12. Data were collected for Romania for the purpose of the present exercise, covering four of the six “sections” of the OECD product market regulation database.1 The first section deals with general regulatory policy issues, concerning public ownership; market access and competition issues; market structure and vertical relationships in utilities and other network industries. The second section covers regulatory and administrative policies, such as processes and capacities in the public administration. The third section covers regulation in transportation industries, focusing on market access, business conduct, and market structure in road freight, railways and passenger air travel. The final section covers regulation in retail distribution, focusing on the regulatory environment, industry behavior and prices. Information from Doing Business 2006 was used for a fifth section of the PMR - administrative burdens on startups. Figure 1. The PMR indicator system
Economic regulation
Administrative regulation
1.The numbers in brackets indicate the weight given to each lower level indicator in the calculation of the higher level indicator immediately above it.
The weights were derived by applying principal components analysis to the set of indicators in each of the main regulatory domains (state control, barriers to
entrepreneurship, barriers to trade and investment, economic regulation and administrative regulation). The same approach was used to derive the weights used
to calculate the indicators of inward and outward-oriented policies and the overall PMR indicator. The principal components analysis was based on
the original 1998 data.
2. Two indicators from the 1998 version of the PMR indicators ('Special voting rights' and 'Control of public enterprise by legislative bodies') have been combined into this indicator.
Outward-oriented policies (0.41)
State control (0.49)Barriers to
entrepreneurship (0.51)
Barriers to trade and investment (1.0)
Public ownership (0.56)
Involvement in business operation
(0.44)
Product market regulation
Inward-oriented policies (0.59)
Barriers to competition
(0.22)
Scope of public enterprise sector
(0.30)Price controls (0.45)
Licenses and permits system (0.55)
Administrative burdens for corporation (0.36)
Explicit barriers to trade and investment (0.70)
Regulatory and administrative opacity
(0.48)
Administrative burdens on
startups (0.30)
Regulatory barriers (1.0)
Legal barriers (0.30) Discriminatory procedures (0.24)
Other barriers (0.30)
Foreign ownership barriers (0.45)
Size of public enterprise sector
(0.30)Use of command & control regulation
(0.55)
Communication and simplification of rules
and procedures (0.45)
Administrative burdens for sole proprietor firms (0.30)
Direct control over business
enterprises2
(0.40)
Antitrust exemptions (0.70)Sector specific administrative
burdens (0.34) Tariffs (0.31)
{regulation data} {regulation data} {regulation data}{regulation data} {regulation data} {regulation data} {regulation data}
Source: Conway et al. (2005) 13. The structure of the PMR system is shown in Figure 1. The system is composed of 16 basic or ‘low-level’ indicators, each capturing a specific aspect of the regulatory 1 The OECD questionnaire adapted for Romania is provided in Annex 2. For a comprehensive reference see www.oecd.org/eco/pmr.

4
regime as described in Box 1. The basic indicators are progressively aggregated in more comprehensive policy areas. The highest level of aggregation corresponds to the summary measure of product market regulation in the country.

5
Box 1. The 16 low-level PMR indicators
These indicators cover a wide range of product market policies and include:
INWARD ORIENTED POLICIES
State control: Public ownership
Scope of public enterprises: this indicator measures the pervasiveness of state ownership across business sectors as the proportion of sectors in which the state has an equity stake in at least one firm.
Size of public enterprise: reflects the overall size of state-owned enterprises relative to the size of the economy.
Direct control over business enterprises: measures the existence of government special voting rights in privately-owned firms, constraints on the sale of state-owned equity stakes, and the extent to which legislative bodies control the strategic choices of public enterprises.
State control: Involvement in business operations
Price controls: reflects the extent of price controls in specific sectors.
Use of command and control regulation: indicates the extent to which government uses coercive (as opposed to incentive-based) regulation in general and in specific service sectors.
Barriers to entrepreneurship: Regulatory and administrative opacity
Licenses and permits systems: reflects the use of ‘one-stop shops’ and ‘silence is consent’ rules for getting information on and issuing licenses and permits.
Communication and simplification of rules and procedures: reflects aspects of government’s communication strategy and efforts to reduce and simplify the administrative burden of interacting with government.
Barriers to entrepreneurship: Administrative burden on corporations
Administrative burdens for corporations: measures the administrative burdens on the creation of corporations.2
Administrative burdens for sole proprietors: measures the administrative burdens on the creation of sole proprietor firms.3
Sector-specific administrative burdens: reflects administrative burdens in the road transport and retail distribution sectors.
Barriers to entrepreneurship: Barriers to competition
Legal barriers: measures the scope of explicit legal limitations on the number of competitors allowed in a wide range of business sectors.
Antitrust exemptions: measures the scope of exemptions to competition law for public enterprises.
OUTWARD ORIENTED POLICIES
Barriers to trade and investment: Explicit barriers
Foreign Ownership barriers: reflects legal restrictions on foreign acquisition of equity in public and private firms and in the telecommunications and airlines sectors.
Tariffs: reflects the (simple) average of most-favoured-nation tariffs.
Discriminatory procedures: reflects the extent of discrimination against foreign firms at the procedural level.
Barriers to trade and investment: Regulatory barriers
Regulatory barriers: reflects other barriers to international trade (e.g. international harmonisation, mutual recognition agreements).
_______________________________
Source: reproduced from Conway, Janod and Nicoletti, 2005
2 Data from Doing Business in 2005 was used to construct this indicator. 3 This indicator is not available for Romania as information about it was not included in the adapted questionnaire for Romania.

6
14. The indicators are calculated on the basis of the qualitative and quantitative information obtained from questionnaire answers. Qualitative data are assigned a numerical value that allows ordering each of the possible responses to a given question. Quantitative information is ranked by subdividing it into categories based on a system of thresholds. The coded information is then normalized over a scale of zero to six. These data are then aggregated into basic or ‘low-level’ indicators by assigning subjective weights to the various regulatory requirements. Given the normalization of the basic data, all the low-level indicators also have a scale of zero to six, reflecting increasing restrictiveness of regulatory areas.4 A detailed description of the low level indicators is presented in the Annex. 15. Basic indicators are then aggregated into broader regulatory domains. Higher level indicators are calculated as weighted averages of their constituent lower level indicators. The attribution of lower-level indicators to each higher-level indicator, and the weights used in the aggregation, are based on principal component analysis (Nicoletti et al., 1999). At the highest level of aggregation the overall indicator of product market regulation summarizes the restrictiveness of the regulatory framework in the product market. The structure of the PMR system, with progressive levels of aggregation, has the advantage of allowing a decomposition of higher-level indicators, with an increasing degree of detail, into the values of the more disaggregated indicators, each corresponding to specific regulatory provisions.
CHOOSING BENCHMARKS 16. The most obvious benchmarks for Romania are Bulgaria (for which data are available for 2006), and the countries of Central and Eastern Europe that are also OECD members (Czech Republic, Hungary, Poland and the Slovak Republic collectively referred to as the OECD CEE). The fact that the data are from 2003, when the OECD CEE were at about the same point as Romania in 2006 relative to their accession to the EU, makes them even better benchmarks. Nevertheless, when interpreting comparative results, it should be kept in mind that comparators are likely to have made further progress since 2003. 17. Additionally, comparison with Romania’s 2002 PMR results provides an indication of the progress made in product market policies. However, since the 2002 PMR was estimated using an earlier methodology, the 2006 and 2002 scores for Romania are not strictly comparable. Nonetheless, both the order of magnitude and the relative standing of Romania clearly show an impressive drive towards adoption of product market policies that are less restrictive of competition in recent years. 5 18. Extension of the benchmarking exercise to Brazil, Mexico and Turkey offers a broader perspective on other middle income countries (MICs) with different historical
4 The calculation of low-level indicators, including the weights used, is based on Conway et al. (2005). 5 See Nicoletti and Scarpetta (1999) for a description of PMR 1998 results. Conway et al. (2005) re-estimate PMR 1998 indicators using the PMR 2003 methodology and show that orders of magnitude and country rankings remain virtually unchanged.

7
experiences. Finally, comparison with the OECD or high income EU15 countries helps identify longer-term objectives for policymakers.6 19. These benchmarks are used in the graphs. Romania’s score relative to the full set of countries (30 OECD members in 2003, Brazil in 2004 and Bulgaria in 2006) is shown in Appendix I for all PMR indicators.
THE ROMANIAN CONTEXT 20. Until 2000, Romania was one of the poorest performing economies of Central and Eastern Europe. The turnaround in 2000 was preceded by a protracted and precipitous decline in GDP, a peaking of the poverty rate to 36 percent, and inflation of 54 percent per year. EU accession aspirations and the opening of official entry negotiations with the EU in December 1999 spurred Romania’s commitment to reforms. This led to significant macroeconomic consolidation and impressive growth in recent years. 21. As a result of the reforms, the economy has been growing at a robust 5 to 6 percent per year over the last six years. The main drivers for this growth have been investment and exports - and occasionally domestic consumption - that responded strongly to improved confidence in banks and macroeconomic stabilization. Inflation declined from above 40 percent in 2000 to 4.9 percent in 2006, the lowest level since the start of the transition. Fiscal consolidation, characterized by a cut in public expenditures of around 4% of GDP, allowed for a reduction in both inflationary pressures and the consolidated budget deficit. The latter shrank from 4.1 percent of GDP in 2000 to 1.7 percent in 2006. In addition, a combination of sustained growth and external migration permitted a substantial decrease in registered unemployment, down to around 5 percent of the labor force. 22. The EU accession process also set the stage for a broad and sustained structural and institutional reform agenda. Privatization of commercial companies picked up, especially in banking and the energy sector, though it slowed down somewhat in 2006. Foreign direct investment (FDI) substantially increased after 2000, with inflows exceeding 5-6 percent of GDP per year recently. Institutional and governance reforms advanced, with the first generation measures, focused on the establishment of the legal framework and the redesign of the institutional architecture of the public sector, either adopted or in the process of being implemented. 23. Important steps were also taken to upgrade the regulatory framework for businesses, remove administrative barriers and enhance the business climate. A major step forward was the adoption by the government, starting with 2001, of an annual Action Plan to remove administrative barriers to businesses.7 The implementation of the Action Plan, updated annually, is overseen by a working group representing stakeholders, and its results are measured through surveys. This has led to the simplification of administrative
6 The EU15 includes Austria, Belgium, Denmark, Finland, France, Germany, Greece, Ireland, Italy, Luxembourg, Netherlands, Portugal, Spain, Sweden, United Kingdom. 7 This was supported by a program with the World Bank (the PSAL and subsequent PAL programs).

8
and regulatory procedures and the decrease of the transaction costs for business entry and operation. As a result, Romania was ranked as the second most dynamic reformer in the world by the World Bank 2007 Doing Business report it terms of improving the legal and regulatory framework for business. 24. These remarkable achievements notwithstanding, important aspects of the regulatory environment still need to be improved. This is true with regard to the quality of the rules and regulations, but more so with respect to their efficient enforcement. Business surveys suggest that sizeable regulatory obstacles to resource allocation remain, unnecessarily increasing the transaction costs for companies and hampering job creation. Some of these will be further documented in the paper. 25. A central element of the regulatory reform agenda to be pursued by Romania is the continued implementation of less restrictive factor and product market policies and, even more so, the strengthening of the institutional framework for their effective implementation. This would encourage a more efficient allocation of resources and improve labor productivity. This is especially important given the significant gaps that Romania has in terms of incomes and productivity with EU members and the demographic trends laying ahead. Romania entered the EU with an estimated per capita income level of about 35% of the average for EU-15.8 In addition, employment and participation rates, albeit improving recently, remain among the lowest in the EU. Evidence suggests that the reforms are paying off and that Romania is gradually, but constantly, catching up with the EU.
BENCHMARKING PRODUCTION MARKET POLICIES IN ROMANIA 26. Enhancing competition in product markets has been found to positively affect GDP per capita by providing incentives to firms to reallocate resources to more productive activities, increase innovation and technological diffusion. In addition, less restrictive regulations may positively affect employment by reducing the rents that some firms extract from overregulation and force firms to expand their activities9. 27. Benchmarking product market regulation has proved to be a useful tool for monitoring the performance of policies and institutions in OECD countries and for identifying specific policy gaps, thus offering the opportunity to benefit from the experience of other member states. Two surveys have been conducted so far collecting data for 1998 and 2003. Results from these surveys point to a convergence in product market policies across OECD countries, with substantial improvements achieved by countries that originally exhibited relatively restrictive product market regulations, such as Poland, Turkey, Czech Republic, Greece, Italy, France, Mexico, Korea, Hungary, and Spain (Figure 2) Substantial improvements in easing product market policies have been also achieved among EU15 countries where the average PMR score fell from 2.1 in 1998 to 1.4 in 2003. While this reflects the increasing harmonization of EU common market rules, the PMR benchmarking may have been instrumental in fostering this improvement. 8 Eurostat. 9 Conway, Janod, Nicoletti (2005).

9
Figure 2. Product Market Regulation among OECD countries, a comparison between 1998 and 2003
00.5
11.5
22.5
33.5
4
Austra
lia
United
Kingdo
m
Icelan
dU.S.
Denmark
Irelan
d
New Zea
land
Canad
a
Sweden
Luxe
mbourgJa
pan
Finlan
d
Austria
Belgium
Netherl
ands
Slovak R
ep.
German
y
NorwayKore
a
Portug
al
Spain
France
Czech
Rep
.
Switzerl
and
GreeceIta
ly
Hunga
ry
Mexico
TurkeyPola
ndEU15
1998 2003
Source: Conway et al. (2005). Note: the 1998 data were re-based to be made more comparable to the 2003 data, given the change in methodology. This explains the slight differences in the data for 1998 between figure 2 and figure 3.a. 28. This positive effect is very much noticeable in Romania. In 2002 it ranked towards the bottom of the league of the 28 countries for which the overall PMR indicator was available. In 2006, out of 33 countries, Romania can confidently be ranked as one of the “middle of the road” countries, a remarkable progress by any measure (Figure 3.a and 3.b).

10
Figure 3.a Product market regulation – Romania’s ranking in 2002
0
0.5
1
1.5
2
2.5
3
3.5
United K
ingdom
Irelan
d
Australia
United S
tates
New Zealand
Sweden
Netherlan
ds
Austria
Denmark
German
y
Canada
Japa
n
Hungary
Spain
Finland
Portugal
Switzerla
nd
Mexico
BelgiumFran
ce
Norway
Greece Ita
lyKore
a
Romania
Turkey
Czech
. Rep
.
Poland
Source: Nicoletti et al. (1999) and OECD (2002a). Note: Data refer to 2002 for Romania and 1998 for other countries. Methodology changed somewhat in 2003 so the ratings are not strictly comparable between Figures 3.a and 3.b. For details on the change see Conway et al (2005). Figure 3.b Product market regulation – Romania’s ranking in 2006
0
1
2
3
4
United
King
dom
Austra
lia
United
Stat
es
New Zea
land
Canad
aIce
land
Denmark
Slovak
Rep
ublic
Irelan
dLu
xembo
urgSwed
enJa
pan
Finlan
dNeth
erlan
dsGerm
any
Austria
Belgium
Norway
Roman
iaPort
ugal
Spain
Korea
Switzerl
and
Bulgari
aFran
ceCze
ch. R
ep.
Italy
Greece
Hunga
ryMex
icoTurk
eyPola
nd
Product market regulation90% confidence interval (2003) 2003 PMR Indicator
Relatively Restrictive
Relatively Liberal
Source: Conway, Janod, Nicoletti (2005) and, for Bulgaria and Romania, World Bank estimates based on information provided by Bulgarian and Romanian authorities and Doing Business in 2005. Note: the values refer to 2006 for Romania and Bulgaria, 2004 for Brazil, and 2003 for all other countries. Note: Values refer to 2006 for Bulgaria and Romania and 2003 for all other countries. The confidence intervals are calculated using stochastic weights on the low-level indicators to generate a distribution of overall PMR indicators for each country. The 90 per cent confidence intervals are calculated from that distribution. Indicator values for the 'relatively liberal' and 'relatively restrictive' countries are significantly different at the 90 percent level of confidence (Conway, Janod, Nicoletti, 2005).

11
29. Today, rules and regulations governing Romania’s product market policies are less restrictive than most other middle income countries. Even relative to its closest comparators, Bulgaria in 2006 and the OECD countries of Central and Eastern Europe in 2003, Romania appears to be among the less restrictive countries, positioning itself slightly above the OECD and EU averages (Figure 4). Figure 4. Product Market Regulation - Country Comparison
1.4 1.4 1.5
2.0 2.1
1.6
2.8
1.81.7
0.0
0.5
1.0
1.5
2.0
2.5
3.0
SlovakRepublic
2003
EU152003
OECD2003
Romania2006
CzechRepublic
2003
Bulgaria2006
Hungary2003
OtherMICs2003
Poland2003
Source: see Figure 3. Note: Other MICs are Brazil, Mexico, and Turkey. OECD CEE include Czech Republic, Hungary, Poland, and Slovak Republic. The values refer to 2006 for Romania and Bulgaria, 2004 for Brazil, and 2003 for all other countries. Romania’s 2002 score was calculated using a different methodology so is not strictly comparable. 30. We now turn to an analysis of the various components of the PMR indicator, in order to examine in greater detail some of the drivers of this excellent performance, but also to identify remaining sources of restrictiveness of product market regulation. A useful approach in doing so is to decompose the indicator into inward and outward oriented policies. The former include policies and regulations that determine the degree of state control and barriers to entrepreneurship, while the latter reflect policies and regulations that affect barriers to trade and investment. Detailed description of the basic indicators included in the indicators of inward and outward oriented policies follows in the next sections. 31. In general, average performance seems better in all countries for outward- than for inward-oriented policies (Figure 5). This is certainly due to the requirements imposed by international agreements - such as the WTO charters, and, for EU countries, membership of the European Union - which are more binding in matters concerning trade and foreign direct investment. Greater reform challenges, as well as greater cross-country variation, lie with the regulations that fall under the category of inward-oriented policies. Within this general framework, Romania’s product market regulations appear to be more restrictive of competition than the OECD and EU averages for outward oriented policies and around the OECD and EU averages for inward oriented policies.

12
Figure 5. Inward and outward oriented policies (a) Inward-oriented policies (b) Outward oriented policies
1.3
1.8 1.8 1.82.1 2.2 2.2 2.4
2.9
0.0
0.5
1.0
1.5
2.0
2.5
3.0
Slovak R
epublic
OECDEU15
Romania
Bulgaria
MICs
Czech
Rep.
Hungar
y
Poland
0.91.1 1.1
1.4 1.41.5 1.5
2.0
2.5
0.0
0.5
1.0
1.5
2.0
2.5
3.0
EU15
Czech
Rep
.
OECD
Roman
ia
Bulgari
a
Slovak R
epub
lic
Hungary
MICs
Poland
Source: see Figure 3. Note: Other MICs are Brazil, Mexico, and Turkey. Values refer to 2006 for Romania and Bulgaria, 2004 for Brazil, and 2003 for all other countries. Romania’s 2002 score was calculated using a different methodology so is not strictly comparable. For full data set see appendix I. 32. The fact that Romania positions itself around the EU average for inward oriented policies suggests that it has already met most of the requirements of the acquis communautaire. More generally, the great progress observed since 2002 in inward-oriented policies can be attributed to both the implementation of the acquis communautaire (e.g. competition policy), and to implementation of less restrictive policies in areas that are subject to domestic discretion. This indicates that the government has been diligent in complying with international commitments in domains that are often controversial from the standpoint of gathering sufficient domestic consensus. 33. As for outward-oriented policies, the data, hence the ranking and score, reflect policies in place as of the spring of 2006. A number of these have changed by the mere fact of Romania joining the EU and therefore becoming governed by EU trade policies and agreements. Inward and outward oriented policies and the underlying indicators are discussed in details below. Inward Oriented Policies 34. In order to identify the drivers of Romania’s progress since 2002, inward-oriented policies can be decomposed into two broad categories: indicators of state control and barriers to entrepreneurship (Figure 6).

13
Figure 6. Barriers to entrepreneurship and state control a. Barriers to entrepreneurship b. State control
0.5
1.1 1.2 1.3 1.4 1.51.9 2.0
2.3
0.00.5
1.01.52.0
2.53.0
3.54.0
Romania
Bulgaria
Slovak R
epublic
EU15
Hungar
yOECD
Czech
Rep.
MICs
Poland
1.4
2.1 2.3 2.4 2.5
3.2 3.2 3.33.6
0.00.5
1.01.5
2.02.5
3.03.5
4.0
Slovak R
epublic
OECDEU15
MICs
Czech
Rep.
Bulgaria
Romania
Hungar
y
Poland
Source: see Figure 3. Note: Other MICs are Brazil, Mexico, and Turkey. Values refer to 2006 for Romania and Bulgaria, 2004 for Brazil, and 2003 for all other countries. Romania’s 2002 score was calculated using a different methodology so is not strictly comparable. For full data set see appendix I. 35. Barriers to entrepreneurship (such as barriers to competition, regulatory and administrative opacity, and administrative burdens on start-ups) which were already low in 2002, have since declined further in 2006, thus placing Romania in a better position than all comparator groups, including other middle income countries, pre-accession Central European countries, as well as the OECD average. 36. Visible but still limited progress has been made in the area of state control, where Romania still lags behind the OECD and EU averages and far from the performance of its more direct comparators, such as the Slovak Republic in 2003. Nonetheless, Romania’s disengagement from state control since 2002 mirrors the evolution of state control in the OECD, where countries that had relatively restrictive policies in 1998 have succeeded in reducing the extent of state control in 2003 by removing price controls and reducing reliance on coercive, as opposed to incentive-based, regulations.
Barriers to Entrepreneurship
Barriers to Competition 37. In terms of barriers to competition (as measured by licenses and permits requirements and antitrust exemptions) Romania’s performance is comparable to both the rest of the EU and other MICs (Annex Table A1.3). This is largely due to Romania’s diligence in incorporating EU rules and practices in national legislation. This resulted in the elimination of antitrust exemptions for state-owned enterprises (Campeanu et al., 2003). In this regard Romania fares very well and even better than EU15 and the average for the OECD countries (Figure 7). 38. On the other hand, Romania’s performance in terms of other legal barriers to competition, in the form of explicit legal limitations on the number of competitors allowed in certain business sectors, appears to have worsened relative to 2002. This

14
could well be due to the change in methodologies. Whatever the reason, this appears to be one of the few categories in which Romania does not rank well. As in many other OECD and EU countries, this result appears to be driven by the existence of legal restrictions to entry in network and utilities sectors, such as rail, road and air transport infrastructure; electricity generation, transmission, distribution and supply; and gas production, transmission, distribution and supply; and telecommunications (see table A2.10 for details). Figure 7. Barriers to Competition a. Legal barriers (licenses and permit requirements)
b. Antitrust exemptions
0.6 0.6
1.11.4 1.4 1.4
1.6 1.82.0
0.0
0.5
1.0
1.5
2.0
2.5
Poland
Slovak
Rep
ublic
Bulgari
a
Czech
Rep
.EU15
OECD
Hunga
ryMIC
s
Roman
ia
0.0 0.0 0.0 0.0 0.0
0.30.4
0.9
1.2
0.0
0.5
1.0
1.5
Bulgari
a
Czech
Rep.
Poland
Romania
Slovak R
epubli
cEU15
OECD
Hunga
ryMIC
s
Source: see Figure 3. Note: Other MICs are Brazil, Mexico, and Turkey. Values refer to 2006 for Romania and Bulgaria, 2004 for Brazil, and 2003 for all other countries. Romania’s 2002 score was calculated using a different methodology so is not strictly comparable. For full data set see appendix I. Regulatory and Administrative Opacity 39. Romania scores well in terms of regulatory and administrative opacity (Annex table A1.3). It has made substantial progress in the simplification of licenses and permits, (Figure 8a) while maintaining its 2002 best practice positioning in terms of communication and simplification of rules and procedures (Figure 8b). The indicator captures aspects of the government’s communication strategy and its efforts to reduce and simplify the administrative burden of interacting with the government. 40. This reflects the substantial efforts made by Romania in streamlining licensing regimes since the previous PMR survey (OECD 2002a). Indeed, the simplification of licensing procedures has been a central theme of the country’s Action Plans for improving the business environment. Important milestones in the simplification process include: the reduction of the number of products and services requiring licensing; the removal of some barriers to free trade, the elimination of some import-export licenses; the simplification of licensing procedures for retailers through the elimination of ex-ante licenses, the use of voluntary assumption of responsibility statements, the strengthening of ex-post control and monitoring; the establishment of the one-stop shop and the elimination of some licenses; the adoption of the Silent Approval Law (2003), which establishes a maximum period of 30 days for the approval of a certain set of licenses and authorizations from the moment of the application.

15
Figure 8. Regulatory and Administrative Opacity a. Licenses and permit system b. Communication and simplification of rules
0.0 0.0 0.0
2.0 2.0 2.0 2.22.7
4.0
0.00.51.01.52.02.53.03.54.04.5
Hungary
Romania
Slovak R
epub
lic
Bulgari
aEU15
Poland
OECDMIC
s
Czech
Rep
.
0.10.3
0.5 0.5 0.5 0.5 0.5
0.8
1.4
0.00.20.40.60.81.01.21.41.6
Romania
Bulgar
iaMIC
s
Czech
Rep
.
Hungary
OECDEU15
Poland
Slovak R
epub
lic
Source: see Figure 3. Note: Other MICs are Brazil, Mexico, and Turkey. Values refer to 2006 for Romania and Bulgaria, 2004 for Brazil, and 2003 for all other countries. Romania’s 2002 score was calculated using a different methodology so is not strictly comparable. For full data set see appendix I. 41. Romania has also implemented a number of reforms to improve the communication of rules and procedures to affected parties. The annual Action Plans to improve the business environment contain communication components whose aim is to enhance the interaction between the administration and the business community, some of which are discussed in Box 2.
42. Improvements in this domain are reflected in firm level surveys. For instance, BEEPS data suggest that the percentage of senior management time devoted to dealing with public officials in connection with regulation or access to public services has
Box 2. Romania’s efforts at simplification and better communication of rules and regulations Measures adopted as part of the Plans include the development of a government site targeting communication with businesses (www.mdp-mediuafaceri.ro), which contains updated information relevant for companies, such as changes in legislation, explanation of implementation norms for laws, links to relevant ministries and government agencies, funding opportunities. Most of the important pieces of legislation impacting upon the business climate, such as the Silence-is-consent Law, the Decisional Transparency Law, the Free Access to Public Information Law, also benefited from broad media dissemination campaigns, including TV, radio and newspapers presentations, brochures and posters, direct free access telephone information lines to the government. Other traditional means of communication, such as meetings with relevant stakeholders, including businesses associations were broadly used, and company surveys were carried out, including by FIAS, to capture satisfaction with the changes and suggestions for further measures. To improve the interface between government and companies, an e-government site (www.e-guvernare.ro) was established. The site allows businesses to access various forms and documents relevant for the interaction with the authority. A stakeholders group, which includes the most important business associations, oversees the implementation of the Action Plans.

16
declined from over nine percent to less than two percent between 2002 and 2005.10 Nonetheless, despite these substantial efforts and achievements, the communication strategies of the authorities only partially succeeded to reach the mass of companies impacted upon. Many firms still complain about a gap between the provisions of the rules and their practical implementation, while others continue to find the access to relevant information difficult. Surveys suggest, for example, that many companies have not even heard about the Silent Approval law. 43. Perhaps as a result the improvements in the rules and regulations were not reflected in perception-based indicators. Thus, Doing Business 2007 ranks Romania 116th out of 172 countries in terms of dealing with licenses, even though Romania does well in the overall ease of doing businesses. A similar finding is reported by the BEEPS surveys that report that 40% of firms consider licenses to be a problem for doing business in the country. This is substantially worse than among comparator countries, and does not appear to have improved markedly since 2002 (Figure 9). 44. Surveys and discussions with companies suggest that, while a limited number of firms seems to be severely affected, most of the difficulties arise for those requesting production and construction licenses. The procedures for obtaining a construction authorization and the certificate for urbanism seem to be long. The procedures to subsequently connect buildings to utilities, mainly gas and electricity, are also long and relatively costly. This paper recommends continuing the simplification of these procedures, as this is critical to the smooth implementation of projects financed from the EU structural and cohesion funds, especially in infrastructure and environment. Figure 9. Business Licenses as a Problem for Doing Business (percent of firms indicating business licenses and permits as a problem for doing business)
39
31
20
36
30
41
1317
2427
33
41
05
101520
2530354045
Slovakia Turkey Hungary Bulgaria Poland Romania
2002 2005
Source: EBRD-WB BEEPS, 2005.
10 The 2002 and 2005 BEEPS surveys ask the question “What percent of senior management’s time in 2001 was spent in dealing with public officials about the application and interpretation of laws and regulations and to get or to maintain access to public services?”

17
Administrative Burdens on Start-Ups 45. Romania’s policies in terms of facilitating the creation of new firms remain liberal relative to 2002, since administrative burdens are lower than among comparators for startups in general, and in specific service sectors, such as road transport and retail distribution (Figure 10). The indicator of administrative burdens for corporation measures the number of procedures, number of days, and the minimum capital required to start a limited liability company. Figure 10. Administrative Burdens on Startups a. Administrative burdens on businesses b. Sector specific administrative burden
0.8
1.41.8 1.9 2.0 2.0
2.3
3.0
4.3
0
1
2
3
4
5
Romania
Bulgaria
EU15OECD
Slovak R
epublic
MICs
Hungar
y
Czech
Rep.
Poland
0.8
1.5 1.61.9 1.9 2.0
2.22.6
4.1
0
1
2
3
4
5
Romania EU15OECD
Bulgaria
Slovak R
epublic
Hungar
y
Czech
Rep.
MICs
Poland
Source: see Figure 3. Note: Other MICs are Brazil, Mexico, and Turkey. Values refer to 2006 for Romania and Bulgaria, 2004 for Brazil, and 2003 for all other countries. Romania’s 2002 score was calculated using a different methodology so is not strictly comparable. For full data set see appendix I. 46. The burden on business creation is substantially lower than in other countries even the EU15 and the OECD. The number and duration of procedures, as well as the cost involved in starting a company is lower in Romania than in other middle income countries and on a par with the best practice of top performers in the EU, such as Ireland or the UK. 47. This could, however, be partly driven by the fact that slightly different data and methods were used to calculate this indicator for Romania. A homogenization procedure was therefore necessary to make its score comparable to the other countries (see Table A2.8 for details). However, this excellent ranking is consistent with Doing Business’ data that rank Romania as the 7th best country (out of 175) in terms of ease of starting a business (it was the 6th in 2005). 48. Romania’s rankings and good performance vis-à-vis the ease of starting a business reflect the continued simplification and reduction (down to five) of the company registration procedures, especially after 2004. These took central stage in three consecutive Action Plans (2004, 2005, and 2006) for the reduction of administrative barriers to entry and operation of businesses, and were part of the PSAL/PAL programs. The establishment of one-stop shops for firm registration played an important role in this progress. The measures implemented through the Action Plans followed the recommendations of two World Bank/FIAS reports (2002 and 2004).

18
State Control of Economic Activity
49. Despite the decline in state control since 2002 (a trend that started in 1999), Romania’s performance still lags behind that of the OECD average and the EU 15. 50. The gradual reduction of the state’s presence in the economy was a crucial element of the reform package associated with Romania’s EU pre-accession commitments. As a result, between 1999 and 2006, most of the commercial companies held in the portfolio of the privatization agency AVAS and in the banking sector were privatized. The energy sector was unbundled and important privatizations took place in electricity and gas distribution. The national oil company was also privatized, although the government retains a golden share in Petrom. In parallel, price liberalization in many sectors and the adjustment of energy tariffs reduced direct state involvement in services and improved the efficiency of resources allocation. Nevertheless, public enterprises still represent a substantial part of the economy and important energy generation companies, whose governance requires further improvement, continue to be managed by the state. Some energy tariffs have not yet reached import price parity. 51. The two measures of state control in the PMR system are public ownership and state involvement in business operations (through price controls and coercive as opposed to incentive-based regulation). A look at Figure 11 reveals that Romania does not favorably compare with OECD and EU averages and is closer to the more restrictive pre-accession CEE with respect to both indicators. Figure 11. Public Ownership and State Involvement in Business Operation a. Public ownership b. State involvement in business operations
1.9
2.4 2.5 2.63.0
3.53.8
4.14.2
0.00.51.01.52.02.53.03.54.04.5
Slovak R
epublic
OECDMIC
sEU15
Czech
Rep.
Bulgaria
Hungary
Romania
Poland
0.8
1.7 1.9 1.92.2 2.2
2.62.8 2.8
0.00.51.01.52.02.53.03.54.04.5
Slovak R
epublic
OECDEU15
Czech
Rep.
Romania
MICs
Hungary
Bulgaria
Poland
Source: see Figure 3. Note: Other MICs are Brazil, Mexico, and Turkey. Values refer to 2006 for Romania and Bulgaria, 2004 for Brazil, and 2003 for all other countries. Romania’s 2002 score was calculated using a different methodology so is not strictly comparable. For full data set see appendix I. Public Ownership 52. The aggregate indicator for public ownership covers size and scope of public enterprise sector, as well as direct control over business enterprises. Given that there is much more variation among EU15 or OECD countries for these indicators, we show the full set of comparators (Figure 12). We find that while the scope of the public sector is

19
below the OECD average, both the degree of control exercised by the state over public enterprises and the size of the public enterprise sector are above the OECD average. 53. The indicator for size is the largest in the sample, suggesting that the public sector remains significant in Romania. This may, however, be an artifact of the methodology: the approach follows a perpetual inventory method whereby an initial estimate of the public enterprise sector is reduced by an amount equivalent to the value of privatization receipts, as captured in the general government budget. 54. This approach may be creating an upward bias in the computation of the “size” indicator for Romania. This is because a large segment of the Romanian economy was privatized through mass privatization (vouchers scheme) whereby the state did not receive any privatization proceeds. A large number of enterprises were acquired by domestic investors and, oftentimes, the price component of the deal was not the most important. Rather the divestiture of the large public industrial sector, with the quality of its assets often questionable, took primacy in the privatization process. Sometimes the privatized companies were allowed, as part of the privatization contract, to retain part of the privatization proceeds for restructuring and upgrades. In addition, several large privatizations deals, done with strategic investors, came to closure after the period of analysis covered in the present paper. 55. Nevertheless, other sources confirm that the Romanian public enterprise sector remains important. Its size was estimated at around 30% of GDP in 2005 by the Romanian National Institute for Statistics (this has decreased in 2006, as several important privatization deals, especially in banking and energy, went through, such as that of the largest bank, BCR). As to its scope, it is also relatively wide given that the state holds important equity stakes in the largest firms in several sectors, such as electricity, gas, oil, banking (CEC bank), rail and road infrastructure and municipal utilities. 56. Nonetheless, when looking at the scope of the public sector, which captures the extent to which the state holds equity stakes in the largest firm in different sectors, Romania is close to the OECD average and in a better position than several EU15 countries (Figure 12b). Romania’s standing worsens when public ownership is further examined from the point of view of the pervasiveness of the formal control exerted by public bodies on public enterprises (Figure 12c). This result is driven by the presence of a golden share retained by the government in the oil sector. The golden share implies that important decisions can be taken only with a share of 75% of the board votes. The fact that the government controls more than 25% of the votes gives it the power to interfere with decisions concerning mergers or acquisitions, changes in the controlling coalition, acquisition of equity by foreign investors, choice of management or other strategic management decisions.
20
Figure 12 Public Ownership: Size, Scope and Extent of Control over Public Enterprises
a. Size of the public enterprise sector
0
1
2
3
4
5
6
Japa
nSl
ovak
Rep
ublic
Braz
ilAu
stra
liaUn
ited
Stat
esNe
w Ze
aland
Switz
erla
ndLu
xem
bour
gUn
ited
King
dom
Portu
gal
Cana
daDe
nmar
kSp
ain
Irelan
dSw
eden
Kore
aIc
eland
Neth
erla
nds
Hung
ary
Ger
man
yCz
ech
Repu
blic
Finl
and
Belg
ium
Bulg
aria
Mex
ico Italy
Gre
ece
Aust
riaNo
rway
Fran
ceTu
rkey
Pola
ndRo
man
ia
OECD average
b. Scope of the public sector
0.0
1.0
2.0
3.0
4.0
5.0
6.0
United
Kingdo
m
Slovak R
epub
lic
Belgium
Japa
nKore
a
Icelan
d
New Zea
land
Denmark
Irelan
d
United
States
Austra
lia
Canad
a
Netherl
ands
Brazil
Roman
ia
Greece
Mexico
German
y
Austria
Finlan
d
Hunga
rySpa
in
Luxe
mbourg
Sweden
Bulgari
a
Czech
Rep
ublic
Portug
al
Switzerl
and
France
Italy
Norway
Turkey
Poland
OECD average
c. Control of public enterprise by legislative bodies
0.0
0.5
1.0
1.5
2.0
2.5
3.0
3.5
4.0
4.5
5.0
Austra
lia
Austria
Japa
n
Icelan
d
Sweden
Denmark
Irelan
d
United
States
Canad
a
Greece
Mexico
Turkey
Korea
Belgium
France
Netherl
ands
Czech
Rep
ublic
German
ySpa
in
Norway
New Zea
land
Switzerl
and
United
Kingdo
m
Finlan
d
Luxe
mbourg
Poland
Brazil
Bulgari
a
Slovak R
epub
licIta
ly
Portug
al
Roman
ia
Hunga
ry
OECD average
Source: see Figure 3. Note: Other MICs are Brazil, Mexico, and Turkey. Values are for 2006 for Romania and Bulgaria and for 2003 for all other countries. Romania’s 2002 score was calculated using a different methodology so is not strictly comparable. For full data set see appendix I.

21
Involvement in Business Operation 57. Regarding state intervention in the overall economy, the use of price controls has substantially decreased since the first phase of transition (World Bank 2004). (The variable measures the existence of price regulation or administrative control of prices in air travel, road freight, telecommunications, and retail distribution sectors). However, prices for some utilities remain administered, especially in the energy sector, where tariffs are below import parity, despite significant adjustments taking place in recent years. Tariffs are also below cost recovery in the case of the least efficient electricity and heating generators. Figure 13. State involvement in business operations a. Price controls b. Use of command-and-control regulation
0.40.8 1.0 1.0 1.1 1.3 1.4
1.62.0
0.00.51.01.52.02.53.03.54.0
Slovak R
epub
licEU15
MICs
OECD
Romania
Czech
Rep
.
Bulgari
a
Poland
Hungary
0.0
2.2 2.3 2.3 2.32.6
3.4 3.53.8
0.00.51.01.52.02.53.03.54.0
Slovak R
epub
lic
OECD
Czech
Rep
.
Hungary
RomaniaEU15
MICs
Poland
Bulgari
a
Source: see Figure 3. Note: Other MICs are Brazil, Mexico, and Turkey. Values refer to 2006 for Romania and Bulgaria, 2004 for Brazil, and 2003 for all other countries. Romania’s 2002 score was calculated using a different methodology so is not strictly comparable. For full data set see appendix I. 58. As to the use of command and control regulation, it remains significant, albeit to a lesser degree than the EU15 average and on par with the OECD average (Figure 13). Overall, it is in line with comparator groups, although Romania’s performance is still far from that of the best practice countries (Australia, New Zealand, Slovakia to cite a few). The indicator reflects the extent to which government uses coercive (as opposed to incentive-based) regulation, in general and in specific service sectors (box 2). 59. Romania’s relatively good comparative score is driven by the fact that authorities have pursued a regulatory reform agenda driven by the highest OECD standards of regulatory quality, for instance by enshrining in legislation best OECD practices such as the considerations of alternatives to regulation as part of the process of adoption of new legislation. Nonetheless, weak implementation may defeat the purpose of the rules themselves.

22
Outward Oriented Policies 60. Observance and implementation of the rules for membership of the World Trade Organization (WTO) and, even more strongly, the European Union (EU) has led to a significant reduction of barriers to trade and investment in Romania since the start of transition. Romania’s foreign trade policy has been driven most of all by the commitments of the EU Eastern Enlargement project, promoting bilateral trade liberalization initially with the EU and EFTA and, subsequently, with other preferential partners of the EU. The Pan-European Agreement on the Cumulation of the Rules of Origin, combined with the gradual removal of tariffs on all industrial products by January 200211, and the harmonization of technical standards has led to Romania’s participation in a de facto free trade area for industrial products (World Bank, 2004). The removal of tariffs on agricultural and agro-processed goods, in January 2007, as Romania joined the Common Agricultural Policy (CAP) has completed the liberalization of trade with the EU.
11 As prescribed by the European Association Agreement between the EU and Romania, signed in 1993.
Box 3. What the PMR survey means by “command and control” regulation The contrasting use of “command-and-control” and “incentive-based” regulation appear to have been brought into common usage by Schultze who wrote in a 1977 lecture about economic efficiency: “We tend to see only one way of intervening – namely removing a set of decision from the decentralized and incentive-oriented private market and transferring them to the command-and-control techniques of government bureaucracy” (page 6)
In this context, the PMR attempts to measure the extent to which the cost of new regulation is assessed, and whether alternatives are considered before implementing new regulations. About half of the indicator weights are allocated to the following two questions (the full make-up of the indicator is provided in Annex table A2.5): Regulators are required to assess alternative policy instruments (regulatory and non-regulatory) before adopting new regulation. (Current answer: yes). Explanation. The use of a wide range of mechanisms for meeting policy goals, not just traditional regulatory controls, helps to ensure that the most efficient and effective approaches are used. Approaches may include green taxes and subsidies, voluntary agreements, information programs such as eco labeling, self-regulation, permit-trading schemes, and performance-based regulation (where a sector or industry must comply with a standard but can broadly choose how to meet it). Note that the question only refers to whether the obligation exists as a specific provision in a specific legislative act, not whether the spirit of it is in fact respected. A positive answer to the question would require the existence of a normative act explicitly ruling out regulation as the default option Guidance has been issued on using alternatives to traditional regulation. (Current answer: no). Explanation. The regulatory process is governed by a standard procedure, outlining the steps to be taken to issue new regulation. For instance, the procedure may include binding ex ante regulatory impact assessment (RIA). Box 3 offers a discussion of alternatives to traditional regulation.

23
61. As a testament to Romania’s success in this respect, in conjunction with the advancements in structural reforms, net foreign direct investment inflows increased from 2.9% of GDP in 2001 to over 9% in 2006 (Figure 14). FDI went to a variety of sectors, notably manufacturing, financial sector, real estate, trade, and transport. Equally important, in recent years, FDI has covered a large part of the expanding external current account deficit. In 2006, for example, FDI covered around 90% of the 10.3% of GDP current account deficit. This is expected to decline in 2007, owing to a slowdown in privatization. Looking forward, strong FDI inflows, and especially greenfield investment, as privatization comes to an end, will be instrumental in ensuring continued macroeconomic stability and productivity growth. Therefore, policies aimed at improving the business environment would need to be implemented with priority. Figure 14. FDI inflows, average 2001-03
0.0
2.0
4.0
6.0
8.0
10.0
12.0
Hungary Poland Czech Rep Romania Slovakia Bulgaria
Source: WIIW, Eurostat, NBR. *Data for Romania refer to 2003-06. *Data for Bulgaria refer to 2003-05 62. Outward oriented policies include explicit barriers to trade and investment (such as foreign ownership barriers, discriminatory procedures against foreign firms, and tariffs) and regulatory barriers (such as a failure to engage in international harmonization treaties etc.) These are reviewed in turn below, but can be summarized as follows: Romania has achieved substantial progress on all count except tariffs, which as of the spring of 2006 remained substantially above the EU. The policy implication of this is nil however, since Romania’s tariff policies are now governed by the EU’s foreign trade regime as of January 2007. Explicit Barriers to Trade and Investment 63. The first generation of reforms, anchored in the 1993 European Association Agreement, rapidly succeeded in eliminating all quantitative restrictions and the state monopoly over foreign trade (World Bank 2004). The EU Eastern enlargement project rapidly led to Romania’s participation in the European free trade area. The association with the EU also encouraged bilateral trade liberalization with other countries enjoying

24
preferential trade relations with the EU, such as the countries of South Eastern Europe. Romania is still part of CEFTA, whose expansion in Eastern Europe it actively encourages. 64. However, Romania did not make similar progress in multilateral trade liberalization. Romania’s tariff levels, measured here as MFN tariffs on industrial goods, remained higher in 2006 than both in comparator middle income countries and in all the pre-accession OECD CEE (Figure 15). In particular, Romania entered the EU with substantially higher tariff levels than Hungary, Poland, the Czech Republic and the Slovak Republic in 2004. However, as of January 1, 2007, tariff levels have been lowered to equal those of the EU Common Market. Figure 15. Tariffs
1.0 1.0 1.01.4
2.0
3.0
4.04.3
5.0
0.0
1.0
2.0
3.0
4.0
5.0
SlovakRepublic
EU15 CzechRep.
OECD Bulgaria Hungary Poland MICs Romania
Source: see Figure 3. Note: Other MICs are Brazil, Mexico, and Turkey. Values refer to 2006 for Romania and Bulgaria, 2004 for Brazil, and 2003 for all other countries. Romania’s 2002 score was calculated using a different methodology so is not strictly comparable. For full data set see appendix I. 65. In contrast, Romania compares well with both high income EU countries and with pre-accession CEE countries and other MICs with respect to foreign ownership barriers (Figure 16). Substantial progress has been achieved in this regard compared to 2002.

25
Figure 16. Foreign Ownership Barriers
0.8
1.3
1.8 1.9 2.02.3
2.63.0
3.7
0.0
0.5
1.0
1.5
2.0
2.5
3.0
3.5
4.0
Romania EU15 OECD Hungary CzechRep.
SlovakRepublic
MICs Bulgaria Poland
Source: see Figure 3. Note: Other MICs are Brazil, Mexico, and Turkey. Values refer to 2006 for Romania and Bulgaria, 2004 for Brazil, and 2003 for all other countries. Romania’s 2002 score was calculated using a different methodology so is not strictly comparable. For full data set see appendix I. 66. Foreign ownership barriers take the form of statutory or other legal limits to the proportion of shares that can be acquired by foreign investor or of special voting rights that can be exercised in case of acquisition of equity by foreign investors. Such restriction may apply in general or in specific sectors that are considered ‘strategic’ such as air transport, telecommunications, and electricity generation. The good (low) score of this indicator for Romania is due to the absence of both of general ownership barriers and barriers in specific sectors. It should be noted, however, that in Romania such statutory or legal restrictions to the proportion of shares acquired by investors, apply not only to foreign but also to domestic investors. For instance, as in other EU countries, a 49% foreign ownership ceiling remains in place in the airlines sector. 67. This means that Romania does not discriminate between domestic and foreign firms, a factor that also explains also the better rating at procedural level. Foreign firms in Romania have equal rights with domestic firms to appeal and redress through competition agencies, regulatory bodies, trade policy bodies, or private rights of action (Figure 17).

26
Figure 17. Discriminatory Procedures against Foreign Firms
0.0 0.0
0.3
0.5 0.5
0.7
0.9
1.1 1.2
0.0
0.2
0.4
0.6
0.8
1.0
1.2
1.4
Bulgaria Romania Poland EU15 OECD CzechRep.
MICs SlovakRepublic
Hungary
Source: see Figure 3. Note: Other MICs are Brazil, Mexico, and Turkey. Values refer to 2006 for Romania and Bulgaria, 2004 for Brazil, and 2003 for all other countries. Romania’s 2002 score was calculated using a different methodology so is not strictly comparable. For full data set see appendix I.
Other Barriers to Trade and Investment
68. Romania has also completely eliminated other regulatory barriers to trade and investment, which were already relatively low in 2002 (Figure 18). These barriers include the existence of specific provisions which require regulators to recognize regulatory measures performed in other countries; to use internationally harmonized standards and certification procedures; or avoid unnecessary trade restrictiveness. Engaging in mutual recognition agreements with other countries also helps reducing other barriers to trade and investment. In this respect, Romania has in fact achieved best practice. Figure 18. Regulatory Barriers to Trade and Investment
0.0 0.0 0.0 0.00.2 0.2
0.4
1.6 1.6
0.0
0.5
1.0
1.5
2.0
Czech
Rep
.
Hunga
ry
Bulgari
a
Roman
iaEU15
OECDMIC
s
Slovak R
epub
lic
Poland
Source: see Figure 3. Note: Other MICs are Brazil, Mexico, and Turkey. Values refer to 2006 for Romania and Bulgaria, 2004 for Brazil, and 2003 for all other countries. Romania’s 2002 score was calculated using a different methodology so is not strictly comparable. For full data set see appendix I.
27
CONCLUSION: THE NEED TO FOCUS ON IMPLEMENTATION, COMPLIANCE AND ENFORCEMENT
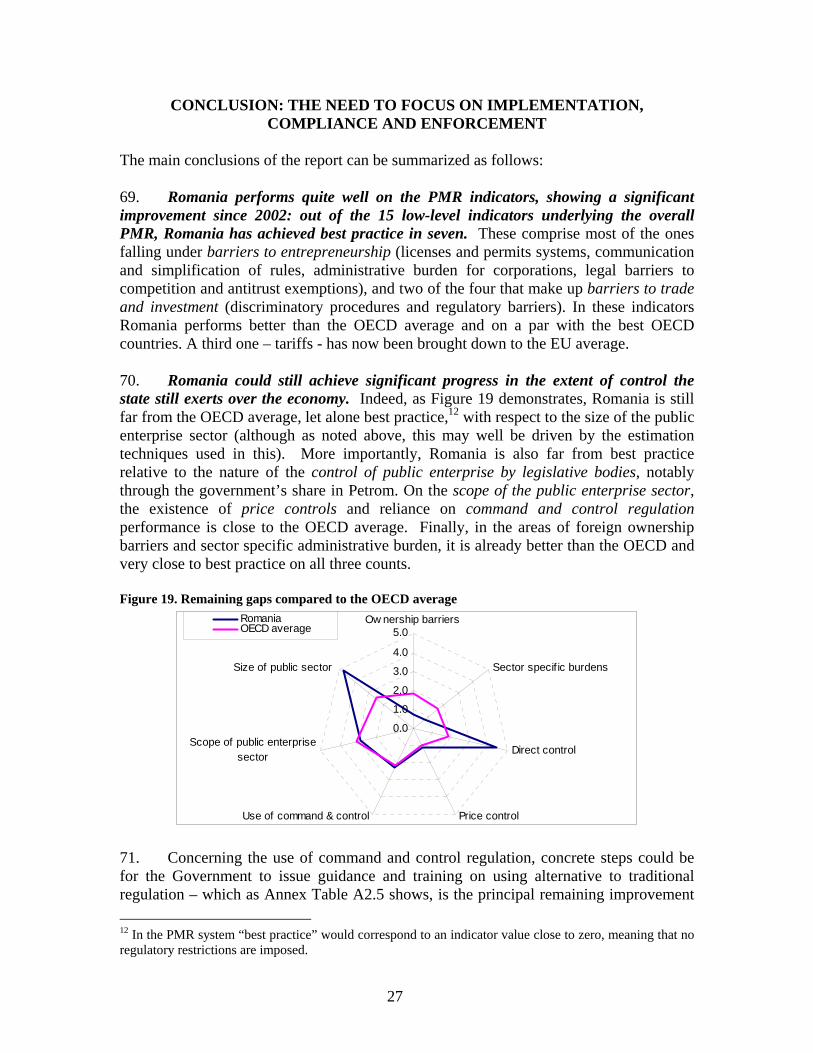
The main conclusions of the report can be summarized as follows: 69. Romania performs quite well on the PMR indicators, showing a significant improvement since 2002: out of the 15 low-level indicators underlying the overall PMR, Romania has achieved best practice in seven. These comprise most of the ones falling under barriers to entrepreneurship (licenses and permits systems, communication and simplification of rules, administrative burden for corporations, legal barriers to competition and antitrust exemptions), and two of the four that make up barriers to trade and investment (discriminatory procedures and regulatory barriers). In these indicators Romania performs better than the OECD average and on a par with the best OECD countries. A third one – tariffs - has now been brought down to the EU average. 70. Romania could still achieve significant progress in the extent of control the state still exerts over the economy. Indeed, as Figure 19 demonstrates, Romania is still far from the OECD average, let alone best practice,12 with respect to the size of the public enterprise sector (although as noted above, this may well be driven by the estimation techniques used in this). More importantly, Romania is also far from best practice relative to the nature of the control of public enterprise by legislative bodies, notably through the government’s share in Petrom. On the scope of the public enterprise sector, the existence of price controls and reliance on command and control regulation performance is close to the OECD average. Finally, in the areas of foreign ownership barriers and sector specific administrative burden, it is already better than the OECD and very close to best practice on all three counts. Figure 19. Remaining gaps compared to the OECD average
0.0
1.0
2.0
3.0
4.0
5.0Ow nership barriers
Sector specif ic burdens
Direct control
Price controlUse of command & control
Scope of public enterprisesector
Size of public sector
RomaniaOECD average
71. Concerning the use of command and control regulation, concrete steps could be for the Government to issue guidance and training on using alternative to traditional regulation – which as Annex Table A2.5 shows, is the principal remaining improvement 12 In the PMR system “best practice” would correspond to an indicator value close to zero, meaning that no regulatory restrictions are imposed.

28
still pending. More substantively, this requires changing the regulatory and administrative culture so that new regulation is not the default option to modify economic behavior. Box 4 discusses alternative regulatory approaches.
72. As to the extent of direct control over business enterprises in which the state holds interest, Romania has limited, but not fully eliminated, the use of golden share to affect strategic decisions of firms. Eliminating legal constraints to the sale of the stakes held by the government in these firms (a practice followed by more than half OECD countries) is the one remaining possible step.
Box 4. Alternative Regulatory approaches Performance-Based Regulations—specify required outcomes or objectives rather than the means by which they must be achieved. Thus firms and individuals can choose processes that are more efficient and less costly, which promotes the use of new technology on a broader scale. Such type of regulation is increasingly used in health, safety, consumer protection, and environmental regulation. Drawbacks include measurement problems related to desired outcomes, higher administrative and monitoring costs, greater responsibilities for small companies to develop appropriate compliance strategies. Most countries have resorted to the use of guidelines or “safe harbors” in conjunction with performance-based regulation. Guidelines provide information on appropriate compliance strategies, while safe harbors allow the benefits of certainty of compliance associated with prescriptive regulation to be attained, while also allowing more innovative firms to take advantage of the benefits of such regulation.
Process Based Regulations—require businesses to develop processes that systematically control and minimize production risks. These processes are used in businesses with multiple and complex sources of risk, where ex post testing of the product is either ineffective or expensive. Process based regulation is predominantly used in health, food safety, and environmental regulation.
Co-regulation—businesses take the lead in regulation through endorsement and adherence to codes of practice. This type of regulation is highly cost effective for the government. Drawbacks include the possibility for encouraging anti-competitive activities by business or professional organizations.
Economic Instruments—taxes, subsidies, tradable permits, vouchers and the like. Economic instruments allow businesses to achieve regulatory goals in the least costly manner and provide market incentives which reward the use of innovation and technical change.
Information and Education—most widely used approach to regulation in OECD member states; empower consumers to adopt actions or make informed choices to change their behavior. Examples include campaigns aimed at reducing speeding when driving, anti-litter behaviors; reducing the use of drinking water; eco-labeling of products.
Guidelines—issued by regulatory authorities, setting out processing or providing interpretations to aid understanding of government objectives by businesses and citizens. Guidelines may accompany existing regulations, but also are increasingly used as stand-alone documents. Guidelines, for example, are widely used in the area of consumer protection in Denmark.
Voluntary Approaches—initiated by industries, sometimes formally sanctioned or endorsed by government. They include voluntary initiatives, voluntary codes, voluntary agreements, and self-regulation. An example of a voluntary arrangement is the chemical industry’s Responsible Care Program, used in 40 countries, which promotes the adoption of rules for sound environmental management practice.
_____________
Source: OECD 2002b.

29
73. So while Romania can certainly continue to improve on rules and regulations governing product market regulations, the pending challenge has to do with improving practices. 74. Without effective implementation and enforcement, the effects of policy measures to increase competition in product markets will not be visible. For instance, notwithstanding the enormous progress evident from the dramatic improvement since the 2002 PMR, BEEPS data indicate that competitive pressures on incumbents remain low compared to other countries in the region and have not substantially changed between 2002 and 2005 (Figure 20). Figure 20. Intensity of price competition in product markets
0%
5%
10%
15%
20%
25%
30%
35%
40%
45%
50%
Czech Rep. Romania Bulgaria Slovak Rep. Poland Hungary
2002 2005
Source: WB-EBRD BEEPS 2002 and 2005. Note: Percentage of firms responding ‘Many of our customers would buy from our competitors instead’ to the question ‘Now I would like to ask you a hypothetical question. If you were to raise your prices of your main product line or main line of services 10% above their current level in the domestic market (after allowing for any inflation) which of the following would best describe the result assuming that your competitors maintained their current prices?’ 75. A series of prerequisites is necessary to improve the effectiveness of the application of regulation and, ultimately, to increase the long run competitiveness of the Romanian economy. These belong to the institutional domain and include:
(i) Political commitment at the highest level. Ensuring political support from the highest level of government is crucial to generate consensus for reform both within and outside public administration. In particular, leadership and support from the Prime Minister’s Office and the Presidential Administration will help in clarifying the allocation of functions and responsibilities among ministries and relevant government agencies with respect to the ownership of the reforms.
(ii) Changes in the institutional architecture of the government to improve oversight and coordination of reforms pertaining to product market liberalization. Political support should be reflected in the reorganization of the institutional architecture of government with the objective of improving

30
the coordination and cooperation among implementing agencies and the oversight of the overall regulatory process. In particular, the Business Environment Department, responsible for oversight and coordination of the implementation of the regulatory reform agenda, should be placed under the Prime Minister’s office, where it used to be prior to the latest governmental reorganization.
(iii) Enhanced capacity of the public administration. Another major obstacle to
the successful implementation of regulatory reform was identified in the ability of the administration to serve the reform agenda. Important shortcomings in this area concern (i) orientation towards compliance with formal procedures – as opposed to a drive for results; and (ii) inadequate level of qualification, especially in the lower echelons of the civil service, associated with poor remuneration and inefficient procedures of selection and promotion.

31
REFERENCES Aghion, Philippe, Christopher Harris, Peter Howitt, and John Vickers. 2001.
“Competition, Imitation and Growth with Step-by-Step Innovation.” Review of Economic Studies, No. 68(3), pp.467-492.
Campeanu, Virginia, Constantin Ciupagea, Joze Damijan, Donato De Rosa, Rumen
Dobrinsky, Surd Kovats, Boyko Nikolov, and Silviya Nikolova. 2003. “EU Competition Policy and its Institutional Framework: A Survey of Transition Countries.” EU COMPPRESS, Institute of Economics of the Hungarian Academy of Sciences, (http://econ.core.hu/english/comppress/D5.PDF).
Conway, Paul, Veronique Janod, and Giuseppe Nicoletti. 2005. Product Market
Regulation in OECD Countries: 1998 to 2003. OECD Economics Department Working Paper, No. 419.
Conway, Paul, Donato De Rosa, Giuseppe Nicoletti, and Faye Steiner. 2006a.
Regulation, Competition and Productivity Convergence. OECD Economics Department Working Paper, No. 509.
Conway, Paul, Donato De Rosa, and Giuseppe Nicoletti. 2007. Competition and
Productivity Convergence in the Age of ICT: Evidence from OECD Countries. OECD Economics Department Working Paper, forthcoming.
Gwartney, Jim, and Robert Lawson. 1997. Economic Freedom of the World Annual
Report: 1997. Vancouver: Fraser Institute. http://www.freetheworld.com/download.html.
Nickel, Stephen J. 1996. “Competition and Corporate Performance.” Journal of Political
Economy, Vol. 104(4), 724-746. Nicoletti, Giuseppe, and Stefano Scarpetta. 2003. “Regulation, Productivity and Growth:
OECD Evidence.” Economic Policy, No. 36, pp. 9-72, April. Nicoletti, Giuseppe, Stefano Scarpetta, and Olivier Boylaud. 1999. “Summary Indicators
of Product Market Regulation with an Extension to Employment Protection Legislation.” OECD Economics Department Working Paper, No. 226.
OECD. 2002a. Romania: Economic Assessment. OECD Economic Surveys, Paris,
October. ———. 2002b. Regulatory Policies in OECD Countries: From Interventionism to
Regulatory Governance. Paris. ———. 2005. OECD Economic Surveys. Brazil. Paris.

32
Schultze, Charles. 1977. The Private Use of Public Interest. Brookings Institution. Washington, DC.
World Bank. 2004. Country Economic Memorandum for Romania: Restructuring for EU
Integration – the Policy Agenda. Report 29123-RO, World Bank, Washington, DC.

33
ANNEX I. COMPARISONS WITH FULL SAMPLE

34
Table A1. 1 PMR
Product market regulation
Inward-oriented policies
Outward-oriented policies
Australia 0.9 0.9 0.9 United Kingdom 0.9 1.2 0.5 Iceland 1.0 1.4 0.4 United States 1.0 1.2 0.8 Ireland 1.1 1.4 0.6 Denmark 1.1 1.3 0.9 New Zealand 1.1 1.3 0.9 Canada 1.2 1.2 1.2 Sweden 1.2 1.5 0.9 Luxembourg 1.3 1.6 0.8 Japan 1.3 1.5 1.0 Finland 1.3 1.7 0.8 Belgium 1.4 2.0 0.5 Netherlands 1.4 1.8 0.8 Austria 1.4 1.8 0.8 Slovak Republic 1.4 1.3 1.5 Germany 1.4 1.9 0.8 Norway 1.5 1.9 0.9 Korea 1.5 1.7 1.3 Romania 1.6 1.8 1.4 Portugal 1.6 2.0 0.9 Spain 1.6 2.1 0.9 Switzerland 1.7 2.1 1.1 France 1.7 2.1 1.1 Czech Republic 1.7 2.2 1.1 Bulgaria 1.8 2.1 1.4 Greece 1.8 2.2 1.3 Italy 1.9 2.3 1.3 Brazil 1.9 1.8 1.9 Hungary 2.0 2.4 1.5 Mexico 2.2 2.1 2.3 Turkey 2.3 2.6 1.8 Romania 2002 2.4 2.6 2.2 Poland 2.8 2.9 2.5
NOTE: The values of indicators refer to 2006 for Bulgaria, 2004 for Brazil, and to 2003 for all other countries (Conway et al. 2005).

35
Table A1. 2 State Control
State control Public ownership Involvement in business operation
Australia 0.6 0.8 0.3 Iceland 1.1 1.8 0.3 United States 1.2 1.2 1.2 Denmark 1.3 1.7 0.8 Slovak Republic 1.4 1.9 0.8 New Zealand 1.4 1.9 0.8 Japan 1.5 0.8 2.4 Canada 1.7 1.7 1.5 Korea 1.7 1.8 1.5 United Kingdom 1.7 1.9 1.6 Mexico 1.9 2.3 1.4 Sweden 1.9 2.2 1.6 Netherlands 1.9 2.5 1.2 Austria 1.9 2.2 1.6 Ireland 2.0 1.8 2.1 Luxembourg 2.0 2.6 1.2 Germany 2.2 2.8 1.5 Switzerland 2.2 2.4 2.1 Finland 2.3 3.2 1.3 Belgium 2.4 2.2 2.6 Brazil 2.4 2.1 2.8 Czech Republic 2.5 3.0 1.9 France 2.7 3.3 1.9 Spain 2.7 2.7 2.7 Portugal 2.7 3.1 2.2 Norway 2.8 3.5 1.8 Greece 2.8 2.4 3.3 Turkey 2.8 3.1 2.5 Romania 3.2 4.1 2.2 Italy 3.2 3.8 2.3 Bulgaria 3.2 3.5 2.8 Hungary 3.3 3.8 2.6 Poland 3.6 4.2 2.8 Romania 2002 3.9 4.6 3.1
NOTE: The values of indicators refer to 2006 for Bulgaria, 2004 for Brazil, and to 2003 for all other countries (Conway et al. 2005).

36
Table A1. 1 Barriers to Entrepreneurship
Barriers to entrepreneurship
Administrative burdens on startups
Regulatory and administrative
opacity
Barriers to competition
Romania 0.5 0.7 0.1 0.6 United Kingdom 0.8 0.7 1.2 0.4 Canada 0.8 0.9 0.5 0.7 Ireland 0.9 0.5 2.1 0.3 Norway 1.0 1.0 1.2 0.6 Sweden 1.1 1.2 1.1 0.6 Finland 1.1 1.3 1.2 0.4 Bulgaria 1.1 1.4 1.2 0.4 Australia 1.1 1.0 1.2 1.5 New Zealand 1.2 0.8 2.2 0.4 United States 1.2 1.0 1.3 1.5 Slovak Republic 1.2 1.9 0.7 0.3 Luxembourg 1.2 1.8 1.1 0.1 Denmark 1.2 0.5 2.1 1.7 Portugal 1.3 1.7 1.2 0.5 Brazil 1.3 1.5 1.4 0.6 Romania 2002 1.3 1.3 2.1 0.1 Italy 1.4 2.4 0.4 0.6 Japan 1.4 1.9 1.2 0.6 Hungary 1.4 2.3 0.4 1.1 Germany 1.6 1.6 2.2 0.5 Iceland 1.6 1.4 2.4 0.7 Greece 1.6 2.6 0.6 0.5 Spain 1.6 2.8 0.4 0.4 France 1.6 1.9 1.3 1.4 Belgium 1.6 1.7 2.2 0.6 Austria 1.6 2.8 0.4 0.8 Netherlands 1.6 1.6 2.5 0.6 Korea 1.7 2.2 1.2 1.0 Switzerland 1.9 1.7 3.1 0.7 Czech Republic 1.9 2.3 2.3 0.5 Mexico 2.2 3.1 0.4 2.9 Poland 2.3 3.7 1.5 0.3 Turkey 2.5 2.7 3.4 0.5 NOTE: The values of indicators refer to 2006 for Bulgaria, 2004 for Brazil, and to 2003 for all other countries (Conway et al. 2005).

37
Table A1. 2 Barriers to trade and investment
Barriers to trade and investment Explicit barriers Other barriers
Iceland 0.3 0.5 0.1 Belgium 0.3 0.5 0.1 United Kingdom 0.4 0.5 0.2 Ireland 0.5 0.8 0.2 Finland 0.6 1.0 0.2 Germany 0.6 0.6 0.7 Netherlands 0.7 1.0 0.3 Spain 0.7 0.7 0.6 Austria 0.7 1.0 0.2 Luxembourg 0.7 1.1 0.2 United States 0.7 1.1 0.2 Norway 0.8 0.9 0.6 Sweden 0.8 1.2 0.3 Portugal 0.8 1.2 0.3 Denmark 0.8 1.0 0.7 New Zealand 0.8 1.3 0.2 Australia 0.9 1.4 0.2 Czech Republic 0.9 1.4 0.3 Japan 0.9 1.4 0.3 France 1.0 1.5 0.3 Switzerland 1.0 1.5 0.4 Canada 1.1 1.7 0.4 Italy 1.1 1.7 0.4 Greece 1.2 1.4 1.0 Korea 1.3 1.9 0.4 Bulgaria 1.3 2.0 0.4 Romania 1.3 1.9 0.5 Hungary 1.4 2.1 0.6 Slovak Republic 1.6 1.6 1.5 Turkey 1.7 2.5 0.6 Brazil 1.9 2.3 1.5 Romania 2002 2.1 2.7 1.3 Mexico 2.4 3.4 1.0 Poland 2.4 3.0 1.7
NOTE: The values of indicators refer to 2006 for Bulgaria, 2004 for Brazil, and to 2003 for all other countries (Conway et al. 2005).

38
Table A1. 3 State Control: values of the low-level indicators
Scope of
public enterprise
sector
Size of public enterprise
sector
Direct control over business
enterprises
Use of command &
control regulation
Price controls
Australia 2.8 0.1 0.0 0.4 0.0 Austria 3.5 4.0 0.0 2.2 1.3 Belgium 1.8 3.3 1.5 4.5 1.0 Brazil 2.9 0.0 3.0 4.2 1.3 Bulgaria 3.7 3.5 3.3 3.8 1.4 Canada 2.8 2.1 0.8 1.3 2.0 Czech Republic 3.8 3.2 2.3 2.3 1.3 Denmark 2.5 2.3 0.8 1.4 0.0 Finland 3.5 3.2 2.9 1.4 0.3 France 4.5 4.1 1.9 3.0 0.3 Germany 3.3 3.2 2.3 1.8 0.5 Greece 3.0 3.8 0.9 5.1 2.3 Hungary 3.5 3.0 4.8 2.3 2.0 Iceland 2.3 2.8 0.7 0.0 0.3 Ireland 2.5 2.6 0.8 3.8 0.8 Italy 4.5 3.7 3.5 1.9 2.0 Japan 2.0 0.0 0.6 3.0 2.5 Korea 2.0 2.8 1.0 1.1 2.0 Luxembourg 3.5 1.2 2.9 1.5 0.0 Mexico 3.0 3.6 0.9 1.7 1.0 Netherlands 2.8 2.8 2.0 1.7 0.3 New Zealand 2.3 0.8 2.6 0.8 0.0 Norway 4.8 4.0 2.4 2.2 0.8 Poland 5.8 4.6 3.0 3.5 1.6 Portugal 3.8 1.7 3.8 2.0 1.8 Romania 2.9 4.8 4.4 2.3 1.1 Romania 2002 4.5 5.0 4.5 3.1 2.6 Slovak Republic 1.6 0.0 3.5 0.0 0.4 Spain 3.5 2.5 2.3 4.4 0.8 Sweden 3.7 2.7 0.7 2.3 1.0 Switzerland 3.8 0.9 2.6 1.2 2.6 Turkey 4.8 4.3 1.0 4.4 0.6 United Kingdom 0.8 1.6 2.9 2.3 0.4 United States 2.5 0.6 0.8 1.5 0.8 NOTE: The values of indicators refer to 2006 for Bulgaria, 2004 for Brazil, and to 2003 for all other countries (Conway et al. 2005).

39
Table A1. 4 Barriers to entrepreneurship: values of the low-level indicators
Licence and
permits system
Communication and
simplification of rules and procedures
Administrative burdens for corporations
Sector specific
administrative burdens
Legal barriers
Antitrust exemptions
Australia 2.0 0.2 1.3 0.3 1.6 1.5 Austria 0.0 0.5 3.0 3.4 0.3 1.0 Belgium 4.0 0.3 1.8 1.7 1.6 0.0 Brazil 2.0 0.6 0.5 1.3 2.0 0.0 Bulgaria 2.0 0.3 1.4 1.9 1.1 0.0 Canada 0.0 1.0 0.8 0.9 0.9 0.6 Czech Republic 4.0 0.5 3.0 2.2 1.4 0.0 Denmark 4.0 0.0 1.0 0.3 1.4 1.9 Finland 2.0 0.3 1.3 1.1 1.4 0.0 France 2.0 0.3 2.0 1.6 2.2 1.1 Germany 4.0 0.3 2.3 1.4 1.4 0.0 Greece 0.0 1.1 2.3 2.9 1.6 0.0 Hungary 0.0 0.5 2.3 2.0 1.6 0.9 Iceland 4.0 0.7 1.3 1.6 2.3 0.0 Ireland 4.0 0.2 0.8 0.3 0.9 0.0 Italy 0.0 0.5 2.8 2.1 1.9 0.0 Japan 2.0 0.3 1.5 2.3 1.4 0.3 Korea 2.0 0.0 2.7 1.9 1.9 0.6 Luxembourg 2.0 0.0 2.5 0.3 0.3 0.0 Mexico 0.0 0.3 3.3 3.2 1.9 3.5 Netherlands 4.0 0.9 2.0 1.3 1.9 0.0 New Zealand 4.0 0.3 1.0 0.8 0.3 0.4 Norway 2.0 0.2 1.0 0.9 2.2 0.0 Poland 2.0 0.8 4.3 4.1 0.6 0.0 Portugal 0.0 2.6 1.5 1.8 1.4 0.0 Romania 0.0 0.1 0.8 0.8 2.0 0.0 Romania 2002 4.0 0.0 1.0 1.4 0.0 0.0 Slovak Republic 0.0 1.4 2.0 1.9 0.6 0.0
Spain 0.0 0.6 2.8 2.4 1.1 0.0 Sweden 2.0 0.0 1.0 0.9 2.0 0.0 Switzerland 6.0 0.0 2.3 0.8 2.2 0.0 Turkey 6.0 0.5 2.3 3.2 1.4 0.0 United Kingdom 2.0 0.2 0.8 0.6 1.4 0.0
United States 2.0 0.4 0.8 1.0 1.4 1.6 NOTE: The values of indicators refer to 2006 for Bulgaria, 2004 for Brazil, and to 2003 for all other countries (Conway et al. 2005).

40
Table A1. 5 Barriers to Trade and Investment: values of the low-level indicators
Ownership barriers Discriminatory procedures Regulatory barriers Tariffs
Australia 2.4 0.0 0.0 1.0 Austria 1.5 0.3 0.0 1.0 Belgium 0.3 0.0 0.0 1.0 Brazil 2.0 0.7 1.3 4.0 Bulgaria 3.0 0.0 0.0 2.0 Canada 2.9 0.5 0.0 1.0 Czech Republic 2.0 0.7 0.0 1.0 Denmark 1.2 0.5 0.7 1.0 Finland 1.5 0.0 0.0 1.0 France 2.3 0.5 0.0 1.0 Germany 0.3 0.7 0.7 1.0 Greece 1.3 2.0 0.7 1.0 Hungary 1.9 1.2 0.0 3.0 Iceland 1.1 0.0 0.0 0.0 Ireland 1.2 0.0 0.0 1.0 Italy 2.8 0.7 0.0 1.0 Japan 2.4 0.3 0.0 1.0 Korea 2.2 0.0 0.0 3.0 Luxembourg 1.5 0.3 0.0 1.0 Mexico 2.8 1.4 0.0 6.0 Netherlands 1.2 0.5 0.0 1.0 New Zealand 2.3 0.0 0.0 1.0 Norway 1.9 0.3 0.7 0.0 Poland 3.7 0.3 1.6 4.0 Portugal 1.6 0.7 0.0 1.0 Romania 0.8 0.0 0.0 5.0 Romania 2002 2.0 1.2 0.7 5.0 Slovak Republic 2.3 1.1 1.6 1.0 Spain 0.8 0.3 0.7 1.0 Sweden 1.5 0.7 0.0 1.0 Switzerland 2.0 1.1 0.0 1.0 Turkey 3.1 0.7 0.0 3.0 United Kingdom 0.3 0.3 0.0 1.0 United States 1.8 0.0 0.0 1.0
NOTE: The values of indicators refer to 2006 for Bulgaria, 2004 for Brazil, and to 2003 for all other countries (Conway et al. 2005).

41
ANNEX II. DETAILED RESULTS OF PMR SURVEY FOR ROMANIA

42
Table A2. 1 Scope of public enterprise sector
ISIC (Rev. 3.1)
code Sector Yes No
Bulgaria Romania OECD EU15 Slovak Rep. Poland16 Manufacture of tobacco products 1 6 0 yes no na na no yes232 Manufacture of refined petroleum products 1 6 0 yes yes na na no yes27 Manufacture of basic metals 1 6 0 yes no na na no yes
28, 29 Manufacture of fabricated metal products, machinery and equipment 1 6 0 no no na na no yes
4010 Electricity: electricity generation/import or electricity transmission or electricity distribution or electricity supply 1 6 0 yes yes na na yes yes
4020 Gas: gas production/import or gas transmission or gas distribution or gas supply 1 6 0 yes yes na na yes yes
4100 Collection, purification and distribution of water 1 6 0 yes yes na na - yes50, 51 Wholesale trade, incl. motor vehicles 1 6 0 no no na na no yes
55 Restaurant and hotels 1 6 0 no no na na no yes
601, 6303 Railways: Passenger transport via railways, Freight transport via railways, operation of railroad infrastrucutre 1 6 0 yes yes na na no yes
6021 Other urban, suburban and interurban passenger transport 1 6 0 no yes na na yes yes
6021 Other scheduled passenger land transport
1 6 0 n.a. n.a. na na n.a. n.a.
6023 Freight transport by road 1 6 0 no no na na no yes6303 Operation of road infrastructure 1 6 0 yes yes na na no no61 Water transport 1 6 0 yes no na na no yes
6303 Operation of water transport infrastructure 1 6 0 yes yes na na no yes62 Air transport 1 6 0 yes yes na na yes yes
6303 Operation of air transport infrastructure 1 6 0 yes yes na na no yes
642 Telecommunication fixed line services, mobile services, internet services. 1 6 0 yes yes na na yes yes
6519, 659, 671 Financial institutions 1 6 0 no no na na no yes
66, 672 Insurance 1 6 0 no no na na no yes74 Other business activity 1 6 0 no no na na no yes851 Human health activities 851 1 6 0 yes no na na yes yes
9211, 9212 Motion picture distribution and projection 1 6 0 no no na na no yes
60.87% 47.83% 52.41% 53.63% 27.27% 95.83%
3.65 2.87 3.14 3.22 5.75 1.64Country score (0-6) if number of answers>=20 then
(Σiai answeri)/Σiai
Do the national, state or provincial government hold equity stakes in the largest firm in the sector: Coding of answers
Weight (a i )
percent of sectors with state ownership

43
Table A2. 2 Size of public enterprise sector
Privatization proceeds as (pct of
GDP)1 Size of public sector
(0 to 6 index)2 1994 6.0 1995 1.2 5.9 1996 1.8 5.6 1997 2.3 5.4 1998 2.1 5.1 1999 1.2 5.0 2000 0.2 4.9 2001 0.1 4.9 2002 0.2 4.9 2003 0.2 4.9 2004 0.3 4.8 2005 0.19 4.8 2006 0.23 4.8 1/ Source 2/ The 1995 figure is from Gwartney and Lawson (1997), but rescaled from a 0 to 10 scale (with 0 the worst or largest size of the public sector), to follow the 0 to 6 scale of the PMR (where 6 is now the worst ranking). Data for subsequent years were calculated relying on a perpetual inventory method type of approach: It= It-1 +0.2*(Pt-1), where the first It-1 is the original index (equal to zero for 1996) and Pt-1 is the privatization proceeds flow for the year. We are grateful to Paul Conway for his help in calculating these data in a manner consistent with the overall PMR.

44
Table A2. 3 Extent of direct control over business enterprise

45
Table A2. 4 Price Controls
Bulgaria Romania OECD EU15
No
1/4 Score 2.40 2.40 1.23 0.541/2 0 no no na na
1/2 0.8 0.8 na na1/4 Score 0 0 0.87 1.00
1/3 0no no na na
1/3 0 no no na na
1/3 0- - na na
1/4 Score 3 2 2 1.63Yes or - Yes or - No
Yes No 1/6 6 0 0 yes yes na na1/6 6 0 0 - no na na1/6 6 0 0 yes no na na1/6 6 0 0 no no na na1/6 6 0 0 yes yes na na1/6 6 0 0 - yes na na
Score 0 0 0 0
1/4 1 0no no na na
Overall score 1.35 1.10 1.01 0.83
6
6
Retail prices of certain staples (e.g. milk and bread) are subject to price controls
6
Retail prices of road freight services are regulated in some way by the government
Government provides pricing guidelines to road freight companies 6
6
Retail prices of gasoline are subject to price controls Retail prices of tobacco are subject to price controls
Prices of domestic air fares are regulated Relatif number of 5 or 4 busiest routes subject to price regulation
Road freight
Retail prices of alcohol are subject to price controls Retail prices of pharmaceuticals are subject to price controls
Professional bodies or representatives of trade and commercial interests are involved in specifying or enforcing pricing guidelines or regulations
Retail distribution Retail prices of certain products are subject to price controls
Industry weights
(b j )
Question weights
(c k )
Coding of answers
Yes
_ jbj _ kck answer jk
Air travel
(n/5)*6 or (n/4)*6
Scale for Retail
Retail prices of other product are subject to price controls Telecommunication
Country scores (0-6) Retail prices of digital mobile service in telecommunications are regulated

46
Table A2. 5 Use of command and control regulation
Yes NoBulgaria Romania OECD EU15 Poland Slovak Republic
1/2 1/2 0 6
no yes n.a. n.a. yes yes
1/2 0 6
no no n.a. n.a. no yes1/2 n.a. n.a.
1/4 n.a. n.a.
1/8 6 0no no n.a. n.a. no no
1/8 6 0no no n.a. n.a. no no
1/8 6 0
no no n.a. n.a. no no
1/8 6 0
no no n.a. n.a. no no1/4 n.a. n.a.
2/3 6 0 no no n.a. n.a. yes no
1/3 6 0
n.a. n.a.
* -0.5 0n.a. n.a.
1/4 n.a. n.a.
1 6 0
no no n.a. n.a. yes no1/4 n.a. n.a.
1 6 0
yes yes n.a. n.a. yes no
3.8 2.3 2.2 2.6 3.5 0.0
Note: (1) Yes= State, National+State, National; No = Local, National+local, States+local, No
Sector specific information
Question weights
(c k)
Industry weights
(b j)
General vs industry- specific weights
(a i )
The regulation of opening hours became more flexible in the last 5 years
Air travel
Shop opening hours are regulated Government regulations on shop opening hours
apply at national level (1)
Country scores (0-6) Σ ia i Σ jb j
Σ kc k answer ijk
Carriers operating on domestic routes are subject to universal service requirements (e.g. obligation to
serve specified customers or areas) Railways
Companies operating the infrastructure or providing railway services are subject to universal service requirements (e.g. obligation to serve specified
customers or areas)
Regulations prevent or constrain contract carriage (contractual relation between an otherwise
independent haulier and one shipper) Regulations prevent or constrain intermodal
operations (operating or ownership links between firms in different
transportation sectors) Retail distribution
Road freight Regulations prevent or constrain backhauling
(picking up freight on the return leg) Regulations prevent or constrain private carriage
(transport only for own account)
Regulators are required to assess alternative policy instruments (regulatory and non-regulatory) before
adopting new regulation Guidance has been issued on using alternatives to
traditional regulation
Coding of answers
General information

47
Table A2. 6 Licenses and permits system
Yes No Bulgaria Romania OECD EU15 Poland Slovak Rep.
1/3 0 6 no yes n.a. n.a. no yes
1/3 0 6 yes yes n.a. n.a. yes yes
1/3 0 6 yes yes n.a. n.a. yes yes
2 0 2.2 2 2 0
Coding of answers
Country scores (0-6)
The 'silence is consent' rule (i.e. that licenses areissued automatically if the competent licensing officehas not acted by the end of the statutory responseperiod) is used at all
There are single contact points (“one-stop shops”)for getting information on notifications and licenses
There are single contact points (“one-stop shops”)for issuing or accepting on notifications and licenses
Σkck answerjk
Question weights
(c k )

48
Table A2. 7 Communication and simplification of rules and procedures
Bulgaria Romania OECD EU15 Poland Slovakia
1/2
2/12 6 - yes yes n.a. n.a. yes yes
1/12 6 - yes yes n.a. n.a. yes yes
Yes or in all cases
In some cases No - in all cases in all cases n.a. n.a. in all cases in some
cases
0 3 6 -
3/12 6 - yes yes n.a. n.a. yes yes
Government wide
For some sectors No - government
widegovernment
wide n.a. n.a. government wide
government wide
0 3 6 -
1/3 yes no n.a. n.a. yes no
1/3 no yes n.a. n.a. yes yes
1/3 yes yes n.a. n.a. no no
0.3 0.1 0.5 0.5 0.8 1.4
Weights (d k )1/41/41/41/4
�kdk scorek
Communication
National government (all ministries and agencies) keeps a complete count of the number of permits and licenses required
There are systematic procedures for making regulations known and accessible to affected parties
There is a general policy requiring "plain language" drafting of regulation
There are inquiry points where affected or interested foreign parties can get information on the operation and enforcement of regulations
Affected parties have the right to appeal against adverse enforcement decisions in individual cases
Government policy imposes specific requirements in relation to transparency/freedom of information government wide
Country weight (0-1)
Administrative burdens for corporationAdministrative burdens for sole proprietor firms Sector specific administrative burdens
2/12
Communication
There is an explicit program to reduce the administrative burdens imposed by government on enterprises and/or citizensThere is a program underway to review and reduce the number of licenses and permits required by the national government
Simplification
Weight for the simplification element Wi
Country scores (0-6)
0
0
4/12
NoYes
6
0 6
0
� jbj �kck answerjk
1/2*(Wi-Min W)/(Max W98- Min W)
Coding of answersQuestion weights
(c k )
Weights by theme (b j )
0 6
0

49
Table A2. 8 Administrative burden on corporations
0 1 2 3 4 5 6Bulgaria Romania OECD EU15 Poland Slovak Republic
Number of mandatory procedures required to register a public limited company (pre-
registration+registration)1/4 <=3 <=5 <=8 <=12 <=16 <=20 >20
11 5 14.9 14.5 28 15
Number of public and private bodies to contact to register a public limited company (pre-
registration+registration)1/4 0 1 2 3 4 5 6
5.0 5.1 6 8Number of working days required to complete all
mandatory procedures for registering a public limited company (pre-registration+registration)
1/4 <=16.4 <=32.8 <=49.2 <=65.6 <=82 <=98.4 >98.432 11 23.8 22.3 90 15
Total cost (euros) of registering a public limited company (pre-registration+registration)
1/4 <=500 <=1000 <=1500 <=2500 <=5000 <=7500 >7500180.33 107.54 1108.14 899.07 n.a 721.97
Country scores (0-6) 1.37 0.80 1.90 1.83 4.33 2.00Σkck answerk
Weight on compliance
type (c k )
Scale 0-6
NOTE: Values for Bulgaria and Romania were obtained based on Doing Business 2005 data. Since Doing Business information on number of procedures, number of days and cost connected with starting a company are not directly comparable to the same information in the OECD International Regulation Database, a normalization process was necessary to homogenize the scores obtained. The normalization process proceeded as follows. 1) A standard score (also called z-score or normal score) was obtained as Z = (raw score - meanOECD-DB)/standard deviationOECD-DB based on the Doing Business sample, where the values for OECD countries refer to Doing Business 2003. The z-score reveals how many units of the OECD standard deviation Bulgaria and Romania are above or below the OECD mean. 2) A transformed score, comparable to OECD scores obtained from the OECD International Regulation Database, is calculated for Bulgaria and Romania as T = Z*( standard deviationOECD-PMR) + meanOECD-PMR

50
Table A2. 9 Sector specific administrative burdens
Overall weight Industry weights (b j )
Question weights (c k )
Bulgaria Romania OECD EU15Slovak
Republic Poland1/2
Yes No or missing
No or missing
No or missing
No or missing
No or missing yes yes na na yes yes
No or missing Yes No or
missingNo or
missingNo or
missingNo or
missing no no na na yes No
No or missing
No or missing Yes No or
missingNo or
missingNo or
missing yes yes na na yes no
No or missing
No or missing
No or missing Yes No - no no na na yes No
4 3 2 1 0 -
1/3 yes no na na yes yes
1/3 no yes na na no no
1/2 na na
1/8 always required
always required na na depends on
size of outletalways
required
1/8 always required
always required na na depends on
size of outletAlways required
1/8 always required
always required na na depends on
size of outletalways
required
1/8 always required
always required na na depends on
size of outletAlways required
1/8 always required
depends on size of outlet
or type of goods sold
na na depends on size of outlet
always required
1/8 -
depends on size of outlet
or type of goods sold
na na depends on size of outlet -
1/8 always required
always required na na always required always
required
1/8 always required
always required na na always required depends on
size of outlet
1.88 0.75 1.67 1.56 4.11 1.91
Notification to authorities is needed to start up a commercial activity for selling food products
Country scores (0-6)
Notification to authorities is needed to start up a commercial activity for selling clothing products
Licenses or permits are needed to engage in commercial acitivity (not related to outlet siting) for selling food products
1/3
6
6
6
6
6
Registration in commercial register is needed to start up a commercial activity for selling clothing products
1 0
In order to establish a national road freight business, operators need to obtain a license (other than a driving license) or permit from the government or a regulatory agency
There are criteria other than technical and financial fitness and compliance with public safety requirements considered in decisions on entry of new operatorsThese entry regulations apply also if a firm wants to transport only for its own account
Registration in commercial register is needed to start up a commercial activity for seeling food products
Scale for the first element of road freight
"always required"
6
w∗Σjbj Σkck answerjk
Normalised value of the indicator of
general administrative
burdens on startups w=wi
/ Max w98
Licenses or permits are needed to engage in commercial acitivity (not related to outlet siting) for selling clothing products
Licenses or permits are needed for outlet siting (in addition to compliance with general urban planning provisions) for selling food products Licenses or permits are needed for outlet siting (in addition to compliance with general urban planning provisions) for selling clothing products
Road freight
Retail distribution
Sector specific administrative burdens
1 0
Coding of answers
In order to establish a national road freight business, operators need to notify any level of government or a regulatory agency and wait for approval before they can start operation
Registration in transport register is required in order to establish a new business in the road freight sectorIn order to operate a national road freight business, operators need to notify any level of government or a regulatory agency
3
3
6
6
0
0
3
3
3
3
3
3
0
0
Yes No
0
0
0
0
"depends on type of "no requirement"
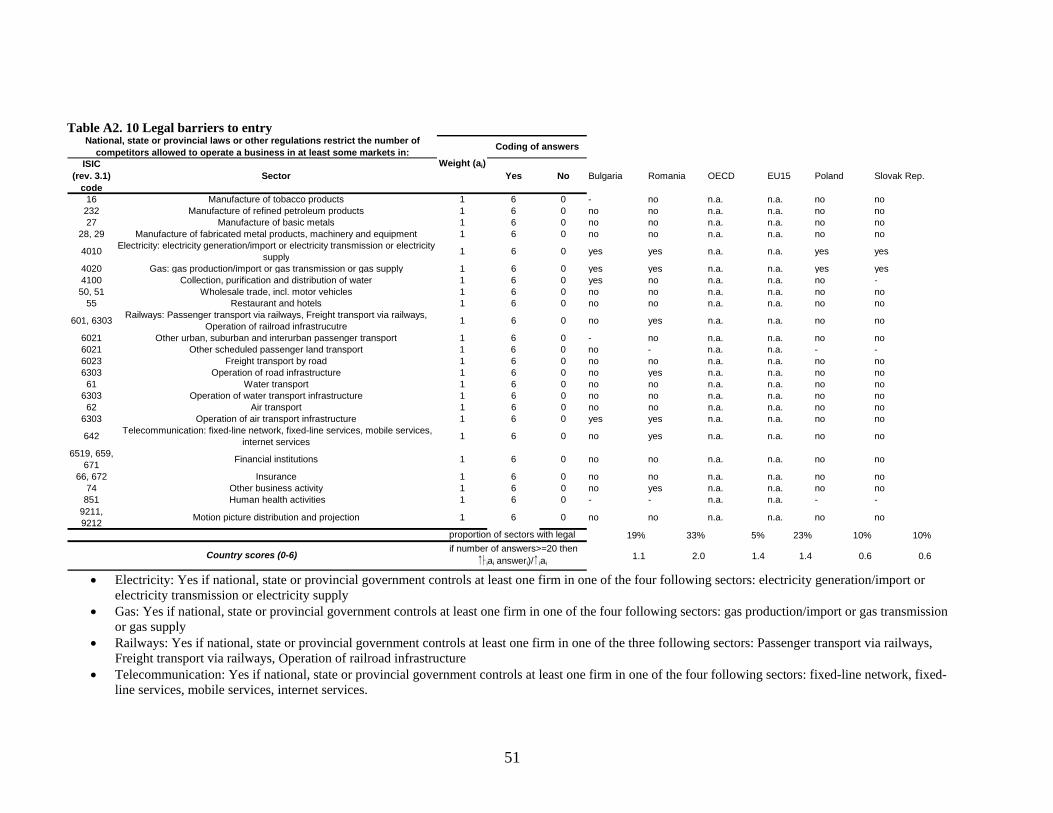
51
Table A2. 10 Legal barriers to entry
ISIC (rev. 3.1)
codeSector Yes No Bulgaria Romania OECD EU15 Poland Slovak Rep.
16 Manufacture of tobacco products 1 6 0 - no n.a. n.a. no no232 Manufacture of refined petroleum products 1 6 0 no no n.a. n.a. no no27 Manufacture of basic metals 1 6 0 no no n.a. n.a. no no
28, 29 Manufacture of fabricated metal products, machinery and equipment 1 6 0 no no n.a. n.a. no no
4010 Electricity: electricity generation/import or electricity transmission or electricity supply 1 6 0 yes yes n.a. n.a. yes yes
4020 Gas: gas production/import or gas transmission or gas supply 1 6 0 yes yes n.a. n.a. yes yes4100 Collection, purification and distribution of water 1 6 0 yes no n.a. n.a. no -50, 51 Wholesale trade, incl. motor vehicles 1 6 0 no no n.a. n.a. no no
55 Restaurant and hotels 1 6 0 no no n.a. n.a. no no
601, 6303 Railways: Passenger transport via railways, Freight transport via railways, Operation of railroad infrastrucutre 1 6 0 no yes n.a. n.a. no no
6021 Other urban, suburban and interurban passenger transport 1 6 0 - no n.a. n.a. no no6021 Other scheduled passenger land transport 1 6 0 no - n.a. n.a. - -6023 Freight transport by road 1 6 0 no no n.a. n.a. no no6303 Operation of road infrastructure 1 6 0 no yes n.a. n.a. no no
61 Water transport 1 6 0 no no n.a. n.a. no no6303 Operation of water transport infrastructure 1 6 0 no no n.a. n.a. no no
62 Air transport 1 6 0 no no n.a. n.a. no no6303 Operation of air transport infrastructure 1 6 0 yes yes n.a. n.a. no no
642 Telecommunication: fixed-line network, fixed-line services, mobile services, internet services 1 6 0 no yes n.a. n.a. no no
6519, 659, 671 Financial institutions 1 6 0 no no n.a. n.a. no no
66, 672 Insurance 1 6 0 no no n.a. n.a. no no74 Other business activity 1 6 0 no yes n.a. n.a. no no
851 Human health activities 1 6 0 - - n.a. n.a. - -9211, 9212 Motion picture distribution and projection 1 6 0 no no n.a. n.a. no no
19% 33% 5% 23% 10% 10%
1.1 2.0 1.4 1.4 0.6 0.6
proportion of sectors with legal
Country scores (0-6) if number of answers>=20 then
�� iai answeri)/� iai
National, state or provincial laws or other regulations restrict the number of competitors allowed to operate a business in at least some markets in:
Weight (ai)
Coding of answers
• Electricity: Yes if national, state or provincial government controls at least one firm in one of the four following sectors: electricity generation/import or
electricity transmission or electricity supply • Gas: Yes if national, state or provincial government controls at least one firm in one of the four following sectors: gas production/import or gas transmission
or gas supply • Railways: Yes if national, state or provincial government controls at least one firm in one of the three following sectors: Passenger transport via railways,
Freight transport via railways, Operation of railroad infrastructure • Telecommunication: Yes if national, state or provincial government controls at least one firm in one of the four following sectors: fixed-line network, fixed-
line services, mobile services, internet services.

52
Table A2. 11 Antitrust exemptions for public enterprises or state-mandated actions
Yes NoBulgaria Romania OECD EU15 Poland Slovakia
Is there rule or principle providing for exclusion or exemption from liability under the general competition law for conduct that is required or authorized by other government authority (in addition to exclusions that might apply to complete sectors)?
1/4 6 0
no no n.a. n.a. no no
Publicly-controlled firms or undertakings are subject to an exclusion or exemption from competition law such as horizontal cartels
1/4 6 0
Country is not
concerned by the
question
Country is not
concerned by the
question n.a. n.a.
Country is not
concerned by the
question -
Publicly-controlled firms or undertakings are subject to an exclusion or exemption from competition law such as vertical restraints or to abuse of dominance
1/4 6 0
Country is not
concerned by the
question
Country is not
concerned by the
question n.a. n.a.
Country is not
concerned by the
question -
Publicly-controlled firms or undertakings are subject to an exclusion or exemption from competition law such as mergers 1/4 6 0
Country is not
concerned by the
question
Country is not
concerned by the
question n.a. n.a.
Country is not
concerned by the
question -
Country scores (0-6) 0 0 0.4 0.3 0.0 0.0
Coding of answers
Weight =wi
= (Scope + Size of public sector enterprises)/2)
wi∗Σkck answerk / wimax
Overall weight Question weights (c k )

53
Table A2. 12 Foreign ownership barriers
Bulgaria Romania OECD EU15 Poland Slovak Rep.
2/3*wi (% of business sectors in which the state controls at least a
firm)
yes no n.a. n.a. yes yes
1/3 yes
Country is not
concerned by the
question
n.a. n.a. yes yes
Yes6 none none n.a. n.a. none none
<50% <40% <35% <30% <25%
0 1 3 4 6 0.49 0.49 n.a. n.a. 0.49
49% after 01/05/2004 also EU community concecpt of the ownership and
control could be applicable
3.0 0.8 1.8 1.3 3.7 2.3
Memo item61% 48% n.a. n.a. 96% 27%Memo item: % of business sectors in which the state controls
at least a firm
Country scores (0-6)
Sector-specific barriers
Ceiling on foreign investment in an airline company 1/2
03
General barriers
There are statutory or other legal limits to the number or proportion of shares that can be acquired by foreign investors in publicly-controlled firms
Special government rights can be exercised in the case of acquisition of equity by foreign investors
Σjbj Σkck answerjk
Foreign ownership restrictions in telecomunications
Partly No1/2
1/2
1/2
6
0
0
6
Question weights (ck)
Weights by theme (bj)
Coding of answers
Yes No

54
Table A2. 13 Discriminatory procedures
Bulgaria Romania OECD EU15 Poland Slovak Rep.
General discrimination 2/3
3/6 yes 0 n.a. n.a. yes yes
2/6 yes 0 n.a. n.a. yes yes
1/6 yes 0 n.a. n.a. no yes
Competition discrimination 1/3 n.a. n.a.
Yes Yes Yes Yes Yes No/- Yes Yes Yes No/- Yes No/- No/- No/- No/- No/- yes 0 n.a. n.a. yes yes
Yes Yes No/- No/- Yes Yes No/- Yes No/- Yes No/- No/- Yes No/- Yes No/- yes 0 n.a. n.a. yes no
Yes No/- Yes No/- Yes Yes Yes No/- Yes No/- No/- No/- No/- Yes Yes No/- yes 0 n.a. n.a. yes yes
Yes Yes Yes Yes No/- Yes No/- No/- Yes Yes No/- Yes No/- No/- No/- No/- yes 0 n.a. n.a. yes yes
0 0.75 0.75 1.5 2.625 2.625 3.375 3.375 3.375 3.375 4.125 4.125 5.25 5.25 5.25 60.00 0.00 0.49 0.49 0.25 1.13Σjbj Σkck answerjk
When business practices are perceived to restrict competition and hence prevent effective access of foreign firms (foreign owned or controlled) to such markets, foreign firms can have redress through regulatory authorities involved
Country scores (0-6)
When business practices are perceived to restrict competition foreign firms can have redress through private rights of action
Weights by theme (b j )
Question weights (c k )
Coding of answers
Yes No
6
When appeal procedures relating to regulatory decisions are available in domestic regulatory systems, they are open to affected or interested foreign parties as well
There are specific provisions which require that regulations, prior to entry into force, be published or otherwise communicated to the public in a manner accessible at the international level
When business practices are perceived to restrict competition foreign firms can have redress through trade policy bodies
0
0
0-6 Scale for competition discrimination
When business practices are perceived to restrict competition foreign firms can have redress through competition agencies
6
6
Country has any specific provisions which require or encourage explicit recognition of the national treatment principle when applying regulations, so as to guarantee non-discrimination between foreign and domestic firms, goods or services
0

55
Table A2. 14 Tariffs trade barriers
Bulgaria Romania OECD EU15 Poland Slovak RepublicAverage production-weighted tariff <=3% <=6% <=9% <=12% <=15% <=18% >18% 8.6 15.8 5.5 4.4 13.4 5.1
Country scores (0-6) 0 1 2 3 4 5 6 2.0 5.0 1.4 1.0 4.0 1.0
Coding of answersTariffs trade barriers

56
Table A2. 15 Regulatory barriers to trade and investment
Bulgaria Romania OECD EU15 Poland Slovak Republic
Yes No
The country has engaged in Mutual Recognition Agreements (MRAs) in at least a sector with any other country
2/5 0 6 yes yes na na yes yes
There are specific provisions which require or encourage regulators to consider recognizing the equivalence of regulatory measures or the result of conformity assessment performed in other countries, wherever possible and appropriate
4/15 0 6 yes yes na na no no
There are specific provisions which require or encourage regulators to use internationally harmonized standards and certification procedures wherever possible and appropriate
2/9 0 6 yes yes na na yes yes
There are any specific provisions which require or encourage regulatory administrative procedures to avoid unnecessary trade restrictiveness
1/9 0 6 yes yes na na yes yes
Country scores (0-6) 0.00 0.00 0.22 0.18 0.00 1.60
Coding of answers
Σkck answerjk
Question weights
(c k )